disease testing summary report - usda testing summary report summary report for nahln laboratory...
TRANSCRIPT
Animal and Plant Health Inspection Service Veterinary Services September 2014
Swine Enteric Coronavirus Disease Testing Summary Report
Summary Report for NAHLN Laboratory Testing
April 2013 – June 2014 (Prior to the USDA Federal Order)
SECD Testing Summary Report For NAHLN Laboratory Testing April 13, 2013 through June 4, 2014
Table of Contents Section 1. Introduction ......................................................................................................... 3
1.1 Purpose of this Report ................................................................................................................................. 3 1.2 Background .................................................................................................................................................. 3 1.3 Data-Sharing Participants ............................................................................................................................. 4 1.4 About the Data in this Report ...................................................................................................................... 4
Section 2. SECD Testing Overview ......................................................................................... 6
2.1 Testing Summary .......................................................................................................................................... 6
Section 3. Porcine Epidemic Diarrhea Virus (PEDV) Testing Summary ..................................... 7
3.1 PEDV Time Trends ........................................................................................................................................ 7 3.2 PEDV Age Class Trends ............................................................................................................................... 10 3.3 PEDV Summary by State Figure 3. Maps showing the number of positive PEDV accessions from each State at intervals prior to the Federal Order on June 4, 2014 ................................................................................ 12
Section 4. Porcine Deltacoronavirus (PDCoV) Testing Summary ............................................ 16
4.1 PDCoV Time Trends Table 6. Biological accessions and biological samples tested for PDCoV and number and percent positive by month. .............................................................................................................................. 16 4.2 PDCoV Age Class Trends ............................................................................................................................. 18 4.3 PDCoV Summary by State .......................................................................................................................... 19
Section 5. Environmental Testing Summary ......................................................................... 21
Section 6. Appendices ......................................................................................................... 23
This report was prepared by USDA-APHIS-VS Center for Epidemiology and Animal Health. For more information, contact: Dr. Brian McCluskey, VS Chief Epidemiologist, [email protected]
United States Department of Agriculture Animal and Plant Health Inspection Service Veterinary Services 2
SECD Testing Summary Report For NAHLN Laboratory Testing April 13, 2013 through June 4, 2014
Section 1. Introduction
1.1 Purpose of this Report This report summarizes swine enteric coronavirus diseases (SECD) testing results that were voluntarily provided by National Animal Health Laboratory Network (NAHLN) laboratories prior to issuance of the June 2014 Federal Order (Reporting, Herd Monitoring, and Management of Novel Swine Enteric Coronavirus Disease, June 5, 2014).
1.2 Background Porcine epidemic diarrhea virus (PEDV) was first detected in the United States in the spring of 2013, and NAHLN diagnostic laboratories began collating and sharing their PEDV testing data among themselves and with swine health stakeholders on April 16, 2013. In mid-June 2013, the USDA NAHLN Program Office began to assist with this data coordination effort. Starting the week of June 16, 2013, NAHLN laboratories began voluntarily providing their PEDV testing data to the NAHLN Program Office; this cooperative effort was intended to facilitate the collation of U.S. PEDV testing information from NAHLN laboratories and sharing this information with key swine health stakeholders. The NAHLN Program Office started producing weekly reports summarizing PEDV testing on June 16, 2013. The reports provided a basic overview of the number of laboratory accessions tested and the number of positive accessions. Reports also tracked the numbers of accessions tested and positives in each State and in different production types/age classes. In March 2014, labs began voluntarily providing their testing results for a second newly detected coronavirus, porcine deltacoronavirus (PDCoV). The reports incorporated testing information for both diseases and were referred to as Swine Enteric Coronavirus Disease (SECD) reports. Premises identification data are essential in an outbreak to determine the number of affected herds, areas affected, and other information that enables understanding and management of the disease situation. Because premises identification information was not provided to USDA with the SECD laboratory testing results and because of the suspected occurrence of repeat testing on affected herds, it was not possible to use the NAHLN laboratory accession data to accurately determine the number of infected herds/premises. Although the number of positive accessions could be counted and summarized, it was unknown how many accessions represented repeat testing on the same herd. For example, if there were 100 positive accessions from State X, without premises identification information, it was impossible to determine if this represented 100 tests on a single herd or 100 different affected herds in that State. These data could be interpreted to represent anywhere from 1 to 100 affected herds. In response to the significant impact novel SECDs were having on the U.S. pork industry, USDA issued a Federal Order on June 5, 2014. The Federal Order mandated reporting of SECD cases and specifically required that premises information be provided for SECD cases
United States Department of Agriculture Animal and Plant Health Inspection Service Veterinary Services 3
SECD Testing Summary Report For NAHLN Laboratory Testing April 13, 2013 through June 4, 2014
to allow accurate assessment of the spread of these diseases and to facilitate disease control. This report summarizes the SECD testing information that was provided to VS prior to the Federal Order (prior to June 5, 2014). The report summarizes the number of laboratory accessions that were tested and found positive, but because of the reasons explained above, the accessions counts do not equate to herd/premises counts.
1.3 Data-Sharing Participants Veterinary diagnostic laboratories that voluntarily reported PEDV and PDCoV testing data to the NAHLN Program office were:
• Arkansas Livestock & Poultry Commission-Veterinary Diagnostic Laboratory • Athens Veterinary Diagnostic Laboratory, University of Georgia • University of Illinois Veterinary Diagnostic Laboratory • Illinois Department of Agriculture, Galesburg Animal Disease Laboratory • Iowa State University Veterinary Diagnostic Laboratory • Kansas State Veterinary Diagnostic Laboratory • Michigan State University-- Diagnostic Center for Population and Animal Health • University of Minnesota Veterinary Diagnostic Laboratory • Veterinary Medical Diagnostic Laboratory, University of Missouri • University of Nebraska Veterinary Diagnostic Center • USDA National Veterinary Services Laboratories • Rollins Diagnostic Laboratory, North Carolina Department of Agriculture • Veterinary Diagnostic Laboratory, North Dakota State University • Ohio Animal Disease Diagnostic Laboratory - Ohio Department of Agriculture • Oregon State University Veterinary Diagnostic Laboratory • Indiana Animal Disease Diagnostic Laboratory, Purdue University • Animal Disease Research & Diagnostic Laboratory, South Dakota State University • Texas Veterinary Medical Diagnostic Laboratory, Texas A&M University This report does not include data from testing conducted at private diagnostic laboratories or for research purposes.
1.4 About the Data in this Report Data in this report were compiled from PEDV and PDCOV testing results data that were voluntarily provided by the above NAHLN laboratories. Important caveats about these testing data: • As described previously, in this outbreak situation the number of accessions does
not equate to the number of herds/premises. Because premises identification information were not provided by laboratories or by those who submitted the samples for testing, and because of the high occurrence of repeat testing on a herd in an outbreak, it was not possible to use NAHLN accession data to determine the number of infected herds/premises or accurately monitor disease spread.
United States Department of Agriculture Animal and Plant Health Inspection Service Veterinary Services 4
SECD Testing Summary Report For NAHLN Laboratory Testing April 13, 2013 through June 4, 2014
• A laboratory accession is a set of samples collected at a single premises on a single day and received at the laboratory. A laboratory accession represents a swine herd and samples within the accession represents an individual animal tested for PEDV or PDCoV on a given date. Because multiple swine within a herd are often simultaneously infected, analyses often use the laboratory accession (rather than individual sample) as the epidemiological unit of interest.
• A single accession can include samples from multiple age classes or samples tested in different weeks. Therefore, the same accession can be counted in more than one age class category or more than one testing week summary.
• The collection site State data provided in this report are based on information provided by the testing laboratory. VS notified State animal health officials when a positive accession was reported for the first time in a State. Prior to the Federal Order, however, VS did not officially confirm positive accessions.
• Data in this report include PCR test results only. Some NAHLN laboratories also provided results data from different laboratory tests (e.g., IHC, IFA, ELISA), but those results are not presented here.
• Data from feed samples are not included in this report. • From mid-April to mid-June 2013, SECD testing data were compiled by the Iowa State
University Veterinary Diagnostic Laboratory; only summary data on positive samples were provided for that time period.
• Starting the week of June 16, 2013, NAHLN laboratories began providing more granular data about PEDV testing to the USDA NAHLN Program Office; this allowed more information to be reported starting in mid-June.
• During the October 2013 federal government shutdown, the University of Minnesota Diagnostic Laboratory collected and reported PEDV testing data (weeks of Sept. 22 through Oct. 6, 2013.)
• In November 2013, NAHLN laboratories began reporting data on PEDV-negative cases, thereby allowing reporting on the numbers of samples and accessions that were tested in addition to the number that were positive. Summaries “total number tested” and “percent positive” were calculated for samples tested after November 1, 2013.
• For NAHLN laboratory reporting, age classes were defined as suckling (< 1 month old or still on sow), nursery (1 month up to 3 months), grower/finisher (3 months up to 8 months), and sow/boar (8 months or older).
United States Department of Agriculture Animal and Plant Health Inspection Service Veterinary Services 5
SECD Testing Summary Report For NAHLN Laboratory Testing April 13, 2013 through June 4, 2014
Section 2. SECD Testing Overview
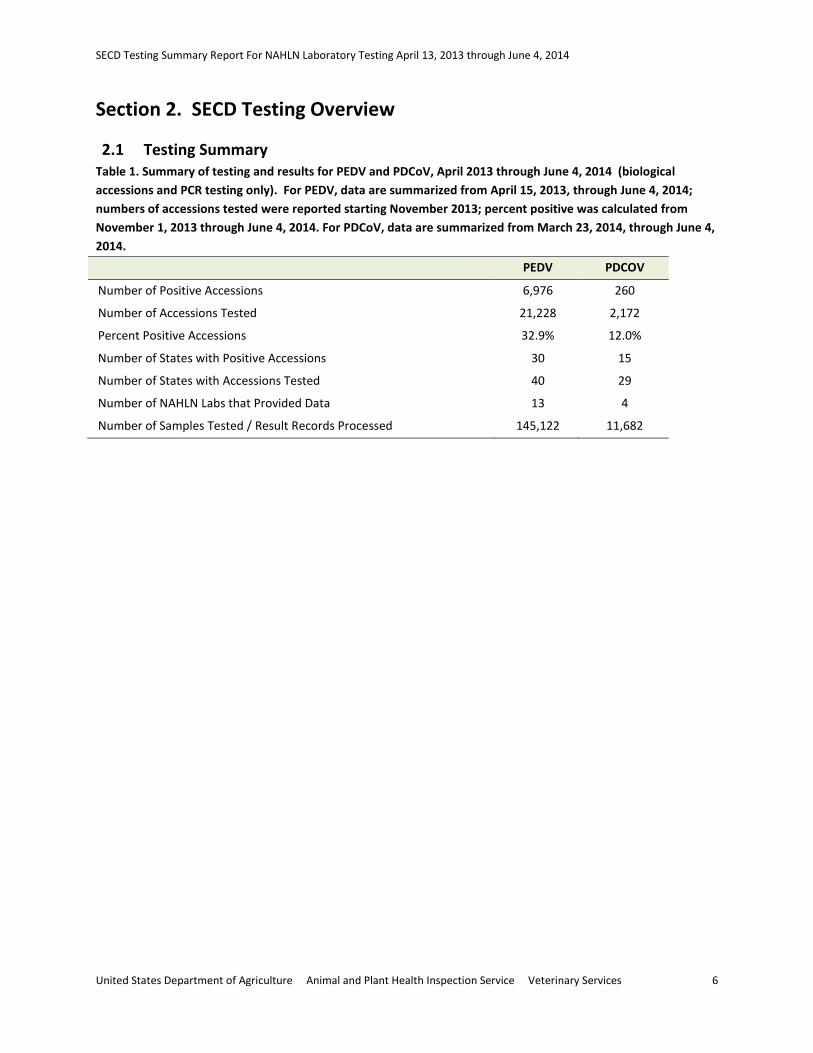
2.1 Testing Summary Table 1. Summary of testing and results for PEDV and PDCoV, April 2013 through June 4, 2014 (biological accessions and PCR testing only). For PEDV, data are summarized from April 15, 2013, through June 4, 2014; numbers of accessions tested were reported starting November 2013; percent positive was calculated from November 1, 2013 through June 4, 2014. For PDCoV, data are summarized from March 23, 2014, through June 4, 2014.
PEDV PDCOV
Number of Positive Accessions 6,976 260
Number of Accessions Tested 21,228 2,172
Percent Positive Accessions 32.9% 12.0%
Number of States with Positive Accessions 30 15
Number of States with Accessions Tested 40 29
Number of NAHLN Labs that Provided Data 13 4
Number of Samples Tested / Result Records Processed 145,122 11,682
United States Department of Agriculture Animal and Plant Health Inspection Service Veterinary Services 6
SECD Testing Summary Report For NAHLN Laboratory Testing April 13, 2013 through June 4, 2014
Section 3. Porcine Epidemic Diarrhea Virus (PEDV) Testing Summary
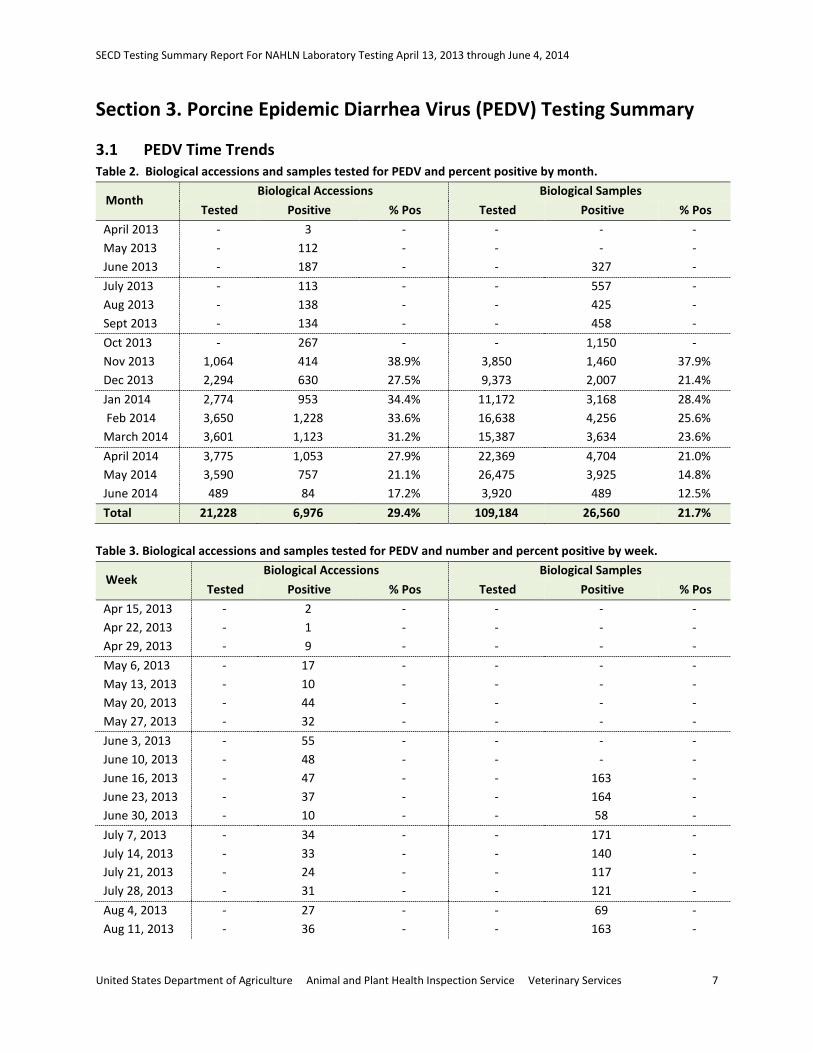
3.1 PEDV Time Trends Table 2. Biological accessions and samples tested for PEDV and percent positive by month.
Month Biological Accessions Biological Samples
Tested Positive % Pos Tested Positive % Pos April 2013 - 3 - - - - May 2013 - 112 - - - - June 2013 - 187 - - 327 - July 2013 - 113 - - 557 - Aug 2013 - 138 - - 425 - Sept 2013 - 134 - - 458 - Oct 2013 - 267 - - 1,150 - Nov 2013 1,064 414 38.9% 3,850 1,460 37.9% Dec 2013 2,294 630 27.5% 9,373 2,007 21.4% Jan 2014 2,774 953 34.4% 11,172 3,168 28.4% Feb 2014 3,650 1,228 33.6% 16,638 4,256 25.6% March 2014 3,601 1,123 31.2% 15,387 3,634 23.6% April 2014 3,775 1,053 27.9% 22,369 4,704 21.0% May 2014 3,590 757 21.1% 26,475 3,925 14.8% June 2014 489 84 17.2% 3,920 489 12.5% Total 21,228 6,976 29.4% 109,184 26,560 21.7%
Table 3. Biological accessions and samples tested for PEDV and number and percent positive by week.
Week Biological Accessions Biological Samples
Tested Positive % Pos Tested Positive % Pos Apr 15, 2013 - 2 - - - - Apr 22, 2013 - 1 - - - - Apr 29, 2013 - 9 - - - - May 6, 2013 - 17 - - - - May 13, 2013 - 10 - - - - May 20, 2013 - 44 - - - - May 27, 2013 - 32 - - - - June 3, 2013 - 55 - - - - June 10, 2013 - 48 - - - - June 16, 2013 - 47 - - 163 - June 23, 2013 - 37 - - 164 - June 30, 2013 - 10 - - 58 - July 7, 2013 - 34 - - 171 - July 14, 2013 - 33 - - 140 - July 21, 2013 - 24 - - 117 - July 28, 2013 - 31 - - 121 - Aug 4, 2013 - 27 - - 69 - Aug 11, 2013 - 36 - - 163 -
United States Department of Agriculture Animal and Plant Health Inspection Service Veterinary Services 7

SECD Testing Summary Report For NAHLN Laboratory Testing April 13, 2013 through June 4, 2014
Week Biological Accessions Biological Samples
Tested Positive % Pos Tested Positive % Pos Aug 18, 2013 - 30 - - 72 - Aug 25, 2013 - 26 - - 71 - Sept 1, 2013 - 31 - - 85 - Sept 8, 2013 - 28 - - 79 - Sept 15, 2013 - 32 - - 130 - Sept 22, 2013 - 40 - - 156 - Sept 29,2013 - 41 - - 170 - Oct 6, 2013 - 43 - - 196 - Oct 13, 2013 - 57 - - 252 - Oct 20, 2013 - 68 - - 288 - Oct 27, 2013 - 84 - - 331 - Nov 3, 2013 219 90 41% 649 292 45% Nov 10, 2013 221 92 42% 696 373 54% Nov 17, 2013 239 113 47% 741 304 41% Nov 24, 2013 338 96 28% 1,617 412 25% Dec 1, 2013 565 139 25% 2,481 367 15% Dec 8, 2013 572 132 23% 2,356 451 19% Dec 15, 2013 501 185 37% 1,816 524 29% Dec 22, 2013 418 118 28% 1,773 409 23% Dec 29, 2013 439 122 28% 2,077 546 26% Jan 5, 2014 693 188 27% 2,876 590 21% Jan 12, 2014 497 215 43% 1,735 621 36% Jan 19, 2014 816 218 27% 3,386 816 24% Jan 26, 2014 576 267 46% 2,073 851 41% Feb 2, 2014 917 295 32% 4,025 934 23% Feb 9, 2014 897 306 34% 3,901 1,060 27% Feb 16, 2014 916 315 34% 4,374 1,201 27% Feb 23, 2014 927 313 34% 4,317 1,068 25% Mar 2, 2014 846 281 33% 3,351 751 22% Mar 9, 2014 949 295 31% 3,732 851 23% Mar 16, 2014 835 270 32% 3,601 999 28% Mar 23, 2014 831 247 30% 4,112 886 22% Mar 30, 2014 926 260 28% 5,221 1,279 24% Apr 6, 2014 889 272 31% 4,859 1,104 23% Apr 13, 2014 825 222 27% 4,645 943 20% Apr 20, 2014 798 211 26% 5,107 941 18% Apr 27, 2014 824 198 24% 5,350 858 16% May 4, 2014 856 192 22% 5,719 978 17% May 11, 2014 855 190 22% 6,398 949 15% May 18, 2014 811 158 19% 6,106 821 13% May 25, 2014 756 143 19% 6,023 896 15% June 1, 2014 489 84 17% 6,306 757 12% Total 21,228 6,976 33% 109,184 26,560 24%
United States Department of Agriculture Animal and Plant Health Inspection Service Veterinary Services 8
SECD Testing Summary Report For NAHLN Laboratory Testing April 13, 2013 through June 4, 2014
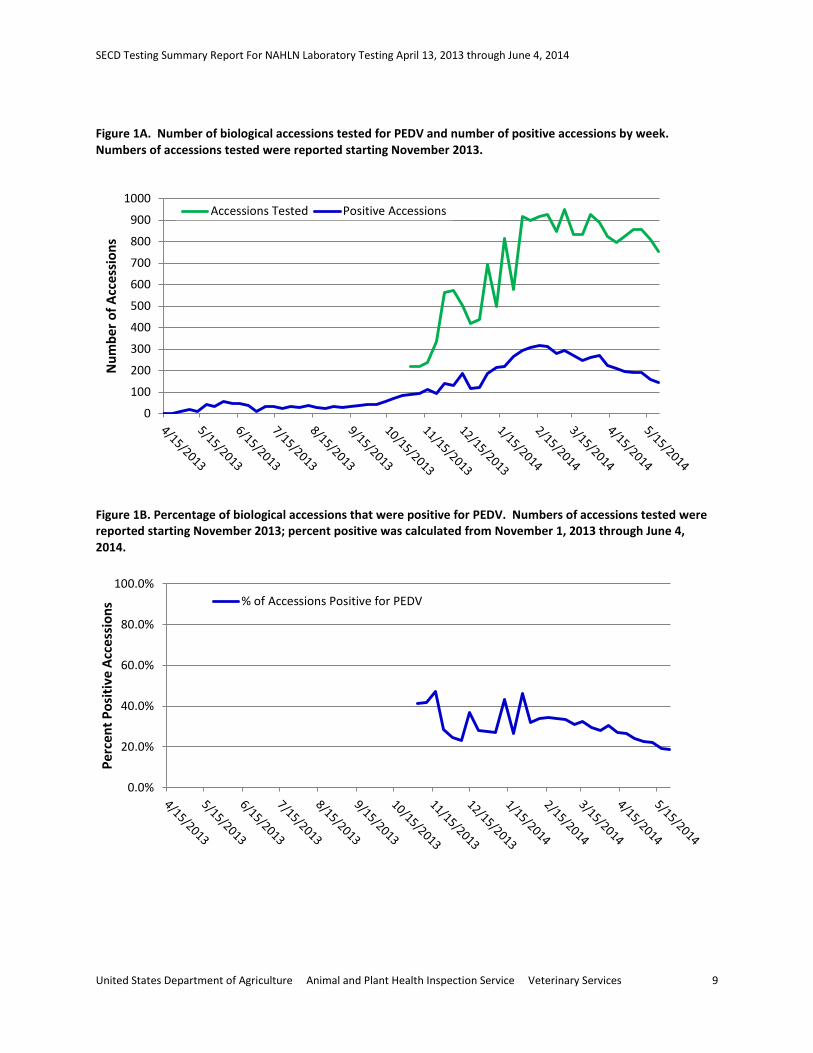
Figure 1A. Number of biological accessions tested for PEDV and number of positive accessions by week. Numbers of accessions tested were reported starting November 2013.
Figure 1B. Percentage of biological accessions that were positive for PEDV. Numbers of accessions tested were reported starting November 2013; percent positive was calculated from November 1, 2013 through June 4, 2014.
0
100
200
300
400
500
600
700
800
900
1000
Num
ber o
f Acc
essi
ons
Accessions Tested Positive Accessions
0.0%
20.0%
40.0%
60.0%
80.0%
100.0%
Perc
ent P
ositi
ve A
cces
sion
s % of Accessions Positive for PEDV
United States Department of Agriculture Animal and Plant Health Inspection Service Veterinary Services 9
SECD Testing Summary Report For NAHLN Laboratory Testing April 13, 2013 through June 4, 2014
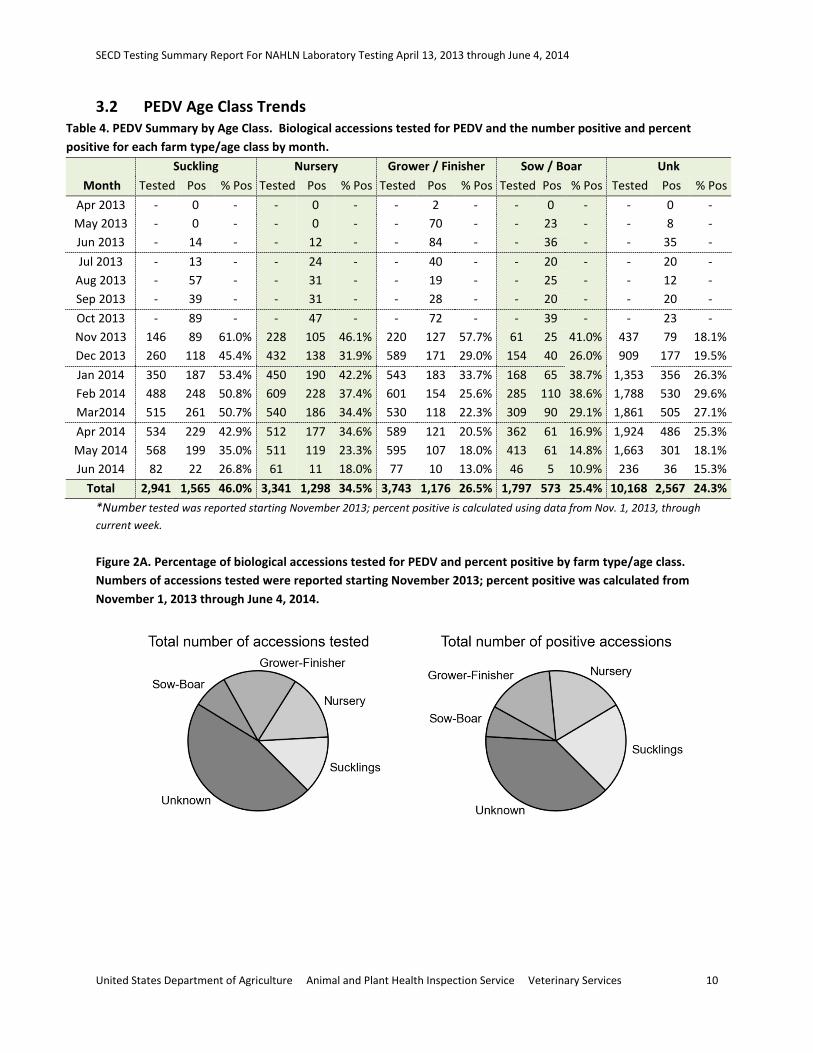
3.2 PEDV Age Class Trends Table 4. PEDV Summary by Age Class. Biological accessions tested for PEDV and the number positive and percent positive for each farm type/age class by month.
Month Suckling Nursery Grower / Finisher Sow / Boar Unk
Tested Pos % Pos Tested Pos % Pos Tested Pos % Pos Tested Pos % Pos Tested Pos % Pos Apr 2013 - 0 - - 0 - - 2 - - 0 - - 0 - May 2013 - 0 - - 0 - - 70 - - 23 - - 8 - Jun 2013 - 14 - - 12 - - 84 - - 36 - - 35 - Jul 2013 - 13 - - 24 - - 40 - - 20 - - 20 -
Aug 2013 - 57 - - 31 - - 19 - - 25 - - 12 - Sep 2013 - 39 - - 31 - - 28 - - 20 - - 20 - Oct 2013 - 89 - - 47 - - 72 - - 39 - - 23 - Nov 2013 146 89 61.0% 228 105 46.1% 220 127 57.7% 61 25 41.0% 437 79 18.1% Dec 2013 260 118 45.4% 432 138 31.9% 589 171 29.0% 154 40 26.0% 909 177 19.5% Jan 2014 350 187 53.4% 450 190 42.2% 543 183 33.7% 168 65 38.7% 1,353 356 26.3% Feb 2014 488 248 50.8% 609 228 37.4% 601 154 25.6% 285 110 38.6% 1,788 530 29.6% Mar2014 515 261 50.7% 540 186 34.4% 530 118 22.3% 309 90 29.1% 1,861 505 27.1% Apr 2014 534 229 42.9% 512 177 34.6% 589 121 20.5% 362 61 16.9% 1,924 486 25.3% May 2014 568 199 35.0% 511 119 23.3% 595 107 18.0% 413 61 14.8% 1,663 301 18.1% Jun 2014 82 22 26.8% 61 11 18.0% 77 10 13.0% 46 5 10.9% 236 36 15.3%
Total 2,941 1,565 46.0% 3,341 1,298 34.5% 3,743 1,176 26.5% 1,797 573 25.4% 10,168 2,567 24.3% *Number tested was reported starting November 2013; percent positive is calculated using data from Nov. 1, 2013, through current week. Figure 2A. Percentage of biological accessions tested for PEDV and percent positive by farm type/age class. Numbers of accessions tested were reported starting November 2013; percent positive was calculated from November 1, 2013 through June 4, 2014.
United States Department of Agriculture Animal and Plant Health Inspection Service Veterinary Services 10

SECD Testing Summary Report For NAHLN Laboratory Testing April 13, 2013 through June 4, 2014
Figure 2B. Percentage of PEDV positive accessions for each farm type/age class. Numbers of accessions tested were reported starting November 2013; percent positive was calculated from November 1, 2013 through June 4, 2014.
United States Department of Agriculture Animal and Plant Health Inspection Service Veterinary Services 11
SECD Testing Summary Report For NAHLN Laboratory Testing April 13, 2013 through June 4, 2014
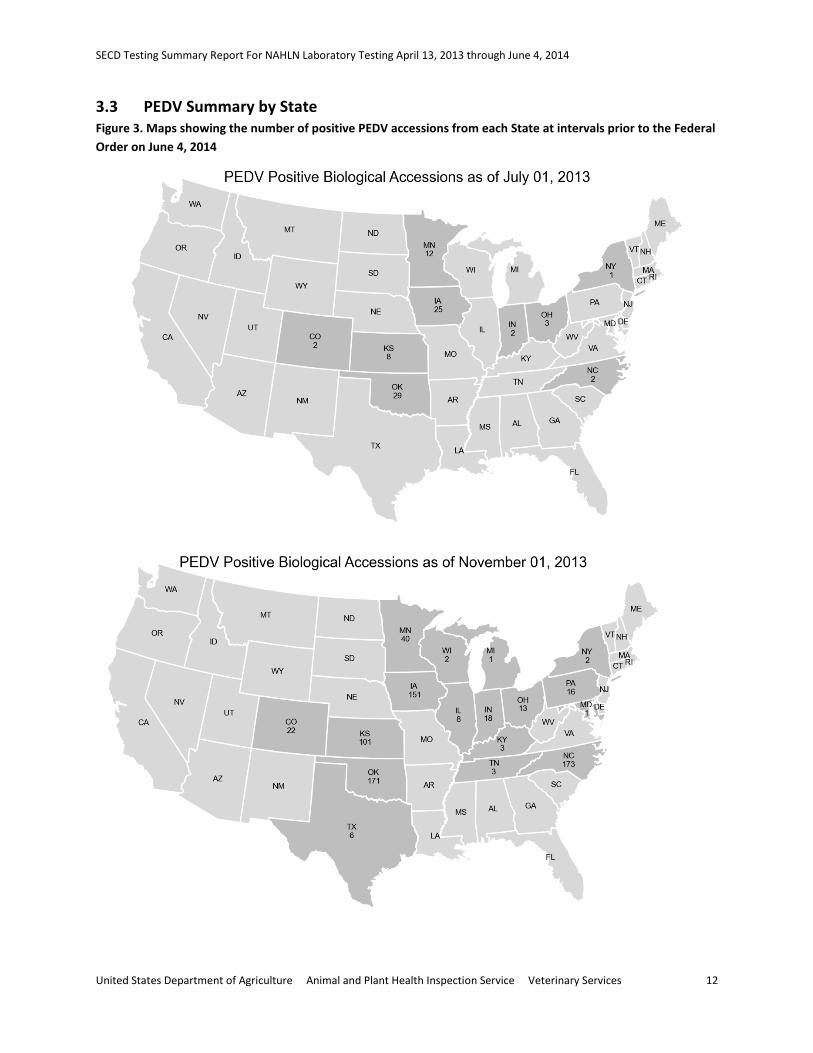
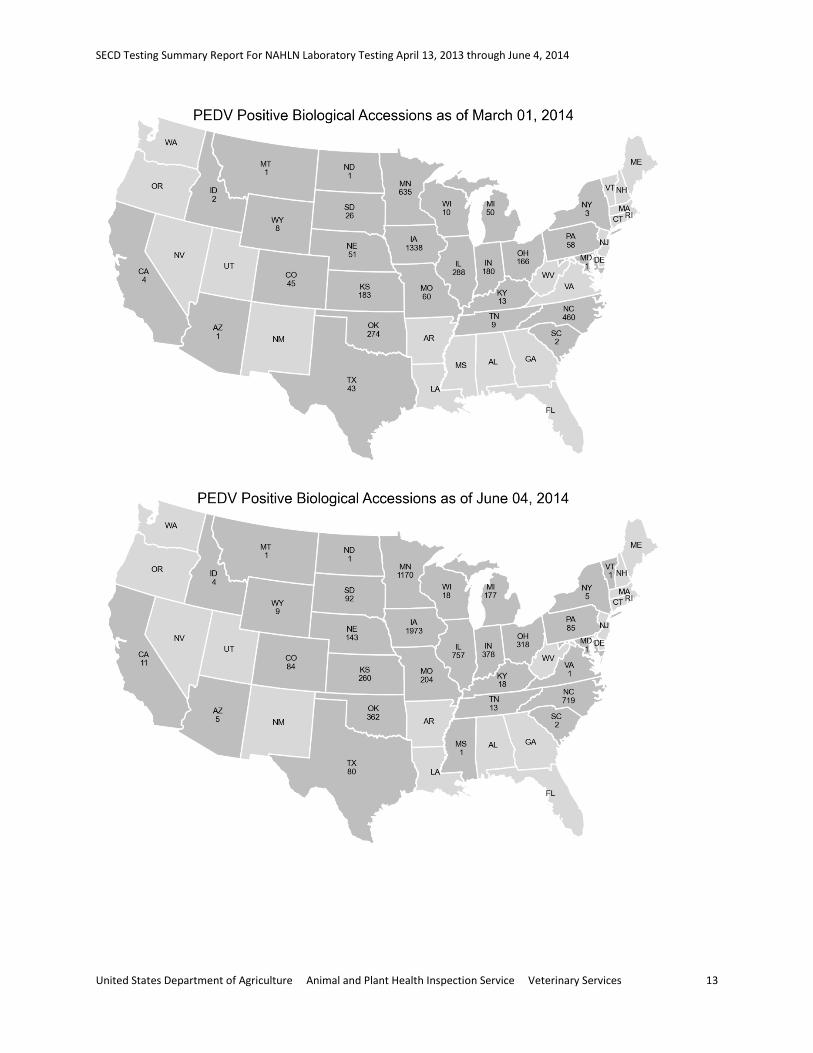
3.3 PEDV Summary by State Figure 3. Maps showing the number of positive PEDV accessions from each State at intervals prior to the Federal Order on June 4, 2014
United States Department of Agriculture Animal and Plant Health Inspection Service Veterinary Services 12
SECD Testing Summary Report For NAHLN Laboratory Testing April 13, 2013 through June 4, 2014
United States Department of Agriculture Animal and Plant Health Inspection Service Veterinary Services 13
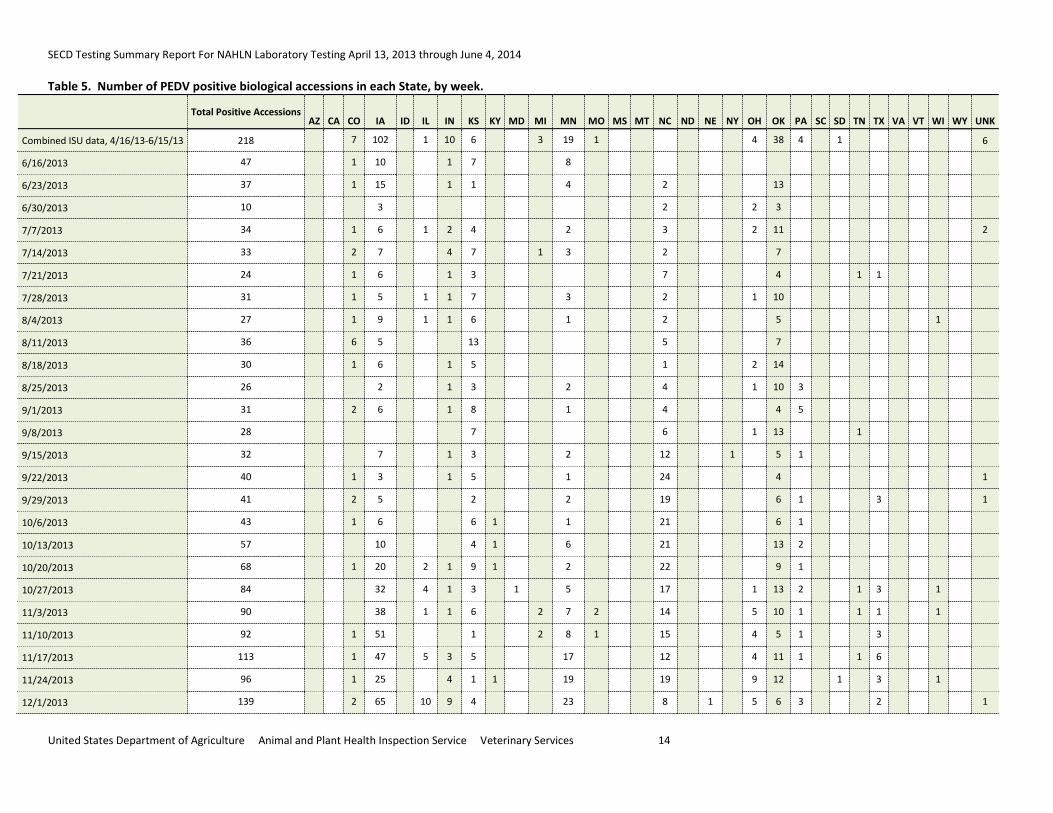
SECD Testing Summary Report For NAHLN Laboratory Testing April 13, 2013 through June 4, 2014 Table 5. Number of PEDV positive biological accessions in each State, by week.
Total Positive Accessions AZ CA CO IA ID IL IN KS KY MD MI MN MO MS MT NC ND NE NY OH OK PA SC SD TN TX VA VT WI WY UNK
Combined ISU data, 4/16/13-6/15/13 218 7 102 1 10 6 3 19 1 4 38 4 1 6
6/16/2013 47 1 10
1 7
8
6/23/2013 37 1 15
1 1
4
2 13
6/30/2013 10 3
2 2 3
7/7/2013 34 1 6
1 2 4
2
3 2 11 2
7/14/2013 33 2 7
4 7
1 3
2 7
7/21/2013 24 1 6
1 3
7 4 1 1
7/28/2013 31 1 5
1 1 7
3
2 1 10
8/4/2013 27 1 9
1 1 6
1
2 5 1
8/11/2013 36 6 5
13
5 7
8/18/2013 30 1 6
1 5
1 2 14
8/25/2013 26
2
1 3
2
4 1 10 3
9/1/2013 31 2 6
1 8
1
4 4 5
9/8/2013 28 7
6 1 13 1
9/15/2013 32 7
1 3
2
12 1 5 1
9/22/2013 40 1 3
1 5
1
24 4 1
9/29/2013 41 2 5
2
2
19 6 1 3 1
10/6/2013 43
1 6
6 1
1
21 6 1
10/13/2013 57 10
4 1
6
21 13 2
10/20/2013 68 1 20
2 1 9 1
2
22 9 1
10/27/2013 84 32
4 1 3
1
5
17 1 13 2 1 3 1
11/3/2013 90 38
1 1 6
2 7 2
14 5 10 1 1 1 1
11/10/2013 92 1 51
1
2 8 1
15 4 5 1 3
11/17/2013 113
1 47
5 3 5
17
12 4 11 1 1 6
11/24/2013 96 1 25
4 1 1
19
19 9 12 1 3 1
12/1/2013 139 2 65
10 9 4
23
8 1 5 6 3 2 1
United States Department of Agriculture Animal and Plant Health Inspection Service Veterinary Services 14
SECD Testing Summary Report For NAHLN Laboratory Testing April 13, 2013 through June 4, 2014
Total Positive Accessions AZ CA CO IA ID IL IN KS KY MD MI MN MO MS MT NC ND NE NY OH OK PA SC SD TN TX VA VT WI WY UNK
12/8/2013 132 65 8 6 5 2 18 3 12 3 7 1 1 1
12/15/2013 185 1 96 15 8 3 27 5 19 1 3 5 1 1
12/22/2013 118 1 61 8 3 5 2 17 2 5 1 5 3 2 3
12/29/2013 122 1 49 13 2 4 20 4 17 2 5 2 1 1 1
1/5/2014 188 3 81 10 2 9 1 1 46 15 1 7 4 2 1 4 1
1/12/2014 215 1 1 88 19 7 7 3 4 31 4 20 5 9 8 2 2 3 1
1/19/2014 218 2 70 21 9 10 1 4 51 7 19 2 10 2 2 3 1 1 3
1/26/2014 267 1 2 87 39 24 3 1 2 50 7 15 7 11 4 4 3 2 1 1 3
2/2/2014 295 1 2 93 1 27 15 3 1 4 76 9 1 24 4 11 4 4 3 1 1 1 9
2/9/2014 306 2 91 27 22 7 1 9 62 4 23 9 1 21 6 3 4 2 1 2 9
2/16/14 315 3 90 35 25 7 7 59 4 24 6 22 9 7 5 1 2 2 1 6
2/23/14 313 2 79 1 41 22 1 1 10 61 8 23 1 12 19 5 12 3 1 2 2 7
3/2/14 281 1 1 1 81 32 26 6 3 47 11 26 2 19 1 3 6 5 1 9
3/9/14 295 2 7 71 43 22 13 13 52 7 16 5 1 13 9 3 7 6 5
3/16/14 270 3 2 54 1 44 21 5 1 16 40 17 17 6 1 17 9 5 6 2 3
3/23/14 247 2 48 43 14 5 9 45 16 20 9 16 5 1 5 1 1 2 5
3/30/13 260 1 1 51 41 17 9 1 17 48 8 1 24 7 17 5 1 5 2 4
4/6/14 272 2 5 48 43 17 7 10 49 12 23 10 22 10 2 2 2 3 5
4/13/14 222 1 5 42 43 16 6 9 46 7 20 2 10 4 2 4 3 1 1
4/20/14 211 2 52 30 12 13 6 36 9 9 12 9 9 3 3 1 5
4/27/14 198 1 44 32 15 11 40 5 16 7 12 6 5 1 2 1
5/4/14 192 40 1 25 8 3 9 33 17 21 6 7 10 1 5 4 2
5/11/14 190 5 31 31 10 4 1 10 35 14 18 4 7 8 3 4 3 1 1
5/18/14 158 3 32 25 11 1 1 3 27 5 23 9 3 4 1 6 3 1
5/25/14 143 3 32 26 5 3 6 23 8 15 10 1 4 2 4 1
6/1/14 84 2 9 11 5 2 1 5 16 9 13 4 4 3 1
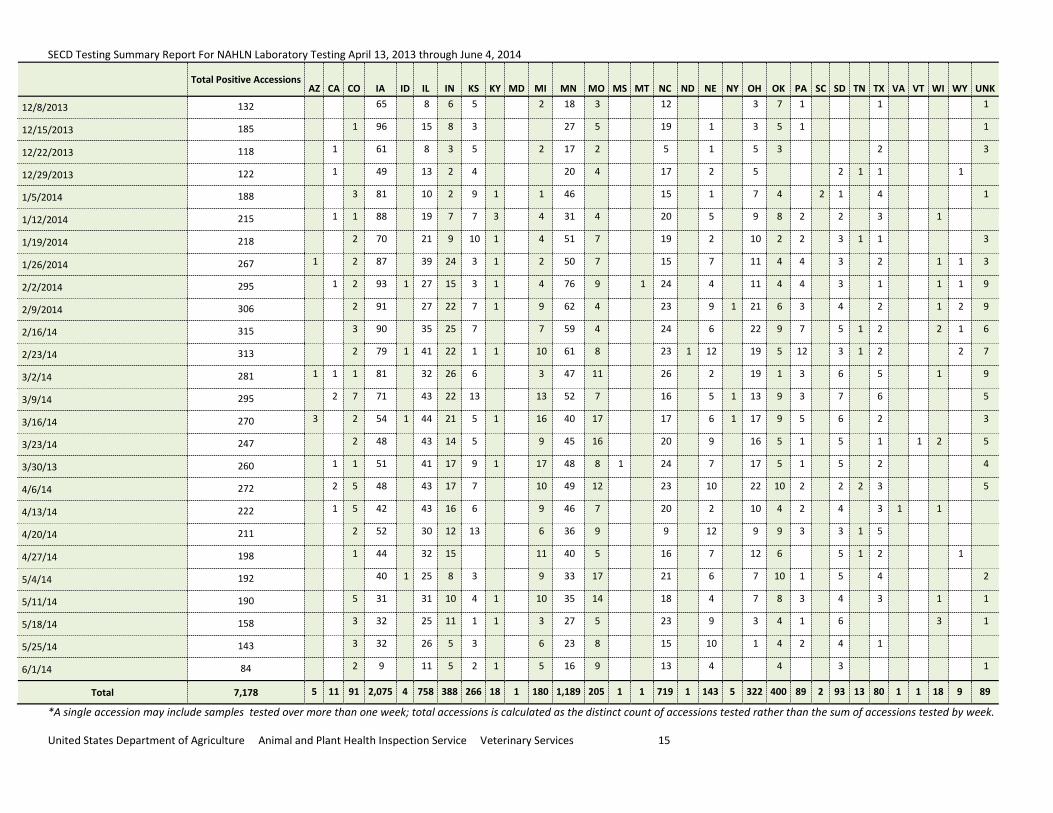
Total 7,178 5 11 91 2,075 4 758 388 266 18 1 180 1,189 205 1 1 719 1 143 5 322 400 89 2 93 13 80 1 1 18 9 89
*A single accession may include samples tested over more than one week; total accessions is calculated as the distinct count of accessions tested rather than the sum of accessions tested by week.
United States Department of Agriculture Animal and Plant Health Inspection Service Veterinary Services 15
SECD Testing Summary Report For NAHLN Laboratory Testing April 13, 2013 through June 4, 2014
Section 4. Porcine Deltacoronavirus (PDCoV) Testing Summary
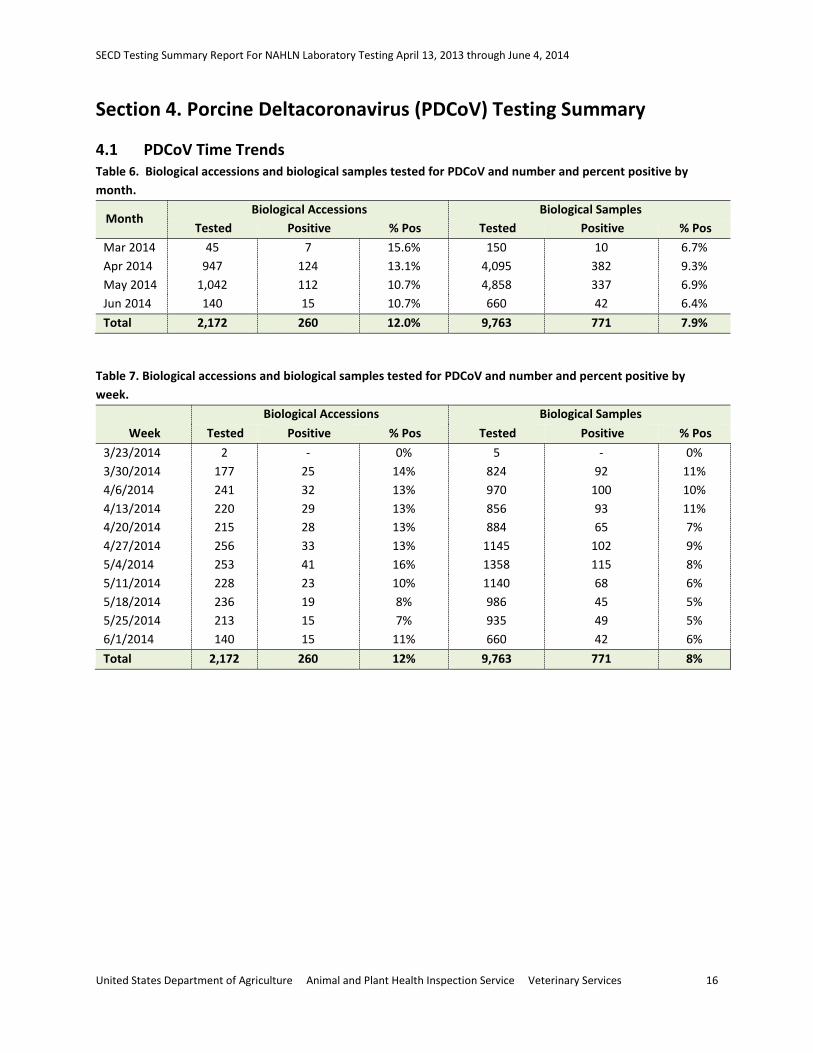
4.1 PDCoV Time Trends Table 6. Biological accessions and biological samples tested for PDCoV and number and percent positive by month.
Month Biological Accessions Biological Samples
Tested Positive % Pos Tested Positive % Pos Mar 2014 45 7 15.6% 150 10 6.7% Apr 2014 947 124 13.1% 4,095 382 9.3% May 2014 1,042 112 10.7% 4,858 337 6.9% Jun 2014 140 15 10.7% 660 42 6.4% Total 2,172 260 12.0% 9,763 771 7.9%
Table 7. Biological accessions and biological samples tested for PDCoV and number and percent positive by week.
Week Biological Accessions Biological Samples
Tested Positive % Pos Tested Positive % Pos 3/23/2014 2 - 0% 5 - 0% 3/30/2014 177 25 14% 824 92 11% 4/6/2014 241 32 13% 970 100 10% 4/13/2014 220 29 13% 856 93 11% 4/20/2014 215 28 13% 884 65 7% 4/27/2014 256 33 13% 1145 102 9% 5/4/2014 253 41 16% 1358 115 8% 5/11/2014 228 23 10% 1140 68 6% 5/18/2014 236 19 8% 986 45 5% 5/25/2014 213 15 7% 935 49 5% 6/1/2014 140 15 11% 660 42 6% Total 2,172 260 12% 9,763 771 8%
United States Department of Agriculture Animal and Plant Health Inspection Service Veterinary Services 16
SECD Testing Summary Report For NAHLN Laboratory Testing April 13, 2013 through June 4, 2014
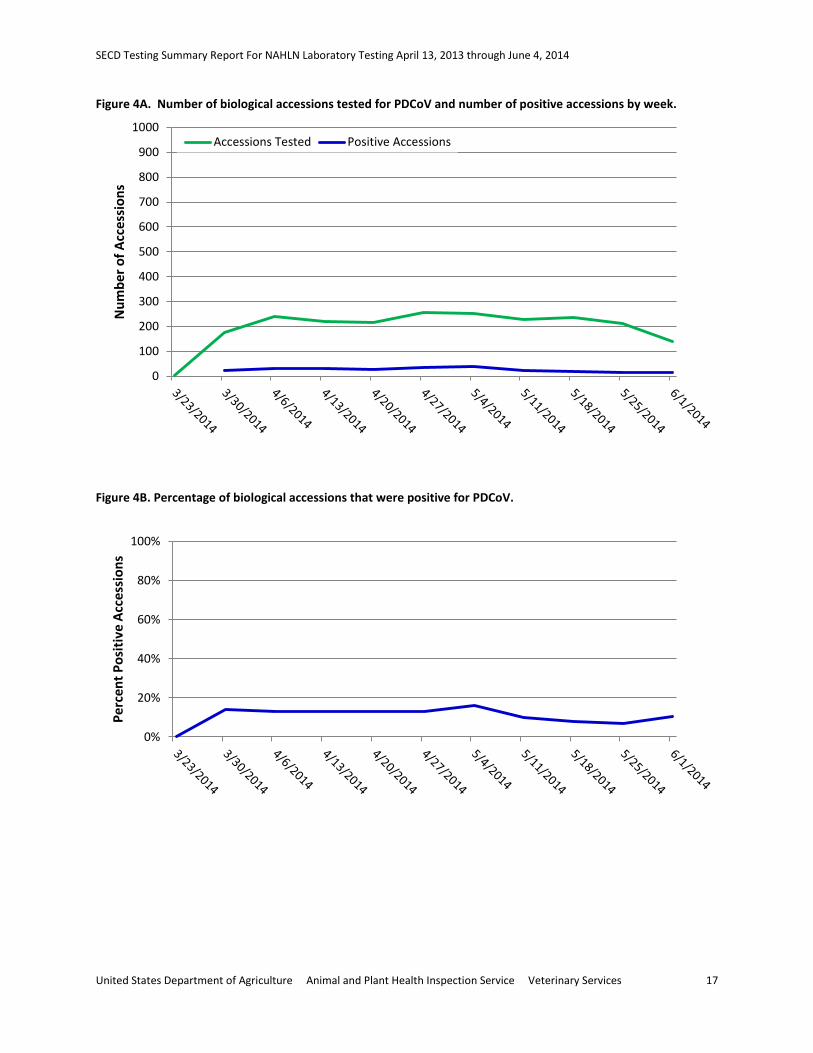
Figure 4A. Number of biological accessions tested for PDCoV and number of positive accessions by week.
Figure 4B. Percentage of biological accessions that were positive for PDCoV.
0
100
200
300
400
500
600
700
800
900
1000N
umbe
r of A
cces
sion
s Accessions Tested Positive Accessions
0%
20%
40%
60%
80%
100%
Perc
ent P
ositi
ve A
cces
sion
s
United States Department of Agriculture Animal and Plant Health Inspection Service Veterinary Services 17
SECD Testing Summary Report For NAHLN Laboratory Testing April 13, 2013 through June 4, 2014
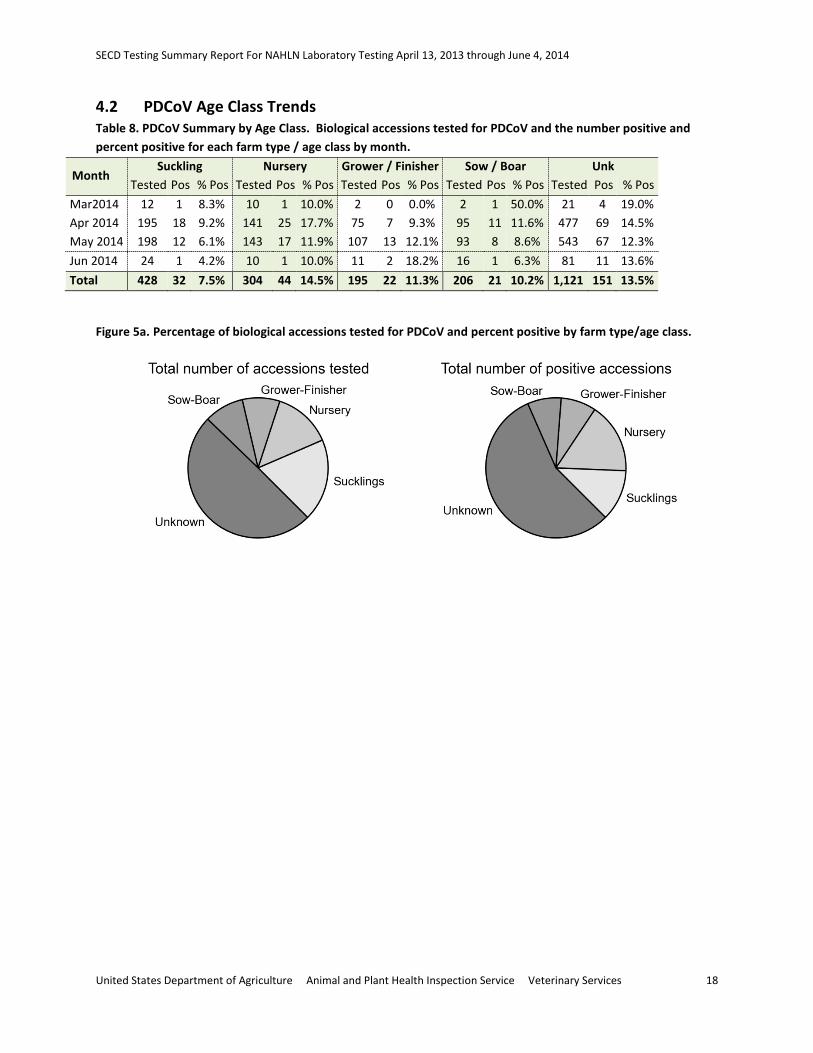
4.2 PDCoV Age Class Trends Table 8. PDCoV Summary by Age Class. Biological accessions tested for PDCoV and the number positive and percent positive for each farm type / age class by month.
Month Suckling Nursery Grower / Finisher Sow / Boar Unk
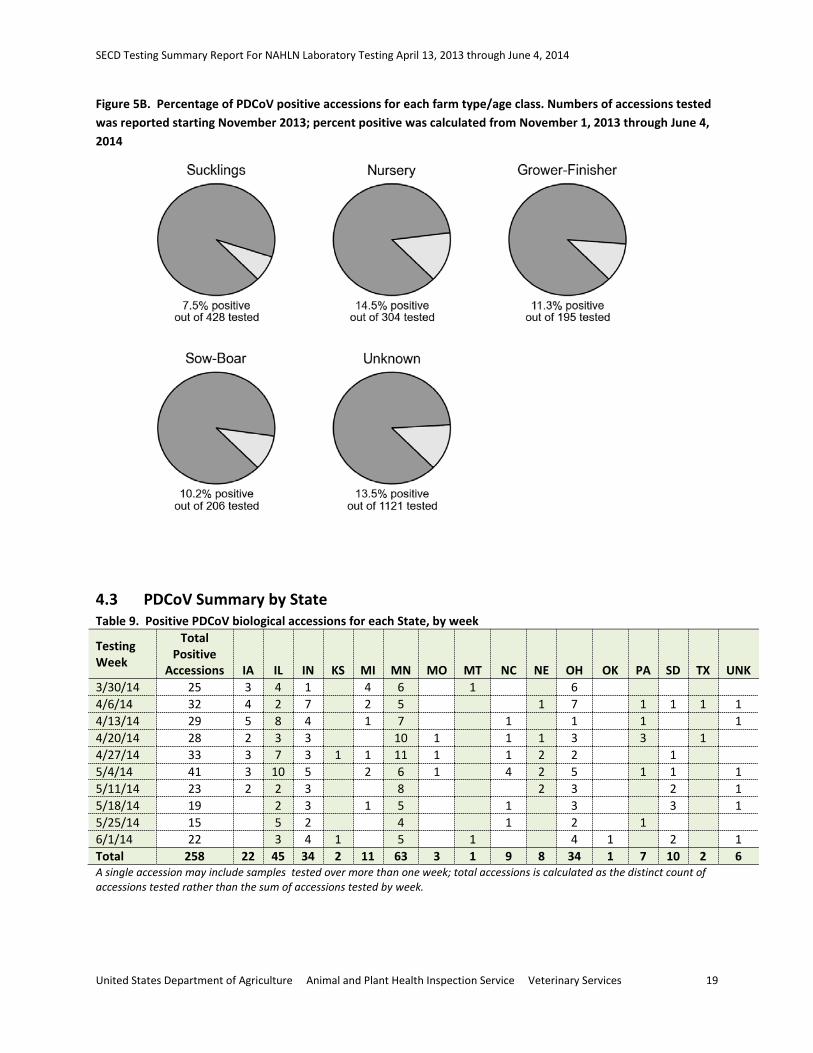
Tested Pos % Pos Tested Pos % Pos Tested Pos % Pos Tested Pos % Pos Tested Pos % Pos Mar2014 12 1 8.3% 10 1 10.0% 2 0 0.0% 2 1 50.0% 21 4 19.0% Apr 2014 195 18 9.2% 141 25 17.7% 75 7 9.3% 95 11 11.6% 477 69 14.5% May 2014 198 12 6.1% 143 17 11.9% 107 13 12.1% 93 8 8.6% 543 67 12.3% Jun 2014 24 1 4.2% 10 1 10.0% 11 2 18.2% 16 1 6.3% 81 11 13.6% Total 428 32 7.5% 304 44 14.5% 195 22 11.3% 206 21 10.2% 1,121 151 13.5%
Figure 5a. Percentage of biological accessions tested for PDCoV and percent positive by farm type/age class.
United States Department of Agriculture Animal and Plant Health Inspection Service Veterinary Services 18
SECD Testing Summary Report For NAHLN Laboratory Testing April 13, 2013 through June 4, 2014
Figure 5B. Percentage of PDCoV positive accessions for each farm type/age class. Numbers of accessions tested was reported starting November 2013; percent positive was calculated from November 1, 2013 through June 4, 2014
4.3 PDCoV Summary by State Table 9. Positive PDCoV biological accessions for each State, by week
Testing Week
Total Positive
Accessions IA IL IN KS MI MN MO MT NC NE OH OK PA SD TX UNK 3/30/14 25 3 4 1 4 6 1 6 4/6/14 32 4 2 7 2 5 1 7 1 1 1 1 4/13/14 29 5 8 4 1 7 1 1 1 1 4/20/14 28 2 3 3 10 1 1 1 3 3 1 4/27/14 33 3 7 3 1 1 11 1 1 2 2 1 5/4/14 41 3 10 5 2 6 1 4 2 5 1 1 1 5/11/14 23 2 2 3 8 2 3 2 1 5/18/14 19 2 3 1 5 1 3 3 1 5/25/14 15 5 2 4 1 2 1 6/1/14 22 3 4 1 5 1 4 1 2 1 Total 258 22 45 34 2 11 63 3 1 9 8 34 1 7 10 2 6 A single accession may include samples tested over more than one week; total accessions is calculated as the distinct count of accessions tested rather than the sum of accessions tested by week.
United States Department of Agriculture Animal and Plant Health Inspection Service Veterinary Services 19
SECD Testing Summary Report For NAHLN Laboratory Testing April 13, 2013 through June 4, 2014
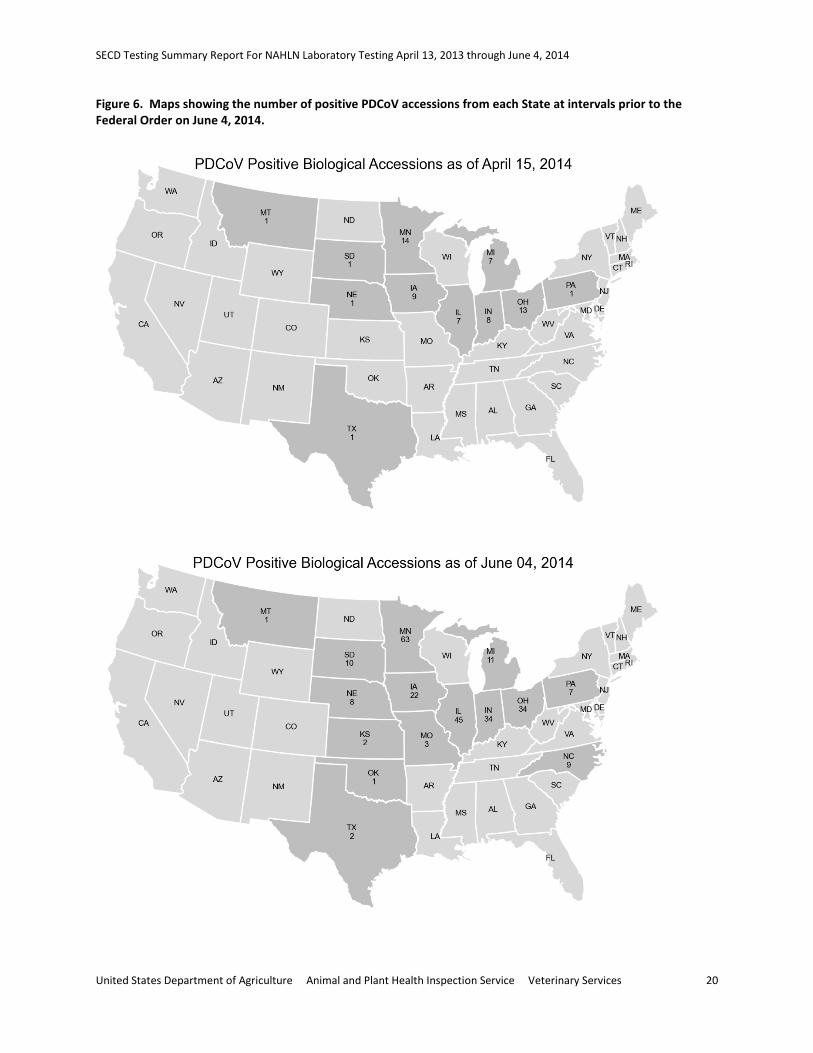
Figure 6. Maps showing the number of positive PDCoV accessions from each State at intervals prior to the Federal Order on June 4, 2014.
United States Department of Agriculture Animal and Plant Health Inspection Service Veterinary Services 20
SECD Testing Summary Report For NAHLN Laboratory Testing April 13, 2013 through June 4, 2014
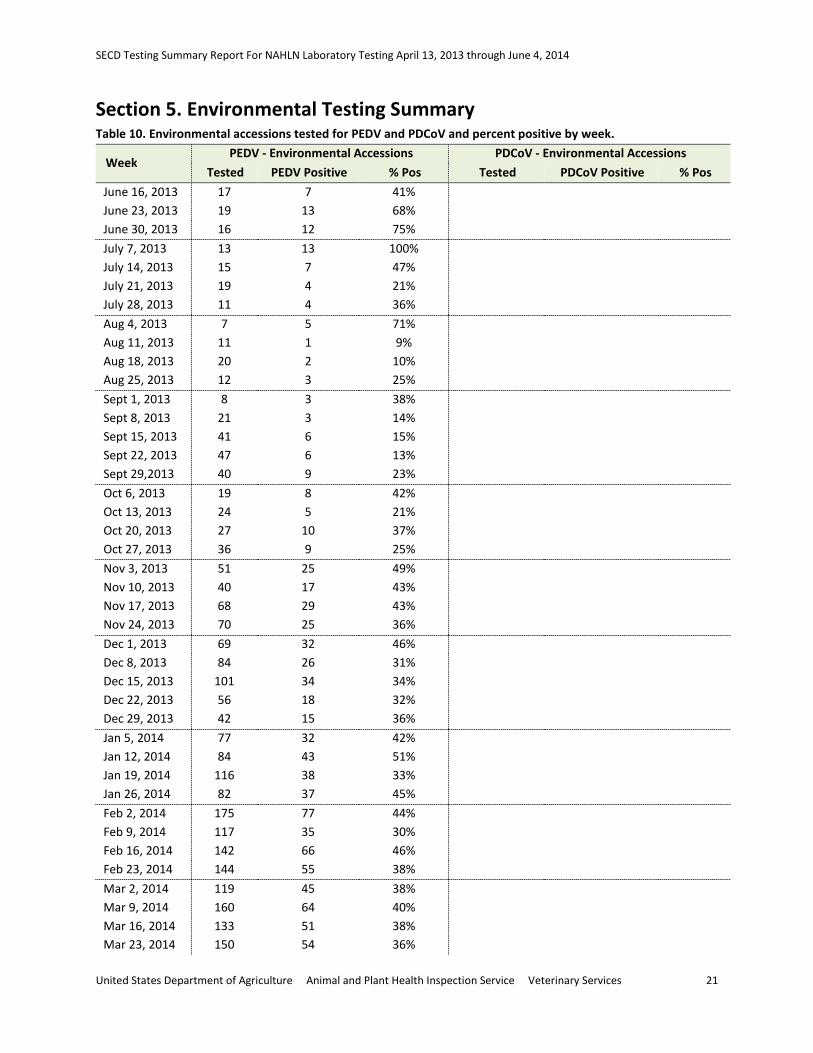
Section 5. Environmental Testing Summary Table 10. Environmental accessions tested for PEDV and PDCoV and percent positive by week.
Week PEDV - Environmental Accessions PDCoV - Environmental Accessions
Tested PEDV Positive % Pos Tested PDCoV Positive % Pos June 16, 2013 17 7 41% June 23, 2013 19 13 68% June 30, 2013 16 12 75% July 7, 2013 13 13 100% July 14, 2013 15 7 47% July 21, 2013 19 4 21% July 28, 2013 11 4 36% Aug 4, 2013 7 5 71% Aug 11, 2013 11 1 9% Aug 18, 2013 20 2 10% Aug 25, 2013 12 3 25% Sept 1, 2013 8 3 38% Sept 8, 2013 21 3 14% Sept 15, 2013 41 6 15% Sept 22, 2013 47 6 13% Sept 29,2013 40 9 23% Oct 6, 2013 19 8 42% Oct 13, 2013 24 5 21% Oct 20, 2013 27 10 37% Oct 27, 2013 36 9 25% Nov 3, 2013 51 25 49% Nov 10, 2013 40 17 43% Nov 17, 2013 68 29 43% Nov 24, 2013 70 25 36% Dec 1, 2013 69 32 46% Dec 8, 2013 84 26 31% Dec 15, 2013 101 34 34% Dec 22, 2013 56 18 32% Dec 29, 2013 42 15 36% Jan 5, 2014 77 32 42% Jan 12, 2014 84 43 51% Jan 19, 2014 116 38 33% Jan 26, 2014 82 37 45% Feb 2, 2014 175 77 44% Feb 9, 2014 117 35 30% Feb 16, 2014 142 66 46% Feb 23, 2014 144 55 38% Mar 2, 2014 119 45 38% Mar 9, 2014 160 64 40% Mar 16, 2014 133 51 38% Mar 23, 2014 150 54 36%
United States Department of Agriculture Animal and Plant Health Inspection Service Veterinary Services 21

SECD Testing Summary Report For NAHLN Laboratory Testing April 13, 2013 through June 4, 2014
Week PEDV - Environmental Accessions PDCoV - Environmental Accessions
Tested PEDV Positive % Pos Tested PDCoV Positive % Pos Mar 30, 2014 144 61 42% 22 6 27% Apr 6, 2014 170 78 46% 38 5 13% Apr 13, 2014 151 54 36% 39 2 5% Apr 20, 2014 157 64 41% 36 4 11% Apr 27, 2014 180 66 37% 31 5 16% May 4, 2014 115 36 31% 37 9 24% May 11, 2014 139 42 30% 36 3 8% May 18, 2014 170 49 29% 36 1 3% May 25, 2014 122 36 30% 23 1 4% June 1, 2014 90 11 12% 14 0 0% Total 3,941 1,445 37% 312 36 12%
United States Department of Agriculture Animal and Plant Health Inspection Service Veterinary Services 22
SECD Testing Summary Report For NAHLN Laboratory Testing April 13, 2013 through June 4, 2014
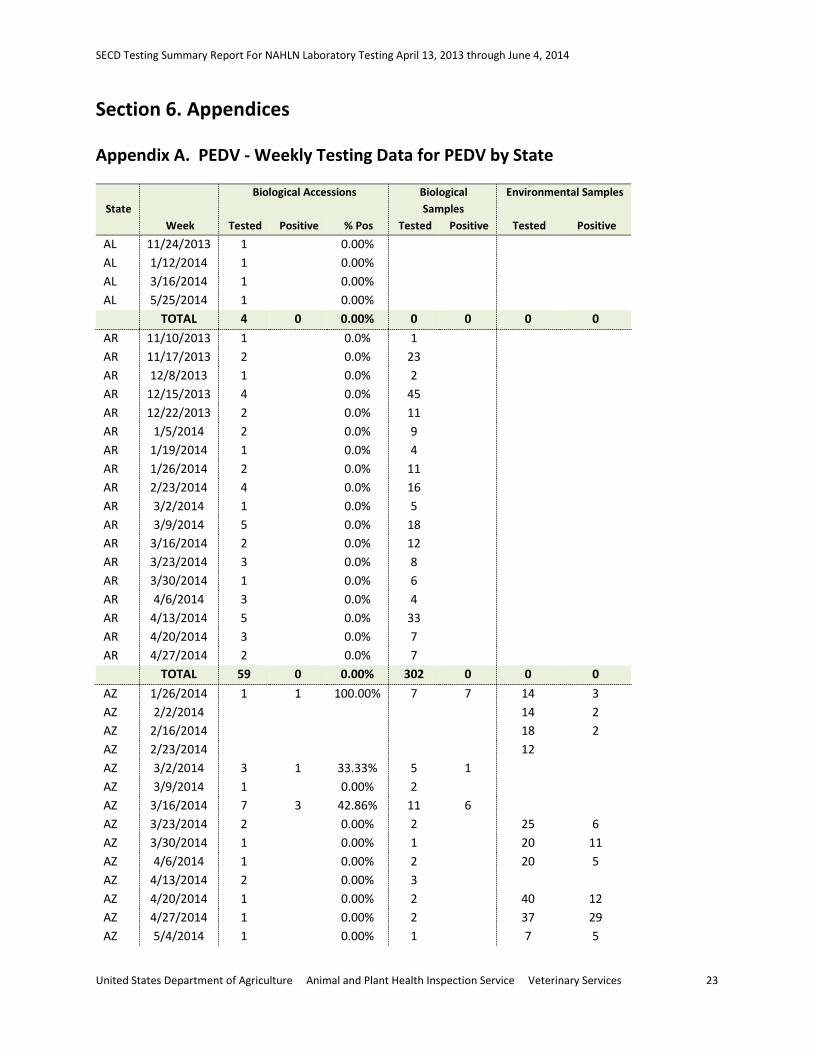
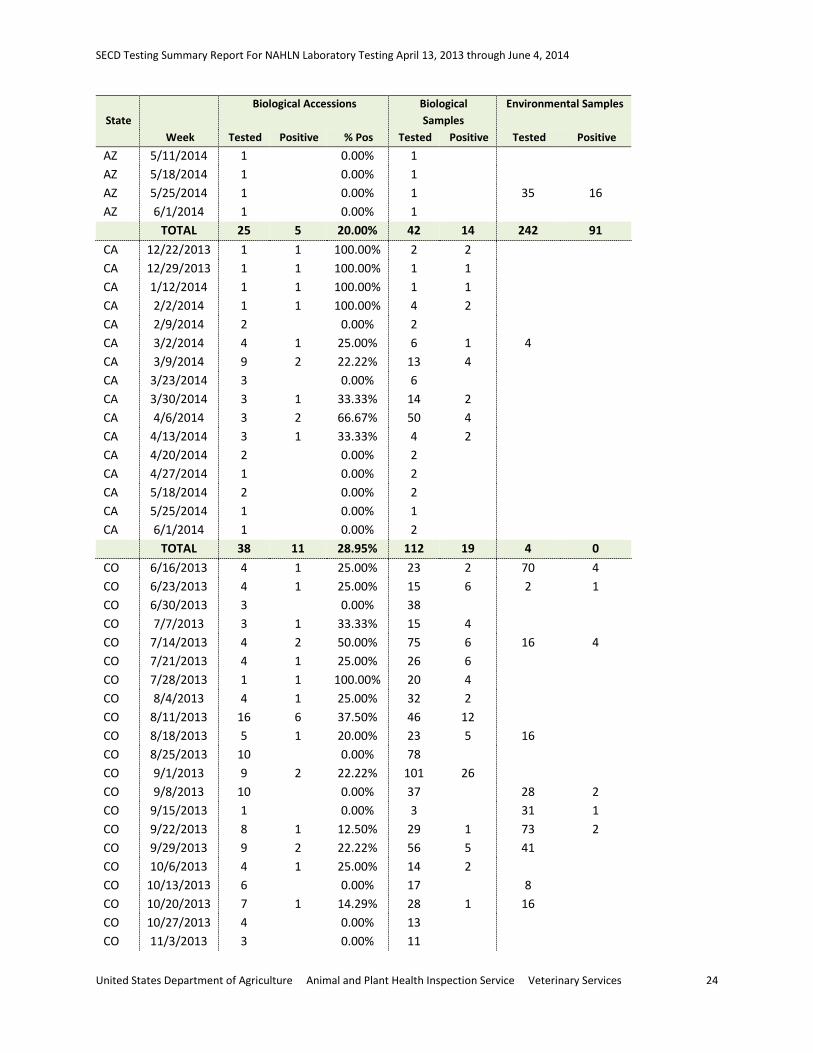
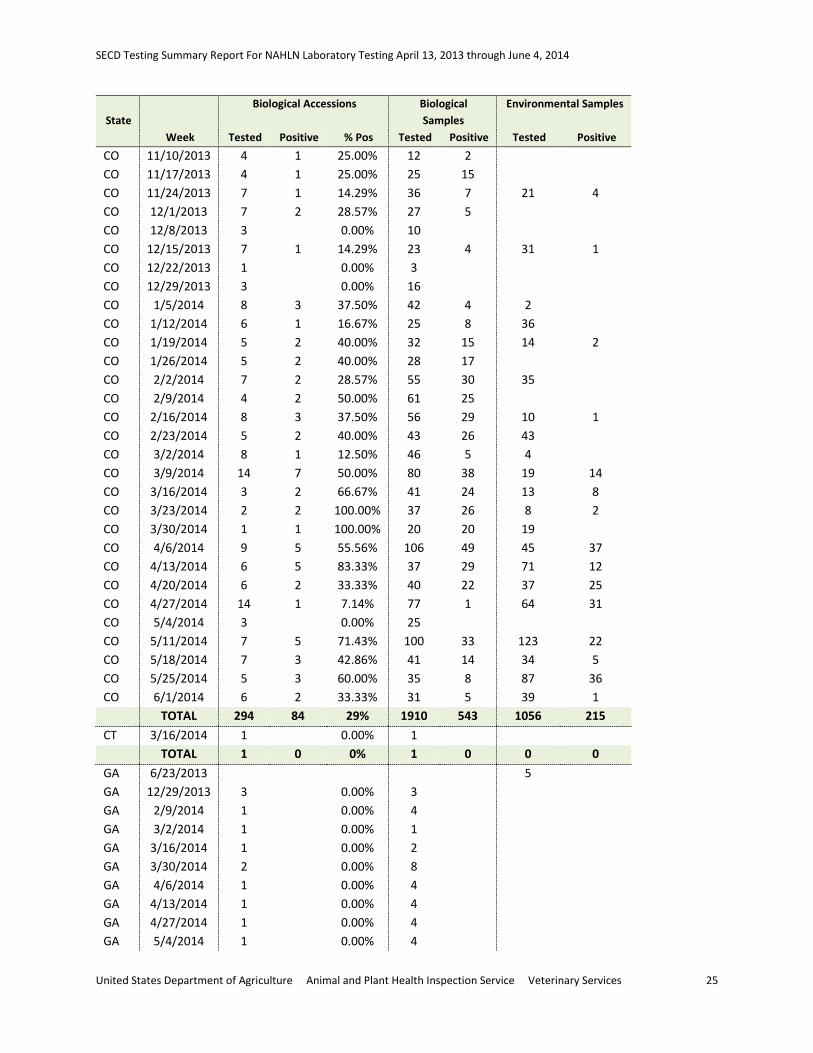
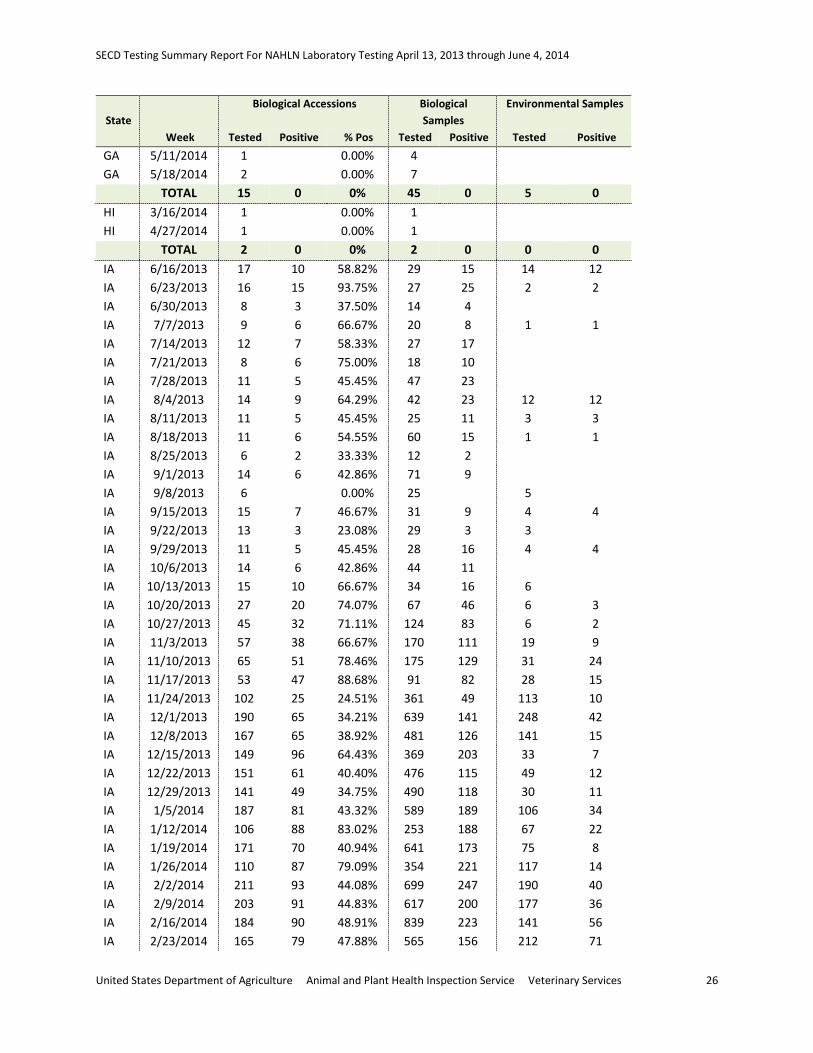
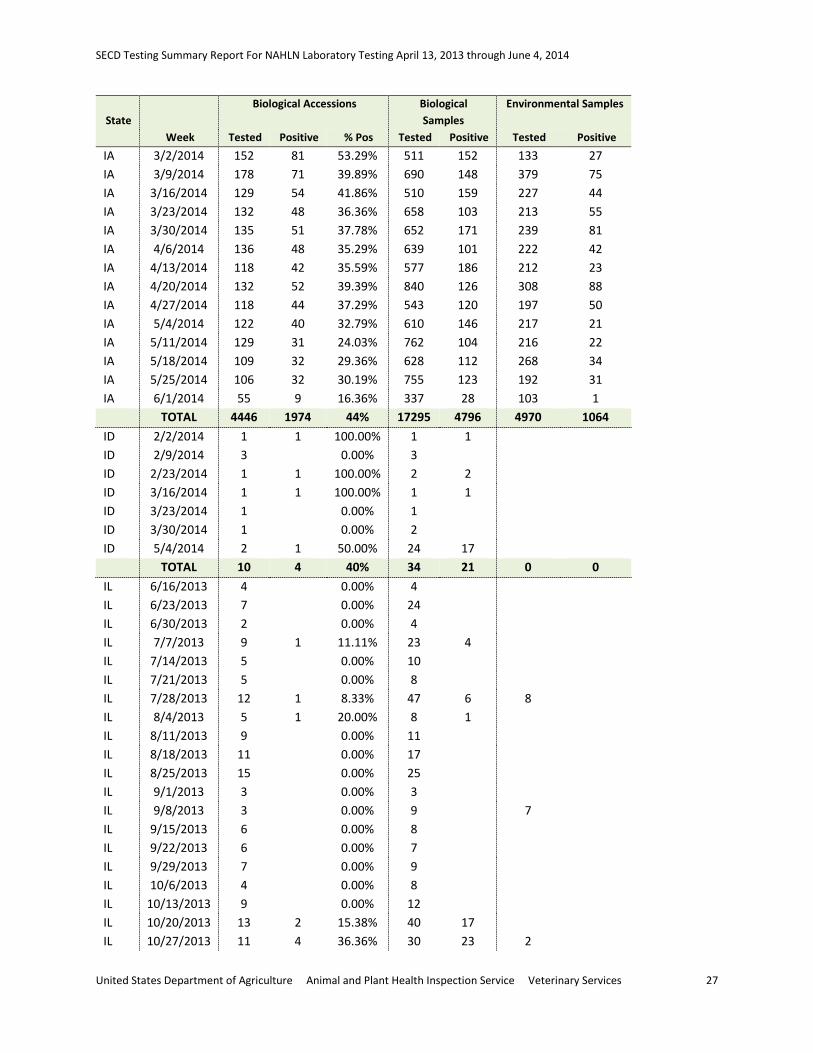
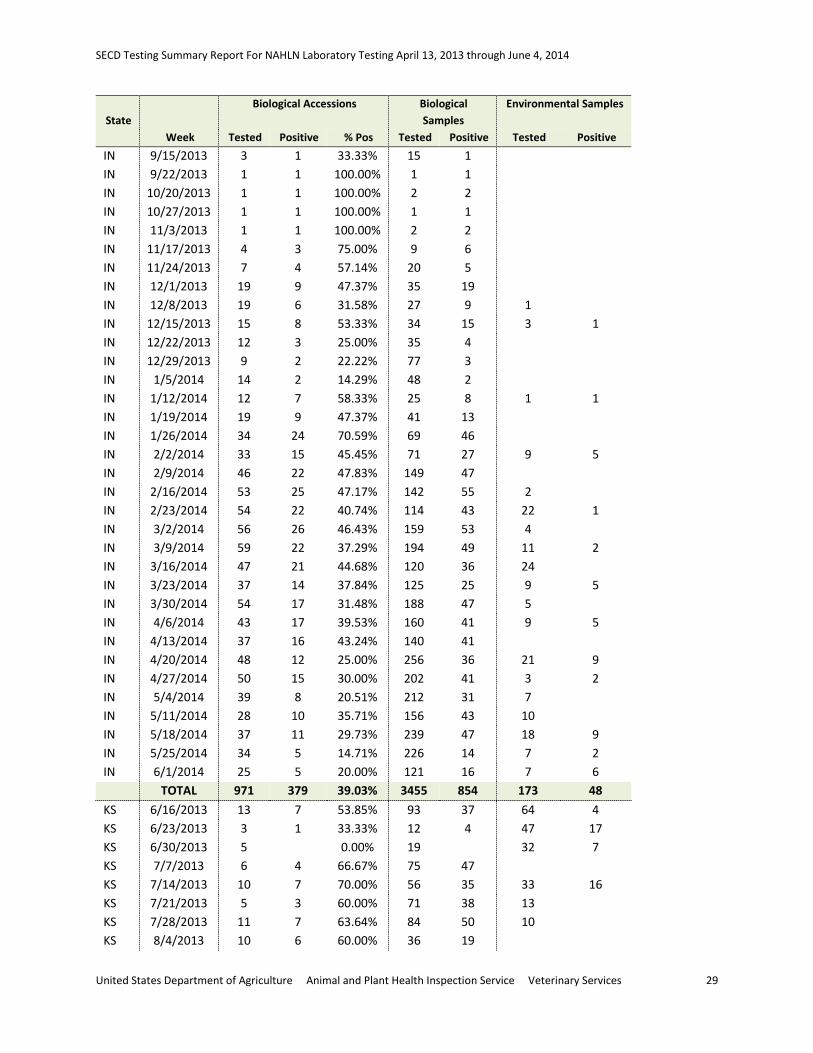
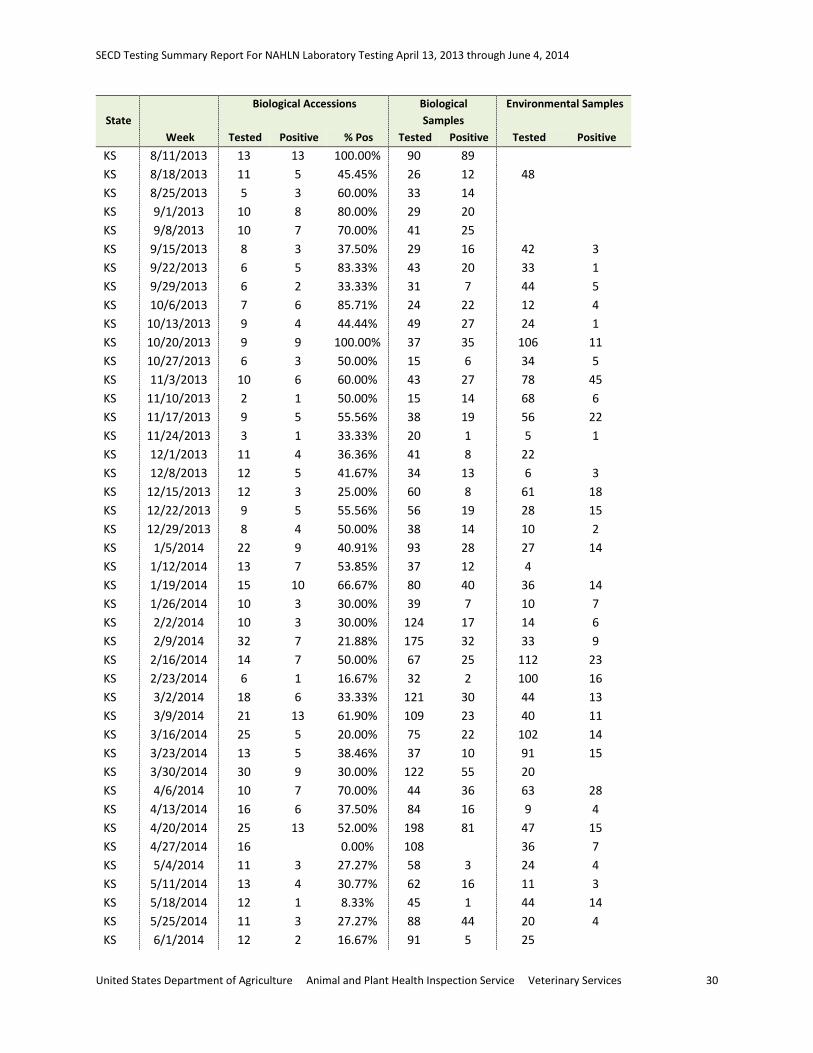
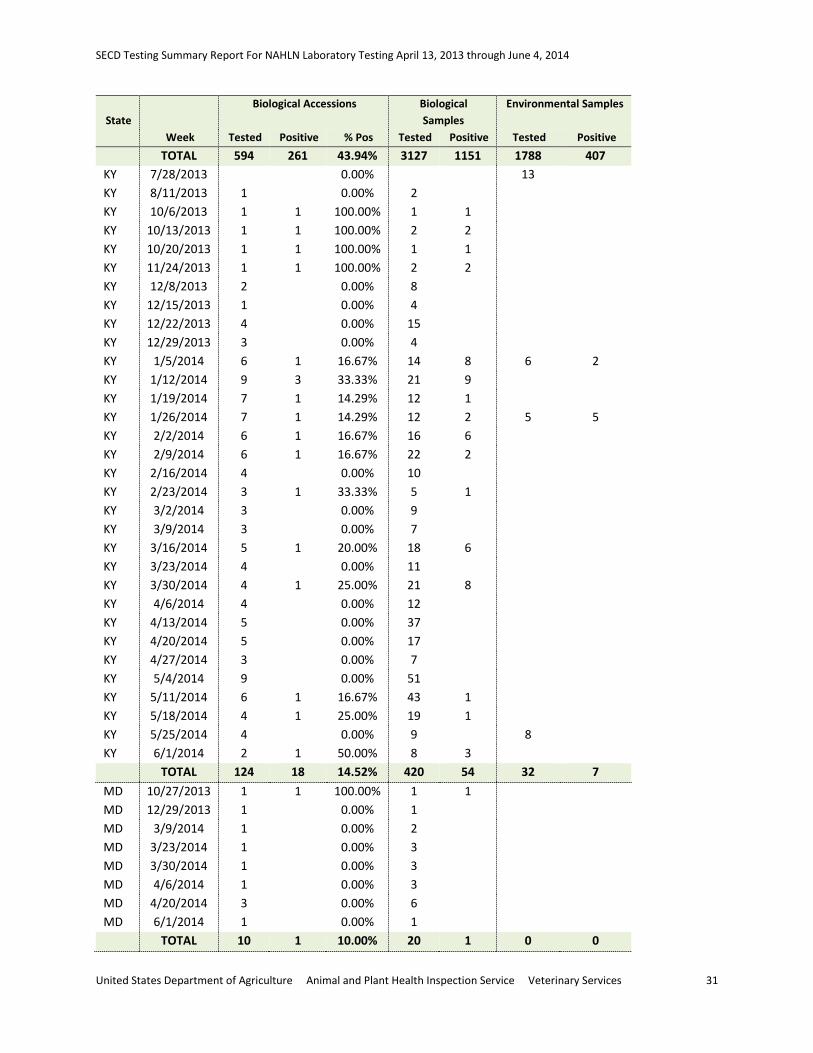
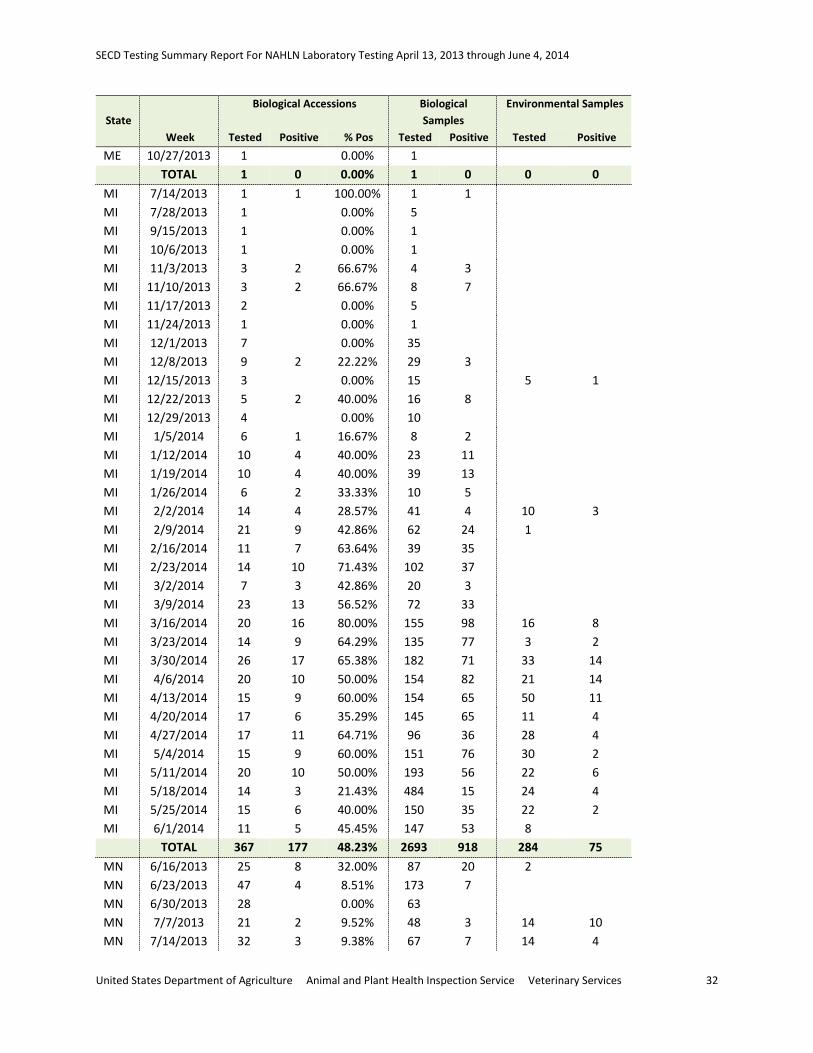
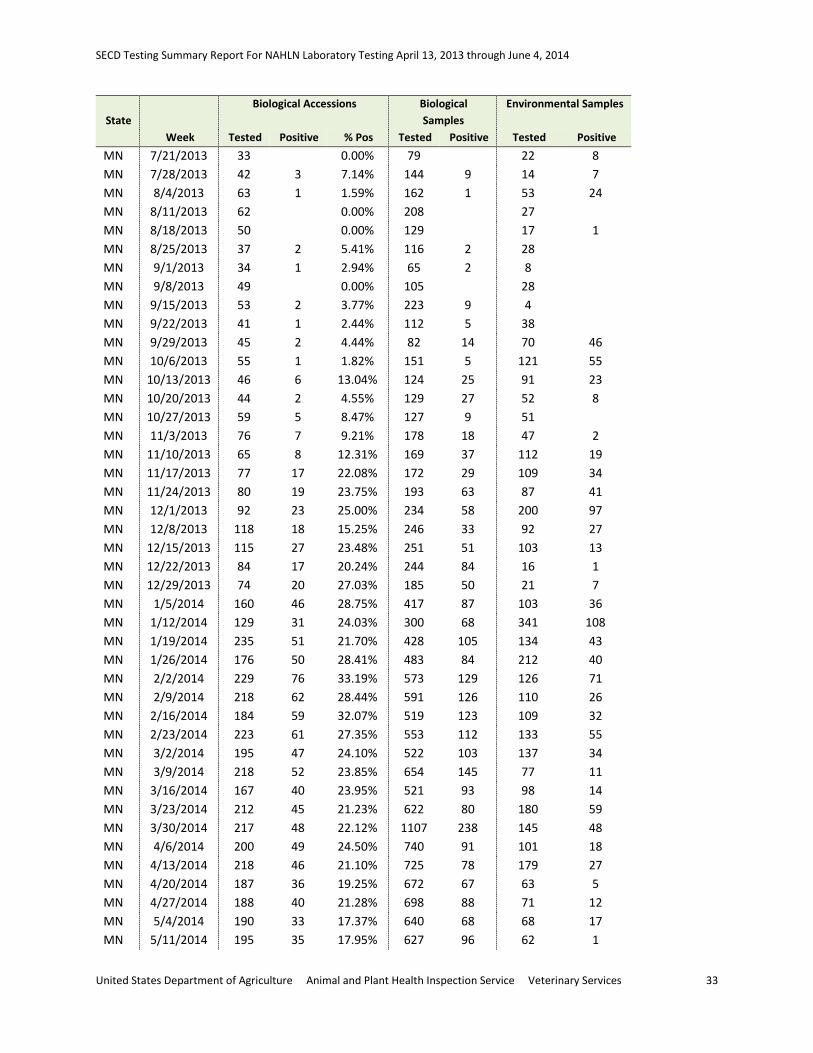
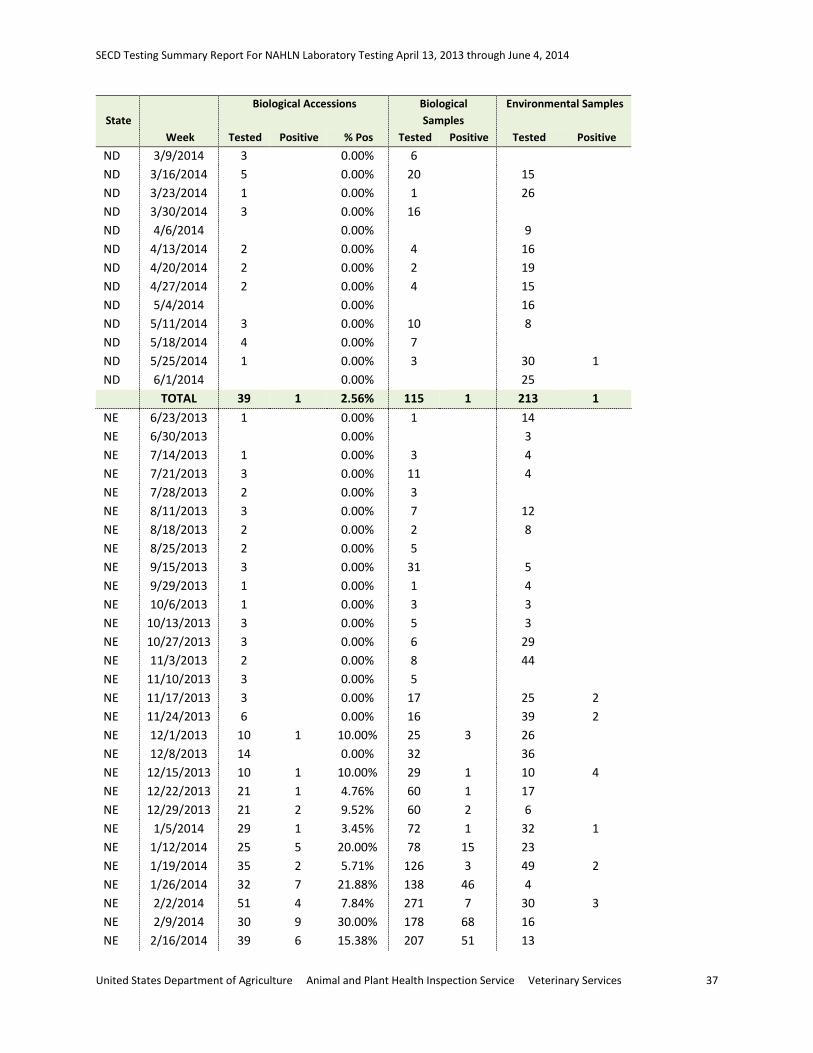
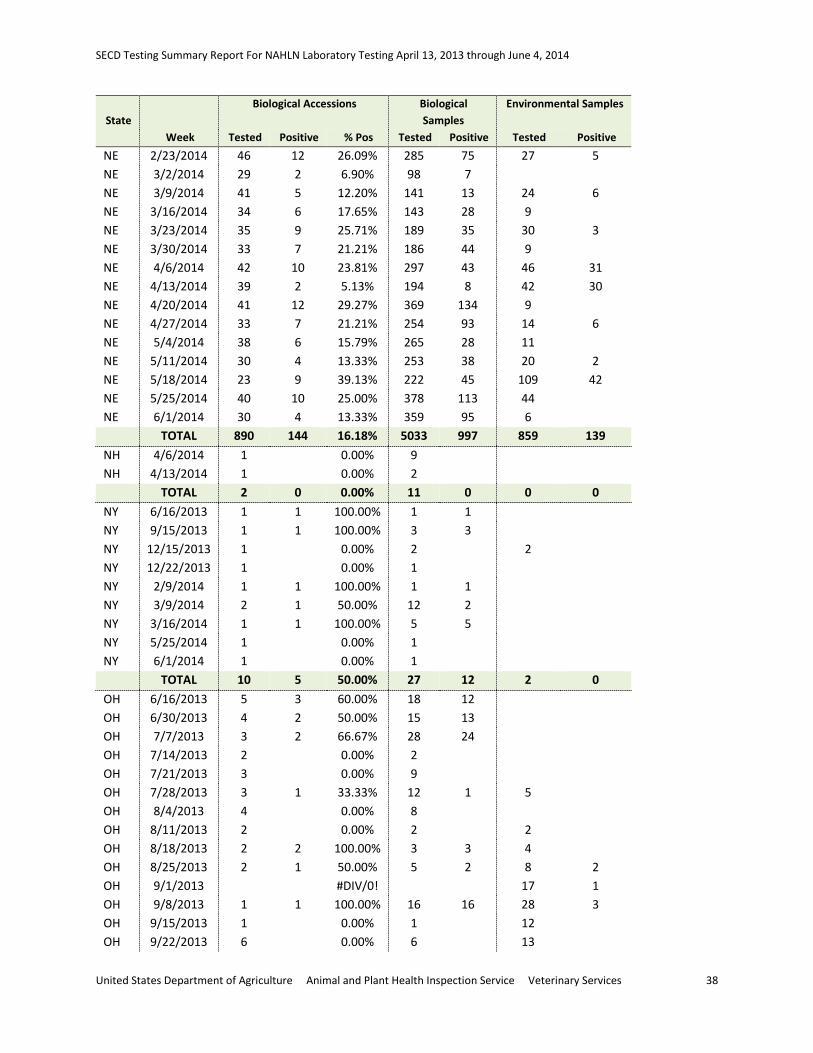
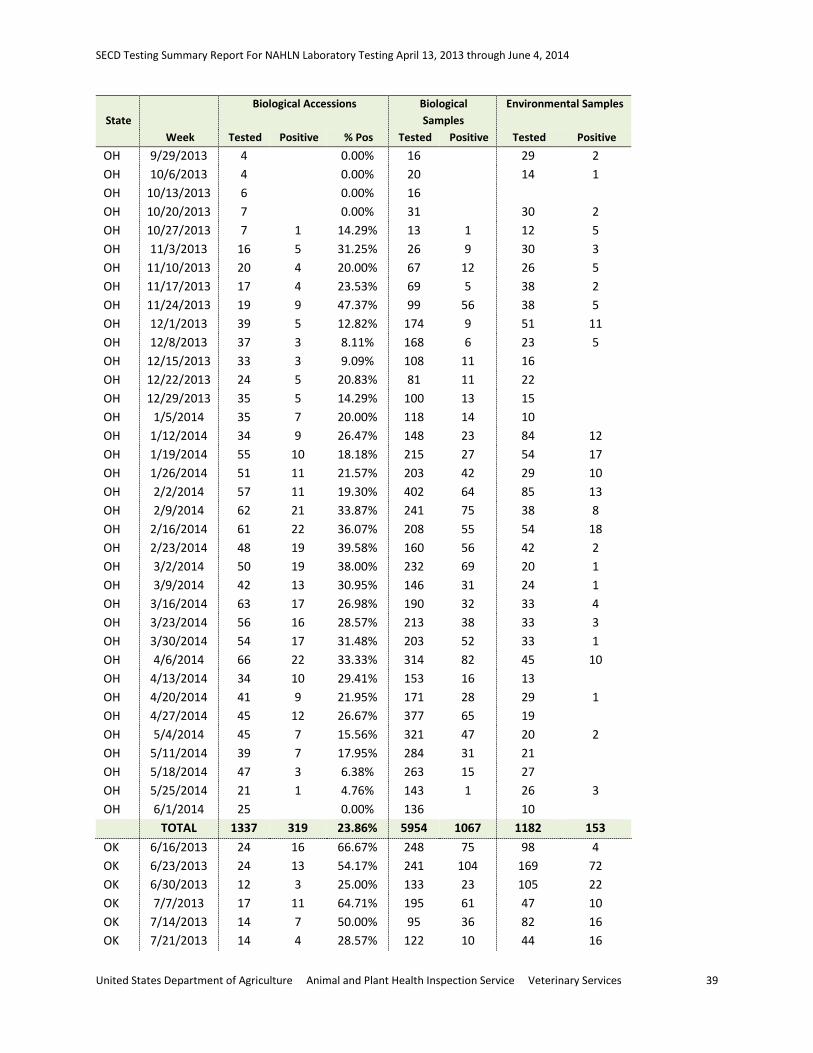
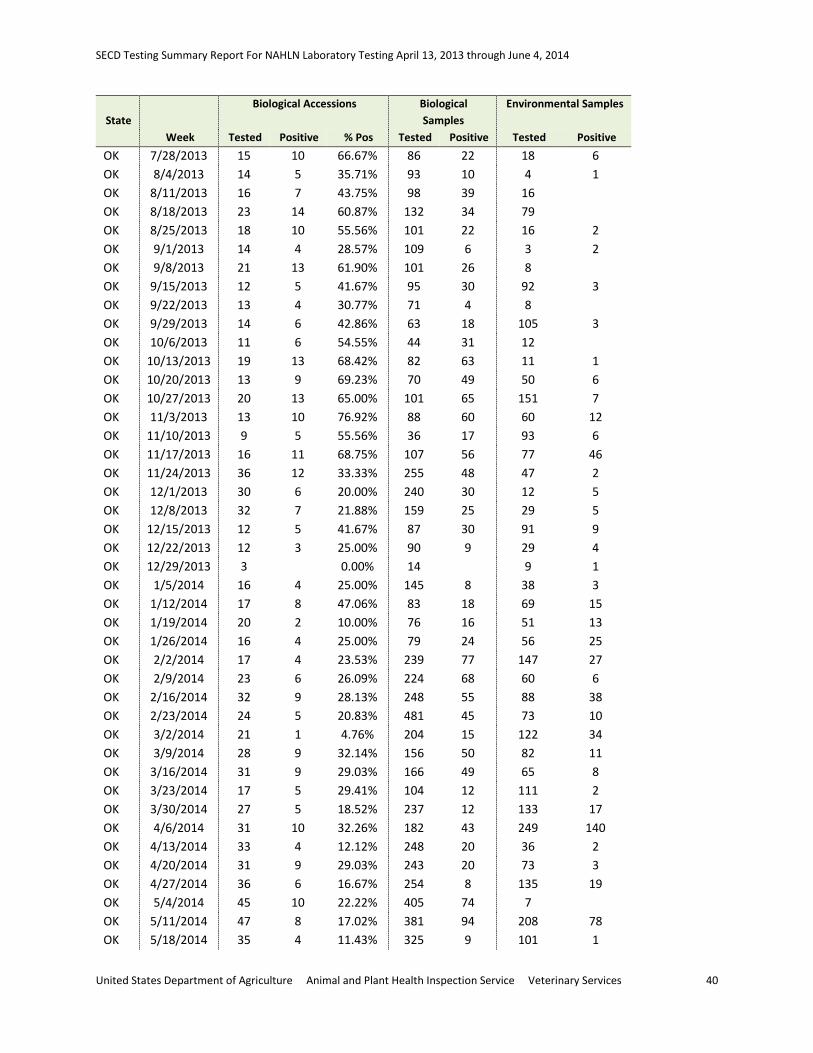
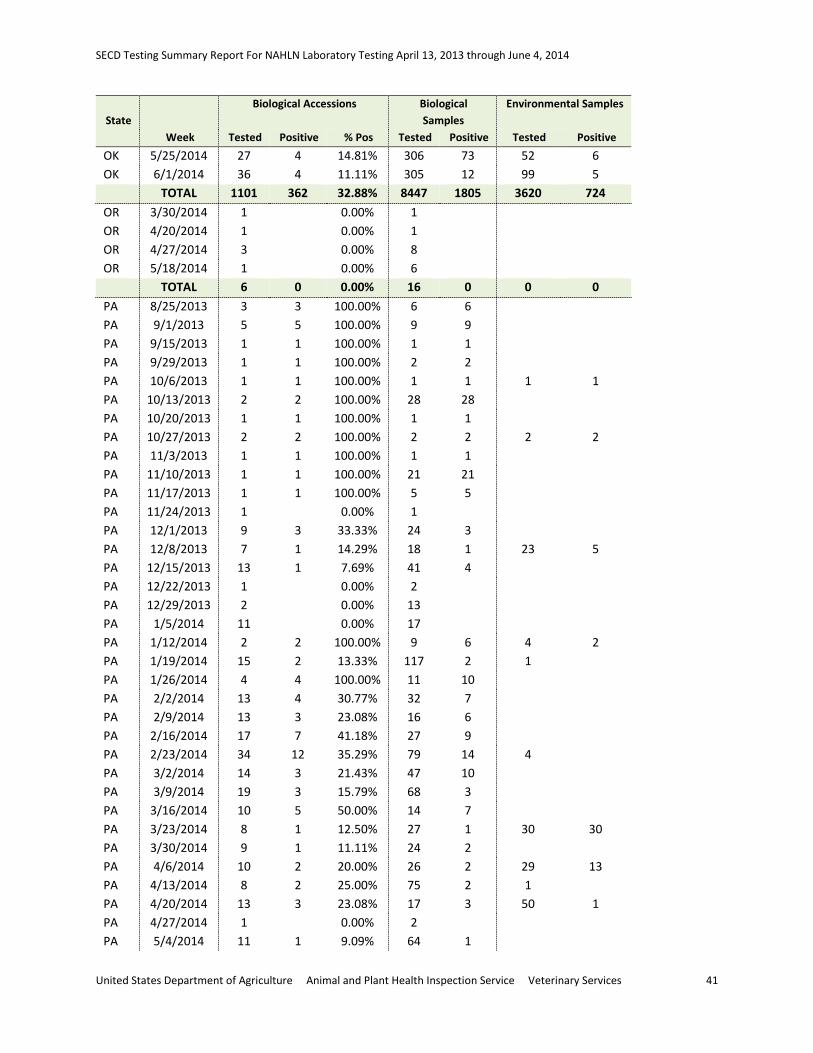
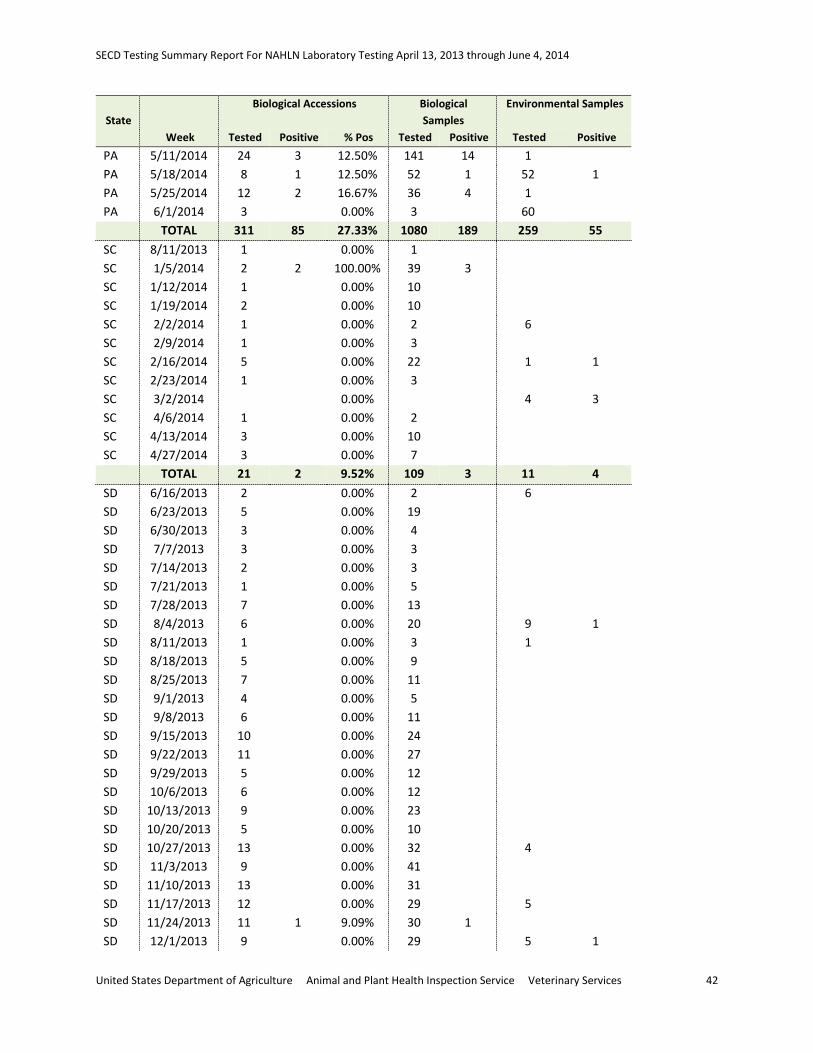
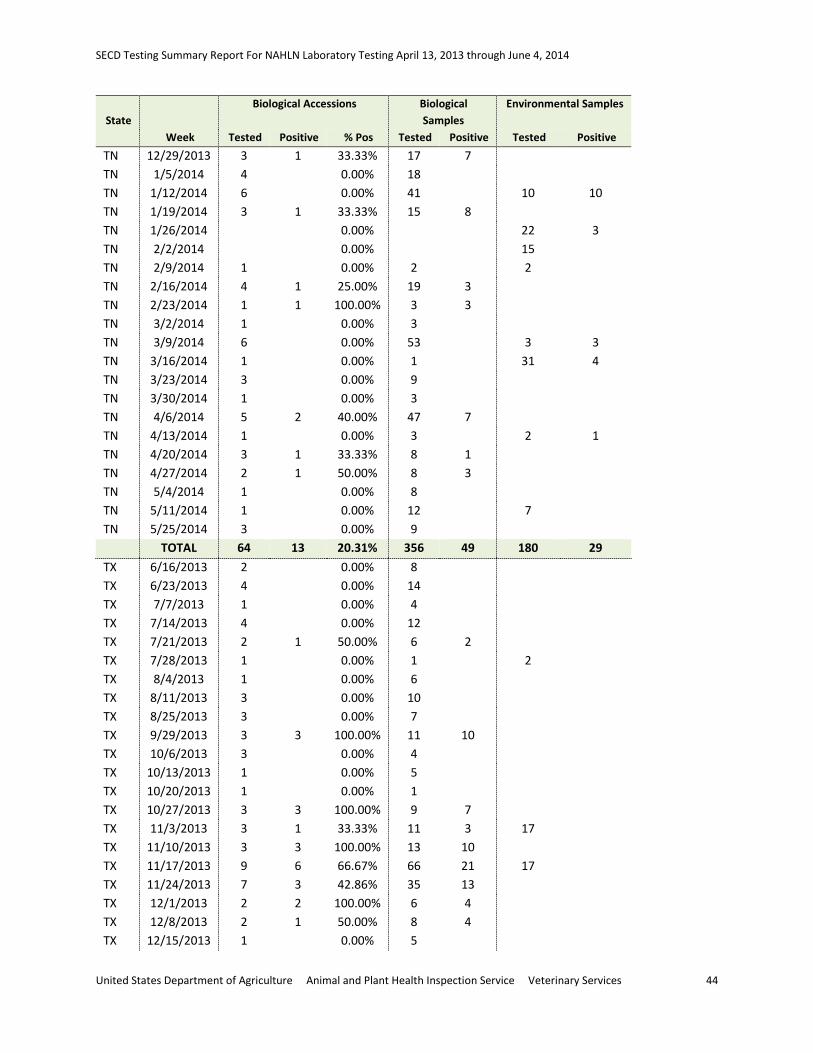
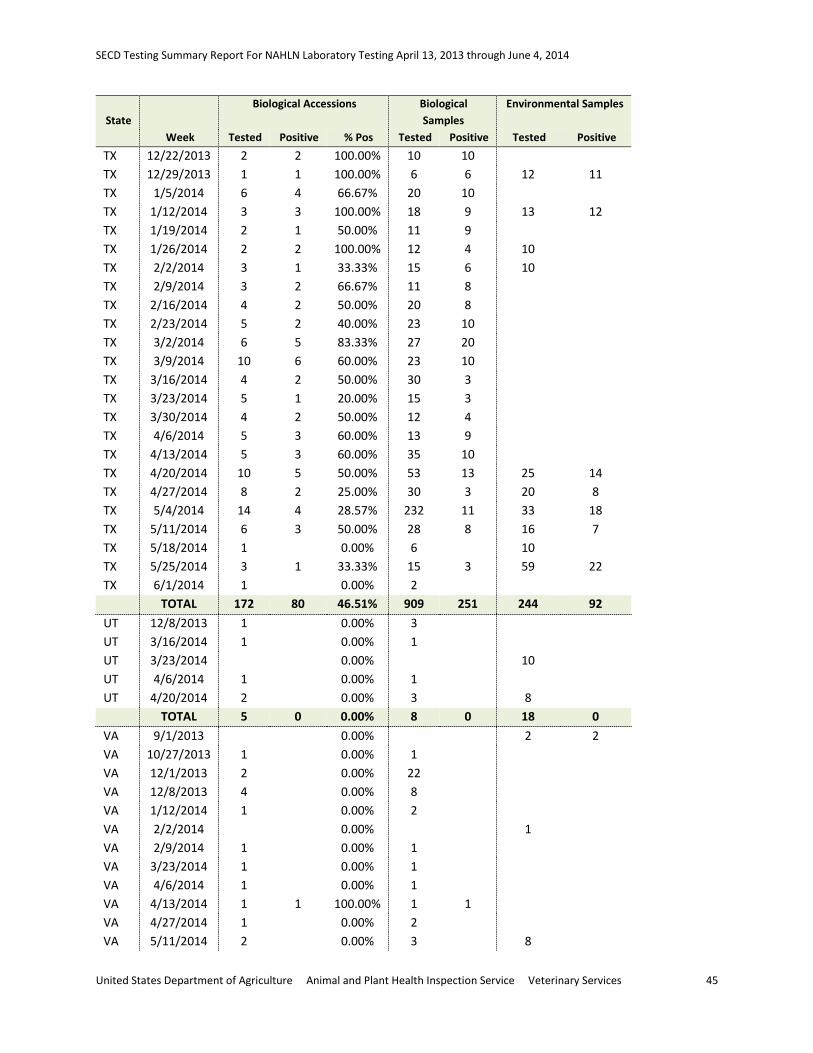
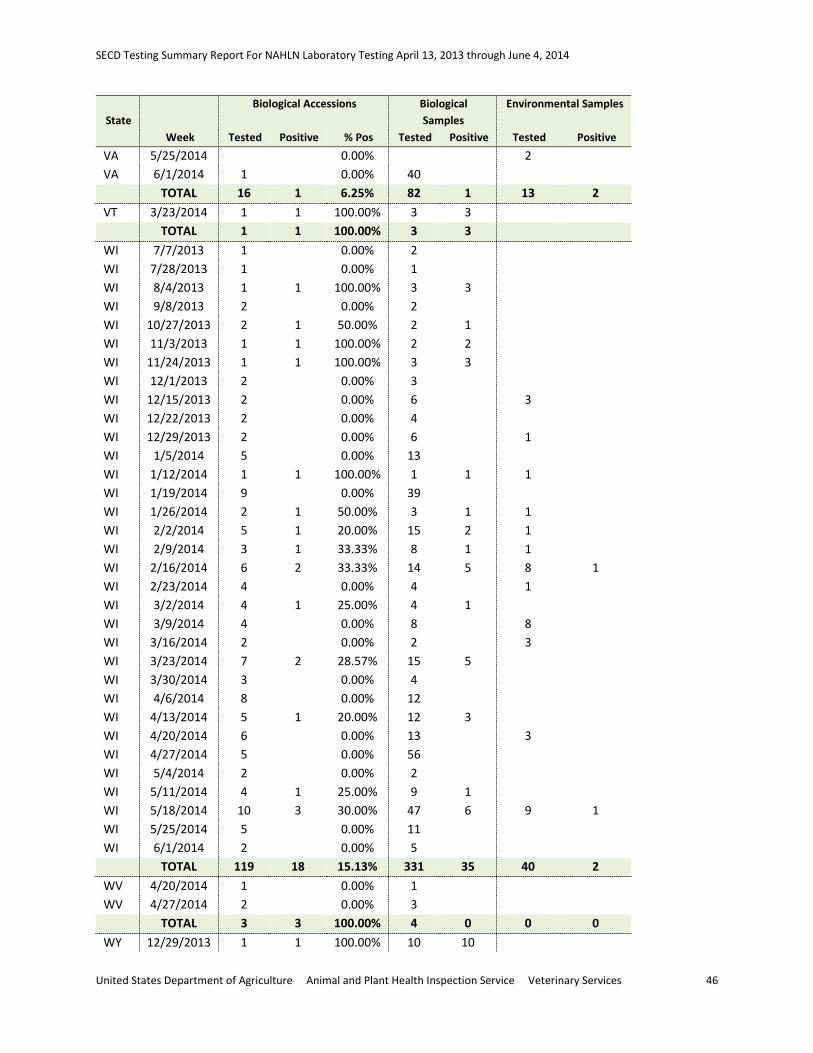
Section 6. Appendices Appendix A. PEDV - Weekly Testing Data for PEDV by State
State Week
Biological Accessions Biological Samples
Environmental Samples
Tested Positive % Pos Tested Positive Tested Positive AL 11/24/2013 1 0.00% AL 1/12/2014 1 0.00% AL 3/16/2014 1 0.00% AL 5/25/2014 1 0.00% TOTAL 4 0 0.00% 0 0 0 0 AR 11/10/2013 1 0.0% 1 AR 11/17/2013 2 0.0% 23 AR 12/8/2013 1 0.0% 2 AR 12/15/2013 4 0.0% 45 AR 12/22/2013 2 0.0% 11 AR 1/5/2014 2 0.0% 9 AR 1/19/2014 1 0.0% 4 AR 1/26/2014 2 0.0% 11 AR 2/23/2014 4 0.0% 16 AR 3/2/2014 1 0.0% 5 AR 3/9/2014 5 0.0% 18 AR 3/16/2014 2 0.0% 12 AR 3/23/2014 3 0.0% 8 AR 3/30/2014 1 0.0% 6 AR 4/6/2014 3 0.0% 4 AR 4/13/2014 5 0.0% 33 AR 4/20/2014 3 0.0% 7 AR 4/27/2014 2 0.0% 7 TOTAL 59 0 0.00% 302 0 0 0 AZ 1/26/2014 1 1 100.00% 7 7 14 3 AZ 2/2/2014 14 2 AZ 2/16/2014 18 2 AZ 2/23/2014 12 AZ 3/2/2014 3 1 33.33% 5 1 AZ 3/9/2014 1 0.00% 2 AZ 3/16/2014 7 3 42.86% 11 6 AZ 3/23/2014 2 0.00% 2 25 6 AZ 3/30/2014 1 0.00% 1 20 11 AZ 4/6/2014 1 0.00% 2 20 5 AZ 4/13/2014 2 0.00% 3 AZ 4/20/2014 1 0.00% 2 40 12 AZ 4/27/2014 1 0.00% 2 37 29 AZ 5/4/2014 1 0.00% 1 7 5
United States Department of Agriculture Animal and Plant Health Inspection Service Veterinary Services 23
SECD Testing Summary Report For NAHLN Laboratory Testing April 13, 2013 through June 4, 2014
State Week
Biological Accessions Biological Samples
Environmental Samples
Tested Positive % Pos Tested Positive Tested Positive AZ 5/11/2014 1 0.00% 1 AZ 5/18/2014 1 0.00% 1 AZ 5/25/2014 1 0.00% 1 35 16 AZ 6/1/2014 1 0.00% 1 TOTAL 25 5 20.00% 42 14 242 91 CA 12/22/2013 1 1 100.00% 2 2 CA 12/29/2013 1 1 100.00% 1 1 CA 1/12/2014 1 1 100.00% 1 1 CA 2/2/2014 1 1 100.00% 4 2 CA 2/9/2014 2 0.00% 2 CA 3/2/2014 4 1 25.00% 6 1 4 CA 3/9/2014 9 2 22.22% 13 4 CA 3/23/2014 3 0.00% 6 CA 3/30/2014 3 1 33.33% 14 2 CA 4/6/2014 3 2 66.67% 50 4 CA 4/13/2014 3 1 33.33% 4 2 CA 4/20/2014 2 0.00% 2 CA 4/27/2014 1 0.00% 2 CA 5/18/2014 2 0.00% 2 CA 5/25/2014 1 0.00% 1 CA 6/1/2014 1 0.00% 2 TOTAL 38 11 28.95% 112 19 4 0 CO 6/16/2013 4 1 25.00% 23 2 70 4 CO 6/23/2013 4 1 25.00% 15 6 2 1 CO 6/30/2013 3 0.00% 38 CO 7/7/2013 3 1 33.33% 15 4 CO 7/14/2013 4 2 50.00% 75 6 16 4 CO 7/21/2013 4 1 25.00% 26 6 CO 7/28/2013 1 1 100.00% 20 4 CO 8/4/2013 4 1 25.00% 32 2 CO 8/11/2013 16 6 37.50% 46 12 CO 8/18/2013 5 1 20.00% 23 5 16 CO 8/25/2013 10 0.00% 78 CO 9/1/2013 9 2 22.22% 101 26 CO 9/8/2013 10 0.00% 37 28 2 CO 9/15/2013 1 0.00% 3 31 1 CO 9/22/2013 8 1 12.50% 29 1 73 2 CO 9/29/2013 9 2 22.22% 56 5 41 CO 10/6/2013 4 1 25.00% 14 2 CO 10/13/2013 6 0.00% 17 8 CO 10/20/2013 7 1 14.29% 28 1 16 CO 10/27/2013 4 0.00% 13 CO 11/3/2013 3 0.00% 11
United States Department of Agriculture Animal and Plant Health Inspection Service Veterinary Services 24
SECD Testing Summary Report For NAHLN Laboratory Testing April 13, 2013 through June 4, 2014
State Week
Biological Accessions Biological Samples
Environmental Samples
Tested Positive % Pos Tested Positive Tested Positive CO 11/10/2013 4 1 25.00% 12 2 CO 11/17/2013 4 1 25.00% 25 15 CO 11/24/2013 7 1 14.29% 36 7 21 4 CO 12/1/2013 7 2 28.57% 27 5 CO 12/8/2013 3 0.00% 10 CO 12/15/2013 7 1 14.29% 23 4 31 1 CO 12/22/2013 1 0.00% 3 CO 12/29/2013 3 0.00% 16 CO 1/5/2014 8 3 37.50% 42 4 2 CO 1/12/2014 6 1 16.67% 25 8 36 CO 1/19/2014 5 2 40.00% 32 15 14 2 CO 1/26/2014 5 2 40.00% 28 17 CO 2/2/2014 7 2 28.57% 55 30 35 CO 2/9/2014 4 2 50.00% 61 25 CO 2/16/2014 8 3 37.50% 56 29 10 1 CO 2/23/2014 5 2 40.00% 43 26 43 CO 3/2/2014 8 1 12.50% 46 5 4 CO 3/9/2014 14 7 50.00% 80 38 19 14 CO 3/16/2014 3 2 66.67% 41 24 13 8 CO 3/23/2014 2 2 100.00% 37 26 8 2 CO 3/30/2014 1 1 100.00% 20 20 19 CO 4/6/2014 9 5 55.56% 106 49 45 37 CO 4/13/2014 6 5 83.33% 37 29 71 12 CO 4/20/2014 6 2 33.33% 40 22 37 25 CO 4/27/2014 14 1 7.14% 77 1 64 31 CO 5/4/2014 3 0.00% 25 CO 5/11/2014 7 5 71.43% 100 33 123 22 CO 5/18/2014 7 3 42.86% 41 14 34 5 CO 5/25/2014 5 3 60.00% 35 8 87 36 CO 6/1/2014 6 2 33.33% 31 5 39 1 TOTAL 294 84 29% 1910 543 1056 215 CT 3/16/2014 1 0.00% 1 TOTAL 1 0 0% 1 0 0 0 GA 6/23/2013 5 GA 12/29/2013 3 0.00% 3 GA 2/9/2014 1 0.00% 4 GA 3/2/2014 1 0.00% 1 GA 3/16/2014 1 0.00% 2 GA 3/30/2014 2 0.00% 8 GA 4/6/2014 1 0.00% 4 GA 4/13/2014 1 0.00% 4 GA 4/27/2014 1 0.00% 4 GA 5/4/2014 1 0.00% 4
United States Department of Agriculture Animal and Plant Health Inspection Service Veterinary Services 25
SECD Testing Summary Report For NAHLN Laboratory Testing April 13, 2013 through June 4, 2014
State Week
Biological Accessions Biological Samples
Environmental Samples
Tested Positive % Pos Tested Positive Tested Positive GA 5/11/2014 1 0.00% 4 GA 5/18/2014 2 0.00% 7 TOTAL 15 0 0% 45 0 5 0 HI 3/16/2014 1 0.00% 1 HI 4/27/2014 1 0.00% 1 TOTAL 2 0 0% 2 0 0 0 IA 6/16/2013 17 10 58.82% 29 15 14 12 IA 6/23/2013 16 15 93.75% 27 25 2 2 IA 6/30/2013 8 3 37.50% 14 4 IA 7/7/2013 9 6 66.67% 20 8 1 1 IA 7/14/2013 12 7 58.33% 27 17 IA 7/21/2013 8 6 75.00% 18 10 IA 7/28/2013 11 5 45.45% 47 23 IA 8/4/2013 14 9 64.29% 42 23 12 12 IA 8/11/2013 11 5 45.45% 25 11 3 3 IA 8/18/2013 11 6 54.55% 60 15 1 1 IA 8/25/2013 6 2 33.33% 12 2 IA 9/1/2013 14 6 42.86% 71 9 IA 9/8/2013 6 0.00% 25 5 IA 9/15/2013 15 7 46.67% 31 9 4 4 IA 9/22/2013 13 3 23.08% 29 3 3 IA 9/29/2013 11 5 45.45% 28 16 4 4 IA 10/6/2013 14 6 42.86% 44 11 IA 10/13/2013 15 10 66.67% 34 16 6 IA 10/20/2013 27 20 74.07% 67 46 6 3 IA 10/27/2013 45 32 71.11% 124 83 6 2 IA 11/3/2013 57 38 66.67% 170 111 19 9 IA 11/10/2013 65 51 78.46% 175 129 31 24 IA 11/17/2013 53 47 88.68% 91 82 28 15 IA 11/24/2013 102 25 24.51% 361 49 113 10 IA 12/1/2013 190 65 34.21% 639 141 248 42 IA 12/8/2013 167 65 38.92% 481 126 141 15 IA 12/15/2013 149 96 64.43% 369 203 33 7 IA 12/22/2013 151 61 40.40% 476 115 49 12 IA 12/29/2013 141 49 34.75% 490 118 30 11 IA 1/5/2014 187 81 43.32% 589 189 106 34 IA 1/12/2014 106 88 83.02% 253 188 67 22 IA 1/19/2014 171 70 40.94% 641 173 75 8 IA 1/26/2014 110 87 79.09% 354 221 117 14 IA 2/2/2014 211 93 44.08% 699 247 190 40 IA 2/9/2014 203 91 44.83% 617 200 177 36 IA 2/16/2014 184 90 48.91% 839 223 141 56 IA 2/23/2014 165 79 47.88% 565 156 212 71
United States Department of Agriculture Animal and Plant Health Inspection Service Veterinary Services 26
SECD Testing Summary Report For NAHLN Laboratory Testing April 13, 2013 through June 4, 2014
State Week
Biological Accessions Biological Samples
Environmental Samples
Tested Positive % Pos Tested Positive Tested Positive IA 3/2/2014 152 81 53.29% 511 152 133 27 IA 3/9/2014 178 71 39.89% 690 148 379 75 IA 3/16/2014 129 54 41.86% 510 159 227 44 IA 3/23/2014 132 48 36.36% 658 103 213 55 IA 3/30/2014 135 51 37.78% 652 171 239 81 IA 4/6/2014 136 48 35.29% 639 101 222 42 IA 4/13/2014 118 42 35.59% 577 186 212 23 IA 4/20/2014 132 52 39.39% 840 126 308 88 IA 4/27/2014 118 44 37.29% 543 120 197 50 IA 5/4/2014 122 40 32.79% 610 146 217 21 IA 5/11/2014 129 31 24.03% 762 104 216 22 IA 5/18/2014 109 32 29.36% 628 112 268 34 IA 5/25/2014 106 32 30.19% 755 123 192 31 IA 6/1/2014 55 9 16.36% 337 28 103 1 TOTAL 4446 1974 44% 17295 4796 4970 1064 ID 2/2/2014 1 1 100.00% 1 1 ID 2/9/2014 3 0.00% 3 ID 2/23/2014 1 1 100.00% 2 2 ID 3/16/2014 1 1 100.00% 1 1 ID 3/23/2014 1 0.00% 1 ID 3/30/2014 1 0.00% 2 ID 5/4/2014 2 1 50.00% 24 17 TOTAL 10 4 40% 34 21 0 0 IL 6/16/2013 4 0.00% 4 IL 6/23/2013 7 0.00% 24 IL 6/30/2013 2 0.00% 4 IL 7/7/2013 9 1 11.11% 23 4 IL 7/14/2013 5 0.00% 10 IL 7/21/2013 5 0.00% 8 IL 7/28/2013 12 1 8.33% 47 6 8 IL 8/4/2013 5 1 20.00% 8 1 IL 8/11/2013 9 0.00% 11 IL 8/18/2013 11 0.00% 17 IL 8/25/2013 15 0.00% 25 IL 9/1/2013 3 0.00% 3 IL 9/8/2013 3 0.00% 9 7 IL 9/15/2013 6 0.00% 8 IL 9/22/2013 6 0.00% 7 IL 9/29/2013 7 0.00% 9 IL 10/6/2013 4 0.00% 8 IL 10/13/2013 9 0.00% 12 IL 10/20/2013 13 2 15.38% 40 17 IL 10/27/2013 11 4 36.36% 30 23 2
United States Department of Agriculture Animal and Plant Health Inspection Service Veterinary Services 27

SECD Testing Summary Report For NAHLN Laboratory Testing April 13, 2013 through June 4, 2014
State Week
Biological Accessions Biological Samples
Environmental Samples
Tested Positive % Pos Tested Positive Tested Positive IL 11/3/2013 4 1 25.00% 7 3 30 24 IL 11/10/2013 12 0.00% 15 4 IL 11/17/2013 10 5 50.00% 20 11 13 IL 11/24/2013 8 0.00% 32 9 1 IL 12/1/2013 60 10 16.67% 235 39 15 7 IL 12/8/2013 68 8 11.76% 245 27 33 IL 12/15/2013 44 15 34.09% 146 36 31 6 IL 12/22/2013 32 8 25.00% 161 55 13 1 IL 12/29/2013 58 13 22.41% 352 149 138 1 IL 1/5/2014 82 10 12.20% 377 69 106 20 IL 1/12/2014 61 19 31.15% 256 86 10 3 IL 1/19/2014 77 21 27.27% 330 102 19 IL 1/26/2014 58 39 67.24% 269 149 12 1 IL 2/2/2014 93 27 29.03% 503 108 12 2 IL 2/9/2014 81 27 33.33% 365 108 25 IL 2/16/2014 110 35 31.82% 426 190 17 3 IL 2/23/2014 91 41 45.05% 424 193 20 2 IL 3/2/2014 101 32 31.68% 344 104 30 6 IL 3/9/2014 105 43 40.95% 387 153 45 3 IL 3/16/2014 115 44 38.26% 550 211 27 5 IL 3/23/2014 96 43 44.79% 655 271 21 IL 3/30/2014 145 41 28.28% 934 331 17 4 IL 4/6/2014 114 43 37.72% 845 345 72 15 IL 4/13/2014 115 43 37.39% 881 329 42 15 IL 4/20/2014 96 30 31.25% 826 254 125 31 IL 4/27/2014 122 32 26.23% 1126 256 101 38 IL 5/4/2014 117 25 21.37% 1009 190 45 7 IL 5/11/2014 118 31 26.27% 1225 240 89 18 IL 5/18/2014 117 25 21.37% 1102 248 115 16 IL 5/25/2014 120 26 21.67% 1200 226 93 29 IL 6/1/2014 65 11 16.92% 757 57 114 3 TOTAL 2641 757 29% 16311 4591 1460 261 IN 6/16/2013 1 1 100.00% 1 1 IN 6/23/2013 2 1 50.00% 3 2 IN 7/7/2013 2 2 100.00% 3 3 IN 7/14/2013 5 4 80.00% 11 8 IN 7/21/2013 1 1 100.00% 4 4 IN 7/28/2013 1 1 100.00% 1 1 IN 8/4/2013 3 1 33.33% 9 1 IN 8/18/2013 1 1 100.00% 3 2 IN 8/25/2013 2 1 50.00% 3 2 IN 9/1/2013 1 1 100.00% 1 1 IN 9/8/2013 1 0.00% 1
United States Department of Agriculture Animal and Plant Health Inspection Service Veterinary Services 28
SECD Testing Summary Report For NAHLN Laboratory Testing April 13, 2013 through June 4, 2014
State Week
Biological Accessions Biological Samples
Environmental Samples
Tested Positive % Pos Tested Positive Tested Positive IN 9/15/2013 3 1 33.33% 15 1 IN 9/22/2013 1 1 100.00% 1 1 IN 10/20/2013 1 1 100.00% 2 2 IN 10/27/2013 1 1 100.00% 1 1 IN 11/3/2013 1 1 100.00% 2 2 IN 11/17/2013 4 3 75.00% 9 6 IN 11/24/2013 7 4 57.14% 20 5 IN 12/1/2013 19 9 47.37% 35 19 IN 12/8/2013 19 6 31.58% 27 9 1 IN 12/15/2013 15 8 53.33% 34 15 3 1 IN 12/22/2013 12 3 25.00% 35 4 IN 12/29/2013 9 2 22.22% 77 3 IN 1/5/2014 14 2 14.29% 48 2 IN 1/12/2014 12 7 58.33% 25 8 1 1 IN 1/19/2014 19 9 47.37% 41 13 IN 1/26/2014 34 24 70.59% 69 46 IN 2/2/2014 33 15 45.45% 71 27 9 5 IN 2/9/2014 46 22 47.83% 149 47 IN 2/16/2014 53 25 47.17% 142 55 2 IN 2/23/2014 54 22 40.74% 114 43 22 1 IN 3/2/2014 56 26 46.43% 159 53 4 IN 3/9/2014 59 22 37.29% 194 49 11 2 IN 3/16/2014 47 21 44.68% 120 36 24 IN 3/23/2014 37 14 37.84% 125 25 9 5 IN 3/30/2014 54 17 31.48% 188 47 5 IN 4/6/2014 43 17 39.53% 160 41 9 5 IN 4/13/2014 37 16 43.24% 140 41 IN 4/20/2014 48 12 25.00% 256 36 21 9 IN 4/27/2014 50 15 30.00% 202 41 3 2 IN 5/4/2014 39 8 20.51% 212 31 7 IN 5/11/2014 28 10 35.71% 156 43 10 IN 5/18/2014 37 11 29.73% 239 47 18 9 IN 5/25/2014 34 5 14.71% 226 14 7 2 IN 6/1/2014 25 5 20.00% 121 16 7 6 TOTAL 971 379 39.03% 3455 854 173 48 KS 6/16/2013 13 7 53.85% 93 37 64 4 KS 6/23/2013 3 1 33.33% 12 4 47 17 KS 6/30/2013 5 0.00% 19 32 7 KS 7/7/2013 6 4 66.67% 75 47 KS 7/14/2013 10 7 70.00% 56 35 33 16 KS 7/21/2013 5 3 60.00% 71 38 13 KS 7/28/2013 11 7 63.64% 84 50 10 KS 8/4/2013 10 6 60.00% 36 19
United States Department of Agriculture Animal and Plant Health Inspection Service Veterinary Services 29
SECD Testing Summary Report For NAHLN Laboratory Testing April 13, 2013 through June 4, 2014
State Week
Biological Accessions Biological Samples
Environmental Samples
Tested Positive % Pos Tested Positive Tested Positive KS 8/11/2013 13 13 100.00% 90 89 KS 8/18/2013 11 5 45.45% 26 12 48 KS 8/25/2013 5 3 60.00% 33 14 KS 9/1/2013 10 8 80.00% 29 20 KS 9/8/2013 10 7 70.00% 41 25 KS 9/15/2013 8 3 37.50% 29 16 42 3 KS 9/22/2013 6 5 83.33% 43 20 33 1 KS 9/29/2013 6 2 33.33% 31 7 44 5 KS 10/6/2013 7 6 85.71% 24 22 12 4 KS 10/13/2013 9 4 44.44% 49 27 24 1 KS 10/20/2013 9 9 100.00% 37 35 106 11 KS 10/27/2013 6 3 50.00% 15 6 34 5 KS 11/3/2013 10 6 60.00% 43 27 78 45 KS 11/10/2013 2 1 50.00% 15 14 68 6 KS 11/17/2013 9 5 55.56% 38 19 56 22 KS 11/24/2013 3 1 33.33% 20 1 5 1 KS 12/1/2013 11 4 36.36% 41 8 22 KS 12/8/2013 12 5 41.67% 34 13 6 3 KS 12/15/2013 12 3 25.00% 60 8 61 18 KS 12/22/2013 9 5 55.56% 56 19 28 15 KS 12/29/2013 8 4 50.00% 38 14 10 2 KS 1/5/2014 22 9 40.91% 93 28 27 14 KS 1/12/2014 13 7 53.85% 37 12 4 KS 1/19/2014 15 10 66.67% 80 40 36 14 KS 1/26/2014 10 3 30.00% 39 7 10 7 KS 2/2/2014 10 3 30.00% 124 17 14 6 KS 2/9/2014 32 7 21.88% 175 32 33 9 KS 2/16/2014 14 7 50.00% 67 25 112 23 KS 2/23/2014 6 1 16.67% 32 2 100 16 KS 3/2/2014 18 6 33.33% 121 30 44 13 KS 3/9/2014 21 13 61.90% 109 23 40 11 KS 3/16/2014 25 5 20.00% 75 22 102 14 KS 3/23/2014 13 5 38.46% 37 10 91 15 KS 3/30/2014 30 9 30.00% 122 55 20 KS 4/6/2014 10 7 70.00% 44 36 63 28 KS 4/13/2014 16 6 37.50% 84 16 9 4 KS 4/20/2014 25 13 52.00% 198 81 47 15 KS 4/27/2014 16 0.00% 108 36 7 KS 5/4/2014 11 3 27.27% 58 3 24 4 KS 5/11/2014 13 4 30.77% 62 16 11 3 KS 5/18/2014 12 1 8.33% 45 1 44 14 KS 5/25/2014 11 3 27.27% 88 44 20 4 KS 6/1/2014 12 2 16.67% 91 5 25
United States Department of Agriculture Animal and Plant Health Inspection Service Veterinary Services 30
SECD Testing Summary Report For NAHLN Laboratory Testing April 13, 2013 through June 4, 2014
State Week
Biological Accessions Biological Samples
Environmental Samples
Tested Positive % Pos Tested Positive Tested Positive TOTAL 594 261 43.94% 3127 1151 1788 407 KY 7/28/2013 0.00% 13 KY 8/11/2013 1 0.00% 2 KY 10/6/2013 1 1 100.00% 1 1 KY 10/13/2013 1 1 100.00% 2 2 KY 10/20/2013 1 1 100.00% 1 1 KY 11/24/2013 1 1 100.00% 2 2 KY 12/8/2013 2 0.00% 8 KY 12/15/2013 1 0.00% 4 KY 12/22/2013 4 0.00% 15 KY 12/29/2013 3 0.00% 4 KY 1/5/2014 6 1 16.67% 14 8 6 2 KY 1/12/2014 9 3 33.33% 21 9 KY 1/19/2014 7 1 14.29% 12 1 KY 1/26/2014 7 1 14.29% 12 2 5 5 KY 2/2/2014 6 1 16.67% 16 6 KY 2/9/2014 6 1 16.67% 22 2 KY 2/16/2014 4 0.00% 10 KY 2/23/2014 3 1 33.33% 5 1 KY 3/2/2014 3 0.00% 9 KY 3/9/2014 3 0.00% 7 KY 3/16/2014 5 1 20.00% 18 6 KY 3/23/2014 4 0.00% 11 KY 3/30/2014 4 1 25.00% 21 8 KY 4/6/2014 4 0.00% 12 KY 4/13/2014 5 0.00% 37 KY 4/20/2014 5 0.00% 17 KY 4/27/2014 3 0.00% 7 KY 5/4/2014 9 0.00% 51 KY 5/11/2014 6 1 16.67% 43 1 KY 5/18/2014 4 1 25.00% 19 1 KY 5/25/2014 4 0.00% 9 8 KY 6/1/2014 2 1 50.00% 8 3 TOTAL 124 18 14.52% 420 54 32 7 MD 10/27/2013 1 1 100.00% 1 1 MD 12/29/2013 1 0.00% 1 MD 3/9/2014 1 0.00% 2 MD 3/23/2014 1 0.00% 3 MD 3/30/2014 1 0.00% 3 MD 4/6/2014 1 0.00% 3 MD 4/20/2014 3 0.00% 6 MD 6/1/2014 1 0.00% 1 TOTAL 10 1 10.00% 20 1 0 0
United States Department of Agriculture Animal and Plant Health Inspection Service Veterinary Services 31
SECD Testing Summary Report For NAHLN Laboratory Testing April 13, 2013 through June 4, 2014
State Week
Biological Accessions Biological Samples
Environmental Samples
Tested Positive % Pos Tested Positive Tested Positive ME 10/27/2013 1 0.00% 1 TOTAL 1 0 0.00% 1 0 0 0 MI 7/14/2013 1 1 100.00% 1 1 MI 7/28/2013 1 0.00% 5 MI 9/15/2013 1 0.00% 1 MI 10/6/2013 1 0.00% 1 MI 11/3/2013 3 2 66.67% 4 3 MI 11/10/2013 3 2 66.67% 8 7 MI 11/17/2013 2 0.00% 5 MI 11/24/2013 1 0.00% 1 MI 12/1/2013 7 0.00% 35 MI 12/8/2013 9 2 22.22% 29 3 MI 12/15/2013 3 0.00% 15 5 1 MI 12/22/2013 5 2 40.00% 16 8 MI 12/29/2013 4 0.00% 10 MI 1/5/2014 6 1 16.67% 8 2 MI 1/12/2014 10 4 40.00% 23 11 MI 1/19/2014 10 4 40.00% 39 13 MI 1/26/2014 6 2 33.33% 10 5 MI 2/2/2014 14 4 28.57% 41 4 10 3 MI 2/9/2014 21 9 42.86% 62 24 1 MI 2/16/2014 11 7 63.64% 39 35 MI 2/23/2014 14 10 71.43% 102 37 MI 3/2/2014 7 3 42.86% 20 3 MI 3/9/2014 23 13 56.52% 72 33 MI 3/16/2014 20 16 80.00% 155 98 16 8 MI 3/23/2014 14 9 64.29% 135 77 3 2 MI 3/30/2014 26 17 65.38% 182 71 33 14 MI 4/6/2014 20 10 50.00% 154 82 21 14 MI 4/13/2014 15 9 60.00% 154 65 50 11 MI 4/20/2014 17 6 35.29% 145 65 11 4 MI 4/27/2014 17 11 64.71% 96 36 28 4 MI 5/4/2014 15 9 60.00% 151 76 30 2 MI 5/11/2014 20 10 50.00% 193 56 22 6 MI 5/18/2014 14 3 21.43% 484 15 24 4 MI 5/25/2014 15 6 40.00% 150 35 22 2 MI 6/1/2014 11 5 45.45% 147 53 8 TOTAL 367 177 48.23% 2693 918 284 75 MN 6/16/2013 25 8 32.00% 87 20 2 MN 6/23/2013 47 4 8.51% 173 7 MN 6/30/2013 28 0.00% 63 MN 7/7/2013 21 2 9.52% 48 3 14 10 MN 7/14/2013 32 3 9.38% 67 7 14 4
United States Department of Agriculture Animal and Plant Health Inspection Service Veterinary Services 32
SECD Testing Summary Report For NAHLN Laboratory Testing April 13, 2013 through June 4, 2014
State Week
Biological Accessions Biological Samples
Environmental Samples
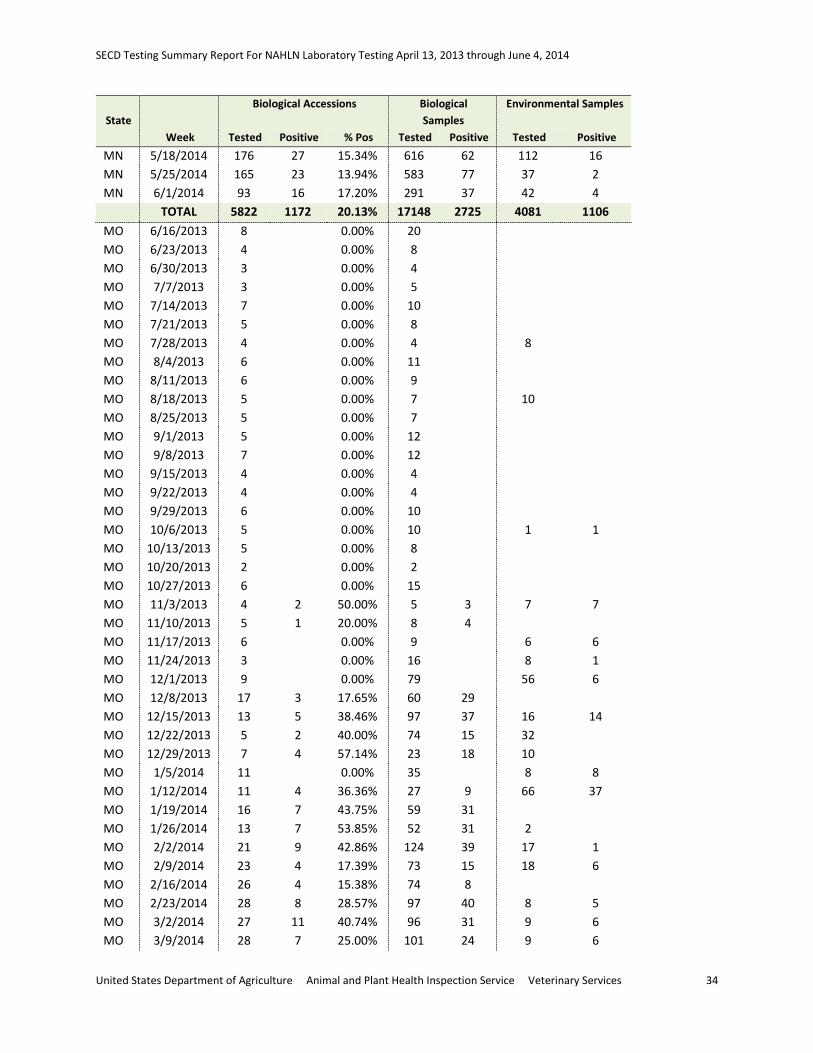
Tested Positive % Pos Tested Positive Tested Positive MN 7/21/2013 33 0.00% 79 22 8 MN 7/28/2013 42 3 7.14% 144 9 14 7 MN 8/4/2013 63 1 1.59% 162 1 53 24 MN 8/11/2013 62 0.00% 208 27 MN 8/18/2013 50 0.00% 129 17 1 MN 8/25/2013 37 2 5.41% 116 2 28 MN 9/1/2013 34 1 2.94% 65 2 8 MN 9/8/2013 49 0.00% 105 28 MN 9/15/2013 53 2 3.77% 223 9 4 MN 9/22/2013 41 1 2.44% 112 5 38 MN 9/29/2013 45 2 4.44% 82 14 70 46 MN 10/6/2013 55 1 1.82% 151 5 121 55 MN 10/13/2013 46 6 13.04% 124 25 91 23 MN 10/20/2013 44 2 4.55% 129 27 52 8 MN 10/27/2013 59 5 8.47% 127 9 51 MN 11/3/2013 76 7 9.21% 178 18 47 2 MN 11/10/2013 65 8 12.31% 169 37 112 19 MN 11/17/2013 77 17 22.08% 172 29 109 34 MN 11/24/2013 80 19 23.75% 193 63 87 41 MN 12/1/2013 92 23 25.00% 234 58 200 97 MN 12/8/2013 118 18 15.25% 246 33 92 27 MN 12/15/2013 115 27 23.48% 251 51 103 13 MN 12/22/2013 84 17 20.24% 244 84 16 1 MN 12/29/2013 74 20 27.03% 185 50 21 7 MN 1/5/2014 160 46 28.75% 417 87 103 36 MN 1/12/2014 129 31 24.03% 300 68 341 108 MN 1/19/2014 235 51 21.70% 428 105 134 43 MN 1/26/2014 176 50 28.41% 483 84 212 40 MN 2/2/2014 229 76 33.19% 573 129 126 71 MN 2/9/2014 218 62 28.44% 591 126 110 26 MN 2/16/2014 184 59 32.07% 519 123 109 32 MN 2/23/2014 223 61 27.35% 553 112 133 55 MN 3/2/2014 195 47 24.10% 522 103 137 34 MN 3/9/2014 218 52 23.85% 654 145 77 11 MN 3/16/2014 167 40 23.95% 521 93 98 14 MN 3/23/2014 212 45 21.23% 622 80 180 59 MN 3/30/2014 217 48 22.12% 1107 238 145 48 MN 4/6/2014 200 49 24.50% 740 91 101 18 MN 4/13/2014 218 46 21.10% 725 78 179 27 MN 4/20/2014 187 36 19.25% 672 67 63 5 MN 4/27/2014 188 40 21.28% 698 88 71 12 MN 5/4/2014 190 33 17.37% 640 68 68 17 MN 5/11/2014 195 35 17.95% 627 96 62 1
United States Department of Agriculture Animal and Plant Health Inspection Service Veterinary Services 33
SECD Testing Summary Report For NAHLN Laboratory Testing April 13, 2013 through June 4, 2014
State Week
Biological Accessions Biological Samples
Environmental Samples
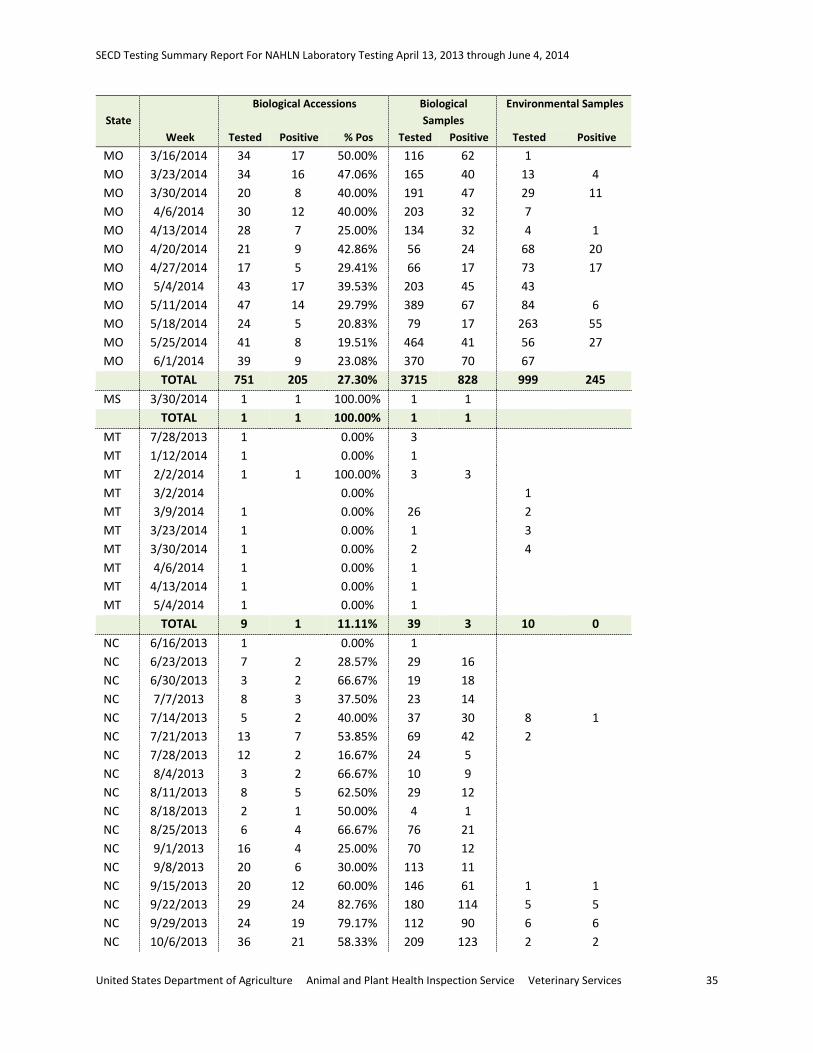
Tested Positive % Pos Tested Positive Tested Positive MN 5/18/2014 176 27 15.34% 616 62 112 16 MN 5/25/2014 165 23 13.94% 583 77 37 2 MN 6/1/2014 93 16 17.20% 291 37 42 4 TOTAL 5822 1172 20.13% 17148 2725 4081 1106 MO 6/16/2013 8 0.00% 20 MO 6/23/2013 4 0.00% 8 MO 6/30/2013 3 0.00% 4 MO 7/7/2013 3 0.00% 5 MO 7/14/2013 7 0.00% 10 MO 7/21/2013 5 0.00% 8 MO 7/28/2013 4 0.00% 4 8 MO 8/4/2013 6 0.00% 11 MO 8/11/2013 6 0.00% 9 MO 8/18/2013 5 0.00% 7 10 MO 8/25/2013 5 0.00% 7 MO 9/1/2013 5 0.00% 12 MO 9/8/2013 7 0.00% 12 MO 9/15/2013 4 0.00% 4 MO 9/22/2013 4 0.00% 4 MO 9/29/2013 6 0.00% 10 MO 10/6/2013 5 0.00% 10 1 1 MO 10/13/2013 5 0.00% 8 MO 10/20/2013 2 0.00% 2 MO 10/27/2013 6 0.00% 15 MO 11/3/2013 4 2 50.00% 5 3 7 7 MO 11/10/2013 5 1 20.00% 8 4 MO 11/17/2013 6 0.00% 9 6 6 MO 11/24/2013 3 0.00% 16 8 1 MO 12/1/2013 9 0.00% 79 56 6 MO 12/8/2013 17 3 17.65% 60 29 MO 12/15/2013 13 5 38.46% 97 37 16 14 MO 12/22/2013 5 2 40.00% 74 15 32 MO 12/29/2013 7 4 57.14% 23 18 10 MO 1/5/2014 11 0.00% 35 8 8 MO 1/12/2014 11 4 36.36% 27 9 66 37 MO 1/19/2014 16 7 43.75% 59 31 MO 1/26/2014 13 7 53.85% 52 31 2 MO 2/2/2014 21 9 42.86% 124 39 17 1 MO 2/9/2014 23 4 17.39% 73 15 18 6 MO 2/16/2014 26 4 15.38% 74 8 MO 2/23/2014 28 8 28.57% 97 40 8 5 MO 3/2/2014 27 11 40.74% 96 31 9 6 MO 3/9/2014 28 7 25.00% 101 24 9 6
United States Department of Agriculture Animal and Plant Health Inspection Service Veterinary Services 34
SECD Testing Summary Report For NAHLN Laboratory Testing April 13, 2013 through June 4, 2014
State Week
Biological Accessions Biological Samples
Environmental Samples
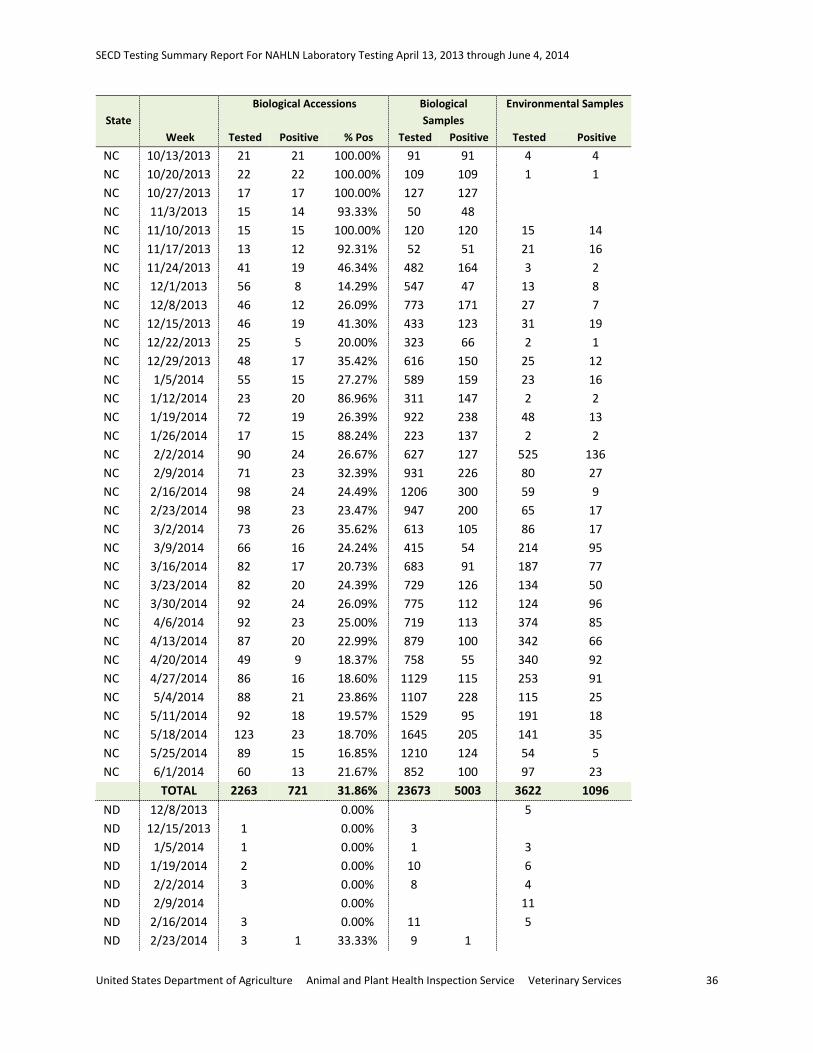
Tested Positive % Pos Tested Positive Tested Positive MO 3/16/2014 34 17 50.00% 116 62 1 MO 3/23/2014 34 16 47.06% 165 40 13 4 MO 3/30/2014 20 8 40.00% 191 47 29 11 MO 4/6/2014 30 12 40.00% 203 32 7 MO 4/13/2014 28 7 25.00% 134 32 4 1 MO 4/20/2014 21 9 42.86% 56 24 68 20 MO 4/27/2014 17 5 29.41% 66 17 73 17 MO 5/4/2014 43 17 39.53% 203 45 43 MO 5/11/2014 47 14 29.79% 389 67 84 6 MO 5/18/2014 24 5 20.83% 79 17 263 55 MO 5/25/2014 41 8 19.51% 464 41 56 27 MO 6/1/2014 39 9 23.08% 370 70 67 TOTAL 751 205 27.30% 3715 828 999 245 MS 3/30/2014 1 1 100.00% 1 1 TOTAL 1 1 100.00% 1 1 MT 7/28/2013 1 0.00% 3 MT 1/12/2014 1 0.00% 1 MT 2/2/2014 1 1 100.00% 3 3 MT 3/2/2014 0.00% 1 MT 3/9/2014 1 0.00% 26 2 MT 3/23/2014 1 0.00% 1 3 MT 3/30/2014 1 0.00% 2 4 MT 4/6/2014 1 0.00% 1 MT 4/13/2014 1 0.00% 1 MT 5/4/2014 1 0.00% 1 TOTAL 9 1 11.11% 39 3 10 0 NC 6/16/2013 1 0.00% 1 NC 6/23/2013 7 2 28.57% 29 16 NC 6/30/2013 3 2 66.67% 19 18 NC 7/7/2013 8 3 37.50% 23 14 NC 7/14/2013 5 2 40.00% 37 30 8 1 NC 7/21/2013 13 7 53.85% 69 42 2 NC 7/28/2013 12 2 16.67% 24 5 NC 8/4/2013 3 2 66.67% 10 9 NC 8/11/2013 8 5 62.50% 29 12 NC 8/18/2013 2 1 50.00% 4 1 NC 8/25/2013 6 4 66.67% 76 21 NC 9/1/2013 16 4 25.00% 70 12 NC 9/8/2013 20 6 30.00% 113 11 NC 9/15/2013 20 12 60.00% 146 61 1 1 NC 9/22/2013 29 24 82.76% 180 114 5 5 NC 9/29/2013 24 19 79.17% 112 90 6 6 NC 10/6/2013 36 21 58.33% 209 123 2 2
United States Department of Agriculture Animal and Plant Health Inspection Service Veterinary Services 35
SECD Testing Summary Report For NAHLN Laboratory Testing April 13, 2013 through June 4, 2014
State Week
Biological Accessions Biological Samples
Environmental Samples
Tested Positive % Pos Tested Positive Tested Positive NC 10/13/2013 21 21 100.00% 91 91 4 4 NC 10/20/2013 22 22 100.00% 109 109 1 1 NC 10/27/2013 17 17 100.00% 127 127 NC 11/3/2013 15 14 93.33% 50 48 NC 11/10/2013 15 15 100.00% 120 120 15 14 NC 11/17/2013 13 12 92.31% 52 51 21 16 NC 11/24/2013 41 19 46.34% 482 164 3 2 NC 12/1/2013 56 8 14.29% 547 47 13 8 NC 12/8/2013 46 12 26.09% 773 171 27 7 NC 12/15/2013 46 19 41.30% 433 123 31 19 NC 12/22/2013 25 5 20.00% 323 66 2 1 NC 12/29/2013 48 17 35.42% 616 150 25 12 NC 1/5/2014 55 15 27.27% 589 159 23 16 NC 1/12/2014 23 20 86.96% 311 147 2 2 NC 1/19/2014 72 19 26.39% 922 238 48 13 NC 1/26/2014 17 15 88.24% 223 137 2 2 NC 2/2/2014 90 24 26.67% 627 127 525 136 NC 2/9/2014 71 23 32.39% 931 226 80 27 NC 2/16/2014 98 24 24.49% 1206 300 59 9 NC 2/23/2014 98 23 23.47% 947 200 65 17 NC 3/2/2014 73 26 35.62% 613 105 86 17 NC 3/9/2014 66 16 24.24% 415 54 214 95 NC 3/16/2014 82 17 20.73% 683 91 187 77 NC 3/23/2014 82 20 24.39% 729 126 134 50 NC 3/30/2014 92 24 26.09% 775 112 124 96 NC 4/6/2014 92 23 25.00% 719 113 374 85 NC 4/13/2014 87 20 22.99% 879 100 342 66 NC 4/20/2014 49 9 18.37% 758 55 340 92 NC 4/27/2014 86 16 18.60% 1129 115 253 91 NC 5/4/2014 88 21 23.86% 1107 228 115 25 NC 5/11/2014 92 18 19.57% 1529 95 191 18 NC 5/18/2014 123 23 18.70% 1645 205 141 35 NC 5/25/2014 89 15 16.85% 1210 124 54 5 NC 6/1/2014 60 13 21.67% 852 100 97 23 TOTAL 2263 721 31.86% 23673 5003 3622 1096 ND 12/8/2013 0.00% 5 ND 12/15/2013 1 0.00% 3 ND 1/5/2014 1 0.00% 1 3 ND 1/19/2014 2 0.00% 10 6 ND 2/2/2014 3 0.00% 8 4 ND 2/9/2014 0.00% 11 ND 2/16/2014 3 0.00% 11 5 ND 2/23/2014 3 1 33.33% 9 1
United States Department of Agriculture Animal and Plant Health Inspection Service Veterinary Services 36
SECD Testing Summary Report For NAHLN Laboratory Testing April 13, 2013 through June 4, 2014
State Week
Biological Accessions Biological Samples
Environmental Samples
Tested Positive % Pos Tested Positive Tested Positive ND 3/9/2014 3 0.00% 6 ND 3/16/2014 5 0.00% 20 15 ND 3/23/2014 1 0.00% 1 26 ND 3/30/2014 3 0.00% 16 ND 4/6/2014 0.00% 9 ND 4/13/2014 2 0.00% 4 16 ND 4/20/2014 2 0.00% 2 19 ND 4/27/2014 2 0.00% 4 15 ND 5/4/2014 0.00% 16 ND 5/11/2014 3 0.00% 10 8 ND 5/18/2014 4 0.00% 7 ND 5/25/2014 1 0.00% 3 30 1 ND 6/1/2014 0.00% 25 TOTAL 39 1 2.56% 115 1 213 1 NE 6/23/2013 1 0.00% 1 14 NE 6/30/2013 0.00% 3 NE 7/14/2013 1 0.00% 3 4 NE 7/21/2013 3 0.00% 11 4 NE 7/28/2013 2 0.00% 3 NE 8/11/2013 3 0.00% 7 12 NE 8/18/2013 2 0.00% 2 8 NE 8/25/2013 2 0.00% 5 NE 9/15/2013 3 0.00% 31 5 NE 9/29/2013 1 0.00% 1 4 NE 10/6/2013 1 0.00% 3 3 NE 10/13/2013 3 0.00% 5 3 NE 10/27/2013 3 0.00% 6 29 NE 11/3/2013 2 0.00% 8 44 NE 11/10/2013 3 0.00% 5 NE 11/17/2013 3 0.00% 17 25 2 NE 11/24/2013 6 0.00% 16 39 2 NE 12/1/2013 10 1 10.00% 25 3 26 NE 12/8/2013 14 0.00% 32 36 NE 12/15/2013 10 1 10.00% 29 1 10 4 NE 12/22/2013 21 1 4.76% 60 1 17 NE 12/29/2013 21 2 9.52% 60 2 6 NE 1/5/2014 29 1 3.45% 72 1 32 1 NE 1/12/2014 25 5 20.00% 78 15 23 NE 1/19/2014 35 2 5.71% 126 3 49 2 NE 1/26/2014 32 7 21.88% 138 46 4 NE 2/2/2014 51 4 7.84% 271 7 30 3 NE 2/9/2014 30 9 30.00% 178 68 16 NE 2/16/2014 39 6 15.38% 207 51 13
United States Department of Agriculture Animal and Plant Health Inspection Service Veterinary Services 37
SECD Testing Summary Report For NAHLN Laboratory Testing April 13, 2013 through June 4, 2014
State Week
Biological Accessions Biological Samples
Environmental Samples
Tested Positive % Pos Tested Positive Tested Positive NE 2/23/2014 46 12 26.09% 285 75 27 5 NE 3/2/2014 29 2 6.90% 98 7 NE 3/9/2014 41 5 12.20% 141 13 24 6 NE 3/16/2014 34 6 17.65% 143 28 9 NE 3/23/2014 35 9 25.71% 189 35 30 3 NE 3/30/2014 33 7 21.21% 186 44 9 NE 4/6/2014 42 10 23.81% 297 43 46 31 NE 4/13/2014 39 2 5.13% 194 8 42 30 NE 4/20/2014 41 12 29.27% 369 134 9 NE 4/27/2014 33 7 21.21% 254 93 14 6 NE 5/4/2014 38 6 15.79% 265 28 11 NE 5/11/2014 30 4 13.33% 253 38 20 2 NE 5/18/2014 23 9 39.13% 222 45 109 42 NE 5/25/2014 40 10 25.00% 378 113 44 NE 6/1/2014 30 4 13.33% 359 95 6 TOTAL 890 144 16.18% 5033 997 859 139 NH 4/6/2014 1 0.00% 9 NH 4/13/2014 1 0.00% 2 TOTAL 2 0 0.00% 11 0 0 0 NY 6/16/2013 1 1 100.00% 1 1 NY 9/15/2013 1 1 100.00% 3 3 NY 12/15/2013 1 0.00% 2 2 NY 12/22/2013 1 0.00% 1 NY 2/9/2014 1 1 100.00% 1 1 NY 3/9/2014 2 1 50.00% 12 2 NY 3/16/2014 1 1 100.00% 5 5 NY 5/25/2014 1 0.00% 1 NY 6/1/2014 1 0.00% 1 TOTAL 10 5 50.00% 27 12 2 0 OH 6/16/2013 5 3 60.00% 18 12 OH 6/30/2013 4 2 50.00% 15 13 OH 7/7/2013 3 2 66.67% 28 24 OH 7/14/2013 2 0.00% 2 OH 7/21/2013 3 0.00% 9 OH 7/28/2013 3 1 33.33% 12 1 5 OH 8/4/2013 4 0.00% 8 OH 8/11/2013 2 0.00% 2 2 OH 8/18/2013 2 2 100.00% 3 3 4 OH 8/25/2013 2 1 50.00% 5 2 8 2 OH 9/1/2013 #DIV/0! 17 1 OH 9/8/2013 1 1 100.00% 16 16 28 3 OH 9/15/2013 1 0.00% 1 12 OH 9/22/2013 6 0.00% 6 13
United States Department of Agriculture Animal and Plant Health Inspection Service Veterinary Services 38
SECD Testing Summary Report For NAHLN Laboratory Testing April 13, 2013 through June 4, 2014
State Week
Biological Accessions Biological Samples
Environmental Samples
Tested Positive % Pos Tested Positive Tested Positive OH 9/29/2013 4 0.00% 16 29 2 OH 10/6/2013 4 0.00% 20 14 1 OH 10/13/2013 6 0.00% 16 OH 10/20/2013 7 0.00% 31 30 2 OH 10/27/2013 7 1 14.29% 13 1 12 5 OH 11/3/2013 16 5 31.25% 26 9 30 3 OH 11/10/2013 20 4 20.00% 67 12 26 5 OH 11/17/2013 17 4 23.53% 69 5 38 2 OH 11/24/2013 19 9 47.37% 99 56 38 5 OH 12/1/2013 39 5 12.82% 174 9 51 11 OH 12/8/2013 37 3 8.11% 168 6 23 5 OH 12/15/2013 33 3 9.09% 108 11 16 OH 12/22/2013 24 5 20.83% 81 11 22 OH 12/29/2013 35 5 14.29% 100 13 15 OH 1/5/2014 35 7 20.00% 118 14 10 OH 1/12/2014 34 9 26.47% 148 23 84 12 OH 1/19/2014 55 10 18.18% 215 27 54 17 OH 1/26/2014 51 11 21.57% 203 42 29 10 OH 2/2/2014 57 11 19.30% 402 64 85 13 OH 2/9/2014 62 21 33.87% 241 75 38 8 OH 2/16/2014 61 22 36.07% 208 55 54 18 OH 2/23/2014 48 19 39.58% 160 56 42 2 OH 3/2/2014 50 19 38.00% 232 69 20 1 OH 3/9/2014 42 13 30.95% 146 31 24 1 OH 3/16/2014 63 17 26.98% 190 32 33 4 OH 3/23/2014 56 16 28.57% 213 38 33 3 OH 3/30/2014 54 17 31.48% 203 52 33 1 OH 4/6/2014 66 22 33.33% 314 82 45 10 OH 4/13/2014 34 10 29.41% 153 16 13 OH 4/20/2014 41 9 21.95% 171 28 29 1 OH 4/27/2014 45 12 26.67% 377 65 19 OH 5/4/2014 45 7 15.56% 321 47 20 2 OH 5/11/2014 39 7 17.95% 284 31 21 OH 5/18/2014 47 3 6.38% 263 15 27 OH 5/25/2014 21 1 4.76% 143 1 26 3 OH 6/1/2014 25 0.00% 136 10 TOTAL 1337 319 23.86% 5954 1067 1182 153 OK 6/16/2013 24 16 66.67% 248 75 98 4 OK 6/23/2013 24 13 54.17% 241 104 169 72 OK 6/30/2013 12 3 25.00% 133 23 105 22 OK 7/7/2013 17 11 64.71% 195 61 47 10 OK 7/14/2013 14 7 50.00% 95 36 82 16 OK 7/21/2013 14 4 28.57% 122 10 44 16
United States Department of Agriculture Animal and Plant Health Inspection Service Veterinary Services 39
SECD Testing Summary Report For NAHLN Laboratory Testing April 13, 2013 through June 4, 2014
State Week
Biological Accessions Biological Samples
Environmental Samples
Tested Positive % Pos Tested Positive Tested Positive OK 7/28/2013 15 10 66.67% 86 22 18 6 OK 8/4/2013 14 5 35.71% 93 10 4 1 OK 8/11/2013 16 7 43.75% 98 39 16 OK 8/18/2013 23 14 60.87% 132 34 79 OK 8/25/2013 18 10 55.56% 101 22 16 2 OK 9/1/2013 14 4 28.57% 109 6 3 2 OK 9/8/2013 21 13 61.90% 101 26 8 OK 9/15/2013 12 5 41.67% 95 30 92 3 OK 9/22/2013 13 4 30.77% 71 4 8 OK 9/29/2013 14 6 42.86% 63 18 105 3 OK 10/6/2013 11 6 54.55% 44 31 12 OK 10/13/2013 19 13 68.42% 82 63 11 1 OK 10/20/2013 13 9 69.23% 70 49 50 6 OK 10/27/2013 20 13 65.00% 101 65 151 7 OK 11/3/2013 13 10 76.92% 88 60 60 12 OK 11/10/2013 9 5 55.56% 36 17 93 6 OK 11/17/2013 16 11 68.75% 107 56 77 46 OK 11/24/2013 36 12 33.33% 255 48 47 2 OK 12/1/2013 30 6 20.00% 240 30 12 5 OK 12/8/2013 32 7 21.88% 159 25 29 5 OK 12/15/2013 12 5 41.67% 87 30 91 9 OK 12/22/2013 12 3 25.00% 90 9 29 4 OK 12/29/2013 3 0.00% 14 9 1 OK 1/5/2014 16 4 25.00% 145 8 38 3 OK 1/12/2014 17 8 47.06% 83 18 69 15 OK 1/19/2014 20 2 10.00% 76 16 51 13 OK 1/26/2014 16 4 25.00% 79 24 56 25 OK 2/2/2014 17 4 23.53% 239 77 147 27 OK 2/9/2014 23 6 26.09% 224 68 60 6 OK 2/16/2014 32 9 28.13% 248 55 88 38 OK 2/23/2014 24 5 20.83% 481 45 73 10 OK 3/2/2014 21 1 4.76% 204 15 122 34 OK 3/9/2014 28 9 32.14% 156 50 82 11 OK 3/16/2014 31 9 29.03% 166 49 65 8 OK 3/23/2014 17 5 29.41% 104 12 111 2 OK 3/30/2014 27 5 18.52% 237 12 133 17 OK 4/6/2014 31 10 32.26% 182 43 249 140 OK 4/13/2014 33 4 12.12% 248 20 36 2 OK 4/20/2014 31 9 29.03% 243 20 73 3 OK 4/27/2014 36 6 16.67% 254 8 135 19 OK 5/4/2014 45 10 22.22% 405 74 7 OK 5/11/2014 47 8 17.02% 381 94 208 78 OK 5/18/2014 35 4 11.43% 325 9 101 1
United States Department of Agriculture Animal and Plant Health Inspection Service Veterinary Services 40
SECD Testing Summary Report For NAHLN Laboratory Testing April 13, 2013 through June 4, 2014
State Week
Biological Accessions Biological Samples
Environmental Samples
Tested Positive % Pos Tested Positive Tested Positive OK 5/25/2014 27 4 14.81% 306 73 52 6 OK 6/1/2014 36 4 11.11% 305 12 99 5 TOTAL 1101 362 32.88% 8447 1805 3620 724 OR 3/30/2014 1 0.00% 1 OR 4/20/2014 1 0.00% 1 OR 4/27/2014 3 0.00% 8 OR 5/18/2014 1 0.00% 6 TOTAL 6 0 0.00% 16 0 0 0 PA 8/25/2013 3 3 100.00% 6 6 PA 9/1/2013 5 5 100.00% 9 9 PA 9/15/2013 1 1 100.00% 1 1 PA 9/29/2013 1 1 100.00% 2 2 PA 10/6/2013 1 1 100.00% 1 1 1 1 PA 10/13/2013 2 2 100.00% 28 28 PA 10/20/2013 1 1 100.00% 1 1 PA 10/27/2013 2 2 100.00% 2 2 2 2 PA 11/3/2013 1 1 100.00% 1 1 PA 11/10/2013 1 1 100.00% 21 21 PA 11/17/2013 1 1 100.00% 5 5 PA 11/24/2013 1 0.00% 1 PA 12/1/2013 9 3 33.33% 24 3 PA 12/8/2013 7 1 14.29% 18 1 23 5 PA 12/15/2013 13 1 7.69% 41 4 PA 12/22/2013 1 0.00% 2 PA 12/29/2013 2 0.00% 13 PA 1/5/2014 11 0.00% 17 PA 1/12/2014 2 2 100.00% 9 6 4 2 PA 1/19/2014 15 2 13.33% 117 2 1 PA 1/26/2014 4 4 100.00% 11 10 PA 2/2/2014 13 4 30.77% 32 7 PA 2/9/2014 13 3 23.08% 16 6 PA 2/16/2014 17 7 41.18% 27 9 PA 2/23/2014 34 12 35.29% 79 14 4 PA 3/2/2014 14 3 21.43% 47 10 PA 3/9/2014 19 3 15.79% 68 3 PA 3/16/2014 10 5 50.00% 14 7 PA 3/23/2014 8 1 12.50% 27 1 30 30 PA 3/30/2014 9 1 11.11% 24 2 PA 4/6/2014 10 2 20.00% 26 2 29 13 PA 4/13/2014 8 2 25.00% 75 2 1 PA 4/20/2014 13 3 23.08% 17 3 50 1 PA 4/27/2014 1 0.00% 2 PA 5/4/2014 11 1 9.09% 64 1
United States Department of Agriculture Animal and Plant Health Inspection Service Veterinary Services 41
SECD Testing Summary Report For NAHLN Laboratory Testing April 13, 2013 through June 4, 2014
State Week
Biological Accessions Biological Samples
Environmental Samples
Tested Positive % Pos Tested Positive Tested Positive PA 5/11/2014 24 3 12.50% 141 14 1 PA 5/18/2014 8 1 12.50% 52 1 52 1 PA 5/25/2014 12 2 16.67% 36 4 1 PA 6/1/2014 3 0.00% 3 60 TOTAL 311 85 27.33% 1080 189 259 55 SC 8/11/2013 1 0.00% 1 SC 1/5/2014 2 2 100.00% 39 3 SC 1/12/2014 1 0.00% 10 SC 1/19/2014 2 0.00% 10 SC 2/2/2014 1 0.00% 2 6 SC 2/9/2014 1 0.00% 3 SC 2/16/2014 5 0.00% 22 1 1 SC 2/23/2014 1 0.00% 3 SC 3/2/2014 0.00% 4 3 SC 4/6/2014 1 0.00% 2 SC 4/13/2014 3 0.00% 10 SC 4/27/2014 3 0.00% 7 TOTAL 21 2 9.52% 109 3 11 4 SD 6/16/2013 2 0.00% 2 6 SD 6/23/2013 5 0.00% 19 SD 6/30/2013 3 0.00% 4 SD 7/7/2013 3 0.00% 3 SD 7/14/2013 2 0.00% 3 SD 7/21/2013 1 0.00% 5 SD 7/28/2013 7 0.00% 13 SD 8/4/2013 6 0.00% 20 9 1 SD 8/11/2013 1 0.00% 3 1 SD 8/18/2013 5 0.00% 9 SD 8/25/2013 7 0.00% 11 SD 9/1/2013 4 0.00% 5 SD 9/8/2013 6 0.00% 11 SD 9/15/2013 10 0.00% 24 SD 9/22/2013 11 0.00% 27 SD 9/29/2013 5 0.00% 12 SD 10/6/2013 6 0.00% 12 SD 10/13/2013 9 0.00% 23 SD 10/20/2013 5 0.00% 10 SD 10/27/2013 13 0.00% 32 4 SD 11/3/2013 9 0.00% 41 SD 11/10/2013 13 0.00% 31 SD 11/17/2013 12 0.00% 29 5 SD 11/24/2013 11 1 9.09% 30 1 SD 12/1/2013 9 0.00% 29 5 1
United States Department of Agriculture Animal and Plant Health Inspection Service Veterinary Services 42

SECD Testing Summary Report For NAHLN Laboratory Testing April 13, 2013 through June 4, 2014
State Week
Biological Accessions Biological Samples
Environmental Samples
Tested Positive % Pos Tested Positive Tested Positive SD 12/8/2013 11 0.00% 36 SD 12/15/2013 16 0.00% 43 1 SD 12/22/2013 11 0.00% 17 5 SD 12/29/2013 11 2 18.18% 35 5 SD 1/5/2014 26 1 3.85% 104 2 10 2 SD 1/12/2014 24 2 8.33% 64 2 7 4 SD 1/19/2014 25 3 12.00% 67 9 23 2 SD 1/26/2014 26 3 11.54% 55 4 17 1 SD 2/2/2014 30 3 10.00% 92 4 21 3 SD 2/9/2014 28 4 14.29% 52 5 SD 2/16/2014 30 5 16.67% 64 6 6 SD 2/23/2014 32 3 9.38% 99 10 1 1 SD 3/2/2014 42 6 14.29% 155 18 30 6 SD 3/9/2014 37 7 18.92% 150 16 11 7 SD 3/16/2014 35 6 17.14% 154 20 1 1 SD 3/23/2014 31 5 16.13% 91 7 SD 3/30/2014 41 5 12.20% 149 21 SD 4/6/2014 33 2 6.06% 152 4 8 3 SD 4/13/2014 35 4 11.43% 205 5 10 1 SD 4/20/2014 37 3 8.11% 194 12 SD 4/27/2014 40 5 12.50% 183 11 8 SD 5/4/2014 39 5 12.82% 164 8 SD 5/11/2014 38 4 10.53% 149 8 4 4 SD 5/18/2014 42 6 14.29% 167 20 6 1 SD 5/25/2014 43 4 9.30% 220 10 3 SD 6/1/2014 18 3 16.67% 56 8 TOTAL 946 92 9.73% 3325 216 202 38 TN 6/16/2013 1 0.00% 2 TN 7/7/2013 1 0.00% 4 TN 7/21/2013 1 1 100.00% 5 5 TN 8/4/2013 0.00% 10 TN 8/11/2013 0.00% 15 TN 8/18/2013 0.00% 7 TN 8/25/2013 1 0.00% 3 10 TN 9/8/2013 1 1 100.00% 1 1 TN 9/29/2013 0.00% 13 TN 10/20/2013 1 0.00% 4 TN 10/27/2013 1 1 100.00% 5 5 TN 11/3/2013 1 1 100.00% 2 2 TN 11/17/2013 1 1 100.00% 4 4 3 3 TN 11/24/2013 2 0.00% 10 25 TN 12/1/2013 1 0.00% 24 TN 12/22/2013 2 0.00% 13 5 5
United States Department of Agriculture Animal and Plant Health Inspection Service Veterinary Services 43
SECD Testing Summary Report For NAHLN Laboratory Testing April 13, 2013 through June 4, 2014
State Week
Biological Accessions Biological Samples
Environmental Samples
Tested Positive % Pos Tested Positive Tested Positive TN 12/29/2013 3 1 33.33% 17 7 TN 1/5/2014 4 0.00% 18 TN 1/12/2014 6 0.00% 41 10 10 TN 1/19/2014 3 1 33.33% 15 8 TN 1/26/2014 0.00% 22 3 TN 2/2/2014 0.00% 15 TN 2/9/2014 1 0.00% 2 2 TN 2/16/2014 4 1 25.00% 19 3 TN 2/23/2014 1 1 100.00% 3 3 TN 3/2/2014 1 0.00% 3 TN 3/9/2014 6 0.00% 53 3 3 TN 3/16/2014 1 0.00% 1 31 4 TN 3/23/2014 3 0.00% 9 TN 3/30/2014 1 0.00% 3 TN 4/6/2014 5 2 40.00% 47 7 TN 4/13/2014 1 0.00% 3 2 1 TN 4/20/2014 3 1 33.33% 8 1 TN 4/27/2014 2 1 50.00% 8 3 TN 5/4/2014 1 0.00% 8 TN 5/11/2014 1 0.00% 12 7 TN 5/25/2014 3 0.00% 9 TOTAL 64 13 20.31% 356 49 180 29 TX 6/16/2013 2 0.00% 8 TX 6/23/2013 4 0.00% 14 TX 7/7/2013 1 0.00% 4 TX 7/14/2013 4 0.00% 12 TX 7/21/2013 2 1 50.00% 6 2 TX 7/28/2013 1 0.00% 1 2 TX 8/4/2013 1 0.00% 6 TX 8/11/2013 3 0.00% 10 TX 8/25/2013 3 0.00% 7 TX 9/29/2013 3 3 100.00% 11 10 TX 10/6/2013 3 0.00% 4 TX 10/13/2013 1 0.00% 5 TX 10/20/2013 1 0.00% 1 TX 10/27/2013 3 3 100.00% 9 7 TX 11/3/2013 3 1 33.33% 11 3 17 TX 11/10/2013 3 3 100.00% 13 10 TX 11/17/2013 9 6 66.67% 66 21 17 TX 11/24/2013 7 3 42.86% 35 13 TX 12/1/2013 2 2 100.00% 6 4 TX 12/8/2013 2 1 50.00% 8 4 TX 12/15/2013 1 0.00% 5
United States Department of Agriculture Animal and Plant Health Inspection Service Veterinary Services 44
SECD Testing Summary Report For NAHLN Laboratory Testing April 13, 2013 through June 4, 2014
State Week
Biological Accessions Biological Samples
Environmental Samples
Tested Positive % Pos Tested Positive Tested Positive TX 12/22/2013 2 2 100.00% 10 10 TX 12/29/2013 1 1 100.00% 6 6 12 11 TX 1/5/2014 6 4 66.67% 20 10 TX 1/12/2014 3 3 100.00% 18 9 13 12 TX 1/19/2014 2 1 50.00% 11 9 TX 1/26/2014 2 2 100.00% 12 4 10 TX 2/2/2014 3 1 33.33% 15 6 10 TX 2/9/2014 3 2 66.67% 11 8 TX 2/16/2014 4 2 50.00% 20 8 TX 2/23/2014 5 2 40.00% 23 10 TX 3/2/2014 6 5 83.33% 27 20 TX 3/9/2014 10 6 60.00% 23 10 TX 3/16/2014 4 2 50.00% 30 3 TX 3/23/2014 5 1 20.00% 15 3 TX 3/30/2014 4 2 50.00% 12 4 TX 4/6/2014 5 3 60.00% 13 9 TX 4/13/2014 5 3 60.00% 35 10 TX 4/20/2014 10 5 50.00% 53 13 25 14 TX 4/27/2014 8 2 25.00% 30 3 20 8 TX 5/4/2014 14 4 28.57% 232 11 33 18 TX 5/11/2014 6 3 50.00% 28 8 16 7 TX 5/18/2014 1 0.00% 6 10 TX 5/25/2014 3 1 33.33% 15 3 59 22 TX 6/1/2014 1 0.00% 2 TOTAL 172 80 46.51% 909 251 244 92 UT 12/8/2013 1 0.00% 3 UT 3/16/2014 1 0.00% 1 UT 3/23/2014 0.00% 10 UT 4/6/2014 1 0.00% 1 UT 4/20/2014 2 0.00% 3 8 TOTAL 5 0 0.00% 8 0 18 0 VA 9/1/2013 0.00% 2 2 VA 10/27/2013 1 0.00% 1 VA 12/1/2013 2 0.00% 22 VA 12/8/2013 4 0.00% 8 VA 1/12/2014 1 0.00% 2 VA 2/2/2014 0.00% 1 VA 2/9/2014 1 0.00% 1 VA 3/23/2014 1 0.00% 1 VA 4/6/2014 1 0.00% 1 VA 4/13/2014 1 1 100.00% 1 1 VA 4/27/2014 1 0.00% 2 VA 5/11/2014 2 0.00% 3 8
United States Department of Agriculture Animal and Plant Health Inspection Service Veterinary Services 45
SECD Testing Summary Report For NAHLN Laboratory Testing April 13, 2013 through June 4, 2014
State Week
Biological Accessions Biological Samples
Environmental Samples
Tested Positive % Pos Tested Positive Tested Positive VA 5/25/2014 0.00% 2 VA 6/1/2014 1 0.00% 40 TOTAL 16 1 6.25% 82 1 13 2 VT 3/23/2014 1 1 100.00% 3 3 TOTAL 1 1 100.00% 3 3 WI 7/7/2013 1 0.00% 2 WI 7/28/2013 1 0.00% 1 WI 8/4/2013 1 1 100.00% 3 3 WI 9/8/2013 2 0.00% 2 WI 10/27/2013 2 1 50.00% 2 1 WI 11/3/2013 1 1 100.00% 2 2 WI 11/24/2013 1 1 100.00% 3 3 WI 12/1/2013 2 0.00% 3 WI 12/15/2013 2 0.00% 6 3 WI 12/22/2013 2 0.00% 4 WI 12/29/2013 2 0.00% 6 1 WI 1/5/2014 5 0.00% 13 WI 1/12/2014 1 1 100.00% 1 1 1 WI 1/19/2014 9 0.00% 39 WI 1/26/2014 2 1 50.00% 3 1 1 WI 2/2/2014 5 1 20.00% 15 2 1 WI 2/9/2014 3 1 33.33% 8 1 1 WI 2/16/2014 6 2 33.33% 14 5 8 1 WI 2/23/2014 4 0.00% 4 1 WI 3/2/2014 4 1 25.00% 4 1 WI 3/9/2014 4 0.00% 8 8 WI 3/16/2014 2 0.00% 2 3 WI 3/23/2014 7 2 28.57% 15 5 WI 3/30/2014 3 0.00% 4 WI 4/6/2014 8 0.00% 12 WI 4/13/2014 5 1 20.00% 12 3 WI 4/20/2014 6 0.00% 13 3 WI 4/27/2014 5 0.00% 56 WI 5/4/2014 2 0.00% 2 WI 5/11/2014 4 1 25.00% 9 1 WI 5/18/2014 10 3 30.00% 47 6 9 1 WI 5/25/2014 5 0.00% 11 WI 6/1/2014 2 0.00% 5 TOTAL 119 18 15.13% 331 35 40 2 WV 4/20/2014 1 0.00% 1 WV 4/27/2014 2 0.00% 3 TOTAL 3 3 100.00% 4 0 0 0 WY 12/29/2013 1 1 100.00% 10 10
United States Department of Agriculture Animal and Plant Health Inspection Service Veterinary Services 46
SECD Testing Summary Report For NAHLN Laboratory Testing April 13, 2013 through June 4, 2014
State Week
Biological Accessions Biological Samples
Environmental Samples
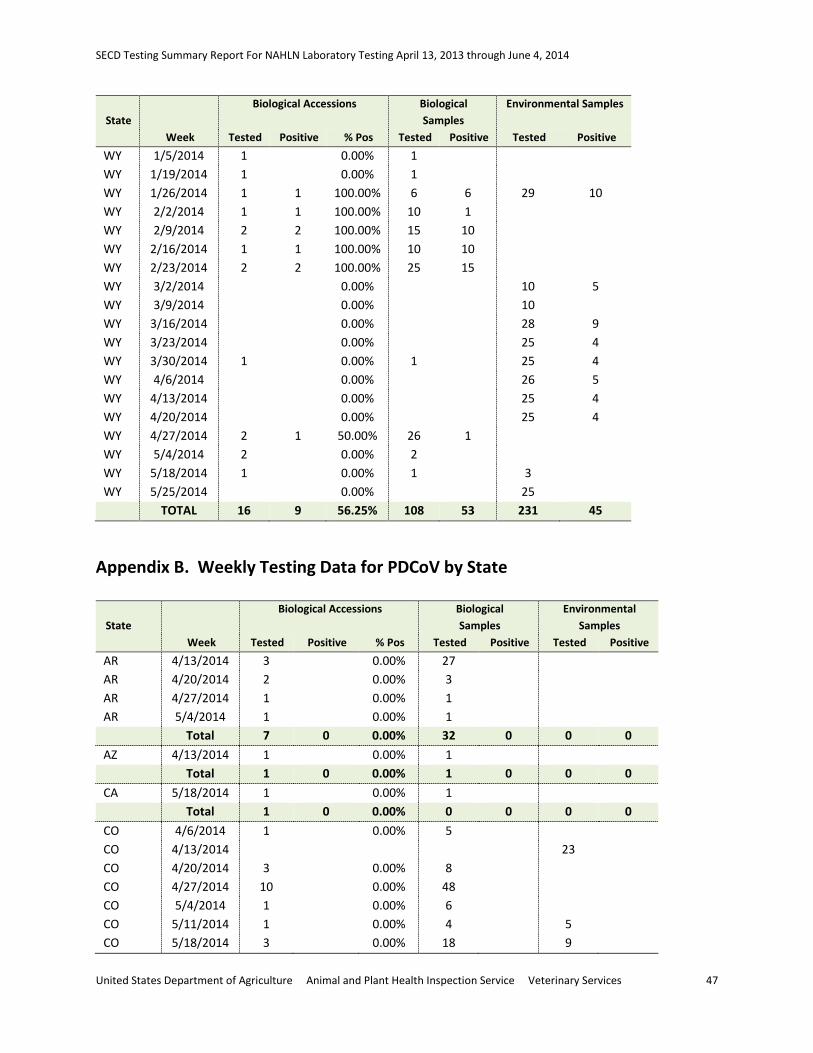
Tested Positive % Pos Tested Positive Tested Positive WY 1/5/2014 1 0.00% 1 WY 1/19/2014 1 0.00% 1 WY 1/26/2014 1 1 100.00% 6 6 29 10 WY 2/2/2014 1 1 100.00% 10 1 WY 2/9/2014 2 2 100.00% 15 10 WY 2/16/2014 1 1 100.00% 10 10 WY 2/23/2014 2 2 100.00% 25 15 WY 3/2/2014 0.00% 10 5 WY 3/9/2014 0.00% 10 WY 3/16/2014 0.00% 28 9 WY 3/23/2014 0.00% 25 4 WY 3/30/2014 1 0.00% 1 25 4 WY 4/6/2014 0.00% 26 5 WY 4/13/2014 0.00% 25 4 WY 4/20/2014 0.00% 25 4 WY 4/27/2014 2 1 50.00% 26 1 WY 5/4/2014 2 0.00% 2 WY 5/18/2014 1 0.00% 1 3 WY 5/25/2014 0.00% 25 TOTAL 16 9 56.25% 108 53 231 45
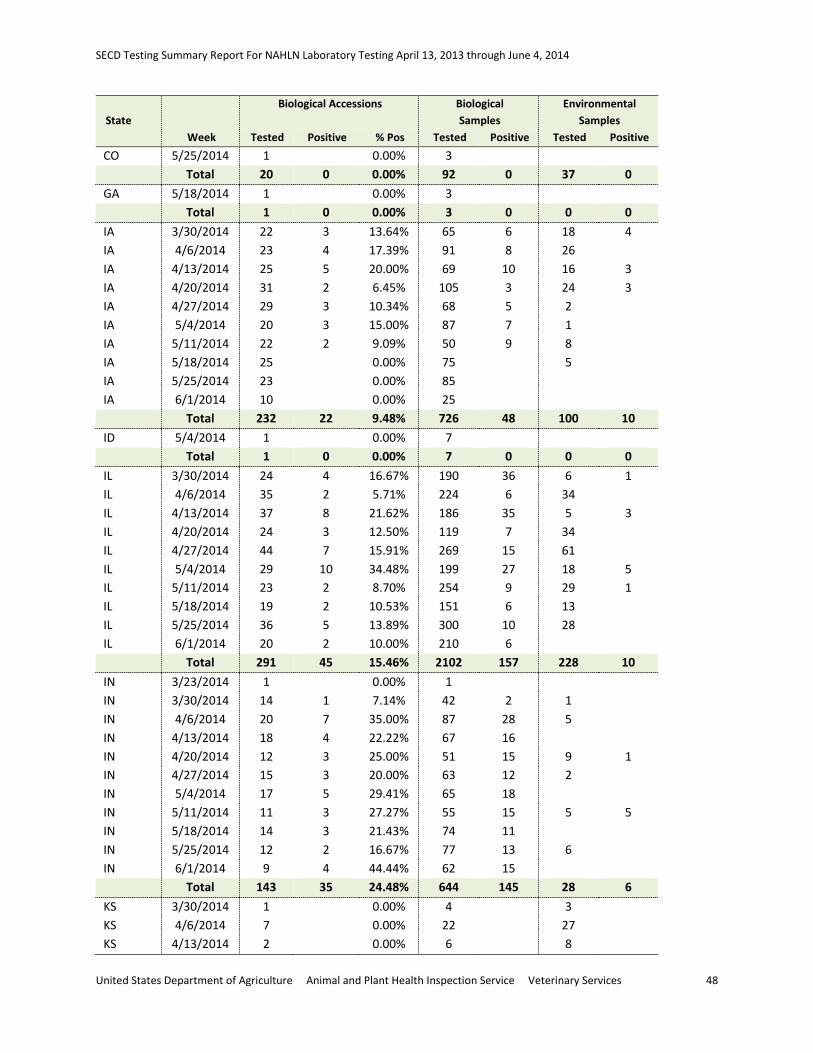
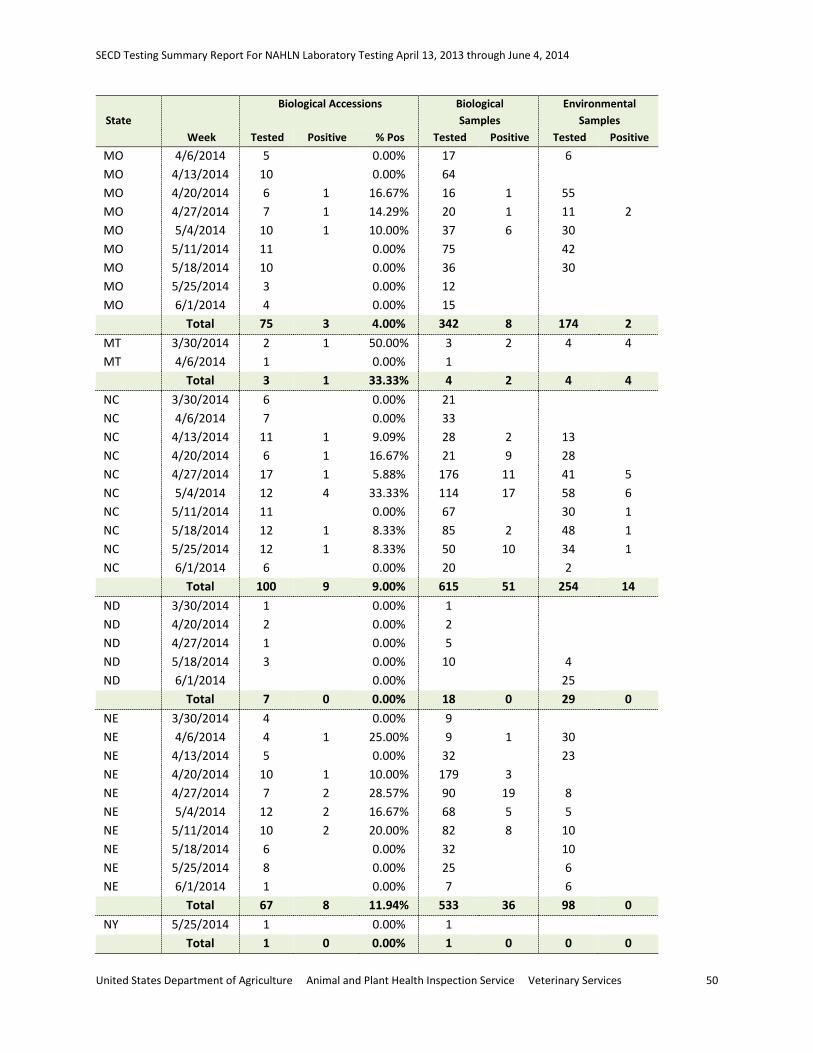
Appendix B. Weekly Testing Data for PDCoV by State
State Week
Biological Accessions Biological Samples
Environmental Samples
Tested Positive % Pos Tested Positive Tested Positive AR 4/13/2014 3 0.00% 27 AR 4/20/2014 2 0.00% 3 AR 4/27/2014 1 0.00% 1 AR 5/4/2014 1 0.00% 1 Total 7 0 0.00% 32 0 0 0 AZ 4/13/2014 1 0.00% 1 Total 1 0 0.00% 1 0 0 0 CA 5/18/2014 1 0.00% 1 Total 1 0 0.00% 0 0 0 0 CO 4/6/2014 1 0.00% 5 CO 4/13/2014 23 CO 4/20/2014 3 0.00% 8 CO 4/27/2014 10 0.00% 48 CO 5/4/2014 1 0.00% 6 CO 5/11/2014 1 0.00% 4 5 CO 5/18/2014 3 0.00% 18 9
United States Department of Agriculture Animal and Plant Health Inspection Service Veterinary Services 47
SECD Testing Summary Report For NAHLN Laboratory Testing April 13, 2013 through June 4, 2014
State Week
Biological Accessions Biological Samples
Environmental Samples
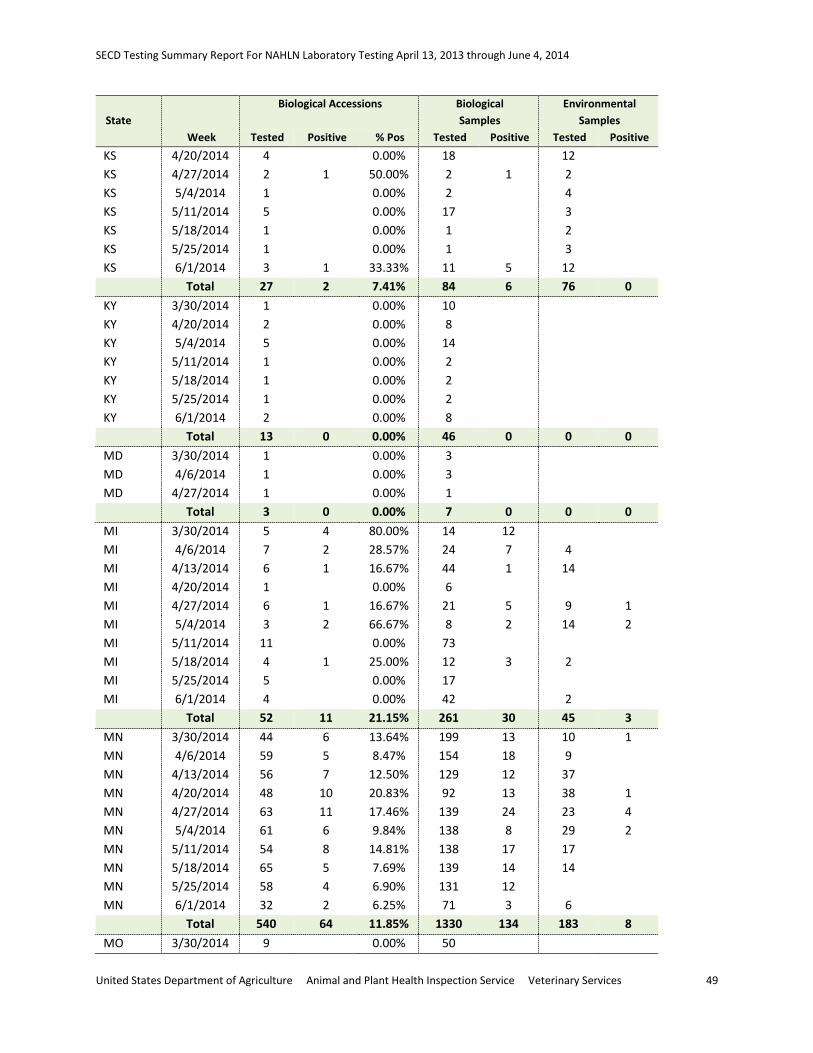
Tested Positive % Pos Tested Positive Tested Positive CO 5/25/2014 1 0.00% 3 Total 20 0 0.00% 92 0 37 0 GA 5/18/2014 1 0.00% 3 Total 1 0 0.00% 3 0 0 0 IA 3/30/2014 22 3 13.64% 65 6 18 4 IA 4/6/2014 23 4 17.39% 91 8 26 IA 4/13/2014 25 5 20.00% 69 10 16 3 IA 4/20/2014 31 2 6.45% 105 3 24 3 IA 4/27/2014 29 3 10.34% 68 5 2 IA 5/4/2014 20 3 15.00% 87 7 1 IA 5/11/2014 22 2 9.09% 50 9 8 IA 5/18/2014 25 0.00% 75 5 IA 5/25/2014 23 0.00% 85 IA 6/1/2014 10 0.00% 25 Total 232 22 9.48% 726 48 100 10 ID 5/4/2014 1 0.00% 7 Total 1 0 0.00% 7 0 0 0 IL 3/30/2014 24 4 16.67% 190 36 6 1 IL 4/6/2014 35 2 5.71% 224 6 34 IL 4/13/2014 37 8 21.62% 186 35 5 3 IL 4/20/2014 24 3 12.50% 119 7 34 IL 4/27/2014 44 7 15.91% 269 15 61 IL 5/4/2014 29 10 34.48% 199 27 18 5 IL 5/11/2014 23 2 8.70% 254 9 29 1 IL 5/18/2014 19 2 10.53% 151 6 13 IL 5/25/2014 36 5 13.89% 300 10 28 IL 6/1/2014 20 2 10.00% 210 6 Total 291 45 15.46% 2102 157 228 10 IN 3/23/2014 1 0.00% 1 IN 3/30/2014 14 1 7.14% 42 2 1 IN 4/6/2014 20 7 35.00% 87 28 5 IN 4/13/2014 18 4 22.22% 67 16 IN 4/20/2014 12 3 25.00% 51 15 9 1 IN 4/27/2014 15 3 20.00% 63 12 2 IN 5/4/2014 17 5 29.41% 65 18 IN 5/11/2014 11 3 27.27% 55 15 5 5 IN 5/18/2014 14 3 21.43% 74 11 IN 5/25/2014 12 2 16.67% 77 13 6 IN 6/1/2014 9 4 44.44% 62 15 Total 143 35 24.48% 644 145 28 6 KS 3/30/2014 1 0.00% 4 3 KS 4/6/2014 7 0.00% 22 27 KS 4/13/2014 2 0.00% 6 8
United States Department of Agriculture Animal and Plant Health Inspection Service Veterinary Services 48
SECD Testing Summary Report For NAHLN Laboratory Testing April 13, 2013 through June 4, 2014
State Week
Biological Accessions Biological Samples
Environmental Samples
Tested Positive % Pos Tested Positive Tested Positive KS 4/20/2014 4 0.00% 18 12 KS 4/27/2014 2 1 50.00% 2 1 2 KS 5/4/2014 1 0.00% 2 4 KS 5/11/2014 5 0.00% 17 3 KS 5/18/2014 1 0.00% 1 2 KS 5/25/2014 1 0.00% 1 3 KS 6/1/2014 3 1 33.33% 11 5 12 Total 27 2 7.41% 84 6 76 0 KY 3/30/2014 1 0.00% 10 KY 4/20/2014 2 0.00% 8 KY 5/4/2014 5 0.00% 14 KY 5/11/2014 1 0.00% 2 KY 5/18/2014 1 0.00% 2 KY 5/25/2014 1 0.00% 2 KY 6/1/2014 2 0.00% 8 Total 13 0 0.00% 46 0 0 0 MD 3/30/2014 1 0.00% 3 MD 4/6/2014 1 0.00% 3 MD 4/27/2014 1 0.00% 1 Total 3 0 0.00% 7 0 0 0 MI 3/30/2014 5 4 80.00% 14 12 MI 4/6/2014 7 2 28.57% 24 7 4 MI 4/13/2014 6 1 16.67% 44 1 14 MI 4/20/2014 1 0.00% 6 MI 4/27/2014 6 1 16.67% 21 5 9 1 MI 5/4/2014 3 2 66.67% 8 2 14 2 MI 5/11/2014 11 0.00% 73 MI 5/18/2014 4 1 25.00% 12 3 2 MI 5/25/2014 5 0.00% 17 MI 6/1/2014 4 0.00% 42 2 Total 52 11 21.15% 261 30 45 3 MN 3/30/2014 44 6 13.64% 199 13 10 1 MN 4/6/2014 59 5 8.47% 154 18 9 MN 4/13/2014 56 7 12.50% 129 12 37 MN 4/20/2014 48 10 20.83% 92 13 38 1 MN 4/27/2014 63 11 17.46% 139 24 23 4 MN 5/4/2014 61 6 9.84% 138 8 29 2 MN 5/11/2014 54 8 14.81% 138 17 17 MN 5/18/2014 65 5 7.69% 139 14 14 MN 5/25/2014 58 4 6.90% 131 12 MN 6/1/2014 32 2 6.25% 71 3 6 Total 540 64 11.85% 1330 134 183 8 MO 3/30/2014 9 0.00% 50
United States Department of Agriculture Animal and Plant Health Inspection Service Veterinary Services 49
SECD Testing Summary Report For NAHLN Laboratory Testing April 13, 2013 through June 4, 2014
State Week
Biological Accessions Biological Samples
Environmental Samples
Tested Positive % Pos Tested Positive Tested Positive MO 4/6/2014 5 0.00% 17 6 MO 4/13/2014 10 0.00% 64 MO 4/20/2014 6 1 16.67% 16 1 55 MO 4/27/2014 7 1 14.29% 20 1 11 2 MO 5/4/2014 10 1 10.00% 37 6 30 MO 5/11/2014 11 0.00% 75 42 MO 5/18/2014 10 0.00% 36 30 MO 5/25/2014 3 0.00% 12 MO 6/1/2014 4 0.00% 15 Total 75 3 4.00% 342 8 174 2 MT 3/30/2014 2 1 50.00% 3 2 4 4 MT 4/6/2014 1 0.00% 1 Total 3 1 33.33% 4 2 4 4 NC 3/30/2014 6 0.00% 21 NC 4/6/2014 7 0.00% 33 NC 4/13/2014 11 1 9.09% 28 2 13 NC 4/20/2014 6 1 16.67% 21 9 28 NC 4/27/2014 17 1 5.88% 176 11 41 5 NC 5/4/2014 12 4 33.33% 114 17 58 6 NC 5/11/2014 11 0.00% 67 30 1 NC 5/18/2014 12 1 8.33% 85 2 48 1 NC 5/25/2014 12 1 8.33% 50 10 34 1 NC 6/1/2014 6 0.00% 20 2 Total 100 9 9.00% 615 51 254 14 ND 3/30/2014 1 0.00% 1 ND 4/20/2014 2 0.00% 2 ND 4/27/2014 1 0.00% 5 ND 5/18/2014 3 0.00% 10 4 ND 6/1/2014 0.00% 25 Total 7 0 0.00% 18 0 29 0 NE 3/30/2014 4 0.00% 9 NE 4/6/2014 4 1 25.00% 9 1 30 NE 4/13/2014 5 0.00% 32 23 NE 4/20/2014 10 1 10.00% 179 3 NE 4/27/2014 7 2 28.57% 90 19 8 NE 5/4/2014 12 2 16.67% 68 5 5 NE 5/11/2014 10 2 20.00% 82 8 10 NE 5/18/2014 6 0.00% 32 10 NE 5/25/2014 8 0.00% 25 6 NE 6/1/2014 1 0.00% 7 6 Total 67 8 11.94% 533 36 98 0 NY 5/25/2014 1 0.00% 1 Total 1 0 0.00% 1 0 0 0
United States Department of Agriculture Animal and Plant Health Inspection Service Veterinary Services 50
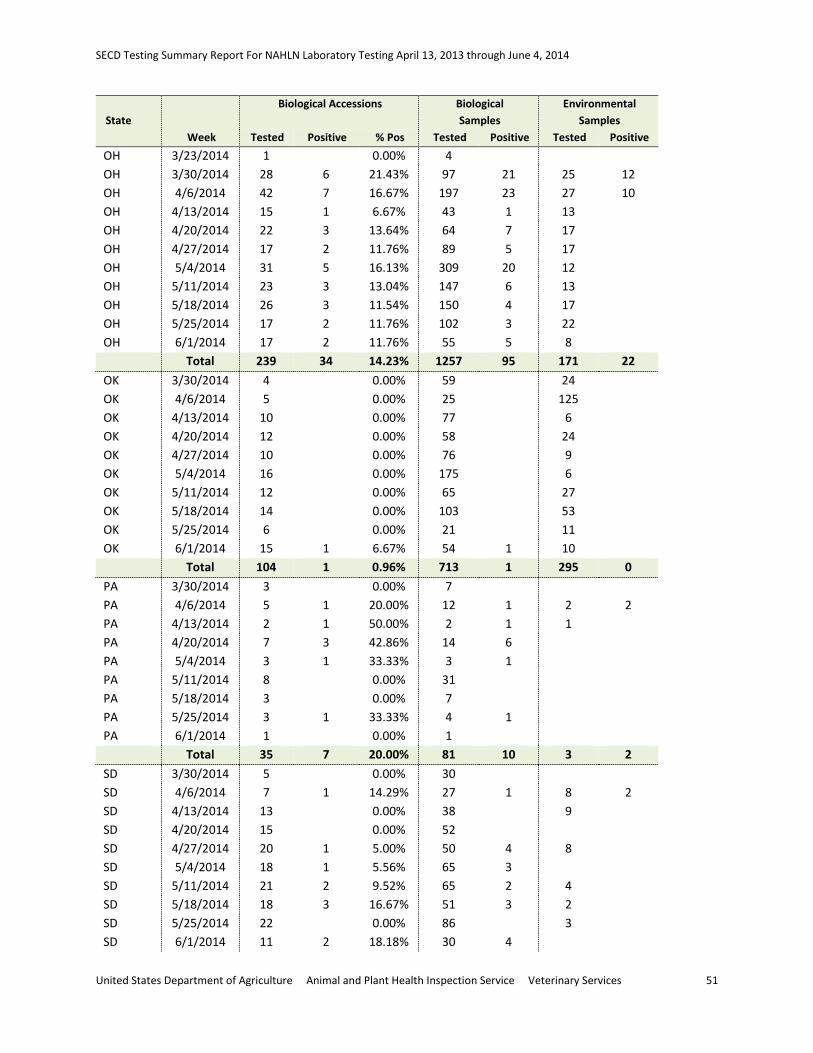
SECD Testing Summary Report For NAHLN Laboratory Testing April 13, 2013 through June 4, 2014
State Week
Biological Accessions Biological Samples
Environmental Samples
Tested Positive % Pos Tested Positive Tested Positive OH 3/23/2014 1 0.00% 4 OH 3/30/2014 28 6 21.43% 97 21 25 12 OH 4/6/2014 42 7 16.67% 197 23 27 10 OH 4/13/2014 15 1 6.67% 43 1 13 OH 4/20/2014 22 3 13.64% 64 7 17 OH 4/27/2014 17 2 11.76% 89 5 17 OH 5/4/2014 31 5 16.13% 309 20 12 OH 5/11/2014 23 3 13.04% 147 6 13 OH 5/18/2014 26 3 11.54% 150 4 17 OH 5/25/2014 17 2 11.76% 102 3 22 OH 6/1/2014 17 2 11.76% 55 5 8 Total 239 34 14.23% 1257 95 171 22 OK 3/30/2014 4 0.00% 59 24 OK 4/6/2014 5 0.00% 25 125 OK 4/13/2014 10 0.00% 77 6 OK 4/20/2014 12 0.00% 58 24 OK 4/27/2014 10 0.00% 76 9 OK 5/4/2014 16 0.00% 175 6 OK 5/11/2014 12 0.00% 65 27 OK 5/18/2014 14 0.00% 103 53 OK 5/25/2014 6 0.00% 21 11 OK 6/1/2014 15 1 6.67% 54 1 10 Total 104 1 0.96% 713 1 295 0 PA 3/30/2014 3 0.00% 7 PA 4/6/2014 5 1 20.00% 12 1 2 2 PA 4/13/2014 2 1 50.00% 2 1 1 PA 4/20/2014 7 3 42.86% 14 6 PA 5/4/2014 3 1 33.33% 3 1 PA 5/11/2014 8 0.00% 31 PA 5/18/2014 3 0.00% 7 PA 5/25/2014 3 1 33.33% 4 1 PA 6/1/2014 1 0.00% 1 Total 35 7 20.00% 81 10 3 2 SD 3/30/2014 5 0.00% 30 SD 4/6/2014 7 1 14.29% 27 1 8 2 SD 4/13/2014 13 0.00% 38 9 SD 4/20/2014 15 0.00% 52 SD 4/27/2014 20 1 5.00% 50 4 8 SD 5/4/2014 18 1 5.56% 65 3 SD 5/11/2014 21 2 9.52% 65 2 4 SD 5/18/2014 18 3 16.67% 51 3 2 SD 5/25/2014 22 0.00% 86 3 SD 6/1/2014 11 2 18.18% 30 4
United States Department of Agriculture Animal and Plant Health Inspection Service Veterinary Services 51
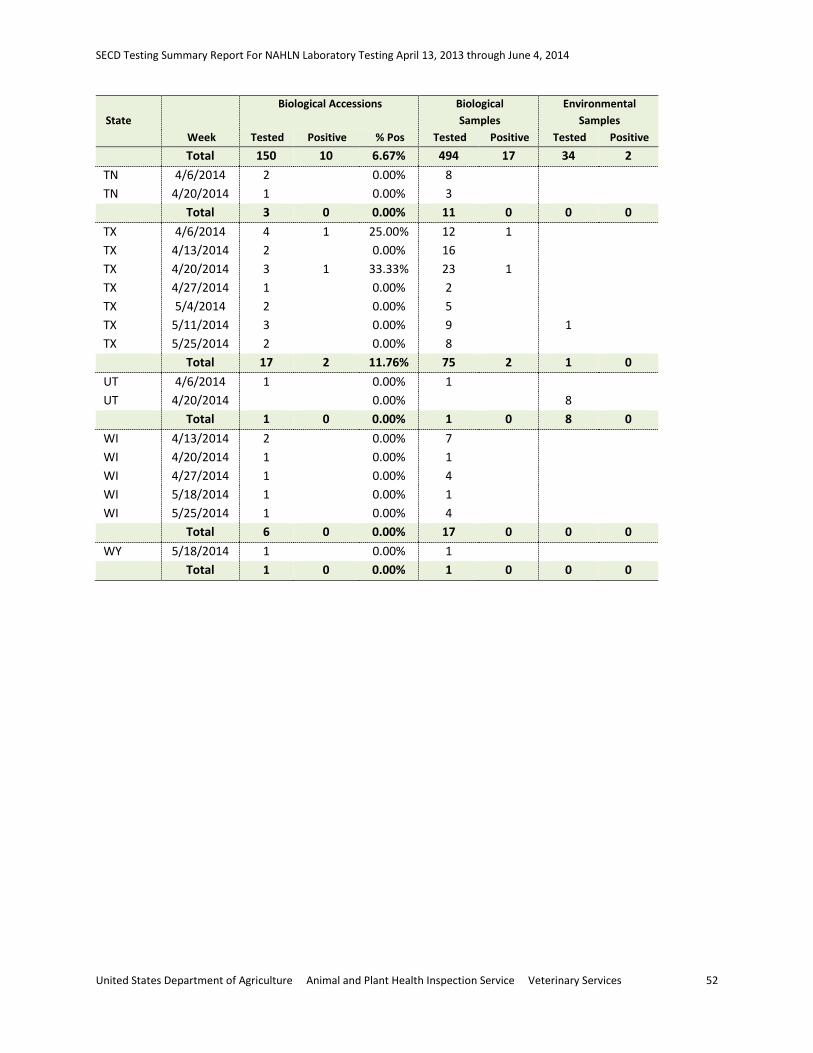
SECD Testing Summary Report For NAHLN Laboratory Testing April 13, 2013 through June 4, 2014
State Week
Biological Accessions Biological Samples
Environmental Samples
Tested Positive % Pos Tested Positive Tested Positive Total 150 10 6.67% 494 17 34 2 TN 4/6/2014 2 0.00% 8 TN 4/20/2014 1 0.00% 3 Total 3 0 0.00% 11 0 0 0 TX 4/6/2014 4 1 25.00% 12 1 TX 4/13/2014 2 0.00% 16 TX 4/20/2014 3 1 33.33% 23 1 TX 4/27/2014 1 0.00% 2 TX 5/4/2014 2 0.00% 5 TX 5/11/2014 3 0.00% 9 1 TX 5/25/2014 2 0.00% 8 Total 17 2 11.76% 75 2 1 0 UT 4/6/2014 1 0.00% 1 UT 4/20/2014 0.00% 8 Total 1 0 0.00% 1 0 8 0 WI 4/13/2014 2 0.00% 7 WI 4/20/2014 1 0.00% 1 WI 4/27/2014 1 0.00% 4 WI 5/18/2014 1 0.00% 1 WI 5/25/2014 1 0.00% 4 Total 6 0 0.00% 17 0 0 0 WY 5/18/2014 1 0.00% 1 Total 1 0 0.00% 1 0 0 0
United States Department of Agriculture Animal and Plant Health Inspection Service Veterinary Services 52