discussion papers no. 19
TRANSCRIPT

Robot Adoption at German Plants Liuchun Deng, Verena Plümpe, Jens Stegmaier
Discussion Papers No. 19October 2020

Authors Liuchun DengSocial Sciences Division, Yale-NUS College, Singapore, and Halle Institute for Economic Research (IWH) ‒ Member of the Leibniz Association
Verena PlümpeHalle Institute for Economic Research (IWH) – Member of the Leibniz Association, Depart-ment of Structural Change and Productivity E-mail: [email protected]
Jens StegmaierInstitute for Employment Research (IAB)
The responsibility for discussion papers lies solely with the individual authors. The views expressed herein do not necessarily represent those of IWH. The papers represent prelimi-nary work and are circulated to encourage discussion with the authors. Citation of the discussion papers should account for their provisional character; a revised version may be available directly from the authors.
Comments and suggestions on the methods and results presented are welcome.
IWH Discussion Papers are indexed in RePEc-EconPapers and in ECONIS.
Editor
Halle Institute for Economic Research (IWH) – Member of the Leibniz Association Address: Kleine Maerkerstrasse 8 D-06108 Halle (Saale), Germany Postal Address: P.O. Box 11 03 61 D-06017 Halle (Saale), Germany Tel +49 345 7753 60 Fax +49 345 7753 820 www.iwh-halle.de
ISSN 2194-2188
IWH Discussion Papers No. 19/2020II

Using a newly collected dataset of robot use at the plant level from 2014 to 2018, we provide the first microscopic portrait of robotisation in Germany and study the potential determinants of robot adoption. Our descriptive analysis uncovers five stylised facts concerning both extensive and, perhaps more importantly, intensive margin of plant-level robot use: (1) Robot use is relatively rare with only 1.55% German plants using robots in 2018. (2) The distribution of robots is highly skewed. (3) New robot adopters contribute substantially to the recent robotisation. (4) Ro-bot users are exceptional along several dimensions of plant-level characteristics. (5) Heterogeneity in robot types matters. Our regression results further suggest plant size, low-skilled labour share, and exporter status to have strong and positive effect on future probability of robot adoption. Manufacturing plants impacted by the introduction of minimum wage in 2015 are also more likely to adopt robots. However, controlling for plant size, we find that plant-level productivity has no, if not negative, impact on robot adoption.
Keywords: robots, robot adoption, automation, labour, productivity, plant-level
JEL classification: J24, O14, O33
Robot Adoption at German Plants*
First Draft: October 2020This Draft: January 2021
Abstract
IWH Discussion Papers No. 19/2020 III
* We are grateful to Steffen Müller for stimulating conversations and constructive comments. We thank seminar participants at IWH for helpful comments. We are indebted to numerous firms, practitioners, and experts who helped us to develop the questionnaire. All errors are ours.
Liuchun Deng acknowledges support of the start-up grant from Yale-NUS College.

1 Introduction
The robots are coming. The recent advances of automation technology, robotics and artificialintelligence in particular, have sparked a heated debate over the future of labor and human societyat large. To better understand the recent wave of automation, a nascent literature examines thedrivers and consequences of (industrial) robots using firm- or plant-level data from mainly a fewEuropean countries.1 Perhaps surprisingly, there is little systematic microeconomic data on the useof robots in Germany, a country especially known for robot production and adoption, and thus, theexisting work on the rise of robots in Germany, Dauth et al. (2019) most notably, relies solely on theindustry-level dataset from the International Federation of Robotics (IFR).2 Using a newly collectedplant-level data in Germany, this paper attempts to fill this void.
In this paper, we leverage the plant-level information on the use and adoption of robots in the 2019IAB Establishment Survey to portray the state, the recent development, correlates, and potentialdeterminants of robot use and adoption in Germany. Five stylized facts emerge. First, robot use isrelatively rare, as only 1.55% of German plants used robots in 2018. Even in the manufacturingsector, only 8.22% of the plants were robot users. The finding is striking because Germany is thelargest robot market in Europe and among the countries with the highest robot intensity in theworld.3 Second, the distribution of robots is highly skewed. Top 5% of the robot-using plants ownedmore than half of the total robot stock in 2018. Third, the new robot adopters (the extensive margin)contributed substantially to growth in the share of robot users and the aggregate stock of robots from2014 to 2018. Fourth, robot users are exceptional. Robot users in 2018 are found to be larger, havehigher labor productivity, invest more, are more likely to export, and adopt up-to-date technologythan non-robot-using plants. We term those conditional gains from robot installation as robotizationpremia. Last, plants use different types of robots and heterogeneity in robot types matters for anarray of plant-level characteristics.
We further examine the potential determinants of robot adoption at the plant level. Our regressionresults demonstrate plant size to be the most robust predictor of future robot adoption. According toour preferred estimate, a one-standard-deviation increase in the total employment in 2014 leads to a1.6-percentage-point increase in the probability of robot adoption from 2015 to 2018, compared withthe unconditional probability of robot adoption which is 2.48% over the same period. Conditionalon plant size, both low-skilled labor intensity and export status have strong and positive effects onrobot adoption, while sub-sample regressions suggest that the effect of low-skilled labor intensity isonly found significant within the manufacturing sample. Manufacturing plants that raised wagesdue to the introduction of minimum wage in 2015 are also found to be more likely to adopt robots.Interestingly, we document that, when controlling for plant size, productivity has little, if not negative,effect on robot adoption. This result questions the overwhelmingly positive effect of productivity onrobotization predicted by the existing theoretical work (Koch et al., 2019; Humlum, 2019).
To our knowledge, this paper is the first to collect and use the plant-level robot data to investigaterobotization in Germany. Following the seminal paper by Graetz and Michaels (2018), the cross-
1See Acemoglu et al. (2020) and Bonfiglioli et al. (2019) for France, Humlum (2019) for Denmark, Koch et al. (2019)for Spain, and Barth et al. (2020) for Norway. See also Cheng et al. (2019) for robotization in China.
2The only exception is Zator (2019) which exploits the broader measures of automation (including robots and CNCmachines) and digitalization in the 2016 and 2017 waves of the IAB Establishment Panel.
3See IFR’s Annual Report, World Robotics: Industrial Robots 2018.
1

country industry-level IFR dataset has been widely used in empirical studies (Acemoglu and Restrepo,2019; Dauth et al., 2019; de Vries et al., 2020; Faber, 2020; among many others). Given the significantheterogeneity of robot use in both extensive and intensive margins across plants, industry-level robotinformation becomes increasingly insufficient for a deeper understanding of the roots and outcomesof robotization. Based on the newly-collected dataset, the stylized facts documented in this paperadd to the growing body of microeconomic evidence of robotization.4
This paper contributes to the literature on the determinants of robot adoption. The positiveeffects of plant size, low-skilled labor intensity, and exporter status echo empirical findings usingthe Spanish firm-level data in Koch et al. (2019). The impact of minimum wage on robot adoptionis consistent with the earlier firm-level evidence from China (Fan et al., 2020). The fact that,conditional on firm size being controlled, robot adopters are ex ante not more productive whileex post robot using plants enjoy higher productivity suggests that laggard plants may attempt toachieve productivity catchup by replacing their workers with robots, a channel largely overlooked inthe existing theoretical framework. By focusing on the effects of plant characteristics, our resultscomplement Acemoglu and Restrepo (2018a) and Zator (2019) which examine the labor marketfactors, population aging and labor scarcity in particular, of automation.
Last but not least, the rich robot information in our dataset enables us to explore two aspectsthat are largely neglected in the literature, namely, robotization in the manufacturing versus non-manufacturing sector and heterogeneity in robot types. Similar to the industry-level pattern in theIFR data, we find the non-manufacturing sector is at a much earlier stage of robotization. Moreimportantly, we note that skill composition and the introduction of minimum wage do not play asignificant role in robot adoption decision for non-manufacturing plants. Regression results furtherreveal that robotization premia vary significantly across plants using different types of robots.
The rest of the paper is organized as follows. In the next section, we introduce the datasetand present the five stylized facts. In Section 3, we present the empirical results on the potentialdeterminants of robot adoption. We provide concluding remarks in Section 4.
2 The Data and Stylized Facts
2.1 The Plant-level Data
The basis of our empirical analysis is drawn from the IAB Establishment Panel, an annual survey ofnearly 16,000 plants, sampled from around 2 million German employers with a particular focus onemployment5. The IAB Establishment Panel is a high-quality, long-standing panel data set thatis nationally representative as a whole but also at the sector level, for firm-size classes, and acrossGerman federal states. In the most recent 2019 wave, we included a dedicated section on robot use.Our definition of robots follows the ISO definition: A robot is any automated machine with multipleaxis or directions of movement, programmed to perform specific tasks (partially) without humanintervention. The difference between robots and traditional CNC machines is explicitly stated inthe survey. The survey questions include (1) whether a plant used robots from 2014 to 2018; if so,
4Another strand of the literature exploits alternative measures of the broader phenomenon of automation at themicroeconomic level (Bessen et al., 2019; Aghion et al., 2020; Domini et al., 2020).
5We use the IAB Establishment Panel, Waves 2013 -2019. DOI: 10.5164/IAB.IABBP9318.de.en.v1. For moreinformation on the IAB Establishment Panel, see Bechmann et al. (2019).
2

(2a) the number of robots used in each year from 2014 to 2018 and (2b) the number of robots newlypurchased in 2018; (3) heterogeneity regarding the types of robots in use.6 An additional surveyround was conducted for a subset of plants which we suspect may have given inaccurate answers torobot questions to ensure the quality and consistency of the dataset.
Our dataset is the first longitudinal dataset that reports direct measure of robot use and intensityat the plant level. Due to the scarcity of microeconomic information on robotization, most of theexisting papers infer the firm- or plant-level robot information indirectly from the import data(Acemoglu et al., 2020; Bonfiglioli et al., 2019; Humlum, 2019; Barth et al., 2020).7 This approachnot only suffers from the measurement error in trade classifications and domestic resales of robotsas noted in the literature but also is much less feasible in the German context given the country’sprominent role in robot production. Coming closest to our direct survey-based robot measures isthe Spanish data used in Koch et al. (2019), while we also obtain direct robot information in theintensive margin.
The plant-level data, aggregated to the industry-level, is broadly consistent and highly correlatedwith the industry-level IFR data for Germany.8 Given the panel structure, we incorporate a widearray of plant-level variables from the earlier waves of the IAB Establishment Panel. The resultingdataset is an unbalanced panel of 15,307 plants spanning from 2014 to 2018. Table 1 reports thesummary statistics for the main non-robot variables with the definition of each variable explained inthe notes. We now turn to the set of stylized facts on robot use and adoption.
2.2 Stylized Facts
Based on the newly collected plant-level information on robots, we present five stylized factsconcerning the use and adoption of robots in Germany. As the IAB Establishment Panel is based ona stratified sample design, survey weights are applied in order to obtain representative results forGermany. We mainly focus on the results with survey weights in the main text and relegate some ofthe unweighted results to the Appendix.
In what follows, we define a plant to be a robot user in a given year if that plant is identified tohave a positive number of robots in that year and a plant to be a robot adopter over a given period ifthat plant is identified to have no robots at the beginning of that period and become a robot user bythe end of the period.
Fact I: Robot use is relatively rare.In 2018, only 1.55% of the plants are robot users in Germany. Table 2 reports the share of robot
users in 2018 by industry. Column “Weighted” reports the share of robot users with survey weightsand thus provides a representative picture of plant-level robotization for the whole country. Themanufacturing sector, which has undergone a continued process of robotization for more than fivedecades,9 has 8.22% of the plants being robot users in 2018. Even for the most robot-intensive
6An English translation of the survey questions can be found in the Appendix.7Acemoglu et al. (2020) supplements the French customs data with three additional data sources to help them
identify the actual users of robots. Humlum (2019) also leverages a binary question on robot use in a 2018 Danishfirm-level survey.
8For details on cross validation, consistency checks, and imputation, see Plumpe and Stegmaier (Mimeo). Figure A1in the Appendix provides a general industry-level comparison between the two datasets.
9For a brief history of industrial robots, see the IFR 2012 report, History of Industrial Robots: From the FirstInstallation until Today.
3
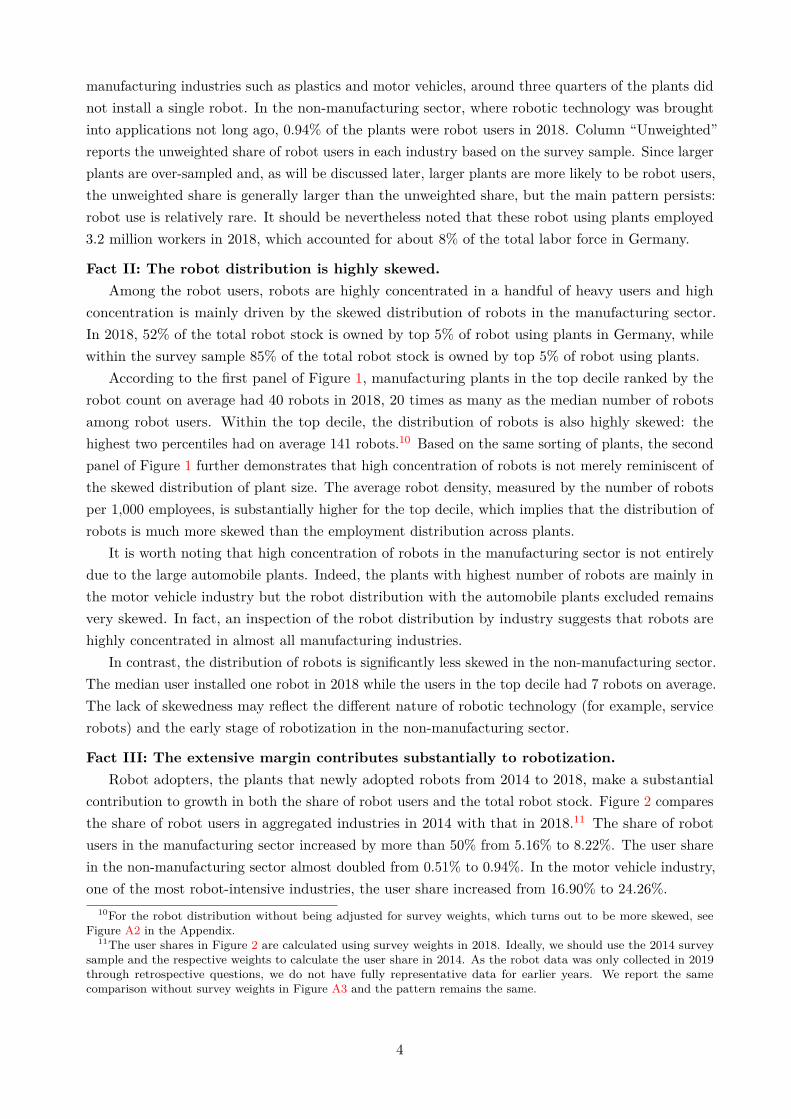
manufacturing industries such as plastics and motor vehicles, around three quarters of the plants didnot install a single robot. In the non-manufacturing sector, where robotic technology was broughtinto applications not long ago, 0.94% of the plants were robot users in 2018. Column “Unweighted”reports the unweighted share of robot users in each industry based on the survey sample. Since largerplants are over-sampled and, as will be discussed later, larger plants are more likely to be robot users,the unweighted share is generally larger than the unweighted share, but the main pattern persists:robot use is relatively rare. It should be nevertheless noted that these robot using plants employed3.2 million workers in 2018, which accounted for about 8% of the total labor force in Germany.
Fact II: The robot distribution is highly skewed.Among the robot users, robots are highly concentrated in a handful of heavy users and high
concentration is mainly driven by the skewed distribution of robots in the manufacturing sector.In 2018, 52% of the total robot stock is owned by top 5% of robot using plants in Germany, whilewithin the survey sample 85% of the total robot stock is owned by top 5% of robot using plants.
According to the first panel of Figure 1, manufacturing plants in the top decile ranked by therobot count on average had 40 robots in 2018, 20 times as many as the median number of robotsamong robot users. Within the top decile, the distribution of robots is also highly skewed: thehighest two percentiles had on average 141 robots.10 Based on the same sorting of plants, the secondpanel of Figure 1 further demonstrates that high concentration of robots is not merely reminiscent ofthe skewed distribution of plant size. The average robot density, measured by the number of robotsper 1,000 employees, is substantially higher for the top decile, which implies that the distribution ofrobots is much more skewed than the employment distribution across plants.
It is worth noting that high concentration of robots in the manufacturing sector is not entirelydue to the large automobile plants. Indeed, the plants with highest number of robots are mainly inthe motor vehicle industry but the robot distribution with the automobile plants excluded remainsvery skewed. In fact, an inspection of the robot distribution by industry suggests that robots arehighly concentrated in almost all manufacturing industries.
In contrast, the distribution of robots is significantly less skewed in the non-manufacturing sector.The median user installed one robot in 2018 while the users in the top decile had 7 robots on average.The lack of skewedness may reflect the different nature of robotic technology (for example, servicerobots) and the early stage of robotization in the non-manufacturing sector.
Fact III: The extensive margin contributes substantially to robotization.Robot adopters, the plants that newly adopted robots from 2014 to 2018, make a substantial
contribution to growth in both the share of robot users and the total robot stock. Figure 2 comparesthe share of robot users in aggregated industries in 2014 with that in 2018.11 The share of robotusers in the manufacturing sector increased by more than 50% from 5.16% to 8.22%. The user sharein the non-manufacturing sector almost doubled from 0.51% to 0.94%. In the motor vehicle industry,one of the most robot-intensive industries, the user share increased from 16.90% to 24.26%.
10For the robot distribution without being adjusted for survey weights, which turns out to be more skewed, seeFigure A2 in the Appendix.
11The user shares in Figure 2 are calculated using survey weights in 2018. Ideally, we should use the 2014 surveysample and the respective weights to calculate the user share in 2014. As the robot data was only collected in 2019through retrospective questions, we do not have fully representative data for earlier years. We report the samecomparison without survey weights in Figure A3 and the pattern remains the same.
4

It should be noted that out of the 616 plants that used robots from 2014 to 2018 in our surveysample, 104 (≈ 17%) plants reported missing values for their robot stock in 2014. Due to the missingvalues for the robot stock in 2014, the share of robot users in 2014 is estimated using the rate ofrobot adoption over 2014–2018 based on the plants that reported their robot stocks throughoutthe sample period. Figure A4 in the Appendix, a companion to Figure 2, presents both the lowerand upper bounds for the estimated share of robot users in 2014. The lower bound is calculated byassuming that all the plants with missing robot stock in 2014 were not robot users and the upperbound is calculated by assuming that those plants were all robot users in 2014. However, even themost conservative estimate based on the upper bound of the user share in 2014 suggests that theuser share rose considerably by more than a third from 2014 to 2018 in the manufacturing sector.
Figure 3 plots the growth of robot stock by industry from 2014 to 2018.12 The industry-levelgrowth is decomposed into the extensive and intensive margins. The extensive margin, illustrated bythe light blue bars, is the contribution of robot adopters from 2014 to 2018 to the overall growthof robots, while the intensive margin, illustrated by the dark blue bars, is the contribution of theplants that already used robots in 2014. Two notable features arise. First, the aggregate numbersfor the manufacturing sector mask substantial heterogeneity across industries. For example, inthe electrical equipment industry, the adopters play a dominant role in robot growth by raisingthe industry-level robot stock by 260% from 2014 to 2018, which stands in sharp contrast to themotor vehicle industry where robots have been traditionally heavily used. Since the motor vehicleindustry has reached a mature phase of robotization with an exceptionally high stock, it significantlydownsizes the overall growth in robot stock and the contribution of the extensive margin in themanufacturing sector. Second, the contribution of the extensive margin to growth is much greaterin the non-manufacturing sector. The majority of the new robot purchases were made by robotadopters in that sector, consistent with the pattern suggested by the previous figure.13
Fact IV: Robot users are exceptional.Robot users are not only rare but also different from non-users in a number of plant-level
characteristics. To capture robotization premia, which draw a direct parallelism with the exporterpremia as in Bernard et al. (2007, 2018), we use the 2018 cross-sectional sample to perform a batteryof bivariate regressions of the following form
Xijk = α+ βRobotUseijk + φj + ψk + γ log(Empijk) + εijk, (1)
where Xijk is a given characteristic of interest for plant i in industry j and state k; RobotUseijk isa dummy variable which equals one if plant i used robots in 2018 and zero otherwise; φj and ψk
are the industry and state fixed effects; Employmentijk is the plant-level employment count. Ourspecification takes into account important features that approximate the sample design of the IABEstablishment Panel (plant size, region, and industry), so we do not weight our regressions andpresent regression results without survey weights throughout this paper for conciseness.14 We have
12Again, survey weights in 2018 are applied to the calculation. For the decomposition without survey weights, seeFigure A5 in the Appendix.
13Hidden in Figure 3 is the number of robots being replaced. According to the survey answers, a significant shareof the new robot installations in 2018 can be attributed to replacement of the existing robots, echoing a channelconsidered in the extension of the baseline model in Humlum (2019).
14For a detailed comparison between weighted regressions and unweighted regressions with the elements of the surveydesign being controlled for, see Bossler et al. (2018).
5

also run the same regression specification with survey weights, but the implications based on theseresults are qualitatively the same. Thus, our regression results can be viewed as representative forGermany.
According to the estimates of β in Table 3, robot users are larger, have higher labor productivity,make more investments, and are more likely to export and adopt the most updated technology. AsColumn (2) suggests, the average plant size of the robot users, measured by the employment count,is more than 4 times (e1.422 ≈ 4.145) as large as that of the non-users. Controlling for plant size,Column (3) suggests that the share of low-skilled labor in total employment is 2.7 percentage pointshigher in robot-using plants. Interestingly, the last two rows of estimates imply that robot usersare consistently associated with a lower level of product and process improvement and refinement.Columns (4) and (5) report coefficient estimates of the robot use dummy for the manufacturing andnon-manufacturing samples separately. The robotization premia are remarkably similar for mostof the plant-level characteristics. The only notable difference lies in the share of low-skilled labor:robot users in the manufacturing sector hire disproportionately more low-skilled labor while robotusers in the non-manufacturing sector have a smaller share of low-skilled labor than non-users do.
Within the sample of robot users, we examine robotization premia on the intensive margin:
Xijk = α+ β log(Robotijk) + φj + ψk + γ log(Empijk) + εijk, (2)
where log(Robot) is the log number of robots in a given plant in 2018. According to Table 4, plantsthat use more robots are larger. A 10% increase in robot stock is associated with 3.93% increase inplant size measured by employment. Due to the small sample size, the point estimates are much lessprecise for other variables, but the signs of those estimates are largely consistent with our findingson the extensive margin. Plants with more robots have higher labor productivity and employ alarger share of low-skilled labor. The only exception is exporter status. Heavy robot users are notnecessarily more likely to export.
Fact V: Heterogeneity of robots matters.The composition of robots changes over time. Technological progress in the last decade has been
shaking the stereotype of (industrial) robots; robots which can be used in collaboration with humanworkers, usually smaller in size and cheaper in price, are on the rise.15 To estimate the overalleffect of robotization and its evolution, it is important to understand whether collaborative andless expensive robots differ from the prevalent and more expensive non-collaborative robots in theirimpact on plant-level outcomes.
According to our survey, 49% of the German robot using plants reported using robots that areseparated from employees during the regular operations with the help of a protection device (labeledas “cage robots” henceforth), which are distinguished from the new collaborative robots, and 54% ofthe robot using plants reported using robots that cost more than 50,000 Euros (labeled as “expensiverobots” henceforth) in 2018. Among those cage robot users, more than 85% of them had all of theirrobots operated in separation from employees, accounting for 72% of the total robot stock. Amongthose expensive robot users, 78% of them had all of their robots purchased at a price above 50,000Euros, accounting for 45% of the total robot stock.16
15For a more detailed discussion on “cobots”, collaborative robots, see World Robotics: Industrial Robots 2018.16These shares are calculated with survey weights. Within the survey sample, close to 70% of the robot users used
6

Leveraging the information on robot types, we reexamine robotization premia on both theextensive and intensive margin. In Equation (1), we replace the dummy RobotUse with threedummies corresponding to three types of robot users: plants with all robots being cage robots, plantswith all robots being purchased at a price of above 50,000 Euros, and robot users that do not belongto the first two categories. Note that the first two categories are not mutually exclusive. The controlgroup for these extensive margin regressions are the non robot using plants. In Equation (2), wefurther include the share of cage robots and that of expensive robots to explore the intensive marginamong robot users.
According to the first panel in Table 5, robot users are all significantly larger than non-users, butthis size premium is largest for plants that solely used cage robots. Conditional on plant size beingcontrolled, cage robot users tend to have higher labor productivity and are much more likely toexport. The purchase price of robots does not yield any significant difference in plant characteristicsin the extensive-margin regression. In the second panel, we study the role of the composition ofrobots. Both the share of cage robots and that of expensive robots are significantly positivelycorrelated with plant size. Controlling for the number of robots, a plant that solely uses cage robotsis 55% larger than a plant that does not use cage robots; the size premium for the expensive robotsis 44%. Consistent with the extensive margin result, a larger share of cage robots is associated withhigher probability of export. Those results taken together point to the importance of accounting forheterogeneity of robots.
3 Plant-level Correlates of Robot Adoption
In this section, we explore the potential determinants of robot adoption. In Germany, robot usersdiffered from non-users in several plant characteristics in 2018, as shown in the previous section inStylized Fact IV. To examine whether these differences existed prior to adoption of robots, we focuson the sample of robot adopters. Using the sample of plants that reported no robot use in 2014,we investigate which plant-level characteristics in the base year correlate with robot adoption insubsequent years. Our baseline cross-sectional regression setting is given by
RobotAdp2015−2018ijk = α+X2014
ijk β + φj + ψk + εijk, (3)
where Xijk is a set of plant-level characteristics in 2014 for plant i in industry j and state k;RobotAdpijk is a dummy variable which equals one if a plant that did not use robots in 2014 newlyadopted robots from 2015 to 2018; φj and ψk are the industry and state fixed effects. Based on ourdefinition of robot adoption, 189 plants in total are identified as robot adopters from 2015 to 2018,among which 33 adopted robots for the first time in 2015, 44 in 2016, 34 in 2017, and 78 in 2018.
In light of a task-based framework of robot adoption with firm heterogeneity as in Koch et al.(2019), we focus on five categories of plant-level characteristics as potential determinants of robotadoption: (1) plant size measured by total employment or business volume; (2) productivity measuressuch as labor productivity or TFP; (3) skill composition proxied by the share of low-skilled labor orthe average wage; (4) change in labor cost due to the introduction of minimum wage in 2015;17 (5)
cage robots and 65% of them used expensive robots.17The uniform minimum wage was introduced country-wide on January 1, 2015 and the hourly minimum wage was
initially set at 8.50 Euros.
7

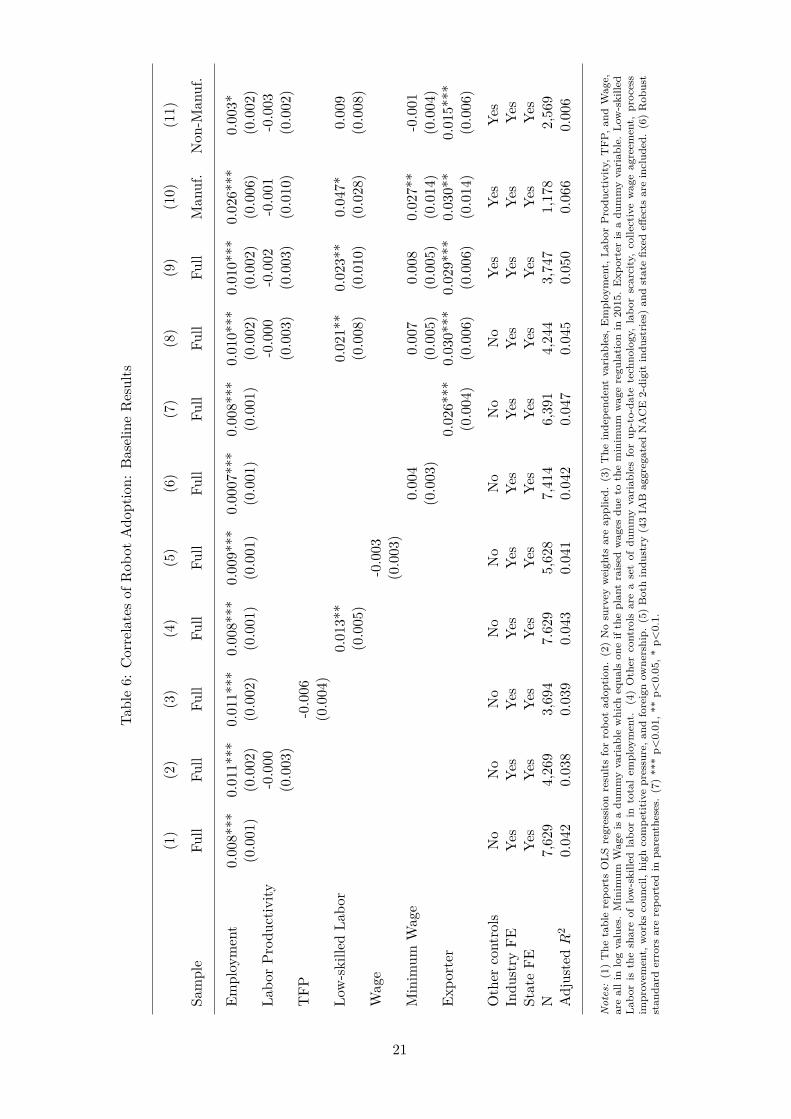
exporter status.Table 6 presents the baseline regression results. Columns (1) – (9) report the results for the
full sample. The total employment has a consistently positive effect on future robot adoption. Theeffect is statistically significant across all specifications. The robust finding of plant size premiumin adoption is consistent with the framework as in Humlum (2019) which postulates that robotictechnology enter multiplicatively the production function and adoption of robots involves a one-timefixed cost. Columns (2) – (7) present regression results for each of the productivity, skill, labor cost,and trade measures with the total employment being controlled. Interestingly, once plant size iscontrolled for, productivity does not seem to have any additional effect on robot adoption. The shareof low-skilled labor positively impacts robotization. It is consistent with the prediction of the task-based theoretical framework (Acemoglu and Restrepo, 2018b): other things equal, low-skilled laborwhich has comparative advantage in performing simple and easily automatable tasks is more likely tobe replaced by robots. The average wage, arguably a cruder measure of plant-level skill composition,however shows no significant effect on robot adoption. In Column (6), the minimum-wage dummy isdefined as whether a plant raised its wages due to the introduction of minimum wage in 2015. For thefull sample, the estimate is positive but not significant. Similar to Koch et al. (2019), the exporterstatus in Column (7) is found to have a positive effect on robot adoption. In Column (8), we includemeasures of all the five categories of plant-level characteristics simultaneously, the effects of the shareof low-skilled labor and exporter status remain positive and statistically significant with increasedmagnitude. In Column (9), we further control for a wide array of plant-level characteristics whichmay potentially impact robot adoption. In particular, as documented by Zator (2019) that laborscarcity has a strong effect on adoption of automation technology, we control for plant-level laborscarcity by including a dummy variable that equals one if a plant experiences any of the followingstaffing problems: skilled workers hard to find; staff shortage; innovation prevented due to lack ofqualified staff. Our main results are found to be robust to additional controls.
Our point estimates are not only statistically significant but also economically sizable. Accordingto our preferred estimate in Column (9), a one-standard-deviation increase in log(Employment) in2014, which is 1.6, leads to a 1.6 percentage point increase in the probability of robot adoption.A one-standard-deviation increase in the share of low-skilled labor in 2014, which is 0.27, yields a0.57 percentage point increase in adoption probability, while being an exporter increases adoptionprobability by 3.0 percentage points. Compared with the unconditional probability of robot adoptionbeing 2.48%, the effects of plant size, skill composition, and exporter status on robot adoption arequite substantial in their magnitude.
Columns (10) and (11) in Table 6 further report the regression results for the manufacturingand non-manufacturing samples. The coefficient of employment remains statistically significantand positive in both samples while the magnitude of the estimated effect is much larger in themanufacturing sector. It is worth highlighting that our point estimate of employment for themanufacturing sample is remarkably similar to the results in the panel specification of Koch et al.(2019) using the Spanish manufacturing firm-level data. The estimated coefficient of the share oflow-skilled labor doubles in the manufacturing sector while its positive effect largely disappears inthe non-manufacturing sector. More interestingly, plants impacted by the minimum wage legislationin 2015 see a significant increase in adoption probability in the manufacturing sector, consistent withthe findings in Fan et al. (2020) using the Chinese firm-level data, whereas in the non-manufacturing
8

sector, change in labor cost due to minimum wage seems to have no effect. These comparisonstaken together suggest that the determinants of robot adoption may be quite different between themanufacturing and non-manufacturing plants. As collaborative robots are used more intensivelyin the non-manufacturing sector, the elasticity of substitution between robots and human workersmay depend on the type of robots and thus be different there. The effect of exporter status onrobotization is also stronger in the manufacturing sector, though the effect remains highly significantand economically meaningful in the non-manufacturing sector. The robust results on exporter statusunderscore the role of international trade in robotization: Since both plant size and productivity arecontrolled for, the effect of trade on robot adoption perhaps operates through a channel that goesbeyond market size and productivity selection.
To make it more comparable with the findings in Koch et al. (2019), Table 7 presents the cross-sectional regression results with an output-based measure of plant size, the total business volume.The main difference from Table 6 is that higher labor productivity now implies lower adoptionprobability and this negative effect is statistically significant for both full and non-manufacturingsample. Competing arguments can be made for how productivity impacts robot adoption decision.On the one hand, more productive firms have higher incentives to adopt robots due to the standardproductivity selection channel as in Koch et al. (2019). On the other hand, it is conceivable thatlaggard plants may attempt to catch up by replacing employees with lower labor productivitywith robots. Since the total business volume, as an output measure, is less reliable than the totalemployment, an input-based measure, in Establishment Panel, we view the negative coefficient ofproductivity in Table 7 as tentative evidence of calling for an incorporation of the catch-up motiveinto the model of robot adoption.
More than 40% of the robot adopters in our sample adopted robots in 2018, while the cross-sectional specification has the base year as of 2014. To address this issue and better exploit thetiming information of robot adoption, we construct a panel dataset by dividing the sample periodequally into two two-year windows. The regression specification is given by
RobotAdpt+1,t+2ijk = α+Xijktβ + φjt + ψkt + εijkt, (4)
where the base year t is 2014 for the first period and 2016 for the second period and RobotAdpt+1,t+2ijk
is a dummy variable which equals one if a plant that did not use robots in base year t newly adoptedrobots in the two subsequent years; φjt and ψkt are the industry-period and state-period fixed effects.We drop all the plant-period pairs if a plant used robots in or prior to the base year of a given period.Therefore, if a plant adopted robots in the first period, its second-period observation is excludedfrom our sample.
Table 8 reports the regression results using the panel data. The results confirm the findings in thecross-sectional regressions with the only exception that the positive effect of exporter status on robotadoption is no longer significant for the non-manufacturing plants in Column (4). Compared withTable 6, the point estimates for the total employment, the share of low-skilled labor, and exporterstatus are about half of the cross-sectional estimates with the statistical significance preserved. Thisis reassuring because we study the effect of plant-level characteristics on robot adoption decision inthe subsequent two years in the panel specification as opposed to four years in the cross-sectionalsetting.
9

To summarize, we document the effects or lack thereof of five plant-level characteristics on robotadoption decision which have all been theoretically formulated in the existing literature. First,larger plants are more likely to adopt robots and the positive effect of plant size is substantiallystronger in the manufacturing sector. Second, conditional on plant size being controlled, robotadopters are ex ante not more productive than non adopters. Moreover, plants with a higher shareof low-skilled labor and plants impacted by the minimum wage introduction are more likely to adoptrobots and the effects are entirely driven by the manufacturing plants. Last, participation in exportseems to introduce additional incentives for adoption and the exporter effect is also stronger for themanufacturing plants.
4 Concluding Remarks
Using a newly collected dataset, we provide the first portrait of the use and adoption of robots atthe plant level in Germany. Five stylized facts emerge from our descriptive analysis: (1) Robot use isrelatively rare; (2) The distribution of robots is highly skewed; (3) The extensive margin contributessubstantially to the recent robotization; (4) Robot users are larger, more productive, and more likelyto export and use low-skilled labor more intensively; (5) Heterogeneity of robots matters. Examiningthe potential determinants of robot adoption, we find plant size, the share of low-skilled labor, andexporter status to have a strong positive impact on future robot adoption, while once plant size iscontrolled, productivity has no, if not negative, impact on robotization. Introduction of minimumwage also incentivizes plants in the manufacturing sector to adopt robots.
Our empirical results point to several interesting open questions. First, the fact that robot usershave higher labor productivity but are ex ante not more productive than non-adopters suggeststhat robot adoption may have a positive effect on labor productivity as documented by Koch et al.(2019), Bonfiglioli et al. (2019) and Acemoglu et al. (2020) using Spanish and French data and alsoearlier cross-country regressions as in Graetz and Michaels (2018). Second, it remains unclear ifrobotization premia in plant size, low-skilled labor intensity, and exporter status are reminiscent ofthe ex-ante differences due to self-selection of plants into robotization. Third, since our plant-levelrobot dataset can be readily merged with the worker-level employment biographies in Germany, it isexciting to investigate the wage and employment dynamics for workers in robot-adopting plants. Weplan to take up all those questions in our future work.
References
Acemoglu, Daron and Pascual Restrepo, “Demographics and automation,” Working Paper,2018.
and , “The race between man and machine: Implications of technology for growth, factorshares, and employment,” The American Economic Review, 2018, 108 (6), 1488–1542.
and , “Robots and jobs: Evidence from US labor markets,” Journal of Political Economy,2019, 122 (4), 1759–1799.
, Claire Lelarge, and Pascual Restrepo, “Competing with robots: Firm-level evidence fromFrance,” AEA Papers and Proceedings, 2020, 110, 383–388.
10

Aghion, Philippe, Celine Antonin, Simon Bunel, and Xavier Jaravel, “What are the laborand product market effects of automation? New evidence from France,” Working Paper, 2020.
Barth, Erling, Marianne Roed, Pal Schøne, and Janis Umblijs, “How robots change within-firm wage inequality,” Working Paper, 2020.
Bechmann, Sebastian, Nikolai Tschersich, Peter Ellguth, Susanne Kohaut, and Elisa-beth Baier, “Technical report on the IAB Establishment Panel,” FDZ-Methodenreport, 2019.
Bernard, Andrew B, J Bradford Jensen, Stephen J Redding, and Peter K Schott, “Firmsin international trade,” Journal of Economic Perspectives, 2007, 21 (3), 105–130.
, , , and , “Global firms,” Journal of Economic Literature, 2018, 56 (2), 565–619.
Bessen, James E, Maarten Goos, Anna Salomons, and Wiljan Van den Berge, “Automaticreaction – What happens to workers at firms that automate,” Working Paper, 2019.
Bonfiglioli, Alessandra, Rosario Crino, Harald Fadinger, and Gino Gancia, “Robotsimports and firm-level outcomes,” Working Paper, 2019.
Bossler, Mario, Gregor Geis, and Jens Stegmaier, “Comparing survey data with an officialadministrative population: Assessing sample-selectivity in the IAB Establishment Panel,” Quality& Quantity, 2018, 52 (2), 899–920.
Cheng, Hong, Ruixue Jia, Dandan Li, and Hongbin Li, “The rise of robots in china,” Journalof Economic Perspectives, 2019, 33 (2), 71–88.
Dauth, Wolfgang, Sebastian Findeisen, Jens Suedekum, and Nicole Woessner, “Adjustingto robots: Worker-level evidence,” Working Paper, 2019.
de Vries, Gaaitzen J, Elisabetta Gentile, Sebastien Miroudot, and Konstantin MWacker, “The rise of robots and the fall of routine jobs,” Labour Economics, 2020, 66, 101885.
Domini, Giacomo, Marco Grazzi, Daniele Moschella, and Tania Treibich, “Threats andopportunities in the digital era: Automation spikes and employment dynamics,” Research Policy,2020, forthcoming.
Faber, Marius, “Robots and reshoring: Evidence from Mexican labor markets,” Journal ofInternational Economics, 2020, forthcoming.
Fan, Haichao, Yichuan Hu, and Lixin Tang, “Labor costs and the adoption of robots in China,”Journal of Economic Behavior & Organization, 2020, forthcoming.
Graetz, Georg and Guy Michaels, “Robots at work,” The Review of Economics and Statistics,2018, 100 (5), 753–768.
Humlum, Anders, “Robot adoption and labor market dynamics,” Working Paper, 2019.
Koch, Michael, Ilya Manuylov, and Marcel Smolka, “Robots and firms,” Working Paper,2019.
11

Muller, Steffen, “Capital stock approximation with the perpetual inventory method: An update,”FDZ-Methodenreport, 2017, 5.
Plumpe, Verena and Jens Stegmaier, “Robots in Germany: A new dataset from the IABEstablishment Panel (2019),” Mimeo.
Zator, Micha l, “Digitization and automation: Firm investment and labor outcomes,” WorkingPaper, 2019.
12

Figures
Figure 1: The Intensive Margin: Robot Distribution in the Manufacturing Sector in 2018
Notes: (1) We sort plants by the number of robots reported in 2018. For plants with the same number of robots, they are randomlysorted (a further sorting by plant-level attributes like plant size could artificially skew the distribution of robot intensity). Thesame sorting is applied to both panels. (2) Survey weights are applied. (3) Average robot count or robot density (measured byrobot count per 1,000 employees) is calculated within each decile or bi-centile and rounded to the closest integer. (4) Due toskewedness of the distribution, the first panel is plotted in log scale.
13

Figure 2: Growth in the Extensive Margin from 2014 to 2018
Notes: (1) A plant is identified as a robot user in 2018 if it answered yes to the question of whether it used robots from 2014 to2018 and its robot stock in 2018 was not zero. (2) Survey weights in 2018 are applied. (3) The estimated share of robot usersin 2014 is the product of the share of robot users in 2018 and the share of plants reporting a positive robot stock in 2014 in therobot users in 2018 reporting a non-missing robot stock in 2014.
14

Figure 3: Decomposition of Growth of Robot Stock: The Extensive versus Intensive Margin
Notes: (1) Calculations are based on the surveyed plants that reported their robot use in each year from 2014 to 2018. Surveyweights in 2018 are applied. (2) For each industry (sector), the contribution of the robot adopters to growth is defined as theratio of the total robot stock of robot adopters in 2018 to the robot stock aggregated over the existing users in 2014. Thecontribution of the robot users to growth is defined as the percentage change of the aggregate robot stock from 2014 to 2018 forthe plants that already used robots in 2014.
15

Tables
Table 1: Summary Statistics
Variable Mean Std. Dev. N
Summary Statistics in 2018
Employment 107.32 1100.12 15,307Labor Productivity (€1,000/Worker) 56.79 69.39 8,267log(TFP) 4.63 1.25 4,264Exporter 0.22 0.41 13,156Monthly Wage (€1,000) 2.07 2.14 12,386Low-skilled Labor 0.34 0.30 15,307Investment (€1,000) 1,410.24 52,105.62 14,282Up-to-date Technology 0.62 0.48 15,262Product Improvement 0.65 0.48 15,259Process Improvement 0.83 0.38 15,259
Summary Statistics in 2014
Employment 103.62 967.73 7,832Business Volume (€1,000) 25,297.10 770,542.76 5,008Labor Productivity (€1,000/Worker) 56.81 66.37 4,418log(TFP) 4.47 1.28 3,840Exporter 0.23 0.42 6,587Monthly Wage (€1,000) 1.92 1.09 5,812Low-skilled Labor 0.27 0.27 7832
Notes: (1) The summary statistics are based on the sample of plants that provided a non-missing answer to whether theyused robots in 2018. (2) No survey weights are applied. (3) Employment is the total employment count. Labor Productivityis defined as value added per worker. TFP is the residual obtained by regressing the business volume on labor, capital, andintermediate input by industry. Capital stock is approximated using the method as in Muller (2017). Export is a dummy forexporter status. Monthly Wage is the average monthly wage of all employees that are subject to social insurance contributions,including part-time employees and apprentices. Low-skilled Labor is the share of workers without degree or apprenticeship intotal employment. Investment is the total investment. Up-to-date Technology is a dummy variable for plants that answer “upto date” about their technological status. Product Improvement is a dummy variable for product improvement or refinement.Process improvement is a dummy variable for development or implementation of improved procedure. Business Volume is thetotal sales (CPI-deflated).
16

Table 2: The Extensive Margin: Share of Robot Users by Industry in 2018
Industry/Sector Weighted (%) Unweighted (%) # of Surveyed Plants
All Manufacturing 8.22 14.52 3,257
plastics 25.55 30.98 184motor vehicles 24.26 30.50 200basic metals 12.67 21.00 200fabricated metal 6.22 17.07 457machinery and equipment 11.29 15.90 434electrical equipment 11.33 15.34 163glass/ceramic 7.74 14.44 187precision/optical equipment 4.16 11.18 152paper/print/wood 7.61 10.96 228food/luxury 5.87 10.54 313furniture/jewelry/sports/medical 9.67 8.68 265chemical/pharmaceutical 7.12 5.85 205textiles/clothing 3.27 2.26 133repair/installation 0.10 0.74 136
All Non-manufacturing 0.94 1.16 12,050
mining 5.71 12.00 25agriculture/forestry 7.41 4.79 334research/development 0.28 4.17 72reparation of consumer goods 6.78 2.94 34wholesale trade 1.62 2.51 479retail trade 1.43 1.88 1,170culture/sports/entertaining 2.00 1.71 175legal accounting/advertising 1.46 1.38 290building/installation 1.45 1.24 807information/communication 0.43 1.24 322architecture 0.34 1.22 328other services 0.24 1.20 332transport/warehousing 0.97 1.19 587consulting 0.27 1.18 170human health 0.34 1.04 1,828main building sector 0.37 1.01 296other non-manufacturing 0.28 0.49 4,937
Total 1.55 4.00 15,307
Notes: (1) Column “Weighted” reports the share of robot users with survey weights. (2) Column “Unweighted” reports theshare of robot users without survey weights. (3) The last column reports the total number of surveyed plants (robot usersand non-users). (4) The second to last row is a residual category that consists of all the “other non-manufacturing” industrieswith the unweighted user share below 1%, which include itinerant trading/landscaping, repair/installation, activities of member-ship, civil service/social insurance, hotel business/gastronomy, energy, real estate activities, placement/temporary provision oflabor, education, financial/insurance sector, sales/maintenance/repair of, marketing/design/translation, renting, and veterinaryindustry.
17

Tabl
e3:
Rob
otiz
atio
nPr
emia
onth
eEx
tens
ive
Mar
gin
Dep
ende
ntEm
ploy
men
tLa
bor
TFP
Expo
rter
Wag
eLo
w-s
kille
dIn
vest
men
tU
p-to
-dat
ePr
oduc
tPr
oces
sVa
riabl
ePr
oduc
tivity
Labo
rTe
chno
logy
Impr
ovem
ent
Impr
ovem
ent
No
Con
trol
1.80
2***
0.54
6***
-0.0
710.
462*
**0.
449*
**-0
.070
***
2.29
8***
0.04
5**
-0.3
53**
*-0
.308
***
Full
Sam
ple
(0.0
70)
(0.0
35)
(0.0
53)
(0.0
20)
(0.0
24)
(0.0
10)
(0.1
05)
(0.0
19)
(0.0
19)
(0.0
20)
FE1.
422*
**0.
315*
**-0
.004
0.22
6***
0.24
6***
-0.0
30**
1.69
2***
0.12
2***
-0.2
46**
*-0
.254
***
Full
Sam
ple
(0.0
64)
(0.0
41)
(0.0
23)
(0.0
16)
(0.0
31)
(0.0
12)
(0.1
01)
(0.0
21)
(0.0
20)
(0.0
16)
FE+
Size
0.13
3***
-0.0
070.
169*
**0.
006
0.02
7**
0.63
5***
0.09
6***
-0.1
63**
*-0
.197
***
Full
Sam
ple
(0.0
40)
(0.0
24)
(0.0
16)
(0.0
28)
(0.0
12)
(0.0
76)
(0.0
21)
(0.0
20)
(0.0
16)
FE+
Size
0.06
3-0
.007
0.07
4***
-0.0
260.
051*
**0.
399*
**0.
076*
**-0
.103
***
-0.1
45**
*M
anuf
.(0
.041
)(0
.023
)(0
.024
)(0
.027
)(0
.012
)(0
.085
)(0
.027
)(0
.025
)(0
.023
)
FE+
Size
0.09
6-0
.012
0.08
1***
0.02
7-0
.044
*0.
726*
**0.
118*
**-0
.177
***
-0.2
15**
*N
on-m
anuf
.(0
.088
)(0
.060
)(0
.027
)(0
.057
)(0
.023
)(0
.150
)(0
.040
)(0
.038
)(0
.029
)
Not
es:
(1)
The
tabl
ere
port
sth
ees
tim
ated
coeffi
cien
tof
the
dum
my
vari
able
ofro
bot
use
byre
gres
sing
agi
ven
plan
t-le
vel
char
acte
rist
icon
the
robo
t-us
edu
mm
yan
dad
diti
onal
cont
rols
.(2
)N
osu
rvey
wei
ghts
are
appl
ied.
(3)
The
depe
nden
tva
riab
les,
Em
ploy
men
t,La
bor
Pro
duct
ivity
,T
FP,
and
Wag
e,In
vest
men
t,ar
eal
lin
log
valu
es.
Exp
orte
r,U
pdat
e-to
-dat
eTe
chno
logy
,P
rodu
ctIm
prov
emen
t,an
dP
roce
ssIm
prov
emen
tar
edu
mm
yva
riab
les.
Low
-ski
lled
Labo
ris
the
shar
eof
low
-ski
lled
labo
rin
tota
lem
ploy
men
t.(4
)T
here
are
five
spec
ifica
tion
s.T
hefir
stth
ree
spec
ifica
tion
sus
eth
efu
llsa
mpl
e(N
=15
,307
).T
hefo
urth
spec
ifica
tion
isba
sed
onth
em
anuf
actu
ring
sam
ple
(N=
3,25
7)an
dth
efif
this
base
don
the
non-
man
ufac
turi
ngsa
mpl
e(N
=12
,050
).T
here
gres
sion
sam
ple
size
vari
esac
ross
plan
t-le
velc
hara
cter
isti
cs.
(5)
Inth
efir
stsp
ecifi
cati
on(“
No
Con
trol
”),t
here
isno
addi
tion
alco
ntro
l.T
hese
cond
spec
ifica
tion
(“F
E”)
incl
udes
indu
stry
(43
IAB
aggr
egat
edN
AC
E2-
digi
tin
dust
ries
)an
dst
ate
fixed
effec
ts.
The
last
thre
esp
ecifi
cati
ons
(“F
E+
Size
”)in
clud
ebo
thfix
edeff
ects
and
plan
t-le
vel
empl
oym
ent
(in
log)
.(6
)R
obus
tst
anda
rder
rors
are
repo
rted
inpa
rent
hese
s.(6
)**
*p<
0.01
,**
p<0.
05,*
p<0.
1.
18

Table 4: Robotization Premia on the Intensive Margin
Dependent Employment Labor TFP Exporter Wage Low-skilledVariable Productivity Labor
Controls: Industry and State Fixed Effects
log(Robots) 0.393*** 0.080*** -0.001 0.012 0.073*** 0.005(0.049) (0.028) (0.016) (0.016) (0.018) (0.009)
N 553 392 224 534 483 553Adjusted R2 0.436 0.263 0.891 0.291 0.424 0.174
Controls: Industry and State Fixed Effects and Plant Size
log(Robots) 0.023 0.002 -0.014 0.022 0.014(0.029) (0.017) (0.017) (0.017) (0.009)
N 392 224 534 483 553Adjusted R2 0.317 0.890 0.319 0.508 0.187
Notes: (1) The table reports the estimated coefficient of the number of robots (in log). (2) No survey weights are applied. (3)The dependent variables, Employment, Labor Productivity, TFP, and Wage, are all in log values. Exporter is a dummy variable.Low-skilled Labor is the share of low-skilled labor in total employment. (4) Both specifications are based on the full sampleof robot users in 2018. The first specification includes industry (43 IAB aggregated NACE 2-digit industries) and state fixedeffects. The second specification includes both fixed effects and plant-level employment (in log). (5) Robust standard errors arereported in parentheses. (6) *** p<0.01, ** p<0.05, * p<0.1.
19

Table 5: Robotization Premia: Heterogeneity in Robot Types
Employment Labor TFP Exporter Wage Low-skilledProductivity Labor
Extensive Margin
Cage Robot User 0.935*** 0.132* -0.029 0.167*** 0.014 0.007(0.121) (0.072) (0.043) (0.029) (0.052) (0.022)
Expensive Robot User 0.719*** 0.056 0.023 0.050 -0.020 0.036(0.129) (0.077) (0.046) (0.031) (0.055) (0.024)
Other Robot User 0.697*** -0.144 -0.096 0.093** 0.071 0.012(0.160) (0.097) (0.061) (0.038) (0.067) (0.029)
N 15,206 8,224 4,248 13,074 12,267 15,206Adjusted R2 0.228 0.250 0.935 0.303 0.356 0.211
Intensive Margin
log(Robots) 0.387*** 0.031 -0.010 -0.015 0.024 0.018*(0.051) (0.030) (0.018) (0.017) (0.018) (0.010)
Share of 0.551*** 0.042 0.001 0.102** -0.006 -0.004Cage Robots (0.158) (0.092) (0.063) (0.052) (0.054) (0.028)
Share of 0.440*** 0.082 0.032 -0.014 0.014 0.038Expensive Robots (0.139) (0.080) (0.049) (0.045) (0.048) (0.025)
N 513 375 218 502 460 513Adjusted R2 0.459 0.327 0.889 0.334 0.494 0.201
Notes: (1) For the first panel, in 2018, 390 plants solely used cage robots (CageUser = 1), 323 plants solely used expensive robots(ExpUser = 1), and 107 plants were tagged as other robot users (OthUser = 1). 207 plants solely used both cage and expensiverobots (CageUser = ExpUser = 1). Robot using plants that did not answer survey questions on robots types are excluded. (2)For the first panel, the control group are non robot using plants. (3) The dependent variables, Employment, Labor Productivity,TFP, and Wage, are all in log values. Exporter is a dummy variable. Low-skilled Labor is the share of low-skilled labor in totalemployment. (4) Column “Employment” includes only industry and state fixed effects; the other columns include both industryand state fixed effects and the employment count (in log) as controls. (5) No survey weights are applied. (6) Robust standarderrors are reported in parentheses. (7) *** p<0.01, ** p<0.05, * p<0.1.
20
Tabl
e6:
Cor
rela
tes
ofR
obot
Ado
ptio
n:B
asel
ine
Res
ults
(1)
(2)
(3)
(4)
(5)
(6)
(7)
(8)
(9)
(10)
(11)
Sam
ple
Full
Full
Full
Full
Full
Full
Full
Full
Full
Man
uf.
Non
-Man
uf.
Empl
oym
ent
0.00
8***
0.01
1***
0.01
1***
0.00
8***
0.00
9***
0.00
07**
*0.
008*
**0.
010*
**0.
010*
**0.
026*
**0.
003*
(0.0
01)
(0.0
02)
(0.0
02)
(0.0
01)
(0.0
01)
(0.0
01)
(0.0
01)
(0.0
02)
(0.0
02)
(0.0
06)
(0.0
02)
Labo
rPr
oduc
tivity
-0.0
00-0
.000
-0.0
02-0
.001
-0.0
03(0
.003
)(0
.003
)(0
.003
)(0
.010
)(0
.002
)T
FP-0
.006
(0.0
04)
Low
-ski
lled
Labo
r0.
013*
*0.
021*
*0.
023*
*0.
047*
0.00
9(0
.005
)(0
.008
)(0
.010
)(0
.028
)(0
.008
)W
age
-0.0
03(0
.003
)M
inim
umW
age
0.00
40.
007
0.00
80.
027*
*-0
.001
(0.0
03)
(0.0
05)
(0.0
05)
(0.0
14)
(0.0
04)
Expo
rter
0.02
6***
0.03
0***
0.02
9***
0.03
0**
0.01
5***
(0.0
04)
(0.0
06)
(0.0
06)
(0.0
14)
(0.0
06)
Oth
erco
ntro
lsN
oN
oN
oN
oN
oN
oN
oN
oYe
sYe
sYe
sIn
dust
ryFE
Yes
Yes
Yes
Yes
Yes
Yes
Yes
Yes
Yes
Yes
Yes
Stat
eFE
Yes
Yes
Yes
Yes
Yes
Yes
Yes
Yes
Yes
Yes
Yes
N7,
629
4,26
93,
694
7.62
95,
628
7,41
46,
391
4,24
43,
747
1,17
82,
569
Adj
uste
dR
20.
042
0.03
80.
039
0.04
30.
041
0.04
20.
047
0.04
50.
050
0.06
60.
006
Not
es:
(1)
The
tabl
ere
port
sO
LSre
gres
sion
resu
lts
for
robo
tad
opti
on.
(2)
No
surv
eyw
eigh
tsar
eap
plie
d.(3
)T
hein
depe
nden
tva
riab
les,
Em
ploy
men
t,La
bor
Pro
duct
ivity
,TF
P,an
dW
age,
are
alli
nlo
gva
lues
.M
inim
umW
age
isa
dum
my
vari
able
whi
cheq
uals
one
ifth
epl
ant
rais
edw
ages
due
toth
em
inim
umw
age
regu
lati
onin
2015
.E
xpor
ter
isa
dum
my
vari
able
.Lo
w-s
kille
dLa
bor
isth
esh
are
oflo
w-s
kille
dla
bor
into
tal
empl
oym
ent.
(4)
Oth
erco
ntro
lsar
ea
set
ofdu
mm
yva
riab
les
for
up-t
o-da
tete
chno
logy
,la
bor
scar
city
,co
llect
ive
wag
eag
reem
ent,
proc
ess
impr
ovem
ent,
wor
ksco
unci
l,hi
ghco
mpe
titi
vepr
essu
re,a
ndfo
reig
now
ners
hip.
(5)
Bot
hin
dust
ry(4
3IA
Bag
greg
ated
NA
CE
2-di
git
indu
stri
es)
and
stat
efix
edeff
ects
are
incl
uded
.(6
)R
obus
tst
anda
rder
rors
are
repo
rted
inpa
rent
hese
s.(7
)**
*p<
0.01
,**
p<0.
05,*
p<0.
1.
21

Table 7: Correlates of Robot Adoption: Alternative Firm Size Control
(1) (2) (3) (4)
Sample Full Full Manuf. Non-Manuf.
Business Volume 0.009*** 0.009*** 0.024*** 0.003**(0.001) (0.002) (0.005) (0.002)
Labor Productivity -0.007** -0.008** -0.017 -0.005*(0.003) (0.004) (0.011) (0.003)
Low-skilled Labor 0.023*** 0.024** 0.051* 0.010(0.008) (0.010) (0.028) (0.008)
Minimum Wage 0.008* 0.008 0.029** -0.001(0.005) (0.005) (0.014) (0.004)
Exporter 0.028*** 0.027*** 0.028** 0.014**(0.006) (0.006) (0.014) (0.006)
Other controls No Yes Yes YesIndustry FE Yes Yes Yes YesState FE Yes Yes Yes YesN 4,244 3,747 1,178 2,569Adjusted R2 0.046 0.051 0.067 0.007
Notes: (1) The table reports OLS regression results for robot adoption. (2) No survey weights are applied. (3) The independentvariables, Business Volume and Labor Productivity, are all in log values. Minimum Wage is a dummy variable which equals oneif the plant raised wages due to the minimum wage regulation in 2015. Exporter is a dummy variable. Low-skilled Labor is theshare of low-skilled labor in total employment. (4) Other controls are a set of dummy variables for up-to-date technology, laborscarcity, collective wage agreement, process improvement, works council, high competitive pressure, and foreign ownership. (5)Both industry (43 IAB aggregated NACE 2-digit industries) and state fixed effects are included. (6) Robust standard errors arereported in parentheses. (7) *** p<0.01, ** p<0.05, * p<0.1.
22

Table 8: Correlates of Robot Adoption: The Panel Sample
(1) (2) (3) (4)
Sample Full Full Manuf. Non-Manuf.
Employment 0.005*** 0.004*** 0.012*** 0.001*(0.001) (0.001) (0.004) (0.001)
Labor Productivity 0.001 -0.000 0.002 -0.001(0.001) (0.002) (0.006) (0.001)
Low-skilled Labor 0.007 0.009* 0.032** -0.001(0.004) (0.005) (0.015) (0.004)
Minimum Wage 0.004 0.004 0.015* -0.001(0.003) (0.003) (0.008) (0.002)
Exporter 0.014*** 0.014*** 0.018*** 0.003(0.003) (0.003) (0.006) (0.003)
Other controls No Yes Yes YesIndustry-period FE Yes Yes Yes YesState-period FE Yes Yes Yes YesN 8,228 7,498 2,333 5,165Adjusted R2 0.273 0.279 0.308 0.193
Notes: (1) The table reports the regression results for robot adoption, repeated for 2 periods of robot adoption. Explanatoryvariables for the first period of adoption are from base year 2014, while for the second period of adoption the base year is 2016.(2) No survey weights are applied. (3) The independent variables, Employment and Labor Productivity, are all in log values.Minimum Wage is a dummy variable which equals one if the plant raised wages due to the minimum wage regulation in 2015.Exporter is a dummy variable. Low-skilled Labor is the share of low-skilled labor in total employment. (4) Other controls are aset of dummy variables for up-to-date technology, labor scarcity, collective wage agreement, process improvement, works council,high competitive pressure, and foreign ownership in the base year. (5) Standard errors clustered at the plant level are reportedin parentheses. (6) *** p<0.01, ** p<0.05, * p<0.1.
23
A Appendix
A.1 Survey Questions
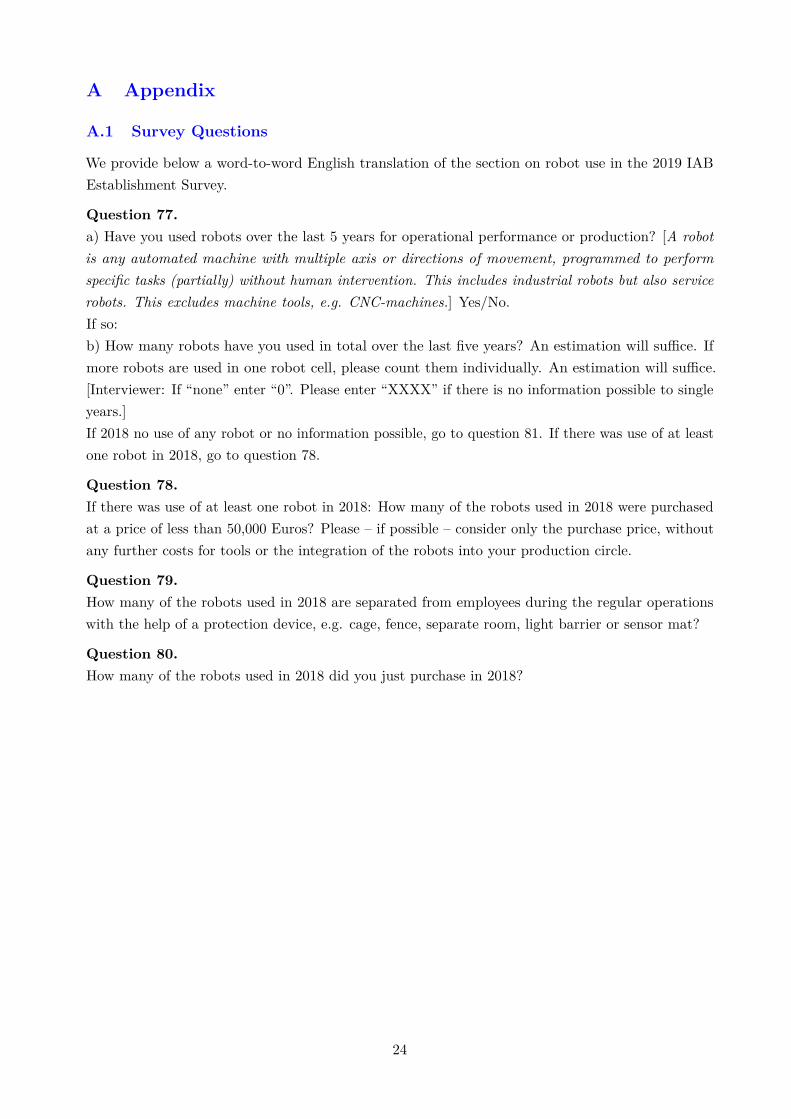
We provide below a word-to-word English translation of the section on robot use in the 2019 IABEstablishment Survey.
Question 77.a) Have you used robots over the last 5 years for operational performance or production? [A robotis any automated machine with multiple axis or directions of movement, programmed to performspecific tasks (partially) without human intervention. This includes industrial robots but also servicerobots. This excludes machine tools, e.g. CNC-machines.] Yes/No.If so:b) How many robots have you used in total over the last five years? An estimation will suffice. Ifmore robots are used in one robot cell, please count them individually. An estimation will suffice.[Interviewer: If “none” enter “0”. Please enter “XXXX” if there is no information possible to singleyears.]If 2018 no use of any robot or no information possible, go to question 81. If there was use of at leastone robot in 2018, go to question 78.
Question 78.If there was use of at least one robot in 2018: How many of the robots used in 2018 were purchasedat a price of less than 50,000 Euros? Please – if possible – consider only the purchase price, withoutany further costs for tools or the integration of the robots into your production circle.
Question 79.How many of the robots used in 2018 are separated from employees during the regular operationswith the help of a protection device, e.g. cage, fence, separate room, light barrier or sensor mat?
Question 80.How many of the robots used in 2018 did you just purchase in 2018?
24

A.2 Cross Validation and Stylized Facts: Additional Figures
Figure A1: Cross Validation with the IFR Data in 2018
Notes: (1) Robot density is defined as the number of robots per 1,000 employees. (2) Robot counts in 2018 are aggregatedat industry level and divided by the aggregate number of employees per industry to obtain IAB robot density. As the IABEstablishment Panel is representative on industry level, we use the same employment count to derive IFR robot density. (3) Thecorrelation coefficient of robot density across industries between the two datasets is 0.84. If only the manufacturing industriesare considered, the correlation coefficient is 0.96.
25
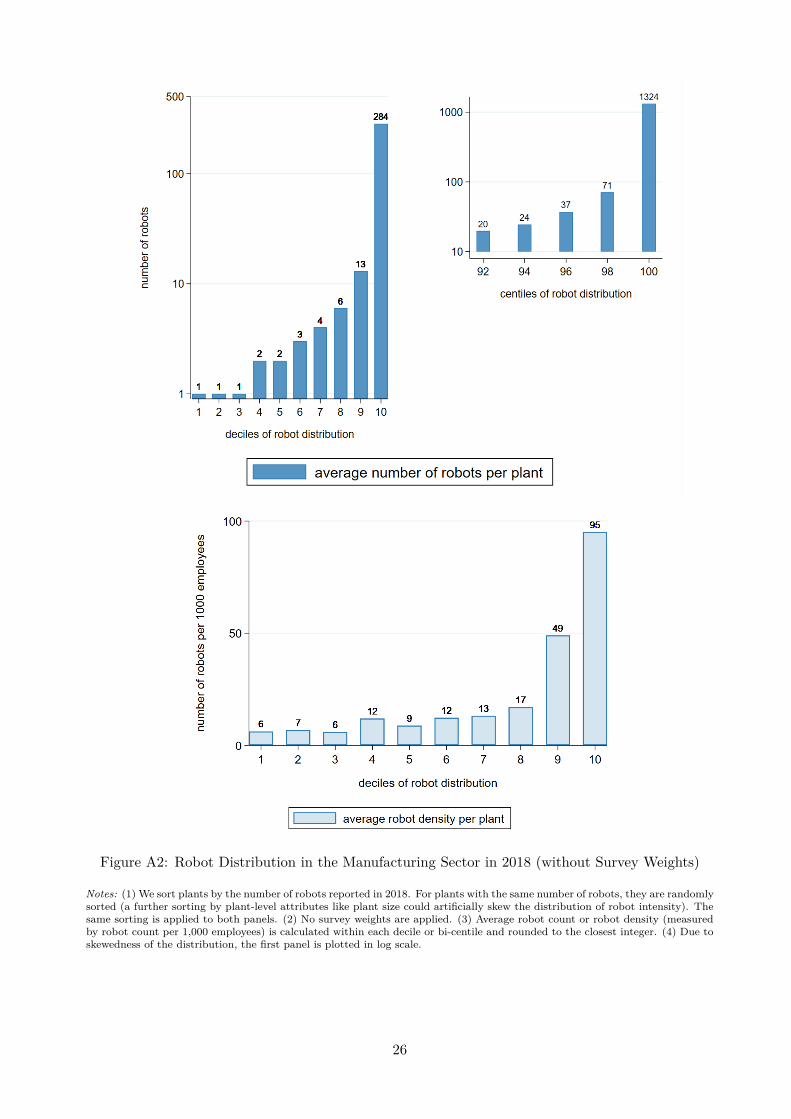
Figure A2: Robot Distribution in the Manufacturing Sector in 2018 (without Survey Weights)
Notes: (1) We sort plants by the number of robots reported in 2018. For plants with the same number of robots, they are randomlysorted (a further sorting by plant-level attributes like plant size could artificially skew the distribution of robot intensity). Thesame sorting is applied to both panels. (2) No survey weights are applied. (3) Average robot count or robot density (measuredby robot count per 1,000 employees) is calculated within each decile or bi-centile and rounded to the closest integer. (4) Due toskewedness of the distribution, the first panel is plotted in log scale.
26

Figure A3: Growth in the Extensive Margin from 2014 to 2018
Notes: (1) No survey weights are applied. (2) A plant is identified as a robot user in 2018 if it answered yes to the question ofwhether it used robots from 2014 to 2018 and its robot stock in 2018 was not zero. (3) The estimated share of robot users in2014 is the product of the share of robot users in 2018 and the share of plants reporting a positive robot stock in 2014 in therobot users in 2018 reporting a non-missing robot stock in 2014.
27

Figure A4: Growth in the Extensive Margin from 2014 to 2018: Lower and Upper Bounds
Notes: (1) Survey weights in 2018 are applied. (2) A plant is identified as a robot user in 2018 if it answered yes to the questionof whether it used robots from 2014 to 2018 and its robot stock in 2018 was not zero. (3) The lower bound for the share of robotusers in 2014 is based on the share of plants stating their robot stock being positive in 2014, assuming missing values to be zero.(4) The upper bound for the share of robot users in 2014 is based on the share of plants stating their robot stock being positivein 2014, assuming missing values to be positive, such that these plants with missing robot stock are counted as robot users in2014.
28

Figure A5: Decomposition of Growth of Robot Stock (without Survey Weights)
Notes: (1) Calculations are based on the surveyed plants that reported their robot use in each year from 2014 to 2018. (2)No survey weights are applied. (3) For each industry (sector), the contribution of the robot adopters to growth is defined asthe ratio of the total robot stock of robot adopters in 2018 to the robot stock aggregated over the existing users in 2014. Thecontribution of the robot users to growth is defined as the percentage change of the aggregate robot stock from 2014 to 2018 forthe plants that already used robots in 2014.
29


Halle Institute for Economic Research – Member of the Leibniz Association
Kleine Maerkerstrasse 8
D-06108 Halle (Saale), Germany
Postal Adress: P.O. Box 11 03 61
D-06017 Halle (Saale), Germany
Tel +49 345 7753 60
Fax +49 345 7753 820
www.iwh-halle.de
ISSN 2194-2188