discussion paper on proposed draft maximum levels … · 2500 ek the hague the netherlands e-mail:...
TRANSCRIPT

Agenda Item 7 CX/CF 13/7/7
February 2013
JOINT FAO/WHO FOOD STANDARDS PROGRAMME
CODEX COMMITTEE ON CONTAMINANTS IN FOODS
Seventh Session Moscow, Russian Federation, 8 – 12 April 2013
PROPOSED DRAFT MAXIMUM LEVELS FOR DEOXYNIVALENOL IN CEREALS AND CEREAL-BASED PRODUCTS AND ASSOCIATED SAMPLING PLANS
(AT STEP 3)
Codex Members and Observers wishing to submit comments at Step 3 on the proposed draft revision of the maximum levels for DON and corresponding sampling plans as presented in Appendix I, including possible implications for their economic interests, should do so in conformity with the Uniform Procedure for the Elaboration of Codex Standards and Related Texts (Codex Alimentarius Commission Procedural Manual) before 25 March 2013. Comments should be directed:
to:
Mrs Tanja Åkesson Codex Contact Point Ministry of Economic Affairs P.O. Box 20401 2500 EK The Hague The Netherlands E-mail: [email protected]
with a copy to:
Secretariat, Codex Alimentarius Commission, Joint FAO/WHO Food Standards Programme, Viale delle Terme di Caracalla, 00153 Rome, Italy E-mail: [email protected]
Note: Supporting information presented in Appendix II is not subject to comments but it is for information only.
BACKGROUND
1. At the 6th session of the Committee on Contaminants in Food (CCCF), the proposed maximum levels (ML) for deoxynivalenol (DON) were returned to Step 2/3 for further development. The Committee agreed to re-establish the electronic working group (e-WG), led by Canada and co-chaired by the European Union. The Committee requested that the e-WG consider MLs for individual semi-processed wheat, maize/corn and barley grain products, lower ML values for infant cereals than the one previously proposed, and the development of operational characteristic curves for the sampling plan (REP12/CF, paras. 66 – 78). A number of Codex members and observers expressed an interest in participating in this e-WG, namely representatives from Argentina, Austria, Belgium, Brazil, China, the Republic of Korea, Spain, Thailand, the United Kingdom, the United States, and Uruguay (See Appendix III, List of Participants).
INTRODUCTION
2. This document builds on the previously presented Proposed Draft Maximum Levels for Deoxynivalenol (DON) in Cereals and Cereal-Based Products and Associated Sampling Plans (CF/CX 12/6/9). Its objective is to further elaborate on the proposed draft MLs and sampling plan for DON in cereals and cereal-based foods.
3. The concept of developing different MLs for the various semi-processed wheat, maize or barley grain-based products rather than a single ML for all semi-processed products, is explored. The need for an ML for DON in cereal-based foods intended for infants and young children, as well as lower MLs for these commodities than the one previously proposed are also further considered. Operational characteristic curves are presented for the proposed sampling plan which is based on the existing European Union sampling plan for DON in cereals.
E

CX/CF 13/7/7 2
REQUEST FOR COMMENTS
4. Codex Members and Observers are kindly invited to send their comments on the proposed maximum levels for DON in cereal and cereal-based products and potential changes to the associated sampling plan as presented in Appendix I, for consideration by the 7th Session of the Committee on Contaminants in Foods.
5. While considering the proposed MLs and sampling plans, due consideration should be given to the conclusions and recommendations accompanying these proposals.
CX/CF 13/7/7 3
APPENDIX I
PROPOSED DRAFT MAXIMUM LEVELS FOR DEOXYNIVALENOL IN CEREALS AND CEREAL-BASED PRODUCTS AND ASSOCIATED SAMPLING PLAN
CONCLUSIONS AND RECOMMENDATIONS
1. Lack of global of consumption rates specifically for each semi-processed product prevented the determination of DON concentrations in individual products that would be considered safe for human health. Generally, the major portion of semi-processed grain product consumption is expected to come from flour and therefore separate MLs for different semi-processed products are not expected to significantly reduce DON exposure. Nonetheless, maintaining an ML for the specified semi-processed commodities, or for semi-processed commodities with exclusions for wheat starch, maize/corn starch and maize/corn grits, would ensure adequate protection of human health during periods of high DON prevalence. A harmonized ML for semi-processed commodities would also minimize confusion over the various terms used to describe grain products that are processed by different methods and which can result in various DON reductions. The Committee should continue to consider a single ML of 1 mg/kg for semi-processed foods derived from wheat, maize and/or barley (flour, semolina, meal, grits, flakes and starch) and also consider whether starch and grits should be excluded.
2. Bran products were initially excluded from the proposed ML for semi-processed products derived from wheat, maize/corn and barley. Limited occurrence data for DON in bran products (wheat and corn) suggest that DON levels in such products may be higher than in other semi-processed commodities, and higher than the ML of 1 mg/kg which is proposed for other semi-processed products. Based on consumption data for Canada and the United States only, an ML for bran products higher than the 1 mg/kg could be established while remaining protective of human health. However, global consumption patterns specifically for bran products are lacking and the available data on DON occurrence in bran remains insufficient to propose a separate ML for bran commodities. The Committee should continue to exclude bran from the category of semi-processed products derived from wheat, maize/corn and barley for which an ML of 1 mg/kg is proposed, and encourage members to collect and submit DON occurrence data for wheat and corn brans for possible future work. Complete datasets with individual sample results should be submitted rather than aggregate or summarized results.
3. Available data on DON occurrence in cereal-based infant foods suggest that an ML lower than the previously proposed value of 0.5 mg/kg is achievable. It was demonstrated that an ML as low as 0.2 mg/kg would result in a very low percentage of samples exceeding the ML. However, this may not represent the true global situation as most of the occurrence data available for these commodities were submitted by members from Europe where an ML of 0.2 mg/kg for DON in infant cereals has been in place for a number of years. At this time it is recommended that the Committee consider maintaining the proposed ML of 0.5 mg/kg for DON in cereal-based foods intended for infants and young children as this value remains protective of human health and is readily achievable. However, the Committee should also encourage members from countries where data is lacking to submit additional occurrence data for DON in such products if it wishes to consider an even lower ML in the future.
4 Operating characteristic curves are presented to demonstrate the performance of the DON sampling plan for raw wheat, raw barley and shelled maize, which was proposed in CX/CF 12/6/9. The Committee should consider these results in support of the proposed ML for DON in raw wheat, barley and maize, and in determining an appropriate sampling plan. As such, the Committee may consider the proposed sampling plan as presented in CX/CF 12/6/9 with the following amendment to the laboratory sample size – 1 kg for raw wheat and barley; 5 kg for raw maize. However, if the Committee decides to maintain a single sampling plan for all raw cereal grains, a sample size of 5 kg for raw wheat, raw barley, and shelled maize would appear to be sufficient for consideration (see Tables 1a and 1b in “Proposed Draft Sampling Plans for Deoxynivalenol in Cereals and Cereal-Based Products”)
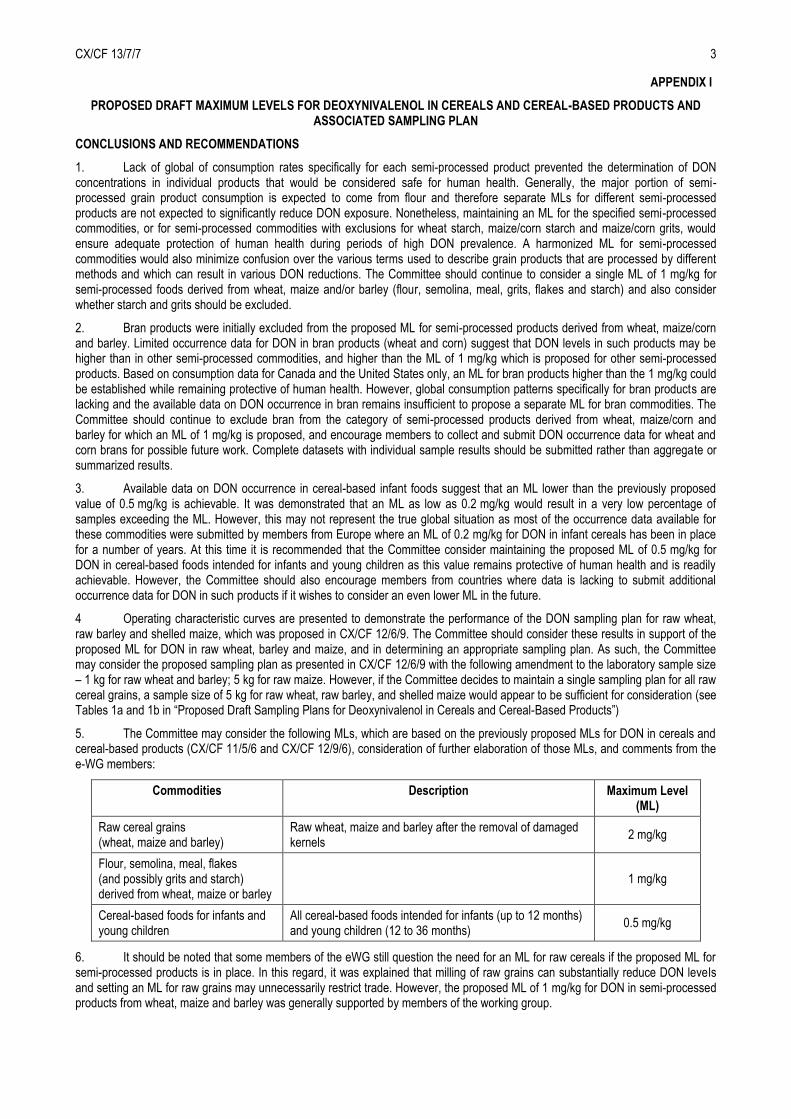
5. The Committee may consider the following MLs, which are based on the previously proposed MLs for DON in cereals and cereal-based products (CX/CF 11/5/6 and CX/CF 12/9/6), consideration of further elaboration of those MLs, and comments from the e-WG members:
Commodities Description Maximum Level (ML)
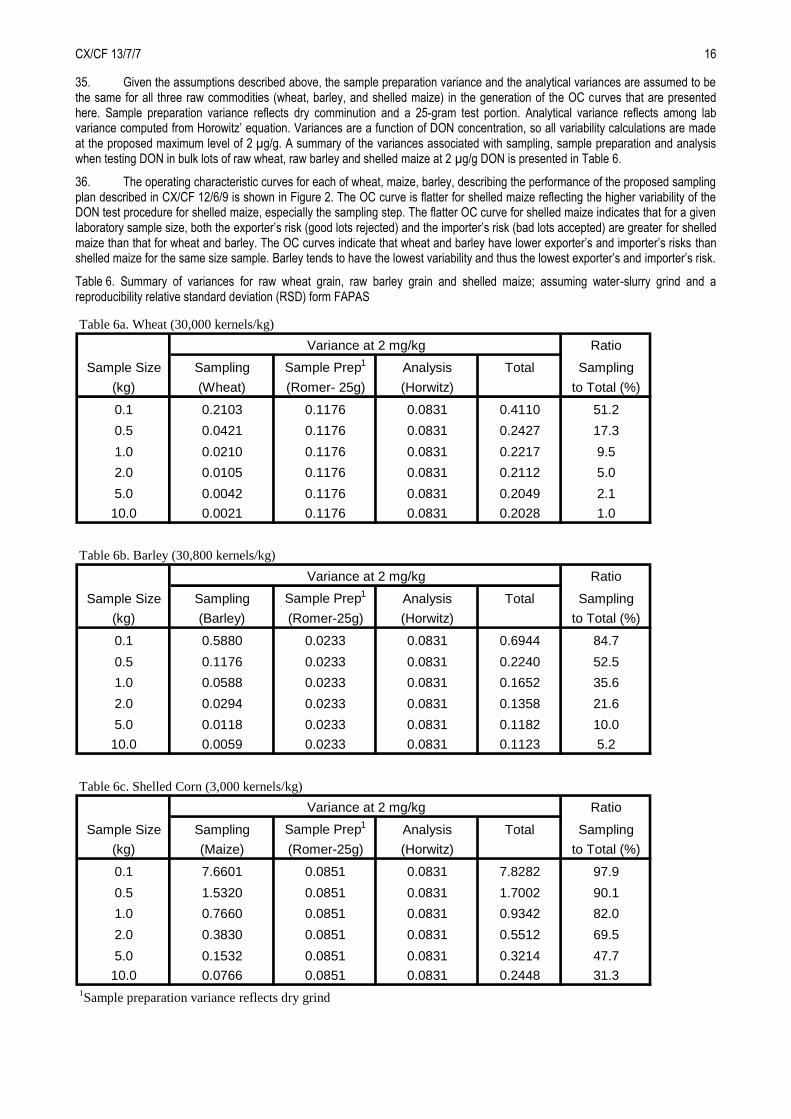
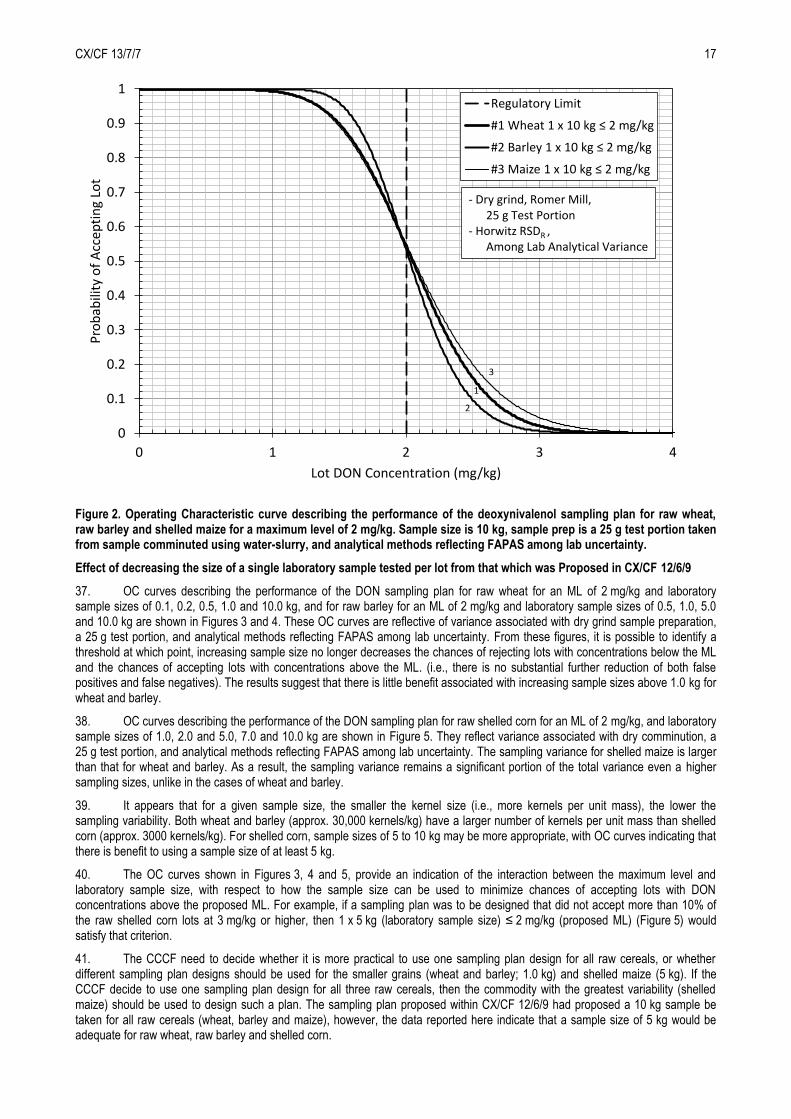
Raw cereal grains (wheat, maize and barley)
Raw wheat, maize and barley after the removal of damaged kernels
2 mg/kg
Flour, semolina, meal, flakes (and possibly grits and starch) derived from wheat, maize or barley
1 mg/kg
Cereal-based foods for infants and young children
All cereal-based foods intended for infants (up to 12 months) and young children (12 to 36 months)
0.5 mg/kg
6. It should be noted that some members of the eWG still question the need for an ML for raw cereals if the proposed ML for semi-processed products is in place. In this regard, it was explained that milling of raw grains can substantially reduce DON levels and setting an ML for raw grains may unnecessarily restrict trade. However, the proposed ML of 1 mg/kg for DON in semi-processed products from wheat, maize and barley was generally supported by members of the working group.
CX/CF 13/7/7 4
PROPOSED DRAFT SAMPLING PLANS FOR DEOXYNIVALENOL (DON) IN CEREALS AND CEREAL-BASED PRODUCTS
DEFINITIONS
Lot - an identifiable quantity of a food commodity delivered at one time and determined by the official to have common characteristics, such as origin, variety, type of packing, packer, consignor, or markings.
Sublot - designated part of a larger lot in order to apply the sampling method on that designated part. Each sublot must be physically separate and identifiable.
Sampling plan - is defined by a deoxynivalenol test procedure and an accept/reject level. A deoxynivalenol test procedure consists of three steps: sample selection, sample preparation and analysis or deoxynivalenol quantification. The accept/reject level is a tolerance usually equal to the Codex maximum level (ML).
Incremental sample - the quantity of material taken from a single random place in the lot or sublot.
Aggregate sample - the combined total of all the incremental samples that is taken from the lot or sublot. The aggregate sample has to be at least as large as the laboratory sample or samples combined.
Laboratory sample – the smallest quantity of cereal/cereal based product comminuted in a mill. The laboratory sample may be a portion of or the entire aggregate sample. If the aggregate sample is larger than the laboratory sample(s), the laboratory sample(s) should be removed in a random manner from the aggregate sample.
Test portion – a portion of the comminuted laboratory sample. The entire laboratory sample should be comminuted in a mill. A portion of the comminuted laboratory sample is randomly removed for the extraction of the deoxynivalenol for chemical analysis.
Operating Characteristic (OC) Curve – a plot of the probability of a accepting a lot versus lot concentration for a specific sampling plan design. The OC curve provides an estimate of the chances of rejecting a good lot (exporter’s risk) and the chances of accepting a bad lot accepted (importer’s risk) by a specific deoxynivalenol sampling plan design. A good lot is defined as having a deoxynivalenol concentration below the ML; a bad lot is defined as having a deoxynivalenol concentration above the ML.
SAMPLE SELECTION
Material to be sampled
A) Sampling procedure for cereals and cereal products for lots 50 tonnes
Each lot, which is to be examined for deoxynivalenol must be sampled separately. Lots larger than 50 tonnes should be subdivided into sublots to be sampled separately. If a lot is greater than 50 tonnes, the lot has to be subdivided into sublots following Table 1
Table 1a Subdivision of lots into sublots depending on product and lot weight
Commodity Lot weight (ton) Weight or number of sublots
No incremental samples
Aggregate sample Weight (kg)
Cereals and cereal products
1 500
> 300 and < 1 500
50 and 300
< 50
500 tonnes
3 sublots
100 tonnes
--
100
100
100
3-100*
5
5
5
1-5
OR
Table 1b Subdivision of lots into sublots depending on product and lot weight
Commodity Lot weight (ton) Weight or number of sublots
No incremental samples
Aggregate sample Weight (kg)
Raw wheat and barley
Raw maize
1 500
> 300 and < 1 500
50 and 300
< 50
1 500
> 300 and < 1 500
< 50
500 tonnes
3 sublots
100 tonnes
--
500 tonnes
3 sublots
100 tonnes
--
100
100
100
3-100*
100
100
100
3-100*
1
1
1
1
5
5
5
1-5
CX/CF 13/7/7 5
* Depending on the lot weight - see Table 2
Taking into account that the weight of the lot is not always an exact multiple of the weight of the sublots, the weight of the sublot may exceed the mentioned weight by a maximum of 20%.
- Each sublot must be sampled separately.
- Number of incremental samples: 100.
- If it is not possible to carry out the method of sampling set out in this point because of the commercial consequences resulting from damage to the lot such as packaging forms, means of transport, an alternative method of sampling may be applied provided that it is as representative as possible and is fully described and documented.
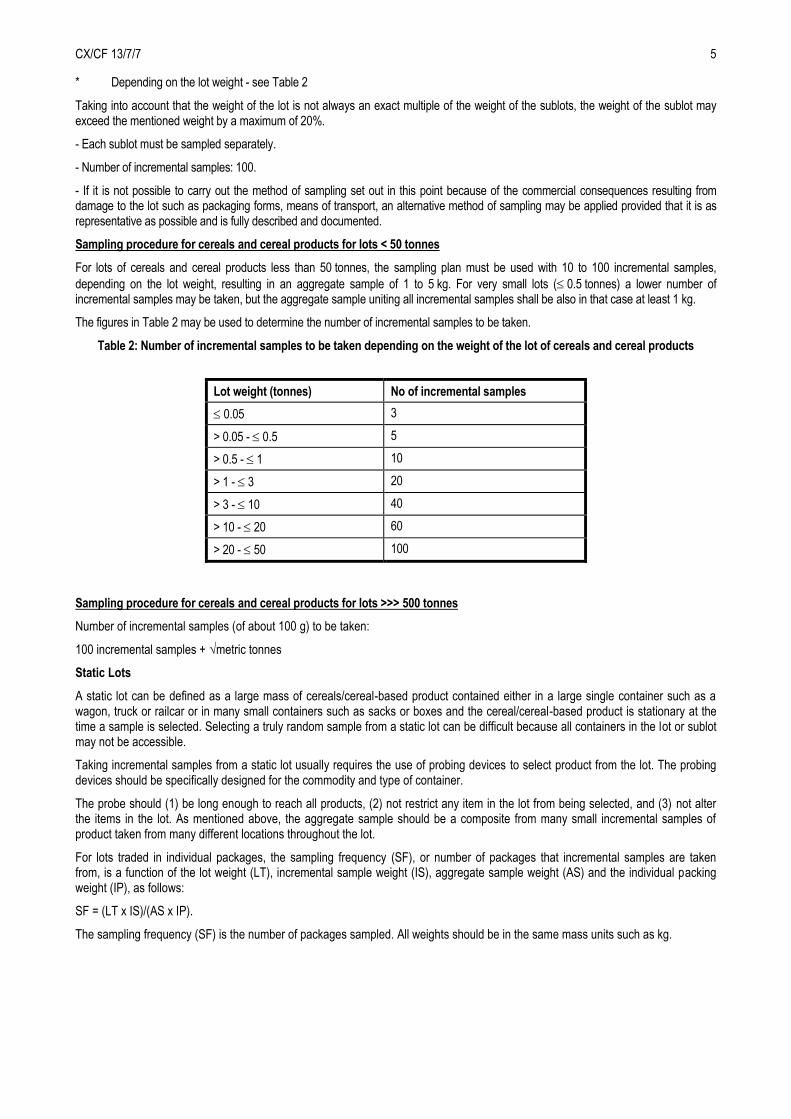
Sampling procedure for cereals and cereal products for lots < 50 tonnes
For lots of cereals and cereal products less than 50 tonnes, the sampling plan must be used with 10 to 100 incremental samples,
depending on the lot weight, resulting in an aggregate sample of 1 to 5 kg. For very small lots ( 0.5 tonnes) a lower number of incremental samples may be taken, but the aggregate sample uniting all incremental samples shall be also in that case at least 1 kg.
The figures in Table 2 may be used to determine the number of incremental samples to be taken.
Table 2: Number of incremental samples to be taken depending on the weight of the lot of cereals and cereal products
Sampling procedure for cereals and cereal products for lots >>> 500 tonnes
Number of incremental samples (of about 100 g) to be taken:
100 incremental samples + √metric tonnes
Static Lots
A static lot can be defined as a large mass of cereals/cereal-based product contained either in a large single container such as a wagon, truck or railcar or in many small containers such as sacks or boxes and the cereal/cereal-based product is stationary at the time a sample is selected. Selecting a truly random sample from a static lot can be difficult because all containers in the lot or sublot may not be accessible.
Taking incremental samples from a static lot usually requires the use of probing devices to select product from the lot. The probing devices should be specifically designed for the commodity and type of container.
The probe should (1) be long enough to reach all products, (2) not restrict any item in the lot from being selected, and (3) not alter the items in the lot. As mentioned above, the aggregate sample should be a composite from many small incremental samples of product taken from many different locations throughout the lot.
For lots traded in individual packages, the sampling frequency (SF), or number of packages that incremental samples are taken from, is a function of the lot weight (LT), incremental sample weight (IS), aggregate sample weight (AS) and the individual packing weight (IP), as follows:
SF = (LT x IS)/(AS x IP).
The sampling frequency (SF) is the number of packages sampled. All weights should be in the same mass units such as kg.
Lot weight (tonnes) No of incremental samples
0.05 3
> 0.05 - 0.5 5
> 0.5 - 1 10
> 1 - 3 20
> 3 - 10 40
> 10 - 20 60
> 20 - 50 100
CX/CF 13/7/7 6
Dynamic Lots
Representative aggregate samples can be more easily produced when selecting incremental samples from a moving stream of cereals/cereal-based product as the lot is transferred from one location to another. When sampling from a moving stream, take small incremental samples of product from the entire length of the moving stream; composite the incremental samples to obtain an aggregate sample; if the aggregate sample is larger than the required laboratory sample(s), then blend and subdivide the aggregate sample to obtain the desired size laboratory sample(s).
Automatic sampling equipment such as a cross-cut sampler is commercially available with timers that automatically pass a diverter cup through the moving stream at predetermined and uniform intervals. When automatic sampling equipment is not available, a person can be assigned to manually pass a cup through the stream at periodic intervals to collect incremental samples. Whether using automatic or manual methods, incremental samples should be collected and put together at frequent and uniform intervals throughout the entire time the flow past the sampling point.
Cross-cut samplers should be installed in the following manner: (1) the plane of the opening of the diverter cup should be perpendicular to the direction of the flow; (2) the diverter cup should pass through the entire cross sectional area of the stream; and (3) the opening of the diverter cup should be wide enough to accept all items of interest in the lot. As a general rule, the width of the diverter cup opening should be about two to three times the largest dimensions of items in the lot.
The size of the aggregate sample (S) in kg, taken from a lot by a cross cut sampler is:
S = (D x LT) / (T x V),
where D is the width of the diverter cup opening (cm), LT is the lot size (kg), T is interval or time between cup movement through the stream (seconds), and V is cup velocity (cm/sec).
If the mass flow rate of the moving stream, MR (kg/sec), is known, then the sampling frequency (SF), or number of cuts made by the automatic sampler cup can be computed as a function of S, V, D, and MR.
SF = (S x V) / (D x MR).
Packaging and Transportation of Samples
Each laboratory sample shall be placed in a clean, inert container offering adequate protection from contamination, sunlight, and against damage in transit. All necessary precautions shall be taken to avoid any change in composition of the laboratory sample, which might arise during transportation or storage. Samples should be stored in a cool dark place.
Sealing and Labelling of Samples
Each laboratory sample taken for official use shall be sealed at the place of sampling and identified. A record must be kept of each sampling, permitting each lot to be identified unambiguously and giving the date and place of sampling together with any additional information likely to be of assistance to the analyst.
SAMPLE PREPARATION
Precautions
Sunlight should be excluded as much as possible during sample preparation, since some mycotoxins may gradually break down under the influence of ultra-violet light. Also, environmental temperature and relative humidity should be controlled and not favour mould growth and deoxynivalenol formation.
Homogenization - Grinding
As the distribution of deoxynivalenol is non-homogeneous, laboratory samples should be completely homogenized by grinding the entire laboratory sample received by the laboratory. Homogenization is a procedure that reduces particle size and disperses the contaminated particles evenly throughout the comminuted laboratory sample.
The laboratory sample should be finely ground and mixed thoroughly using a process that approaches as complete homogenization as possible. Complete homogenization implies that particle size is extremely small and the variability associated with sample preparation approaches zero. After grinding, the grinder should be cleaned to prevent deoxynivalenol cross-contamination.
Test portion
The suggested weight of the test portion taken from the comminuted laboratory sample should be approximately 25 grams.
Procedures for selecting the 25 g test portion from the comminuted laboratory sample should be a random process. If mixing occurred during or after the comminution process, the 25 g test portion can be selected from any location throughout the comminuted laboratory sample. Otherwise, the 25 g test portion should be the accumulation of several small portions selected throughout the laboratory sample.
It is suggested that three test portions be selected from each comminuted laboratory sample. The three test portions will be used for enforcement, appeal, and confirmation if needed.
CX/CF 13/7/7 7
ANALYTICAL METHODS
Background
A criteria-based approach, whereby a set of performance criteria is established with which the analytical method used should comply, is appropriate. The criteria-based approach has the advantage that, by avoiding setting down specific details of the method used, developments in methodology can be exploited without having to reconsider or modify the specific method. The performance criteria established for methods should include all the parameters that need to be addressed by each laboratory such as the detection limit, repeatability coefficient of variation (within lab), reproducibility coefficient of variation (among lab), and the percent recovery necessary for various statutory limits. Analytical methods that are accepted by chemists internationally (such as AOAC) may be used. These methods are regularly monitored and improved depending upon technology.
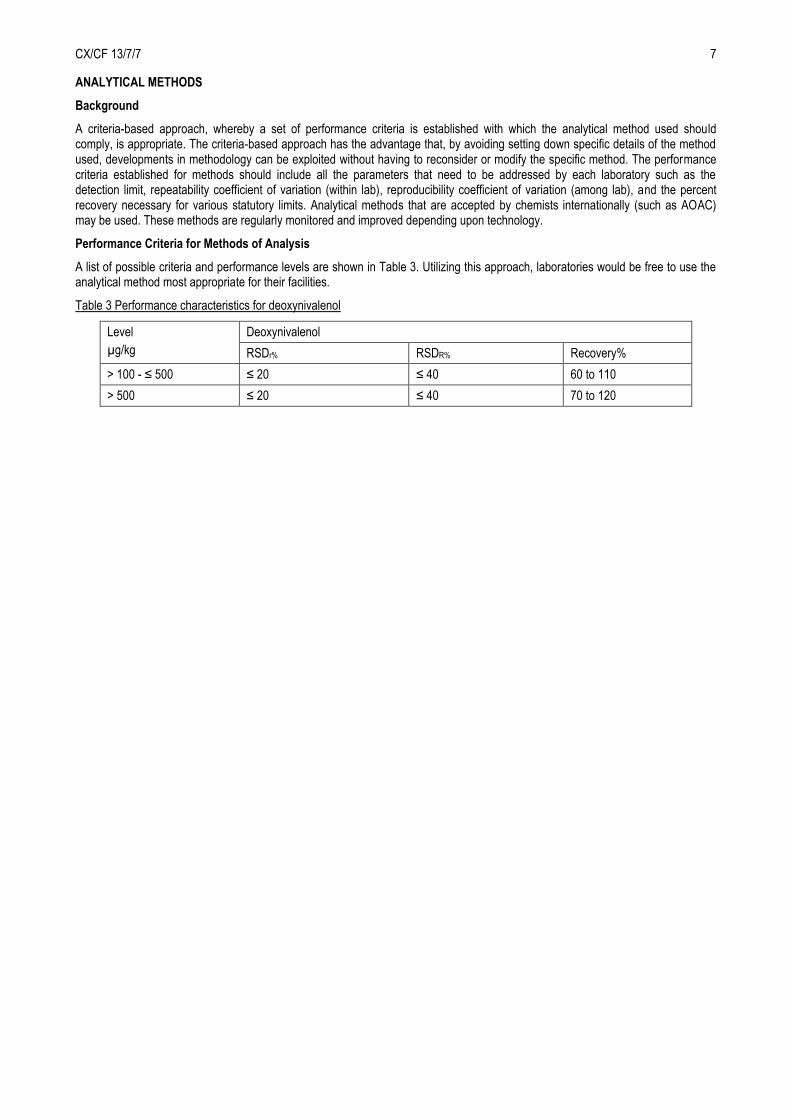
Performance Criteria for Methods of Analysis
A list of possible criteria and performance levels are shown in Table 3. Utilizing this approach, laboratories would be free to use the analytical method most appropriate for their facilities.
Table 3 Performance characteristics for deoxynivalenol
Level
µg/kg
Deoxynivalenol
RSDr% RSDR% Recovery%
> 100 - ≤ 500 ≤ 20 ≤ 40 60 to 110
> 500 ≤ 20 ≤ 40 70 to 120

CX/CF 13/7/7 8
APPENDIX II
SUPPORTIVE INFORMATION ON THE ELABORATION OF PROPOSED MAXIMUM LEVELS (MLs) AND THE DEVELOPMENT OF OPERATING CHARACTERISTIC CURVES IN SUPPORT OF THE ASSOCIATED SAMPLING PLANS PRESENTED IN CX/CF 12/6/9
ELABORATION OF PROPOSED MAXIMUM LEVELS
1. The following MLs were proposed for consideration at the 6th session of the CCCF (CX/CF 12/6/9):
a) raw wheat (common, spelt, and durum wheat), maize and barley: 2 mg/kg
b) semi-processed products derived from wheat, maize and/or barley (flour, semolina, meal, grits, flakes and starch): 1 mg/kg
c) cereal-based (derived from all grains) foods for infants (up to 12 months) and young children (12 to 23 months): 0.5 mg/kg
Consideration of the need for an ML for raw wheat, maize and barley
2. At the 6th session of the CCCF, the need for an ML for raw cereals was questioned based on the fact that milling can substantially reduce DON levels. Although milling can reduce DON levels, the impact of processing on the reduction of DON levels can vary. Raw cereal grains are an important commodity in international trade. This would tend to support the need for establishing an international ML for DON for raw grain commodities that have the largest impact on potential DON exposure.
3. The Code of Practice for the Prevention and Reduction of Mycotoxin Contamination in Cereals (CAC/RCP 51-2003) stipulates that freshly harvested cereals should be cleaned to remove damaged kernels and other foreign matter. It is therefore specified that the proposed ML for DON in raw cereals be applied to raw cereals after the removal of damaged kernels.
Consideration of separate MLs for semi-processed foods from wheat, maize or barley (flour, semolina, meal, grits, flakes, starch)
4. Currently, a single ML of 1 mg/kg is proposed for semi-processed foods (flour, semolina, meal, grits, flakes and starch) derived from wheat, maize and/or barley. At the 6th session of the CCCF, the Committee indicated that there are significant differences with respect to the levels of DON in the various semi-processed products. One general ML may be considered too strict (too low) for some commodities and too high for others.
5. DON occurrence data for raw grains, semi-processed products and finished foods that were submitted by, or made available from, various member countries (Austria, Brazil, Canada, China, Japan, South Africa, the United States, and the United Kingdom), were summarized and presented in CX/CF 12/6/9. A breakdown of DON levels in individual semi-processed foods derived from wheat, maize/corn and barley are summarized and presented in Table 1. DON levels are also presented for the scenario where a 1 mg/kg ML is applied for these commodities.
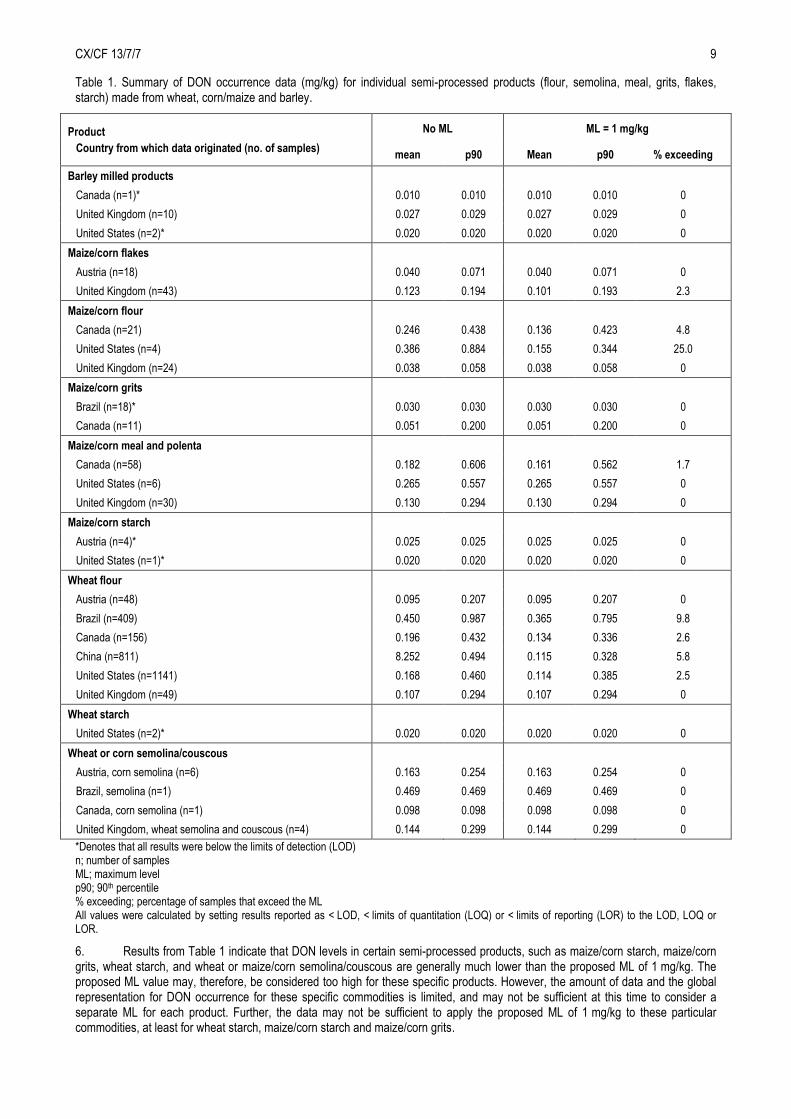
CX/CF 13/7/7 9
Table 1. Summary of DON occurrence data (mg/kg) for individual semi-processed products (flour, semolina, meal, grits, flakes, starch) made from wheat, corn/maize and barley.
Product
Country from which data originated (no. of samples)
No ML ML = 1 mg/kg
mean p90 Mean p90 % exceeding
Barley milled products
Canada (n=1)* 0.010 0.010 0.010 0.010 0
United Kingdom (n=10) 0.027 0.029 0.027 0.029 0
United States (n=2)* 0.020 0.020 0.020 0.020 0
Maize/corn flakes
Austria (n=18) 0.040 0.071 0.040 0.071 0
United Kingdom (n=43) 0.123 0.194 0.101 0.193 2.3
Maize/corn flour
Canada (n=21) 0.246 0.438 0.136 0.423 4.8
United States (n=4) 0.386 0.884 0.155 0.344 25.0
United Kingdom (n=24) 0.038 0.058 0.038 0.058 0
Maize/corn grits
Brazil (n=18)* 0.030 0.030 0.030 0.030 0
Canada (n=11) 0.051 0.200 0.051 0.200 0
Maize/corn meal and polenta
Canada (n=58) 0.182 0.606 0.161 0.562 1.7
United States (n=6) 0.265 0.557 0.265 0.557 0
United Kingdom (n=30) 0.130 0.294 0.130 0.294 0
Maize/corn starch
Austria (n=4)* 0.025 0.025 0.025 0.025 0
United States (n=1)* 0.020 0.020 0.020 0.020 0
Wheat flour
Austria (n=48) 0.095 0.207 0.095 0.207 0
Brazil (n=409) 0.450 0.987 0.365 0.795 9.8
Canada (n=156) 0.196 0.432 0.134 0.336 2.6
China (n=811) 8.252 0.494 0.115 0.328 5.8
United States (n=1141) 0.168 0.460 0.114 0.385 2.5
United Kingdom (n=49) 0.107 0.294 0.107 0.294 0
Wheat starch
United States (n=2)* 0.020 0.020 0.020 0.020 0
Wheat or corn semolina/couscous
Austria, corn semolina (n=6) 0.163 0.254 0.163 0.254 0
Brazil, semolina (n=1) 0.469 0.469 0.469 0.469 0
Canada, corn semolina (n=1) 0.098 0.098 0.098 0.098 0
United Kingdom, wheat semolina and couscous (n=4) 0.144 0.299 0.144 0.299 0
*Denotes that all results were below the limits of detection (LOD) n; number of samples ML; maximum level p90; 90th percentile % exceeding; percentage of samples that exceed the ML All values were calculated by setting results reported as < LOD, < limits of quantitation (LOQ) or < limits of reporting (LOR) to the LOD, LOQ or LOR.
6. Results from Table 1 indicate that DON levels in certain semi-processed products, such as maize/corn starch, maize/corn grits, wheat starch, and wheat or maize/corn semolina/couscous are generally much lower than the proposed ML of 1 mg/kg. The proposed ML value may, therefore, be considered too high for these specific products. However, the amount of data and the global representation for DON occurrence for these specific commodities is limited, and may not be sufficient at this time to consider a separate ML for each product. Further, the data may not be sufficient to apply the proposed ML of 1 mg/kg to these particular commodities, at least for wheat starch, maize/corn starch and maize/corn grits.

CX/CF 13/7/7 10
7. Global consumption rates for maize/corn starch, maize/corn grits, wheat starch, and wheat or maize/corn semolina/couscous were not available which did not allow for the determination of DON concentrations in each of these products that would result in reaching the provisional maximum tolerable daily intake (PMTDI) value of 1 µg/kg bw/day or the acute reference dose (ARfD) of 8 µg/kg bw/day derived by JECFA (FAO/WHO, 2011). Relative to flour, these commodities are not generally expected to represent a large proportion of the total consumption under the broader category defined as wheat or maize/corn processed products. As such, excluding some or all of these particular commodities from the proposed ML for semi-processed products or establishing lower MLs for these commodities is not expected to have a significant impact on reducing dietary exposure to DON.
8. If a single harmonized ML is maintained for semi-processed products, this would help to ensure the protection of human health during years of potentially high DON occurrence in grains (such as during years when climatic conditions favour the prevalence of DON). If those products that, based on currently available data are not likely significant contributors to dietary exposure, are excluded from the semi-processed products, Good Agricultural Practices (GAP) and Good Manufacturing Practices (GMP) described in the Code of Practice for the Prevention and Reduction of Mycotoxin Contamination in Cereals (CAC/RCP 51-2003) should continue to be used to maintain DON levels as low as reasonably achievable (ALARA).
9. The proposed ML of 1 mg/kg is not expected to result in trade barriers as the data, although limited, still indicate that an ML of 1 mg/kg is readily achievable for semi-processed products. A harmonized ML for these commodities, if possible, would be expected to contribute clear guidance and transparency for international trade. Certain terms used to describe processed grain products are not universal and the same term may actually represent products that were processed differently in different parts of the world. For example, in some countries, the term flour may be used more generally while others may actually describe the same product as meal or starch due to either different processing methods used or the fraction of the wholegrain that constitutes the main component of the products. It is recognized that different processing methods can lead to different DON levels in final products due to the variable concentrations of DON in the different component of the wholegrain. However, the terms used to describe certain products are not necessarily reflective of the method used to prepare them. While Codex has developed standards for some of these semi-processed products such as wheat flour and maize/corn meal, grits and couscous, standards are currently not available to clearly distinguish each term used to describe the semi-processed products for which the ML is proposed to apply. A single ML for all specified semi-processed commodities would minimize potential confusion from the different terminologies used to represent these products in different parts of the world.
Consideration of establishing an ML for bran from wheat or maize/corn
10. The proposed ML for DON in semi-processed products from wheat, maize/corn and barley has thus far excluded bran products due to their potential to appreciably exceed 1 mg/kg. Studies on the distribution of DON in the various wheat fractions have reported that DON concentrations are generally higher in the outer skin of the kernel and therefore higher in the bran portion (Young et al., 1984; Abbas et al.1985; Trigo-Stockli et al., 1996; Schollenberger et al., 2002; Gartner et al., 2008). Table 2 summarizes the data for DON in wheat and maize/corn bran that were submitted as full occurrence data sets from various eWG members. Results indicate that a high proportion of these samples contain DON levels that would exceed the proposed ML of 1 mg/kg.
Table 2. Summary of DON occurrence data (mg/kg) for wheat and maize/corn bran products submitted by various member countries.
Product
Country from which data originated (no. of samples)
No ML ML = 1 mg/kg
mean p90 mean p90 % exceeding
Maize/corn bran
Canada (n=2) 1.106 1.869 0.152 0.152 50.0
United Kingdom (n=8) 0.683 1.261 0.354 0.650 37.5
Wheat bran
Brazil (n=65) 1.574 3.050 0.550 0.948 50.8
Canada (n=46) 0.215 0.755 0.186 0.724 2.2
China (n=1) 0.010 0.010 0.010 0.010 0
United Kingdom (n=10) 0.268 0.496 0.268 0.496 0
United States (n=68) 0.519 1.016 0.226 0.764 10.3
n; number of samples ML; maximum level p90; 90th percentile % exceeding; percentage of samples that exceed the ML All values were calculated assuming concentrations less than the LOD, limits of quantitation (LOQ) or limits of reporting (LOR) were equal to the LOD, LOQ or LOR.
CX/CF 13/7/7 11
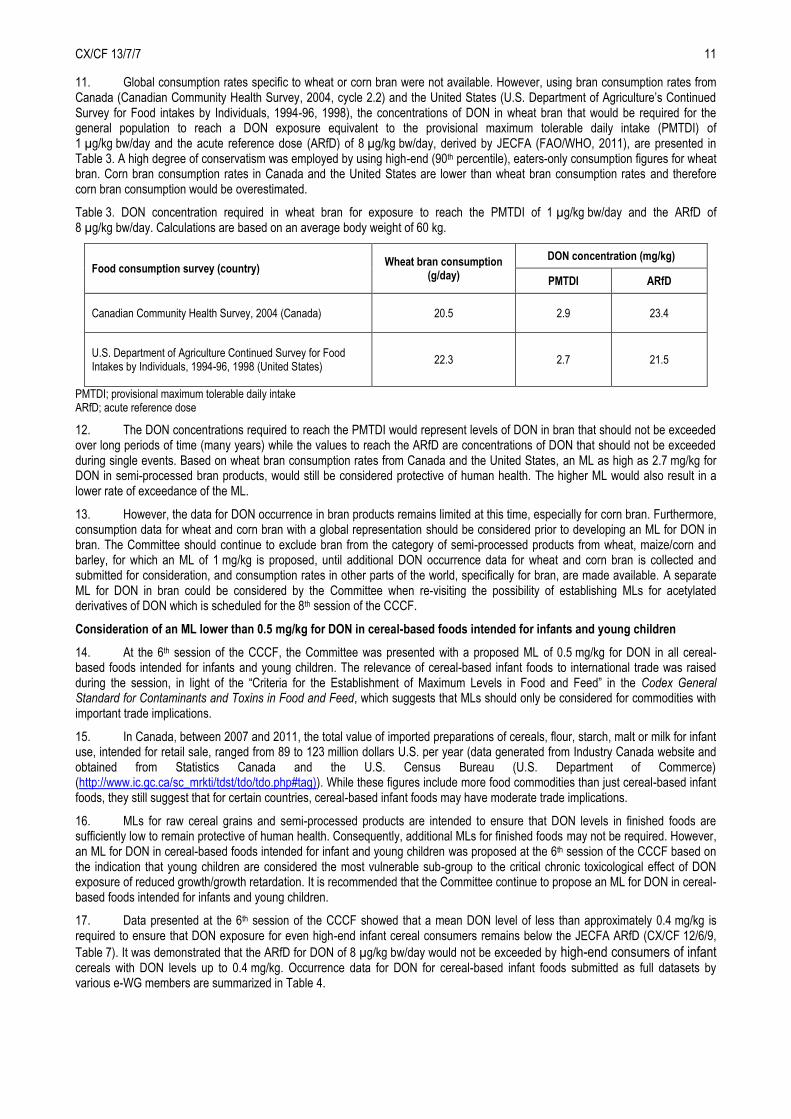
11. Global consumption rates specific to wheat or corn bran were not available. However, using bran consumption rates from Canada (Canadian Community Health Survey, 2004, cycle 2.2) and the United States (U.S. Department of Agriculture’s Continued Survey for Food intakes by Individuals, 1994-96, 1998), the concentrations of DON in wheat bran that would be required for the general population to reach a DON exposure equivalent to the provisional maximum tolerable daily intake (PMTDI) of 1 µg/kg bw/day and the acute reference dose (ARfD) of 8 µg/kg bw/day, derived by JECFA (FAO/WHO, 2011), are presented in Table 3. A high degree of conservatism was employed by using high-end (90th percentile), eaters-only consumption figures for wheat bran. Corn bran consumption rates in Canada and the United States are lower than wheat bran consumption rates and therefore corn bran consumption would be overestimated.
Table 3. DON concentration required in wheat bran for exposure to reach the PMTDI of 1 µg/kg bw/day and the ARfD of 8 µg/kg bw/day. Calculations are based on an average body weight of 60 kg.
Food consumption survey (country) Wheat bran consumption
(g/day)
DON concentration (mg/kg)
PMTDI ARfD
Canadian Community Health Survey, 2004 (Canada) 20.5 2.9 23.4
U.S. Department of Agriculture Continued Survey for Food Intakes by Individuals, 1994-96, 1998 (United States)
22.3 2.7 21.5
PMTDI; provisional maximum tolerable daily intake ARfD; acute reference dose
12. The DON concentrations required to reach the PMTDI would represent levels of DON in bran that should not be exceeded over long periods of time (many years) while the values to reach the ARfD are concentrations of DON that should not be exceeded during single events. Based on wheat bran consumption rates from Canada and the United States, an ML as high as 2.7 mg/kg for DON in semi-processed bran products, would still be considered protective of human health. The higher ML would also result in a lower rate of exceedance of the ML.
13. However, the data for DON occurrence in bran products remains limited at this time, especially for corn bran. Furthermore, consumption data for wheat and corn bran with a global representation should be considered prior to developing an ML for DON in bran. The Committee should continue to exclude bran from the category of semi-processed products from wheat, maize/corn and barley, for which an ML of 1 mg/kg is proposed, until additional DON occurrence data for wheat and corn bran is collected and submitted for consideration, and consumption rates in other parts of the world, specifically for bran, are made available. A separate ML for DON in bran could be considered by the Committee when re-visiting the possibility of establishing MLs for acetylated derivatives of DON which is scheduled for the 8th session of the CCCF.
Consideration of an ML lower than 0.5 mg/kg for DON in cereal-based foods intended for infants and young children
14. At the 6th session of the CCCF, the Committee was presented with a proposed ML of 0.5 mg/kg for DON in all cereal-based foods intended for infants and young children. The relevance of cereal-based infant foods to international trade was raised during the session, in light of the “Criteria for the Establishment of Maximum Levels in Food and Feed” in the Codex General Standard for Contaminants and Toxins in Food and Feed, which suggests that MLs should only be considered for commodities with important trade implications.
15. In Canada, between 2007 and 2011, the total value of imported preparations of cereals, flour, starch, malt or milk for infant use, intended for retail sale, ranged from 89 to 123 million dollars U.S. per year (data generated from Industry Canada website and obtained from Statistics Canada and the U.S. Census Bureau (U.S. Department of Commerce) (http://www.ic.gc.ca/sc_mrkti/tdst/tdo/tdo.php#tag)). While these figures include more food commodities than just cereal-based infant foods, they still suggest that for certain countries, cereal-based infant foods may have moderate trade implications.
16. MLs for raw cereal grains and semi-processed products are intended to ensure that DON levels in finished foods are sufficiently low to remain protective of human health. Consequently, additional MLs for finished foods may not be required. However, an ML for DON in cereal-based foods intended for infant and young children was proposed at the 6th session of the CCCF based on the indication that young children are considered the most vulnerable sub-group to the critical chronic toxicological effect of DON exposure of reduced growth/growth retardation. It is recommended that the Committee continue to propose an ML for DON in cereal-based foods intended for infants and young children.
17. Data presented at the 6th session of the CCCF showed that a mean DON level of less than approximately 0.4 mg/kg is required to ensure that DON exposure for even high-end infant cereal consumers remains below the JECFA ARfD (CX/CF 12/6/9,
Table 7). It was demonstrated that the ARfD for DON of 8 µg/kg bw/day would not be exceeded by high-end consumers of infant cereals with DON levels up to 0.4 mg/kg. Occurrence data for DON for cereal-based infant foods submitted as full datasets by various e-WG members are summarized in Table 4.
CX/CF 13/7/7 12
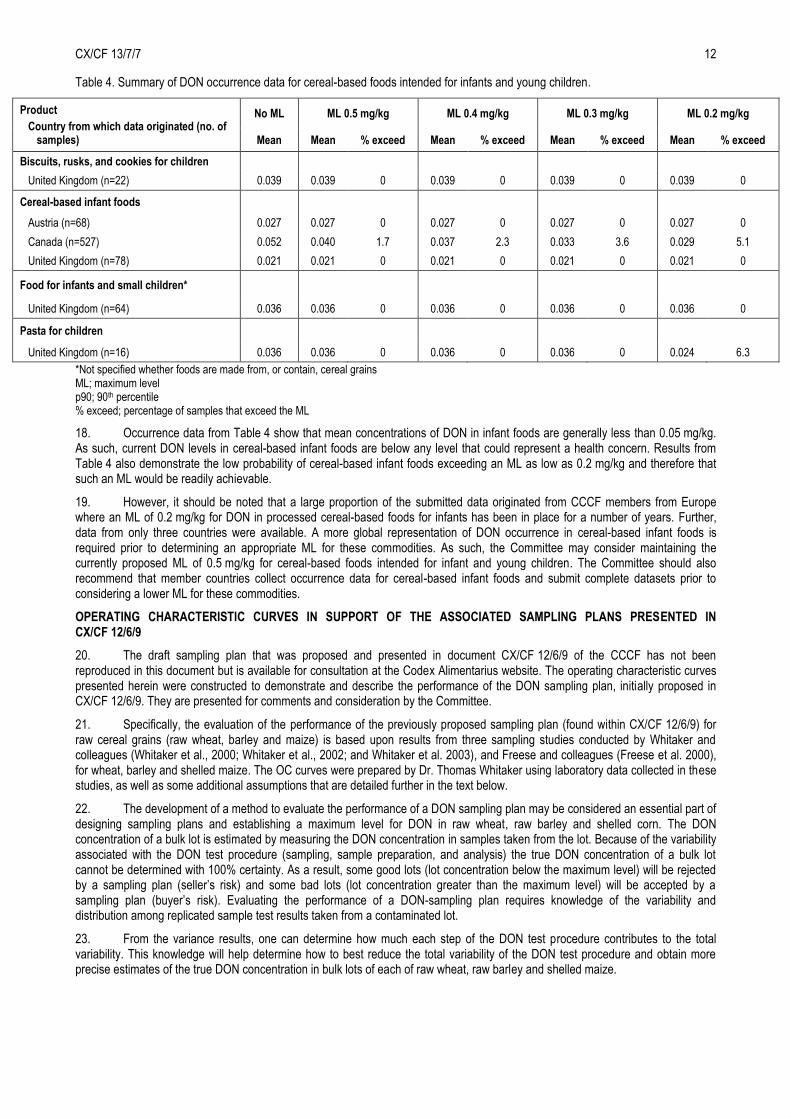
Table 4. Summary of DON occurrence data for cereal-based foods intended for infants and young children.
Product
Country from which data originated (no. of samples)
No ML ML 0.5 mg/kg ML 0.4 mg/kg ML 0.3 mg/kg ML 0.2 mg/kg
Mean Mean % exceed Mean % exceed Mean % exceed Mean % exceed
Biscuits, rusks, and cookies for children
United Kingdom (n=22) 0.039 0.039 0 0.039 0 0.039 0 0.039 0
Cereal-based infant foods
Austria (n=68) 0.027 0.027 0 0.027 0 0.027 0 0.027 0
Canada (n=527) 0.052 0.040 1.7 0.037 2.3 0.033 3.6 0.029 5.1
United Kingdom (n=78) 0.021 0.021 0 0.021 0 0.021 0 0.021 0
Food for infants and small children*
United Kingdom (n=64) 0.036 0.036 0 0.036 0 0.036 0 0.036 0
Pasta for children
United Kingdom (n=16) 0.036 0.036 0 0.036 0 0.036 0 0.024 6.3
*Not specified whether foods are made from, or contain, cereal grains ML; maximum level p90; 90th percentile % exceed; percentage of samples that exceed the ML
18. Occurrence data from Table 4 show that mean concentrations of DON in infant foods are generally less than 0.05 mg/kg. As such, current DON levels in cereal-based infant foods are below any level that could represent a health concern. Results from Table 4 also demonstrate the low probability of cereal-based infant foods exceeding an ML as low as 0.2 mg/kg and therefore that such an ML would be readily achievable.
19. However, it should be noted that a large proportion of the submitted data originated from CCCF members from Europe where an ML of 0.2 mg/kg for DON in processed cereal-based foods for infants has been in place for a number of years. Further, data from only three countries were available. A more global representation of DON occurrence in cereal-based infant foods is required prior to determining an appropriate ML for these commodities. As such, the Committee may consider maintaining the currently proposed ML of 0.5 mg/kg for cereal-based foods intended for infant and young children. The Committee should also recommend that member countries collect occurrence data for cereal-based infant foods and submit complete datasets prior to considering a lower ML for these commodities.
OPERATING CHARACTERISTIC CURVES IN SUPPORT OF THE ASSOCIATED SAMPLING PLANS PRESENTED IN CX/CF 12/6/9
20. The draft sampling plan that was proposed and presented in document CX/CF 12/6/9 of the CCCF has not been reproduced in this document but is available for consultation at the Codex Alimentarius website. The operating characteristic curves presented herein were constructed to demonstrate and describe the performance of the DON sampling plan, initially proposed in CX/CF 12/6/9. They are presented for comments and consideration by the Committee.
21. Specifically, the evaluation of the performance of the previously proposed sampling plan (found within CX/CF 12/6/9) for raw cereal grains (raw wheat, barley and maize) is based upon results from three sampling studies conducted by Whitaker and colleagues (Whitaker et al., 2000; Whitaker et al., 2002; and Whitaker et al. 2003), and Freese and colleagues (Freese et al. 2000), for wheat, barley and shelled maize. The OC curves were prepared by Dr. Thomas Whitaker using laboratory data collected in these studies, as well as some additional assumptions that are detailed further in the text below.
22. The development of a method to evaluate the performance of a DON sampling plan may be considered an essential part of designing sampling plans and establishing a maximum level for DON in raw wheat, raw barley and shelled corn. The DON concentration of a bulk lot is estimated by measuring the DON concentration in samples taken from the lot. Because of the variability associated with the DON test procedure (sampling, sample preparation, and analysis) the true DON concentration of a bulk lot cannot be determined with 100% certainty. As a result, some good lots (lot concentration below the maximum level) will be rejected by a sampling plan (seller’s risk) and some bad lots (lot concentration greater than the maximum level) will be accepted by a sampling plan (buyer’s risk). Evaluating the performance of a DON-sampling plan requires knowledge of the variability and distribution among replicated sample test results taken from a contaminated lot.
23. From the variance results, one can determine how much each step of the DON test procedure contributes to the total variability. This knowledge will help determine how to best reduce the total variability of the DON test procedure and obtain more precise estimates of the true DON concentration in bulk lots of each of raw wheat, raw barley and shelled maize.
CX/CF 13/7/7 13
24. A sampling plan is defined by an accept/reject level (may or may not be the maximum limit) and a DON test procedure. The DON test procedure is defined by the number and size of samples, the sample preparation method (type mill, i.e., degree of sample grind or comminution) and test portion size (i.e., subsample size), the analytical procedure/method, and the number of aliquots quantified. Methods of selecting the samples should also be a consideration, and should be a random, unbiased and representative process. The accept probabilities are used to compute an operating characteristic (OC) curve specific to a sampling plan design. The OC curve is used to predict the good lots rejected (seller’s or exporter’s risk) and the bad lots accepted (buyer’s or importer’s risk).
25. Because of uncertainty associated with the DON test procedure, two types of mistakes can be made when using a DON sampling plan to classify lots as good (lot concentration below a maximum level) or bad (lot concentration above a maximum level). Sometimes good lots will test “bad” by the sampling plan and be rejected. Good lots that are rejected are often called false positives or seller’s risk. Sometimes bad lots will test “good” by the sampling plan and be accepted. Bad lots that are accepted are often called false negatives or buyer’s risk. The definition of seller and buyer depends where in the market system the lot is being tested. If lots are tested in the export market, the buyer and seller are importers and exporters, respectively. The buyer’s and seller’s risks associated with a DON-sampling plan can be predicted with the help of an operating characteristic (OC) curve.
26. A generalized OC curve is shown in Figure 1. An OC curve indicates the chances of accepting a lot at a given concentration by a specific sampling plan design. The chances of rejecting lots can also be determined by subtracting the percent lots accepted from 100%. Lots with DON levels below the maximum level that are rejected by a sampling plan represent the seller’s risk of a good lot rejected by a sampling plan design. Lots with DON levels above the maximum level that are accepted by a sampling plan represent the buyer’s risk of bad lots accepted by a sampling plan design. The seller’s risk (good lots rejected) is represented by the area above the OC curve and below the maximum limit. The buyer’s risk (bad lots accepted) is represented by the area below the OC curve and to the left of the maximum level. A good sampling plan should try to minimize the buyer’s and seller’s risks for available resources.
27. Reducing the variability associated with the mycotoxin test procedure will reduce both the buyer’s and seller’s risk associated with a sampling plan design. Typically, the variability of a mycotoxin test procedure can be reduced by increasing sample size (or number of samples of a given size), grinding the sample into smaller particles, increasing test portion size, increasing the number of aliquots quantified, and/or using a more precise analytical method. The choice to reduce variability is often a compromise between minimizing risks (false positives and false negatives) and costs related to sampling and analysis, and/or restricting trade. For example, by increasing the number or size of the laboratory sample, variability may be reduced but costs may increase as a result of obtaining a larger sample.

CX/CF 13/7/7 14
Figure 1. Typical shape of an operating characteristic curve used to evaluate the buyer’s risk (false negative or bad lots accepted) and seller’s risk (false positive or good lots rejected) associated with a sampling plan. The area under the OC curve for lot concentrations greater than the regulatory limit (C > CML) represents the buyer’s risk while the area above the OC curve for a lot concentrations less or equal to the regulatory limit (C ≤ CML) represents the sellers’ risk for a particular sampling plan.
Original studies conducted by Whitaker and colleagues, and Freese and colleagues for raw wheat, barley and shelled maize
28. From the sampling studies by Whitaker and colleagues (Whitaker et al., 2000; Whitaker et al., 2002; and Whitaker et al. 2003) and Freese and colleagues (Freese et al. 2000) described above, the sampling, sample preparation, and analytical variance, as well as the original DON test procedure for wheat, barley and maize are shown in Table 5. The sample preparation variance from the three sampling studies reflected a dry grind with a Romer mill and either a 25 or 50 g test portion for the DON extraction in the sample preparation step.
29. Presented in Table 5 are also the equations describing the sampling variance (S2s) for any sample size ns in number of kernels; the sample preparation variance (S2sp) for the Romer mill and any size test portion nss in grams; and the analytical variance (S2a) for either Romer FluoroQuant or HPLC using any number of aliquots na, as a function of DON concentration C in µg/g for each of wheat, barley and maize. In the original experiments, all samples were ground with a Romer mill.
(Buyer’s risk)
(Seller’s risk)
Max
imu
m L
evel
CM
L
C > CM L (bad
lots)
C ≤ CM L (good
lots)
1
0.3
0.1
0
0.2
0.4
0.5
0.6
0.7
0.8
0.9
Lot DON Concentration – C
(µg/g)
Acc
epta
nce
Pro
bab
ilit
y –
P(A
)
0

CX/CF 13/7/7 15
Table 5. Variances associated with the DON test procedure from studies conducted by Whitaker and colleagues (Whitaker et al., 2000; Whitaker et al., 2002; and Whitaker et al. 2003) and Freese and colleagues (Freese et al. 2000), for each raw cereal of interest (wheat, shelled maize and barley).
Variance and Test Procedure for raw Wheat for raw Barley for raw Maize
Variance
Sampling (S2s) = (13,620/ns)0.026C0.833 = (77,000/ns)0.0122C0.947 = (3,000/ns)0.202C1.923
Sample Preparation (S2sp) = (25/nss)0.066C0.833 = (50/nss)0.003C1.956 = (50/nss)0.0193C1.140
Analytical (S2a)† = (1/na)0.026C0.833 = (1/na)0.0108C1.055 = (1/na)0.0036C1.507
Total S2t = S2
s + S2sp + S2
a S2t = S2
s + S2sp + S2
a S2t = S2
s + S2sp + S2
a
Test procedure
Lab sample size (ns; no. of kernels) 30,800 kernels/Kg 30,000 kernels/Kg 3,000 kernels/Kg
Comminuted Test Portion Size (nss) mass (g)dry communition Romer – 25 g
mass (g)dry communition Romer – 50 g
mass (g)dry communition Romer – 25 g
Number of Aliquots (na) quantified by Romer FluoroQuant
quantified by Romer FluoroQuant
quantified by Romer Malone HPLC
†The analytical variance reflects the analytical variability within a single laboratory, which is lower than the analytical variability among laboratories.
Performance of deoxynivalenol sampling plans for raw wheat, raw barley, and raw shelled maize
Deoxynivalenol test procedure and maximum levels from draft sampling plan presented in CX/CF 12/6/9
30. The draft sampling plan has been previously presented (within CX/CF 12/6/9) for the purposes of enforcement and control concerning DON in bulk consignments (lots) of raw wheat, raw maize, and raw barley traded in the export market. The DON test procedure in support of the proposed sampling plan is as follows (summary):
Accept / reject limit (equal to Proposed ML) – 2 mg/kg raw cereals (wheat, shelled maize and barley)
Number of laboratory samples – 1
Laboratory sample size – 10 kg
Sample preparation – dry grind with a mill similar to Romer mill and a test portion that represents 25 g
Analytical method – Horowitz estimate of among lab variance as recommended by FAPAS
Decision rule – if the DON test result is less than or equal to 2 mg/kg DON for the 10 kg laboratory sample, then accept the lot. Otherwise reject the lot.
Performance of DON sampling plans for raw wheat, barley and shelled corn, as proposed in CX/CF 12/6/9
31. Sampling variance assumes that the laboratory samples are representative of the lot. It is assumed that sample selection methods described in the document CX/CF 12/6/9 overcome any lack of spatial homogeneity of contaminated kernels in the bulk lot, and that the samples are representative of the lot. It is assumed that the lot concentration is the same as the sample concentration and decisions about the bulk lot are made based on the sample value.
32. The lognormal distribution provided an acceptable fit to the observed DON distribution among sample test results for raw wheat kernels from the Whitaker and colleagues study (Whitaker et al., 2000; Whitaker et al., 2002). The lognormal distribution was then used to predict the distribution among DON test results for test procedures other than those used in the experimental design of the original study, for each of the raw cereals (wheat, maize, and barley).
33. Variances associated with sampling, sample preparation, and analysis for each of the raw cereals (wheat, shelled maize, and barley) (Table 6) and their associated DON distributions are used to calculate operating characteristic curves that describe the performance of the proposed DON sampling plan for each raw cereal grain. Using the variance and distribution information from the previous studies (Tables 5), as well as the modifications detailed below, a computer model was developed to predict the probability of accepting or rejecting raw wheat, raw barley and shelled maize lots using specific sampling plan designs.
34. The analytical variance measured in each of the sampling studies for raw wheat, raw barley and shelled maize (Tables 5) reflects the within laboratory variance for each cereal. However, for all three raw cereals, the within laboratory variance was replaced with an estimate of analytical methods reflecting Horowitz among laboratory uncertainty, which is based upon Food Analysis Performance Assessment Scheme (FAPAS) data (Thompson, 2000). The converted analytical variance reflecting Horowitz among laboratory precision was s2=(1/na)0.0256C1.699 where s2 is the among laboratory analytical variance and na is the number of aliquots quantified by the analytical method.
CX/CF 13/7/7 16
35. Given the assumptions described above, the sample preparation variance and the analytical variances are assumed to be the same for all three raw commodities (wheat, barley, and shelled maize) in the generation of the OC curves that are presented here. Sample preparation variance reflects dry comminution and a 25-gram test portion. Analytical variance reflects among lab variance computed from Horowitz’ equation. Variances are a function of DON concentration, so all variability calculations are made at the proposed maximum level of 2 µg/g. A summary of the variances associated with sampling, sample preparation and analysis when testing DON in bulk lots of raw wheat, raw barley and shelled maize at 2 µg/g DON is presented in Table 6.
36. The operating characteristic curves for each of wheat, maize, barley, describing the performance of the proposed sampling plan described in CX/CF 12/6/9 is shown in Figure 2. The OC curve is flatter for shelled maize reflecting the higher variability of the DON test procedure for shelled maize, especially the sampling step. The flatter OC curve for shelled maize indicates that for a given laboratory sample size, both the exporter’s risk (good lots rejected) and the importer’s risk (bad lots accepted) are greater for shelled maize than that for wheat and barley. The OC curves indicate that wheat and barley have lower exporter’s and importer’s risks than shelled maize for the same size sample. Barley tends to have the lowest variability and thus the lowest exporter’s and importer’s risk.
Table 6. Summary of variances for raw wheat grain, raw barley grain and shelled maize; assuming water-slurry grind and a reproducibility relative standard deviation (RSD) form FAPAS
Table 6a. Wheat (30,000 kernels/kg)
Ratio
Sample Size Sampling Sample Prep 1 Analysis Total Sampling
(kg) (Wheat) (Romer- 25g) (Horwitz) to Total (%)
0.1 0.2103 0.1176 0.0831 0.4110 51.2
0.5 0.0421 0.1176 0.0831 0.2427 17.3
1.0 0.0210 0.1176 0.0831 0.2217 9.5
2.0 0.0105 0.1176 0.0831 0.2112 5.0
5.0 0.0042 0.1176 0.0831 0.2049 2.1
10.0 0.0021 0.1176 0.0831 0.2028 1.0
Table 6b. Barley (30,800 kernels/kg)
Ratio
Sample Size Sampling Sample Prep 1 Analysis Total Sampling
(kg) (Barley) (Romer-25g) (Horwitz) to Total (%)
0.1 0.5880 0.0233 0.0831 0.6944 84.7
0.5 0.1176 0.0233 0.0831 0.2240 52.5
1.0 0.0588 0.0233 0.0831 0.1652 35.6
2.0 0.0294 0.0233 0.0831 0.1358 21.6
5.0 0.0118 0.0233 0.0831 0.1182 10.0
10.0 0.0059 0.0233 0.0831 0.1123 5.2
Table 6c. Shelled Corn (3,000 kernels/kg)
Ratio
Sample Size Sampling Sample Prep 1 Analysis Total Sampling
(kg) (Maize) (Romer-25g) (Horwitz) to Total (%)
0.1 7.6601 0.0851 0.0831 7.8282 97.9
0.5 1.5320 0.0851 0.0831 1.7002 90.1
1.0 0.7660 0.0851 0.0831 0.9342 82.0
2.0 0.3830 0.0851 0.0831 0.5512 69.5
5.0 0.1532 0.0851 0.0831 0.3214 47.7
10.0 0.0766 0.0851 0.0831 0.2448 31.3 1Sample preparation variance reflects dry grind
Variance at 2 mg/kg
Variance at 2 mg/kg
Variance at 2 mg/kg
CX/CF 13/7/7 17
Figure 2. Operating Characteristic curve describing the performance of the deoxynivalenol sampling plan for raw wheat, raw barley and shelled maize for a maximum level of 2 mg/kg. Sample size is 10 kg, sample prep is a 25 g test portion taken from sample comminuted using water-slurry, and analytical methods reflecting FAPAS among lab uncertainty.
Effect of decreasing the size of a single laboratory sample tested per lot from that which was Proposed in CX/CF 12/6/9
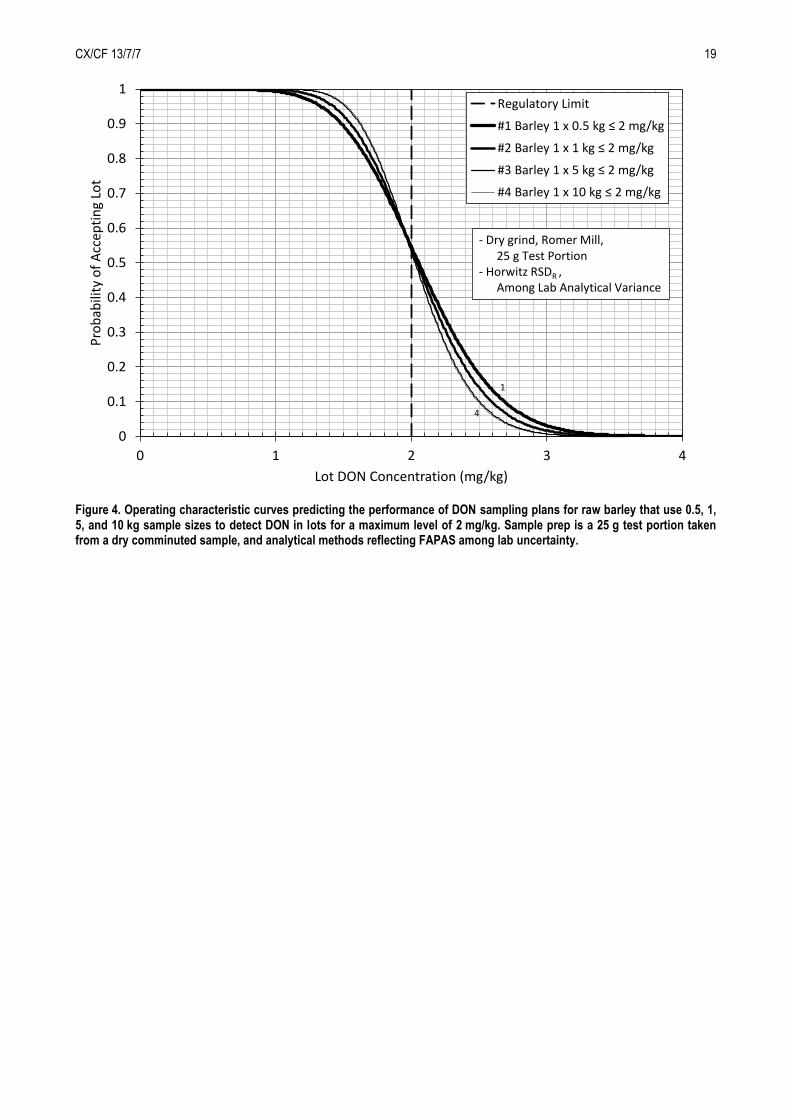
37. OC curves describing the performance of the DON sampling plan for raw wheat for an ML of 2 mg/kg and laboratory sample sizes of 0.1, 0.2, 0.5, 1.0 and 10.0 kg, and for raw barley for an ML of 2 mg/kg and laboratory sample sizes of 0.5, 1.0, 5.0 and 10.0 kg are shown in Figures 3 and 4. These OC curves are reflective of variance associated with dry grind sample preparation, a 25 g test portion, and analytical methods reflecting FAPAS among lab uncertainty. From these figures, it is possible to identify a threshold at which point, increasing sample size no longer decreases the chances of rejecting lots with concentrations below the ML and the chances of accepting lots with concentrations above the ML. (i.e., there is no substantial further reduction of both false positives and false negatives). The results suggest that there is little benefit associated with increasing sample sizes above 1.0 kg for wheat and barley.
38. OC curves describing the performance of the DON sampling plan for raw shelled corn for an ML of 2 mg/kg, and laboratory sample sizes of 1.0, 2.0 and 5.0, 7.0 and 10.0 kg are shown in Figure 5. They reflect variance associated with dry comminution, a 25 g test portion, and analytical methods reflecting FAPAS among lab uncertainty. The sampling variance for shelled maize is larger than that for wheat and barley. As a result, the sampling variance remains a significant portion of the total variance even a higher sampling sizes, unlike in the cases of wheat and barley.
39. It appears that for a given sample size, the smaller the kernel size (i.e., more kernels per unit mass), the lower the sampling variability. Both wheat and barley (approx. 30,000 kernels/kg) have a larger number of kernels per unit mass than shelled corn (approx. 3000 kernels/kg). For shelled corn, sample sizes of 5 to 10 kg may be more appropriate, with OC curves indicating that there is benefit to using a sample size of at least 5 kg.
40. The OC curves shown in Figures 3, 4 and 5, provide an indication of the interaction between the maximum level and laboratory sample size, with respect to how the sample size can be used to minimize chances of accepting lots with DON concentrations above the proposed ML. For example, if a sampling plan was to be designed that did not accept more than 10% of the raw shelled corn lots at 3 mg/kg or higher, then 1 x 5 kg (laboratory sample size) ≤ 2 mg/kg (proposed ML) (Figure 5) would satisfy that criterion.
41. The CCCF need to decide whether it is more practical to use one sampling plan design for all raw cereals, or whether different sampling plan designs should be used for the smaller grains (wheat and barley; 1.0 kg) and shelled maize (5 kg). If the CCCF decide to use one sampling plan design for all three raw cereals, then the commodity with the greatest variability (shelled maize) should be used to design such a plan. The sampling plan proposed within CX/CF 12/6/9 had proposed a 10 kg sample be taken for all raw cereals (wheat, barley and maize), however, the data reported here indicate that a sample size of 5 kg would be adequate for raw wheat, raw barley and shelled corn.
0
0.1
0.2
0.3
0.4
0.5
0.6
0.7
0.8
0.9
1
0 1 2 3 4
Pro
bab
ility
of
Acc
epti
ng
Lot
Lot DON Concentration (mg/kg)
Regulatory Limit
#1 Wheat 1 x 10 kg ≤ 2 mg/kg
#2 Barley 1 x 10 kg ≤ 2 mg/kg
#3 Maize 1 x 10 kg ≤ 2 mg/kg
1
3
2
- Dry grind, Romer Mill,25 g Test Portion
- Horwitz RSDR ,Among Lab Analytical Variance

CX/CF 13/7/7 18
42. The issue of correcting analytical test results for recovery, the estimation of measurement uncertainty and reporting of results is not addressed in this document. However, some performance criteria for analytical methods including suggestions for the range of acceptable recovery rates were included in CX/CF 12/6/9. CCCF members may wish to further discuss corrections for recovery and estimations of measurement uncertainty, in the context of reporting results for enforcement purposes. The need to set general performance criteria for the methods of analysis for DON could also be referred to the Committee on Methods of Analysis and Sampling (CCMAS) for further development.
Figure 3. Operating characteristic curves predicting the performance of DON sampling plans for raw wheat that use 0.1, 0.2, 0.5, 1.0, and 10 kg sample sizes to detect DON in lots for a maximum level of 2 mg/kg. Sample prep is a 25 g test portion taken from a dry comminuted sample, and analytical methods reflecting FAPAS among lab uncertainty.
CX/CF 13/7/7 19
Figure 4. Operating characteristic curves predicting the performance of DON sampling plans for raw barley that use 0.5, 1, 5, and 10 kg sample sizes to detect DON in lots for a maximum level of 2 mg/kg. Sample prep is a 25 g test portion taken from a dry comminuted sample, and analytical methods reflecting FAPAS among lab uncertainty.
0
0.1
0.2
0.3
0.4
0.5
0.6
0.7
0.8
0.9
1
0 1 2 3 4
Pro
bab
ility
of
Acc
epti
ng
Lot
Lot DON Concentration (mg/kg)
Regulatory Limit
#1 Barley 1 x 0.5 kg ≤ 2 mg/kg
#2 Barley 1 x 1 kg ≤ 2 mg/kg
#3 Barley 1 x 5 kg ≤ 2 mg/kg
#4 Barley 1 x 10 kg ≤ 2 mg/kg
1
4
- Dry grind, Romer Mill,25 g Test Portion
- Horwitz RSDR ,Among Lab Analytical Variance

CX/CF 13/7/7 20
Figure 5. Operating characteristic curves predicting the performance of DON sampling plans for shelled corn that use 1, 2, and 5 kg sample sizes to detect DON in lots for a maximum level of 2 mg/Kg. Sample prep is a 25 g test portion taken from a dry comminuted sample, and analytical methods reflecting FAPAS among lab uncertainty.
Development of OC curves for semi-processed wheat, barley and maize products
43. OC curves have not been developed for semi-processed wheat, barley and maize products. No variability data is available for semi-processed products such as flour, meal, etc. It is considered that the total variability of the of the DON test procedure for semi-processed products would be the sum of the sampling variance and analytical variance. For example, since semi-processed product samples (e.g. flour, meal) would generally be comminuted already, there is usually no sample preparation variance. Although no laboratory data is available, OC curves could be generated for semi-processed products provided certain assumptions are made. For example, if the assumption is made that the sampling variance for certain semi-processed products reflects and/or approaches the magnitude of the sample preparation variance of the raw commodities (essentially assuming that the two variance are equal) determined from the studies used to develop the current OC curves, then OC curves could be generated for the semi-processed products. This is based on the premise that certain semi-processed products would have a particle size distribution consistent with comminuting raw wheat, raw barley or shelled maize with the Romer mill or the wet slurry method. While this would provide a basis for generating OC curves for semi-processed products, it is likely that the sampling variability for flour would be much lower than the sampling variability for grain comminuted with the Romer mill. The performance of the sampling plan and consequently the OC curves that are generated are affected by particle size. Similar CCCF work for semi-processed products has been previously done for the fumonisins (CX/CF 12/6/18, Feb. 2012).
CX/CF 13/7/7 21
REFERENCES
Abbas HK, Mirocha CJ, Pawlosky RJ, and Pusch DJ, 1985. Effect of cleaning, milling, and baking on deoxynivalenol in wheat. Applied Environmental Microbiology, 50: 482-486.
CAC/RCP 51-2003. Code of Practice for the Prevention and Reduction of Mycotoxin Contamination in Cereals, Codex Alimentarius Commission, 2003.
CODEX STAN 193-1995. Codex General Standard for Contaminants and Toxins in Food and Feed, Codex Alimentarius Commission, 1995.
CX/CF 12/6/9 Proposed Draft Maximum Levels for Deoxynivalenol (DON) in Cereals and Cereal-Based Products and Associated Sampling Plans (at Step 2/3).
FAO/WHO. 2011. Deoxynivalenol. IN Safety evaluation of certain contaminants in food, Prepared by the Seventy-second meeting of the Joint FAO/WHO Expert Committee on Food Additives (JECFA). World Health Organization, Geneva, 2011, and Food and Agriculture Organization of the United Nations, Rome, 2011. WHO Food Additives Series 63, FAO JECFA MONOGRAPHS 8.
Freese L, Friedrich R, Kendall D, Tanner S, 2000. Variability of Deoxynivalenol measurements in barley. Journal of AOAC International, 83(5):1259-1263.
Gartner BH, Munich M, Kleijer G, and Mascher F, 2008. Characterization of kernel resistance against Fusarium infection in spring wheat by baking quality and mycotoxin assessment. European Journal of Plant Pathology, 120: 61-68.
Ozay G, Seyhan F, Yilmaz A, Whitaker T, Slate A, Giesbrecht F, 2006. Sampling hazelnuts for aflatoxin: UIncertainty associated with sampling, sample preparation, and analysis. Journal of AOAC International, 89:1004-1011.
REP12/CF Report of the sixth session of the Codex Committee on Contaminants in Food, 26-30 March 2012.
Schollenberger M, Jara HT, Suchy S, Drochner W, and Muller H-M, 2002. Fusarium toxins in wheat collected in an area in southwest Germany. International Journal of Food Microbiology, 72(1-2): 85-89.
Spanjer M, Scholten J, Kastrup S, Jorissen U, Schatzki T, Toyofuku N, 2006. Sample comminution for mycotoxin analysis: Dry milling or slurry mixing? Food Additives and Contaminants, 23:73-83.
Thompson M, 2000. Recent trends in inter-laboratory precision at ppb and sub-ppb concentrations in relation to fitness for purpose criteria in proficiency testing. The Analyst (J. Royal Society of Chemistry), 125:385-386.
Trigo-Stockli DM, Deyoe CW, Satumbaga RF, and Pedersen JR, 1996. Distribution of deoxynivalenol and zearalenone in milled fractions of wheat. Cereal Chemistry, 73: 388-391.
Whitaker TB, Hagler WM Jr, Giesbrecht FG, Johansson AS, 2000. Sampling, sample preparation, and analytical variabilty associated with testing wheat for Deoxynivalenol. Journal of AOAC International, 83(5):1285-1292
Whitaker TB, Hagler WM Jr. Giesbrecht FG, Johansson AS, 2002. Sampling wheat for deoxynivalenol. In: Advances in Experimental Medicine and Biology, 504: 73-83, Mycotoxins and Food Safety; Ed Trucksess et al 2002.
Whitaker TB, Richard JL, Giesbrecht FG, Skate AB, Ruiz N, 2003. Estimating deoxynivalenol in shelled corn barge lots by measuring deoxynivalenol in corn screenings. Journal of AOAC International, 86(6):1187-1192.
Young JC, Fulcher RG, Hayhoe JH, Scott PM, Dexter JE, 1984. Effect of milling and baking on deoxynivalenol (vomitoxin) content of eastern Canadian wheats. Journal of Agriculture and Food Chemistry, 32(3): 659-664.
CX/CF 13/7/7 22
APPENDIX III
LIST OF PARTICIPANTS
Argentina
Argentina’s Codex Contact Point Ministerio de Agricultura, Ganaderia y Pesca Email: [email protected]
Austria
Elke Rauscher-Gabernig Austrian Agency for Health and Food Safety Email: [email protected]
Brazil
Ms. Ligia Lindner Schreiner Brazilian Health Surveillance Agency Email: [email protected]
Canada
Mr. Mark Feeley Health Canada, Food Directorate Email: [email protected]
Ms. Carla Hilts Health Canada, Food Directorate Email: [email protected]
Dr. Kelly Hislop Health Canada, Food Directorate Email: [email protected]
Mr. Luc Pelletier Health Canada, Food Directorate Email: [email protected]
China
Dr. Yongning Wu China National Centre for Food Safety Risk Assessment Email: [email protected]
Dr. Shuang Zhou China National Centre for Food Safety Risk Assessment Email: [email protected]
Ms. Shao Yi China National Centre for Food Safety Risk Assessment Email: [email protected]
European Union
Beate Kettlitz Food Drink Europe Email: [email protected]
Patrick Fox Food Drink Europe Email: [email protected]
Mr. Frans Verstraete European Commission Email: [email protected]
Japan
Ms. Keiko Akimoto Ministry of Agriculture, Forestry and Fisheries Email: [email protected]
Nigeria
Dr. Abimbola O. Adegboye Standards Organisation of Nigeria Email: [email protected]; [email protected]
Republic of Korea
Hayun Bong Codex. KFDA Email: [email protected]
Spain
Felicidad Herrero Moreno Ministry of Agriculture, Food and Environment Email: [email protected]
Thailand
Ms. Chutiwan Jatupornpong National Bureau of Agriculture Commodity and Food Standards Email: [email protected]; [email protected]
United Kingdom
Elli Amanatidou Food Standards Agency Email: [email protected]
United States
Henry Kim United States Food and Drug Administration Centre for Food Safety and Applied Nutrition Email: [email protected]
Kathleen D’Ovidio United States Food and Drug Administration Centre for Food Safety and Applied Nutrition Email: kathleen.d’[email protected]
Dr. Maia M. Jack International Council of Grocery Manufacturer Associations Email: [email protected]
Dr. James Coughlin Institute of Food Technologists Email: [email protected]
Dr. Thomas Whitaker Biological and Agricultural Engineering Department North Carolina State University Email: [email protected]

CX/CF 13/7/7 23
Jim Blair North American Millers Association Email: [email protected]
Sherri Lehman North American Millers Association Email: [email protected]
Uruguay
Jacqueline Cea Laboratorio Technologico Del Uruguay Email: [email protected]