calibrant assessment guideline: deoxynivalenol (don)
TRANSCRIPT

RAPPORT BIPM – 2021/02
Version 1.0: May 5, 2021
Calibrant Assessment Guideline: Deoxynivalenol (DON) BIPM CAG-03
Authors: Ralf D. Josephs (BIPM), Xiaomin Li (NIM), Magali Bedu (BIPM), Adeline Daireaux (BIPM), Gustavo Martos (BIPM), Xiuqin Li (NIM), Zhen Guo (NIM), Xianjiang Li (NIM), Yan Gao (NIM), Tiphaine Choteau (BIPM), Steven Westwood (BIPM), Hongmei Li (NIM), Robert Wielgosz (BIPM)

RAPPORT BIPM-2021/02
P a g e | 2 of 29
BIPM CAG-03: Deoxynivalenol (DON) Table of Contents
1. SCOPE 4
2. INTRODUCTION 4
3. PROPERTIES OF DON SOLUTIONS 5
3.1 Hazards identification 5
3.1.1 Protective measures 5
3.1.2 Emergency procedures 5
3.1.3 Spillage / Projections 6
3.2 Physical and chemical properties 6
3.3 Structure 7
4. METHODS FOR THE CHARACTERIZATION OF DON SOLUTIONS 7
4.1 DON and related structure impurities analysis by LC-DAD-MS/MS 7
4.1.1 Materials 9
4.1.2 Sample preparation 9
4.1.3 Instrumentation 9
4.1.4 Liquid chromatography parameters 9
4.1.5 DAD detection parameters 10
4.1.6 MS/MS detection parameters 10
4.1.7 Data analysis 11
5. CHARACTERIZATION SUMMARY OF THE DON STOCK SOLUTION 11
5.1 Preparation and value assignment 11
5.2 Stability study 12
5.3 Homogeneity study and combined uncertainty 13
6. PREPARATION AND CHARACTERIZATION OF THE DON CALIBRATION SOLUTION 14
6.1 Preparation and ampouling 14
6.2 Stability study 15
6.2.1 Study design 15
6.2.2 Stability study measurements 15
6.2.3 Stability data evaluation 17
6.2.4 Stability uncertainty contribution 21
6.3 Homogeneity study 21
6.3.1 Study design 21
6.3.2 Homogeneity study measurements 21
6.3.3 Homogeneity data evaluation 21

RAPPORT BIPM-2021/02
P a g e | 3 of 29
6.4 Mass fraction value assignment and uncertainty 25
6.5 Mass fraction value verification by analytical methods 27
7. ACKNOWLEDGEMENTS 28
8. REFERENCES 28

RAPPORT BIPM-2021/02
P a g e | 4 of 29
1. Scope This document has been prepared to provide guidance on the preparation and value
assignment of a calibration solution of deoxynivalenol (DON) in the mass fraction range of 10-100 mg/kg. The calibration solution is prepared by gravimetric dilution of a gravimetrically prepared stock solution having known DON mass fraction and it is intended for use as a primary calibrator for DON analysis.
The information summarized in the document was obtained as part of the BIPM Metrology for Safe Food and Feed Programme for capacity building and knowledge transfer on the production and characterization of reference materials for mycotoxin analysis.
2. Introduction In collaboration with the National Institute of Metrology, China (NIM) and the National Metrology Institute of South Africa (NMISA), the BIPM initiated in 2016 a Capacity Building and Knowledge Transfer program for Metrology for Safe Food and Feed (MMCBKT) in Developing Economies (1). This project is designed to allow NMIs/DIs to work together to strengthen the worldwide mycotoxin metrology infrastructure; provide knowledge transfer to scientists developing capabilities in this area and to enable NMIs/DIs in developing regions to provide calibrants, matrix reference materials and proficiency test samples that support testing activities and laboratory services for mycotoxin analysis within their countries.
Calibration solutions prepared from well characterized, high purity compounds are the source of metrological traceability of most routine organic analysis results. The preparation and characterization of these solutions is therefore essential within the measurement infrastructure that supports the delivery of reliable results. It is particularly challenging in the case of the provision of standards to underpin mycotoxin testing in developing economies due to stringent export / import regulations, challenging logistics and high costs.
Deoxynivalenol (DON) belongs to the large group of trichothecene mycotoxins. It is produced by certain fungi of the genus Fusarium that predominantly infect wheat, corn, oats, barley, rice, and other grains in the field or during storage. The exposure risk to human is directly through foods of plant origin (flour, bread, breakfast cereals, noodles, infant foods, pancakes, malt and beer) or indirectly through foods of animal origin (carry-over). DON occurs as predominant mycotoxin in the northern part of the globe and due to the adverse effects in animals, DON is known as one of the most significant for animal production (decrease in feed intake and reduced weight gain). The main toxic effect of DON is the inhibition of protein synthesis and mitochondrial function leading to effects such as immunosuppression and cytotoxic effects. DON affects animal and human health causing acute temporary nausea, vomiting, diarrhoea, abdominal pain, headache, dizziness, and fever. DON is a polar and water-soluble chemical compound and it is heat-stable, being able to partially withstand temperatures within the range of 170 °C to 350 °C, with no reduction of DON concentration after 30 min at 170 °C (2, 3, 4). The analytical difficulty and the economic importance of

RAPPORT BIPM-2021/02
P a g e | 5 of 29
controlling DON in food and feed support the need for solution and matrix certified reference materials. They are invaluable tools to ensure comparability and traceability in DON measurements and are very useful for the implementation of written standards, legislation/regulations and laboratory accreditation.
The present guideline summarizes methods that can be used for the preparation and characterization of DON calibration solutions. The method development and validation studies carried out within the BIPM MMCBKT program are the basis for the results and procedures described herein. The document is intended to be of use to other metrology institutes and reference measurement service providers needing to prepare and characterize their own DON primary calibrator solution to underpin the metrological traceability of results. Stock and calibration solutions were prepared from a DON source material. For the MMCBKT programme that material was value assigned in-house for purity. Methods for the characterization of DON pure materials are described in a separate purity evaluation guideline (PEG) (5). The DON solutions prepared gravimetrically from the MMCBKT source material were value assigned and dispensed into glass ampoules and flame sealed. A range of analytical methods were developed to quantify the mass fractions of DON and related structure impurities in solution in order to evaluate the homogeneity and stability of the materials, as well as to verify the gravimetrically assigned DON solution mass fraction value.
3. Properties of DON solutions
3.1 Hazards identification The substance poses high potential risks for human health if handled inappropriately.
It is acutely toxic by inhalation, in contact with skin and if swallowed. Exposure to DON solutions may cause skin or eye corrosion, cough, shortness of breath, headache, nausea and vomiting. Recommendations for handling high-purity solid samples of DON are given in reference (6).
DISCLAIMER: The safety recommendations given in this section are based on literature reported best practice and are not verified by the BIPM.
3.1.1 Protective measures
Avoid breathing of vapours, mist or gas. Wear protective gloves, goggles and clothing. Take special care to avoid skin exposure if handling solutions and work in adequately ventilated areas. Wash hands thoroughly after handling.
3.1.2 Emergency procedures
General advice: Immediately call a POISON CENTER or doctor/physician. Show this safety data sheet to the doctor in attendance. Move out of dangerous area. If inhaled: Move person into fresh air. If not breathing give artificial respiration. Consult a physician. In case of skin contact: Wash off with soap and plenty of water. Consult a physician.

RAPPORT BIPM-2021/02
P a g e | 6 of 29
In case of eye contact: Rinse thoroughly with plenty of water for at least 15 min and consult a physician. If swallowed: Immediately call a POISON CENTRE or doctor/physician. Never give anything by mouth to an unconscious person. Rinse mouth with water.
3.1.3 Spillage / Projections
Contain spillage and then collect by wet-brushing and place in container for disposal. Keep in suitable, closed containers for disposal according to local regulations.
3.2 Physical and chemical properties
Common Name: Deoxynivalenol (DON)
Synonyms: (3β,7α)-3,7,15-Trihydroxy-12,13-epoxytrichothec-9-en-8-one or Vomitoxin
CAS Registry Number: 51401-10-8
Molecular Formula: C15H20O6
Molar Mass: 296.31 g/mol
Monoisotopic mass: 296.125988 g/mol
Melting point: 152 °C (7)
Appearance: White crystalline powder
Solubility: Soluble in water. Soluble in polar organic solvents methanol, ethanol, acetonitrile, etc. (7)
UV maximum: 219 nm (ϵ = 6983 ± 126 L·mol-1·cm-1 in acetonitrile) (5,8)Erreur ! Signet non défini.

RAPPORT BIPM-2020/xx
P a g e | 7 of 29
3.3 Structure
Figure 1. Chemical structure of deoxynivalenol (DON). C15H20O6. Mw = 296.31 Da.
4. Methods for the characterization of DON solutions This section of the guideline describes the methods developed during the BIPM
MMCBKT program for the characterization of DON stock and calibration solutions prepared from the source DON material. The methods are the basis for the stability and homogeneity studies and for the analytical confirmation of the DON mass fraction value assigned gravimetrically.
DISCLAIMER: Commercial instruments, software and materials are identified in this document in order to describe some procedures. This does not imply a recommendation or endorsement by the BIPM nor does it imply that any of the instruments, equipment and materials identified are necessarily the best available for the purpose.
4.1 DON and related structure impurities analysis by LC-DAD-MS/MS A method based on liquid chromatography inline coupled to diode array detection
(DAD) and tandem mass spectrometry (MS/MS) was developed for the quantification of related structure impurities in the DON source material (BIPM ref. OGO.179). Details on the method development and validation are described in the purity evaluation guideline (5). Briefly, commercial standards were purchased from A Chemtek Inc., First Standard for the potential impurities nivalenol (NIV), 3-acetyleoxynivalenol (3-AcDON), deepoxydeoxynivalenol (DOM-1), nordeoxynivalenol A (norDON), 15-o-acetyl-4-deoxynivalenol (15-AcDON) and for the main compound deoxynivalenol (DON) (Figure 2). Figure 2 shows the chemical structure information of DON and related structure impurities. The purity of DON was assessed by qNMR while for the rest of impurities it was taken from information in the supplier’s certificates. DON (BIPM ref. OGO.179) obtained from A Chemtek Inc., First Standard were used to prepare about 640 mg/kg acetonitrile solutions that served as the basis for the LC method development. The impurity standards were used to optimize the chromatographic separation and DAD as well as MS/MS detection parameters that are reported below. The method was validated in-house for the performance characteristics of linearity, precision and limits of detection and quantification.

RAPPORT BIPM-2020/xx
P a g e | 8 of 29
1. Deoxynivalenol (DON)
C15H20O6, mw: 296.32 CAS No: 51481-10-8
pKow: 0.71
2. 4,7-Dideoxynivalenol (7-deoxy-DON, 4,7-deoxy-NIV) (R1=OH, R2=H)
C15H20O5, mw: 280.32 CAS No: 119785-14-7
3. isoDON C15H20O6, mw: 296.32
4. DON lactone
C15H20O6, mw: 296.32
5. norDON A C14H18O5, mw: 266.29 CAS No: 103776-38-1
6. norDON B C14H18O5, mw: 266.29 CAS No: 103776-39-2
7. norDON C
C14H18O5, mw: 266.29 CAS No: 103776-40-5
8. 9-Hydroxymethyl-DON-lactone C16H22O7, mw: 326.34
9. norDON D C15H20O5, mw: 280.32
10. norDON E C15H22O5, mw: 282.34
11. norDON F C15H20O6, mw: 296.32
12. Deepoxy-DON (DOM-1) C15H20O5, mw: 280.32 CAS No: 88054-24-4
pKow: 0.16
13. Nivalenol (NIV) C15H20O7, mw: 312.32 CAS No: 23282-20-4
pKow: 2.24
14. NIV-lactone C15H20O7, mw: 312.32
15. norNIV A C14H18O6, mw: 282.29
16. norNIV B
C14H18O6, mw: 282.29 17. norNIV C
C14H18O6, mw: 282.29 18. isoNIV
C15H20O7, mw: 312.32
19. 3-Acetyl-DON (3-AcDON) C17H22O7, mw: 338.36 CAS No: 50722-38-8
pKow: 0.55
20. 15-Acetyl-DON (15-AcDON) C17H22O7, mw: 338.36 CAS No: 88337-96-6
pKow: -0.30
Figure 2. Chemical structures of DON and related impurities optimized for LC-MS/MS detection.

RAPPORT BIPM-2020/xx
P a g e | 9 of 29
4.1.1 Materials
- Acetonitrile. HPLC gradient grade (HiPerSolv Chromanorm VWR)
- Ultrapure water (Milli-Q)
- DON stock (BIPM ref. OGP.034) and calibration (BIPM ref. OGP.033) solutions.
- Impurity standards: NIV, 3-AcDON, DOM-1, norDON and 15-AcDON (First Standard via NIM China).
4.1.2 Sample preparation
Ampoules of the stock or calibration solution were vortexed before opening and 0.5 mL aliquots of solution were transferred to glass injection vials and placed in the autosampler at 4 °C for immediate analysis.
4.1.3 Instrumentation
Liquid chromatography system Agilent 1100 HPLC equipped with a diode array detector (DAD) and coupled to a Sciex 4000 Qtrap mass spectrometry detector.
4.1.4 Liquid chromatography parameters
Column: Phenomenex Kinetex EVO C18 100 Å, (250 × 4.6 mm, 2.6 µm) Column temperature: 30 °C Detector DAD 219 nm (229 nm) and ref. wavelength 400 nm MS/MS Mobile phase: A) H2O
B) Acetonitrile Operation mode: Gradient (inclusive cleaning gradient) Solvent gradient Time (min) Mobile phase A
0 6.5 % 17 6.5 % 27 20 % 35 20 % 45 95 % 50 95 % 51 6.5 % 60 6.5 %
606.5 % Flow rate: 0.6 mL/min Injection volume: 2 µL or 10 µL Duration: 60 min

RAPPORT BIPM-2020/xx
P a g e | 10 of 29
To avoid contamination of the sensitive MS instrument by the high mass fraction level of the main DON compound, the mobile phase was diverted to waste during the elution window of DON. It was measured in the DAD detector but it did not reach the MS.
4.1.5 DAD detection parameters
The absorption wavelength used for the detection of the main component DON was 219 nm (step and slit widths 2 nm and 4 mm, respectively).
4.1.6 MS/MS detection parameters
The 4000 QTRAP was operated in negative electrospray ionization (ESI) mode. The capillary voltage was set at -4500 V and the source temperature at 700 °C. Nitrogen was used as the ion source gas, curtain gas and collision gas. The Gas 1 and Gas 2 of the ion source were set at 50 psi and 70 psi, respectively. The curtain gas (CUR) was set at 20 psi. The Collision Gas (CAD) was set at “Mid”. The declustering potential (DP), being the accelerating current from atmospheric pressure into high vacuum, was set at -47 V. The entrance potential (EP) was set at -5 V. The collision cell exit potential (CXP) was set at -9 V. Table 1 lists the optimized transitions and conditions for multiple reaction monitoring (MRM) detection and quantification of DON and its structurally related impurities.
Table 1. Transition ions and MS/MS parameters for the detection of DON and selected impurities in MRM mode. Transitions marked with an asterisk were used for quantification purposes.
Q1 (m/z) Q3 (m/z) Time (ms) CE (V) DON 295.1 265.1 50 -17
295.1 247.1 50 -18 NIV 311.1 281.1 50 -17
311.1 191.0 50 -28 3-AcDON 337.1 307.1 50 -17
337.1 173.0 50 -16 15-AcDON 337.1 150.0 50 -22
337.1 219.1 50 -16 DOM-1 279.1 249.1 50 -17
279.1 231.1 50 -25 norDON 265.1 247.1 50 -22
265.1 235.1 50 -23

RAPPORT BIPM-2020/xx
P a g e | 11 of 29
4.1.7 Data analysis
Data was evaluated using Analyst 1.6.3 software (SCIEX). Peak integration was verified manually for all samples and standards. Peak areas were extracted for quantification and uncertainty evaluation.
5. Characterization summary of the DON stock solution
5.1 Preparation and value assignment The DON stock solution (OGP.034) was prepared gravimetrically by dissolving about
500 mg of DON powder material (OGO.179) in 1 L of acetonitrile. Mettler Toledo balances MX5 and XP10002S were used for the mass determination of OGO.179 and the final solution, respectively. Table 2 summarizes the preparation of the stock solution and the mass fraction assignment, calculated according to equation 1. The purity of OGO.179 was determined in-house by quantitative NMR corrected for related structure impurities, as described in a separate purity evaluation guideline (5).
Table 2. Experimental data corresponding to the preparation of the DON stock solution and the calculated mass fraction.
DON stock solution preparation
Weighed mass (m) Buoyancy (b) m x b
DON powder (mg) 499.41 1.000685 499.752
Stock solution (g) 778.85 1.001369 779.925
Purity ± U (mg/g) 978.6 ± 9.0
Mass fraction (µg/g) 627.06
𝑤𝑤𝑠𝑠𝑠𝑠𝑠𝑠𝑠𝑠𝑠𝑠 = 𝑚𝑚𝑝𝑝∙𝑏𝑏𝑝𝑝∙𝑤𝑤𝑝𝑝
𝑚𝑚𝑠𝑠𝑠𝑠𝑠𝑠∙𝑏𝑏𝑠𝑠𝑠𝑠𝑠𝑠 Eq. 1
Where: mp: observed mass of DON powder bp: buoyancy correction of powder weighing wp: mass fraction of DON powder msol: observed mass of stock solution bsol: buoyancy correction of solution weighing
RAPPORT BIPM-2020/xx
P a g e | 12 of 29
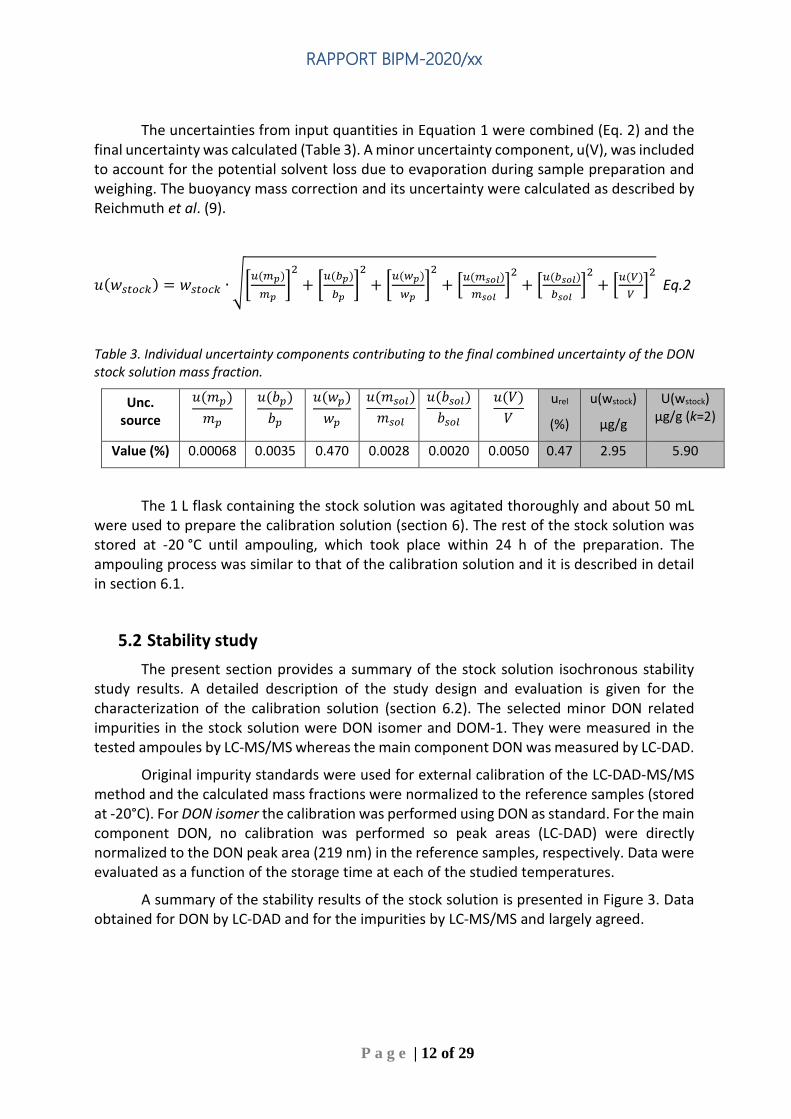
The uncertainties from input quantities in Equation 1 were combined (Eq. 2) and the final uncertainty was calculated (Table 3). A minor uncertainty component, u(V), was included to account for the potential solvent loss due to evaporation during sample preparation and weighing. The buoyancy mass correction and its uncertainty were calculated as described by Reichmuth et al. (9).
𝑢𝑢(𝑤𝑤𝑠𝑠𝑠𝑠𝑠𝑠𝑠𝑠𝑠𝑠) = 𝑤𝑤𝑠𝑠𝑠𝑠𝑠𝑠𝑠𝑠𝑠𝑠 ∙ ��𝑢𝑢(𝑚𝑚𝑝𝑝)𝑚𝑚𝑝𝑝
�2
+ �𝑢𝑢(𝑏𝑏𝑝𝑝)𝑏𝑏𝑝𝑝
�2
+ �𝑢𝑢(𝑤𝑤𝑝𝑝)𝑤𝑤𝑝𝑝
�2
+ �𝑢𝑢(𝑚𝑚𝑠𝑠𝑠𝑠𝑠𝑠)𝑚𝑚𝑠𝑠𝑠𝑠𝑠𝑠
�2
+ �𝑢𝑢(𝑏𝑏𝑠𝑠𝑠𝑠𝑠𝑠)𝑏𝑏𝑠𝑠𝑠𝑠𝑠𝑠
�2
+ �𝑢𝑢(𝑉𝑉)𝑉𝑉�2 Eq.2
Table 3. Individual uncertainty components contributing to the final combined uncertainty of the DON stock solution mass fraction.
Unc. source
𝑢𝑢(𝑚𝑚𝑝𝑝)𝑚𝑚𝑝𝑝
𝑢𝑢(𝑏𝑏𝑝𝑝)𝑏𝑏𝑝𝑝
𝑢𝑢(𝑤𝑤𝑝𝑝)𝑤𝑤𝑝𝑝
𝑢𝑢(𝑚𝑚𝑠𝑠𝑠𝑠𝑠𝑠)𝑚𝑚𝑠𝑠𝑠𝑠𝑠𝑠
𝑢𝑢(𝑏𝑏𝑠𝑠𝑠𝑠𝑠𝑠)𝑏𝑏𝑠𝑠𝑠𝑠𝑠𝑠
𝑢𝑢(𝑉𝑉)𝑉𝑉
urel
(%)
u(wstock)
µg/g
U(wstock) µg/g (k=2)
Value (%) 0.00068 0.0035 0.470 0.0028 0.0020 0.0050 0.47 2.95 5.90
The 1 L flask containing the stock solution was agitated thoroughly and about 50 mL were used to prepare the calibration solution (section 6). The rest of the stock solution was stored at -20 °C until ampouling, which took place within 24 h of the preparation. The ampouling process was similar to that of the calibration solution and it is described in detail in section 6.1.
5.2 Stability study The present section provides a summary of the stock solution isochronous stability
study results. A detailed description of the study design and evaluation is given for the characterization of the calibration solution (section 6.2). The selected minor DON related impurities in the stock solution were DON isomer and DOM-1. They were measured in the tested ampoules by LC-MS/MS whereas the main component DON was measured by LC-DAD.
Original impurity standards were used for external calibration of the LC-DAD-MS/MS method and the calculated mass fractions were normalized to the reference samples (stored at -20°C). For DON isomer the calibration was performed using DON as standard. For the main component DON, no calibration was performed so peak areas (LC-DAD) were directly normalized to the DON peak area (219 nm) in the reference samples, respectively. Data were evaluated as a function of the storage time at each of the studied temperatures.
A summary of the stability results of the stock solution is presented in Figure 3. Data obtained for DON by LC-DAD and for the impurities by LC-MS/MS and largely agreed.

RAPPORT BIPM-2020/xx
P a g e | 13 of 29
Figure 3. Summary of the stability results for DON and detected related impurities in the DON stock solution. Bars represent the amount of time the indicated compound was found stable at the tested temperature.
It was concluded that the material was suitably stable for short-term transport provided it was not exposed to light and to temperatures significantly in excess of 40 °C for more than two to four weeks. To minimize the potential for changes in the material composition, long-term storage is recommended at -20 °C in the dark.
Stability studies were undertaken of the DON and related structure impurity content of the material. Isochronous stability studies confirmed that the material was stable for the purpose of the comparison provided it is stored and handled as recommended. Standard uncertainty contributions due to stability (ults) of 1.45 % for DON by LC-DAD (219 nm) have been used for establishing the uncertainty budget of the assigned value of the main component to cover the period from characterization until comparison performed. The uncertainty contribution of 1.45 % is a very conservative estimate based on storage of 20 weeks at 4 °C and in the dark.
5.3 Homogeneity study and combined uncertainty The homogeneity study for the DON stock solution is analogous to that of the
calibration solution, which is reviewed in detail in section 6.3. The present discussion is therefore limited to a summary of the results. DON in the ten selected homogeneity samples was measured by LC-DAD (219 nm detection wavelength) and its impurities were measured by LC-MS/MS.
Homogeneity evaluation was performed by single factor ANOVA, allowing for the separation of the variation associated with the method (swb) from the actual variation between ampoules (sbb), which is an estimate of the uncertainty associated to batch inhomogeneity. This maximum relative standard uncertainty contribution due to inhomogeneity was 0.16 %, 0.60 % and 1.01 % for DON and the selected low level impurities DON isomer and DOM-1, respectively (Table 4).
Table 4: Homogeneity results of the DON stock solution OGP.034 using the LC-DAD-MS/MS method.

RAPPORT BIPM-2020/xx
P a g e | 14 of 29
DON (219 nm) DON isomer DOM-1 N 30 30 30 swb (%) 0.48 1.68 3.13 sbb (%) 0.09 -(1) -(1) u*bb (%) 0.16 0.60 1.01 ubb (%)/sbb (%)(1) 0.16 0.60 1.01 F 1.11 0.35 0.87 Fcrit 2.39 2.39 2.39
(1) Higher value (u*bb or sbb) was taken as uncertainty estimate for potential inhomogeneity
The homogeneity (section 5.3, ubb) and stability (section 5.2, ults) uncertainty contributions for the main component DON obtained by LC-DAD were combined with the uncertainty from the gravimetric value assignment − see u(wstock) in section 5.1 − to produce a final estimate of the mass fraction uncertainty of the batch (Table 5).
Table 5. Combination of the uncertainty from the gravimetric value assignment and the uncertainty from between-ampoule homogeneity and stability to estimate the final uncertainty of the DON mass fraction in the batch of the stock solution OGP.034.
u(wstock)rel (%) ubb (%) ults (%) u(comb)rel (%) wstock µg/g U(comb) µg/g (k = 2)
0.47 0.16 1.45 1.53 627.1 19.2
6. Preparation and characterization of the DON calibration solution
6.1 Preparation and ampouling The DON calibration solution (BIPM reference: OGP.033) was prepared by gravimetric
dilution of 50 mL of the stock solution with acetonitrile to a final volume of 1 L. The solution was stored at 4 °C until ampouling, which took place within 24 h of the preparation. A 500 mL bottle and 1-10 mL bottle-top dispenser (Dispensette, Brand GmbH) were rinsed twice with the calibration solution and a stainless steel flat tip syringe needle was fitted at the outlet of the dispenser to ensure that all solution is discharged at the bottom of the ampoule.
10 mL glass ampoules were selected for a filling volume of 4 mL to ensure that sufficient head space remains above the liquid and therefore minimize the risk of accidental ignition of the solvent during the sealing process. An Ampoulmatic (Bioscience Inc) system connected to propane and oxygen cylinders was used to ampoule the batch. The flow of both gases was adjusted to produce a bright blue flame at the neck of the ampoules.
The ampoules were filled with 4 mL of OGP.033, one at a time, to minimize the impact of evaporation of acetonitrile. A refrigerant (Jelt Refroidisseur 5320) was sprayed onto the lower portion of the ampoule before being placed in the ampouling carousel to further reduce the ignition risk. After flame sealing, ampoules were allowed to cool down at room temperature in an upright position and have been labelled according to the order of filling.
To test for possible leaks, ampoules were placed into a vacuum drying oven (Haraeus) in an upright position and vacuum (approximately 50 mbar) was applied for at least 4 hours.

RAPPORT BIPM-2020/xx
P a g e | 15 of 29
The ampoules then remained in the sealed oven overnight, after which they were visually inspected for changes in the solution levels. Inadequately sealed ampoules were noted and discarded while the rest of the batch was stored at -20 °C.
6.2 Stability study 6.2.1 Study design
Stability studies consider the impact of temperature and time to simulate potential transport conditions and/or storage conditions. Any significant influence of light, UV-radiation, moisture, etc. is excluded provided that the storage facilities and transport/packaging conditions are appropriate (8).
The stability study of OGP.033 followed an isochronous design (10) with a reference temperature of -20 °C and study temperatures of 4 °C, 22 °C and 40 °C and storage in the dark. Selected sample units were transferred from study temperatures to the reference temperature every two weeks until the end of the eight-week study.
The sample units were selected using a random stratified sampling scheme from each of the quartiles of the approximately 200-unit batch. The study was composed of two units at the reference temperature and eight units at each of the study temperatures, requiring 26 samples in total (Table 6).
Table 6: Temperatures, time points and sample units selected for the stability study of OGP.033. Temperature Time (weeks) Units -20 °C (reference temperature) n.a. 015,127 4 °C dark 2 048,111 4 023,174 6 012,157 8 026,163 22 °C dark 2 004,191 4 007,150 6 018,182 8 036,185 40 °C dark 2 035,159 4 028,189 6 042,179 8 010,138
6.2.2 Stability study measurements
Two samples of each time point and temperature conditions were measured under repeatability conditions (same day and run) in a randomised manner using the LC-DAD-MS/MS for DON and the potential related structure impurities. Ampoules were vortexed before opening and two aliquots were transferred into separate injection vials to have duplicate measurements of each sample (4 measurements for each condition) by LC-DAD-MS/MS. Representative TIC and DAD chromatograms of OGP.033 samples are shown in Figure

RAPPORT BIPM-2020/xx
P a g e | 16 of 29
4.
Figure 4. LC-DAD chromatogram at 219 nm (top) and LC-MS/MS total ion chromatogram (bottom) of a representative sample of OGP.033.
RAPPORT BIPM-2020/xx
P a g e | 17 of 29
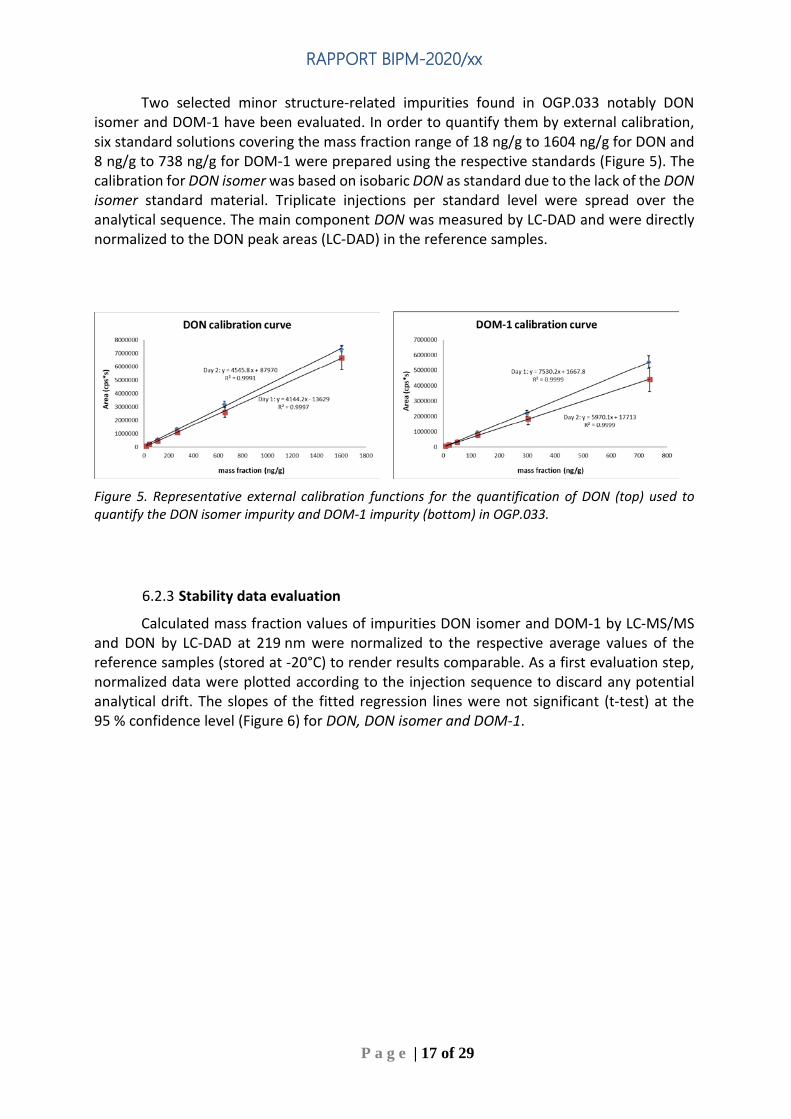
Two selected minor structure-related impurities found in OGP.033 notably DON isomer and DOM-1 have been evaluated. In order to quantify them by external calibration, six standard solutions covering the mass fraction range of 18 ng/g to 1604 ng/g for DON and 8 ng/g to 738 ng/g for DOM-1 were prepared using the respective standards (Figure 5). The calibration for DON isomer was based on isobaric DON as standard due to the lack of the DON isomer standard material. Triplicate injections per standard level were spread over the analytical sequence. The main component DON was measured by LC-DAD and were directly normalized to the DON peak areas (LC-DAD) in the reference samples.
Figure 5. Representative external calibration functions for the quantification of DON (top) used to quantify the DON isomer impurity and DOM-1 impurity (bottom) in OGP.033.
6.2.3 Stability data evaluation
Calculated mass fraction values of impurities DON isomer and DOM-1 by LC-MS/MS and DON by LC-DAD at 219 nm were normalized to the respective average values of the reference samples (stored at -20°C) to render results comparable. As a first evaluation step, normalized data were plotted according to the injection sequence to discard any potential analytical drift. The slopes of the fitted regression lines were not significant (t-test) at the 95 % confidence level (Figure 6) for DON, DON isomer and DOM-1.

RAPPORT BIPM-2020/xx
P a g e | 18 of 29
Figure 6. OGP.033 stability data analysis to identify potential trends in the analytical sequence. Data correspond to normalized mass fractions of DON isomer (middle) and DOM-1 impurities (bottom) determined using LC-MS/MS and normalized peak areas of the main compound DON (top) determined by LC-DAD.
RAPPORT BIPM-2020/xx
P a g e | 19 of 29
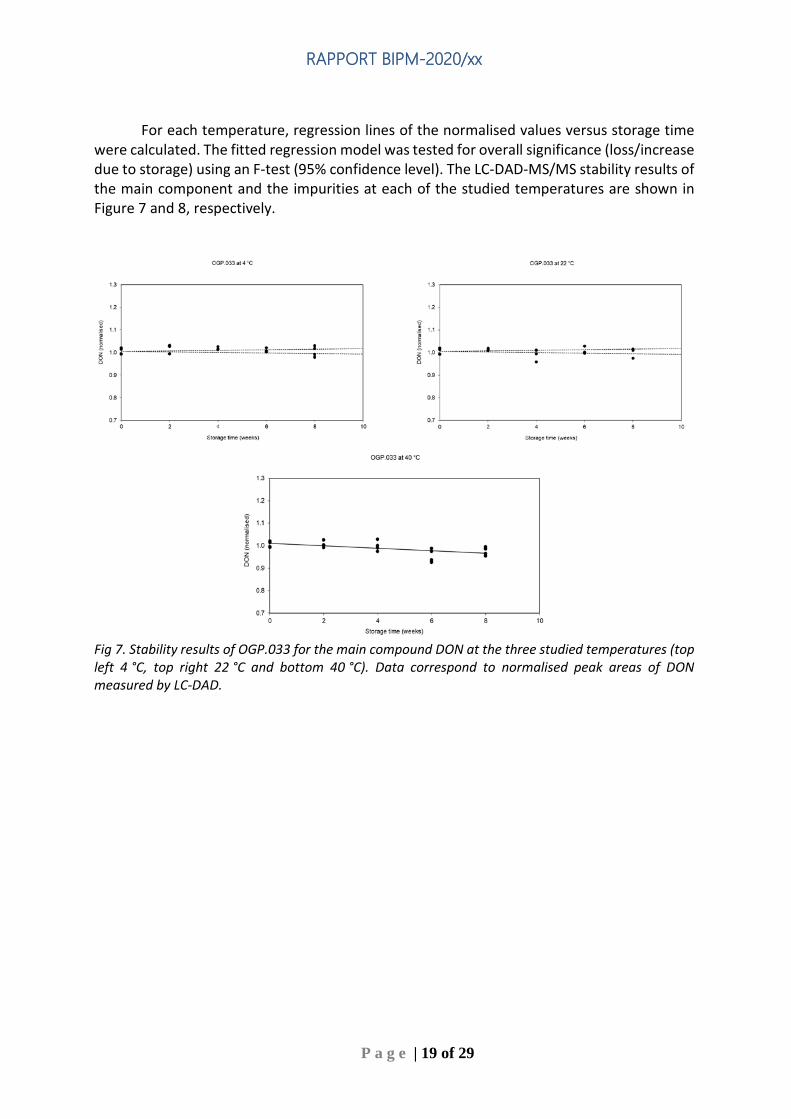
For each temperature, regression lines of the normalised values versus storage time were calculated. The fitted regression model was tested for overall significance (loss/increase due to storage) using an F-test (95% confidence level). The LC-DAD-MS/MS stability results of the main component and the impurities at each of the studied temperatures are shown in Figure 7 and 8, respectively.
Fig 7. Stability results of OGP.033 for the main compound DON at the three studied temperatures (top left 4 °C, top right 22 °C and bottom 40 °C). Data correspond to normalised peak areas of DON measured by LC-DAD.
RAPPORT BIPM-2020/xx
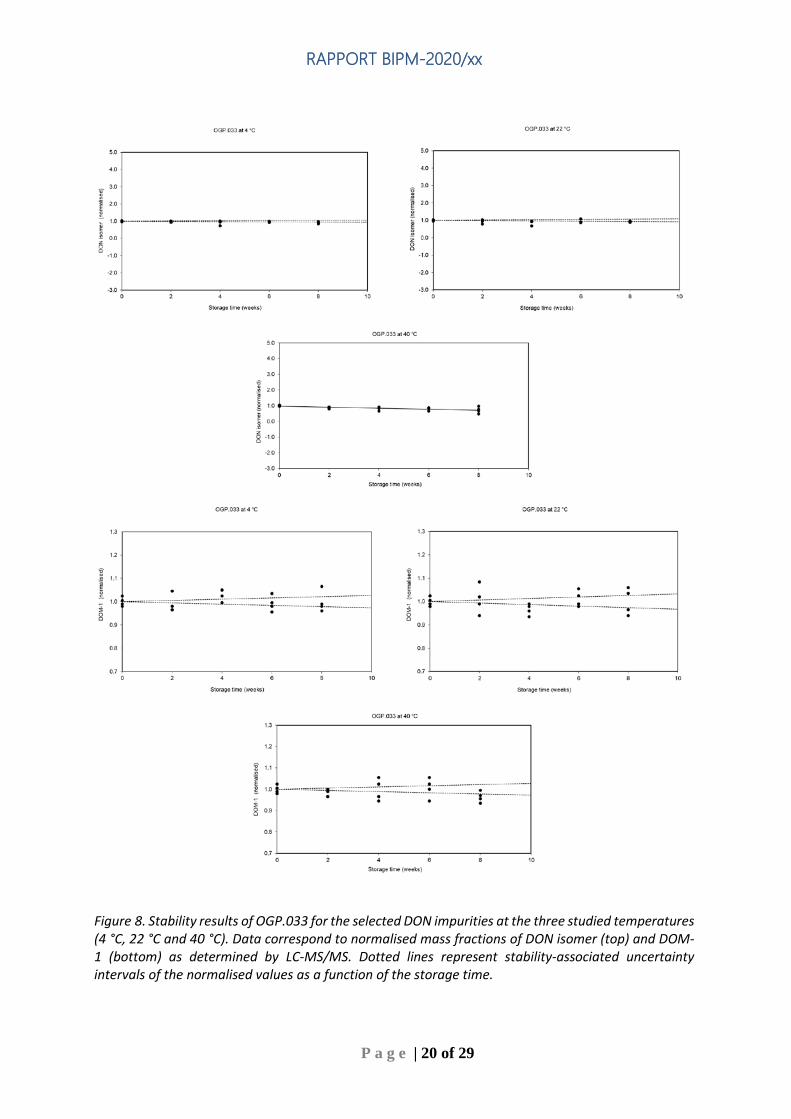
P a g e | 20 of 29
Figure 8. Stability results of OGP.033 for the selected DON impurities at the three studied temperatures (4 °C, 22 °C and 40 °C). Data correspond to normalised mass fractions of DON isomer (top) and DOM-1 (bottom) as determined by LC-MS/MS. Dotted lines represent stability-associated uncertainty intervals of the normalised values as a function of the storage time.

RAPPORT BIPM-2020/xx
P a g e | 21 of 29
At 4 °C and 22 °C, all studied compounds in OGP.033 were stable for 8 weeks, as evidenced by the absence of a significant trend (F-test, 95 % confidence level). At 40 °C the mass fraction of DON and DON isomer changed significantly compared to the reference conditions after two to four weeks of storage, as evidenced by a significant declining trend.
Overall, the LC-DAD-MS/MS measurements results of the OGP.033 stability samples indicated that shipment conditions should not exceed 40 °C for about two weeks. Long-term storage is recommended at -20 °C as a precautionary measure.
6.2.4 Stability uncertainty contribution
The uncertainty contribution of stability over the comparison period was estimated from the isochronous stability studies (10). The influence of the measurement variance of the estimate of the degradation rate is calculated by use of the standard deviation of the slope of the regression line (11). Divergent straight uncertainty lines (dotted lines in Figures 7-8) are calculated by use of the standard deviation as conservative estimate of the degradation rate. Twenty months was chosen as time frame for the comparison period and ults of 2.77 % is directly obtained from the divergent straight uncertainty lines at the time point twenty months storage time for DON at 4 °C (Figure 8, top left). However, long-term storage is recommended at -20 °C as a precautionary measure.
6.3 Homogeneity study 6.3.1 Study design
Homogeneity between ampoules was evaluated to ensure that the assigned value of the calibration solution was valid for all units of the material, within the stated uncertainty. It was therefore necessary to determine this between-unit variation and incorporate it in a combined uncertainty estimate (8).
Ten ampoules were selected from the OGP.033 batch following a randomly stratified sampling scheme. They were measured under repeatability conditions using an LC-DAD-MS/MS method. LC-DAD was used for the main compound DON and LC-MS/MS for selected structure-related impurities DON isomer and DOM-1.
6.3.2 Homogeneity study measurements
The selected ampoules were allowed to equilibrate at room temperature and were vortexed before opening. They were analysed in a random order to ensure that any trends in the ampouling process could be distinguished from potential trends in the analytical sequence. Three aliquots per ampoule were transferred into glass injection vials for LC-DAD-MS/MS analysis.
6.3.3 Homogeneity data evaluation
Peak area values were normalized with respect to the average result for each of the studied compounds. Linear regression functions were calculated for the normalized values arranged in ampouling and analysis order. The slopes of the lines were tested for significance
RAPPORT BIPM-2020/xx
P a g e | 22 of 29
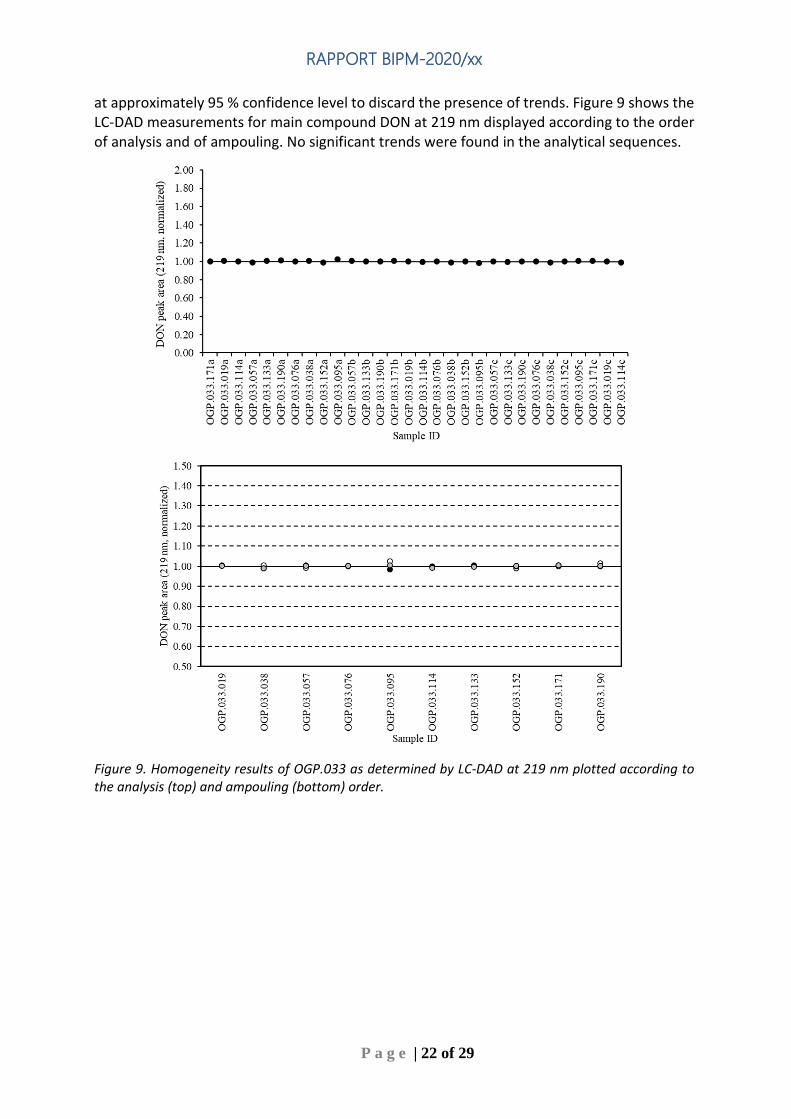
at approximately 95 % confidence level to discard the presence of trends. Figure 9 shows the LC-DAD measurements for main compound DON at 219 nm displayed according to the order of analysis and of ampouling. No significant trends were found in the analytical sequences.
Figure 9. Homogeneity results of OGP.033 as determined by LC-DAD at 219 nm plotted according to the analysis (top) and ampouling (bottom) order.
RAPPORT BIPM-2020/xx
P a g e | 23 of 29
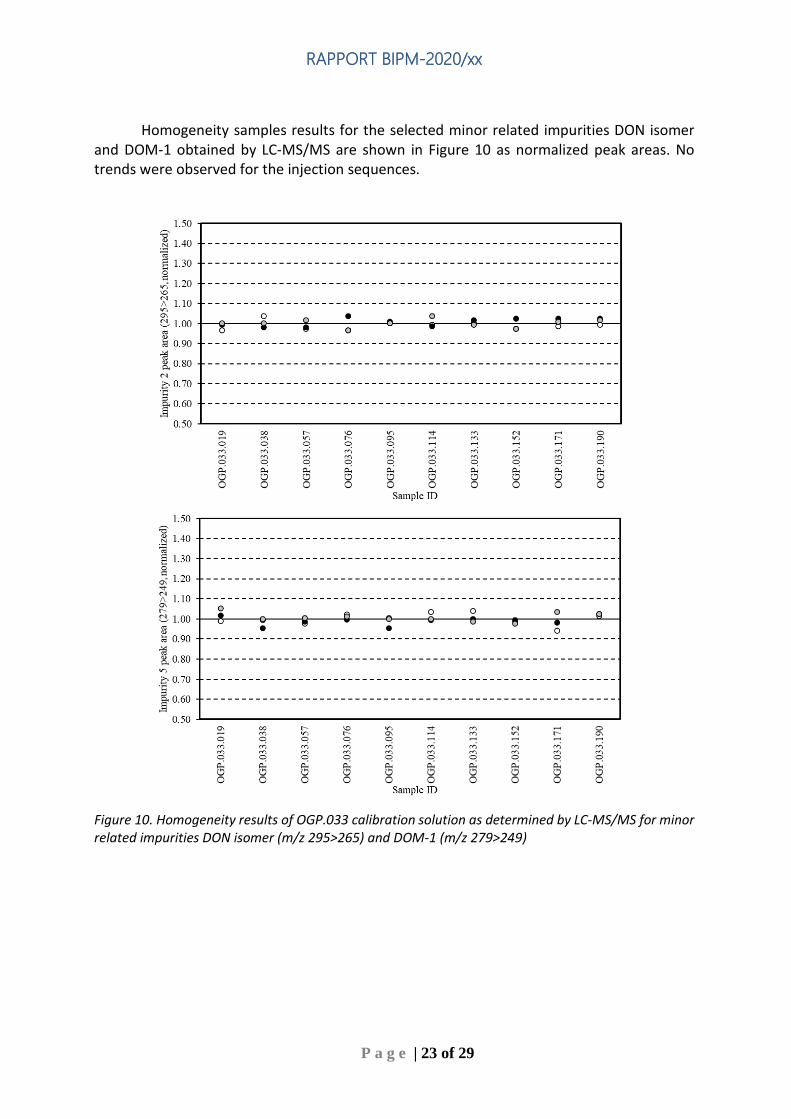
Homogeneity samples results for the selected minor related impurities DON isomer and DOM-1 obtained by LC-MS/MS are shown in Figure 10 as normalized peak areas. No trends were observed for the injection sequences.
Figure 10. Homogeneity results of OGP.033 calibration solution as determined by LC-MS/MS for minor related impurities DON isomer (m/z 295>265) and DOM-1 (m/z 279>249)
RAPPORT BIPM-2020/xx
P a g e | 24 of 29
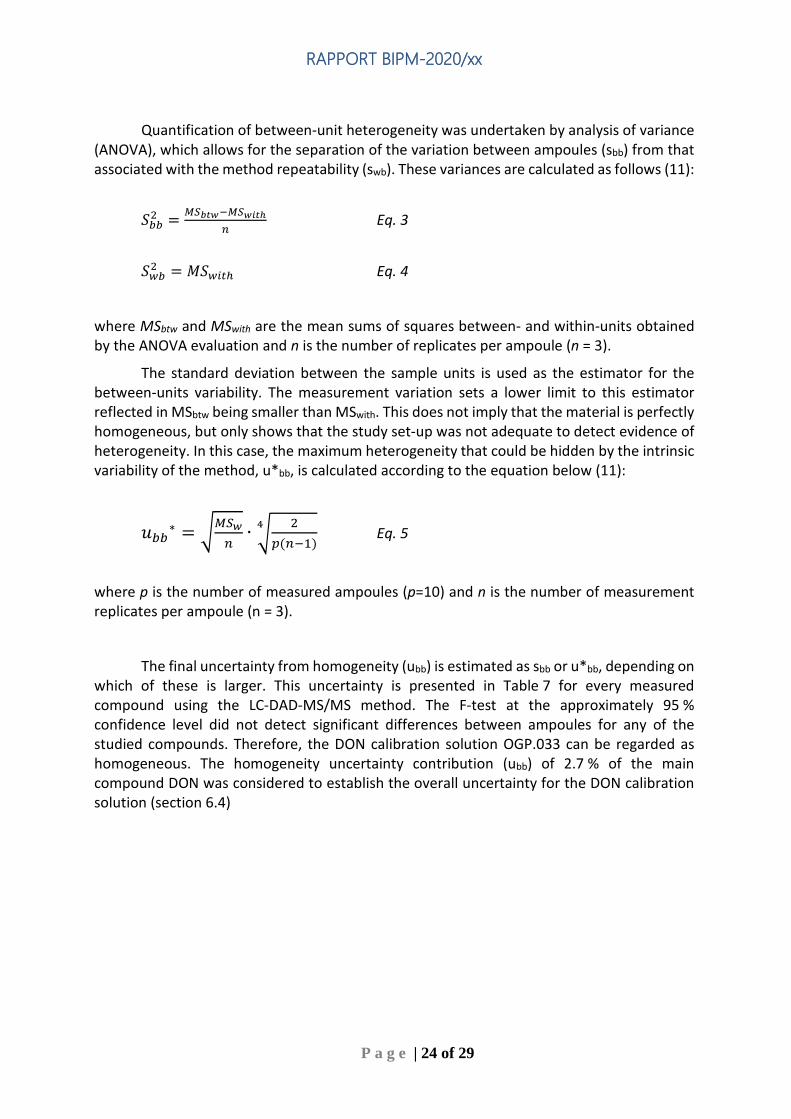
Quantification of between-unit heterogeneity was undertaken by analysis of variance (ANOVA), which allows for the separation of the variation between ampoules (sbb) from that associated with the method repeatability (swb). These variances are calculated as follows (11):
𝑆𝑆𝑏𝑏𝑏𝑏2 = 𝑀𝑀𝑀𝑀𝑏𝑏𝑏𝑏𝑏𝑏−𝑀𝑀𝑀𝑀𝑏𝑏𝑤𝑤𝑏𝑏ℎ
𝑛𝑛 Eq. 3
𝑆𝑆𝑤𝑤𝑏𝑏2 = 𝑀𝑀𝑆𝑆𝑤𝑤𝑤𝑤𝑠𝑠ℎ Eq. 4
where MSbtw and MSwith are the mean sums of squares between- and within-units obtained by the ANOVA evaluation and n is the number of replicates per ampoule (n = 3).
The standard deviation between the sample units is used as the estimator for the between-units variability. The measurement variation sets a lower limit to this estimator reflected in MSbtw being smaller than MSwith. This does not imply that the material is perfectly homogeneous, but only shows that the study set-up was not adequate to detect evidence of heterogeneity. In this case, the maximum heterogeneity that could be hidden by the intrinsic variability of the method, u*bb, is calculated according to the equation below (11):
𝑢𝑢𝑏𝑏𝑏𝑏∗ = �𝑀𝑀𝑀𝑀𝑏𝑏𝑛𝑛∙ � 2
𝑝𝑝(𝑛𝑛−1)4
Eq. 5
where p is the number of measured ampoules (p=10) and n is the number of measurement replicates per ampoule (n = 3).
The final uncertainty from homogeneity (ubb) is estimated as sbb or u*bb, depending on which of these is larger. This uncertainty is presented in Table 7 for every measured compound using the LC-DAD-MS/MS method. The F-test at the approximately 95 % confidence level did not detect significant differences between ampoules for any of the studied compounds. Therefore, the DON calibration solution OGP.033 can be regarded as homogeneous. The homogeneity uncertainty contribution (ubb) of 2.7 % of the main compound DON was considered to establish the overall uncertainty for the DON calibration solution (section 6.4)

RAPPORT BIPM-2020/xx
P a g e | 25 of 29
Table 7: Homogeneity uncertainty results of OGP.033 from data generated by LC-DAD (274 nm) for main compound DON and LC-MS/MS for related structure impurities DON isomer (m/z 295>265) and DOM-1 (m/z 279>249).
DON 219 nm
DON isomer (m/z 295>265)
DOM-1 (m/z 279>249)
N (df) 30 30 30 swb (%) 0.85 2.42 2.53
sbb (%) -(1) -(1) 0.53
u*bb (%) 0.27 0.79 0.82
ubb (%) or sbb (%)(2) 0.27 0.79 0.82
F 0.56 0.44 1.13 Fcrit 2.39 2.39 2.39
(1) Not calculable because MSbtw < MSwith (2) Higher value (u*bb or sbb) was taken as uncertainty estimate for potential inhomogeneity
6.4 Mass fraction value assignment and uncertainty The preparation of the calibration solution and the mass fraction assignment, wcal, are
shown in Table 8. Mettler Toledo balances AX504 and XP10002S were used for mass determinations.
Table 8. Experimental data corresponding to the preparation of the DON calibration solution and the calculated mass fraction.
DON calibration solution preparation
Weighed mass (m) Buoyancy (b) m x b
DON stock sol. (mg) 38.90 1.001369 38.953
Calibration sol. (g) 778.47 1.001386 779.536
w(stock) ± u (µg/g) 627.1 ± 9.6
wcal (µg/g) 31.3
The DON mass fraction of OGP.033, calculated according to Equation 6, was 31.33 µg/g. The associated uncertainty was calculated by considering the input quantities and related uncertainties represented in the Ishikawa diagram of Figure 11.

RAPPORT BIPM-2020/xx
P a g e | 26 of 29
𝑤𝑤𝑠𝑠𝑐𝑐𝑠𝑠 = 𝑚𝑚𝑠𝑠𝑏𝑏𝑠𝑠𝑠𝑠𝑠𝑠∙𝑏𝑏𝑠𝑠𝑏𝑏𝑠𝑠𝑠𝑠𝑠𝑠∙𝑤𝑤𝑠𝑠𝑏𝑏𝑠𝑠𝑠𝑠𝑠𝑠𝑚𝑚𝑠𝑠𝑠𝑠𝑠𝑠∙𝑏𝑏𝑠𝑠𝑠𝑠𝑠𝑠
Eq. 6
Where:
mstock: weighed mass of DON stock solution
bstock: buoyancy correction of stock solution weighing
wstock: DON mass fraction of the stock solution
msol: weighed mass of calibration solution OGP.033
bsol: buoyancy correction of calibration solution weighing
Figure 11. Ishikawa diagram indicating the input quantities contributing to the final uncertainty of the DON mass fraction of the calibration solution OGP.033.
The standard uncertainties of the input quantities of Figure 11 were combined (Eq. 7) to produce the uncertainty of the calibration solution mass fraction, u(wcal) (Table 9). The uncertainty of the stock solution already comprises the purity of the source material homogeneity and stability contributions and the weighing operations, as described in section 5.1. The evaporation uncertainty, u(V), accounts for potential solvent losses during the weighing of the stock solution and of the final solution. The buoyancy mass correction and its uncertainty were calculated as described by Reichmuth et al. (9).
𝑢𝑢(𝑤𝑤𝑠𝑠𝑐𝑐𝑠𝑠) = 𝑤𝑤𝑠𝑠𝑐𝑐𝑠𝑠 ∙
��𝑢𝑢(𝑚𝑚𝑠𝑠𝑏𝑏𝑠𝑠𝑠𝑠𝑠𝑠)𝑚𝑚𝑠𝑠𝑏𝑏𝑠𝑠𝑠𝑠𝑠𝑠
�2
+ �𝑢𝑢(𝑏𝑏𝑠𝑠𝑏𝑏𝑠𝑠𝑠𝑠𝑠𝑠)𝑏𝑏𝑠𝑠𝑏𝑏𝑠𝑠𝑠𝑠𝑠𝑠
�2
+ �𝑢𝑢(𝑤𝑤𝑠𝑠𝑏𝑏𝑠𝑠𝑠𝑠𝑠𝑠)𝑤𝑤𝑠𝑠𝑏𝑏𝑠𝑠𝑠𝑠𝑠𝑠
�2
+ �𝑢𝑢(𝑚𝑚𝑠𝑠𝑠𝑠𝑠𝑠)𝑚𝑚𝑠𝑠𝑠𝑠𝑠𝑠
�2
+ �𝑢𝑢(𝑏𝑏𝑠𝑠𝑠𝑠𝑠𝑠)𝑏𝑏𝑠𝑠𝑠𝑠𝑠𝑠
�2
+ 2 ∙ �𝑢𝑢(𝑉𝑉)𝑉𝑉�2 Eq. 7
Mass fraction stock solution
Mass Stock solution
Mass final solution
Evaporation Buoyancy
Balance
Buoyancy
Balance
Uncertainty
Mass fraction OGP.033

RAPPORT BIPM-2020/xx
P a g e | 27 of 29
Table 9. Individual uncertainty components contributing to the final combined uncertainty of OGP.024 mass fraction.
Unc. source
𝑢𝑢(𝑚𝑚𝑠𝑠𝑠𝑠𝑠𝑠𝑠𝑠𝑠𝑠)𝑚𝑚𝑠𝑠𝑠𝑠𝑠𝑠𝑠𝑠𝑠𝑠
𝑢𝑢(𝑏𝑏𝑠𝑠𝑠𝑠𝑠𝑠𝑠𝑠𝑠𝑠)𝑏𝑏𝑠𝑠𝑠𝑠𝑠𝑠𝑠𝑠𝑠𝑠
𝑢𝑢(𝑤𝑤𝑠𝑠𝑠𝑠𝑠𝑠𝑠𝑠𝑠𝑠)𝑤𝑤𝑠𝑠𝑠𝑠𝑠𝑠𝑠𝑠𝑠𝑠
𝑢𝑢(𝑚𝑚𝑠𝑠𝑠𝑠𝑠𝑠)𝑚𝑚𝑠𝑠𝑠𝑠𝑠𝑠
𝑢𝑢(𝑏𝑏𝑠𝑠𝑠𝑠𝑠𝑠)𝑏𝑏𝑠𝑠𝑠𝑠𝑠𝑠
𝑢𝑢(𝑉𝑉)𝑉𝑉
urel (%) u(wcal
) µg/g U(wcal)
µg/g (k = 2)
Value (%) 0.0468 0.0020 1.531 0.0028 0.0020 0.005 1.532 0.48 0.96
The homogeneity (Table 7, section 6.3, ubb) and stability (section 6.2, ults) uncertainty contributions of 0.27 % and 2.77 %, respectively for the main component DON obtained by LC-DAD were combined with the uncertainty u(wcal) corresponding to the gravimetric value assignment − to produce a final estimate of the mass fraction uncertainty of the calibration solution batch (Table 10).
Table 10. Combination of the uncertainty from the gravimetric value assignment, the uncertainty from between-ampoule homogeneity and the stability uncertainty to estimate the final uncertainty of the DON mass fraction in the batch of the calibration solution OGP.033.
u(wcal)rel (%) ubb (%) ults (%) u(comb)rel (%) wcal µg/g U(comb) µg/g (k = 2)
1.532 0.27 2.77 3.18 31.3 2.0
The DON mass fraction value and associated expanded uncertainty (k = 2) of the calibration solution batch OGP.033 was 31.3 ± 2.0 µg/g.
6.5 Mass fraction value verification by analytical methods The DON mass fraction value assigned gravimetrically to the calibration solution
OGP.033 was verified by independent analytical methods to gain additional confidence in the certified value. The LC-DAD-MS/MS method described in section 4 was used for this purpose. Ideally, a different DON calibrant of certified purity should be used for calibration so that results are completely independent. In the absence of such calibrant, a partially independent calibration solution was prepared from the same original source material (OGO.179). In addition, the gravimetrically prepared calibration solution OGP.033 was verified by UV spectrometry at a wavelength of 219 nm. The mass fraction was assigned independently of calibrators using a published molar extinction coefficient of ϵ(219 nm) = 6983 ± 126 L·mol-1·cm-1 in acetonitrile (5,8).
Figure 12 shows the mass fraction value verification of an ampoule of OGP.033 material. The value assigned gravimetrically (section 6.4) was compared to the analytical values obtained using the LC-DAD method and an additional UV spectrophotometry method at 219 nm detection and corresponding molar extinction coefficient. The agreement between the pairs of methods values is conveniently assessed using the degrees of equivalence (DoE):
𝐷𝐷𝐷𝐷𝐷𝐷 = 𝑤𝑤(𝑐𝑐𝑐𝑐𝑐𝑐)𝑚𝑚𝑚𝑚𝑠𝑠ℎ − 𝑤𝑤(𝑐𝑐𝑐𝑐𝑐𝑐)𝑔𝑔𝑔𝑔𝑐𝑐𝑔𝑔 Eq. 8

RAPPORT BIPM-2020/xx
P a g e | 28 of 29
where w(cal)meth and w(cal)grav are the mass fractions calculated using the analytical and the gravimetric methods, respectively.
The standard uncertainties of the gravimetric (including the homogeneity and stability components) and analytical values add in quadrature to yield the combined uncertainty of the DoE value. The expanded uncertainty bars (k = 2) crossing zero indicate the agreement of the analytical measurements (LC-DAD or UV spectrophotometry) with the gravimetrically assigned value, taking into account the uncertainty associated with each value, at an approximately 95 % confidence level.
Figure 12. Degrees of equivalence (DoE) plot between the gravimetrically assigned value of OGP.033 and the analytical values obtained by LC-DAD and UV spectrophotometric methods, respectively. Error bars represent expanded uncertainties of the DoE values (k = 2).
7. Acknowledgements The chromatography and mass spectrometry methods used in this study were
developed by the co-author of this document, Zhen Guo (NIM), in the course of his secondment at the BIPM. He also was involved in the gravimetric preparation of the DON solutions, filling, homogeneity studies and setting up stability studies. The measurements of the DON stability studies and the DON mass fraction value verification were carried out by Xianjiang Li (NIM) and Yan Gao (NIM) during their secondments at the BIPM, respectively. The support of the parent institutions in making them available for secondment to the BIPM is gratefully acknowledged.
8. References 1 BIPM CBKT programme: Safe Food and Feed in Developing Economies.

RAPPORT BIPM-2020/xx
P a g e | 29 of 29
https://wwwold.bipm.org/en/cbkt/safe-food.html 2 Miller JD, Trenholm HL. Mycotoxins in grain, 1994. Eagan Press, St Paul. 3 Betina V. Mycotoxins: Chemical, Biological and Environmental Aspects, 1993.
Elsevier, Amsterdam. 4 He,J, Zhou T, Young JC, Boland GJ, Scott PM. Chemical and biological
transformations for detoxification of trichothecene mycotoxins in human and animal food chains: a review, Trends Food Sci.Technol., 2010. Pp. 67-76. Vol. 21.
5 Westwood, S. Purity Evaluation Guideline: DON. BIPM-PEG-03. Rapport BIPM-2021/xx. Sèvres (France) : Bureau International des Poids et Mesures, 2021.
6 PubChem, Deoxynivalenol, 2021. National Institutes of Health (NIH), CID 40024 https://pubchem.ncbi.nlm.nih.gov/compound/Deoxynivalenol
7 Krska R, Schubert-Ulrich P, Josephs RD, Emteborg H, Buttinger G, Pettersson H, van Egmond HP, Schothorst RC, MacDonald S, Chan, D. Determination of molar absorptivity coefficients for major type-B trichothecenes and certification of calibrators for deoxynivalenol and nivalenol. Anal. Bioanal. Chem., 2007. pp. 1215-1226. Vol. 388.
8 Josephs RD, Derbyshire M, Stroka J, Emons H, Anklam E. Trichothecenes: reference materials and method validation. Toxicol. Let., 2004. pp. 123-122632. Vol. 153.
9 Reichmuth A, Wunderli S, Weber, Meyer R. The Uncertainty of weighing data obtained with electronic analytical balances. s.l. Microchim. Acta, 2004. pp. 133-141. Vol. 148.
10 Lamberty A, Schimmel H, Pauwels J. The study of stability of reference materials by isochronous measurements. s.l. Fresenius J. Anal. Chem., 1998. pp. 359-361. Vol. 360.
11 Linsinger TPJ, Pauwels J, van der Veen AMH, Schimmel H, Lamberty A. Homogeneity and stability of reference materials. Accred. Qual. Assur., 2001. Pp. 20-25. Vol 6.