disclaimers-space.snu.ac.kr/bitstream/10371/137890/1/000000145543.pdf · 2019-11-14 · reduced nk...
TRANSCRIPT
저 시-비 리- 경 지 2.0 한민
는 아래 조건 르는 경 에 한하여 게
l 저 물 복제, 포, 전송, 전시, 공연 송할 수 습니다.
다 과 같 조건 라야 합니다:
l 하는, 저 물 나 포 경 , 저 물에 적 된 허락조건 명확하게 나타내어야 합니다.
l 저 터 허가를 면 러한 조건들 적 되지 않습니다.
저 에 른 리는 내 에 하여 향 지 않습니다.
것 허락규약(Legal Code) 해하 쉽게 약한 것 니다.
Disclaimer
저 시. 하는 원저 를 시하여야 합니다.
비 리. 하는 저 물 리 목적 할 수 없습니다.
경 지. 하는 저 물 개 , 형 또는 가공할 수 없습니다.
THESIS FOR THE DEGREE OF
MASTER OF SCIENCE IN FOOD AND NUTRITION
Differential Effects of Vitamin D Supplementation
on Natural Killer Cell Activity in Normal and
Obese Mice
비타민 D 의 보충이 자연살해세포의 기능에 미치는 영향 :
비만 여부에 따른 차별적 효과
August 2017
Department of Food and Nutrition
Graduate School
Seoul National University
Ga Young Lee
i
Abstract
Differential Effects of Vitamin D Supplementation on
Natural Killer Cell Activity in Normal and Obese Mice
Ga Young Lee
Department of Food and Nutrition
The Graduate School
Seoul National University
Vitamin D has immunoregulatory effects on both innate and adaptive
immunity. Vitamin D has been reported to induce differentiation of
monocytes into macrophages, inhibit maturation and differentiation of
dendritic cells, and suppress adaptive immunity. There have been in vitro
studies showing contradictory results regarding the role of vitamin D on NK
cell functions, but little is known about this in vivo. The present study
investigated whether vitamin D supplementation (50, 1000, or 10000 IU/kg
of diet: DD, DC, or DS) affects NK cell functions in mice fed a control or
high fat diet (10% or 45% kcal fat: CD or HFD) for 12 weeks. NK cell
activity was assessed using radioisotope 51
Cr release assay against YAC-1
target cells and splenocyte subpopulation was measured by FACS analysis.
Intracellular expression of IFN-γ by NK cells, CD4+ T cells, and CD8
+ T
ii
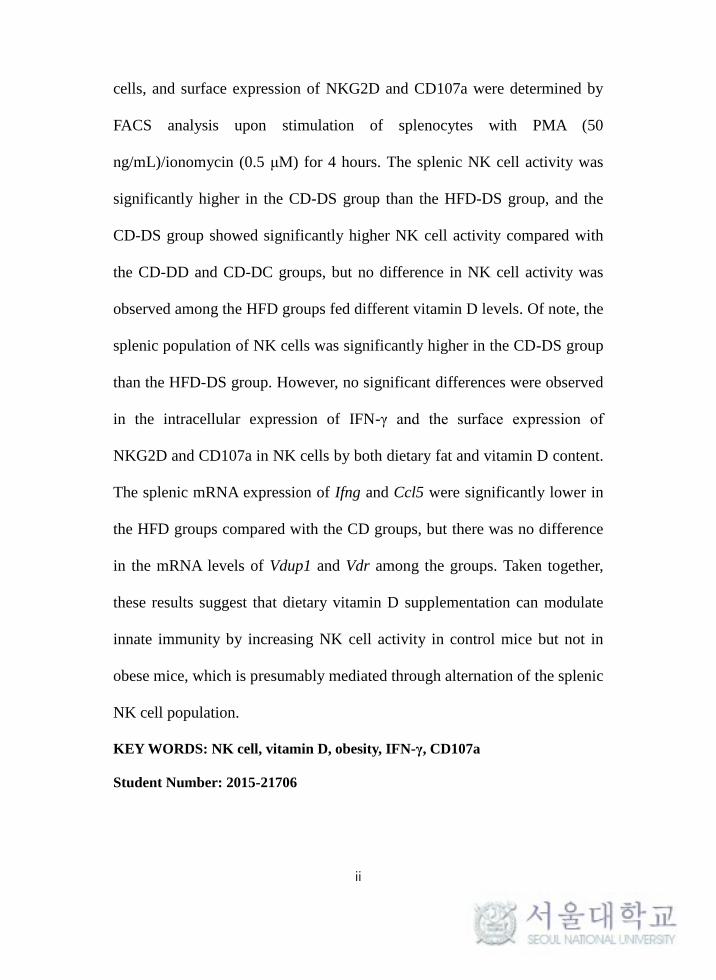
cells, and surface expression of NKG2D and CD107a were determined by
FACS analysis upon stimulation of splenocytes with PMA (50
ng/mL)/ionomycin (0.5 μM) for 4 hours. The splenic NK cell activity was
significantly higher in the CD-DS group than the HFD-DS group, and the
CD-DS group showed significantly higher NK cell activity compared with
the CD-DD and CD-DC groups, but no difference in NK cell activity was
observed among the HFD groups fed different vitamin D levels. Of note, the
splenic population of NK cells was significantly higher in the CD-DS group
than the HFD-DS group. However, no significant differences were observed
in the intracellular expression of IFN-γ and the surface expression of
NKG2D and CD107a in NK cells by both dietary fat and vitamin D content.
The splenic mRNA expression of Ifng and Ccl5 were significantly lower in
the HFD groups compared with the CD groups, but there was no difference
in the mRNA levels of Vdup1 and Vdr among the groups. Taken together,
these results suggest that dietary vitamin D supplementation can modulate
innate immunity by increasing NK cell activity in control mice but not in
obese mice, which is presumably mediated through alternation of the splenic
NK cell population.
KEY WORDS: NK cell, vitamin D, obesity, IFN-γ, CD107a
Student Number: 2015-21706
iii
Contents
Abstract ------------------------------------------------------------------------ ⅰ
Contents ------------------------------------------------------------------------ ⅲ
List of Tables ------------------------------------------------------------------ ⅵ
List of Figures ----------------------------------------------------------------- ⅶ
List of Abbreviations -------------------------------------------------------- ⅸ
Ⅰ. Introduction --------------------------------------------------------------- 1
Ⅱ. Literature Review
1. NK cells ------------------------------------------------------------------
1-1. NK cell development
1-2. NK cell receptors
1-3. Cytokine-induced activation and cytokine production by
NK cells
1-4. NK cell-mediated killing mechanisms
1) Cell apoptosis mediated by secretion of cytotoxic granules
2) Fas/Fas ligand-mediated apoptosis
1-5. NK cells and adaptive immunity
2. Obesity and NK cells --------------------------------------------------
3. Vitamin D and NK cells -----------------------------------------------
4
13
15

iv
Ⅲ. Materials and Methods
1. Animals ------------------------------------------------------------------
2. Diets ----------------------------------------------------------------------
3. Methods ------------------------------------------------------------------
3-1. Tissue collection
3-2. Splenocyte isolation
3-3. NK cell activity assay
3-4. Serum leptin measurement
3-5. FACS analysis of subpopulation of splenocytes
3-6. FACS analysis of surface expression of NKG2D and
CD107a, and intracellular expression of IFN-γ
3-7. Quantitative real-time PCR analysis
4. Statistical analysis ------------------------------------------------------
17
19
21
30
Ⅳ. Results
1. Body weight, weight change, body fat, and dietary intake -------
2. Effects of vitamin D and obesity on NK cell activity -------------
3. Effects of vitamin D and obesity on the subpopulation of
splenocytes -------------------------------------------------------------
4. Effects of vitamin D and obesity on serum leptin levels ----------
5. Effects of vitamin D and obesity on the surface expression of
NKG2D and CD107a, and intracellular expression of IFN-γ by
31
33
35
40
v
NK cells -----------------------------------------------------------------
6. Effects of vitamin D and obesity on the surface expression of
NKG2D and CD107a, and intracellular expression of IFN- γ by
T cells -------------------------------------------------------------------
7. Effects of vitamin D and obesity on the expression of genes
involved in NK cell functions ----------------------------------------
8. Effects of vitamin D and obesity on the expression of genes
involved in vitamin D metabolism ----------------------------------
42
44
46
48
Ⅴ. Discussion ----------------------------------------------------------------- 50
Ⅵ. Summary ------------------------------------------------------------------ 57
Ⅶ. References ----------------------------------------------------------------- 60
국문초록 ----------------------------------------------------------------------- 73
vi
List of Tables
Table 1. Activating and inhibitory NK cell receptors, and their
ligands in mice and human --------------------------------------
7
Table 2. Composition of the experimental diets -------------------------
Table 3. Primer sequences used in real time PCR -----------------------
Table 4. Body weight, weight change, body fat, and dietary intake of
the mice -------------------------------------------------------------
20
29
32

vii
List of Figures
Figure 1. The experimental design ----------------------------------------
Figure 2. Effects of vitamin D and obesity on NK cell activity--------
Figure 3. The subpopulation of splenocytes of mice fed with 6
different diets -----------------------------------------------------
Figure 4. Correlations between NK cell activities and spelnic NK
cell populations --------------------------------------------------
Figure 5. Effects of vitamin D and obesity on serum leptin
concentrations ----------------------------------------------------
18
34
37
39
41
Figure 6. Effects of vitamin D and obesity on the intracellular
expression of IFN-γ, and extracellular expression of
NKG2D and CD107a by NK cells ----------------------------
Figure 7. Effects of vitamin D and obesity on the intracellular
expression of IFN-γ, and extracellular expression of
NKG2D and CD107a by T cells --------------------------------
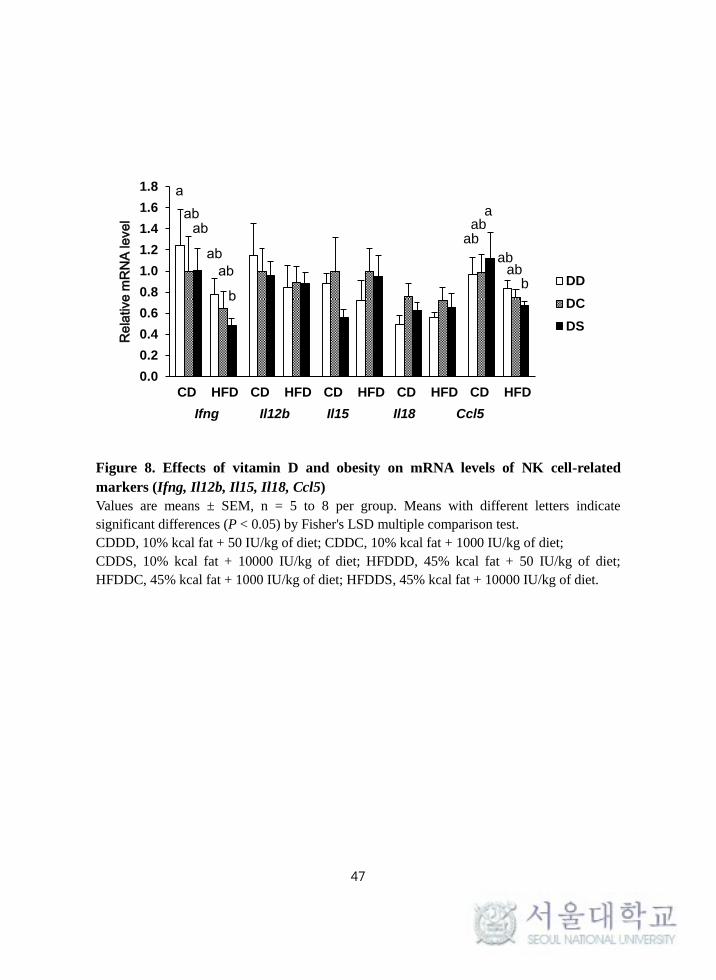
Figure 8. Effects of vitamin D and obesity on mRNA levels of NK
cell-related markers (Ifng, Il12b, Il15, Il18, Ccl5) -----------
Figure 9. Effects of vitamin D and obesity on mRNA level of
vitamin D-related markers (Vdr, Vdup1)----------------------
Figure 10. Differential effects of vitamin D supplementation on NK
43
45
47
49

viii
activity in control and obese mice------------------------------- 56

ix
List of Abbreviations
1,25-(OH)2D3, 1,25-dihydroxyvitamin D
25-(OH)D, 25-hydroxyvitamin D
Abs, antibodies
CD, control diet
FACS, fluorescence-activated cell sorting
HFD, high fat diet
IFN-γ, Interferon-γ
JAK, Janus Kinase
LAK cells, lymphokine-activated killer cells
LSD, least significant difference
NK cells, natural killer cells
PBMCs, peripheral blood mononuclear cells
STAT, signal transducer and activator of transcription
TNF, tumor necrosis factor
VDR, vitamin D receptor
VDUP1, vitamin D3 up-regulated protein 1
WAT, white adipose tissue
1
Ⅰ. Introduction
Natural killer (NK) cells are a subset of lymphocytes that are important in host
defense during the early stage of cancer development, metastasis, or virus
infection (Moretta et al. 1992; Lanier 1998; Vivier et al. 2008). Upon activation
through surface receptors such as NKG2D, NK cells release cytotoxic granules
and secrete cytokines such as Interferon-γ (IFN-γ) that can induce target cell
death (Moretta et al. 2002; Vivier et al. 2011b; Vivier et al. 2012).
Obesity is known to be associated with immune dysfunction (Krishnan et al.
1982; Lamas et al. 2004), and impaired NK cell function with obesity has been
reported in both animal and human (Jeffery et al. 1997; Smith et al. 2007; J. et al.
2015). With obesity, decreased NK cell numbers and activity (O'Shea et al. 2010;
Laue et al. 2015), and downregulation of the expression of activating receptors
(Nave et al. 2008) have been reported. Although the exact mechanisms for the
decline of NK cell functions remain unclear, it has been suggested that obesity-
induced alternation of circulating levels of adipokines such as leptin and
adiponectin can affect NK cell functionality (Wrann et al. 2012; Hubner et al.
2013). In obese individuals, plasma leptin concentration is higher than in control
weight subjects (Caro et al. 1996). While leptin receptor Ob-Rb, which mediates
the leptin signal pathway, is expressed by immune cells including NK cells, the
expression of leptin receptors and Janus kinase (JAK) and signal transducer and
2
activator of transcription (STAT) post-receptor transduction has been found to be
impaired in obese individuals (Nave et al. 2008), indicating NK cell dysfunction
in obesity.
Vitamin D has been shown to affect both adaptive and innate immunity (Mora
et al. 2008). Mice lacking vitamin D3 upregulated protein 1 (VDUP1) showed
reduced NK cytotoxicity and number of CD3-NK1.1
+ cells (Lee et al. 2005),
suggesting that vitamin D is critical for NK cell functions. However, the
relationship between VDUP1 and NK cells has still not been completely
uncovered. With in vitro treatment of 1,25-dihydroxyvitamin D [1,25-(OH)2D3],
enhanced lytic activity of NK cells has been observed against target tumor cells
(Al-Jaderi et al. 2013). Additionally, inhibitory effects of vitamin D on NK cell
activity and lymphokine-activated killer (LAK) cellular differentiation have been
reported as well (Leung 1989; Weeres et al. 2014). Overall, the effects of vitamin
D on NK cell activity are not well characterized and still remain contradictory.
While, most of the previous studies have focused on the effect of in vitro vitamin
D treatment on the functions of NK cells derived from human peripheral blood,
few studies have been conducted to examine the in vivo effect of vitamin D on
NK cell function.
Abnormality of serum vitamin D levels and dysfunction of vitamin D
metabolism have been reported in obesity (Wortsman et al. 2000; Konradsen et al.
3
2008; Ding et al. 2012; Earthman et al. 2012; Clemente-Postigo et al. 2015). A
number of clinical studies have shown that serum 25-hydroxyvitamin D [25-
(OH)D] concentration (the major circulating form of vitamin D) is lower in obese
individuals (Earthman et al. 2012), and body mass index has an inverse
correlation with serum 25-(OH)D concentration (Konradsen et al. 2008). It has
been proposed that this is partially due to decreased bioavailability of vitamin D
and greater sequestration in adipose tissue (Wortsman et al. 2000; Ding et al.
2012). Both obesity and vitamin D can affect NK cell functions and vitamin D
levels have been shown to be altered with obesity, therefore, there is a possibility
that the differential impact of vitamin D on NK cell activity is observed with
obesity.
Given the immunomodulatory capacity of vitamin D, the present study
investigated the effect of in vivo vitamin D supplementation on NK cell function
by measuring NK cell activity as well as expression of cytokine and activating
receptor, and degranulation capacity. Effects of dietary supplementation of
vitamin D on NK functions was evaluated in both control and high-fat diet
(HFD)-induced obese mice.
4
Ⅱ. Literature review
1. NK cells
Naturel killer (NK) cells are a subset of large granular lymphocyte that play a
key role in innate immune system by exerting effector functions against various
tumors and virus infections (Vivier et al. 2008). NK cells recognize infected cells
which have altered or absent MHC class I molecules and directly induce killing
of transformed cells such as tumor cells or virus-infected cells without antigen-
specific immunization (Vivier et al. 2011a). This suggest the importance of NK
cells in the host’s immune system in the early stage of cancer development and
metastasis or virus infection (Moretta et al. 1992; Lanier 1998).
1-1. NK cell development
NK cell development occurs mainly in the BM from the common lymphoid
progenitor cells with T cells and B cells (Lumeng 2012; Murphy 2012). NK cell
commitment takes place through upregulation of CD122 and NK1.1 in B6 mice
(Kim et al. 2002) and interactions with stromal cells situated in the BM regulate
gene expression of surface molecules such as cytokine receptors, integrins, and a
family of NK cell receptors (Chiossone et al. 2009).
NK cell maturation can be determined by surface phenotype as well as
functional capacity (Clinthorne et al. 2013). Following acquisition of CD49 (DX5)
in the early maturation, NK cells express CD11b and CD43, which are strongly

5
associated with the capacity to secrete IFN-γ (Effros et al. 1991). After
maturation, NK cells emigrate from BM to peripheral tissues via the blood and
are distributed to various lymphoid organs, such as spleen and LN, and non-
lymphoid organs, including liver and lung, and peripheral blood (Hayakawa et al.
2006b). In the peripheral tissues, NK cells continue maturation to adapt the
environment by upregulating killer cell lectin-like receptor G1 (KLRG1) and
downregulating CD27 and TRAIL (Hayakawa et al. 2006b). By applying the
marker CD27, NK cells can be further divided into 3 subsets in mice from early
mature NK cells CD27+CD11b
- NK cells to CD27
+CD11b
+ NK cells, followed by
CD27-CD11b
+ NK cells (Clinthorne et al. 2013).
1-2. NK cell receptors
NK cells have two distinct kinds of receptors, activating and inhibitory
receptors, which engage in regulation of NK cell effector functions (Vivier et al.
2008). NK cell activating and inhibitory receptors and their ligands present in
mice and humans are shown in the Table 1. By integrating the signals from the
activating and inhibitory receptors, NK cells regulate their functions against
target cells.
NK cell activation takes places after recognition of alternations in glycoprotein
compositions from the cell surface (Murphy 2012). The triggering of activating
receptors is accompanied by reduced signaling through inhibitory receptors and

6
this induces target cell death making it vulnerable to attack by NK cells (Smyth et
al. 2005). The typical activation receptor is NKG2D that is overexpressed upon
cellular stress or infection status, while expression is remained at low levels in
normal conditions (Vivier et al. 2008; Raulet et al. 2009).
On the contrary, after identification of ‘self’, bearing normal levels of MHC
class I molecules, NK cell activation is inhibited following recognition of
negative signals through protein tyrosine phosphatases (Murphy 2012).
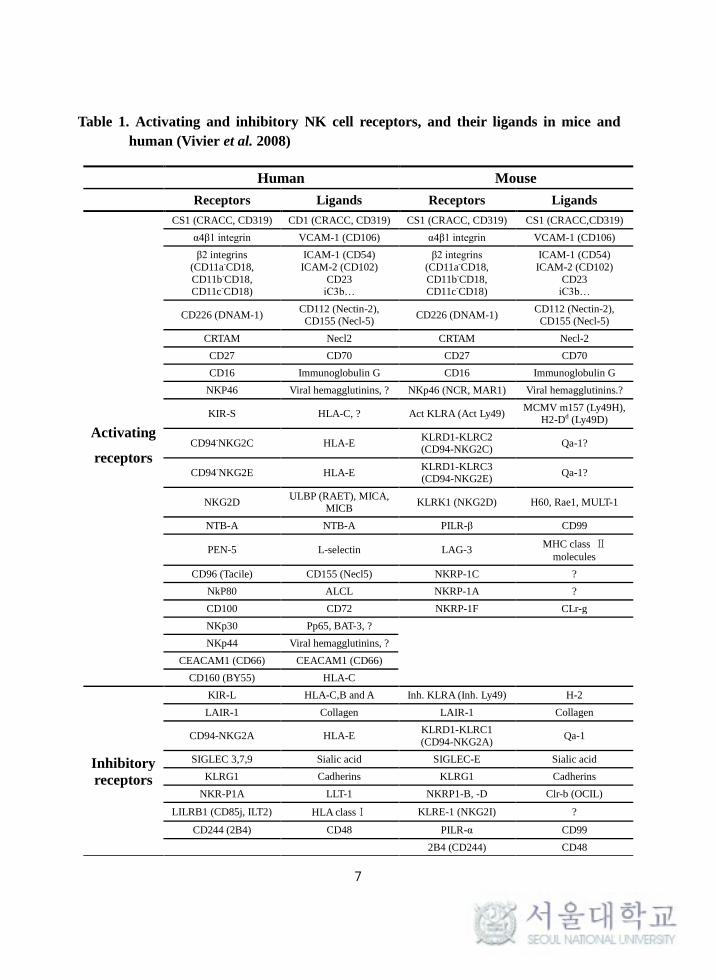
7
Table 1. Activating and inhibitory NK cell receptors, and their ligands in mice and
human (Vivier et al. 2008)
Human Mouse
Receptors Ligands Receptors Ligands
Activating
receptors
CS1 (CRACC, CD319) CD1 (CRACC, CD319) CS1 (CRACC, CD319) CS1 (CRACC,CD319)
α4β1 integrin VCAM-1 (CD106) α4β1 integrin VCAM-1 (CD106)
β2 integrins
(CD11a-CD18,
CD11b-CD18, CD11c-CD18)
ICAM-1 (CD54)
ICAM-2 (CD102)
CD23 iC3b…
β2 integrins
(CD11a-CD18,
CD11b-CD18, CD11c-CD18)
ICAM-1 (CD54)
ICAM-2 (CD102)
CD23 iC3b…
CD226 (DNAM-1) CD112 (Nectin-2),
CD155 (Necl-5) CD226 (DNAM-1)
CD112 (Nectin-2), CD155 (Necl-5)
CRTAM Necl2 CRTAM Necl-2
CD27 CD70 CD27 CD70
CD16 Immunoglobulin G CD16 Immunoglobulin G
NKP46 Viral hemagglutinins, ? NKp46 (NCR, MAR1) Viral hemagglutinins.?
KIR-S HLA-C, ? Act KLRA (Act Ly49) MCMV m157 (Ly49H),
H2-Dd (Ly49D)
CD94-NKG2C HLA-E KLRD1-KLRC2 (CD94-NKG2C)
Qa-1?
CD94-NKG2E HLA-E KLRD1-KLRC3 (CD94-NKG2E)
Qa-1?
NKG2D ULBP (RAET), MICA,
MICB KLRK1 (NKG2D) H60, Rae1, MULT-1
NTB-A NTB-A PILR-β CD99
PEN-5 L-selectin LAG-3 MHC class Ⅱ
molecules
CD96 (Tacile) CD155 (Necl5) NKRP-1C ?
NkP80 ALCL NKRP-1A ?
CD100 CD72 NKRP-1F CLr-g
NKp30 Pp65, BAT-3, ?
NKp44 Viral hemagglutinins, ?
CEACAM1 (CD66) CEACAM1 (CD66)
CD160 (BY55) HLA-C
Inhibitory
receptors
KIR-L HLA-C,B and A Inh. KLRA (Inh. Ly49) H-2
LAIR-1 Collagen LAIR-1 Collagen
CD94-NKG2A HLA-E KLRD1-KLRC1
(CD94-NKG2A) Qa-1
SIGLEC 3,7,9 Sialic acid SIGLEC-E Sialic acid
KLRG1 Cadherins KLRG1 Cadherins
NKR-P1A LLT-1 NKRP1-B, -D Clr-b (OCIL)
LILRB1 (CD85j, ILT2) HLA classⅠ KLRE-1 (NKG2I) ?
CD244 (2B4) CD48 PILR-α CD99
2B4 (CD244) CD48
8
1-3. Cytokine-induced activation and cytokine production by NK cells
Cytokines play crucial roles in NK cell activation. Interferons or cytokines
derived from macrophages are released upon viral infection and tumor cells and
function as activator of NK cells (Murphy 2012). It is shown that cytolytic
activity and IFN-γ production of NK cells are affected by a variety of cytokines
and chemokines (Vivier et al. 2012). Cytokines related with NK cell activation
are IL-2, IL-12, IL-15, IL-18, IFN-α, IFN-β and CCL-5 (Biron et al. 1999; Smyth
et al. 2005).
Conversely, activated NK cells produce various cytokines, including IFN-γ,
tumor necrosis factor (TNF)-α, IL-13, and IL-10 in response to stimulation
(Hayakawa et al. 2006a). In addition, chemokines such as CCL2, CCL3, CCL4,
CCL5 are known to be secreted by NK cells (Walzer et al. 2005), which can
influence cytolytic activity of NK cells (Robertson 2002).
9
1-4. NK cell-mediated killing mechanisms
There are diverse mechanisms that NK cells induce target cells death. Upon
activation through the integration of signals from activating and inhibitory
receptors, NK cells kill targets by releasing cytotoxic granules and by interacting
between Fas and Fas ligand (Arase et al. 1995; Lee et al. 1996; Moretta et al.
2002).
1) Cell apoptosis mediated by secretion of cytotoxic granules
The major NK cell-mediated killing mechanism is by exocytosis of cytotoxic
granules containing perforin, granzymes, and granulysin (Okada et al. 2003; Li et
al. 2008). After target cell recognition, NK cells bound via surface receptors, and
their contents penetrate the cell membrane of target cells to induce programmed
cell apoptosis (Murphy 2012).
The representative cytotoxic effector proteins are perforin and granzyme.
Perforin creates pore in target cells to disturb endosomal trafficking (Smyth et al.
2005) and assist penetration of cytotoxic granules such as granzyme B into the
cytoplasm of target cells (Murphy 2012). Granzymes are a kind of serine
proteases that trigger target cell apoptosis (Murphy 2012). Once they enter into
the cytoplasm of the targets, target cell death is induced by the release of
cytochrome c from disturbed mitochondria, DNA degradation following
activation of caspase 3, and by caspase independent pathway (Smyth et al. 2005;
10
Vivier et al. 2011a; Murphy 2012).
When lytic granules including granzymes and perforins are released from
effector cells, a degranulation marker CD107a appears on the cell surface (Bae et
al. 2013), indicating that increased expression of CD107a reflects secretion of
granzyme and perforin (Diefenbach et al. 2000).
CD107a is a surface marker of degranulation of NK cells as well as cytotoxic T
cells, and is significantly up-regulated on the surface following stimulation with
MHC-deprived target cells and with PMA/Ionomycin (Alter et al. 2004). There
are some studies which presented that CD107a is a functional marker of NK cell
activity, but the precise role of CD107a in NK cell biology still remains unclear,
suggesting the need for further studies.
2) Fas/Fas ligand-mediated apoptosis
Another well-known mechanism of target cell death by NK cells is through cell
membrane-associated Fas (CD95)-FasL (CD178) interaction (Arase et al. 1995).
Fas is a member of TNF superfamily that is expressed in a surface membrane of
cytotoxic lymphocytes including NK cells and cytotoxic T cells (Suds et al. 1993).
FAS ligands are expressed by NK cells in response to tumor target cells and
binding of FAS ligand (CD178) to FAS (CD95) creates signal which induces
death of target cells (Smyth et al. 2005). After binding of Fas ligand to the death
receptor Fas, caspases activation is induced, which initiates apoptotic
11
mechanisms in CD95-expressing target cell (Okamoto et al. 2000; Scott et al.
2009).

12
1-5. NK cells and adaptive immunity
NK cell functions are not confined to cytolytic effector capacity, but they also
act as regulatory cells interacting with other innate immune cells, including DC,
macrophage, and neutrophils (Moretta et al. 2005). IFN-γ and TNF produced by
NK cells are shown to promote maturation of DCs and their production of IL-12,
which in turn activates NK cells (Walzer et al. 2005).
NK cells are also act as an important connection between innate and adaptive
immune responses. Interaction between NK cells and antigen-presenting cells,
particularly DCs, regulates adaptive immune responses (Moretta 2002) by
enhancing antigen presentation to cytotoxic T cells. In addition, a large amount of
cytokines and chemokines secreted by NK cells in response to target cells can
form and induce adaptive immune response (Moretta 2002). Priming of CD4+ T
helper type 1 cells also can be induced by IFN-γ, a representative cytokine
produced by activated NK cells (Krebs et al. 2009). Above this, NK cell-mediated
killing impacts T cell responses by reducing antigenic load, whereas target cell
debris produced by NK cell-mediated killing might promote antigen cross-
presentation to cytotoxic T cells (Robbins et al. 2007).

13
2. Obesity and NK cells
A number of studies have shown that immune dysfunction is observed in
obesity (Lamas et al. 2004; Mancuso et al. 2006). A decreased circulating number
of NK cells and impairment of their function have been reported in obese subjects
(Lynch et al. 2008).
Obesity with excessive body fat mass is known to lead to an elevation of serum
adipokines, such as leptin and adiponectin (Krishnan et al. 1982; Hubner et al.
2013). The alternation of adipokine levels can modulate NK cell function
including NK cell activity (Hubner et al. 2013; Sabrina Wilk et al. 2013). It is
suggested that the alternation of adipokine levels might be due to decreased
activation of post-receptor signaling components such as JAK-2 (Nave et al. 2008;
Laue et al. 2015). Since obesity is related with immune dysfunction, it is
convincing that obese individuals are susceptible to infection of pathogens. This
suggest the importance of NK cells in obesity in consideration that NK cells are
the first-line in immune defensive system mobilized during an infection and
tumor genesis (Smith et al. 2007).
Decreased NK cell activity and intracellular expression of IFN-γ in NK cells of
obese human were significantly improved after body fat mass reduction by
decreasing daily energy intake and adjusting appropriate exercise program (J. et
al. 2015). In addition, reversibility of NK cell activity was observed after body

14
weight and fat mass reduction through bariatric surgery (Moulin et al. 2011).
Nevertheless, studies on the change of NK cell function in obesity have been
reported to be contradictory and tissue dependent. NK cell numbers in visceral fat
are shown to be decreased or unchanged with obesity (S. Caspar-Bauguila et al.
2005; Carine Duffaut et al. 2009). However, the cytotoxicity of NK cells in the
splenocytes was decreased but the difference were not significant (Zhigang Tian
et al. 2002).
15
3. Vitamin D and NK cells
Vitamin D performs its function by the interaction with vitamin D receptor
(VDR) acting as a transcription factor in many target cells (Ding et al. 2012).
Since VDR is found in variety of cells including immune systems, there have
been efforts to examine the biological role of vitamin D on the immune system. It
was demonstrated that vitamin D has an impact on both innate and adaptive
immunity (Mora et al. 2008). 1,25(OH)2D3 has been shown to have an inhibitory
effect in the maturation and differentiation of DC (Etten et al. 2005) and a
regulating effect in adaptive immunity by suppressing induction of Th1 cytokine
from T cells, particularly IFN-γ, while promoting Th2 immune responses by
downregulating expression of IFN-γ expression through increasing IL-4
production (Mora et al. 2008).
However, despite the importance of NK cells as the first-line of defense cells,
effects of vitamin D on NK cells have not been studied well and conflicting
reports are found.
It is reported that NK cell functions are shown to be impaired by in vitro
treatment of vitamin D. NK cell activity from CD16+ peripheral blood NK cells
are reported to be inhibited in a time- and dose-dependent manner by
1,25(OH)2D3 (Merino et al. 1989). In addition, there was a report that
1,25(OH)2D3 inhibited NK cell activity and both IFN-γ and IL-2 activation of NK
16
cell activity (Leung 1989). 1,25(OH)2D3 also showed a decrease in cytotoxicity
of NK cells derived from purified hematopoietic stem cells and in LAK cellular
differentiation (Leung 1989; Weeres et al. 2014).
On the other hand, there are observations which report stimulatory effect of in
vitro-treated vitamin D on NK cells. It was reported that NK cell-mediated
cytotoxicity was enhanced by 1,25(OH)2D3 treatment from control subjects
(Quesada et al. 1995). There was a study that the cytotoxicity of lymphokine-
activated killer (LAK) cells was increased by 1,25(OH)2D3 (Ravid et al. 1993).
Moreover, patients with chronic renal failure accompanied by defective NK cell-
mediated activity was corrected by 1,25(OH)2D3 administration (Quesada et al.
1995).
Overall, the relationship between NK cells and vitamin D still remains
inconclusive, suggesting the need for further investigation.

17
Ⅲ. Materials and methods
1. Animals
Five week-old male C57BL/6 mice (Central Animal Laboratory, Seoul, Korea)
were housed in an specific pathogen free room under controlled temperature (23
± 1°C), relative humidity (50 ± 10%), and light/dark cycle (12-h dark/12-h light
6:00AM-6:00PM). After 5 days of acclimation on the control diet, mice were
randomly divided into 6 groups and fed diets differing in fat amount and vitamin
D content for 12 weeks.
The experimental design and breeding process were shown briefly in Figure 1.
Dietary intake was measured 4 times per week and body weight was measured
once a week. At the end of the experimental period, mice were fasted for 12 h and
euthanized by CO2 asphyxiation. All experimental procedures were conducted
according to the protocols approved by the Institutional Animal Care and Use
Committee of Seoul National University (approval No. SNU-160329-1).
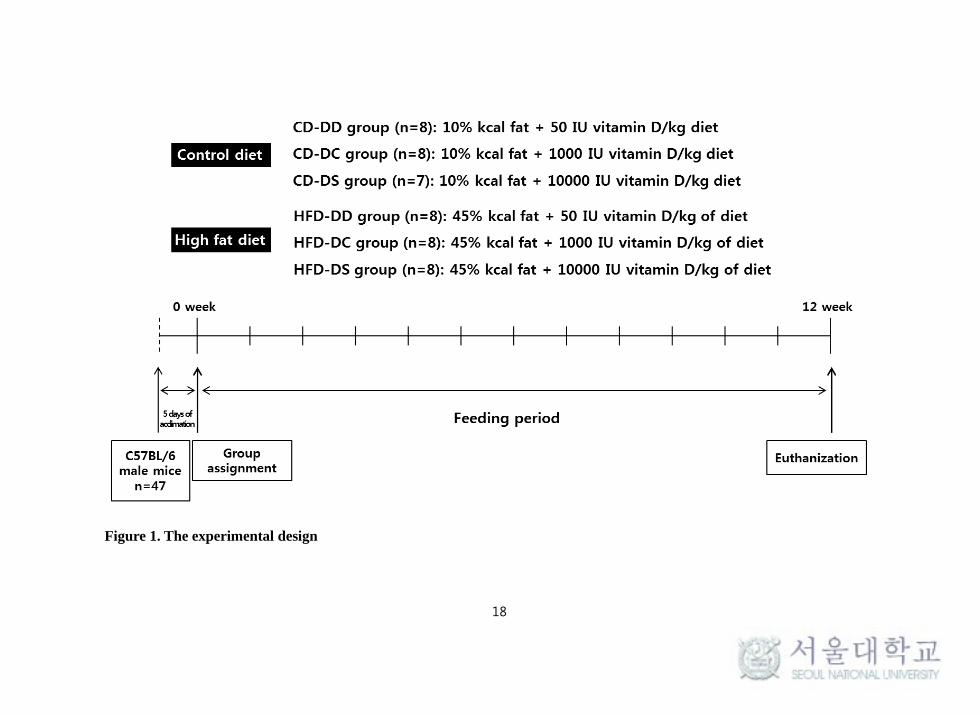
18
Figure 1. The experimental design
19
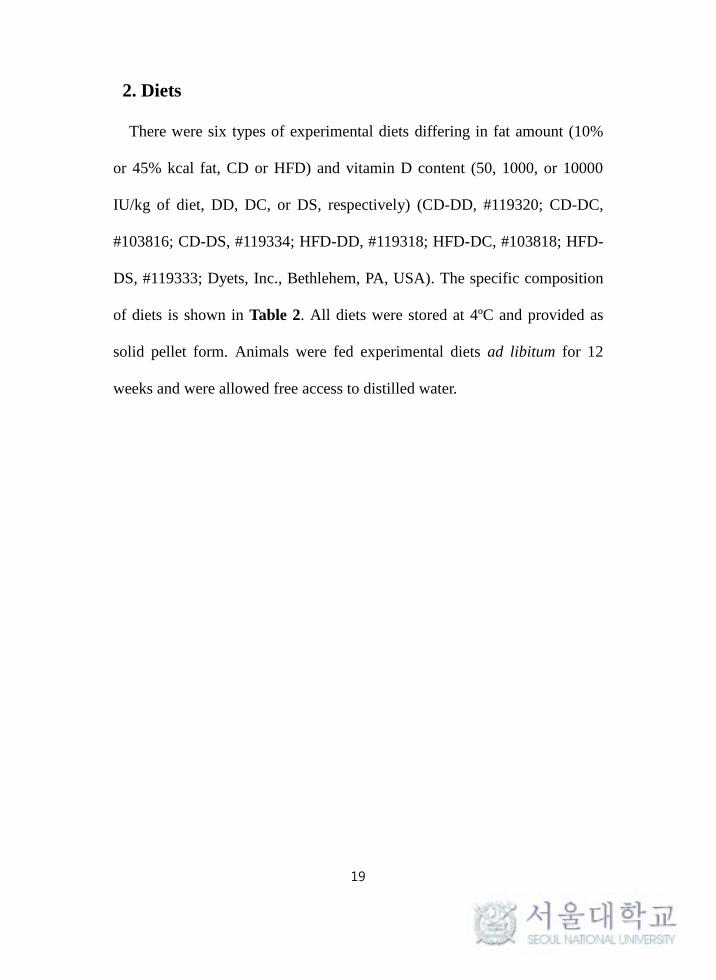
2. Diets
There were six types of experimental diets differing in fat amount (10%
or 45% kcal fat, CD or HFD) and vitamin D content (50, 1000, or 10000
IU/kg of diet, DD, DC, or DS, respectively) (CD-DD, #119320; CD-DC,
#103816; CD-DS, #119334; HFD-DD, #119318; HFD-DC, #103818; HFD-
DS, #119333; Dyets, Inc., Bethlehem, PA, USA). The specific composition
of diets is shown in Table 2. All diets were stored at 4ºC and provided as
solid pellet form. Animals were fed experimental diets ad libitum for 12
weeks and were allowed free access to distilled water.

20
Table 2. Composition of the experimental dietsa
CD-DD
(10% kcal
fat + 50
IU/kg of
diet)
CD-DC
(10% kcal
fat + 1000
IU/kg of
diet)
CD-DS
(10% kcal
fat + 10000
IU/kg of
diet)
HFD-DD
(45% kcal
fat + 50
IU/kg of
diet)
HFD-DC
(45% kcal
fat + 1000
IU/kg of
diet)
HFD-DS
(45% kcal
fat + 10000
IU/kg of
diet)
Casein (g) 200 200 200 200 200 200
L-Cystine (g) 3 3 3 3 3 3
Sucrose (g) 350 350 350 172.8 172.8 172.8
Cornstarch (g) 315 315 315 72.8 72.8 72.8
Dyetrose (g) 35 35 35 100 100 100
Soybean Oil (g) 45 45 45 45 45 45
t-BHQ (g) 0.009 0.009 0.009 0.009 0.009 0.009
Lard (g) - - - 157.5 157.5 157.5
Cellulose (g) 50 50 50 50 50 50
Mineral Mix (g)b 35 35 35 35 35 35
Vitamin Mix (g)
(No vit D) 10 - 10 10 - 10
Vitamin Mixc (g) - 10 - - 10 -
Vit D3 Premix
(100IU/g) 0.5 - - 0.5 - -
Vit D3
(400,000IU/g) - - 0.025 - - 0.025
Choline
Bitartrate (g) 2 2 2 2 2 2
Total (g) 1045.5 1045 1045 848.6 848.1 848.1
Kcal/g of diet 3.86 3.86 3.86 3.94 3.94 3.94
aResource: Dyets, Inc., Bethlehem, PA, USA
b35 g of mineral mix (Dyets, #200000) provides 5.2 g calcium, 4 g phosphorus, 3.6 g
potassium, 1 g sodium, 1.6 g chloride, 0.3 g sulfur, 0.5 g magnesium, 35 mg iron, 6 mg
copper, 54 mg manganese, 30 mg zinc, 2 mg chromium, 0.2 mg iodine, 0.1 mg selenium,
and 4.2 g sucrose. c10 g of vitamin mix (Dyets, #300050) provides 4000 IU vitamin A, 1000 IU vitamin D3,
50 IU vitamin E, 30 mg niacin, 16 mg pantothenic acid, 7 mg vitamin B6, 6 mg vitamin
B1, 6 mg vitamin B2, 2mg folic acid, 0.8 mg menadione, 0.2 mg biotin, 10 μg vitamin
B12, and 9.8 g sucrose.
21
3. Methods
3-1. Tissue collection
After euthanizing mice by CO2 asphyxiation, blood samples were
collected by cardiac puncture and serum was isolated by centrifugation at
2000 rpm for 20 min, after which serum was stored at –80°C following
coagulation at room temperature for 2 hrs. White adipose tissue (WAT),
including perirenal, intraperitoneal, epididymal, and subcutaneous fat were
collected, weighed, and stored at –80°C. Spleen was dissected out and
splenocytes were isolated.
22
3-2. Splenocyte isolation
After aseptic removal, spleen was put into sterile RPMI 1640 (Lonza,
walkersvile, MD, USA) medium supplemented with 100,000 U/L of
penicillin (GibcoBRL, Grand Island, NY, USA), 100 mg/L of streptomycin
(GibcoBRL), 25 mmol/L of HEPES (Sigma Aldrich, St. Louis, MO, USA)
and 2 mmol/L of L-glutamin (GibcoBRL) (complete RPMI). A single-cell
suspension of splenocytes was prepared by homogenization of the spleen
with sterile frosted glass slides. Splenocytes were separated via
centrifugation (700 rpm) to remove tissue debris, and red blood cells were
lysed using Gey’s solution. Isolated splenocytes were washed twice and
their viability was determined by the trypan blue exclusion test, after which
they were suspended in complete RPMI medium supplemented with 10%
FBS at 1ⅹ107 cells/mL for further analysis.
23
3-3. NK cell activity assay
NK cell activity was measured using the radioisotope 51
Cr release assay
against YAC-1 target cells. YAC-1 cells (a molony leukemia virus-induced
murine lymphoma cell line) were purchased from the Korean Cell Line
Bank (Seoul, Korea). The cells were incubated with 51
Cr (Perkin Elmer Life
and Analytical Sciences, Boston, MA, USA) (25 μCi /106 cells) for 90 min
at 37°C and 5% CO2 by gently swirling every 15 min, and were washed
twice and incubated for 30 min at 37°C. The labeled YAC-1 cells were
added to diluted splenocytes in a 96-well round bottom plate to make final
effector cell:target cell (E:T) ratios of 100:1, 50:1, 25:1, and 12.5:1.
Spontaneous release (SR) was measured by the amount of 51
Cr released
from the target cells alone and maximum release (MR) was measured as the
amount of 51
Cr after incubation with 5% Triton-X solution. 100 μL of cell
supernatant was collected and radioactivity was measured with an automatic
gamma counter (2470 WIZARD 2, Perkin Elmer, Shelton, CT, USA). NK
cell activity was shown as lysis percentage: percent specific release =
(experimental release – spontaneous release) / (maximum release –
spontaneous release)ⅹ100. aaaaaaaaaaaaaaaaaaaaaaaaaaaaaaaaaaaaaaa
24
3-4. Serum leptin measurement
Serum leptin concentrations were measured by enzyme linked
immunosorbent assay (Quantikine ELISA kit; R&D Systems, Minneapolis,
MN, USA) according to the manufacturer’s instructions.
25
3-5. FACS analysis of subpopulation of splenocytes
For the analysis of the splenocyte subpopulations, isolated splenocytes
were resuspended in fluorescence-activated cell sorting (FACS)-staining
buffer (0.09% sodium azide, 1% FBS, 1ⅹPBS based) at a concentration of
1ⅹ107 cells/mL. A total of 2ⅹ10
6 cells/sample were stained with
antibodies (Abs) against cell-surface markers for 30 min at 4°C. The Abs
used for staining the subpopulations were as follows: FITC-conjugated anti-
mouse CD3 Molecular Complex, PE-conjugated anti-mouse NK-1.1, APC-
conjugated anti-mouse CD11b, APC-conjugated anti-mouse CD4, PE-
conjugated anti-mouse CD8, PE-conjugated anti-mouse CD19, and PE-
conjugated anti-mouse F4/80, all from BD Pharmingen, San Diego, CA,
USA. After incubation, cells were washed and resuspended in FACS-
staining buffer and then analyzed using FACSCalibur II (BD Biosciences,
SA, USA) and FlowJo software version 10 (Tree Star Inc., Ashland, OR).
26
3-6. Surface expressions of NKG2D and CD107a, and intracellular
expression of IFN-γ
To analyze the surface expression of NKG2D and CD107a and the
intracellular expression of IFN-γ, splenocytes were stimulated in complete
medium with 50 ng/mL of PMA (Sigma Aldrich) and 0.5 μM of ionomycin
(Sigma Aldrich) for 4 h in the presence of BD GolgiStop™ protein transport
inhibitor containing monensin (BD Biosciences). Cells were harvested and
resuspended in FACS-staining buffer, and a total of 2ⅹ106 cells/sample
were labeled with surface-staining Abs, which were as follows: FITC-
conjugated anti-mouse CD3 Molecular complex, APC-conjugated anti-
mouse NK-1.1, APC-conjugated anti-mouse CD4, and PE-conjugated anti-
mouse CD8a, all from BD Pharmingen. Cells were incubated at 4°C for 30
min with the surface-staining Abs, fixed, then permeabilized with BD
Cytofix/Cytoperm™ Plus Fixation/Permeabilization Kit. Cells were stained
with Abs or corresponding isotype-matched Abs, which were as follows:
PE-conjugated Rat IgG1, κ isotype control; PE-conjugated Rat IgG2a, κ
isotype control; PE-conjugated anti-mouse IFN-γ; PE-conjugated anti-
mouse CD314 (NKG2D); and PE-conjugated anti-mouse CD107a; all from
BD Pharmingen, San Diego, CA, USA. After incubation at 4°C for 30 min,
cells were fixed with fixer containing 4 % formaldehyde and washed to
preserve them until analysis with FACSCalibur II and FlowJo software

27
version 10 (Tree Star Inc).
28
3-7. Quantitative real-time PCR analysis
Splenocytes were used to extract total RNA with RNAiso Plus (Takara,
Otsu, Shiga, Japan) following stimulation with 50 ng/mL of PMA (Sigma
Aldrich) and 0.5 μM of ionomycin (Sigma Aldrich) for 4 h. RNA sample
quality was tested with a Gel Doc XR system (Bio-Rad Laboratories,
Hercules, CA, USA) and concentration of the samples was determined using
a spectrophotometer (DU530, BECKMAN, Fullerton, CA, USA) by
measuring their absorbance at 260 and 280 nm. Isolated RNA was reverse
transcribed into cDNA using PrimeScript™ 1st strand cDNA synthesis kit
(Takara Bio Inc., Otsu, Shiga, Japan) and a 2720 thermal cycler (Applied
Biosystems, Foster City, CA, USA). Quantitative RT-PCR was conducted
with a StepOne™ Real-time PCR system (Applied Biosystems). Each PCR
reaction mixture included reverse transcribed cDNA, SYBR Premix Ex Ta,
ROX reference dye (Takara Bio Inc), and specific forward and reverse
primers. Relative expression levels of the genes were calculated by the 2-
ΔCt method and adjusted with Gapdh used as a housekeeping gene. Primer
sequences used for RT-PCR are shown in Table 3.
29
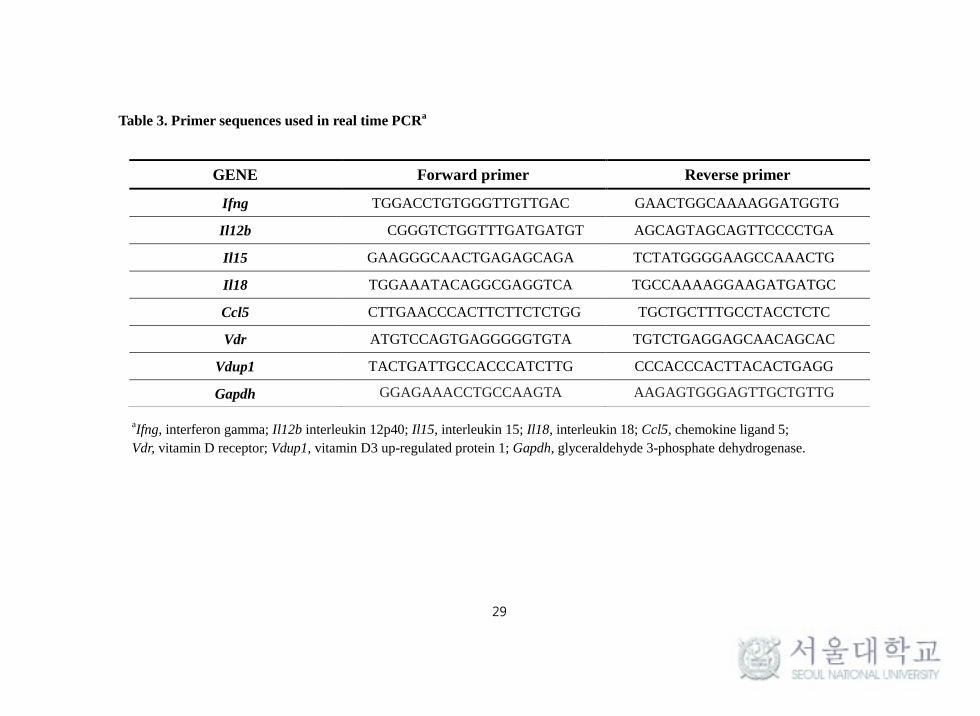
Table 3. Primer sequences used in real time PCRa
aIfng, interferon gamma; Il12b interleukin 12p40; Il15, interleukin 15; Il18, interleukin 18; Ccl5, chemokine ligand 5;
Vdr, vitamin D receptor; Vdup1, vitamin D3 up-regulated protein 1; Gapdh, glyceraldehyde 3-phosphate dehydrogenase.
GENE Forward primer Reverse primer
Ifng TGGACCTGTGGGTTGTTGAC GAACTGGCAAAAGGATGGTG
Il12b CGGGTCTGGTTTGATGATGT AGCAGTAGCAGTTCCCCTGA
Il15 GAAGGGCAACTGAGAGCAGA TCTATGGGGAAGCCAAACTG
Il18 TGGAAATACAGGCGAGGTCA TGCCAAAAGGAAGATGATGC
Ccl5 CTTGAACCCACTTCTTCTCTGG TGCTGCTTTGCCTACCTCTC
Vdr ATGTCCAGTGAGGGGGTGTA TGTCTGAGGAGCAACAGCAC
Vdup1 TACTGATTGCCACCCATCTTG CCCACCCACTTACACTGAGG
Gapdh GGAGAAACCTGCCAAGTA AAGAGTGGGAGTTGCTGTTG
30
4. Statistical analysis
All statistical analyses were carried out using SPSS statistical software
version 21.0 (IBM SPSS Statistics, Chicago, IL, USA). All data were
represented as means ± SEM. Significant differences (P < 0.05) were
determined using a two-way ANOVA test to evaluate the overall effect of
vitamin D and fat amount, followed by Fisher’s least significant difference
(LSD) post-hoc test to compare differences between the individual groups.
Pearson’s correlation test was performed to analyze any correlations
between the variables.

31
Ⅳ. Results
1. Body weight, weight change, body fat, and dietary intake
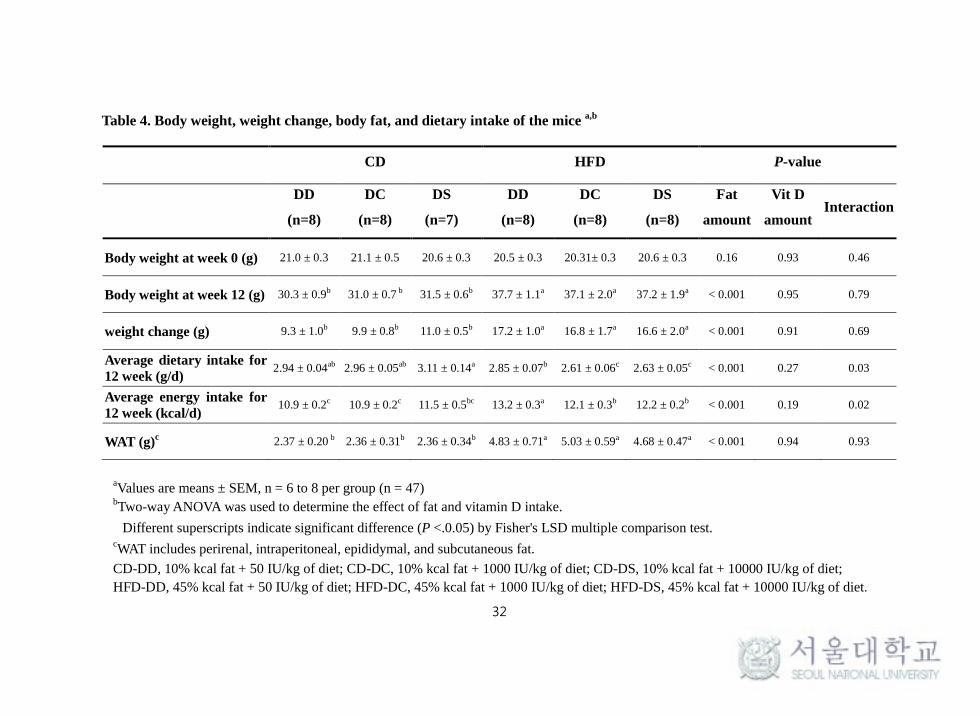
After 12 weeks of feeding, body weight (P < 0.001), weight change (P <
0.001), and WAT weights (P < 0.001) were significantly higher in HFD
groups compared with CD groups, but there was no significant effect of
vitamin D. The average dietary intake for 12 weeks (g/day) was
significantly lower in the HFD groups (P < 0.001), whereas the average
energy intake was significantly higher in the HFD groups compared with the
CD groups (P < 0.001) because of a higher percentage of fat amount in the
high fat diet. However, no significant differences in food intake were
observed regarding vitamin D levels (Table 4).
32
Table 4. Body weight, weight change, body fat, and dietary intake of the mice a,b
aValues are means ± SEM, n = 6 to 8 per group (n = 47)
bTwo-way ANOVA was used to determine the effect of fat and vitamin D intake.
Different superscripts indicate significant difference (P <.0.05) by Fisher's LSD multiple comparison test. cWAT includes perirenal, intraperitoneal, epididymal, and subcutaneous fat.
CD-DD, 10% kcal fat + 50 IU/kg of diet; CD-DC, 10% kcal fat + 1000 IU/kg of diet; CD-DS, 10% kcal fat + 10000 IU/kg of diet;
HFD-DD, 45% kcal fat + 50 IU/kg of diet; HFD-DC, 45% kcal fat + 1000 IU/kg of diet; HFD-DS, 45% kcal fat + 10000 IU/kg of diet.
CD HFD P-value
DD
(n=8)
DC
(n=8)
DS
(n=7)
DD
(n=8)
DC
(n=8)
DS
(n=8)
Fat
amount
Vit D
amount Interaction
Body weight at week 0 (g) 21.0 ± 0.3 21.1 ± 0.5 20.6 ± 0.3 20.5 ± 0.3 20.31± 0.3 20.6 ± 0.3 0.16 0.93 0.46
Body weight at week 12 (g) 30.3 ± 0.9b 31.0 ± 0.7 b 31.5 ± 0.6b 37.7 ± 1.1a 37.1 ± 2.0a 37.2 ± 1.9a < 0.001 0.95 0.79
weight change (g) 9.3 ± 1.0b 9.9 ± 0.8b 11.0 ± 0.5b 17.2 ± 1.0a 16.8 ± 1.7a 16.6 ± 2.0a < 0.001 0.91 0.69
Average dietary intake for
12 week (g/d) 2.94 ± 0.04ab 2.96 ± 0.05ab 3.11 ± 0.14a 2.85 ± 0.07b 2.61 ± 0.06c 2.63 ± 0.05c < 0.001 0.27 0.03
Average energy intake for
12 week (kcal/d) 10.9 ± 0.2c 10.9 ± 0.2c 11.5 ± 0.5bc 13.2 ± 0.3a 12.1 ± 0.3b 12.2 ± 0.2b < 0.001 0.19 0.02
WAT (g)c 2.37 ± 0.20 b 2.36 ± 0.31b 2.36 ± 0.34b 4.83 ± 0.71a 5.03 ± 0.59a 4.68 ± 0.47a < 0.001 0.94 0.93

33
2. Effects of vitamin D and obesity on NK cell activity
There was an interaction between fat amount and vitamin D levels regarding
NK cell activity at E:T ratios of 100:1 (P = 0.006) and 50:1 (P = 0.033). NK cell
activity was significantly enhanced by vitamin D supplementation in the CD
groups at E:T ratios of 100:1 (P = 0.006) and 50:1 (P = 0.042). However, these
differences were not found in mice fed the HFD. The CD-DS group showed
significantly higher NK cell activity compared with the HFD-DS group at E:T
ratios of 100:1 (P < 0.001), 50:1 (P < 0.001), and 12.5:1 (P = 0.036), and tended
to be higher at E:T ratios of 25:1 compared with the HFD-DS group (P = 0.053)
(Figure 2).

34
Figure 2. Effects of vitamin D and obesity on NK cell activity
Values are means ± SEM, n = 6 to 8 per group. Means with different letters indicate
significant differences (P < 0.05) by Fisher's LSD multiple comparison test.
CD-DD, 10% kcal fat + 50 IU/kg of diet; CD-DC, 10% kcal fat + 1000 IU/kg of diet;
CD-DS, 10% kcal fat + 10000 IU/kg of diet; HFD-DD, 45% kcal fat + 50 IU/kg of diet;
HFD-DC, 45% kcal fat + 1000 IU/kg of diet; HFD-DS, 45% kcal fat + 10000 IU/kg of diet.
0.0
2.0
4.0
6.0
8.0
10.0
12.0
14.0
16.0
CD HFD CD HFD CD HFD CD HFD
% K
illi
ng
100:1 50:1 25:1 12.5:1
Effector : Target cells ratio
DD
DC
DS
b
b
a
b
b
b
b
b
a
b
b
b ab
ab
a
ab ab
b
35
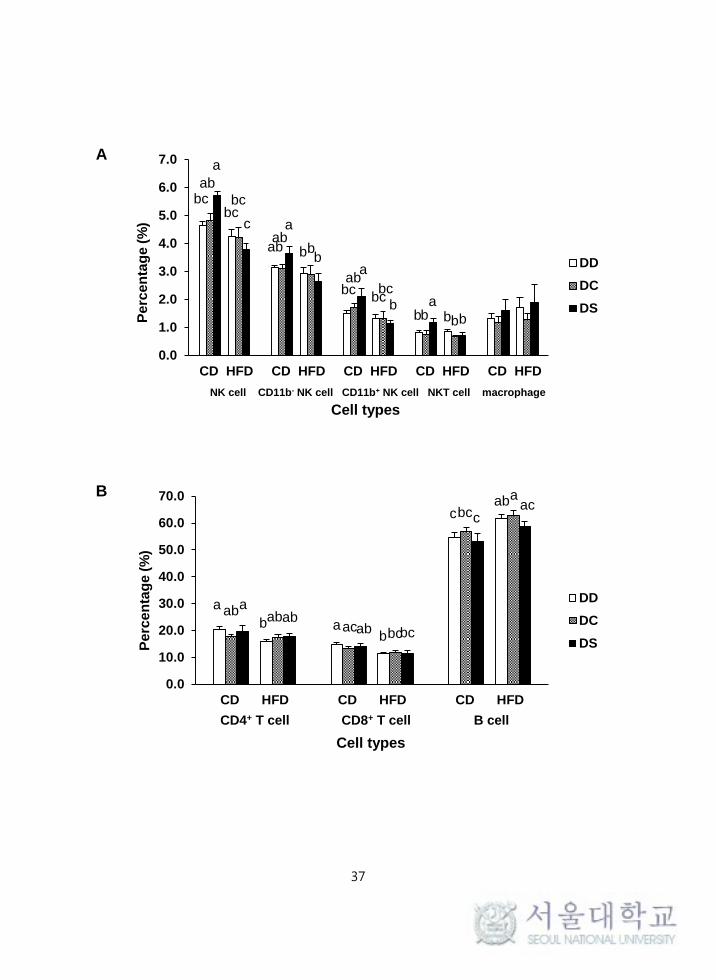
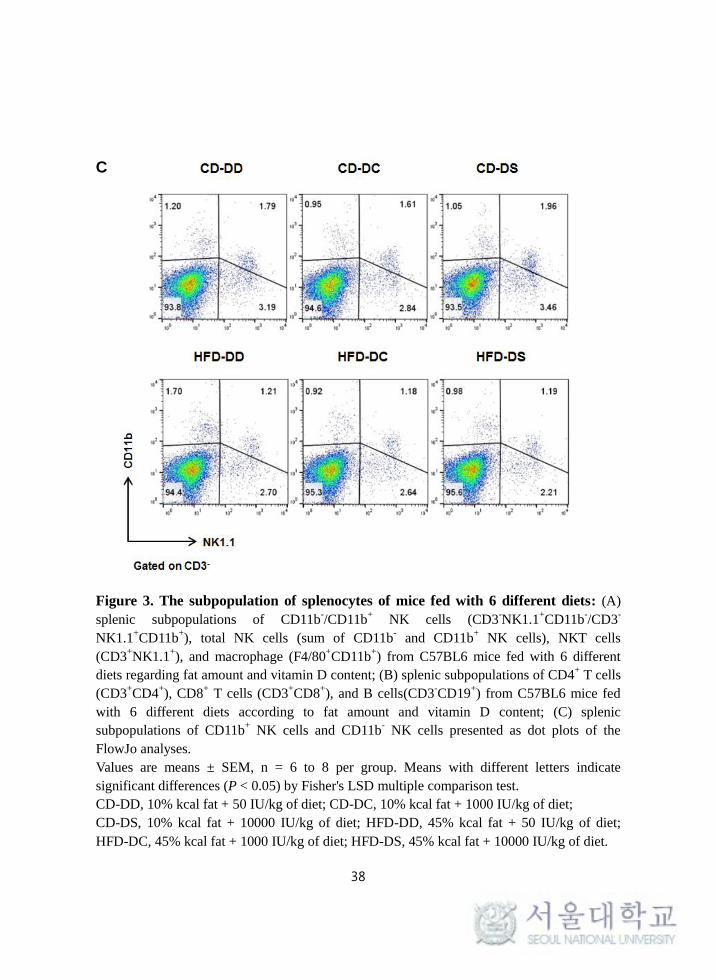
3. Effects of vitamin D and obesity on the splenocyte
subpopulations
Percentages of total splenic NK cells (CD3-NK1.1
+), immature NK cells (CD3
-
NK1.1+CD11b
-), and mature NK cells (CD3
-NK1.1
+CD11b
+) were significantly
lower in the HFD groups compared with the CD groups (P = 0.017, P = 0.001
and P = 0.001, respectively), whereas there was no statistical difference regarding
vitamin D levels. Mice in the CD-DS group had significantly higher percentages
of CD11b- NK cells, CD11b
+ NK cells, and total NK cells compared to mice in
the HFD-DS group (P = 0.006, P = 0.001, P < 0.001, respectively) (Figure 3-A,
C).
The percentages of other immune cells including NKT cells, CD4+ T cells,
CD8+ T cells, and B cells were significantly different among the groups (Figure
3-A, B). There was an interaction between fat amount and vitamin D levels in the
percentage of splenic NKT cells (P = 0.045) and the percentage of NKT cells in
the spleen was significantly lower in the HFD groups compared with the CD
groups. Furthermore, mice in the CD-DS group had a significantly higher
percentage of NKT cells compared to mice in the HFD-DS group (P = 0.002).
The percentages of CD4+ T (P = 0.042) and CD8
+ T cells (P = 0.001) in the
spleen were significantly lower in the HFD groups compared with the CD groups,
while the percentage of B cells (P < 0.001) was significantly higher in HFD
36
groups compared with CD groups. There were no significant differences in
percentages of splenic CD4+ T, CD8
+ T, and B cells according to different vitamin
D levels, and no significant difference in the percentage of splenic macrophages
was observed regardless of different dietary treatments.
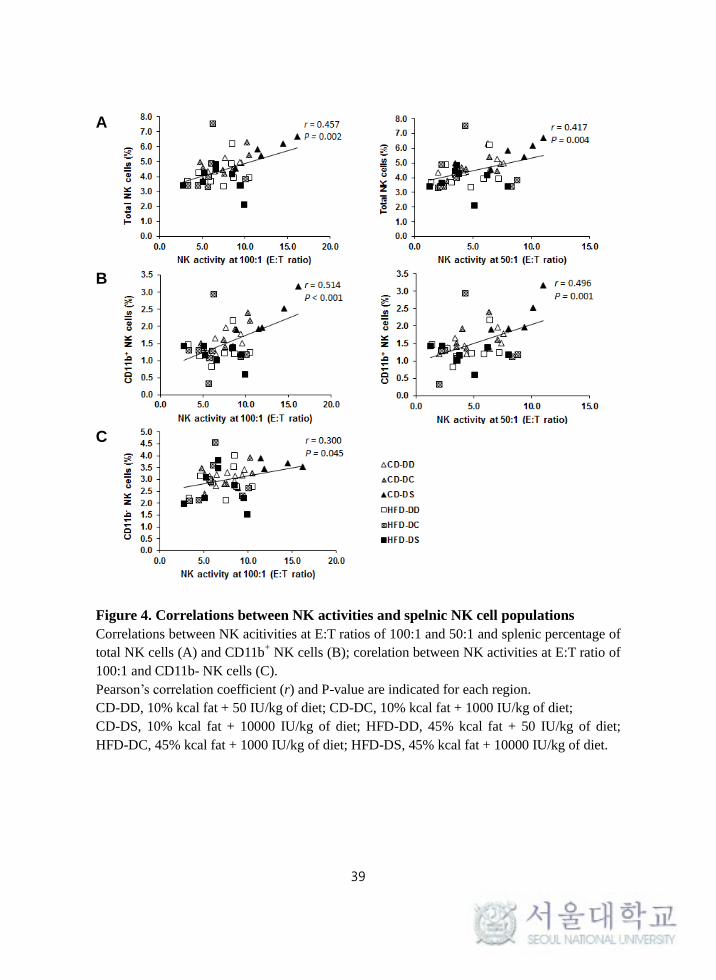
Positive correlations were observed between the percentage of total splenic NK
cells and NK cell activity at E:T ratios of 100:1 (r = 0.457, P = 0.002) and 50:1 (r
= 0.417, P = 0.004). The percentages of splenic CD11b+ NK cells and NK cell
activity at E:T ratios of 100:1 (r = 0.514, P < 0.001) and 50:1 (r = 0.496, P =
0.001) showed significantly positive correlations. In addition, the percentage of
splenic CD11b- NK cells correlated positively with NK cell activity at E:T ratios
of 100:1 (r = 0.300, P = 0.045) (Figure 4).
37
A
B
0.0
1.0
2.0
3.0
4.0
5.0
6.0
7.0
CD HFD CD HFD CD HFD CD HFD CD HFD
Pe
rce
nta
ge
(%
)
NK cell CD11b- NK cell CD11b+ NK cell NKT cell macrophage
DD
DC
DS
Cell types
bc ab
a
bc bc
c
ab ab
a
b b b
bc ab
a
bc bc
b b b
a
b b b
0.0
10.0
20.0
30.0
40.0
50.0
60.0
70.0
CD HFD CD HFD CD HFD
Pe
rce
nta
ge
(%
)
CD4+ T cell CD8+ T cell B cell
DD
DC
DS
a ab a
b ab ab a ac ab
b bc bc
ac a ab
c c bc
Cell types
38
C
Figure 3. The subpopulation of splenocytes of mice fed with 6 different diets: (A)
splenic subpopulations of CD11b-/CD11b
+ NK cells (CD3
-NK1.1
+CD11b
-/CD3
-
NK1.1+CD11b
+), total NK cells (sum of CD11b
- and CD11b
+ NK cells), NKT cells
(CD3+NK1.1
+), and macrophage (F4/80
+CD11b
+) from C57BL6 mice fed with 6 different
diets regarding fat amount and vitamin D content; (B) splenic subpopulations of CD4+ T cells
(CD3+CD4
+), CD8
+ T cells (CD3
+CD8
+), and B cells(CD3
-CD19
+) from C57BL6 mice fed
with 6 different diets according to fat amount and vitamin D content; (C) splenic
subpopulations of CD11b+ NK cells and CD11b
- NK cells presented as dot plots of the
FlowJo analyses.
Values are means ± SEM, n = 6 to 8 per group. Means with different letters indicate
significant differences (P < 0.05) by Fisher's LSD multiple comparison test.
CD-DD, 10% kcal fat + 50 IU/kg of diet; CD-DC, 10% kcal fat + 1000 IU/kg of diet;
CD-DS, 10% kcal fat + 10000 IU/kg of diet; HFD-DD, 45% kcal fat + 50 IU/kg of diet;
HFD-DC, 45% kcal fat + 1000 IU/kg of diet; HFD-DS, 45% kcal fat + 10000 IU/kg of diet.
39
A
B
C
Figure 4. Correlations between NK activities and spelnic NK cell populations
Correlations between NK acitivities at E:T ratios of 100:1 and 50:1 and splenic percentage of
total NK cells (A) and CD11b+ NK cells (B); corelation between NK activities at E:T ratio of
100:1 and CD11b- NK cells (C).
Pearson’s correlation coefficient (r) and P-value are indicated for each region.
CD-DD, 10% kcal fat + 50 IU/kg of diet; CD-DC, 10% kcal fat + 1000 IU/kg of diet;
CD-DS, 10% kcal fat + 10000 IU/kg of diet; HFD-DD, 45% kcal fat + 50 IU/kg of diet;
HFD-DC, 45% kcal fat + 1000 IU/kg of diet; HFD-DS, 45% kcal fat + 10000 IU/kg of diet.
40
4. Effects of vitamin D and obesity on serum leptin levels
Serum leptin concentrations were significantly higher in mice fed the HFD
compared with those fed with control diets (P < 0.001). The level of vitamin D in
the diet did not have a significant effect on leptin levels (Figure 5). Serum leptin
level showed significant positive correlations with weight change (r = 0.887, P <
0.001) and WAT weight (r = 0.939, P < 0.001) (data not shown).

41
Figure 5. Effects of vitamin D and obesity on serum leptin concentrations
Values are means ± SEM, n = 6 per group. Means with different letters indicate significant
differences (P < 0.05) by Fisher's LSD multiple comparison test.
CD-DD, 10% kcal fat + 50 IU/kg of diet; CD-DC, 10% kcal fat + 1000 IU/kg of diet;
CD-DS, 10% kcal fat + 10000 IU/kg of diet; HFD-DD, 45% kcal fat + 50 IU/kg of diet;
HFD-DC, 45% kcal fat + 1000 IU/kg of diet; HFD-DS, 45% kcal fat + 10000 IU/kg of diet.
0.0
10.0
20.0
30.0
40.0
50.0
60.0
70.0
CD HFD
Lep
tin
(n
g/m
L)
DD
DC
DS
a
a
a
b b b
42
5. Effects of vitamin D and obesity on the surface expression of
NKG2D and CD107a, and intracellular expression of IFN-γ by
NK cells
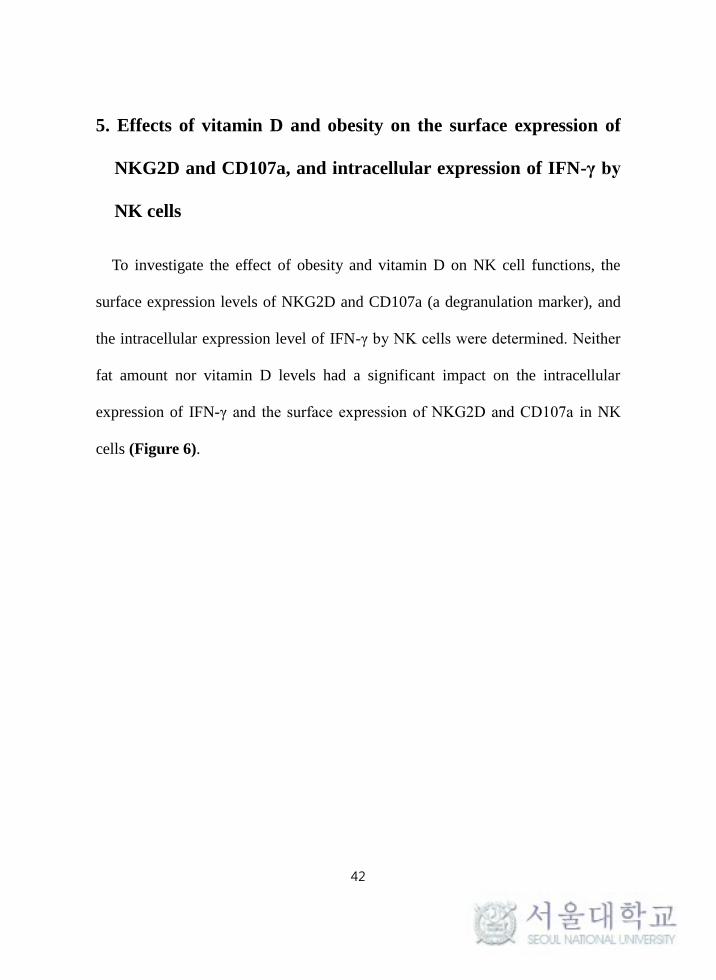
To investigate the effect of obesity and vitamin D on NK cell functions, the
surface expression levels of NKG2D and CD107a (a degranulation marker), and
the intracellular expression level of IFN-γ by NK cells were determined. Neither
fat amount nor vitamin D levels had a significant impact on the intracellular
expression of IFN-γ and the surface expression of NKG2D and CD107a in NK
cells (Figure 6).
43
Figure 6. Effects of vitamin D and obesity on the intracellular expression of IFN-γ,
and extracellular expression of NKG2D and CD107a by NK cells
Values are means ± SEM, n = 6 to 8 per group.
CD-DD, 10% kcal fat + 50IU/kg of diet; CD-DC, 10% kcal fat + 1000 IU/kg of diet;
CD-DS, 10% kcal fat + 10000 IU/kg of diet; HFD-DD, 45% kcal fat + 50 IU/kg of diet;
HFD-DC, 45% kcal fat + 1000 IU/kg of diet; HFD-DS, 45% kcal fat + 10000 IU/kg of diet.
0.0
10.0
20.0
30.0
40.0
50.0
60.0
CD HFD CD HFD CD HFD
% o
f N
K c
ell
s
IFN-γ NKG2D CD107a
DD
DC
DS
44
6. Effects of vitamin D and obesity on the surface expression of
NKG2D and CD107a, and intracellular expression of IFN-γ by
T cells
The intracellular expression of IFN-γ and extracellular expression of NKG2D
and CD107a were determined to examine the effect of HFD-induced obesity and
vitamin D on the cytolytic function of T cells. The surface expression of CD107a
by CD8+ T cells was significantly lowered by vitamin D (P = 0.023). The surface
expression of CD107a by CD8+ T cells was significantly higher in CD-DD group
compared with CD-DS group. In addition, the surface expression of CD107a
tended to be lower in HFD groups compared with CD groups (P = 0.057) (Figure
7-A). However, the intracellular expression of IFN-γ by CD4+ T cells, CD8
+ T
cells, and NKT cells and the surface expression of NKG2D by CD4+ T cells,
CD8+ T cells, and NKT cells were not significantly different among the groups
(Figure 7-A, B).
45
A
B
Figure 7. Effects of vitamin D and obesity on the intracellular expression of IFN-γ,
and extracellular expression of NKG2D and CD107a by T cells: (A) intracellular
expression of IFN-γ by CD4+ T cells, CD8
+ T cells, and NKT cells, and surface expression of
CD107a by NKT cells and (B) surface expression of NKG2D by CD4 T+ cells, CD8
+ T cells,
and NKT cells.
Values are means ± SEM, n = 4 to 6 per group. Means with different letters indicate
significant differences (P < 0.05) by Fisher's LSD multiple comparison test.
CD-DD, 10% kcal fat + 50 IU/kg of diet; CD-DC, 10% kcal fat + 1000 IU/kg of diet;
CD-DS, 10% kcal fat + 10000 IU/kg of diet; HFD-DD, 45% kcal fat + 50 IU/kg of diet;
HFD-DC, 45% kcal fat + 1000 IU/kg of diet; HFD-DS, 45% kcal fat + 10000 IU/kg of diet.
0.0
5.0
10.0
15.0
20.0
25.0
30.0
35.0
40.0
45.0
50.0
CD HFD CD HFD CD HFD CD HFD
perc
en
tag
e (
%)
IFN-γ+CD4 T cell IFN-γ+CD8 T cell IFN-γ+NKT cell CD107a+CD8 T cell
DD
DC
DS
Cell types
a ab abc
abc c
bc
0.0
10.0
20.0
30.0
40.0
50.0
60.0
CD HFD CD HFD CD HFD
perc
en
tag
e (
%)
NKG2D+CD4 T cell NKG2D+CD8 T cell NKG2D+NKT cell
DD
DC
DS
Cell types

46
7. Effects of vitamin D and obesity on the expression of genes
involved in NK cell functions
In order to examine the effect of obesity and vitamin D on cytokines and
chemokines involved with the functions of NK cells, expression of Ifng, Il12b,
Il15, Il18, and Ccl5 genes were determined from PMA/Ionomycin-stimulated
splenocytes. The HFD groups had lower mRNA levels of Ifng (P = 0.030) and
Ccl5 (P = 0.017) compared with the CD groups, whereas there was no significant
difference in terms of vitamin D levels. The CD-DS group had significantly
higher mRNA expression of Ccl5 compared with the HFD-DS group. However,
the mRNA levels of Il12b, Il15, and Il18 were not significantly different among
the groups (Figure 8).
47
Figure 8. Effects of vitamin D and obesity on mRNA levels of NK cell-related
markers (Ifng, Il12b, Il15, Il18, Ccl5)
Values are means ± SEM, n = 5 to 8 per group. Means with different letters indicate
significant differences (P < 0.05) by Fisher's LSD multiple comparison test.
CDDD, 10% kcal fat + 50 IU/kg of diet; CDDC, 10% kcal fat + 1000 IU/kg of diet;
CDDS, 10% kcal fat + 10000 IU/kg of diet; HFDDD, 45% kcal fat + 50 IU/kg of diet;
HFDDC, 45% kcal fat + 1000 IU/kg of diet; HFDDS, 45% kcal fat + 10000 IU/kg of diet.
0.0
0.2
0.4
0.6
0.8
1.0
1.2
1.4
1.6
1.8
CD HFD CD HFD CD HFD CD HFD CD HFD
Re
lative m
RN
A le
ve
l
Ifng Il12b Il15 Il18 Ccl5
DD
DC
DS
ab
a ab
ab
ab b
a
ab ab
ab
ab
b
48
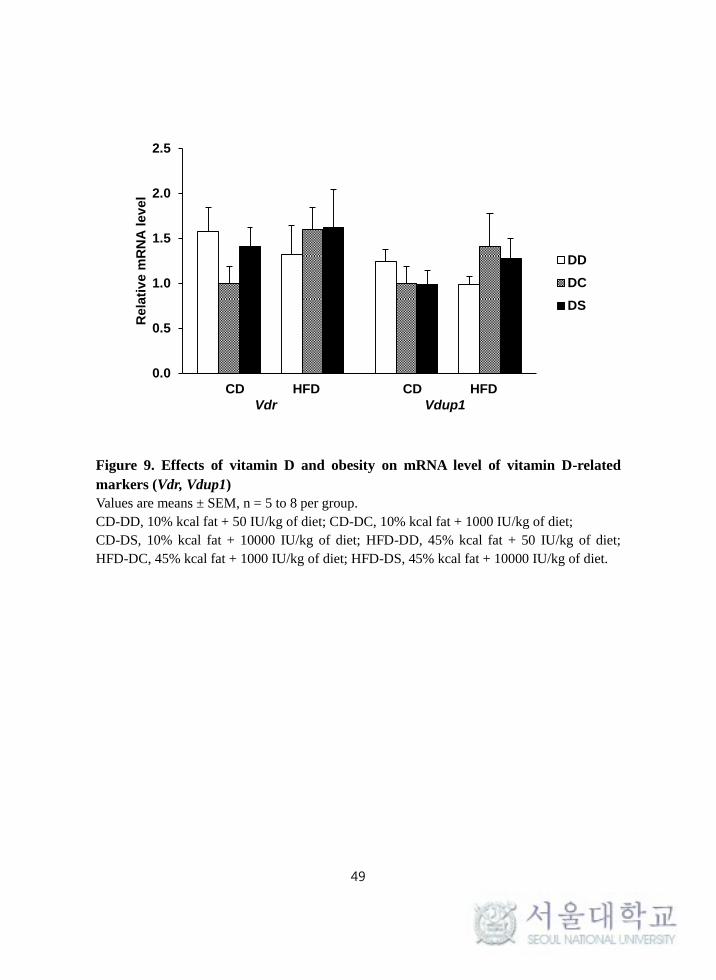
8. Effects of vitamin D and obesity on the expression of genes
involved in vitamin D metabolism
To determine whether the expression of vitamin D-related genes were affected
by vitamin D and obesity, splenic mRNA levels of Vdr and Vdup1 were
determined from splenocytes following stimulation with PMA/Ionomycin. Gene
expression of Vdr and Vdup1 were not affected by obesity or vitamin D (Figure
9).
49
Figure 9. Effects of vitamin D and obesity on mRNA level of vitamin D-related
markers (Vdr, Vdup1)
Values are means ± SEM, n = 5 to 8 per group.
CD-DD, 10% kcal fat + 50 IU/kg of diet; CD-DC, 10% kcal fat + 1000 IU/kg of diet;
CD-DS, 10% kcal fat + 10000 IU/kg of diet; HFD-DD, 45% kcal fat + 50 IU/kg of diet;
HFD-DC, 45% kcal fat + 1000 IU/kg of diet; HFD-DS, 45% kcal fat + 10000 IU/kg of diet.
0.0
0.5
1.0
1.5
2.0
2.5
CD HFD CD HFD
Rela
tiv
e m
RN
A l
ev
el
Vdr Vdup1
DD
DC
DS
50
Ⅴ. Discussion
This study demonstrates that vitamin D supplementation has differential effects
on NK cell activity depending on the adiposity. Vitamin D supplementation
enhanced splenic NK cell activity in the control mice but not in the HFD-induced
obese mice. This enhancement of NK cell activity might have been caused by the
increased percentages of the splenocyte subpopulations of total NK cells, CD11b+
NK cells, and CD11b- NK cells in control mice supplemented with vitamin D.
The effects of vitamin D regarding NK cell function has been investigated by
other researchers, but contradictory results have been reported. In some in vivo
studies, NK cell cytotoxicity and IFN-γ secretion by NK cells derived from
hematopoietic stem cells and peripheral blood mononuclear cells (PBMCs) were
inhibited by 1,25-(OH)2D3 in a dose-dependent manner (Leung 1989; Weeres et
al. 2014). On the other hand, 1,25-(OH)2D3 has been shown to increase the
activity of NK cells derived from PBMCs, LAK cells, and NK YT cells (Ravid et
al. 1993; Balogh et al. 1999; Al-Jaderi et al. 2013). Different types of NK cells
such as primary NK cells and an NK cell-line were used in the studies, which
might explain the conflicting reports among the studies. Only few studies have
examined the in vivo effect of vitamin D on NK cell activity. NK cells undergo
maturation in the developmental stage from immature (CD11b-) to mature
(CD11b+) NK cells (Clinthorne et al. 2013), and the present study showed that the
51
splenic population of CD11b- as well as CD11b
+ NK cells was significantly
higher in the CD-DS group compared with the HFD-DS group. This result
suggests that alternation in percentage of the NK cell subpopulation possibly
contributed to the increased NK cell activity with vitamin D supplementation in
lean mice. While vitamin D enhanced NK cell activity in the control mice, there
was no significant effect of vitamin D supplementation on NK cell activity in the
HFD-induced obese mice, and in line with previous studies, it has been reported
that serum leptin levels were significantly higher in the obese mice compared to
the control mice (Nave et al. 2008; Park et al. 2013; Bahr et al. 2017). NK cells
incubated with leptin for a short time (18 h) has been reported to show increased
NK cell activity, but a relatively long incubation period of over 72 h resulted in
impaired NK cell proliferation and cytotoxicity through down-regulation of the
JAK-STAT signaling pathway (Wrann et al. 2012; Naylor et al. 2016). Chronic
exposure to higher leptin levels in obese mice could have contributed to the
decreased percentage of splenic NK cells as well as NK cell reactiveness to
vitamin D supplementation, resulting in different responses to vitamin D
supplementation between the CD and HFD groups.
In this study, no significant differences were observed in the surface expression
of NKG2D and CD107a, or the intracellular expression of IFN-γ by NK cells
after vitamin D supplementation. Not many studies have been performed to
52
elucidate the relationship between vitamin D and the expression of IFN-γ,
NKG2D, and CD107a by NK cells. Nevertheless, it has been proposed that the
expression of IFN-γ by human NK cells is suppressed by 1,25-(OH)2D3 in a dose-
dependent manner (Leung 1989). The surface expression of NKp30, NKp46, and
NKG2D by NK cells have been reported to be unaffected by supplementation
with in vitro 1,25-(OH)2D3 (Weeres et al. 2014). In one clinical study, the
expression of CD107a in NK cells from the PBMCs in women was
downregulated by 1,25-(OH)2D3 when co-cultured with K562 cells (Merino et al.
1989). However, these studies are different from the present study due to the in
vitro treatment of vitamin D.
Furthermore, the present study showed that the surface expression of CD107a
by CD8+ T cells was significantly lowered by vitamin D. Since CD107a is a
surface marker for the degranulation of cytotoxic T cells as well as NK cells
(Alter et al. 2004), its decreased surface expression suggests impaired cytotoxic
activity of CD8+ T cells against target cells. Alterations in adaptive immune
responses by vitamin D treatment have been reported which is in line with
findings from this study. It has been demonstrated that 1,25-(OH)2D3 suppresses
granzyme A expression via suppression of the Th1 cytokine response (Vidyarani
et al. 2009). In a VDR knockout mouse model, CD8+ cytotoxic T cells produced
less granzyme B (Yuzefpolskiy et al. 2014), suggesting decrease in degranulation
53
and consequential release of the cytotoxic granules by CD8 T cells in the absence
of vitamin D signal.
IFN-γ is known to be produced by both NK and T cells (Balogh et al. 1999),
and CCL-5, which is known to increase the cytolytic activity of NK cell, is
produced by activated NK cells (Robertson 2002), T cells, and endothelium
platelets (Muthian et al. 2006). The results from the present study showed that the
mRNA levels of Ifng and Ccl5 in splenocytes were significantly lower in HFD-
induced obese mice. However, this result doesn’t represent the mRNA expression
exclusively by NK cells since the population of NK cells was about 4.8% of the
total splenocytes, and T cells (31.2%) and B cells (56.7%) comprise the major
population. Rather, it can be explained that the difference in the mRNA
expression level of Ifng with obesity was due to the impact of obesity on T cells.
The sum of CD4+ and CD8
+ T cell population in the spleen was 6.9 % lower in
the HFD group than the CD group. Since both CD4+ T cells and CD8
+ T cells
express IFN-γ, lower splenic subpopulation of these cells in the HFD group could
influence mRNA expression of Ifng in the obese mice resulting in lower Ifng
expression.
The expression levels of Ifng and Ccl5 in visceral adipose tissue have been
reported to be higher in obese mice compared with control mice (Sell et al. 2012).
However, the expression of IFN-γ in splenic NK cells did not show any
54
significant differences between obese and lean mice (Lee et al. 2016). In the
initial obesity-induced inflammatory phase, chemokines such as Ccl5 recruits T
and B lymphocytes to sites of inflammation, and following the local
inflammatory responses, proinflammatory Th1 cytokines such as Ifng are
produced for M1 macrophage recruitment (Kintscher et al. 2008; Rocha et al.
2008; Winer et al. 2011). Therefore, the expression of Ifng and Ccl5 can be up-
regulated through this lymphocyte infiltration. The expression of Ifng and Ccl5 in
the immune cells might be different from the expression of these in response to
the inflammatory reactions within and immune cell infiltration into adipose tissue.
There were no significant effects of vitamin D or fat amount on mRNA levels
of Vdr and Vdup1. 1,25-(OH)2D3 acts on immune cells to exert its effect by
binding to VDRs (Haussler et al. 2011). It was demonstrated that the expression
of Vdrs was higher in the WAT from obese patients compared to control subjects
following the supplementation of vitamin D (Clemente-Postigo et al. 2015; Lee et
al. 2016), but few studies have focused on Vdr expression in the splenocytes after
supplementation of vitamin D. It has been suggested that the expression of Vdrs is
induced by 1,25-(OH)2D3 treatment of monocytes and macrophages (Mora et al.
2008), but there have been conflicting reports concerning whether it has a direct
effect on the Vdr expression by T and B cells (Veldman et al. 2000; Chen et al.
2007; Mora et al. 2008). In regard to VDUP-1, reduced NK cell activity, number
55
of CD3-NK1.1+ cells, and IFN-γ expression of NK cells have been reported in
VDUP-1 knock out mice (Lee et al. 2005), suggesting that vitamin D can affect
NK cell functions. However, little is known and further investigation still needed
into the effect of in vivo supplementation of VDUP-1 and NK cell functions.
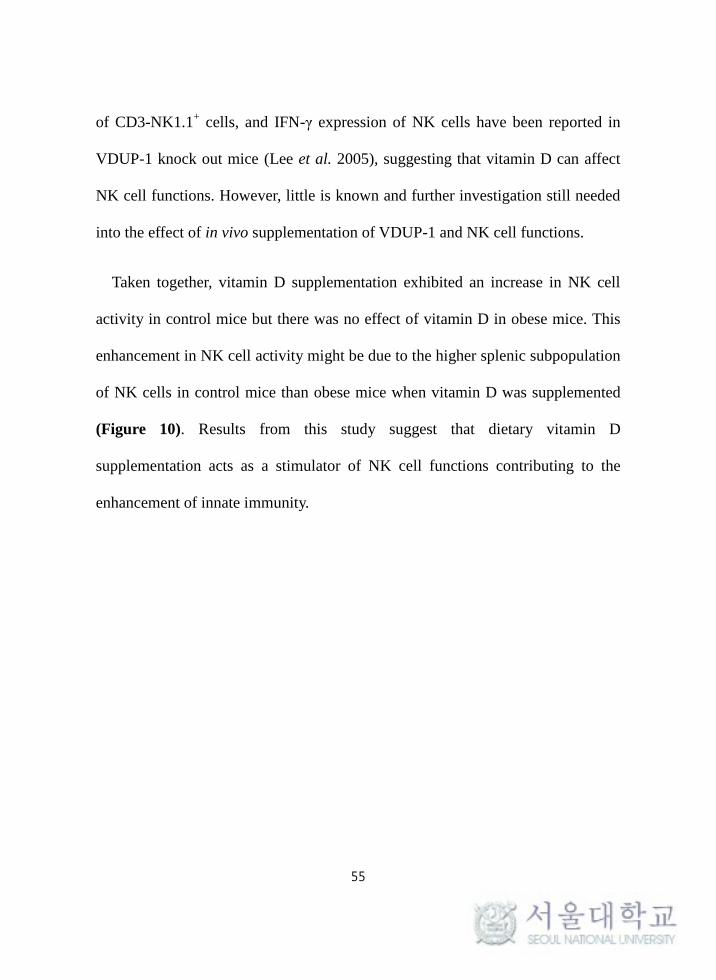
Taken together, vitamin D supplementation exhibited an increase in NK cell
activity in control mice but there was no effect of vitamin D in obese mice. This
enhancement in NK cell activity might be due to the higher splenic subpopulation
of NK cells in control mice than obese mice when vitamin D was supplemented
(Figure 10). Results from this study suggest that dietary vitamin D
supplementation acts as a stimulator of NK cell functions contributing to the
enhancement of innate immunity.
56
Figure 10. Differential effects of vitamin D supplementation on NK cell activity in control and obese mice
57
VI. SUMMARY
The present study investigated the effect of vitamin D and obesity on NK
cell functions. After feeding mice for 12 weeks with diets differed in fat
amount (10% or 45% kcal fat, CD or HFD) and vitamin D content (50, 1000,
10000 IU/kg of diet, DD, DC, or DS), body weight, weight change, WAT
weights, and serum leptin level were measured. In addition, NK cell activity,
subpopulation of splenocytes, surface expression of NKG2D, CD107a,
intracellular expression of IFN-γ by NK cells and T cells, and markers
involved in NK cell function and vitamin D metabolism were analyzed. The
results of the study were as follows.
1) The HFD groups had significantly higher body weight, weight gain, and
WAT weights compared with the CD groups. In addition, the HFD
groups had significantly higher serum leptin level compared to the CD
groups.
2) NK cell activity was significantly higher in the CD-DS group than the
HFD-DS group, and the CD-DS group showed significantly higher NK
cell activity compared with the CD-DD and CD-DC groups, but no
difference in NK cell activity was observed among the HFD groups fed
different vitamin D levels.
3) Splenic percentages of total NK cells, CD11b- NK cells, and CD11b
+
58
NK cells were significantly lower in HFD groups compared with the CD
groups. Total NK cells and CD11b+ NK cells showed higher splenic NK
cell percentages in the CD-DS group compared to the CD-DD group.
Positive correlations were observed between splenic percentage of NK
cells and NK cell activity.
4) The percentage of NKT cells in the spleen was significantly higher in
the CD-DS group than the HFD-DS group, and the CD-DS group
showed significantly higher splenic percentages compared with the CD-
DD and CD-DC groups. The percentages of CD4+ T cells and CD8
+ T
cells in the spleen were significantly lower in the HFD groups compared
with the CD groups, while the percentage of B cells was significantly
higher in the HFD groups compared with the CD groups. No significant
differences were shown in splenic percentages of CD4+ T cells, CD8
+ T
cells, and B cells according to different vitamin D levels.
5) Intracellular expression of IFN-γ and surface expressions of NKG2D
and CD107a in NK cells were not influenced by different fat amount
and vitamin D levels.
6) The surface expression of CD107a by CD8+ T cells was significantly
lowered by vitamin D, and tended to have lower surface expression of
CD107a in the HFD groups compared with CD groups.
59
7) The HFD groups had lower mRNA levels of Ifng and Ccl5 compared
with the CD groups, whereas there was no significant difference in
terms of vitamin D levels. However, mRNA levels of Il12b, Il15, and
Il18 were not significantly different among groups. Gene expression of
Vdr and Vdup1 were also not influenced by obesity or vitamin D.
These results suggest that vitamin D supplementation increased NK cell
activity in control mice but not in obese mice. This enhancement of NK cell
activity might be mediated through alternation of the splenic NK cell
population.
60
Ⅶ. References
Al-Jaderi Z and Maghazachi AA. "Effects of vitamin D3, calcipotriol and
FTY720 on the expression of surface molecules and cytolytic activities
of human natural killer cells and dendritic cells." Toxins (Basel) 2013,
5(11): 1932-1947.
Alter G, Malenfant JM, and Altfeld M. "CD107a as a functional marker for
the identification of natural killer cell activity." J Immunol Methods
2004, 294(1-2): 15-22.
Arase H, Arase N, and Saito T. "Fas-mediated Cytotoxicity by Freshly
Isolated Natural Killer Cells." J Exp Med 1995, 181: 1235-1238.
Bae S, Oh K, Kim H, Kim HR, Hwang YI, Lee DS, Kang JS, and Lee WJ.
"The effect of alloferon on the enhancement of NK cell cytotoxicity
against cancer via the up-regulation of perforin/granzyme B secretion."
Immunobiol 2013, 218(8): 1026-1033.
Bahr I, Goritz V, Doberstein H, Hiller GG, Rosenstock P, Jahn J, Portner O,
Berreis T, Mueller T, Spielmann J, and Kielstein H. "Diet-induced
Obesity Is Associated with an Impaired NK Cell Function and an
Increased Colon Cancer Incidence." J Nutr Metab 2017, 2017: 4297025.
Balogh G, B. ARd, Boland R, and Barja P. "Effect of 1,25(OH)2-Vitamin
D3 on the Activation of Natural Killer Cells, Role of Protein Kinase C
and Extracellular Calcium." Exp Mol Pathol 1999, 67: 63-74.
61
Biron CA, Nguyen KB, Pien GC, Cousens LP, and Salazar-Mather TP.
"Natural killer cells in antiviral defense: Function and Regulation by
Innate Cytokines." Annu Rev Immunol 1999, 17: 189-220.
Carine Duffaut, Jean Galitzky, Max Lafontan, and Bouloumié A.
"Unexpected trafficking of immune cells within the adipose tissue
during the onset of obesity." Biochem Biophys Res Commun 2009,
384(4): 482-485.
Caro JF, Kolaczynski JW, Nyce MR, Ohannesian JP, Opentanova I,
Goldman WH, Lynn RB, Zhang P-L, Sinha MK, and Considine RV.
"Decreased cerebrospinal-fluid/serum leptin ratio in obesity: a possible
mechanism for leptin resistance." The Lancet 1996, 348(9021): 159-161.
Chen S, Sims GP, Chen XX, Gu YY, and Lipsky PE. "Modulatory effects of
1,25-dihydroxyvitamin D3 on Human B Cell Differentiation." J
Immunol 2007, 179(3): 1634-1647.
Chiossone L, Chaix J, Fuseri N, Roth C, Vivier E, and Walzer T.
"Maturation of mouse NK cells is a 4-stage developmental program."
Blood 2009, 113: 5488-5496.
Clemente-Postigo M, Munoz-Garach A, Serrano M, Garrido-Sanchez L,
Bernal-Lopez MR, Fernandez-Garcia D, Moreno-Santos I, Garriga N,
Castellano-Castillo D, Camargo A, Fernandez-Real JM, Cardona F,
Tinahones FJ, and Macias-Gonzalez M. "Serum 25-hydroxyvitamin D
62
and adipose tissue vitamin D receptor gene expression: relationship
with obesity and type 2 diabetes." J Clin Endocrinol Metab 2015,
100(4): E591-595.
Clinthorne JF, Beli E, Duriancik DM, and Gardner EM. "NK cell maturation
and function in C57BL/6 mice are altered by caloric restriction." J
Immunol 2013, 190(2): 712-722.
Diefenbach A, Jamieson AM, Liu SD, Shastri N, and Raulet DH. "Ligands
for the murine NKG2D receptor: expression by tumor cells and
activation of NK cells and macrophages." Nat Immunol 2000, 1(2).
Ding C, Gao D, Wilding J, Trayhurn P, and Bing C. "Vitamin D signalling in
adipose tissue." Br J Nutr 2012, 108(11): 1915-1923.
Earthman CP, Beckman LM, Masodkar K, and Sibley SD. "The link
between obesity and low circulating 25-hydroxyvitamin D
concentrations: Considerations and implications." Int J Obes (Lond)
2012, 36(3): 387-396.
Effros RB, Walford RL, Weindruch R, and Mitcheltree C. "Influences of
Dietary Restriction on Immunity to Influenza in Aged Mice." J Gerontol
1991, 46(4): B142-147.
Etten EV and Mathieu C. "Immunoregulation by 1,25-dihydroxyvitamin D3:
Basic concepts." J Steroid Biochem Mol Biol 2005, 97: 93-101.
Haussler MR, Jurutka PW, Mizwicki M, and Norman AW. "Vitamin D
63
receptor (VDR)-mediated actions of 1alpha,25(OH)(2)vitamin D(3):
Genomic and non-genomic mechanisms." Best Pract Res Clin
Endocrinol Metab 2011, 25(4): 543-559.
Hayakawa Y, Huntington ND, Nutt SL, and Smyth MJ. "Functional subsets
of mouse natural killer cells." Immunol Rev 2006a, 214: 47-55.
Hayakawa Y and Smyth MJ. "CD27 Dissects Mature NK Cells into Two
Subsets with Distinct Responsiveness and Migratory Capacity." J
Immunol 2006b, 176(3): 1517-1524.
Hubner L, Engeli S, Weann C, Goudeva L, Laue T, and Kielstein H.
"Human NK cell subset functions are differentially affected by
adipokines." PLoS One 2013, 8(9): e75703.
Jahn J, Spielau M, Brandsch C, Stangl GI,Delank KS, Bähr I, Berreis T,
Wrann CD, and Kielstein H. "Decreased NK cell function in obesity
can be reactivated by fat mass reduction." Obesity 2015, 23: 2233-2241.
Jeffery NM, Sanderson P, Newsholme EA, and Calder PC. "Effects of
varying the type of saturated fatty acid in the rat diet upon serum lipid
levels and spleen lymphocyte functions." Biochim Biophys Acta 1997,
1345: 223-236.
Kim S, Lizuka K, Kang HSP, Dokun A, Fench AR, Greco S, and Yokoyama
WM. "In vivo developmental stages in murine natural killer cell
maturation." Nat Immunol 2002, 3(6).

64
Kintscher U, Hartge M, Hess K, Foryst-Ludwig A, Clemenz M, Wabitsch M,
Fischer-Posovszky P, Barth TF, Dragun D, Skurk T, Hauner H, Bluher
M, Unger T, Wolf AM, Knippschild U, Hombach V, and Marx N. "T-
lymphocyte infiltration in visceral adipose tissue: a primary event in
adipose tissue inflammation and the development of obesity-mediated
insulin resistance." Arterioscler Thromb Vasc Biol 2008, 28(7): 1304-
1310.
Konradsen S, Ag H, Lindberg F, Hexeberg S, and Jorde R. "Serum 1,25-
dihydroxy vitamin D is inversely associated with body mass index." Eur
J Nutr 2008, 47(2): 87-91.
Krebs P, Barnes JJ, Lampe K, Whitley K, Bahjat KS, Beutler B, Janssen E,
and Hoebe K. "NK cell–mediated killing of target cells triggers robust
antigen-specific T cell–mediated and humoral responses." Blood 2009,
113.
Krishnan EC, Trost L, Aarons S, and Jewell WR. "Study of function and
maturation of monocytes in morbidly obese individuals." J Surg Res
1982, 33: 87-97.
Lamas O, Martinez JA, and Marti A. "Energy restriction resores the
impaired immune response in overnight (cafeteria) rats." J Nutr
Biochem 2004, 15: 418-425.
Lanier LL. "Follow the Leader: NK Cell Receptors for Classical and
65
Nonclassical MHC Class I." Cell 1998, 92: 705-707.
Laue T, Wrann CD, Hoffmann-Castendiek B, Pietsch D, Hubner L, and
Kielstein H. "Altered NK cell function in obese healthy humans." BMC
Obes 2015, 2: 1.
Lee BC, Kim MS, Pae M, Yamamoto Y, Eberle D, Shimada T, Kamei N,
Park HS, Sasorith S, Woo JR, You J, Mosher W, Brady HJ, Shoelson SE,
and Lee J. "Adipose Natural Killer Cells Regulate Adipose Tissue
Macrophages to Promote Insulin Resistance in Obesity." Cell Metab
2016, 23(4): 685-698.
Lee KN, Kang HS, Jeon JH, Kim EM, Yoon SR, Song H, Lyu CY, Piao ZH,
Kim SU, Han YH, Song SS, Lee YH, Song KS, Kim YM, Yu DY, and
Choi I. "VDUP1 is required for the development of natural killer cells."
Immunity 2005, 22(2): 195-208.
Lee RK, Spielman J, Zhao DY, Olsen KJ, and Podack ER. "Perforin, Fas
ligand, and tumor necrosis factor are the major cytotoxic molecules
used by lymphokine-activated killer cells." J Immunol 1996, 157: 1919-
1925.
Leung KH. "Inhibition of Human Natural Killer Cell andLymphokine-
Activated Killer Cell Cytotoxicityand Differentiation by Vitamin D3."
Scand J Immunol 1989, 30: 199-208.
Li Q, Kobayashi M, and Kawada T. "DDVP markedly decreases the

66
expression of granzyme B and granzyme 3/K in human NK cells."
Toxicology 2008, 243: 294-302.
Lumeng CN. "Innate immune activation in obesity." Mol Aspects Med 2012,
34(2013): 12-29.
Lynch LA, O’Connell JM, Kwasnik AK, Cawood1 TJ, O’Farrelly C, and
O’Shea DB. "Are Natural Killer Cells Protecting the Metabolically
Healthy Obese Patient?" Obesity 2008, 17: 601-605.
Mancuso P, Huffnagle GB, Olszewski MA, Phipps J, and Peters-Golden M.
"Leptin Corrects Host Defense Defects after Acute Starvation in Murine
Pneumococcal Pneumonia." Am J Respir Crit Care Med 2006, 173:
212-218.
Merino F, Alvarez-Mon M, Hera. ADL, Ales JE, Bonilla F, and Durantez A.
"Regulation of natural killer cytotoxicity by 1,25-dihydroxyvitamin
D3." Cell Immunol 1989, 118: 328-336.
Mora JR, Iwata M, and von Andrian UH. "Vitamin effects on the immune
system: vitamins A and D take centre stage." Nat Rev Immunol 2008,
8(9): 685-698.
Moretta A. "Natural killer cells and dendritic cells: rendezvous in abused
tissues." Nat Rev 2002, 2.
Moretta A, Bottino C, Mingari MC, Biassoni R, and Moretta L. "What is a
natural killer cell?" Nat Immunol 2002, 3; 6-8.

67
Moretta A, Marcenaro E, Sivori S, Chiesa MD, Vitale M, and Moretta L.
"Early liaisons between cells of the innate immune system in inflamed
peripheral tissues." Trends Immunol 2005, 26(12).
Moretta L, Ciccone E, Moretta A, Hoglund P, Ohlen C, and Karre K.
"Allorecognition by NK cells, nonself or no self." Immunol Today 1992,
13(8).
Moulin CM, Marguti I, Peron JPS, Halpern A, and Rizzo LV. "Bariatric
Surgery Reverses Natural Killer (NK) Cell Activity and NK-Related
Cytokine Synthesis Impairment Induced by Morbid Obesity." Obesity
Surgery 2011, 21(1): 112-118.
Murphy K, Travers T, and Walport M. Janeway's immunobiology: New York:
Garland Science, Taylor & Francis Group; 2012.
Muthian G, Raikwar HP, Rajasingh J, and Bright JJ. "1,25
Dihydroxyvitamin-D3 modulates JAK-STAT pathway in IL-
12/IFNgamma axis leading to Th1 response in experimental allergic
encephalomyelitis." J Neurosci Res 2006, 83(7): 1299-1309.
Nave H, Mueller G, Siegmund B, Jacobs R, Stroh T, Schueler U, Hopfe M,
Behrendt P, Buchenauer T, Pabst R, and Brabant G. "Resistance of
Janus kinase-2 dependent leptin signaling in natural killer (NK) cells: A
novel mechanism of NK cell dysfunction in diet-induced obesity."
Endocrinology 2008, 149(7): 3370-3378.
68
Naylor C and Petri WA, Jr. "Leptin Regulation of Immune Responses."
Trends Mol Med 2016, 22(2): 88-98.
O'Shea D, Cawood TJ, O'Farrelly C, and Lynch L. "Natural killer cells in
obesity: impaired function and increased susceptibility to the effects of
cigarette smoke." PLoS One 2010, 5(1): e8660.
Okada S, Li Q, Whitin JC, Clayberger C, and Krensky AM. "Intracellular
Mediators of Granulysin-Induced Cell Death." J Immunol 2003, 171:
2556-2562.
Okamoto K, Kobayashi T, Kobata T, Hasunuma T, Kato T, Sumida T, and
Nishioka K. "Fas-associtaed death domain protein is a Fas-mediated
apoptosis modulator in synoviocytes." Rheumatology 2000, 39: 471-
480.
Park S, Lim Y, Shin S, and Han SN. "Impact of Korean pine nut oil on
weight gain and immune responses in high-fat diet-induced obese
mice." Nutr Res Pract 2013, 7(5): 352-358.
Quesada JM, Serrano I, Borrego F, Martin A, Peña J, and Solana R.
"Calcitriol effect on natural killer cells from hemodialyzed and normal
subjects." Calcified Tissue International 1995, 56(2): 113-117.
Raulet DH and Guerra N. "Oncogenic stress sensed by the immune system:
role of natural killer cell receptors." Nat rev 2009, 9.
Ravid A, Koren R, Maron L, and Liberman UA. "1,25( OH),D, increases
69
cytoxicity and exocytosis in lyphokine-activated killer cells." Mol Cell
Endocrinol 1993, 96: 133-139.
Robbins SH, Bessou G, Cornillon A, Zucchini N, Rupp B, Ruzsics Z,
Sacher T, Tomasello E, Vivier E, Koszinowski UH, and Dalod M.
"Natural Killer Cells Promote Early CD8 T Cell Responses against
Cytomegalovirus." PLoS Pathog 2007, 3(8): e123.
Robertson MJ. "Role of chemokines in the biology of natural killer cells." J
of Leukoc Biol 2002, 71.
Rocha VZ, Folco EJ, Sukhova G, Shimizu L, Gotsman I, Vernon AH, and
Libby P. "Interferon-, a Th1 Cytokine, Regulates Fat Inflammation : A
Role for Adaptive Immunity in Obesity." Mol Med 2008, 103: 467-476.
S. Caspar-Bauguila, B. Cousina, A. Galiniera, C. Segafredob, and M.
Nibbelinka, M. Andre a, L. Casteillaa, Pe nicaud L. "Adipose tissues as
an ancestral immune organ: Site-specific change in obesity." FEBS
2005, 579: 3487-3492.
Sabrina Wilk, Alexander Jenke, Jenny Stehr, Chin-AnYang, Sandra Bauer,
Katrin Goldner, Katja Kotsch, Hans-Dieter Volk, Wolfgang Poller,
Heinz-Peter Schultheiss, Carsten Skurk, and CarmenScheibenbogen.
"Adiponectin modulates NK-cell function." Eur J Immunol 2013, 43:
1024-1033.
Scott FL, Stec B, Pop C, Dobaczewska MK, Lee JJ, Monosov E, Robinson

70
H, Salvesen GS, Schwarzenbacher R, and Riedl SJ. "The Fas–FADD
death domain complex structure unravels signalling by receptor
clustering." Nature 2009, 457(19).
Sell H, Habich C, and Eckel J. "Adaptive immunity in obesity and insulin
resistance." Nat Rev Endocrinol 2012, 8(12): 709-716.
Smith AG, Sheridan PA, Harp JB, and Beck MA. "Diet-Induced Obese Mice
Have Increased Mortality and Altered Immune Responses When
Infected with Influenza Virus." J Nutr 2007, 137: 1236-1243.
Smyth MJ, Cretney E, Kelly JM, Westwood JA, Street SE, Yagita H, Takeda
K, van Dommelen SL, Degli-Esposti MA, and Hayakawa Y.
"Activation of NK cell cytotoxicity." Mol Immunol 2005, 42(4): 501-
510.
Suds T, Takahashi T, Golstein P, and Nagata S. "Molecular Cloning and
Expression of the Fas Ligand, a Novel Member of the Tumor Necrosis
Factor Family." Cell 1993, 75: 1169-1178.
Veldman CM, Cantorna MT, and DeLuca HF. "Expression of 1,25-
dihydroxyvitamin D(3) receptor in the immune system." Arch Biochem
Biophys 2000, 374(2): 334-338.
Vidyarani M, Selvaraj P, Raghavan S, and Narayanan PR. "Regulatory role
of 1, 25-dihydroxyvitamin D3 and vitamin D receptor gene variants on
intracellular granzyme A expression in pulmonary tuberculosis." Exp
71
Mol Pathol 2009, 86(1): 69-73.
Vivier E, Raulet DH, Moretta A, Caligiuri MA, Zitvogel L, Lanier LL,
Yokoyama WM, and Ugolini S. "Innate or Adaptive Immunity? The
Example of Natural Killer Cells." Science 2011a, 331(6013): 44-49.
Vivier E, Tomasello E, Baratin M, Walzer T, and Ugolini S. "Functions of
natural killer cells." Nat Immunol 2008, 9(5): 503-510.
Vivier E and Ugolini S. "Natural killer cells: from basic research to
treatments." Front Immunol 2011b, 2: 18.
Vivier E, Ugolini S, Blaise D, Chabannon C, and Brossay L. "Targeting
natural killer cells and natural killer T cells in cancer." Nat Rev
Immunol 2012, 12(4): 239-252.
Walzer T, Dalod M, Robbins SH, Zitvogel L, and Vivier E. "Natural-killer
cells and dendritic cells: “l’union fait la forc"." Blood 2005, 106.
Weeres MA, Robien K, Ahn YO, Neulen ML, Bergerson R, Miller JS, and
Verneris MR. "The effects of 1,25-dihydroxyvitamin D3 on in vitro
human NK cell development from hematopoietic stem cells." J
Immunol 2014, 193(7): 3456-3462.
Winer DA, Winer S, Shen L, Wadia PP, Yantha J, Paltser G, Tsui H, Wu P,
Davidson MG, Alonso MN, Leong HX, Glassford A, Caimol M, Kenkel
JA, Tedder TF, McLaughlin T, Miklos DB, Dosch HM, and Engleman
EG. "B cells promote insulin resistance through modulation of T cells

72
and production of pathogenic IgG antibodies." Nat Med 2011, 17(5):
610-617.
Wortsman J, Lois Y Matsuoka TCC, Zhiren Lu, and Michael F Holick.
"Decreased bioavailability of vitamin D in obesity." Am J Clin Nutr
2000, 72: 690-693.
Wrann CD, Laue T, Hübner LK, S, Jacobs R, Goudeva L, and Nave H.
"Short-term and long-term leptin exposure differentially affect human
natural killer cell immune functions." Am J Physiol Endocrinol Metab
2012;2(1):E108nn.
Yuzefpolskiy Y, Baumann FM, Penny LA, Studzinski GP, Kalia V, and
Sarkar S. "Vitamin D Receptor Signals Regulate Effector and Memory
CD8 T Cell Responses to Infections in Mice." J Nutri 2014, 144: 2073-
2082.
Zhigang Tian, Rui Sun, Haiming Wei, and Gao B. "Impaired natural killer
(NK) cell activity in leptin receptor deficient mice: leptin as a critical
regulator in NK cell development and activation." Biochem Biophys
Res Commun 2002, 298: 297-302.
73
국문초록
비타민 D의 보충이 자연살해세포의 기능에
미치는 영향: 비만 여부에 따른 차별적 효과
서울대학교 대학원 식품영양학과
이가영
비타민 D는 면역 조절 효과가 있으며 적응면역뿐만 아니라 내재면역
의 기능에도 관여한다는 것이 알려져 있다. 비타민 D는 적응면역의 작
용은 억제하며, 내재면역의 경우 단핵구가 대식세포로 분화하는 것을 촉
진하고, 수지상세포의 성숙과 분화는 억제하는 것으로 보고되었다. 그러
나 비타민 D가 자연살해세포의 기능에 미치는 영향에 관한 연구는 부족
한 실정이고, 선행된 연구의 대부분이 비타민 D가 자연살해세포의 기능
에 미치는 영향을 세포에 직접 비타민 D를 처리하여 효과를 살펴본 연
구이며 상반된 결과를 보여주고 있다. 따라서, 본 연구에서는 식이를 통
한 비타민 D의 보충에 따른 자연살해세포의 기능 변화를 살펴보고자 하
였고, 비만이 자연살해세포의 살해능력에 미치는 영향을 확인하고자 하
였다. 5주령의 C5BL/6 마우스를 지방의 함량 (10% 또는 45%의 총 지
방 함량; CD, HFD)과 비타민 D의 수준 (식이 kg당 50, 1000, 10000
74
IU; DD, DC, DS)에 따라 6 그룹으로 구분하여 12주 동안 식이를 공급
하였다. 자연살해세포의 살해능력, 사이토카인 분비, 활성 수용체의 발현,
탈과립성을 측정하였다. 체중, 식이 섭취량, 백색지방량, 혈중 렙틴 농도,
자연살해세포의 살해능력, 비장면역세포의 비율, 자연살해세포 및 T 세
포로부터 세포 내 IFN-γ의 발현 및 세포 표면 NKG2D와 CD107a의
발현을 측정하였고, 비장면역세포에서 자연살해세포의 기능 및 비타민
D의 대사와 관련된 지표를 확인하였다. 그 결과, 12주 후의 체중 및 체
중 변화, 백색지방 무게는 고지방 식이 섭취군에서 높았고, 혈중 렙틴
농도도 고지방 섭취군에서 대조군 보다 더 높음을 확인하였다. 자연살해
세포의 살해능력은 대조군에서는 비타민 D의 보충군에서 높았으나 고지
방 섭취군에서는 비타민 D의 보충 효과가 관찰되지 않았다. 비장면역세
포의 비율을 분석한 결과, 성숙한 자연살해세포 (CD11b+)와 미성숙한
자연살해세포 (CD11b-)의 비율이 고지방 섭취군에서 대조군에 비해 낮
았고, 대조군에서는 비타민 D 보충군이 비타민 D 결핍군보다 더 높은
비율을 나타냈다. 비장면역세포에서 자연살해 T 세포의 비율은 대조군
에서는 비타민 D에 의해 비중이 증가되었으나, 고지방 섭취군에서는 유
의적인 차이가 없었다. PMA (50 ng/mL)/Ionomycin (0.5μM)으로 4시
간 동안 자극한 자연살해세포에서 발현된 세포 내 IFN-γ 및 세포표면
NKG2D와 CD107a 수준은 비만이나 비타민 D의 섭취 수준에 의한 영
향이 없었으나, CD8+ T cell에서의 CD107a 발현은 비타민 D 보충군에
서 낮게 나타났다. 또한, 비장면역세포에서 발현되는 Ifng와 Ccl5의 수
75
준은 대조군에 비해 고지방 섭취군에서 유의적으로 낮았으나, Vdr과
Vdup1의 발현은 비타민 D나 비만에 의한 영향이 없었다. 결론적으로,
본 연구에서는 비타민 D을 경구 보충하였을 때 대조군에서 자연살해세
포의 살해능력을 상승시켰으나 고지방 섭취군에서는 영향을 주지 못함을
확인하였고, 이러한 대조군에서의 효과는 자연살해세포의 비율 변화가
영향을 주었을 것으로 생각된다. 본 연구는 비타민 D가 자연살해세포를
자극하는 요인으로 작용함으로써 선천면역 반응의 향상에 기여할 수 있
다는 것을 확인한 점에서 의의가 있다고 사료된다.
주요어: 자연살해세포, 비타민 D, 비만, 인터페론 감마, CD107a
학번: 2015-21706