disaggregated behavior graphs instructions. disaggregated behavior data how to build graphs using oh...
TRANSCRIPT

Disaggregated BehaviorGraphs Instructions
Disaggregated Behavior Data
How to Build Graphs UsingOH EMIS Data and Excel
OH State Support Team Region 13Positive Behavioral Interventions & Support Work Group
1
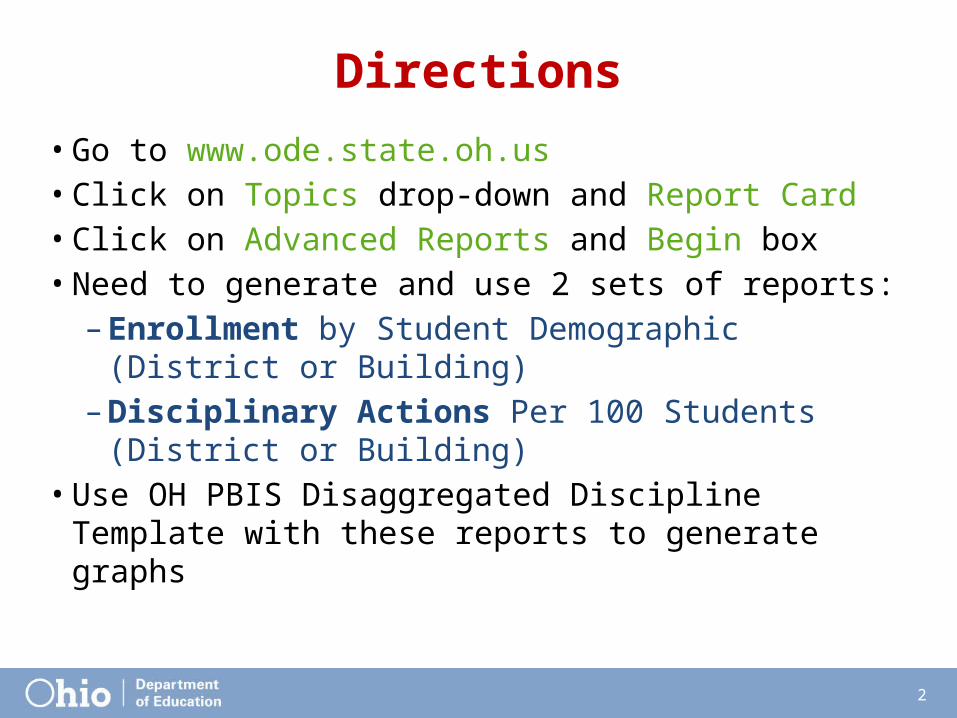
Directions
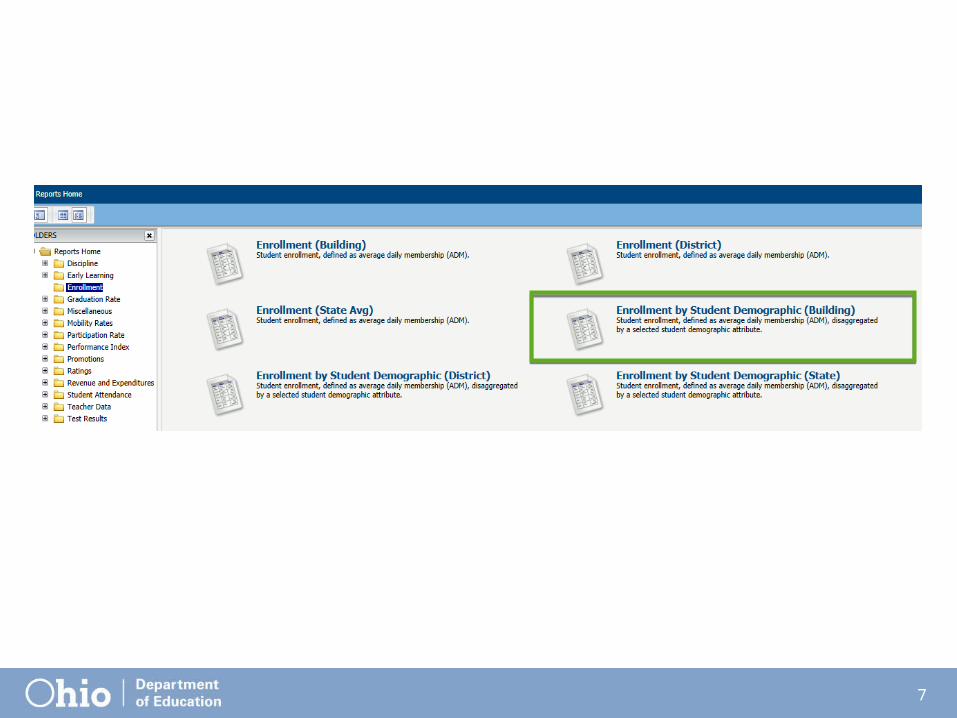
• Go to www.ode.state.oh.us• Click on Topics drop-down and Report Card• Click on Advanced Reports and Begin box• Need to generate and use 2 sets of reports:
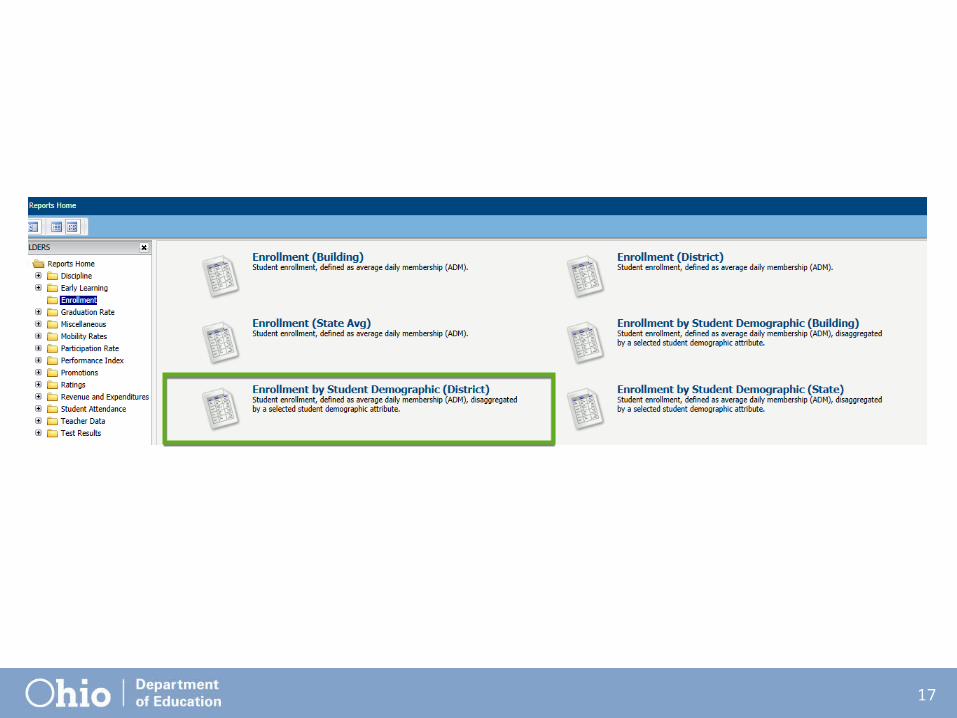
– Enrollment by Student Demographic (District or Building)
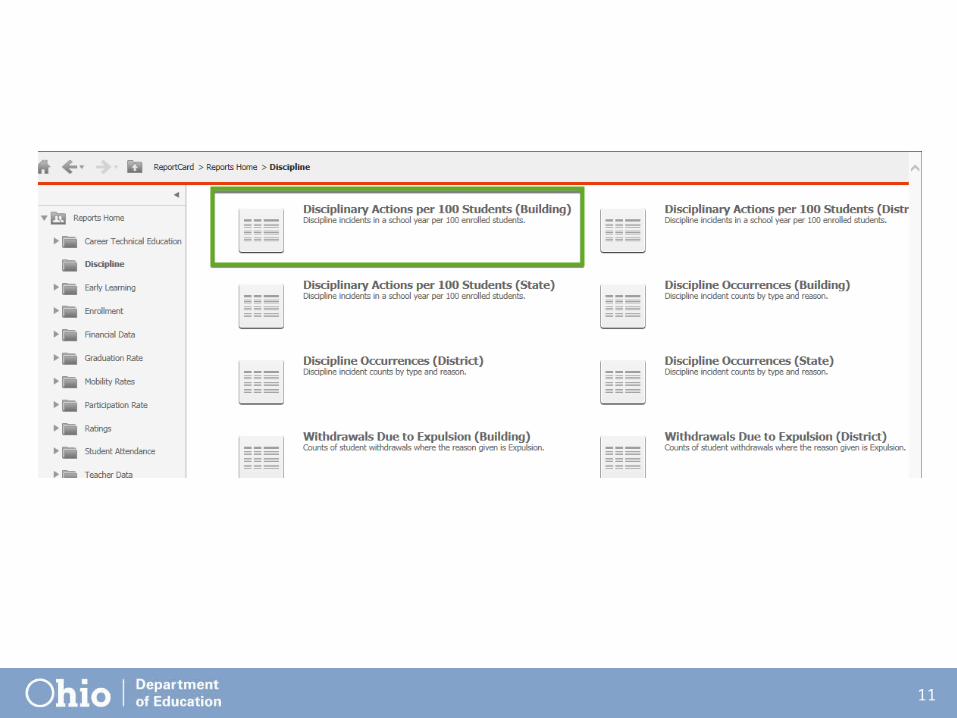
– Disciplinary Actions Per 100 Students (District or Building)
• Use OH PBIS Disaggregated Discipline Template with these reports to generate graphs
2

4

4
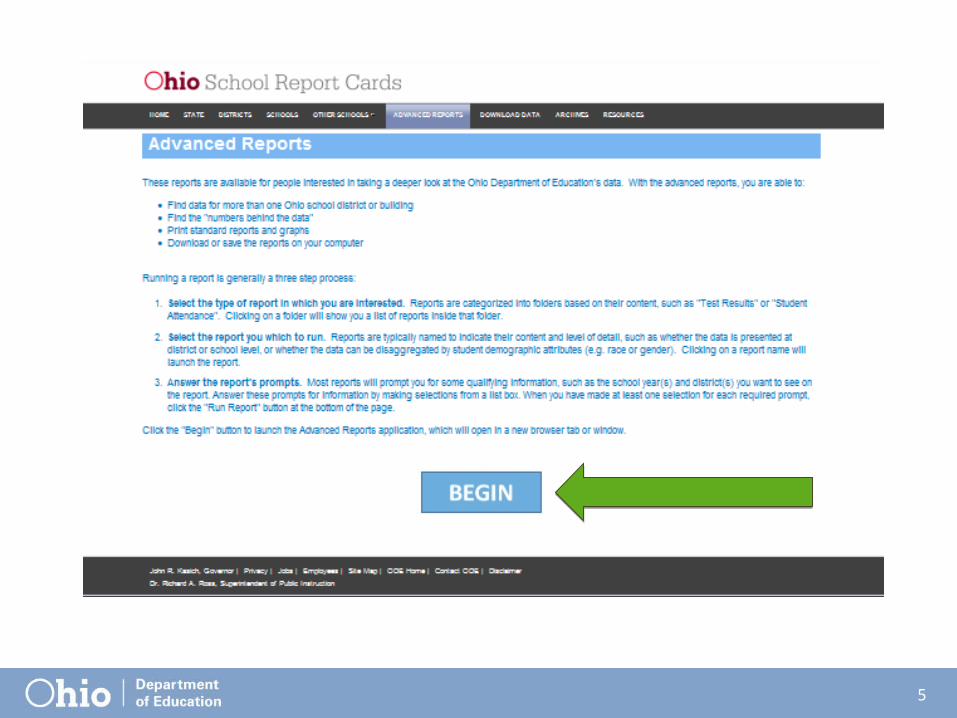
5
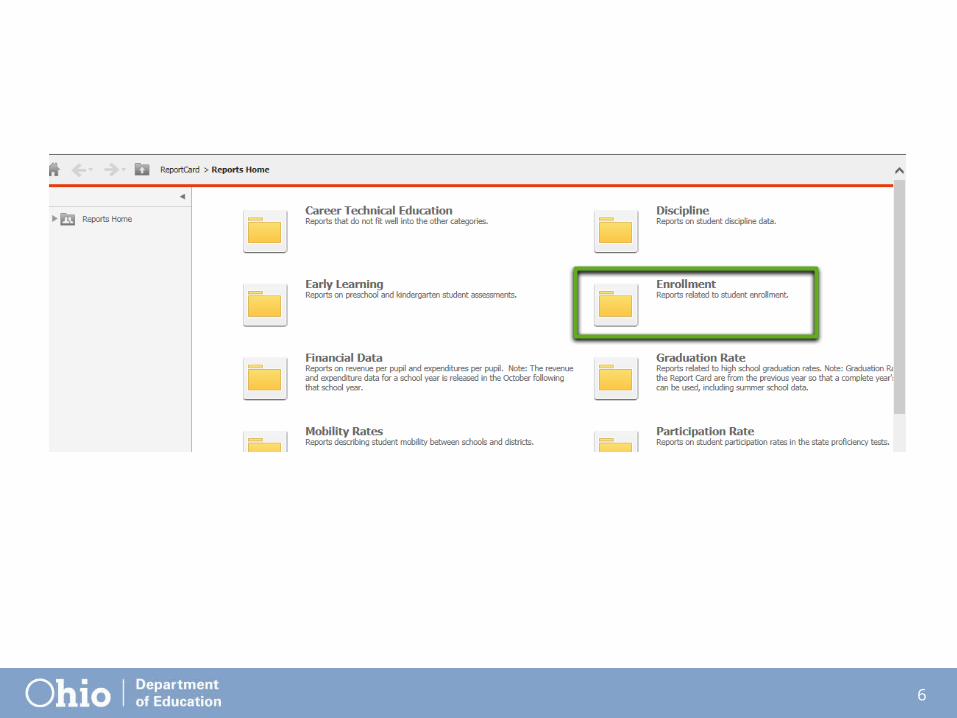
6
7
8
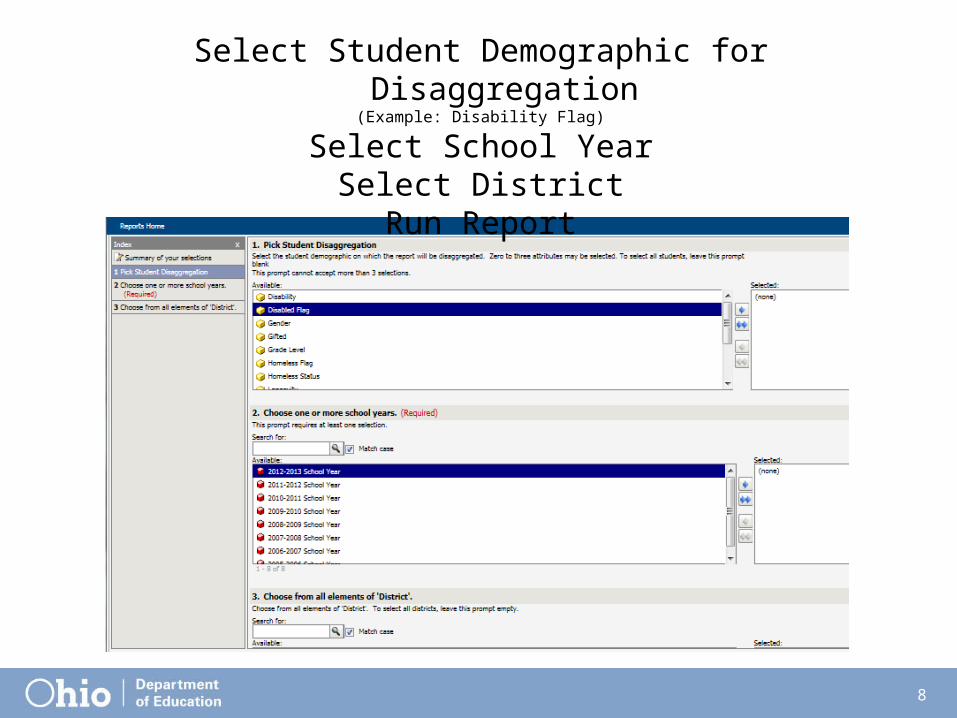
Select Student Demographic for Disaggregation(Example: Disability Flag)
Select School YearSelect DistrictRun Report
9
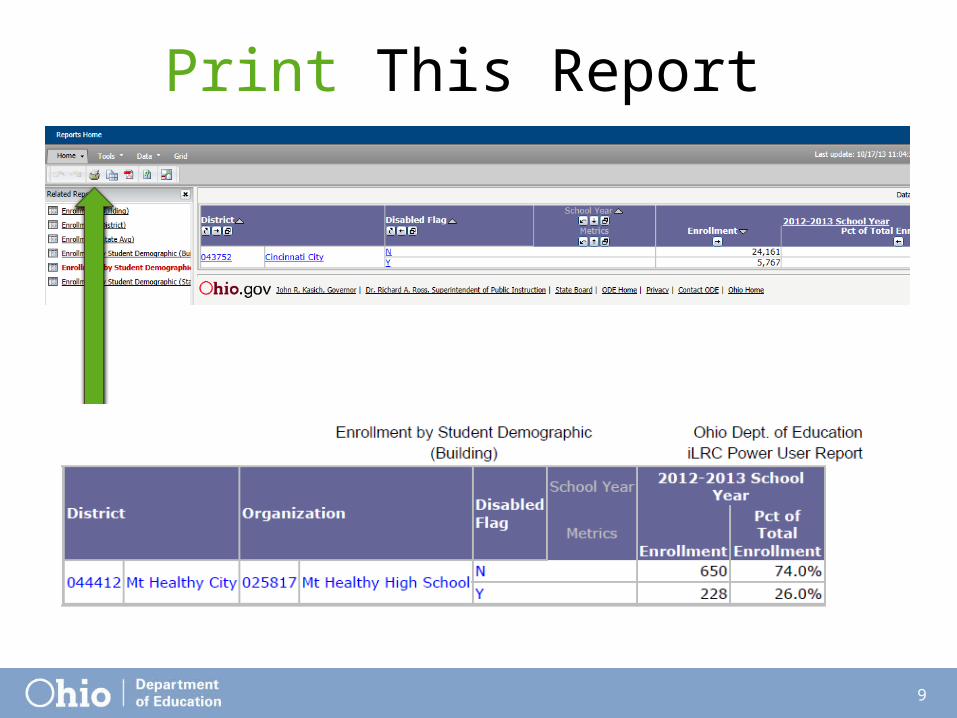
Print This Report
10
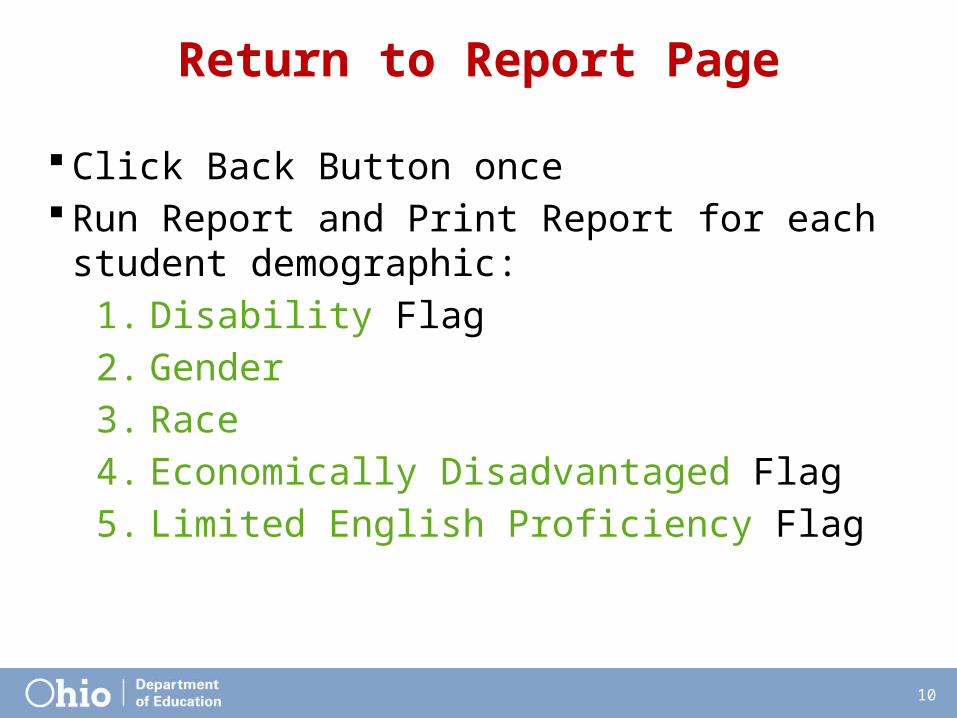
Return to Report Page
Click Back Button once Run Report and Print Report for each student
demographic:
1. Disability Flag
2. Gender
3. Race
4. Economically Disadvantaged Flag
5. Limited English Proficiency Flag
11
12
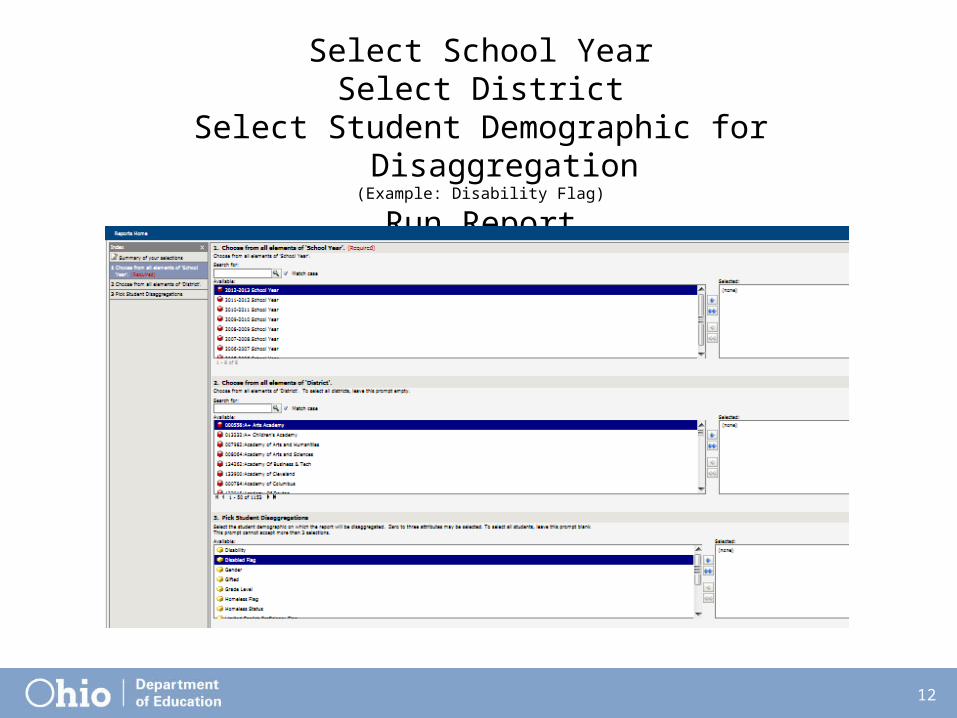
Select School YearSelect District
Select Student Demographic for Disaggregation(Example: Disability Flag)
Run Report

13
Print This Report
14
Return to Report Page
Click Back Button once Run Report and Print Report of Expulsions,
Suspensions, and Other Disciplinary Actions for each student demographic:
1. Disability Flag
2. Gender
3. Race
4. Economically Disadvantaged Flag
5. Limited English Proficiency Flag
15
OH PBIS Disag. Discipline Template
• Enter data from each report into gray boxes on School Name tab.
• Select Tabs on bottom for each of 6 different graphs and edit Title of each to reflect District or Building Name and School Year.
• Save file.
16
Disaggregated District Data Graphs
Build These Graphs By: • Following the same series of steps, with the
exception of running and printing District reports (see next 2 slides), and
• Using the same OH PBIS…Template,
disaggregated data graphs can be built and printed for District Leadership Teams to use in
Stage 1 and Stage 3 of the OIP.
17

18