climapocalypse now? a disaggregated study of climate
TRANSCRIPT

Climapocalypse Now? A Disaggregated Study of Climate-Related Natural Disasters and the Risk of Violent Conflict
Johan Lie Hammerstrøm
Master's Thesis
Department of Political Science Faculty of Social Sciences
University of Oslo 2014

Word count: 22 249

Abstract A changing climate could result in conditions that entail a loss of resources and habitat for a
large portion of the world’s population. This may lead to heightened tensions and the risk of so
called climate wars erupting. Weakened and failed states that are already prone to the risk of
conflict appear to be the most vulnerable as they will also lack the resources to mitigate coming
climate changes and more adverse weather conditions. By combining data from climate-related
natural disasters and conflict data from the last 30 years this thesis tries to discern whether
there is already an observable increase in the risk of civil war braking out in a country or
location ravaged by climate disasters. A country level analysis is complimented by a
disaggregated analysis utilizing geography information systems (GIS) data to see if there is any
indication that a more detailed approach nets different results. The core findings of the thesis
are that there is a heightened risk of civil war in geographical locations that have suffered a
period of extreme drought, two to three years after the occurrence of the drought. Other types
of disasters appear neither to increase nor decrease the risk of civil war onset in any significant
way. Further there is no indication that climate-related natural disasters have any country-wide
effect on the risk of civil war onset.


Acknowledgements It has been a long and interesting journey, not without its hurdles, but finally this thesis is at the
end. I want to extend a big thank you to everyone who has helped me and encouraged me
along the way. First and foremost to my supervisor Håvard Nygård who inspired me to write
this thesis and also had to put up with my questions both good and bad throughout the entire
period. Rune Slettebak and Rune Busch for providing input, data and good pointers. My parents
for always wanting the best for me. Anders, Camilla, Helene, LP, Emil, Calina and several others
for countless coffee breaks, laughs and motivational support. Middagsklubben for keeping me
fed and smiling throughout. And finally to Stine who pushed me over the finish line and made
sure I kept my head on throughout the final weeks. I feel lucky to have spent so many good
days working, discussing and (let us be honest) living at Blindern.
The content, the errors and the mistakes of this thesis are entirely my own.
Johan Lie Hammerstrøm


Contents
1.0 Introduction .......................................................................................................................................... 2
1.1 A change of climate and a change of opinion ................................................................................... 2
1.2 When the chips are down ................................................................................................................. 3
1.3 Research Question and hypothesis ................................................................................................... 5
1.4 Structure ........................................................................................................................................... 6
1.5 Defining Concepts ............................................................................................................................. 6
1.5.1 Climate Change .............................................................................................................................. 7
1.5.2 Conflict ........................................................................................................................................... 9
2.0 Literature Overview ............................................................................................................................ 12
2.1 Civil War .......................................................................................................................................... 12
2.2 Scarcity: The origins of climate war ................................................................................................ 13
2.3 Trying to link climate and conflict ................................................................................................... 17
3.0 Theory ................................................................................................................................................. 20
3.1 Disastrous weather ......................................................................................................................... 20
3.2 Using climate-related natural disasters as a measure .................................................................... 21
3.3 Why does it matter? ....................................................................................................................... 23
4.0 Research Design .................................................................................................................................. 26
4.1 Why a statistical analysis? .............................................................................................................. 26
4.2 Why disaggregate?.......................................................................................................................... 27
4.2.1 PRIO-GRID .................................................................................................................................... 27
4.2.2 GIS procedure .............................................................................................................................. 29
4.3 Data issues and selection bias ........................................................................................................ 30
4.4 Measurement Validity .................................................................................................................... 32
4.5 Dataset and unit of analysis ............................................................................................................ 32
4.6 Dependent variable ........................................................................................................................ 33
4.7 Independent variables .................................................................................................................... 34
4.7.1 Climate related natural disasters ................................................................................................. 34
4.7.2 Control variables .......................................................................................................................... 35
4.7.2.1 Population ................................................................................................................................. 35
4.7.2.2 Economy ................................................................................................................................... 35
4.7.2.3 Terrain and distance to capital ................................................................................................. 36
4.7.2.5 Regimes and stability ................................................................................................................ 37
4.7.2.6 Ethnic and religious fractionalization ....................................................................................... 37

4.7 Regression models .......................................................................................................................... 38
4.8 Statistical model .............................................................................................................................. 38
4.8.1 Logistic binominal regression ...................................................................................................... 38
4.8.2 Model specifications .................................................................................................................... 39
4.9 Missing data .................................................................................................................................... 39
4.10 Summary statistics ........................................................................................................................ 40
4.11 Multicollinearity ............................................................................................................................ 41
5.0 Analysis ............................................................................................................................................... 42
5.1 Country level analysis ..................................................................................................................... 42
5.2 Disaggregated analysis .................................................................................................................... 45
5.3 Summary ......................................................................................................................................... 48
6.0 Robustness and model fit ................................................................................................................... 50
6.1 Mixed-effects and outliers .............................................................................................................. 50
6.2 ROC-plots ........................................................................................................................................ 52
6.3 Conflict incidence ............................................................................................................................ 53
7.0 Results and Discussion ........................................................................................................................ 54
7.1 Hypotheses ..................................................................................................................................... 54
7.2 Behind the numbers ....................................................................................................................... 55
8.0 Conclusions ......................................................................................................................................... 58
8.1 Summary ......................................................................................................................................... 58
8.2 Further research and policy implications ....................................................................................... 59
Appendix ................................................................................................................................................... 64
Year dummies ....................................................................................................................................... 67
Descriptive statistics ............................................................................................................................. 69
Multcollineriarity .................................................................................................................................. 70
ROC-Plots .............................................................................................................................................. 71
Data and do-files ................................................................................................................................... 72
Bibliography ........................................................................................................................................ 74


[1]

[2]
1.0 Introduction
1.1 A change of climate and a change of opinion
The last 50 years have constituted a profound change in how we think about our planet. The
industrious exploits of previous generations have slowly given way to a lingering sense of
unease. An unease spawned by the thought that there are finite limits to the amount of
ecological pressure the Earth can handle. When that pressure mounts there are unknown
consequences as to how humans will react. When the world changes into a warmer and
presumably more hostile planet will we our self also turn more hostile towards each other? This
claim is made by several ecological theorists and various scenarios that factor in diminishing
resources and decreased living conditions in the near future. In this paper I will try to discern if
we already have available data that indicate an empiric linkage between climate change and
civil conflict. I will argue that there might already exist a feasible link between certain climate-
related natural disasters and an increased risk of conflict.
Ecological and environmental damage are young ideas historically. The industrial revolution cut
away forests and clogged cities with coal fired chimneys and sulphurous smoke, but the notion
that this could be unsustainable behavior did not catch on until the latter half of the 20th
century. First appearing in The New Yorker in 1962, Rachel Carson's "Silent Spring" is credited
for banning the pesticide DDT, starting the American environmental movement and the first
real questioning of humanity's strong faith in technological progress and prowess (Carson 1962;
Griswold 2012). Following in the footsteps of Carson, several scientists started asking questions
about Earth's capacity for human exploits. In 1972 a group of scientists first sounded the alarm
that still tolls on today: "The Limits To Growth" famously tried to predict when humankind
would cross the threshold of sustainable development (Meadows et al. 1972). The authors
updated their predictions in the 1992 revision gloomily titled "Beyond The Limits To Growth"
(Meadows et al. 1992). The earliest concerns for sustainable development were mostly
centered on air pollution, hazardous chemicals and the deterioration of the ozone layer. Every
one of these concerns are still present today, but what became more and more clear during the
[3]
seventies and eighties was the fact that the pollution aided the atmospheric effect that is now
known as the greenhouse effect. As we move into the 21ist century the debate has changed
markedly from those earlier and uncertain times. First, it was a debate on whether climate
change was real or not (Mann 2012). Now the debate has moved on to how to stop the world
from warming more than the perceived vital two Celsius degrees (Stocker 2013). Some have
already relinquished the idea of stopping climate change and instead moved the debate over to
how one can best adapt to the changes that are coming (Pielke et al. 2007). The pace is fast
and the facts are chilling: “We are the first humans ever to breathe air with 400 parts per million
of carbon dioxide” , reminded general secretary of the UN Ban Ki-Moon assembled journalists
at the end of last year (Ki-Moon 2013). We are already well into uncharted territory.
Moreover, the last few years the debate has increasingly shifted towards the effect of climate
change on human behaviour. “Climate migration” and “climate refugees” are becoming just as
important discussion points as climate change itself. Furthermore, several researchers engage
in a debate on whether climate change can spur an increase in human violence and conflict
(Buhaug 2014; Burke et al. 2009; Hsiang et al. 2013; Theisen et al. 2011). The important
question asked is how people will react if adversity and scarcity follow in the wake of climate
change and altered weather cycles. Will everyone pull together and join forces, or will there be
a final desperate race for the last resources available?
1.2 When the chips are down
There seems to be a wide breech in the opinions on how humankind will react if the effects of
climate change turn out to meet the direst of the predictions. Prominent figures, like U.S.
president Barack Obama in his Nobel Prize acceptance speech, have warned about coming
clashes and wars because of climate change (Obama 2009). Among the most alarmist examples
are a report from Christian Aid that claims one billion refugees from the effects of climate
change will “de-stabilize whole regions while increasingly desperate populations compete for
dwindling food and water” (Aid 2007). Invoking even stronger visions of apocalypse was a
Pentagon report from 2003 before that warned of the risk of a reversal to a Hobbesian state of

[4]
nature where humankind would fight “constant battles for diminishing resources” (Schwartz
and Randall 2003). Naturally, these kind of astonishing predictions garner media attention and
headlines. They are, however, not at all compatible with what the scientific community has to
say on the same subject.
There are only a handful of studies that claim any relevant linkage between climate and the
number of wars being fought (Burke et al. 2009; Zhang et al. 2006). Current conflict research
seems to agree that the character of the governing regime, population and wealth are the
strongest determining factors when predicting the risk of a civil conflict developing (Collier and
Hoeffler 2004; Hegre and Sambanis 2006; Hegre et al. 2012). Other strong cases have been
made for variables that include ethnic and religious divides within a society (Cederman et al.
2009; Fearon and Laitin 2003).
Although few studies report it, a linkage between wars and climate changes is empirically
feasible. Homer-Dixon among others have theroized a model that presents a linkage between
the two, but so far data limitations have rendered most conclusions severely hamstrung and
also heavily disputed (Homer-Dixon 2010). Further clouding the picture is the fact that the
current period, where one could argue that the effects of climate change and global warming
are being made manifest, is happening simultaneously with a period that is seeing a distinct fall
in the number of conflicts worldwide (Buhaug et al. 2009).
Therefore, the puzzle remains, and the outcome of it is likely to affect all of us in the coming
years. My thesis attempts to contribute to this vital field of research, and will investigate
whether climate related-natural disasters provide any effect when looking at the risk of civil war
onset for the last 30 years. Climate-related natural disasters are measurable, have a high
human impact, and are proven in becoming more regular and of a greater magnitude in the last
fifty years (CRED 2007). Therefore, I argue that such disasters provide a pragmatic tool for
trying to discern effects of global warming on human behaviour. As the question remains big
and cumbersome, and the data available is of discussable quality, I will utilize a different
approach to investigate the contested linkage. My approach will make use of data and employ
methods that give a high amount of detail. This leaves me with a disaggregated model to
identify a linkage between climate-related natural disasters and the risk of civil war onset.

[5]
1.3 Research Question and hypothesis
This thesis main research question is thus:
Do climate related natural disasters affect the risk of civil war onset?
To answer this question I will perform a quantitative analysis with a global scope consisting of
data from the last 30 years. My main independent variables will be climate related natural
disasters. My main dependent variable is the risk of a civil war breaking out, known as civil war
onset in the literature, and my main control variables are various socio-political factors such as
prosperity, social fractionalization and population size.
There are only a handful of climate-related natural disasters that are possible to isolate and
measure. Wildfires, mudslides, storms and cold snaps are all related to volatile weather, but
they are infrequent and some are hard to measure correctly. Since my main analysis is
disaggregated I have chosen the two climate-related natural disaster variables that are the
most common in frequency and therefore also perform the best in the analysis: droughts and
floods. Several studies that discuss the same themes as my thesis utilize these disaster variables
(Benjaminsen et al. 2012; Theisen et al. 2011; Wischnath and Buhaug 2014).
My hypothesis are as follows:
H1) Climate-related natural disasters do no not provide an immediate increase in the risk
of a conflict breaking out in the affected area.
H2) Negative impact from climate-related natural disasters will provide a long term
increase in the risk of conflict in the affected area.
H3) Climate-related natural disasters do not provide country-wide effects for the risk of a
civil war onset.

[6]
1.4 Structure
I argue that there are important differences when analysing climate-related natural disaster
and the risk of civil war onset on a local level and on a country-wide level. Therefore the
analysis will be carried out in two steps and at two different levels of analysis. Firstly, I will
analyse whether climate change affects the risk of civil war onset at country level. The country-
level data is a replication of Slettebak (2012) analysis and utilizes data from Fearon and Laitin
(2003), Collier and Hoeffler (2004) and the EM-DAT disaster database (CRED 2007). Secondly, I
will perform a GIS-based analysis on a grid-level by utilizing data obtained from the PRIO-GRID
dataset (Tollefsen et al. 2012). The disaggregated analysis also uses data from the Dartmouth
Flood Observatory (Brackenridge et al. 2009) and a variable constructed from the dataset of
Fearon and Laitin (2003).
This paper proceeds as follows: I will start by introducing the existing research done in the
areas that concern my thesis. From there I will elaborate on the theoretic framework that will
underpin the analysis. Discussed in this part are contributions from Thomas Homer-Dixon’s
main model of how resource scarcity may lead to an increase in conflict and violence (Homer-
Dixon 2010). In chapter 4 I will present the research design, the methods employed and the
coding of the various variables along with complete descriptive statistics. I will also discuss
missing data and my reasons for choosing a disaggregated analysis. The results of the analysis
are presented in chapter 5 along with a brief discussion of the findings that in short indicate
that there is an observable increase in the risk of civil war onset in cells that have experienced a
catastrophic drought two to three years prior to the conflict. The robustness of the various
models is explored in chapter 6. Finally I will elaborate on the results from the analysis, discuss
the positive observations more in depth and present a summary and a conclusion in chapter 7.
1.5 Defining Concepts
With my hypothesis established I know move on to explain the most important concepts that
will be discussed throughout this thesis.

[7]
1.5.1 Climate Change
Allow this limited technical explanation: The sun rays hitting earth are short band radiation,
whereas outbound radiation from earth is long range. Water vapor, carbon dioxide,
chlorofluorocarbons, methane, nitrous oxide and ozone - are transparent to short wave
radiation but opaque to long range radiation (Cline 1991). This heat trap is the so called
greenhouse effect. Without it the mean temperature on Earth would be - 18 degrees Celsius.
While essential to life on earth, the greenhouse effect can be manipulated by an increase in the
release of greenhouse gasses. The increasingly reflective quality of the layer returns more and
more heat back to earth. Alongside an increase in human emissions, the natural CO2 emissions
could also be increasing rapidly. Deforestation, warmer oceans and less snow and ice all have a
profound effect on the natural radiation equation that determines the mean temperature of
the planet (Jenkinson et al. 1991). The greenhouse effect is the main mechanic behind what we
call global warming. The phrase was first coined in 1975, but became part of the common
language after NASA scientist James E. Hansen testified before the U.S. Senate (Senate 1988).
The last decades have been marked by intense fights over the scientific evidence behind global
warming and the amount of precision in the predictions for the future. At the center of the
fight is the United Nations Intergovernmental Panel on Climate Change (IPCC).
While constantly under siege from a very vocal minority, the IPCC constitutes the most
thorough research body on the subject of global warming. Especially after the gaffe that
predicted the melting of the Himalayan glaciers by 2035 the panel has strengthened its peer
reviewed processes and gained the support of the majority of the scientific community (IPCC
2010; Susan 2007). The frequent attacks on the IPCC’s research from scientists funded by
lobbying groups and energy corporations have led to several open letters from troubled
scientists that fear the ongoing debate is being cluttered on purpose (Adams and others 2010).
In IPCC’ latest report from this autumn the tone is firmer than ever regarding the conclusions
from its research:
“The evidence for human influence on the climate system has grown since the Fourth
Assessment Report (AR4). It is extremely likely that more than half of the observed increase in

[8]
global average surface temperature from 1951 to 2010 was caused by the anthropogenic
increase in greenhouse gas concentrations and other anthropogenic forcings together.” (Allen
et al. 2014: 5)
The consequences are ricing ocean levels, more extreme weather, fewer habitable areas and a
general degradation in the quality of livelihood for a large share of the world’s population (see
IPCC 2013: 19-27 for a full listing of the predicted consequences). In the face of this jarring
evidence the World community has so far failed to be able to launch any significant
countermeasures. Costs, distribution of negative effects and responsibility and especially a
strong divide between developing and developed nations have all contributed to making the
process stagnate. Some progress has been in the last year with a bi-lateral agreement between
China and the United States, but environmentalists were quick to point out that the agreement
have plenty of included caveats (Landler 2014; Shuo 2014). Some scientists even argue that the
human psyche plays a part in the failure to accept the consequences of unmitigated climate
change:
"Maybe there is some sort of in-built safety mechanism, or comfort blanket, that makes us
assume that tomorrow will be pretty much the same as today; that the world when we are
middle-aged or old will be, broadly speaking, the same as it was when we were young" (McGuire
2012)
Michael E. Mann tells the story of how climate sceptics have gained an unreasonable amount of
ground in large thanks to mass media's lack of fact checking and the simple fact that climate
skepticism is a far more comforting alternative than accepting the facts of global warming
(Mann 2012). Lobbying, reluctance to accept the magnitude of the situation and strong
economic interests will all probably continue to try to clutter the debate in the coming years. As
far as this paper is concerned, it is sufficient to assume that climate change is upon us and that
its effects will be felt in the imminent future.

[9]
1.5.2 Conflict
The other main variable in this paper is the onset of civil conflict. As interstate wars have
become a rare phenomenon after the end of World War II, civil wars and armed conflicts make
up almost the entirety of the conflicts that the world experiences from year to year. Civil
conflict is a well-known and oft-used measure in peace and conflict-studies and I will make use
of the same definition that the UCDP/PRIO Armed Conflict dataset codebook lists as:
"...a contested incompatibility that concerns government and/or territory where the use of
armed force between two parties, of which at least one is the government of a state, results in
at least 25 battle-related deaths.”
(See Harbom and others (2009) for the full definition parameters.)
To be classified as a full size civil war the amount of casualties has to exceed 1000 in the span of
a year. Both warfare and violence in general has been on the decline in the last period of
human history (Goldstein 2011; Pinker 2011). This decline is also seen in the civil war literature,
where the end of the cold war signaled a drastic change in the number of armed conflicts
around the world and the number of people killed in battle (Gleditsch et al. 2002; Lacina et al.
2006). A minor increase has been seen after 2005, but according to the predictions this trend
will continue downwards and by 2050 roughly half of the countries that today host a conflict
will be conflict-free according to Hegre et al. (2012). The main explanation is the United
Nations' outlook for a continued worldwide reduction of poverty, considering that gross
domestic product per capita is a significant variable in predicting the risk of civil wars erupting
in a given country. At the time of writing the latest available data from 2012 show that were 23
intrastate conflicts, 8 internationalized intrastate conflicts and a single interstate conflict
ongoing (UCDP 2012).

[10]
Figure 1.1: Annual battle deaths in civil wars and number of countries in a civil war. Model from
(Bank 2011)
Source: (Lacina et al. 2006)
Choosing civil war as a measure of conflict or violence may at first glance not be deemed as
intuitive, but there are several factors that strengthen this choice. Cunningham and Lemke
(2011) explain that the factors used to explain civil war also can be suitable predictors for other
forms of violence, such as assassinations and riots. The overlap in findings between studies
suggests that the theories that are used to explain civil war onset represent more general
mechanisms about the occurrence of violence (Nygard and Weintraub 2011). Since 1946 the
great majority of conflicts in the world have been intrastate (see Figure 1.2) and there is
therefore a lot more data available for analysis.

[11]
Figure 1.2: Amount and type of conflicts per year, 1946-2010.
Source: (Themnér and Wallensteen 2011)

[12]
2.0 Literature Overview
In this section I will try to give a brief overview of the most important literature that has formed
the basis for my thesis. From a short overview of civil war I will move into the discussion around
scarcity and the different models that have been put forth to try to explain an empirical link
between climate changes, resource scarcity and the effects it has upon the chances of conflict.
2.1 Civil War
The Civil War literature is vast and it is far beyond the scope of this thesis to give a complete
overview of its contents. The literature has seen a surge of several large-n statistical studies
that focus on explaining factors that lead to the outbreak of violence at a certain point in time
(see Hegre et al. 2001; Hegre et al. 2012 for examples of this approach; Zhang et al. 2006).
While most studies take the approach that the outbreak of conflict is mostly answered by state
capacity and operation, e.g. that the state controls the allocation of resources, there is also the
debate as to whether intra-state violence mainly stem from a greed or grievance motivation
(Collier and Hoeffler 2004; Fearon and Laitin 2003). The more economic approach has also
spawned the contest model in which several groups fight over the same resources (Garfinkel
and Skaperdas 2007). Naturally the relevance of ethnic fractionalization and the way different
factions interact with each other have been of great interest to scholars of civil war (Cederman
et al. 2009; Esteban et al. 2012). Ethnic nationalism is popularly viewed as one of the leading
source of group cohesion and intergroup civil conflict; of 709 minority ethnic groups identified
around the world, at least 100 had members engage in an ethnically based rebellion against the
state during 1945 to 1998 (Blattman and Miguel 2010; Fearon 2006).
Equally important is the discussion of political instability and the effect of different regimes
upon the risks of civil war (Gates et al. 2006; Gleditsch et al. 2009; Hegre et al. 2001). Dominant
results across several studies are that state capacity in the form of wealth and civil liberties
decrease the risk of conflict while states that are subject to frequent power shifts and poor
income are faced with greater risk of civil war.

[13]
The state centric approach that many of the studies that rely on the same definition that this
thesis does is of interest as it has been the target of some recent critique. Fjelde and Nilsson
(2012) notes that the literature does not account for the complexity of civil conflicts where
there is often more than one active rebel group and that the dyadic relationship between state
and rebels should be more detailed.
Sociology has also contributed strongly to the civil war research literature with micro level
studies on the effects of warfare. Especially the rationale behind group level resource conflicts
have a strong tradition within sociology (Etzioni 1975; Olson 1971). Many of these studies also
concern themselves with questions of leadership or the importance of the presence of a
charismatic character. A lot of these questions also find their way into the more macro-oriented
civil war literature (Buhaug and Gates 2002).
Having briefly given a short overview of the recent civil war literature I now move into the
literature concerning this thesis’ main independent variable.
2.2 Scarcity: The origins of climate war
The idea of so called climate wars originates from another concept: The competition for limited
resources. Fighting for food and territory is as old as nature itself, but it is usually at its most
fierce when several animals are forced to share the same limited habitat. A nearly dried out
watering hole in the savannah is often the stage for struggles of life and death between its
inhabitants, over who gets to drink and who does not. This very scenario, played out by humans,
has troubled thinkers and statesmen throughout history. The English philosopher Thomas
Hobbes thought that the equality of man meant that the state of nature for humankind was a
constant war where everyone would be willing to use violence to secure every advantage
possible and that life was "solitary, poor, nasty, brutish, and short” (Hobbes 1928). Hobbes
gloomy conception of man as a developed animal held in check only by the social contract and
the fear of punishment from a strong state paves the way for many unappealing scenarios. The
thought of society degrading back into the most basic of Darwinist competition has never been

[14]
fully ousted, but it was a stronger factor when the question of sustainability, in simple terms of
producing enough food, seemed nearer than today.
T.R. Malthus and his predictions at the start of the 19th century that the world would struggle
to feed its population spurred a line of thinking that inquired what the maximum capacity of
the earth could be (Malthus 1888). Malthus cited the inability to increase food production as
one of the forces that would keep world population in check, through a natural culling that
would take place once population exceeded food production. Through these Malthusian checks
the world population would then return to sustainable levels. Though proven wrong,
Malthusianism has resurged several times, most notably in the form of a group of Neo-
Malthusianists who believed that the population surge after World War II would result in
hunger catastrophes and Malthusian checks in the following decades (Ehrlich and Club 1971).
The Green Revolution halted the Neo-Malthusianists, but the question has been given a new
vitality with the advent of climate change. Though the total effects of climate change on crop
production are hard to adequately model seeing that they contain as many factors such as
available water for irrigation, the level of agricultural technology, fertilizer improvements,
amount of air pollution and C02-leveles, there have been attempts. Rosenzweig and Parry found
in an early attempt that the total amount of crop production would probably be close to
constant with climate change (Rosenzweig and Parry 1994). The rationale is that warmer
weather will give more crops in the northern hemisphere and vice versa in the southern
hemisphere. Not only is less precipitation in some areas a concern, more extreme precipitation
(like monsoons) could increase topsoil erosion and reduce production output (Buhaug et al.
2009). Rosenzweig and Parry note that this will probably lead to severe food shortages for the
majority of the world's less developed countries unless some system of crop exchange is put in
place. This prediction has held firm through further research into the effects of CO2 (Tubiello
and others 2007) and updated models from the IPCC (Parry et al. 2005). As well as food, water
availability will also come under pressure with global warming. Regions that depend on a snow-
based hydrological cycle will become severely affected and may experience water shortages
according to the estimates from the IPCC (Barnett et al. 2005). While inconclusive for the world
at large, a conservative estimate is that there could be stronger competition for resources on a
regional level stemming from the effects of climate change (Stocker 2013).

[15]
If we accept scarcity as a likely, though not certain, consequence of global warming the next
question is what scarcity will lead to? In his book "Environment, Scarcity and Violence" Thomas
Homer-Dixon argues the fact that scarcity could lead to violence (Homer-Dixon 2010). Homer-
Dixon's main argument is that environmental scarcity, created by supply-induced, demand-
induced and structural scarcity, leads to social segmentation and weakened institutions. When
environmental scarcity manifests itself, constrained economic productivity will lead to the elites
trying to secure themselves buy rent-seeking which in turn leads to expulsion and possibly
migration by those that suffer from this behavior. The end results of this social segmentation
are according to Homer-Dixon group-identity conflicts, coups d’état and insurgencies. Often
misinterpreted, it is important to note that the author clearly states that “environmental
scarcity is never a sole or sufficient cause of large migrations, poverty, or violence; it always
joins with other economic, political, and social factors to produce its effects” (Homer-Dixon
2010: 16)
Figure 2.1: Sources and consequences of environmental scarcity. Model from Homer-Dixon (2010)
[16]
Homer-Dixon sees intra-state wars for resources, easily fitting within the realist framework, as
less than likely. Only easily exploitable resources like petroleum and minerals are worth trying
to conquer another state for, according to Homer-Dixon, because renewable resources (e.g.
fish, grain and forests) cannot so easily be converted into short term wealth. Also dismissed is
the claim that the world will be facing a series of "water-wars" between states in the near
future (Bulloch and Darwish 1993) as Homer-Dixon argues these types of wars also will be
internal in nature. To sum up, Homer-Dixon's main argument is that fighting over scarcity (more
specifically a scarcity of renewable resources) will manifest itself in intra-state conflict such as
insurgencies and ethnic clashes as different groups vie for control over the diminished supply of
resources.
As for possibly reasons as to why this has not been proven yet, Homer-Dixon offers the opinion
that environmental scarcity is often overlooked because analysts simply focus on the social
stress that stems from the environmental scarcity and thus are overlooking the cause of it
(Homer-Dixon 2010). The caveat is that it is near impossible to discern the relative weight of
environmental scarcity and the interactive effect it produces on social stress. Homer-Dixon
offers no solution to this problem, but simply implies that the effect is greatly overlooked and
undervalued by most researchers.
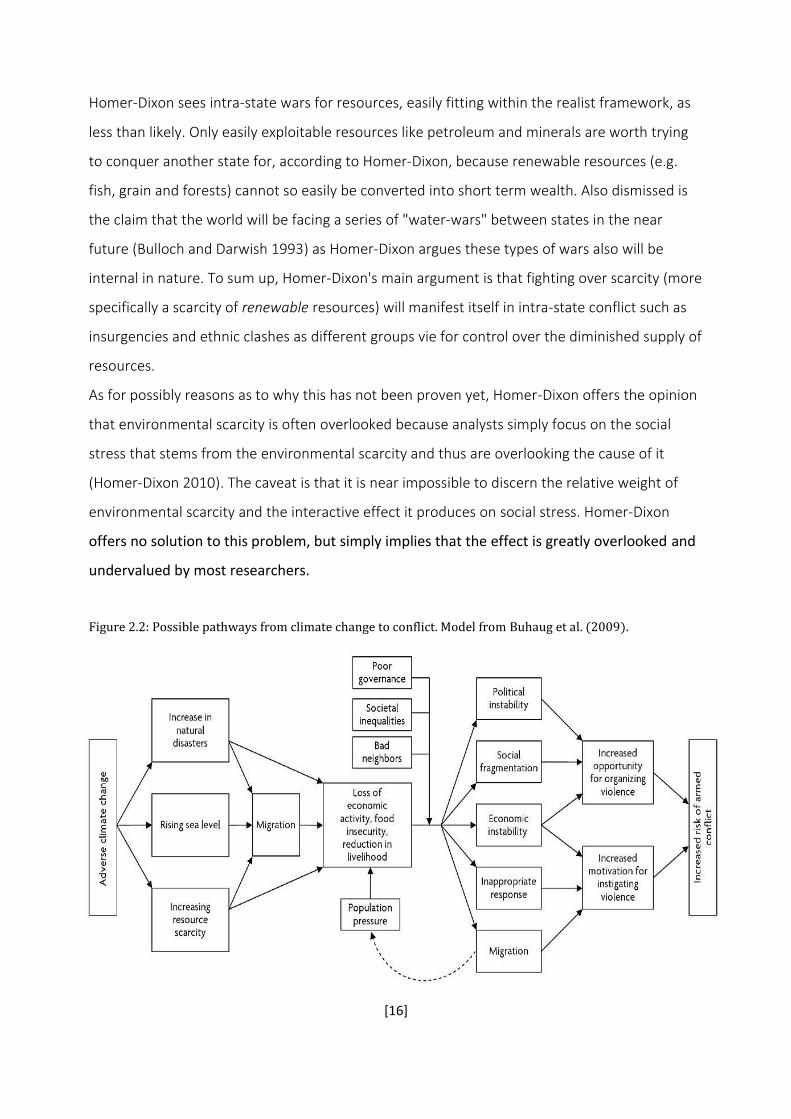
Figure 2.2: Possible pathways from climate change to conflict. Model from Buhaug et al. (2009).

[17]
Buhaug, Gleditsch and Theisen present a more refined version of Homer-Dixon’s original model
and identify five social effects from climate change that are suggested to be crucial catalysts for
organized violence (Buhaug et al. 2009). First, reduced state income stemming from resource
scarcity may reduce political legitimacy through promises that cannot be delivered and give
momentum to political challengers. Second, increased resource competition within a
heterogeneous society may intensify social cleavages and make the population more prone to
radicalization. Third, loss of resources in a subsistence-economy may lead to unemployment
and a negative impact on the economy, again reducing state income. Fourth, fighting or
adapting to climate change may lead to increased tensions and could give rise to actors with
hidden agendas (Salehyan 2008). Finally, adverse environmental effects may force people to
migrate and will put increased pressure on the areas where people migrate to. Again, it is
important to keep in mind that the end product of the model is an increase in the risk of armed
conflict, and that none of the factors are sufficient in themselves: Rich and stable states could
shoulder the increased pressure from the effects, while weak states stand a larger risk of
nearing the critical threshold.
2.3 Trying to link climate and conflict
When discussing the link between climate and conflict one should note that the recent trend of
increasing temperature has coincided with a decrease in the number of active conflicts across
the world. This is a very simple bivariate assessment, but it serves to prove that caution is
needed when discussing climate wars as something that is bound to happen (Buhaug et al.
2009).
The effect of what Homer-Dixon titles social stress has been tried conceptualized in civil war
research. Several of the casual chains that Homer-Dixon provides in his model are already an
established part of the literature: Poverty (in the form of GDP per capita or development) has
been found to be a robust variable for predicting the chance of a civil war outbreak. The same
goes for a large population in the country of question (Collier and Hoeffler 2004; Fearon and
Laitin 2003; Hegre et al. 2001; Hegre and Sambanis 2006). More specifically for this paper Koubi
et al. (2012) refutes that the link between climate change, economic growth and conflict is

[18]
provable and that more research with better indicators is needed to come closer to any
conclusions. Bergholt and Lujala (2012) finds that climate-related natural disasters negatively
affect economic development in the affected country, but the economic downturn does not
translate into increased risk of civil war as proposed by Homer-Dixon. This last paper bears an
extra mention as it severs the link between step 2 and 3 of Homer-Dixon's model (see figure
2.1).
Other attempts at creating casual chains between climate change and civil conflict have been
attempted, especially the link between dry and wet periods and violence in Africa. Case studies
by Adano et al. (2012), Theisen (2012) and Butler and Gates (2012) all find that wetter periods
in different regions of Africa are in fact associated with an increased risk of violence and/or
conflict. Benjaminsen et al. (2012) finds little evidence that environmental and water scarcity
are important drivers for inter-communal conflicts in Mali while Hendrix and Salehyan (2012)
finds that there is a slightly increased risk of violence after heavy rain after examining a dataset
for social conflict in Africa. Theisen et al. (2011) dispute the claim that periods of severe
drought in Sub-Saharan Africa lead to increased levels of conflict and violence. Wischnath and
Buhaug (2014) studies the link between climate variability and conflict in Asia and fails to find a
systematic relationship between the two. A recent study of the linkage between drinking water
availability and conflict risk by Böhmelt et al. (2013) finds that conflict risk is more influenced by
rising demand than by a climate-influenced reduction in supply.
On the other end of the scientific spectrum Zhang et al. (2006) tries to utilize a long-term
perspective by utilizing climate data from the entirety of the last millennium for China. They
find that colder periods introduced a slightly higher risk of conflict. The same results also goes
for Tol and Wagner (2010) who uses similar methods for Europe. They also introduce the
finding that the relation weakens with the advent of the industrial world. Possible explanations
are thought to be a semi-Malthusian effect caused by reduced crops yields during colder
periods.
Finally, the link between climate and conflict has seen several debates in the last years, many of
them involving research director Halvard Buhaug of The Peace Research Institute of Oslo (PRIO).

[19]
Burke et al. (2009) claims that global warming increases the risk of conflict in Africa. This claim
was disputed and debunked by Buhaug (2010a). Buhaug has also engaged in another debate
with Hsiang et al. (2013) over their compilation of different studies that look at the effects
between climate and violence. According to the Hsiang et al’s summary of sixty different
studies there is significant evidence for a 14 percent increase in violence between groups if the
climate changes with one standard deviation. Buhaug claims that this compilation-study is
victim to the previous errors of limited causality made by the studies included in the
compilation. Buhaug also questions the selection of the included studies and the conclusions
the authors have drawn from their own findings (Bilden 2013; Buhaug 2014; Hsiang and Meng
2014).
This concludes a short overview of the literature and history concerning scarcity, climate
change and civil war. I now move on to discuss why there are good reasons to look into how
these variables interact.

[20]
3.0 Theory
In this section I argue for the use of climate-related natural disasters as an adequate measure
for the impact from climate change. I also discuss why there are caveats with modeling human
behavior stemming from exogenous shocks such as natural disasters.
3.1 Disastrous weather
The list of possible effects of climate change makes it very hard to adequately model the
changes it may bring. For the purposes of this paper I have chosen to focus on the increase in
extreme weather phenomenon, which in turn leads to more frequent occurrence of climate-
related natural disasters. A climate-related natural disaster can be defined by the occurrence of
a natural hazard that affects a vulnerable population so that it causes damage and/or deaths.
The hazard in itself does not cause a natural disaster, a disaster must by definition affect a
socio-economic environment, so disasters in unpopulated areas do not constitute disasters
(Dilley 2005). Given these definitions natural hazards can develop into natural disasters, but this
depends on human resilience and vulnerability. The hazard in this case can be heavy rainfall or
high temperatures, but if it turns into a disaster is determined by the settlement in question's
ability to cope with the given hazard. The hazard of heavy rainfall may for example cause flash
floods in one area, while a properly built city with adequate drainage may experience no
damage at all. Human preparedness and a society's institutional ability to adapt to natural
hazards therefore constitutes a large part of what determines a natural disaster (Birkmann
2006). What follows from this definition is that human settlement may in itself be the cause of
natural disasters - if improperly planned to not account for natural hazards (e.g. settlements
threatened by the coming rise in sea-levels). Another implication is that natural disasters occur
more often in poor or undeveloped areas, simply because the infrastructure cannot withstand
the exogenous shock. A good illustrative example (though not climate-related) is the Loma
Prieta earthquake in San Francisco in 1989 compared to the 2010 Haiti earthquake. Both were
magnitude 7.0 earthquakes, 62 people died in the Loma Prieta earthquake, an estimated
220.000 died in the Haiti earthquake. Socio economic conditions and building policies were
obviously the main differentiating factors behind the different outcomes.

[21]
The increase in climate-related natural disasters during the last 60 years can clearly be seen in
the data used in this paper.
Figure 2.3: Number of climate-related disasters per year vs. earthquakes. Graph from Slettebak (2012)
Source: CRED (2007)
The increase in disasters also contains the fact that more severe disasters occur more often
than previously (see McGuire 2012; Peterson and others 2012; Van Aalst 2006; Watson et al.
2000 for more). There are relevant weaknesses to the very visual increase in the number of
climate-related natural disasters however. The data reported can be susceptible to
authoritarian regimes trying to make their countries seem less troubled than in reality. For
example: A lot of data is missing from the earlier days of the communist regime in China.
Advancements in technology may also have contributed to improved reporting and routines
over time. However, the fact that reported earthquakes stay consistent while climate-related
disasters skyrocket after 1980 goes a long way to alleviate some of the reporting concerns.
3.2 Using climate-related natural disasters as a measure
There are clear weaknesses and strengths in using natural disasters as a measuring stick for
climate change. For one, there are other ways to measure natural disasters that do not adhere

[22]
to the human impact definition chosen by this paper. Purely force-based measures are
naturally untroubled by political agendas as long as there is sufficient measuring stations in
place see Brancati (2007); Burke et al. (2009 for examples of this approach), but when
approaching the subject of conflict and climate I side with Slettebak in his approach to the data:
"...humans react to the consequences of natural forces, not the forces in themselves. (...) Thus,
the most relevant measure is the level of adversity resulting from a severe weather event, not
the force of the weather event in itself.”
(Slettebak 2012)
The consequence based measure also takes human disaster adaptation into account
endogenously, which would be lost if applying a simple force-based measure. A further
poignant point of discussion is whether to classify natural hazards as exogenous or endogenous
shocks. On the one hand we do not command where rain falls or where a storm gathers; on the
other there is the vulnerability and resilience aspect of how we define a natural disaster. Social
research usually contains endogenous phenomena and it is hard to finally define which way the
effects pull. For the purpose of this paper I will follow the concept that natural hazards are
exogenous shocks that contribute to exogenous variation in the results even though disasters
are defined by the way they influence human lives. I view this as a compatible for the research
even though I argue that climate-related natural disasters are in effect anthropogenic, the
amount of complicity is of course debatable. The task of discerning whether each climate-
related natural disaster in the dataset was in fact caused by poor adaptability or simply by
overwhelming force is too large for this paper, and therefore the exogenous result is chosen as
default. Trying to limit the endogenous effect of the data I will limit the disaster data to floods
and droughts, due to data constrains.
Another positive effect of choosing to work with climate-related natural disasters is the fact
that rapid onset disasters do not facilitate adaptation and external intervention in the same
way that long time climate change will. This makes any observed correlation more likely to be a
genuine causal relationship (Theisen et al. 2013).
[23]
3.3 Why does it matter?
How do climate-related natural disasters and the risk of intrastate conflict interact? If we follow
Collier and Hoeffler (2004) in their interpretation any damage to interior infrastructure will
increase the risk. If areas become isolated and/or roads deteriorate, it will become harder for
the government to police or respond to any type of insurgency. While partly contested by
Bergholt and Lujala (2012) many other researchers see any type of reduction in GNP as
increasing the risk of civil war because of the subsequent reduction in state capacity. Bergholt
and Lujala (2012) finds the reduction in GNP after a country is struck by a climate-natural
disaster, but does not find any increased risk resulting from the reduction. Generally it can be
said that natural disasters generate a large amount of uncertainty, strife, insecurity, frustration
and scarcity. Several authors argue that these effects transform into an increased risk of
violence (Brancati 2007; Homer-Dixon 2010; Nel and Righarts 2008).There is also the evidence
of looting taking place in the aftermath of disasters, which again can lead to an increase in
violence (Barsky et al. 2006).
Sociology has tried explaining human behavior in the aftermath of natural disasters all the way
back to Durkheim, who found that social disturbances and wars led to greater social integration
(Durkheim 1951). Durkheim’s findings indicated a diminished risk of chaos and violence after
natural disasters because of the suddenly common bond between the victims. The American
scientist Charles E. Fritz picked up where Durkheim left of after the end of World War II. The
reason that he became known for the first large-scale research into human post-disaster
behavior was the American interest in trying to predict how the civil population would react to
a large scale nuclear attack. As only two nuclear attacks has ever been launched, Fritz and his
colleague turned to questionnaires distributed after natural disasters in the USA and interviews
conducted after the allied bombing campaigns in Germany.
“How do human beings act in such a situation? According to a pervasive popular conception,
they panic, trampling each other and losing all sense of concern for their fellow human beings.
After panic has subsided so the image indicates they turn to looting and exploitation, while the
community is rent with conflict. Large numbers of people are left permanently deranged

[24]
mentally. This grim picture, with its many thematic variations, is continually reinforced by novels,
movies, radio and television programs, and journalistic accounts of disaster."
(Charles E Fritz and Williams 1957)
Fritz came to a wholly different conclusion: “Even under the worst circumstances, people
maintained or quickly regained self-control and became concerned about the welfare of others”
(Charles Edward Fritz 1961). He tried to dispel what he considered a wrongful image of "base
human behavior" after disasters that he thought had falsely been put in place. Like Durkheim
he also finds what he calls "a community of sufferers", united by an external threat that brings
them together. Fritz' findings are largely backed up by other disaster sociologists (Barsky et al.
2006; Hodgkinson and Stewart 1991; Peacock et al. 1997). The caveat however is that Fritz, and
most of the other disasters dissected by sociologists all took place in western industrialized
nations. After the 2010 Haiti earthquake, Kolbe et al. (2010) estimated over 11.000 incidents of
sexual violence in the six weeks following the earthquake. They also found greatly increased
risks of physical assault, illness and malnutrition among more than half the population of the
Port-au-Prince in contrast to a matching survey that was undertaken a year before the
earthquake. There is a large literature on the problems of sexual violence in the aftermath of
natural disasters, that all conclude with a highly increased risk for women and young girls in the
immediate chaos and turmoil of a natural disaster (Enarson and Morrow 1998; Felten-Biermann
2006; Fisher 2010).
The picture of human reactions in a disaster aftermath is not a clear cut one, as we can see by
the differing theories. It is also strongly affect by who you happen to be. Ethnicity, gender and
marginalization play a large role in how much hardship one must endure in the aftermath of a
natural disaster, and it also strongly affects if one survives at all in the first place (Busch 2012;
Peacock et al. 1997)
Since this analysis provides the option for the effects from climate-related natural disasters to
affect the results both negatively and positively I find it defensibly to utilize the variables as
indicators of impact from a changing climate. However, as discussed in this section, the
sociology, psychology and societal conditions of an affected population plays a large part in

[25]
how people will react to these events. Accounting for these factors would be preferable, but as
I will discuss in my next chapter there is a clear limit to what a large scale model can take into
account.

[26]
4.0 Research Design
4.1 Why a statistical analysis?
Every researcher must make a choice as to what method is the most relevant and effective way
of reaching the answers to the research questions at hand. The goal is to end up with a
scientific product that maintains high degrees of both validity and reliability while
simultaneously making inferences that are interesting and relevant. King, Keohane and Verba
keep the viewpoint that political scientists should strive to combine both the qualitative
methods, strong on validity but sometimes weaker on the reliability, with the quantitative
methods that exhibit reverse strengths (King et al. 1995). Ultimately, according to the authors,
both methods rely on the same logic of making reliable inferences; avoiding bias and getting
the most out of your data. A sound research design is the best framework for successful theory
evaluation and that is precisely what this paper sets out to do.
When choosing between a qualitative method and a quantitative research method the tradeoff
is about what kind of inferences the researcher can make. Explaining a specific problem like
why there was an armed conflict in Gilgit-Baltistan in Pakistan in 1988, and how it was affected
or related to the flooding of the Ravi river requires an in depth study of that particular situation,
but fails to give answers that are readily reliable for other regions, conflicts or disasters. Large
statistical analysis, like this one, have the strength of being able to compare a large number of
events and factors but suffer from the fact that the observations are weak on detailed
information. Utilizing such a large amount of data often brings into the question the validity of
the indicators that are being used. The phenomena that we are trying to describe are seldom
encompassed wholly within the data at hand. This creates a distance between what we want
to say something about, and what we really say (Busch 2012: 27). While useful for saying
something about the relationship between different phenomena, statistical methods limit the
general inferences one can make about specific social effects. Naturally statistical methods also
allow the researcher to handle large amounts of observations and make systematic inferences
about the correlations in the data while being less prone to selection bias than in qualitative
case studies.

[27]
4.2 Why disaggregate?
While popular with social scientists, the usage of country-level data does not provide a very
high level of accuracy when it comes to most effects and phenomena. There are countless
examples to choose from, but for this paper it will serve to point out that any correlation
between a hypothetical drought in the east of Russia and a an outbreak of civil war in the west
of Russia would be less than ideal. The two events would correlate in a country level analysis
but in reality they would have taken place at two geographical points that are as far apart from
each other as London, United Kingdom and Nome, Alaska. When it comes to natural disasters
there is already an established precedent among earlier research to utilize grid-level data
(Dilley 2005; Peduzzi et al. 2009) and newer conflict research has also started utilizing this
method (Braithwaite 2005; Buhaug 2010b). Smaller units allow for more precise information
and take into account regional variations within countries and states. This is especially
important when assessing natural disaster vulnerability and levels of development as many
countries exhibit rather large variations between privileged and less privileged areas as well as
specific local conditions that will not be observed in a country level analysis. Likewise, most civil
wars are highly local events and many have little impact on the society at large. National data
are often poor proxies for the conditions where conflicts occur, and their use may lead to
ecological fallacy: inferring about individual behavior from aggregate data. Grid-level data also
has the distinct advantage of being socially exogenous as the borders of the independent grid
cells are not determined by actors or organizations, but rather by math. This makes the
observations more stable over time as borders and regimes change while the grid cells do not
(Tollefsen et al. 2012).
4.2.1 PRIO-GRID
The main part of the data in this paper is taken from the PRIO-GRID dataset. Each grid is a
quadratic cell on the two-dimensional terrestrial plane and the total mesh is constructed by
using vector shapes where each cell is represented by a square polygon vector (Tollefsen et al.
2012). Spatially, the grid adheres to the dominant geographic coordinate system (the World
Geodesic System, WGS84) where the arcs separating the grid cells are defined at exactly 0.5

[28]
decimal degree intervals latitude and longitude. The complete global grid matrix consists of
360 rows x 720 columns, amounting to 259,200 grid cells in total (Tollefsen et al. 2012). Several
of the control variables in this dataset are taken from the PRIO-GRID dataset as they allow us to
more accurately find within country variation on issues such as population density and GDP per
capita. The main dependent variable is also taken from the PRIO-GRID dataset.
Figure 4.1: Conversions of a high-resolution land cover raster to grid structure. The figure illustrates how a
high-resolution raster (top) is represented in PRIO-GRID (below). The string codes denote different land
cover, for example WO = woodland. Example from Tollefsen et al. (2012).

[29]
4.2.2 GIS procedure
The variables that were not already in the PRIO-GRID dataset were converted into a GIS-format
using the open source software Grass GIS. This was done by constructing the variables into a
shape file that is then spatially joined together with the existing layers already provided by
PRIO-GRID. When the layers are all combined, merged and exported they are fully usable as
normal datasets in Stata.
Figure 4.2: An animated overview of the areas affected by any type of flood between 1985 and 2002.
Together with additional data from later years this formed the basis for the flood-variable in the
disaggregated analysis.
Source: (Brackenridge et al. 2009)

[30]
4.3 Data issues and selection bias
There are several issues with the data at hand which I will all try to present in a clear manner in
the following section. Firstly, there are several different sources of disaster data available, but
the amount of GIS-data available is not at comparable levels. While Slettebak (2012) in his
country-level approach to the topic utilizes the EM-DAT disaster database, the majority of its
disaster observations lack the required spatial and longitudinal coordinates for a proper
conversion into GIS-data (see Busch 2012 where the remaining observations from EM-DAT are
utilized in a GIS-format). Rather than admit defeat at the hands of having too few disaster
observations I have constructed similar variables out of other databases. The variable for
drought is taken from the PRIO-GRID dataset itself and simply rearranged into a binominal
variable. The flood data is taken from the Darthmouth Flood Observatory database and
converted into a separate layer that was then spatially merged with the remaining data. This
gives a disadvantage when comparing the results with Slettebak’s country level analysis, but I
find it defendable given that both sources of data give reasonable results, are affiliated with
credible institutions and have previously been utilized by other researchers (Brackenridge et al.
2009; Theisen et al. 2011).
There is also a large amount of data in the dataset. For many of the variables, specifically the
dependent one, the amount of positive observations versus negative observations is very
lopsided. This is perfectly explainable by the simple fact that civil war very rarely breaks out in
any given grid cell compared to all the years where a given grid cell does not have an outbreak
of civil war. However, the amount of negative observations in the dataset did provide some
challenges when it comes to collinearity which I will address later in this chapter.
Thirdly, the nature of a natural disaster does entail some particular issues when it comes to
data collection. While there is a clear trend in regards to the amount and occurrence of natural
disasters there is also the fact that reporting measures and technology have improved over the
years. As mentioned previously, one of the conditions of a natural disaster is the fact that it
affects humans. Naturally some of the rise in the occurrence of natural disasters could
reasonably be explained by the fact that humans now inhabit far more areas and space than
previously. At the same time there are qualified reasons to expect that as the economic

[31]
conditions of many countries have bettered since the 1950s, so have their measures of disaster
reporting and assessment. That these kind of social factors have a profound impact on the data
collection is highlighted by Strömberg (2007) who points out that western democracies are
overrepresented in the data available, and that China drastically changed its reporting of
natural disasters after a change of head of state in 1979. Likewise, the flood data from the
Dartmouth Flood Observatory is hampered by the fact that coverage varies from nation to
nation and that: “In general, news from floods in low-tech countries tend to arrive later and be
less detailed than information from 'first world' countries” (DFO 2007). There isn’t however,
many good ways of amending this problem that are within the scope of this paper. I have
reproduced Slettebak’s (2012) country-level analysis as a comparison, but there is scant
evidence that suggests that country-level data does not also suffer from this problem.
Table 4.1: Number of disaster observations in the country-level analysis.
Variable Observations Mean Std. Dev. Min Max
Storms 5829 .3920055 1.401983 0 27
Floods 5829 .5040316 1.207756 0 20
Droughts 5829 .0691371 .2630068 0 3 Source: Slettebak (2012)/EM-DAT (2007)
The country-level disaster-variables take into the account the amount of disaster that a given
country has experienced during a year. The maximum for storms for example, are 27
observations of catastrophic storms in a single year for a single country, in this case Turkey, in
1945.
Table 4.2
Number of disaster observations in the disaggregated analysis.
Variable Observations Mean Std. Dev. Min Max
Floods_gis 1888850 .0226482 .1487792 0 1
Droughts_gis 1737071 .1057205 .3074796 0 1 Source: PRIO-GRID/Dartmouth Flood Observatory
[32]
The disaggregated data on the other hand is coded simply based on if the given grid-cell
experienced an observation of either a catastrophic drought or a catastrophic flood in any given
year. Given the highly dynamic nature of storms I was unable to find any source that supplied a
satisfactory amount of data that could be utilized in a disaggregated analysis. Given the large
discrepancies between the two types of data both of the analysis should be evaluated with
discretion and be viewed as complementary robustness tests.
4.4 Measurement Validity
According to Adcock and Collier (2001) a measurement is valid when the scores derived from a
given indicator can meaningfully be interpreted in terms of the systematized concept that the
indicator seeks to operationalize. As the entirety of the data in this analysis is not collected by
me I can merely advise the same discretion when interpreting the results as I myself have put
to ground. I have provided a full description of what the different variables, their indicators and
how they are operationalized.
4.5 Dataset and unit of analysis
The datasets that are utilized are the PRIO-GRID dataset and its sub-datasets such as the
Climate and Socioeco parts of the dataset (Tollefsen 2012). Furthermore, the disaggregated
analysis uses data from the Dartmouth Flood Observatory (Brackenridge et al. 2009) and a
variable constructed from the dataset of Fearon and Laitin (2003).
The country-level data is a replication of Slettebak (2012) analysis and utilizes data from Fearon
and Laitin (2003), Collier and Hoeffler (2004) and the EM-DAT disaster database (CRED 2007).
The unit of analysis is the risk of civil war developing, commonly named as civil war onset, or
simply onset throughout many parts of this paper.
[33]
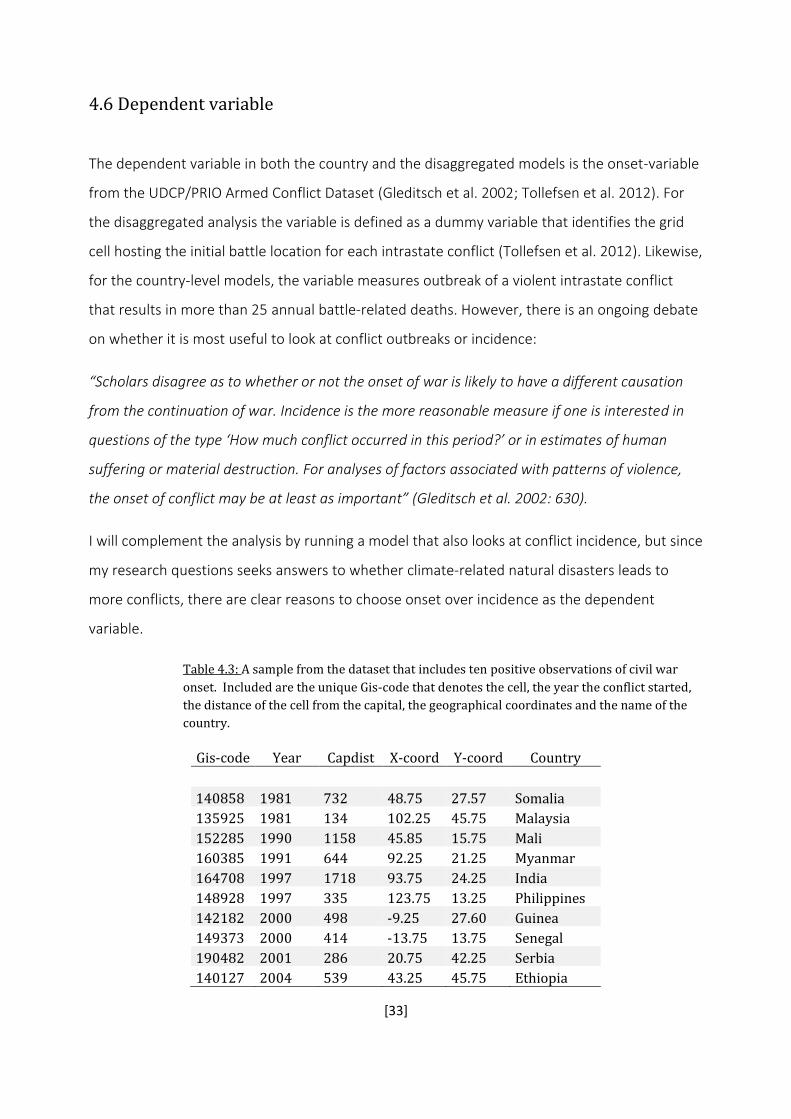
4.6 Dependent variable
The dependent variable in both the country and the disaggregated models is the onset-variable
from the UDCP/PRIO Armed Conflict Dataset (Gleditsch et al. 2002; Tollefsen et al. 2012). For
the disaggregated analysis the variable is defined as a dummy variable that identifies the grid
cell hosting the initial battle location for each intrastate conflict (Tollefsen et al. 2012). Likewise,
for the country-level models, the variable measures outbreak of a violent intrastate conflict
that results in more than 25 annual battle-related deaths. However, there is an ongoing debate
on whether it is most useful to look at conflict outbreaks or incidence:
“Scholars disagree as to whether or not the onset of war is likely to have a different causation
from the continuation of war. Incidence is the more reasonable measure if one is interested in
questions of the type ‘How much conflict occurred in this period?’ or in estimates of human
suffering or material destruction. For analyses of factors associated with patterns of violence,
the onset of conflict may be at least as important” (Gleditsch et al. 2002: 630).
I will complement the analysis by running a model that also looks at conflict incidence, but since
my research questions seeks answers to whether climate-related natural disasters leads to
more conflicts, there are clear reasons to choose onset over incidence as the dependent
variable.
Table 4.3: A sample from the dataset that includes ten positive observations of civil war
onset. Included are the unique Gis-code that denotes the cell, the year the conflict started,
the distance of the cell from the capital, the geographical coordinates and the name of the
country.
Gis-code Year Capdist X-coord Y-coord Country
140858 1981 732 48.75 27.57 Somalia
135925 1981 134 102.25 45.75 Malaysia
152285 1990 1158 45.85 15.75 Mali
160385 1991 644 92.25 21.25 Myanmar
164708 1997 1718 93.75 24.25 India
148928 1997 335 123.75 13.25 Philippines
142182 2000 498 -9.25 27.60 Guinea
149373 2000 414 -13.75 13.75 Senegal
190482 2001 286 20.75 42.25 Serbia
140127 2004 539 43.25 45.75 Ethiopia
[34]
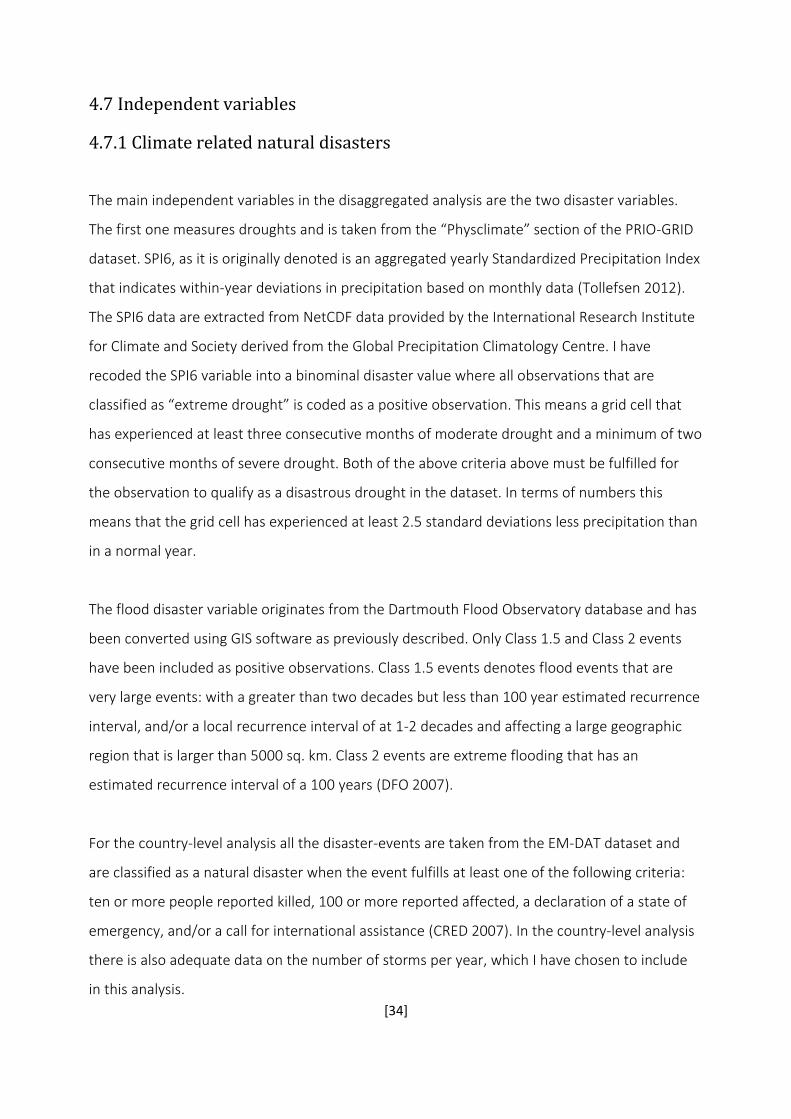
4.7 Independent variables
4.7.1 Climate related natural disasters
The main independent variables in the disaggregated analysis are the two disaster variables.
The first one measures droughts and is taken from the “Physclimate” section of the PRIO-GRID
dataset. SPI6, as it is originally denoted is an aggregated yearly Standardized Precipitation Index
that indicates within-year deviations in precipitation based on monthly data (Tollefsen 2012).
The SPI6 data are extracted from NetCDF data provided by the International Research Institute
for Climate and Society derived from the Global Precipitation Climatology Centre. I have
recoded the SPI6 variable into a binominal disaster value where all observations that are
classified as “extreme drought” is coded as a positive observation. This means a grid cell that
has experienced at least three consecutive months of moderate drought and a minimum of two
consecutive months of severe drought. Both of the above criteria above must be fulfilled for
the observation to qualify as a disastrous drought in the dataset. In terms of numbers this
means that the grid cell has experienced at least 2.5 standard deviations less precipitation than
in a normal year.
The flood disaster variable originates from the Dartmouth Flood Observatory database and has
been converted using GIS software as previously described. Only Class 1.5 and Class 2 events
have been included as positive observations. Class 1.5 events denotes flood events that are
very large events: with a greater than two decades but less than 100 year estimated recurrence
interval, and/or a local recurrence interval of at 1-2 decades and affecting a large geographic
region that is larger than 5000 sq. km. Class 2 events are extreme flooding that has an
estimated recurrence interval of a 100 years (DFO 2007).
For the country-level analysis all the disaster-events are taken from the EM-DAT dataset and
are classified as a natural disaster when the event fulfills at least one of the following criteria:
ten or more people reported killed, 100 or more reported affected, a declaration of a state of
emergency, and/or a call for international assistance (CRED 2007). In the country-level analysis
there is also adequate data on the number of storms per year, which I have chosen to include
in this analysis.

[35]
4.7.2 Control variables
I have chosen control variables that are consistent with previous research in the field of what
constitutes greater chances of a civil war onset (Collier and Hoeffler 2004; Fearon and Laitin
2003; Hegre et al. 2012).
4.7.2.1 Population
Population, and population density, is deemed to be a significant factor in predicting the risk of
a civil war outbreak. While there is evidence that population size does not affect the length of a
conflict (Buhaug and Lujala 2005), and different opinions on whether it makes conflicts more
severe or not (Gleditsch et al. 2009; Lacina et al. 2006), it is proven significant when
determining risk of civil war onset:
“Greater populations are associated with increased conflict risks, and a country with the
population size of Nigeria has an estimated risk that is about three times higher than a country
the size of Liberia.8 The increase in the risk of conflict does not increase proportionally with
population, however—the per-capita risk of civil war onset decreases with population size.
(Hegre et al. 2012: 255).
The population variable in the disaggregated analysis is taken from the PRIO-GRID dataset,
where it is originally coded from the Gridded Population of the World, version 3 (CIESIN 2005).
4.7.2.2 Economy
General levels of income or the gross domestic product per capita is also determined as a
contributing factor when assessing risk of civil war outbreak. Higher levels of income per capita
reduces the risk of conflict and this is a robust finding across several different and varied
[36]
studies (Collier and Hoeffler 2004; Fearon and Laitin 2003; Gleditsch et al. 2009; Hegre et al.
2001). There are different ways to interpret the variable as Collier and Hoeffler (2004) for
example takes the view that GDP per capita signifies the capabilities and infrastructure of the
state in question. Therefore a high GDP per capita may signify a content population, but could
also (or instead) imply a state that simply has the means and resources to suppress any
rebellion quickly and efficiently. The variable is taken from the Nordhaus G-ECON dataset and is
the gross cell product per capita in 1995 (Nordhaus 2006). The data has been extrapolated and
measured against the other five year intervals that are available in the dataset.
Countries that derive a large portion of their income from petroleum exports have previously
been found to be at a greater risk of experiencing a civil war (Fearon and Laitin 2003; Slettebak
2012). The data on oil exports are from the World Bank (2007) and have been expanded to
include all cells in a given country. This may provide a slightly tilted result as some countries
divide the money from oil exports unevenly among different provinces and regions.
4.7.2.3 Terrain and distance to capital
In civil wars the terrain and distance the opponents have to traverse can be vital in determining
whether the rebel faction can sustain or even launch a campaign. Mountainous terrain and
dense jungle often provide safe harbors for rebel militia that deters government forces from
launching large scale operations against them, the FARC in Colombia and the Taliban in
Afghanistan are current examples of organizations aided by these factors. In the disaggregated
analysis I have included a mountainous variable that measures how rugged a specific cell is. The
variable gives the proportion (i.e., average pixel value, in percent) of mountainous terrain
within each cell. This indicator is based on high-resolution mountain raster data that were
developed for UNEP’s Mountain Watch Report (Blyth 2002; Tollefsen 2012). The other terrain-
based variable is the given cell’s distance to the country’s capital measured in kilometers. The
capital is determined from which country code the cell adheres to (Tollefsen 2012).

[37]
4.7.2.5 Regimes and stability
Regime type and the age of a new state can influence its institutional stability and its risk of
experiencing a civil war. The new state-variable is a simple dummy that determines whether
the cell in question is located within a newly born state within a time frame of three years. The
data comes from the Polity IV dataset and the Correlates of War Project (Marshall and Jaggers
2006; Sarkees and Wayman 2010). Likewise the variable that measures regime stability is a
simple dichotomy that takes into the account that regimes that range between -5 and 5 on the
Polity IV Scale, typically anocracies, experience a higher risk of conflict (Hegre et al. 2001;
Marshall and Jaggers 2006; Slettebak 2012).
4.7.2.6 Ethnic and religious fractionalization
The country-level analysis contains variables for ethnic and religious fractionalization within a
country and are directly imported from Fearon and Laitin (2003). The variables are constructed
by Fearon and Laitin and “consists of data from the ethnolinguistic fractionalization index (ELF),
a measure of the share of the population belonging to the largest ethnic group constructed
from the CIA Factbook and other sources” (Fearon and Laitin 2003: 78-79). Sadly, it proved too
large a task to construct similar variables for the disaggregated analysis, considering that the
construction process for the original variables is not readily apparent. Cederman et al. (2009)
utilize a disaggregated ethnicity variable for exploring ethno-nationalist civil wars on a global
scale. I have tried to incorporate their data, but have found that the limits on the available data
constrict the disaggregated analysis to a level that made it necessary to drop the variable in the
final analysis. This is regrettable as it is likely an important variable and its absence should
therefore be noted when interpreting the results.

[38]
4.7 Regression models
I utilize the following two regression models to see if there is a significant relationship between
climate-related natural disasters and the risk of civil war.
For the country level analysis:
Y(Onset) + β0 + β1(Conflict previous year) + β2(GDP/capita, lagged) + β3(Population
size lagged) + β4(Rough terrain) + β5(Noncontiguous state) + β6(New state) +
β7(Instability, lagged) + β8(Level of democracy) + β9(Ethnic fractionalization) +
β10(Religious fractionalization) + β11(Storms) + β12(Floods) + β13(Droughts) + ϵ
For the disaggregated analysis:
Y(Onset) + β0 + β1(Cell population, lagged) + β2(Cell GDP/capita 1995, extrapolated) +
β3(Cell distance to Capital) + β4(Petroleum exports) + β5(Cell in New state) + β6(Rough
terrain) + β7(Level of Democracy) + β8(Flood in cell) + β9(Drought in cell) + ϵ
4.8 Statistical model
I employ a statistical model where the dependent variable is in the form of a binominal value
that differs between one and zero. I therefore utilize a binominal logistic regression model to
explain the outcomes.
4.8.1 Logistic binominal regression
Standard linear regression models do not handle outlying observations in a manner that
provide a plot that is easily translatable. Non-linear models such as the logistic binominal
regression model which I will utilize in this paper are better at handling discrepancies in the
data and provide an answer that is translated as the logarithmic odds of a given outcome, in
this case the risk of civil war onset. Furthermore, when using binominal count measures such as
the dependent variable in this case; ordinary least square (OLS) models may lead to inefficient
and inconsistent estimates (Long and Freese 2006). A logistic model takes into account the
heavily centered distribution of the results, which naturally are all centered either at 0 or 1.

[39]
4.8.2 Model specifications
Because the model assumes that all observations are independent from each other, while in
reality they are in fact not, certain measures have to be taken. Utilizing the robust option to
compensate for violations of the assumption produces more accurate and conservative
standard errors (Long and Freese 2006). Further using the clustering option tries to minimize
the effect of observations that are not independent of each other, such as observations within
the same country. Hopefully this eliminates some of the problems from having the effects of
one civil war driving the results of another. This leads me to clustering the observations by
country code, both in the country-level and in the disaggregated analysis. Further measures,
such as year-dummies and random effects models are explained in Chapter 6.
4.9 Missing data
Having employed a conservative approach to the collection of the data I have eliminated the
worst of the problems with missing data points by simply narrowing the analysis to the period
after 1980. The disaster data turns out to be more comprehensive after 1980 and the
previously mentioned problem with a politically motivated period of missing data from China is
mitigated as well. In the disaggregated analysis there is a wide berth of missing data on both
cell populations and GDP measures as there simply are no existing yearly measures on a grid-
level detail for neither of these variables. Both have been extrapolated and interpolated to
make them viable for analysis. The variable for petroleum exports is the variable with the most
missing observations and since it does not contribute to the disaggregated analysis I have
removed it from my models. For the replicated analysis it is included in the same models as per
the original. As with all data-sets of such a considerable size as the disaggregated one it is
important to keep in mind all the potential disturbances and problems that goes into collecting
so much data. Caution is advised when interpreting the results.

[40]
4.10 Summary statistics
Table 4.3: Country-level summary statistics
Variable Obs Mean Std. Dev. Min Max
Onset 4569 .033 .179 0 1
Previous Conflict 4526 .177 .382 0 1
GDP/cap 5268 8.274 1.194 4.094 11.558
Population, ln 5138 8.512 2.085 2.302 14.096
Rough terrain 4308 2.096 1.432 0 4.557
Noncontigious 4308 .156 .363 0 1
New state 5829 .014 .119 0 1
Instability 4398 .129 .335 0 1
Anocracy 4354 .236 .424 0 1
Ethnic frac. 4308 .409 .280 .001 .925
Religious frac. 4308 .381 .280 0 .782
Storms 5829 .392 1.401 0 27
Floods 5829 .504 1.207 0 20
Drought 5829 .069 .263 0 3
Table 4.4: Disaggregated analysis summary statistics
Variable Obs Mean Std. Dev. Min Max
Onset 1814926 .001 .011 0 1 Cell Population
(log) 1688108 8.334 3.111 0 16.700
GDP per capita (log)
1716624 9.987 1.340 6.498 16.716
Capital distance (log)
1814771 7.013 1.104 0.693 8.981
Ex. Constraints 1709505 2.432 4.557 -6 7
New State 1815257 .003 .058 0 1
Rough Terrain 1816202 .225 .352 0 1
Anocracy 1789881 .187 .390 0 1
Floods 1816094 .018 .135 0 1
Droughts 1677172 .108 .310 0 1

[41]
4.11 Multicollinearity
Multicollinearity can be a problem if a certain independent variable inexplicably exerts an
unproportionally strong influence on another independent variable. This can make it hard to
isolate the effects of each variable on the dependent variable as the effects from both
independent variables will appear at the same time (Skog 2005). The will results in inflated
standard errors and insignificant relationships. By calculating the Variance Inflation Factor (VIF)
of the models I am able to see if there are any worrisome effects. The mean VIF for the full
model of my disaggregated analysis is 1.29 and the highest score is 1.74, which is far below the
threshold for troublesome variables, which is set at 10. For the country-level analysis the
highest VIF-score is even lower at 1.56. Looking at the correlations in table 4.5 there are no
variables that approach the threshold value of 0.7. In other words: Multicollinearity is not a
problem in the analysis.
Table 4.5: Cross-correlation table for the main variables in the disaggregated analysis
Onset Pop/cell GDP/cell Distance Newstate
Onset 1.0000
Pop/cell 0.0121 1.0000
GDP/cell -0.0091 -0.4694 1.0000
Distance -0.0127 -0.5792 0.3516 1.0000
Newstate 0.0064 0.0160 -0.0171 -0.0560 1.0000
Terrain 0.0028 0.0160 -0.0406 0.1489 -0.0148
Xconst -0.0020 -0.1690 0.4554 0.0567 -0.0363
Drought 0.0002 -0.0060 0.0207 -0.0054 0.0034
Flood 0.0006 0.0497 -0.0228 -0.0251 -0.0030
Terrain Xpolity Drought Flood
Terrain 1.0000
Xconst -0.0597 1.0000
Drought -0.0024 -0.0256 1.0000
Flood 0.0083 0.0195 -0.0201 1.0000

[42]
5.0 Analysis
5.1 Country level analysis
The original research question of this paper is whether climate related natural disasters have
any effect on the risk of civil war outbreak. Rune Slettebak tried answering this question in his
2012 article “Don’t Blame the Weather: Climate Related Natural Disasters and Conflict”, and my
country level analysis is a modified replication of his study. The country level data spans over a
longer period of years than what is available for the disaggregated study, but for comparative
reasons I have cut the country-level analysis down to the same time frame as the disaggregated
analysis. This operation does not affect the results of the main variables dramatically.1
Slettebak’s approach utilizes Fearon and Laitin’s (2003) dependent variable in the first model
and then moves on to the onset variable from the UDCP/PRIO Armed Conflict Dataset in the
following models (Gleditsch et al. 2002). In Fearon & Laitin’s baseline model the data behaves
differently in the form of giving large explanative weight to the dummy that determines
whether the country experienced conflict the previous year or not. In all of the other models
the dummy turns insignificant and has little to no explanative power.
The baseline model for the UDCP/PRIO onset variable establishes that population size and GDP
per capita are highly significant and important drivers when determining the risks of civil war
onset. These two variables perform well and are by far the most robust in terms of maintaining
their significance across models and specifications. The terrain variable loses a lot of its
significance when removing the decades from 1945-1980 and performs much better in
Slettebak’s original analysis. It remains significant at lower levels throughout most of the
models however and still predicts a small risk increase in the chance of a civil war starting in
countries where the factions may utilize terrain that is hard to access.
The noncontiguous variable actually provides explanatory power in all of the UDCP/PRIO-
models, which they do not do in Slettebak’s analysis. The variable for petroleum exporting
countries does not perform robustly across models and is dropped after the baseline models
1 See the appendix for the full country-level analysis from 1945-2007.

[43]
because it strains the amount of available observations. However the dummy that takes into
effect whether a state is newly founded performs strongly across all models and shows that
new states have a significantly higher chance of experiencing civil war outbreaks than old states.
The instability variable loses all explanatory power in this analysis, and performs poorly in
Slettebak’s original analysis as well. The anocracy dummy provides significant results that
indicate increased risk of civil war, but its explanatory value is challenged in the following grid-
level analysis. Both of the variables that measures ethnic and religious fractionalization provide
strong results, but religious fractionalization performs better in this analysis than in the original
results.
Looking at the independent disaster variables Slettebak’s count measure, which simply
measures the amount of disasters in a given country in one year, adds very little to the model.
However, the binary dummy performs well and shows that countries that experience a natural
disaster experience a reduction in the risk of a civil war breaking out. When categorized into
separate variables only droughts give significant results in the original analysis, but in this
concentrated replication it loses its significance. Slettebak introduces an interaction term
between population and the binary disaster variable in the final model that retains some of its
significance in this replication. Its results show that countries that have increased risk of civil
war outbreaks because of large populations will experience a significant decrease in this type of
risk if they experience a natural disaster.

[44]
Table 5.1: Country-level analysis 1980-2007
Dependent variable
(1) F&L onset
(2) Onset
(3) Onset
(4) Onset
(5) Onset
(6) Onset
Conflict previous year
-1.107** (0.463)
-0.012 (0.325)
-0.138 (0.336)
-0.137 (0.330)
-0.161 (0.336)
-0.150 (0.340)
GDP/cap, lagged
-0.536*** (0.143)
-0.440*** (0.135)
-0.512*** (0.146)
-0.505*** (0.146)
-0.507*** (0.145)
-0.505*** (0.146)
Pop. Size (ln), lagged
0.260** (0.108)
0.223** (0.082)
0.248** (0.079)
0.286*** (0.074)
0.230** (0.082)
0.104 (0.123)
Rough terrain
0.180 (0.121)
0.151* (0.083)
0.121 (0.079)
0.141* (0.078)
0.131* (0.079)
0.150* (0.079)
Noncontiguous state
0.757 (0.496)
0.755** (0.335)
0.844** (0.362)
0.871** (0.362)
0.867** (0.353)
0.781** (0.377)
Oil exporter
0.437 (0.442)
0.543* (0.315)
New State
2.572*** (0.626)
1.734** (0.604)
1.650** (0.618)
1.620** (0.624)
1.705** (0.624)
1.570** (0.619)
Recent Instability (lag)
0.540 (0.352)
-0.252 (0.259)
-0.250 (0.239)
-0.234 (0.241)
-0.237 (0.239)
-0.227 (0.242)
Anocracy (lag)1 0.044* (0.026)
0.328 (0.264)
0.441* (0.248)
0.454* (0.242)
0.417* (0.244)
0.502** (0.250)
Ethnic fractionalization
0.407 (0.616)
1.459** (0.495)
1.404** (0.487)
1.415** (0.490)
1.396** (0.482)
1.386** (0.490)
Religious fractionalization
0.065 (0.803)
-0.888* (0.537)
-1.049** (0.517)
-1.113** (0.509)
-0.988* (0.521)
-1.098** (0.516)
Disasters, count
-0.007 (0.035)
Disasters, binary
-0.437** (0.194)
-3.065** (1.529)
Storms
-0.064 (0.072)
Floods
0.070 (0.084)
Droughts
-0.482 (0.304)
Disaster * Population
0.278* (0.162)
Constant
-6.073*** (1.121)
-3.325** (1.353)
-2.795** (1.412)
-3.090** (1.399)
-2.661* (1.427)
-1.462 (1.589)
Observations
2744 3224 3734 3734 3734 3734
Pseudo R2 0.139 0.144 0.133 0.137 0.139 0.140 1 Model 1: score on Polity IV scale; all other models: anocracy dummy. Robust standard errors in parentheses. ***p < 0.01, **p < 0.05, *p < 0.1. Fearon & Laitin’s (2003) original dependent variable is used in Model 1, while the dependent variable in the other models is from UCDP/ PRIO Armed Conflict Dataset (Gleditsch et al., 2002; Strand, 2006). All models but the original one from Fearon & Laitin are run with robust standard errors and year-fixed effects (year dummies not shown).

[45]
5.2 Disaggregated analysis
The disaggregated analysis is my own and therefore it is subjected to several alterations
compared to the replication of Slettebak’s country level analysis. The baseline model contains
most of the variables from the country level analysis but the variables for petroleum exporting
countries, noncontiguous borders and previous instability are omitted because they do not
contribute to the analysis in a significant manner. I was unable to reproduce cell-based versions
of the variables for ethnic and religious fractionalization. Successful attempts have been made
by Cederman et al. (2009) for measuring the effects of marginalized groups by using center—
periphery dyads and the results indicate a significant increase of risk for ethnic civil wars in
dyads with marginalized groups. It should be noted that an ethnic
fractionalization/marginalization variable would have contributed to this analysis.
Another important difference from Slettebak’s replication is that I have chosen to lag the
dependent variable by one year in the standard models. I have taken this measure because I
find it more plausible that social effects like resource deprivation, desperation and aggression
that that stem from a natural disaster will need time to grow into fully fledged conflicts. I have
provided models that lag the onset variable by additional years and have also included an
incidence model for comparison.
The baseline model provides highly significant and expected results for all the main variables.
The risk of civil war increases with population size and decreases with a higher gross domestic
product per capita. The results for these two variables continue to stay consistent and reliable
throughout all of the models in the cell-based analysis. The log-transformed variable that
measures the distance from the cell to the country’s capital is also highly significant and shows
that the risk of a civil war onset in a cell decreases the further away from the capital the cell is
located. This finding is consistent with the fact that many of the opening battles of a civil war
erupt close to or even in the capital itself. The variable that measures mountainous and
inaccessible terrain does not perform well throughout the models and is only slightly significant
in the baseline model.
The second model adds the anocracy dummy from the country level analysis that is based on
the PolityIV scale. I have also included a democracy dummy from PolityIV for comparison.

[46]
However, the PolityIV scale is arguably a flawed measure when it is used as an independent
variable in conflict onset scenarios. James Vreeland (2008) shows that the composition of the
PolityIV scale uses variables that themselves captures the effects of civil war and violence. He
concludes that “Using this variable to test the relationship between regime and civil war is
tantamount to tautology” (Vreeland 2008: 7). To alleviate the problems with the PolityIV scale I
instead opt to use the solution from Koubi et al. (2012) where the “Constraints on Chief
Executive (XCONST)” variable is used instead of the full PolityIV scale. Predicted and shown by
Vreeland, the effects from the PolityIV scale disappears once these steps are employed. The
same is true for the quadrated version of the variable.
Model 3 adds the disaster variables to the equation and provides results that are similar to the
country level analysis in terms of the lack of any significance. Neither floods nor droughts add
any explanatory power to the analysis. The next model also disputes Slettebak’s significant
findings for a binary disaster variable.
However when lagging the dependent onset variable further, respectively by two and three
years in model 5 and 6, the results change dramatically. While the main control variables stay
consistent with the other models the result for the drought variable turns significant at the 95
percent level. The models state that the odds of a civil war breaking out in a cell that
experienced catastrophic drought increase with 1.83 two years after the drought and 1.63
three years after the drought. In other words: Two years after a cell experienced drought it has
nearly double the chance of a civil war erupting than a cell that did not experience a drought
two years prior. The effect is driven by the fact that the dataset only contains a total of 186
conflict onsets in the total time period. Nearly 18 percent of all conflict onsets in the dataset
happened in a cell that had experienced a drought two years prior (see table 5.3). Examples of
matches include cells in Burundi, Angola, and Liberia all during the middle part of the 1990s.
The majority of the matches stem from the Sahel-region, but Pakistan, India and Thailand are
also present. The flood-variable remains insignificant throughout both of the models as there
where only seven and eight matches, respectively, for cells that experienced a civil war onset
two and three years after a major flood. Also of note is the fact that the variable for new states
becomes obsolete when the onset variable is lagged three years.

[47]
Table 5.2: Grid-level analysis 1980-2007
Dependent variable
(1) Onseta
(2) Onseta
(3) Onseta
(4) Onseta
(5) Onseta
(6) Onsetb
(7) Onsetc
Cell population (log)
0.471*** (0.081)
0.503*** (0.077)
0.487*** (0.092)
0.478*** (0.090)
0.479*** (0.089)
0.486*** (0.090)
0.477*** (0.091)
Cell-GDP/cap (log)
-0.508*** (0.108)
-0.492*** (0.135)
-0.521*** (0.157)
-0.547*** (0.143)
-0.554*** (0.143)
-0.558*** (0.143)
-0.545*** (0.142)
Distance to Capital (log)
-0.616*** (0.158)
-0.553*** (0.147)
-0.562*** (0.165)
-0.571*** (0.163)
-0.575*** (0.162)
-0.591*** (0.163)
-0.609*** (0.169)
Cell is part of a new state
2.252*** (0.554)
2.424*** (0.497)
2.286*** (0.621)
2.315*** (0.626)
2.310*** (0.626)
1.931*** (0.612)
d
Rough Terrain
0.656* (0.346)
0.658* (0.376)
0.598 (0.409)
0.616 (0.407)
0.608 (0.407)
0.549 (0.417)
0.603 (0.420)
Anocracy
0.918*** (0.329)
Democracy
0.486 (0.337)
Xconst
0.057 (0.047)
0.023 (0.041)
0.024 (0.041)
0.035 (0.042)
0.033 (0.044)
Xconst2
-0.011 (0.009)
Drought in cell
0.130 (0.256)
0.609** (0.285)
0.492** (0.250)
Flood in cell
-0.021 (0.513)
0.012 (0.408)
0.437 (0.491)
Disasters, binary
0.055 (0.264)
Constant
-6.042*** (1.922)
-7.235*** (2.108)
-6.269*** (2.411)
-6.109*** (2.362)
-6.028** (2.356)
-6.090*** (2.297)
-5.975*** (2.306)
Observations
1 571 991 1 554 690 1 418 959 1 414 264 1 481 959 1 359 701 1 299 685
Pseudo R2
0.147 0.153 0.143 0.139 0.142 0.142 0.139
a Lagged one year b Lagged two years
c Lagged three years d Omitted because 0 explains failure perfectly Robust standard errors in parentheses. ***p < 0.01, **p < 0.05, *p < 0.1.
All models with robust standard errors (country clusters).

[48]
Table 5.3 Tabulation of conflict onsets and droughts
5.3 Summary
Overall the country-level analysis performs as expected and shows a reduction in the risk of civil
war outbreaks if a country suffers a climate-related natural disaster that same year. However,
this finding is only consistent when utilizing Slettebak’s binary disaster variable. The main
control variables for population and gross national product per capita perform well and
produce results that are plausible and consistent with several other studies (Fearon and Laitin
2003; Hegre and Sambanis 2006; Hegre et al. 2012). Fearon and Laitin’s control variable that
measures if the rebels have access to an area that does not share borders with the country in
question turns relevant in this analysis, but it is driven by a very small number (9) of positive
observations. The main bulk consists of three conflicts in post-Soviet Russia and two
insurgencies in Kashmir during the 1980s. Indonesia and Papau New Guinea also features as
positive observations because Fearon and Laitin (2003) coded the variable so that more than
100 kilometers of open sea between the belligerents constitutes as a positive observation. In
0
5
10
15
20
25
30
35
0 1 2 3 4
Nu
mb
er
of
con
flic
t o
nse
ts
Years after cathastorfic drought
[49]
general, the low number of total conflict onsets during the period necessitates a lot of caution
when interpreting the results.
In the disaggregated analysis the main control variables continue to perform as expected and
provide very similar results to the country level analysis. The variable that measures distance to
the capital shows that the majority of conflicts after 1980 had their initial battle close to the
capital city. Over 25 percent of the onsets happened less than 100 kilometers from the capital
in question, examples being the Second Congo War which is coded as starting with the battle to
secure Kinshasa International Airport. As mentioned in the previous section, when taken into
account, Vreeland’s (2008) critique of the PolityIV scale makes it lose its explanatory power.
Clearly, the most interesting finding is the fact that cells struck by droughts experience a much
higher risk of hosting the initial battle of a conflict more than one year later. There are however,
numerous reasons to temper the expectations as to what these findings signify, as I will try to
explain in the coming chapter and the conclusion.

[50]
6.0 Robustness and model fit
6.1 Mixed-effects and outliers
I have tried to be as clear as possible in regards to the procedural steps taken in the analysis. To
further prove that the models are thoroughly robust I have run the complete set of models with
fixed effects and random effects as well as year dummies and country dummies2. This is done
to make sure that there is no single year or country that is unbalancing the results from the
analysis.
I have utilized the mixed effects measure when looking at my own disaggregated model.
Repeated measures models, such as this one, “usually include an underlying “functional”
relationship between at least one of the predictor variables and the observations within
individuals” (or countries, as in this analysis) (Lindstrom and Bates 1990: 3). Mixed effects
models for repeated measures data are popular because their flexible covariance structure
allows for nonconstant correlation among the observations and/or unbalanced data. Running
the models with mixed effects confirms that the results from the analysis are robust, and more
specifically that no single country is unbalancing the results. Furthermore, looking at the
dfbetaes for the variables and Cook’s distance-calculations there are no observations that come
close to approach the critical thresholds. This provides added insurance that none of the
observations are highly influential outliers that distort the inferences gathered from the
analysis.
2 Complete figures and tables can be found in the appendix.

[51]
Table 6.1: Grid-level analysis 1980-2007, all models with mixed-effects
Dependent variable
(1) Onseta
(2) Onseta
(3) Onseta
(4) Onseta
(5) Onseta
(6) Onsetb
(7) Onsetc
Cell population (log)
0.642*** (0.071)
0.643*** (0.072)
0.660*** (0.076)
0.651*** (0.076)
0.660*** (0.076)
0.662*** (0.790)
Cell-GDP/cap (log)
-0.576*** (0.129)
-0.567*** (0.131)
-0.519*** (0.150)
-0.595*** (0.143)
-0.609*** (0.145)
-0.619*** (0.145)
Distance to Capital (log)
-0.248*** (0.098)
-0.248** (0.100)
-0.198* (0.105)
-0.219** (0.105)
-0.205* (0.105)
-0.248** (0.106)
Cell is part of a new state
1.767*** (0.467)
1.685*** (0.557)
1.547*** (0.524)
1.726*** (0.510)
1.714*** (0.510)
1.250** (0.586)
Rough Terrain
0.932*** (0.251)
0.960*** (0.254)
0.956*** (0.272)
0.944*** (0.270)
0.946*** (0.271)
0.879*** (0.281)
Anocracy
0.761*** (0.222)
Democracy
0.464* (0.260)
Xconst
0.092** (0.040)
0.032 (0.030)
0.034 (0.030)
0.051* (0.031)
Xconst2
-0.025** (0.010)
Drought in cell
0.169 (0.268)
0.668*** (0.233)
Flood in cell
-0.065 (0.509)
-0.027 (0.510)
Disasters, binary
0.078 (0.248)
Constant
-9.879*** (1.729)
-10.29*** (1.745)
-10.63*** (1.925)
-10.19*** (1.907)
-10.27*** (1.921)
-10.05*** (1.935)
Observations
1 571 991 1 554 690 1 481 959 1 414 264 1 481 959 1 359 701
Wald chi2
193.44 201.70 168.68 162.16 163.04 165.64
a Lagged one year b Lagged two years
c Omitted because of failure to converge Robust standard errors in parentheses. ***p < 0.01, **p < 0.05, *p < 0.1.

[52]
6.2 ROC-plots
A traditional approach to quantitative studies of civil wars suggests testing the statistical
significance of the theoretically interesting variables. If one or more are found to be significant,
it is usually interpreted as a sign that one has advanced a step closer to discerning the logic of
civil war. In “The Perils of Policy by p-value” Ward et al. (2010) dispute this common approach
because they find that studies that have lots of significant variables such as Fearon and Laitin
(2003) and Collier and Hoeffler (2004) do a poor job of actually correctly predicting civil war.
Even at the lowest probability threshold Fearon and Latin’s study only correctly predicts 15 out
of 107 conflicts in the study, and that comes at the cost of 66 false positive predictions (Ward
et al. 2010). To see if this holds true for my own study I utilize a Receiver Operator
Characteristic (ROC) plot, which illustrates the relationship between the rate of false positives
and the rate of true positives. In an ideal case, a perfectly predictive model will correctly
identify all actual cases of civil war and never generate false positives. At the other end of the
spectrum, a model with no predictive power whatsoever would, on average, generate one
incorrect prediction for every correct prediction at all thresholds (Ward et al. 2010). The area
under the ROC-curve is usually a good measure for this, the highest value being 1.0 (a model
that predicts every conflict without any false positives) and the lowest being 0.5 (same number
of correct and incorrect predictions. Running ROC-plots for all the models shows that the
predictive power of the disaggregated analysis stays at an overall excellent level (any results
above 0.9). It is worth noting however that the baseline model predicts better than the final
model. The country-level replication turns in mediocre scores, an almost perfect 0.76 across all
models.

[53]
Table 6.2: ROC-plot results for all models in the country-level analysis
Model Area under ROC-curve
(1) 0.7601
(2) 0.7686
(3) 0.7635
(4) 0.7651
(5) 0.7686
(6) 0.7681
Table 6.3: ROC-plot results for all models in the disaggregated analysis
Model Area under ROC-curve
(1) 0.9024
(2) 0.9139
(3) 0.9042
(4) 0.8984
(5) 0.9034
(6) 0.8991
(7) 0.9001
6.3 Conflict incidence
As discussed earlier it is possible to measure civil war not by onset, but instead by incidence,
meaning that a cell which experienced conflict turns positive. Running the full set of models
utilizing a one year lagged measure of conflict incidence in the cell naturally shows some major
discrepancies compared to the other models (see the full table in the appendix). The GDP
variable nearly doubles its effect and both the new state and the distance to capital variable
lose their significance. For this paper the most important finding is that the flood disaster
variable turns significant and predicts almost a doubling in the risk of there being a conflict in a
cell that experienced a flood one year prior. Five percent of all the conflict incidences in the
dataset happened in a cell that had experienced a major flooding the year before.

[54]
7.0 Results and Discussion
7.1 Hypotheses
My motivation for writing this thesis was to try to answer a question I feel there are wildly
differing opinions on, especially considering the wide gap between the public perception and
the consensus of the scientific community. As I have tried to explain straightforwardly in the
previous sections there are many reasons as to why this is a challenging task from a statistic
perspective, but statistic technicalities aside I will now try to put my findings into the theoretic
framework developed earlier. First let us sum up the answers to the hypothesis presented in
the introduction:
H1) Climate-related natural disasters do no not provide an immediate increase in the risk
of a conflict breaking out in the affected area.
I have found limited proof for my first hypothesis from the first four models in the grid-level
analysis and the results from the country-level replication. There does not appear to be any
significant relationship between climate-related natural disasters and the immediate risk of
conflict. The country level analysis goes even further and finds a negative relationship between
natural disasters and the immediate risk of conflict. This follows Slettebak’s original findings and
lends approval to Charles E Fritz and Williams (1957) theories of people pulling together and
forming bands of “fellow strugglers” when catastrophe hits.
H2) Negative impact from climate-related natural disasters will provide a long term
increase in the risk of conflict in the affected area.
I have found a statistically significant effect that shows that areas that experience catastrophic
periods of droughts gain a higher risk of hosting the outbreak of a conflict in two to three years
after the drought. This does not corroborate with previous literature and I will go into greater
detail on the results in the next section.

[55]
H3) Climate-related natural disasters do not provide country-wide effects for the risk of a
civil war onset.
The country level analysis finds an immediate negative relationship between climate-related
natural disasters and the risk of conflict onset. Further testing with increasing lag finds no
significant relationship between the variables. This answer fits with the consensus of the field
when it comes to climate change and conflict (Buhaug 2010a; Theisen et al. 2011; Wischnath
and Buhaug 2014).
7.2 Behind the numbers
My original thesis was that climate-related natural disasters so far have yet to have any real
impact on the potential risk of a civil war breaking out. The choice of a disaggregated analysis
was made to further prove that when divided into geographic cells, any effects found in a
country-level analysis, would be even less pronounced and relevant. The finding that cells
which experience catastrophic droughts are much more likely to see a conflict breaking out two
or three years later therefore came as a slight surprise. The question is whether this is a
structural or systematic finding, or if it can be explained in other ways?
Going back to Thomas Homer-Dixon (2010) and his models there is a compelling narrative that
lends itself to the numbers previously discussed. Homer-Dixon’s model (see Figure 2.1), and
revised versions of his original one (see Figure 2.2), all contain a logical amount of time-span
within them. If a natural disaster leads to resource scarcity, which again leads to insecurity and
social fragmentation, to finally end up at an increase in motivation and opportunity for
instigating violence, there should have to be some time allowed for these processes to evolve
and develop. As the numbers from the disaggregated analysis show, there is no effect of either
droughts or floods within the same year or the year after these natural disasters have taken
place. This seems to fit well given how the theoretic model predicts the effects from natural
disasters to manifest.

[56]
That being said let us look closer at some of the matching cases that make up our results.
Starting with Asia 4 of the 29 matches come from India: one stems from religious disputes in
the early nineties, the other three are all from the Indian-sponsored rebel groups operating on
the border of Myanmar (formerly Burma). Papua New Guinea is registered with the
Bougainville civil war from 1991, Iraq registers with a 1997 observation from the fighting in the
Kurdish part of the country and Iran registers twice because of attacks from the Mojahedin-e-
Khalq at the end of the nineties. Azerbaijan also registers with the 1995 Azeri coup d’état
attempt in Baku.
Moving on to the Americas, Haiti contributes two matches, both from the 1991 coup d’état and
the following UN peace keeping mission. Suriname also registers a single observation from the
guerilla war between the Maroons and the government in 1988. In Africa Gambia registers with
Kukoi Sanyang’s rebellion in 1981, Ethiopia with the border skirmishes in 1998 and Angola with
a single observation in 2000 at the end of its long civil war. Burundi comes with three
observations, all from 1990s and all of them from the devastating ethnic clashes between the
Hutus and the Tutsis. A failed coup attempt in the Comoros islands and a single observation
from the Algerian civil war make up the last of the observations from Africa. Europe contributes
three observations from Slovenia, Romania and Moldova as a heavy drought at the start of the
1990s correlates with conflict observations from the start of the collapse of Yugoslavia.
The point of this extensive listing is to say that of all the 29 positive correlations there is only
one case where droughts are actually mentioned as a contributing factor in the literature. In
1983 Nigeria, on a very short notice, deported up to one million Ghanaian and other African
immigrants to Ghana while the country was in the midst of facing severe droughts and wildfires
(Berry 1995). The conflict observation in the dataset is however attributed to the coup d’état
attempt by Ekow Dennis and Edward Adjei-Ampofo against then president Jerry John Rawlings.
Ghana did experience severe economic inflation, famine and adverse social conditions because
of the droughts, but proclaiming a direct linkage between this and a military coup d’état is
tendentious at best without a more in-depth study of the conflict. On the other part of the
spectrum are the observations from Europe, where there is ample evidence that the fall of
Yugoslavia was not brought about by droughts in Slovenia.

[57]
Several of the conflicts seem to be partly explained by the missing ethnicity variable, which with
an educated guess should have turned out at least as relevant as in the country level analysis.
However, even though most of the conflicts in question are driven by ethnic divides and
independency struggles there is something to be said for the time at which they trigger. Both
types of conflict are usually based on longstanding divides and issues, for example; the Kurds
have fought for their own state since the fall of the Ottoman Empire at the start of the 20th
century. That it appears to be a higher risk of fighting breaking out after droughts might be
spurred by the effects of increased resource competition and a general sense of desperation
and deprivation that makes launching a campaign all the more pressing or opportune at that
moment of time.
While the listing of all the conflict matches at first glance might seem like an argument against
the theoretical model, given that none of them appear to be specifically about climate-change
at first glance, the majority still fit into the theoretical framework. Nearly all of the conflicts are
based in weak states that have poor infrastructure and suffer from a lack of institutional
capability and stability. Per the theoretical assumptions these are the most likely cases to be
affect by the effects of increased resource scarcity stemming from climate change. There is
however the classic conundrum of the chicken and the egg: States that have economic
instability and institutional weakness are more prone to suffer climate-related natural
disasters3. E.g. while climate-related natural disasters may weaken the resilience of a state,
weakened states are already more likely to be affected more severely and more often (Busch
2012).
3 Keep in mind that vulnerability, not only location and exposure, defines a natural disaster (see chapter 2.2).

[58]
8.0 Conclusions
8.1 Summary
This paper has tried to look closer at the links between climate change and civil conflict by
utilizing different data on climate-related natural disasters and civil wars. I have tried to
thoroughly explain that there are ample reasons to interpret these results with caution and the
mindset that they do not constitute any kind of final say, rather a simple indication that there is
reason for further inquiries and thought. Climate-related natural disasters will probably
manifest themselves as important factors in conflict-research in the coming years, but their
effect will most likely be noticed not through their direct impact, but rather through the
negative effects they have on more important and significant variables such as economy and
infrastructure. What we do now is that climate-related natural disasters are more likely to
become stronger and more frequent, which could lead to their effects becoming more
pronounced and independent.
One important factor that this thesis is unable to take into account is the difference in how
people will react to what is perceived to be a single random natural disaster and how they will
react towards a disaster that is perceived to be one of a chain of recurring climate-related
disasters. If climate-related natural disasters become seen as the product of human actions,
they may also cause a completely different reaction than what natural disasters do today.
Anger, condemnation and frustration towards governments that fail to shield their population
from the effects may be worse than what it today if disasters become viewed as a systemic
failure rather than as random acts by nature. This could further pronounce the effects from the
theoretical model of Homer-Dixon.
What the disaggregated analysis from this paper tells us is that there are reasons to worry even
more for those that already have reasons to worry about the future: Weak states that have
areas that are prone to suffer droughts may experience that the same area becomes a hotbed
for civil conflict in the years following the drought. Even though it does not register as a valid
case in the dataset, the complex Darfur-conflict may serve as a an example or likely case of the
kind of conflict that the analysis predicts may become more common if the occurrence of

[59]
droughts continue to rise: A type of conflict that involves a failed state, ethnic divides and with
the backdrop of competition for renewable resources like drinking water and arable land
(Mohamed 2013). Like Homer-Dixon predicts, this analysis also finds that traditional variables
that reflect state capability are more robust and more important than climate impact, but that
the added stress may be final straw that breaks the camel’s back. Of importance is the fact that
the analysis finds no correlation between floods and conflict outbreak, which draws the
theoretical model into question depending on how you interpret it. One could argue that
droughts simply fit the theoretical model better and have a stronger negative impact on the
amount of available resources; a more critical view would see the findings as prone to random
coincidences considering the model tries to incorporate resource scarcity as a whole, and not
specific disasters.
Furthermore the findings from the disaggregated analysis are not repeated, but partly reversed
in the country-level analysis, providing more ground for caution in the interpretation. There is
no evidence in the analysis that suggests that countries as a whole are more prone to host a
civil war in the aftermath of a climate-related natural disaster, but rather that there is a slight
decrease in the risk immediately following a disaster. The disaggregated model fits better and
predicts better than the country-level analysis however, suggesting that an increase in the level
of detail is advantageous when studying these types of phenomena.
8.2 Further research and policy implications
There are many avenues for further research that present themselves at the end of this thesis.
The biggest hurdle of all is effectively isolating the effect of climate change upon the risk of
conflict. Even though this thesis has tried, there is still a long way to go before one can more
decisively determine which effects that stems from climate-change and which do not. Better
data is of course key in this area; bigger samples, more detail and of course longer periods than
just thirty years. A longer and more robust causal chain is also highly beneficial as trying to
discern which variables are influenced by which. More detailed case studies like Benjaminsen et
al. (2012) will also pave the way for being able to make better inferences based on statistical
evidence. Interesting projects are already well under way like Gilmore et al’s (2013) attempt to

[60]
modify Hegre et al’s (2012) predictive model for civil conflict to include climate-change. I think
the coming years will see great improvement and expansion in the possibility to model the
effects of climate-change in general.
If there only policy implication that should be taken from this analysis it is the fact that the
parts of the world that are at risk of hosting an armed conflict will be at an even higher risk in
the future. That the burden of climate-change will not be shared evenly among the countries of
the world has already been addressed several times by others, especially the IPCC which states
in one of its latest summary for policymakers that:
“Risks are unevenly distributed and are generally greater for disadvantaged people and
communities in countries at all levels of development. Risks are already moderate because of
regionally differentiated climate-change impacts on crop production in particular”
(IPCC 2013: 11).
The areas that are defined as the most likely to be hit the hardest are tropical rural areas that
are already underdeveloped (IPCC 2013: 15-19). This prediction already fits well with the results
from the disaggregated analysis where the majority of the conflict onsets that happened in cells
hit by droughts were tropical areas in the Sahel, south-east Asia and Central America. It is
important to note that the IPCC c takes a moderate view when commenting on the linkage
between climate change and violent conflict. The chapter that is devoted to Africa specially
answers this question in the following way: “Violent conflict are based on a variety of
interconnected causes, of which the environment is considered to be one, but rarely the most
decisive factor” (IPCC 2014: 50).
Like the IPCC I to do not find that this thesis has any basis to say anything more conclusive than
that environment is a factor, but clearly not the most decisive one, when evaluating the risk of
violent conflict. I do find that the analysis however has given further indications to the fact that
the world community should immediately begin to make a framework for how to alleviate the
areas that will be hit the hardest from the effects of climate change. I appeal to a sense of
solidarity that seems necessary if the differences between the rich and the poor are not to
become even more pronounced when a new type of climate will bring further distress to those
that occupy the bottom tier. It is also of vital importance that the relative positive forecast from

[61]
conflict research that predicts a further reduction in the number of conflicts and number of
people killed in battle hinges on the notion that more and more people will be brought away
from poverty (Hegre et al. 2012). Setbacks in the form of an increase in the number of climate-
related nature disasters and sudden reductions in livelihood will likely affect these predictions
in a negative way that may paint a slightly less optimistic picture of the future.
The answers to these challenges are complicated and require a lot more space than what is
available here. This thesis concludes that more research hopefully will bring an even more
detailed account of the risk that climate change constitutes to everyone, but especially that
those that are in need already are readily identified and that measures are taken now, rather
than when it is too late act. Climate change has already started and in this case it is better not
wait for conclusive evidence as to what the exact consequences will be.

[62]

[63]

[64]
Appendix
In the appendix you will find a complete replication of Slettebak’s country level analysis (Table A.1) with
all years included. A full grid-level model run with conflict incidence in the cell instead of conflict onset
as the main dependent variable (Table A.2). A full overview of the year dummies from the final models
of the country-level and grid-level analysis (Table A.3 and A.4). And finally descriptive statistics, cross
tabulations and ROC-Plots (Table A5-8).

[65]
Table A.1: Complete country-level analysis 1945-2007
Dependent variable
(1) F&L onset
(2) Onset
(3) Onset
(4) Onset
(5) Onset
(6) Onset
Conflict previous year
-0.954*** (0.314)
-0.047 (0.263)
-0.132 (0.268)
-0.115 (0.259)
-0.153 (0.269)
-0.151 (0.270)
GDP/cap, lagged
-0.343*** (0.071)
-0.410*** (0.086)
-0.449*** (0.095)
-0.441*** (0.094)
-0.452*** (0.095)
-0.445*** (0.095)
Pop. Size (ln), lagged
0.262*** (0.072)
0.242*** (0.059)
0.240*** (0.052)
0.284*** (0.056)
0.231*** (0.055)
0.154** (0.075)
Rough terrain
0.218** (0.084)
0.134** (0.063)
0.108* (0.062)
0.124** (0.060)
0.113* (0.062)
0.133** (0.068)
Noncontiguous state
0.443 (0.273)
0.298 (0.231)
0.340 (0.259)
0.387 (0.253)
0.346 (0.255)
0.338 (0.257)
Oil exporter
0.857*** (0.279)
0.539** (0.254)
New State
1.709*** (0.338)
1.323*** (0.353)
1.292*** (0.357)
1.298*** (0.359)
1.294*** (0.356)
1.245*** (0.352)
Recent Instability (lag)
0.617** (0.235)
0.165 (0.192)
0.117 (0.188)
0.125 (0.189)
0.121 (0.189)
0.143 (0.190
Anocracy (lag)1 0.021 (0.016)
0.419** (0.189)
0.505** (0.185)
0.493** (0.181)
0.490** (0.184)
0.532*** (0.183)
Ethnic fractionalization
0.166 (0.373)
1.079*** (0.322)
1.133*** (0.185)
1.143*** (0.328)
1.126** (0.321)
1.138*** (0.321)
Religious fractionalization
0.285 (0.508)
-0.510 (0.443)
-0.703* (0.415)
-0.758* (0.410)
-0.661 (0.421)
-0.769* (0.412)
Disasters, count
0.016 (0.032 )
Disasters, binary
-0.333** (0.161)
-2.908*** (0.997)
Storms
-0.027 (0.052)
Floods
0.092 (0.065)
Droughts
-0.554** (0.267)
Disaster * Population
0.263** (0.099)
Constant
-6.731*** (0.735)
-5.311*** (1.449)
-4.954*** (1.434)
-5.442*** (1.435)
-4.862*** (1.433)
-4.260*** (1.494)
Observations
6327 6444 6954 6954 6954 6954
Pseudo R2 0.108 0.118 0.113 0.115 0.117 0.118 1 Model 1: score on Polity IV scale; all other models: anocracy dummy. Robust standard errors in parentheses. ***p < 0.01, **p < 0.05, *p < 0.1. Fearon & Laitin’s (2003) original dependent variable is used in Model 1, while the dependent variable in the other models is from UCDP/ PRIO Armed Conflict Dataset (Gleditsch et al., 2002; Strand, 2006). All models but the original one from Fearon & Laitin are run with robust standard errors and year-fixed effects (year dummies not shown).

[66]
Table 5.2: Grid-level analysis 1980-2007 with conflict incidence in cell as dependent variable
Dependent variable
(1) Incidencea
(2) Incidencea
(3) Incidencea
(4) Incidencea
(5) Incidencea
(6) Incidenceb
(7) Incidencec
Cell population (log)
0.273** (0.122)
0.289** (0.113)
0.252*** (0.089)
0.240*** (0.091)
0.240*** (0.088)
0.235*** (0.089)
0.231*** (0.089)
Cell-GDP/cap (log)
-0.737*** (0.154)
-0.745*** (0.154)
-0.907*** (0.188)
-0.932*** (0.174)
-0.940*** (0.173)
-0.920*** (0.173)
-0.915*** (0.172)
Distance to Capital (log)
-0.223 (0.236)
-0.180 (0.213)
-0.248 (0.197)
-0.257 (0.196)
-0.260 (0.193)
-0.263 (0.194)
-0.274 (0.193)
Cell is part of a new state
-0.639 (0.671)
-0.707 (0.752)
-0.925 (0.770)
-0.908 (0.756)
-0.868 (0.758)
-0.904 (0.741)
-0.711 (1.060)
Rough Terrain
0.104 (0.393)
0.179 (0.367)
0.253 (0.355)
0.237 (0.355)
0.238 (0.354)
0.222 (0.357)
0.236 (0.357)
Anocracy
0.758* (0.458)
Democracy
0.514 (0.362)
Xconst
0.161** (0.073)
0.111* (0.065)
0.114* (0.064)
0.104 (0.065)
0.097 (0.065)
Xconst2
-0.015 (0.017)
Drought in cell
-0.022 (0.106)
-0.115 (0.102)
-0.157 (0.118)
Flood in cell
0.614*** (0.100)
0.468*** (0.131)
0.350** (0.152)
Disasters, binary
0.109 (0.084)
Constant
2.349 (2.709)
1.647 (2.495)
4.294* (2.263)
4.420* (2.319)
4.511* (2.297)
4.343* (2.296)
4.499** (2.277)
Observations
1 571 991 1 554 690 1 418 959 1 414 264 1 481 959 1 359 701 1 305 109
Pseudo R2
0.205 0.218 0.236 0.227 0.233 0.222 0.219
a Lagged one year b Lagged two years
c Lagged three years Robust standard errors in parentheses. ***p < 0.01, **p < 0.05, *p < 0.1.
All models with robust standard errors (country clusters).

[67]
Year dummies
Table A.3: Complete list of years dummies for the final model (6) of the country level analysis.
Year Coef Std.E
1981 .285 .729
1982 .321 .728
1983 -.609 .907
1984 -.214 .817
1986 -.202 .812
1987 -.162 .684
1989 1.333** .610
1990 1.225* .659
1991 1.469** .603
1992 .417* .722
1993 .806 .667
1994 .444 .725
1995 -.652 .938
1996 .491 .720
1997 .878 .696
1998 .383 .731
1999 .132 .752
2000 .413 .645
2001 .230 .781
2002 -.036 .819
2003 -.040 .858
2004 .487 .727
2005 .566 .742
2006 .336 .772
2007 .891 .732

[68]
Table A.4: Complete list of years dummies for the final model (6) of the grid-level analysis.
Year Coef Std.E
1983 .616 .861
1984 -.776 1.221
1985 .366 .913
1986 -.054 1.003
1988 -.767 1.231
1989 -.800 1.230
1991 1.213 .816
1992 1.447* .785
1993 1.400* .724
1994 1.278 .831
1995 1.168 .808
1996 1.390* .806
1997 .998 .816
1998 .996 .843
1999 1.404* .780
2000 .807 .838
2001 .870 .867
2002 .683 .853
2003 -.228 1.009
2004 .172 .954
2005 .455 .866
2006 .851 .876
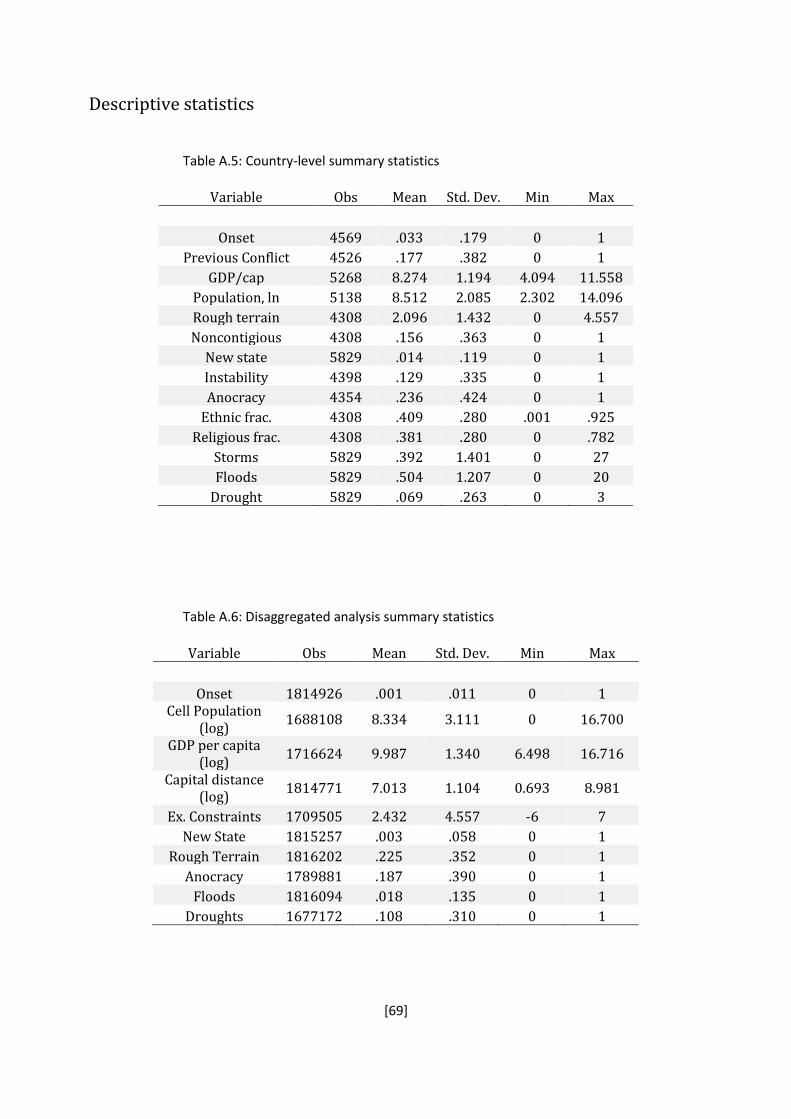
[69]
Descriptive statistics
Table A.5: Country-level summary statistics
Variable Obs Mean Std. Dev. Min Max
Onset 4569 .033 .179 0 1
Previous Conflict 4526 .177 .382 0 1
GDP/cap 5268 8.274 1.194 4.094 11.558
Population, ln 5138 8.512 2.085 2.302 14.096
Rough terrain 4308 2.096 1.432 0 4.557
Noncontigious 4308 .156 .363 0 1
New state 5829 .014 .119 0 1
Instability 4398 .129 .335 0 1
Anocracy 4354 .236 .424 0 1
Ethnic frac. 4308 .409 .280 .001 .925
Religious frac. 4308 .381 .280 0 .782
Storms 5829 .392 1.401 0 27
Floods 5829 .504 1.207 0 20
Drought 5829 .069 .263 0 3
Table A.6: Disaggregated analysis summary statistics
Variable Obs Mean Std. Dev. Min Max
Onset 1814926 .001 .011 0 1 Cell Population
(log) 1688108 8.334 3.111 0 16.700
GDP per capita (log)
1716624 9.987 1.340 6.498 16.716
Capital distance (log)
1814771 7.013 1.104 0.693 8.981
Ex. Constraints 1709505 2.432 4.557 -6 7
New State 1815257 .003 .058 0 1
Rough Terrain 1816202 .225 .352 0 1
Anocracy 1789881 .187 .390 0 1
Floods 1816094 .018 .135 0 1
Droughts 1677172 .108 .310 0 1

[70]
Multcollineriarity
Table A.7: Cross-correlation table for the main variables in the disaggregated analysis
Onset Pop/cell GDP/cell Distance Newstate
Onset 1.0000
Pop/cell 0.0121 1.0000
GDP/cell -0.0091 -0.4694 1.0000
Distance -0.0127 -0.5792 0.3516 1.0000
Newstate 0.0064 0.0160 -0.0171 -0.0560 1.0000
Terrain 0.0028 0.0160 -0.0406 0.1489 -0.0148
Xconst -0.0020 -0.1690 0.4554 0.0567 -0.0363
Drought 0.0002 -0.0060 0.0207 -0.0054 0.0034
Flood 0.0006 0.0497 -0.0228 -0.0251 -0.0030
Terrain Xpolity Drought Flood
Terrain 1.0000
Xconst -0.0597 1.0000
Drought -0.0024 -0.0256 1.0000
Flood 0.0083 0.0195 -0.0201 1.0000

[71]
ROC-Plots
Table A.8: ROC-plot results for all models in the country-level analysis
Model Area under ROC-curve
(1) 0.7601
(2) 0.7686
(3) 0.7635
(4) 0.7651
(5) 0.7686
(6) 0.7681
Table A.8: ROC-plot results for all models in the disaggregated analysis
Model Area under ROC-curve
(1) 0.9024
(2) 0.9139
(3) 0.9042
(4) 0.8984
(5) 0.9034
(6) 0.8991
(7) 0.9001

[72]
Data and do-files
Do-file and datasets are avaible on the accompanying USB storage device. The author is
available for all inqueries at johanlh at gmail.com

[73]

[74]
Bibliography
Adams and others (2010), 'An open letter: Climate change and the integrety of science', (Editorial letter on theguardian.co.uk).
Adano, Wario R, et al. (2012), 'Climate change, violent conflict and local institutions in Kenya’s drylands', Journal of Peace Research, 49 (1), 65-80.
Adcock, Robert and Collier, David (2001), 'Measurement validity: A shared standard for qualitative and quantitative research', American Political Science Association (95: Cambridge Univ Press), 529-46.
Aid, Christian (2007), 'Human Tide: The Real Migration Crisis, A Christian Aid Report', (London: Christian Aid).
Allen, Myles R, et al. (2014), 'IPCC Fifth Assessment Synthesis Report-Climate Change 2014 Synthesis Report'.
Bank, The World (2011), 'WDR 2011: Conflict, Security and Devolpment', (New York).
Barnett, Tim P, Adam, Jennifer C, and Lettenmaier, Dennis P (2005), 'Potential impacts of a warming climate on water availability in snow-dominated regions', Nature, 438 (7066), 303-09.
Barsky, Lauren, Trainor, Joseph, and Torres, Manuel (2006), 'Disaster realities in the aftermath of Hurricane Katrina: Revisiting the looting myth'.
Benjaminsen, Tor A, et al. (2012), 'Does climate change drive land-use conflicts in the Sahel?', Journal of Peace Research, 49 (1), 97-111.
Bergholt, Drago and Lujala, P\"a, ivi (2012), 'Climate-related natural disasters, economic growth, and armed civil conflict', Journal of peace research, 49 (1), 147-62.
Berry, LaVerle Bennette (1995), 'Ghana: A country study', (Federal Research Division Library of Congress).
Bilden, Kaare (2013), 'Klima for vold', Morgenbladet, 194 (36), 20-21.
Birkmann, Jorn (2006), 'Measuring vulnerability to promote disaster-resilient societies: Conceptual frameworks and definitions', Measuring vulnerability to natural hazards: Towards disaster resilient societies, 9-54.
Blattman, Christopher and Miguel, Edward (2010), 'Civil war', Journal of Economic Literature, 3-57.
Blyth, Simon (2002), Mountain watch: environmental change & sustainable developmental in mountains (UNEP/Earthprint).
Brackenridge, GR, Anderson, E, and Caquard, S (2009), 'Global active archive of large floods 1985–2007, Dartmouth Flood Observatory (DFO), Hanover, USA'.
Braithwaite, Alex (2005), 'Location, location, location… identifying hot spots of international conflict', International Interactions, 31 (3), 251-73.
Brancati, Dawn (2007), 'Political aftershocks: The impact of earthquakes on intrastate conflict', Journal of Conflict Resolution, 51 (5), 715-43.
Buhaug, Halvard (2010a), 'Climate not to blame for African civil wars', Proceedings of the National Academy of Sciences, 107 (38), 16477-82.
--- (2010b), 'Dude, where’s my conflict? LSG, relative strength, and the location of civil war', Conflict Management and Peace Science, 27 (2), 107-28.
--- (2014), 'Concealing agreements over climate-conflict results', Proceedings of the National Academy of Sciences of the United States of America.

[75]
Buhaug, Halvard and Gates, Scott (2002), 'The geography of civil war', Journal of Peace Research, 39 (4), 417-33.
Buhaug, Halvard and Lujala, Päivi (2005), 'Accounting for scale: Measuring geography in quantitative studies of civil war', Political Geography, 24 (4), 399-418.
Buhaug, Halvard, Gleditsch, Nils Petter, and Theisen, Ole Magnus (2009), 'Implications of climate change for armed conflict'.
Bulloch, John and Darwish, Adel (1993), Water wars: coming conflicts in the Middle East (Gollancz \^{} eLondon London).
Burke, Marshall B, et al. (2009), 'Warming increases the risk of civil war in Africa', Proceedings of the National Academy of Sciences, 106 (49), 20670-74.
Busch, Rune (2012), 'Disasters by Design:: A Disaggregated Study of the Ethnic and Institutional Determinants of Natural Disaster Vulnerability'.
Butler, Christopher K and Gates, Scott (2012), 'African range wars: Climate, conflict, and property rights', Journal of Peace Research, 49 (1), 23-34.
Böhmelt, Tobias, et al. (2013), 'Demand, supply, and restraint: Determinants of domestic water conflict and cooperation', Global Environmental Change.
Carson, Rachel (1962), Silent spring (New York: The New Yorker).
Cederman, Lars-Erik, Buhaug, Halvard, and Rød, Jan Ketil (2009), 'Ethno-nationalist dyads and civil war a GIS-based analysis', Journal of Conflict Resolution, 53 (4), 496-525.
CIESIN (2005), 'Gridded Population of the World Version 3 (GPWv3): Population Grids. Palisades'. <http://sedac.ciesin.columbia.edu/gpw/>.
Cline, William R (1991), 'Scientific basis for the greenhouse effect', The Economic Journal, 101 (407), 904-19.
Collier, Paul and Hoeffler, Anke (2004), 'Greed and grievance in civil war', Oxford economic papers, 56 (4), 563-95.
CRED (2007), 'EM-DAT: The OFDA/CRED International Disaster Database'.
Cunningham, David E and Lemke, Douglas (2011), 'Beyond Civil War: A Quantitative Analysis of Sub-state Violence', APSA 2011 Annual Meeting Paper.
DFO (2007), 'Global Archive of Large Flood Events - Notes'. <http://www.dartmouth.edu/~floods/Archives/ArchiveNotes.html>.
Dilley, Maxx (2005), Natural disaster hotspots: a global risk analysis (5: World Bank Publications).
Durkheim, Emile (1951), 'Suicide: a study in sociology [1897]', Translated by JA Spaulding and G. Simpson (Glencoe, Illinois: The Free Press, 1951).
Ehrlich, Paul R and Club, Sierra (1971), The population bomb (68: Ballantine Books New York).
Enarson, Elaine and Morrow, Betty Hearn (1998), The gendered terrain of disaster (Praeger Westport).
Esteban, Joan, Mayoral, Laura, and Ray, Debraj (2012), 'Ethnicity and conflict: An empirical study', The American Economic Review, 102 (4), 1310-42.
Etzioni, Amitai (1975), Comparative Analysis of Complex Organizations, Rev (Simon and Schuster).
Fearon, James D (2006), 'Ethnic mobilization and ethnic violence', Barry R. Weingast and.

[76]
Fearon, James D and Laitin, David D (2003), 'Ethnicity, insurgency, and civil war', American political science review, 97 (1), 75-90.
Felten-Biermann, Claudia (2006), 'Gender and Natural Disaster: Sexualized violence and the tsunami', Development, 49 (3), 82-86.
Fisher, Sarah (2010), 'Violence against women and natural disasters: findings from post-tsunami Sri Lanka', Violence against Women, 16 (8), 902-18.
Fjelde, Hanne and Nilsson, Desirée (2012), 'Rebels against Rebels Explaining Violence between Rebel Groups', Journal of Conflict Resolution, 56 (4), 604-28.
Fritz, Charles E and Williams, Harry B (1957), 'The human being in disasters: A research perspective', The Annals of the American Academy of Political and Social Science, 309 (1), 42-51.
Fritz, Charles Edward (1961), Disaster (Institute for Defense Analyses, Weapons Systems Evaluation Division).
Garfinkel, Michelle R and Skaperdas, Stergios (2007), 'Economics of conflict: An overview', Handbook of defense economics, 2, 649-709.
Gates, Scott, et al. (2006), 'Institutional inconsistency and political instability: Polity duration, 1800–2000', American Journal of Political Science, 50 (4), 893-908.
Gilmore, Elisabeth, et al. (2013), 'Forecasting Civil Conflict under Different Climate Change Scenarios', Impacts World 2013 International Conference on Climate Change Effects, Potsdam. http://www. climate-impacts-2013. org/files/wism_gilmore. pdf.
Gleditsch, Nils Petter, Hegre, Håvard, and Strand, Håvard (2009), 'Democracy and civil war', Handbook of War Studies III: The Intrastate Dimension, 155-92.
Gleditsch, Nils Petter, et al. (2002), 'Armed conflict 1946-2001: A new dataset', Journal of peace research, 39 (5), 615-37.
Goldstein, Joshua S (2011), Winning the war on war: The decline of armed conflict worldwide (Penguin).
Griswold, Eliza (2012), 'How Silent Spring Ignited The Enviromental Movement', (The New York Times).
Harbom and others (2009), 'UCDP/PRIO armed conflict dataset codebook', Codebook. Uppsala Conflict Data Program and International Peace Research Institute, Oslo.
Hegre, H\aa, vard and Sambanis, Nicholas (2006), 'Sensitivity analysis of empirical results on civil war onset', Journal of Conflict Resolution, 50 (4), 508-35.
Hegre, H\aa, vard, et al. (2001), 'Toward a democratic civil peace? Democracy, political change, and civil war, 1816-1992', American political science review, 95 (1), 33-48.
Hegre, H\aa, vard, et al. (2012), 'Predicting Armed Conflict, 2010--20501', International Studies Quarterly.
Hendrix, Cullen S and Salehyan, Idean (2012), 'Climate change, rainfall, and social conflict in Africa', Journal of Peace Research, 49 (1), 35-50.
Hobbes, Thomas (1928), Leviathan, or the matter, forme and power of a commonwealth ecclesiasticall and civil (Yale University Press).
Hodgkinson, Peter E and Stewart, Michael (1991), Coping with catastrophe: A handbook of disaster management (Taylor \& Frances/Routledge).

[77]
Homer-Dixon, Thomas F (2010), Environment, scarcity, and violence (Princeton University Press).
Hsiang, Solomon M and Meng, Kyle C (2014), 'Reconciling disagreement over climate–conflict results in Africa', Proceedings of the National Academy of Sciences, 201316006.
Hsiang, Solomon M, Burke, Marshall, and Miguel, Edward (2013), 'Quantifying the influence of climate on human conflict', Science, 341 (6151), 1235367.
IPCC (2010), 'IPCC statement on the melting of Himalayan glaciers'.
--- (2013), 'Summary for Policymakers. In: Climate Change 2013: The Physical Science Basis. Contribution of
Working Group I to the Fifth Assessment Report of the Intergovernmental Panel on Climate Change', (New York).
--- (2014), 'Climate Change 2014: Impacts, Adaptation, and Vulnerability - Working Group II Contribution to the IPCC 5th Assessment Report ', (Edinburgh: Intergovernmental Panel on Climate Change).
Jenkinson, DS, Adams, DE, and Wild, A (1991), 'Model estimates of CO2 emissions from soil in response to global warming', Nature, 351 (6324), 304-06.
Ki-Moon, Ban (2013), 'Remarks to media at UNFCCC Climate Change Conference', (UN News Centre).
King, Gary, Keohane, Robert O, and Verba, Sidney (1995), 'The importance of research design in political science', American Political Science Review, 89 (02), 475-81.
Kolbe, Athena R, et al. (2010), 'Mortality, crime and access to basic needs before and after the Haiti earthquake: a random survey of Port-au-Prince households', Medicine, conflict and survival, 26 (4), 281-97.
Koubi, Vally, et al. (2012), 'Climate variability, economic growth, and civil conflict', Journal of Peace Research, 49 (1), 113-27.
Lacina, Bethany, Gleditsch, Nils Petter, and Russett, Bruce (2006), 'The declining risk of death in battle', International Studies Quarterly, 50 (3), 673-80.
Landler, Mark (2014), 'U.S. and China Reach Climate Accord After Months of Talks', The New York Times.
Lindstrom, Mary J and Bates, Douglas M (1990), 'Nonlinear mixed effects models for repeated measures data', Biometrics, 673-87.
Long, J Scott and Freese, Jeremy (2006), 'Regression models for categorical and limited dependent variables using Stata', Stata Press, College Station, TX.
Malthus, Thomas Robert (1888), An essay on the principle of population: or, A view of its past and present effects on human happiness (Reeves \& Turner).
Mann, Michael E (2012), The hockey stick and the climate wars (Columbia University Press).
Marshall, Monty G and Jaggers, Keith (2006), 'Polity IV Country Reports'.
McGuire, Bill (2012), Waking the Giant: How a Changing Climate Triggers Earthquakes, Tsunamis, and Volcanoes (Oxford University Press).
Meadows, Donella H, et al. (1972), The Limits to Growth: A Report to The Club of Rome (1972) (Universe Books, New York).
Meadows, Donella H, et al. (1992), Beyond the limits: global collapse or a sustainable future (Earthscan Publications Ltd.).

[78]
Mohamed, Yagoub Abdalla (2013), 'Drought and the need to change: the expansion of water harvesting in Central Darfur, Sudan', Sustaining the Soil: Indigenous Soil and Water Conservation in Africa (London: Earthscan).
Nel, Philip and Righarts, Marjolein (2008), 'Natural disasters and the risk of violent civil conflict', International Studies Quarterly, 52 (1), 159-85.
Nordhaus, William D (2006), 'Geography and macroeconomics: New data and new findings', Proceedings of the National Academy of Sciences of the United States of America, 103 (10), 3510-17.
Nygard, Havard Mokleiv and Weintraub, Michael (2011), 'Bargaining Between Rebel Groups and the Outside Option of Violence'.
.
Olson, Mancur (1971), 'The logic of collective action: Public goods and the theory of groups, second printing with new preface and appendix (Harvard Economic Studies)'.
Parry, Martin, Rosenzweig, Cynthia, and Livermore, Matthew (2005), 'Climate change, global food supply and risk of hunger', Philosophical Transactions of the Royal Society B: Biological Sciences, 360 (1463), 2125-38.
Peacock, Walter Gillis, Morrow, Betty Hearn, and Gladwin, Hugh (1997), Hurricane Andrew: Ethnicity, gender and the sociology of disasters (Psychology Press).
Peduzzi, Pascal, et al. (2009), 'Assessing global exposure and vulnerability towards natural hazards: the Disaster Risk Index', Natural Hazards & Earth System Sciences, 9 (4).
Peterson, Tom and others (2012), Explaining Extreme Events of 2012 from a Climate Perspective (97: The American Meterological Society).
Pielke, Roger, et al. (2007), 'Climate change 2007: lifting the taboo on adaptation', Nature, 445 (7128), 597-98.
Pinker, Steven (2011), The better angels of our nature: The decline of violence in history and its causes (Penguin).
Rosenzweig, Cynthia and Parry, Martin L (1994), 'Potential impact of climate change on world food supply', Nature, 367 (6459), 133-38.
Salehyan, Idean (2008), 'From climate change to conflict? No consensus yet', Journal of Peace Research, 45 (3), 315-26.
Sarkees, Meredith Reid and Wayman, Frank Whelon (2010), Resort to war: a data guide to inter-state, extra-state, intra-state, and non-state wars, 1816-2007 (Cq Pr).
Schwartz, Peter and Randall, Doug (2003), 'An abrupt climate change scenario and its implications for United States national security', (DTIC Document).
Senate, US (1988), 'Greenhouse Effect and Global Climate Change, part 2', (Commitee on Energy and Natural Resources).
Shuo, Li (2014), 'Historic US-China deal marks the beginning of the end of China’s coal chapter'.
Skog, Ole-Jørgen (2005), Å forklare sosiale fenomener: En regresjonsbasert tilnærming (Gyldendal norsk forlag).
Slettebak, Rune T (2012), 'Don’t blame the weather! Climate-related natural disasters and civil conflict', Journal of Peace Research, 49 (1), 163-76.
Stocker, T.F., D. Qin, G.-K. Plattner, M. Tignor, S.K. Allen, J. Boschung, A. Nauels, Y. Xia, V. Bex and P.M. Midgley (2013), 'Climate change 2013: The physical science basis', Working Group I Contribution to the Fifth Assessment Report

[79]
of the Intergovernmental Panel on Climate Change, Summary for Policymakers, IPCC.
Strömberg, David (2007), 'Natural disasters, economic development, and humanitarian aid', The Journal of Economic Perspectives, 199-222.
Susan, Solomon (2007), Climate change 2007-the physical science basis: Working group I contribution to the fourth assessment report of the IPCC (4: Cambridge University Press).
Theisen, Ole Magnus (2012), 'Climate clashes? Weather variability, land pressure, and organized violence in Kenya, 1989--2004', Journal of Peace Research, 49 (1), 81-96.
Theisen, Ole Magnus, Holtermann, Helge, and Buhaug, Halvard (2011), 'Climate wars? Assessing the claim that drought breeds conflict'.
Theisen, Ole Magnus, Gleditsch, Nils Petter, and Buhaug, Halvard (2013), 'Is climate change a driver of armed conflict?', Climatic change, 117 (3), 613-25.
Themnér, Lotta and Wallensteen, Peter (2011), 'Armed conflict, 1946–2010', Journal of Peace Research, 48 (4), 525-36.
Tol, Richard SJ and Wagner, Sebastian (2010), 'Climate change and violent conflict in Europe over the last millennium', Climatic Change, 99 (1-2), 65-79.
Tollefsen, Andreas Forø (2012), 'PRIO-GRID Codebook1'.
Tollefsen, Andreas Forø, Strand, Håvard, and Buhaug, Halvard (2012), 'PRIO-GRID: A unified spatial data structure', Journal of Peace Research, 49 (2), 363-74.
Tubiello, Francesco and others (2007), 'Crop response to elevated CO< sub> 2</sub> and world food supply: A comment on “Food for Thought…” by Long et al., Science 312: 1918--1921, 2006', European Journal of Agronomy, 26 (3), 215-23.
UCDP (2012), UCDP Conflict Database (12.05.14).
Van Aalst, Maarten K (2006), 'The impacts of climate change on the risk of natural disasters', Disasters, 30 (1), 5-18.
Vreeland, James Raymond (2008), 'The effect of political regime on civil war unpacking anocracy', Journal of Conflict Resolution, 52 (3), 401-25.
Ward, Michael D, Greenhill, Brian D, and Bakke, Kristin M (2010), 'The perils of policy by p-value: Predicting civil conflicts', Journal of Peace Research, 47 (4), 363-75.
Watson, Robert T, et al. (2000), 'Summary for policymakers', Land Use, Land-use Change and Forestry. A special report of the Intergovernmental Panel on Climate Change (IPCC), Cambridge University Press, Cambridge, UK.
Wischnath, Gerdis and Buhaug, Halvard (2014), 'On climate variability and civil war in Asia', Climatic Change, 1-13.
Zhang, David D, et al. (2006), 'Climatic change, wars and dynastic cycles in China over the last millennium', Climatic Change, 76 (3-4), 459-77.