disability and american families: 2000 issued july 2005 · census 2000 data showed ... disability...
TRANSCRIPT

Census 2000 data showedthat approximately 20.9 mil-lion American families had atleast one member with a dis-ability1 and that they differedin important ways fromother families. Disability canbe measured in a variety ofways, as described in thenext section. The remainderof this report presents esti-mates of disability preva-lence in American familiesusing the measures availablefrom Census 2000, discussesthe general economic well-being of families with mem-bers with a disability, andexamines differences acrossdemographic groups andgeographical regions.
It is based on data from theCensus 2000 long form,which includes all the ques-tions on the short form plusadditional detailed questionsrelating to the social, eco-nomic, and housing charac-teristics of each individualand household.2 Estimatesin this report are limited tofamilies and people infamilies; see text box“Definition of Family andRelated Concepts.” It
U S C E N S U S B U R E A UHelping You Make Informed Decisions
U.S.Department of CommerceEconomics and Statistics Administration
U.S. CENSUS BUREAU
Issued July 2005
CENSR-23
Disability and American Families: 2000 Census 2000 Special Reports
By Qi Wang
1 See “Disability status” in thenext section.
2 The long form was sent to asample of approximately one in everysix households. See the section onAccuracy of the Estimates for sam-pling procedures and sampling errors.
DEFINITION OF FAMILY AND RELATED CONCEPTS
Family Household: Census 2000 collected dataon two types of households: family householdsand non-family households. This report focuseson the former, which, by the Census Bureau’s defi-nition, consists of a householder living with one ormore individuals related to him or her by birth,marriage, or adoption. The householder and allthe people in the household related to him or herare defined as family members. People living bythemselves or with others to whom they are notrelated are not included in this report.
Family Structure: This report examines threetypes of families: married-couple families, familieswith a female householder, and families with amale householder. Married-couple families aredefined as those in which the householder andspouse are listed as members of the same house-hold. Families with a female householder are thosewith a female householder and no husband of thehouseholder present. Similarly, families with amale householder are those with a male household-er and no wife of the householder present.
Family Householder: The householder refers tothe person (or one of the people) in whose namethe housing unit is owned or rented (maintained)or, if there is no such person, any adult member,excluding roomers, borders, or paid employees. Ifthe home is owned or rented jointly by a marriedcouple, the householder may be either the hus-band or the wife. The person designated as thehouseholder is the “reference person” to whom therelationship of all other household members, ifany, is recorded. This report uses the characteris-tics of the family householder, such as race andHispanic origin, to describe the family.

2 U.S. Census Bureau
complements a Census 2000 briefon the disability status of all non-institutionalized individuals whowere aged 5 and older by providingnew details about the prevalence offamilies with members with a dis-ability and their economic well-being in 2000.3
DISABILITY MEASUREMENTSIN CENSUS 2000 AND THIS REPORT
Census disability questions: TheCensus 2000 long form had sixquestions on disability, as shown inthe text box “Questions onDisability From Census 2000.” Thefollowing terms are used in thisreport for the six questions:“Sensory Disability” for Question 16part a, “Physical Disability” forQuestion 16 part b, “MentalDisability” for Question 17 part a,“Self-care Disability” for Question 17part b, “Going-outside-homeDisability” for Question 17 part c,and “Employment Disability” forQuestion 17 part d. This reportadopts the above terms to be con-sistent with those used in otherCensus 2000 data products such asSummary File 3, DemographicProfiles, and the Census 2000 briefon the disability status of U.S. non-institutionalized individuals 5 yearsor older. Rather than relying on thetechnical labels, readers are encour-aged to review the actual questions,which are shown in the text box.
The six disability questions on theCensus 2000 long form were theresult of a collaborative effort of afederal interagency working groupconvened by the Office ofManagement and Budget (OMB).4
Due to the time constraints onquestionnaire development, limita-tions on one portion of the ques-tions were not identified in time toadjust it for Census 2000.Consequently, this paper concen-trates on the responses to theother portion. Currently, anotherinteragency effort, also under theauspices of OMB, is reviewing thecensus disability questions to iden-tify improved ones for the 2008American Community Survey(ACS).5
Disability status: At times, thisreport uses a summary measure ofdisability for its estimates and com-parisons. The summary measurecombines responses from the firstfive questions to identify familymembers with a disability if theyare in one of the following cate-gories: first, they were 5 through15 years old and reported havingany one or a combination of thefour disabilities: sensory, physical,mental, or self-care; or second, theywere aged 16 and over and report-ed having one or a combination ofthe five disabilities: sensory, physi-cal, mental, self-care, or going-out-side-home. A person so identifiedis referred to in this report as “afamily member with a disability.” A
Does this person have any of the followinglong-lasting conditions:
a. Blindness, deafness, or a severevision or hearing impairment?
b. A condition that substantially limitsone or more basic physical activitiessuch as walking, climbing stairs,reaching, lifting, or carrying?
Yes No
Because of a physical, mental, or emotionalcondition lasting 6 months or more, doesthis person have any difficulty in doing any ofthe following activities:
a. Learning, remembering, orconcentrating?
Yes No
b. Dressing, bathing, or getting aroundinside the home?
c. (Answer if this person is 16 YEARS OLDOR OVER.) Going outside the homealone to shop or visit a doctor’s office?
d. (Answer if this person is 16 YEARS OLDOR OVER.) Working at a job or business?
REPRODUCTION OF THE QUESTIONS ON DISABILITY FROM CENSUS 2000
Source: U.S. Census Bureau, Census 2000 questionnaire.
16
17
3 See: Judith Waldrop and Sharon Stern,Disability Status: 2000, C2KBR-17, Washing-ton D.C.: US Government Printing Office,2003.
4 Adler, Michele C., Robert F. Clark,Theresa J. DeMaio, Louisa F. Miller, and ArleneF. Saluter. 1999. “Collecting Information onDisability in 2000 Census: An Example ofInteragency Cooperation.” Social SecurityBulletin, Vol. 62, No. 4, pp 21-30.
5 The American Community Survey (ACS)is a nationwide survey collecting year-to-yearinformation from households similar to whatwas collected on the Census 2000 longform. It is to replace the long form in the2010 Census.
family member with a disability issometimes further identified,according to his or her family role,as “a householder with a disability”or “a child with a disability.”
The summary measure is designedto capture specific functional limi-tations and long-term difficultywith functional or daily living activ-ities.6 Since the concept of work-ing at a job or business (Question17 part d) is not tied to any partic-ular limitation or function, peoplewho only reported difficulty inworking at a job or business arenot included in this summarymeasure. As a result, this summarymeasure differs from the one usedin Summary File 3, which includesdata on work disability status.
Families with members with adisability: The unit of analysis inthis report is the family.Households made up solely of unre-lated individuals are not included inthis report. The core comparisonsare between families with memberswith a disability and families with-out members with a disability. Thereport classifies all families that hadat least one member reporting adisability as “families with memberswith a disability,” or as “familieswith children with a disability” if theperson reporting a disability wasunder 18 years old in 2000. In gen-eral, this report does not distin-guish between families with onlyone member with a disability andthose with multiple members with adisability. Rather, it groups themtogether as “families with at leastone member with a disability” or“families with members with a dis-ability.” Both terms refer to thesame group and are used inter-changeably in this report.
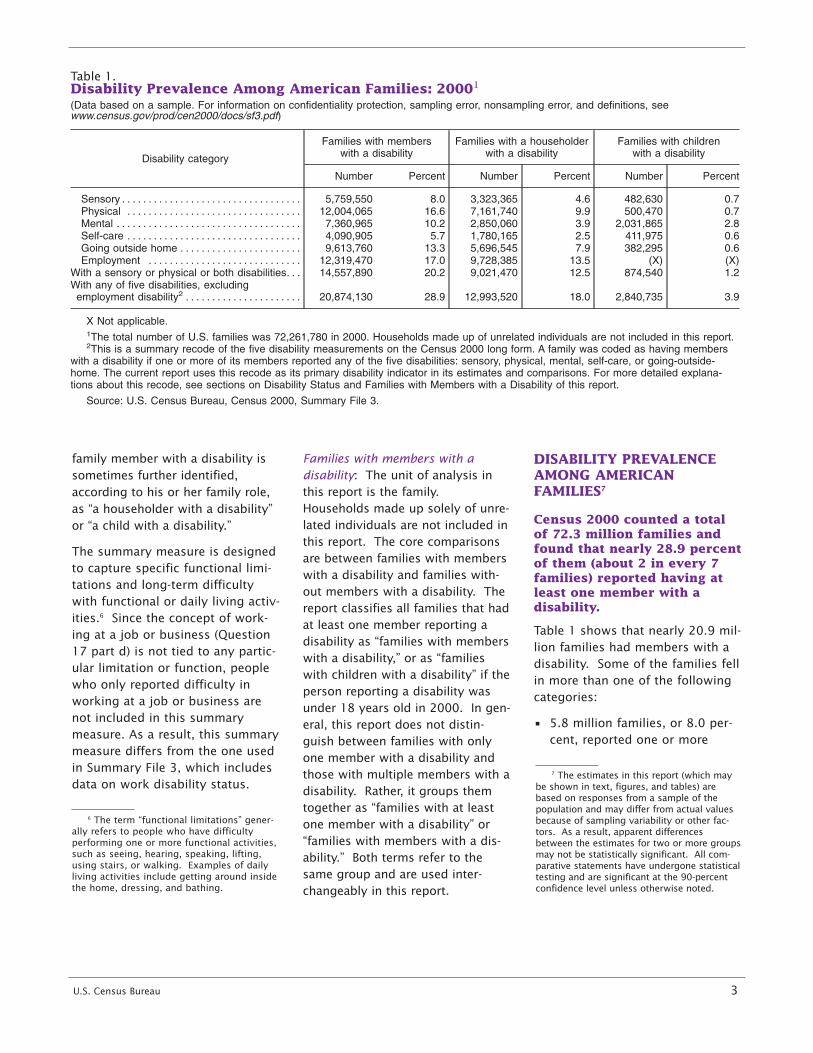
DISABILITY PREVALENCEAMONG AMERICANFAMILIES7
Census 2000 counted a totalof 72.3 million families andfound that nearly 28.9 percentof them (about 2 in every 7families) reported having atleast one member with adisability.
Table 1 shows that nearly 20.9 mil-lion families had members with adisability. Some of the families fellin more than one of the followingcategories:
• 5.8 million families, or 8.0 per-cent, reported one or more
U.S. Census Bureau 3
6 The term “functional limitations” gener-ally refers to people who have difficultyperforming one or more functional activities,such as seeing, hearing, speaking, lifting,using stairs, or walking. Examples of dailyliving activities include getting around insidethe home, dressing, and bathing.
Table 1.Disability Prevalence Among American Families: 20001
(Data based on a sample. For information on confidentiality protection, sampling error, nonsampling error, and definitions, seewww.census.gov/prod/cen2000/docs/sf3.pdf)
Disability category
Families with memberswith a disability
Families with a householderwith a disability
Families with childrenwith a disability
Number Percent Number Percent Number Percent
Sensory . . . . . . . . . . . . . . . . . . . . . . . . . . . . . . . . . . 5,759,550 8.0 3,323,365 4.6 482,630 0.7Physical . . . . . . . . . . . . . . . . . . . . . . . . . . . . . . . . . 12,004,065 16.6 7,161,740 9.9 500,470 0.7Mental . . . . . . . . . . . . . . . . . . . . . . . . . . . . . . . . . . . 7,360,965 10.2 2,850,060 3.9 2,031,865 2.8Self-care . . . . . . . . . . . . . . . . . . . . . . . . . . . . . . . . . 4,090,905 5.7 1,780,165 2.5 411,975 0.6Going outside home . . . . . . . . . . . . . . . . . . . . . . . 9,613,760 13.3 5,696,545 7.9 382,295 0.6Employment . . . . . . . . . . . . . . . . . . . . . . . . . . . . . 12,319,470 17.0 9,728,385 13.5 (X) (X)
With a sensory or physical or both disabilities. . . 14,557,890 20.2 9,021,470 12.5 874,540 1.2With any of five disabilities, excludingemployment disability2 . . . . . . . . . . . . . . . . . . . . . . 20,874,130 28.9 12,993,520 18.0 2,840,735 3.9
X Not applicable.1The total number of U.S. families was 72,261,780 in 2000. Households made up of unrelated individuals are not included in this report.2This is a summary recode of the five disability measurements on the Census 2000 long form. A family was coded as having members
with a disability if one or more of its members reported any of the five disabilities: sensory, physical, mental, self-care, or going-outside-home. The current report uses this recode as its primary disability indicator in its estimates and comparisons. For more detailed explana-tions about this recode, see sections on Disability Status and Families with Members with a Disability of this report.
Source: U.S. Census Bureau, Census 2000, Summary File 3.
7 The estimates in this report (which maybe shown in text, figures, and tables) arebased on responses from a sample of thepopulation and may differ from actual valuesbecause of sampling variability or other fac-tors. As a result, apparent differencesbetween the estimates for two or more groupsmay not be statistically significant. All com-parative statements have undergone statisticaltesting and are significant at the 90-percentconfidence level unless otherwise noted.

4 U.S. Census Bureau
members with blindness, deaf-ness, or a severe vision or hear-ing impairment.
• 12.0 million families, or 16.6percent, reported one or moremembers with a condition thatsubstantially limited one ormore basic physical activitiessuch as walking, climbing stairs,reaching, lifting, or carrying.
• 7.4 million families, or 10.2 per-cent, reported one or moremembers who had difficulty inlearning, remembering, or con-centrating.
• 4.1 million families, or 5.7 per-cent, reported one or moremembers who had difficultywith dressing, bathing, or get-ting around inside the home.
• 9.6 million families, or 13.3 per-cent, reported one or moremembers who had difficultygoing outside the home alone toshop or visit a doctor’s office.
• 12.3 million families, or 17.0 percent, reported one ormore members who had difficul-ty working at a job or business.
In 13 million families, thehouseholder had a disability(18.0 percent of all families),and in 2.8 million families (3.9 percent of all families),children had a disability (see Table 1).8
Often, more than one family mem-ber reported having a disability.Of the 20.9 million families report-ing at least one member with adisability, 5.5 percent had bothadults and children with a disabili-ty. Among the 20.9 million fami-lies, 25.7 percent had two peoplewith a disability and 5.7 percenthad three or more people with adisability (see Table 2).
Disability rates varied among single-race groups and Hispanics.
Census 2000 asked respondents toreport one or more races. With theexception of the Two or MoreRaces population, all the racegroups discussed in this reportrefer to householders who indicat-ed only one racial identity amongthe six major categories: White,Black or African American,American Indian and Alaska Native,Asian, Native Hawaiian or OtherPacific Islander, and Some OtherRace. The use of the single-racecategories to present data in thisreport does not imply it is the pre-ferred method.
The prevalence of disability variedamong families of different racialgroups and Hispanic origin. In thegroups examined in this report,disability occurrence was mostcommon among families withAmerican Indian and Alaska Nativehouseholders — 217,000, or
Table 2.Presence of Disabilities in Families and Children: 2000(Data based on a sample. For information on confidentiality protection, sampling error, nonsampling error, and definitions, seewww.census.gov/prod/cen2000/docs/sf3.pdf)
Family member disabilities
NumberPercent of total
families
Percent of familieswith members or
children witha disability
Total families . . . . . . . . . . . . . . . . . . . . . . . . . . . . . . . . . . . . . . . . . . . . . . . . . 72,261,780 100.0 (X)Reporting no member with a disability . . . . . . . . . . . . . . . . . . . . . . . . . . 51,387,650 71.1 (X)Reporting at least one member with a disability . . . . . . . . . . . . . . . . . 20,874,130 28.9 100.0
Families reporting any members with a disabilityReporting one member with a disability . . . . . . . . . . . . . . . . . . . . . . . . . 14,325,175 19.8 68.6Reporting two members with a disability . . . . . . . . . . . . . . . . . . . . . . . . 5,361,850 7.4 25.7Reporting three or more members with a disability . . . . . . . . . . . . . . . 1,187,105 1.6 5.7
Families reporing adults or children with a disabilityReporting only adults with a disability . . . . . . . . . . . . . . . . . . . . . . . . . . 18,033,395 25.0 86.4Reporting only children with a disability . . . . . . . . . . . . . . . . . . . . . . . . . 1,686,305 2.3 8.1Reporting both adults and children with a disability . . . . . . . . . . . . . . 1,154,425 1.6 5.5
Families reporting children with a disability1
Reporting one or more children with a disability . . . . . . . . . . . . . . . . . 2,840,735 3.9 100.0Reporting one child with a disability . . . . . . . . . . . . . . . . . . . . . . . . . . . . 2,473,245 3.4 87.1Reporting two children with a disability . . . . . . . . . . . . . . . . . . . . . . . . . 310,985 0.4 10.9Reporting three or more children with a disability . . . . . . . . . . . . . . . . 56,500 0.1 2.0
X = Not Applicable.1This number includes all people 5 to 17 years old.
Note: Details may not sum to totals because of rounding.
Source: U.S. Census Bureau, Census 2000, Summary File 3.
8 For the definition of a family household-er, see text box “Definition of Family andRelated Concepts” in this report.

U.S. Census Bureau 5
38.5 percent. Next were familieswith a Black householder, with aprevalence rate of 35.7 percent (or2.9 million families). Disabilityprevalence rates for families withnon-Hispanic White householdersand Asian householders werebelow the national average at 27.1 percent and 26.5 percent,respectively. Hispanic families hada prevalence rate of 33.2 percent(or 2.5 million families reportingone or more members with a dis-ability), as shown in Table 3.9
Disability was more prevalentamong families in the Southand in rural areas.
Disability prevalence was not even-ly distributed across the four U.S.regions or between urban and ruralareas.10 With a 30.8 percent dis-ability prevalence rate, the Southhad the highest concentration offamilies with members reportingdisabilities, whereas the Midwest
had the lowest prevalence rate at26.5 percent. About 30.1 percentof rural families and 28.5 percentof urban families reported at leastone member with a disability (seeTable 3).
One in every three familieswith a female householderwith no husband presentreported members with a disability.
Families with a female householderwith no husband present weremore likely than other family typesto report having members with adisability. Among the 12.5 millionsuch families, 34.8 percent report-ed one or more members with adisability, compared with 27.3 per-cent among the 55.5 million mar-ried-couple families and 31.6 per-cent among the 4.3 million familieswith a male householder with nowife present (see Figure 1).
Table 3.Disability Prevalence by Race, Hispanic Origin, and Geographic Location: 2000(Data based on a sample. For information on confidentiality protection, sampling error, nonsampling error, and definitions, seewww.census.gov/prod/cen2000/docs/sf3.pdf)
Family charcteristics
Total
Families reporting members witha disability
Number Percent
All Families . . . . . . . . . . . . . . . . . . . . . . . . . . . . . . . . . . . . . . . . . . . . . . . . . . . 72,261,780 20,874,130 28.9
Race and Hispanic Origin
White alone . . . . . . . . . . . . . . . . . . . . . . . . . . . . . . . . . . . . . . . . . . . . . . . . . . . 56,470,095 15,548,770 27.5White alone, not Hispanic . . . . . . . . . . . . . . . . . . . . . . . . . . . . . . . . . . . . . 52,769,535 14,322,150 27.1
Black alone . . . . . . . . . . . . . . . . . . . . . . . . . . . . . . . . . . . . . . . . . . . . . . . . . . . 8,209,430 2,931,270 35.7American Indian and Alaska Native alone . . . . . . . . . . . . . . . . . . . . . . . . . 563,650 217,195 38.5Asian alone. . . . . . . . . . . . . . . . . . . . . . . . . . . . . . . . . . . . . . . . . . . . . . . . . . . . 2,350,400 623,255 26.5Native Hawaiian and Other Pacific Islander alone . . . . . . . . . . . . . . . . . 79,255 25,075 31.6Some other race alone . . . . . . . . . . . . . . . . . . . . . . . . . . . . . . . . . . . . . . . . . 3,206,530 1,032,330 32.2Two or more races . . . . . . . . . . . . . . . . . . . . . . . . . . . . . . . . . . . . . . . . . . . . . 1,382,420 496,235 35.9Hispanic (of any race) . . . . . . . . . . . . . . . . . . . . . . . . . . . . . . . . . . . . . . . . . . 7,483,040 2,486,495 33.2
Region
Northeast . . . . . . . . . . . . . . . . . . . . . . . . . . . . . . . . . . . . . . . . . . . . . . . . . . . . . 13,633,405 3,830,505 28.1Midwest . . . . . . . . . . . . . . . . . . . . . . . . . . . . . . . . . . . . . . . . . . . . . . . . . . . . . . 16,769,420 4,450,450 26.5South . . . . . . . . . . . . . . . . . . . . . . . . . . . . . . . . . . . . . . . . . . . . . . . . . . . . . . . . 26,428,370 8,146,465 30.8West . . . . . . . . . . . . . . . . . . . . . . . . . . . . . . . . . . . . . . . . . . . . . . . . . . . . . . . . . 15,430,585 4,446,710 28.8
Rural/urban
Rural . . . . . . . . . . . . . . . . . . . . . . . . . . . . . . . . . . . . . . . . . . . . . . . . . . . . . . . . . 16,679,230 5,024,380 30.1Urban . . . . . . . . . . . . . . . . . . . . . . . . . . . . . . . . . . . . . . . . . . . . . . . . . . . . . . . . 55,582,550 15,849,750 28.5
Source: U.S. Census Bureau, Census 2000, Summary File 3.
9 Because Hispanics may be any race,data in this report for Hispanics overlap withdata for racial groups. Based on the Census2000 sample data used for analysis of dis-ability, the proportion of Hispanics was 8.0 percent for Whites, 1.9 percent forBlacks, 14.6 percent for American Indiansand Alaska Natives, 1.0 percent for Asians,9.5 percent for Native Hawaiian and OtherPacific Islanders, 97.1 percent for thosereporting Some Other Race, and 31.1 per-cent for those reporting Two or More Races.
10 The Northeast region includes the statesof Connecticut, Maine, Massachusetts, NewHampshire, New Jersey, New York,Pennsylvania, Rhode Island, and Vermont. TheMidwest region includes the states of Illinois,Indiana, Iowa, Kansas, Michigan, Minnesota,Missouri, Nebraska, North Dakota, Ohio,South Dakota, and Wisconsin. The Southregion includes the states of Alabama,Arkansas, Delaware, Florida, Georgia,Kentucky, Louisiana, Maryland, Mississippi,North Carolina, Oklahoma, South Carolina,Tennessee, Texas, Virginia, West Virginia, andthe District of Columbia, a state equivalent.The West region includes the states of Alaska,Arizona, California, Colorado, Hawaii, Idaho,Montana, Nevada, New Mexico, Oregon, Utah,Washington, and Wyoming.

6 U.S. Census Bureau
ECONOMICCHARACTERISTICS OFFAMILIES VARIED WITHDISABILITY STATUS
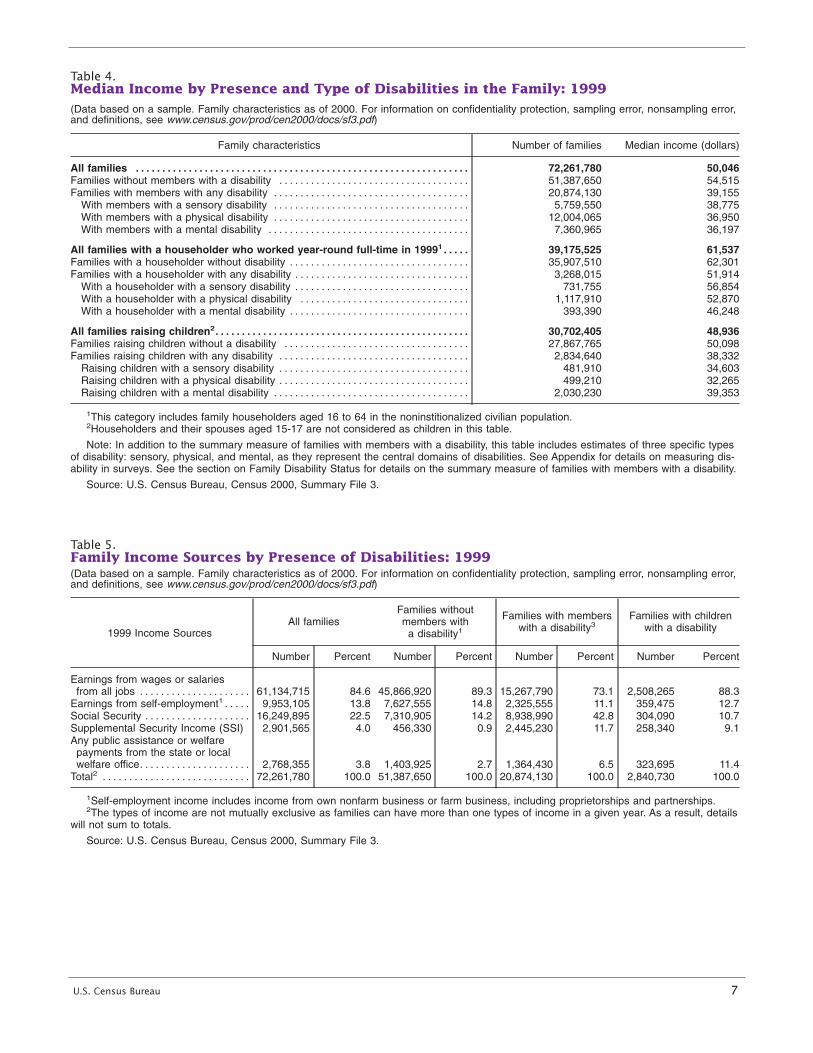
Families with members with adisability had lower medianincome than other families.
Families with members with a dis-ability had a median income of$39,155, below the overall familymedian income of $50,046 and the$54,515 median income of familieswithout members with a disability(see Table 4).11 Across disabilitytypes, families with members witha mental disability had a medianincome of $36,197, lower than themedian incomes of $38,775 and$36,950 for families with memberswith a sensory disability or thosewith a physical disability,respectively.
Families with members with adisability were less likely thanother families to have earningsand more likely to receiveincome from Social Securityand public assistance.
About 3 in 4 families with mem-bers with a disability (73.1 per-cent) had earnings from wages orsalaries in 1999, compared to 84.6 percent of all U.S. familiesand 89.3 percent of families with-out members with a disability.About 11.1 percent of familieswith members with a disability hadearnings from self-employment,compared to 13.8 percent for allfamilies and 14.8 percent for fami-lies with members without a dis-ability (see Table 5).
About 42.8 percent of families withmembers with a disability receivedincome from Social Security, com-pared with 22.5 percent of all fami-lies and 14.2 percent of families
without members with a disability.About 11.7 percent had incomesfrom Supplemental Security Income,compared with 4.0 percent of allU.S. families and 0.9 percent offamilies without members with adisability. About 6.5 percent hadincomes from welfare paymentsfrom state or local governments.Families with children with adisability were also more likely to receive various types of assis-tance from state and local govern-ments — 11.4 percent, comparedwith 3.8 percent of all U.S. familiesand 2.7 percent of families withoutmembers with a disability (seeTable 5).
Family householders withdisabilities were less likely to be employed and less likely to be in the labor force thanother family householders.
Family householders are often thebreadwinners of their households(see text box on page 1 for defini-tion of Family Householder used inthis report). Of all family house-holders, those with a disability hada lower employment rate (53.5 per-cent compared with 80.7 percentfor all family householders) and alarger proportion of people not inthe labor force (42.3 percent com-pared with 16.4 percent for all fami-ly householders) (see Figure 2).
Figure 1.Family Structure and Presence of Disabilities: 20001
1 The total number of families was 72.3 million in 2000, including 55.5 million married-couple families, 12.5 million families with a female householder with no husband present, and 4.3 million families with a male householder with no wife present. Households of unrelated individuals are not included in this analysis. Source: U.S. Census Bureau, Census 2000, Summary File 3.
(Percent distribution. Data based on sample. For information on confidentiality protection, sampling error, nonsampling error, and definitions, see www.census.gov/prod/cen2000/doc/sf3.pdf)
Family witha male
householder,no wifepresent
Family witha female
householder,no husband
present
Married-couplefamily
Members with a disability
No members with a disability
27.334.8 31.6
72.7 65.2
68.4
11 Income levels are for calendar year1999.
U.S. Census Bureau 7
Table 4.Median Income by Presence and Type of Disabilities in the Family: 1999(Data based on a sample. Family characteristics as of 2000. For information on confidentiality protection, sampling error, nonsampling error,and definitions, see www.census.gov/prod/cen2000/docs/sf3.pdf)
Family characteristics Number of families Median income (dollars)
All families . . . . . . . . . . . . . . . . . . . . . . . . . . . . . . . . . . . . . . . . . . . . . . . . . . . . . . . . . . . . . . . 72,261,780 50,046Families without members with a disability . . . . . . . . . . . . . . . . . . . . . . . . . . . . . . . . . . . . 51,387,650 54,515Families with members with any disability . . . . . . . . . . . . . . . . . . . . . . . . . . . . . . . . . . . . . 20,874,130 39,155
With members with a sensory disability . . . . . . . . . . . . . . . . . . . . . . . . . . . . . . . . . . . . . 5,759,550 38,775With members with a physical disability . . . . . . . . . . . . . . . . . . . . . . . . . . . . . . . . . . . . . 12,004,065 36,950With members with a mental disability . . . . . . . . . . . . . . . . . . . . . . . . . . . . . . . . . . . . . . 7,360,965 36,197
All families with a householder who worked year-round full-time in 19991 . . . . . 39,175,525 61,537Families with a householder without disability . . . . . . . . . . . . . . . . . . . . . . . . . . . . . . . . . . 35,907,510 62,301Families with a householder with any disability . . . . . . . . . . . . . . . . . . . . . . . . . . . . . . . . . 3,268,015 51,914
With a householder with a sensory disability . . . . . . . . . . . . . . . . . . . . . . . . . . . . . . . . . 731,755 56,854With a householder with a physical disability . . . . . . . . . . . . . . . . . . . . . . . . . . . . . . . . 1,117,910 52,870With a householder with a mental disability . . . . . . . . . . . . . . . . . . . . . . . . . . . . . . . . . . 393,390 46,248
All families raising children2. . . . . . . . . . . . . . . . . . . . . . . . . . . . . . . . . . . . . . . . . . . . . . . . 30,702,405 48,936Families raising children without a disability . . . . . . . . . . . . . . . . . . . . . . . . . . . . . . . . . . . 27,867,765 50,098Families raising children with any disability . . . . . . . . . . . . . . . . . . . . . . . . . . . . . . . . . . . . 2,834,640 38,332
Raising children with a sensory disability . . . . . . . . . . . . . . . . . . . . . . . . . . . . . . . . . . . . 481,910 34,603Raising children with a physical disability . . . . . . . . . . . . . . . . . . . . . . . . . . . . . . . . . . . . 499,210 32,265Raising children with a mental disability . . . . . . . . . . . . . . . . . . . . . . . . . . . . . . . . . . . . . 2,030,230 39,353
1This category includes family householders aged 16 to 64 in the noninstitionalized civilian population.2Householders and their spouses aged 15-17 are not considered as children in this table.
Note: In addition to the summary measure of families with members with a disability, this table includes estimates of three specific typesof disability: sensory, physical, and mental, as they represent the central domains of disabilities. See Appendix for details on measuring dis-ability in surveys. See the section on Family Disability Status for details on the summary measure of families with members with a disability.
Source: U.S. Census Bureau, Census 2000, Summary File 3.
Table 5.Family Income Sources by Presence of Disabilities: 1999(Data based on a sample. Family characteristics as of 2000. For information on confidentiality protection, sampling error, nonsampling error,and definitions, see www.census.gov/prod/cen2000/docs/sf3.pdf)
1999 Income SourcesAll families
Families withoutmembers with
a disability1
Families with memberswith a disability3
Families with childrenwith a disability
Number Percent Number Percent Number Percent Number Percent
Earnings from wages or salariesfrom all jobs . . . . . . . . . . . . . . . . . . . . . 61,134,715 84.6 45,866,920 89.3 15,267,790 73.1 2,508,265 88.3
Earnings from self-employment1 . . . . . 9,953,105 13.8 7,627,555 14.8 2,325,555 11.1 359,475 12.7Social Security . . . . . . . . . . . . . . . . . . . . 16,249,895 22.5 7,310,905 14.2 8,938,990 42.8 304,090 10.7Supplemental Security Income (SSI) 2,901,565 4.0 456,330 0.9 2,445,230 11.7 258,340 9.1Any public assistance or welfarepayments from the state or localwelfare office. . . . . . . . . . . . . . . . . . . . . 2,768,355 3.8 1,403,925 2.7 1,364,430 6.5 323,695 11.4
Total2 . . . . . . . . . . . . . . . . . . . . . . . . . . . . 72,261,780 100.0 51,387,650 100.0 20,874,130 100.0 2,840,730 100.0
1Self-employment income includes income from own nonfarm business or farm business, including proprietorships and partnerships.2The types of income are not mutually exclusive as families can have more than one types of income in a given year. As a result, details
will not sum to totals.
Source: U.S. Census Bureau, Census 2000, Summary File 3.

Among householders with disabili-ties, those with a mental disabilityhad the lowest employment rate,34.2 percent, and the largest pro-portion of people not in the laborforce, 60.8 percent. Next werehouseholders with a physical dis-ability, with an employment rate of39.3 percent; in 2000, 56.8 percentof them did not participate in thelabor force.
The median income offamilies with a householderwho worked full-time, year-round varied by whether thehouseholder had a disabilityand by the type of disability.
Among the approximately 3.3 mil-lion families with householderswho reported a disability andworked full-time year-round in1999, the median income was$51,914, lower than the medianincome of $61,537 for all U.S. fam-ilies with householders working
full-time year-round and the medi-an income of $62,301 for familieswith householders without a dis-ability and working full-time year-round. Across disability types,families with householders with amental disability and working full-time year-round reported the low-est median income ($46,248),compared with families withhouseholders with a physical dis-ability ($52,870) or those with asensory disability ($56,854) (seeTable 4).
8 U.S. Census Bureau
Figure 2.Employment Status of Family Householders by Presence and Selected Type of Disabilities: 20001
1 The total number of family householders in the civilian population aged 16 to 64 years old was 59.7 million in 2000. A family householder was coded as having a disability if he or she reported any of the five disabilities: sensory, physical, mental, self-care, or going-outside-home.
Note 1: Details may not sum to totals due to rounding. Note 2: In addition to the summary measure of families with members with a disability, Figures 2, 3, 4, and 6 in this report include estimates of three specific types of disability: sensory, physical, and mental, as they represent the central domains of disabilities. See Appendix for details on measuring disability in surveys. See the section on Family Disability Status for details on the summary measure of families with members with a disability.
Source: U.S. Census Bureau, Census 2000, Summary File 3.
(Percent distribution. Data based on sample. For information on confidentiality protection, sampling error, nonsampling error, and definitions, see www.census.gov/prod/cen2000/doc/sf3.pdf)
Not in labor force
Unemployed
Employed
Familyhouseholderswith a mental
disability
Familyhouseholders
with a physicaldisability
Familyhouseholderswith a sensory
disability
Familyhouseholders
with adisability
Familyhouseholders
without adisability
All familyhouseholders
80.7
2.9
16.4
85.1
2.7
12.2
53.5
4.3
42.3
58.7
3.7
37.6
39.3
3.9
56.8
34.2
5.0
60.8

Families with householderswith a disability were lesslikely to own their residencethan other families.
Among families with householderswith a disability, a smaller propor-tion (71.3 percent) lived in owner-occupied housing units than allU.S. families (74.2 percent) or thanfamilies with householders without
any disability (74.8 percent) (seeFigure 3).12
Homeownership also varied bytypes of disability in the family.Families with a householder with amental disability had the smallestproportion (65.6 percent) living inowner-occupied housing units.Families with a householder with asensory disability, meanwhile, hadthe largest proportion (78.4 per-cent).
U.S. Census Bureau 9
Figure 3.Homeownership by Selected Type of Disabilities of the Family Householder: 2000
Note 1: Details may not sum to totals due to rounding. Note 2: In addition to the summary measure of families with members with a disability, Figures 2, 3, 4, and 6 in this report include estimates of three specific types of disability: sensory, physical, and mental, as they represent the central domains of disabilities. See Appendix for details on measuring disability in surveys. See the section on Family Disability Status for details on the summary measure of families with members with a disability.
Source: U.S. Census Bureau, Census 2000, Summary File 3.
(Percent distribution. Data based on sample. For information on confidentiality protection, sampling error, nonsampling error, and definitions, see www.census.gov/prod/cen2000/doc/sf3.pdf)
Owner-occupied housing unit
Renter-occupied housing unit
Families withhouseholderwith a mental
disability
Families withhouseholder
with a physicaldisability
Families withhouseholder
with a sensorydisability
Families withhouseholder
with adisability
Families withhouseholder
without adisability
All families
74.2
25.8
74.8
25.2
71.3
28.7
78.4
21.6
73.9
26.1
65.6
34.4
12 The Census 2000 long form collectedinformation on housing tenure from respon-dents of all occupied housing units. Housingunits are classified as either owner-occupiedor renter-occupied. A housing unit is owner-occupied if the owner or co-owner lives in theunit even if it is mortgaged or not fully paidfor. Occupied housing units which are notowner-occupied, whether they are rented forcash rent or occupied without payment ofcash rent, are classified as renter-occupied.

DISABILITY AND FAMILYPOVERTY13
Using poverty status as anotherindicator of economic well-being,this section discusses disabilityand poverty among American fami-lies and the extent to which theyvaried across different family struc-tures and regional and racialgroups.14 A description of the defi-nition and measurement of family
poverty is contained in the textbox “Definition of Family Povertyand Related Concepts.”
In every state, families withmembers with a disabilitywere more likely than otherfamilies to live in poverty.
Among families with one or moremembers with a disability, thepoverty rate was 12.8 percent —higher than the 9.2 percent for allfamilies and the 7.7 percent forfamilies without members with adisability. In every state and in theDistrict of Columbia, the povertyrate was higher among familieswith members with a disability thanamong families without, as shownin Table 6. The magnitude of the
difference varied across states. InHawaii, for instance, the povertyrate for families with members witha disability was 8.9 percent — a dif-ference of 1.7 points from the 7.1 percent for those without mem-bers with a disability. The corre-sponding rates in Nevada were 6.9 percent compared with 9.1 per-cent and in Utah 5.8 percent com-pared with 8.4 percent, as shown inthe last column of Table 6.
Of the families with two ormore members with a disability,16.5 percent were in poverty.
Poverty rates increased with thenumber of family membersreporting a disability and varied
10 U.S. Census Bureau
Total Family Income: Census 2000 asked aboutmoney income received during the 1999 calendaryear. The incomes of all members in each familywere then summed and treated as a single amount:total family income.
Family Poverty: Following the Office ofManagement and Budget’s (OMB) Statistical Policy
Directive 14, this report uses a set of moneyincome thresholds that vary by family size andcomposition (see the matrix below). To determinewhether a family was in poverty in 1999, the totalfamily income was compared with the appropriatepoverty threshold. If the total family income wasless than the threshold, then the family was consid-ered to be in poverty.
Poverty Thresholds (Annual Dollar Amounts) by Size of Family and Number of RelatedChildren Under 18 Years Old: 1999
Size of family unit
Related children under 18 years
None One Two Three Four Five Six SevenEight or
more
One person (unrelated individual)Under 65 years . . . . . . . . . . . . . . . . . . . 8,66765 years and over . . . . . . . . . . . . . . . . 7,990
Two peopleHouseholder under 65 years . . . . . . . 11,156 11,483Householder 65 years and over . . . . 10,070 11,440
Three people . . . . . . . . . . . . . . . . . . . . . . . 13,032 13,410 13,423Four people . . . . . . . . . . . . . . . . . . . . . . . . 17,184 17,465 16,895 16,954Five people . . . . . . . . . . . . . . . . . . . . . . . . 20,723 21,024 20,380 19,882 19,578Six people . . . . . . . . . . . . . . . . . . . . . . . . . 23,835 23,930 23,436 22,964 22,261 21,845Seven people . . . . . . . . . . . . . . . . . . . . . . 27,425 27,596 27,006 26,595 25,828 24,934 23,953Eight people . . . . . . . . . . . . . . . . . . . . . . . 30,673 30,944 30,387 29,899 29,206 28,327 27,412 27,180Nine people or more . . . . . . . . . . . . . . . . 36,897 37,076 36,583 36,169 35,489 34,554 33,708 33,499 32,208
Source: U.S. Census Bureau.
DEFINITION OF FAMILY POVERTY AND RELATED CONCEPTS
13 Poverty, like income, refers to calendaryear 1999.
14 Estimates and comparisons in this sec-tion use the family as the unit of analysis.For poverty statistics of the entire U.S. popu-lation, see Alemayehu Bishaw and JohnIceland, Poverty: 1999: Census 2000, C2KBR-19, Washington D.C.: US GovernmentPrinting Office, 2003.

U.S. Census Bureau 11
Table 6.Poverty Rate by Presence of Disabilities for States: 1999(Data based on a sample. Family characteristics as of 2000. For information on confidentiality protection, sampling error, nonsampling error,and definitions, see www.census.gov/prod/cen2000/docs/sf3.pdf)
Area
Total Families Families without memberswith a disability
Families with memberswith a disability
Difference inpercentage
points1
Number(1)
Percentin pov-erty (2)
Number offamilies
(3)
Number inpoverty
(4)
Percentin pov-erty (5)
Number offamilies
(6)
Number inpoverty
(7)
Percentin pov-erty (8)
Column(8)
minuscolumn
(2)
Column(8)
minuscolumn
(5)
United States . . . . . . . . . . . . . 72,261,780 9.2 51,387,650 3,950,480 7.7 20,874,130 2,670,465 12.8 3.6 5.1
Alabama . . . . . . . . . . . . . . . . . 1,223,185 12.5 809,780 84,530 10.4 413,405 68,585 16.6 4.1 6.2Alaska . . . . . . . . . . . . . . . . . . . 153,610 6.7 116,135 6,895 5.9 37,475 3,375 9.0 2.3 3.1Arizona . . . . . . . . . . . . . . . . . . 1,296,595 9.9 918,660 80,220 8.7 377,935 48,100 12.7 2.8 4.0Arkansas . . . . . . . . . . . . . . . . . 736,065 12.0 484,330 49,165 10.2 251,735 39,310 15.6 3.6 5.5California. . . . . . . . . . . . . . . . . 7,985,490 10.6 5,582,810 519,790 9.3 2,402,680 326,205 13.6 3.0 4.3Colorado . . . . . . . . . . . . . . . . . 1,092,350 6.2 825,895 43,275 5.2 266,455 24,340 9.1 2.9 3.9Connecticut . . . . . . . . . . . . . . . 885,745 5.6 663,135 30,540 4.6 222,615 19,440 8.7 3.1 4.1Delaware. . . . . . . . . . . . . . . . . 205,775 6.5 148,765 8,175 5.5 57,010 5,130 9.0 2.5 3.5District of Columbia. . . . . . . . . 115,965 16.7 77,540 11,415 14.7 38,425 7,950 20.7 4.0 6.0Florida. . . . . . . . . . . . . . . . . . . 4,238,410 9.0 2,877,525 229,560 8.0 1,360,885 153,570 11.3 2.2 3.3
Georgia . . . . . . . . . . . . . . . . . . 2,126,360 9.9 1,503,745 124,195 8.3 622,615 85,945 13.8 3.9 5.5Hawaii . . . . . . . . . . . . . . . . . . . 289,010 7.6 203,800 14,555 7.1 85,215 7,545 8.9 1.3 1.7Idaho. . . . . . . . . . . . . . . . . . . . 337,885 8.3 246,605 18,615 7.5 91,280 9,515 10.4 2.1 2.9Illinois . . . . . . . . . . . . . . . . . . . 3,125,320 7.8 2,289,615 147,260 6.4 835,705 97,045 11.6 3.8 5.2Indiana . . . . . . . . . . . . . . . . . . 1,611,045 6.7 1,162,630 64,745 5.6 448,415 43,045 9.6 2.9 4.0Iowa . . . . . . . . . . . . . . . . . . . . 774,245 6.0 586,605 30,605 5.2 187,645 16,035 8.5 2.5 3.3Kansas . . . . . . . . . . . . . . . . . . 706,785 6.7 524,995 30,885 5.9 181,790 16,415 9.0 2.3 3.1Kentucky . . . . . . . . . . . . . . . . . 1,110,425 12.7 729,775 69,885 9.6 380,655 70,635 18.6 5.9 9.0Louisiana. . . . . . . . . . . . . . . . . 1,163,190 15.8 782,590 107,240 13.7 380,605 76,210 20.0 4.3 6.3Maine . . . . . . . . . . . . . . . . . . . 342,430 7.8 244,370 15,185 6.2 98,060 11,430 11.7 3.9 5.4
Maryland . . . . . . . . . . . . . . . . . 1,368,645 6.1 1,004,175 49,920 5.0 364,475 33,315 9.1 3.1 4.2Massachusetts . . . . . . . . . . . . 1,587,535 6.7 1,172,100 61,535 5.2 415,435 44,085 10.6 4.0 5.4Michigan . . . . . . . . . . . . . . . . . 2,591,310 7.4 1,854,455 113,020 6.1 736,860 79,360 10.8 3.4 4.7Minnesota . . . . . . . . . . . . . . . . 1,262,955 5.1 981,780 41,565 4.2 281,175 22,615 8.0 3.0 3.8Mississippi. . . . . . . . . . . . . . . . 752,235 16.0 486,700 64,985 13.4 265,535 55,055 20.7 4.8 7.4Missouri. . . . . . . . . . . . . . . . . . 1,486,545 8.6 1,063,985 76,760 7.2 422,560 50,560 12.0 3.4 4.8Montana . . . . . . . . . . . . . . . . . 238,735 10.5 175,045 16,485 9.4 63,685 8,520 13.4 2.9 4.0Nebraska. . . . . . . . . . . . . . . . . 446,550 6.7 341,005 20,615 6.0 105,545 9,360 8.9 2.2 2.8Nevada . . . . . . . . . . . . . . . . . . 502,510 7.5 355,575 24,515 6.9 146,935 13,360 9.1 1.6 2.2New Hampshire . . . . . . . . . . . 325,580 4.3 243,130 8,105 3.3 82,450 5,845 7.1 2.8 3.8
New Jersey . . . . . . . . . . . . . . . 2,167,575 6.3 1,586,670 83,395 5.3 580,905 52,155 9.0 2.7 3.7New Mexico . . . . . . . . . . . . . . 468,900 14.5 324,755 42,125 13.0 144,145 26,055 18.1 3.5 5.1New York. . . . . . . . . . . . . . . . . 4,673,485 11.5 3,252,020 303,035 9.3 1,421,465 232,900 16.4 4.9 7.1North Carolina. . . . . . . . . . . . . 2,173,345 9.0 1,522,720 114,920 7.5 650,625 81,500 12.5 3.5 5.0North Dakota . . . . . . . . . . . . . 166,965 8.3 127,010 9,485 7.5 39,955 4,405 11.0 2.7 3.6Ohio . . . . . . . . . . . . . . . . . . . . 3,007,205 7.8 2,180,070 143,365 6.6 827,140 91,660 11.1 3.3 4.5Oklahoma . . . . . . . . . . . . . . . . 927,705 11.2 632,500 62,300 9.8 295,200 41,455 14.0 2.9 4.2Oregon . . . . . . . . . . . . . . . . . . 884,875 7.9 635,790 43,755 6.9 249,085 26,275 10.6 2.7 3.7Pennsylvania. . . . . . . . . . . . . . 3,225,705 7.8 2,332,680 148,680 6.4 893,030 101,620 11.4 3.6 5.0Rhode Island. . . . . . . . . . . . . . 266,655 8.9 190,185 14,315 7.5 76,470 9,290 12.1 3.3 4.6
South Carolina . . . . . . . . . . . . 1,078,735 10.7 735,795 65,480 8.9 342,945 50,420 14.7 4.0 5.8South Dakota . . . . . . . . . . . . . 195,455 9.3 147,140 12,045 8.2 48,315 6,125 12.7 3.4 4.5Tennessee. . . . . . . . . . . . . . . . 1,557,620 10.3 1,057,975 88,245 8.3 499,645 72,470 14.5 4.2 6.2Texas . . . . . . . . . . . . . . . . . . . 5,283,475 12.0 3,749,740 387,200 10.3 1,533,735 245,475 16.0 4.0 5.7Utah . . . . . . . . . . . . . . . . . . . . 539,730 6.5 402,300 23,430 5.8 137,440 11,540 8.4 1.9 2.6Vermont . . . . . . . . . . . . . . . . . 158,685 6.3 118,610 6,210 5.2 40,075 3,715 9.3 3.0 4.0Virginia . . . . . . . . . . . . . . . . . . 1,859,985 7.0 1,353,560 77,365 5.7 506,425 52,525 10.4 3.4 4.7Washington . . . . . . . . . . . . . . . 1,509,395 7.3 1,098,330 68,945 6.3 411,065 41,720 10.1 2.8 3.9West Virginia. . . . . . . . . . . . . . 507,255 13.9 324,695 35,865 11.0 182,560 34,585 18.9 5.1 7.9Wisconsin . . . . . . . . . . . . . . . . 1,395,035 5.6 1,059,690 49,115 4.6 335,350 29,075 8.7 3.1 4.0Wyoming . . . . . . . . . . . . . . . . . 131,510 8.1 98,195 6,960 7.1 33,315 3,625 10.9 2.8 3.8
Puerto Rico . . . . . . . . . . . . . . . 1,008,555 44.6 556,375 228,215 41.0 452,180 222,040 49.1 4.5 8.1
1These differences are statistically significant at 90-percent confidence level.
Note: Details may not sum to totals due to rounding.
Source: U.S. Census Bureau, Census 2000, Summary File 3.

12 U.S. Census Bureau
Figure 4.Poverty Rates by Number and Type of Members With a Disability: 1999
Note 1: Householders and their spouses aged 15-17 are not considered as children. Note 2: In addition to the summary measure of families with members with a disability, Figures 2, 3, 4, and 6 in this report include estimates of three specific types of disability: sensory, physical, and mental, as they represent the central domains of disabilities. See Appendix for details on measuring disability in surveys. See the section on Family Disability Status for details on the summary measure of families with members with a disability.
Source: U.S. Census Bureau, Census 2000, Summary File 3.
(In percent. Family characteristics as of 2000. Data based on sample. For information on confidentiality protection, sampling error, nonsampling error, and definitions, see www.census.gov/prod/cen2000/doc/sf3.pdf)
Families with members with a disability
Families without members with a disability
All families
Families with both adults and children with a disability
Families with children with a disability only
Families with adults with a disability only
Families with two or more children with a disability
Families with one child with a disability
Families with at least one child with a disability
Families with any three or more members with a disability
Families with any two members with a disability
Families with any one member with a disability
Families raising children with a mental disability
Families raising children with a physical disability
Families raising children with a sensory disability
Families with members with a mental disability
Families with members with a physical disability
Families with members with a sensory disability
By types of members with a disability
All families
By number of members with a disability
By disability types
21.1
9.2
7.7
12.8
11.4
17.0
28.9
12.8
14.2
18.9
21.8
20.2
32.4
11.0
12.6
16.2
25.7
27.6

across disability type. Among theestimated 6.5 million families withtwo or more members with adisability, 16.5 percent were inpoverty. The poverty rate for the1.2 million families with bothadults and children with a disabili-ty was 28.9 percent (see Figure 4).
Across disability types, familieswith members with a mental dis-ability were more likely to live inpoverty, 16.2 percent, than werefamilies with members with aphysical or a sensory disability at12.6 percent and 11.3 percent,respectively (see Figure 4).
Poverty and disability tended to occur in similarproportions in Black familiesand American Indian andAlaska Native families.
Of the single-race and Hispanicgroups examined in this report,Black families and American Indian
U.S. Census Bureau 13
Table 7.Poverty Rates by Presence of Disabilities and Selected Family Characteristics: 1999(Data based on a sample. Family characteristics as of 2000. For information on confidentiality protection, sampling error, nonsampling error,and definitions, see www.census.gov/prod/cen2000/docs/sf3.pdf)
Family characteristics
All families Families without memberswith a disability
Families with members witha disability
Difference inpercentage
points1
Number(1)
Percentin poverty
(2)Number
(3)
Familiesin poverty
(4)
Per-cent in
poverty(5)
Number(6)
Familiesin poverty
(7)
Per-cent in
poverty(8)
Column(8)
minuscolumn
(2)
Column(8)
minuscolumn
(5)
Race and HispanicOrigin1
White alone . . . . . . . . . . . . . 56,470,095 6.3 40,921,325 2,109,285 5.2 15,548,770 1,439,250 9.3 3.0 4.2White alone, notHispanic . . . . . . . . . . . . . 52,769,535 5.5 38,447,385 1,702,285 4.4 14,322,150 1,186,810 8.3 2.8 3.9
Black alone. . . . . . . . . . . . . . 8,209,430 21.7 5,278,165 1,043,235 19.8 2,931,270 733,870 25.0 3.4 5.3American Indian andAlaska Native alone . . . . . 563,650 21.8 346,455 67,605 19.5 217,195 55,325 25.5 3.7 6.0
Asian alone . . . . . . . . . . . . . 2,350,400 9.7 1,727,145 149,920 8.7 623,255 76,995 12.4 2.7 3.7Native Hawaiian and otherPacific Islander alone. . . . 79,255 14.6 54,18 7,405 13.7 25,075 4,180 16.7 2.1 3.0
Some other race alone . . . 3,206,530 22.0 2,174,205 444,525 20.5 1,032,330 261,955 25.4 3.3 4.9Two or more races . . . . . . . 1,382,420 16.5 886,185 128,510 14.5 496,240 98,895 19.9 3.5 5.4Hispanic (of any race) . . . . 7,483,040 20.0 4,996,545 922,615 18.5 2,486,495 572,680 23.0 3.1 4.6
Region
Northeast . . . . . . . . . . . . . 13,633,405 8.5 9,802,900 671,000 6.8 3,830,505 480,475 12.5 4.1 5.7Midwest. . . . . . . . . . . . . . . 16,769,420 7.2 12,318,970 739,460 6.0 4,450,450 465,695 10.5 3.3 4.5South. . . . . . . . . . . . . . . . . 26,428,370 10.6 18,281,905 1,630,450 8.9 8,146,465 1,174,130 14.4 3.8 5.5West . . . . . . . . . . . . . . . . . 15,430,585 9.5 10,983,875 909,570 8.3 4,446,710 550,165 12.4 2.9 4.1
Rural/Urban Status
Rural . . . . . . . . . . . . . . . . . 16,679,230 8.3 11,654,850 770,485 6.6 5,024,380 607,870 12.1 3.8 5.5Urban. . . . . . . . . . . . . . . . . 55,582,550 9.4 39,732,800 3,179,995 8.0 15,849,750 2,062,600 13.0 3.6 5.0
Family Type
Married-couple family . . . . . 55,458,450 4.9 40,293,445 1,530,325 3.8 15,165,005 1,188,735 7.8 2.9 4.0Family with female house-holder, no spousepresent . . . . . . . . . . . . . . . . 12,500,760 26.5 8,150,735 2,062,650 25.3 4,350,025 1,253,265 28.8 2.3 3.5
Family with male house-holder, no spousepresent . . . . . . . . . . . . . . . . 4,302,570 13.6 2,943,470 357,505 12.2 1,359,095 228,465 16.8 3.2 4.6
1These difference are statistically significant at 90-percent confidence level.
Source: U.S. Census Bureau, Census 2000, Summary File 3.

and Alaska Native families weremost likely to be in poverty (eachhaving a poverty rate of approxi-mately 22 percent) and most likelyto have family members with a dis-ability (35.7 percent for Black fami-lies and 38.5 percent for AmericanIndian and Alaska Native families).In contrast, non-Hispanic Whitefamilies and Asian families had thelowest poverty rates (8.3 percentand 12.4 percent, respectively) andthe lowest disability prevalencerates (27.1 percent and 26.5 per-cent, respectively). Hispanic
families had a poverty rate of 23.0 percent and a disability rateof 33.2 percent (see Table 3 andTable 7).
Families in the South hadhigher prevalence rates ofboth disability and poverty.
Among the four U.S. regions, fami-lies in the South had a higherpoverty rate (10.6 percent) thantheir counterparts in the otherthree regions (see Table 7). TheSouth was also the region wherefamilies had the highest disability
prevalence (30.8 percent). TheNortheast had the largest differ-ence in poverty rates: 12.5 percentpoverty rate for families with mem-bers with a disability, comparedwith the 6.8 percent poverty ratefor families without members witha disability.
In both urban and rural areas, largerproportions of families with mem-bers with a disability than familieswithout a disability lived in poverty(see Table 7). Families in ruralareas had a higher disability rate
14 U.S. Census Bureau
Figure 5.Poverty Rates by Presence of Disabilities and Other Selected Family Characteristics: 1999
Source: U.S. Census Bureau, Census 2000, Summary File 3.
(In percent. Family characteristics as of 2000. Data based on sample. For information on confidentiality protection, sampling error, nonsampling error, and definitions, see www.census.gov/prod/cen2000/doc/sf3.pdf)
Families with a male householder,no wife present
Families with a female householder,no husband present
Married-couple families
Hispanics (of any race)
Some other race alone
Pacific Islander alone
Asian alone
American Indian alone
Black alone
White alone, not Hispanics
White alone
All families
Race and Hispanic origin
(Number)
Family structure
Families withoutmembers with a disability
Families with members with a disability
16.812.1
12.8
9.3
8.3
25.0
25.5
12.4
16.7
25.4
23.0
7.8
28.8
7.7
5.2
4.4
19.8
19.5
8.7
13.7
20.5
18.5
3.8
25.3
(20.9 million)(51.4 million)

than those in urban areas (30.1 per-cent compared with 28.5 percent),but not a higher poverty rate (8.3 percent compared with 9.4 percent).
The poverty rates for families with a member with a disability varied with thecomposition of the family andthe race and Hispanic originof the householder.
The poverty rate among familieswith a female householder with nohusband present and with memberswith a disability — 28.8 percent —
exceeded the national average of12.8 percent. The correspondingrate for families with a male house-holder with no wife present andwith members with a disability was16.8 percent, as shown in Table 7and Figure 5. Married-couple fami-lies with members with a disabilityhad a poverty rate of 7.8 percent.
With a poverty rate of 8.3 percent,families with a non-Hispanic Whitehouseholder and members with adisability were less likely to be inpoverty than other families with amember with a disability. While not
statistically different from eachother, the poverty rates for familieswith a member with a disabilityand a householder who was Black,American Indian or Alaska Native,or Some Other Race (ranging from25.0 percent to 25.5 percent),were higher than the rates for fam-ilies with a member with a disabili-ty and an Asian householder (12.4 percent), a Native Hawaiianor Other Pacific Islander house-holder (16.7 percent), or a Hispanichouseholder (23.0 percent).
U.S. Census Bureau 15
Table 8.Poverty Rates Among Families Raising Children and Other Selected FamilyCharacteristics: 1999(Data based on a sample. Family characteristics as of 2000. For information on confidentiality protection, sampling error, nonsampling error,and definitions, see www.census.gov/prod/cen2000/docs/sf3.pdf)
Family characteristics
Families raising childrenwithout a disability
Families raising childrenwith a disability
Difference inpercentage
points1
Number(1)
Percent inpoverty
(2)Number
(3)
Percent inpoverty
(4)
Column (4)minus
column (2)
All families raising children1 . . . . . . . . . . . . . . . . . . . . . . 27,867,765 12.6 2,834,640 21.8 9.2
Race and Hispanic Origin
White alone . . . . . . . . . . . . . . . . . . . . . . . . . . . . . . . . . . . . 20,054,590 8.5 1,942,215 15.9 7.4White alone, not Hispanic . . . . . . . . . . . . . . . . . . . . . 18,253,415 7.2 1,760,315 14.4 7.2
Black alone . . . . . . . . . . . . . . . . . . . . . . . . . . . . . . . . . . . . 4,040,705 25.5 509,520 37.7 12.2American Indian and Alaska Native alone . . . . . . . . . 274,480 25.9 39,295 33.4 7.5Asian alone . . . . . . . . . . . . . . . . . . . . . . . . . . . . . . . . . . . . 1,020,830 11.7 61,190 18.4 6.7Native Hawaiian and Other Pacific Islander alone . . 42,155 17.1 4,280 22.7 5.6Some other race alone . . . . . . . . . . . . . . . . . . . . . . . . . . 1,807,190 24.7 194,445 34.3 9.6Two or more races. . . . . . . . . . . . . . . . . . . . . . . . . . . . . . 627,820 19.8 83,705 29.0 9.2Hispanic (of any race). . . . . . . . . . . . . . . . . . . . . . . . . . . 3,912,795 23.5 419,975 32.7 9.2
RegionNortheast . . . . . . . . . . . . . . . . . . . . . . . . . . . . . . . . . . . . 5,112,020 11.7 526,580 22.4 10.7Midwest . . . . . . . . . . . . . . . . . . . . . . . . . . . . . . . . . . . . . 6,332,275 9.7 653,880 18.6 8.9South . . . . . . . . . . . . . . . . . . . . . . . . . . . . . . . . . . . . . . . 10,095,460 14.4 1,060,420 24.0 9.6West . . . . . . . . . . . . . . . . . . . . . . . . . . . . . . . . . . . . . . . . 6,328,010 13.3 593,760 20.6 7.3
Rural/Urban StatusRural . . . . . . . . . . . . . . . . . . . . . . . . . . . . . . . . . . . . . . . . 6,136,745 11.0 609,770 19.4 8.4Urban . . . . . . . . . . . . . . . . . . . . . . . . . . . . . . . . . . . . . . . 21,731,020 13.0 2,224,870 22.4 9.4
Family StructureMarried-couple family . . . . . . . . . . . . . . . . . . . . . . . . . . . 19,876,035 6.3 1,746,055 10.7 4.4Family with a female householder with no husbandpresent. . . . . . . . . . . . . . . . . . . . . . . . . . . . . . . . . . . . . . . 6,231,650 31.5 906,205 42.7 11.2
Family with a male householder with no wifepresent. . . . . . . . . . . . . . . . . . . . . . . . . . . . . . . . . . . . . . . 1,760,080 16.6 182,380 23.5 6.9
1These differences are all statistically significant at 90-percent confidence level.
Note: Householders and their spouses aged 15-17 are not considered as children.
Source: U.S. Census Bureau, Census 2000, Summary File 3.

FAMILIES RAISING CHILDRENWITH A DISABILITY
This section describes levels of income, employment situations,and the prevalence of povertyamong families raising childrenwith a disability.
One in every 26 Americanfamilies reported raisingchildren with a disability.
An estimated 2.8 million familieswere raising at least one child aged
5 to 17 with a disability.15 This fig-ure represents 3.9 percent of the72.3 million American families and9.2 percent of the 30.7 million fami-lies raising children in 2000 (seeTable 8). Among the 2.8 millionfamilies, 367,000 families, or 1.3 percent, reported raising two ormore children with a disability.
Employment situations variedamong householders raisingchildren with a disability.
Among the 2.7 million working-age family householders raisingchildren with a disability, 2 million,or 73.5 percent, worked part or allof 1999. The employment ratewas 82.4 percent for all house-holders raising children and 83.3 percent for householders rais-ing children without a disability(see Figure 6). Across disability
16 U.S. Census Bureau
Figure 6.Employment Status of Family Householders Raising Children With Disabilities: 20001
1 The total number of family householders in the civilian noninstitutionalized population aged 16 to 64 years old and raising children was 29.7 million in 2000.
Note 1: Details may not sum to totals due to rounding. Note 2: In addition to the summary measure of families with members with a disability, Figures 2, 3, 4, and 6 in this report include estimates of three specific types of disability: sensory, physical, and mental, as they represent the central domains of disabilities. See Appendix for details on measuring disability in surveys. See the section on Family Disability Status for details on the summary measure of families with members with a disability.
Source: U.S. Census Bureau, Census 2000, Summary File 3.
(Percent distribution. Data based on sample. For information on confidentiality protection, sampling error, nonsampling error, and definitions, see www.census.gov/prod/cen2000/doc/sf3.pdf)
Not in labor force
Unemployed
Employed
Householdersraising childrenwith a mental
disability
Householdersraising childrenwith a physical
disability
Householdersraising childrenwith a sensory
disability
Householdersraising children
with adisability
Householdersraising children
without anydisability
All householdersraising children
82.4
3.3
14.4
83.3
3.1
13.6
73.5
4.8
21.8
70.8
5.1
24.1
68.1
5.3
26.6
74.8
4.7
20.5
15 Householders and their spouses aged15-17 are not considered as children.

types, householders raising chil-dren with a mental disability hadan employment rate of 74.8 per-cent, compared with 70.8 percentof householders raising childrenwith a sensory disability and 68.1 percent of those raising chil-dren with a physical disability.
Families raising children with a disability had a lowermedian income than other families.
Families raising children with a dis-ability had a median income of$38,332, compared with $39,515for families with any memberswith a disability and $48,936 for
all families raising children. Acrossdisability types, families raisingchildren with a mental disabilityreported a median income of$39,353, compared to $34,603and $32,265 for families raisingchildren with a sensory disabilityor with a physical disability,respectively (see Table 4).
U.S. Census Bureau 17
Figure 7.Poverty Rates Among Families Raising Children by Selected Family Characteristics: 1999
Note: Householders and their spouses aged 15 - 17 are not considered as children.
Source: U.S. Census Bureau, Census 2000, Summary File 3.
(In percent. Data based on sample. For information on confidentiality protection, sampling error, nonsampling error, and definitions, see www.census.gov/prod/cen2000/doc/sf3.pdf)
Race and HIspanic origin
(Number)
Family structure
Families raising childrenwithout a disability
Families raising children with a disability
(2.8 million)(27.9 million)
Families with a male householder,no wife present
Families with a female householder,no husband present
Married-couple families
Hispanics (of any race)
Two or more races
Some other race alone
Pacific Islander alone
Asian alone
American Indian alone
Black alone
White alone, not Hispanics
White alone
All families
23.5
21.8
15.9
14.4
37.7
33.4
18.4
22.7
34.3
29.0
32.7
10.7
42.7
16.6
12.6
8.5
7.2
25.5
25.9
11.7
17.1
24.7
19.8
23.5
6.3
31.5

Families raising children witha disability were more likelyto live in poverty than otherfamilies raising children.
Families raising children with a dis-ability had a poverty rate of 21.8 percent, compared with 12.6 percent for families raisingchildren without a disability. Thepoverty rate of families raisingchildren with a physical disabilitywas 27.6 percent, compared with25.7 percent of those raising chil-dren with a sensory disability and21.1 percent of those raising chil-dren with a mental disability, asshown in Figure 4.
The poverty rate increased with thenumber of children in the familywho had a disability. While about 1in every 5 families raising one childwith a disability lived in poverty, therate was about 1 in 3 for familiesraising two or more children with adisability, as shown in Figure 4.
Married-couple familiesraising children with adisability were better offeconomically than otherfamilies raising children with a disability.
Among families raising childrenwith a disability, 10.7 percent ofmarried-couple families lived inpoverty, compared with 42.7 per-cent of families with a femalehouseholder with no husband pres-ent and 23.5 percent of familieswith a male householder with nowife present (see Figure 7).
ACCURACY OF THEESTIMATES
The data contained in this reportare based on the sample of house-holds who responded to theCensus 2000 long form.Nationally, approximately 1 out of
every 6 housing units was includedin this sample. As a result, thesample estimates may differ some-what from the 100-percent figuresthat would have been obtained ifall housing units, people withinthose housing units, and peopleliving in group quarters had beenenumerated using the same ques-tionnaires, instructions, enumera-tors, and so forth. The sampleestimates also differ from the val-ues that would have been obtainedfrom different samples of housingunits, and hence of people living inthose housing units, and peopleliving in group quarters. The devi-ation of a sample estimate fromthe average of all possible samplesis called the sampling error.
In addition to the variability thatarises from the sampling proce-dures, both sample data and 100-percent data are subject to non-sampling error. Nonsampling errormay be introduced during any ofthe various complex operationsused to collect and process data.Such errors may include: not enu-merating every household or everyperson in the population, failing toobtain all required informationfrom the respondents, obtainingincorrect or inconsistent informa-tion, and recording informationincorrectly. In addition, errors canoccur during the field review of theenumerators’ work, during clericalhandling of the census question-naires, or during the electronicprocessing of the questionnaires.
While it is impossible to completelyeliminate error from an operationas large and complex as the decen-nial census, the Census Bureauattempts to control the sources ofsuch error during the data collec-tion and processing operations.
The primary sources of error andthe programs instituted to controlerror in Census 2000 are describedin detail in Summary File 3Technical Documentation underChapter 8, “Accuracy of the Data,”located at www.census.gov/prod/cen2000/doc/sf3.pdf.
Nonsampling error may affect thedata in two ways: first, errors thatare introduced randomly willincrease the variability of the dataand, therefore, should be reflectedin the standard errors; and second,errors that tend to be consistent inone direction will bias both sampleand 100-percent data in that direc-tion. For example, if respondentsconsistently tend to underreporttheir incomes, then the resultingestimates of households or fami-lies by income category will tendto be understated for the higherincome categories and overstatedfor the lower income categories.Such biases are not reflected in thestandard errors.
All statements in this report haveundergone statistical testing andall comparisons are significant atthe 90-percent confidence levelunless otherwise noted. The esti-mates in tables, maps, and otherfigures may vary from actual val-ues due to sampling and nonsam-pling errors. As a result, estimatesin one category used to summarizestatistics in the maps and figuresmay not be statistically differentfrom estimates assigned to a dif-ferent category. Further informa-tion on the accuracy of the data islocated at www.census.gov/prod/cen2000/doc/sf3.pdf. For furtherinformation on the computationand use of standard errors, contactthe Decennial Statistical StudiesDivision at 301-763-4242.
18 U.S. Census Bureau
U.S. Census Bureau 19
APPENDIX
Background on Disability and Its Measurement in Surveys
For over 30 years, the accepted def-initions of disability have beenchanging. In the 1970s, the con-cept of a disability was associateddirectly with an underlying physicalor mental condition. Today, there isa growing acceptance that disabilityis a complex process that involvesthe interaction between a personand his or her environment. Inother words, in 1970 a person withleg paralysis would have been con-sidered to be disabled based solelyon physical condition. In 2004,ascertainment of disability statuscould involve the nature of thephysical impairment as well as thebarriers in the environment whichprevent full social participation.The development of theInternational Classification ofFunctioning, Disability, and Health(ICF) by the World HealthOrganization reflects this new per-spective. The ICF is meant to codi-fy a classification of functioning,disability, and health “to provide aunified standard language andframework for the description ofhealth and health-related state.”The ICF views disability as anumbrella term and does not providea single way to determine disabilitystatus. Thus, it is important tostate clearly what aspect of the dis-ablement process is being capturedby a specific set of questions.
As public perception of disabilityhas changed over time, so havethe goals of programs supportingpeople with disabilities. In the
past, the emphasis was to providesupport to people with disabilitiesprimarily through benefits. Today,that has shifted to an emphasis onsupporting independence and pro-moting involvement in all aspectsof society. As the conceptualiza-tion of disability and as serviceprograms for people with disabili-ties have changed, the CensusBureau and other statistical bodieshave struggled with operationaliz-ing the concept of disability for thepurpose of measurement. The “def-initions” devised by the disabilitytheorists and researchers presentchallenges in two areas. First, theprocess of measuring a complex,multi-dimensional concept in a sur-vey format with limited space isinherently difficult. Second, theconstantly evolving concept ofdisability requires surveyprofessionals to continuouslydevelop new measurementapproaches to adapt to the newestdefinitions of disability.
The preparations for Census 2000followed the same pattern estab-lished for previous decennial cen-suses. The Census Bureau workedwith other federal agencies to deter-mine which aspects of disabilitywere relevant and necessary for theagencies to meet their specific legalor regulatory obligations for plan-ning and/or evaluating programsand services. As in the previouscensus, two of the groups thatCensus 2000 tried to measure werepeople unable to care for them-selves and people limited or unable
to work due to health impairment.During the 1990s, along with theAmericans with Disabilities Act(ADA) guaranteeing civil rights topeople with disabilities, agenciesbegan requesting that statisticalagencies collect and report disabili-ty statistics as a demographic char-acteristic of the population.
The work group which developedthe questions for Census 2000faced three tasks: (1) measuringdisability using a definition inkeeping with the ADA, (2) meetingthe needs of various agenciesrequiring specific information, and(3) having a maximum of six ques-tions. The committee agreed thatthree domains (sensory, physical,and mental/emotional/cognitive)sufficiently represented the broadclassification of impairments andhealth conditions that generallyresult in disability. In addition, thecommittee concluded that it couldmeet an array of other program-matic requirements with threequestions on difficulty with specif-ic types of functional activities.They were intended to addresspeople with limitations in perform-ing the following: Activities ofDaily Living, which generallyinclude self-care type activitiessuch as bathing or dressing;Instrumental Activities of DailyLiving, which are activities oftenassociated with independent livingsuch as going out alone to shop orvisit a doctor’s office; and, finally,working at a job or business.

20 U.S. Census Bureau
Andresen, Elena, et al. 2002.“Reliability and Validity ofDisability Questions for USCensus 2000,” American Journalof Public Health 90(8): 297-1299.
Burkhauser, R. et al. 2002. “Self-Reported Work-Limitation Data:What They Can and Cannot TellUs,” Demography 12(3): 541-555.
Jette, A. and E. Badley. 2000.“Conceptual Issues in theMeasurement of WorkDisability,” in SurveyMeasurement of Work Disability:4-27 edited by N. Mathiowetzand G. Wunderlich. Washington,DC: National Academy Press.
Hale, T. 2001. “The Lack of aDisability Measure in Today’s
Current Population Survey,”Monthly Labor Review, June: 38-40.
Stern, Sharon. 2003. “CountingPeople with Disabilities,”Proceedings from 2003 JointStatistical Meetings, (May):4064-4071.
REFERENCES