directors & financial report - parliament of western · pdf filetrading as esperance ports...
TRANSCRIPT

Esperance Port AuthorityTrading As Esperance Ports Sea & Land
Directors & Financial Reportto 30 September 2014
www.epsl.com.au

Esperance Port Authority Trading As Esperance Ports Sea & Land
Directors & Financial Report
30 September 2014

Contents
Page
Directors Report i-v Statement of Profit or Loss and Other Comprehensive Income 1 Statement of Financial Position 2 Statement of Changes in Equity 3 Statement of Cash Flows 4 Notes to the Financial Statements 5-48 Directors’ Declaration 49 Auditors’ Declaration 50

Esperance Ports Sea & Land i Directors’ Report As at 30 September 2014
The Board of Directors of the Esperance Port Authority (the Authority) trading as Esperance Ports Sea & Land has pleasure in submitting its report for the period ended 30 September 2014.
1. Directors
The Directors of the Authority during the period 1 July 2014 to 30 September 2014 were: Robert J. McKinnon Appointed: October 2010 FCPA, FGIA, MAICD
Mr Robert (Bob) McKinnon has had more than 40 years of experience in senior financial and general management positions in the light manufacturing and industrial sectors in Australia, New Zealand and Canada.
Bob McKinnon served as Managing Director of Fleetwood Corp. Ltd. from 1 November 2007 to 31 March 2010 and was Austal Ltd’s General Manager from 1999 to 2000 before serving as its Managing Director from February 2000 to June 2005. He was responsible for the day to day operations of Austal Ltd and its subsidiaries.
Prior to joining Austal Ltd, Bob McKinnon held a 28 year career with Capral Aluminum (formerly Alcan Australia) during which time he held senior positions in finance, distribution and manufacturing operations.
Bob McKinnon has extensive experience as a Non-Executive Chairman and Director, including: Non-Executive Chairman of Tox Free Solutions Ltd since July 2010 (current); Non-Executive Chairman and Director of Esperance Port Authority since October 2010; Non-Executive Director and Audit Committee Chairman of Programmed Maintenance Services Ltd
since November 2011 (current); Non-Executive Director of Bankwest and Chair of the Audit Committee from July 2009 until October
2012; Director of Brierty Limited from February 2010 to September 2011; and Non-Executive Director of Peet Limited since May 2014 (current).
Timothy Shanahan Appointed: March 2009 LLB PSM
Mr Timothy (Tim) Shanahan has extensive depth and breadth of experience and networks within in the resources, business and government sectors in Western Australia.
Since its foundation in November 2007, Tim Shanahan has been the Director of the Energy and Minerals Institute (EMI) at UWA. EMI has the important task of uniting the high level of energy and minerals research and activities across campus, reinforcing the University’s strong commitment to this sector of our economy.
In his role as Director of the EMI, Tim Shanahan has served on many of the Boards representing UWA, including the: WA Energy Research Alliance; Centre for Exploration Targeting; Planning and Transport Research Centre; and National Resource Sciences Precinct (NRSP).

Esperance Ports Sea & Land ii Directors’ Report As at 30 September 2014
Directors (Cont’d) Tim Shanahan was also a founder of the ‘In the Zone Forum’ (which promotes thought-leadership, dialogue and engagement between the Western Australian resources hub and the Asian region), and the International Mining for Development Centre (IM4DC).
From 1989 to 2000, Tim Shanahan was the Executive Director of the Western Australian Municipal Association, the representative organisation of Local Government in Western Australia.
From June 2001, Tim Shanahan was Chief Executive of the Western Australian Chamber of Minerals and Energy (CME). The CME is the peak advocacy group for the resources sector in WA, representing companies that contribute more than 90 percent of the state’s mining production and exploration expenditure.
In January 2001, Tim Shanahan was awarded the Public Service Medal for outstanding service to Local Government and in April 2003, he was awarded a Centenary Medal for service to Local Government in Western Australia. He was also the recipient of the 2007 WA Gas Industry Development Award. In March 2009, Tim Shanahan was appointed as Deputy Chair / Director of the Esperance Port Authority. In 2014, Tim Shanahan was appointed Chairman of WA Super, having served 10 years as an Independent Trustee Director. He is also the former Chairman of the Pilbara Development Commission, and in 2010 became a member of the Western Australian Regional Development Trust, of which he is now the Deputy Chair. He is also a Councilor and Honorary Life Member of the RACWA, and was its immediate past President. Tim Shanahan has also served on the Board of the AAA. He is a Trustee of the Committee for the Economic Development of Australia (CEDA) and a member of the CEDA WA Advisory Committee and is a past Chairman of the Australia Day Council, Western Australia. Tim Shanahan is a Law Graduate from the University of Western Australia. Dr Phillip Chalmer Appointed: November 2007 B.Sc (Hons.), Ph D Dr Phillip (Phil) Chalmer is one of the most experienced marine environmental consultants in Western Australia, having worked in the environmental industry since 1975. He has been responsible for a large number of marine surveys, impact assessments and monitoring programs including extensive work for North-West Shelf LNG projects. His specialty expertise includes benthic flora and fauna surveys and specific assessments of marine outfalls, sub-marine pipelines, oil platform and harbour investigations. His Australian site experience includes the south-west coast around the Perth Metropolitan area, the North-West Shelf area from Exmouth Gulf to Port Hedland and the Geraldton Region. He has also undertaken assessments in the Timor Sea, Indonesia and Oman. Phil Chalmer completed his Honours and Doctor of Philosophy degrees at the University of Western Australia in 1975 and 1979 respectively. His doctoral thesis was on the ecology of marine fouling at the Stirling Naval Base in Cockburn Sound. The impact of marine fouling on offshore oil and gas platforms later became a specialist area of expertise.

Esperance Ports Sea & Land iii Directors’ Report As at 30 September 2014
Directors (Cont’d) Phil Chalmer was a Director of LeProvost, Semeniuk and Chalmer, Environmental Consultants for approximately 10 years. His role included ecological impact, client liaison, project design and control as well as company management, finance and administration. Phil has played a major role in the production of Environmental Review and Management Plans and Public Environmental Reviews and monitoring programs for a range of large and small developments. Phil Chalmer worked on projects with ATA Environmental from 1993 to 2007 including port site evaluation at Geraldton and Oakajee, dredging management plans at Albany and Dampier, marina developments at Maude’s Landing, water and sediment quality management plans, environmental approval of three port development in Oman and development of a marine training institute in Indonesia. Phil Chalmer has also been involved in a beef production enterprise since 1980, initially at Denmark but located 60km east of Esperance since 1994. Phil has used his environmental skills within the beef industry to supervise the production of a land capability study for the Walpole Tingledale district and has been on the committees of Meat and Livestock Australia’s Sustainable Grazing Systems and More Beef from Pastures programs for the Southern Australian beef industry. In November 2007, Phil Chalmer was appointed as a Non-Executive Director of the Esperance Port Authority. Kathleen Finlayson Appointed: March 2009 JP CitWA Mrs Kathleen (Kathy) Finlayson has had extensive business and rural community experience, having held a number of prominent positions in rural communities including: Shire Councillor – Shire of Menzies (1995 to 2005); Shire President – Shire of Menzies (1997 to 2005); Chairman – Goldfields Esperance Development Commission (1995 to 2004); Member Eastern Regional Council for Local Government (1995 to 2005); Member of WA Regional Development Council (1995 – 2004); Chair – North Eastern Goldfields Health Advisory Board (1993 to 2000); Chair – Kalgoorlie Esperance Board of Curtin University (1998 – 2009); Board Member – Desert Knowledge Australia (2005 to date) – Portfolio Aboriginal Health; Board Member – Enterprise Connect Commonwealth Department of Innovation, Industry, Science and
Research (2009 to 2010); and Deputy Chair – Southern Regional Governing Council (2012 to date). In March 2009, Kathy Finlayson was appointed as a Non-Executive Director of Esperance Port Authority. Kathy Finlayson lived on a sheep station for 30 years, co-managing the Property in Menzies, which ran 10,000 merino sheep. She is married with three children, and has worked as a Registered Nurse in the northern goldfields, as well as being a “mother, teacher, gardener, accountant, mechanic and musterer” on Jeedamya Station.
She spent 4 years in Kalgoorlie and since 2008 has been living in Perth but maintains a strong presence in regional Western Australian in both a professional working role and in the business in Jurien.

Esperance Ports Sea & Land iv Directors’ Report As at 30 September 2014
Directors (Cont’d) Kathy Finlayson has relieved as a Clinical Nurse Manager (CNM) in the Pilbara at Onslow for 4 years, followed by relief CNM positions at Roebourne, Wickepin, and Williams. She continues to provide relief as a CNM at Williams. Kathy Finlayson was ABC Rural Woman of the Year in 1996 and WA Citizen of the Year for Regional Development in 2002. Kim Horne Appointed: January 2012 Mr Kim Horne is one of Western Australia's most familiar mining figures, having served as President of The WA Chamber of Minerals and Energy ( for which he was awarded life membership) in addition to a wide range of roles with his employer, Alcoa of Australia. In his career Kim Horne served as Alcoa’s Manager of Mining in WA, Location Manager of the Pinjarra Refinery, progressing to Executive Director of Health, Safety and Environment, Community and Government Relations and Human Resources. Kim Horne also filled roles for Alcoa globally based in New York, where he was the Vice President of Human Relations for Global Primary Products and finally as President of Global Mining. He has been a Non-Executive Chairman of both Mitchell Logistics Company and the Mining Contractor - HSE which were both successfully sold. Kim Horne has been a Director of Toll Mining Services (MCA) Pty Ltd since December 2005 and is currently a Non-Executive Director of Synergy and a Non-Executive Director of Rainbow Bee-Eater, which is a technology development company. In January 2012, Kim Horne was appointed as a Non-Executive Director of Esperance Port Authority. Kim Horne has also filled a number of Community roles including Chairman of the Peel Development Commission. On a part time basis he operates a consultancy in Mining and Business Management both within Australia and internationally. In January 2014, Kim Horne was recognised as a member of the order of Australia, for significant service to the mining sector through a range of executive roles.
2. Directors’ meetings The Directors of the Authority attended the following Board and Committee meetings during the period ended 30 September 2014. The table on the following page notes the number of meetings held and the number of attendances by the Director at the respective meetings. Column A – Indicates the number of meetings the Director was eligible to attend. Column B – Indicates the number of meetings attended.

Esperance Ports Sea & Land v Directors’ Report As at 30 September 2014
Directors meetings (Cont’d)
3. Principal activities
During the year the principal activities of the Port consisted of: Planning for future development; Promoting and facilitating trade; Maintaining existing and providing new infrastructure when required; Providing services, power supply and labour as required for stevedoring, pilotage, mooring and
maintenance activities; and Managing the environment of the Port.
There were no significant changes in the nature of activities of the Authority during the period.
4. Dividends
The Authority did not pay or declare any Dividends since the end of the previous financial year. The Board has made a recommendation to Government with respect to the 2013-14 Financial Year, in accordance with current Government Financial Policy, and subject to Government approval the dividend will be provided for in the 2014-15 financial year in the accounts of the Southern Ports Authority.
Director Full Board Audit & Risk Committee
Board Safety Committee
Environmental Committee
Port Consultative Committee
A B A B A B A B A B R. McKinnon 2 2 2 2 2 2 0 0 0 0 T. Shanahan 2 2 2 2 2 2 0 0 0 0 P. Chalmer 2 2 2 2 2 2 1 1 1 1 K. Finlayson 2 2 2 2 2 2 0 0 0 0 K. Horne 2 2 2 2 2 2 0 0 0 0

Esperance Ports Sea & Land vi Directors’ Report As at 30 September 2014
5. Operating and financial review
Review of operations
Comments on the operations and the results of those operations are set out below;
Sept 2014 2014
Total trade (tonnes) 3,838,485 14,938,954
‘$000” ‘$000”
Revenue from cargo 5,134 13,896
Revenue from vessels 4,096 16,069
Revenue from port services 9,520 43,876
Infrastructure revenue 609 3,796
Other revenue and income 1,506 4,954
Total revenue and income 20,865 82,592
Less expenditure 18,973 79,250
Operating profit before tax 1,892 3,342
Income tax expense 568 56
Operating profit after tax 1,324 3,398
Commentary on operating results
Operating profit after tax of $1.324 million for the quarter that this report is the subject of is further evidence of the transformation of the financial performance of the Port and is principally driven by the successful resolution of a number of legacy commercial issues.
The Port is now in a sound financial position ahead of the transition to the Southern Ports Authority and is well placed to deliver the returns expected by Government in the future.
6. Significant changes in the state of affairs
In the opinion of the Directors there were no significant changes in the state of affairs of the Authority that occurred during the financial period under review.

Esperance Ports Sea & Land vii Directors’ Report As at 30 September 2014
7. Events subsequent to reporting date
There has not arisen in the interval between the end of the financial period and the date of this report any item, transaction or event of a material and unusual nature likely, in the opinion of the Directors of the Authority, to affect significantly the operations of the Authority, the results of those operations, or the state of affairs of the Authority, in future financial years.
8. Likely developments
The Authority expects that trade volumes for the balance of the 2014-15 financial year will be broadly in line with the past year. The merger and formation of the Southern Ports Authority, comprising the ports of Albany, Bunbury and Esperance was gazetted on 19th September 2014 and came into operation on 1 October 2014. Local Port management will continue to represent the interests of Port users and the local community in Esperance.
9. Directors’ emoluments
The Minister in accordance with Section 10 of the Port Authorities Act 1999, determines the fees for Directors.
In accordance with Section 13(c)(i) of Schedule 5 of the Port Authorities Act 1999, the nature and amount of each major element of remuneration of each Director of the Authority, each of the three named executives who received the highest remuneration and other key management personnel of the Authority are: Non-Executive Directors of Esperance Port Authority
NAME DIRECTOR’S FEE $
SUPERANNUATION $
TOTAL $
R. McKinnon Chairman
11,250 1,069 12,319
T. Shanahan 6,250 594 6,844P. Chalmer 4,125 392 4,517K. Finlayson 4,125 392 4,517K.Horne 4,125 392 4,517
Senior executives of Esperance Port Authority
NAME SALARY $
SUPER- ANNUATION
$
OTHER BENEFITS
$
TOTAL $
B.R.Williamson (Chief Executive Officer)
69,870 6,638 76,508
S.P.Flanagan (former Chief Executive Officer)
5,824 553 59,427* 65,804
R.H. Lovell (Harbour Master)
58,894 5,595 64,489
* Payout of accrued entitlements

Esperance Ports Sea & Land viii Directors’ Report As at 30 September 2014
10. Environmental regulation
The Authority’s operations are subject to regulation under both Commonwealth and State environmental legislation applicable to any Australian commercial entity. Under the Port Authorities Act 1999, the Authority is also required to “protect the environment of the Port and minimise the impact of Port activities on that environment”.
11. Environmental management
The Authority is committed to demonstrating that it is an environmentally responsible organisation and this commitment is reflected in its values and corporate priorities. In order to comply with environmental responsibilities and objectives, the Authority maintains an environmental management system to the international standard ISO14001.
12. Rounding off
Amounts have been rounded off to the nearest thousand dollars in the Directors’ Report and Financial Statements.
This report is made with a resolution of the Directors:
R. McKinnon T. Shanahan Chairman Deputy Chairman
Esperance Esperance
19 December 2014 19 December 2014

Esperance Ports Sea & Land 1 Statement of Profit or Loss and Other Comprehensive Income For the period ended 30 September 2014
Note 3 months
ended 30 Sept
2014
12 months ended
30 June 2014
$’000 $’000 Revenue 5 20,451 80,424
Other income 6 414 2,168
Expenses
Depreciation and amortisation expense 7 (1,011) (10,955)
Employee benefits 8 (4,686) (19,003)
General administration (1,885) (9,964)
Materials, supplies and fuel (1,473) (5,604)
Contract services (6,379) (18,976)
Power and water (1,842) (7,834)
Insurance (289) (1,205)
Government charges (393) (1,378)
Finance costs 9 (1,012) (4,281)
Other expenses 10 (3) (50)
Profit / (loss) before income tax 1,892 3,342
Income tax expense 11 (568) 56
Profit / (loss) for the period 1,324 3,398
Other comprehensive income net of income tax - -
Total comprehensive profit / (loss) for the period / year 1,324 3,398 The notes on pages 5 to 48 are an integral part of these financial statements.

Esperance Ports Sea & Land 2 Statement of Financial Position As at 30 September 2014
Note
30 Sept 2014
30 June 2014
$’000 $’000 ASSETS Current Assets Cash and cash equivalents 13 16,298 19,646
Trade and other receivables 14 16,034 13,831
Inventories 15 2,501 2,496
Total current assets 34,833 35,973
Non-Current Assets
Trade and other receivables 14 24,908 26,332
Deferred tax assets 11 5,574 5,990
Inventories 15 2,533 2,305
Property, plant and equipment 16 48,153 48,714
Intangible assets 17 321 344
Total non-current assets 81,489 83,685
TOTAL ASSETS 116,322 119,658
LIABILITIES
Current Liabilities
Trade and other payables 18 5,812 8,607
Interest bearing borrowings 19 8,173 8,065
Provisions 20 3,722 3,739
Total current liabilities 17,707 20,411
Non-current Liabilities
Interest bearing borrowings 19 50,988 53,074
Deferred tax liabilities 11 9,891 10,290
Provisions 20 930 880
Total non-current liabilities 61,809 64,244
TOTAL LIABILITIES 79,516 84,655
NET ASSETS 36,806 35,003
EQUITY
Contributed equity 21 7,747 7,268
Retained earnings 21 29,059 27,735
TOTAL EQUITY 36,806 35,003
The notes on pages 5 to 48 are an integral part of these financial statements.

Esperance Ports Sea & Land 3 Statement of Changes in Equity For the period ended 30 September 2014
Note Contributed
equity Retained earnings
Total equity
$’000 $’000 $’000
Balance at 1 July 2013 22 3,609 24,337 27,946
Profit / (loss) for the year - 3,398 3,398
Total comprehensive profit / (loss) for the year - - -
Transactions with owners in their capacity as owners:
Contributions from owners 3,659 - 3,659
Balance at 30 June 2014 7,268 27,735 35,003
Balance at 1 July 2014 7,268 27,735 35,003
Profit / (loss) for the period - 1,324 1,324
Total comprehensive profit / (loss) for the period - - -
Transactions with owners in their capacity as owners:
Contributions from owners 479 - 479
Balance at 30 September 2014 7,747 29,059 36,806
The notes on pages 5 to 48 are an integral part of these financial statements.

Esperance Ports Sea & Land 4 Statement of Cash Flows For the period ended 30 September 2014
Note 3 months ended
30 Sept 2014
12 months ended
30 June 2014
$’000 $’000
Cash flows from operating activities
Cash receipts from customers 19,012 84,924
Cash paid to suppliers and employees (20,758) (64,849)
Cash generated from operations (1,746) 20,075
Interest paid (1,012) (4,281)
Net cash from operating activities 22 (2,758) 15,794
Cash flows from investing activities
Proceeds from sale of property, plant and equipment 1,336 5,145
Payments for property, plant and equipment (427) (6,243)
Net cash (used in) / from investing activities 909 (1,098)
Cash flows from financing activities
Repayment of borrowings (1,978) (7,494)
Proceeds from borrowings - 2,000
Proceeds from government 479 1,847
Net cash (used in) / from financing activities (1,499) (3,647)
Net increase in cash and cash equivalents (3,348) 11,049
Cash and cash equivalents at beginning of financial year 19,646 8,597
Cash and cash equivalents at the end of period / year 13 16,298 19,646
The notes on pages 5 to 48 are an integral part of these financial statements.

Esperance Port Authority 5 Notes to the Financial Statements
1. Basis of preparation
(a) Statement of compliance
Esperance Port Authority (“the Authority”) is a not-for-profit entity that prepares general purpose financial statements in accordance with Australian Accounting Standards (AASBs) (including Australian Interpretations) adopted by the Australian Accounting Standards Board (AASB) and the financial reporting provisions of the Port Authorities Act 1999. The financial statements were authorised for issue on 19 December 2014 by the Board of Directors of Esperance Port Authority.
(b) Presentation of the Statement of Profit or Loss and Other Comprehensive Income
The Statement of Profit or Loss and Other Comprehensive Income classification of expenses by nature is considered to provide more relevant and reliable information than classification by function due to the nature of the Authority’s operations. The directors have concluded that the financial statements present fairly the Authority’s financial position, financial performance and cash flows and that it has complied with applicable standards and interpretations, except that it has departed from AASB 101, para 99, to achieve a fair presentation.
(c) Basis of measurement
The financial statements have been prepared on the accrual basis of accounting using the historical cost convention. Under the Port Authorities Act 1999, the Ports of Bunbury, Albany and Esperance will amalgamate to form Southern Ports Authority. The new operations will commence on 1 October 2014. Under the legislation changes, all assets and liabilities of Esperance Port Authority, including those under or in connection with contracts and deeds to which Esperance Port Authority is a party will be transferred to Southern Ports Authority on 1 October 2014.
(d) Functional and presentation currency
These financial statements are presented in Australian dollars which is the Authority’s functional currency. All financial information presented in Australian dollars has been rounded to the nearest thousand dollars ($’000) unless otherwise stated.
(e) Use of estimates and judgements
The preparation of financial statements requires management to make judgements, estimates and assumptions that affect the application of accounting policies and the reported amounts of assets, liabilities, income and expenses. Actual results may differ from these estimates. Estimates and underlying assumptions are reviewed on an ongoing basis. Revisions to accounting estimates are recognised in the period in which the estimate is revised and in any future periods affected. Information about significant areas of estimation uncertainty and critical judgements in applying accounting policies that have the most significant effect on the amounts recognised in the financial statements are:

Esperance Port Authority 6 Notes to the Financial Statements 1. Basis of Preparation (continued)
(e) Use of estimates and judgements (continued)
Operating lease commitments – as lessor
The Authority has entered into commercial property leases on some of its buildings and land and has determined that it retains all the significant risks and rewards of ownership of these buildings and land and has thus classified the leases as operating leases. Defined benefit plans Various actuarial assumptions are required when determining the Authority’s superannuation obligations. These assumptions and the related carrying amounts are discussed in note 20(d).
2. Summary of significant accounting policies
The accounting policies set out below have been applied consistently to all periods presented in these financial statements unless otherwise stated.
(a) Revenue recognition
Revenue is measured at the fair value of consideration received or receivable. Revenue is recognised for the major business activities as follows:
(i) Rendering of services
Revenue from services rendered is recognised in the Statement of Profit or Loss and Other Comprehensive Income on completion of the delivery of the service to the customer.
(ii) Interest
Interest revenue is recognised as it accrues using the effective interest method [see note 2(b)].
(iii) Rental income
Rental income is recognised in the Statement of Profit or Loss and Other Comprehensive Income on a straight-line basis over the term of the lease. Lease incentives granted are recognised as an integral part of the total rental income.
(b) Finance income and expenses
Finance income comprises interest income on funds invested and interest receivable under finance leases. Interest income is recognised as it accrues in the Statement of Profit or Loss and Other Comprehensive Income, using the effective interest method. The interest receivable component of finance lease receivables is also recognised in the Statement of Profit or Loss and Other Comprehensive Income using the effective interest method.
Finance costs comprise interest expense on borrowings and finance charges payable under finance leases. All borrowing costs are recognised in the Statement of Profit or Loss and Other Comprehensive Income using the effective interest method. The interest expense component of finance lease payments is also recognised in the Statement of Profit or Loss and Other Comprehensive Income using the effective interest method.

Esperance Port Authority 7 Notes to the Financial Statements 2. Summary of significant accounting policies (continued)
(b) Finance income and expenses (continued)
Borrowing costs are recognised as expenses in the period in which they are incurred except where they are directly attributable to the acquisition, construction or production of a qualifying asset in which case they are capitalised as part of the cost of the asset, in accordance with AASB 123 Borrowing Costs.
In determining the amount of borrowing costs to be capitalised during the period, investment revenue earned directly relating to the borrowings, is deducted from the borrowing costs incurred.
(c) Income tax
The Authority operates within the National Tax Equivalent Regime (NTER) whereby an equivalent amount in respect of income tax is payable to the State Government. The calculation of the liability in respect of income tax is governed by NTER guidelines and directions approved by Government.
As a consequence of participation in the NTER, the Authority is required to comply with AASB 112 Income Taxes.
Income tax expense comprises current and deferred tax. Income tax expense is recognised in the Statement of Profit or Loss and Other Comprehensive Income except to the extent that it relates to items recognised directly in equity or in other comprehensive income.
Current tax is the expected tax payable or receivable on the taxable income or loss for the period, using tax rates enacted or substantively enacted at the reporting date, and any adjustment to tax payable in respect of previous years.
Deferred tax is recognised in respect of temporary differences between the carrying amounts of assets and liabilities for financial reporting purposes and the amounts used for taxation purposes. Deferred tax is not recognised for temporary differences on the initial recognition of assets or liabilities in a transaction that is not a business combination and that affects neither accounting nor taxable profit or loss. Deferred tax is measured at the tax rates that are expected to be applied to the temporary differences when they reverse, using tax rates enacted or substantively enacted at the reporting date.
Deferred tax assets and liabilities are offset if there is a legally enforceable right to offset current tax liabilities and assets, and they relate to income taxes levied by the same tax authority on the same taxable entity, or on different tax entities, but they intend to settle current tax liabilities and assets on a net basis or their tax assets and liabilities will be realised simultaneously.
A deferred tax asset is recognised for unused tax losses, tax credits and deductible temporary differences to the extent that it is probable that future taxable profits will be available against which they can be utilised. Deferred tax assets are reviewed at each reporting date and are reduced to the extent that it is no longer probable that the related tax benefit will be realised.

Esperance Port Authority 8 Notes to the Financial Statements 2. Summary of significant accounting policies (continued)
(d) Receivables
(i) Trade receivables
Trade receivables are recognised and carried at the original invoice amounts less an allowance for any uncollectible amounts. Receivables are generally settled within 30 days except for property rentals, which are governed by individual lease agreements.
The collectability of receivables is reviewed on an ongoing basis and any receivables identified as uncollectible are written-off against the allowance account. The allowance for uncollectible amounts (doubtful debts) is raised when there is objective evidence that the Authority will not be able to collect its debts.
(ii) Lease receivables
A finance lease receivable is recognised for leases of property, plant and equipment which effectively transfers to the lessee substantially all of the risks and benefits incidental to legal ownership of the leased asset. The lease receivable is initially recognised as the amount of the present value of the minimum lease payments receivable at the reporting date plus the present value of any unguaranteed residual value expected to accrue at the end of the lease term.
Finance lease payments are allocated between interest revenue and reduction of the lease receivable over the term of the lease in order to reflect a constant periodic rate of return on the net investment outstanding in respect of the lease with interest revenue calculated using the interest rate implicit in the lease and recognised directly in the Statement of Profit or Loss and Other Comprehensive Income.
(e) Inventories
Inventories consist of stores which are measured at the lower of cost and net realisable value.
(f) Property, plant and equipment
(i) Recognition and measurement
The Authority has a general policy of expensing at the time of purchase all individual assets costing $1,000 or less or with a useful life of less than three (3) years. The materiality of the item purchased is also taken into consideration when adopting this policy. Regardless of cost, physical control over all the Authority’s assets is maintained
Items of property, plant and equipment are measured at cost less accumulated depreciation and accumulated impairment losses.

Esperance Port Authority 9 Notes to the Financial Statements 2. Summary of significant accounting policies (continued)
(f) Property, plant and equipment (continued)
Cost includes expenditure that is directly attributable to the acquisition of the asset. The cost of self-constructed assets includes the following:
the cost of materials and direct labour,
any other costs directly attributable to bringing the asset to a working condition for its intended use,
when the Authority has an obligation to remove the asset or restore the site, an estimate of the cost of dismantling and removing the items and restoring the site on which they are located, and
capitalised borrowing costs.
Purchased software that is integral to the functionality of the related equipment is capitalised as part of that equipment.
When parts of an item of property, plant and equipment have different useful lives, they are accounted for as separate items (major components) of property, plant and equipment.
Any gains or loss on disposal of an item of property, plant and equipment is calculated as the difference between the net proceeds from disposal with the carrying amount of the item and is recognised in profit or loss.
(ii) Subsequent costs
Subsequent expenditure is capitalised only when it is probable that the future economic benefits associated with the expenditure will flow to the Authority. The carrying amount of the replaced part is derecognised. Ongoing repairs and maintenance is expensed as incurred.
(iii) Depreciation
Items of property, plant and equipment are depreciated on a straight-line basis in profit or loss over the estimated useful lives of each component. Leased assets are depreciated over the shorter of the lease term and their useful lives unless it is reasonably certain that the Authority will obtain ownership by the end of the lease term. Land is not depreciated.
Items of property, plant and equipment are depreciated from the date that they are installed and are ready for use, or in respect of internally constructed assets, from the date that the asset is completed and ready for use.
The estimated useful lives for the current and comparative years of significant items of property, plant and equipment are as follows:

Esperance Port Authority 10 Notes to the Financial Statements 2. Summary of significant accounting policies (continued)
(f) Property, plant and equipment (continued)
Channels 20 - 80 years
Breakwater 50 years
Buildings and ancillaries 5 – 50 years
Berths 20 – 25 years
Oil pipeline 20 years
Electrical services 5 – 40 years
Office equipment 2 - 15 years
Motor vehicles 4 – 7 years
Plant and equipment 2 - 20 years
Bulk loading facilities 3 - 40 years
Berth stabilisation and fenders 10 - 25 years
Depreciation methods, useful lives and residual values are reviewed at each reporting date and adjusted if appropriate.
(g) Intangible assets
(i) Research and development
Expenditure on research activities is recognised in the Statement of Profit or Loss and Other Comprehensive Income as incurred.
Development activities involve a plan or design for the production of new or substantially improved products and processes. Development expenditure is capitalised only if development costs can be measured reliably, the product or process is technically and commercially feasible, future economic benefits are probable, and the Authority intends to and has sufficient resources to complete development and to use or sell the asset. The expenditure capitalised includes the cost of materials, direct labour and overhead costs that are directly attributable to preparing the asset for its intended use, and capitalised borrowing costs. Other development expenditure is recognised in the Statement of Profit or Loss and Other Comprehensive Income as incurred.
Capitalised development expenditure is measured at cost less accumulated amortisation and accumulated impairment losses.
(ii) Subsequent expenditure
Subsequent expenditure is capitalised only when it increases the future economic benefits embodied in the specific asset to which it relates.
(iii) Computer software
Software that is an integral part of the related hardware is treated as property, plant and equipment. Software that is not an integral part of the related hardware is treated as an intangible asset.

Esperance Port Authority 11 Notes to the Financial Statements 2. Summary of significant accounting policies (continued)
(g) Intangible assets (continued)
(iv) Amortisation
Intangible assets are amortised on a straight-line basis in the Statement of Profit or Loss and Other Comprehensive Income over their estimated useful lives, from the date that they are available for use. The estimated useful lives for the current and comparative years are as follows:
Computer software 2 - 5 years
Licenses 3 years
Amortisation methods, useful lives and residual values are reviewed at each reporting date and adjusted if appropriate.
(h) Impairment
Property, plant and equipment and intangible assets are tested for any indication of impairment at each balance sheet date. Where there is any indication of impairment, the recoverable amount is estimated. Where the recoverable amount is less than the carrying amount, the asset is considered impaired and is written down to the recoverable amount and an impairment loss is recognised. As the Authority is a not-for-profit entity, the recoverable amount is the higher of an asset’s fair value less costs to sell and depreciated replacement cost.
The risk of impairment is generally limited to circumstances where an asset’s depreciation is materially understated, where the replacement cost is falling or where there is a significant change in useful life. Each relevant class of assets is reviewed annually to verify that the accumulated depreciation/amortisation reflects the level of consumption or expiration of the asset’s future economic benefits and to evaluate any impairment risk from falling replacement costs.
Intangible assets with an indefinite useful life and intangible assets not yet available for use are tested for impairment at each reporting date irrespective of whether there is any indication of impairment.
The recoverable amount of assets identified as surplus assets is the higher of fair value less costs to sell and the present value of future cash flows expected to be derived from the asset. Surplus assets carried at fair value have no risk of material impairment where fair value is determined by reference to market-based evidence. Where fair value is determined by reference to depreciated replacement cost, surplus assets are at risk of impairment and the recoverable amount is measured. Surplus assets at cost are tested for indications of impairment at the end of each reporting period. All impairment losses are recognised in the Statement of Profit or Loss and Other Comprehensive Income.
An impairment loss is reversed only to the extent that the asset’s carrying amount does not exceed the carrying amount that would have been determined, net of depreciation or amortisation, if no impairment loss had been recognised.

Esperance Port Authority 12 Notes to the Financial Statements 2. Summary of significant accounting policies (continued)
(i) Leases
Leases are classified as either finance leases or operating leases based on the economic substance of the lease agreements.
Leases in terms of which the Authority assumes substantially all the risks and rewards of ownership are classified as finance leases. On initial recognition the leased asset is measured at an amount equal to the lower of its fair value and the present value of the minimum lease payments. A finance lease liability of equal value is also recognised. Subsequent to initial recognition, the asset is accounted for in accordance with the accounting policy applicable to that asset.
Other leases are operating leases and the leased assets are not recognised on the Authority’s Statement of Financial Position.
Payments made under operating leases are recognised in the Statement of Profit or Loss and Other Comprehensive Income on a straight-line basis over the term of the lease. Lease incentives received are recognised as an integral part of the total lease expense, over the term of the lease.
Minimum lease payments made under finance leases are apportioned between the finance expense and the reduction of the outstanding liability. The finance expense is allocated to each period during the lease term so as to produce a constant periodic rate of interest on the remaining balance of the liability. Contingent lease payments are accounted for by revising the minimum lease payments over the remaining term of the lease when the lease adjustment is confirmed.
(j) Financial instruments
In addition to cash and cash equivalents, the Authority has three categories of financial instruments:
Loans and receivables
Held to maturity investments
Financial liabilities measured at amortised cost
Financial instruments have been disaggregated into the following classes:
Financial Assets
o Cash and cash equivalents
o Trade and other receivables
Financial Liabilities
o Trade and other payables
o Interest bearing liabilities
o WATC/Bank borrowings
o Finance lease liabilities

Esperance Port Authority 13 Notes to the Financial Statements 2. Summary of significant accounting policies (continued)
(j) Financial instruments (continued)
Refer to Note 23(ii) for further information on the classification of financial instruments.
Initial recognition and measurement is at fair value plus directly attributable transaction costs for assets not carried at fair value through profit or loss. Subsequent measurement is at amortised cost using the effective interest method.
The fair value of short-term receivables and payables approximates their carrying amount because there is no interest rate applicable and subsequent measurement is not required as the effect of discounting is not material. Gains or losses are recognised when the financial assets are derecognised or impaired.
(k) Payables
Payables, including trade payables, amounts payable and accrued expenses, are recognised for amounts to be paid in the future for goods and services received prior to the reporting date. The carrying amount is equivalent to fair value, as they are generally settled within 30 days.
(l) Borrowings
All borrowings are initially recognised at the fair value of the consideration received less directly attributable transaction costs. Subsequent measurement is at amortised cost using the effective interest method.
Gains and losses are recognised in the Statement of Profit or Loss and Other Comprehensive Income when the liabilities are derecognised, as well as through the amortisation process.
Borrowing costs are expensed as incurred unless they relate to qualifying assets.
(m) Employee benefits All annual leave and long service leave provisions are in respect of employees’ services up to the end of the reporting period. Annual leave Annual leave is expected to be settled wholly within 12 months after the end of the reporting period and is therefore considered to be a ‘short-term employee benefit’. The annual leave liability is recognised and measured at the undiscounted amounts expected to be paid when the liability is settled. When assessing expected future payments consideration is given to expected future wage and salary levels including non-salary components such as employer superannuation contributions, as well as the experience of employee departures and periods of service. The expected future payments are discounted using market yields at the end of the reporting period on national government bonds with terms to maturity that match, as closely as possible, the estimated future cash outflows. The provision for annual leave is classified as a current liability as the Authority does not have an unconditional right to defer settlement of the liability for at least 12 months after the end of the reporting period.

Esperance Port Authority 14 Notes to the Financial Statements 2. Summary of significant accounting policies (continued)
(m) Employee benefits (continued) Long service leave Long service leave is not expected to be settled wholly within 12 months after the end of the reporting period is recognised and measured at the present value of amounts expected to be paid when the liabilities are settled using the remuneration rate expected to apply at the time of settlement. When assessing expected future payments consideration is given to expected future wage and salary levels including non-salary components such as employer superannuation contributions, as well as the experience of employee departures and periods of service. The expected future payments are discounted using market yields at the end of the reporting period on national government bonds with terms to maturity that match, as closely as possible, the estimated future cash outflows. Unconditional long service leave provisions are classified as current liabilities as the Authority does not have an unconditional right to defer settlement of the liability for at least 12 months after the end of the reporting period. Pre-conditional and conditional long service leave provisions are classified as non-current liabilities because the Authority has an unconditional right to defer the settlement of the liability until the employee has completed the requisite years of service.
(n) Employee superannuation
The Gold State Superannuation Scheme (GSS), a defined benefit lump sum scheme, and the Superannuation and Family Benefits Act Scheme, a defined benefit pension scheme, are now closed to new members. The Authority is liable for superannuation benefits for past years’ service of members of the Superannuation and Family Benefits Act Scheme who elected to transfer to the GSS Scheme. The Authority accrues superannuation benefits to the pension scheme for those members who elected not to transfer from that scheme. Monthly contributions are also made to SERF to satisfy existing workforce requirements for waterside employees who transferred to the Authority during 1992 and for casual staff.
The superannuation liability for existing employees with the pre-transfer service incurred under the Superannuation and Family Benefits Act Scheme who transferred to the GSS Scheme is provided for at reporting date.
The Authority’s total superannuation liability has been actuarially assessed as at 30 September 2014.
Employees who are not members of either the Pension or the GSS Schemes became non-contributory members of the West State Superannuation Scheme (WSS), an accumulation fund until 15 April 2007. From 16 April 2007, employees who are not members of the Pension, GSS or WSS Schemes become non-contributory members of the GESB Superannuation Scheme (GESB Super), a taxed accumulation fund. The Authority makes concurrent contributions to the Government Employee Superannuation Board (GESB) on behalf of employees in compliance with the Commonwealth Government’s Superannuation Guarantee (Administration) Act 1992. These contributions extinguish the liability for superannuation charges in respect of the WSS and GESB Super Schemes.

Esperance Port Authority 15 Notes to the Financial Statements 2. Summary of significant accounting policies (continued)
(n) Employee superannuation (continued)
Defined benefit plan
The Authority’s net obligation in respect of the defined benefit pension plan is calculated separately by estimating the amount of future benefit that employees have earned in return for their service in the current and prior periods; that benefit is discounted to determine its present value, and the fair value of any plan assets is deducted. These benefits are unfunded.
The discount rate used is the market yield rate at the balance sheet date on national government bonds that have maturity dates approximating to the terms of the entity’s obligations. The calculation is performed by a qualified actuary using the projected unit credit method.
The superannuation expense of the defined benefit plan is made up of the following elements:
Current service cost;
Interest cost (unwinding of the discount);
Actuarial gains and losses; and
(n) Employee superannuation
Past service cost.
Actuarial gains and losses of the defined benefit plan are recognised immediately in the Statement of Profit or Loss and Other Comprehensive Income.
The superannuation expense of the defined contribution plan is recognised as and when the contributions fall due.
(o) Dividends
Dividends are recognised as a liability in the period in which they are declared.
(p) Provisions
A provision is recognised if, as a result of a past event, the Authority has a present legal or constructive obligation that can be estimated reliably, and it is probable that an outflow of economic benefits will be required to settle the obligation. Provisions are determined by discounting the expected future cash flows at a pre-tax rate that reflects current market assessments of the time value of money and the risks specific to the liability.
The unwinding of the discount is recognised as finance cost
(q) Cash and cash equivalents
Cash and cash equivalents in the Statement of Financial Position comprise cash on hand, cash at bank, at call deposits and term deposits due within 30 days.
For the purpose of the statement of cash flow, cash equivalents consist of cash and cash equivalents as defined above.

Esperance Port Authority 16 Notes to the Financial Statements 2. Summary of significant accounting policies (continued)
(r) Goods and services tax
Revenue, expenses and assets are recognised net of the amount of goods and services tax (GST), except where the amount of GST incurred is not recoverable from the taxation authority. In these circumstances, the GST is recognised as part of the cost of acquisition of the asset or as part of the expense.
Receivables and payables are stated inclusive of GST. The net amount of GST recoverable from, or payable to, the ATO is included as a current asset or liability in the Statement of Financial Position.
Cash flows are included in the statement of cash flows on a gross basis. The GST components of cash flows arising from investing and financing activities which are recoverable from, or payable to, the ATO are classified as operating cash flows.
(s) Contributed equity
The Authority receives support from the WA Government (see note 21). The amount received is recognised directly as a credit to contributed equity.
(t) New and Revised Accounting Standards that are effective for these Financial Statements
The AASB has issued a number of new and amended Accounting Standards and Interpretations that have mandatory application dates for future reporting periods, some of which are relevant to the Authority. The Authority has decided not to early adopt any of the new and amended pronouncements. The Authority’s assessment of the new and amended pronouncements that are relevant to the Authority but applicable in future reporting periods is set out below:
AASB 9: Financial Instruments (December 2010) and AASB 2010-7: Amendments to Australian Accounting Standards arising from AASB 9 (December 2010).
This Standard is mandatorily applicable for annual reporting periods commencing on or after 1 January 2013. However, AASB 2012-6 defers the application date of AASB 9 from 1 January 2013 to 1 January 2015. AASB 9 introduces new requirements for the classification and measurement of financial assets and liabilities.
Management has reviewed the requirements of AASB 9 and AASB 2010-7 and has concluded that there is no material effect on the financial statements.
AASB 13: Fair Value Measurement and AASB 2011-8: Amendments to Australian Accounting Standards arising from AASB 2013 (applicable for annual reporting periods commencing on or after 1 January 2013).
AASB 13 establishes a single source of guidance for determining the fair value of assets and liabilities. AASB 13 does not change when an entity is required to use fair value, but rather, provides guidance on how to determine fair value when fair value is required or permitted by other Standards.
Management has reviewed the requirements of AASB 13 and AASB 2011-8 and has concluded that there is no material effect on the financial statements.

Esperance Port Authority 17 Notes to the Financial Statements 2. Summary of significant accounting policies (continued)
(t) New and Revised Accounting Standards that are effective for these Financial Statements (continued)
AASB 119: Employee Benefits (September 2011) and AASB 2011-10: Amendments to Australian Accounting Standards arising from AASB 119 (September 2011) (applicable for annual reporting periods beginning on or after 1 January 2013).
This Standard introduces a number of changes to presentation and disclosure of a defined benefit plan. AASB 119 also includes changes to the criteria for determining when termination benefits should be recognised as obligation.
These amendments have no significant impact on the entity.
AASB 2012-2: Amendments to Australian Accounting Standards – Disclosures – Offsetting Financial Assets and Financial Liabilities (application for annual reporting periods commencing on or after 1 January 2014).
This Standard amends the required disclosures in AASB 7 to include information that will enable users of an entity’s financial statements to evaluate the effect or potential effect of netting arrangements, including rights of set-off associated with the entity’s recognised financial assets and recognised financial liabilities, on the entity’s statement of financial position.
There will be no impact on the entity as the entity does not have any netting arrangements in place.
AASB 2012-5: Amendments to Australian Accounting Standards arising from Annual Improvements 2009-2011 (applicable for annual reporting periods beginning on or after 1 January 2013).
These amendments are a consequence of the annual improvement process, which provides a vehicle for making non-urgent but necessary amendments to Standards.
This Standard has no significant impact to the Authority’s financial statements.

Esperance Port Authority 18 Notes to the Financial Statements
2. Summary of significant accounting policies (continued)
(u) Future impact of Australian Accounting Standards not yet operative The Authority cannot early adopt an Australian Accounting Standard unless specifically permitted by TI 1101 Application of Australian Accounting Standards and Other Pronouncements. Consequently, the Authority has not applied early any of the following Australian Accounting Standards that have been issued that may impact the Authority. Where applicable, the Authority plans to apply these Australian Accounting Standards from their application date. Operative for
reporting periods
beginning on/after
Int 21 Levies This Interpretation clarifies the circumstances under which a liability to pay a government levy imposed should be recognised. There is no financial impact for the Authority at reporting date.
1 Jan 2014
AASB 9 Financial Instruments This Standard supersedes AASB 139 Financial Instruments: Recognition and Measurement, introducing a number of changes to accounting treatments. The mandatory application date of this Standard was amended to 1 January 2017. The Authority has not yet determined the application or the potential impact of the Standard.
1 Jan 2017
AASB 10 Consolidated Financial Statements This Standard, issued in August 2011, supersedes AASB 127 Consolidated and Separate Financial Statements and Int 112 Consolidation – Special Purpose Entities, introducing a number of changes to accounting treatments. Mandatory application was deferred by one year for not-for-profit entities by AASB 2012-10 Amendments to Australian Accounting Standards – Transition Guidance and Other Amendments. The adoption of the new Standard has no financial impact for the Model Statutory Authority as it doesn’t impact accounting for related bodies and the Authority has no interests in other entities.
1 Jan 2014
AASB 11 Joint Arrangements This Standard, issued in August 2011, supersedes AASB 131 Interests in Joint Ventures, introduces new principles for determining the type of joint arrangement that exists, which are more aligned to the actual rights and obligations of the parties to the arrangement. Mandatory application of the Standard was deferred by one year for not-for-profit entities by AASB 2012-10. There is no financial impact for the Model Statutory Authority as the new standard will continue to require proportional consolidation of the Authority’s rights to assets and liabilities for the unincorporated joint operation.
1 Jan 2014

Esperance Port Authority 19 Notes to the Financial Statements 2. Summary of significant accounting policies (continued)
Operative for
reporting periods
beginning on/after
AASB 12 Disclosure of Interests in Other Entities This Standard, issued in August 2011, supersedes disclosure requirements under AASB 127 Consolidated and Separate Financial Statements, AASB 128 Investments in Associates and AASB 131 Interests in Joint Ventures. Mandatory application was deferred by one year for not-for-profit entities by AASB 2012-10. There is no financial impact.
1 Jan 2014
AASB 127 Separate Financial Statements This Standard, issued in August 2011, supersedes AASB 127 Consolidated and Separate Financial Statements, removing the consolidation requirements of the earlier standard whilst retaining accounting and disclosure requirements for the preparation of separate financial statements. Mandatory application was deferred by one year for not-for-profit entities by AASB 2012-10. There is no financial impact.
1 Jan 2014
AASB 128 Investments In Associates and Joint Ventures This Standard issued in August 2011, supersedes AASB 128 Investments in Associates, introducing a number of clarifications for the accounting treatments of changed ownership interest. Mandatory application was deferred by one year for not-for-profit entities by AASB 2012-10. The adoption of the new Standard has no financial impact for the Model Statutory Authority as it doesn’t hold investments in associates or and the accounting treatments for joint operations is consistent with current practice.
1 Jan 2014
AASB 1031 Materiality This Standard is an interim standard cross-referencing definitions of ‘materiality’ in other Standards and will remain operative until references to AASB 1031 are removed from other Standards. There is no financial impact.
1 Jan 2014
AASB 1055 Budgetary Reporting This Standard specifies the nature of budgetary disclosures, the circumstances in which they are to be included in the general purpose financial statements of not-for-profit entities within the General Government Sector. The Authority will be required to disclose additional budgetary information and explanations of major variances between actual and budgeted amounts, though there is no financial impact.
1 Jul 2014
AASB 2009-11
Amendments to Australian Accounting Standards arising from AASB 9 [AASB 1, 3, 4, 5, 7, 101, 102, 108, 112, 118, 121, 127, 128, 131, 132, 136, 139, 1023 & 1038 and Int 10 & 12] [modified by AASB 2010-7]
1 Jan 2015

Esperance Port Authority 20 Notes to the Financial Statements 2. Summary of significant accounting policies (continued)
Operative for reporting periods
beginning on/after
AASB 2010-7
Amendments to Australian Accounting Standards arising from AASB 9 (December 2010) [AASB 1, 3, 4, 5, 7, 101, 102, 108, 112, 118, 120, 121, 127, 128, 131, 132, 136, 137, 139, 1023 & 1038 and Int 2, 5, 10, 12, 19 & 127] This Standard makes consequential amendments to other Australian Accounting Standards and Interpretations as a result of issuing AASB 9 in December 2010. The Authority has not yet determined the application or the potential impact of the Standard.
1 Jan 2015
AASB 2012-3
Amendments to Australian Accounting Standards – Offsetting Financial Assets and Financial Liabilities [AASB 132] This Standard adds application guidance to AASB 132 to address inconsistencies identified in applying some of the offsetting criteria, including clarifying the meaning of “currently has a legally enforceable right of set-off” and that some gross settlement systems may be considered equivalent to net settlement. The model Authority does not routinely hold financial assets and financial liabilities that it intends to settle on a net basis, therefore there is no financial impact.
1 Jan 2014
AASB 2013-3
Amendments to AASB 136 – Recoverable Amount Disclosures for Non-Financial Assets. This Standard introduces editorial and disclosure changes. There is no financial impact.
1 Jan 2014
AASB 2013-4
Amendments to Australian Accounting Standards – Novation of Derivatives and Continuation of Hedge Accounting [AASB 139] This Standard permits the continuation of hedge accounting in circumstances where a derivative, which has been designated as a hedging instrument, is novated from one counterparty to a central counterparty as a consequence of laws or regulations. The model Authority does not routinely enter into derivatives or hedges, therefore there is no financial impact.
1 Jan 2014
AASB 2013-9
Amendments to Australian Accounting Standards – Conceptual Framework, Materiality and Financial Instruments. This omnibus Standard makes amendments to other Standards arising from the deletion of references to AASB 1031 in other Standards for periods beginning on or after 1 January 2014 (Part B), and, defers the application of AASB 9 to 1 January 2017 (Part C). The Authority has not yet determined the application or the potential impact of AASB 9, otherwise there is no financial impact for Part B.
1 Jan 2014
1 Jan 2017
3. Changes in accounting estimates
The Authority has not changed any accounting estimates during the period.

Esperance Port Authority 21 Notes to the Financial Statements 4. Expenses by nature
Operating expenses are presented on the face of the Statement of Profit or Loss and Other Comprehensive Income using a classification based on the nature of expenses (see note 1(b)). Marine expenses include those expenses derived from water-based activities, Port operations expenses include those expenses related to land-based support activities, whilst general administration expenses includes expenditure of an administrative nature.
5. Revenue
Revenue consists of the following items: 3 months
ended 30 Sept
2014
12 months ended
30 June 2014
$’000 $’000 Rendering of services Charges on cargo 5,134 13,896 Charges on ships 4,096 16,069 Port services 9,520 43,876 Infrastructure charge 609 3,796 Interest revenue on bank accounts 150 211 Rentals and leases 131 472 Other operating revenue 811 2,104 Total revenue 20,451 80,424
6. Other income
Other income consists of the following items: 3 months
ended 30 Sept
2014
12 months ended
30 June 2014
$’000 $’000
Net gain on sale of property, plant and equipment - 1
Sale of electricity and water 414 2,167
414 2,168

Esperance Port Authority 22 Notes to the Financial Statements
7. Depreciation and amortisation expense 3 months
ended 30 Sept
2014
12 months ended
30 June 2014
$’000 $’000
Depreciation
Buildings and ancillaries 287 1,082
Berths one and two 70 275
Berth three and ship loader 8 34
Berth stabilisation and fenders 29 115
Breakwater 52 210
Bulk loading facilities (a) 92 7,537
Channels 81 304
Electrical services 15 75
Office equipment 39 131
Oil pipeline 5 18
Plant and equipment 311 1,082
Total depreciation 989 10,863
Amortisation
Intangible assets 22 92 Total amortisation 22 92
Total depreciation and amortisation 1,011 10,955
(a) Refer to Note 16A
8. Employee benefits expense 3 months
ended 30 Sept
2014
12 months ended
30 June 2014
$’000 $’000
Wages and salaries 4,231 16,774
Superannuation – defined benefit plans (see note 20(e)) 426 1,563
Long service leave 22 268
Annual leave 20 193 Sick leave 8 188 Accumulated days off (21) 17 4,686 19,003
Employment on-costs such as workers’ compensation insurance and payroll tax are included at note 10 Other expenses. The employment on-costs liability is included at note 20 Provisions.

Esperance Port Authority 23 Notes to the Financial Statements 9. Finance costs
3 months ended
30 Sept 2014
12 months ended
30 June 2014
$’000 $’000
Interest paid 1,012 4,281
Finance costs expensed 1,012 4,281
10. Other expenses 3 months
ended 30 Sept 2014
12 months ended
30 June 2014
$’000 $’000
Employee on-costs(a) 3 50
3 50
(a) Includes workers’ compensation insurance, payroll tax and other employment on-costs. The on-costs liability associated with the recognition of annual and long service leave liability is included at note 20 Provisions. Superannuation contributions accrued as part of the provision for leave are employee benefits and are not included in employee on-costs.

Esperance Port Authority 24 Notes to the Financial Statements
11. Income tax expense 3 months
ended 30 Sept
2014
12 months ended
30 June 2014
$’000 $’000 Recognised in the Statement of Profit or Loss and Other Comprehensive Income Current tax expense Current income tax charge (552) - Deferred tax expense Origination and reversal of temporary differences (17) (963) Change in the unrecognised temporary differences - 1,019
(17) 56
Total income tax (expense) / benefit (569) 56
Reconciliation between tax expense and pre-tax net profit 3 months
ended 30 Sept
2014
12 months ended
30 June 2014
$’000 $’000 Profit / (loss) for the period / year 1,892 3,342 Total income tax (expense) / benefit (568) (963)
Profit / (loss) including income tax 1,324 2,379
Income tax using the statutory tax rate of 30% (2012: 30%) (568) (1,003) Non-deductible expenses - 40
(568) (963) (Under) / over provision in prior years - 1,019 Prior year tax losses not recognised now recouped - -
Income tax (expense) / benefit (568) 56

Esperance Port Authority 25 Notes to the Financial Statements
11. Income tax expense (continued)
Deferred income tax
3 months
ended
30 Sept 2014
12 months ended
30 June
2014
3 months
ended
30 Sept 2014
12 months ended
30 June
2014
Statement of Financial position
Statement of Profit or Loss and Other Comprehensive
Income
$’000 $’000 $’000 $’000
Deferred tax liabilities
Other adjustments (8,650) (8,648)
Accelerated depreciation for tax purposes - -
Finance lease receivable (current) (1,241) (1,642)
Gross deferred tax liabilities (9,891) (10,290)
Deferred tax assets
Employee benefits 1,395 1,386
Prepaid rental - -
Tax losses - 349
Others 4,179 4,255
Gross deferred tax assets 5,574 5,990
Set-off of deferred tax liabilities pursuant to set-off provisions
(9,891) (10,290)
Net deferred tax liability (4,317) (4,300)
Deferred tax charge (17) 56
Current tax liabilities
The current tax liability of nil (2014: nil) represents the amount of income taxes payable in respect of current and prior financial periods.

Esperance Port Authority 26 Notes to the Financial Statements
12. Dividends 3 months
ended 30 Sept
2014
12 months ended
30 June 2014
$’000 $’000 Dividends paid in the period - -
In accordance with Government Financial Policy, WA Ports are required to pay dividends of 65% of after tax profits. However, in accordance with Australian Accounting Standards, dividends relating to the financial results for the period ended 30 September 2014 have not been provided as they are expected to be declared by Government after balance date.
A dividend recommendation of $2.209 million in respect of the financial results for the year ended 30 June 2014 has been made to the Minister for Transport but has not been provided for as this dividend is expected to be declared by Government after balance date.

Esperance Port Authority 27 Notes to the Financial Statements
13.Cash and cash equivalents
30 Sept 2014
30 June 2014
$’000 $’000 Bank balances 16,298 19,646 Cash and cash equivalents in the statements of cash flows 16,298 19,646
The Authority’s exposure to interest rate risk and sensitivity analysis for financial assets and liabilities are disclosed in note 23(i).
14. Trade and other receivables 30 Sept
2014 30 June
2014
$’000 $’000
Current
Receivables 8,786 7,640 GST receivable - 153 Finance lease receivable 5,561 5,473 Prepayments 1,687 565
16,034 13,831
Non-current
Finance lease receivable 24,908 26,332
24,908 26,332
The Authority does not hold any collateral as security or other credit enhancements relating to receivables.
The Authority does not hold any financial assets that had to have their terms renegotiated that would have otherwise resulted in them being past due or impaired.
At 30 September 2014, the ageing analysis of trade debtors past due but not impaired was nil.

Esperance Port Authority 28 Notes to the Financial Statements
15. Inventories 30 Sept
2014 30 June
2014 $’000 $’000 Current Stores – at cost 2,501 2,496 2,501 2,496
Non-current Stores – at cost 2,533 2,305 2,533 2,305
16. Property, plant and equipment 30 Sept
2014 30 June
2014 $’000 $’000 Channels At cost 16,921 16,921 Accumulated depreciation (3,912) (3,831) 13,009 13,090
Land At cost 1,282 1,282 1,282 1,282 Buildings and ancillaries At cost 18,491 18,472 Accumulated depreciation (6,815) (6,528) 11,676 11,944
Berths one and two At cost 6,157 6,157 Accumulated depreciation (4,961) (4,891) 1,196 1,266
Berth three and ship loader At cost 616 616 Accumulated depreciation (398) (390) 218 226
Berth stabilisation and fenders At cost 3,911 3,911 Accumulated depreciation (2,684) (2,655) 1,227 1,256 Breakwater At cost 10,483 10,483 Accumulated depreciation (3,355) (3,302) 7,128 7,181 Bulk loading facilities At cost 34,397 36,212 Accumulated depreciation (24,592) (26,315) Accumulated impairment losses (6,500) (6,500) 3,305 3,397

Esperance Port Authority 29 Notes to the Financial Statements
16. Property, plant and equipment (continued) 30 Sept
2014 30 June
2014 $’000 $’000 Electrical services At cost 1,653 1,653 Accumulated depreciation (768) (753) 885 900 Office equipment At cost 979 946 Accumulated depreciation (593) (557) 386 389 Oil pipeline At cost 555 540 Accumulated depreciation (329) (324) 226 216
Plant and equipment At cost 14,557 14,198 Accumulated depreciation (6,942) (6,631) 7,615 7,567
Total property, plant and equipment at net book value 48,153 48,714

Esperance Port Authority 30 Notes to the Financial Statements 16. Property, plant and equipment (continued)
Reconciliations of the carrying amounts of property, plant and equipment at the beginning and end of the reporting period are set out below. 30 Sept
2014 30 June
2014 $’000 $’000 Breakwater Carrying amount at 1 July 7,180 7,390 Depreciation (52) (210) Carrying amount at end of period / year 7,128 7,180
Land Carrying amount at 1 July 1,282 1,282 Carrying amount at end of period / year 1,282 1,282
Buildings and ancillaries Carrying amount at 1 July 11,944 10,671 Additions / Reclassification 19 2,355 Depreciation (287) (1,082) Carrying amount at end of period / year 11,676 11,944
Berths one and two Carrying amount at 1 July 1,266 1,541 Depreciation (70) (275) Carrying amount at end of period / year 1,196 1,266
Berth three and ship loader Carrying amount at 1 July 226 260 Depreciation (8) (34) Carrying amount at end of period / year 218 226 Berth stabilisation and fenders Carrying amount at 1 July 1,256 1,371 Depreciation (29) (115) Carrying amount at end of period / year 1,227 1,256 Bulk loading facilities Carrying amount at 1 July 3,397 8,961 Additions - 1,973 Depreciation (92) (7,537) Carrying amount at end of period / year : refer note 16 A 3,305 3,397

Esperance Port Authority 31 Notes to the Financial Statements 16. Property, plant and equipment (continued)
Reconciliations of the carrying amounts of property, plant and equipment at the beginning and end of the reporting period are set out below.
30 Sept
2014 30 June
2014 $’000 $’000 Channels Carrying amount at 1 July 13,090 13,105 Additions - 289 Depreciation (81) (304) Carrying amount at end of period / year 13,009 13,090
Electrical services Carrying amount at 1 July 900 975 Depreciation (15) (75) Carrying amount at end of period / year 885 900
Office equipment Carrying amount at 1 July 389 404 Additions 37 116 Depreciation (39) (131) Disposals (1) - Carrying amount at end of period / year 386 389 Oil pipeline Carrying amount at 1 July 216 54 Additions 15 180 Depreciation (5) (18) Carrying amount at end of period / year 226 216
Plant and equipment Carrying amount at 1 July 7,568 5,537 Additions / Reclassification 358 3,126 Depreciation (311) (1,082) Disposals - (13) Carrying amount at end of period / year 7,615 7,568 Total property, plant and equipment 48,153 48,714
16A- Bulk Loading Facilities – The Mineral Concentrate Circuit contained within this asset group has not been in operation since October 2011.
At 30 June 2014, the effective life of the Mineral Concentrate Circuit was deemed to have expired. As a result accelerated depreciation of $5.328 million was posted to reduce the carrying value of this asset to nil.

Esperance Port Authority 32 Notes to the Financial Statements
17. Intangible assets 30 Sept
2014 30 June
2014 $’000 $’000 Computer software At cost 719 719 Accumulated amortisation (398) (375) 321 344 Reconciliation of carrying amounts Computer software Carrying amount at 1 July 343 420 Additions - 15 Amortisation expense (22) (92) Carrying amount at period end / year 321 343
18. Trade and other payables 30 Sept
2014 30 June
2014 $’000 $’000 Current Trade payables 4,660 5,997 Accrued expenses 1,110 2,610 GST Payable 42 - 5,812 8,607
The Authority’s exposure to liquidity risk related to trade and other payables is disclosed in note 23(i).

Esperance Port Authority 33 Notes to the Financial Statements
19. Interest bearing borrowings
This note provides information about the contractual terms of the Authority’s interest bearing borrowings, which are measured at amortised cost. For more information about the Authority’s exposure to interest rate and liquidity risk, see note 23(i).
30 Sept
2014 30 June
2014 $’000 $’000 Current liabilities Direct borrowings 638 645 Special borrowings 7,535 7,420 8,173 8,065 Non-current liabilities Direct borrowings 3,417 3,575 Special borrowings 47,571 49,499 50,988 53,074 Financing arrangements The Authority has access to the following lines of credit: Total facilities available: Direct and special borrowings 70,361 72,339 70,361 72,339 Facilities utilised at reporting date: Direct and special borrowings 59,161 61,139 59,161 61,139
Facilities not utilised at reporting date: Direct and special borrowings 11,200 11,200 11,200 11,200
Significant terms and conditions
The Port Authority’s loans and borrowings are financed at fixed rates of interest; therefore changes in interest rates will have no impact on the profitability of the Port Authority.

Esperance Port Authority 34 Notes to the Financial Statements 19. Interest bearing borrowings (continued)
Interest rate risk exposure
The Authority’s exposure to interest rate risk on the interest bearing borrowings and the effective weighted average interest rate at year end by maturity periods is set out in the following table. 30 Sept 2014 Fixed interest rate Weighted
average effective interest
rate
1 year or less
Over 1 to 2
years
Over 2 to 3
years
Over 3 to 4
years
Over 4 to 5
years More than 5 years
Total
% $’000 $’000 $’000 $’000 $’000 $’000 $’000
Interest bearing borrowings:
Direct borrowings 5.03% 638 611 586 503 414 1,302 4,054
Special borrowings 6.19% 7,535 7,984 7,810 7,343 7,801 16,634 55,107
6.11% 8,173 8,595 8,396 7,846 8,215 17,936 59,161
Weighted average interest rate:
Direct borrowings 5.03% 5.03% 5.03% 5.03% 5.03% 5.03% 5.03%
Special borrowings 6.19% 6.19% 6.19% 6.19% 6.19% 6.19% 6.19%
30 June 2014 Fixed interest rate Weighted
average effective interest
rate
1 year or less
Over 1 to 2
years
Over 2 to 3
years
Over 3 to 4
years
Over 4 to 5
years More than 5 years
Total
% $’000 $’000 $’000 $’000 $’000 $’000 $’000
Interest bearing borrowings:
Direct borrowings 5.06% 645 617 592 539 436 1,391 4,220
Special borrowings 6.19% 7,420 7,892 7,880 7,414 7,689 18,624 56,919
6.11% 8,065 8,509 8,472 7,953 8,125 20,015 61,139
Weighted average interest rate:
Direct borrowings 5.06% 5.06% 5.06% 5.06% 5.06% 5.06% 5.06%
Special borrowings 6.19% 6.19% 6.19% 6.19% 6.19% 6.19% 6.19%

Esperance Port Authority 35 Notes to the Financial Statements
20. Provisions 30 Sept
2014 30 June
2014 $’000 $’000 Current Employee benefits provision Annual leave (a) 1,385 1,364 Long service leave (b) 1,005 1,013 Superannuation (e) 4 4 Sick leave 885 894 Liability for accumulated days off 192 213 Other provisions Employment on-costs (c) 251 251
3,722 3,739
Non-current Employee benefits provision Long service leave 610 580 Superannuation 23 23 Sick leave 231 214 Other provisions Employment on-costs 66 63
930 880
(a) Annual leave liabilities have been classified as current as there is no unconditional right to defer settlement for at least 12 months after balance sheet date. Assessments indicate that actual settlement of the liabilities will occur as follows:
30 Sept 2014
30 June 2014
$’000 $’000 Within 12 months of balance date 950 950 More than 12 months after balance sheet date 434 414
1,385 1,364
(b) Long service leave liabilities have been classified as current where there is no unconditional right to defer settlement for at least 12 months after balance sheet date. Assessments indicate that actual settlement of the liabilities will occur as follows:
30 Sept
2014 30 June
2014 $’000 $’000
Within 12 months of balance date 600 600 More than 12 months after balance sheet date 1,015 993
1,615 1,593
(c) The settlement of annual and long service leave liabilities gives rise to the payment of employment on-costs including workers’ compensation premiums and payroll tax. The provision is measured at the present value of expected future payments. The associated expense, apart from the unwinding of the discount (finance cost), is included at note 10 Other expenses.

Esperance Port Authority 36 Notes to the Financial Statements 20. Provisions (continued)
(d) The general claims provision is in relation to revenue being overcharged for past services rendered.
(e) Defined benefit superannuation plans.
The following is a summary of the most recent financial position of the Pension Scheme and GSS Scheme related to the Authority, calculated in accordance with AASB 119 Employee Benefits:
30 Sept
2014 30 June
2014
$’000 $’000
Amounts recognised in the Statement of Financial Position Present value of unfunded obligations 27 27 Fair value of plan assets - -
27 27
Reconciliation of movement in the present value of the unfunded obligations recognised in the Statement of Financial Position
Opening balance 28 29 Current service cost - - Interest cost - 1 Actuarial gain on liabilities - 2 Benefits paid (including expenses and taxes) - (4)
28 28
Amounts recognised in the Statement of Profit or Loss and Other Comprehensive Income
Current service cost - - Interest cost - 1 Actual gain recognised - -
- 1
Historic summary Defined benefit plan obligation 27 27 Plan assets - -
27 27
Experience adjustments arising on plan liabilities - - Experience adjustments arising on plan assets - - Principal actuarial assumptions Discount rate 3.69 3.69 Expected future salary increases 5.0 5.0 Expected future pension increases 2.5 2.5 Anticipated return on plan assets - - Expected contributions 5 5
Employer contributions are made to meet the cost of retirement benefit obligations as they fall due. For further details regarding the policy in respect of provision for retirement benefit obligations, refer to note 2(n).

Esperance Port Authority 37 Notes to the Financial Statements
20. Provisions (continued)
Movements in provisions
Reconciliations for the carrying amounts of each class of provision, except for employee benefits are set out below:
30 Sept
2014 $’000
30 June 2014 $’000
Retirement benefit obligations
Carrying amount at 1 July 27 29
Provisions made during the period - 2
Amounts utilised in the period - (4)
Carrying amount at 30 September 27 27
Employment on-costs provision
Carrying amount at 1 July 314 263
Provisions made during the period - 51
Amounts utilised in the period - 1
Carrying amount at 30 September 314 314
General claims provision
Carrying amount at 1 July - 1,151
Provisions made during the period - -
Amounts utilised in the period - (1,151)
Carrying amount at 30 September - -

Esperance Port Authority 38 Notes to the Financial Statements
21. Equity
30 Sept
2014 30 June
2014
$’000 $’000
Contributed equity Balance at the start of the year 7,268 3,609 Capital contributions – MRWA gifted infrastructure - 1,811 Capital contributions – Treasury 479 1,848
Balance at period end 7,747 7,268
Retained earnings Balance at start of year 27,735 24,337 Profit for the period 1,324 3,398
Balance at period end 29,059 27,735
22. Reconciliation of cash flows from operating activities
30 Sept 2014
30 June 2014
Reconciliation of Profit / (loss) after tax to the net cash flows from operations
$’000 $’000
Cash flows from operating activities Profit / (Loss) for the period / year 1,324 3,398 Adjustments for: Depreciation 988 10,863 Amortisation of intangible assets 22 92 Loss / (Gain) on sale of property, plant and equipment - (1) Income tax expense / (benefit) - (56)
Operating profit before changes in working capital and provisions
2,334 14,296
Change in trade and other receivables (2,096) (4) Change in inventories (234) (1,380) Change in trade and other payables (2,795) 3,320 Change in provisions and employee benefits 33 (438)
Net cash from operating activities (2,758) 15,794

Esperance Port Authority 39 Notes to the Financial Statements 23. Financial instruments
(i) Financial risk management objectives and policies
The Authority’s principal financial instruments comprise cash and cash equivalents, receivables, payables, interest bearing borrowings, and finance leases. The Authority has limited exposure to financial risks. The Authority’s overall risk management program focuses on managing the risks identified below.
Market risk
Market risk is the risk that changes in market prices such as foreign exchange rates and interest rates will affect the Authority’s income or the value of its holdings of financial instruments. The Authority does not trade in foreign currency and is not materially exposed to other price risks.
The Authority’s exposure to market risk for changes in interest rates relates primarily to its long-term debt obligations. The Authority’s borrowings are all obtained through the Western Australian Treasury Corporation (WATC) and are at fixed rates with varying maturities. The risk is managed by WATC through portfolio diversification and variation in maturity dates. Other than as detailed in the interest rate sensitivity analysis in the table below, the Authority has limited exposure to interest rate risk because it has no borrowings other than WATC borrowings and finance leases (fixed interest rate).
Sensitivity analysis
The Authority’s policy is to manage its finance costs using a mix of fixed and variable debt with the objective of achieving optimum returns whilst managing interest rate risk to avoid uncertainty and volatility in the market place.
The Authority constantly analyses its interest rate exposure. Within this analysis consideration is given to potential renewals of existing positions and alternative financing structures.
At the balance sheet date, if interest rates had moved as illustrated in the table below, with all other variables held constant, the effect would be as follows:
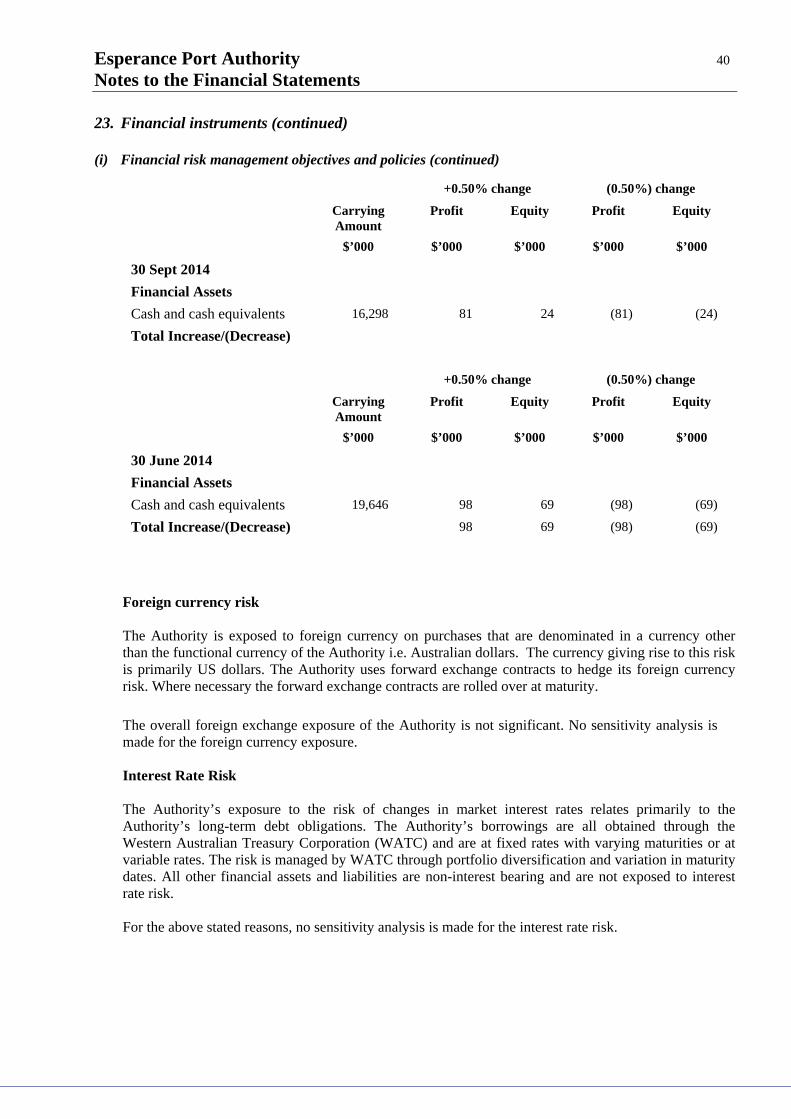
Esperance Port Authority 40 Notes to the Financial Statements 23. Financial instruments (continued)
(i) Financial risk management objectives and policies (continued)
Foreign currency risk The Authority is exposed to foreign currency on purchases that are denominated in a currency other than the functional currency of the Authority i.e. Australian dollars. The currency giving rise to this risk is primarily US dollars. The Authority uses forward exchange contracts to hedge its foreign currency risk. Where necessary the forward exchange contracts are rolled over at maturity.
The overall foreign exchange exposure of the Authority is not significant. No sensitivity analysis is made for the foreign currency exposure. Interest Rate Risk
The Authority’s exposure to the risk of changes in market interest rates relates primarily to the Authority’s long-term debt obligations. The Authority’s borrowings are all obtained through the Western Australian Treasury Corporation (WATC) and are at fixed rates with varying maturities or at variable rates. The risk is managed by WATC through portfolio diversification and variation in maturity dates. All other financial assets and liabilities are non-interest bearing and are not exposed to interest rate risk. For the above stated reasons, no sensitivity analysis is made for the interest rate risk.
+0.50% change (0.50%) change
Carrying Amount
Profit Equity Profit Equity
$’000 $’000 $’000 $’000 $’000
30 Sept 2014
Financial Assets
Cash and cash equivalents 16,298 81 24 (81) (24)
Total Increase/(Decrease)
+0.50% change (0.50%) change
Carrying Amount
Profit Equity Profit Equity
$’000 $’000 $’000 $’000 $’000
30 June 2014
Financial Assets
Cash and cash equivalents 19,646 98 69 (98) (69)
Total Increase/(Decrease) 98 69 (98) (69)

Esperance Port Authority 41 Notes to the Financial Statements
23. Financial instruments (continued)
(i) Financial risk management objectives and policies (continued) Credit risk
Credit risk arises when there is the possibility of the Authority’s receivables defaulting on their contractual obligations resulting in financial loss to the Authority. The Authority measures credit risk on a fair value basis and monitors risk on a regular basis. With respect to credit risk arising from cash and cash equivalents, the Authority’s exposure to credit risk arises from default of the counter party, with a maximum exposure equal to the carrying amount of the cash and cash equivalents.
The Authority operates predominantly within the shipping and cargo handling industry and accordingly is exposed to risks affecting that industry. The maximum exposure to credit risk at reporting date in relation to each class of recognised financial assets is the gross carrying amount of those assets inclusive of any provisions for impairment, as shown in the table at note 23(ii).
The Authority follows stringent credit control and management procedures in reviewing and monitoring debtor accounts and outstanding balances as evidenced by the historical aged debtor balances. In addition, management of receivable balances includes frequent monitoring thereby minimising the Authority’s exposure to bad debts. For financial assets that are either past due or impaired, refer to note 14 ‘Trade and other receivables’. The Authority’s credit risk management is further supported by rental agreements and sections 116 and 117 of the Port Authorities Act 1999. Section 116 refers to the liability to pay port charges in respect of vessels and Section 117 refers to the liability to pay port charges in respect of goods. Port charges are defined in Section 115. Liquidity risk The Authority’s objective is to maintain a balance between continuity of funding and flexibility through the use of cash reserves and its borrowing facilities. The Authority manages its exposure to liquidity risk by ensuring appropriate procedures are in place to manage cash flows, including monitoring forecast cash flows to ensure sufficient funds are available to meet its commitments. The table below reflects the contractual maturity of financial liabilities. The contractual maturity amounts are representative of the undiscounted amounts at the balance sheet date. The table includes both interest and principal cash flows. An adjustment has been made where material.

Esperance Port Authority 42 Notes to the Financial Statements
23. Financial instruments (continued)
(i) Financial risk management objectives and policies (continued) Liquidity Risk (continued) Carrying
amount 6 mths or
less 6-12
mths 1-2
years 2-5
years More
than 5 years
Financial liabilities
$’000 $’000 $’000 $’000 $’000 $’000
30 Sept 2014
Trade and other payables
5,812 5,812 - - - - Interest bearing borrowings
59,161 3,877 4,297 8,595 24,456 17,936 64,973 9,689 4,297 8,595 24,456 17,936 30 June 2014
Trade and other payables
8,607 8,607 - - - - Interest bearing borrowings
61,139 3,985 4,080 8,510 24,550 20,014 69,746 12,592 4,080 8,510 24,550 20,014
The risk implied from the values shown in the table below reflects cash inflows and outflows. Leasing obligations, trade payables and other financial liabilities mainly originate from the financing of assets used in the ongoing operations such as property, plant and equipment and investments in working capital e.g. inventories and trade receivables. These assets are considered in the Authority’s overall liquidity risk.
The table below reflects the contractual maturity of financial liabilities and financial assets. The table includes both interest and principal cash flows.
Risk associated with the liability on borrowings is reduced by the Authority paying a guarantee charge. This charge guarantees payment to the WATC by the Government for outstanding borrowings in case of default.

Esperance Port Authority 43 Notes to the Financial Statements
23. Financial instruments (continued)
(i) Financial risk management objectives and policies (continued)
Carrying
amount 6 mths
or less 6-12
mths 1-2
years 2-5
years More
than 5 years
30 Sept 2014 $’000 $’000 $’000 $’000 $’000 $’000 Financial assets Cash and cash equivalents
16,298 16,298
Trade and other receivables
40,942 13,209 2,826 5,933 7,861 11,113
57,240 29,507 2,826 5,933 7,861 11,113
Financial liabilities Trade and other payables 5,812 5,812 Interest bearing borrowings
59,161 3,877 4,297 8,595 24,456 17,936
64,973 9,689 4,297 8,595 24,456 17,936
Net maturity (7,733) 19,818 (1,471) (2,662) (16,595) (6,823)
Carrying
amount 6 mths
or less 6-12
mths 1-2
years 2-5
years More
than 5 years
30 June 2014 $’000 $’000 $’000 $’000 $’000 $’000 Financial assets Cash and cash equivalents
19,646 19,646
Trade and other receivables
40,163 11,050 2,781 5,838 9,104 11,390
59,809 30,696 2,781 5,838 9,104 11,390
Financial liabilities Trade and other payables 8,607 8,607 Interest bearing borrowings
61,139 3,985 4,080 8,510 24,550 20,014
69,746 12,592 4,080 8,510 24,550 20,014
Net maturity (9,937) 18,104 (1,299) (2,672) (15,446) (8,624)

Esperance Port Authority 44 Notes to the Financial Statements
23. Financial instruments (continued)
(ii) Categories of financial instruments by fair value
Set out below are the carrying amounts of the Authority’s financial instruments. The Directors consider the carrying amounts of the financial instruments represent their net fair values.
30 Sept
2014 30 June
2014
$’000 $’000
Financial assets
Cash and cash equivalents 16,298 19,646 Trade and other receivables 16,034 13,831 Receivables (non-current) 24,908 26,332
Financial liabilities Trade and other payables 5,812 8,607 Variable rate borrowings 4,054 4,220 Fixed rate borrowings 55,107 56,919
The fair value of the interest bearing borrowings was provided by the WATC using a lending curve, based on the various maturing dates for each loan, less a margin. The carrying amount, by maturity, of the interest-bearing borrowings that are exposed to interest rate risk are disclosed in note 19.
All financial assets and liabilities recognised in the Statement of Financial Position, whether they are carried at cost or fair value, are recognised at amounts that represent a reasonable approximation of fair value unless otherwise stated in the applicable notes.
(iii) Weighted average cost of capital
30 Sept 2014
Within one year
Weighted Average
Interest Rate
Floating Interest
Rate
Fixed Interest Bearing
Non Interest Bearing
Total
Financial Assets and Liabilities $’000 $’000 $’000 $’000
Cash and deposits 1.95% 16,298 16,298
Receivables 40,942 40,942
WATC borrowings (floating rate) 5.03% (4,054) (4,054)
WATC borrowings (fixed rate) 6.19% (55,107) (55,107)
Trade and other payables (5,812) (5,812)
Net financial assets (liabilities) 12,244 (55,107) 35,130 (7,733)

Esperance Port Authority 45 Notes to the Financial Statements
23. Financial instruments (continued)
(iv) Weighted average cost of capital (continued)
30 June 2014
Within one year
Weighted Average
Interest Rate
Floating Interest
Rate
Fixed Interest Bearing
Non Interest Bearing
Total
Financial Assets and Liabilities $’000 $’000 $’000 $’000
Cash and deposits 1.95% 19,646 19,646
Receivables 40,163 40,163
WATC borrowings (floating rate) 5.06% (4,220) (4,220)
WATC borrowings (fixed rate) 6.19% (56,919) (56,919)
Trade and other payables (8,607) (8,607)
Net financial assets (liabilities) 15,426 (56,919) 31,556 (9,937)
24. Commitments
(i) Capital expenditure commitments 30 Sept
2014 30 June
2014
$’000 $’000
Capital expenditure commitments, being contracted capital expenditure additional to the amounts reported in the financial statements, are payable as follows:
Within 1 year - - Later than 1 year and not later than 5 years - - Later than 5 years - -
- -
(ii) Lease commitments
The Authority has no lease commitments.

Esperance Port Authority 46 Notes to the Financial Statements
24. Commitments (continued)
(iii) Finance lease receivable
30 Sept
2014 30 June
2014
$’000 $’000
Amounts receivable under finance leases:
Within 1 year 7,421 7,421 Later than 1 year and not later than 5 years 17,585 19,440 Later than 5 years 14,789 14,789
39,795 41,650 Unearned finance income (9,326) (9,846)
Present value of minimum lease payments receivable 30,469 31,804
Representing finance lease receivable:
Current (note 14) 5,561 5,472 Non-current (note 14) 24,908 26,332
30,469 31,804
Finance leases receivable are in respect of storage and ship loading facilities. One lease agreement expires on 1 April 2017 and is charged interest at 6.598% per annum. One lease agreement expires on 1 July 2018 and is charged interest at 6.44% per annum. The other agreement expires on 1 July 2027 and is charged interest at 6.30% per annum.
(iv) Operating leases receivable 30 Sept
2014 30 June
2014
$’000 $’000
Future minimum rentals receivable for operating leases at reporting date:
Within 1 year 244 308 Later than 1 year and not later than 5 years 1,165 1,165 Later than 5 years 3,913 3,913
5,322 5,386
Operating leases receivable are in respect of property rentals.
25. Remuneration of auditor
Remuneration payable to the Auditor General in respect to the audit for the current financial year is as follows:
30 Sept 2014
30 June 2014
$’000 $’000
Auditing the accounts and financial statements 34 46

Esperance Port Authority 47 Notes to the Financial Statements 26. Related parties
The following persons held the position of Director during the financial period: Robert McKinnon Phil Chalmer Tim Shanahan Kathy Finlayson Kim Horne
There are no transactions in the year with the Directors or other related parties.
27. Contingent liabilities
In addition to the liabilities included in the financial statements, there is the following contingent liability:
The Authority has a contract to load bulk nickel for BHP Billiton Nickel West. Since October 2011 this contract has been frustrated due to the bulk loader no longer being fit for purpose. The Authority is unable to obtain funding to make the bulk loader operational to continue with this trade as it is presently deemed to be unviable. BHP Billiton Nickel West has confirmed a temporary suspension of the current contract with a view to negotiating a new agreement utilising alternative methods. The likelihood of any legal action being taken by BHP Billiton Nickel West for breach of contract is considered to be low and insufficient information is currently available to determine the financial impact.
28. Contaminated Sites Under the Contaminated Sites Act 2003, the Authority is required to report known and suspected contaminated sites to the Department of Environment Regulation (DER).
In accordance with the Act, DER classifies these sites on the basis of the risk to human health, the environment and environmental values. Where sites are classified as contaminated – remediation required or possibly contaminated – investigation required, the Authority may have a liability in respect of investigation or remediation expenses.
During the period the Authority did not report any suspected contaminated sites to DER.

Esperance Port Authority 48 Notes to the Financial Statements 29. Subsequent Events
In February 2012 the State Government announced a number of port related reforms, including the establishment of four regional port authorities one of which is the Southern Ports Authority (SPA) – comprising the ports of Albany, Bunbury and Esperance. The legislation to enact the changes received Royal assent on 20 May 2014. The merger and formation of the Southern Ports Authority was gazetted on 19th September 2014 and came into operation on 1 October 2014. Schedule 8, Clause 2 and 3 of the amended Port Authorities Act 1999 (the Act) designates the Esperance Port Authority as a merging authority, meaning it ceased to be a port authority under the Act and merged into SPA, effective 1 October 2014. This is the final set of financial statements for the Esperance Port Authority as a reporting entity. On the 24 November 2014 the FairWork Commission approved the Southern Ports Authority: Port of Esperance & MUA Enterprise Agreement 2014/17. As a result a backpayment of approximately $360,000 relating to the period 1 January 2014 to 30 September 2014 became payable however this has not been included in this financial report as it is not considered material. Except as disclosed above, there has not arisen in the interval between the end of the period and the date of this report any item, transaction or event of a material and unusual nature likely, in the opinion of the Directors of the Authority, to affect significantly the operations of the Authority, the results of those operations, or the state of affairs of the Authority, in future financial years.

Esperance Port Authority 49 Notes to the Financial Statements
Directors’ Declaration In the opinion of the Directors of Esperance Port Authority (the Authority): (a) the financial statements and notes, set out on pages 1 to 48, are in accordance with the financial
reporting provisions of the Port Authorities Act 1999, including:
(i) giving a true and fair view of the Authority’s financial position as at 30 September 2014 and of its performance for the financial period ended on that date; and
(ii) complying with Australian Accounting Standards (including the Australian Accounting
Interpretations) and the Port Authorities Act 1999. (b) there are reasonable grounds to believe that the Authority will be able to pay its debts as and when they
become due and payable. As stated under Note 1 (c), under legislation changes, on 1 October 2014 the assets and liabilities of the Authority were transferred to the Southern Ports Authority.
Signed in accordance with a resolution of the Directors: Robert McKinnon Tim Shanahan Chairman Deputy Chair / Director
19 December 2014
Esperance

