digital solutions for compliance & ir | eqs group
TRANSCRIPT
ANN
UAL
REP
OR
T 20
19
Annual Report 2019 Infineon Technologies AG
INFI
NEO
N T
ECH
NO
LOG
IES
AG
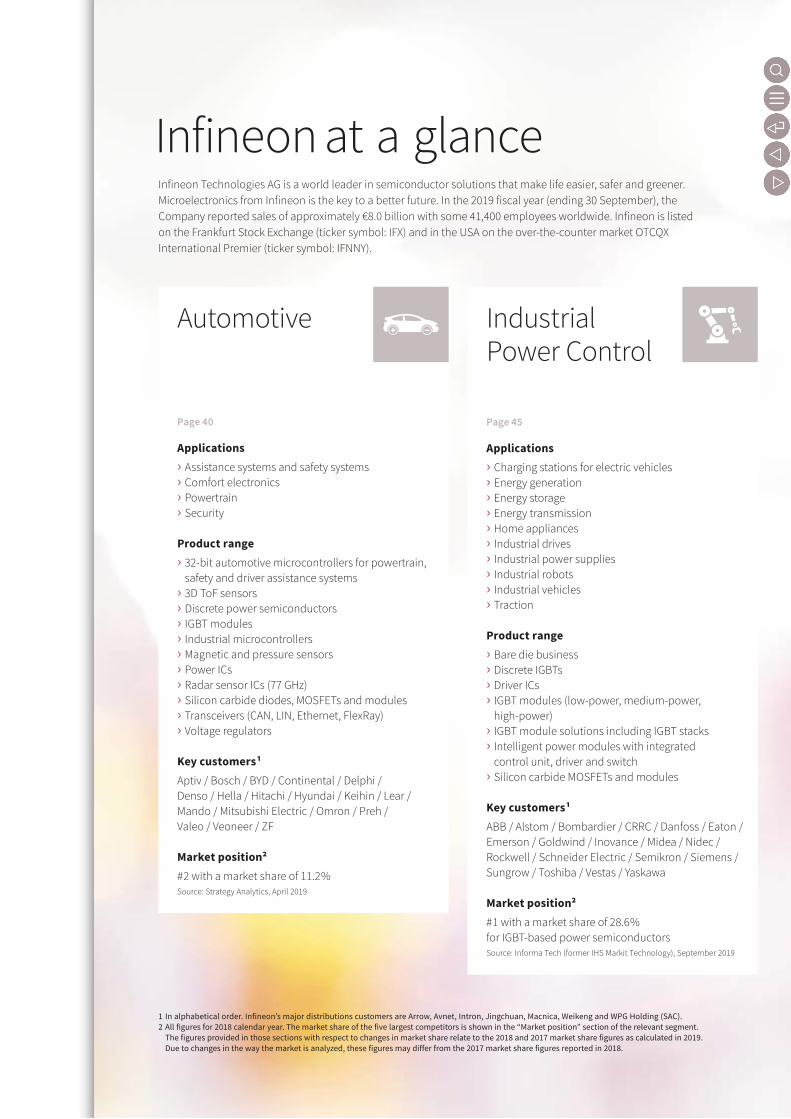
Infineon at a glanceInfineon Technologies AG is a world leader in semiconductor solutions that make life easier, safer and greener. Microelectronics from Infineon is the key to a better future. In the 2019 fiscal year (ending 30 September), the Company reported sales of approximately €8.0 billion with some 41,400 employees worldwide. Infineon is listed on the Frankfurt Stock Exchange (ticker symbol: IFX) and in the USA on the over-the-counter market OTCQX International Premier (ticker symbol: IFNNY).
1 In alphabetical order. Infineon’s major distributions customers are Arrow, Avnet, Intron, Jingchuan, Macnica, Weikeng and WPG Holding (SAC).2 All figures for 2018 calendar year. The market share of the five largest competitors is shown in the “Market position” section of the relevant segment.
The figures provided in those sections with respect to changes in market share relate to the 2018 and 2017 market share figures as calculated in 2019. Due to changes in the way the market is analyzed, these figures may differ from the 2017 market share figures reported in 2018.
Automotive
Page 40
Applications› Assistance systems and safety systems› Comfort electronics› Powertrain› Security
Product range› 32-bit automotive microcontrollers for powertrain,
safety and driver assistance systems› 3D ToF sensors› Discrete power semiconductors› IGBT modules› Industrial microcontrollers› Magnetic and pressure sensors› Power ICs› Radar sensor ICs (77 GHz)› Silicon carbide diodes, MOSFETs and modules› Transceivers (CAN, LIN, Ethernet, FlexRay)› Voltage regulators
Key customers 1Aptiv / Bosch / BYD / Continental / Delphi / Denso / Hella / Hitachi / Hyundai / Keihin / Lear / Mando / Mitsubishi Electric / Omron / Preh / Valeo / Veoneer / ZF
Market position2# 2 with a market share of 11.2 %Source: Strategy Analytics, April 2019
Industrial Power Control
Page 45
Applications› Charging stations for electric vehicles› Energy generation› Energy storage› Energy transmission› Home appliances› Industrial drives› Industrial power supplies› Industrial robots› Industrial vehicles› Traction
Product range› Bare die business› Discrete IGBTs› Driver ICs› IGBT modules (low-power, medium-power,
high-power)› IGBT module solutions including IGBT stacks› Intelligent power modules with integrated
control unit, driver and switch› Silicon carbide MOSFETs and modules
Key customers 1ABB / Alstom / Bombardier / CRRC / Danfoss / Eaton / Emerson / Goldwind / Inovance / Midea / Nidec / Rockwell / Schneider Electric / Semikron / Siemens / Sungrow / Toshiba / Vestas / Yaskawa
Market position2# 1 with a market share of 28.6 % for IGBT-based power semiconductorsSource: Informa Tech (former IHS Markit Technology), September 2019

Power Management & MultimarketPage 49
Applications› Audio amplifier› Cellular infrastructure› Charging stations for electric vehicles› DC motors› HiRel (high-reliability components)› Internet of Things› LED and conventional lighting systems› Mobile devices› Power management (adapters, chargers,
power supplies)
Product range› 3D-ToF sensors› Control ICs› Customized chips (ASICs)› Discrete low-voltage and high-voltage
power MOSFETs› GPS low-noise amplifier› Low-voltage and high-voltage driver ICs› MEMS and ASICs for pressure sensors› MEMS and ASICs for silicon microphones› Radar sensor ICs (24 GHz, 60 GHz)› RF antenna switches› RF power transistors› Silicon carbide diodes› TVS (transient voltage suppressor) diode
Key customers 1Airbus / Alibaba / Amazon / Artesyn / Baidu / Boeing / Cisco / Dell / Delta / Ericsson / Google / Hewlett Packard Enterprise / HP / Huawei / Lenovo / LG Electronics / Lite-On / Makita / Nokia / Osram / Panasonic / Quanta / Samsung / ZTE
Market position2# 1 with a market share of 27.7 % for power MOSFETsSource: Informa Tech (former IHS Markit Technology), September 2019
Digital Security Solutions
Page 52
Applications› Authentication› Automotive› Governmental identification documents› Healthcare cards› Internet of Things› Mobile communications› Payment system, mobile payment› Ticketing, access control› Trusted computing
Product range› Contact-based security controllers› Contactless security controllers› Dual-interface security controllers
(contact-based and contactless)› Embedded security controllers
Key customers 1Giesecke & Devrient / Google / HP / Idemia / Lenovo / Microsoft / Thales / US Government Publishing Office / Watchdata
Market position2# 2 with a market share of 24.3 % for smart card and secure ICsSource: ABI Research, October 2019

Infineon key dataAs of and for the fiscal years ended 30 September (under IFRS) ¹
Fiscal year from 1 October to 30 September 2019 2018 2019/2018
€ in
millionsin % of
revenue€ in
millionsin % of
revenueChange
in %
Revenue by region 8,029 7,599 6
Europe, Middle East, Africa 2,430 30 2,443 32 (1) therein: Germany 1,169 15 1,171 15 (0)
Asia-Pacific (excluding Japan, Greater China) 1,187 15 1,129 15 5
Greater China 2,769 35 2,599 34 7 therein: China 2,159 27 1,921 25 12
Japan 593 7 534 7 11
Americas 1,050 13 894 12 17 therein: USA 862 11 719 9 20
Revenue by segment 8,029 7,599 6
Automotive 3,503 44 3,284 43 7
Industrial Power Control 1,418 18 1,323 17 7
Power Management & Multimarket 2,445 30 2,318 31 5
Digital Security Solutions 642 8 664 9 (3)
Other Operating Segments 21 0 10 0 +++
Corporate and Eliminations – 0 – – –
Gross profit/Gross margin 2,994 37.3 2,885 38.0 4
Research and development expenses (945) 11.8 (836) 11.0 13
Selling, general and administrative expenses (865) 10.8 (850) 11.2 2
Operating income 1,161 1,469 (21)
Income from continuing operations 889 1,218 (27)
Gain (loss) from discontinued operations, net of income taxes (19) (143) 87
Net income 870 1,075 (19)
Segment Result/Segment Result Margin 1,319 16.4 1,353 17.8 (3)
Property, plant and equipment 3,510 3,038 16
Total assets 13,412 10,879 23
Total equity 8,633 6,446 34
Net cash provided by operating activities from continuing operations 1,603 1,571 2
Net cash used in investing activities from continuing operations (2,488) (1,163) – – –
Net cash provided by (used in) financing activities from continuing operations 1,167 (542) +++
Free cash flow 2 39 618 (94)
Depreciation and amortization 945 861 10
Investments 2 1,451 1,254 16
Gross cash position 2 3,779 2,543 49
Net cash position 2 2,223 1,011 +++
Basic earnings per share in € 0.75 0.95 (21)
Diluted earnings per share in € 0.75 0.95 (21)
Adjusted earnings per share in € 3 – diluted 0.89 0.98 (9)
Dividend per share in € 4 0.27 0.27 –
Equity ratio 64.4 % 59.3 %
Return on equity 5 10.1 % 16.7 %
Return on assets 5 6.5 % 9.9 %
Inventory intensity 5 12.7 % 13.6 %
Debt-to-equity ratio 5 18.0 % 23.8 %
Debt-to-total-capital ratio 6 11.6 % 14.1 %
Return on Capital Employed (RoCE) 2 12.2 % 20.5 %
Infineon employees as of 30 September 41,418 40,098 3
1 Columns may not add due to rounding. 2 See the chapter “Internal management system” for definition, P page 63 f.3 See the chapter “Review of results of operations” for definition, P page 72.4 A dividend per share of €0.27 for the 2019 fiscal year will be proposed to the Annual General Meeting on 20 February 2020.5 See the chapter “Review of financial condition” for definition, P page 73.6 Debt-to-total-capital ratio = long-term and short-term debt divided by total assets.

Our year
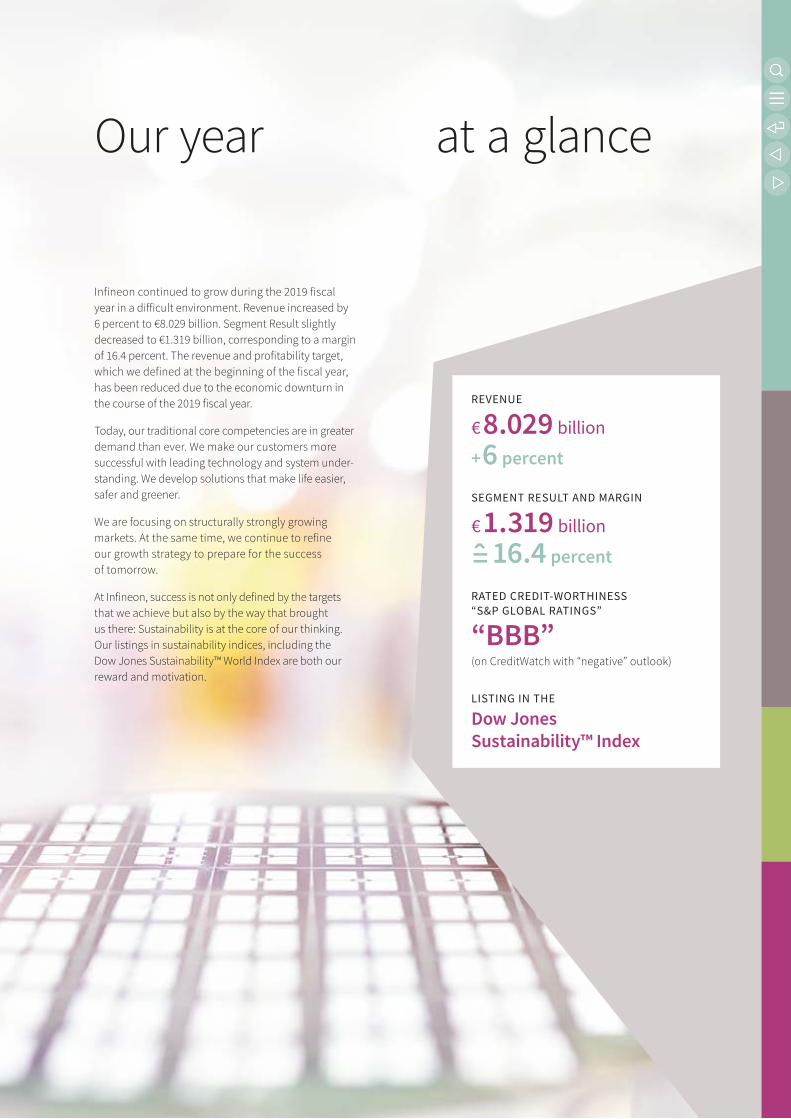
Infineon continued to grow during the 2019 fiscal year in a difficult environment. Revenue increased by 6 percent to €8.029 billion. Segment Result slightly decreased to €1.319 billion, corresponding to a margin of 16.4 percent. The revenue and profitability target, which we defined at the beginning of the fiscal year, has been reduced due to the economic downturn in the course of the 2019 fiscal year.
Today, our traditional core competencies are in greater demand than ever. We make our customers more successful with leading technology and system under-standing. We develop solutions that make life easier, safer and greener.
We are focusing on structurally strongly growing markets. At the same time, we continue to refine our growth strategy to prepare for the success of tomorrow.
At Infineon, success is not only defined by the targets that we achieve but also by the way that brought us there: Sustainability is at the core of our thinking. Our listings in sustainability indices, including the Dow Jones Sustainability™ World Index are both our reward and motivation.
2019
at a glanceOur year
Infineon continued to grow during the 2019 fiscal year in a difficult environment. Revenue increased by 6 percent to €8.029 billion. Segment Result slightly decreased to €1.319 billion, corresponding to a margin of 16.4 percent. The revenue and profitability target, which we defined at the beginning of the fiscal year, has been reduced due to the economic downturn in the course of the 2019 fiscal year.
Today, our traditional core competencies are in greater demand than ever. We make our customers more successful with leading technology and system under-standing. We develop solutions that make life easier, safer and greener.
We are focusing on structurally strongly growing markets. At the same time, we continue to refine our growth strategy to prepare for the success of tomorrow.
At Infineon, success is not only defined by the targets that we achieve but also by the way that brought us there: Sustainability is at the core of our thinking. Our listings in sustainability indices, including the Dow Jones Sustainability™ World Index are both our reward and motivation.
REVENUE
€ 8.029 billion
+ 6 percent
SEGMENT RESULT AND MARGIN
€ 1.319 billion
=̂ 16.4 percent
RATED CREDIT-WORTHINESS “S&P GLOBAL RATINGS”
“BBB” (on CreditWatch with “negative” outlook)
LISTING IN THE
Dow Jones Sustainability™ Index

Content
Management Board and Supervisory Board 2 Letter to shareholders 6 The Management Board 8 Report of the Supervisory Board
to the Annual General Meeting
Combined Management Report
Our Group
16 Finances and strategy 39 The segments 56 Research and development 60 Operations 62 Internal management system 65 Sustainability at Infineon 65 The Infineon share
Our 2019 fiscal year
68 Group performance 79 Report on outlook, risk and opportunity 95 Overall statement on Infineon’s financial condition 96 Infineon Technologies AG 99 Corporate Governance
Consolidated Financial Statements 118 Consolidated Statement of Operations 119 Consolidated Statement of Comprehensive Income 120 Consolidated Statement of Financial Position 121 Consolidated Statement of Cash Flows 122 Consolidated Statement of Changes in Equity 124 Notes to the Consolidated Financial Statements
Further Information 195 Responsibility Statement by the Management Board 196 Independent Auditor’s Report 202 List of Abbreviations 203 Financial calendar 204 Imprint

INFINEON TECHNOLOGIES | ANNUAL REPORT 2019
Management Board and Supervisory BoardLetter to shareholders
2
Neubiberg, November 2019
Infineon has been an independent company for 20 years now. During this time, we have matured into a very solid accomplished company with unique technology competencies, full of plans for shaping the future. In the 2019 fiscal year, important direc-tions were set – in terms of strategy, operations, finance and personnel. Without a doubt, the most significant event is the planned acquisition of Cypress, with which Infineon will evolve into a provider of comprehensive and integrated system solutions, in line with our long-term strategy. Equally forward-looking is the construction of our second 300-millimeter plant for power semiconductors in Villach (Austria), for which the groundbreaking took place about one year ago. The acquisition of Siltectra is another important element that reinforces our leading technology position in the area of silicon carbide.
Infineon always aligns its entrepreneurial actions to a long-term perspective. Our strategy aims at benefitting from the numerous structural growth drivers in our target markets and being successful throughout economic cycles. The previous fiscal year has illustrated that such cycles are inherent in our business: After a boom phase lasting several years, during which industry growth was mainly limited by available manu-facturing capacities, we initially forecast revenue growth of 11 percent. However, geopolitical conflicts and trade tensions cast dark and lasting shadows on the economic outlook at the beginning of the calendar year. Many end-markets experienced a significant slump in demand, and growth momentum was lacking in markets that are important to Infineon:
Letter to shareholders
Dr. Reinhard PlossChief Executive Officer

The automotive industry saw a decline in vehicle sales, the manufacturing industry postponed automation projects and capacity expansions, data center expansions were slowed, end-users held off on purchasing major home appliances. Infineon is not immune to such fluctuations of the world economy, but we stayed our course in an increasingly difficult environment and performed robustly. In March, we had to reduce our revenue target for the year, which we achieved at €8.0 billion. This represents 6 percent more revenue compared to the previous year, which is clearly noteworthy when measured against the development of the semiconductor market as a whole. By way of comparison: The semiconductor association WSTS (World Semiconductor Trade Statistics) expects a decline of semiconductor industry revenues, excluding microprocessors and memory ICs, of 4.2 percent for the 2019 calendar year. Infineon’s stringent exposure towards structural growth drivers in the key areas Energy Efficiency, Mobility, the Internet of Things & Big Data as well as Security is paying off. This is particularly evident during weak economic phases: In the previous fiscal year, we were among the very few companies in our industry to increase our revenue in each quarter compared to the corresponding period of the preceding year.
The resilient nature of the business we developed over the last few years is also illustrated by the margin evolution. At 16.4 percent, the Segment Result Margin was approximately half a percentage point below the through-cycle target value, pretty well for a year characterized by a shrinking overall market. The challenge is not so much in the low level of growth itself, but rather in the process of transitioning to such reduced growth levels from the boom phase to which we had oriented our resources. We timely implemented countermeasures and focused on cost management. We put projects to the test, prudently limited increases in employee headcount and, above all, lowered our manufacturing output to curb rising inventory levels. These steps are all a normal part of cycle management, which we will continue to carefully balance with preserving mid-term and long-term growth opportunities: These opportunities are fully intact, and we are ideally positioned to take advantage of them.
The pillars of our strategy with its clearly defined three elements – core activities; growth in adjacent markets; opportunities in new business areas – provide a strong fundament. In the core element, we have mastered the essential technologies, offer a comprehensive product spectrum, and understand the applications of the target markets. A prime example is power electronics for applications in the automotive industry. The element of supple-mentary growth is built on this, i.e. starting with these competencies we expand into adjacent areas by transferring existing know-how on technologies, products and/or applications and by gaining additional expertise. One such example is variable motor control for industrial applications like factory automation and air conditioners. The third element is innovation for opportunities in new business areas. For example, we use our expertise in sensor technol-ogies to enable more intuitive human-machine-interactions, be it three-dimensional capture with the Time-of-Flight technology, context-sensitive user identification or gesture control based on radar. Our strategic “Product to System (P2S)” approach applies to all three elements of the strategy – core, adjacent and new. Initially the task was to build a deeper system understanding to offer customers components that were better suited to solving their challenges. In the context of shorter and shorter innovation cycles, today and in the future we are enhancing customer value with a complete system offering consisting of seamlessly interoperable, configurable elements, including software, that makes putting together the desired functionalities simple, secure and fast. The performance capabilities of the overall system are increased by functional integration, i.e. consolidation of previously separate sub-functions in a single module (system-in-package) or even on a single chip (system-on-chip), depending on the application. This makes it possible to use smaller form factors and often entails a reduction in power consumption. For the customer this means a simplified design phase, shorter time to market for new products, simplified interoperability and cost savings at the system level.
We intend to accelerate this continuous strategic evolution from a component manufacturer to a provider of system solutions with the planned acquisition of Cypress.
Cypress Semiconductor Corporation was founded in 1982 in San José (USA) and in the years since has become a leading provider of products for automotive and industrial applications and for the Internet of Things. These products include various microcontroller families which are based on the industry-standard Arm® architecture and which can be flexibly programmed with the associated development environment. The second mainstay of Cypress consists of connectivity components, more precisely WiFi and Bluetooth/Bluetooth low energy for wireless and USB/USB-C for wired applications. In addition to this, Cypress offers differentiated memory technologies such as NOR flash, SRAM and F-RAM, which for the most part address special applications. We gained conviction regarding the high level of technological expertise of Cypress from a joint development cooperation we started in early 2018.
3
INFINEON TECHNOLOGIES | ANNUAL REPORT 2019
Management Board and Supervisory Board Letter to shareholders

How will we benefit from Cypress, what is the rationale behind the largest planned acquisition in the history of Infineon? What are the reasons why we intend to spend approximately €9 billion in economically unstable times?
› The products and technologies of Infineon and Cypress are highly complementary and define standards in their respective fields. Our power semiconductors, sensors and our microcontrollers for automotive and security applications will be supplemented with connectivity, general purpose microcontrollers for industrial and Internet of Things applications including software, and differentiated memory.
› Together this will lead to a comprehensive portfolio of complete system solutions. Secure connectivity of energy-efficient devices is the key to success. A wide variety of applications is at the tipping point of growth phases that can be addressed with functional integration.
› We are moving our strategic P2S approach forward, strengthening and expanding our core through growth in adjacent and new fields. Two examples: The consolidation of Infineon’s security expertise with the connectivity know-how of Cypress will accelerate the entry into the field of new industrial Internet of Things applications. The expanded portfolio of microcontrollers and NOR flash memory offers great potential for automotive semiconductors, especially with regard to their growing significance for advanced driver assistance systems and new electronic architectures in the vehicle.
› The two companies also complement one another in areas other than their product portfolios. This is true of the geographic focus areas and sales channels: Cypress will thus bring Infineon broader market access, in particular in Japan and through distributors. We are expanding our position in Silicon Valley in terms of research and devel-opment. With regard to its manufacturing strategy, its product portfolio lets Cypress resort considerably more to outsourcing. The combination will help to deploy our business more broadly and make it more robust.
Together with Cypress, we will be able to address the application spectrum in our target markets in a more compre-hensive way. We will be able to offer system solutions needed for connecting the real with the digital world. This strategic rationale is mirrored by financial attractiveness, as we can accelerate our profitable growth. We expect the transaction to have a positive impact on the development of the Segment Result and adjusted earnings per share from the 2021 fiscal year onwards. This entails expected annual cost synergies of €180 million, which are expected to arise by the 2022 fiscal year primarily as a result of scale effects. However, more decisive for value creation are the revenue synergies derived from system thinking, which will be realized through cross-selling and the consolida-tion of the complementary portfolios into system solutions. We estimate these effects at more than €1.5 billion annually in the long-term. On closing of the acquisition, we will adjust our target operating model. During the inte-gration process, we will leverage more and more of the synergies and meet our targets: By then, we expect revenue growth through the cycle for the larger, combined company to be slightly above our current target rate of 9 percent. The Segment Result Margin is to increase through the cycle from 17 percent to 19 percent. The investment-to-sales ratio will drop through the cycle from 15 percent to 13 percent because of the lower capital intensity of Cypress.
Infineon has grown tremendously in the past few years, and certainly in more respects than just revenue and profit. Approximately five years after buying International Rectifier, we are facing an acquisition easily more than three times larger. We trust that we will succeed, and the outside world puts trust in us. Right now, the Infineon and Cypress teams are intensively preparing the integration, and we are confident regarding pending regulatory approvals and the completion of the transaction around the end of this year. The fact that Infineon is appreciated as a solid trust-worthy company also when taking courageous actions has become visible in the steps taken to finance the acquisi-tion: Based on the clear principle of maintaining our investment grade rating, the credit facility for the planned acquisition financing was syndicated within a very short period of time to a consortium of national and international banks. The syndication was significantly oversubscribed, as was the case with the capital increase, where we placed shares with a total value of about €1.5 billion in mid-June. In September, we for the first time issued a hybrid bond, achieving a volume of €1.2 billion. Thus, within only a few months we were already able to refinance approximately one third of the entire transaction. We are very pleased about the support Infineon received from shareholders, bond investors and banks. Broad access to sources of financing is and will remain important to Infineon; at the same time, we are aware of the volatility of financial markets. We are therefore adhering to our strategic liquidity target, are increasing our leverage commensurate with the cash generation of the combined company and are maintaining our dividend policy. Accordingly, we will once again recommend to the Annual General Meeting the payment of a dividend of 27 euro cents per share for the fiscal year ended. Given the higher share count, the total amount to be disbursed would increase from €305 million for the 2018 fiscal year to €336 million.
4
INFINEON TECHNOLOGIES | ANNUAL REPORT 2019
Management Board and Supervisory Board Letter to shareholders

Continuity and change, this duo characterizes our strategy and our business. We build on what we do well and constantly expand our capabilities. Thus in the short term, we want to hold up well in a still challenging market environment, while taking advantage of medium-term and long-term growth potentials. The economic situation remains tense, and the yet unresolved trade conflicts are a burden. Infineon clearly supports free global trade with low customs tariffs and minimal trade barriers. Accordingly, we hope the protectionist tendencies will not ultimately win out. Until then we will manage everything under our control in order to keep costs tight and to be able to react flexibly when the economic situation begins to recover. However, we expect such recovery for our markets not before the second half of the 2020 fiscal year. This expectation is baked into our outlook, hence we expect revenue growth of 5 percent plus/minus 2 percentage points. At the midpoint of this growth range, the Segment Result Margin should be around 16 percent. We are once again planning on investments of approximately €1.3 billion. Cypress is not yet included in either of these planned figures.
Continuity and change can also describe the past year’s personnel developments in the Supervisory and Manage-ment Boards. Dr. Eckart Sünner took over as temporary Chairman of the Supervisory Board after the 2018 Annual General Meeting. With his extensive experience, he has supported Infineon in this capacity with vigilance and expertise through approximately one and a half very eventful years and has played a particularly decisive role with regard to the Cypress transaction. Mr. Sünner will retire from the Board at the conclusion of the 2020 Annual General Meeting for reasons of age. Until then he will remain chairman of the Investment, Finance and Audit Com-mittee and will have been a member of the Infineon Supervisory Board for a total of 13 years. I would like to take this opportunity to express my personal gratitude for this always very close cooperation. The Supervisory Board elected Dr. Wolfgang Eder as its Chairman at its meeting of 6 August 2019. Dr. Eder’s entrepreneurial experience and high-profile person ality will help shape the future strategic course of the Company, and I look forward to continuing to work together with him. There was also a change in the Chief Financial Officer position. Dominik Asam left the Infineon Management Board as of 31 March 2019 and became Chief Financial Officer at Airbus SE on 1 April 2019. Dominik Asam worked at Infineon in a variety of roles and as a member of the Management Board since his return to Infineon in 2011. With his profound understanding of financial markets, he was able to make an essential contri-bution to ensuring Infineon’s excellent financial position today. I wish Dominik all the best in his new assignment and all the best for his personal future! At the same time, I am very pleased to welcome Dr. Sven Schneider as again a seasoned financial expert, who joined the Management Board team as of 1 May 2019 from Linde AG. Sven Schneider passed his trial-by-fire at Infineon by skillfully mastering the financing of the planned Cypress acquisition. His expertise and personality will help us shape our future path successfully. I myself am also very pleased to continue to help chart this course as CEO in the future. I would like to personally thank the Supervisory Board for placing its confidence in me and extending my contract until 2022. I will continue to serve Infineon with full dedication.
Infineon is developing more than just technology. We have given ourselves a goal and a purpose that will lead us on our way into the future, a journey we have successfully pursued for quite some time. We want to have a lasting impact on creating a more resource-efficient, more connected and more secure future. The next technology generation has to help make more from less in order to make it possible for the growing number of people in the world to live a better life in harmony with nature and thus in harmony with one another. One element is responsible accountability for our actions; developing leading technologies is another. Accepting this challenge and continuing to write our success story is only possible thanks to the enormous dedication, enthusiasm and expertise of our employees, whom I would like to thank personally and in the name of the entire Management Board. Together with our new colleagues from Cypress, we will continue to grow successfully.
Dr. Reinhard PlossChief Executive Officer
5
INFINEON TECHNOLOGIES | ANNUAL REPORT 2019
Management Board and Supervisory Board Letter to shareholders

Jochen Hanebeck Chief Operations Officer
Jochen Hanebeck has been a member of the Management Board and Chief Operations Officer of Infineon Technologies AG since 2016. He is responsible for Operations, including Manufacturing, Logistics, Quality, Customs and Purchasing.
Jochen Hanebeck was born on 2 February 1968 in Dortmund. He received a degree in electrical enginee- ring from RWTH Aachen University. He has been with Infineon since 1994 (Siemens AG until 1999).
Dr. Sven Schneider Chief Financial Officer
Sven Schneider has been a member of the Manage-ment Board and Chief Financial Officer at Infineon Technologies AG since 2019. He is responsible for Accounting & Reporting, Financial Controlling, Financial Planning, Investor Relations, Tax, Treasury, Audit, Compliance, Export Control, Risk Management, Business Continuity and Information Technology.
Sven Schneider was born on 21 March 1966 in Berlin. After completing a banking apprenticeship, he studied business administration (Diplom-Kaufmann) at the Universities of Regensburg, Nantes (France) and Trier. Subsequently, he received his doctorate in political science from the University of Trier. In 1995, he began his professional career at Linde AG in the finance depart-ment. From 2000 to 2019, he has held leading positions at Linde, most recently as Spokesman of the Executive Board, Chief Financial Officer and Labor Director.
Dr. Helmut Gassel Chief Marketing Officer
Helmut Gassel has been a member of the Manage- ment Board and Chief Marketing Officer of Infineon Technologies AG since 2016. He is responsible for Sales & Marketing, Regions, Strategy Development, Mergers & Acquisitions and Intellectual Property.
Helmut Gassel was born on 13 March 1964 in Dortmund. He holds a Diploma in physics from the Ruhr-University in Bochum. He received his PhD in electrical engineering from the University of Duisburg. He joined Infineon (Siemens AG until 1999) in 1995.
Dr. Reinhard Ploss Chief Executive Officer
Reinhard Ploss has been a member of the Management Board of Infineon Technologies AG since 2007. He has been Chief Executive Officer since 1 October 2012, responsible for Segments, Group Strategy, Communi-cations & Government Relations, Human Resources (Labor Director), Legal, Research and Development.
Reinhard Ploss was born on 8 December 1955 in Bamberg. He studied process engineering at the Technical University of Munich and received his doctorate in 1990. He began his career at Infineon in 1986 (Siemens AG until 1999).
The Management Board
6
INFINEON TECHNOLOGIES | ANNUAL REPORT 2019
Management Board and Supervisory Board The Management Board
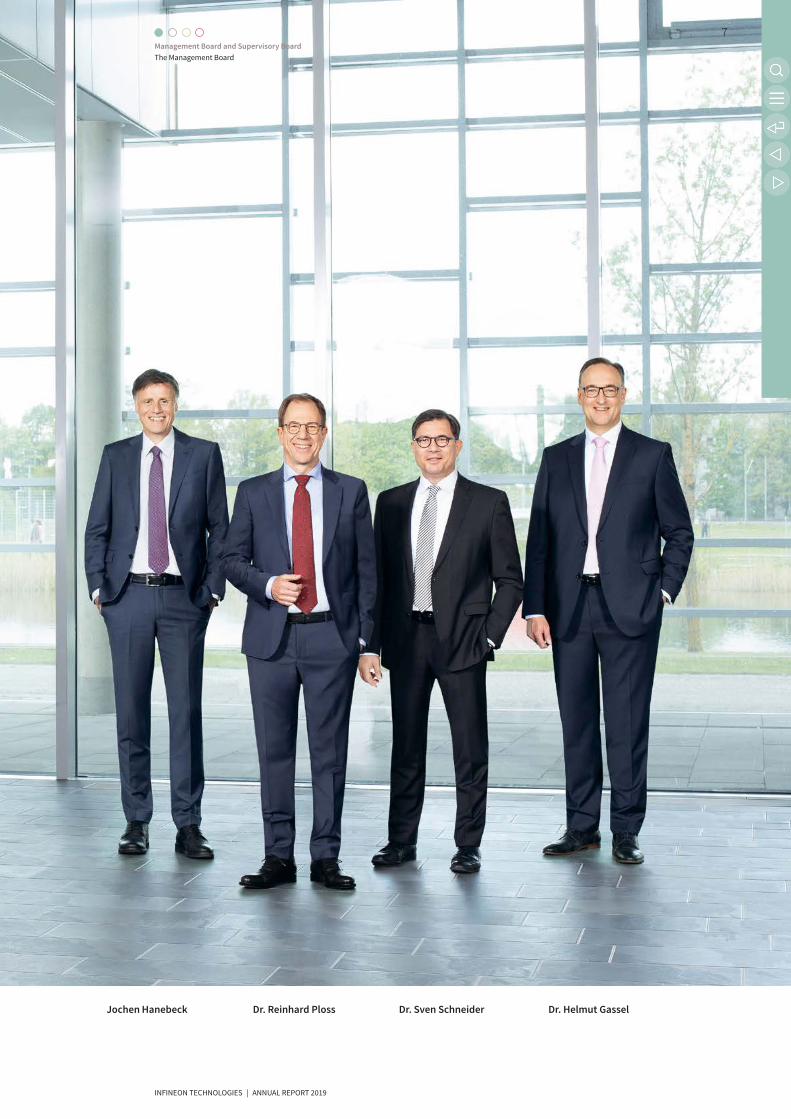
Jochen Hanebeck Dr. Reinhard Ploss Dr. Sven Schneider Dr. Helmut Gassel
7
INFINEON TECHNOLOGIES | ANNUAL REPORT 2019
Management Board and Supervisory Board The Management Board

The 2019 fiscal year was undoubtedly a special one, in which Infineon embarked on the largest acquisition in its corporate history, thereby sending out a strong strategic signal. The planned takeover of the US-based Cypress Semiconductor Corporation not only broadens the company’s range of core competencies, it simultaneously opens up additional growth potential. The Supervisory Board is fully committed to the transaction – despite the ongoing macroeconomic headwinds. Like the Management Board, it is of the opinion that Infineon’s structural growth drivers remain compelling and will gather renewed momentum as the global economy recovers. For Infineon, therefore, the right course of action is to prepare for the next upturn by implementing a range of measures, including strategically challenging projects such as the Cypress takeover, and rigorously continue pursuing its goal of sustainable, profitable growth.
The past fiscal year was also marked by important decisions affecting the composition of Infineon’s executive bodies. Firstly, Dr. Reinhard Ploss will remain Chairman of the Management Board for a further three years. Sec-ondly, Infineon has gained an acclaimed Chief Financial Officer in the person
of Dr. Sven Schneider. Last but not least, in my new role as Chairman of the Supervisory Board, I look forward with pleasure to the honor of working with my colleagues on the Supervisory Board and the Management Board and to helping write the next chapter in Infineon’s success story. At the same time, on behalf of the entire Supervisory Board, I wish to take this opportunity to thank my predecessor, Dr. Eckart Sünner, for his circumspect and profes-sional chairmanship of the Supervisory Board throughout his tenure.
Main activities of the Supervisory Board
During the 2019 fiscal year, the Supervisory Board again performed its duties with the greatest of diligence in accor-dance with the law, the Company’s statutes and its own terms of reference. It both advised and supervised the Management Board, mainly on the basis of detailed written and oral reports presented by the Management Board at Supervisory Board and committee meetings covering matters such as current business performance, significant transactions, macroeconomic developments, the quarterly financial reports and corporate planning. The Manage-ment Board discussed and coordinated corporate strategy as well as key operational issues in collaboration with the Supervisory Board, which was always given ample opportunity to thoroughly examine any reports and proposed resolutions drawn up by the Management Board. On all occasions, the Supervisory Board was able to assure itself that the governance of Infineon’s corporate affairs was lawful, compliant and appropriate.
Report of the Supervisory Board to the Annual General Meeting
Dr. Wolfgang EderChairman of the Supervisory Board
8
INFINEON TECHNOLOGIES | ANNUAL REPORT 2019
Management Board and Supervisory Board Report of the Supervisory Board to the Annual General Meeting

The Supervisory Board was provided with written quarterly reports on Infineon’s business performance, key financial data, risks and opportunities, major areas of litigation and other topics of importance. Between quarterly reports, the Management Board kept the Supervisory Board well informed of current developments in the form of monthly reports.
Throughout the fiscal year under report, the Chairman of the Supervisory Board (initially Dr. Eckart Sünner and then myself, following the change of chairmanship in August 2019) remained in regular contact with both the Chair-man and the other members of the Management Board. The Chairman of the Management Board always informed us without delay of any events of significance for Infineon, both during and between regular Supervisory Board meetings.
In the 2019 fiscal year, the full Supervisory Board met nine times (five ordinary and four extraordinary meetings; the latter included three in the form of telephone conferences). One resolution was also passed on the basis of written communication. Measured in relation to these various proceedings for all members of the Supervisory Board, total attendance averaged nearly 92 percent. Dr. Herbert Diess was excused from five meetings, Prof. Renate Köcher from three meetings, Dr. Manfred Puffer from two meetings and Ms. Géraldine Picaud and Mr. Hans-Ulrich Holdenried from one meeting each. Attendance at Supervisory Board committees was just over 97 percent; Mr. Holdenried excused himself from one meeting of the Strategy and Technology Committee and one meeting of the Executive Committee. Details of the individual attendance record of Supervisory Board members is provided in the Statement on Corporate Governance. @ www.infineon.com/declaration-on-corporate-governance
Corporate strategy and the planned acquisition and financing of CypressThe Infineon Supervisory Board is committed to closely supporting the Management Board in the conception and implementation of corporate strategy. Not least due to this commitment, in addition to the periodic meetings of the Strategy and Technology Committee, a meeting of the full Supervisory Board was again held during the fiscal year under report for the exclusive purpose of dealing with strategic issues. At that meeting we discussed the general development of the semiconductor industry, markets and trends, external conditions, risks, the competitive environ-ment and potential acquisition options as well as Infineon’s strategic market positioning and orientation.
The dominant topic and the reason for several of the extraordinary meetings held during the past fiscal year was the planned acquisition of Cypress and the financing thereof. After comprehensively discussing and weighing up the opportunities and risks, the Supervisory Board concluded that the planned acquisition represents a significant strategic step in Infineon’s further development and one that is fully in line with its long-term strategy. The product portfolios and competencies of Infineon and Cypress complement each other ideally and create an even stronger, broader base for the Group in key markets of the future. Taking all the circumstances into account, in view of the opportunities for Infineon arising from the planned acquisition, both the Supervisory Board and the Management Board consider the purchase price appropriate. The Management Board also presented the Supervisory Board with a solid and prudently calculated financing concept, including a range of refinancing options, all geared to maintaining Infineon’s investment grade rating. Against this backdrop, at its meeting on 2 June 2019, the Supervisory Board approved the planned acquisition and the key financing parameters.
The financing concept also includes a substantial equity component. Without delay, the Management Board pro-ceeded to implement two specific financing measures. Firstly, a share capital increase out of Authorized Capital was executed in June 2019, involving the issuance of around 113 million new shares generating net proceeds of approximately €1.5 billion. Secondly, in October 2019 Infineon issued a hybrid bond for €1.2 billion, significantly increasing the equity capital component of the financing without further diluting the shareholders’ interests by issuing additional shares. Given the magnitude of the financing requirements, the Supervisory Board deemed it of utmost importance to be closely involved in these measures. For that reason, it decided not merely to leave the monitoring and approval of decisions regarding the share capital increase and the hybrid bond to the Investment, Finance and Audit Committee, which is responsible for these specific issues, but also to address them in two extraordinary meetings of the full Supervisory Board, which were held on 12 June and 11 September 2019, respec-tively. The Investment, Finance and Audit Committee then granted its definitive approval of the share capital increase and the hybrid bond.
9
INFINEON TECHNOLOGIES | ANNUAL REPORT 2019
Management Board and Supervisory Board Report of the Supervisory Board to the Annual General Meeting

Personnel matters relating to the Management BoardNew Chief Financial Officer Towards the end of 2018, the former Chief Financial Officer, Mr. Dominik Asam, informed the Supervisory Board of his intention to take up a new position at Airbus SE, also in the function of CFO, with effect from 1 April 2019. The Supervisory Board complied with this request with great regret. Mr. Asam had held various positions at Infineon, including the role of CFO since 2011. He made a significant contribution to Infineon’s success, particularly due to his financial market expertise. On behalf of the Supervisory Board, I would like to express my sincere thanks to Mr. Asam for his excellent work and wish him all the best in his new professional environment.
Immediately after Mr. Asam informed the Supervisory Board of his plans, it initiated a structured process to find a successor, enlisting the services of a well-known external human resources consultant. During the selection process, both external candidates and internal applicants were assessed. Following a number of interviews and in-depth discussions within both the Executive Committee and the full Supervisory Board, the decision was taken to appoint Dr. Sven Schneider as Chief Financial Officer with effect from 1 May 2019. The initial mandate and service contract were agreed upon for a term of three years. Dr. Schneider was most recently Spokesman of the Executive Board, Chief Financial Officer and Labor Director at Linde AG. His work to date on the planned Cypress acquisition alone has already proved that his expertise and wealth of experience will make a significant contribution to Infineon’s continued success.
Continuity in the chairmanship of the Management BoardDuring the year under report, the Supervisory Board decided that Dr. Ploss, the current Chairman of the Management Board, should continue to head up Infineon until the end of 2022. His mandate and service contract were due to expire on 30 September 2020. On behalf of the Supervisory Board, I wish to thank Dr. Ploss for the decisive role he has played in charting Infineon’s successful course in his seven years as Chairman of the Management Board to date.
Management Board compensationIn accordance with section 4.2.2 of the German Corporate Governance Code (DCGK), the Supervisory Board regularly engages an external, independent compensation expert to review Infineon’s Management Board compensation system and examine its compliance with applicable legislation as well as its overall appropriateness. The most recent system review was conducted in 2016. During the 2018 fiscal year, the Supervisory Board again engaged an external compensation expert to assess Infineon’s system as well as the target annual incomes of the members of the Management Board. The expert concluded that the compensation system complies both with legal require-ments and with the recommendations contained in the DCGK. In particular, the expert concluded that the compen-sation of Infineon’s Management Board is commensurate with market conditions and that the variable compensation component is oriented towards the sustainable growth of the company. In addition, the target annual incomes of the members of the Management Board were deemed appropriate in all material respects, notwithstanding the existence of some scope for maneuverability. The results of the compensation expert’s review were discussed in detail at the Executive Committee meeting held on 25 October 2018 and by the full Supervisory Board on 20 November 2018. The Supervisory Board concurs with the compensation expert’s assessment.
Management Board compensation and the related reporting requirements are currently the subject of various regulatory initiatives. For instance, a draft law, which is currently undergoing parliamentary scrutiny, relating to the implementation of the second Shareholder Rights Directive (ARUG II) is expected to come into force at the beginning of 2020. Furthermore, the Government Commission on the German Corporate Governance Code has adopted a new version of the DCGK, which is to take effect to coincide with ARUG II coming into force. The Supervisory Board has observed these developments very closely over a lengthy period and is already making detailed preparations for the expected changes. However, in the opinion of the Supervisory Board, a definitive analysis, above all of the need for action with regard to the existing Management Board compensation system, can only be performed once the new regulatory framework has been definitively established, i.e. ARUG II has come into force and the revised DCGK taken effect. The Supervisory Board therefore intends to make any changes to the Management Board compensa-tion system that may be necessary in the course of 2020 and to present a revised version to shareholders at the 2021 Annual General Meeting.
10
INFINEON TECHNOLOGIES | ANNUAL REPORT 2019
Management Board and Supervisory Board Report of the Supervisory Board to the Annual General Meeting

For the third time, a tranche of performance shares became due for settlement at the beginning of October 2019. As the specified performance hurdle was not achieved, only 50 percent of the tranche allocated in 2015 was required to be fulfilled at the end of the four-year holding period. Unlike in the two preceding years, the tranche was not settled in cash but in the form of shares, as generally stipulated in the relevant service contracts.
Details of Management Board compensation – in particular the amounts paid to individual members in the 2019 fiscal year – are available in the comprehensive Compensation report, which is contained in the Annual Report.
Litigation The Supervisory Board was regularly provided with detailed information regarding major legal disputes during the 2019 fiscal year, which were then thoroughly discussed with the Management Board. These included in particular the Company’s appeal, brought before European courts, against an antitrust fine imposed by the EU Commission in 2014, subsequent proceedings relating to that appeal, and the dispute with the insolvency administrator of Qimonda AG pertaining to alleged residual liability claims.
Composition of the Supervisory Board; committee work
Composition of the Supervisory Board and change in its chairmanshipAt its meeting held on 6 August 2019, the Infineon Supervisory Board elected me to succeed Dr. Eckart Sünner as its new Chairman. Dr. Sünner succeeded Wolfgang Mayrhuber as Chairman in February 2018. At the most recent Annual General Meeting, Dr. Sünner announced his intention to step down as Chairman in summer 2019. He will continue to serve Infineon as a regular member of the Supervisory Board and as Chairman of the Investment, Finance and Audit Committee until the Annual General Meeting in 2020. On behalf of the Supervisory Board, I would like to thank Dr. Sünner for supporting Infineon so expertly and calmly with his wealth of experience throughout his exciting 18-month tenure. I personally look forward to taking on my new responsibilities as Chairman of the Super-visory Board in this dynamic, innovative company, which has great opportunities for the future.
The mandates of the employee representatives on the Supervisory Board are due to expire at the end of the Annual General Meeting to be held in February 2020. The mandates of six of the eight shareholder representatives also expire at the same time. New employee representatives are due to be elected by the end of December 2019. The election of shareholder representatives will be an item on the agenda of the 2020 Annual General Meeting.
Committee workThe committees are responsible for drawing up resolutions and preparing other important projects and topics that need to be dealt with by the full Supervisory Board. Certain decision-making powers have been delegated to the committees, to the extent permitted under German law. The chairpersons of each committee routinely report on committee meetings at the next relevant full Supervisory Board meeting.
Mediation CommitteeThe Mediation Committee did not need to convene during the 2019 fiscal year.
Nomination CommitteeThe Nomination Committee convened twice during the 2019 fiscal year, intensively deliberating on the topic of long- term succession planning for the Supervisory Board. In preparation for the upcoming election of six shareholder representatives at the 2020 Annual General Meeting, it discussed the re-election of Supervisory Board members and the suitability of new candidates. In its search for and assessment of candidates, the Committee took particular account of the competence profile and the catalog of objectives decided on by the Supervisory Board for its own composition, drawing on the support of a renowned external human resources consultant to reach its decisions.
P see page 103 ff.
11
INFINEON TECHNOLOGIES | ANNUAL REPORT 2019
Management Board and Supervisory Board Report of the Supervisory Board to the Annual General Meeting

Executive CommitteeThe Executive Committee held one ordinary and two extraordinary meetings during the year under report. In addition, it made three resolutions on the basis of written communication.
The ordinary meeting focused on preparing the Supervisory Board’s resolutions with respect to determining the level of the Management Board’s variable compensation. The main aspects of this work were to determine the degree to which targets for the 2018 fiscal year were achieved and to set new targets for the 2019 fiscal year.
The extraordinary meetings dealt primarily with the departure of former CFO Dominik Asam and the succession procedures, including the proposal to appoint Dr. Schneider.
Investment, Finance and Audit CommitteeThe Investment, Finance and Audit Committee held four ordinary and three extraordinary meetings during the 2019 fiscal year.
Its activities centered on monitoring the financial reporting process, reviewing the half-year and quarterly financial statements, conducting the preliminary audit of the Separate Financial Statements, Consolidated Financial State-ments and Combined Management Report for both Infineon Technologies AG and Infineon, and discussing the audit reports with the auditor. In addition, the committee examined the financial and investment budget. Furthermore, it considered the effectiveness of the internal control, internal audit, risk management and compliance manage-ment systems. The Committee’s members also received reports from the Compliance Officer on a regular basis as well as continuous updates on significant legal disputes.
The Committee’s recommendation to the full Supervisory Board to propose to shareholders at the 2019 Annual General Meeting that KPMG AG Wirtschaftsprüfungsgesellschaft, Munich, (“KPMG”) be elected as Company and Group auditor was based on a Declaration of Independence obtained from KPMG as well as an analysis of the non-audit services provided by KPMG. There were no indications of conflicts of interest, grounds for exclusion, or lack of independence in any other respect on the part of the auditor. The recommendation was also based on the committee’s confirmation that its recommendation was free from undue influence by third parties and that it had not been subject to any restriction regarding the selection of auditors within the meaning of section 16, para-graph 6 of the EU Statutory Audit Regulation. The committee also considered the fee arrangements and issued contracts for the relevant audit engagements. In addition, supplementary areas for audit emphasis were defined.
The most important single project arising for the Committee during the 2019 fiscal year was the financing of the planned acquisition of the US-based company Cypress, in particular determining matters relating to the required share capital increase and the supplementary hybrid bond. Based on a corresponding authorization granted by the full Supervisory Board, the Committee approved the share capital increase in two extraordinary meetings on 17 June 2019 and the placement of the hybrid bond in another extraordinary meeting on 25 September 2019.
The auditor attended the ordinary meetings of the Investment, Finance and Audit Committee and reported in detail on the audit activities performed.
Strategy and Technology CommitteeThe Supervisory Board’s Strategy and Technology Committee convened three times during the fiscal year under report. The Management Board provided it with detailed information about non-organic growth opportunities through M&A activities and, in this context, also about the risks regarding the necessary approvals from the antitrust and other authorities. Information on the operations of individual segments, such as Power Management & Multimarket and Digital Security Solutions, was also provided in the form of in-depth presentations. A further topic of discussion was the reorganization of the Human Resources function across the Group, particularly in the context of changing requirements for employee training and vocational qualifications. Last but not least, the strategic assessment of the planned Cypress acquisition was a major topic of Committee deliberations.
12
INFINEON TECHNOLOGIES | ANNUAL REPORT 2019
Management Board and Supervisory Board Report of the Supervisory Board to the Annual General Meeting

Corporate Governance
Declaration of Compliance 2019In the Declaration of Compliance issued in November 2018, the Management Board and Supervisory Board declared a deviation from section 5.3.2, paragraph 3, sentence 3 DCGK according to which the Chairman of the Supervisory Board should not additionally chair the Audit Committee. The reason for this deviation was that the Chairman of the Investment, Finance and Audit Committee, Dr. Eckart Sünner, was also elected Chairman of the Supervisory Board at the meeting of the Supervisory Board on 22 February 2018. The deviation was ended with his resignation from the position as Chairman of the Supervisory Board at the Supervisory Board meeting held on 6 August 2019. The Declaration of Compliance was updated accordingly in August 2019.
In the Declaration of Compliance dated November 2019, the Management Board and the Supervisory Board jointly declared that Infineon Technologies AG has complied with all the recommendations made by the DCGK in the version dated 7 February 2017 and will continue to do so in the future.
The original versions of the Declarations of Compliance are available on Infineon’s website. @ www.infineon.com/cms/en/about-infineon/investor/corporate-governance/declaration-of-compliance/
Efficiency examination for Supervisory Board activitiesThe Supervisory Board examines the efficiency of its activities on an annual basis. The examination for the 2017 fiscal year was performed with the assistance of an external, independent consultant. In both the 2018 and 2019 fiscal years, the examination was based on a structured questionnaire. The examination provided a positive picture of the work of the Supervisory Board and its collaboration with the Management Board. No noteworthy shortcomings were identified.
Examination of potential conflicts of interestThe members of the Management Board and the Supervisory Board are required to disclose any conflicts of interest to the Supervisory Board without delay. No conflicts of interest were disclosed by members of either the Management Board or the Supervisory Board in the 2019 fiscal year.
Prior to members of the Management Board assuming sideline activities, particularly supervisory board mandates outside the Company, the DCGK requires that permission be given by the Supervisory Board. No conflicts of interest were discernible in the mandates assumed.
Further information on corporate governance can be found in the Statement on Corporate Governance, which also contains the Corporate Governance Report. @ www.infineon.com/declaration-on-corporate-governance
Rules of procedureThe rules of procedure for the full Supervisory Board, the Investment, Finance and Audit Committee of the Super-visory Board and the Management Board are available on the Infineon website. @ www.infineon.com/cms/en/about-infineon/investor/corporate-governance/articles-of-association/
Separate and Consolidated Financial Statements
KPMG audited the Separate Financial Statements of Infineon Technologies AG and the Consolidated Financial Statements as of 30 September 2019 as well as the Combined Management Report for Infineon Technologies AG and the Infineon Group, and issued unqualified audit opinions thereon.
The Half-Year Financial Report was also reviewed by KPMG. No issues were identified that might indicate that the abridged Interim Group Financial Statements and Interim Group Management Report had not been prepared in accordance with the applicable provisions in all material respects.
13
INFINEON TECHNOLOGIES | ANNUAL REPORT 2019
Management Board and Supervisory Board Report of the Supervisory Board to the Annual General Meeting

KPMG has audited the Separate Financial Statements of Infineon Technologies AG and the Consolidated Financial Statements of the Group and reviewed the Interim Financial Statements of the Group since the 1999 fiscal year (short fiscal year from 1 April 1999 to 30 September 1999). Prof. Dr. Andrejewski signed the auditors’ report for the first time for the 2019 fiscal year (1 October 2018 to 30 September 2019) and Mr. Pritzer for the first time for the 2017 fiscal year (1 October 2016 to 30 September 2017).
At the meeting of the Investment, Finance and Audit Committee held on 11 November 2019 and continued in a telephone conference on 18 November 2019, intensive discussions were held with the auditor regarding the Separate Financial Statements, the Consolidated Financial Statements, the Combined Management Report, the proposed profit appropriation, and the auditor’s findings. The committee deliberated at length on the key audit matters and on the related audit procedures performed by the auditor. The Investment, Finance and Audit Committee resolved to propose to the Supervisory Board that the financial statements drawn up and presented by the Management Board be approved and the proposed profit appropriation agreed to.
The Separate Financial Statements, the Consolidated Financial Statements, the Combined Management Report, the Management Board’s proposal for the appropriation of unappropriated profit (all prepared by the Management Board) and KPMG’s long-form audit reports were all made available to the Supervisory Board at the meeting held on 22 November 2019. At this meeting, the Chairman of the Investment, Finance and Audit Committee reported in depth on the corresponding recommendations of the Committee. In addition, all material issues relevant to the financial statements and the audit, including key audit matters, were discussed in detail with the auditor and examined by the Supervisory Board. The examination also covered the proposal to pay a dividend of €0.27 per entitled share.
The Supervisory Board concluded that it has no objections to the financial statements and the audits performed by the auditor. In its opinion, the Combined Management Report complies with legal requirements. Likewise, the Supervisory Board concurs with the assertions regarding Infineon’s future development made therein. The Supervisory Board therefore concurred with the results of the audit and approved the Separate Financial State-ments of Infineon Technologies AG and the Consolidated Financial Statements of Infineon. The Separate Financial Statements were accordingly adopted. The Supervisory Board also approved the Management Board’s proposal for the appropriation of unappropriated profit.
In conjunction with the presentation of the sustainability report, the Investment, Finance and Audit Committee and the full Supervisory Board also deliberated on the separate non-financial report of Infineon Technologies AG (Company and Group) from 30 September 2019, which was drawn up by the Management Board. KPMG performed a “limited assurance” review of these reports and issued an unqualified statement thereon. The documents were carefully examined by the Investment, Finance and Audit Committee at its meeting held on 11 November 2019, which was continued in a telephone conference on 18 November 2019, and by the Supervisory Board at its meeting on 22 November 2019. The Supervisory Board acknowledged and approved the separate non-financial report (Company and Group) drawn up by the Management Board.
The Supervisory Board wishes to thank the entire staff and the Board of Management of Infineon once again for their great commitment and outstanding achievements during the 2019 fiscal year.
Neubiberg, November 2019 On behalf of the Supervisory Board
Dr. Wolfgang EderChairman of the Supervisory Board
14
INFINEON TECHNOLOGIES | ANNUAL REPORT 2019
Management Board and Supervisory Board Report of the Supervisory Board to the Annual General Meeting

Combined Management Report
Our Group 16 Finances and strategy 16 2019 fiscal year 21 Business focus 22 Growth drivers 29 Group strategy 37 Human Resources strategy
39 The segments 40 Automotive 45 Industrial Power Control 49 Power Management & Multimarket 52 Digital Security Solutions
56 Research and development 60 Operations 62 Internal management system 65 Sustainability at Infineon 65 The Infineon share
Our 2019 fiscal year 68 Group performance 68 Review of results of operations 73 Review of financial condition 76 Review of liquidity
79 Report on outlook, risk and opportunity 79 Outlook 83 Risk and opportunity report
95 Overall statement on Infineon’s financial condition 96 Infineon Technologies AG 99 Corporate Governance 99 Information pursuant to section 289a, paragraph 1,
and section 315a, paragraph 1, of the German Commercial Code (HGB)
102 Statement on Corporate Governance pursuant to section 289f, 315d of the German Commercial Code (HGB)/Corporate Governance report
103 Compensation report
This report combines the Group Management Report of Infineon (“Infineon” or “Group”) – comprising Infineon Technologies AG (hereafter also referred to as “the Company”) and its consolidated subsidiaries – and the Management Report of Infineon Technologies AG.
The Combined Management Report contains forward-looking statements about the business, financial condition and earnings performance of Infineon. These statements are based on assumptions and projections based on currently available information and present estimates. They are subject to a multitude of uncertainties and risks. Actual business development may therefore differ materially from what has been expected. Beyond disclosure requirements stipulated by law, Infineon does not undertake any obligation to update forward-looking statements.
15
INFINEON TECHNOLOGIES | ANNUAL REPORT 2019
Content

2019 fiscal year
Revenue growth achieved under difficult market conditions Unchanged dividend planned despite lower earnings
Revenue up by 6 percent; Segment Result Margin of 16.4 percent achieved Infineon generated revenue of €8,029 million in the 2019 fiscal year, representing an increase of 6 percent compared to the previous year’s figure of €7,599 million and clearly better than the semiconductor market trend as a whole (see “Development in the semiconductor industry” below). At the beginning of the fiscal year under report, Infineon forecasted revenue growth of 11 percent plus or minus 2 percentage points. Against a background of geopolitical tensions and trade conflicts, however, the economy entered a phase of significant and sustained slowdown after the turn of the year. Demand dropped significantly in numerous end markets, particularly the automotive industry. The decline in vehicle production in the 2019 calendar year is the biggest since the global economic crisis of 2009. The 2019 fiscal year was also characterized by higher levels of inventories being held within the sales channel by both direct customers and distributors, most noticeably in the power semiconductor segment. In March, Infineon had to reduce its revenue target to €8 billion plus or minus 2 percent, the figure that was ultimately achieved (see the chapter “Outlook”). Automotive, our highest-revenue segment, contributed €219 million to total revenue growth of €430 million. The Industrial Power Control and Power Management & Multimarket segments also reported revenue growth of €95 million and €127 million respectively. The Digital Security Solutions segment recorded a €22 million drop in revenue (see the chapter “The segments”). The favorable development of the US dollar exchange rate to the euro, which averaged 1.13 for the year compared to 1.19 one year earlier, had a positive impact (see the chapter “Review of results of operations”).
P see page 18 ff.
P see page 79
P see page 54 f.
P see page 69
Revenue growth of the individual segments in the 2019 fiscal year compared to the previous year
Automotive
Industrial Power Control
Power Management & Multimarket
Digital Security Solutions
7 %
7 %
5 %
(3 %)
Finances and strategy
16Combined Management Report | Our Group Finances and strategy 2019 fiscal year
INFINEON TECHNOLOGIES | ANNUAL REPORT 2019

China has been Infineon’s most important sales market for several years now and, with revenue of €2,159 million, accounted for 27 percent (2018: 25 percent) of Infineon’s revenue during the fiscal year under report. The next largest single markets are Germany with revenue of €1,169 million and a 15 percent share (2018: 15 percent), the USA with €862 million and an 11 percent share (2018: 9 percent) and Japan with €593 million and a 7 percent share (2018: 7 percent).
The Segment Result totaled €1,319 million for the 2019 fiscal year, 3 percent down on the €1,353 million reported one year earlier. The Segment Result Margin of 16.4 percent (2018: 17.8 percent) was therefore in line with the forecast of about 16 percent, at the mid-point of the forecast revenue range, as adjusted in March 2019. Especially, the additional manufacturing capacity built up by investments in the previous fiscal year could not be fully utilized particularly during the second half of the fiscal year, resulting in idle costs that negatively impacted the margin. In addition, inventories were adjusted to demand in particular in the second half of the fiscal year. Productivity and cost-cutting measures were only partially able to offset this effect.
Key performance indicators for Group decliningNet income decreased to €870 million (see the chapter “Review of results of operations”), €205 million down on the previous fiscal year’s €1,075 million, which included a gain of €270 million arising on the sale of the major part of the RF power components business to Cree, Inc. In a contrasting trend, however, the loss from discontinued operations decreased by €124 million to €19 million year-on-year.
The resulting earnings per share for the 2019 fiscal year amounted to €0.75 (basic and diluted), 21 percent down on the previous fiscal year’s figure of €0.95 (basic and diluted). Adjusted earnings per share (diluted) decreased from €0.98 to €0.89 (see the chapter “Review of results of operations” for details on the calculation of adjusted earnings per share).
Free cash flow from continuing operations (see the chapter “Internal management system” for definition) totaled €39 million in the 2019 fiscal year, a decrease of €579 million compared to the €618 million generated one year earlier. Free cash flow from continuing operations in the previous fiscal year included a cash inflow of €345 million arising on the sale of the major part of the RF power components business to Cree, Inc. Net cash provided by oper-ating activities from continuing operations amounting to €1,603 million (2018: €1,571 million) was used to finance investments in property, plant and equipment and intangible assets totaling €1,451 million (2018: €1,254 million) and the cash outflow for the acquisition of Siltectra GmbH (“Siltectra”) amounting to €123 million.
Revenue by segment in the 2019 fiscal year
Industrial Power Control: €1,418 million 18 %
Power Management & Multimarket: €2,445 million 30 %
Digital Security Solutions: €642 million 8 %
0 % Other Operating Segments, Corporate and Eliminations: €21 million
44 % Automotive: €3,503 million
Infineon revenue by region in the 2019 fiscal year
1 Greater China includes China and Taiwan.
Greater China1 35 %Japan 7 %
Americas 13 %
15 % Asia-Pacific (excluding Japan, Greater China)
15 % Europe (excluding Germany), Middle East, Africa
15 % Germany
P see page 68
P see page 72
P see page 63
17Combined Management Report | Our Group Finances and strategy 2019 fiscal year
INFINEON TECHNOLOGIES | ANNUAL REPORT 2019

The Return on Capital Employed (RoCE) in the 2019 fiscal year amounted to 12.2 percent, down on the previous year’s 20.5 percent. Operating profit from continuing operations after tax fell from €1,263 million to €925 million, whereas capital employed increased from €6,168 million to €7,599 million (for a definition of RoCE and details relating to its calculation, see the chapters “Internal management system” and “Review of financial condition”).
The gross cash position (see the chapter “Internal management system” for definition) amounted to €3,779 million as of 30 September 2019, an increase of 49 percent compared to the previous year’s figure of €2,543 million, mainly reflecting the impact of the share capital increase implemented on 18 June 2019, which generated net proceeds of €1,524 million, in conjunction with the financing of the planned acquisition of Cypress Semiconductor Corporation (“Cypress”). The dividend payment of €305 million for the 2018 fiscal year had an offsetting effect.
The net cash position (see the chapter “Internal management system” for definition) increased accordingly by €1,212 million to stand at €2,223 million at the end of the 2019 fiscal year (30 September 2018: €1,011 million).
Unchanged dividend payment of €0.27 per share planned Our dividend policy is aimed firstly at enabling our shareholders to participate appropriately in the success of the business and secondly to at least keep the dividend at a constant level in times of flat or declining earnings.
Despite lower earnings in the 2019 fiscal year, a proposal will be made to the Annual General Meeting to be held on 20 February 2020 to pay an unchanged dividend of €0.27 per share. The approximately 113 million new shares issued in conjunction with the share capital increase on 18 June 2019 are fully entitled to a dividend, bringing the expected dividend payment for the 2019 fiscal year to €336 million compared to €305 million for the 2018 fiscal year.
Developments in the semiconductor industry
Evaluation of the 2019 fiscal year (in euro)Worldwide semiconductor revenues totaled €370.422 billion in the 2019 fiscal year (Source: World Semiconductor Trade Statistics (WSTS)). This represents a decrease of 5.9 percent compared to the previous year’s value of €393.783 billion. This decrease in market revenues is attributable to the strong growth of memory chips during the preceding year. This product category, which essentially includes DRAM and flash memory products, decreased by 24.0 percent and at €101.817 billion accounted for approximately 27 percent of the entire semiconductor market. On the other hand, the semiconductor market excluding memory products and microprocessors managed to increase by 3.2 percent based on the euro. In the 2019 fiscal year, Infineon increased its revenues by 6 percent.
P see page 63 f. and page 75
P see page 64
P see page 64
Dividend per share for the 2010 to 2019 fiscal yearsin € cents
1 Proposal to the Annual General Meeting to be held on 20 February 2020.
22
2016
20
2015
18
2014
12
2013
12
2012
12
2011
10
2010
25
2017
27 27 1
2018 2019
18Combined Management Report | Our Group Finances and strategy 2019 fiscal year
INFINEON TECHNOLOGIES | ANNUAL REPORT 2019

Evaluation of the 2018 calendar year (in US dollars)In the 2018 calendar year worldwide semiconductor revenues reached US$485.009 billion, an increase of 12.3 percent compared to US$432.051 billion in the previous year (Source: Informa Tech). The four largest semi-conductor companies had respective market shares of more than 5 percent each. Samsung increased revenues to US$74.644 billion, representing a 20.3 percent increase, and had a market share of 15.4 percent in the calendar year. Intel increased revenue by 13.4 percent to US$69.895 billion with a 14.4 percent market share. Lagging far behind as in the previous years were the two memory chip manufacturers SK Hynix (market share: 7.5 percent ) and Micron (market share: 6.1 percent). With revenue of US$9.134 billion and an increase of 12.5 percent, Infineon’s market share remained unchanged at 1.9 percent. Nevertheless, Infineon was able to overtake the two competitors NXP and Western Digital and rise from 13th to 11th place. The Chinese company HiSilicon was among the 20 largest semiconductor manufacturers for the first time, while Apple was no longer among the top 20.
The 2018 calendar year was characterized by strong demand in the area of memory ICs. Accordingly, the memory chip manufacturers SK Hynix, Micron and Samsung had disproportionately high growth rates of 20 percent and more. Intel is the leader in the area of processors. Infineon is not active in these two product categories and is thus not in direct competition with these companies. Among the 20 largest semiconductor companies, the following companies compete with Infineon: Samsung (only in security ICs; this revenue accounts for less than 1 percent of Samsung revenue), Texas Instruments, Toshiba, STMicroelectronics, NXP, Renesas, and ON Semiconductor.
The 20 largest semiconductor companies accounted for 75.2 percent of the worldwide semiconductor revenues in the 2018 calendar year. In the 2017 calendar year, the top 20 companies accounted for 74.4 percent of the overall market. The remaining 24.8 percent (previous year: 25.6 percent ) was distributed among over 1,500 other semi-conductor companies. The semiconductor industry is thus highly fragmented. The consolidation process is more or less advanced, depending on the product category.
5% market share
10% market share
Top 20 semiconductor manufacturers for 2018 calendar yearRevenue in billion US$
16.6
Samsung
Intel
SK Hynix
Micron
Broadcom
Qualcomm
Texas Instr
uments
STMicroelectronics
Analog Devices
ON Semiconductor
Toshiba
nVidia
Infineon
NXP
Western
Digital
Media Tek
HiSilicon
Renesas
Sony SemiconductorAMD
Source: Based on or includes content supplied by Informa Tech (former IHS Markit Technology), “Competitive Landscaping Tool – 2019 (Q2 Update),” August 2019.
Foundries and subcontractors are not included in this market research.
74.669.9
36.329.7
17.4 15.4 11.4 10.4 9.7 9.1 9.0 8.4 7.9 7.4 6.7 6.6 6.2 6.2 5.7
19Combined Management Report | Our Group Finances and strategy 2019 fiscal year
INFINEON TECHNOLOGIES | ANNUAL REPORT 2019
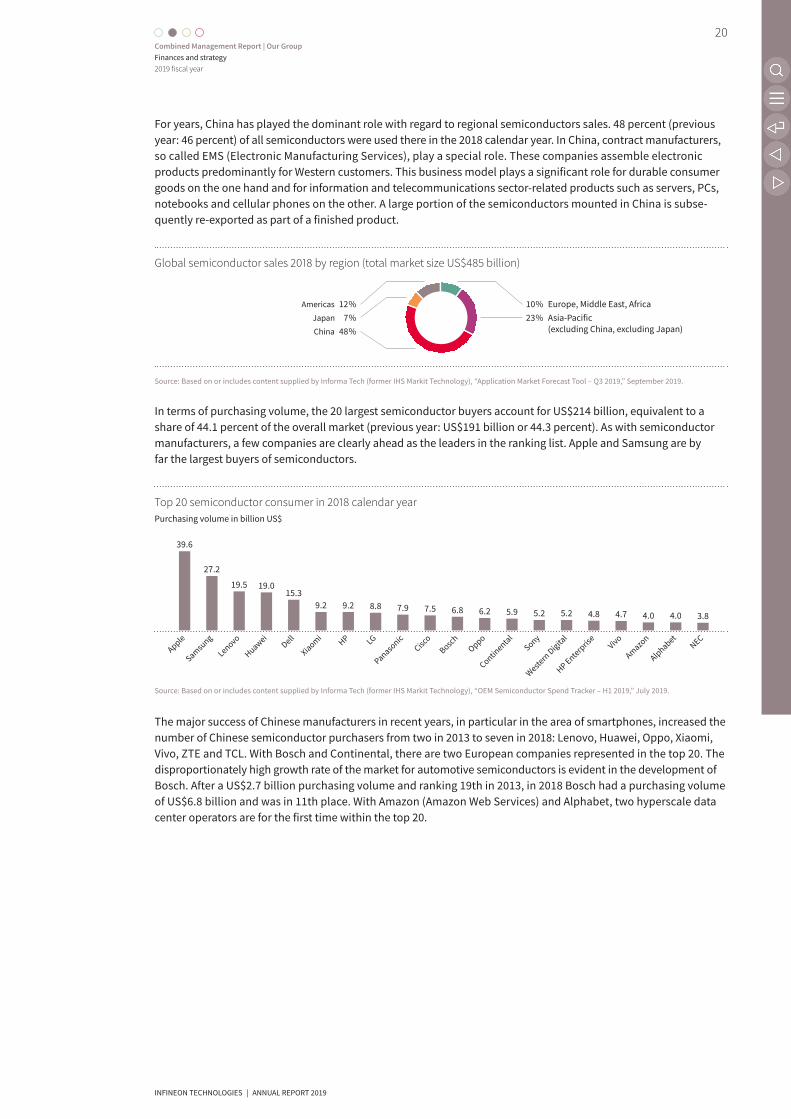
For years, China has played the dominant role with regard to regional semiconductors sales. 48 percent (previous year: 46 percent) of all semiconductors were used there in the 2018 calendar year. In China, contract manufacturers, so called EMS (Electronic Manufacturing Services), play a special role. These companies assemble electronic products predominantly for Western customers. This business model plays a significant role for durable consumer goods on the one hand and for information and telecommunications sector-related products such as servers, PCs, notebooks and cellular phones on the other. A large portion of the semiconductors mounted in China is subse-quently re-exported as part of a finished product.
In terms of purchasing volume, the 20 largest semiconductor buyers account for US$214 billion, equivalent to a share of 44.1 percent of the overall market (previous year: US$191 billion or 44.3 percent). As with semiconductor manufacturers, a few companies are clearly ahead as the leaders in the ranking list. Apple and Samsung are by far the largest buyers of semiconductors.
The major success of Chinese manufacturers in recent years, in particular in the area of smartphones, increased the number of Chinese semiconductor purchasers from two in 2013 to seven in 2018: Lenovo, Huawei, Oppo, Xiaomi, Vivo, ZTE and TCL. With Bosch and Continental, there are two European companies represented in the top 20. The disproportionately high growth rate of the market for automotive semiconductors is evident in the development of Bosch. After a US$2.7 billion purchasing volume and ranking 19th in 2013, in 2018 Bosch had a purchasing volume of US$6.8 billion and was in 11th place. With Amazon (Amazon Web Services) and Alphabet, two hyperscale data center operators are for the first time within the top 20.
Global semiconductor sales 2018 by region (total market size US$485 billion)
Source: Based on or includes content supplied by Informa Tech (former IHS Markit Technology), “Application Market Forecast Tool – Q3 2019,” September 2019.
China 48 %Japan 7 %
Americas 12 %23 % Asia-Pacific
(excluding China, excluding Japan)
10 % Europe, Middle East, Africa
Top 20 semiconductor consumer in 2018 calendar yearPurchasing volume in billion US$
9.2
Apple
Samsung
Lenovo
HuaweiDell
XiaomiHP
Cisco
AlphabetNECLG
Panasonic
BoschOppo
Continental
Sony
Western
Digital
HP Enterpris
eVivo
Amazon
Source: Based on or includes content supplied by Informa Tech (former IHS Markit Technology), “OEM Semiconductor Spend Tracker – H1 2019,” July 2019.
39.6
27.2
19.5 19.015.3
9.2 8.8 7.9 7.5 6.8 6.2 5.9 5.2 5.2 4.8 4.7 4.0 4.0 3.8
20Combined Management Report | Our Group Finances and strategy 2019 fiscal year
INFINEON TECHNOLOGIES | ANNUAL REPORT 2019

Business focusWe want to continue to grow and to create value for our customers and our shareholders as well as for our employees and for society. Therefore, our strategy focuses on global megatrends that are fundamentally shaping the world today: demographic and social change, climate change and scarce resources, urbanization and digital transformation. Our focus on energy efficiency, mobility, the Internet of Things & Big Data as well as security opens up extraordinary growth opportunities for us that we want to leverage with innovative approaches. In these markets, we follow structural drivers, areas which are expected to grow disproportionately because of the developments cited or which have major innovation potential.
According to the United Nations, a total of 9.7 billion people will be living on earth by 2050 – two billion more than today. And they will all want to live comfortably. In addition, the population is growing older in many industrial nations, both due to increases in longevity and due to sinking birth rates. Rapid population growth results in increased energy consumption, while rising demands push existing concepts for infrastructure, industry and com-munication to their limits. This all makes it necessary to generate, store, transmit and use energy more efficiently. Microelectronics plays a decisive role in supplying energy to the growing and evolving population and in protecting the environment. Our semiconductors enable systems that make our everyday lives more comfortable and at the same time minimize impacts on our environment. The key is making “more from less”.
More and more people are crowding from rural areas into cities, a trend which will continue into the future. According to a United Nations forecast, in 2030 there will be more than 40 “mega-cities” with populations of over ten million each. Current giants such as Tokyo (37 million residents in the metropolitan region), Shanghai (26 million) and New York City (19 million) will no longer be exceptional. In the year 2050 an expected two thirds of the world’s population will live in urban areas. Such rapid urbanization means enormous challenges for infra-structure and the associated services. How should a metropolis be designed in order to guarantee adequate quality of life in close proximity? One possible solution is the “Smart City” model: In the cities of the future, all aspects of public life will intermesh and be connected with one another. An intelligent power grid (Smart Grid) can efficiently manage energy requirements, sustainable mobility solutions like the Smart Car can master the increasing volume of street traffic and digital and intelligent solutions in the Smart Home will increase quality of life. Our products are our contribution to the further development of energy infrastructure, traffic and transportation systems and residential spaces. The objective is to make metropolises more efficient, greener and more comfortable.
In today’s digital world, more and more things are connected with one another over the Internet. Forecasts for the coming year already estimate approximately 20 billion connected devices in households and companies worldwide, up from approximately 6 billion networked devices in 2016. The Internet of Things is a main driver of the digital transformation of households and is the foundation of the future-oriented project Industry 4.0. The number of data volumes that are generated, transmitted and stored is increasing every day. Correspondingly, the respective infra-structures are facing increasing requirements to process this data at highest speed and lowest latency.
Humans and machines produce enormous amounts of data, at present 33 zettabytes – equivalent to 33,000,000,000,000,000,000,000 bytes – per year, with the amount expected to be five times that by 2025. Big Data is an extremely valuable raw material and changes the ways we communicate: We are voluntarily revealing more and more sensitive information about ourselves. This makes it necessary for users to be able to communicate with one another securely and without the risk of misuse or theft of data. Safeguarding electronic devices and infrastructures thus takes on the highest priority and makes the digital transformation possible. Meeting this increased need for security is one of the core competencies of Infineon.
21Combined Management Report | Our Group Finances and strategy Business focus
INFINEON TECHNOLOGIES | ANNUAL REPORT 2019

Growth driversThere are numerous application areas with high growth potential for our semiconductor business in each of the market trends addressed above, Energy Efficiency, Mobility, the Internet of Things & Big Data, as well as Security. The need to generate, store, transmit and use energy more efficiently is growing along with the increasing demand for energy and the urgency of worldwide CO2 reduction goals. The rising level of traffic and transportation makes sustainable, intelligent mobility solutions indispensable. In a highly digitalized world, the number of interconnected objects and the requirements placed on secure processing, transmission and storage of data continue to expand. We service all these application areas with our solutions and systems, helping us achieve sustainable growth.
Energy Efficiency
A new mindset in climate protection depends entirely on a new mindset in the context of the energy transformation (“Energiewende”). A viable energy transformation will only succeed in the future if we take sustainable and climate- friendly action everywhere from generation of electricity to its consumption. Microelectronics plays a decisive role here, helping to provide a constantly growing population with energy in an efficient and environmentally friendly manner. In the future, it will no longer be possible to meet the rising demand for electric energy using fossil fuels to the same extent as today. This makes renewable energy sources that do not emit CO2 continuously more important. One key here is the use of wind power and photovoltaic (PV). The fluctuating availability of energy from these sources can be balanced out using storage, but also calls for a holistic management of the power grid.
Power generation from renewable energy sourcesIn Germany, today, almost 40 percent of electric power comes from renewable energy sources. Infineon benefits from the fact that wind power turbines and photovoltaic power plants require multiples of power semiconductors per gigawatt of power generated than conventional power plants do. In contrast to coal-fired, natural gas or nuclear power plants, there is no turbine whose consistent movement can generate a constant alternating current of 50 hertz. This means that the electricity produced cannot be fed directly into the grid and power-electronic systems are required for conversion and protection. Infineon supplies all the major manufacturers of wind power turbines and PV inverters.
WindWhen it comes to energy generation from wind, two trends in particular drive demand for semiconductors. First of all, older, poorly performing wind power turbines are being replaced with modern, high-performance wind turbines, a process referred to as “repowering”. Secondly, ever-stronger turbines are being used in initial installations. The performance of wind power turbines rose from approximately 50 kilowatts to 150 kilowatts in the 1980s, to an average of 1 megawatt in the early 2000s and today has reached an average of 3 megawatts for onshore turbines and 5 to 6 megawatts for turbines used in offshore parks. The higher the power rate, the higher the value of integrated power semiconductors. Offshore wind parks in particular also place high requirements on the quality and reliability of the components used, since they require low-maintenance operation in a harsh environment, at high air humidity and in extremely saline air.
PhotovoltaicsInfineon addresses a broad international basis and has been collaborating for years with the world’s leading manu-facturers of photovoltaic inverters. We benefit from the growth of Chinese inverter manufacturers, among other things, both with regard to the domestic expansion of photovoltaics in China and in the export of the inverters to other regions. Furthermore, we work closely with leading European manufacturers and support innovative American companies with our products. Efficient conversion and low system costs contribute to reducing electricity generation costs in photovoltaic power plants and to creating grid parity compared with conventionally generated electricity. Using our silicon carbide transistors saves inverter manufacturers up to 20 percent in costs compared to silicon-based solutions. The power semiconductor content increases by two to three times.
22Combined Management Report | Our Group Finances and strategy Growth drivers
INFINEON TECHNOLOGIES | ANNUAL REPORT 2019

Energy storageIn the course of the energy transformation, by the year 2035 Germany is to draw 55 to 60 percent of its electricity from renewable energies, and 80 percent by 2050. The use of renewable energies is linked with specific requirements on the entire energy supply chain. Electric power generation through wind and sun does not take place centrally in a small number of central power plants, but rather decentrally at many different locations. In addition, fluctuating power generation does not always match the actual demand. Conventional power plants still have to substitute for or supplement renewable energy sources, making temporary energy storage necessary. Market researchers expect the global power employed by the energy storage systems to increase from approximately 3,000 megawatts in 2018 to 9,000 megawatts by 2025. We estimate the value of the power semiconductor components at €3,200 per megawatt. Infineon provides the essential power components and subsystems for increasing the efficiency of energy storage.
Hydrogen In the upcoming years, hydrogen will play a crucial role in energy supply. Even if many difficulties still remain to be overcome, we see major potential in the generation of hydrogen from renewable energy sources, as well as in the use of hydrogen in fuel cells. In the long-term, green hydrogen can become a fundamental growth driver for Infineon.
Using electricity Current conversion A power supply for electric devices consists essentially of two stages. First, the power unit converts the grid alter-nating current (AC) to direct current (DC), a process referred to as AC-DC conversion. Depending on requirements, in a second step the voltage of this direct current is precisely adapted at the point of load to fit the respective requirements, for example for a server’s processors. This second step is referred to as DC-DC conversion. The devices in question usually have several DC-DC converters. Growth in the area of power supplies depends on the power, complexity and especially on the unit growth of the devices.
AC-DC conversion In the medium-term, we see the highest unit growth in the case of servers; because of the high power level, here a correspondingly high number of power semiconductors is required for power supplies. Demand for computing power and DRAM/Flash memory is currently driven by social networks and increasingly by machine learning. The Internet of Things and Industry 4.0 will accelerate this trend even more in the future. In addition, we see growth opportunities in business with compact chargers, fast-charging features and solutions for wireless charging of smartphones, tablets and portables.
DC-DC conversion The demand for more computing power and storage capacity is driving the demand for DC-DC conversion. Processors, especially those used in artificial intelligence applications, require high power at very low voltages. In addition, energy requirements change considerably depending on load. As a result, the electronic systems are supplied with higher voltages that are then precisely stepped down to the required low voltages directly at the point of load. The situation is similar for PCs and communication devices, which sometimes require a large number of different voltages. Requirements placed on dynamics, efficiency and stand-by consumption are continuously increasing. Customers are looking for simple and reliable solutions, making the change to digital regulation of point of load systems while also driving the trend towards all-in-one solutions.
Efficient drives and smart motor control Electric drives are at the heart of a large number of systems, for example cranes, conveyor belts and robots. We find them wherever something moves or is transported. According to the European Commission, electric motors account for almost 50 percent of the electricity consumed in Europe. The savings lever is correspondingly large when efficiency is increased. In the upcoming year, the EU member states could already have saved approximately 135 terawatt-hours of electricity with more efficient motors, corresponding to the annual electricity consumption of Sweden. This would eliminate more than 60 million tons of CO2 emissions.
23Combined Management Report | Our Group Finances and strategy Growth drivers
INFINEON TECHNOLOGIES | ANNUAL REPORT 2019

Battery-powered devicesOne important electric motor model is referred to as the brushless direct current (BLDC) motor. In BLDC motors, all the commutation is electronic, depending on rotor position, rotor rotation speed and torque. This calls for the appropriate power semiconductors and, depending on the configuration, also for components for diagnostic and security functions. Because of their high level of energy efficiency and their low power-to-weight ratio, brushless direct current motors are particularly well-suited for use in battery-powered systems. Examples here are cordless home appliances such as robot vacuum cleaners, cordless drills and electric lawn mowers. Compared to conven-tional motors, this type of motor requires high-performance electronic control units. In addition to the motors, battery performance is also continuously increasing, enabling longer operating times. Furthermore, all the examples cited also require additional power semiconductor components for the chargers. With battery-powered devices, we benefit both from unit growth and from the higher number of semiconductor components used.
Major home appliances New EU regulations will place stricter energy efficiency requirements on home appliances in the European market starting in 2021. For the first time, demands in terms of reparability and replacement parts are also being defined. The new regulations are among other things intended to create incentives for designing products with longer service lives. As a result, the manufacturers of major home appliances are increasingly turning to variable speed- controlled motors. These motors are significantly more energy-efficient, low-noise and have longer service lives than uncontrolled motors. And: The value of the semiconductors used is increasing by more than a factor of ten. Examples are the motors in washing machines and dishwashers, compressors in refrigerators and various drives in air conditioning systems.
Industrial automationOne way to reduce the energy consumption of an electric motor is to use an electronic control unit for automatic speed control, thus adapting performance to the respective load. Electronically controlled motors are also a central element in automation. Without them, it would be impossible to coordinate the various motion sequences efficiently. The market penetration of speed-controlled motors will increase. A speed-controlled motor control unit requires a large number of the power semiconductors we supply. The number and value of these power semiconductors depend on the power range of the motor. Industry 4.0 will trigger a new investment cycle not only for automation in factories, but also for global transport and handling systems as well as for collaborative robots (see the section “Internet of Things & Big Data” in this chapter).
Mobility
Global population growth and increasingly global value chains as well as urbanization are driving demand for all types of transportation, ranging from mass transportation such as airplanes and trains to vehicles for private use such as cars, eBikes and eScooters. Cities in particular are confronted with the challenge of making transportation cheaper, more efficient and more sustainable.
Electro-mobility The automotive industry is continuously working to reduce pollutant emissions. A new European Commission regu-lation requires for example the reduction of average fleet emissions to 81 grams of CO2 per kilometer by 2025. The reduction goal for 2030 is 59 grams of CO2 per kilometer, a reduction of 37.5 percent compared to 95 grams of CO2 per kilometer by 2021. More realistic exhaust gas testing procedures such as the WLTP cycle (Worldwide Harmonized Light-Duty Vehicles Test Procedure), in effect since 2017, mean further, implicit tightening of CO2 reduction rules. This will in turn increase demand for semiconductors. The optimization of the combustion engine alone will not be enough to fulfill legal requirements and satisfy customer demands for sustainable mobility. Instead, systems consum-ing energy in the vehicle will increasingly have to be made more efficient and hydraulic or mechanical solutions will have to be replaced by more efficient electromechanical and thus semiconductor-based systems.
P see page 26 f.
24Combined Management Report | Our Group Finances and strategy Growth drivers
INFINEON TECHNOLOGIES | ANNUAL REPORT 2019

In order to reduce the fleet average to the mandated target CO2 value, many vehicle manufacturers are expanding their product ranges to include more models such as hybrid vehicles or pure electric vehicles. These vehicles have a significantly higher semiconductor content than conventional ones. Infineon offers a wide range of corresponding power semiconductor components. While the current average semiconductor content of a car with a conventional combustion engine is US$417, the amount in full hybrid or plug-in hybrid vehicles is US$785, and for purely electric vehicles as much as US$775. Here power semiconductors make up approximately three quarters of the additional semiconductor content per vehicle.
There are also what are referred to as mild-hybrid vehicles, based on 48 volt technology, which will be used in addition to the 12 volt onboard network. On the one hand, these vehicles can recover a certain amount of braking energy, while on the other hand pollutant emissions can be reduced with more efficient systems. Mechanical functions are being increasingly replaced with electric functions, the 48 volt partial onboard network handles the power supply for high-power consumers such as the electric turbocharger, electric power steering as well as electronic stability control. In addition, the 48 volt technology enables better recuperation while braking. Market researchers calculate approximately US$90 per vehicle of additional power semiconductors to control these power consumers as well as the coupling of the two on-board power networks.
Charging infrastructure for electro-mobilityThe steadily increasing number of electric vehicles also requires a corresponding charging infrastructure. A well- developed network of charging stations increases the incentive to buy an electric vehicle. In order to promote the acceptance level of electro-mobility, China has begun operating charging stations along the country’s eight most important highways. This also includes the important connection between Beijing and Shanghai. By 2020, 10,000 charging stations with 120,000 charging points are to be implemented, with an investment volume of approximately US$770 million. And other countries will most likely constantly expand their networks of publicly accessible charging stations in the coming years, too. Depending on the system topology, the charging stations use different types of power semiconductors.
Safe automated driving “Vision Zero” describes one of the largest objectives of the automotive industry: Vehicles are to be made so safe that no serious or fatal accidents occur anymore; today approximately 90 percent of such accidents are attributable to human error. Active safety systems can either completely prevent an accident or at least significantly reduce its consequences by directly intervening in the driving process. Examples here are pedestrian detection, adaptive cruise control and blind spot detection. These functions are no longer reserved for luxury class vehicles, but rather are in the meantime conventional equipment in the mid-range vehicle class.
Active safety systems are being expanded more and more and are taking on the character of driver assistance systems. By supporting the driver with the tasks of driving, they increase both driving comfort and traffic safety. Among other things, they assist in critical situations or help correct a driver error when appropriate, for example with automatic emergency braking maneuvers. Systems for partially and fully automated driving essentially consist, firstly, of the sensors (for example radar, cameras in the vehicle’s interior and exterior), and secondly, a central high-performance computer for the evaluation of sensor data as well as calculation of the driving strategy (to a certain extent, the system’s intelligence). The third element is the actuators (steering, brakes, engine control and transmission). The importance of the functional safety of components and vehicle systems increases as more electronic assistance systems are used in vehicles. Functional safety and quality are thus very important, placing challenges on the entire industry. Infineon consolidates this topic as reliability or “dependability” and has a major competitive lead in this field.
25Combined Management Report | Our Group Finances and strategy Growth drivers
INFINEON TECHNOLOGIES | ANNUAL REPORT 2019

Traction systems Sustainable and optimally networked mobility within metropolitan centers as well as between metropolitan centers is one of the key topics of the 21st century. Today, reliable and rapid public transportation determines more than ever the quality of life and competitive ability in many regions and cities worldwide. Our components are used in public transportation, urban rail systems and trams as well as in high-speed trains.
China is one of the largest rail vehicle markets in the world. We also see the reinvigoration of the market for traction systems. As a result of industrialization and urbanization, there is demand primarily for urban rail systems and regional trains.
Internet of Things & Big Data
The Internet of Things has the potential to radically change how companies and consumers interact with one another and with the infrastructure surrounding them. The Internet of Things connects the real and the digital world. A wide variety of physical “things” – ranging from people and places to cars and computers and even to home appliances and industrial equipment – are equipped with embedded electronic systems, software and sensors.
Our semiconductor solutions drive the Internet of Things. Sensors transform environmental information into data; microcontrollers process this data and generate control signals; actuators convert the control signals into actions – in most cases motion but also light and heat; security solutions protect the integrity of devices and equipment. This is how we connect the real and digital world.
The planned acquisition of Cypress will expand our product portfolio by several differentiating components. This includes microcontrollers with corresponding software eco-systems, high-performance memory components, as well as connectivity components such as WiFi, Bluetooth and USB-C. The additional combination of our security expertise with the connectivity know-how of Cypress will generate new growth potential in the area of the Internet of Things, especially in the industrial and consumer segment.
Linking the real and the digital world
Infineon Cypress Sense Sensors Compute Microcontrollers Actuate Power Semiconductors Connectivity Wi-Fi, BT, BLE, USB/USB-C
Battery-powered devices
Industrial IoT
Consumer IoT
Drives
Powersupplies
5G
Automotive
Connectivity
Real-world applications
Sens
e Compute
Actuate
Security solutions
SoftwareEcosystem
101010100010101001010100100101010001010101101001010010101010010101010100101010100101001010010010100101010100100101010100100100101001010100101010010010100101001010010010010100101001010100101010010100101010100010101001010100100101010001010101101001010010101010010101010100101010100101001010010010100101010100100101010100100100101001010100101010010010100101001010010010010100101001010100101010010100101010100010101001010100100101010001010101101001010010101010010101010100101010100101001010010010100101010100100101010100100100101001010100101010010010100101001010010010010100101001
Digital world
26Combined Management Report | Our Group Finances and strategy Growth drivers
INFINEON TECHNOLOGIES | ANNUAL REPORT 2019

Human Machine InteractionHuman Machine Interaction is concerned with how humans and systems interact and communicate with one another. The focus has long moved past classic industrial machines and now affects computers, digital systems and devices for the Internet of Things, i.e. the connection of the real and digital worlds. More and more devices are connected and perform their tasks automatically. Operation of all these machines, systems and devices has to be as intuitive as possible, as if the user were communicating with a person. Smooth communication between human and machine requires the right interfaces. A system can for example be controlled using text entry on the keyboard or mouse, but touchscreens, voice and gesture control are more natural.
Collaborative robotsThe field of robotics has been attracting special attention for several years now. In addition to the continuing devel-opment of conventional industrial robots, more and more areas of industry are implementing collaborative robots, known as “cobots”. Cobots work together with humans in the manufacturing process and are no longer separated from their human colleagues by protective equipment, as the typical industrial robot is; the requirements placed on their reliability and safety are correspondingly high since they have to be able to perceive their surroundings well enough to effectively work together with humans without endangering them. Cobots will relieve and support humans in difficult and dangerous tasks. In the long term, cobots will support elderly people in living more independently, helping to master the challenge of an aging population. Their further development continues the trend towards intuitive robot programming and self-learning robots. Infineon offers not only the necessary sensors, microcontrollers and power semiconductors, but also provides numerous start-ups in this market with know-how in the area of motor control, sensor systems, and security.
Smart Home“Smartification” is finding its way into the home as well. While in an industrial context the primary issue is increasing productivity, applications in the private environment are usually focused on comfort. A Smart Home not only provides remote control of appliances and devices, it can also offer more comfort, higher energy efficiency, and a higher level of security by working together with the various sensors, devices and the internet. The Infineon portfolio of sensors, power semiconductors and security controllers offers the right solutions for a networked home.
Mobile communicationsMobile data traffic is constantly increasing in volume with the arrival of the new wireless communications standard 5G: While 19 exabytes – equivalent to 19,000,000,000,000,000,000 bytes – were transferred by mobile communications worldwide in each month of 2018, experts expect a volume of 77 exabytes per month for the year 2022. In order to be prepared for the exponentially increasing data volumes, to achieve higher data transmission rates and to improve network coverage, network providers are turning to a high-performance infrastructure. The migration of network architecture to smaller cell sites enables, among other things, the use of higher frequency ranges and better exploita-tion of the available frequency spectrum. Radio-frequency components are required for both the communication between mobile devices and the base station and for wireless backhaul from local networks to the main network.
Security
The increasing degree of interconnection of humans, machines and devices calls for more IT security, from the manufacturing industry and Smart Home applications to information and communication technologies. We provide our customers with robust, future-oriented embedded security hardware for electronic equipment, computer systems, network components and industrial facilities. These security technologies make it possible to authenticate persons and machines, protect confidential data and detect unauthorized changes to networked machines and devices. At the same time, user awareness of the topic of IT security is increasing. One example: In the context of Smart Home, the majority of Germans is willing to accept a significant premium for improved data security. This means that people are attributing more importance to the protection of their personal data.
27Combined Management Report | Our Group Finances and strategy Growth drivers
INFINEON TECHNOLOGIES | ANNUAL REPORT 2019

Security for mobile devicesThe development of smartphones and wearables, the mobile Internet and Near Field Communication (NFC) tech-nologies has made it possible to integrate payment services in today’s mobile devices. Cash-free payment is just one of many mobile end device functions requiring the storage and processing of sensitive data. For example, users experience a new kind of comfort when riding in public transportation with mobile tickets instead of using coins and physical tickets. These application areas require special security solutions, for example a security chip known as a Secure Element (SE). The SE can either be built into the smartphone (referred to as an “embedded SE” (eSE)), integrated in the SIM card or located on a microSD card.
Secure authentication for the Internet of Things Security plays a decisive role in the Internet of Things. The rising number of hacking attacks underlines the impor-tance of appropriate precautions. In order to secure electronic systems, it is important to only connect authorized and authenticated devices with one another and to protect them against cyber-attacks and manipulation. This means security has to be integrated into every end-point whenever possible. The electronic components central to security are typically assembled on the printed circuit board, which is why these components are referred to as embedded security.
Security for industrial applications (smart factories)The fourth Industrial Revolution is in full swing. In the era of Industry 4.0, companies are using the most modern technologies to design their manufacturing to be faster and more cost-effective, to reduce rejection rates and to minimize incidents and downtimes through predictive maintenance. Networking and digitalization of factories, however, create points of attack for hackers. To protect themselves, companies must therefore take security into account from the very beginning of Industry 4.0 projects. A combination of software-based and hardware-based security solutions can protect connected machines and communication nodes. Examples are the OPTIGA™ TPM chips from Infineon, which can be integrated in routers, industrial PCs and complex control units and which serve to identify devices to communicating partners in the network. They thus authenticate themselves in the network and secure data transmission.
Security for connected vehiclesThe constant increase in connected vehicles creates opportunities for many new services, but also entails the danger of unauthorized access. This makes it necessary to guarantee secure data exchange both between the various onboard systems and between vehicles and the infrastructure. Vehicle safety and personal safety on the one hand and data and IT security on the other hand can no longer be considered in isolation from one another. The vehicle is becoming a networked computer on four wheels and is also becoming a part of the Internet of Things. The demand for data and IT security in the vehicle is rising. We see our opportunity here with hardware-based security offered by our security controllers – either as a separate component or integrated in our automotive microcontrollers.
Integrity of devicesThe integrity of devices has to be ensured as the degree of networking increases. This integrity consists of both data and system integrity and means that data modification cannot go undetected. Integrity thus ensures that a system will function correctly. A Trusted Platform Module (TPM) can be implemented here. This special security chip can protect keys, passwords and digital certificates and store them separately from the CPU. Here, sensitive information and security-critical data are locked away in a “data safe”. At the same time, the integrity of the data can be checked, making it possible to detect attacks promptly.
28Combined Management Report | Our Group Finances and strategy Growth drivers
INFINEON TECHNOLOGIES | ANNUAL REPORT 2019

Group strategyIn recent years, we have established a stable foundation for success in our target markets. Our core competencies are in higher demand than ever in the context of global megatrends. Our strategy aims to further strengthen our core business and acquire new growth markets. Over many years, we have gained and systematically expanded the technical expertise necessary to do so. And since good ideas do not become innovations until they are successful in the market, we have also developed the right concepts for implementing our strategy to create value.
The center of this implementation is our strategic “Product to System” approach, in which we orient our entire value chain to the success of the customer. This strategy is supported by further elements: a solidly anchored innovation culture, continuous pursuit of technology leadership, pronounced quality consciousness, differentiating in-house production and a sales strategy custom-tailored to fit the various markets. This allows us to offer our customers leading products, the highest quality and supply reliability and thus to succeed in profitable growth and faster than the market. Our objective is a leadership position in the markets we address.
Strategic guideline: Strengthening the core business and unlocking new growth markets
Our Group strategy is focusing on the megatrends mentioned already and thus ensures Infineon’s long-term structural growth. We concentrate on markets with strong structural growth. Our course of action in the individual markets depends on our competitive position, which we analyze in terms of technologies, products and application under-standing. This results in three possible categories to start with: core, adjacent and new businesses, in terms of products, applications and markets.
P see page 22 ff.
Core Adjacent New
Strategic growth model
Markets
Applications
Products/ Technologies
grow in scopegrow in scale
Enable
Drive
Enable
Drive
29Combined Management Report | Our Group Finances and strategy Group strategy
INFINEON TECHNOLOGIES | ANNUAL REPORT 2019

The core business includes all those areas in which we have a comprehensive understanding of applications or master the base technologies, and in which we can therefore offer a differentiating product portfolio. We want to at least grow with the market and, in doing so, to maintain or strengthen our leading positions (“grow in scale”). One example: Power semiconductors are instrumental in the generation, transmission and use of electric power. We understand how these systems are used to convert and control electric power and we supply particularly com-pact and energy-efficient MOSFETs and IGBTs for this purpose. As the clear market leader in this area, our broad tech nology and product portfolio lets us actively shape the transition of certain applications to new semiconductor materials such as silicon carbide (SiC) and gallium nitride (GaN), offering our customers solutions ideally suited to their needs. Our high-volume manufacturing offers economies of scale and makes it possible for us to provide manufacturing capacities and to grow with our customers.
The greatest growth potential is to be found in markets that are adjacent to our core business, which we have not yet addressed at all or only incompletely. For example, we can adapt existing technologies and products for additional applications with reasonable effort and can thus increase sales potentials. And in the application fields we have already addressed we can use our system understanding to increase the scope of our business with a broader product and solution portfolio to generate higher revenue (“grow in scope”). Thus, the core mentioned above is not a static portfolio of activities; much more the adjacent areas will become part of our core business in the mid-term. The core is growing and the boundaries are shifting, because when we make progress in particular markets in terms of technology, products and application understanding, the classification of these markets changes accordingly. To return to the example of power semiconductors: We are proud to point to “Power” as one of our original core competencies. Nevertheless, we continuously develop here, too. We are expanding our portfolio in order to offer our customers an increasing degree of “Intelligence” in addition to “Power”. Specifically this means that for some time now we have been complementing our range of efficient power transistors with additional solutions in order to integrate them in digital solutions. The products required for intelligent control of these switches tend to be more complex and higher-end because they integrate more functionalities. In the context of increasingly complex systems and shorter development times, many customers appreciate solutions in which we combine “Power” and “Intelligence”.
Technological progress also enables completely new application areas in which broad commercialization is still pending. Sometimes, the impulse for new applications comes from innovations in semiconductor technology (for example Time-of-Flight technology for 3D sensing technologies), sometimes groundbreaking concepts on the customer side require the development of suitable semiconductor solutions (such as the combination of various sensor technologies for easier Human Machine Interaction (HMI)). We actively address these new business areas in order to secure a good starting position in highly promising future markets at an early stage.
We supplement our organic growth with targeted acquisitions. These acquisitions have to meet three criteria: They must be strategically compatible with our three growth categories (core, adjacent, new), financially reasonable and culturally fitting. An acquisition thus has to strengthen Infineon’s market position according to our strategic orientation and has to be a viable addition to our range of expertise. The business acquired has to increase our profit, contribute to our margin target of an average of at least 17 percent throughout the cycle and must earn a return at least equal to its capital costs. Finally, the corporate culture of a potential acquisition candidate has to be a good fit with Infineon’s culture, ideally contributing valuable elements to it.
Source: Based on or includes content supplied by Informa Tech (former IHS Markit Technology), “Power Semiconductor Market Share Database 2018,” September 2019.
World discrete power semiconductor and modules market share 2018
19.9 %
8.9 %
5.4 %
4.8 %
4.5 %
Infineon
ON Semiconductor
STMicroelectronics
Mitsubishi
Vishay
30Combined Management Report | Our Group Finances and strategy Group strategy
INFINEON TECHNOLOGIES | ANNUAL REPORT 2019

We also placed these criteria at the center of the planned acquisition of Cypress, which we announced on 3 June 2019 and which we expect to have concluded by late in the 2019 calendar year or early in the 2020 calendar year. The combination of complementary product portfolios strengthens and expands our core power semiconductor business and can cover an even wider application spectrum, which means we increase our ability to differentiate and enlarge our potential growth. Cypress has a comprehensive portfolio of microcontrollers as well as software and connectivity components. The combination of our power semiconductors, sensors and security solutions lets us offer our customers even more comprehensive and more innovative system solutions. The consolidation of our security expertise with the connectivity know-how of Cypress will accelerate the introduction of new applications in the Internet of Things. For automotive semiconductors the expanded portfolio of microcontrollers and NOR flash memory has a substantial potential, in particular with regard to their growing significance for driver assistance systems and new electronic architectures.
Strategic fields of action: Factors for successful implementation
The strategic “Product to System” approach defines our actionsOur strategic approach “From Product to System” goes well beyond thinking in terms of technologies and products.We want to understand what markets demand and how the markets are changing. Only then will we be able to understand how we can change the markets ourselves. We consider more than just the direct sales opportunities for our products: We also look at our customers’ success factors and the development of end-markets. By doing so, we recognize at an early stage when the foundation of our business is changing. This is a prerequisite for timely action, guaranteeing sustainable differentiation in growth applications and increasing profit. In order for this to succeed, we have to understand the environments in which our customers’ products are used, how the products are embedded in larger systems, what other devices they interact with, what requirements they have to fulfill and what tasks they are intended to perform. On the level of our products in these systems, we also have to consider which active and passive components they use, which control concepts they use and what capabilities our customers contribute to the value creation process. Equipped with this knowledge, we can leverage our competencies even better: We want to translate what is technologically possible into a commercially viable product that provides the greatest possible benefit to our customers. For example, sensor systems not only capture information about the surrounding environment, but also interpret and process the data they gather in order to initiate a particular action; digital control loops in power supplies enable higher energy efficiency at both high and low load levels; and security controllers are capable of distinguishing authorized access from unauthorized access. In addition to the hardware components involved, this also requires varying degrees of software support. Thus, to a certain degree, system understanding also means software understanding.
System know-how is bridging the gap between core technology and target application
Competencies evolve over time
Customer system
Algorithms
Softw
are
Har
dwar
e
Firmware
Integration of analog and digital functionality
Discrete components
Base technology
Full system functionality
Partial system functionality
Building block
Single functionSystem know-how
31Combined Management Report | Our Group Finances and strategy Group strategy
INFINEON TECHNOLOGIES | ANNUAL REPORT 2019

Technology know-how has always been the foundation of our business model, whether in the form of discrete components, integrated solutions or mixed-signal components. Our broad portfolio ranges from single compo-nents all the way to solutions with hardware-related software. This enables us to provide targeted support to our customers while choosing from a variety of approaches. Some customers want to differentiate themselves from their competitors by means of their own software, purchasing only the necessary hardware from us. We go one step further with automotive microcontrollers and security controllers, which we supply with special firmware that supports the basic functionality of the hardware and cannot be modified. More extensive functions can then be implemented using additional program code. For example, the second generation of our digital motor control platform iMOTION™ was developed for use in major home appliances and comes with a development kit that meets the priorities of our customers in this market: lower system costs, compact design, reduced development effort, shorter development times and high reliability. iMOTION™ already comes with all the algorithms required to control an electric motor. Only a small number of application-specific parameters need to be defined in order to complete programming. Since we think in terms of systems, we can support all of these different approaches and understand how value is created. In order to provide our digital age customers with even more created value, in the future the iMOTION™ will be expanded to include security and networking components. It is not always the most sophisticated solution that provides the biggest value added to the customer: Standard components may also be just the right fit. Nevertheless, system understanding creates a competitive advantage because it gives us the ability to develop better products in cooperation with our customers.
In recent years, we have intensified our activities in the area of software, both in strategic partnerships and with our own development activities. The progress we have made is becoming increasingly visible, benefitting our customers. For example, the second generation of our successful automotive microcontroller family AURIX™ can be used for radar signal pre-processing in combination with our radar sensor ICs. We have implemented this feature, referred to as pre-processing, in hardware, since this is substantially more effective. However, we were only able to do so because we understood the underlying algorithms.
Technology leadership means added value for customersCustomers choose Infineon because we stand for highest levels of quality, reliability and technological leadership. The satisfaction of our customers attests to the fact that we are successful with our rigorous quality strategy. In the 2019 fiscal year, Infineon was once again honored by many leading manufacturers in the automotive industry. For example, Japan’s largest automobile manufacturer Toyota recognized Infineon once again with an award for what is now five years of defect-free deliveries to its plant in Hirose (Japan). In order to fulfill the promise of technical leadership, our engineers already anticipate many challenges even before our customers are affected. We meet the high quality requirements of the automotive industry, achieve the highest efficiency levels in handling electricity and we deliver solutions for the world’s challenging security projects. The close collaboration with our customers helps us make targeted use of this specific expertise and recognize future trends at an early stage. One example: Since May 2019, Infineon has been a partner in the Volkswagen group’s strategic supplier network FAST. FAST stands for the “Future Automotive Supply Tracks” program and for close collaboration in central future-oriented fields. As a market leader in semiconductors for electro-mobility, Infineon makes an essential contribution to the drive trans-formation of the world’s largest automotive group. Our power modules control the electric drives in Volkswagen’s electro-mobility platform MEB, the industry’s largest platform for pure electric vehicles. In the context of FAST, Infineon and Volkswagen will also discuss future semiconductor requirements and thus will be able to generate innovations that for example increase the driving range of electric cars or reduce charging times.
32Combined Management Report | Our Group Finances and strategy Group strategy
INFINEON TECHNOLOGIES | ANNUAL REPORT 2019

Furthermore, we make use of our technology leadership to systematically expand our abilities, strengthen our core business and grow in scope – for example, whenever the requirements of our markets change or when we see long-term growth potential in an adjacent business segment. Thus, as the market leader, we began researching new materials for power semiconductors at an early stage. Silicon carbide (SiC) and galium nitride (GaN) are particularly well-suited for use in the field of power electronics. Here we are advancing into new areas of performance and efficiency. These components are typically more expensive than silicon-based products, but thanks to new system architectures they also open the door to many new types of customer benefit, such as a smaller form factor, higher efficiency and lower system costs. The realization of these benefits implies higher research and development efforts on the part of our customers. Therefore, we support the introduction of these new technologies in two ways: On the one hand, we work together closely with our highly innovative customers, while on the other hand we provide less technology-oriented customers with solutions that are easy to implement. In the context of the increasing importance of SiC to certain power semiconductor applications, we acquired the silicon carbide specialist Siltectra in November 2018. The company has developed an innovative method for especially material-saving and efficient processing of crystals (Cold Split technology). Infineon will use the Cold Split technology to split silicon carbide (SiC) wafers to make two wafers out of what was originally one and thus to potentially double the number of chips har-vested. In addition, the efficient separation of the SiC ingots into wafers offers substantial potential. The increased number of SiC chips will significantly simplify the ramp-up of our SiC products, especially with regard to the further expansion of renewable energy sources and the increasing use of SiC in the power train of electric vehicles. We have now established all the prerequisites for future success in the growing SiC market: access to high-quality wafers, leading technologies at the product level (Trench SiC MOSFET), module expertise and system understanding.
Based on our technology leadership in transistors, we also want to strengthen our position in solutions for their control and to expand our product portfolio. As the number one in MOSFETs and IGBTs, we see interesting opportu-nities for growing more strongly than before in this area. This approach is exemplary of the strategy outlined above for moving from a strong core business to penetrate adjacent markets.
Many years ago, we intentionally blazed new trails in the field of sensor technologies, anticipating the drastically increasing importance of capturing environmental data for our target markets. Today we have a comprehensive portfolio of sensors for a wide variety of systems in the car, for mobile devices, consumer electronics and the Internet of Things. The example of the REAL3™ image sensor chip shows that we act flexibly and adapt to market demands: Together with LG Electronics, Infineon has developed a smartphone featuring leading Time-of-Flight (ToF) technol-ogies. Our ToF image sensor chip provides more exact measurements based on infrared light than other 3D tech-nologies that use complex algorithms to calculate the distance between an object and the camera lens. This makes ToF faster and more effective in difficult ambient light conditions, reducing the load on the smartphone processor and thus cutting electricity consumption. Our image sensor chips not only prove our expertise, they also exceed manufacturers’ requirements.
Strategic advantages through in-house manufacturingAll our actions are aimed at creating value for the customer and at opening up opportunities for us to differentiate. This also applies to manufacturing. We manufacture in-house, when doing so means we can differentiate ourselves from the competition in the market through lower cost or higher performance. On the other hand, when it comes to standard technologies, usually in the case of highly integrated products such as microcontrollers and security ICs where design is the main concern, we primarily work with contract manufacturers. We thus utilize our invested capital in the most efficient way possible and optimize our investments in research and development.
Our outstanding manufacturing methods and our process expertise give us a strategic advantage in many application areas, for example in power electronics and sensor technologies, because we can offer components that can only be produced using leading-edge manufacturing technologies. Several years ago, we were the first company in the world to develop highly-integrated radar sensor ICs for the 77 gigahertz frequency range based on innovative silicon germanium technology. This cuts the cost of radar systems, which as a result are used more widely in vehicles outside of the premium segment, making street traffic safer.
33Combined Management Report | Our Group Finances and strategy Group strategy
INFINEON TECHNOLOGIES | ANNUAL REPORT 2019

In the frontend, our 300-millimeter thin-wafer manufacturing for power semiconductors is a sustainable competitive advantage. We are equipping the available cleanroom space in Dresden (Germany) with additional tools step-by-step, and we benefit from the resulting higher productivity and lower capital intensity compared to manufacturing on 200-millimeter wafers. Furthermore, in November 2018, construction of a second, fully automated 300-millimeter factory at the Villach (Austria) site began. Depending on the macro-economic situation, we currently plan to ramp the fab by the end of the 2021 calendar year. We expect the 300-millimeter manufacturing cleanroom space in Dresden to be fully used by then. The estimated additional potential revenue from the new factory is approximately €1.8 billion annually, with a necessary total investment of approximately €1.6 billion. Manufacturing in Villach and Dresden will use the same processes, facilities, automation and digitalization concepts, thus constituting a manu-facturing complex (“Verbundfertigung”). This will mean synergies as well as benefits for the customer, since we can rapidly shift manufacturing volumes between the sites. By expanding our manufacturing capacities, we are also sending a clear signal to our customers: Infineon is the ideal partner for future growth.
In addition to innovative strength and delivery reliability, quality and costs are also essential aspects in the orienta-tion of our manufacturing landscape. Innovation of manufacturing processes takes place primarily in Europe. Our Asian sites focus on efficiency and are intended to cover further growth.
Innovation drives differentiationInnovation is one of the most fundamental success factors in the semiconductor industry and is Infineon’s basis for differentiating itself from competition. Infineon has shown time and again that our technological and product innovation lets us grow faster than the market and increase profitability. But challenges are growing as well: Competition is intensifying and competitive coverage of the application areas in our markets calls for a wider and wider technology portfolio. In addition, development efforts are increasing disproportionally as technologies grad-ually approach physical limitations. This fact underlines the significance of economies of scale and the connection between technology leadership and size. Previous concepts for success are too shortsighted under these conditions and have to be either expanded or rethought.
This is why innovation and system thinking ideally complement one another. We think about what the key factors are and how we can combine several innovative, sometimes at first sight minimal steps to form a larger whole that will in turn provide an additional and substantial benefit for the customer. Thus, today our claim to innovation covers all areas of our company: logistics, operations, technology, products, system solutions and partnership with the customer. Depending on particular market demands, we focus on different aspects. The company-internal focus is on innovation in business and continuous improvements in order to become leaner and faster. The key to success is collaboration across organizational boundaries and the resulting creation of a working environment that helps us expand our innovative expertise. We have established successful new concepts, which are independent of hierarchical approaches and based on the self-motivation of our employees.
Here, the digital transformation plays a crucial role, a development from which we benefit in two ways as a globally active semiconductor manufacturer: As both a user and provider of digital solutions. We are achieving excellent results in our well over 100 digitalization projects. Thus, for example we are connecting our sites and organizing our global supply chain to form a virtual factory. In sales and marketing, we are using new methods for ana lyzing Big Data to improve our cross-selling and as a result, we can provide more targeted solutions for our customers’ needs. With initiatives like this, we are building our digital expertise and are becoming even more competitive. We are following an exploratory approach in order to best utilize the potential of the digital transformation. This way we gather experience based on specific application cases and work towards solutions in an iterative process.
34Combined Management Report | Our Group Finances and strategy Group strategy
INFINEON TECHNOLOGIES | ANNUAL REPORT 2019

The Internet of Things as well as Big Data are constantly bringing new players to the electronics marketplace and call for a strong partnership across a variety of knowledge areas. In this dynamic environment, joint innovation is the key to corporate success. One example is our Silicon Valley Innovation Center – a start-up center for innovations. It provides a platform for investigating new ideas and for fast learning. We also operate what are called “Co-Innovation Spaces”, where cross-company innovation processes bring us into early contact with new and potentially ground-breaking end-applications. We opened the first Co-Innovation Space in Singapore. We support the typical abilities of start-ups to try out new technologies and applications and develop several of them to market readiness with our experience and expertise. This way both sides benefit. This approach also lets us accelerate our own innovation processes and to further penetrate adjacent and new markets.
Flexible go-to-market strategies accommodate rapidly changing marketsGoing forward we will address more customers with more flexibility and innovative go-to-market strategies. Histori-cally, Infineon has grown through close collaboration with key customers, with whom we have successfully defined products that then enabled us to penetrate the broad market. We reach many of our smaller customers through distributors. We will increase our leverage of the enormous potential of the distribution channel with standardized but configurable standard products for the mass market. Here we have made good progress by emphasizing short-term delivery reliability, continuous and tailored adjustment of the product portfolio and close partnership with distributors.
Digitalization and the Internet of Things create new business models. Manufacturers usually concentrate on making these devices “smart” with the best possible sensing and data processing capability. They are neither able nor interested in dealing with the underlying semiconductor technologies. We want to make our products and solutions more easily available to these vendors, for example through optimized product bundles and support in the form of reference designs. Here in particular, our system understanding makes the difference.
At the same time, we are engaging in networks consisting of distributors, development service providers and manufacturing service providers. These networks enable smaller companies and start-ups to jointly develop and manufacture electronics for new functions and new devices. This broad sales strategy lets us maximize revenues with existing technologies while at the same time increasing the return of our investments in research and development.
Long-term financial targets underline our growth ambitions
In the upcoming years, several structural trends will continue to drive our growth, in particular electro-mobility, renewable energies, manufacturing automation, data centers, Internet of Things and an increasing number of battery- powered devices. Thanks to our leading technologies, our understanding of applications and systems and our differentiating expertise in manufacturing, we have achieved an outstanding position in these markets. We want to take advantage of the resulting opportunities and to continue to outgrow the respective markets as well as to increase our profitability step by step. We are making targeted investments for this purpose. Our long-term financial targets reflect this claim. They are true through the cycle and are based on a stable global macro-economic environment.
Target 1: An average 9 percent annual revenue growth through the cycleWe hold leading positions in our core markets and have systematically entered adjacent markets in the past. Our four segments are positioned to capitalize on the megatrends mentioned earlier. Our strategic “Product to System” approach helps us develop better solutions with our broad technology and product expertise and thus to create significant added value for our customers. This lets us leverage additional potential revenue. Furthermore, we are using tailor-made go-to-market strategies to broaden our customer base and generate more business. The struc-tural growth drivers of our business are intact and we therefore expect an unchanged revenue growth of 9 percent through the cycle.
35Combined Management Report | Our Group Finances and strategy Group strategy
INFINEON TECHNOLOGIES | ANNUAL REPORT 2019

Target 2: 17 percent Segment Result Margin gradually improving through the cycleGrowth is only one prerequisite for sustainable success. Another criterion is profitability. When we work profitably on a sustainable basis, it means that we steer our developments to the point where they provide the highest benefit to our customers who are then willing to pay for them. In addition, we want to continue our development activities at unabated speed even in difficult market phases. We want to achieve an average Segment Result Margin of 17 percent of revenue through the cycle and plan to gradually improve this margin. Here, we are relying among other things on economies of scale and on cost advantages from the increasing share of 300-millimeter in our total manufacturing volume as well as on a disproportionately lower increase in operational costs. Technology leadership and the strategic “Product to System” approach also enable us to maintain a higher degree of differentiation.
Target 3: Investments amounting to 15 percent of revenue through the cycleOur planning is oriented towards providing the necessary manufacturing capacities for the expected growth. The accelerated growth is in particular driven by strong demand for power semiconductors, a field in which Infineon’s in-house manufacturing provides competitive differentiation. As a result, we reaffirm the target of an investment rate of 15 percent of revenue through the cycle.
In coming years, we also plan to invest a low triple-digit million amount in order to take advantage of possible addi-tional business opportunities and follow structural changes. These investments are not included in the 15 percent ratio described above. In addition, we have already announced investments in front-end cleanrooms and large office buildings, including the 300-millimeter cleanroom and the research and development building at the Villach site (Austria). In the 2019 fiscal year, around €200 million of this incurred. If these measures are implemented, the investment rate will temporarily be significantly higher than the rate provided in the target operating model.
Planned Cypress acquisition: improved competitive position; modification of the target business modelThe expected acquisition of Cypress will strengthen Infineons focus on structural growth drivers. We will be able to cover an even more comprehensive application spectrum in our target markets and will thus accelerate our course of profitable growth. The strategy already illustrated will also manifest in higher financial attractiveness. We expect the transaction to have a positive impact on the development of the Segment Result and adjusted earnings per share from the 2021 fiscal year onwards. This entails expected annual cost synergies of €180 million, which are expected to arise by the 2022 fiscal year primarily as a result of scale effects. However, revenue synergies resulting from cross-selling as well as from the consolidation of the complementary portfolios to form system solutions will be more decisive in the creation of value. We estimate these at more than €1.5 billion annually in the long term.
On closing of the acquisition, we will adjust our target operating model. During the integration process, we will leverage more and more of the synergies and meet our targets: By then, we expect revenue growth through the cycle for the larger, combined company to be slightly above our current target rate of 9 percent. The Segment Result Margin is to increase through the cycle from 17 percent to 19 percent. The investment-to-sales ratio will drop through the cycle from 15 percent to 13 percent because of the lower capital intensity of Cypress.
Capital structure targets demonstrate our long-term reliability
The long-term stability of the Company is of great importance from a variety of perspectives: It is important to our customers that Infineon remains a trusted partner that will also be able to supply reliably for many years to come. Our debt providers rely on our ability to securely service our debt over a long period of time. As an employer, we also want to give this kind of long-term reliability to our employees, even well beyond their active working lives in the form of retirement benefits. As a result, we give a high priority to solid creditworthiness and derive our conser-vative long-term and medium-term capital structure targets from the clear objective of maintaining our investment grade rating. This will remain the case during the course of the planned, transformative acquisition of Cypress and the associated demanding financial requirements.
36Combined Management Report | Our Group Finances and strategy Group strategy
INFINEON TECHNOLOGIES | ANNUAL REPORT 2019

Our gross cash target is €1 billion plus 10 to 20 percent of revenue. The fixed basic amount of €1 billion provides a solid liquidity reserve for contingent liabilities and retirement fund liabilities, which are independent of revenue. Furthermore, 10 to 20 percent of revenue means we always have access to enough cash to be able to finance the operative business and development activities for the future during all phases of the business cycle. The lower end of this liquidity target is also to be maintained during the planned acquisition of Cypress, a factor that we took into consideration when designing the financing structure. The upper limit on our gross financial debt is twice Earnings Before Interest, Tax, Depreciation and Amortization (EBITDA).
Because of the planned acquisition of Cypress, we will exceed the limit on our gross financial debt, however only to a degree that is compatible with the retention of the investment grade rating. Infineon’s medium-term target after the acquisition is a rigorous reduction of debt either to or below the maximum target value in accordance with our capital structure target.
The rating agency S&P Global Ratings (S&P) currently rates Infineon’s creditworthiness as “BBB” and, following the announcement of the planned acquisition of Cypress, placed us on “CreditWatch” with a negative outlook. This is however typical for transactions of this type and means that, after an inspection of the actually achieved financial circumstances by S&P following the completion of the acquisition, a possible reduction of the rating by a maximum of one grade could occur, which would still correspond to the investment grade.
Sustainable value creation for our shareholders
Our strategy has paid off: Infineon continues its path of sustainable, profitable growth. We also pursue a dividend policy aimed at letting shareholders adequately participate in Infineon’s economic development and at paying out at least an unchanged dividend even in periods of slower growth.
Human Resources strategyOur Human Resources strategy makes an important contribution to ensuring that Infineon can achieve its growth and profitability targets and navigate smoothly through different economic phases. The strategy is therefore designed to enable our employees to be successful in the long term. Successful in the sense that they enjoy doing what they do and are motivated to take on even the most challenging tasks. And long-term in that we prepare together for the working conditions of tomorrow and thereby help safeguard each individual employee’s ability to work on a sustainable basis. Therefore, we need to ensure an attractive working environment, competitive talent management and high-performance HR processes.
In order to remain innovative, competitive and successful in the future, Infineon constantly searches for the most talented individuals. This is not an easy task, given the increasing scarcity of experts. Talent management also includes successfully integrating new colleagues. We do this with a combination of systematic and individually tailored onboarding measures. One of our great advantages is Infineon’s positive employer image, which helps win over and retain talents. The fact that we make future-oriented products and create value for society makes our company very attractive to potential employees.
We also define ourselves by the way we work together, for instance with a well-developed culture of feedback, which is actively practiced at our company. One example: our “Leadership Dialog” – a format in which employees provide their managers with feedback. The new Infineon Leadership Principles underpin our commitment to continuously improving our leadership qualities. Introduced by top management in spring 2019, these principles encourage both feedback and self-reflection. This approach not only helps strengthen efficiency within the organi-zation, it also fosters a strong team spirit across our international working environment with colleagues from over 100 nations. We are proud of this diversity. In 2019, Infineon celebrated its first global Diversity Day, in all respects a highly successful event. Furthermore, we have already achieved our interim target of 15 percent women in leadership positions, which we set ourselves for 2020 (long-term target: 20 percent).
37Combined Management Report | Our Group Finances and strategy Group strategy | Human Resources strategy
INFINEON TECHNOLOGIES | ANNUAL REPORT 2019

The most recent Great Place to Work® survey confirmed the satisfaction of our workforce – not only in Germany, but also worldwide. More than 80 percent of the employees surveyed at Infineon gave their employer an excellent evaluation: “Taking everything into account, I would say this is a great place to work.” This is yet another reason for us to continue preparing the Company for the working environment of the future – also in order to remain attractive to new generations of employees. This entails the flexible design of working conditions (for example work hours, mobile working, sabbatical) as well as the ongoing development of workstations in manufacturing (“Industry 4.0”). Here we highly value constructive dialog and trust-based collaboration with Workers’ Councils. We also orient our learning formats to take account of digitalization and future working environments. With LinkedIn Learning for example, our employees have on-demand access to a wide range of high-quality training courses in various languages.
We continue to work on designing an HR infrastructure that allows the organization to react flexibly to growth and changing requirements. In order to achieve this, we constantly improve core processes in HR, for example performance management, the process of succession planning and compensation planning. We use the new user-oriented processes and tools to strengthen the employees in the self-directed performance of their respon-sibilities for their personal development. People are the focus of our actions: The highest level of long-term entrepreneurial performance can only be achieved by happy, healthy and successful employees.
Alongside its core functions, the planned acquisition of the US company Cypress is of high priority for HR. In the preparations to integrate the Cypress workforce of nearly 6,000 employees worldwide, HR makes a significant contribution to the successful implementation of the acquisition – in strategic, financial and cultural terms.
You will find further information including detailed statistics in the 2019 sustainability report and in the 2019 Human Resources report. @ www.infineon.com/csr_reporting @ www.infineon.com/hrreport
Infineon Leadership Principles
Infineon Leadership Principles
Desire to grow and motivate others to do so, too
Take ownership
Integrity, trust and consistency are the
basis for your actions
Create a framework of action for success to achieve results
Leadership starts with leading yourself and acting as a role model
Begin with the big picture and set motivating targets
Our leadership model: Our people are the key for success
Team success is a priority: Empower and coach your people, provide a framework for success and focus on result
38
INFINEON TECHNOLOGIES | ANNUAL REPORT 2019
Combined Management Report | Our Group Finances and strategy Human Resources strategy

Infineon is divided into four segments whose strategic deployment is derived from the Group Strategy. All activities can be allocated to one of the higher-level growth drivers: Energy Efficiency, Mobility, Internet of Things & Big Data, and Security. Here the segments are responsible for particular areas that reflect their respective core competencies. The Automotive segment is responsible for business with semiconductors for automotive electronics. The Industrial Power Control segment concentrates on power semiconductors primarily used in industrial applica-tions, while the Power Management & Multimarket segment addresses consumer-oriented applications and power supplies in general. Activities relating to classic and new security appli-cations are consolidated in the Digital Security Solutions segment.
Our markets are continuously converging, so that a strict organizational delimitation would not be appropriate. Technologies and products are increasingly being put to use in global applications, according to our strategic “Product to System” approach. The digital transformation in particular calls for flexible and innovative approaches. Teams from various organizational units work on an application-oriented and expertise-specific basis. In these cases, one segment takes on responsi-bility for the overall system and develops the roadmap for the application, while responsibility for the necessary technologies and products remains in the established organizational units. Similarly, the segments collaborate when it comes to technology development. Electro-mobility is a core topic for the Automotive segment, and accordingly this segment is responsible for the system. Nevertheless, the segments Industrial Power Control and Power Management & Multi-market also benefit from the developments in the necessary charging infrastructures as well as from new requirements in vehicles.
The segments
39Combined Management Report | Our Group The segments
INFINEON TECHNOLOGIES | ANNUAL REPORT 2019

Automotive
The Automotive segment in the 2019 fiscal year
The Automotive segment provides semiconductors and semiconductor solutions for automotive applications. Its broad product portfolio of microcontrollers, intelligent sensors, transmitting and receiving ICs for radio-frequency and radar applications as well as discrete and integrated power semiconductors cover the most important application fields in the vehicle: powertrain & energy management, body and convenience electronics as well as safety. For over 40 years, this comprehensive product palette, combined with a high level of quality, innovation and long-term partnership-based collaboration along the value chain has made us a preferred partner in the automotive industry. Our technologies contribute to sustainable mobility by reducing fuel consumption, emissions and costs on the one hand and by increasing safety and performance on the other.
Applications
Assistance systems and safety systems› ABS (Anti-blocking system)› Airbag› Automatic parking › Blind spot detection› Cruise control› Distance warning systems › Electronic chassis control› Electronic power steering› Emergency braking assistant› ESP (Electronic Stability Program)› Lane departure warning system› Tire pressure monitoring system
Comfort electronics› Air conditioning› Body control units› Door electronics› Electronic seat adjustment› Hatch door› Lighting› Power window› Steering› Sunroof› Suspension› Windshield wipers
Powertrain› Battery charging control› Battery management› Combustion engine control› Electric motor control› Generator control› Start-stop system› Transmission control
Security› Communication (car-to-car,
car-to-infrastructure)› Original spare parts
authentication› Protection against
manipulation (e.g. odometer)› Protection against
software manipulation› Tachograph
Strategic deployment The automotive industry is facing a structural transformation. We can expect to see more change over the next five years than in the last 20 years. The reasons for this are the desire for more and more intelligent cars and the need to comply with continuously more demanding emission standards and with calls for sustainable mobility.
REVENUE€3,503 million
SEGMENT RESULT €404 million
40Combined Management Report | Our Group The segments Automotive
INFINEON TECHNOLOGIES | ANNUAL REPORT 2019

When it comes to driver assistance systems, whether in partially autonomous vehicles or the autonomous taxis and busses of the future, demands dictate that these vehicles do not make a single mistake while driving (in contrast to their human counterparts) and that they always work perfectly. And after an error or defect, these vehicles are also expected to continue functioning reliably until they come to a stop in a situation which is safe for all pedestrians and motorists. This degree of error-tolerant behavior requires extremely high reliability of the overall system “car” and thus of all the car’s control units and their components. They all have to be error-tolerant and highly reliable, i.e. protected against failure, and must remain so for the entire lifetime of the vehicle. For quite some time, Infineon has offered concepts and solutions for reliability on the component and subsystem level. The Company’s semicon-ductor solutions make it possible to build systems that meet the high requirements of functional safety defined in ISO 26262. They also secure data communication both within the car and with the outside world. Here, the focus is on the provision of reliable sensors, reliable microcontrollers, reliable power electronics, reliable vehicle communi-cations and reliable power supplies.
Our products are ideally suitable not only both for classical applications in the vehicle – drivetrain, comfort, safety – but also for keeping up with the megatrends of the industry such as electro-mobility and automated driving. In the case of classic applications, our growth is driven on the one hand by new functions in the area of lighting technologies, comfort and safety and, on the other hand, by the further electrification of various vehicle functions. This means an increase in the number of electronic components and thus in the semiconductors required for each vehicle. The two megatrends electro-mobility and automated driving further raise the average semiconductor demand per vehicle. While it will take some time before autonomous driving is introduced and becomes widespread, driver assistance systems are in high demand among customers and will continue their already robust growth tendency into the years to come. By contrast, electro-mobility is still at the beginning of the market penetration phase.
In the area of power electronics, we are the unchallenged market leader in automotive when it comes to silicon- based semiconductor solutions. New materials such as silicon carbide and gallium nitride are well suited for use in power electronics and open up additional potential improvements in efficiency and power density. Today we are the only manufacturer in the automotive power electronics sector who can offer the entire portfolio of technologies and package form factors – from the unpackaged chip all the way to the highly-integrated module – and can thus offer the right solution for the widest possible variety of customer requirements. On the way to automated driving, as the number two in sensor chips today we already benefit greatly from the constantly growing number of driver assistance systems. These systems make an enormous contribution to increasing traffic safety and preventing accidents. In the long-term, the number of radar systems in the vehicle will rise and they will be complemented by additional sensor technologies more so than they are today. Infineon will not only profit from this development when it comes to sensor chips. Our AURIX™ family microcontrollers handle an essential part of signal processing for example in radar and camera-based driver assistance systems.
Additional semiconductor demand per vehicle raised by electro-mobility and automated drivingin US$
48 V and mild hybrid
vehicle
Level 2+1Combustion engine vehicle
Level 21Full hybrid and plug-in
hybrid vehicle
Level 31Pure electric vehicle
Level 4 and
Level 51
417 417417 417
114560
160
417 417
368 630
417 417
358
970
Electro-mobility: additional semiconductor demand per vehicle Automated driving: additional semiconductor demand per vehicle Standard vehicle
1 Refers to the defined degree of automatization.
Sources: Strategy Analytics, “Automotive Semiconductor Content,” August 2019; IHS Markit, Automotive Group, “Alternative propulsion forecast,” September 2019; Infineon
531
977
417577
785
1,047
775
1,387
41Combined Management Report | Our Group The segments Automotive
INFINEON TECHNOLOGIES | ANNUAL REPORT 2019

Furthermore, they take on additional importance as the degree of automation in vehicles rises together with the associated requirements for secure, reliable control systems in the automobile. The microcontrollers of our AURIX™ family take control of systems (for example steering and brakes) and function as host controllers that ensure the functional safety of central control units.
Essential elements in our success are partnership-based customer relationships, our rigorous quality strategy and the continuous further development from product thinking to system understanding. We want to understand the systems and applications of our customers and their success factors and to offer them decisive added value with products oriented to the requirements of the future. This close collaboration along the entire value chain enables targeted innovation and generates new possibilities for us to differentiate from our competition and to achieve permanent profitable growth. As described in the Group strategy, with our integration in the Volkswagen group’s strategic supplier network FAST we are one of Volkswagen’s most important partners in the area of electro- mobility. Together with our customers, we want to help bring electro-mobility to everyday life. Our rigorous quality strategy is highly appreciated. Toyota, Japan’s largest automobile manufacturer, has already honored us several times with awards for defect-free deliveries to its Hirose (Japan) plant; in 2019 we received an award for what is in the meantime five years of absolutely defect-free quality. This quality strategy empowers us to grow faster than the market, for example in Japan. And we were the first semiconductor manufacturer ever to be honored by the Korean car manufacturer Hyundai Kia as “Partner of the Year” in recognition of our quality and innovation. Continental, one of the world’s largest automobile component suppliers, chose Infineon as “2018 Supplier of the Year” in the category “Electronics”.
Market position The world market for automotive semiconductors expanded by 9.3 percent from US$34.469 billion in the 2017 calendar year to US$37.668 billion in the 2018 calendar year (Source: Strategy Analytics). All regions contributed to growth. Europe remained by far the largest region, at about US$13 billion, followed by China and North America with revenue volumes of about US$7 billion each. With a market size of about US$6 billion, Japan is only negligibly smaller than these two regions. Infineon achieved record growth in Japan last year with a revenue increase of 24.7 percent and an increase in market share of 1.1 percentage points. Infineon is further gaining momentum in Japan. With a market share of 7.3 percent Infineon already achieved number four in the market. This means there is still disproportionally high growth potential in the future. Infineon was also able to achieve double-digit increases in revenue in China (growth of 19.2 percent) and Europe (growth of 13.0 percent). In the other regions, Infineon’s growth was in the single-digit percentage range.
Infineon further strengthened its position as number two in the overall automotive semiconductor market. While the market leader lost 0.4 percentage points market share to land at 12.0 percent, Infineon increased its market share by 0.4 percentage points to 11.2 percent. The market share of the third-largest company dropped by 1.1 percentage points to 8.9 percent. The five largest market players together account for a market share of 47.9 percent.
World automotive semiconductor market share 2018
Source: Strategy Analytics, “Automotive Semi conductor Vendor Market Shares,” April 2019.
Comparability limited due to differing reporting period (fiscal year-end) and currency.
NXP
Infineon
Renesas
Texas Instruments
STMicroelectronics
12.0 %
11.2 %
8.9 %
8.2 %
7.6 %
42Combined Management Report | Our Group The segments Automotive
INFINEON TECHNOLOGIES | ANNUAL REPORT 2019

Revenue development In the Automotive segment, Infineon recorded revenue of €3,503 million in the 2019 fiscal year, an increase of 7 percent compared to the €3,284 million revenue of the previous year. The segment contributed 44 percent of the Group revenue.
In contrast to previous years, growth in global vehicle manufacturing did not continue during the 2019 fiscal year. Market analysts expect for the 2019 calendar year that the number of vehicles manufactured worldwide will decrease by approximately 6 percent compared to the preceding year.
In spite of overall lower vehicle manufacturing levels during 2019 fiscal year, Infineon’s Automotive segment continued to grow. This is due on the one hand to Infineon’s strong presence in vehicles of the premium and upper mid-range classes. On average, both vehicle classes contain more semiconductors than vehicles of the mid-range and compact classes. On the other hand, it is due to the fact that production of premium and upper mid-range vehicles dropped less percentage-wise than worldwide vehicle manufacturing as a whole.
Among other things, Infineon benefits from new functions in the areas lighting systems, comfort and safety as well as from electrification of previously hydraulic and electro-mechanical systems. In addition, the two megatrends electro-mobility as well as automated driving and driver assistance systems, respectively, continue to determine the increase in the average semiconductor content of cars. They are among the structural growth factors for Infineon and are expected to account for approximately two thirds of growth in the Automotive segment over the next five years.
In addition to batteries, semiconductors are an essential component in the electro-mobility megatrend. Infineon currently offers the industry’s widest range of power semiconductors with the corresponding assembly and connection technologies for chip and package: from individual chips (so called “bare die”) to discrete components, chips embedded in printed circuit boards all the way to entire modules. Here Infineon uses both the classic semiconductor material silicon and the new material silicon carbide. Infineon’s broad product portfolio and com-prehensive system know-how help Infineon react flexibly to customer requirements. Furthermore, Infineon offers the additional components needed for the overall system in addition to power semiconductors: control ICs, microcontrollers and sensor technologies. Thus, Infineon makes it possible for its customers to develop their products in an easy and timesaving way. The Infineon product portfolio also meets the high quality and reliability requirements of the automotive industry.
Revenue and Segment Result of the Automotive segment€ in millions
3,503
404
2019
3,284
466
2018
Revenue Segment Result
43Combined Management Report | Our Group The segments Automotive
INFINEON TECHNOLOGIES | ANNUAL REPORT 2019

Industrial Power Control
The Industrial Power Control segment in the 2019 fiscal year
The Industrial Power Control segment specializes in the efficient conversion of electric energy along the entire supply chain (generation, storage, transmission and consumption) with a focus on efficient drives, intelligent motor control units and renewable energies. The comprehensive product portfolio consists mainly of IGBT power tran-sistors, driver ICs for their control, and silicon carbide-based components. We offer the products in various form factors, such as discrete components and modules with different levels of functionality, and cover almost the entire power range from a few hundred watts up to several megawatts. The application fields range from wind power and photovoltaic systems to energy storage systems, high-voltage direct current transmission (HVDC), traction, industrial drives, all the way to major home appliances.
Applications
Energy consumption Energy generation Energy transmission
Home appliances› Air conditioners› Dishwashers› Induction cooktops› Microwave ovens› Refrigerators› Vacuum cleaners › Washing machines
Industrial vehicles› Agricultural vehicles› Construction vehicles› Electric delivery vehicles› Forklifts › Hybrid busses
Industrial drives 1› Air conditioning
technology› Automation technology› Drives technologies › Elevator systems› Escalators › Materials handling › Oil derricks› Pipelines› Rolling mills
Traction› High-speed trains› Locomotives› Metro trains› Trams
Industrialpower supplies› Auxiliary power
supplies› Battery chargers› Charging stations for
electric vehicles› Home energy storage› Uninterruptable
power supplies
Industrial Robotics
› Energy storage› Photovoltaic systems› Wind power turbines
› FACTS (Flexible AC Transmission Systems)
› Offshore wind farm HVDC transmission lines
› Overland HVDC transmission lines
REVENUE€1,418 million
SEGMENT RESULT €251 million
1 Including motors, compressors, pumps and fans.
In the area of power semiconductors, Infineon is significantly better positioned than the competition when it comes to the future growth of electro-mobility and the associated considerable increase in demand for power semicon-ductors. This is because, for years, Infineon has invested significantly more than its competitors in manufacturing capacities. The ability of a semiconductor supplier to cover the expected strong increase in demand consistently and with supply reliability is an important competitive edge. Infineon’s semiconductor solutions fit for all types of electric vehicles: Pure electric vehicles as well as hybrid and plug-in hybrid vehicles, including 48 volt technologies. In China, the world’s largest market for electro-mobility, the robust growth in the production of vehicles continued with plug-in hybrid and pure electric drives by almost 60 percent in the 2018 calendar year. However, in the second half of the 2019 calendar year, demand dropped significantly due to the cut of subsidies by the Chinese government.
Together with its partner Schweizer Electronic AG, in the 2019 fiscal year Infineon brought chip embedding, an innovative technology in the area of 48 volt technologies for mild-hybrid vehicles, onto the market. Here low- voltage transistors from Infineon are already put into the printed circuit board (PCB) as early as during production of the PCB by Schweizer Electronic AG, instead of assembling and soldering the transistors on the PCB, the tradi-tional technology today. Chip embedding creates substantial added values for Infineon’s customers, since their systems are made more compact and even more efficient. For example, compared to a conventionally structured system, chip-embedding technology increases the performance capabilities of a 48 volt starter generator by about 60 percent.
In the area of driver assistance systems, dynamic growth continued in the context of the megatrend automated driving. Once again, revenues from radar sensor ICs and AURIX™ microcontrollers increased substantially during the 2019 fiscal year. 77 gigahertz radar systems suitable for use over medium and long distances saw particularly strong demand.
Growth for AURIX™ microcontrollers was driven primarily by their use as signal processors in radar systems and as host processors in camera systems. Demand for the use of the controller in the central gateway, in the telematics unit and as a gateway to the infotainment system of the vehicle also showed very positive development. The significance of the AURIX™ microcontroller for the sensor fusion box, the unit, which gathers all the signals for driver assistance, continued to increase. However, the revenue in this area was still relatively small. Demand also devel-oped nicely in the classic microcontroller application areas, i.e. powertrain and general safety systems, however, at a significantly lower growth rate compared to the area of driver assistance systems.
Development of the Segment ResultSegment Result was €404 million and thus lower than the previous year’s Segment Result of €466 million. Based on revenue, the Segment Result Margin was 11.5 percent (previous year: 14.2 percent).
In spite of the positive increase in revenue, in the previous fiscal year the Segment Result decreased. This was essen-tially due to the fact that revenue growth was for the most part based on the demand for electro-mobility products. Compared to a share of approximately 10 percent in the previous year, their share of segment revenue increased in the meantime to approximately 13 percent; however, due to large investments in development and manufacturing, the profitability of these products is still not at the average margin level of the Automotive segment. In addition, at the beginning of the 2019 fiscal year, a higher growth rate than the actually achieved 7 percent was expected. Consequently, it was not possible to fully utilize the available manufacturing capacities, especially during the second half of the fiscal year. This resulted in idle costs that had a negative impact on the Segment Result.
44Combined Management Report | Our Group The segments Automotive
INFINEON TECHNOLOGIES | ANNUAL REPORT 2019

Industrial Power Control
The Industrial Power Control segment in the 2019 fiscal year
The Industrial Power Control segment specializes in the efficient conversion of electric energy along the entire supply chain (generation, storage, transmission and consumption) with a focus on efficient drives, intelligent motor control units and renewable energies. The comprehensive product portfolio consists mainly of IGBT power tran-sistors, driver ICs for their control, and silicon carbide-based components. We offer the products in various form factors, such as discrete components and modules with different levels of functionality, and cover almost the entire power range from a few hundred watts up to several megawatts. The application fields range from wind power and photovoltaic systems to energy storage systems, high-voltage direct current transmission (HVDC), traction, industrial drives, all the way to major home appliances.
Applications
Energy consumption Energy generation Energy transmission
Home appliances› Air conditioners› Dishwashers› Induction cooktops› Microwave ovens› Refrigerators› Vacuum cleaners › Washing machines
Industrial vehicles› Agricultural vehicles› Construction vehicles› Electric delivery vehicles› Forklifts › Hybrid busses
Industrial drives 1› Air conditioning
technology› Automation technology› Drives technologies › Elevator systems› Escalators › Materials handling › Oil derricks› Pipelines› Rolling mills
Traction› High-speed trains› Locomotives› Metro trains› Trams
Industrialpower supplies› Auxiliary power
supplies› Battery chargers› Charging stations for
electric vehicles› Home energy storage› Uninterruptable
power supplies
Industrial Robotics
› Energy storage› Photovoltaic systems› Wind power turbines
› FACTS (Flexible AC Transmission Systems)
› Offshore wind farm HVDC transmission lines
› Overland HVDC transmission lines
REVENUE€1,418 million
SEGMENT RESULT €251 million
1 Including motors, compressors, pumps and fans.
45Combined Management Report | Our Group The segments Industrial Power Control
INFINEON TECHNOLOGIES | ANNUAL REPORT 2019

Strategic deploymentPower semiconductors are a central element in the products and systems of our customers, determining the basic function, efficiency, size, weight and costs of the systems. The Industrial Power Control segment products form the foundation for the efficient generation, storage and almost completely lossless transmission of electric energy, as well as for reducing the losses during consumption. The core business consists of discrete IGBTs, unpackaged IGBT chips that the customer then assembles into modules, IGBT modules and the respective associated driver ICs. We intend to further strengthen this core. We continuously develop our existing products, leveraging our economies of scale in both research and development as well as in manufacturing in order to achieve a broad portfolio opti-mized for both cost and performance. In addition, we develop products with long-term potential for differentiation. One example here is the PrimePACK™ module, which combines the IGBT5 chip technology with the .XT bonding and connection technology. While the IGBT5 chip technology allows higher power densities with lower static and dynamic losses, the .XT bonding and connection technologies in the module provide a longer service life through improved thermal load cycle capability. This provides our customers with significant added value for high-power inverters in wind and photovoltaic applications as well as in industrial drives.
We strengthen and expand our product core based on new materials. We have also successfully ramped our silicon carbide (SiC) MOSFET technology and reached series manufacturing readiness. The Easy module family is a central success factor here, offering our customers a flexible and easily scalable module solution. This has given the family a key position in applications such as photovoltaics, industrial automation and charging infrastructures for electric vehicles. In addition to the modules, we are now strengthening series manufacturing of our comprehensive discrete SiC MOSFET product portfolio. Our SiC products guarantee our customers the reliability Infineon is known for and the support in developing systems based on this new material. This gives us a leading role in the area of silicon carbide for industrial applications.
The Industrial Power Control segment uses the expertise gained in the application of discrete IGBTs and IGBT modules to grow in adjacent product categories, for example with Intelligent Power Modules (IPMs). By a higher level of functional integration, i.e. integrating drivers and switches, our CIPOS™ IPMs provide higher efficiency for drives for smaller motors and thus help our customers meet new energy efficiency standards for home appliances and for industrial applications. Furthermore, these integrated products enable a significant reduction in system size and development effort. The products of the iMOTION™ family, in principle application-optimized microcon-trollers, enable easy-to-implement intelligent motor control. Infineon offers reference designs and ready-to-use solutions for these compact products. With Infineon’s special algorithms for motor control drivers, customers only need to adjust a few parameters in order to receive a high-performance motor control solution suited to their challenges. iMOTION™ products are used in home appliances of all types, from hair dryers and washing machines to air conditioners.
Based on this portfolio the Industrial Power Control segment addresses long-term high-growth application fields such as industrial automation, renewable energies and home appliances, while at the same time covering emerging power semiconductor applications such as charging infrastructures for electric vehicles and electric utility vehicles.
Market positionThe world market for IGBT-based power semiconductors – discrete IGBT power transistors and IGBT modules – reached US$6.224 billion in the 2018 calendar year, an increase of 17.4 percent compared to the previous year’s value of US$5.303 billion (Source: Informa Tech). Infineon was able to further improve its leadership position with a market share of 28.6 percent (an increase of 1.8 percentage points). The five largest market players together accounted for a market share of 66.4 percent.
P see page 57
46Combined Management Report | Our Group The segments Industrial Power Control
INFINEON TECHNOLOGIES | ANNUAL REPORT 2019

A fast growing sub-market of IGBT-based power semiconductors are IPMs. In the 2018 calendar year, we were able to increase our revenue in this area by 24.2 percent and were thus significantly above the market growth of 7.6 percent. As a result, we gained 1.6 percentage points in market shares and further improved our top-3 position. The Infineon market share for IPMs is now 12.0 percent.
Revenue developmentIn the Industrial Power Control segment Infineon recorded revenue of €1,418 million in the 2019 fiscal year, an increase of 7 percent compared to the €1,323 million revenue of the previous year. The segment contributed 18 percent of the Group revenue.
In the previous fiscal year, almost all areas contributed to the revenue increase. The growth rates of the business areas wind energy, industrial power supplies, traction and energy transmission were above the segment average.
The second-largest absolute revenue increase came from the drives business, the segment’s largest, accounting for approximately one third of segment revenue. The reason for the revenue increase was essentially the further increase of the automation level in factories and industrial manufacturing systems. This was particularly evident in the first half of the fiscal year and affected all power classes of the product portfolio.
World IGBT-based power semiconductor market share 2018
Source: Based on or includes content supplied by Informa Tech (former IHS Markit Technology), “Power Semiconductor Market Share Database 2018,” September 2019.
Comparability limited due to differing reporting period (fiscal year-end) and currency.
Infineon
Mitsubishi
Fuji Electric
ON Semiconductor
Semikron
28.6 %
15.2 %
9.7 %
7.2 %
5.7 %
World IPM market share 2018
Source: Based on or includes content supplied by Informa Tech (former IHS Markit Technology), “Power Semiconductor Market Share Database 2018,” September 2019.
Comparability limited due to differing reporting period (fiscal year-end) and currency.
Mitsubishi
ON Semiconductor
Infineon
Fuji Electric
Semikron
32.3 %
18.9 %
12.0 %
10.0 %
5.8 %
1,418
251
1,323
256
20192018
Revenue and Segment Result of the Industrial Power Control segment€ in millions
Revenue Segment Result
47Combined Management Report | Our Group The segments Industrial Power Control
INFINEON TECHNOLOGIES | ANNUAL REPORT 2019

The home appliances business segment, accounting for approximately one fifth of revenue, is the second-largest area in the segment. Following a period of growth, this area did not grow in the previous fiscal year. Because of new efficiency regulations on energy consumption, for example in China, demand for inverterized home appli-ances – for example air conditioners and washing machines – is expected to remain at a high level. Mainly our CIPOS™ family IPMs as well as iMOTION™ family motor control solutions will benefit from this. The positive market acceptance of our products can also be seen in the increase of our IPM market share (see the section “Market position” in this chapter).
The area of renewable energies showed very nice growth. The Industrial Power Control segment generates almost 10 percent of its revenue with wind energy products. Here revenues increased by more than 35 percent and provided the highest absolute revenue increase within the segment. This was on the one hand due to the robust global expansion of wind energy, which is expected to increase by more than 65 gigawatts of newly installed output worldwide in the 2019 calendar year. On the other hand, Infineon landed important customer orders with the PrimePACK™ IGBT5 .XT. However, during the previous fiscal year, the situation in photovoltaics was somewhat different. The first half of the fiscal year was characterized by reticence stemming from political uncertainties. The Chinese government’s May announcement that it would keep the expansion of photovoltaic systems stable in the 2019 calendar year compared to the year before and that it would increase reliance on auction-based models created a substantial catch-up effect in the second half of the 2019 calendar year, resulting in total in revenue growth of 4 percent. In the coming years, global expansion of photovoltaics is expected to continue to grow. This expansion is driven by Europe, the Middle East, Africa and Southeast Asia. The area of photovoltaics contributed approximately 10 percent to the segment revenue.
Revenue growth in the area of traction systems was around 10 percent, with the focus remaining on China, where there was demand for all traction variants: high-speed trains, urban rail systems as well as electric and partially electric locomotives for freight trains.
Areas with smaller revenue shares also contributed to revenue growth. The connection of wind and solar parks remained the growth driver in the area of energy transmission. In addition, there was demand from major infra-structure projects in high-voltage direct current transmission (HVDC) in China, the USA and India. Revenue in the area of industrial power supplies increased by approximately 15 percent, while revenue for industrial vehicles dropped, mainly for hybrid busses, in particular as a result of modified subsidy policies in China.
In the 2019 fiscal year Infineon further expanded its portfolio of silicon carbide transistors, adding 12 discrete products as well as seven more derivatives in Easy module packages for the silicon carbide MOSFETs of the 1200 volt voltage class, already very well established in the industrial market. A product family with 650 volt CoolSiC™ MOSFETs was also introduced. This expanded the previous spectrum, which principally addressed industrial switched-mode power supplies and PV inverters, to include battery-charging infrastructure, energy storage solutions, motor drives, auxiliary inverters for traction systems, switched-mode power supplies for servers and telecom applications as well as industrial power supplies. This wide variety of possible application fields results in the industrial sector in a justified potential revenue of around €1 billion in the upcoming years. Thanks to its leading position in the relevant chip and package technologies, Infineon is ideally positioned to leverage the market potential. Thus, for example, revenue from silicon carbide MOSFETs in industrial applications increased by more than a factor of four compared to the previous fiscal year.
Development of the Segment ResultSegment Result was €251 million, representing a slight decrease compared to the previous year’s Segment Result of €256 million. Based on revenue, the Segment Result Margin was 17.7 percent (previous year: 19.3 percent).
Segment Result was positively impacted by the higher contribution from the increased revenue. However, the costs for input factors in manufacturing (raw materials, auxiliary materials and operational materials, silicon and silicon carbide raw wafers) increased significantly compared to the previous year. During the second half of the fiscal year in particular, partly lower market demand in individual areas resulted in underutilization of available capacities in parts of the manufacturing landscape, leading to increased idle costs.
P see page 47
Power Management & Multimarket
The Power Management & Multimarket segment in the 2019 fiscal year
The Power Management & Multimarket segment covers business with power semiconductors for energy manage-ment, components for cellular infrastructure and mobile devices as well as high-reliability components for harsh environments. Infineon is the clear market leader in the MOSFET market. Our leading basis technologies allows us to offer a broad product portfolio of drivers, controllers and MOSFET power transistors. Our power management products set standards in terms of the two most important requirements of the market: efficiency in conversion and power density.
Our power semiconductors and radio-frequency components service the cellular infrastructure sector. We also cover the market for mobile devices with additional radio-frequency components which differ from those for cellular communications in terms of performance and frequency. Furthermore, we see an enormous growth potential for our sensors in this application area: MEMS-based microphones and pressure sensors, 24-gigahertz and 60-giga-hertz radar sensor ICs as well as 3D sensors.
Applications
Audio amplifiers › Battery-powered loudspeakers › Smart speakers
BLDC motor › Battery-powered gardening
equipment (e.g. hedge trimmers, lawn mowers)
› Battery-powered home appliances (e.g. vacuum cleaners)
› Battery-powered power tools (e.g. cordless screwdrivers, drills, power saws)
› eBikes› eScooters› Multicopters
Cellular communications infrastructure › Base stations
Charging stations for electric vehicles
HiRel › Aerospace systems› Aviation technologies› Defense technologies › Oil and gas exploration› Submarine
telecommunications
Internet of Things› Communications› Sensors› Smart speakers› Voice control
LED and conventional lighting systems
Mobile devices › Activity trackers› Navigation devices › Smartphones› Tablets
Power management› Consumer electronics› Home appliances › Mobile devices› PCs and notebooks› Servers› Telecommunication
technology
REVENUE€2,445 million
SEGMENT RESULT €585 million
48Combined Management Report | Our Group The segments Industrial Power Control
INFINEON TECHNOLOGIES | ANNUAL REPORT 2019

Power Management & Multimarket
The Power Management & Multimarket segment in the 2019 fiscal year
The Power Management & Multimarket segment covers business with power semiconductors for energy manage-ment, components for cellular infrastructure and mobile devices as well as high-reliability components for harsh environments. Infineon is the clear market leader in the MOSFET market. Our leading basis technologies allows us to offer a broad product portfolio of drivers, controllers and MOSFET power transistors. Our power management products set standards in terms of the two most important requirements of the market: efficiency in conversion and power density.
Our power semiconductors and radio-frequency components service the cellular infrastructure sector. We also cover the market for mobile devices with additional radio-frequency components which differ from those for cellular communications in terms of performance and frequency. Furthermore, we see an enormous growth potential for our sensors in this application area: MEMS-based microphones and pressure sensors, 24-gigahertz and 60-giga-hertz radar sensor ICs as well as 3D sensors.
Applications
Audio amplifiers › Battery-powered loudspeakers › Smart speakers
BLDC motor › Battery-powered gardening
equipment (e.g. hedge trimmers, lawn mowers)
› Battery-powered home appliances (e.g. vacuum cleaners)
› Battery-powered power tools (e.g. cordless screwdrivers, drills, power saws)
› eBikes› eScooters› Multicopters
Cellular communications infrastructure › Base stations
Charging stations for electric vehicles
HiRel › Aerospace systems› Aviation technologies› Defense technologies › Oil and gas exploration› Submarine
telecommunications
Internet of Things› Communications› Sensors› Smart speakers› Voice control
LED and conventional lighting systems
Mobile devices › Activity trackers› Navigation devices › Smartphones› Tablets
Power management› Consumer electronics› Home appliances › Mobile devices› PCs and notebooks› Servers› Telecommunication
technology
REVENUE€2,445 million
SEGMENT RESULT €585 million
49Combined Management Report | Our Group The segments Power Management & Multimarket
INFINEON TECHNOLOGIES | ANNUAL REPORT 2019

Strategic deployment High efficiency, increasing performance and small form factors: The trend for power supplies continues unabated. Power density in particular is becoming a decisive parameter. Our concepts in the area of “Digital Power Manage-ment” – the transformation from analog to digital regulation of power supplies – are in line with this trend, with technology that does more, consumes less and is available for all.
The power transistors of the CoolMOS™ and OptiMOS™ families, together with corresponding drivers form the core of the Power Management & Multimarket segment’s power semiconductor business. Infineon’s leading technologies for low voltages (up to 40 volts), medium voltages (40 volts to 500 volts) and higher voltages (over 500 volts) allow us to cover a broad power semiconductor application spectrum. Examples of application areas are power conversion for data centers, battery-powered devices as well as cellular infrastructure.
Building on our deep understanding of customer applications, we continuously develop new modifications of existing products in order to penetrate adjacent and new fields of application. One example is the further develop-ment of the OptiMOS™ basis technology. The new OptiMOS™ Linear FET technology fulfills two requirements that were mutually exclusive in the past: On the one hand, the power transistors of this innovative product family have a very low on-state resistance, and on the other hand they can be operated in wide operating ranges. Thanks to this innovation, this product family can capture new application fields, for example battery management systems for cellular base stations.
Battery-powered devices are among the strongest-growing applications in this MOSFET product group, usually in connection with brushless direct current (BLDC) motors. Here we have shown that we can use existing products to cover new applications like eScooters. Furthermore, Infineon continuously expands its product portfolio for digital load control and focuses on technologically adjacent markets, for example point of load controllers for data centers and Class D audio amplifiers.
In research and development as well as in manufacturing we benefit from scale effects which we reinforce with our market position. This way we can expand our core portfolio of silicon-based power semiconductors to include switches based on new materials such as gallium nitride (GaN). We began volume manufacturing of CoolGaN™ products in the 2019 fiscal year.
In the radio-frequency and sensor technologies businesses – the second mainstay of the Power Management & Multimarket segment, next to power semiconductors – Infineon has a strong foundation due to technologies such as radar, Time-of-Flight (ToF) for 3D camera applications and MEMS (in particular silicon microphones). Silicon microphones are no longer used exclusively in smartphones, demand also benefits from connecting of intelligent devices in new application fields such as smart speakers, smart home and wearables. Furthermore, the Company offers radio-frequency components that for example are used for signal amplification in mobile telephones and for communication between mobile devices and base stations.
Market position The world market for standard MOSFET power transistors reached US$7.581 billion in the 2018 calendar year, an increase of 16.8 percent compared to the previous year value of US$6.492 billion (Source: Informa Tech). Infineon’s revenue increased by 19.7 percent. The high growth level was made possible by the continuation of capacity expan-sion, especially the expansion of 300-millimeter manufacturing capacities in Dresden (Germany) and of 200-millimeter manufacturing capacities in Kulim (Malaysia). This resulted in a market share increase of 0.7 percentage points. A 27.7 percent market share keeps Infineon clearly in the lead in this market (previous year: 27.0 percent). The number- two competitor trails far behind at 14.6 percent (previous year: 13.9 percent). The five largest market players together have a market share of 62.8 percent.
50Combined Management Report | Our Group The segments Power Management & Multimarket
INFINEON TECHNOLOGIES | ANNUAL REPORT 2019

Revenue development In the Power Management & Multimarket segment Infineon recorded revenue of €2,445 million in the 2019 fiscal year, an increase of 5 percent compared to the €2,318 million revenue of the previous year. The segment contributed 30 percent of the Group revenue.
Demand for high-voltage power transistors of the CoolMOS™ family in AC-DC power supplies stayed very positive across all application areas, continuing the dynamic growth of the previous year. The highest revenue share was attributed to products for use in data centers. Demand rose primarily because of the ongoing expansion of hyper-scale data centers by cloud computing providers. Increased revenues also came from high-voltage power transistors for use in on-board chargers for electric and plug-in hybrid vehicles in all regions. Similarly, Infineon saw higher growth linked to equipping charging stations for electric vehicles, here primarily in China.
The demand dynamics in the DC-DC power supply business were significantly lower in the previous fiscal year as compared to the previous year and there was only a slight increase in revenue. Important demand was primarily driven by the three application fields battery-powered devices, cellular infrastructure and data centers.
Battery-powered devices use OptiMOS™ power transistors of the low voltage and mid voltage classes. Demand for these transistors continued to benefit from the rising demand for devices with BLDC motors, such as cordless screwdrivers, drills, hedge trimmers, power saws, lawn mowers and robot vacuum cleaners. Furthermore, the demand for electric two-wheelers such as eBikes, eScooters and Pedelecs also rose.
Revenue development was very positive with power supplies for the next generation of cellular infrastructure. The DC-DC power supply area profits in particular from the sharp increase in semiconductor content in systems for the new 5G technologies compared to 4G technology.
Many applications use products both from the AC-DC power supply area and from DC-DC power supply. In DC-DC power supply, our control and driver ICs and thus complete solutions for digital control also contributed to revenue in addition to our OptiMOS™ low-voltage power transistors.
World power MOSFET market share 2018
Source: Based on or includes content supplied by Informa Tech (former IHS Markit Technology), “Power Semiconductor Market Share Database 2018,” September 2019.
Comparability limited due to differing reporting period (fiscal year-end) and currency.
Infineon
ON Semiconductor
Renesas
Toshiba
STMicroelectronics
27.7 %
13.1 %
8.0 %
7.0 %
7.0 %
Revenue and Segment Result of the Power Management & Multimarket segment€ in millions
Revenue Segment Result
2,445
585
2,318
532
20192018
51Combined Management Report | Our Group The segments Power Management & Multimarket
INFINEON TECHNOLOGIES | ANNUAL REPORT 2019

The area of sensor technologies also experienced excellent demand, with revenue increases driven by silicon microphone business. Although the smartphone market remained stagnant, Infineon benefited from additional design wins in this area and from an increase in the number or products featuring voice control, which also need silicon microphones. Examples here are headphones, smart speakers and remote controls for smart home devices. Initial revenues were also achieved with 3D ToF sensors for 3-dimensional image recognition in smartphones. In May 2019, the XENSIV™ REAL3™ ToF sensor from Infineon was honored as Product of the Year in the category “Sensors” by the Embedded Vision Alliance. In addition, our 24-gigahertz radar sensors also saw an increase in revenue. With these sensors already in successful use in automotive areas, they are now being used in applications for presence detection and gesture control in smart home devices. As a whole, the sensor solutions made a significant contribution to revenue growth, while revenue from products for the radio-frequency area dropped during the previous fiscal year.
Development of the Segment ResultSegment Result was €585 million, representing an increase of 10 percent compared to the previous year’s Segment Result of €532 million. As a percent of revenue, the Segment Result Margin was 23.9 percent (previous year: 23.0 percent).
The increase in Segment Result was a result of increased revenue compared to the previous year, higher average selling prices for power semiconductors and a positive development of the US dollar exchange rate for the euro with regard to revenue and development of earnings.
Digital Security Solutions
The Digital Security Solutions segment in the 2019 fiscal year
The Digital Security Solutions Segment specializes in hardware-based IT security solutions. The focus areas are divided into classic smartcard and embedded security applications. These products are based on our core compe-tencies in the areas security, contactless communication, software and embedded security controller solutions. Modern forms of communication and the rising degree of connected objects increasingly require companies to integrate security solutions in their products. With more than 30 years of experience and expertise we understand the requirements of our customers with regard to fast and tailor-made integration and short time-to-market.
REVENUE€642 million
SEGMENT RESULT €77 million
52
INFINEON TECHNOLOGIES | ANNUAL REPORT 2019
Combined Management Report | Our Group The segments Power Management & Multimarket | Digital Security Solutions

Applications
Authentication › Accessories› Brand protection › Game consoles› Industrial control
systems
Automotive› Connected vehicles
(e.g. eCall, car-to-car communications, car-to-infrastructure communications)
› Electronic toll collection (Toll Collect)
› Protection against manipulation (e.g. tachograph)
Government identification documents› Driver’s licenses› Healthcare cards› National identity cards › Passports› Social insurance cards
Internet of Things› Industry 4.0 › IT› Smart City› Smart Home
Mobile communications› Embedded SIM
(machine-to-machine communication)
› SIM cards
Payment systems › Credit/debit cards› Mobile payment› NFC-based contactless
payment
Ticketing, access control
Trusted Computing
Strategic deploymentDigital transformation is affecting more and more facets of everyday life – and at the same time, security is becoming a central aspect of many applications. The integration of security solutions is thus indispensable for intelligent devices, connected vehicles, companies and Industry 4.0 factories in order to defend against all kinds of attacks, whether theft, fraud or manipulation.
Our core competencies in the Digital Security Solutions segment are divided into the two areas of classical smartcard applications and Embedded Security solutions. We transfer our core competencies for payment cards and govern-mental identification documents to the high-growth area of embedded security applications. Our business is thus transforming from these classical applications to security solutions featuring a chip as a high-reliability anchor for security. The significance of software as a part of the solutions offered continues to increase. This means we can offer our customers solutions for secure authentication, encryption and protection against unauthorized access as a function all the way to complete system solutions, for example in payment.
For smartcard applications, the central application areas of our security chips are cash-free payment as well as mobile communication, electronic identification and ticketing. For example, the SECORA™ Pay portfolio includes easily integrated solutions for contactless payment cards and mobile devices. SECORA™ Connect expands our product family to include a solution for battery-powered, connected smart wearables such as smart watches. The solution combines a security module (Secure Element) with a system-in-package NFC antenna and lets device manufacturers easily integrate and administer payment applications as well as ticket and access solutions. Here the basis is the secure digitalization of credit and debit cards – referred to as “tokenization” – in the smartphone or smart watch.
Embedded security applications open up a variety of possibilities to address structural growth drivers and to penetrate new application fields, including for example the authentication of devices in the Internet of Things and connecting vehicles, as well as protecting smart factories in industry. Growth in this sector is driven by increases in data traffic. For example, cars transmit real-time road traffic information to the cloud or receive updates from the manufacturer “over the air”, so that software can be updated quickly and cost-effectively. The senders and receivers of this data – whether car manufacturers or individual systems in the car – are authenticated using cryptographic keys. OPTIGA™ TPM can store this sensitive information much like a physical safe does, providing particularly high levels of protection against data-technical and physical attacks. OPTIGA™ TPM can thus be regarded as a successful example of our strategic “Product to System” approach.
Part of Infineon’s strategic deployment is to be the leading provider of security solutions consisting of security chips and software. This means it is particularly positive to see that Infineon makes more than one fourth of the segment’s revenue with products in which the security controller is bundled with software, for example firmware, driver software and hardware-related application software. Infineon’s software and system expertise mean it can provide reference designs and easily integrated security modules. The partners in the Infineon Security Partner Network (ISPN), for example, play an active and important role in completing the Infineon service range with application and product- specific software services.
For more informa-tion on ISPN: @ www.infineon.com/ispn
53Combined Management Report | Our Group The segments Digital Security Solutions
INFINEON TECHNOLOGIES | ANNUAL REPORT 2019

In addition to its role as an independent division, the Digital Security Solutions segment also has a second important function within the Group: The segment supports the other three segments as a kind of competence center when it comes to integrating security as a function in their system solutions. This also creates additional areas for differentiation from the competition. For example, Infineon offers automobile manufacturers and industrial companies the extensive security expertise of the Digital Security Solutions segment together with the detailed system expertise and application know-how of the Automotive and Industrial Power Control segments.
Market positionThe size of the world market for security ICs was US$3.190 billion in the 2018 calendar year. Compared to the previous year value of US$3.260 billion it shrank by 2.1 percent (Source: ABI Research). Infineon’s revenues in this market segment also dropped slightly by 2.0 percent. Compared to the previous year Infineon was able to improve market share by 0.1 percentage point. Growth in authentication and dual-interface payment cards was not sufficient to compensate for the expected revenue drops in the area of SIM cards for mobile communication and for contact- based payment cards. The five largest market players accounted for a total market share of 85.1 percent in the 2018 calendar year.
Revenue developmentIn the Digital Security Solutions segment Infineon recorded revenue of €642 million in the 2019 fiscal year, a decrease of 3 percent compared to the €664 million revenue of the previous year. The segment contributed 8 percent of the Group revenue.
Revenues in the area of SIM cards for mobile communication continued to decline as planned in the 2019 fiscal year. For strategic reasons Infineon has only participated selectively in project biddings for several years now. Due to the effects of projects, revenues also dropped in the area of governmental identification documents. On the other hand, revenue increased in the payment cards area. The transition from purely contact-based cards to dual interface cards, i.e. cards that can be used both contactless and contact-based, continued.
World smart card and secure ICs market share 2018
Source: ABI Research, “Smart Card & Secure ICs,” September 2019.
Comparability limited due to differing reporting period (fiscal year-end) and currency.
NXP
Infineon
Samsung
STMicroelectronics
CEC Huada
24.8 %
24.3 %
17.4 %
10.1 %
8.5 %
Revenue and Segment Result of the Digital Security Solutions segment€ in millions
Revenue Segment Result
642
77
664
105
20192018
54Combined Management Report | Our Group The segments Digital Security Solutions
INFINEON TECHNOLOGIES | ANNUAL REPORT 2019

Infineon benefits from this trend in particular due to its core expertise in the area of contactless technologies. Security solutions such as SECORA™ Pay also saw an increase in revenue. This product gives the customer complete payment solutions, i.e. the security chip together with the associated software. SECORA™ Pay was introduced in the early 2019 fiscal year and immediately enjoyed very good user acceptance. Small regional customers in particular prefer complete solutions.
In the area of transport and ticketing, we have seen increasing acceptance of the CIPURSE™ ticketing standard among the operators of public transportation networks, especially in Europe, Eastern Europe and South America. CIPURSE™ is the open standard of OSPT (Open Standard for Public Transportation) for collecting fares in the area of public transportation. Infineon has provided decisive support for the development and introduction of CIPURSE™.
Revenue from embedded SIM (eSIM) once again increased in the previous fiscal year. eSIMs are installed in the customer device as a replacement for classic SIM cards and ensure identification with the telecommunications operator. eSIMs are also used for the emergency call (eCall) function, which has been mandatory in the EU since March 2018 for all new cars sold. As a result, revenue for eSIMs used in vehicles continued to rise. Demand for eSIMs is also increasing in the industry sector, driven especially by progress in Industry 4.0 production machines, tools and other technical devices are becoming more and more connected and can thus be remotely restocked and maintained.
Infineon customers rely on the Company’s security expertise to protect their products, their business models and ultimately their own customers. Infineon offers a wide spectrum of security products in the area of authentication, for example Trusted Platform Modules (TPMs), OPTIGA™ Trust security chips and USB tokens. These are used in applications for example in the Internet of Things, Industry 4.0, Smart Home, Smart City and connected vehicles. Infineon is the first company to offer a TPM with automotive qualification. The Volkswagen group is among the first customers to purchase this product. The TPM secures all the important communication channels in the car such as the central gateway, the telematics unit and access to the infotainment system. The heightened awareness in the area of security for companies is visible in the clearly increased revenues from USB tokens (USB sticks) containing security elements, which can be used for identification purposes.
In the previous fiscal year, Infineon scored an impressive number of design wins in the area of authentication, although the individual projects are relatively small. The high number of potential applications means, however, that the products are required in a large number of projects, making advice and support for the customer together with partners in this area particularly practical. The Infineon Security Partner Network (ISPN) was launched in October 2015 and currently has more than 50 partners in industry that help provide individual security solutions.
Development of the Segment ResultThe Segment Result was €77 million, equivalent to a decline of 27 percent compared with the €105 million Segment Result of the previous year. The Segment Result Margin was 12.0 percent, compared to 15.8 percent in the previous year.
The Segment Result was in essence negatively impacted by the lower contribution from declining revenue. In addition, some idle costs from production occurred, resulting from a temporary drop in demand due to inventory adjustments. Despite the increase in headcount, especially in the area of software and system expertise, operating expenses remained almost constant. This can be attributed to the cost optimization measures implemented in the context of the expected revenue decline.
55Combined Management Report | Our Group The segments Digital Security Solutions
INFINEON TECHNOLOGIES | ANNUAL REPORT 2019

Research and development expenses in the 2019 fiscal year amounted to €945 million after €836 million in the previous year, representing an increase of €109 million or 13 percent. Research and development expenses thus increased disproportionally to revenue, which increased by 6 percent. In the 2019 fiscal year, we spent 11.8 percent of revenue on research and development compared to 11.0 percent in the previous year. The effects of the adjust-ments both to the increase in the number of employees and the R&D projects to the economic downturn in the course of the 2019 fiscal year have a certain time lag. The reduced revenue growth led to an increase in the ratio.
At the end of the 2019 fiscal year we employed 7,755 people (19 percent of Infineon’s total workforce) at our research and development sites; at the end of the 2018 fiscal year the figure was 7,161 employees (18 percent of the total workforce). Infineon maintains research and development departments at 37 sites in 16 countries: Graz, Linz and Villach (all Austria); Beijing and Xi’an (both China); Herlev (Denmark); Le Puy-Sainte-Réparade (France); Augsburg, Dresden, Duisburg, Erlangen, Karlsruhe, Neubiberg near Munich, Regensburg and Warstein (all Germany); Bristol and Reigate (both Great Britain); Bangalore (India); Padua and Pavia (both Italy); Tokyo (Japan); Seoul (Korea); Kulim, Ipoh and Melaka (all Malaysia); Nijmegen (The Netherlands); Muntinlupa (Philippines); Bucharest (Romania); Singapore; Andover, Chandler, El Segundo, Leominster, Milpitas, Morrisville, San Jose, and Warwick (all USA).
In the 2019 fiscal year, the capitalized development costs totaled €125 million (previous year: €143 million). Amorti-zation of capitalized development costs in the 2019 fiscal year amounted to €57 million (previous year: €50 million). Subsidies and grants for research and development increased from €86 million in the 2018 fiscal year to €111 million in the 2019 fiscal year.
Principal research and development activitiesResearch and development expenses are incurred in the area of components as well as for platforms, manufactur-ing technologies and, increasingly, for software. We earn approximately two thirds of our revenue with power semiconductors, and our research and development activities focus on this area accordingly. Activities include the development of individual components and modules, technology platforms for low-voltage and high-voltage power switches, power semiconductors based on the new materials silicon carbide and gallium nitride as well as digital controls for power supplies and complete motor control units.
R&D expenses€ in millions
11.8 %11.0 %
836945
2018 2019
R&D expenses Percentage of revenue
Research and development
56Combined Management Report | Our Group Research and development
INFINEON TECHNOLOGIES | ANNUAL REPORT 2019

The Infineon strategic “Product to System” approach is also of central importance here. While in the past both research and development primarily focused on technologies or components, today the systems in which the components are used play a decisive role. The development of the associated software for such systems is also becoming more and more important. Innovative system solutions start with the optimization of system functionality. If savings and improvements, for example, for passive components, cooling systems, packages, weight and reliability create value for the customer, the customer is willing to pay a higher price for the semiconductor compo-nent providing these advantages. Here, digital microelectronics is often combined with RF components, control ICs, drivers, sensors and actuators, resulting in a significant increase in performance. Furthermore, hardware is increasingly being complemented by software to offer turnkey solutions to our customers.
Power semiconductorsAs the market player with probably the most comprehensive portfolio of power semiconductors, Infineon focuses on understanding the customer’s application. Examples of products we have successfully introduced are firstly the highly efficient and robust PrimePACK™ modules for offshore wind turbines, secondly, our latest generation of 80 volt MOSFETs for mild-hybrid vehicles based on 48 volt technology and thirdly, our new discrete IGBTs with additional safety features for rice cookers and induction cooktops. The goal is to offer our customers the solution with the best price-performance ratio. Such a solution can also be based on a combination of silicon and silicon carbide (SiC) components. The balance between cost and performance advantages of the individual components is essential to a sustainable improvement of the customer’s system. This may apply to the efficiency, costs, size, weight or time-to-market.
New materials Manufacturing technologies and transistor architectures for power semiconductor components based on new materials are also an important focus area of our research and development activities. Silicon carbide (SiC), a combination of silicon and carbon, and gallium nitride (GaN), a combination of gallium and nitrogen, permit higher power densities and efficiency in power semiconductors. This makes products more compact while reducing switching losses at the same time. The material properties of SiC and GaN components make them suitable for different voltage classes. While the SiC technology is advantageous for voltages of over 1,000 volts, GaN technology is well suited for use with 600 volts or lower.
Silicon carbide The main areas of application for SiC have up to now been photovoltaic systems, industry power supplies and charging infrastructure for electric vehicles, where the system advantages of SiC are clearly evident. A penetration of industrial applications is currently beginning, primarily uninterrupted power supplies; there are also initial designs in the significant market for variable speed drives (servo-motors, robotics) which also benefit from the special properties of the new technology, allowing a very cost-effective, high-performance implementation from a system point of view. We also regard auxiliary units in trains as a promising future application. In the mid and long term, vehicles with hybrid or pure electric drive trains also promise enormous potential. Applications here are for example main inverters for the drive train and the on-board charger. In total Infineon achieved cumulated design-in-potential of about €1.8 billion over lifetime. About two thirds of that refer to industrial applications, about one third refers to automotive. Among other automakers, Korea-based Hyundai has chosen products of our CoolSiC™ family for their next-generation electric vehicles.
In 2017, Infineon was one of the first manufacturers to introduce to the market a SiC MOSFET with trench technology. Trench architecture offers significantly more freedom in the realization of efficient and at the same time, more robust transistors compared to less demanding planar architectures. It put Infineon well ahead of the competition in terms of development. The focus of our future development activities in the area of SiC is on expanding the product portfolio. Research and development activities center on technologies for higher voltages (1,700 volts and 3,300 volts) and appropriate packages to make most use of the performance capabilities of SiC technology.
57Combined Management Report | Our Group Research and development
INFINEON TECHNOLOGIES | ANNUAL REPORT 2019

In November 2018, Infineon acquired the Dresden-based start-up Siltectra GmbH. Siltectra was founded in 2010 and has a portfolio of more than 50 patent families. The core of the portfolio is referred to as Cold Split technology, which is used to split crystalline materials with a minimum of material loss compared to conventional sawing techniques. Among other things, these technologies can be used with the semiconductor material silicon carbide (SiC), which is expected to generate strongly increasing demand in the years to come. Cold Split technology can double the number of chips yielded by a single wafer. Infineon’s goal is to use the Cold Split technology to ensure SiC product supplies on a long-term basis. Increased availability of SiC wafers resulting from Cold Split technology will significantly simplify the ramp-up of our SiC products, in particular with regard to the further expansion of renewable energies and the increasing use of SiC in the drive train for electric vehicles.
Infineon is the only company in the world to have already been manufacturing power semiconductors on 300-milli-meter silicon thin-wafers on an industrial scale for several years. This experience puts Infineon in an excellent position to transfer thin-wafer technology to SiC. The continuing development of Cold Split technology will take place in Villach and at the Siltectra site in Dresden. The implementation in our manufacturing process is expected within the next few years.
Gallium nitride Compared to silicon-based transistors, gallium nitride transistors offer entirely new and interesting properties that can be used for example for power supplies. Lower losses when switching as well as when in on-state can enable significantly more compact and more efficient devices. The first products of our CoolGaN™ family, various 600-volt GaN power transistors based on an enhancement mode (e-Mode) GaN transistor, have already reached volume production readiness. The development of the next generation of our GaN transistors has already begun. This new architecture makes it possible to substantially increase performance even further. This will make GaN the first-choice technology for applications with the highest requirements on energy efficiency and power density, for example in data centers. GaN’s properties, which are very different from those of silicon, make it possible to integrate high-voltage systems on a chip, resulting in compact solutions for example for motor control units in robots. In the coming months we will be presenting several of these new products at a variety of trade fairs. Volume pro-duction of our GaN products will take place in Villach on a 150-millimeter wafer manufacturing line. The transition to volume production on 200-millimeter wafers is currently in planning.
In May 2019, the European research project UltimateGaN was launched under the leadership of Infineon Technologies Austria AG. With a size over lifetime of approximately €48 million, the project is one of the largest European GaN research projects. It is financed by investments from industry, funding by the individual countries involved as well as from the ECSEL (Electronic Components and Systems for European Leadership) Joint Undertaking. The objective is to develop innovative power and radio-frequency electronics using the new semiconductor material GaN. Many applications will benefit from the results of the project. The research project will give new boost to electro-mobility and intelligent power supplies: Small, integrated on-board charging devices with GaN components will make charging an electric car at home three times faster than in the past. These efficient power semiconductors will also make the integration of renewable energy sources such as solar and wind power in the power grid easier and faster.
Digitalization of products and systemsIn addition to the new materials, another focus area of our research and development activities is the digital control of power semiconductors. We are currently witnessing the transition from analog control to digital control of power switches. Digital control systems enable much easier adaptation to various operating conditions (for example, stand-by, partial load, full load) and also increase the efficiency of increasingly complex power components. Pro-grammability of the control ICs enables customers to adapt the function of the control unit to the requirements even with shorter learning cycles. This transition already began several years ago for MOSFET-based control loops; the trend has now also started for IGBT-based control loops. Infineon provides components for all stages of the digital control loop, namely control ICs, driver ICs and power switches. In particular, the controllers of the iMOTION™ family are attracting great interest in the market. We will expand this successful family and will develop products with integrated drivers and integrated power switches.
58Combined Management Report | Our Group Research and development
INFINEON TECHNOLOGIES | ANNUAL REPORT 2019

Sensor technologies and radio-frequency applicationsSensors capture the real, analog world. The signals measured are first digitalized. Then, the digital values are processed, transmitted and stored according to the requirements of the target application. Sensors also play an increasingly important role in operating machines and devices, referred to as human machine interaction. In this area we are developing our portfolio of MEMS-based silicon microphones and pressure sensors as well as 3D ToF sensors and radar sensors. In addition, we are working on new sensor types for capturing other physical measurements. Infineon has about 40 years of experience in sensor design and sensor manufacturing and offers the most comprehensive portfolio of pressure and magnetic field sensors for automotive applications.
In the area of RF applications, we intend to provide radio-frequency solutions for smartphones and cellular infrastructure. In addition to today’s components – essentially low-noise signal amplifiers, antenna switches and antenna tuners – we will introduce further products including 5G millimeter-wave products and antenna modules.
Infineon continues to develop its development sites Infineon is expanding its research and development expertise for radio-frequency components at the Linz site. The groundbreaking took place in April 2019; by summer 2020, the new construction can house up to 400 employees, including in the medium term 220 new workstations on top of the 180 that already exist. Solutions for important future markets are developed in Linz, where development focuses on 77 gigahertz radar sensor ICs for driver assis-tance systems and on radio-frequency components for smartphones, tablets and navigation applications.
The expansion of the new development center in Dresden is proceeding according to plan. The preparation phase was completed late in the 2018 calendar year and in the meantime, the development center employs more than 20 new employees. Mid-term, a total of 250 jobs are to be created here. The Dresden development center intends to facilitate the development of new products for automotive and power electronics as well as solutions for artificial intelligence. System integration is growing in importance for the complex interaction of semiconductors in vehicles with increasingly complex technology. The core tasks of the development center are modelling complex systems and the development of highly-integrated products, in addition to chip design.
Dresden was also the site of the June 2019 launch of the European research project “Power2Power”. Until mid 2022, 43 partners from eight countries will jointly research and develop innovative power semiconductors with highest power densities and energy efficiencies using silicon-based IGBT technology. Universities, research institutes, small and medium-sized companies and international corporations are participating in this partnership, which is being coordinated by Infineon Dresden. The project size totals approximately €74 million and is being funded by industry, grants from the participating countries and by ECSEL Joint Undertaking.
PatentsAnother indication of Infineon’s innovative power and long-term competitive strength is the number and quality of our patents. In the 2019 fiscal year we applied for approximately 1,760 patents worldwide, compared to approxi-mately 1,550 patent applications in the previous year. The portfolio did also change due to acquisition or sale of business units and as a result of regular strategic patent portfolio reviews. At the end of the 2019 fiscal year, the worldwide patent portfolio consisted of approximately 26,570 patents and patent applications (previous year: approximately 26,850).
59Combined Management Report | Our Group Research and development
INFINEON TECHNOLOGIES | ANNUAL REPORT 2019

In the 2019 fiscal year, our investments amounted to €1,451 million, representing an increase of €197 million or 16 percent compared to the €1,254 million invested in the previous year. Relative to revenues, the investments in the 2019 fiscal year increased to 18.1 percent compared to the previous year’s 16.5 percent. €1,295 million of the overall investment volume was dedicated to property, plant and equipment (previous year: €1,090 million) and €156 million to intangible assets including capitalized research and development costs (previous year: €164 million).
By far the largest share of the amount invested in property, plant and equipment is accounted for by investments in manufacturing facilities. Approximately two thirds of this amount went to frontend manufacturing facilities, with the rest essentially going to backend manufacturing facilities.
Infineon maintains a total of 17 manufacturing sites in 10 countries: Villach (Austria); Beijing and Wuxi (both China); Dresden, Regensburg and Warstein (all Germany); Cegléd (Hungary); Batam (Indonesia); Cheonan (Korea); Melaka and Kulim (both Malaysia); Tijuana (Mexico); Singapore; and Leominster, Mesa, San José and Temecula (all USA). As of 30 September 2019, there were 28,981 people employed in manufacturing at these sites (previous year: 28,532 employees).
Milestones and essential investment focuses in manufacturing during the 2019 fiscal yearBased on customer demand, at the beginning of the fiscal year we planned for high growth, but had to correct our plans downward during the course of the fiscal year. Since the investments have lead times between order and initial implementation of the manufacturing facilities of nine to twelve months in frontend and three to six months in backend manufacturing, we were only able to adapt to the changing market with some delay. One result is that significant idle costs arose in the area of in-house manufacturing, in particular in the second half of the fiscal year, and we were only able to reduce our investment budget slowly. Since our long-term growth drivers are intact, we expect that all these investments will be viable when seen in the mid to long term. With regard to the investment budget we are following the target business model and will compensate the increased budget of the previous fiscal year during later periods. Our strategy remains oriented to the long-term and is less affected by cyclical downturns. We want to rigorously leverage the opportunities arising from the forecast strong market growth.
Investments ¹€ in millions
18.1 %16.5 %
1,2541,451
2018 20191 Property, plant and equipment and intangible assets.
Investments Percentage of revenue
Operations
60Combined Management Report | Our Group Operations
INFINEON TECHNOLOGIES | ANNUAL REPORT 2019

Investment focus areas in the 2019 fiscal year:1. We began the construction of a fully automated 300-millimeter thin-wafer manufacturing facility in November
2018 at the Villach site, our competence center for power electronics. Depending on the macro-economic situation, we currently plan to ramp the fab by late 2021 calendar year. The planned investments for the fully equipped building and cleanroom facilities amount to approximately €1.6 billion. The estimated additional potential revenue associated with this factory is approximately €1.8 billion annually. The expansion will provide us with significant effects of scale at the Villach site and thus will increase our efficiency. The expansion of manufacturing capacities for silicon also makes it possible to increase capacities for silicon carbide and gallium nitride technologies. Existing buildings and manufacturing lines can be refunctioned for these compound semiconductors. This means a capital-efficient capacity expansion.
2. Moderate expansion of the 300-millimeter frontend manufacturing capacities in Dresden and Kulim in differentiating manufacturing technologies for power semiconductors and sensors.
3. Further ramp-up of volume production of our silicon carbide (SiC) MOSFETs in trench technology and SiC diodes on 150-millimeter wafers.
4. Expansion of the backend IGBT module manufacturing capacities for industrial and automotive applications. Based on the expected strong demand for IGBT modules for drive trains in hybrid and pure electric vehicles, the corresponding backend manufacturing capacities are being expanded at the Warstein and Wuxi sites. Further-more, the groundbreaking for a new module manufacturing facility took place in Cegléd in September 2019.
5. Because of its cost position, operation of the Temecula site is planned to continue until 2021 only, and either to sell it before this date or close it. The products manufactured in Temecula will be transferred to other Infineon sites or will be outsourced to external manufacturing partners.
Furthermore, during the 2019 fiscal year investments were made in frontend and backend sites primarily in the following areas:
› further increases in the level of automation at our frontend and backend sites, for example, improvement of the wafer transport system;
› adaptation and retooling of manufacturing lines to accommodate the modified product portfolio, in particular due to the beginning of volume production for new technologies and products;
› equipment for innovative technologies and further improvements in quality.
In order to optimize use of capital and to increase flexibility, in addition to in-house manufacturing in frontend in differentiating technologies such as discrete power semiconductors and sensors, we are increasingly using external manufacturing partners for CMOS and CMOS derivate technologies. This applies primarily for technology nodes smaller than 90 nanometer as well as for older generations of power semiconductors. In backend, i.e. assembly and testing, we are making increasing use of manufacturing partners for standardized package types, with an emphasis on stable partnerships.
61Combined Management Report | Our Group Operations
INFINEON TECHNOLOGIES | ANNUAL REPORT 2019

The internal management system at Infineon is designed to assist in implementing the Group strategy and related long-term financial targets described in the chapter “Group strategy” and “Long-term financial targets underline our growth ambitions”. Accordingly, performance indicators are used, which enable profitable growth and efficient employment of capital to be measured. Overall, reaching our long-term financial targets gives rise to a sustainable increase in the value of the business, brought about by achieving a premium on the cost of capital in the long term.
In this context, growth, profitability and investments are all interdependent. Profitability is the prerequisite for being able to finance operations internally, which, put another way, means opening up potential opportunities for growth. Growth, in turn, requires continual investment in research and development as well as in manufacturing capacities. Growing at a commensurate rate allows Infineon to achieve leading market positions and to generate economies of scale that contribute to greater profitability. Employing financial resources efficiently is a critical factor in achieving these goals.
Infineon deploys a comprehensive controlling system to manage its business with respect to the strategic targets it has set itself. The system involves the use of financial and operating key performance indicators. Information for controlling purposes is derived from annual long-term planning, quarterly outlooks, orders received per week and actual monthly data. This knowledge enables management to base its decisions on sound information with respect to the current situation and future expected financial and operational developments. Sustainable business practices and the consideration of forward-thinking qualitative factors are important for Infineon’s long-term success. As an enterprise very much aware of its responsibilities towards society, Infineon also takes account of non-financial factors, mainly in the fields of sustainability (see the report “Sustainability at Infineon” on our website @ www.infineon.com/csr_reporting) and human resources (see the chapter “Human Resources strategy”). Although these factors are not used to manage business performance, they nevertheless help Infineon achieve its financial targets.
As part of the process of managing business performance, management also attaches great importance to ensuring that Infineon acts in strict compliance with all relevant legal requirements and, of equal importance, that its internal Corporate Governance Standards are complied with (see the chapter “Corporate Governance”).
Performance indicators
Principal performance indicatorsIn order to measure its success in implementing its strategies, Infineon uses the following three overarching performance indicators:
› Segment Result and Segment Result Margin to measure the operating profitability of its various businesses and of the portfolio as a whole,
› Free cash flow from continuing operations to measure the amount of cash generated or used excluding financing activities,
› Return on Capital Employed (RoCE) to measure capital efficiency.
Segment Result is the key figure of the Group for measuring operating performance. Expressed as a percentage of revenue (Segment Result Margin), it measures profitability of revenue and shows how well operations are being managed. The activities of Infineon’s segments are managed on the basis of Segment Result. Responsibility for optimizing Segment Result within the framework of Group strategy (as approved by the Management Board) rests with the management teams of the relevant segments, acting, however, in coordination with the Management Board.
Internal management system
P see page 29 ff. and page 35 f.
P see page 37 f.
P see page 99 ff.
62Combined Management Report | Our Group Internal management system
INFINEON TECHNOLOGIES | ANNUAL REPORT 2019

Free cash flow from continuing operations enables us to measure how well operating profitability is being converted into cash inflows. This key figure also provides information on the efficient use of working capital and property, plant and equipment.
Infineon also compares the actual as well as the planned Return on Capital Employed (RoCE) against the cost of capital, in order to ensure value creation.
The three performance indicators described above are also the cornerstones of the system for variable compen-sation within Infineon. Most variable salary components for employees and management are directly linked to these performance indicators.
Since all three performance indicators and especially Segment Result strongly correlate with revenue growth, the latter is not used as a key performance indicator in its own right but is covered by the three performance indicators indirectly.
Segment ResultSegment Result is defined as operating income (loss) excluding certain impairments (such as goodwill impairments), impact on earnings of restructuring measures and closures, share-based compensation expense, acquisition related depreciation/amortization and other expenses, gains (losses) on sales of businesses, or interests in subsidiaries and other income (expense), including litigation costs (see note 28 to the Consolidated Financial Statements for a computation of the relevant figures). Court and legal fees arising in conjunction with licensing Infineon’s patents are included in Segment Result, as is any related income. Segment Result is the indicator that Infineon uses to eval-uate the operating performance of its segments (for an analysis of Group and individual segment performance in the 2019 fiscal year, see the chapters “The segments” and “2019 fiscal year”).
Free cash flowAn important key performance indicator for Infineon is the free cash flow figure, defined as net cash provided by or used in operating activities and net cash provided by or used in investing activities, both from continuing operations, after adjusting for cash flows related to the purchase and sale of financial investments. Free cash flow measures the ability to generate sufficient cash flows to finance day-to-day operations and fund required invest-ments out of the ongoing business. It is Infineon’s stated target to sustainably generate positive free cash flow (see the chapter “Review of liquidity” for an analysis of free cash flow in the 2019 fiscal year).
The main levers for generating free cash flow are profitability, the ability to manage working capital efficiently and the levels of investments.
Infineon manages net working capital levels by focusing continuously on optimizing levels of inventories, trade receivables and trade payables.
Effective investment management plays a key role with regard to managing free cash flow. Our stated strategy of managing investments systematically should be seen in this context. Free cash flow is managed by Infineon at Group level only and not at segment level.
Return on Capital Employed (RoCE)The performance indicator RoCE measures the ability of capital to provide a return and is defined as the operating result after tax from continuing operations divided by capital employed. Capital employed consists of non-current assets and net working capital. RoCE shows the correlation between profitability and the capital resources required to run the business.
RoCE =Operating result after tax from continuing operations
Capital employed
P see page 182 ff.
P see page 39 ff. and page 16 ff.
P see page 77
63Combined Management Report | Our Group Internal management system
INFINEON TECHNOLOGIES | ANNUAL REPORT 2019

This key performance indicator describes how efficiently a company manages its resources. RoCE is also analyzed by Infineon at Group level only and not at segment level. A comparison of a company’s RoCE and its weighted cost of capital provides information on the extent to which returns have been generated in excess of shareholders’ and debt holders’ expectations. Thus, RoCE serves as a tool for value-based management.
Apart from profitability, RoCE is also influenced by asset intensity, of both non-current assets and net working capital. Asset intensity describes the amount of assets necessary to generate a certain level of revenue (for an analysis of the derivation of and change in RoCE in the 2019 fiscal year, see the chapter “Review of financial condition”).
Other performance indicatorsThe principal performance indicators described above are supplemented by others that provide information about growth potential, cost efficiency by functional area and liquidity.
Growth and profitability performance indicatorsRevenue growth is compared continuously with the rate of growth of relevant target markets. This ties in directly with our strategic target of profiting continuously from the growth of our target markets. A further indicator for future revenue growth is the number of design wins, whereby we regularly measure actual outcomes against targets.
As part of the process of analyzing operating profitability in detail, Infineon considers earnings and costs above the Segment Result line. This involves a review of gross profit, research and development expenses, selling, general administrative expenses and the ratio of these items to revenue. These performance indicators are used to manage the business at both Group and segment levels (for an analysis of changes in the fiscal year under report, see the chapter “Review of results of operations”).
Liquidity performance indicatorsA rolling cash flow forecast helps ensure that Infineon has appropriate levels of liquidity at its disposal and an optimal capital structure. Liquidity is managed at Group level, not at segment level, using the following key performance indicators:
› Gross cash position: Cash and cash equivalents plus financial investments.
› Net cash position: Gross cash position less short-term and long-term debt.
› Net working capital: Current assets less cash and cash equivalents, less financial investments, less assets classified as held for sale, less current liabilities excluding short-term debt, and current maturities of long-term debt, excluding liabilities classified as held for sale.
› Investments: The total amount invested in property, plant and equipment and intangible assets, including capitalized development costs.
For an analysis of changes in these key performance indicators during the 2019 fiscal year, see the chapter “Review of liquidity”.
Moreover, in order to avoid costs resulting from overcapacity and/or capacity bottlenecks, the key operational figures for capacity utilization and forecast capacity requirements are analyzed. The results of this analysis are used in determining investment requirements.
Actual and target values for performance indicatorsThe chapter “Outlook” contains a table showing the actual values achieved in the 2019 fiscal year for the key performance indicators, along with expectations for the 2019 fiscal year and the 2020 fiscal year.
P see page 75
P see page 68 ff.
P see page 76 ff.
P see page 79
64Combined Management Report | Our Group Internal management system
INFINEON TECHNOLOGIES | ANNUAL REPORT 2019

Sustainability activities are described in the separate report “Sustainability at Infineon”.
In accordance with the stipulations of the German CSR Directive Implementation Act, Infineon Technologies AG is required to publish a non-financial report at both Company and Group level for the 2019 fiscal year. This report is published jointly for Infineon Technologies AG and the Infineon Group as a summarized separate non-financial report within the sustainability report. The information required by law is marked accordingly to distinguish it from the voluntary reporting according to the GRI standards. The entire report “Sustainability at Infineon” including the chapters of the Non-Financial Report have been subjected to a limited assurance audit by KPMG AG Wirtschafts-prüfungsgesellschaft, Munich (Germany), and has been certified without restrictions.
The separate report “Sustainability at Infineon” including the summarized Non-Financial Report is available on Infineon’s website. @ www.infineon.com/csr_reporting
Basic information on shares
Share types
Ordinary registered shares in the form of shares or American Depositary Shares (ADS) with a notional value of €2 each (ADS : shares = 1 : 1)
Share capital €2,501,368,142 (as of 30 September 2019), €2,273,991,668 (as of 30 September 2018)
Shares issued 1 1,250,684,071 (as of 30 September 2019), 1,136,995,834 (as of 30 September 2018)
Own shares 6 million shares (as of 30 September 2019) 6 million shares (as of 30 September 2018)
ISIN WKN
DE0006231004 623100
Ticker symbol IFX (share), IFNNY (ADS)Bloomberg Reuters
IFX GY (Xetra trading system), IFNNY US IFX-XE, IFNNY-XE
Listings Shares: Frankfurt Stock Exchange (FSE)Market capitalization 2 €20,552 million (as of 30 September 2019)Daily average shares traded on Xetra 7,252,990 (in the 2019 fiscal year)Trading in the USA ADS, over-the-counter trading on the OTC market (OTCQX)Market capitalization 2 US$22,417 million (as of September 2019)Daily average ADS traded 307,476 (in the 2019 fiscal year)Index membership (selected) @ A full overview of other major indices in which the Infineon
share is represented can be found on Infineon’s website at www.infineon.com/cms/en/about-infineon/investor/ infineon-share/index-membership/
DAX 30 TecDAX Dow Jones STOXX Europe 600 Dow Jones Euro STOXX TMI Technology Hardware & Equipment Dow Jones Germany Titans 30 MSCI Germany S&P-Europe-350 Dow Jones Sustainability World Index
1 The number of shares issued includes own shares.2 Own shares were not taken into consideration for calculation of market capitalization.
Sustainability at Infineon
The Infineon share@ Interested parties
may participate in telephone confer-ences via a webcast broadcast in the Investor Relations section of the Infineon website (www.infineon.com/investor).
Retail investors can contact us by email (investor.relations @infineon.com) and by telephone (+49 89 234-26655).
65
INFINEON TECHNOLOGIES | ANNUAL REPORT 2019
Combined Management Report | Our Group Sustainability at Infineon | The Infineon share

Basic information on bonds
1.500% Infineon Bond from 10 March 2015 €500 million due on 10 March 2022, ISIN: XS11911161742.875% Hybrid Bond from 1 October 2019 €600 million first reset date 1 April 2025, ISIN: XS20567303233.625% Hybrid Bond from 1 October 2019 €600 million first reset date 1 April 2028, ISIN: XS2056730679US Private Placement from 5 April 2016 US$350 million tranche with maturity 5 April 2024US Private Placement from 5 April 2016 US$350 million tranche with maturity 5 April 2026US Private Placement from 5 April 2016 US$235 million tranche with maturity 5 April 2028Rating of S&P Global Ratings
since June 2019: “BBB” (CreditWatch: “negative” due to the planned acquisition of Cypress Semiconductor Corporation)
Share price development The Infineon share finished the 2019 fiscal year at a closing price of €16.51, a decline of 16 percent compared to the closing price of €19.57 at the end of the 2018 fiscal year.
During the first half of the 2019 fiscal year, the price of the Infineon share tended mostly sideways, albeit with some significant volatility. The share reached its high for the twelve-month period in mid-April at €21.48. A continuing intensification of the trade tensions between the USA and China subsequently resulted in a sharp drop in stock market prices, and the Infineon share price too.
On 3 June 2019, Infineon announced the planned acquisition of Cypress. On that day, the share closed 8 percent down on the previous day’s price. In connection with the planned acquisition, Infineon placed approximately 113 million new shares on the stock market on 17 June 2019 by way of an accelerated book building process. The share capital increase was completed on 18 June 2019, at which stage the share’s low for the fiscal year was recorded at €14.07. The Infineon share recovered appreciably thereafter, with significant volatility, before closing the fiscal year at €16.51.
The weak performance of the Infineon share between mid-April 2019 and mid-June 2019 meant that it was significantly outperformed by the benchmark indices over the entire 2019 fiscal year. The DAX, the Dow Jones US Semiconductor Index and the Philadelphia Semiconductor Index (SOX) recorded gains of 1 percent, 5 percent and 14 percent, respectively.
23.48 120
09 | 201904 | 2019 06 | 201902 | 201911 | 2018 07 | 2019 08 | 201903 | 201912 | 2018 05 | 201901 | 201910 | 2018
21.53
19.57
110
17.61
100
15.66
90
80
13.70 70
Development of the Infineon Technologies AG share compared to Germany’s DAX Index, the Philadelphia Semiconductor Index (SOX) and the Dow Jones US Semiconductor Index for the 2019 fiscal year (daily closing prices)Infineon share price in € 30 September 2018 = 100
Infineon DAX SOX Dow Jones US Semiconductor Index
66Combined Management Report | Our Group The Infineon share
INFINEON TECHNOLOGIES | ANNUAL REPORT 2019

Trading volumes and stock indicesMeasured in units, the average volume of Xetra-traded Infineon shares increased by 35 percent in the 2019 fiscal year compared to one year earlier. 7.3 million shares were traded daily in the 2019 fiscal year, compared to an average of 5.4 million in the previous comparable period. Measured in euros, the average daily trading volume rose by 4 percent, based on a daily average of €126.9 million and €122.6 million during the 2019 and 2018 fiscal year, respectively.
In the USA, the Infineon share is traded in the form of American Depositary Shares (“ADS”) on the OTCQX Interna-tional over-the-counter market under the ticker symbol “IFNNY”. The average daily ADS trading volume also rose in the 2019 fiscal year. The average daily number of ADS traded in the 2019 fiscal year increased to 307 thousand, compared to 165 thousand per day one year earlier. The number of ADS outstanding rose as well from 31.7 million as of 30 September 2018 to 38.9 million at the end of the 2019 fiscal year.
In the DAX ranking, Infineon ranked place 15th in terms of market capitalization as of end of the 2019 fiscal year, unchanged compared to the previous year. In terms of the volume traded in euros on Xetra and on the Frankfurt trading floor during the last twelve months Infineon dropped by one place, moving from 12th place at the end of the 2018 fiscal year to 13th place at the end of the 2019 fiscal year. The Infineon share has been listed in the TecDAX since 25 September 2018. Compared to the end of the previous fiscal year, it remained in 3rd place in terms of market capitalization as of 30 September 2019 and dropped one place in the ranking from 3rd to 4th in terms of volume traded.
Shareholder structureAs of 30 September 2019, three shareholders each held more than 3 percent of the Infineon shares issued. Also at the end of the 2018 fiscal year, the same three shareholders each held more than 3 percent of the Company’s shares. The share capital held by retail investors increased slightly from 9.81 percent at the end of the 2018 fiscal year to 9.96 percent at the end of the 2019 fiscal year.
DividendIn recent years, Infineon has continuously increased the amount of dividend paid. The dividend payment for the 2018 fiscal year was €0.27 per share. On 26 February 2019, the third business day after the Annual General Meeting, a total of €305 million was paid out to shareholders. At that point in time the number of shares entitled to a dividend stood at 1,130,995,834. As of 30 September 2019, the number of shares entitled to a dividend was 1,244,684,071. In October 2019, some of these shares were transferred to eligible members of the Management Board and employees in conjunction with the settlement of the performance share plan tranche for the 2016 fiscal year (see note 21 to the Consolidated Financial Statements). As a result, the dividend entitlement attached to the transferred shares has been revived. A proposal is to be made to shareholders at the 2020 Annual General Meeting to pay an unchanged dividend of €0.27 per share for the 2019 fiscal year. The approximately 113 million new shares issued as part of the capital increase on 18 June 2019 are fully entitled to dividends, which increases the anticipated dividend distribution for the 2019 fiscal year to €336 million, compared to €305 million for the 2018 fiscal year. For more information on Infineon’s dividend policy, see “Sustainable value creation for our shareholders” in the chapter “Group strategy”.
Shareholder structure as of end 2019 fiscal year
BlackRock Inc. 5.36 %
Other 75.01 %
4.85 % Kingdom of Norway 4.82 % Allianz Global Investors GmbH 9.96 % Retail investors
P see page 164 f.
P see page 37
67Combined Management Report | Our Group The Infineon share
INFINEON TECHNOLOGIES | ANNUAL REPORT 2019

Review of results of operations
The consolidated statement of operations
€ in millions, except earnings per share 2019 2018
Revenue 8,029 7,599
Gross profit 2,994 2,885
Research and development expenses (945) (836)
Selling, general and administrative expenses (865) (850)
Other operating income and expenses, net (23) 270
Operating income 1,161 1,469
Net financial result (financial income and expenses, net) (72) (53)
Income from investments accounted for using the equity method (6) (5)
Income tax (194) (193)
Income from continuing operations 889 1,218
Loss from discontinued operations, net of income taxes (19) (143)
Net income 870 1,075
Basic earnings per share (in euro) 0.75 0.95
Diluted earnings per share (in euro) 0.75 0.95
Adjusted earnings per share (in euro) – diluted 0.89 0.98
Net income lower due to exceptional factorsAt €870 million, net income for the 2019 fiscal year was €205 million lower year-on-year (2018: €1,075 million). Despite difficult market conditions, revenue grew by €430 million or 6 percent to €8,029 million (2018: €7,599 million). The favorable development of the US dollar exchange rate to the euro also had a positive impact. At €1,161 million, operating income fell well short of the previous year’s figure (2018: €1,469 million). It should be noted, however, that operating income in the 2018 fiscal year included a gain of €270 million arising on the sale of the major part of the RF power components business to Cree, Inc. In addition, increases in research and development expenses on the one hand and selling, general and administrative expenses on the other had a negative impact on operating income. As in the previous fiscal year, acquisition-related depreciation and amortization as well as other expenses, mainly relating to the earlier acquisition of International Rectifier, totaling €114 million were included in operating income reported for the 2019 fiscal year (2018: €118 million).
Earnings per share (basic and diluted) amounted to €0.75 and were therefore lower than one year earlier (2018: €0.95 respectively).
Similarly, adjusted earnings per share (diluted) decreased from €0.98 to €0.89 per share (see the section “Decrease in adjusted earnings per share” in this chapter).
Group performance
P see page 72
68Combined Management Report | Our 2019 fiscal year Group performanceReview of results of operations
INFINEON TECHNOLOGIES | ANNUAL REPORT 2019

Revenue growth despite difficult market conditionsRevenue grew by €430 million to €8,029 million in the 2019 fiscal year (2018: €7,599 million). Automotive, the segment with the highest volume, contributed 51 percent, hence slightly more than half of total revenue growth. The segment continued to grow despite lower overall vehicle production during the 2019 fiscal year. The two megatrends – electro- mobility and automated driving on the one hand and driver assistance systems on the other – will continue to determine the increasing semiconductor content in vehicles. The Industrial Power Control segment contributed 22 percent of Group revenue growth during the fiscal year under report performing well in the areas of wind power, industrial power supplies, traction systems, energy distribution and in particular electric drives. The Power Management & Multimarket segment contributed 30 percent to revenue growth. In contrast, the Digital Security Solutions segment recorded a 3 percent drop in revenue, mainly due to lower revenue from SIM cards for mobile communications. For details see the chapter “The segments”.
Positive impact of currency effects on revenue growthThe majority of revenue was generated in foreign currencies in the 2019 fiscal year, with revenue denominated in US dollars accounting for the largest share. The average euro/US dollar exchange rate changed from around 1.19 in the previous fiscal year to 1.13 in the 2019 fiscal year. Approximately 3 percentage points of the increase in revenue were attributable to positive currency factors. The year-on-year currency impact is measured by applying the previous fiscal year’s relevant average exchange rates to the current fiscal year revenue.
P see page 39 ff.
Revenue by segment€ in millions
3,503
1,323
2,318 2,445
642
21
664
10
Industrial Power Control
Automotive Power Management &
Multimarket
Digital Security Solutions
Other Operating Segments
1,418
3,284
2018 2019
Revenue by segment in the 2019 fiscal year
Industrial Power Control 18 %
Power Management & Multimarket 30 %
Digital Security Solutions 8 %
0 % Other Operating Segments, Corporate and Eliminations
44 % Automotive
69Combined Management Report | Our 2019 fiscal year Group performanceReview of results of operations
INFINEON TECHNOLOGIES | ANNUAL REPORT 2019

Significance of Greater China remains strong; China ahead of Germany as most important sales market
€ in millions, except percentages 2019 2018
Europe, Middle East, Africa 2,430 30% 2,443 32% therein: Germany 1,169 15% 1,171 15%
Asia-Pacific (excluding Japan, Greater China) 1,187 15% 1,129 15%
Greater China 2,769 35% 2,599 34% therein: China 2,159 27% 1,921 25%
Japan 593 7% 534 7%
Americas 1,050 13% 894 12% therein: USA 862 11% 719 9%
Total 8,029 100% 7,599 100%
With an increase of €170 million (40 percent), the Greater China region accounted for the largest proportion of revenue growth by far, followed by the Americas region with a €156 million increase (equals 36 percent of total revenue growth), Japan with a €59 million increase (equals 14 percent of total revenue growth) and the Asia-Pacific region (excluding Japan and Greater China) with a €58 million increase (13 percent of total revenue growth). China has been Infineon’s most important sales market for several years now and, with a figure of €2,159 million, accounted for 27 percent (2018: 25 percent) of Infineon’s revenue during the fiscal year under report. Overall, 55 percent of year-on-year revenue growth was achieved in China.
The distribution of revenue by region remains more or less unchanged compared to the 2018 fiscal year. As in the previous year, Greater China was the largest region in revenue terms, accounting for 35 percent of total revenue generated, followed by the Europe, Middle East, Africa region with 30 percent.
China accounted for €2,159 million or 27 percent of Infineon’s worldwide revenue and therefore for the largest share at individual country level, followed by Germany at €1,169 million or 15 percent.
Gross margin lowerThe gross margin decreased to 37.3 percent year-on-year (2018: 38.0 percent). In particular, the additional manu-facturing capacity built up through investments in the previous fiscal year could not be fully utilized during the second half of the fiscal year, resulting in idle costs that negatively impacted the margin. Furthermore, higher prices for materials, in particular for wafer substrates, caused costs to rise and therefore the gross margin to decline. Productivity and cost-cutting measures were only partially able to offset these effects. The line item “Cost of goods sold” includes the earnings impact arising in conjunction with the purchase price allocation and acquisition-related expenses for International Rectifier (in particular higher depreciation/amortization on intangible assets and property, plant and equipment, which were revalued to their fair value as part of the purchase price allocation) amounting to €55 million (2018: €67 million).
€ in millions, except percentages 2019 2018
Cost of goods sold 5,035 4,714
Change year-on-year 7% 6%
Percentage of revenue 62.7% 62.0%
Gross profit 2,994 2,885
Percentage of revenue (gross margin) 37.3% 38.0%
Operating expenses stable as percentage of revenueOperating expenses (research and development expenses and selling, general and administrative expenses) increased by €124 million to €1,810 million year-on-year (2018: €1,686 million), corresponding to 22.5 percent of revenue (2018: 22.2 percent).
70Combined Management Report | Our 2019 fiscal year Group performanceReview of results of operations
INFINEON TECHNOLOGIES | ANNUAL REPORT 2019

Research and development expenses (R&D expenses)Grants received in conjunction with R&D projects and capitalized development costs reduce the amount of R&D expenses recognized:
€ in millions, except percentages 2019 2018
Research and development expenses, gross 1,181 1,065
Minus:
Grants received (111) (86)
Capitalized development costs (125) (143)
Research and development expenses 945 836
Change year-on-year 13% 8%
Percentage of revenue 11.8% 11.0%
R&D expenses amounted to €945 million in the 2019 fiscal year, an increase of €109 million or 13 percent compared to the previous year’s figure of €836 million, mainly reflecting the increased number of employees. A total of 7,755 employees were employed in research and development functions at the end of the reporting period (30 Sep-tember 2018: 7,161 employees). The reduced scale of revenue growth meant that R&D expenses as a percentage of revenue increased from 11.0 percent to 11.8 percent year-on-year.
The main R&D activities undertaken during the 2019 fiscal year are described in more detail in the chapter “Research and development”.
Selling, general and administrative expenses
€ in millions, except percentages 2019 2018
Selling, general and administrative expenses 865 850
Change year-on-year 2% 4%
Percentage of revenue 10.8% 11.2%
At 10.8 percent of revenue, selling, general and administrative expenses were lower in percentage terms than in the previous fiscal year (11.2 percent). In absolute terms, they went up by €15 million or 2 percent to €865 million, and therefore at a less pronounced rate than revenue growth. This reported figure also includes the earnings impact arising in conjunction with the purchase price allocation and acquisition-related expenses for International Rectifier totaling €44 million (2018: €49 million).
Net amount of other operating income and expenses decreasedThe net amount from other operating income and expenses deteriorated from a positive amount of €270 million to negative €23 million year-on-year. It should be noted, however, that the net amount reported in the 2018 fiscal year included a gain of €270 million arising on the sale of the major part of the RF power components business to Cree, Inc. Moreover, expenses were incurred during the 2019 fiscal year in connection with the planned acquisition of Cypress totaling €12 million, which are included in the net amount of other operating income and expenses.
Financial result negatively impacted by Cypress financing costsThe financial result for the 2019 fiscal year was a negative amount of €72 million, a deterioration of €19 million compared to the previous fiscal year (2018: net negative amount of €53 million). This includes expenses totaling €22 million incurred to hedge equity market risks in connection with the share capital increase implemented in June 2019 to finance the planned acquisition of Cypress (see note 19 to the Consolidated Financial Statements).
Effective tax rate up to 17.9 percentBased on pre-tax income of €1,083 million and an income tax expense of €194 million, the effective tax rate for the 2019 fiscal year amounted to 17.9 percent. The equivalent figures for the 2018 fiscal year were a tax expense of €193 million or 13.7 percent on pre-tax income of €1,411 million.
P see page 56 ff.
P see page 161
71Combined Management Report | Our 2019 fiscal year Group performanceReview of results of operations
INFINEON TECHNOLOGIES | ANNUAL REPORT 2019

As in the previous fiscal year, income tax expense for the 2019 fiscal year was affected by foreign tax rates, non- deductible expenses, tax-exempt income, tax credits and changes in valuation allowances on deferred tax assets.
Further details regarding income tax expense are provided in note 6 to the Consolidated Financial Statements.
Loss from discontinued operations reducedThe loss from discontinued operations, net of income taxes, for the 2019 fiscal year amounted to €19 million (2018: loss of €143 million). The higher loss reported in the previous fiscal year was mainly attributable to the increase in provisions for Qimonda in connection with pending legal proceedings. For further information on risks relating to the Qimonda insolvency see note 23 to the Consolidated Financial Statements.
Earnings per share downThe lower net income reported for the 2019 fiscal year resulted in a corresponding decrease in earnings per share. Earnings per share amounted to €0.75 (diluted and undiluted), compared to €0.95 respectively in the previous fiscal year.
Decrease in adjusted earnings per shareEarnings per share in accordance with IFRS are influenced by amounts relating to purchase price allocations for acquisitions (in particular International Rectifier), by one-time expenses recorded within the financial result in conjunction with the planned acquisition of Cypress and by other exceptional items. To enable better comparability of operating performance over time, Infineon computes adjusted earnings per share (diluted) as follows:
€ in millions (unless otherwise stated) 2019 2018
Net income from continuing operations attributable to shareholders of Infineon Technologies AG – diluted 889 1,218
Plus/minus:
Impairments (such as on goodwill), net of reversals1 – 7
Share-based compensation expense 11 13
Acquisition-related depreciation/amortization and other expenses 114 118
Losses (gains) on sales of businesses, or interests in subsidiaries, net 2 1 (272)
Other income and expense, net 32 18
Acquisition-related expenses within financial result 27 –
Tax effects on adjustments (30) 9
Revaluation of deferred tax assets resulting from the annually updated earnings forecast (3) 5
Adjusted net income from continuing operations attributable to shareholders of Infineon Technologies AG – diluted 1,041 1,116
Weighted-average number of shares outstanding (in million) – diluted 1,165 1,134
Adjusted earnings per share (in euro) – diluted 3 0.89 0.98
1 Since 1 October 2018 impairments/reversal of impairments on assets are generally shown in segment result (excluding impairments for Goodwill). The previous period’s figures were not adjusted.
2 Without gains and losses from the disposal of assets since 1 October 2018. The previous period’s figures were not adjusted.3 The calculation of the adjusted earnings per share is based on unrounded figures.
Adjusted net income and adjusted earnings per share (diluted) should not be seen as a replacement or superior performance indicator, but rather as additional information to net income and earnings per share (diluted) determined in accordance with IFRS. The calculation of earnings per share in accordance with IFRS is presented in detail in note 8 to the Consolidated Financial Statements.
P see page 146 ff.
P see page 166 ff.
P see page 149
72Combined Management Report | Our 2019 fiscal year Group performanceReview of results of operations
INFINEON TECHNOLOGIES | ANNUAL REPORT 2019

Review of financial condition
€ in millions, except percentages30 Septem-
ber 201930 Septem-
ber 2018Change
year-on-year
Current assets 7,324 5,423 35%
Non-current assets 6,088 5,456 12%
Total assets 13,412 10,879 23%
Current liabilities 2,044 2,182 (6%)
Non-current liabilities 2,735 2,251 22%
Total liabilities 4,779 4,433 8%
Total equity 8,633 6,446 34%
Statement of Financial Position ratios:
Return on assets1 6.5% 9.9%
Equity ratio 2 64.4% 59.3%
Return on equity 3 10.1% 16.7%
Debt-to-equity ratio 4 18.0% 23.8%
Inventory intensity 5 12.7% 13.6%
RoCE 6 12.2% 20.5%
1 Return on assets = Net income/Total assets2 Equity ratio = Total equity/Total assets3 Return on equity = Net income/Total equity4 Debt-to-equity ratio = (Long-term and short-term debt)/Total equity5 Inventory intensity = Inventories (net)/Total assets6 Calculation see following section about RoCE in this chapter
Current assets influenced primarily by increase in gross cash position Current assets increased by €1,901 million (35 percent) to stand at €7,324 million as of 30 September 2019, compared to €5,423 million one year earlier, mainly due to the €1,236 million increase in the gross cash position (sum total of cash and cash equivalents and financial investment) (see “Gross cash position and net cash position” in the chapter “Review of liquidity” for further information). The increase in inventories and the first-time recognition of contract assets in connection with the adoption of IFRS 15 increased current assets by €312 million. Fair value measurement gains amounting to €210 million on hedging transactions concluded to hedge the foreign currency risk in connection with the planned acquisition of Cypress (see note 3 to the Consolidated Financial Statements and the section “Derivative financial instruments and hedging activities” within note 26 to the Consolidated Financial Statements) also contributed to the increase in current assets.
P see page 75
P see page 77 f.
P see page 142
P see page 174 ff.
73Combined Management Report | Our 2019 fiscal year Group performanceReview of financial condition
INFINEON TECHNOLOGIES | ANNUAL REPORT 2019

Increase in non-current assets due to higher level of investments and acquisition of SiltectraNon-current assets increased by €632 million from €5,456 million to €6,088 million over the course of the fiscal year under report. Additions to property, plant and equipment totaling €1,276 million exceeded the depreciation and amortization expense of €804 million. Investments related primarily to the production sites in Villach (Austria), Dresden and Regensburg (both Germany) as well as Kulim and Melaka (both Malaysia) (see also the chapter “Operations”). Additions in intangible assets (€156 million) were higher than the corresponding amortization expense (€141 million). The acquisition of 100 percent of the shares in Siltectra resulted in an increase in goodwill and other intangible assets of €130 million (see note 3 to the Consolidated Financial Statements). Goodwill and other intangible assets went up by €64 million due to exchange rate factors.
Increase in liabilities driven by higher pension plans and similar commitments Total liabilities stood at €4,779 million as of 30 September 2019 and were therefore €346 million (8 percent) higher than one year earlier (€4,433 million). Hereby, liabilities for pension plans and similar commitments increased in particular by €181 million, mainly as a result of the lower discount factor applied (see note 18 to the Consolidated Financial Statements for details). Other current liabilities increased by €137 million compared to the end of the previous fiscal year. The figure includes €112 million relating to the so-called “Deal Contingent Option” concluded to partially hedge exchange rate risks arising in conjunction with the planned acquisition of Cypress and which is only required to be paid if the acquisition of Cypress is completed, and the related Deal Contingent Option is exercised (see notes 3 and 26 to the Consolidated Financial Statements).
Debt also increased slightly by €24 million in total. Information on debt maturities is provided in note 15 to the Consolidated Financial Statements.
Equity up mainly due to share capital increase Equity increased by €2,187 million (34 percent) to stand at €8,633 million at the end of the reporting period (30 September 2018: €6,446 million). The higher amount was mainly attributable to the share capital increase implemented in June 2019, which resulted in increases of €226 million and €1,299 million to ordinary share capital and additional paid-in capital, respectively (see note 19 to the Consolidated Financial Statements). Net income generated in the 2019 fiscal year amounting to €870 million also increased equity. The payment of the dividend for the 2018 fiscal year reduced equity by €305 million.
The equity ratio improved to 64.4 percent as of the end of the reporting period (30 September 2018: 59.3 percent).
P see page 60 f.
P see page 141 f.
P see page 156 ff.
P see page 142 and page 174 ff.
P see page 154 f.
Debt by currencies€ in millions
55 % 45 %1,5562019
53 % 47 %1,5322018
US dollar Euro
P see page 161
74Combined Management Report | Our 2019 fiscal year Group performanceReview of financial condition
INFINEON TECHNOLOGIES | ANNUAL REPORT 2019

RoCE of 12.2 percent generated Operating income from continuing operations after tax fell by 27 percent from €1,263 million to €925 million in the 2019 fiscal year. By contrast, capital employed rose by 23 percent from €6,168 million to €7,599 million year-on-year. As a result, the Return on Capital Employed (RoCE) decreased from 20.5 percent to 12.2 percent.
RoCE for the 2019 and 2018 fiscal years is calculated as follows:
€ in millions 2019 2018
Operating income 1,161 1,469
Plus/minus:
Financial result excluding interest result1 (36) (8)
Gain from investments accounted for using the equity method (6) (5)
Income tax (194) (193)
Operating income from continuing operations after tax 1 925 1,263
Assets 13,412 10,879
Plus/minus:
Cash and cash equivalents (1,021) (732)
Financial investments (2,758) (1,811)
Assets classified as held for sale (12) (11)
Total current liabilities (2,044) (2,182)
Short-term debt and current maturities of long-term debt 22 25
Capital employed 2 7,599 6,168
RoCE 1 / 2 12.2% 20.5%
1 The financial result for the 2019 and 2018 fiscal year amounted to negative €72 million and negative €53 million, respectively, and included negative €36 million and negative €45 million, respectively, of net interest result.
75Combined Management Report | Our 2019 fiscal year Group performanceReview of financial condition
INFINEON TECHNOLOGIES | ANNUAL REPORT 2019

Review of liquidity
Cash flow
€ in millions 2019 2018
Net cash provided by operating activities from continuing operations 1,603 1,571
Net cash used in investing activities from continuing operations (2,488) (1,163)
Net cash provided by (used in) in financing activities from continuing operations 1,167 (542)
Net change in cash and cash equivalents from discontinued operations (2) 4
Cash-relevant change in cash and cash equivalents 280 (130)
Effect of foreign exchange rate changes on cash and cash equivalents 9 2
Change in cash and cash equivalents 289 (128)
Increase in net cash provided by operating activities from continuing operations Net cash provided by operating activities from continuing operations in the 2019 fiscal year amounted to €1,603 million, an increase of €32 million compared to the previous fiscal year’s figure of €1,571 million. Taking income from continuing operations before depreciation, amortization, impairment losses, interest and taxes amounting to €2,070 million as the starting point, changes in inventories, trade receivables and trade payables totaling €277 million were the main items reducing net cash provided by operating activities from continuing operations. Cash outflows for interest and income taxes totaled €167 million.
In the previous fiscal year, net cash provided by operating activities from continuing operations totaled €1,571 million. Taking income from continuing operations before depreciation and amortization, impairment losses, interest, taxes and the gain on the sale of the major part of Infineon’s RF components business amounting to €2,054 million as the starting point, changes in trade receivables, trade payables and inventories totaling €209 million were the main items reducing cash and cash equivalents. Cash outflows for interest and income taxes totaled €262 million.
Net cash used in investing activities from continuing operations influenced by investments and purchase of financial investmentsNet cash used in investing activities from continuing operations totaled €2,488 million in the 2019 fiscal year, including €1,295 million invested in property, plant and equipment. €156 million invested in intangible and other assets, and €123 million used for the acquisition of 100 percent of the shares in Siltectra (see note 3 to the Consolidated Financial Statements). A net amount of €924 million relates to cash used to purchase financial investments that are part of the gross cash position and which are not included in free cash flow (see the section “Free cash flow” below).
In the previous fiscal year, net cash used in investing activities from continuing operations totaled €1,163 million. Investments in property, plant and equipment and in intangible assets amounted to €1,254 million. Cash received in connection with the sale of the major part of the RF components business to Cree, Inc. amounting to €323 million had an offsetting effect.
Share capital increase results in net cash provided by financing activities from continuing operations Net cash used in financing activities from continuing operations in the 2019 fiscal year totaled €1,167 million and was mainly impacted by the net proceeds from the share capital increase implemented in June 2019 amounting to €1,524 million (see note 19 to the Consolidated Financial Statements). The main offsetting effect resulted from the disbursement of the dividend for the 2018 fiscal year amounting to €305 million.
In the previous fiscal year, net cash used in financing activities from continuing operations totaled €542 million and was mainly impacted by repayments of long-term debt amounting to €321 million. In addition, the dividend for the 2017 fiscal year amounting to €283 million was disbursed.
P see page 141 f.
P see page 77
P see page 161
76Combined Management Report | Our 2019 fiscal year Group performanceReview of liquidity
INFINEON TECHNOLOGIES | ANNUAL REPORT 2019

Free cash flowInfineon reports the free cash flow figure, defined as net cash provided by and/or used in operating activities and net cash provided by and/or used in investing activities, both from continuing operations, after adjusting for cash flows related to the purchase and sale of financial investments. Free cash flow serves as an additional performance indicator, since Infineon holds part of its liquidity in the form of financial investments. This does not mean that the free cash flow calculated in this way is available to cover other disbursements, since dividend, debt-servicing obligations and other fixed disbursements are not deducted. Free cash flow should not be seen as a replacement or superior performance indicator, but rather as an additional useful item of information over and above the disclosure of the cash flow reported in the Consolidated Statement of Cash Flows, and as a supplementary disclosure to other liquidity performance indicators and other performance indicators derived from the IFRS figures. Free cash flow only includes amounts from continuing operations, and is derived as follows from the Consolidated Statement of Cash Flows:
€ in millions 2019 2018
Net cash provided by operating activities from continuing operations 1,603 1,571
Net cash used in investing activities from continuing operations (2,488) (1,163)
Purchases of (proceeds from sales of) financial investments, net 924 210
Free cash flow 39 618
Investments and acquisition of Siltectra financed by net cash provided by operating activitiesFree cash flow in the 2019 fiscal year amounted to €39 million. Net cash provided by operating activities from continuing operations amounting to €1,603 million exceeded the combined amount of cash used for investments in property, plant and equipment and intangible and other assets (€1,451 million) and for the acquisition of Siltectra (€123 million). Payments in connection with the planned acquisition of Cypress reduced the free cash flow by €23 million.
Free cash flow in the previous fiscal year amounted to €618 million. Net cash provided by operating activities from continuing operations amounting to €1,571 million exceeded investments in property, plant and equipment, intangible and other assets totaling €1,254 million. Free cash flow of the previous fiscal year included proceeds from the sale of the major part of the RF components business to Cree, Inc.
Gross cash position and net cash positionThe following table reconciles the gross cash position and the net cash position (i.e. after deduction of debt). Since some liquid funds are held in the form of financial investments, which, for IFRS purposes, are not considered to be “cash and cash equivalents”, Infineon reports on its gross and net cash positions in order to provide investors with a better understanding of its overall liquidity. The gross and net cash positions are determined as follows from the Consolidated Statement of Financial Position:
€ in millions 30 Septem-ber 2019
30 Septem-ber 2018
Cash and cash equivalents 1,021 732
Financial investments 2,758 1,811
Gross cash position 3,779 2,543
Minus:
Short-term debt and current maturities of long-term debt 22 25
Long-term debt 1,534 1,507
Total debt 1,556 1,532
Net cash position 2,223 1,011
The gross cash position as of 30 September 2019 increased by €1,236 million, mainly due to the net proceeds of €1,524 million arising on the share capital increase implemented in June 2019. Free cash flow amounted to €39 million. The dividend payment reduced cash by €305 million.
77Combined Management Report | Our 2019 fiscal year Group performanceReview of liquidity
INFINEON TECHNOLOGIES | ANNUAL REPORT 2019

Taking into account the financial resources available to Infineon – including internal liquidity on hand, net cash that can be generated, and available credit facilities (€8,201 million; 2018: €72 million, see note 15 to the Consolidated Financial Statements for further information) – Infineon assumes that it will be able to cover those capital require-ments for the 2020 fiscal year that are currently expected. These include the financing of the planned acquisition of Cypress, for which binding credit commitments are in place and for which the first material steps towards re-financing were taken in the form of the share capital increase implemented in June 2019 and the issue of a perpetual hybrid bond with a nominal volume of €1.2 billion on 1 October 2019 (see note 29 to the Consolidated Financial Statements). Forecasted capital requirements also include fixed contractual obligations, such as leasing arrangements, fixed service and supply agreements for commodities, input materials, electricity, gas and other similar items (see note 22 to the Consolidated Financial Statements for further information). Planned investments are discussed in the chapter “Outlook”.
Principles and structure of Infineon’s treasuryThe Infineon treasury’s stated objective is to ensure financial flexibility based on a solid capital structure. It is the primary goal to ensure that sufficient cash funds are available to finance operating activities and planned investments throughout all phases of the business cycle. Debt should only constitute a modest proportion of the financing mix, so that headroom is available at all times. Further information on the nature, maturity, currency and interest rate structure of financial liabilities is provided in note 15 to the Consolidated Financial Statements.
Group-wide treasury principles are in place regarding all issues relating to liquidity and financing, such as banking policies and strategies, execution of financing agreements, liquidity and investment management worldwide, currency and interest rate risk management and the handling of external and intragroup cash flows.
Treasury at Infineon is based on a centralized approach in which the Group Finance & Treasury department is responsible for all major tasks and processes worldwide relating to financing and treasury matters.
In the context of centralized liquidity management and where permitted by law and economically feasible, cash pooling structures are in place for liquidity management purposes in order to ensure the best possible allocation of liquidity within the Group and reduce external financing requirements. Liquidity accumulated at Group level is invested centrally by the Group Finance & Treasury department, based on a conservative approach to investments, in which preservation of capital is prioritized over return maximization. The Group Finance & Treasury department is also responsible for managing currency and interest rate risks. We employ the following derivative financial instruments for hedging purposes: forward foreign currency contracts to reduce exchange rate exposures (to the extent foreign currency cash flows are not offset within the Group) and commodity swaps to reduce price risks for expected purchases of gold. In order to hedge against most of the exchange rate risk associated with the purchase price obligation arising from the planned acquisition of Cypress, the Company concluded a euro/US dollar forward currency contract (Deal Contingent Forward) as well as a euro/US dollar foreign currency option (Deal Contingent Option), both of which are contingent on the acquisition deal. Derivative financial instruments are not used for trading or speculation purposes. Further information regarding derivative financial instruments and the manage-ment of financial risks is provided in notes 26 and 27 to the Consolidated Financial Statements.
Furthermore, to the extent permitted by law, all financing activities and credit lines worldwide are arranged, structured and managed either directly or indirectly by the Group Finance & Treasury department in accordance with stipulated treasury principles.
P see page 155
P see page 186
P see page 165 f.
P see page 81 f.
P see page 154 f.
P see page 174 ff. und S. 178 f.
78Combined Management Report | Our 2019 fiscal year Group performanceReview of liquidity
INFINEON TECHNOLOGIES | ANNUAL REPORT 2019

OutlookActual and target values for performance indicatorsThe following table and subsequent explanatory comments compare the actual and forecast values of Infineon’s key performance indicators for the 2019 fiscal year and show the outlook for the 2020 fiscal year excluding the planned acquisition of Cypress. Only certain costs incurred in connection with the transaction were included.
The outlook for Infineon’s principal performance indicators as well as for selected supplementary performance indicators including the planned acquisition of Cypress is presented in a separate section within the overall statement on the expected development.
€ in millions, except percentages Actuals FY 2018
Original outlookFY 20191
Actuals FY 2019
Outlook FY 2020
Principal performance indicators
Segment Result Margin 17.8% About 18% (at the mid-point of the planned range for revenue growth)
16.4% Around 16% (at the mid-point of the planned range for revenue growth)
Free cash flow from continuing operations
618 Slightly positive up to €200 million 39 Between €500 million and €700 million
RoCE 20.5% Moderate decrease 12.2% On similar level as in previous year
Selected supplementary performance indicators
Change in revenue compared to previous year
8% Increase by 11% plus/minus 2 percentage points 6%
Increase by 5% plus/minus 2 percentage points
Investments 1,254 Between €1.6 billion and €1.7 billion 1,451 Around €1.3 billion
Gross cash position
2,543 €1 billion
+ 20%
In the range of €1.9 billion to €2.7 billion and therefore within the target range of €1 billion + 10% to 20% of revenue
3,779 €1 billion
+ 35%
In the range of €2.1 to €2.7 billion and therefore within the target rangeof €1 billion + 10% to 20% of revenue 2
1 The original forecast was adjusted in the context of the ad hoc announcement of 27 March 2019.2 The cash inflows from the capital increase implemented in June 2019 are not included.
Comparison of original outlook and actual figures for the 2019 fiscal yearRevenue growth for the 2019 fiscal year was originally forecast at 11 percent, plus or minus 2 percentage points. In view of the adverse economic environment, the forecast was adjusted in the ad hoc announcement dated 27 March 2019 to an expected revenue of €8 billion, plus or minus 2 percent. With actual revenue of €8.029 billion, the reduced revenue forecast was achieved. Revenue grew by 6 percent year-on-year. In conjunction with the lower estimate made for revenue, the expected Segment Result Margin was also adjusted downward from 18 percent to 16 percent at the mid-point of the planned range for revenue growth. The actual Segment Result Margin recorded in the 2019 fiscal year came in at 16.4 percent.
Free cash flow generated in the 2019 fiscal year amounted to €39 million and was thus within the originally forecast range of “slightly positive up to €200 million” and above the later adjusted forecast of “between break-even and negative €150 million”. This includes the payment of €123 million for the acquisition of Siltectra.
Report on outlook, risk and opportunity
79Combined Management Report | Our 2019 fiscal year Report on outlook, risk and opportunityOutlook
INFINEON TECHNOLOGIES | ANNUAL REPORT 2019

The forecast for Return on Capital Employed (RoCE) initially predicted a moderate decline and, following the adjusted forecast, a significant decline. At 12.2 percent, actual RoCE in the 2019 fiscal year was well below the previous year’s figure of 20.5 percent. In addition to lower revenue growth, this was also due to higher idle costs. Capital employed increased primarily as a result of investments and the increase in working capital, in particular due to higher inventories. The previous year’s figure was also positively impacted by the gain of €270 million arising on the sale of the major part of the RF power components business to Cree, Inc.
The targeted range for the gross cash position was between €1.9 billion and €2.7 billion. This range was substantially exceeded, with the actual gross cash position finishing at €3,779 million. Excluding the net proceeds from the capital increase of €1,524 million implemented in June 2019 to finance the planned Cypress acquisition, which are included in the gross cash position, a value within the forecast range would have been achieved.
At €1,451 million, investments were both below the originally forecast range of between €1.6 billion and €1.7 billion and slightly below the adjusted forecast of €1.5 billion.
Explanatory comments on the outlook for the 2020 fiscal year excluding CypressThe following forecasts are based on current business developments and Infineon’s internal forecasts. The planned acquisition of Cypress is not yet included in the figures presented. The outlook for Infineon’s principal performance indicators as well as for selected supplementary performance indicators including the planned acquisition of Cypress is discussed in a separate section within the overall statement on the expected development.
Assumed euro/US dollar exchange rateAs a globally operating organization, Infineon generates revenue not only in euros, but also in foreign currencies, predominantly US dollars. It also incurs expenses in US dollars and, to some extent, in currencies correlated to the US dollar, such as the Singapore dollar, the Malaysian ringgit and the Chinese renminbi. The impact of non-euro denominated revenue and expenses does not always balance out. For this reason, fluctuations in exchange rates, particularly between the euro and the US dollar, influence the amounts reported for revenue and earnings. A stronger US dollar against the euro has a positive impact, whereas a weaker US dollar against the euro has an adverse impact on revenue and earnings. Excluding the effect of currency hedging instruments, the impact of a deviation of 1 cent in the actual exchange rate of the US dollar against the euro compared to the forecast rate would amount to a change in Segment Result of approximately €3 million per quarter or approximately €12 million per fiscal year compared to the forecast value. These figures assume, however, that the exchange rates of currencies correlated with the US dollar – in which costs arise for Infineon – change in line with the euro/US dollar exchange rate. In terms of revenue, the impact of exchange rates is limited primarily to the euro/US dollar exchange rate, where a deviation of 1 cent in the actual exchange rate compared to the forecast rate would continue to have an impact on revenue of approximately €9 million per quarter or approximately €36 million per fiscal year. Planning for the 2020 fiscal year is based on an assumed average exchange rate of US$1.13 to the euro. This corresponds to the average exchange rate achieved in the 2019 fiscal year.
Growth prospects for the global economy and the semiconductor marketThe world economy grew by 3.1 percent in the 2018 calendar year. For the 2019 calendar year, in spring 2019 experts at the International Monetary Fund (IMF) had forecast that the growth rate would slow to 2.7 percent. In its October 2019 forecast, however, the IMF further lowered its prediction for the 2019 calendar year to 2.5 percent. For the 2020 calendar year, the experts forecast a slight recovery in global economic growth, predicting in their October 2019 forecast a growth rate of 2.7 percent for the 2020 calendar year. The rise in trade barriers and unresolved geopolitical conflicts are cited as the main reasons for the global economic slowdown. According to the IMF, the slight increase predicted for the 2020 calendar year is not broadly based and therefore remains uncertain.
P see page 82
80Combined Management Report | Our 2019 fiscal year Report on outlook, risk and opportunityOutlook
INFINEON TECHNOLOGIES | ANNUAL REPORT 2019

The markets to which Infineon supplies its products are also impacted by the effects of the slowdown in global eco-nomic growth. On a US dollar basis, the global semiconductor market relevant for Infineon (i.e. excluding memory ICs and microprocessors) grew by 5.7 percent in the 2018 calendar year. Informa Tech now predicts that this market will contract by 4.2 percent in the 2019 calendar year, before growing again by 3.7 percent in the 2020 calendar year.
Revenue growth of 5 percent expected, plus or minus 2 percentage points year-on-year Based on our expectations for the growth of the global economy and for the semiconductor market segments relevant for Infineon as described above and an assumed average exchange rate of US$1.13 to the euro, the Group forecasts revenue growth of 5 percent, plus or minus 2 percentage points, for the 2020 fiscal year. Revenue growth in the Automotive segment is expected to be slightly above the Group average. The Power Management & Multimarket segment revenue growth is expected to be in line with the Group average. The Industrial Power Control segment is likely to report a slightly lower growth than the Group average while for the Digital Security Solutions segment a stagnant to only slightly growing revenue is expected.
Segment Result Margin around 16 percent expectedBased on the forecast changes in revenue described above, in the 2020 fiscal year the Segment Result Margin is expected to come it at around 16 percent at the mid-point of the planned range for revenue growth.
Free cash flow from continuing operationsThe Company expects to achieve a free cash flow of between €500 million and €700 million in the 2020 fiscal year.
RoCEThe Return on Capital Employed (RoCE) in the 2019 fiscal year amounted to 12.2 percent and is forecast to remain at a similar level in the 2020 fiscal year.
Gross cash positionThe gross cash position is expected to finish the 2020 fiscal year at a level of between €2.1 billion and €2.7 billion. Hence, Infineon again expects to meet its capital structure targets in the 2020 fiscal year. See “Capital structure targets demonstrate our long-term reliability” in the chapter “Group strategy” for more information on capital structure targets.
Investments and depreciation/amortizationInvestments (defined by Infineon as the sum of investments in property, plant and equipment, investments in intangible assets and capitalized research and development costs) are expected to be around €1.3 billion in the 2020 fiscal year. About one third of this amount is attributable to manufacturing buildings including their infrastructure as well as office buildings to create the conditions to profit from the next market upturn and to make full use of structural growth potential. In the 2019 fiscal year, the actual figure amounted to €1,451 million, comprising invest-ments in property, plant and equipment of €1,295 million and in capitalized development costs and other intangible assets of €156 million. In the 2020 fiscal year, investments in capitalized development costs and other intangible assets are expected to be slightly higher than one year earlier.
Planned investments in manufacturing facilities during the 2020 fiscal year will focus on improving the structural and quality-related aspects of production as well as expanding frontend capacities on a moderate scale. Investments in the existing 200-millimeter and 300-millimeter manufacturing plants will mainly focus on ensuring that they remain state-of-the-art in terms of automation, quality, innovation and infrastructure. The largest single project remains the continued construction of the cleanroom for the new 300-millimeter manufacturing facility in Villach (Austria). Depending on the macro-economic situation, we currently plan to ramp the fab by late 2021 calendar year. Investments in upgrades and capacity expansions for backend facilities will be significantly lower than the amount being invested in frontend facilities.
P see page 36 f.
81Combined Management Report | Our 2019 fiscal year Report on outlook, risk and opportunityOutlook
INFINEON TECHNOLOGIES | ANNUAL REPORT 2019

Depreciation and amortization are expected to be in the region of €1.0 billion. Approximately €60 million of that amount relates to depreciation and amortization resulting from purchase price allocations, mainly in connection with the acquisition of International Rectifier.
Overall statement on the expected development Expected development of Infineon excluding CypressBased on forecasts for the global economy and the semiconductor market in the 2020 calendar year, excluding Cypress, Infineon expects revenue growth of 5 percent year-on-year, plus or minus 2 percentage points.
At the mid-point of the planned range of revenue growth, the Segment Result Margin is expected to be around 16 percent.
Free cash flow from continuing operations should amount to between €500 million and €700 million.
The Return on Capital Employed (RoCE) is expected to reach the previous fiscal year’s level.
Investments of around €1.3 billion and depreciation and amortization of approximately €1.0 billion are planned.
Expected development of Infineon including CypressTaking into account the additional Cypress revenue that is expected to accrue to the Group following completion of the planned acquisition, Infineon anticipates a significant increase in Group revenue in the 2020 fiscal year.
We assume the Segment Result Margin to be approximately at the level of the previous year.
In the 2020 fiscal year, the payment of the purchase price of US$23.85 per share and other costs in connection with the planned Cypress acquisition will significantly impact free cash flow, which will therefore be clearly negative despite the positive contribution that Cypress is expected to make, particularly to net cash provided by operating activities.
The Return on Capital Employed (RoCE) is expected to decrease sharply in the 2020 fiscal year. In particular, the purchase price allocation and the related depreciation and amortization will lead to a reduction in operating result after tax from continuing operations and an increase in capital employed.
Approximately 70 percent of the planned acquisition is to be financed in the form of debt capital, which will result in a significant increase in financial liabilities and therefore in interest expense.
The outlook for Infineon including Cypress, as described above, was prepared prior to conclusion of the acquisition, at which stage Infineon had no control over Cypress and information was therefore only available to a very limited extent. The outlook is therefore primarily based on externally available information (for example, from financial data drawn up in accordance with US GAAP and already published by Cypress) and on information made available by Cypress in the course of the due diligence phase in May 2019. The forecasts take into account initial indicative assumptions, in particular with regard to the purchase price allocation. Once the acquisition is completed and more reliable data is available, the outlook for Infineon including Cypress will be adjusted. The acquisition is expected to be completed towards the end of the 2019 calendar year or early in 2020.
82Combined Management Report | Our 2019 fiscal year Report on outlook, risk and opportunityOutlook
INFINEON TECHNOLOGIES | ANNUAL REPORT 2019

Risk and opportunity reportRisk policy: Underlying principles of our risk and opportunity management Effective risk and opportunity management is central to all of our business activities and plays an important role in implementing the strategic targets described in the chapter “Group strategy” – namely achieving sustainable, profitable growth and preserving our financial resources through efficient employment of capital. Infineon’s risk and opportunity profile is characterized by periods of rapid growth, followed by periods of significant market decline, a substantial need for capital investment in order to achieve and sustain our market position and an extraordinarily rapid pace of technological change. Gaining a leading edge through technological innovation also has a legal dimension. Against this background, Infineon’s risk policy is aimed firstly at taking advantage of identified oppor-tunities as quickly as possible in a way most appropriate to increasing the value of the business, and secondly at pro-actively mitigating risks – particularly those capable of posing a threat to Infineon’s going-concern status – by adopting appropriate countermeasures. Risk management at Infineon is therefore closely linked to forecasting and the implementation of our business strategy. Ultimate responsibility for risk management lies with the Infineon Management Board.
Coordinated risk management and control system elements are in place that enable us to pursue our stated risk policy in practice. Alongside the “Risk and Opportunity Management System” and the “Internal Control System with respect to Financial Reporting Processes” described below, it also includes the related forecasting, management and internal reporting processes as well as the Compliance Management System.
Risk and Opportunity Management System Infineon’s centralized risk management system is based on a Group-wide, management-oriented Enterprise Risk Management (ERM) approach, which aims to cover all relevant risks and opportunities. The approach is based on the “Enterprise Risk Management – Integrated Framework” developed by the Committee of Sponsoring Organi-zations of the Treadway Commission (COSO). The objective of the system is the early identification, assessment and management of risks that could have a significant influence on Infineon’s ability to achieve its strategic, opera-tional, financial, legal and compliance targets. We therefore define risk/opportunity as the occurrence of future uncertainties that could result in a negative or positive variance from plan. We incorporate all relevant organizational units within the Group in this analysis, thus covering all segments, significant centralized functions and regions.
Responsibility for processes and systems relating to Risk and Opportunity Management rests with the Risk Management and Internal Control System (ICS) function within the corporate finance department and with desig-nated Risk Officers working at segment, corporate function and regional levels. Responsibility for the identification, measurement, management and reporting of risks and opportunities lies with the management of the organizational unit concerned.
In organizational terms, the Risk and Opportunity Management System is structured in a closed-loop, multiple-stage process, which stipulates the manner and criteria to be applied to identify, measure, manage and report on risks and opportunities and defines how the system is to be monitored as a whole. Major components of the system are a quarterly analysis of risks and opportunities, reporting by all consolidated entities, an analysis of the overall situation at segment, regional and Group level, reporting to the Management Board on the risks and opportunities situation as well as major management measures undertaken. The Management Board, in turn, reports regularly to the Supervisory Board’s Investment, Finance and Audit Committee. Where necessary, standard processes are supplemented by the ad-hoc reporting of any major risks identified between regular reporting dates.
Risks and opportunities are measured cumulatively over the multi-year planning horizon on a net basis, i.e. after taking into account any existing risk mitigation or hedging measures. The time periods and the measurement categories used are closely linked to our short- and medium-term business planning and entrepreneurial targets.
P see page 29 ff.
83Combined Management Report | Our 2019 fiscal year Report on outlook, risk and opportunityRisk and opportunity report
INFINEON TECHNOLOGIES | ANNUAL REPORT 2019

All relevant risks and opportunities are assessed uniformly across the Group in quantitative and/or qualitative terms, based on the dimensions degree of impact on operations, liquidity, earnings, cash flows and reputation on the one hand and likelihood of occurrence on the other.
In light of Infineon’s strong growth in recent years, the degree of impact was reviewed at the beginning of the 2019 calendar year and adjusted to take account of revenue and Segment Result developments. The reference value for the highest degree of impact (Level 5) was increased from a Segment Result impact of greater than €250 million to one of greater than €500 million and all other gradations were adjusted accordingly.
The scales used to measure these two factors (degree of impact and likelihood of occurrence) and the resulting risk assessment matrix are depicted in the following graph.
Based on the potential degree of impact on operations, liquidity, earnings, cash flows and reputation as well as the estimated probability of occurrence, a risk is classified as “high”, “medium” or “low”.
All reported risks and opportunities for Infineon are aggregated and reviewed for possible correlation and cumulative effects, and are analyzed using an Infineon-specific categorization model. Risks and opportunities analysis and new developments in risk management culture are supplemented by interdisciplinary workshops held at segment, cor-porate and regional levels. Important information relevant for Infineon’s Risk and Opportunity Management System is available to all employees via our intranet system, including access to ERM tools and ERM guidelines, containing job descriptions for all functions involved in the process as well as all information necessary for reporting purposes.
Risk and Opportunity Managers are designated at appropriate hierarchical levels to manage and monitor identified risks and opportunities, and are responsible for formally determining a set of appropriate strategies (avoidance, mitigation, transfer to other parties, acceptance). Working closely with corporate functions and individual managers, the Risk and Opportunity Manager is also responsible for defining and monitoring measures aimed at implementing the adopted management strategy. For our system to be successful, it is essential that risks and opportunities are managed and monitored pro-actively and with a great deal of commitment.
Compliance with the ERM approach is monitored by the corporate Risk Management and ICS departments using procedures incorporated in business processes. Group Internal Audit also tests compliance with legal requirements and Infineon guidelines and, where appropriate, rules relating to Risk and Opportunity Management and initiates corrective measures.
The Supervisory Board’s Investment, Finance and Audit Committee oversees the effectiveness of the Risk Manage-ment System. As part of the statutory audit, the external Group auditor also examines our early warning system pursuant to section 91, paragraph 2, of the German Stock Corporation Act to ascertain its suitability to detect risks that could pose a threat to Infineon’s going-concern status and reports annually thereon to the Chief Financial Officer (CFO) and the Investment, Finance and Audit Committee of the Supervisory Board.
Likelihood of Occurrence
1 < 10 % Unlikely 2 < 40 % Possible 3 < 60 % Likely 4 < 90 % Probable 5 > 90 % Certain
Degree of Impact on Segment Result1 < €60 million Marginal 2 > €60 million Minor 3 > €100 million Moderate 4 > €250 million Significant 5 > €500 million Major
Risk assessment matrix
Degree of Impact
Likelihood of Occurrence
5
1 2 3 4 5
4
3
2
1
Low Risk Medium Risk High Risk
84Combined Management Report | Our 2019 fiscal year Report on outlook, risk and opportunityRisk and opportunity report
INFINEON TECHNOLOGIES | ANNUAL REPORT 2019

Internal Control System with respect to the financial reporting process The principal focus of the Internal Control System (ICS) is on the financial reporting process, with the aim of monitoring the proper maintenance and effectiveness of accounting systems and financial reporting. The primary objective of the ICS is to minimize the risk of misstatement in Infineon’s internal and external reporting and to ensure with a reasonable amount of certainty that the Consolidated Financial Statements comply with all relevant regulations. Appropriate controls must therefore be in place throughout the organization to ensure such compliance. Clear lines of responsibility are assigned to each of the processes.
The ICS is an integral part of the accounting process in all relevant legal entities and corporate functions. The system monitors compliance with stated principles and stipulated procedures based on preventive and detective controls. Among other things, we regularly check that:
› Group-wide financial reporting, valuation and accounting guidelines are continually updated and adhered to;
› intragroup transactions are fully accounted for and properly eliminated;
› issues relevant for financial reporting and disclosures in connection with agreements entered into are recognized and appropriately presented;
› processes and controls are in place to explicitly guarantee the completeness and correctness of the year-end financial statements and financial reporting;
› processes are in place for the segregation of duties and for the dual control principle in the context of preparing financial statements, as well as for authorization and access rules for relevant IT accounting systems.
Assessment of effectivenessWe systematically assess the effectiveness of the ICS with regard to the corporate accounting process. An annual risk analysis is initially performed and the defined controls are revised, as and when required. The assessment involves identifying and updating significant risks relating to accounting and financial reporting in the relevant legal entities and corporate functions. The controls defined for identifying risks are documented in accordance with Group-wide guidelines. Regular random tests are performed to assess the effectiveness of the controls. These tests constitute the basis for an assessment of the appropriateness design and effectiveness of the controls. The results are documented and reported in a global IT system. Any deficiencies identified are remedied with due consideration given to their potential impact.
Furthermore, in a Representation Letter, all legal entities, segments and relevant corporate functions confirm that all business transactions, all assets and liabilities and all income and expense items have been recognized in the financial statements.
At the end of the annual cycle, the material legal entities review and confirm the effectiveness of the ICS with regard to the accounting and financial reporting process. The Management Board and the Investment, Finance and Audit Committee of the Supervisory Board are regularly informed about any significant control deficiencies and the effectiveness of the internal controls.
The Risk and Opportunities Management System as well as the Internal Control System are continuously developed and extended to ensure compliance with internal and external requirements. Regular improvements made to the system contribute to the continuous monitoring of the relevant risk areas including the responsible organi zational units.
85Combined Management Report | Our 2019 fiscal year Report on outlook, risk and opportunityRisk and opportunity report
INFINEON TECHNOLOGIES | ANNUAL REPORT 2019

Significant risksIn the following section, we describe risks that could have a significant or materially adverse impact on Infineon’s operations, liquidity, earnings, cash flows and reputation and which have therefore been allocated to the risk classes “high” or “medium”. Depending on the potential degree of impact and the estimated likelihood of occurrence, the risk class is shown in parentheses for each risk (e.g. “RC: high”).
The following description of specific risks does not take into account the planned acquisition of Cypress. The main potential risks arising in connection with the planned acquisition are presented in the section “Risks arising in connection with the planned acquisition of Cypress”.
Strategic risksUnsettled political and economic climate (RC: high)As a globally operating company, our business is highly dependent on global economic developments. A worldwide economic downturn – particularly in the markets we serve – may result in us not achieving our forecasted revenue and contribution to earnings. Risks can also arise due to political and social changes, in particular when those changes occur in countries in which we manufacture and/or sell our products.
Trade and customs disputes could constrain global trade thereby dampening global economic growth, triggered by political tensions and/or trade conflicts between individual countries or regions, which – as a result of short-term or unforeseeable decisions – could have a significant impact on Infineon’s revenue and earnings performance.
Following the global financial and economic crisis in 2008, the debt situation in a number of European countries remains very tense. The terms of the United Kingdom’s exit from the European Union (Brexit) also remain unclear.
Our dependence on the Chinese market remains unchanged. This risk includes the possibility of lower external demand and hence a decline in manufacturing capacity utilization levels. There is also a risk that an increased volume of previously imported semiconductors will be manufactured in China and that a greater volume of semi-conductors manufactured in China will be exported. Regardless of our assessment of potential scenarios and out-comes within this complex set of risks, these developments could have an adverse impact on Infineon’s operations, financial condition, liquidity, cash flows and earnings.
Cyclical market and sector development (RC: high)The worldwide semiconductor market is dependent on global economic growth and hence subject to fluctuations. Our target markets continue to be exposed to the risk of short-term market fluctuations. As a result, our own forecasts of future business developments are subject to a high degree of uncertainty. It is possible, for instance, that future market downturns will follow another pattern, for example an L shape. The absence of market growth or its decline would make it considerably more difficult to attain our own growth target. In the event that we are unprepared for market fluctuations, or our response to such fluctuations turns out to be inappropriate, this could have a sustained materially adverse impact on Infineon’s operations, financial condition, liquidity, cash flows and earnings.
Increased market competition and commoditization of products (RC: high)The rapid pace of technological change in the market also results in a greater replaceability of products. Due to the resulting aggressive pricing policies, we may be unable to achieve our long-term strategic goals of gaining and/or maintaining market share and of product pricing. Moreover, accelerating M&A (Merger and Acquisition) activity within the semiconductor industry could result in even tougher competition. Potential benefits for competitors in this market include improved cost structures and stronger sales channels. Overall, this situation could have an adverse impact on Infineon’s earnings.
P see page 91 f.
86Combined Management Report | Our 2019 fiscal year Report on outlook, risk and opportunityRisk and opportunity report
INFINEON TECHNOLOGIES | ANNUAL REPORT 2019

Operational risksData and IT systems security (RC: high)The reliability and security of Infineon’s information technology systems are of crucial importance. At the same time, the world has seen a general rise in the level of threats to data security. This applies to the deployment of IT systems to support business processes on the one hand and internal and external communications on the other. Despite the array of precautionary measures put in place, any major disruption to these systems could result in risks relating to the confidentiality, availability and reliability of data and systems used in development, manufacturing, selling or administration functions, which, in turn, could have an adverse impact on our reputation, competitiveness and operations.
Potential virus attacks, in particular on IT systems used in manufacturing processes, present additional risks that could result in production downtime and supply bottlenecks.
Increasingly dynamic markets (RC: high)The accelerating pace of events in the markets in which we operate, increased demands for flexibility by our customers, and short-term changes in order volumes could result in rising costs due to the underutilization of manufacturing capacities, higher inventory levels and unfulfilled commitments to suppliers.
Thus, despite the fact that manufacturing processes and sites have become even more flexible, fluctuations in capacity utilization levels and purchase commitments, coupled with idle costs at manufacturing sites, nevertheless pose risks related to our cost position. These risks could possibly jeopardize our ability to attain growth and profitability targets that are based on cycle averages.
The situation is exacerbated by the fact that our products are highly dependent on the degree of success achieved by individual customers in their own markets. Furthermore, there is a risk of losing future business and design wins if we are unable to deliver volumes over and above our contractual obligations if called upon by the customer to do so. In the case of unexpectedly high demand, we therefore face the challenge of having to deliver increased volumes that require an appropriate level of upfront investment. This could have an adverse impact on our planned investment ratio and, ultimately, on earnings.
Dependence on the success of specific customers may also grow if they account for an above-average share of Infineon’s revenue and earnings. This situation could be driven by an exceptionally strong performance by the relevant customer, resulting, for instance, from exceptional demand for its products or from consolidation trends, in particular those affecting our first- and second-tier customers.
Product quality trends (RC: medium)Product quality assurance is a key success factor for the business. Potential quality risks – for example due to the high utilization levels – can affect yield fluctuations and hence our ability to supply customers. Shortfalls in product quality can lead to product recalls and potential costs related to liability claims. In addition, quality risks could also damage Infineon’s reputation and thus have a significant adverse impact on future earnings.
Product development delays (RC: medium)The ever-increasing complexity of technologies and products, shorter development cycles and higher customer expectations can cause a great deal of tension in the field of product development. Buffer times built into processes to compensate for potential delays are reduced accordingly. In the event of being unable to execute our development plans at the desired quality levels, the outcome could be development delays and increased development costs, which could have an adverse impact on our financial condition, liquidity, cash flows and earnings.
Manufacturing cost trends – raw material prices, cost of materials and process costs (RC: medium)Our medium- and long-term forecasts are based on expected manufacturing cost trends. In this context, measures aimed at optimizing manufacturing costs for raw materials and supplies, energy, labor and automation, as well as for bought-in services from external business partners, may not be feasible to the extent envisaged.
87Combined Management Report | Our 2019 fiscal year Report on outlook, risk and opportunityRisk and opportunity report
INFINEON TECHNOLOGIES | ANNUAL REPORT 2019

Moreover, our dependence on various materials (such as wafer substrates) and raw materials (such as gold and copper) used in manufacturing, as well as our energy requirements expose us to substantial price risks. We are also dependent on supplies of the so-called rare earths required for selected manufacturing processes in conjunction with production process integration. At the time of writing, financial instruments are in place to hedge our price risk exposure for gold wire during the 2020 fiscal year, based on planned volume requirements. The prices of raw materials and energy have recently been subject to significant fluctuation, and there is no reason to assume the situation will change in the near future. If we are unable to offset cost rises or pass them on to customers via price adjustments, it could have an adverse impact on earnings.
Determining and adjusting manufacturing volumes (RC: medium)Frontend and backend manufacturing need to be optimally synchronized to enable Infineon to develop competitive and high-quality products designed to provide customized technological solutions. In view of the rapid pace of technological change and increasingly stringent customer requirements, coordination processes need to become increasingly sophisticated. Failure to continue making progress in this area could result in quality problems, product development or market maturity delays as well as higher R&D expenses and hence adversely impact our earnings performance.
One risk that semiconductor companies operating in-house manufacturing facilities typically face is that of delays in the ramping-up of production volumes at new manufacturing sites, or in case of transfers of technology. One good example is in the Automotive segment, where customers’ product approval and testing processes can take place over an extended period of time, thus influencing our global manufacturing strategy as well as short- and medium-term capacity utilization. Failure to anticipate these changes in the manufacturing process in good time could result in capacity shortages and hence lower revenue on the one hand as well as costs incurred due to under-utilization on the other.
Dependence on individual manufacturing sites (RC: medium)Our South East Asian manufacturing sites are of critical importance for our production. If, for example, political upheavals or natural disasters in the region were to impede our ability to manufacture at these sites on the planned scale or to export products manufactured at those sites, it would have an adverse impact on our financial condi-tion, liquidity and earnings. Our current manufacturing capacities in this region are, to a large extent, not insured against political risks such as expropriation of assets. The transfer of manufacturing capacities from these sites would, therefore, not only involve a great deal of time and technical effort, Infineon would also be required to bear the necessary cost of investment.
Dependence on individual suppliers (RC: medium)We cooperate with numerous suppliers who provide us with materials and services, or who manage parts of our supply chain. We do not always have alternative sources for some of these suppliers and therefore depend on their ability to deliver products of the required quality. Failure of one or more of these suppliers to meet their obligations to Infineon could have an adverse impact on our earnings performance.
Need for qualified staff (RC: medium)One of our key success factors is the availability of sufficient qualified employees at all times. There is, however, a general risk of losing qualified staff or not being able to recruit, train and retain adequately qualified staff within the business. A lack of technical or management staff could, among other things, restrict future growth and hence adversely impact our earnings performance.
Financial risksCurrency risks (RC: medium)Our involvement and participation in various regional markets around the world creates cash flows in a number of currencies other than the euro – primarily in US dollars. A significant share of revenue on the one hand and of operating costs and investments on the other is denominated in US dollars and correlated currencies. For the most part, Infineon generates a US dollar surplus from these transactions.
Specified currency risks are hedged Group-wide by means of derivative financial instruments. These hedges are based on forecasts of future cash flows, the occurrence of which is uncertain. Under these circumstances, exchange rate fluctuations could – despite hedging measures – also have an adverse impact on earnings.
88Combined Management Report | Our 2019 fiscal year Report on outlook, risk and opportunityRisk and opportunity report
INFINEON TECHNOLOGIES | ANNUAL REPORT 2019

Risk of default by banking partners (RC: medium)The relatively high level of our holdings of liquid funds (gross cash position) exposes us to the potential risk of a default by one or more of the banking partners with whom we do business. We mitigate this risk – which could still arise despite various state-insured deposit protection mechanisms – by a combination of risk avoidance analyses and risk-spreading measures. The failure of these measures could have a materially adverse impact on Infineon’s financial condition and liquidity situation.
Further information regarding the management of financial risks is provided in note 27 to the Consolidated Financial Statements.
Legal and compliance risksQimonda insolvency (RC: medium)Due to the insolvency proceedings of Qimonda and the related action of the insolvency administrator, we are exposed to risks, which are described in detail in note 23 to the Consolidated Financial Statements.
Provisions are recognized in connection with these matters as of 30 September 2019. The provisions reflect the amount of those liabilities that management believes are probable and can be estimated with reasonable accuracy at that time. There can be no assurance that these provisions will be sufficient to cover all liabilities that may be incurred in conjunction with the insolvency proceedings relating to Qimonda.
Intellectual property rights and patents (RC: medium)As with many other companies in the semiconductor industry, allegations are made against us from time to time that we have infringed other parties’ protected rights. Regardless of the prospects of success of such claims, substantial legal defense costs can arise.
Whilst we often benefit from cross-licensing arrangements with major competitors, no such opportunities exist to safeguard against risks of this nature in the case of companies specializing in the exploitation of patent rights.
We cannot rule out that patent infringement claims will be upheld in a court of law, thus resulting in significant claims for damages or restrictions in selling the products concerned. Any such outcome could in turn have an adverse impact on our earnings performance.
Further information regarding litigation and government inquiries is provided in note 23 to the Consolidated Financial Statements.
Impact of our global operations (RC: medium)Our global business strategy requires the maintenance of R&D locations and manufacturing sites throughout the world. The location of such facilities is determined by market entry hurdles, technology and cost factors. Risks could, therefore, arise if adverse economic and geopolitical crises were to affect our regional markets and if country-specific legislation and regulations were to influence our investment activities and the ability to trade freely. Differing practices in the way tax, judicial and administrative regulations are interpreted could therefore also have a negative impact on operations. We could also be exposed to fines, sanctions and damage to reputation.
Asian markets are particularly important to our long-term growth strategy. Our operations in China are influenced by a legal system that may be subject to change. One example is the fact that local regulations could make it mandatory to enter into partnerships with local companies. These circumstances could lead on the one hand to Infineon’s intellectual property no longer being sufficiently protected and on the other to intellectual property developed by Infineon in China not being freely transferable to other countries and locations, thus impairing revenue and profitability.
Acquisitions and cooperation arrangements (RC: medium)In order to develop or expand our business, we may seek to acquire other businesses or enter into various forms of cooperation arrangements. In the case of acquisitions, there is a risk that these activities prove to be unsuccessful, particularly regarding the integration of people and products in existing business structures. These issues could adversely impact our financial condition and earnings performance.
P see page 180
P see page 166 ff.
P see page 166 ff.
89Combined Management Report | Our 2019 fiscal year Report on outlook, risk and opportunityRisk and opportunity report
INFINEON TECHNOLOGIES | ANNUAL REPORT 2019

In the case of acquisitions or portfolio decisions, there is, at the same time, a risk of non-compliance with antitrust regulations due to lack of knowledge or failure to make the people involved in such transactions adequately aware of the issues. This can result in high levels of cost (e.g. significant time spent by management, assignment of attorneys) and fines. Infineon’s reputation may also suffer under these circumstances.
Tax, fair trade and capital market regulations can all entail additional risks. In order to mitigate these risks, we rely upon the advice of both in-house and external experts and provide suitable training to our employees.
Measures to implement our risk management strategy At a strategic risk level, we endeavor to mitigate the typical risks that arise in the semiconductor sector from economic and demand fluctuations and the risks related to Infineon’s operations, financial condition, liquidity and earnings by closely monitoring changes in early warning indicators as well as by developing specific response strategies appropriate to the current position within the economic cycle. This can be done, for instance, by rigorously adjusting capacities and inventory levels at an early stage, initiating cost-saving measures and making flexible use of external manufacturing capacities, both at frontend and backend facilities.
At an operational level, we have adopted various quality management strategies aimed at avoiding quality risks (such as “Zero Defects” and “Six Sigma”), to prevent or solve problems and to improve our business processes. Our Group-wide quality management system has been certified on a worldwide basis in accordance with ISO 9001 and ISO/TS 16949 for a number of years and also encompasses supplier development. Our processes and initiatives to ensure continuous quality improvement in corporate procedures are aimed at identifying and eliminating the reasons for quality-related problems at an early stage.
A structured project management system is in place to handle development projects, including customer-specific projects. Clear project milestones and verification procedures required to be carried out during a project as well as clearly defined limits of authority help us identify potential project risks at an early stage and counter these risks with specific measures.
We seek to minimize procurement-related risks through appropriate purchasing strategies and techniques, including constant product and cost analysis (“Best Cost Country Sourcing” and “Focus-on-Value”). These programs include cross-functional teams of experts who are responsible for the standardization of purchasing processes with respect to material and technical equipment.
In response to the general increase in threats to data security and the high degree of professionalism meanwhile applied in the area of cybercrime, we have initiated an information security program to further improve protection against hacking attacks and related risks to our IT systems, networks, products, solutions and services. Information security is achieved primarily with the aid of Infineon’s systematically applied and global Information Security Management System (ISMS), the prime objectives of which are to identify and measure all potential IT risks and to ensure that effective processes and tools are in place to minimize and avoid risk. The ISMS covers all areas of Infineon’s business and is certified to the globally recognized ISO/IEC 27001 norm. All relevant risk areas are contin-uously monitored and optimized in conjunction with regular internal and external audits.
We minimize legal risks relating to intellectual property rights and patents by pursuing a well-defined patent strategy, including thorough patent research and selective development and registration of Infineon patents as well as pre-cautionary protective measures in the form of agreements with major competitors. However, no such opportunities exist to safeguard against risks of this nature in the case of companies specializing in exploiting patent rights.
We have established a Group-wide compliance management system with the aim of managing compliance-related risks on a systematic, comprehensive and sustainable basis. Under this system, major preventive procedures are continuously developed, other elements of the system revamped or strengthened, and appropriate responses established for possible or actual incidences of non-compliance with internal or external regulations. The Compliance Officer reports on a quarterly basis to the Chief Financial Officer and bi-annually to the Investment, Finance and Audit Committee of the Supervisory Board.
In certain cases, insurance policies have been taken out to protect against potential claims and liability risks, with the aim of avoiding or at least minimizing any adverse impact on Infineon’s financial condition and liquidity.
90Combined Management Report | Our 2019 fiscal year Report on outlook, risk and opportunityRisk and opportunity report
INFINEON TECHNOLOGIES | ANNUAL REPORT 2019

Risks arising in connection with the planned acquisition of Cypress (RC: medium)Due to the size and significance of the planned acquisition, the main risks that could have a negative impact on Infineon’s current or future business, its financial position, the share price or dividend payments are described separately in the following section.
As Infineon and Cypress are currently still autonomous and independent companies, the risks presented below were identified and assessed as part of a preparatory integration project, based on available information, and not in the context of the enterprise risk management procedures described above. The list of risks does not purport to be exhaustive. Moreover, the order in which they are presented does not imply any attribution of value to the risks concerned.
Prerequisites for the completion of the planned acquisitionAt present, it cannot be ruled out that the planned acquisition may be delayed or not completed at all. The trans-action is still subject to customary closing conditions, including approval by relevant authorities. Necessary official approvals could be refused. There is a risk that stipulated measures cannot be implemented – either at all or on time or on reasonable conditions – potentially leading to reputational damage or financial disadvantages. For example, the acquisition agreement provides for a payment of US$425 million by Infineon in the event that the transaction is not completed (“breakup fee”).
Risks arising from the financing of the planned acquisitionIn connection with the planned acquisition of Cypress, on 3 June 2019 Infineon concluded an agreement with an inter national banking consortium for a syndicated credit facility. It is unsecured and non-subordinated and comprised four tranches as of 30 September 2019:
› bridge financing of €5.1 billion with a term of up to two years and nine months from the date of the loan commitment, and
› three tranches, each amounting to US$1.1 billion, with terms of three, four and five years.
The tranches will be drawn down upon completion of the acquisition. On 7 October 2019, the bridge financing was reduced to approximately €3.9 billion as a result of the issuance of a €1.2 billion hybrid bond.
Infineon’s level of indebtedness will increase significantly as a result of the syndicated credit facility in the event that the acquisition is completed.
Furthermore, in conjunction with the agreement, Infineon was required to pay fees to the financing parties which would be lost without compensation should the acquisition not be successful.
The credit agreement contains certain market standard undertakings, restrictions and representations which may limit Infineon’s operational flexibility.
The bridge financing has a maximum term of up to two years and nine months. The intention is to refinance the bridge financing within that period by means of capital market instruments. Infineon has already refinanced €2.7 billion by placing shares and issuing a hybrid bond. The remainder of the refinancing could become more difficult or temporarily impossible in the event of restricted access to capital markets, e.g. as a result of a general financial market crisis, or/and a sharp decline in Infineon’s creditworthiness, e.g. as a result of a significant downturn in operating performance.
Non-achievement of strategic or operational targets and integration-related risksThe strategic and operational targets we have set with respect to the planned acquisition and integration of Cypress are based on assumptions and estimates that may subsequently prove to be incorrect. The assumptions and estimates we have applied include the financial and operational performance of Cypress, the synergy and innovation potential of the two companies as well as future economic developments and market changes.
In the event of unexpected integration difficulties, weaker-than-expected growth of Cypress-related business or other unforeseen deviations in business development, it cannot be ruled out that we may be forced to recognize an impairment loss on non-current assets and/or goodwill relating to the planned acquisition of Cypress.
91Combined Management Report | Our 2019 fiscal year Report on outlook, risk and opportunityRisk and opportunity report
INFINEON TECHNOLOGIES | ANNUAL REPORT 2019

In particular, the possible loss of key employees could have a negative impact. As the prerequisite for a successful integration and implementation of a joint strategy, we need talented managers and employees from both Infineon and Cypress. If, for instance, we are unable to retain employees due to potential uncertainties regarding jobs, locations or corporate culture, the benefits of integration and the ability to exploit the respective strengths of the two companies may be impaired.
Overall statement by Group Management on risk situationThe overall risk assessment is based on a consolidated view of all significant individual risks. We are not currently aware of individual risks capable of jeopardizing Infineon’s going-concern status.
Opportunities The principal opportunities are described in the following section. The list is not exhaustive and represents only a cross-section of the opportunities available. Our assessment of these opportunities is subject to continuous change, reflecting the fact that our business, our markets and the technologies we deploy are continuously subject to new developments, bringing with them fresh opportunities, causing others to become less relevant or otherwise changing the significance of an opportunity from our perspective. Depending on the potential degree of impact and the estimated probability of occurrence, each of these opportunities is assigned to an “opportunity class” (OC) in the same way that risks are allocated to a risk class. These classifications are shown in parentheses (e.g. “OC: medium”).
The following description of significant opportunities does not take into account the planned acquisition of Cypress. The main potential opportunities arising in connection with the planned acquisition are presented in a section “Opportunities arising in connection with the planned acquisition of Cypress”.
New technologies and materials (OC: medium)We are constantly striving to develop new technologies, products and solutions and to improve on existing ones, both separately and in collaboration with customers. We therefore continually invest in research and development relating to the use of new technologies and materials. Technologies and materials in current use may well lose their predominance in the foreseeable future, such as silicon, which is reaching its physical limits in some applications.
We see numerous opportunities for working with new materials, such as those associated with silicon carbide or gallium nitride, to develop more powerful and/or lower-cost products. These materials could well have a positive influence on our ability to attain our strategic growth and profitability targets.
Strategic approach “Product to System” (OC: medium)With the “Product to System” strategic approach, we seek to identify additional benefits on a system level for our customers from within our broad portfolio of technologies and products. The strategy enables us to exploit further revenue growth potential and thereby achieve our growth and margin targets. This approach also enables us to reduce customers’ development costs and shorten lead times required to bring their products to market.
Support for change in energy policies and consideration of climate change issues (OC: medium)Population growth and increasing industrialization in all parts of the world are resulting in ever-greater global demand for energy. Electric power is becoming the most important energy carrier of the 21st century and renewables are playing a key role in reducing carbon emissions. The long-term objective is to achieve global decarbonization by the end of the century, as resolved at the Climate Change Conference held in Paris (France) in December 2015.
Infineon’s semiconductors enable electric power to be generated from renewable energy sources. They offer efficiency gains at all stages of the energy industry’s value-added chain, whether in generation, transmission, or above all in the use of electrical power. They form the basis for the intelligent and efficient use of electrical power, for instance in industrial applications, power supplies for computers, consumer electronics and vehicles.
92Combined Management Report | Our 2019 fiscal year Report on outlook, risk and opportunityRisk and opportunity report
INFINEON TECHNOLOGIES | ANNUAL REPORT 2019

Digitalization (OC: medium)The trend towards digitalization represents a significant business opportunity for Infineon. This is reflected on one hand in the optimization of internal processes, for example for our interconnected manufacturing capabilities on a global scale. At the same time, our portfolio of sensors, microcontrollers, power semiconductors, security controllers and specific software puts us in an excellent position to exploit growing market potential. Thanks to our “Product to system” strategic approach, we are ideally placed to penetrate and develop the markets involved. Good examples already visible today include automated driving, voice and gesture control of devices and machines, and the advancing development of the Internet of Things & Big Data.
Ability to supply due to available capacities (OC: medium)Our in-house manufacturing capacities, together with those of our external partners, provide us with sufficient flexibility to meet demand requirements. In particular, further expansion of 300-millimeter manufacturing in Dresden (Germany), of the second manufacturing module in Kulim (Malaysia) and the construction of a second, fully automated 300-millimeter factory at the Villach site (Austria) will help meet growing demand for power semiconductors.
The availability of additional capacities, combined with the pro-active strategic and operational planning of internal and external resources, enable us to meet rising demand from both existing and new customers in the event of a market upturn. We benefited from this trend again during the previous fiscal year.
Market access and activities in China (OC: medium)Infineon generates more revenue in China than in any other country. Accordingly, developments and growth opportunities in China are of the utmost importance to the Group and relate to the following markets that we serve:
Vehicle production in China is still expanding, albeit at a slower pace. At the same time, rapid growth in the production of plug-in hybrid and all-electric vehicles has turned China into the world’s largest market for electro-mobility. For this reason, during the 2018 fiscal year Infineon and SAIC Motor (China’s largest car manufacturer) established SIAPM, a joint venture that offers power semiconductor solutions for electric vehicles. Volume production has already commenced. The joint venture strengthens our position in China, whilst also offering additional potential for Infineon’s future global business.
China is the world’s largest market for trains and, with CRRC (an Infineon customer) home to the world’s largest train manufacturer by far. The continued expansion of the domestic rail network and a growing volume of international infrastructure projects both represent growing business opportunities for Infineon.
At the G20 summit held in Hangzhou (China) in September 2016, China ratified the Paris climate agreement, thereby giving its formal commitment to reducing carbon emissions. As a consequence, the importance of expanding renew-able energy sources in China has increased enormously. Our presence in this market, alongside our collaboration with leading companies in the wind and solar power sectors, will create further opportunities for long-term growth.
Our success in positioning Infineon in China as an integral part of Chinese industry (and hence Chinese society) could well open up a multitude of new opportunities and is highly likely to have a positive impact on the growth and profitability of our business.
Further growth in semiconductor content in vehicles (OC: medium)We expect semiconductor content per vehicle to continue growing. The primary driving force behind this trend is the rising demand for electro-mobility, active safety features and driver assistance systems.
We are also convinced that current global carbon emissions targets cannot be achieved without further electrification. The need for increased efforts in this field is relevant not only for electro-mobility (i.e. hybrid, plug-in hybrid and all-electric vehicles), but also for power units in vehicles with combustion engines. IT security within the vehicle is also further gaining in importance. Thanks to our expertise in the field of security controllers, we are extremely well positioned to exploit opportunities in this area.
93Combined Management Report | Our 2019 fiscal year Report on outlook, risk and opportunityRisk and opportunity report
INFINEON TECHNOLOGIES | ANNUAL REPORT 2019

Growth from mobile applications (OC: medium)The continued trend towards mobility is also reflected in the unbroken high demand for smartphones and tablets. We benefit from this development in two ways. Firstly, through the components we supply for mobile devices (silicon-MEMS microphones, TVS diodes, GPS signal amplifiers, CMOS-RF switches), and secondly, through power semiconductors, which form the key components for energy-efficient chargers (high-voltage and low-voltage power transistors, driver ICs and control ICs).
Security applications (OC: medium)The trend towards electronic identity documents is having a positive impact on Digital Security Solutions segment revenue. Paper-based documents are increasingly being replaced by chip-based versions, due to the higher level of security they offer. New markets are also emerging in conjunction with the Internet of Things and the Industrial Internet (“Industry 4.0”). The authentication of devices is playing an increasingly important role in both of these fields, for which Infineon offers the corresponding security chips.
Liquidity position (OC: medium)Our current liquidity position, which we describe in the chapter “Review of liquidity”, enables us to obtain and, if necessary, make use of favorable refinancing conditions. This fact gives Infineon both the financial headroom and the entrepreneurial flexibility it needs to implement its business strategies and initiatives.
Opportunities arising in connection with the planned acquisition of Cypress (OC: medium)Upon successfully integrating the Cypress business, we see in particular the following opportunities:
The products and technologies of Infineon and Cypress complement each other ideally and set the standards in their respective fields. In addition to our current range of power semiconductors, sensors and microcontrollers for automotive and security applications, we will also be able to grow in scope to offer connectivity, multi-purpose industrial microcontrollers and IoT applications, together with the corresponding software, as well as high-perfor-mance discrete memory products.
The resulting broadly-based portfolio will enable Infineon to offer the complete system solutions needed to link the real with the digital world. The key to success is our ability to provide secure connectivity for energy-efficient devices. Advances in functional integration mean that a whole host of relevant applications is currently in an early phase of growth.
We are pushing ahead with our P2S strategy in order to strengthen and expand core business by driving growth in both related and new fields. To cite two examples, firstly, the combination of Infineon’s security expertise with Cypress’s connectivity know-how will accelerate entry into new IoT applications in the industrial segment. Secondly, in the field of automotive semiconductors, the expanded portfolio of microcontrollers and NOR flash memories offers great potential, especially in light of their growing importance for driver assistance systems and new electronic architectures in vehicles.
Quite apart from their product portfolios, the two companies also complement each other in other aspects. We also see an excellent match in terms of geographical focus and sales channels, with Infineon gaining wider market access through Cypress, particularly in Japan, and via distributors. Infineon will also be adding to its R&D presence in Silicon Valley. Due to its product portfolio, the manufacturing strategy of Cypress is focused to a far greater extent on contract manufacturing. The combination of the two companies will help our business diversify, make it more robust and enable us to generate additional cost synergies.
P see page 76 ff.
94Combined Management Report | Our 2019 fiscal year Report on outlook, risk and opportunityRisk and opportunity report
INFINEON TECHNOLOGIES | ANNUAL REPORT 2019

After a boom phase lasting several years, the global economy entered in a phase of significant and sustained slowdown after the turn of the 2018/2019 calendar year due to geopolitical tensions and trade conflicts. In March, Infineon was therefore obliged to reduce its original revenue target for the 2019 fiscal year from about €8.4 billion to €8 billion, plus or minus 2 percent, which was then achieved with revenue of €8.029 billion. This corresponds to year-on-year revenue growth of 6 percent, a performance that outperformed the semiconductor market as a whole. Infineon’s rigorous focus on structural growth drivers in the areas of energy efficiency, mobility, the Internet of Things & Big Data as well as security is paying off. The fact that business has developed robustly in recent years is also underpinned by our margin development. At 16.4 percent, the Segment Result Margin in the 2019 fiscal year was only 0.6 percentage points below our average margin target throughout the cycle. Free cash flow from continuing operations totaled €39 million in the 2019 fiscal year. The substantial amounts invested in property, plant and equipment and intangible assets as well as the acquisition of Siltectra during the fiscal year under report were financed out of net cash provided by operating activities.
The situation for businesses remains strained in light of economic and political uncertainty. Ongoing trade conflicts continue to have a negative impact. Looking at the economic situation in our target markets, it seems unlikely that the situation will improve in the foreseeable future. Moreover, various macroeconomic indicators suggest that the outlook is likely to remain gloomy for the time being. We expect our markets to recover not before the second half of the 2020 fiscal year. Revenue for Infineon without Cypress is expected to increase by 5 percent plus or minus 2 percentage points compared to the previous fiscal year based on an euro/US dollar exchange rate of 1.13. We have already implemented necessary measures during the previous fiscal year and are adapting them on the basis of new market developments. It is our stated goal to operate our business profitably, even during weak phases. We have shown in the past that we can successfully manage our business throughout the various cycles of the semiconductor industry.
We are convinced that Infineon’s structural growth drivers remain intact and will regain momentum as the global economy picks up. Infineon’s growth strategy is based on three pillars: achieving economies of scale in its core business, broadening its scope to include adjacent markets, applications and products as well as engaging in new, long-term growth areas. Our “Product to System” strategic approach provides an excellent basis for the continuing development of our core business. By gaining an extensive understanding of our customers’ requirements, we develop solutions that take all system aspects into consideration and therefore offer customers a competitive advantage. With the planned acquisition of Cypress, we intend to continue pursuing the evolutionary strategy of advancing from being a manufacturer of components to becoming a provider of systems and solutions. With Cypress, we will be able to serve our target markets even more comprehensively and offer system solutions that are necessary to strengthen the link between the real and the digital world. This strategic rationale also has financial consequences. We assume that the transaction will already have a positive effect on the development of the segment result and adjusted earnings per share from the 2021 fiscal year on. First, the anticipated yearly cost synergies of €180 million, which are to be created by the end of the 2022 fiscal year mainly due to economies of scale, will contribute to this. However, more important for the creation of value are the revenue synergies arising from cross-selling as well as the merger of the complementary portfolios into system solutions. We estimate these in the long term to be more than €1.5 billion per year. On closing of the acquisition, we will adjust our target operating model. During the inte-gration process, we will leverage more and more of the synergies and meet our targets: By then, we expect revenue growth through the cycle for the larger, combined company to be slightly above our current target rate of 9 percent. The Segment Result Margin is to increase through the cycle from 17 percent to 19 percent. The investment-to-sales ratio will drop through the cycle from 15 percent to 13 percent because of the lower capital intensity of Cypress.
Overall statement on Infineon’s financial condition
95Combined Management Report | Our 2019 fiscal year Overall statement on Infineon’s financial condition
INFINEON TECHNOLOGIES | ANNUAL REPORT 2019

Infineon attaches great importance to ensuring that its creditworthiness is based on a solid foundation. Our prudent medium- and long-term capital structure targets are derived from the clear objective of maintaining our investment grade rating. These targets will also apply during and after the planned acquisition of Cypress and are taken into account when structuring the related challenging financing arrangements. The planned acquisition of Cypress means that Infineon will exceed its gross debt target (see “Capital structure targets demonstrate our long-term reliability” in the chapter “Group strategy”), but only to an extent compatible with maintaining its investment grade rating. Infineon’s medium-term target after the acquisition is to reduce debt to, or below, the maximum target level in accordance with the capital structure target.
In addition to reporting on Infineon as a whole, in the following section we also provide information on the perfor-mance of Infineon Technologies AG.
Infineon Technologies AG is the parent company of Infineon and performs the Group’s management and corporate functions. It is responsible for key Group-wide functions such as Finance and Accounting, Corporate Compliance, Human Resources, strategic and product-oriented R&D activities and also Corporate and Marketing Communication worldwide. Furthermore, it manages supply chain processes throughout the Group. Infineon Technologies AG also has its own manufacturing facilities, located in Regensburg and Warstein (both in Germany).
Unlike the Consolidated Financial Statements, which are prepared in accordance with International Financial Reporting Standards (“IFRS”), Infineon Technologies AG’s Separate Financial Statements are prepared in accordance with the provisions of the German Commercial Code (“HGB”). The complete Separate Financial Statements are published separately.
Earnings positionStatement of income of Infineon Technologies AG in accordance with the German Commercial Code (condensed)
€ in millions 2019 2018
Revenue 5,483 5,357
Cost of goods sold (3,802) (3,896)
Gross profit 1,681 1,461
Research and development expenses (1,069) (1,003)
Selling expenses (292) (282)
General and administrative expenses (178) (200)
Other income (expense), net (63) 150
Result from investments, net 64 980
Interest result (15) (81)
Other financial result (129) –
Income tax (16) (43)
Income after taxes/net loss (previous year: net income) (17) 982
Transfers to retained earnings according to section 58, paragraph 2, AktG – (491)
Transfers to retained earnings according to section 58 paragraph 2a AktG 355 –
Unappropriated profit at the end of year 338 491
The gross profit margin for the 2019 fiscal year increased by 3.4 percentage points to 30.6 percent year-on-year. Infineon Technologies AG reported a net loss of €17 million for the 2019 fiscal year, whereby earnings were negatively impacted by one-time expenses in connection with the planned acquisition of Cypress as well as by the lower result from investments. After transferring a total of €355 million from revenue reserves, the unappropriated profit amounted to €338 million.
P see page 36 f.
Infineon Technologies AG
96
INFINEON TECHNOLOGIES | ANNUAL REPORT 2019
Combined Management Report | Our 2019 fiscal year Overall statement on Infineon’s financial condition | Infineon Technologies AG
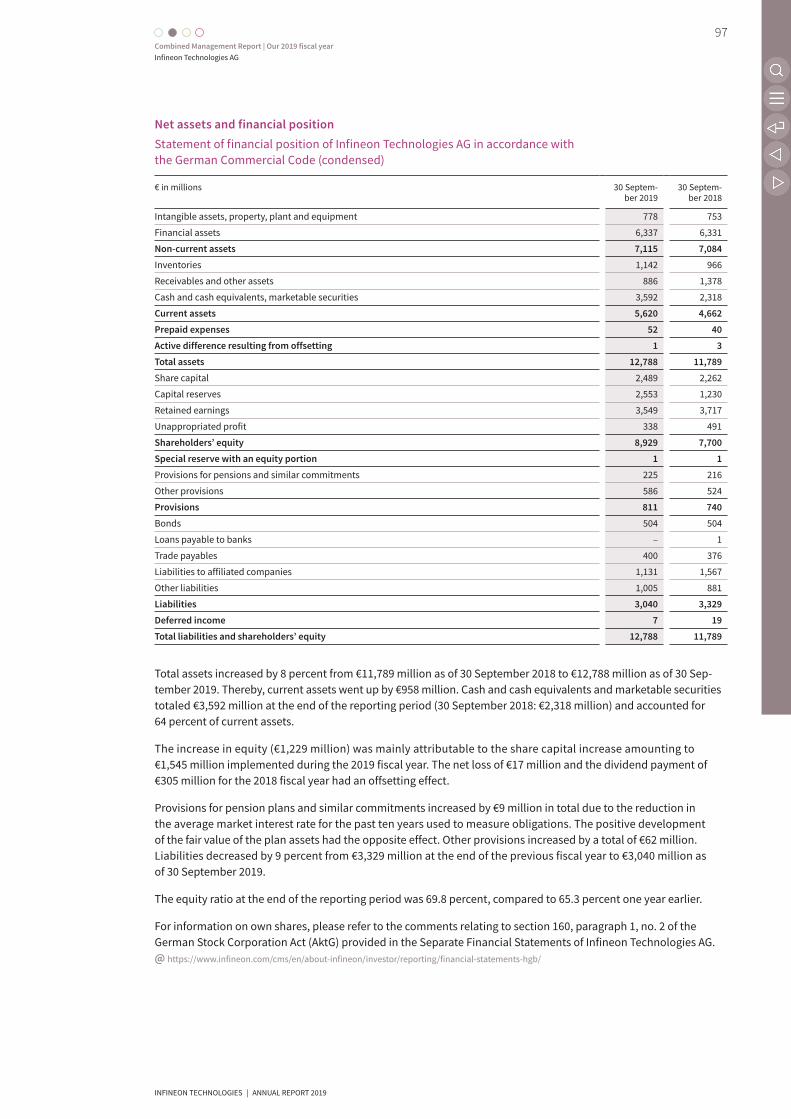
Net assets and financial position Statement of financial position of Infineon Technologies AG in accordance with the German Commercial Code (condensed)
€ in millions 30 Septem-ber 2019
30 Septem-ber 2018
Intangible assets, property, plant and equipment 778 753
Financial assets 6,337 6,331
Non-current assets 7,115 7,084
Inventories 1,142 966
Receivables and other assets 886 1,378
Cash and cash equivalents, marketable securities 3,592 2,318
Current assets 5,620 4,662
Prepaid expenses 52 40
Active difference resulting from offsetting 1 3
Total assets 12,788 11,789
Share capital 2,489 2,262
Capital reserves 2,553 1,230
Retained earnings 3,549 3,717
Unappropriated profit 338 491
Shareholders’ equity 8,929 7,700
Special reserve with an equity portion 1 1
Provisions for pensions and similar commitments 225 216
Other provisions 586 524
Provisions 811 740
Bonds 504 504
Loans payable to banks – 1
Trade payables 400 376
Liabilities to affiliated companies 1,131 1,567
Other liabilities 1,005 881
Liabilities 3,040 3,329
Deferred income 7 19
Total liabilities and shareholders’ equity 12,788 11,789
Total assets increased by 8 percent from €11,789 million as of 30 September 2018 to €12,788 million as of 30 Sep-tember 2019. Thereby, current assets went up by €958 million. Cash and cash equivalents and marketable securities totaled €3,592 million at the end of the reporting period (30 September 2018: €2,318 million) and accounted for 64 percent of current assets.
The increase in equity (€1,229 million) was mainly attributable to the share capital increase amounting to €1,545 million implemented during the 2019 fiscal year. The net loss of €17 million and the dividend payment of €305 million for the 2018 fiscal year had an offsetting effect.
Provisions for pension plans and similar commitments increased by €9 million in total due to the reduction in the average market interest rate for the past ten years used to measure obligations. The positive development of the fair value of the plan assets had the opposite effect. Other provisions increased by a total of €62 million. Liabilities decreased by 9 percent from €3,329 million at the end of the previous fiscal year to €3,040 million as of 30 September 2019.
The equity ratio at the end of the reporting period was 69.8 percent, compared to 65.3 percent one year earlier.
For information on own shares, please refer to the comments relating to section 160, paragraph 1, no. 2 of the German Stock Corporation Act (AktG) provided in the Separate Financial Statements of Infineon Technologies AG. @ https://www.infineon.com/cms/en/about-infineon/investor/reporting/financial-statements-hgb/
97Combined Management Report | Our 2019 fiscal year Infineon Technologies AG
INFINEON TECHNOLOGIES | ANNUAL REPORT 2019
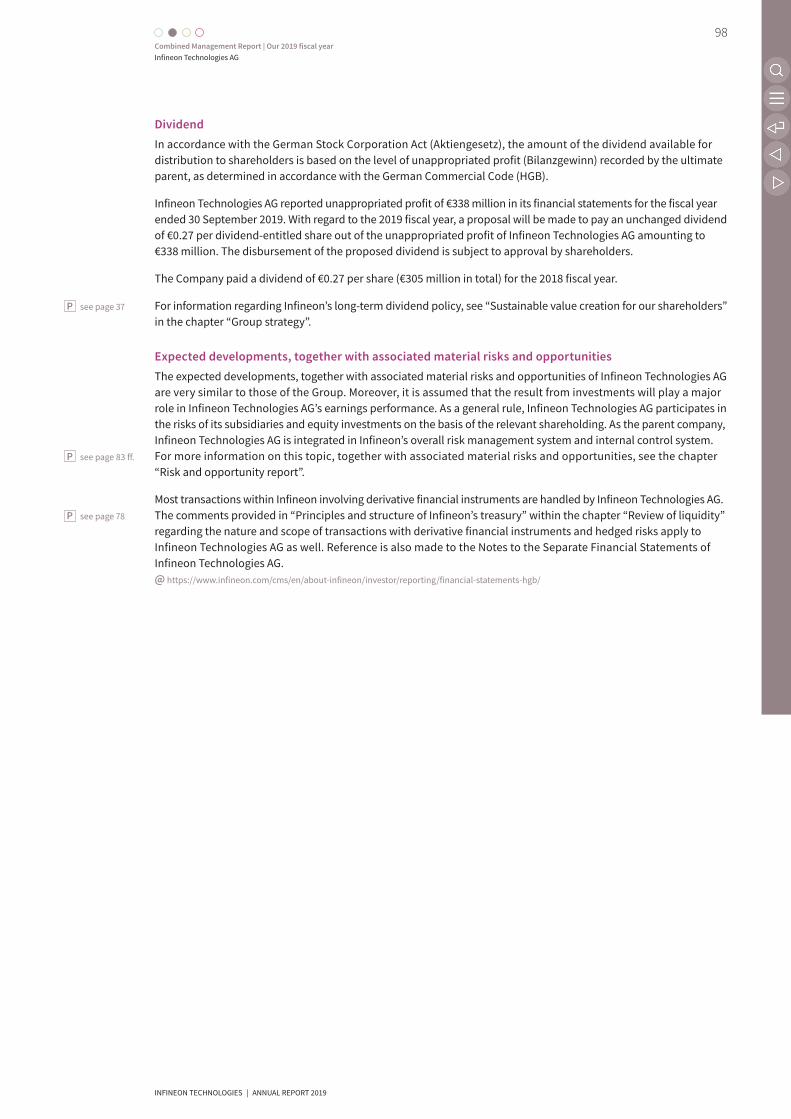
DividendIn accordance with the German Stock Corporation Act (Aktiengesetz), the amount of the dividend available for distribution to shareholders is based on the level of unappropriated profit (Bilanzgewinn) recorded by the ultimate parent, as determined in accordance with the German Commercial Code (HGB).
Infineon Technologies AG reported unappropriated profit of €338 million in its financial statements for the fiscal year ended 30 September 2019. With regard to the 2019 fiscal year, a proposal will be made to pay an unchanged dividend of €0.27 per dividend-entitled share out of the unappropriated profit of Infineon Technologies AG amounting to €338 million. The disbursement of the proposed dividend is subject to approval by shareholders.
The Company paid a dividend of €0.27 per share (€305 million in total) for the 2018 fiscal year.
For information regarding Infineon’s long-term dividend policy, see “Sustainable value creation for our shareholders” in the chapter “Group strategy”.
Expected developments, together with associated material risks and opportunitiesThe expected developments, together with associated material risks and opportunities of Infineon Technologies AG are very similar to those of the Group. Moreover, it is assumed that the result from investments will play a major role in Infineon Technologies AG’s earnings performance. As a general rule, Infineon Technologies AG participates in the risks of its subsidiaries and equity investments on the basis of the relevant shareholding. As the parent company, Infineon Technologies AG is integrated in Infineon’s overall risk management system and internal control system. For more information on this topic, together with associated material risks and opportunities, see the chapter “Risk and opportunity report”.
Most transactions within Infineon involving derivative financial instruments are handled by Infineon Technologies AG. The comments provided in “Principles and structure of Infineon’s treasury” within the chapter “Review of liquidity” regarding the nature and scope of transactions with derivative financial instruments and hedged risks apply to Infineon Technologies AG as well. Reference is also made to the Notes to the Separate Financial Statements of Infineon Technologies AG. @ https://www.infineon.com/cms/en/about-infineon/investor/reporting/financial-statements-hgb/
P see page 37
P see page 83 ff.
P see page 78
98Combined Management Report | Our 2019 fiscal year Infineon Technologies AG
INFINEON TECHNOLOGIES | ANNUAL REPORT 2019

Information pursuant to section 289a, paragraph 1, and section 315a, paragraph 1, of the German Commercial Code (HGB)
Structure of the subscribed capitalThe share capital of Infineon Technologies AG stood at €2,501,368,142 as of 30 September 2019. This sum is divided into 1,250,684,071 non-par registered shares, each of which represents a notional portion of the share capital of €2. Each share carries one vote and gives an equal right to the profit of the Company based on the profit appropriation resolved by shareholders at the Annual General Meeting.
The Company held 6 million of the above-mentioned issued shares as own shares as of 30 September 2019 (30 September 2018: 6 million). Own shares held by the Company on the date of the Annual General Meeting do not carry a vote and are not entitled to participate in profit.
Restrictions on voting rights or the transfer of sharesRestrictions on the voting rights of shares may, in particular, arise as the result of the regulations of the German Stock Corporation Act (Aktiengesetz – “AktG”). For example, pursuant to section 136 AktG shareholders are prohibited from voting under certain circumstances and, according to section 71b AktG, Infineon Technologies AG has no voting rights from its own shares. Furthermore, non-compliance with the notification requirements pursuant to section 33, paragraphs 1 or 2 of the German Securities Trading Act (Wertpapierhandelsgesetz – “WpHG”) and to section 38, paragraph 1 or section 39, paragraph 1, WpHG can, pursuant to section 44 WpHG, have the effect that certain rights (including the right to vote) may, temporarily at least, not exist. We are not aware of any contractual restrictions on voting rights or the transfer of shares.
Pursuant to section 67, paragraph 2, AktG, only those persons recorded in the share register of Infineon Techno-logies AG are recognized as shareholders of the Company. In order to be recorded in the share register of Infineon Technologies AG, shareholders are required to submit to the Company the number of shares held by them and their name or company name, their address and, where applicable, their registered office and their date of birth. Pursuant to section 67, paragraph 4, AktG, Infineon Technologies AG is entitled to request information from the party listed in the share register regarding the extent to which shares, to which the entry in the share register relates, are actually owned by the registered party and, if it does not own the shares, to receive the information necessary for the maintenance of the share register in relation to the party for whom the shares are held. Section 67, paragraph 2, AktG stipulates that the shares concerned do not confer voting rights until such time as the information requested has been supplied in the appropriate manner.
Direct or indirect shareholdings exceeding 10 percent of the voting rightsSection 33, paragraph 1, WpHG requires each shareholder whose voting rights reach, exceed or, after exceeding, fall below 3, 5, 10, 15, 20, 25, 30, 50 or 75 percent of the voting rights of a listed corporation to notify such corporation and the German Federal Financial Supervisory Authority (Bundesanstalt für Finanzdienstleistungsaufsicht – “BaFin”) immediately. As of 30 September 2019, we have not been notified of any direct or indirect shareholdings reaching or exceeding 10 percent of the voting rights. The shareholdings notified to us as of 30 September 2019 are presented in the Notes to the Separate Financial Statements of Infineon Technologies AG under the information pursuant to section 160, paragraph 1, No. 8 AktG.
Shares with special rights which confer control rightsNo shares conferring special control rights have been issued.
Corporate Governance
99Combined Management Report | Our 2019 fiscal year Corporate GovernanceInformation pursuant to section 289a, paragraph 1, and section 315a, paragraph 1, of the German Commercial Code (HGB)
INFINEON TECHNOLOGIES | ANNUAL REPORT 2019

Nature of control over voting rights when employees participate in the Company’s capital and do not exercise their control rights directlyEmployees who participate in the capital of Infineon Technologies AG exercise their control rights directly in accordance with the applicable laws and the Articles of Association, just like other shareholders.
Statutory regulations and Articles of Association provisions governing the appointment and dismissal of members of the Board of Management and amendments to the Articles of AssociationSection 5, paragraph 1, of the Articles of Association stipulates that the Management Board of Infineon Technologies AG shall consist of at least two members. The Management Board currently comprises four members. Members of the Management Board are appointed and dismissed by the Supervisory Board in accordance with section 84, paragraph 1, AktG. As Infineon Technologies AG falls within the scope of the German Co-Determination Act (Mitbestimmungs-gesetz – “MitbestG”), the appointment or dismissal of members of the Management Board requires a two-thirds majority of the votes of the members of the Supervisory Board (section 31, paragraph 2, MitbestG). If such majority is not achieved at the first ballot, the appointment may be approved on a recommendation of the Mediation Com-mittee at a second ballot by a simple majority of the votes of the members of the Supervisory Board (section 31, paragraph 3, MitbestG). If the required majority is still not achieved, a third ballot is held in which the Chairman of the Supervisory Board has two votes (section 31, paragraph 4, MitbestG). If the Management Board does not have the required number of members, in urgent cases, the local court (Amtsgericht of Munich) makes the necessary appointment upon petition of a party concerned pursuant to section 85, paragraph 1, AktG.
Pursuant to section 84, paragraph 1, sentence 1, AktG, the maximum term of appointment for members of the Management Board is five years. Re-appointment or extension of the term of office, in each case for a maximum of five years, is permitted (section 84, paragraph 1, sentence 2, AktG). Section 5, paragraph 1, of the Articles of Asso-ciation and section 84, paragraph 2, AktG stipulate that the Supervisory Board may appoint a chairman and a deputy chairman to the Management Board. The Supervisory Board may revoke the appointment of a member of the Management Board and the Chairman of the Management Board for good cause (section 84, paragraph 3, AktG).
Pursuant to section 179, paragraph 1, AktG, responsibility for amending the Articles of Association rests with the Annual General Meeting. However, section 10, paragraph 4, of the Articles of Association gives the Supervisory Board the authority to amend the Articles of Association insofar as such amendments relate merely to the wording, such as changes in the share capital amount resulting from a capital increase out of conditional or authorized capital or a capital decrease by means of cancellation of own shares. Unless the Articles of Association provide for another majority, section 179, paragraph 2, AktG stipulates that resolutions of the Annual General Meeting regarding the amendment of the Articles of Association require a majority of at least three quarters of the share capital repre-sented. Section 17, paragraph 1, of the Articles of Association of Infineon Technologies AG provides in principle for resolutions to be passed with a simple majority of the votes cast and, when a capital majority is required, with a simple majority of the capital unless a higher majority is required by law or in accordance with other stipulations contained in the Articles of Association.
Powers of the Management Board, in particular with respect to the issuing or buying back of sharesThe powers of the Management Board to issue shares derive from section 4 of the Articles of Association, in con-junction with applicable legal provisions. Further information relating to the Company’s existing Authorized and Conditional Capital can be found in note 19 to the Consolidated Financial Statements.
Authorization to issue convertible bonds and/or bonds with warrantsThe Annual General Meeting on 22 February 2018 authorized the Management Board, in the period through 21 Feb-ruary 2023, either once or in partial amounts, to issue convertible bonds and/or bonds with warrants (referred to collectively as “bonds”) in an aggregate nominal amount of up to €4,000,000,000, to guarantee such bonds issued by subordinated Group companies of the Company and to grant bondholders conversion or option rights to up to 130,000,000 no-par-value registered Company shares, representing a notional portion of the share capital of up to €260,000,000, in accordance with the relevant terms of the bonds. The Management Board is authorized, with the approval of the Supervisory Board, to exclude the right of shareholders to subscribe to the bonds,
› if the issue price is not substantially lower than the bonds’ theoretical market value as determined in accordance with accepted valuation methods, in particular those based on financial mathematics; however, this right of exclusion only applies insofar as the shares to be issued to service the conversion or option rights established
P see page 161 f.
100Combined Management Report | Our 2019 fiscal year Corporate GovernanceInformation pursuant to section 289a, paragraph 1, and section 315a, paragraph 1, of the German Commercial Code (HGB)
INFINEON TECHNOLOGIES | ANNUAL REPORT 2019

on this basis in aggregate do not exceed 10 percent of the share capital either at the time of this authorization becoming effective or at the time of its exercise (as a result of the share capital increase executed on 17/18 June 2019, an exclusion of subscription rights of this kind is currently not possible);
› in order to exclude fractional amounts resulting from a given subscription ratio from the subscription rights of the shareholders to the bonds or insofar as such action is necessary in order to grant holders of conversion or option rights arising from bonds that have already been or will in future be issued by the Company or its subordinated Group companies subscription rights to that extent to which they would be entitled after exercise of their rights or after fulfillment of any conversion or option obligations;
› insofar as bonds are issued in return for a capital contribution in kind, provided that the value of such capital contribution in kind is appropriate in relation to the market value of the bonds.
Even if the dilution protection regulations are applied, the conversion or option price must equal at least 80 percent of the arithmetic mean of the closing prices of the Company’s share in XETRA trading on the Frankfurt Stock Exchange (or comparable successor system); further details – including the conditions under which the conversion or option price may be reduced – are set out in the authorization.
The Management Board is authorized, subject to the requirements resolved by the shareholders at the Annual General Meeting, to determine the further details of the bond issue, including terms and conditions.
Authorization to acquire own sharesA resolution passed by the Annual General Meeting on 22 February 2018 authorizes Infineon Technologies AG, in the period through 21 February 2023, to acquire its own shares, within the statutory boundaries, in an aggregate amount not exceeding 10 percent of the share capital at the time the resolution was passed or – if the latter amount is lower – of the share capital in existence at the time the authorization is exercised. The Company may not use the authorization for the purposes of trading in its own shares. The Management Board decides whether own shares are acquired through the stock exchange, by means of a public offer to purchase addressed to all shareholders or a public invitation to submit offers for sale or via a bank or other entity that meets the requirements of section 186, paragraph 5 sentence 1, AktG. The authorization includes differentiating requirements – in particular with regard to the permissible purchase price – for each method of acquisition.
Infineon shares acquired or being acquired on the basis of this or an earlier authorization may – if not sold either via the stock exchange or by means of a public offer to purchase addressed to all shareholders – be used for all legally admissible purposes. The shares may also be cancelled or offered to third parties in conjunction with business combinations or the acquisition of companies, parts of companies or participations in companies. Under specified circumstances subject to the consent of the Supervisory Board, the shares may also be sold to third parties in return for cash payment (including by means other than through the stock exchange or through an offer to all shareholders), used to meet the Company’s obligations under convertible bonds and bonds with warrants and stock option plans, offered for sale or granted as a remuneration component to members of representative bodies and employees within the Group, and/or used to repay securities-backed loans. The subscription right of shareholders is excluded in all of the above cases (except when the shares are cancelled). In addition, the subscription rights of shareholders are excluded in respect of fractional amounts in instances in which the shares are sold through a public offer addressed to all shareholders.
According to a resolution passed by the Annual General Meeting on 22 February 2018, the acquisition of Infineon Technologies AG shares may also be effected using equity derivatives. The total number of shares that can be acquired using derivatives may not exceed 5 percent of the Company’s share capital, determined either at the time of this authorization becoming effective or at the time of its exercise through the use of the derivatives. The shares acquired through the exercise of this authorization are to be counted toward the acquisition threshold for the shares acquired in accordance with the authorization to acquire own shares as described above. The authorization stipu-lates other restrictions when derivatives are deployed, including their execution, term, servicing and acquisition price.
If own shares are acquired using derivatives in accordance with the requirements stipulated in the authorization, any right of the shareholders to conclude such derivative transactions with the Company will be excluded in analogous application of section 186, paragraph 3, sentence 4, AktG. The shareholders have no right to conclude derivative transactions with the Company.
Shareholders have a right to sell their Infineon shares in this connection only insofar as the Company is required to accept the shares under the derivative transactions. No other right to sell shares will apply in this connection.
101Combined Management Report | Our 2019 fiscal year Corporate GovernanceInformation pursuant to section 289a, paragraph 1, and section 315a, paragraph 1, of the German Commercial Code (HGB)
INFINEON TECHNOLOGIES | ANNUAL REPORT 2019

The use of own shares, acquired through derivatives, is governed by the same rules as applicable for the direct acquisition of own shares.
Significant agreements that are subject to the condition of a change of control as a result of a takeover bid and compensation agreements with members of the Management Board or with employees in the event of a takeover bidVarious financing agreements with lending banks and capital market creditors (see note 15 to the Consolidated Financial Statements) contain defined change-of-control clauses which give creditors the right to call for early repayment. These clauses reflect standard market practice. In addition, one financing agreement stipulates that in the event of a change of control, Infineon Technologies AG may be required to provide collateral in the form of cash rather than as a guarantee.
Furthermore, certain patent cross-licensing agreements, development agreements, subsidy agreements and approvals, supply contracts, joint venture agreements and license agreements contain customary change-of-control clauses, according to which a change in control of Infineon Technologies AG triggers the right of the other party at its sole discretion to terminate the agreement or to continue the agreement as well as other rights which may, under certain circumstances, be unfavorable for Infineon.
If a member of the Management Board leaves his or her position in connection with a defined change of control (namely, where a party holds at least 50 percent of the voting rights in Infineon Technologies AG) that member is currently entitled to continued payment of the relevant annual remuneration for the entire remaining contract term. In accordance with a special contract termination right granted to members of the Management Board, the period of continued payment is capped at a maximum of 36 months in the event that the member resigns, or at a minimum of 24 months and a maximum of 36 months in the event of dismissal/termination of contract by Infineon Technologies AG. Further details are contained in the Compensation report.
The change-of-control clauses agreed with the members of the Management Board correspond to the recommen-dation made in section 4.2.3, paragraph 5, of the German Corporate Governance Code. Such clauses are intended to give members of the Management Board financial security in the event of a change of control, with a view to preserving their independence in this situation.
The conditions of both the Performance Share Plan (open to participation by members of the Management Board, managers and other selected employees of the worldwide company) and the Restricted Stock Unit Plan (additionally applicable to specified employees of Infineon in the USA) contain rules that are triggered in the event of a defined change of control (namely holding at least 30 percent of the voting rights of Infineon Technologies AG). For the most part, these rules specify that the vesting periods that are envisaged by the relevant plans are aborted in the event of a change of control. The corresponding rule in the Performance Share Plan does not, however, apply to members of the Management Board, given that the service contracts take precedence.
Statement on Corporate Governance pursuant to sections 289f, 315d of the German Commercial Code (HGB)/Corporate Governance Report
The Statement on Corporate Governance pursuant to sections 289f and section 315d of the German Commercial Code (HGB) including the Corporate Governance Report has been made publicly accessible. @ www.infineon.com/declaration-on-corporate-governance
P see page 154 f.
P see page 103 ff.
102
INFINEON TECHNOLOGIES | ANNUAL REPORT 2019
Combined Management Report | Our 2019 fiscal year Corporate GovernanceInformation pursuant to section 289a, paragraph 1, and section 315a, paragraph 1, of the German Commercial Code (HGB) | Statement on Corporate Governance pursuant to sections 289f, 315d of the German Commercial Code (HGB)/Corporate Governance Report

Compensation reportThis Compensation report, which forms part of the Combined Management Report, explains the principles applied in determining compensation for the Management Board and Supervisory Board of Infineon Technologies AG and the level of remuneration paid to the individual members of the Management Board and Supervisory Board in accordance with applicable legal requirements and the recommendations of the German Corporate Governance Code in the version dated 7 February 2017 (Deutscher Corporate Governance Kodex – “DCGK”). Infineon believes that transparent and understandable reporting of Management Board and Supervisory Board compensation represents a fundamental element of good corporate governance.
Management Board compensationCompensation systemThe Management Board compensation system – similar to the compensation paid to the individual members of the Management Board – is defined and regularly reviewed by the full Supervisory Board on the basis of proposals made by the Executive Committee. In accordance with applicable legal requirements and the recommendations of the DCGK, the compensation paid to members of the Management Board is intended to reflect the typical level and structure of management board compensation at peer companies, as well as Infineon’s economic position and future prospects. The duties, responsibilities and performance of each member of the Management Board are also to be considered, as is Infineon’s wider pay structure. This includes considering Management Board compensation in relation to that of senior management and of the workforce as a whole, including changes in the level of com-pensation over time. The stated objective is that the compensation structure should be designed in such a way that it promotes sustainable business development, with a cap in place in the event of exceptional developments. Infineon aims to set compensation at a level that is competitive both nationally and internationally, so as to inspire and reward dedication and success in a dynamic environment.
In the 2018 fiscal year, the Supervisory Board engaged an independent external remuneration expert to perform the regular review of the Management Board compensation system. The review was completed during the 2019 fiscal year, with the expert reaching the conclusion that the Company’s compensation system complies with the requirements of the German Stock Corporation Act (Aktiengesetz) and the DCGK and is in line with current market conditions (for details see “Review of the Management Board compensation system, compensation components and individual contracts” in this chapter).
Components of the Management Board compensation systemThere have been no changes to the Management Board compensation system in the 2019 fiscal year compared to the previous fiscal year.
All members of the Management Board receive as compensation for their service an annual income which – based on target achievement of 100 percent – comprises approximately 45 percent fixed compensation and approximately 55 percent variable compensation components:
› Fixed compensation: The fixed compensation comprises a contractually agreed basic annual salary that is not linked to performance and is paid in twelve equal monthly installments.
› Variable (performance-related) compensation: The variable compensation comprises three components – an annual bonus (short-term incentive), a multiple-year bonus (mid-term incentive) and a long-term variable compensation component (long-term incentive).
The short-term incentive (“STI”) is intended to reward performance over the preceding fiscal year, reflecting Infineon’s recent progress. Assuming a 100 percent target achievement for each of the variable compensation components, the STI constitutes approximately 20 percent of target annual income. It is set by the Supervisory Board in a two-phase process:
(i) At the beginning of each fiscal year, the target functions with respect to the two key performance indicators “free cash flow” and “Return on Capital Employed (RoCE)” are defined uniformly for all members of the Management Board. Underpinning the consistent approach taken to managing the business, the same target indicators – supplemented by the Segment Result – are used as the basis for determining the variable com-pensation components (bonus payments) for Infineon managers and employees. The two key performance indicators referred to above, which are described in more detail in the chapter “Internal management system”, are equally weighted for the purposes of measuring the STI.
P see page 114
P see page 62 ff.
103Combined Management Report | Our 2019 fiscal year Corporate GovernanceCompensation report
INFINEON TECHNOLOGIES | ANNUAL REPORT 2019

(ii) At the end of the fiscal year, the actual levels of target achievement and hence, the amount of the STI payouts, are determined by the Supervisory Board by reference to the levels of target achievement for free cash flow and RoCE as reported in the audited financial statements.
An STI is paid only if the levels of target achievement reach at least the 50 percent threshold for both performance indicators (free cash flow, RoCE). If one of the two target thresholds is not achieved, no annual bonus is paid for the relevant fiscal year. If the thresholds are achieved, the arithmetic mean of the two target achievements is calculated and used as the percentage rate to determine the actual STI amount. A cap of 250 percent applies, meaning that the maximum amount that can be paid is two-and-a-half times the target STI (= 100 percent), regardless of an actual higher achievement level. The Supervisory Board may, in addition, increase or reduce the amount to be paid in each case by up to 50 percent, as it sees fit, based on the performance of the Management Board as a whole, Infineon’s position, and any exceptional factors. A lower limit applies in this case such that the amount to be paid cannot be less than the amount that would be due given 50 percent target achievement. The upper limit for an upward adjustment is the cap of 250 percent.
If the term of office on the Board begins or ends during a fiscal year, the entitlement to STI is reduced on a pro rata monthly basis (by one-twelfth for each full month missing from the complete STI tranche). A member of the Management Board is not entitled to receive an STI bonus for the fiscal year in which he/she resigns from office (unless the resignation is for a reason (“good cause”), for which the member is not responsible) or if the contract of the member of the Board is terminated by the Company for good cause.
The mid-term incentive (“MTI”) is intended to reward sustained performance by the Management Board reflecting Infineon’s medium-term progress. In combination with the long-term incentive, the MTI therefore ensures compliance with the stock corporation law requirement that the structure of compensation is “oriented toward sustainable growth of the enterprise”. Assuming a 100 percent target achievement of the variable components, the MTI constitutes approximately 20 percent of target annual income.
A new MTI tranche, each with a term of three years, commences every fiscal year. The incentive is paid in cash at the end of the three-year term. The amount of the payment is determined on the basis of actual RoCE and free cash flow figures during each three-year period. For these purposes, the target values for RoCE and free cash flow for each individual year of an MTI tranche correspond to the STI targets set each year in advance. The level of achievement for both the RoCE target and the free cash flow target must reach a threshold of 50 percent in each year of the relevant three-year period, otherwise it is deemed – for MTI purposes – to be zero for the year concerned. If the thresholds are exceeded, the level of target achievement determined for the STI applies for the relevant annual tranche of the MTI. The MTI to be paid at the end of the three-year period is determined by calculating the arith-metic mean of the three annual target achievement levels. Unlike the STI, the MTI is paid as calculated, even if the mean level of target achievement for the three-year period is below 50 percent. A cap of 200 percent applies, meaning that the maximum amount that can be paid is two times the target MTI (= 100 percent), regardless of the actual achievement level.
The Supervisory Board may increase or reduce the amount to be paid under the MTI in each case by up to 50 percent, as it sees fit, based on the performance of the Management Board as a whole, Infineon’s situation and any excep-tional factors. When exercising its judgment in this respect, the Supervisory Board also takes into account the extent to which the three-year target for revenue growth and Segment Result (set each year by the Supervisory Board exclusively for this purpose) has been achieved and the degree of success achieved complementing organic growth through M&A activities. Unlike the STI, there is no lower limit for the amount by which the Supervisory Board can adjust the MTI; for the upper limit, however, the cap applies (200 percent).
If the term of office commences during a fiscal year, the MTI tranche is reduced on a pro rata monthly basis (by 1/36 for each full month missing from the complete MTI tranche). Upon leaving Infineon, regulations ensure as a general rule that the member of the Management Board can only receive an MTI payment for the number of MTI tranches corresponding to his/her term of office, reduced where appropriate on a pro rata basis. MTI tranches already started are forfeited if a mandate or service contract of a member of the Management Board comes to an end before the due date, for instance if a member resigns from office (unless the resignation is for good cause, for which the member is not responsible) or if the contract of the member of the Board is terminated by the Company for good cause.
104Combined Management Report | Our 2019 fiscal year Corporate GovernanceCompensation report
INFINEON TECHNOLOGIES | ANNUAL REPORT 2019

The long-term incentive (“LTI”) is intended to reward long-term and, similar to the MTI, sustained performance on the part of members of the Management Board and, additionally, to ensure that their interests are aligned with the interest of the Company’s shareholders regarding a positive share price development. Assuming a 100 percent target achievement of the variable compensation components, the LTI constitutes approximately 15 percent of target annual income.
With effect from the 2014 fiscal year, the LTI is awarded in the form of a Performance Share Plan. As well as being relevant for members of the Management Board, the LTI also applies to Infineon managers and selected Infineon employees worldwide, in their case however on a voluntary basis and with minor differences attributable to specific circumstances.
The (virtual) performance shares are allocated as of 1 March for the fiscal year commenced on 1 October, initially on a provisional basis. The final allocation and transfer of (real) Infineon shares takes place four years later.
Performance shares are allocated provisionally on the basis of the contractually agreed “LTI allocation amount” in euros, agreed upon individually in the contract of each member of the Management Board. The number of perfor-mance shares is determined by dividing the LTI allocation amount by the average price of the Infineon share (Xetra closing price) during the nine months prior to the allocation date. The prerequisites for the definitive allocation of the – at that stage still virtual – performance shares are (i) that the member of the Management Board invests 25 percent of his/her individual LTI allocation amount in Infineon shares and (ii) that the holding period of four years applicable both for the member’s own-investment and for the performance shares has come to an end. 50 percent of the performance shares are also performance-related; they are only allocated definitively if (iii) the Infineon share outperforms the Philadelphia Semiconductor Index (SOX) between the date of the performance shares’ provisional allocation and the end of the holding period. If the conditions for the definitive allocation of performance shares – either of all or of only those that are not performance-related – are met at the end of the holding period, the member of the Management Board acquires a claim against the Company for the transfer of the corresponding number of (real) Infineon shares. Performance shares which do not achieve the target are forfeited. The value of the perfor-mance shares definitively granted to the member of the Management Board per LTI tranche at the end of the holding period may not exceed 250 percent of the relevant LTI allocation amount; the performance shares above this amount lapse (cap).
Members of the Management Board can freely dispose of the shares transferred to them. The same also applies to Infineon shares acquired in conjunction with the own-investment requirement at the end of the holding period.
The Supervisory Board has the right, at the end of the holding period, to make a value-equivalent cash settlement to the member of the Management Board rather than actually transfer Infineon shares.
The LTI is reduced proportionately if the length of service of a member of the Board in the year in which the LTI is allocated is shorter than the fiscal year to which the LTI award relates. This situation usually arises when a member of the Board does not begin his duties exactly at the beginning of a fiscal year or does not leave office exactly at the end of a fiscal year. The allocation amount is reduced in each case by one twelfth for each full month missing for the fiscal year in which the LTI is allocated.
The allocation amount is also reduced proportionately in the case of a so-called “good leaver”, i.e. a member of the Board leaving office without any fault on his/her part, for instance in the event of reaching the stipulated age limit. The group of “good leavers” also includes cases in which a member of the Board fulfills his/her contract properly up to the end of the agreed term and leaves the Company only because the contract has not been extended. By contrast, if a member of the Board resigns from office (unless the resignation is for good cause for which the member is not responsible) or if a contract of a member of the Board is terminated by the Company for good cause (a so-called “bad leaver”), all performance shares not yet definitely allocated are forfeited when the member of the Board leaves office.
The Supervisory Board is required to define suitable alternative LTI instruments of commensurate value if it is impossible or not desired by the Supervisory Board to offer an LTI on the basis of the Performance Share Plan.
Prior to the introduction of the Performance Share Plan, the Company maintained a stock option plan as an LTI, which was resolved at the 2010 Annual General Meeting. The stock options allocated to members of the Management Board on the basis of the “Stock Option Plan 2010” were all exercised during the 2017 fiscal year.
105Combined Management Report | Our 2019 fiscal year Corporate GovernanceCompensation report
INFINEON TECHNOLOGIES | ANNUAL REPORT 2019

Additionally, the Supervisory Board has the option – based in all cases on its own best judgment – to grant a special bonus, among other things for special achievements of the Management Board or its individual members. In each case, however, the bonus is capped at a maximum of 30 percent of the fixed compensation of the member of the Management Board concerned.
Management Board compensation in the 2019 fiscal year in accordance with German Accounting Standard 17 (DRS 17)Total compensationTotal compensation to members of the Management Board pursuant to DRS 17 and benefits to the individual members of the Management Board – also presented in accordance with DRS 17 – are shown in the following table:
in €
Dr. Reinhard Ploss Chief Executive Officer
Dr. Sven Schneider Chief Financial Officer
since 1 May 2019
Dominik Asam Chief Financial Officer
until 31 March 2019
2019 2018 2019 2018 2019 2018
Fixed compensation Basic annual salary 1,240,000 1,240,000 343,750 – 412,500 825,000
Fringe benefits 39,492 36,461 23,876 – 23,056 44,940
Total fixed compensation 1,279,492 1,276,461 367,626 – 435,556 869,940 Variable compensation Single-year variable compensation (STI) 491,700 630,850 139,688 – – 430,125
Multi-year variable compensation Mid Term Incentive (MTI) 1 2016 – 2018 tranche – 183,520 – – – 129,993
2017 – 2019 tranche 143,040 183,520 – – – 129,993
2018 – 2020 tranche 163,900 210,283 – – – 143,375
2019 – 2021 tranche 163,900 – 46,563 – – –
Long Term Incentive (LTI) Performance Share Plan 2 289,287 298,168 – – – 191,662
Total variable compensation 1,251,827 1,506,341 186,251 – – 1,025,148Total compensation 2,531,319 2,782,802 553,877 – 435,556 1,895,088
in €
Dr. Helmut Gassel Member of the
Management Board
Jochen Hanebeck Member of the
Management Board
Total Management Board
2019 2018 2019 2018 2019 2018
Fixed compensation Basic annual salary 750,000 750,000 750,000 750,000 3,496,250 3,565,000
Fringe benefits 69,756 65,596 35,143 33,500 191,323 180,497
Total fixed compensation 819,756 815,596 785,143 783,500 3,687,573 3,745,497 Variable compensation Single-year variable compensation (STI) 303,960 389,980 303,960 389,980 1,239,308 1,840,935
Multi-year variable compensation Mid Term Incentive (MTI) 1 2016 – 2018 tranche – 117,759 – 117,759 – 549,031
2017 – 2019 tranche 91,784 117,759 91,784 117,759 326,608 549,031
2018 – 2020 tranche 101,320 129,993 101,320 129,993 366,540 613,644
2019 – 2021 tranche 101,320 – 101,320 – 413,103 –
Long Term Incentive (LTI) Performance Share Plan 2 165,315 170,373 165,315 170,373 619,917 830,576
Total variable compensation 763,699 925,864 763,699 925,864 2,965,476 4,383,217Total compensation 1,583,455 1,741,460 1,548,842 1,709,364 6,653,049 8,128,714
1 The values include the annual MTI tranche granted in the respective fiscal year based on the fulfilment of the plan requirements.2 The figures for the active members of the Management Board in the 2019 fiscal year were based on a fair market value per performance share amounting
to €13.79 (2018: €15.25), which was calculated using a Monte-Carlo simulation model taking account of the value-reducing cap. In accordance with his service contract, Dr. Schneider is entitled to the LTI tranche for the 2019 fiscal year on pro rata basis, namely for the months May to September 2019. In view of the fact the annual allocation for the 2019 fiscal year had already taken place before the start of Dr. Schneider’s term of office, performance shares for the 2019 fiscal year will be allocated together and in accordance with the conditions of the allocation for the 2020 fiscal year.
106Combined Management Report | Our 2019 fiscal year Corporate GovernanceCompensation report
INFINEON TECHNOLOGIES | ANNUAL REPORT 2019
Mr. Dominik Asam resigned from the Management Board of Infineon Technologies AG in agreement with the Super-visory Board effective 31 March 2019 and left the Company. In accordance with his service contract, Mr. Asam’s entitle-ment to receive the STI for the 2019 fiscal year and the MTI and LTI for uncompleted tranches forfeited. As a result, previously recognized provisions amounting to €901,613.67 were released. A post-employment non-competition clause was agreed with Mr. Asam for a period of 18 months. In return, Mr. Asam will receive a one-time compensation amount of €150,000, payable on 31 December 2019.
Members of the Management Board did not receive any loans from Infineon either in the 2019 or 2018 fiscal year.
Similarly, they did not receive any benefits from third parties in the 2019 and 2018 fiscal year, whether promised or actually paid, for their board activities at Infineon.
Fringe benefitsIn accordance with their service contracts, members of the Management Board are entitled to a chauffeur-driven company car, which may also be used for private purposes. Operating and maintenance costs for the company car and chauffeur are borne by the Company. Taxes arising on the fringe benefit related to private usage are borne by the members of the Management Board.
The Company also maintains accident insurance policies for members of the Board in the case of death (€3 million) and invalidity (€5 million).
Other fringe benefits relate mainly to statutory obligations such as the payment of inventor’s compensation or to general benefits/discounts available to all Infineon employees.
Share-based remunerationAs described in the section “Management Board compensation”, the contractually agreed LTI is granted to members of the Management Board by the Company in the form of “performance shares”. The average price of the Infineon share relevant for the number of performance shares granted for the 2019 fiscal year was €20.02 (2018: €21.48).
A fair market value of €13.79 (2018: €15.25) per performance share granted in the 2019 fiscal year was determined, taking account of the cap of 250 percent cap set on the LTI allocation amount as well as the performance hurdle.
P see page 105
107Combined Management Report | Our 2019 fiscal year Corporate GovernanceCompensation report
INFINEON TECHNOLOGIES | ANNUAL REPORT 2019

The following table shows the number of performance shares awarded to members of the Management Board in the 2019 fiscal year:
Performance Share Plan
Virtual performance
shares outstanding
at the begin-ning of the fiscal year
Virtual performance shares newly
granted at the begin-
ning of the fiscal year
Fair value grant date
Virtual performance
shares exercised
in thefiscal year 1
Virtual performance shares expi-
red in thefiscal year 2
Virtual performance
shares outstanding
at the end of the
fiscal year
Total expense for
share-based compen-
sation
Member of the Management Board Fiscal year Number Number in € Number Number Number in €
Dr. Reinhard Ploss (Chief Executive Officer)
2019 125,160 20,978 289,287 42,990 – 103,148 188,878
2018 153,190 19,552 298,168 35,967 11,615 125,160 198,986
Dr. Sven Schneider 3 (Chief Financial Officer from 1 May 2019)
2019 – – – – – – –
2018 – – – – – – –
Dominik Asam (Chief Financial Officer until 31 March 2019)
2019 83,454 – – 28,856 54,598 – –
2018 104,118 12,568 191,662 25,119 8,113 83,454 134,669
Dr. Helmut Gassel (Member of the Management Board)
2019 28,082 11,988 165,315 – – 40,070 107,929
2018 16,910 11,172 170,373 – – 28,082 95,379
Jochen Hanebeck (Member of the Management Board)
2019 28,082 11,988 165,315 – – 40,070 107,929
2018 16,910 11,172 170,373 – – 28,082 95,379
Total
2019 264,778 44,954 619,917 71,846 54,598 183,288 404,736
2018 291,128 54,464 830,576 61,086 19,728 264,778 524,413
1 The share price of the virtual performance shares exercised in the 2019 fiscal year amounts to €19.99.2 The expiration of the virtual performance shares results from the cap. The finally allocated performance shares may not exceed 250 percent of the respective LTI allocation amount.
With regard to the remuneration of Mr. Asam after the end of his Management Board activity, see “Management Board compensation in the 2019 fiscal year in accordance with German Accounting Standard 17 (DRS 17)” in this chapter.
3 In accordance with his service contract, Dr. Schneider was entitled to the LTI tranche for the 2019 fiscal year on pro rata basis, namely for the months May to September 2019. In view of the fact the annual allocation for the 2019 fiscal year had already taken place before the start of Dr. Schneider’s term of office, performance shares for the 2019 fiscal year will be allocated together and in accordance with the conditions of the allocation for the 2020 fiscal year.
Further details regarding the LTI tranche which vested on 1 October 2019 and the performance shares awarded to the members of the Management Board on 1 March 2019 for the 2019 fiscal year are provided in note 21 to the Consolidated Financial Statements.
Special bonusesThe Supervisory Board did not award any special bonuses to members of the Management Board during the 2019 fiscal year.
Other awards and benefits In the 2009 fiscal year, the Company entered into a restitution agreement with each of the active members of the Management Board at that time. Dr. Ploss is the only current member of the Management Board affected by the agreement. These agreements stipulate that the Company covers all costs and expenses of any legal, governmental, regulatory and/or parliamentary proceedings and investigations as well as arbitration proceedings, in which the member of the Management Board is involved in conjunction with his/her activities on behalf of the Company. However, the agreements specifically exclude any restitution of costs in conjunction with section 93, paragraph 2, German Stock Corporation (Aktiengesetz).
P see page 164 f.
108Combined Management Report | Our 2019 fiscal year Corporate GovernanceCompensation report
INFINEON TECHNOLOGIES | ANNUAL REPORT 2019

Management Board compensation in the 2019 fiscal year in accordance with the German Corporate Governance CodeThe DCGK recommends that the individual compensation components for each member of the Management Board be disclosed in accordance with specified criteria. It also recommends that disclosure is based on the model tables – in part diverging from DRS 17 – provided in the appendix to the Code.
Compensation granted in accordance with DCGKThe following table shows the value of compensation granted for the 2018 and 2019 fiscal year, including fringe benefits, as well as the minimum and maximum values that can be achieved for the 2019 fiscal year.
Unlike in the disclosures in accordance with DRS 17, the STI is required to be disclosed pursuant to the DCGK at the target value (i.e. the value in the event of 100 percent target achievement). The MTI is required to be disclosed – in a deviation from DRS 17 – at the target value for an “average probability scenario” at the grant date. For these purposes, Infineon assumes 100 percent target achievement on a scale ranging from 0 to 200 percent. In addition, the pension expense, i.e. the service cost pursuant to IAS 19 (see “Commitments to members of the Management Board upon termination of their Board activities” in this chapter) is also required to be included in the amount of total compensation disclosed in accordance with the DCGK.
Compensation granted to members of the Management Board in accordance with the DCGK (total compensation and compensation components) as well as the minimum and maximum values that can be achieved are shown in the following table:
in € Dr. Reinhard Ploss Chief Executive Officer
Dr. Sven Schneider1 Chief Financial Officer since 1 May 2019
2019 2018 2019 (min.) 2019 (max.) 2019 2018 2019 (min.) 2019 (max.)
Fixed compensation
Basic annual salary 1,240,000 1,240,000 1,240,000 1,240,000 343,750 – 343,750 343,750
Fringe benefits 39,492 36,461 39,492 39,492 23,876 – 23,876 23,876
Total fixed compensation 1,279,492 1,276,461 1,279,492 1,279,492 367,626 – 367,626 367,626
Variable compensation
Single-year variable compensation (STI) 550,000 550,000 – 1,375,000 156,250 – – 390,625
Multi-year variable compensation
Mid Term Incentive (MTI)
2018 – 2020 tranche – 550,000 – – – – – –
2019 – 2021 tranche 550,000 – – 1,100,000 156,250 – – 312,500
Long Term Incentive (LTI)
Performance Share Plan 2 289,287 298,168 144,643 1,050,000 – – – –
Total variable compensation 1,389,287 1,398,168 144,643 3,525,000 312,500 – – 703,125
Pension expense 356,108 318,442 356,108 356,108 114,134 – 114,134 114,134
Total compensation (DCGK) 3,024,887 2,993,071 1,780,243 5,160,600 794,260 – 481,760 1,184,885
1 In accordance with his service contract, Dr. Schneider was entitled to the LTI tranche for the 2019 fiscal year on pro rata basis, namely for the months May to September 2019. In view of the fact the annual allocation for the 2019 fiscal year had already taken place before the start of Dr. Schneider’s term of office, performance shares for the 2019 fiscal year will be allocated together and in accordance with the conditions of the allocation for the 2020 fiscal year.
2 The figures of the active members of the Management Board in the 2019 fiscal year were based on a fair market value per performance share amounting to €13.79 (2018: €15.25), which was calculated using a Monte-Carlo simulation taking into account the value-decreasing Cap.
P see page 112 ff.
109Combined Management Report | Our 2019 fiscal year Corporate GovernanceCompensation report
INFINEON TECHNOLOGIES | ANNUAL REPORT 2019

in € Dominik Asam Chief Financial Officer until 31 March 2019
Dr. Helmut Gassel Member of the Management Board
2019 2018 2019 (min.) 2019 (max.) 2019 2018 2019 (min.) 2019 (max.)
Fixed compensation
Basic annual salary 412,500 825,000 412,500 412,500 750,000 750,000 750,000 750,000
Fringe benefits 23,056 44,940 23,056 23,056 69,756 65,596 69,756 69,756
Total fixed compensation 435,556 869,940 435,556 435,556 819,756 815,596 819,756 819,756
Variable compensation
Single-year variable compensation (STI) – 375,000 – – 340,000 340,000 – 850,000
Multi-year variable compensation
Mid Term Incentive (MTI)
2018 – 2020 tranche – 375,000 – – – 340,000 – –
2019 – 2021 tranche – – – – 340,000 – – 680,000
Long Term Incentive (LTI)
Performance Share Plan 1 – 191,662 – – 165,315 170,373 82,657 600,000
Total variable compensation – 941,662 – – 845,315 850,373 82,657 2,130,000
Pension expense 144,593 279,374 144,593 144,593 98,324 124,723 98,324 98,324
Total compensation (DCGK) 580,149 2,090,976 580,149 580,149 1,763,395 1,790,692 1,000,737 3,048,080
in € Jochen Hanebeck Member of the Management Board
2019 2018 2019 (min.) 2019 (max.)
Fixed compensation
Basic annual salary 750,000 750,000 750,000 750,000
Fringe benefits 35,143 33,500 35,143 35,143
Total fixed compensation 785,143 783,500 785,143 785,143
Variable compensation
Single-year variable compensation (STI) 340,000 340,000 – 850,000
Multi-year variable compensation
Mid Term Incentive (MTI)
2018 – 2020 tranche – 340,000 – –
2019 – 2021 tranche 340,000 – – 680,000
Long Term Incentive (LTI)
Performance Share Plan 1 165,315 170,373 82,657 600,000
Total variable compensation 845,315 850,373 82,657 2,130,000
Pension expense 114,234 148,449 114,234 114,234
Total compensation (DCGK) 1,744,692 1,782,322 982,034 3,029,377
1 The figures of the active members of the Management Board in the 2019 fiscal year were based on a fair market value per performance share amounting to €13.79 (2018: €15.25), which was calculated using a Monte-Carlo simulation taking into account the value-decreasing Cap.
With regard to compensation paid to Mr. Asam after termination of his Board activities, see “Management Board compensation in the 2019 fiscal year in accordance with DRS 17” in this chapter.
P see page 107
110Combined Management Report | Our 2019 fiscal year Corporate GovernanceCompensation report
INFINEON TECHNOLOGIES | ANNUAL REPORT 2019

Allocation amount in accordance with DCGK Since compensation granted to members of the Management Board for the 2019 fiscal year did not coincide fully with amounts disbursed in a particular fiscal year, a separate table is presented – in accordance with the relevant DCGK recommendation – showing the amounts flowing to members of the Management Board for the 2019 fiscal year (the “allocation amount” (“Zufluss”)).
In line with the DCGK recommendations, the fixed compensation and the STI are required to be disclosed as the allocation amount for the relevant fiscal year concerned. In the case of the MTI, the DCGK recommends that this is disclosed as flowing to members of the Management Board in the fiscal year in which the plan term of the relevant MTI tranche ends. In addition to the fixed compensation and the STI granted for the 2019 fiscal year, the allocation amount for the 2017-2019 MTI tranche therefore flowed to the members of the Management Board in the 2019 fiscal year. In accordance with the DCGK, share-based payments are deemed to be allocated on the basis of the relevant time and value for German tax law purposes. The performance shares awarded on 1 October 2015 which were definitively awarded to the members of the Management Board after the end of the 2019 fiscal year and transferred in the form of real Infineon shares (see “Components of the Management Board compensation system” in this chapter) will not be disclosed as having flowed until the 2020 fiscal year. In line with the DCGK recommendations, the pension expense (meaning the service cost pursuant to IAS 19) constitutes the allocation amount (see previous table), even though it is not – strictly speaking – an allocation.
The total compensation allocated to the individual members of the Management Board for the 2019 fiscal year in accordance with DCGK – analyzed by component – is shown in the following table:
in €
Dr. Reinhard Ploss Chief Executive Officer
Dr. Sven Schneider Chief Financial Officer
since 1 May 2019
Dominik Asam Chief Financial Officer
until 31 March 2019
2019 2018 2019 2018 2019 2018
Fixed compensation
Basic annual salary 1,240,000 1,240,000 343,750 – 412,500 825,000
Fringe benefits 39,492 36,461 23,876 – 23,056 44,940
Total fixed compensation 1,279,492 1,276,461 367,626 – 435,556 869,940
Variable compensation
Single-year variable compensation (STI) 491,700 630,850 139,688 – – 430,125
Multi-year variable compensation
Mid Term Incentive (MTI)
2016 – 2018 tranche – 584,640 – – – 414,120
2017 – 2019 tranche 569,760 – – – – –
Long Term Incentive (LTI)
Performance Share Plan – – – – – –
due in the 2018 fiscal year1 787,500 – 550,000
due in the 2019 fiscal year 859,370 – 576,831
Total variable compensation 1,920,830 2,002,990 139,688 – 576,831 1,394,245
Pension expense 356,108 318,442 114,134 144,593 279,374
Total compensation (DCGK) 3,556,430 3,597,893 621,448 – 1,156,980 2,543,559
1 Represented 250 percent of the LTI allocated amount (cap) at the time of granting the virtual performance shares in the 2013 fiscal year.
P see page 105
111Combined Management Report | Our 2019 fiscal year Corporate GovernanceCompensation report
INFINEON TECHNOLOGIES | ANNUAL REPORT 2019

in €
Dr. Helmut Gassel Member of the
Management Board
Jochen Hanebeck Member of the
Management Board
2019 2018 2019 2018
Fixed compensation
Basic annual salary 750,000 750,000 750,000 750,000
Fringe benefits 69,756 65,596 35,143 33,500
Total fixed compensation 819,756 815,596 785,143 783,500
Variable compensation
Single-year variable compensation (STI) 303,960 389,980 303,960 389,980
Multi-year variable compensation
Mid Term Incentive (MTI)
2016 – 2018 tranche – 281,358 – 281,358
2017 – 2019 tranche 365,596 – 365,596 –
Long Term Incentive (LTI)
Performance Share Plan – – – –
due in the 2018 fiscal year1
due in the 2019 fiscal year – – – –
Total variable compensation 669,556 671,338 669,556 671,338
Pension expense 98,324 124,723 114,234 148,449
Total compensation (DCGK) 1,587,636 1,611,657 1,568,933 1,603,287
1 Represented 250 percent of the LTI allocated amount (cap) at the time of granting the virtual performance shares in the 2013 fiscal year.
With regard to compensation paid to Mr. Asam after termination of his Board activities, see “Management Board compensation in the 2019 fiscal year in accordance with DRS 17” in this chapter.
Commitments to members of the Management Board upon termination of their Board activitiesBenefits and pension entitlements in the 2019 fiscal yearIn accordance with the Management Board compensation system in place since 2010, the members of the Manage-ment Board have, in the meantime, all received a defined contribution pension commitment, which is essentially identical to the Infineon pension plan applicable to all employees. The Company has accordingly set up a personal pension account (basic account) for each beneficiary and makes annual pension contributions to it. The Company adds annual interest to the balance in the basic account using the highest statutory interest rates valid for the insurance industry (guaranteed interest rates) until disbursement of the pension begins and may also award surplus credits. Ninety-five percent of any income earned over and above the guaranteed interest rate is credited to the pension account, either at the date on which disbursement of the pension begins or, at the latest, when the bene-ficiary reaches the age of 60. The balance of the basic account when disbursement of the pension begins (due to age, invalidity or death) – increased by an adjusting amount in the event of invalidity or death – constitutes the retirement benefit entitlement and is paid out to the member of the Management Board or his or her surviving dependents in twelve annual installments, or, if so requested by the member of the Management Board, in eight annual installments, as a lump sum or as a life-long pension. In addition to the defined contribution pension plan that has been in place for Dr. Ploss since 1 January 2016, a fully vested fixed-amount pension entitlement of €210,000 p.a. also exists for his Board activities up to 31 December 2015 which will not increase in future.
If the entitlements of members of the Management Board (i) have not yet legally vested or (ii) have legally vested, but are not protected by the state pension insurance scheme (Pensionssicherungsverein), the Company maintains pension reinsurance policies in favor of, and pledged to, the members of the Management Board concerned.
The plan rules applicable to members of the Management Board differ in terms of the initial defined component, the annual transfer to the pension account and the vesting period.
› On joining the Management Board, the Company made a one-time, contractually vested initial pension contribution of €540,000 on behalf of Mr. Asam for the loss of vested retirement pension entitlements in connection with the termination agreement with his previous employer. In addition, Mr. Asam received, for each fiscal year of his membership on the Management Board, a pension contribution from the Company amounting to between 25 and 40 percent, as determined by the Supervisory Board, of the relevant agreed basic annual salary. The pension contribution for Mr. Asam for the 2019 fiscal year was set – as in the previous year – at 30 percent of his basic
P see page 107
112Combined Management Report | Our 2019 fiscal year Corporate GovernanceCompensation report
INFINEON TECHNOLOGIES | ANNUAL REPORT 2019

annual salary and reduced on a pro rata basis to take account of the termination of his mandate on 31 March 2019. The pension contribution for the 2019 fiscal year therefore amounted to €123,750. The pension entitlements arising from the defined contributions made on behalf of Mr. Asam vested with effect from 31 December 2013.
› Dr. Gassel and Mr. Hanebeck have statutorily vested pension entitlements as a result of their previous periods of employment in senior management positions with Infineon. Their service contracts specifically state that the amounts made available to cover their vested pension entitlements represent a continuation of those vested entitlements and are, therefore, not subject to any separate vesting arrangements. The Company makes a fixed annual pension contribution on behalf of Dr. Gassel and Mr. Hanebeck for each full fiscal year of service on the Board, equivalent to 30 percent of the relevant agreed basic annual salary. The Supervisory Board is not required to decide each time on the amount to be contributed. The pension contributions for the 2019 fiscal year for Dr. Gassel and Mr. Hanebeck amounted in each case to €225,000.
› The defined contribution pension commitment in place for Dr. Ploss is also based on a fixed contribution amount of 30 percent of the relevant agreed basic annual salary. The pension contribution made by the Company for the 2019 fiscal year amounted to €372,000.
› The corresponding contribution for Dr. Schneider also amounts to 30 percent of the relevant agreed basic annual salary. As he was appointed to the Management Board with effect from 1 May 2019, Dr. Schneider received a pro forma pension contribution for the 2019 fiscal year amounting to €103,125.
The amounts credited to the pension entitlement accounts of the members of the Management Board – in line with the plan rules applied to Infineon employees – are paid out on or after reaching the age of 67, provided the service contract arrangements have also ended. Upon request, amounts can be paid out at an earlier point in time if the service contract arrangements end on or after reaching the age of 60, or, in the case of commitments made from 2012 onwards, on or after reaching the age of 62. If the beneficiaries elect that their pension be paid out in monthly installments, the pension amount is adjusted automatically each year in accordance with the Infineon pension plan.
Alongside the annual retirement entitlements and related benefit amounts, the following table shows the present values of pension entitlements earned to date and the service cost in accordance with IFRS. The present value of pension and benefit entitlements is particularly dependent on changes in the discount rate required to be applied (30 September 2019: 0.6 percent, 30 September 2018: 1.7 percent).
Pension entitlements
in € Member of the Management Board
Fiscal year
Pension entitlements
(annual) as of beginning of
pension period
Benefit amounts determined
for the relevant fiscal year
Present value of pension
and benefit entitlement
Original service cost
(earned in the current year)
Dr. Reinhard Ploss 1 (Chief Executive Officer)
2019 – 372,000 1,393,462 356,108
210,000 – 5,596,191 –
2018 – 372,000 977,189 318,442
210,000 – 5,046,826 –
Dr. Sven Schneider 2 (Chief Financial Officer since 1 May 2019)
2019 – 103,125 125,547 114,134
2018 – – – –
Dominik Asam 3 (Chief Financial Officer until 31 March 2019)
2019 – 123,750 3,475,131 144,593
2018 – 247,500 2,787,031 279,374
Dr. Helmut Gassel (Member of the Management Board)
2019 – 225,000 2,575,231 98,324
2018 – 225,000 2,241,660 124,723
Jochen Hanebeck (Member of the Management Board)
2019 – 225,000 3,219,373 114,234
2018 – 225,000 2,702,051 148,449
Total
2019 210,000 1,048,875 16,384,935 827,393
2018 210,000 1,069,500 13,754,757 870,988
1 The upper line for Dr. Ploss in the 2019 fiscal year respectively 2018 shows the contribution amount, the present value and the service cost relating to the defined contribution pension commitment additionally granted to him with effect from 1 January 2016. The second line in the 2019 fiscal year respectively 2018 shows the pension entitlement and the present value of his fixed amount pension plan. Income of €583,940 was recognized in 2019 fiscal year for past service, reflecting the fact that the financing period was retrospectively extended by the reappointment of Dr. Ploss through 31 December 2022.
2 The service cost recognized for Dr. Schneider takes into account of the fact that he was appointed to the Management Board with effect from 1 May 2019 and therefore only received a pro rata annual contribution for the 2019 fiscal year.
3 The service cost for Mr. Asam for the 2019 fiscal year was recognized on a pro rata basis in line with the termination of his activities on the Infineon’s Management Board with effect from 31 March 2019.
113Combined Management Report | Our 2019 fiscal year Corporate GovernanceCompensation report
INFINEON TECHNOLOGIES | ANNUAL REPORT 2019

Early termination of service contractsThe service contracts of members of the Management Board include a change-of-control clause, which stipulates the terms that apply when the activities of a member of the Management Board are terminated in the event of a significant change in Infineon’s ownership structure. A change of control for the purposes of this clause occurs when a third party, individually or together with another party, acquires at least 50 percent of the voting rights in Infineon Technologies AG as defined in section 30 of the German Securities Acquisition and Takeover Act (Wert-papiererwerbs- und Übernahmegesetz – “WpÜG”). Members of the Management Board have the right to resign and terminate their service contracts within twelve months of the announcement of such a change of control and any who choose to do so are entitled to continued payment of their annual remuneration through to the end of the originally agreed duration of their contract, up to a maximum of 36 months. If Infineon Technologies AG removes a member of the Management Board or terminates his or her contract within twelve months of the announcement of a change of control, the members of the Management Board concerned are entitled to continued payment of their annual remuneration through to the end of the originally agreed duration of their contract, subject to a mini-mum period of 24 months and a maximum period of 36 months.
The Management Board service contracts otherwise contain no promises of severance pay for situations in which contracts are terminated early.
A post-employment non-competition clause was agreed with Mr. Asam for a period of 18 months. As compensation, Mr. Asam will receive a one-time compensation amount of €150,000, payable on 31 December 2019.
Payments to former members of the Management Board in the 2019 fiscal yearTotal compensation (primarily pension benefits) of €2,007,096.87 (2018: €1,527,437.89) was paid to former members of the Management Board (without Mr. Asam) in the 2019 fiscal year. As of 30 September 2019, accrued pension liabilities for former members of the Management Board amounted to €81,187,076 (2018: €68,838,837).
Review of the Management Board compensation system, compensation components and individual contractsRegular review of appropriatenessIn accordance with section 4.2.2 DCGK, the Supervisory Board engaged an external, independent compensation expert to review the Management Board compensation system in place since 1 October 2010 and conclude on its compliance with applicable legislation and its overall appropriateness from an objective perspective. In this context, the target annual incomes of each individual member of the Management Board were subjected to detailed scrutiny. The expert’s report concluded that the Company’s compensation system complies with legal requirements and with the recommendations contained in the German Corporate Governance Code (DCGK). In particular, the expert concluded that the compensation of Infineon’s Management Board is commensurate with market conditions and that the variable compensation component is oriented towards the sustainable growth of the enterprise. The indi-vidual target annual incomes of the members of the Management Board are appropriate, both horizontally (i.e. looking at peer companies) and vertically (i.e. looking at Infineon’s various employee groupings). The results of the compensation expert’s review were discussed in detail during the Executive Committee meeting held on 25 October 2018 and by the full Supervisory Board on 20 November 2018. The Supervisory Board concurred with the conclusions reached by the external expert.
Future regulatory changesManagement Board compensation and related reporting requirements are currently the subject of various regulatory projects. For instance, the draft law – currently undergoing parliamentary scrutiny – relating to the implementation of the second Shareholder Rights Directive (ARUG II) is expected to come into force beginning of the 2020 calendar year. In addition, the Government Commission on the German Corporate Governance Code has adopted a new version of the DCGK, which is to take effect at the same time as ARUG II comes into force. The Supervisory Board has been observing these developments very closely over a lengthy period and is already preparing in detail for the expected changes. However, in the opinion of the Supervisory Board, a definitive analysis, above all of the need for action with regard to the existing Management Board compensation system, can only be performed once the new regulatory framework has been established, i.e. ARUG II has entered into force and the revised DCGK taken effect. The Supervisory Board therefore intends to make any necessary revisions to the Management Board remuneration system in the course of the 2020 calendar year and to present a revised/new Management Board compensation system to shareholders at the 2021 Annual General Meeting.
114Combined Management Report | Our 2019 fiscal year Corporate GovernanceCompensation report
INFINEON TECHNOLOGIES | ANNUAL REPORT 2019

Supervisory Board compensation Compensation structureThe compensation due to the Supervisory Board (total compensation) is governed by section 11 of the Company’s Articles of Association and comprises the following:
› A fixed compensation (basic remuneration) of €90,000. This amount applies to each member of the Supervisory Board and is payable within one month of the close of the fiscal year.
› Allowances recognizing the additional work involved in performing certain functions within the Supervisory Board: The Chairman of the Supervisory Board receives an allowance of €90,000, each Vice-chairman receives an allow-ance of €30,000, the Chairman of the Investment, Finance and Audit Committee and the Chairman of the Strategy and Technology Committee each receive an allowance of €25,000 and each member of a Supervisory Board com-mittee receives an allowance of €15,000 – with the exception of the Nomination Committee and the Mediation Committee. The additional allowance is payable only if the body to which the Supervisory Board or committee member belongs has convened or passed resolutions in the fiscal year concerned. A member of the Supervisory Board performing more than one of the functions indicated receives only the highest single additional allowance payable to a member performing the functions concerned. The allowance is paid to the relevant holder of office within one month of the end of the fiscal year.
› A meeting attendance fee of €2,000 per meeting of the Supervisory Board or one of its committees that is attended in person. The meeting attendance fee is paid only once if more than one meeting of the relevant committees takes place on a given day.
In the event that a member, during a fiscal year, joins (or leaves) the Supervisory Board or one of its committees, or takes on a Supervisory Board function for which an allowance is paid, the relevant compensation components are disbursed on a pro rata basis, i.e. payment of one twelfth of the relevant annual compensation component for each (started) month of membership or exercise of function.
Members of the Supervisory Board, moreover, are reimbursed for all expenses incurred in connection with the performance of their Supervisory Board duties and for any value-added tax payable by them in this connection. The Company also pays any value-added tax incurred on their total remuneration (including meeting attendance fees) for the members of the Supervisory Board.
115Combined Management Report | Our 2019 fiscal year Corporate GovernanceCompensation report
INFINEON TECHNOLOGIES | ANNUAL REPORT 2019

Compensation of the Supervisory Board for the 2019 fiscal yearThe total compensation (including meeting attendance fees) paid to the individual members of the Supervisory Board in the 2019 fiscal year comprises the following (these figures do not include value-added tax at 19 percent):
Supervisory Board compensation
in € Member of the Supervisory Board
Fiscal year
Fixed compen-
sation
Allowance for specific
functions
Meeting attendance
fees
Total compen-
sation
Peter Bauer 2019 90,000 25,000 24,000 139,000
2018 90,000 25,000 20,000 135,000
Johann Dechant 2019 90,000 30,000 32,000 152,000
2018 90,000 30,000 28,000 148,000
Dr. Herbert Diess 2019 90,000 – 10,000 100,000
2018 90,000 – 12,000 102,000
Dr. Wolfgang Eder 1 2019 90,000 27,500 38,000 155,500
2018 60,000 10,000 14,000 84,000
Annette Engelfried 2019 90,000 15,000 30,000 135,000
2018 90,000 15,000 18,000 123,000
Peter Gruber 2019 90,000 15,000 24,000 129,000
2018 90,000 15,000 20,000 125,000
Gerhard Hobbach 2019 90,000 15,000 22,000 127,000
2018 90,000 15,000 20,000 125,000
Hans-Ulrich Holdenried 2019 90,000 15,000 24,000 129,000
2018 90,000 15,000 22,000 127,000
Prof. Dr. Renate Köcher 2019 90,000 – 14,000 104,000
2018 90,000 – 12,000 102,000
Dr. Susanne Lachenmann 2019 90,000 15,000 22,000 127,000
2018 90,000 15,000 18,000 123,000
Wolfgang Mayrhuber 2 2019 – – – –
2018 37,500 37,500 18,000 93,000
Géraldine Picaud 2019 90,000 – 16,000 106,000
2018 90,000 – 20,000 110,000
Dr. Manfred Puffer 2019 90,000 – 22,000 112,000
2018 90,000 – 14,000 104,000
Jürgen Scholz 2019 90,000 15,000 26,000 131,000
2018 90,000 15,000 20,000 125,000
Kerstin Schulzendorf 2019 90,000 – 18,000 108,000
2018 90,000 – 14,000 104,000
Dr. Eckart Sünner 2019 90,000 84,583 34,000 208,583
2018 90,000 68,333 24,000 182,333
Diana Vitale 2019 90,000 – 22,000 112,000
2018 90,000 – 14,000 104,000
Total 2019 1,440,000 257,083 378,000 2,075,083
2018 1,447,500 260,833 308,000 2,016,333
1 Joined as Member of the Supervisory Board since 22 February 2018. The compensation for 2018 therefore was awarded on a pro rata basis.2 Joined as Member of the Supervisory Board until 22 February 2018. The compensation for 2018 therefore was awarded on a pro rata basis.
Members of the Supervisory Board did not receive any loans from Infineon in either the 2019 or 2018 fiscal year.
Neubiberg, 18 November 2019
Management Board
Dr. Reinhard Ploss Dr. Sven Schneider Dr. Helmut Gassel Jochen Hanebeck
116Combined Management Report | Our 2019 fiscal year Corporate GovernanceCompensation report
INFINEON TECHNOLOGIES | ANNUAL REPORT 2019

Consolidated Financial Statements 118 Consolidated Statement of Operations 119 Consolidated Statement of Comprehensive Income 120 Consolidated Statement of Financial Position
121 Consolidated Statement of Cash Flows
122 Consolidated Statement of Changes in Equity
124 Notes to the Consolidated Financial Statements
Inhalt 117
INFINEON TECHNOLOGIES | ANNUAL REPORT 2019

€ in millions Notes 2019 2018
Revenue 4 8,029 7,599
Cost of goods sold 4 (5,035) (4,714)
Gross profit 2,994 2,885
Research and development expenses 4 (945) (836)
Selling, general and administrative expenses 4 (865) (850)
Other operating income 56 332
Other operating expenses (79) (62)
Operating income 1,161 1,469
Financial income 4 26 15
Financial expenses 4 (98) (68)
Gain (loss) from investments accounted for using the equity method 5 (6) (5)
Income from continuing operations before income taxes 1,083 1,411
Income tax 6 (194) (193)
Income from continuing operations 889 1,218
Loss from discontinued operations, net of income taxes 7 (19) (143)
Net income 870 1,075
Attributable to:
Shareholders of Infineon Technologies AG 870 1,075
Basic earnings per share (in euro) attributable to shareholders of Infineon Technologies AG: 1
Basic earnings per share (in euro) from continuing operations 8 0.77 1.08
Basic earnings per share (in euro) from discontinued operations 8 (0.02) (0.13)
Basic earnings per share (in euro) 8 0.75 0.95
Diluted earnings per share (in euro) attributable to shareholders of Infineon Technologies AG: 1
Diluted earnings per share (in euro) from continuing operations 8 0.77 1.08
Diluted earnings per share (in euro) from discontinued operations 8 (0.02) (0.13)
Diluted earnings per share (in euro) 8 0.75 0.95
1 The calculation of earnings per share is based on unrounded figures.
Consolidated Statement of Operations for the year ended 30 September 2019 and 2018
118Consolidated Financial Statements Consolidated Statement of Operations
INFINEON TECHNOLOGIES | ANNUAL REPORT 2019

Consolidated Statement of Comprehensive Income for the year ended 30 September 2019 and 2018
€ in millions Notes 2019 2018
19
Net income 870 1,075
Actuarial gains (losses) on pension plans and similar commitments 1 (153) (4)
Total items not expected to be reclassified to profit or loss in the future (153) (4)
Currency translation effects 85 27
Net change in fair value of hedging instruments 155 (2)
Cost of hedging (42) –
Total items expected to be reclassified to profit or loss in the future 198 25
Other comprehensive income for the year, net of tax 45 21
Total comprehensive income for the year, net of tax 915 1,096
Attributable to:
Shareholders of Infineon Technologies AG 915 1,096
1 Contains losses from investments accounted for using the equity method in the 2019 fiscal year of €2 million (2018: losses €1 million).
119Consolidated Financial Statements Consolidated Statement of Comprehensive Income
INFINEON TECHNOLOGIES | ANNUAL REPORT 2019

€ in millions Notes 30 Septem-ber 2019
30 Septem-ber 20181
ASSETS
Cash and cash equivalents 1,021 732
Financial investments 9 2,758 1,811
Trade receivables 10 888 971
Inventories 11 1,701 1,480
Income tax receivable 6 83 52
Contract assets 12 91 –
Other current assets 13 770 366
Assets classified as held for sale 7 12 11
Total current assets 7,324 5,423
Property, plant and equipment 14 3,510 3,038
Goodwill and other intangible assets 14 1,805 1,596
Investments accounted for using the equity method 5 29 37
Deferred tax assets 6 599 648
Other non-current assets 145 137
Total non-current assets 6,088 5,456
Total assets 13,412 10,879
LIABILITIES AND EQUITY
Short-term debt and current maturities of long-term debt 15 22 25
Trade payables 1,089 1,181
Short-term provisions 16 383 590
Income tax payable 6 144 117
Other current liabilities 17 406 269
Total current liabilities 2,044 2,182
Long-term debt 15 1,534 1,507
Pension plans and similar commitments 18 733 552
Deferred tax liabilities 6 20 9
Long-term provisions 16 283 46
Other non-current liabilities 165 137
Total non-current liabilities 2,735 2,251
Total liabilities 4,779 4,433
Shareholders’ equity: 19
Ordinary share capital 2,501 2,274
Additional paid-in capital 5,494 4,486
Retained earnings (accumulated deficit) 421 (333)
Other reserves 254 56
Own shares at cost (37) (37)
Total equity 8,633 6,446
Total liabilities and equity 13,412 10,879
1 No prior period adjustments are required as a result of the new valuation and accounting methods arising from our chosen transition approach in accordance with IFRS 9 and IFRS 15.
Consolidated Statement of Financial Position as of 30 September 2019 and 2018
120Consolidated Financial Statements Consolidated Statement of Financial Position
INFINEON TECHNOLOGIES | ANNUAL REPORT 2019

€ in millions Notes 2019 2018
25 Net income 870 1,075Plus: loss from discontinued operations, net of income taxes 19 143Adjustments to reconcile net income to net cash provided by operating activities: Depreciation and amortization 14 945 861 Income tax 6 194 193 Net interest result 4 36 45 Gains on disposals of property, plant and equipment (11) (1) Loss (gain) from sale of RF power business 1 (270) Dividends received from joint ventures 5 – 8 Impairment charges 14, 28 6 7 Other non-cash result 16 7 Change in trade receivables 10 71 (116) Change in inventories 11 (239) (251) Change in trade payables (109) 158 Change in provisions 16 (25) (1) Change in other assets and liabilities (4) (25) Interest received 25 14 Interest paid (67) (50)
Income tax paid 6 (125) (226)Net cash provided by operating activities from continuing operations 1,603 1,571Net cash provided by (used in) operating activities from discontinued operations (2) 4Net cash provided by operating activities 1,601 1,575Purchases of financial investments 9 (3,760) (3,277)Proceeds from sales of financial investments 9 2,836 3,067Purchases of other equity investments – (1)Acquisitions of businesses, net of cash acquired (123) (16)Proceeds from sales of businesses and interests in subsidiaries, net of cash disbursed – 324Investments in related companies (5) (17)Purchases of intangible assets and other assets 14 (156) (164)Purchases of property, plant and equipment 14 (1,295) (1,090)Proceeds from sales of property, plant and equipment and other assets 15 11Net cash used in investing activities from continuing operations (2,488) (1,163)Net cash used in investing activities from discontinued operations – –Net cash used in investing activities (2,488) (1,163)Net change in short-term debt 15 – –Net change in related party financial receivables and payables 24 (14) (18)Proceeds from issuance of long-term debt 15 1 –Repayments of long-term debt 15 (23) (321)Payments for financing-related derivatives 4 (41) –Deposits for financing-related derivatives 4 19 –Change in cash deposited as collateral – 74Proceeds from issuance of ordinary shares 19 1,530 6Dividend payments 19 (305) (283)Net cash provided by (used in) in financing activities from continuing operations 1,167 (542)Net cash used in financing activities from discontinued operations – –Net cash provided by (used in) in financing activities 1,167 (542)Net change in cash and cash equivalents 280 (130)Effect of foreign exchange rate changes on cash and cash equivalents 9 2Cash and cash equivalents at beginning of period 732 860Cash and cash equivalents at end of period 1,021 732
Consolidated Statement of Cash Flows for the year ended 30 September 2019 and 2018
121Consolidated Financial Statements Consolidated Statement of Cash Flows
INFINEON TECHNOLOGIES | ANNUAL REPORT 2019

€ in millions, except for number of shares
Notes
Ordinary shares issued
Shares
Amount
19
Balance as of 1 October 2017 1,136,200,929 2,272
Net income – –
Other comprehensive income (loss) for the period, net of tax – –
Total comprehensive income (loss) for the period, net of tax – –
Dividends – –
Issuance of ordinary shares:
Exercise of stock options 794,905 2
Share-based compensation 21 – –
Balance as of 30 September 2018 1,136,995,834 2,274
Effects from the transition to IFRS 9 and IFRS 15 – –
Balance as of 1 October 2018 1,136,995,834 2,274
Net income – –
Other comprehensive income (loss) for the period, net of tax – –
Total comprehensive income (loss) for the period, net of tax – –
Dividends – –
Issuance of ordinary shares:
Exercise of stock options 914,314 1
Share-based compensation 21 – –
Capital increase 112,773,923 226
Balance as of 30 September 2019 1,250,684,071 2,501
Consolidated Statement of Changes in Equity for the year ended 30 September 2019 and 2018
122Consolidated Financial Statements Consolidated Statement of Changes in Equity
INFINEON TECHNOLOGIES | ANNUAL REPORT 2019

Additional paid-in capital
Retained earnings (accumulated
deficit)
Other reserves Own shares
Total equity attributable to
shareholders of Infineon
Technologies AG
Foreign currency translation
adjustment
Hedges
Cost of hedging
4,774 (1,404) 32 (1) – (37) 5,636
– 1,075 – – – – 1,075
– (4) 27 (2) – – 21
– 1,071 27 (2) – – 1,096
(283) – – – – – (283)
4 – – – – – 6
(9) – – – – – (9)
4,486 (333) 59 (3) – (37) 6,446
– 37 – – – – 37
4,486 (296) 59 (3) – (37) 6,483
– 870 – – – – 870
– (153) 85 155 (42) – 45
– 717 85 155 (42) – 915
(305) – – – – – (305)
4 – – – – – 5
10 – – – – – 10
1,299 – – – – – 1,525
5,494 421 144 152 (42) (37) 8,633
123Consolidated Financial Statements Consolidated Statement of Changes in Equity
INFINEON TECHNOLOGIES | ANNUAL REPORT 2019
Notes to the Consolidated Financial Statements The Infineon Group (“Infineon”) comprising Infineon Technologies AG (“the Company”) and its direct and indirect subsidiaries design, develop, manufacture and market a broad range of semiconductors and related system solutions. The focus of activities is on applications for automotive electronics, industrial electronics, information and communications infrastructure as well as hardware-based security. The product range includes standard, application-specific and customer-specific components as well as system solutions for power, digital, analog, high frequency and mixed-signal applications. About two thirds of Infineon’s revenue is generated by power semi-conductors, the remaining revenue is attributable to high frequency components, sensors, and microcontrollers for automotive, industrial and security applications. Research and development sites, manufacturing facilities, investments and customers are located mainly in Europe, Asia and North America.
Infineon Technologies AG is a listed company under German law and the ultimate parent company of Infineon. The principal office of the Company is Am Campeon 1 – 15, 85579 Neubiberg (Germany). The Company is registered in the Commercial Register of the District Court of Munich (Germany) under the number HRB 126492.
1 Basis of the Consolidated Financial Statements
The Consolidated Financial Statements, prepared by Infineon Technologies AG as ultimate parent company for the year ended 30 September 2019, have been prepared in accordance with International Financial Reporting Standards (“IFRS”) and related interpretations effective as of 30 September 2019 as issued by the International Accounting Standards Board (“IASB”) to the extent to which the IFRS and interpretations have been endorsed by the European Union (“EU”). The Consolidated Financial Statements also comply with the supplementary require-ments set out in section 315e, paragraph 1, of the German Commercial Code (“Handelsgesetzbuch” or “HGB”). The aforementioned standards were complied with in full.
The Consolidated Statement of Operations is presented using the cost of sales method.
The fiscal year end for both Infineon and the Company is 30 September of each year.
The Group currency is the euro (“€”).
Deviations between amounts presented are possible due to rounding. Negative amounts are presented in parentheses.
The Company’s Management Board presented the Consolidated Financial Statements on 18 November 2019.
Financial reporting rules applied for the first timeThe IASB has issued the following Standards or amendments to Standards, which are required to be applied in the Consolidated Financial Statements for the year ended 30 September 2019:
Standard/amendment/interpretation Effective date Impact on Infineon
IFRS 2 Share-based payment (classification and measurement of share-based payment transactions – Amendment to IFRS 2) 1 January 2018 immaterial
IFRS 9 Financial instruments 1 January 2018
see explanations below the table
IFRS 15 Revenue from contracts with customers including clarifications to IFRS 15 1 January 2018
see explanations below the table
IFRIC 22 Foreign currency transactions and advance consideration 1 January 2018 none
Annual IFRS improvement cycle 2014 – 2016 – Amendments to IFRS 1 and IAS 28 1 January 2018 none
124Consolidated Financial Statements Notes to the Consolidated Financial Statements
INFINEON TECHNOLOGIES | ANNUAL REPORT 2019

IFRS 9 “Financial Instruments”IFRS 9 “Financial Instruments” replaces the existing rules contained in IAS 39 “Financial Instruments; Recognition and Measurement” and was applied for the first time by Infineon as of 1 October 2018. IFRS 9 contains new rules for the classification and measurement of financial assets, as well as new regulations for impairments, although the requirements for financial liabilities most relevant to Infineon had largely already been adopted under IAS 39. In addition, the new standard requires more comprehensive disclosure, and contains accounting rules for hedging transactions.
The first-time application was made by an adjustment of the cumulative effect to the opening balance of equity. The previous period is disclosed according to the old requirements (modified retrospective approach).
The classification and measurement of financial assets are based on the underlying business model of the portfolio according to which the financial asset is managed, as well as the specific form of the contractually agreed cash flows. From now on a limited number of financial assets (debt instruments) held by Infineon are recognized at fair value through profit or loss; these were previously recognized at amortized cost or at fair value through other comprehensive income according to IAS 39. In principle, Infineon measures equity instruments at fair value through profit or loss.
According to IFRS 9, the recognition of the impairment of financial instruments is based on expected credit losses, instead of losses already incurred as was previously the case under IAS 39. Infineon applies the so-called simplified impairment model for trade receivables and contract assets, and the so-called general impairment model for cash and cash equivalents and financial investments. The probability-weighted models to estimate expected future credit losses have been integrated into the existing credit risk management process (see note 27). The balance on allowances for impairments based on the IAS 39 rules is reconciled to the new impairment allowance balance in accordance with IFRS 9 in the following table:
€ in millions 2018
Balance at 30 September per IAS 39 –
Adjustment on initial application of IFRS 9 9
Loss allowance on trade receivables (2)
Loss allowance on financial investments 2
Balance at 1 October per IFRS 9 9
The expected credit losses for cash and cash equivalents, contract assets in accordance with IFRS 15, and other financial assets that are classified and measured at amortized cost are immaterial.
The new rules for the application of hedge accounting, whose target is to better represent risk management strategy, has primarily resulted in changes to the documentation and effectiveness requirements for Infineon. All existing hedging arrangements fulfill the hedge accounting requirements as set out in IFRS 9, and are continuing as before. Therefore, there was no effect on the Consolidated Statement of Financial Position arising from the first-time application as of 1 October 2018.
The requirements for the classification and measurement of financial liabilities according to IFRS 9 correspond substantially to the previous requirements of IAS 39. The first application of IFRS 9 had no effect on the classification and measurement of financial liabilities.
In total, the implementation of IFRS 9 as of 1 October 2018, including the effect of deferred tax, had no effect on retained earnings.
P see page 180 f.
125Consolidated Financial Statements Notes to the Consolidated Financial Statements
INFINEON TECHNOLOGIES | ANNUAL REPORT 2019

The following table presents the classification and measurement categories of financial assets in accordance with IAS 39 as of 30 September 2018 and the transition to the new classification and measurement categories in accordance with IFRS 9 as well as the respective carrying amounts as of 1 October 2018:
€ in millions
Original classification under IAS 39
Classification under IFRS 9
Carrying amount as of
30 Septem-ber 2018
Reclassi-fication
Remeasure-ment
Carrying amount as of
1 October 2018
Cash and cash equivalents Loans and receivables Amortized cost 732 (89) – 643
At fair value through profit or loss – 89 – 89
Financial Investments Loans and receivables Amortized cost 1,248 – (2) 1,246
Available for sale At fair value through
profit or loss 563 – – 563
Trade receivables Loans and receivables Amortized cost 971 – 2 973
Other current assets Loans and receivables Amortized cost 110 – – 110
At fair value through profit and loss
At fair value through profit or loss 3 – – 3
Other non-current assets Loans and receivables Amortized cost 64 (18) – 46
At fair value through profit or loss – 18 – 18
Available for sale At fair value through profit or loss 40 (4) – 36
Not assignable to any IFRS 9 measurement category – 4 – 4
Total carrying amount 3,731 – – 3,731
Certain investments in money market funds that are classified as cash equivalents according to IAS 7, as well as investments in investment funds reported under financial investments, were reclassified from “loans and receivables” or from “available for sale” to “fair value through profit or loss”. They do not meet the cash flows criteria of IFRS 9 because the contractual payments resulting from these financial investments do not represent solely payments of principal and interest. Since these funds have a stable net asset value there were no differences between amortized cost and fair value, which means that there were no effects on the opening balance of the retained earnings as of 1 October 2018. Due to the implementation of the impairment model in accordance with IFRS 9, an increase of €2 million in the allowance for impairment of financial investments that are classified at amortized cost was recog-nized in the opening balance of retained earnings as of 1 October 2018.
Trade receivables and other receivables that were classified as loans and receivables under IAS 39 are now classified as at amortized cost. A decrease of €2 million in the impairment allowance was recognized in the opening retained earnings as of 1 October 2018 due to the transition to IFRS 9. This resulted on the one hand in an increase in impair-ments due to the impairment model implemented in accordance with IFRS 9, which takes into account expected credit losses. On the other hand portfolio impairments, previously recognized as of 30 September 2018 in accordance with IAS 39 on the basis of flat-rate percentages, were released.
126Consolidated Financial Statements Notes to the Consolidated Financial Statements
INFINEON TECHNOLOGIES | ANNUAL REPORT 2019

Other non-current assets include investments in shares over which Infineon no significant influence has and which are held as long-term strategic investments. They are classified as fair value through profit or loss under IFRS 9. In accordance with IAS 39, they were classified as available for sale. There were no differences between the carrying amounts calculated in accordance with IAS 39 and IFRS 9. The cumulative amounts recognized in other compre-hensive income, which were reclassified to the opening balance of retained earnings upon first-time application of IFRS 9, were in total insignificant.
Certain other non-current financial assets that were classified as “loans and receivables” or “available for sale” under IAS 39 were reclassified to financial assets “at fair value through profit or loss” because their contractual cash flows do not represent solely payments of principal and interest. As there were no material differences between amortized cost and fair value of these assets, there were no effects on the opening balance of retained earnings as of 1 October 2018.
IFRS 15 “Revenue from Contracts with Customers”IFRS 15 “Revenue from Contracts with Customers” was applied for the first time as of 1 October 2018. It replaces all previous standards and revenue recognition interpretations including IAS 11, IAS 18, IFRIC 13, IFRIC 15, IFRIC 18 and SIC 31. IFRS 15 provides a comprehensive framework for determining whether, to what extent, and at which point in time or over which period revenue should be recognized. For this purpose, the standard provides a principle-based, uniform, five-step model, which is to be applied to all categories of revenue transactions with customers. In essence, revenue is recognized when control is transferred to the customer as defined by IFRS 15, in contrast to recognition upon the transfer of significant risks and rewards according to IAS 18. The amount to be recognized as revenue is based on the value of the consideration that the entity expects to receive. According to IAS 18, the revenue to be recognized was based on the fair value of the consideration received or receivable.
The first-time application of IFRS 15 took place by adjusting the equity opening balance with the cumulative effect. The previous periods are presented in accordance with the old requirements (modified retrospective application).
According to IFRS 15, revenues under particular contract types are recognized over time instead of, as previously, at a particular point in time. For Infineon, this affects primarily the sale of customer-specific products with no alter-native use for which Infineon has, even before delivery, an entitlement to payment for services already rendered. Performance progress over the period in which revenue is to be recognized is determined using an input-based method. For sales to some customers with whom Infineon holds consignment stock, revenue recognition has shifted from the point of withdrawal of finished goods and products by the customer to the point of delivery into the customer’s consignment warehouse. Apart from these changes, there were no further material effects on Infineon’s earnings or financial position, since Infineon’s customer contracts generally only contain one contractual obligation that is fulfilled either over a period of time or at a particular point in time.
The first-time application of IFRS 15 resulted in the recognition of contract assets of €89 million and a reduction in inventories of €45 million as of 1 October 2018, so that losses carried forward as of 1 October 2018, taking into account deferred tax effects, decreased by €37 million.
The following tables show the effects of the application of IFRS 15 to the Consolidated Statement of Operations, the Consolidated Statement of Comprehensive Income, the Consolidated Statement of Financial Position and the Consolidated Statement of Cash Flows:
Consolidated Statement of Operations and Consolidated Statement of Comprehensive Income for the fiscal year ending 30 September 2019:
€ in millions
As reported
IFRS 15 Adjustments
Balances without IFRS 15
Adjustments
Revenue 8,029 2 8,027
Cost of goods sold (5,035) (5) (5,030)
Income tax (194) 1 (195)
Net income 870 (2) 872
Total comprehensive income, net of tax 915 (2) 917
127Consolidated Financial Statements Notes to the Consolidated Financial Statements
INFINEON TECHNOLOGIES | ANNUAL REPORT 2019

Consolidated Statement of Financial Position as of 30 September 2019:
€ in millions
As reported
IFRS 15 Adjustments
Balances without IFRS 15
Adjustments
Inventories 1,701 (50) 1,751
Contract assets 91 91 –
Deferred tax assets 599 (5) 604
Total assets 13,412 36 13,376
Retained earnings 421 36 385
Total equity 8,633 36 8,597
Consolidated Statement of Cash Flows for the fiscal year ending 30 September 2019:
€ in millions
As reported
IFRS 15 Adjustments
Balances without IFRS 15
Adjustments
Net income 870 (2) 872
Income tax 194 (1) 195
Change in inventories (239) 5 (244)
Change in other assets and liabilities (4) (2) (2)
Net cash provided by operating activities 1,601 – 1,601
Financial reporting rules issued not yet appliedThe following new or amended Standards have been issued by the IASB and will be relevant to Infineon from today’s perspective. They have not been applied in the Consolidated Financial Statements as of 30 September 2019 since they are not yet mandatory or, alternatively, have not yet been endorsed by the EU. The new or amended Standards are applicable for fiscal years beginning on or after their respective effective date. As a general rule, they are not applied before their effective date, even if this is permitted for certain standards.
Standard/amendment/interpretation Effective date Expected impact on Infineon
IAS 1 and IAS 8
Definition of Material (Amendments to IAS 1 and IAS 8) 1 January 2020 none
IAS 19 Plan amendment, curtailment or settlement (Amendments to IAS 19) 1 January 2019 none
IAS 28 Long-term interests in associated companies and joint ventures (Amendments to IAS 28) 1 January 2019 none
IFRS 3 Definition of a business (Amendments to IFRS 3) 1 January 2020 none
IFRS 9 Prepayment features with negative compensation (Amendments to IFRS 9) 1 January 2019 none
IFRS 16 Leases 1 January 2019
see explanations below the table
IFRS 17 Insurance Contracts 1 January 2021 none
IFRIC 23 Uncertainty over income tax treatments 1 January 2019 immaterial
Annual IFRS improvement cycle 2015 – 2017 – Amendments to IFRS 3 and IFRS 11 as well as IAS 12 and IAS 23 1 January 2019 none
IFRS 16 “Leases”IFRS 16 introduces a standardized accounting model by which leases are to be recorded in the balance sheet of the lessee and replaces all previous standards and lease accounting interpretations including IAS 17, IFRIC 4, and SIC 15 and SIC 27. This means that in future all assets and liabilities arising from a leasing agreement must be recognized by the lessee, unless it is a short-term lease (duration of twelve months or less) or a lease for a low-value asset (each may be elected by the lessee). The distinction between finance and operating leases is still required in the accounts of the lessor and therefore does not differ significantly from IAS 17 “Leases”.
128Consolidated Financial Statements Notes to the Consolidated Financial Statements
INFINEON TECHNOLOGIES | ANNUAL REPORT 2019

The new standard applies to fiscal years that begin on or after 1 January 2019. Therefore, Infineon will apply the standard from the fiscal year that begins on 1 October 2019, according to the modified retrospective approach. Leases which were previously classified as operating leases by Infineon are mainly affected by the first-time application. Short-term lease agreements with a duration of not more than twelve months (unless they contain a purchase option) and leases in which the underlying asset is of low value are not recognized in accordance with the exemption allowed by IFRS 16. Contractual relationships which were not previously classified as leases under IAS 17 “Leases” in conjunction with IFRIC 4 “Determination of whether an agreement includes a lease” were not reassessed against the IFRS 16 definition of a lease.
In a cross-functional IFRS 16 project, Infineon evaluated the expected effect of the first-time application of IFRS 16 on existing processes, systems, contracts and the Consolidated Financial Statements and made adjustments accordingly. The following categories of leases, previously recognized as operating leases, are now recognized as leases according to the definition of the new standard following the transition to IFRS 16 as of 1 October 2019: land and buildings, technical equipment, vehicles and other leased assets. When IFRS 16 is first applied to operating leases, the value of the right-of-use asset is generally measured using the amount of the lease liability. The incre-mental borrowing rate of interest prevailing at the time of the first application of IFRS 16 is used. In the case of deferred lease liabilities, the value of the right-of-use asset shall be adjusted by the amount of lease payments paid in advance or the deferred lease liability. The valuation of the right-of-use asset at the point of first-time application does not take into account the initial direct costs.
As a result of the first-time application, right-of-use assets amounting to around €255 million and leasing liabilities in the amount of around €262 million are recognized in the Consolidated Statement of Financial Position as of 1 October 2019. The difference of €7 million between these two closing balances relates to advance lease payments as well as deferred lease liabilities.
2 Summary of significant accounting policies
Basis of consolidationThe Consolidated Financial Statements presented here include the individual financial statements of Infineon Technologies AG and its direct and indirect subsidiaries on a consolidated basis. A subsidiary is defined as an entity which, directly or indirectly, is controlled by Infineon Technologies AG.
Control exists when Infineon is subjected to variable returns arising from its engagement with the subsidiary or has a right to such, and has the ability to influence these returns as a result of its power over the subsidiary. Power means that Infineon has existing rights that give Infineon the ability to direct the relevant activities of the subsidiary, that is the activities that significantly affect the aforementioned returns.
An entity is included in the Consolidated Financial Statements from the date on which Infineon acquires control. Upon first-time consolidation of an entity, the acquired assets and liabilities are measured on the basis of their fair value at the acquisition date. Any excess of consideration paid (purchase price) over the share of the fair value of acquired assets, liabilities and contingent liabilities is recognized as goodwill. Any excess of Infineon’s share of the fair value of items acquired over consideration paid is recognized as a gain.
The financial statements of entities included in the Consolidated Financial Statements are prepared using uniform valuation and accounting policies.
The balance sheet effects of intragroup transactions as well as gains and losses arising from intragroup business relationships are eliminated on consolidation.
A list of subsidiaries of Infineon Technologies AG is provided in note 30.P see page 191 ff.
129Consolidated Financial Statements Notes to the Consolidated Financial Statements
INFINEON TECHNOLOGIES | ANNUAL REPORT 2019

Functional currency, reporting currency and foreign currency translationThe functional currency of Infineon Technologies AG is the euro. The Consolidated Financial Statements have been prepared with the euro as the reporting currency.
Foreign currency transactions of subsidiaries are translated into the functional currency of the relevant entity using the spot rate prevailing at the transaction date. Monetary foreign currency assets and liabilities are translated at the spot rate prevailing at the reporting date. Exchange rate gains and losses from the translation of foreign currency transactions are recognized in the Consolidated Statement of Operations.
The assets and liabilities of subsidiaries with functional currencies other than the euro are translated into euros using the spot rate at the end of the reporting period. Income and expenses of these entities are translated using the average spot rate of the reporting period. All currency translation differences resulting from the consolidation are recognized directly in equity and presented as “Other reserves”.
The euro/US dollar exchange rate is particularly significant for the preparation of the Consolidated Financial Statements. As of the reporting date 30 September 2019 it was 1.0935 (30 September 2018: 1.1576) and the average for the 2019 fiscal year was 1.1252 (2018: 1.1892).
Recognition and measurement principles The following table summarizes the main measurement principles used in the preparation of the Consolidated Financial Statements:
Balance sheet item Measurement principle
ASSETS
Cash and cash equivalents Fair value/nominal amount
Financial investments Fair value/amortized cost
Trade receivables Transactions price/amortized cost
Inventories Lower of acquisition or production cost and net realizable value
Contract assets Transactions price/amortized cost
Assets classified as held for sale Lower of carrying amount and fair value less costs to sell
Property, plant and equipment Amortized acquisition or production cost
Goodwill Impairment-only approach
Intangible assets (except goodwill):
With definite useful life Amortized acquisition or production cost
Other assets (current and non-current):
Other financial assets:
At amortized cost Fair value/amortized cost
At fair value through profit or loss Fair value through profit or loss
Designated hedging instruments Fair value through other comprehensive income
Remaining other assets Amortized cost
130Consolidated Financial Statements Notes to the Consolidated Financial Statements
INFINEON TECHNOLOGIES | ANNUAL REPORT 2019

Balance sheet item Measurement principle
LIABILITIES AND EQUITY
Debt Fair value/amortized cost
Trade payables Fair value/amortized cost
Provisions:
Pensions Projected unit credit method
Other provisions Expected settlement amount
Other liabilities (current and non-current):
Other financial liabilities:
Measured at fair value through profit or loss Fair value through profit or loss
Designated hedging instruments Fair value through other comprehensive income
Other financial liabilities Fair value/amortized cost
Remaining other liabilities Fair value/amortized cost
Own shares Acquisition cost
Cash and cash equivalentsCash and cash equivalents represent cash and all financial resources with a maturity at acquisition date of three months or less. Cash equivalents partly include investments in money market funds. The valuation is recorded at amortized acquisition cost or at fair value through profit or loss.
Financial instrumentsFinancial instruments are initially recognized at their fair value. Transaction costs directly attributable to the acqui-sition or issuance of financial instruments are only included in the carrying amount if the financial instruments are not measured at fair value through profit or loss. Trade receivables are measured at the transaction price as determined in accordance with IFRS 15.
Regular purchases and sales of financial assets are recognized on the settlement date.
Financial assets are derecognized when the rights to receive payments from the investments have expired, or have been transferred and Infineon has transferred all risks and rewards associated with ownership. Financial liabilities are derecognized when they are extinguished, that is when the contractual obligation is discharged, canceled or expired.
Financial assetsClassification and measurement of financial assetsFor subsequent revaluations, financial assets are classified upon initial recognition either as at amortized cost, fair value through equity or fair value through profit or loss. This classification depends on the characteristics of the contractual cash flows of the financial assets, and Infineon’s business model for managing its financial assets.
In order for a financial asset (debt instrument) to be classified and measured at amortized cost or at fair value through equity, cash flows may only arise from the repayment of principal and interest payments on the outstanding principal amount. This assessment is referred to as a cash flow test or SPPI test (“solely payments of principal and interest”) and is carried out at the level of the individual financial instrument.
The classification and valuation of financial assets is based on the business model. Infineon’s business model for managing financial asset portfolios reflects how the Company controls its financial assets in order to generate cash flows. Depending on the business model, cash flows arise from the receipt of contractual cash flows, the sale of financial assets or both.
131Consolidated Financial Statements Notes to the Consolidated Financial Statements
INFINEON TECHNOLOGIES | ANNUAL REPORT 2019

Based on these two criteria, Infineon’s financial asset valuation categories are as follows:
Financial assets measured at amortized cost include all assets whose contractual provisions result in cash flows at fixed times that represent only interest and repayments of the outstanding principal amount, provided that those assets are held with the intention of collecting the contractual cash flows expected over their respective duration. In subsequent periods, financial assets measured at amortized cost are measured using the effective interest method. Interest income, currency gains and losses, impairments, and gains or losses from the derecognition of such financial assets are recognized through profit or loss.
At the reporting date, Infineon did not hold any financial assets with the intention to collect contractual cash flows and and also to sell them. Therefore, there was no allocation of debt instruments to the category “fair value through other comprehensive income”.
Financial assets in the form of debt instruments that are measured at fair value in profit or loss include all financial assets at Infineon whose cash flows are not exclusively interest payments and principal repayments.
At Infineon, financial assets in the form of equity instruments are consistently measured at fair value through profit or loss. Net gains and losses, including interest and dividend income, from financial assets that are measured at fair value through profit or loss (debt and equity instruments) are recognized in the Consolidated Statement of Operations.
Impairment of financial assetsInfineon determines an impairment charge for expected credit losses for financial assets in the form of debt instruments that are measured at amortized cost or at fair value through equity. The calculation of the expected future credit losses is generally determined by multiplying the probability of default by the carrying amount of the financial asset (exposure at default) and the expected loss ratio (loss given default).
Infineon recognizes impairments for expected credit losses primarily for cash and cash equivalents, financial investments, trade receivables, and contract assets. The expected credit losses are adjusted at each reporting date to reflect changes in credit risk since the instrument was first recognized.
For cash and cash equivalents and financial investments measured at amortized cost, Infineon recognizes credit losses expected in the next twelve months (twelve-month credit loss) in accordance with the general approach. Due to their short-term maturity, this corresponds to the expected credit losses over the entire term. Infineon rates the counterparty risk for cash and cash equivalents and financial investments as low. Infineon assumes that a financial asset has a low credit risk if it has an investment grade rating or an internal rating that corresponds to the invest-ment grade rating as defined by the global definition. In order to assess whether there has been a significant increase in credit risk since initial recognition, Infineon considers appropriate and robust information that is relevant and available without relatively high effort. This includes both quantitative and qualitative information and analyses, which are based on the Company’s historical experience and a sound credit assessment as well as forward-looking information. Macroeconomic information is taken into account in the internal rating model (information on Infineon’s financial risk management is included in note 27). Irrespective of the above analysis, a significant increase in credit risk is assumed if a debtor is more than 30 days overdue with the settlement of a contractual payment.
For trade receivables, Infineon recognizes credit losses that are expected over the entire term using a simplified procedure. The estimate of expected losses on trade receivables is based primarily on the results of customer financial data, ratings, credit default spreads, past payment behavior of customers and forward-looking Information.
P see page 177 ff.
132Consolidated Financial Statements Notes to the Consolidated Financial Statements
INFINEON TECHNOLOGIES | ANNUAL REPORT 2019

In the case of objective indications that expected future cash flows are affected, a financial asset is classified as impaired (with impaired creditworthiness) and adjusted to its individual value. As a rule, this is the case for financial assets (unless it is a trade receivable) no later than 90 days after the due date. For trade receivables, the impaired creditworthiness is not determined automatically in the event of a payment overdue by more than 90 days, but always on the basis of the individual assessment of credit management.
A default event occurs when Infineon concludes that the other party would most likely not be able to meet the payment obligations, or not in full.
Financial assets are partly or completely written off, together with previously recognized impairments, if there is no reasonable expectation of repayment. This is generally the case when Infineon finds that the debtor does not have assets or revenue sources that could generate sufficient cash flows to repay the amounts subject to derecognition. Even when financial assets have been written off, Infineon will continue to take enforcement action to attempt to recover the outstanding amount. Insofar as repayments are made, these are recognized in profit or loss.
Financial liabilitiesInfineon classifies financial liabilities into the following categories: “Financial liabilities measured at fair value through profit and loss” and “Other financial liabilities”. Furthermore, “Designated hedging instruments (cash flow hedges)” belong to financial liabilities.
At Infineon financial liabilities measured at fair value through profit or loss comprise entirely of derivatives used to hedge currency risks for which hedge accounting is not applied.
Upon acquisition, other financial liabilities are measured at fair value after deduction of transaction costs. In subsequent periods, they are measured at amortized cost using the effective interest method. The liabilities are derecognized when the contractual obligations are discharged, canceled or expired.
Designated hedging instruments (cash flow hedges)Certain derivative financial instruments are used to hedge foreign currency risks or risks of commodity price changes (such as gold prices) for firm commitments as well as expected and highly probable future transactions in order to minimize the associated risk (cash flow hedges).
Derivative financial instruments are measured at their fair value and included in “other current assets” or “other current liabilities”.
The effective portion of changes in the fair value of derivative financial instruments that are designated as cash flow hedges and are part of hedging relationships that meet the criteria for hedge accounting is recognized directly in equity. “Effective” is the degree to which changes in the fair value or cash flows of the hedged items that are attributable to a hedged risk are offset by changes in the fair value or cash flows of the hedging instrument. The gain or loss relating to the ineffective portion is recognized in profit or loss. Amounts accumulated in equity are recycled in profit or loss in the periods in which the underlying hedged item affects profit or loss, or, if the expected transaction subsequently results in the recognition of a non-financial asset, included in the acquisition cost upon initial recognition.
In accordance with the provisions of IFRS 9, in the case of foreign currency derivatives, the currency base spread (cost of hedging) is split from the designated hedging instrument and recognized separately in other comprehensive income as an excluded component in the reserve for costs of hedging as part of equity.
When a hedging instrument expires or is sold, or when a hedging relationship no longer meets the criteria for hedge accounting, any cumulative gain or loss existing at that time remains in equity until the underlying transaction actually occurs. When a forecasted transaction is no longer expected to occur, the cumulative gain or loss that was reported in equity is immediately transferred to profit or loss.
133Consolidated Financial Statements Notes to the Consolidated Financial Statements
INFINEON TECHNOLOGIES | ANNUAL REPORT 2019

Recognition and measurement of financial assets according to IAS 39 (2018 fiscal year)In the 2018 fiscal year Infineon applied IAS 39 (see note 1). Accordingly, Infineon classified financial assets into the following categories: “Loans and receivables”, “Available-for-sale financial assets” and “Financial assets measured at fair value through profit or loss”. Financial instruments in the category “Assets held-to-maturity” were not held by Infineon. The categories of financial assets that differ from the new classification and valuation model are explained in detail below:
Loans and receivablesLoans and receivables were non-derivative financial assets with fixed or determinable payments that were not quoted in an active market. At Infineon, the balance sheet items “Cash and cash equivalents”, “Financial invest-ments”, “Trade receivables” and current and non-current “Other assets” all contained financial assets which were classified in the category “Loans and receivables”. Loans and receivables were measured on initial recognition at their fair value plus incidental acquisition costs. Subsequently, they were measured at amortized cost using the effective interest method and were tested for impairment.
Available-for-sale financial assetsAvailable-for-sale financial assets were non-derivative financial assets that were either designated as available for sale, or were not allocated to any of the other categories. Upon acquisition, they were measured at fair value taking into account transaction costs and were subsequently measured at their fair value at the end of the relevant reporting period. Transaction costs relating to the acquisition of available-for-sale financial assets with a finite term and fixed or determinable payments were capitalized and recognized in the Consolidated Statement of Operations using the effective interest method. Changes in the fair value of available-for-sale financial assets were recognized directly in equity. If the fair value was permanently or significantly lower than the amortized cost, then an impairment loss was recognized through profit or loss.
InventoriesInventories are measured at the lower of historical acquisition or fully absorbed production cost – calculated using the weighted-average method – and net realizable value. Net realizable value corresponds to realizable sale proceeds under normal business conditions less estimated expected costs to complete and sell. Production cost comprises costs of material, production wages and an appropriate portion of attributable overheads, along with attributable depreciation and amortization on property, plant and equipment and intangible assets. Overhead mark-ups are determined on the basis of normal capacity utilization levels.
Write-downs to net realizable value are recorded on inventories using a consistent approach throughout Infineon and are determined at product level for technically obsolete and slow-moving inventories on the basis of the amount of revenues expected to be generated by the relevant product.
Inventories include an asset resulting from sales with a right of return, representing Infineon’s right to recover products from customers upon payment of the refund liability (see “Revenue recognition”). The valuation is made by reference to the previous book value of the products.
Contract assetsContract assets are recognized if Infineon has fulfilled its performance obligations arising from contracts with customers and an unconditional entitlement to customer consideration does not yet exist. The approach is based on the transaction price (see “Revenue recognition”). Valuation adjustments for expected credit losses on contract assets are made in accordance with the measurement method for trade receivables (see “Financial instruments”).
At Infineon, contract assets result from revenue arising from over time revenue recognition for certain types of contracts, as well as from sales to some customers for whom Infineon maintains a consignment warehouse and where revenue is recorded at the time of delivery to the consignment warehouse, whereas the invoice is only issued at the time of withdrawal of product by the customer.
P see page 125 ff.
P see page 138 f.
P see page 138 f.
P see page 132 f.
134Consolidated Financial Statements Notes to the Consolidated Financial Statements
INFINEON TECHNOLOGIES | ANNUAL REPORT 2019

Property, plant and equipmentProperty, plant and equipment are measured at amortized acquisition or construction cost, and its value is reduced by scheduled depreciation and considering any impairment.
Scheduled depreciation on property, plant and equipment is recorded using the straight-line method. Land, property rights and construction in progress are not depreciated on a scheduled basis. Scheduled depreciation on property, plant and equipment is based on the following useful lives, as applied consistently throughout Infineon:
Years
Buildings 10 – 25
Technical equipment and machinery 3 – 10
Other plant and office equipment 1 – 10
Intangible assets (excluding goodwill)Intangible assets consist of capitalized development costs and purchased intangible assets; for example licenses, technologies and customer relationships. These assets have finite useful lives and are valued at their amortized acquisition or production costs with amortization recorded using the straight-line method over their expected economic life.
Scheduled amortization of intangible assets is based on the following useful lives:
Years
Capitalized development costs 3 – 10
Customer relationships 1 – 12
Technologies 4 – 12
Licenses and similar rights 3 – 5
Other intangible assets 2 – 8
Infineon did not hold any intangible assets with indefinite useful lives in either the 2019 or 2018 fiscal years.
Recoverability of intangible assets and other long-lived assetsGoodwill Goodwill acquired in a business combination is the excess of the consideration transferred for an interest in a busi-ness over the net fair value of acquired, separately identifiable, assets, liabilities and contingent liabilities as of the date of acquisition. Goodwill is reported in the line item “Goodwill and other intangible assets” in the Consolidated Statement of Financial Position and is allocated to the cash-generating units (“CGUs”) or groups of CGUs that will benefit from the synergies generated by the business combination. A CGU represents the smallest identifiable group of assets that generates cash inflows from continuing activities and that are largely independent of other assets or group of assets.
Acquired goodwill is only impaired if there is evidence of impairment. Its value is tested at the operating segment level for possible impairment annually as of 30 June and, additionally, whenever there are events or changes in circumstances that indicate that the carrying amount may not be recoverable. The recoverable amount is the higher of the fair value less costs to sell and the value in use. If the carrying amount of the respective operating segment to which the goodwill is allocated exceeds the recoverable amount of this CGU, the goodwill is impaired accordingly. The reversal in subsequent periods of such impairments is not permitted.
135Consolidated Financial Statements Notes to the Consolidated Financial Statements
INFINEON TECHNOLOGIES | ANNUAL REPORT 2019
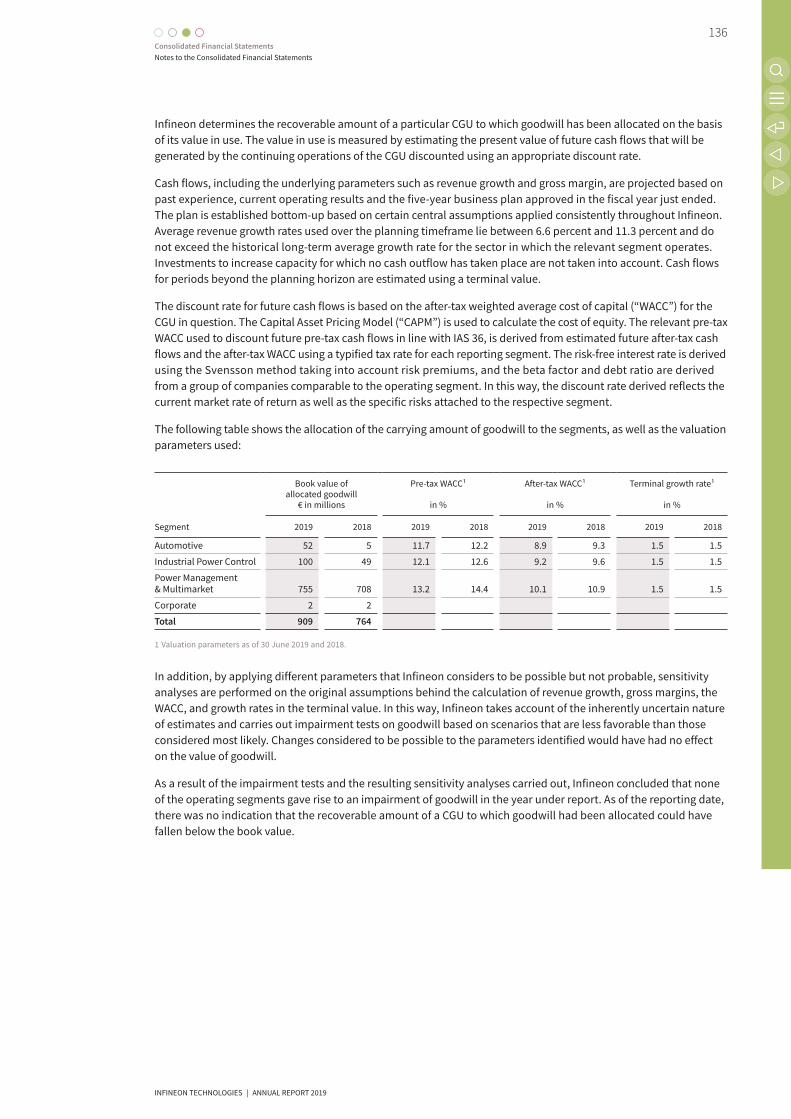
Infineon determines the recoverable amount of a particular CGU to which goodwill has been allocated on the basis of its value in use. The value in use is measured by estimating the present value of future cash flows that will be generated by the continuing operations of the CGU discounted using an appropriate discount rate.
Cash flows, including the underlying parameters such as revenue growth and gross margin, are projected based on past experience, current operating results and the five-year business plan approved in the fiscal year just ended. The plan is established bottom-up based on certain central assumptions applied consistently throughout Infineon. Average revenue growth rates used over the planning timeframe lie between 6.6 percent and 11.3 percent and do not exceed the historical long-term average growth rate for the sector in which the relevant segment operates. Investments to increase capacity for which no cash outflow has taken place are not taken into account. Cash flows for periods beyond the planning horizon are estimated using a terminal value.
The discount rate for future cash flows is based on the after-tax weighted average cost of capital (“WACC”) for the CGU in question. The Capital Asset Pricing Model (“CAPM”) is used to calculate the cost of equity. The relevant pre-tax WACC used to discount future pre-tax cash flows in line with IAS 36, is derived from estimated future after-tax cash flows and the after-tax WACC using a typified tax rate for each reporting segment. The risk-free interest rate is derived using the Svensson method taking into account risk premiums, and the beta factor and debt ratio are derived from a group of companies comparable to the operating segment. In this way, the discount rate derived reflects the current market rate of return as well as the specific risks attached to the respective segment.
The following table shows the allocation of the carrying amount of goodwill to the segments, as well as the valuation parameters used:
Segment
Book value of allocated goodwill
€ in millions
Pre-tax WACC1
in %
After-tax WACC1
in %
Terminal growth rate1
in %
2019 2018 2019 2018 2019 2018 2019 2018
Automotive 52 5 11.7 12.2 8.9 9.3 1.5 1.5
Industrial Power Control 100 49 12.1 12.6 9.2 9.6 1.5 1.5
Power Management & Multimarket 755 708 13.2 14.4 10.1 10.9 1.5 1.5
Corporate 2 2
Total 909 764
1 Valuation parameters as of 30 June 2019 and 2018.
In addition, by applying different parameters that Infineon considers to be possible but not probable, sensitivity analyses are performed on the original assumptions behind the calculation of revenue growth, gross margins, the WACC, and growth rates in the terminal value. In this way, Infineon takes account of the inherently uncertain nature of estimates and carries out impairment tests on goodwill based on scenarios that are less favorable than those considered most likely. Changes considered to be possible to the parameters identified would have had no effect on the value of goodwill.
As a result of the impairment tests and the resulting sensitivity analyses carried out, Infineon concluded that none of the operating segments gave rise to an impairment of goodwill in the year under report. As of the reporting date, there was no indication that the recoverable amount of a CGU to which goodwill had been allocated could have fallen below the book value.
136Consolidated Financial Statements Notes to the Consolidated Financial Statements
INFINEON TECHNOLOGIES | ANNUAL REPORT 2019

Intangible assets and other non-current assetsInfineon reviews non-current assets, including property, plant and equipment and intangible assets for possible impairment whenever events or changes in circumstances indicate that the carrying amount of an asset may not be recoverable. Regardless of whether an indication of impairment exists, intangible assets including capitalized development costs not yet subject to scheduled amortization undergo an annual impairment test (see also “Research and development expenses”).
The recoverability of an asset is measured by comparing its carrying amount with its recoverable amount. To the extent it is not possible to determine the recoverable amount of an individual asset, the book value of the CGU to which the asset is allocated is compared to its recoverable amount.
The recoverable amount of an asset is defined as the higher of its fair value less costs to sell and its value in use. The value in use is calculated based on discounted future cash flows. Considerable management judgment is necessary to estimate future cash flows.
If an asset or CGU is considered to be impaired, the impairment recognized is measured as the amount by which the carrying value exceeds the recoverable amount. If the recoverable amount of a CGU is less than the carrying value, the impairment is allocated pro rata to the assets recorded within the scope of IAS 36 therein. An impairment loss recognized in prior periods for an asset is reversed insofar as, since the last impairment, a change in the under-lying assumptions has occurred, which leads to a lower impairment requirement. The maximum possible reversal of an impairment loss is that which would lead to the carrying amount that would have been determined (net of scheduled depreciation and amortization) if no impairment loss had been recognized for that asset in prior years.
Defined benefit pension plansThe net pension obligation recognized in respect of defined benefit pension plans comprises the present value of the defined benefit obligation (DBO) at the end of the reporting period less the fair value of the plan assets. The present value of the DBO and the resulting pension expense are determined annually in accordance with IAS 19 “Employee Benefits” for each separate plan by independent, qualified actuaries using the projected-unit-credit method. The calculation is subject to, among other things, assumptions on increases in salaries, future developments in pensions as well as the life expectancy of the beneficiaries. As of the balance sheet date, the obligations are discounted using discount rates determined on the basis of market yields of high-grade, fixed-interest corporate bonds from issuers carrying a very high credit rating.
All items of income and expense relating to defined benefit plans, with the exception of the net interest result, are recognized on a net basis in the functional areas within the operating result. The net interest result arising from the multiplication of the net pension obligation (pension obligation less plan assets) by the discount rate is presented as financial expense. Actuarial gains and losses arising from changes to actuarial assumptions and estimates as well as the difference between the normalized and actual return on plan assets are recognized directly in equity and recorded in the Consolidated Statement of Comprehensive Income in the periods in which they arise. Past service costs are recognized immediately in profit or loss.
P see page 139
137Consolidated Financial Statements Notes to the Consolidated Financial Statements
INFINEON TECHNOLOGIES | ANNUAL REPORT 2019

ProvisionsProvisions are recognized for present legal and/or constructive obligations arising from past events that are likely to result in a future outflow of resources, the amount of which can be reliably estimated.
With regard to legal proceedings and litigation, for example those connected with the Qimonda insolvency, Infineon regularly assesses the probability of an unfavorable outcome. Infineon records provisions and liabilities, including provisions for significant legal costs, for those obligations and risks relating to legal disputes which it assesses at the relevant reporting date are likely to occur. That is where, from Infineon’s perspective at the date of assessment, there is compelling evidence which indicates an obligation or risk, and the obligation or risk can be quantified with reasonable accuracy at the time of assessment. As soon as additional information is available, the affected estimates are reviewed and, where necessary, provisions for these proceedings are revised.
Provisions are measured at their expected settlement amount. The amount recognized for a provision is the best estimate of the expenditure required to settle the present obligation. Estimates of outcomes and financial effects are dependent upon the judgment of management, supplemented by experience gained from similar transactions and, where appropriate, the assessment of independent experts. If the circumstances to be assessed encompass a large number of possible outcomes, the obligation is estimated by weighting all possible outcomes by their asso-ciated probabilities (expected value method).
Where cash flows are expected to arise after more than one year and the interest effect is considered material, provisions are stated at the present value of expected cash outflows.
If the obligation decreases because of a change in the estimate, the provision is adjusted accordingly and the resulting income recognized in the same functional area of the Consolidated Statement of Operations in which the original charge was recognized.
Contingent liabilitiesContingent liabilities are either possible obligations whose actual existence is dependent on the occurrence of one or more uncertain future events not wholly within the control of Infineon, or they are present obligations that will probably not result in the outflow of resources or whose outflow of resources cannot be quantified reliably. Contingent liabilities are not recognized in the Statement of Financial Position, instead they are disclosed and described in the Notes to the Consolidated Financial Statements (see notes 22 and 23).
Revenue recognitionInfineon generates revenues mainly from the sale of semiconductor products and related system solutions. Revenue is recognized when control over the products is transferred to the customer in accordance with IFRS 15. Typically, Infineon’s customer contracts only contain one performance obligation which is fulfilled either over a period of time or at a specific point in time. For sales of customer-specific products with no alternative use for Infineon, for which Infineon has a legal right to payment for services rendered prior to delivery, revenue is recognized over time. Performance progress is determined using an input-based method and is based on the ratio of costs already incurred to the estimated total cost. Where revenue from the sale of products is not realized on an over time basis, revenue is generally recognized upon delivery, since customers cannot derive material benefits from the products before this point in time. In cases of deliveries to consignment warehouses, control remains with Infineon where there is no contractual requirement for the customer to withdraw products. In these cases, revenue is recognized when products are withdrawn from the consignment warehouse by the customer.
Invoices for sales of product are issued at the time of delivery or withdrawal by the customer from the consignment warehouse, and have a short payment term. The amount of revenue corresponds to the expected transaction price to be received from the customer, taking into account revenue reductions such as rebates and discounts. Variable consideration is estimated taking into account the available historical, current and forecast information. The relevant estimate is based on the expected value and the most likely amount.
P see page 165 ff.
138Consolidated Financial Statements Notes to the Consolidated Financial Statements
INFINEON TECHNOLOGIES | ANNUAL REPORT 2019

Infineon recognizes revenue for deliveries to distributors by using the “sell in” method, that is when a product is sold to the distributor, to the extent that revenue has not already been recognized on an over time basis. In accordance with established business practice in the semiconductor industry, under certain circumstances distributors can apply for price protection. Price protection allows distributors to receive a credit (debit) note for unsold products held in inventory if Infineon has reduced (increased) the standard list price of certain products. In addition, in certain cases distributors may request a ship and debit credit note for price adjustments. Infineon adjusts revenue for price protection and ship and debit in the period in which the related revenue is recorded. The ship and debit adjust-ments are determined based on rolling trends in the difference between contract prices and standard list prices to the distributors. The price protection adjustments are based on current list prices and the relevant distributors’ inventory on hand. The availability of detailed distributor inventory data, the transparency of pricing for standard products and the long distributor pricing history enable Infineon to reliably estimate the adjustments for price protection and ship and debit credit notes at the end of the reporting period. Distributors can, subject to certain conditions, return a limited amount of inventory (stock return) or request scrap allowances. Stock return credit notes are accrued based on expected stock returns in accordance with the contractual agreements combined with historical experience. Distributor scrap allowances are accrued based on the contractual agreements and, upon submission of a valid claim, are granted up to a certain maximum based on turnover in a given period. Infineon monitors such product returns on an ongoing basis and adjusts accrual assumptions accordingly. Other returns are only permitted for quality defects within the ordinary warranty period.
The additional costs of a contract initiation are immediately recognized as an expense as soon as they arise, providing the otherwise resulting depreciation period would not exceed one year. Costs of the performance of the contract are capitalized at the earliest when an expected, specifically identifiable contract exists.
Cost of goods soldCost of goods sold includes the manufacturing costs of products sold during the reporting period. In addition, cost of goods sold contains idle costs, inventory risks, the cost of warranty cases, as well as the amortization of capital-ized development costs. Recognized foreign currency effects as well as changes in the fair value of undesignated derivative financial instruments that are connected to the operating business are recognized in cost of goods sold.
Research and development expensesCosts of research activities are expensed as incurred. Costs for development activities, the results of which lead to a plan or design for the production of new or substantially improved products or process improvements, are capitalized if the development costs can be measured reliably, the product or process is technically and commercially feasible, future economic benefits are probable and Infineon intends, and has sufficient resources, to complete development and use or sell the asset. The costs capitalized include the cost of materials, direct labor and directly attributable general overhead expense that serves to prepare the asset for use. Such capitalized costs are presented as internally generated intangible assets within “Goodwill and other intangible assets” (see note 14). Development costs, which do not fulfill the criteria for capitalization, are expensed as incurred. Capitalized development costs are stated at cost less accumulated amortization and impairment charges. After the completion of the development phase and following the ramp-up of production, internally generated intangible assets are generally amortized as part of cost of goods sold over a period of three to five years.
GrantsGrants are recognized when it is reasonably assured that Infineon will comply with the conditions attached to the grant, and it is reasonably assured that the grant will be received. Investment-related grants are deducted from the purchase and production cost of the related asset and thereby reduce depreciation and amortization expense in future periods.
Grants that are related to expenses are presented as a reduction of the related expense in the Consolidated Statement of Operations (see note 4).
P see page 152 f.
P see page 144
139Consolidated Financial Statements Notes to the Consolidated Financial Statements
INFINEON TECHNOLOGIES | ANNUAL REPORT 2019

Current and deferred income taxesThe current income tax expense is calculated in accordance with taxation provisions in force at the end of the reporting period.
Deferred taxes are calculated on temporary differences between the tax base and the book value of assets and liabilities, and on tax losses available for carry-forward and tax allowances. By contrast, no deferred tax is recognized on goodwill arising in connection with business combinations. Similarly, deferred taxes are not recognized on the initial recognition of an asset or liability in connection with a transaction that is not a business combination and which, at the time of the transaction, affects neither the pre-tax income according to IFRS nor taxable profit. Deferred tax assets and liabilities are measured using applicable tax rates and laws that have been enacted by the end of the reporting period or are about to be enacted, and are to be applied when the related deferred tax asset is realized or the deferred tax liability is settled.
Deferred tax assets in respect of deductible temporary differences, tax loss carry-forwards and tax allowances which exceed deferred tax liabilities in respect of taxable temporary differences, are only recognized to the extent that it is probable that the relevant Group entity can generate sufficient taxable profit to realize the corresponding benefit. Infineon reviews deferred tax assets for impairment at every reporting date. The assessment requires management to make assumptions about future taxable profits as well as other positive and negative influencing factors.
Deferred tax assets and liabilities are netted to the extent they relate to the same tax authority and to the same taxpayer or a group of different taxpayers who are jointly assessed for income tax purposes.
Income taxes are recognized in the Consolidated Statement of Operations, with the exception of income taxes relating to items recognized directly in equity or in other comprehensive income.
For uncertain tax positions a current tax liability is recorded or, in case of a tax loss carried forward or a tax allowance, the respective deferred tax asset is reduced accordingly. The assessment of uncertain tax positions is based on best estimates.
Estimates and assumptionsThe preparation of financial statements in accordance with IFRS requires management to make estimates and assumptions that have an impact on the presented amounts and the associated disclosures.
Estimates and assumptions undergo regular review and must be adjusted where appropriate. They can vary from period to period and have a material effect on the financial condition, liquidity position and results of operations of Infineon.
Although these estimates and assumptions are applied by management to the best of its knowledge based on current events and circumstances, actual events may result in deviations from these estimates.
Areas containing estimates and assumptions and that are consequently most likely to be affected when actual results vary from estimates are:
› over time revenue recognition (see “Revenue recognition” and note 12),
› recognition and recoverability of deferred tax assets (see “Current and deferred income taxes” and note 6),
› valuation of inventory (see “Inventories” and note 11),
› recoverability of non-financial assets especially goodwill (see “Recoverability of intangible assets and other long-lived assets” and note 14),
› recognition and valuation of provisions (see “Provisions” and notes 16 and 23),
P see page 138 f. and page 151
P see page 140 and page 146 ff.
P see page 134 and page 151
P see page 135 ff. and page 152 ff.
P see page 138, page 155 and page 166 ff.
140Consolidated Financial Statements Notes to the Consolidated Financial Statements
INFINEON TECHNOLOGIES | ANNUAL REPORT 2019

› valuation of defined benefit pension plans (see “Defined benefit pension plans” and note 18),
› valuation of share-based compensation (see note 21) and
› assessment of the high probability of the planned acquisition of Cypress and the resulting possibility of applying hedge accounting to the concluded transaction-dependent euro/US dollar foreign currency forward (Deal Contingent Forward) and the transaction-dependent euro/US dollar foreign currency option (Deal Contingent Option) (see notes 3 and 26).
All assumptions and estimates are based on the circumstances and assessments as of the balance sheet date, and taking into account knowledge gained up to the approval by the Management Board of the Consolidated Financial Statements on 18 November 2019.
3 Acquisitions
Acquisition of 100 percent of the shares in Siltectra GmbHOn 9 November 2018, Infineon acquired all of the shares in Siltectra GmbH (“Siltectra”), which is based in Dresden (Germany).
Siltectra has developed a technology that allows silicon carbide (SiC) crystals to be very precisely and efficiently processed. As a result there is virtually no loss of material compared to the previous method. This technology can be used in two ways. Firstly by cutting the silicon carbide boule into wafers yielding significantly more wafers than the conventional approach. Secondly, the technology enables a very thin layer to be separated from the top of a wafer thereby enabling the remaining wafer to be reused. This 2-out-of-1 concept is very important as the future long-term supply of silicon carbide wafers could be a limiting factor, especially if the material is used to an ever- greater extent in the electro-mobility, photovoltaic, power supplies as well as drives sectors in the future. In the coming years Infineon will work on making the Siltectra technology useable in volume production.
The consideration transferred (purchase price) for the acquired company amounted to €124 million. The purchase price allocation, based on the fair values of the assets and liabilities as of the acquisition date, resulted in the recognition of the technology as an asset, and goodwill.
The following table shows the final allocation of the purchase price to assets and liabilities as of the acquisition date:
€ in millions
Other intangible assets (technology) 35
Other assets 4
Total assets 39
Deferred tax liabilities 7
Other liabilities 3
Total liabilities 10
Net assets acquired 29
Goodwill 95
Purchase price 124
Paid in cash and cash equivalents during the twelve months ended 30 September 2019 124
Acquired cash and cash equivalents (1)
Net cash outflow for the acquisition 123
P see page 137 and page 156 ff.
P see page 164 f.
P see page 142 and page 175
141Consolidated Financial Statements Notes to the Consolidated Financial Statements
INFINEON TECHNOLOGIES | ANNUAL REPORT 2019

Goodwill of €95 million arose from the acquisition that is not deductible for tax purposes. This goodwill is mainly attributable to the expected cost benefits from the use and future development of the technology developed by Siltectra.
Siltectra did not generate any revenue during the reporting period. From the first-time consolidation of Siltectra to 30 September 2019 Siltectra contributed a loss of €2 million after tax to the Consolidated Statement of Comprehensive Income. The inclusion of Siltectra from 1 October 2018 would not have had a material effect on Infineon’s earnings.
Planned acquisition of Cypress Semiconductor CorporationOn 3 June 2019 Infineon and Cypress Semiconductor Corporation (“Cypress”), which is based in San José (California, USA) signed an agreement under which Infineon will acquire Cypress for US$23.85 per share in cash, corresponding to an enterprise value of €9 billion.
With the planned acquisition of Cypress, Infineon is strengthening its focus on structural growth drivers and serving an even broader range of applications. Cypress has a differentiated portfolio of microcontrollers as well as software and connectivity components that are complementary to Infineon’s leading power semiconductors, sensors, and security solutions. The combination enables even more comprehensive advanced solutions for high-growth appli-cations such as electric drives, battery-powered devices, and power supplies. The combination of Infineon’s security expertise and Cypress’s connectivity know-how will accelerate entry into new IoT applications in the industrial and consumer segments. In automotive semiconductors, the expanded portfolio of microcontrollers and NOR flash memory offers great potential, especially in view of their growing importance for driver assistance systems and new electronic architectures in vehicles.
The Company’s Supervisory Board and the Board of Directors of Cypress have approved the transaction. The share-holders of Cypress granted the required approval at the extraordinary general meeting on 27 August 2019. The acquisition is still subject to approval by the relevant regulatory bodies as well as the fulfillment of other customary conditions. The closing and execution of the transaction is expected by the end of the 2019 calendar year or early 2020.
In order to finance the transaction, a small group of banks had initially committed to binding loans, which were subsequently syndicated within a larger banking consortium (see note 15). The final financing structure is designed to maintain the investment grade rating. Infineon therefore intends to finance around 30 percent of the transaction with equity. The remainder is to be financed by debt instruments and available cash. In view of the intended equity portion of the financing, a capital increase against cash contribution with net proceeds of approximately €1.5 billion was executed on 18 June 2019 (see note 19) and a hybrid bond with net proceeds of approximately €1.2 billion was executed on 1 October 2019 (see note 29). In order to hedge against most of the exchange rate risk associated with the purchase price obligation arising from the planned acquisition of Cypress, the Company concluded a transaction-dependent euro/US dollar foreign currency forward (Deal Contingent Forward) as well as a transaction- dependent euro/US dollar foreign currency option (Deal Contingent Option), each with a nominal value of €3.3 billion (see note 26).
P see page 154 f.
P see page 161
P see page 186
P see page 175 ff.
142Consolidated Financial Statements Notes to the Consolidated Financial Statements
INFINEON TECHNOLOGIES | ANNUAL REPORT 2019

4 Notes to the Consolidated Statement of Operations
RevenueBreakdowns of revenue by segments, product groups and geographic areas are disclosed in note 28.
The aggregate amount of the transaction prices of the unsatisfied and partially unsatisfied performance obligations, arising from contracts with customers within the meaning of IFRS 15 with expected original durations of more than one year, was as follows as of 30 September 2019:
Revenue expected in (€ in millions) Total Less than 1 year
1 year and after
As of 30 September 2019 113 19 94
Infineon refrains from disclosing the remaining performance obligations arising from contracts with customers within the meaning of IFRS 15 with original expected durations of one year or less.
Cost of materials and purchased services as well as personnel expenseThe Consolidated Statement of Operations (continuing and discontinued operations) includes the following expenses for purchased services, materials and personnel.
Expenses for purchased services and materials comprised the following in the 2019 and 2018 fiscal years:
€ in millions 2019 2018
Cost of raw materials, supplies and purchased goods 1,816 1,647
Cost of purchased services 1,653 1,595
Total (continuing and discontinued operations) 3,469 3,242
Personnel expenses comprised the following in the 2019 and 2018 fiscal years:
€ in millions 2019 2018
Wages and salaries 2,154 1,982
Social insurance levies, pension plans and similar commitments 399 365
Total (continuing and discontinued operations) 2,553 2,347
The average number of employees by geographic region was as follows for the 2019 and 2018 fiscal years:
2019 2018
Europe 18,365 16,757 therein: Germany 11,896 10,980
Asia-Pacific (excluding Japan, Greater China) 16,826 16,167
Greater China 2,087 2,076 therein: China 1,927 1,921
Japan 203 191
Americas 3,943 3,905 therein: USA 2,016 2,022
Total 41,424 39,096
P see page 183 and page 185
143Consolidated Financial Statements Notes to the Consolidated Financial Statements
INFINEON TECHNOLOGIES | ANNUAL REPORT 2019

GrantsInfineon has received grants from various governmental institutions under government business development programs including grants for the construction of manufacturing facilities, for research and development activities, and employee development. A grant received by Infineon for one of these funding programs in the 2019 fiscal year amounted to €32 million, and is conditional on the number of people employed at defined German locations through to the end of 2025 not being less than an agreed number, and that the grant may only be used in the European Economic Area. Infineon received investment grants as well as grants under the funding program. Recognition is in line with the principles described in note 2 under “Grants”.
Grants included directly in profit or loss in the Consolidated Financial Statements during the 2019 and 2018 fiscal years were as follows:
€ in millions 2019 2018
Included in the Consolidated Statement of Operations in:
Cost of goods sold 58 37
Research and development expenses 111 86
Selling, general and administrative expenses 2 2
Total 171 125
Of the grants totaling €171 million (2018: €125 million) included in the Consolidated Statement of Operations in the 2019 fiscal year, €124 million (2018: €80 million) related to expenses from previous years.
In the 2019 fiscal year, investment grants of €46 million (2018: €2 million) were deducted from acquisition and production costs for property, plant and equipment and intangible assets. In the 2019 fiscal year, Infineon received investment grants of €24 million (2018: €0 million).
For compliance with the conditions attached to the grants received and potential repayment requirements in case of nonfulfillment, see note 22.
Financial Income and expensesFinancial income comprised the following in the 2019 and 2018 fiscal years:
€ in millions 2019 2018
Interest income 26 15
Total 26 15
Financial expenses comprised the following in the 2019 and 2018 fiscal years:
€ in millions 2019 2018
Interest expenses (62) (60)
Other financial expenses (36) (8)
Total (98) (68)
Other financial expenses in the 2019 fiscal year included €22 million from the acquisition or realization of financing- related derivatives to hedge stock market risks in connection with the capital increase carried out to finance the planned acquisition of Cypress (see note 19).
Further information on Infineon’s financial income and expenses is contained in note 26.
P see page 139
P see page 166
P see page 161
P see page 174
144Consolidated Financial Statements Notes to the Consolidated Financial Statements
INFINEON TECHNOLOGIES | ANNUAL REPORT 2019

5 Investments accounted for using the equity method
Investments accounted for using the equity method include shares in the joint ventures Infineon Technologies Bipolar GmbH & Co. KG and SAIC Infineon Automotive Power Modules (Shanghai) Co., Ltd.
Infineon Technologies Bipolar GmbH & Co. KGInfineon Technologies Bipolar GmbH & Co. KG (“Bipolar”) located in Warstein (Germany) develops and manufactures bipolar power semiconductors. Infineon accounts for the 60 percent interest in the joint venture by using the equity method as Infineon lacks controlling influence due to certain contractual participation rights of co-shareholder Siemens AG.
The investment in Bipolar is allocated to the Industrial Power Control segment.
SAIC Infineon Automotive Power Modules (Shanghai) Co., Ltd.SAIC Infineon Automotive Power Modules (Shanghai) Co., Ltd. (“SIAPM”), registered in Shanghai (China), offers power semiconductor solutions for electric vehicles in China. Volume production is running at Infineon’s site in Wuxi (China). Infineon holds 49 percent of the company’s shares.
The investment in SIAPM is allocated to the Automotive segment.
Summarized financial informationAs of 30 September 2019 and 2018, the carrying amount of joint ventures accounted for using the equity method was €29 million and €37 million, respectively. The pro rata results from investments accounted for using the equity method were as follows for the 2019 and 2018 fiscal years:
€ in millions 2019 2018
Gain (loss) from investments accounted for using the equity method (6) (5)
Attributable to:
Segment Automotive (8) (8)
Segment Industrial Power Control 2 3
The result of the investments accounted for using the equity method is not part of the segment result (see note 28).
For the 2019 and 2018 fiscal years, Infineon’s proportion of selected items from the statement of comprehensive income of the joint ventures were aggregated as follows:
€ in millions 2019 2018
Income (loss) for the year, net of tax (6) (5)
Other comprehensive income (loss) for the year, net of tax (2) (1)
Total comprehensive income (loss) for the year, net of tax (8) (6)
P see page 184
145Consolidated Financial Statements Notes to the Consolidated Financial Statements
INFINEON TECHNOLOGIES | ANNUAL REPORT 2019

6 Income tax
Income tax from continuing operations for the fiscal years ending 30 September 2019 and 2018 was as follows:
€ in millions 2019 2018
Current tax expense (135) (211)
Deferred tax expense (income) (59) 18
Income tax (194) (193)
Current tax expense included tax income of €26 million (2018: €23 million income tax expense) relating to previous fiscal years.
Included within deferred tax expense was €3 million (2018: income €37 million) from the creation and reversal of temporary differences.
The German combined statutory tax rate for Infineon Technologies AG was 28 percent for the 2019 and 2018 fiscal year. This comprised a corporate income tax rate of 15 percent, plus a solidarity surcharge of 5.5 percent and a trade tax rate of 12 percent.
Taxable income earned by foreign subsidiaries is determined on the basis of the tax laws applicable in the relevant countries and is taxed based on country specific tax rates.
A reconciliation of income taxes from continuing operations for the fiscal years ended 30 September 2019 and 2018, using as a basis the German combined statutory income tax rate of 28 percent (2018: 28 percent) is as follows:
€ in millions 2019 2018
Expected income tax expense (303) (350)
Tax rate differential 57 35
Effects due to changes in tax rate – 27
Effects from the difference between local and functional currency (11) 4
Prior year taxes 20 (38)
Non-deductible expenses and tax-exempt income, net 22 (51)
Change in valuation allowance on deferred tax assets (53) 117
Change in available tax credits 75 64
Other (1) (1)
Actual income taxes (194) (193)
In the 2019 fiscal year, the profit or loss effect from the valuation allowances on deferred tax assets for tax loss carry- forwards amounted to €21 million (2018: €0 million), for tax credits amounted to €57 million (2018: €0 million), and from temporary differences €7 million (2018: €14 million). A write-up of deferred tax assets for tax loss carry-forwards of €8 million was recorded (2018: €81 million). For temporary differences the write-up amounted to €1 million in the 2019 fiscal year (2018: €31 million), for tax credits the write-up was €23 million (2018: €19 million).
The utilization of tax loss carry-forwards, tax credits and temporary differences for which deferred tax assets had not previously been recorded resulted in current tax income of €6 million in the 2019 fiscal year (2018: €2 million).
146Consolidated Financial Statements Notes to the Consolidated Financial Statements
INFINEON TECHNOLOGIES | ANNUAL REPORT 2019

Deferred tax assets and liabilities as of 30 September 2019 and 2018 comprised the following:
€ in millions
30 September 2019 30 September 2018
Deferred tax assets
Deferred tax liabilities
Deferred tax assets
Deferred tax liabilities
Intangible assets 39 (206) 38 (183)
Property, plant and equipment 152 (17) 142 (23)
Provisions, pension plans and similar commitments 161 (170) 130 (140)
Tax loss carry-forwards 393 – 415 –
Unused tax credits and excess foreign tax credits 123 – 136 –
Other 143 (39) 137 (13)
Total deferred taxes 1,011 (432) 998 (359)
Netting (412) 412 (350) 350
Total 599 (20) 648 (9)
The reduction in deferred taxes of €60 million was recognized directly in equity/other comprehensive income in the amount of €2 million (2018: increase €27 million) relating to the following positions: intangibles assets of €11 million (2018: €0 million) and others of €16 million (2018: €0 million) as well as – with an opposite effect – provisions, pension plans and similar commitments of €15 million (2018: €25 million), loss carry-forwards of €10 million (2018: €0 million) and others of €0 million (2018: €2 million).
In Germany, Infineon Technologies AG had corporate income tax loss carry-forwards of €1.5 billion and trade tax loss carry-forwards of €2.6 billion as of 30 September 2019 (30 September 2018: €1.6 billion and €2.6 billion, respectively).
In other jurisdictions, corporate income tax loss carry-forwards amounted to €31 million (30 September 2018: €33 million) and local income tax loss carry-forwards amounted to €26 million (30 September 2018: €92 million). Additionally, there were unused tax credits and excess foreign tax credits of €413 million (30 September 2018: €360 million).
Infineon assessed its deferred tax assets for the need for a valuation allowance. Based on the results of the assessment of deferred tax assets, considering all positive and negative factors and information relating to the foreseeable future, Infineon recognized deferred tax assets, after netting, of €599 million as of 30 September 2019 (30 September 2018: €648 million).
No deferred taxes were recorded for the following items (gross amounts):
€ in millions 2019 2018
Tax loss carry-forwards (corporate tax and local income tax) 1,317 1,357
Tax credits 290 224
Temporary differences 547 388
There were no tax loss carry-forwards for which material deferred tax assets were not recognized and which were subject to expiration under statutory tax regulations. Of the tax credits for which no deferred tax assets were recognized, €2 million (2018: €39 million) will expire in the coming five years.
147Consolidated Financial Statements Notes to the Consolidated Financial Statements
INFINEON TECHNOLOGIES | ANNUAL REPORT 2019

The change in the net amount of deferred tax assets and liabilities is broken down as follows:
€ in millions 2019 2018
Deferred taxes, net as of the end of the previous fiscal year 639 594
Deferred tax income (expense), recognized through income statement:
From continued operations (59) 18
From discontinued operations 1 –
Change of deferred taxes, recognized directly in equity:
Adjustment on initial application of IFRS 9 and IFRS 15 (6) –
Deferred tax arising from business acquisitions (7) –
Deferred taxes recognized in other comprehensive income 11 27
Deferred taxes, net as of the end of the fiscal year 579 639
In connection with investments in subsidiaries there were taxable temporary differences of €610 million (2018: €120 million) for which no deferred taxes have been recognized because the timing of the reversal can be controlled and it is not probable that the temporary difference will reverse in the foreseeable future.
Including the items recognized directly in equity and the expense/benefit from continuing and discontinued operations, the income tax consisted of the following:
€ in millions 2019 2018
Income taxes from continuing operations (194) (193)
Income taxes from discontinued operations 6 17
Income taxes recognized in other comprehensive income 18 27
Income taxes recognized directly in equity (3) 1
Income taxes (173) (148)
Aside from tax effects from non-realized gains and lossed from hedges, income taxes recognized in other compre-hensive income mainly related to actuarial gains and losses arising from the pension commitments. Income taxes recognized directly in equity related to the capital increase and the first time adoption of IFRS 9 and IFRS 15.
7 Disposals and discontinued operations and assets classified as held for sale
Qimonda – discontinued operationsOn 23 January 2009, Qimonda AG (“Qimonda”), a majority-owned company, filed an application at the Munich Local Court to commence insolvency proceedings. On 1 April 2009, the insolvency proceedings opened. Insolvency proceedings were also opened for further domestic and foreign subsidiaries of Qimonda. Some of these insolvency proceedings have already been completed. The impacts of these proceedings are reported as discontinued opera-tions in Infineon’s Consolidated Statement of Operations and Consolidated Statement of Cash Flows, to the extent that the underlying events occurred before the commencement of insolvency proceedings. To the extent that the events occurred after the commencement of insolvency proceedings, their results are reported as part of continuing operations.
The current risks and provisions relating to Qimonda’s insolvency are described in detail in note 23 “Proceedings in relation to Qimonda”.
In the 2019 and 2018 fiscal years, adjustments to individual provisions arose as a result of recent developments in connection with the insolvency of Qimonda, as well as subsequent income from other discontinued operations. Infineon expects lengthy proceedings in respect of the alleged activation of a shell company and liability for impair-ment of capital. Provisions created for this purpose were adjusted accordingly in the 2019 fiscal year and partly reclassified from current to non-current (see note 16).
P see page 166 ff.
P see page 155
148Consolidated Financial Statements Notes to the Consolidated Financial Statements
INFINEON TECHNOLOGIES | ANNUAL REPORT 2019

Loss from discontinued operations, net of income taxes
€ in millions 2019 2018
Qimonda’s share of discontinued operations, net of income taxes (24) (150)
Others business’ share of discontinued operations, net of income taxes 5 7
Loss from discontinued operations, net of income taxes (19) (143)
Assets classified as held for saleAs of 30 September 2019, land and buildings as well as technical equipment and machinery with a carrying amount of €12 million (2018: €11 million) were disclosed as assets classified as held for sale.
8 Earnings per share
Basic earnings per share are calculated by dividing net income by the weighted average number of shares outstanding during the reporting period. The calculation of the diluted earnings per share is based on the assumption that all potentially dilutive instruments are converted into ordinary shares, resulting in a corresponding increase in the number of shares.
Basic and diluted earnings per share are calculated as follows for the fiscal years ended 30 September 2019 and 2018:
€ in millions (unless otherwise stated) 2019 2018
Net income attributable to shareholders of Infineon Technologies AG – basic and diluted 870 1,075
thereof from continuing operations 889 1,218
thereof from discontinued operations (19) (143)
Weighted-average number of shares outstanding (in millions):
– Ordinary share capital 1,169.4 1,136.5
– Adjustment for own shares (6.0) (6.0)
Weighted-average number of shares outstanding – basic 1,163.4 1,130.5
Adjustments for:
– Effect of share-based compensation 1.4 3.6
Weighted-average number of shares outstanding – diluted 1,164.8 1,134.1
Basic and diluted earnings per share 1 (in euro):
Earnings per share (in euro) from continuing operations 0.77 1.08
Earnings per share (in euro) from discontinued operations, net of income taxes (0.02) (0.13)
Earnings per share (in euro) – basic and diluted 0.75 0.95
1 The calculation of earnings per share is based on unrounded figures.
9 Financial investments
Financial investments comprise fixed-term deposits with banks and investment funds. Fixed-term deposits with banks are measured at amortized cost and are categorized as financial assets. Investment funds are measured at fair value through profit or loss and categorized as financial assets (for valuation see note 26).P see page 172 f.
149Consolidated Financial Statements Notes to the Consolidated Financial Statements
INFINEON TECHNOLOGIES | ANNUAL REPORT 2019

Financial investments as of 30 September 2019 and 2018 comprise the following (for further information see also notes 1, 2 and 26):
€ in millions 30 Septem-ber 2019
30 Septem-ber 2018
Fixed-term bank deposits 571 1,248
Investment funds 2,187 563
Financial investments 2,758 1,811
The impairment losses on financial investments that are measured at amortized cost changed as follows during the 2019 fiscal year:
€ in millions 2019
As of 30 September 2018 in accordance with IAS 39 –
Adjustment for first-time application of IFRS 9 2
As of 1 October 2018 in accordance with IFRS 9 2
Revaluation of allowances, net (2)
As of 30 September 2019 in accordance with IFRS 9 –
Information on Infineon’s credit risk management is contained in note 27.
10 Trade receivables
Trade receivables result from contracts with customers that are due within one year. As of 30 September 2019 and 2018 they consisted of the following:
€ in millions 30 Septem-ber 2019
30 Septem-ber 2018
Trade receivables, third parties 890 973
Trade receivables, related parties 5 7
Trade receivables, gross 895 980
Loss allowances (7) (9)
Trade receivables, net 888 971
Changes in the allowances for trade receivables in the 2019 fiscal year were as follows:
€ in millions
Balance at 30 September 2018 per IAS 39 9
Adjustment on initial application of IFRS 9 (2)
Balance at 1 October 2018 per IFRS 9 7
Net remeasurement of loss allowances –
Usage of loss allowances, net –
Balance at 30 September 2019 per IFRS 9 7
Information about Infineon’s credit risk management is contained in note 27.
Allowances in accordance with IAS 39 for the 2018 fiscal year:
€ in millions 2018
Allowances for doubtful accounts at beginning of the fiscal year 9
Current year’s allowances, net of reversals –
Allowances for doubtful accounts at end of the fiscal year 9
P see page 125 ff., page 131 ff. and page 171 ff.
P see page 180
P see page 181
150Consolidated Financial Statements Notes to the Consolidated Financial Statements
INFINEON TECHNOLOGIES | ANNUAL REPORT 2019

Third party trade receivables, net of allowances for doubtful accounts, as of 30 September 2018 comprised the following:
€ in millions
Carrying amount
thereof not past due
Past due 0 – 30 days
Past due > 31 days
Third party trade receivables, net of allowances as of 30 September 2018 964 932 29 3
With respect to trade receivables that were not overdue and not impaired as of 30 September 2018, there were no indications that customers, based on their past credit history and current creditworthiness assessments, were not able to meet their obligations.
11 Inventories
Inventories as of 30 September 2019 and 2018 consisted of the following:
€ in millions 30 Septem-ber 2019
30 Septem-ber 2018
Raw materials and supplies 205 166
Work in progress 1,093 895
Finished goods and merchandise 403 419
Total 1,701 1,480
Cost of goods sold consisted mainly of inventory-related expenses in the 2019 and 2018 fiscal years.
As of 30 September 2019 and 2018, finished goods and merchandise contained an asset resulting from sales with a right of return of €7 million and €8 million, respectively.
Inventory write-downs as of 30 September 2019 and 2018 amounted to €198 million and €138 million, respectively.
12 Contract assets
In the 2019 fiscal year, contract assets increased by €2 million to €91 million (1 October 2018: €89 million). The increase results from an increase in contract assets relating to revenue recognized over time.
13 Other current assets
Other current assets at 30 September 2019 and 2018 consisted of the following:
€ in millions 2019 2018
Derivative financial instruments (see note 26) 215 3
VAT and other receivables from tax authorities 171 171
Prepaid expenses 92 57
Grants receivables 88 49
Other 204 86
Total 770 366
P see page 174 ff.
151Consolidated Financial Statements Notes to the Consolidated Financial Statements
INFINEON TECHNOLOGIES | ANNUAL REPORT 2019

14 Property, plant and equipment, goodwill and other intangible assets
A summary of changes in property, plant and equipment as well as in goodwill and other intangible assets for the years ended 30 September 2019 and 2018 is as follows:
Changes in property, plant and equipment and goodwill and other intangible assets 2019
€ in millions
Cost Depreciation/amortization and impairment Carrying amount
1 October 2018
Additions
Acquisitions through
business combi-
nations 1
Disposals
Reclassi- fication
Foreign currency
effects
30 Sep-tember
2019
1 October 2018
Depreciation/amortization
Disposals
Foreign currency
effects
30 Septem-ber 2019
30 Septem-ber 2019
30 Septem-ber 2018
Property, plant and equipment
Land, land rights and buildings 1,593 43 – (4) 23 5 1,660 (822) (63) 3 (3) (885) 775 771
Technical equipment and machinery 8,845 627 1 (118) 282 15 9,652 (7,069) (635) 114 (12) (7,602) 2,050 1,776
Other plant and office equipment 1,248 103 – (68) 24 4 1,311 (1,109) (106) 67 (3) (1,151) 160 139
Payments on account and construction in progress 352 502 – (1) (329) 1 525 – – – – – 525 352
Total property, plant and equipment 12,038 1,275 1 (191) – 25 13,148 (9,000) (804) 184 (18) (9,638) 3,510 3,038
Goodwill and other intangible assets
Goodwill acquired for consideration 764 – 95 – – 50 909 – – – – – 909 764
Capitalized development costs 769 125 – – – – 894 (294) (57) – – (351) 543 475
Customer relationships 396 – – (1) – 11 406 (229) (43) 1 (5) (276) 130 167
Technologies 288 – 35 – – 15 338 (151) (28) – (9) (188) 150 137
Licenses and similar rights 227 31 – (1) – 3 260 (180) (12) 1 (1) (192) 68 47
Other intangible assets 18 – – – – – 18 (12) (1) – – (13) 5 6
Total goodwill and other intangible assets 2,462 156 130 (2) – 79 2,825 (866) (141) 2 (15) (1,020) 1,805 1,596
1 For the year ended 30 September 2019, amounts shown under “Goodwill and other intangible assets” as “Acquisitions through business combinations” relate to assets acquired in connection with the acquisition of Siltectra.
Changes in property, plant and equipment and goodwill and other intangible assets 2018
€ in millions
Cost Depreciation/amortization and impairment Carrying amount
1 October 2017
Additions
Acquisitions through
business combi-
nations
Disposals
Reclassi- fication
Foreign currency
effects
30 Sep-tember
2018
1 October 2017
Depreciation/amortization
Disposals
Reclassi- fication
Impairments
Foreign currency
effects
30 Septem-ber 2018
30 Septem-ber 2018
30 Septem-ber 2017
Property, plant and equipment
Land, land rights and buildings 1,501 81 – (3) 14 – 1,593 (771) (60) 3 2 4 – (822) 771 730
Technical equipment and machinery 8,146 589 – (156) 266 – 8,845 (6,669) (540) 144 (6) – 2 (7,069) 1,776 1,477
Other plant and office equipment 1,227 65 – (95) 53 (2) 1,248 (1,107) (102) 95 4 – 1 (1,109) 139 120
Payments on account and construction in progress 332 355 – (2) (333) – 352 – – – – – – – 352 332
Total property, plant and equipment 11,206 1,090 – (256) – (2) 12,038 (8,547) (702) 242 – 4 3 (9,000) 3,038 2,659
Goodwill and other intangible assets
Goodwill acquired for consideration 759 – 18 (28) – 15 764 – – – – – – – 764 759
Capitalized development costs 643 143 – (17) – – 769 (247) (50) 14 – (11) – (294) 475 396
Customer relationships 392 – – – – 4 396 (179) (49) – – – (1) (229) 167 213
Technologies 275 – 8 – – 5 288 (109) (39) – – – (3) (151) 137 166
Licenses and similar rights 219 21 – (15) – 2 227 (174) (20) 15 – – (1) (180) 47 45
Other intangible assets 18 – – – – – 18 (11) (1) – – – – (12) 6 7
Total goodwill and other intangible assets 2,306 164 26 (60) – 26 2,462 (720) (159) 29 – (11) (5) (866) 1,596 1,586
152Consolidated Financial Statements Notes to the Consolidated Financial Statements
INFINEON TECHNOLOGIES | ANNUAL REPORT 2019

14 Property, plant and equipment, goodwill and other intangible assets
A summary of changes in property, plant and equipment as well as in goodwill and other intangible assets for the years ended 30 September 2019 and 2018 is as follows:
Changes in property, plant and equipment and goodwill and other intangible assets 2019
€ in millions
Cost Depreciation/amortization and impairment Carrying amount
1 October 2018
Additions
Acquisitions through
business combi-
nations 1
Disposals
Reclassi- fication
Foreign currency
effects
30 Sep-tember
2019
1 October 2018
Depreciation/amortization
Disposals
Foreign currency
effects
30 Septem-ber 2019
30 Septem-ber 2019
30 Septem-ber 2018
Property, plant and equipment
Land, land rights and buildings 1,593 43 – (4) 23 5 1,660 (822) (63) 3 (3) (885) 775 771
Technical equipment and machinery 8,845 627 1 (118) 282 15 9,652 (7,069) (635) 114 (12) (7,602) 2,050 1,776
Other plant and office equipment 1,248 103 – (68) 24 4 1,311 (1,109) (106) 67 (3) (1,151) 160 139
Payments on account and construction in progress 352 502 – (1) (329) 1 525 – – – – – 525 352
Total property, plant and equipment 12,038 1,275 1 (191) – 25 13,148 (9,000) (804) 184 (18) (9,638) 3,510 3,038
Goodwill and other intangible assets
Goodwill acquired for consideration 764 – 95 – – 50 909 – – – – – 909 764
Capitalized development costs 769 125 – – – – 894 (294) (57) – – (351) 543 475
Customer relationships 396 – – (1) – 11 406 (229) (43) 1 (5) (276) 130 167
Technologies 288 – 35 – – 15 338 (151) (28) – (9) (188) 150 137
Licenses and similar rights 227 31 – (1) – 3 260 (180) (12) 1 (1) (192) 68 47
Other intangible assets 18 – – – – – 18 (12) (1) – – (13) 5 6
Total goodwill and other intangible assets 2,462 156 130 (2) – 79 2,825 (866) (141) 2 (15) (1,020) 1,805 1,596
1 For the year ended 30 September 2019, amounts shown under “Goodwill and other intangible assets” as “Acquisitions through business combinations” relate to assets acquired in connection with the acquisition of Siltectra.
Changes in property, plant and equipment and goodwill and other intangible assets 2018
€ in millions
Cost Depreciation/amortization and impairment Carrying amount
1 October 2017
Additions
Acquisitions through
business combi-
nations
Disposals
Reclassi- fication
Foreign currency
effects
30 Sep-tember
2018
1 October 2017
Depreciation/amortization
Disposals
Reclassi- fication
Impairments
Foreign currency
effects
30 Septem-ber 2018
30 Septem-ber 2018
30 Septem-ber 2017
Property, plant and equipment
Land, land rights and buildings 1,501 81 – (3) 14 – 1,593 (771) (60) 3 2 4 – (822) 771 730
Technical equipment and machinery 8,146 589 – (156) 266 – 8,845 (6,669) (540) 144 (6) – 2 (7,069) 1,776 1,477
Other plant and office equipment 1,227 65 – (95) 53 (2) 1,248 (1,107) (102) 95 4 – 1 (1,109) 139 120
Payments on account and construction in progress 332 355 – (2) (333) – 352 – – – – – – – 352 332
Total property, plant and equipment 11,206 1,090 – (256) – (2) 12,038 (8,547) (702) 242 – 4 3 (9,000) 3,038 2,659
Goodwill and other intangible assets
Goodwill acquired for consideration 759 – 18 (28) – 15 764 – – – – – – – 764 759
Capitalized development costs 643 143 – (17) – – 769 (247) (50) 14 – (11) – (294) 475 396
Customer relationships 392 – – – – 4 396 (179) (49) – – – (1) (229) 167 213
Technologies 275 – 8 – – 5 288 (109) (39) – – – (3) (151) 137 166
Licenses and similar rights 219 21 – (15) – 2 227 (174) (20) 15 – – (1) (180) 47 45
Other intangible assets 18 – – – – – 18 (11) (1) – – – – (12) 6 7
Total goodwill and other intangible assets 2,306 164 26 (60) – 26 2,462 (720) (159) 29 – (11) (5) (866) 1,596 1,586
153Consolidated Financial Statements Notes to the Consolidated Financial Statements
INFINEON TECHNOLOGIES | ANNUAL REPORT 2019

Depreciation on property, plant and equipment is presented in the Consolidated Statement of Operations mainly in cost of goods sold. Amortization of intangible assets is mainly presented in cost of goods sold or selling, general and administrative expenses. Impairments on property, plant and equipment and intangible assets are reported under other operating expenses.
Property, plant and equipment of €186 million (30 September 2018: €200 million) served mainly as collateral for the existing financing arrangements of MoTo Objekt CAMPEON GmbH & Co. KG (“MoTo”) as of 30 September 2019.
Undiscounted future minimum lease payments to be received from operating lease arrangements for Infineon as lessor were as follows:
Payments due in (€ in millions) Total Less than 1 year
1 – 5 years 5 years and after
As of 30 September 2019 97 20 62 15
As of 30 September 2018 99 23 61 15
15 Debt
Debt as of 30 September 2019 and 2018 consisted of the following:
€ in millions 30 Septem-ber 2019
30 Septem-ber 2018
Current maturities of long-term debt, weighted average interest rate: 1.60% (2018: 1.65%) 22 25
Short-term debt and current maturities of long-term debt 22 25
Loans payable to banks:
Unsecured loans, weighted average interest rate 1.15% (2018: 0.95%), due 2020 – 2023 11 19
Secured term loans, weighted average interest rate 2.03% (2018: 2.03%), due 2020 – 2021 172 185
Bond €500 million, coupon 1.50%, due 2022 498 497
USPP notes US$935 million, weighted average interest rate 4.09%, due 2024 – 2028 853 806
Long-term debt 1,534 1,507
Total 1,556 1,532
In addition, financing was completed for the planned acquisition of Cypress (see note 3) with various national and international banks. It is unsecured and non-subordinated and comprised four tranches as of 30 September 2019:
› bridge facility of €5.1 billion with maturity of up to two years and nine months from the date of the loan commitment, and
› three tranches, each amounting to US$1.1 billion, with maturities of three, four and five years.
The tranches will be drawn upon completion of the acquisition. On 7 October 2019, the bridge facility was reduced to approximately €3.9 billion as a result of the issuance of a €1.2 billion hybrid bond (see note 29).
Infineon has established further independent financing arrangements in the form of short- and long-term credit facilities to finance its operating activities.
P see page 142
P see page 186
154Consolidated Financial Statements Notes to the Consolidated Financial Statements
INFINEON TECHNOLOGIES | ANNUAL REPORT 2019

The total lines of credit as of 30 September 2019 and 2018 are summarized in the following table:
€ in millions Term
30 September 2019 30 September 2018
Aggregate facility
Drawn Available Aggregate facility
Drawn Available
Short-term 102 22 80 97 25 72
Long-term 8,303 182 8,121 204 204 –
Total 8,405 204 8,201 301 229 72
As of 30 September 2019 this included the credit lines to finance the planned acquisition of Cypress for the first time.
Amounts of debt and interest maturing in the coming years were as follows:
€ in millions
30 September 2019 30 September 2018
Debt Interest Debt Interest
Less than 1 year 21 46 23 46
1 – 2 years 176 43 21 44
2 – 3 years 503 42 176 41
3 – 4 years 3 35 503 40
5 years and after 855 98 810 126
Total 1,558 264 1,533 297
16 Provisions
Short-term and long-term provisions as of 30 September 2019 consisted of the following:
€ in millions 1 October 2018
Addition Usage Reversal 30 Septem-ber 2019
Obligations to employees 374 300 (277) (23) 374
Warranties 42 7 (5) (18) 26
Provisions related to Qimonda (see notes 7 and 23) 185 26 (4) (2) 205
Other 35 42 (12) (4) 61
Total provisions 636 375 (298) (47) 666
thereof short-term 590 383
thereof long-term 46 283
Obligations to employees included, among others, costs of variable compensation, outstanding vacation and flextime, service anniversary awards, other personnel costs and social security costs.
Provisions for warranties mainly represented the estimated future cost of fulfilling contractual requirements associated with products sold.
Other provisions comprised provisions for litigations (other than those relating to Qimonda), asset retirement obligations, onerous contracts and miscellaneous other liabilities.
Of the total provisions as of 30 September 2019 and 2018, a cash outflow of €383 million and €590 million, respectively, was expected to occur within one year. For the long-term provisions a cash outflow was expected to occur after more than one year. Of these, €38 million and €31 million as of 30 September 2019 and 2018, respectively, were attributable to length-of-service related anniversary awards.
P see page 148 and page 166 ff.
155Consolidated Financial Statements Notes to the Consolidated Financial Statements
INFINEON TECHNOLOGIES | ANNUAL REPORT 2019

17 Other Current Liabilities
Other current liabilities as of 30 September 2019 and 2018 consisted of the following:
€ in millions 2019 2018
Payroll and similar obligations to employees 132 146
Other financial liabilities in connection with the planned acquisition of Cypress (see note 26) 112 –
Other 162 123
Total 406 269
18 Pension plans
Defined benefit pension plansInfineon’s employee benefit plans consist of domestic and foreign defined benefit and defined contribution pension plans providing retirement, disability and surviving dependents’ benefits. For Infineon, the significant benefit plans in Germany pertain to Infineon Technologies AG, and among the foreign benefit plans to Infineon Technologies Austria AG.
In Germany, Infineon primarily offers defined contribution benefits which provide for the employees when they reach retirement age, or in the event of disability or death. The statutory framework is provided by the Company Pension Act (in German: Betriebsrentengesetz or “BetrAVG”) and by employment law in general. With the Infineon pension plan new entrants receive a defined contribution benefit, which is funded by Infineon. Payments by the Infineon pension plan are generally made in twelve installments. For active employees who were entitled to benefits in form of an annuity before the Infineon Pension Plan came into force, this commitment was transferred into the Infineon Pension Plan and thereby the possibility of an annuity is guaranteed. Together with former employees, whose pension benefit obligations were not transferred into the Infineon Pension Plan, this group makes up the largest part of the obligation at this time. An appropriate provision is recorded for the German defined benefit pension plans, which are partly backed by plan assets. Individual agreements are in place for the members of the Management Board which are backed by plan assets (detailed in the chapter “Compensation report” in the Combined Management Report). The major portion of the plan assets is managed by a pension trust in the legal form of a registered association. This is composed of executives of Infineon Technologies AG and the investment strategy is defined by Infineon Technologies AG.
The benefit obligation of some foreign plans is measured according to the income in the last month or year of service, others are dependent on average income over the service period. Foreign pension plans are managed by country-specific external pension funds or other pension schemes. The liabilities arising from foreign defined bene-fit pension plans are partly covered by plan assets. The management of existing foreign plan assets is performed by the respective pension scheme.
The valuation date of both the German and foreign pension plans is 30 September.
The Group-defined benefit pension plans are exposed to risks arising from changes to actuarial assumptions such as interest rates, salary and pension trends, investment risks and longevity risks. A low discount rate leads to higher pension liabilities. Equally, a lower than expected growth in plan assets could lead to a deterioration of the funded status, or require the payment of additional contributions.
P see page 171 ff.
P see page 103 ff.
156Consolidated Financial Statements Notes to the Consolidated Financial Statements
INFINEON TECHNOLOGIES | ANNUAL REPORT 2019

The development of Infineon’s German (domestic) and non-German (foreign) pension plans and the plan assets as of 30 September 2019 and 2018 is presented in the following table:
€ in millions
2019 2018
Domestic plans
Foreign plans
Total Domestic plans
Foreign plans
Total
Change in defined benefit obligations taking into account future salary increases:
Present value at beginning of year (987) (167) (1,154) (876) (164) (1,040)
Current service cost (26) (4) (30) (23) (7) (30)
Past service income (cost) – 1 1 (3) – (3)
Interest cost (17) (5) (22) (15) (4) (19)
Actuarial gains (losses) for:
Experience adjustments (2) (1) (3) (13) (3) (16)
Adjustments to demographic assumptions – (1) (1) (6) 3 (3)
Adjustments to financial assumptions (200) (26) (226) (4) – (4)
Plan settlements – 3 3 – – –
Benefits paid by Infineon 19 6 25 15 7 22
Employee contributions (6) – (6) – – –
Reclassification of present value of defined benefit obligations1 – – – (62) – (62)
Foreign currency effects – (3) (3) – 1 1
Present value of defined benefit obligation at end of year (1,219) (197) (1,416) (987) (167) (1,154)
Change in fair value of plan assets:
Fair value of plan assets at beginning of year 534 68 602 474 63 537
Expected return on plan assets 10 2 12 7 3 10
Actuarial gains (losses) 52 11 63 (2) 1 (1)
Contributions from Infineon 17 6 23 14 8 22
Employee contributions 6 – 6 – – –
Benefits paid (19) (6) (25) (15) (7) (22)
Reclassification of fair value of plan assets1 – – – 56 – 56
Foreign currency effects – 2 2 – – –
Fair value of plan assets at end of year 600 83 683 534 68 602
Net pension liability (619) (114) (733) (453) (99) (552)
thereof: Infineon Technologies AG (572) – (572) (419) – (419)
thereof: Infineon Technologies Austria AG – (70) (70) – (56) (56)
1 In the previous reporting period, net obligations from deferred compensation plans amounting to €6 million were reclassified from other liabilities.
157Consolidated Financial Statements Notes to the Consolidated Financial Statements
INFINEON TECHNOLOGIES | ANNUAL REPORT 2019

Pension obligations are reported in the Consolidated Statement of Financial Position under “Pension plans and similar commitments”.
Since no asset ceilings applied, the funded status of the Infineon pension plans corresponded to the amounts reported in the Consolidated Statement of Financial Position as of 30 September 2019 and 2018.
The funding of the defined benefit obligations as of 30 September 2019 and 2018 was as follows:
€ in millions
30 September 2019 30 September 2018
Domestic plans
Foreign plans
Total Domestic plans
Foreign plans
Total
Plans that are wholly unfunded 13 100 113 14 87 101
Plans that are wholly or partly funded 1,206 97 1,303 973 80 1,053
Total 1,219 197 1,416 987 167 1,154
Actuarial assumptionsThe weighted-average assumptions used in calculating the actuarial values for the pension plans were as follows:
in %
30 September 2019 30 September 2018
Domestic plans
Foreign plans
Domestic plans
Foreign plans
Discount rate at the end of the fiscal year 0.6 2.0 1.7 2.8
Rate of salary increase 2.0 2.3 2.0 2.1
Projected future pension increases 1.8 2.0 1.8 2.0
Discount rates were derived from high-grade fixed interest corporate bonds from issuers carrying a very high credit rating.
The 2018 G mortality tables by Dr. Klaus Heubeck were used for Germany, and for Austria the AVÖ 2018-P tables were applied.
Sensitivity analysisThe following sensitivity analysis table shows how the present value of all defined benefit pension obligations would be affected by changes in the aforementioned actuarial assumptions. In each case, they reflect the effect of changes in one actuarial assumption while all other assumptions remain constant.
€ in millions
30 September 2019 30 September 2018
Domestic plans
Foreign plans
Total Domestic plans
Foreign plans
Total
Present value of defined benefit pension plans with:
a 50 basis points higher discount rate 1,127 185 1,312 909 156 1,065
a 50 basis points lower discount rate 1,322 214 1,536 1,073 180 1,253
a 50 basis points higher expected rate of salary increase 1,232 204 1,436 998 172 1,170
a 50 basis points lower expected rate of salary increase 1,205 194 1,399 976 163 1,139
a 50 basis points higher expected rate of pension increase 1,240 204 1,444 1,005 172 1,177
a 50 basis points lower expected rate of pension increase 1,200 194 1,394 972 163 1,135
Increase in life expectancy by one year 1,250 203 1,453 1,013 171 1,184
158Consolidated Financial Statements Notes to the Consolidated Financial Statements
INFINEON TECHNOLOGIES | ANNUAL REPORT 2019

Investment strategyThe pension plans’ assets are invested with several fund managers. The investment guidelines require a mix of active and passive investment management programs covering different asset classes. Taking the duration of the underlying liabilities into account, a portfolio of investments of plan assets in equity, debt and other securities as well as real estate and reinsurance policies is targeted to maximize the total long-term return on assets for a given level of risk. Investment risk is monitored on an ongoing basis through periodic portfolio reviews, by coordination with investment managers and annual liability measurements. Investment policies and strategies are periodically reviewed as part of detailed studies of assets and liabilities by independent investment advisors and actuaries to ensure the objectives of the plans are met, taking into account any changes in benefit plan structure, market condi-tions or other material items. The aim is to optimize the risk-return profile of plan assets against the liabilities, using a diversified portfolio of investments within a defined risk budget and to thereby increase the funding ratio in the long term.
Plan asset allocationAs of 30 September 2019 and 2018 the allocation of invested plan assets to the major asset categories was as follows:
€ in millions
30 September 2019 30 September 2018
Quoted in an active
market
Not quoted in an active
market
Quoted in an active
market
Not quoted in an active
market
Government bonds 170 12 157 –
Corporate bonds 141 13 172 2
Equity securities 209 – 169 –
Cash and cash equivalents 12 2 7 2
Reinsurance policies – 35 1 34
Property 6 30 11 7
Other 28 25 21 19
Total 566 117 538 64
Government and corporate bonds are traded in liquid markets and the majority of them have an investment grade rating. The geographical allocation of the equity component of plan assets is predominantly based on the MSCI World Index. As a matter of policy Infineon’s pension plans do not invest in shares or debt instruments of Infineon. The position “Other” in the table above comprises exchange-traded commodities (ETC) and other investment funds.
The market value of the land and real estate leased to Group companies by the legally independent pension trust amounted to €30 million and €7 million respectively as of 30 September 2019 and 2018.
The actual return on plan assets in the fiscal year ended 30 September 2019 was €74 million (30 September 2018: €7 million).
159Consolidated Financial Statements Notes to the Consolidated Financial Statements
INFINEON TECHNOLOGIES | ANNUAL REPORT 2019

Amounts recognized in the Consolidated Statement of Operations and in the Consolidated Statement of Comprehensive IncomeThe expenses and income of defined benefit plans for the 2019 and 2018 fiscal years comprised the following:
€ in millions
2019 2018
Domestic plans
Foreign plans
Total Domestic plans
Foreign plans
Total
Current service cost (26) (4) (30) (23) (7) (30)
Past service (cost) benefit – 1 1 (3) – (3)
Interest cost (17) (5) (22) (15) (4) (19)
Expected return on plan assets 10 2 12 7 3 10
Curtailment gain recognized – 3 3 – – –
Pension cost (33) (3) (36) (34) (8) (42)
Service costs are recorded within cost of goods sold to the extent that they relate to production employees, otherwise they are recorded as research and development or selling, general and administrative expenses. Interest costs and expected return on plan assets were recorded net as part of financial expense.
Actuarial losses before taxes of €167 million and €28 million for the fiscal year have 2019 and 2018 had been recognized outside profit and loss in other comprehensive income.
As of 30 September 2019 and 2018, cumulative actuarial losses amounted to €567 million and €400 million, respectively. In addition, cumulative actuarial losses amounting to €2 million resulting from health care plans were also recognized directly in other comprehensive income.
In the 2020 fiscal year, payments of €29 million are expected to be made to plan assets which relate to benefits paid directly to pension recipients by the Group companies.
The weighted average duration of defined benefit plans was around 17 years as of 30 September 2019 and 2018, respectively.
The following table shows the expected disbursements for defined benefit plans for the next ten fiscal years as of 30 September 2019 and 2018:
€ in millions 30 Septem-ber 2019
30 Septem-ber 2018
Less than 1 year 32 32
1 – 2 years 33 28
2 – 5 years 119 102
5 – 10 years 275 269
Total 459 431
Defined contribution plansIn connection with defined contribution plans, fixed contributions are made to external insurance providers or funds. Infineon has no further performance obligations or risks with regard to these pension plans in excess of the fixed contributions paid. Additionally, the Group makes contributions to government pension schemes. Expenses for defined contribution plans amounted to €203 million and €183 million in the fiscal years ended 30 Septem-ber 2019 and 2018, respectively.
160Consolidated Financial Statements Notes to the Consolidated Financial Statements
INFINEON TECHNOLOGIES | ANNUAL REPORT 2019

19 Equity
Ordinary share capitalThe ordinary share capital of Infineon Technologies AG increased during the 2019 fiscal year by €227,376,474. Firstly, the Management Board, with the approval of the Supervisory Board, decided on 17 June 2019 to increase its capital against cash contributions, taking advantage partly of the authorized capital. The capital increase was entered in the Commercial Register on 18 June 2019 and was thus effective. The share capital of the Company was thereby increased with the exclusion of the subscription rights of the existing shareholders by issuing 112,773,923 new registered no par value shares in return for cash consideration as part of an accelerated bookbuilding process. The shares were allocated at a placement price of €13.70 per share, and resulted in gross issue proceeds of €1,545 million. They are eligible to a share of profits from 1 October 2018 on. Secondly, 914,314 new shares were issued (2018: 794,905) as a result of the exercise of stock options by employees. As of 30 September 2019, the ordinary share capital stood at €2,501,368,142 divided into 1,250,684,071 no par value registered shares, each representing €2 of the Company’s ordinary share capital and is fully paid in. Each share grants the holder one vote and an equal portion of the profits in the form of a dividend as resolved by the Annual General Meeting. As of 30 September 2019, of the above-men-tioned total number of issued shares, the Company held 6 million own shares (30 September 2018: 6 million). Own shares held by the Company as of the date of the Annual General Meeting carry no voting rights and are not entitled to dividend.
Additional paid-in capitalAdditional paid-in capital reported in the Consolidated Statement of Financial Position increased by €1,008 million in the 2019 fiscal year. Based on gross issue proceeds of €1,545 million from the issue of 112,773,923 new shares on 18 June 2019 as described above, less €226 million not related to the ordinary share capital, and less €20 million directly attributable third party costs (net after tax) incurred in connection with the capital increase, an amount of €1,299 million was recognized as an increase in additional paid-in capital. As a result of employee exercise of stock options, additional paid-in capital increased by a further €4 million. The pro rata costs for share-based compensation led to an increase in additional paid-in capital of €10 million in the 2019 fiscal year. The dividend of €305 million paid in February 2019 (see “Retained earnings/accumulated deficit”) reduced additional paid-in capital.
Additional paid-in capital reported in the Consolidated Statement of Financial Position decreased by €288 million in the 2018 fiscal year, of which €283 million related to the dividend paid in February 2018. The exercise of stock options by employees increased additional paid-in capital by €4 million. Pro rata expenses for share-based com-pensation led to an increase in additional paid-in capital of €11 million in the 2018 fiscal year. In addition, negative €20 million (net after tax) was recorded in additional paid-in capital in the 2018 fiscal year mainly in connection with the settlement of the 2015 fiscal year tranche of the Performance Share Plan. The Management Board and the Supervisory Board decided to settle the tranche in cash for the 2015 fiscal year. This amount has been reclassified to other current liabilities.
Authorized share capitalAs of 30 September 2019, the Company’s Articles of Associations provided for two authorized share capitals amounting to up to €480,452,154:
› Section 4, paragraph 4, of the Articles of Association provides that the Management Board is authorized, with the approval of the Supervisory Board, to increase the share capital in the period until its expiry on 11 February 2020 once or in partial amounts by a total of up to €450,452,154 through the issue of new no par value registered shares, carrying a dividend right from the beginning of the fiscal year in which they are issued, against contributions in cash or in kind (Authorized Capital 2015/I). As a result, the originally authorized capital 2015/I, of €676,000,000 was reduced to €450,452,154, following the capital increase of €225,547,846 as decided by the Management Board and the Supervisory Board on 17 June 2019 and entered in the Commercial Register on 18 June 2019. Within the framework of the Authorized Capital 2015/I, the Management Board is authorized, with the approval of the
P see page 163
161Consolidated Financial Statements Notes to the Consolidated Financial Statements
INFINEON TECHNOLOGIES | ANNUAL REPORT 2019

Supervisory Board, to exclude the subscription rights of the shareholders in certain cases. In accordance with German law, cash capital increases with subscription rights excluded pursuant to section 186, paragraph 3, sen-tence 4, of the AktG, are not permitted to exceed 10 percent of a company’s share capital – either at the time of the authorization becoming effective or at the time of its exercise. The capital increase of 17/18 June 2019 utilized this framework. For share capital increases against contributions in kind or a combination of cash contributions and contributions in kind, the authorization further provides an upper limit of 20 percent of the share capital, again measured either at the time the authorization becomes effective or, if the value is lower, at the time of its exercise.
› Section 4, paragraph 7, of the Articles of Association provides that the Management Board is authorized, with the approval of the Supervisory Board, to increase the share capital in the period up to 17 February 2021 – either once or in partial amounts – by a total of up to €30,000,000 by issuing new no par value registered shares against contributions in cash for the purpose of increasing the issue to employees of the Company or its Group companies (Authorized Capital 2016/I). The subscription rights of the shareholders are excluded in relation to these shares. The shares may be issued in such a manner that the contribution to be paid on such shares is covered by the portion of the profit for the year that the Management Board and Supervisory Board could transfer to retained earnings in accordance with section 58, paragraph 2, AktG.
Conditional capitalAs of 30 September 2019, the Company’s Articles of Associations provided for two conditional capitals amounting to up to €266,265,388:
› Pursuant to section 4, paragraph 5, of the Articles of Association the share capital is conditionally increased by up to a nominal €6,265,388 through the issue of up to 3,132,694 new no par value registered shares in connection with the Company’s “Infineon Technologies AG Aktienoptionsplan 2010” (“Stock Option Plan 2010”) (see note 21) (Conditional Capital 2010/I). During the 2019 fiscal year, a total of 914,314 new no par value shares with a propor-tionate amount of share capital of €2 per share were issued out of the Conditional Capital 2010/I as a result of the exercise of share options in connection with the Stock Option Plan 2010. Conditional Capital 2010/I decreased accordingly by €1,828,628 to €4,436,760. The corresponding change to the Articles of Association was submitted after the end of the reporting period and entered into the Commercial Register as requested.
› Pursuant to section 4, paragraph 6, of the Articles of Association the share capital is conditionally increased by up to €260,000,000 through the issue of up to 130,000,000 new no par value registered shares to satisfy the rights of the holders of warrants or convertible bonds, which the Company may issue at any time prior to 21 February 2023 (Conditional Capital 2018).
Other reservesChanges in other reserves during the 2019 and 2018 fiscal years were as follows:
€ in millions 2019 2018
Pretax Tax Net after tax Pretax Tax Net after tax
Foreign currency translation differences 85 – 85 27 – 27
Unrealized gains (losses) resulting from hedge accounting 1 146 9 155 (4) 2 (2)
Cost of hedging 1 (42) – (42) – – –
Total 189 9 198 23 2 25
1 Of the unrealized gains (losses) resulting from hedging transactions in the 2019 fiscal year, €140 million of pre-tax gains are attributable to the Deal Contingent Forward and Deal Contingent Option hedging of the purchase price obligation concluded for the planned acquisition of Cypress. The cost of hedging is related to the Deal Contingent Forward and the Deal Contingent Option (see “Derivative financial instruments and hedging activities” in note 26).
P see page 165
P see page 175 ff.
162Consolidated Financial Statements Notes to the Consolidated Financial Statements
INFINEON TECHNOLOGIES | ANNUAL REPORT 2019

Retained earnings/accumulated deficitThe following table shows a reconciliation of retained earnings (2018: accumulated deficit) as of 30 September 2019 and 2018:
€ in millions
As of 1 October 2017 (1,404)
Net income attributable to shareholders of Infineon Technologies AG 1,075
Actuarial losses on pension plans and similar commitments net of tax of €25 million (4)
As of 30 September 2018 (333)
Effect from first adoption of IFRS 9 and IFRS 15 37
As of 1 October 2018 (296)
Net income attributable to shareholders of Infineon Technologies AG 870
Actuarial gains on pension plans and similar commitments net of tax of €16 million (153)
As of 30 September 2019 421
The distribution for the 2018 fiscal year was made from additional paid-in capital in line with previous years, as there was a loss carry-forward as of 30 September 2018. From the 2020 fiscal year, the distribution will be made from retained earnings provided that, at the end of the fiscal year, it covers the distribution in the following year.
DividendsFor the 2018 fiscal year, a cash dividend of €0.27 per share (total amount: €305 million) was paid. For the 2017 fiscal year, a cash dividend of €0.25 per share (total amount: €283 million) was paid.
With regard to the 2019 fiscal year, a dividend of €0.27 for each share entitled to a dividend shall be proposed to be paid from the €338 million of distributable profits of Infineon Technologies AG. This would result in an expected distribution of approximately €336 million. The payment of this dividend depends on the approval of the Annual General Meeting on 20 February 2020.
20 Capital management
Infineon’s main capital management objective is to ensure financial flexibility on the basis of a solid capital structure. As with comparable companies in the semiconductor industry, it is of prime importance that sufficient cash funds are available to finance operating activities and planned investments throughout all phases of the business cycle. On the other hand, debt should only constitute a modest portion of the financing mix.
Based on these principles and the clear intention to retain its investment grade rating, Infineon has derived conser-vative medium- and long-term key objectives for the capital management. These will remain in place over the course of the planned acquisition of Cypress (see note 3), and the financing required for this purpose. Infineon plans to maintain a liquidity level (gross cash position) of €1 billion plus additionally 10 to 20 percent of revenue. The lower range of this liquidity target should be maintained, even with the planned acquisition of Cypress. This was taken into account when devising the financing structure. Infineon’s gross financial debt is capped at a maximum of twice the earnings before interest, taxes, depreciation and amortization (EBITDA). As a result of the planned acquisition of Cypress, Infineon will exceed its gross debt target, but only to an extent that is still compatible with maintaining the investment grade rating. Infineon’s medium-term goal after the planned acquisition is a consistent reduction in debt to or below the maximum target level in line with its capital structure target.
Infineon is not subject to any statutory capital requirements, nor are any such defined in the Articles of Association.
Capital management as well as the corresponding targets and definitions are based on indicators determined on the basis of the consolidated IFRS financial statements. Gross cash is defined as the total of cash, cash equivalents and financial investments. Infineon defines EBIT as earnings (loss) from continuing operations before interest and taxes and EBITDA as EBIT plus scheduled depreciation and amortization.
P see page 142
163Consolidated Financial Statements Notes to the Consolidated Financial Statements
INFINEON TECHNOLOGIES | ANNUAL REPORT 2019

The gross cash position increased from €2,543 million as of 30 September 2018 to €3,779 million as of 30 September 2019 (for details see the chapter “Review of liquidity” in the Combined Management Report). Based on revenue of €8,029 million, the ratio of gross cash to revenue was €1 billion plus 34.6 percent of revenue as of 30 September 2019, well above the target range, however it should be noted that this includes the capital increase with net proceeds of €1,524 million (see note 19) which was conducted in June 2019 to finance the planned acquisition of Cypress. In the previous year, the ratio of gross cash to revenue was €1 billion plus 20.3 percent of revenue.
With gross debt of €1,556 million as of 30 September 2019 (30 September 2018: €1,532 million) and EBITDA of €2,064 million for the 2019 fiscal year (2018: €2,317 million), gross debt to EBITDA ratio was 0.8 as of 30 September 2019 (30 September 2018: 0.7). Infineon continues to have sufficient financial flexibility to ensure that in addition to financing its planned investments it is also able to pay regular dividends (see note 19).
The USPP notes totaling US$935 million issued in April 2016 contain a number of standard covenants, including change of control clauses as well as the compliance with a debt coverage ratio, which provides for a certain relation-ship between the size of debt (adjusted) and earnings (adjusted). The financial liabilities, which were taken over in connection with the acquisition of MoTo, also contain three standard covenants based on certain financial ratios (equity ratio, debt ratio and liquidity ratio).
In the 2019 fiscal year, Infineon was significantly above the minimum requirements of all covenants. Should Infineon not comply with the covenants attached to the USPP notes, then all USPP notes outstanding as of 30 September 2019 amounting to US$935 million (see note 15) could become immediately repayable. Failure to comply with the covenants of financial liabilities acquired in connection with the acquisition of MoTo would only result in additional annual fees, but not in a repayment obligation.
21 Share-based compensation
The Company makes use of the Stock Option Plan 2010, the Performance Share Plan from the 2014 fiscal year, and the Restricted Stock Unit Plan from the 2017 fiscal year, in order to provide share-based compensation.
Performance share planA new Long Term Incentive Plan (LTI) consisting of a “performance share” plan was developed for the Management Board and selected senior executives as a successor to the Stock Option Plan 2010.
Under this plan, (virtual) performance shares are initially provisionally granted on 1 March (up to the 2017 fiscal year: on 1 October) of the fiscal year according to a pre-determined LTI grant amount in euro. With the granting of a virtual performance share, the participant in the plan acquires the right to receive (real) Infineon shares once a personal investment in Infineon shares – depending on position and LTI grant amount – has reached a four-year holding period.
50 percent of the performance shares are performance-related, 50 percent are not dependent on performance. The performance-related shares are only finally granted if the Infineon share outperforms the Philadelphia Semi-conductor Index (SOX) during the period between the date of the provisional allocation and the end of the holding period. If at the end of the holding period the requirements for an allocation of performance shares – either all or only those that are not performance related – are fulfilled, then the entitlement to the transfer of the corresponding number of (real) Infineon shares is acquired. The value of the performance shares ultimately assigned to members of the Management Board may not exceed 250 percent of the respective LTI grant amount; above this cap perfor-mance shares are forfeited.
The fair value of the performance shares at the date of allocation was determined by an external expert using a recognized financial-mathematical method (Monte Carlo simulation model for the prediction of share price and index developments). The fair value of the instruments granted is determined taking into account future dividends as well as the payment cap.
P see page 77
P see page 161
P see page 163
P see page 154
164Consolidated Financial Statements Notes to the Consolidated Financial Statements
INFINEON TECHNOLOGIES | ANNUAL REPORT 2019

The following is an overview of the allocations made:
Tranche
End of the waiting period
Average share price of the nine months
before grant in €
Number of performance shares outstanding as of
30 September 2019
Fair value per performance share
in €
Fiscal year 2019: Employees 28 February 2023 20.02 777,560 14.20
Fiscal year 2019: Management Board 28 February 2023 20.02 44,954 13.79
Fiscal year 2018: Employees 28 February 2022 21.48 678,898 15.76
Fiscal year 2018: Management Board 28 February 2022 21.48 41,896 15.25
Fiscal year 2017: Employees 30 September 2020 13.01 886,634 11.86
Fiscal year 2017: Management Board 30 September 2020 13.01 61,874 11.25
Fiscal year 2016: Employees 30 September 2019 10.56 1,078,852 7.26
Fiscal year 2016: Management Board 30 September 2019 10.56 57,764 7.07
The tranche due in October 2019 for the 2016 fiscal year was settled with shares. As the planned performance target was not reached as of 30 September 2019, only 50 percent of the tranche was to be settled (non-performance shares). In October 2019, 568,308 Infineon shares were issued to eligible directors and employees from the holding of own shares.
Stock Option Plan 2010There were 0.3 million and 1.2 million stock options with an average exercise price of €7.00 per option outstanding as of 30 September 2019 and 2018, respectively. Of these, 0.3 million and 1.2 million were exercisable as of 30 Sep-tember 2019 and 2018, respectively.
Restricted Stock Unit PlanIn the 2017 fiscal year, Infineon introduced the Restricted Stock Unit Plan (RSUP), addressing Infineon US-employees and based on local market conditions. Restricted stock units are measured at the respective fair value at their grant dates. As of 30 September 2019, restricted stock units of €0.5 million (30 September 2018: €0.4 million) with fair values between €18.32 and €21.28 depending on the tranche were outstanding.
Costs for share-based compensationThe costs for share-based compensation amounted to €11 million in the 2019 fiscal year (2018: €13 million).
22 Other financial commitments
In addition to provisions and liabilities, there were other financial commitments which were not recognized in the Consolidated Statement of Financial Position, relating in particular to lease arrangements and unconditional purchase commitments. These are explained in more detail below.
Undiscounted future minimum lease payments arising from operating lease arrangements to be made by Infineon as lessee were the following:
Payments due in (€ in millions) Total Less than 1 year
1 – 5 years 5 years and after
As of 30 September 2019 250 54 121 75
As of 30 September 2018 258 68 130 60
Rental expenses under operating lease arrangements amounted to €68 million and €59 million in the 2019 and 2018 fiscal years, respectively, and related mainly to minimum lease payments made.
Contracts already entered into for commenced or planned investments in property, plant and equipment (purchase commitments) as of 30 September 2019 amounted to €660 million (30 September 2018: €557 million).
165Consolidated Financial Statements Notes to the Consolidated Financial Statements
INFINEON TECHNOLOGIES | ANNUAL REPORT 2019

In the course of its investing activities, Infineon also receives government grants related to the construction and financing of certain of its production facilities. Grants are also received for selected research and development proj-ects. Certain of these grants have been received contingent upon Infineon complying with certain project-related requirements, such as creating a specified number of jobs over a defined period of time. From today’s perspective, Infineon expects to comply with these requirements. Nevertheless, should such requirements not be met, as of 30 September 2019, a maximum of €163 million (30 September 2018: €145 million) of subsidies already received could be refundable.
Infineon, through certain sales and other agreements may, in the normal course of business, be obligated to indemnify its counterparties under certain conditions for warranties, patent infringement or other matters. The maximum amount of potential future payments under these types of agreements is not predictable with any degree of certainty, since the potential obligations are contingent on events that may or may not occur in the future, and depend on certain facts and circumstances specific to each agreement. Historically, payments made by Infineon under these types of agreements have not had a material adverse effect on Infineon’s financial condition, liquidity position and results of operations.
As part of an audit finding relating to the tax treatment of losses from the repurchase of convertible bonds in the 2011 and 2012 fiscal years, as of 30 September 2019, there was a contingent liability of €55 million for withholding tax payables (30 September 2018: €55 million). Suspension of enforcement has been granted under the current appeal procedure. Infineon expects that there is sufficient likelihood of winning any potential appeal or legal action.
23 Legal risks
Litigation and government inquiriesSmart card chips antitrust litigationIn October 2008, the EU Commission initiated an investigation into the Company and other manufacturers of chips for smart cards for alleged violations of antitrust laws. In September 2014, the EU Commission imposed a fine of €83 million on Infineon. Infineon brought an action against the decision before the General Court of the European Union in November 2014. The Court dismissed Infineon’s action and in February 2017 Infineon filed an appeal to the European Court of Justice against this decision. On 26 September 2018 the European Court of Justice referred the case back to the court of first instance in order to re-review the proportionality of the fine.
Two class actions for damages of an unspecified amount in connection with the EU Commission investigative proceedings have been filed in Canada: The first action was filed in the state of British Columbia in July 2013, and the second in the state of Quebec in September 2014. The actions followed the press reports on the investigation and subsequent decision of the EU Commission. No dates have been set for court proceedings.
In July 2019, a direct customer filed a lawsuit against Infineon Technologies UK Limited and several Renesas entities in London (United Kingdom) relating to the aforementioned EU antitrust case. The Company received service of claim in this regard in August 2019.
Any further statements about these matters by the Company could seriously compromise the Company’s position in these proceedings.
Proceedings in relation to QimondaAll significant assets, liabilities and business activities attributable to the memory business (Memory Products) were carved out from Infineon and transferred to Qimonda in the form of a contribution in kind with economic effect from 1 May 2006. Qimonda filed an application at the Munich Local Court to commence insolvency proceedings on 23 January 2009. On 1 April 2009, the insolvency proceedings formally opened. The insolvency of Qimonda has given rise to various disputes between the insolvency administrator and Infineon.
166Consolidated Financial Statements Notes to the Consolidated Financial Statements
INFINEON TECHNOLOGIES | ANNUAL REPORT 2019

Alleged activation of a shell company and liability for impairment of capitalThe insolvency administrator filed a request for declaratory judgment in an unspecified amount against Infineon Technologies AG and, by way of third party notice, Infineon Technologies Holding B.V. and Infineon Technologies Investment B.V., at Regional Court Munich I in November 2010. This requested that Infineon be deemed liable to make good the deficit balance of Qimonda as it stood when the insolvency proceedings in respect of the assets of Qimonda began, i.e., to refund to Qimonda the difference between the latter’s actual business assets when the insolvency proceedings began and its share capital (in German: “Unterbilanzhaftung”). The insolvency administra-tor contended that the commencement of operating activities by Qimonda amounted to what is considered in case law to be the activation of a shell company (in German: “Wirtschaftliche Neugründung”), and that this activation of a shell company was not disclosed in the correct manner. On 6 March 2012, with respect to another matter, the German Federal High Court issued a ruling on principle that any liability resulting from the activation of a shell company only depends on the situation at the date of the activation of a shell company and not, as asserted by the insolvency administrator, on the situation at the date on which insolvency proceedings are opened.
In addition to the request for declaratory judgment against Infineon in an unspecified amount, on 14 February 2012 the insolvency administrator also lodged a request for payment based on an alternative claim (in German: “Hilfsantrag”), as well as making other additional claims. In conjunction with this alternative claim, the insolvency administrator has requested the payment of at least €1.71 billion plus interest in connection with the alleged activation of a shell company. On 15 June 2012, the insolvency administrator increased his request for the payment of 14 February 2012 on the grounds of activation of a shell company to at least approximately €3.35 billion plus interest. Furthermore, the insolvency administrator continues to base a substantial part of his alleged payment claims, as already asserted out of court against Infineon in August 2011 for an unspecified amount, on liability for impairment of capital (in German “Differenzhaftung”). This claim is based on the allegation that, from the very beginning, the carved-out memory products business had a negative billion euro value. The insolvency adminis-trator therefore asserts that Infineon is obliged to make good the difference between this negative value and the lowest issue price (in German: “geringster Ausgabebetrag”) of the subscribed stock. Additionally, the insolvency administrator has asserted a claim for repayment of allegedly unjustly charged consultancy fees in an amount of €10 million in connection with the flotation of Qimonda.
The alleged impairment of capital runs contrary to two valuations prepared as part of the preparatory documentation for the capital increase by independent auditing companies, one of which had been engaged by Infineon and the other of which was acting in the capacity of a court-appointed auditor of contributions in kind and post-formation acquisitions. The auditing company engaged by Infineon concluded in its valuation that the business area contri-buted had a value of several times the lowest issue price of the shares issued, while the court-appointed auditor of contributions in kind and post-formation acquisitions confirmed to the court that the lowest issue price of the shares issued was covered – as legally required – by the value of the contributions in kind. Additionally, in the course of its defense against the claims asserted by the insolvency administrator, Infineon has commissioned several expert opinions, all of which arrived at the same conclusion that the objections raised by the insolvency administrator against the valuation of the contribution in kind are not valid.
The legal dispute has, in the meantime, focused on the claims asserted for alleged lack of value. On 29 August 2013, the court appointed an independent expert to clarify the valuation issues raised by the insolvency administrator and to address technical matters.
The legal dispute is being pursued with great effort by both parties, and many extensive written submissions have already been exchanged between the parties. Both sides have engaged numerous specialists and experts who are supporting the respective parties with assessments and opinions.
On 21 September 2018, in consultation with the parties, the independent expert appointed by the court presented an interim report on his preliminary assessment of the value of the contribution in kind. The Company is in principle prepared to conduct discussions about an out of court settlement of the legal dispute on the basis of the interim report.
The parties are exchanging further written submissions. It is not clear at this stage if the legal dispute can be resolved with an out of court settlement, and, if this is not the case, when a first-instance court decision would be reached.
167Consolidated Financial Statements Notes to the Consolidated Financial Statements
INFINEON TECHNOLOGIES | ANNUAL REPORT 2019

Residual liability of Infineon as former shareholder of Qimonda Dresden GmbH & Co. OHG Infineon was a shareholder with personal liability of Qimonda Dresden until the carve-out of the memory business; as a result certain long-standing creditors have residual liability claims against Infineon. These claims can only be exercised by the insolvency administrator acting in the name of the creditors concerned. In the meantime, settlements have been concluded with most of the major liability creditors.
Liabilities, provisions and contingent liabilities relating to QimondaInfineon recognizes provisions and liabilities for such obligations and risks, which it assesses at the end of each reporting period, are more likely than not to be incurred (that is where, from Infineon’s perspective at the end of each reporting period, the probability of having to settle an obligation or risk is greater than the probability of not having to) and the obligation or risk can be estimated with reasonable accuracy at this time.
As described above, Infineon faces certain risks in connection with the insolvency proceedings relating to the assets of Qimonda and that entity’s subsidiaries. In consideration of the interim report from the court-appointed expert, Infineon recorded provisions relating to Qimonda of €205 million in total as of 30 September 2019. This comprises mainly provisions for the still pending legal dispute over the alleged activation of a shell company and liability for impairment of capital including legal costs. As of 30 September 2018, provisions relating to Qimonda amounted to €185 million.
There can be no certainty that the provisions recorded for Qimonda will be sufficient to cover all of the liabilities that could ultimately be incurred in relation to the insolvency of Qimonda and, in particular, the matters discussed above. In addition, it is possible that liabilities and risks materialize that are currently considered to be unlikely to do so, and accordingly represent contingent liabilities that are not included in provisions. Should the alleged claims relating to the activation of a shell company and liability for impairment of capital prove to be valid, substantial financial obligations above the provisions already recorded could arise for Infineon, which could have a material adverse effect on its business and its financial condition, liquidity position and results of operations.
OtherInfineon is also involved in various other legal disputes and proceedings in connection with its existing or previous business activities. These can relate, in particular, to products, services, patents, export control and environmental issues and other matters.
Based on its current knowledge, Infineon does not believe that the ultimate resolution of these other pending legal disputes and proceedings will have a material adverse effect on Infineon’s financial condition, liquidity position and results of operations. However, future revisions to this assessment cannot be ruled out and any reassessment of the miscellaneous legal disputes and proceedings could have a material adverse effect on the financial condition, liquidity position and results of operations, particularly in the period in which reassessment is made.
Furthermore, in connection with its existing or previous business operations, Infineon is also exposed to numerous legal risks which have until now not resulted in legal disputes. These include risks related to product liability, environment, capital market, anti-corruption, competition and antitrust legislation as well as export control and other compliance regulations. Claims could also be made against Infineon in connection with these matters in the event of breaches of law committed by individual employees or third parties.
Provisions and contingent liabilities for legal proceedings and other uncertain legal issuesProvisions relating to legal proceedings and other uncertain legal issues are recorded when it is probable that a liability has been incurred and the associated amount can be reasonably estimated. To the extent that liabilities arising from legal disputes and other uncertain legal positions are not probable or cannot be reliably estimated, then they qualify as contingent liabilities.
168Consolidated Financial Statements Notes to the Consolidated Financial Statements
INFINEON TECHNOLOGIES | ANNUAL REPORT 2019

Any potential liability is reviewed again as soon as additional information becomes available and the estimates are revised if necessary. Provisions with respect to these matters are subject to future developments or changes in circumstances in each of the matters, which could have a material adverse effect on Infineon’s financial condition, liquidity position and results of operations.
A settlement or adverse judicial decision in any of the matters described above could result in significant financial liabilities for Infineon and other adverse effects, and these in turn could have a material adverse effect on its business and financial condition, liquidity position and results of operations. Irrespective of the validity of the allegations and the success of the aforementioned claims and other matters described above, Infineon could incur significant costs in the defense of these matters.
24 Transactions with related companies and persons
Infineon has transactions in the normal course of business with joint ventures and other related companies (collectively, “related companies”). The related companies are disclosed in note 30. Related persons are persons in key management positions in particular members of the Management and Supervisory Board (see note 30) and their close relatives (collectively “related persons”).
Related companiesInfineon purchases certain raw materials and services from and sells certain products and services to related companies. These purchases from and sales to related companies are generally effected at arm’s length.
Related companies receivables and payables as of 30 September 2019 and 2018 consisted of the following:
€ in millions
30 September 2019 30 September 2018
Joint ventures
Other related companies
Joint ventures
Other related companies
Trade and other receivables 5 – 7 –
Financial receivables 32 1 18 1
Trade and other payables 10 1 10 1
Financial payables – – – 1
Sales and service charges to and products and services received from related companies in the 2019 and 2018 fiscal years consisted of the following:
€ in millions
2019 2018
Joint ventures
Other related companies
Joint ventures
Other related companies
Sales and service charges 40 2 53 2
Products and services received 83 16 81 15
As of 30 September 2019, sales and services relationships with related companies resulted in purchase commitments of €7 million (30 September 2018: €9 million).
P see page 191 ff.
P see page 187 ff.
169Consolidated Financial Statements Notes to the Consolidated Financial Statements
INFINEON TECHNOLOGIES | ANNUAL REPORT 2019

Related personsMembers of the Management Board active in the 2019 fiscal year received fixed non-performance-related compen-sation for their services of €3.7 million (2018: €3.7 million). In addition, the members of the Management Board received variable performance-related compensation for their services in the 2019 fiscal year of €2.3 million (2018: €3.6 million). This comprised a Short Term Incentive of €1.2 million (2018: €1.9 million), and a Mid Term Incentive of €1.1 million (2018: €1.7 million). Furthermore, the Management Board received a Long Term Incentive (LTI) which, since 2014, takes the form of performance shares. The expense resulting from the LTI amounted to €0.6 million (2018: €0.8 million). The compensation granted to active members of the Management Board amounted to €6.7 million in the 2019 fiscal year (2018: €8.1 million).
With effect from the close of 31 March 2019, Mr. Dominik Asam resigned from his position as a member of the Management Board of Infineon Technologies AG in agreement with the Supervisory Board, and left the Company. In line with his service contract, Mr. Asam’s entitlement to payments under the Short Term Incentive (STI) for the 2019 fiscal year as well as from the ongoing Mid Term Incentive (MTI) and Long Term Incentive (LTI) tranches forfeited on his departure. A post-employment non-competition clause was agreed with Mr. Asam for a period of 18 months. As compensation for this non-competition obligation, Mr. Asam will receive a one-time compensation of €150,000, payable on 31 December 2019. The net income recorded as a result of Mr. Asam’s departure (including the requisite adjustment to the pension obligation) amounted to approximately €1 million.
The compensation of the members of the Supervisory Board of Infineon Technologies AG in the 2019 fiscal year, including attendance fees, amounted to €2.1 million (2018: €2.0 million). Employee representatives in the Supervisory Board who are employed by Infineon also receive a salary for their activities as employees.
Former members of the Management Board received payments (in particular pension payments) of €2.0 million in the 2019 fiscal year (2018: €1.5 million).
As of 30 September 2019, pension obligations for former members of the Management Board amounted to €81.2 million (30 September 2018: €68.8 million).
Disclosure of the individual remuneration of the members of the Management Board and the Supervisory Board as required by section 315e, paragraph 1, in connection with section 314, paragraph 1, no. 6a, sentences 5 to 8, of the German Commercial Code, is provided in the Compensation report which is part of the Combined Manage-ment Report.
In the 2019 and 2018 fiscal years there were no further significant transactions between Infineon and related persons which fall outside of the scope of the existing employment, service or appointment terms, or of the contractual arrangements for their remuneration.
25 Supplemental cash flow information
Cash and cash equivalents reported as of 30 September 2019 and 2018 totaling €1,021 million and €732 million, respectively, included €66 million and €100 million, respectively, which were subject to legal transfer restrictions and so were not available for general use by Infineon. This amount represented cash and cash equivalents of consolidated companies located in countries where the transfer of cash is legally restricted, for example China.
The reconciliation below shows changes in those financial liabilities and hedging transactions for which payments received and made are shown under cash provided by/used in financing activities in the statement of cash flows.
€ in millions
Non-cash effective changes
Starting balance
Cash- effective changes
Acquisitions
Currency effects
Other changes
Ending balance
The 2019 fiscal year
Short-term and long-term debt 1,532 (22) – 47 (1) 1,556
Related party financial payables 1 (1) – – – –
Total 1,533 (23) – 47 (1) 1,556
P see page 103 ff.
170Consolidated Financial Statements Notes to the Consolidated Financial Statements
INFINEON TECHNOLOGIES | ANNUAL REPORT 2019

€ in millions
Non-cash effective changes
Starting balance
Cash- effective changes
Acquisitions
Currency effects
Other changes
Ending balance
The 2018 fiscal year
Short-term and long-term debt 1,834 (321) 1 16 2 1,532
Related party financial payables 1 – – – – 1
Total 1,835 (321) 1 16 2 1,533
26 Additional disclosures on financial instruments
Infineon adopted IFRS 9 from 1 October 2018 onwards. The first adoption effects from the revised classification and measurement of financial instruments as a result of the transition to IFRS 9 can be found in note 1. The following table presents the carrying amounts and the fair values of financial instruments by their respective classes and a breakdown by category of financial instruments as of 30 September 2019 according to IFRS 9, and as of 30 Sep-tember 2018 according to IAS 39:
€ in millions Financial assets
Categories of financial assets
Carrying amount
At fair value through
profit or loss
At amortized cost
Designated cash flow
hedges
Fair value
Balance as of 30 September 2019
Current assets:
Cash and cash equivalents 1,021 73 948 – 1,021
Financial investments 2,758 2,187 571 – 2,758
Trade receivables 888 – 888 – 888
Other current assets 558 2 343 213 558
Non-current assets:
Other non-current assets 1 107 55 52 – 107
Total 5,332 2,317 2,802 213 5,332
1 As of 30 September 2019, other non-current assets, which are measured at amortized cost, included €1 million (previous year: €4 million) from an agreement related to the residual liability of Infineon as former shareholder of Qimonda Dresden GmbH & Co. OHG (see note 23), which are deposited in escrow in order to secure potential claims against Infineon.
€ in millions Financial assets
Categories of financial assets
Carrying amount
At fair value through
profit or loss
Available for sale
Loans and receivables
Fair value
Balance as of 30 September 2018
Current assets:
Cash and cash equivalents 732 – – 732 732
Financial investments 1,811 – 563 1,248 1,811
Trade receivables 971 – – 971 971
Other current assets 113 3 – 110 113
Non-current assets:
Other non-current assets 104 – 40 64 104
Total 3,731 3 603 3,125 3,731
P see page 125 ff.
P see page 166 ff.
171Consolidated Financial Statements Notes to the Consolidated Financial Statements
INFINEON TECHNOLOGIES | ANNUAL REPORT 2019
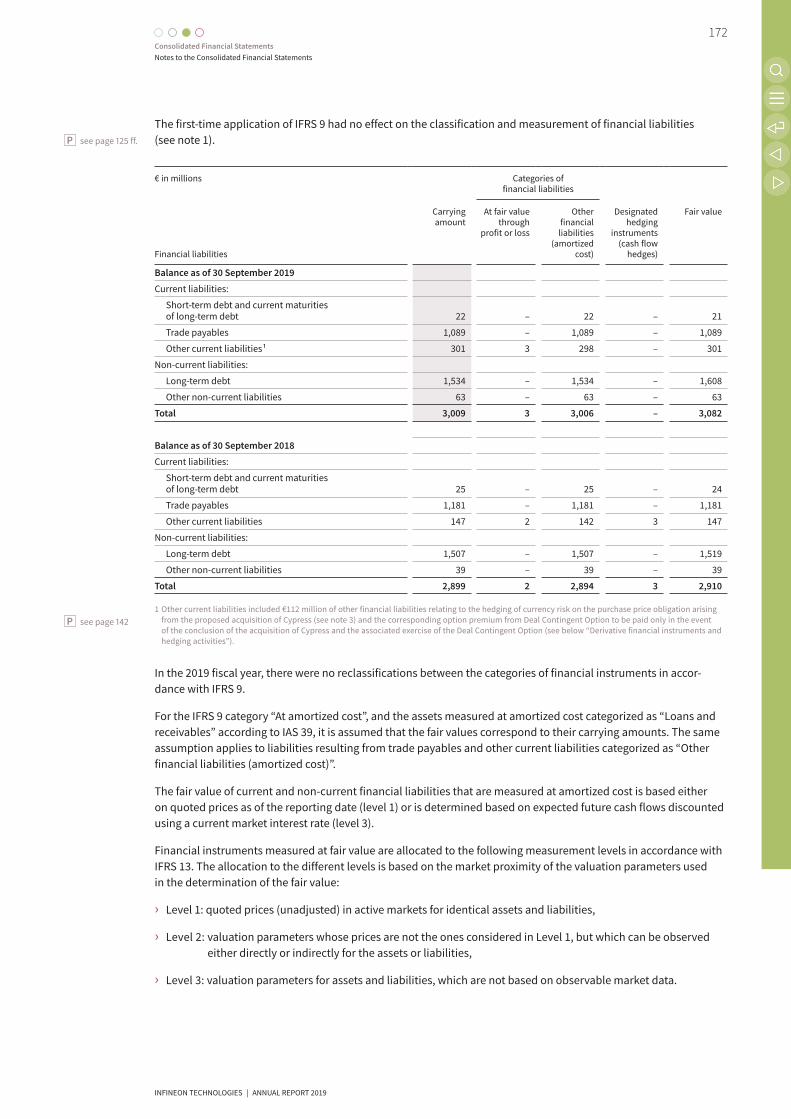
The first-time application of IFRS 9 had no effect on the classification and measurement of financial liabilities (see note 1).
€ in millions Financial liabilities
Categories of financial liabilities
Carrying amount
At fair value through
profit or loss
Other financial
liabilities (amortized
cost)
Designated hedging
instruments (cash flow
hedges)
Fair value
Balance as of 30 September 2019
Current liabilities:
Short-term debt and current maturities of long-term debt 22 – 22 – 21
Trade payables 1,089 – 1,089 – 1,089
Other current liabilities 1 301 3 298 – 301
Non-current liabilities:
Long-term debt 1,534 – 1,534 – 1,608
Other non-current liabilities 63 – 63 – 63
Total 3,009 3 3,006 – 3,082
Balance as of 30 September 2018
Current liabilities:
Short-term debt and current maturities of long-term debt 25 – 25 – 24
Trade payables 1,181 – 1,181 – 1,181
Other current liabilities 147 2 142 3 147
Non-current liabilities:
Long-term debt 1,507 – 1,507 – 1,519
Other non-current liabilities 39 – 39 – 39
Total 2,899 2 2,894 3 2,910
1 Other current liabilities included €112 million of other financial liabilities relating to the hedging of currency risk on the purchase price obligation arising from the proposed acquisition of Cypress (see note 3) and the corresponding option premium from Deal Contingent Option to be paid only in the event of the conclusion of the acquisition of Cypress and the associated exercise of the Deal Contingent Option (see below “Derivative financial instruments and hedging activities”).
In the 2019 fiscal year, there were no reclassifications between the categories of financial instruments in accor-dance with IFRS 9.
For the IFRS 9 category “At amortized cost”, and the assets measured at amortized cost categorized as “Loans and receivables” according to IAS 39, it is assumed that the fair values correspond to their carrying amounts. The same assumption applies to liabilities resulting from trade payables and other current liabilities categorized as “Other financial liabilities (amortized cost)”.
The fair value of current and non-current financial liabilities that are measured at amortized cost is based either on quoted prices as of the reporting date (level 1) or is determined based on expected future cash flows discounted using a current market interest rate (level 3).
Financial instruments measured at fair value are allocated to the following measurement levels in accordance with IFRS 13. The allocation to the different levels is based on the market proximity of the valuation parameters used in the determination of the fair value:
› Level 1: quoted prices (unadjusted) in active markets for identical assets and liabilities,
› Level 2: valuation parameters whose prices are not the ones considered in Level 1, but which can be observed either directly or indirectly for the assets or liabilities,
› Level 3: valuation parameters for assets and liabilities, which are not based on observable market data.
P see page 125 ff.
P see page 142
172Consolidated Financial Statements Notes to the Consolidated Financial Statements
INFINEON TECHNOLOGIES | ANNUAL REPORT 2019
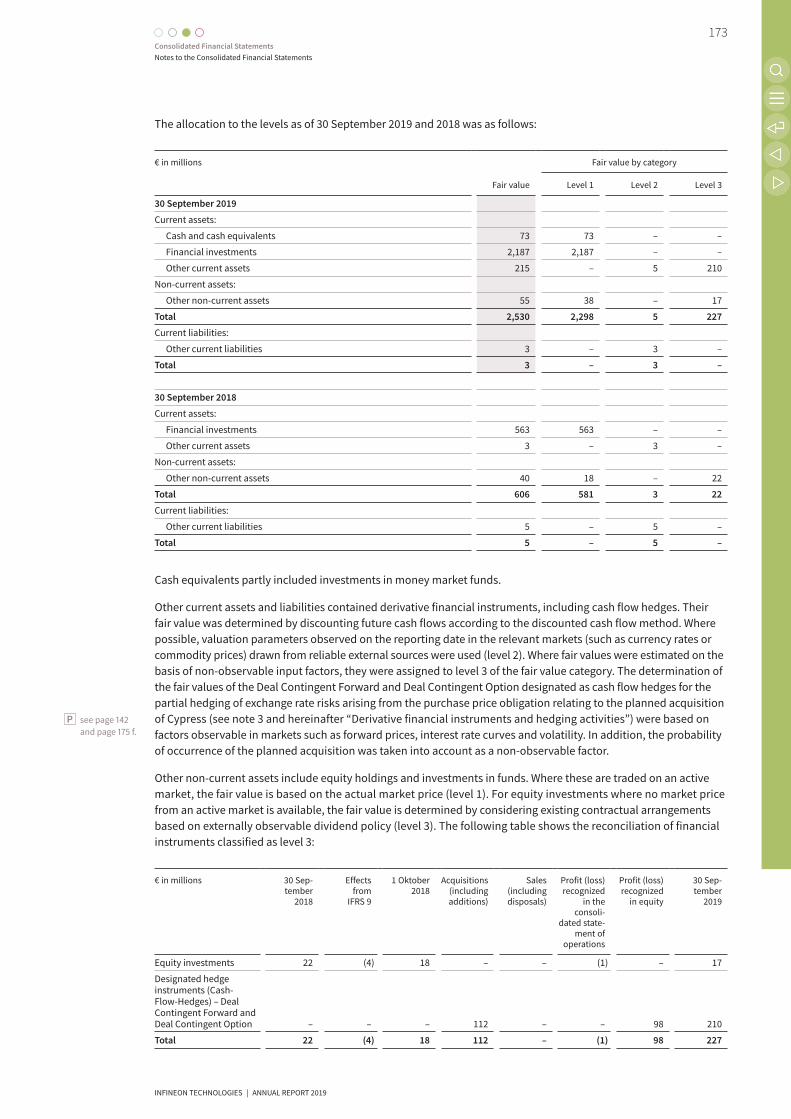
The allocation to the levels as of 30 September 2019 and 2018 was as follows:
€ in millions Fair value
Fair value by category
Level 1 Level 2 Level 3
30 September 2019
Current assets:
Cash and cash equivalents 73 73 – –
Financial investments 2,187 2,187 – –
Other current assets 215 – 5 210
Non-current assets:
Other non-current assets 55 38 – 17
Total 2,530 2,298 5 227
Current liabilities:
Other current liabilities 3 – 3 –
Total 3 – 3 –
30 September 2018
Current assets:
Financial investments 563 563 – –
Other current assets 3 – 3 –
Non-current assets:
Other non-current assets 40 18 – 22
Total 606 581 3 22
Current liabilities:
Other current liabilities 5 – 5 –
Total 5 – 5 –
Cash equivalents partly included investments in money market funds.
Other current assets and liabilities contained derivative financial instruments, including cash flow hedges. Their fair value was determined by discounting future cash flows according to the discounted cash flow method. Where possible, valuation parameters observed on the reporting date in the relevant markets (such as currency rates or commodity prices) drawn from reliable external sources were used (level 2). Where fair values were estimated on the basis of non-observable input factors, they were assigned to level 3 of the fair value category. The determination of the fair values of the Deal Contingent Forward and Deal Contingent Option designated as cash flow hedges for the partial hedging of exchange rate risks arising from the purchase price obligation relating to the planned acquisition of Cypress (see note 3 and hereinafter “Derivative financial instruments and hedging activities”) were based on factors observable in markets such as forward prices, interest rate curves and volatility. In addition, the probability of occurrence of the planned acquisition was taken into account as a non-observable factor.
Other non-current assets include equity holdings and investments in funds. Where these are traded on an active market, the fair value is based on the actual market price (level 1). For equity investments where no market price from an active market is available, the fair value is determined by considering existing contractual arrangements based on externally observable dividend policy (level 3). The following table shows the reconciliation of financial instruments classified as level 3:
€ in millions
30 Sep- tember
2018
Effects from
IFRS 9
1 Oktober 2018
Acquisitions (including additions)
Sales (including disposals)
Profit (loss) recognized
in the consoli-
dated state- ment of
operations
Profit (loss) recognized
in equity
30 Sep- tember
2019
Equity investments 22 (4) 18 – – (1) – 17
Designated hedge instruments (Cash- Flow-Hedges) – Deal Contingent Forward and Deal Contingent Option – – – 112 – – 98 210
Total 22 (4) 18 112 – (1) 98 227
P see page 142 and page 175 f.
173Consolidated Financial Statements Notes to the Consolidated Financial Statements
INFINEON TECHNOLOGIES | ANNUAL REPORT 2019

A hypothetical change in the material non-observable valuation parameters at the balance sheet date of ± 10 percent would have resulted in a theoretical reduction in fair values of €25 million or an increase of €25 million.
In the 2019 and 2018 fiscal years, there were no reclassifications between the categories (levels) of fair values.
The net gain or loss on financial instruments (including interest income and expense) within continuing operations in the Consolidated Statement of Operations amounted to the following:
€ in millions 2019
Financial assets measured at amortized cost 149
therein interest income 26
therein impairment loss 2
Financial assets measured at fair value through profit and loss (26)
Financial liabilities measured at amortized cost (180)
therein interest expenses (52)
Financial assets or liabilities measured at fair value through profit and loss – held for trading (5)
Total (62)
The currency effects included within net gains and losses amounted to negative €6 million (2018: negative €9 million). This net currency effect arose exclusively from recognized financial instruments.
Infineon does not net financial instruments. Infineon conducts derivative transactions according to the global netting agreement (Master Agreement) of the International Swaps and Derivatives Association (ISDA) and other comparable national framework agreements. Under the terms of these agreements, any netting arising from the occurrence of certain future events would have had no material effect on the balance sheet presentation of these financial instruments.
The following table shows net gains and losses according to IAS 39 for the 2018 fiscal year:
€ in millions 2018
Available-for-sale financial assets (6)
Loan and receivables 59
Held for trading (5)
Other financial liabilities (99)
Total (51)
Interest income from financial instruments not measured at fair value through profit and loss in the 2018 fiscal year amounted to €15 million; interest expense from such financial instruments amounted to €50 million.
Derivative financial instruments and hedging activitiesInfineon holds derivative financial instruments exclusively for hedging purposes. This includes the use of forward exchange contracts, foreign currency options, and commodity swaps. The objective is to reduce the impact of exchange rate and commodity price fluctuations on future net cash flows. In the 2019 fiscal year derivatives were acquired in order to hedge equity market risks in connection with the June 2019 capital increase used to finance the planned acquisition of Cypress (see note 19). After the capital increase was completed, the derivatives were settled.P see page 161
174Consolidated Financial Statements Notes to the Consolidated Financial Statements
INFINEON TECHNOLOGIES | ANNUAL REPORT 2019

The nominal values and fair values of Infineon’s derivative instruments as of 30 September 2019 and 2018 that were not designated as cash flow hedges were as follows:
€ in millions
30 September 2019 30 September 2018
Nominal value
Fair value Nominal value
Fair value
Forward exchange contracts sold 134 (3) 129 –
Forward exchange contracts purchased 150 2 239 1
Total (1) 1
Foreign exchange derivatives are entered into by Infineon to offset the exchange risk from anticipated cash receipts from operating activities. As in the previous year, in 2019 no foreign exchange derivatives used to hedge ongoing business were designated as cash flow hedges.
As of 30 September 2019, Infineon held the following instruments, which were designated as cash flow hedges and were used to hedge against exchange rate and commodity price changes.
€ in millions (except exchange rates and prices) short term
30 September 2019
Hedging of foreign currency risks
Deal Contingent Forward/Deal Contingent Option
Nominal value 3,300
Average forward rate (US dollar/euro) 1.1199
Deal Contingent Option
Nominal value 3,300
Average strike price (US dollar/euro) 1.1506
Hedging of other risks
Commodity swaps
Nominal value 30
Average price (US dollar/ounce) 1,364
30 September 2018
Commodity swaps
Nominal value 33
Average price (US dollar/ounce) 1,304
In order to hedge the majority of the foreign currency risks arising from the purchase price obligation of the planned acquisition of Cypress, a transaction-dependent euro/US dollar foreign currency forward (Deal Contingent Forward) and a transaction-dependent euro/US dollar foreign currency option (Deal Contingent Option), each with a nominal value of €3.3 billion, were concluded and were accounted for as cash flow hedges. At the inception of the hedging transaction, and on a continuing basis, Infineon verifies the existence of an economic relationship between the hedged item and the hedging instrument (Critical Term). For the above-mentioned hedging transactions, the hedge ratio was 1:1. As part of the hedging, only the spot component from the Deal Contingent Forward and the intrinsic value of the Deal Contingent Option were designated as hedging instruments. The forward elements of the Deal Contingent Forward and the fair value of the Deal Contingent Option, each containing a contingency component, are excluded from the hedging instrument designation and are separately accounted for and reported in equity in a reserve for costs of hedging. No ineffectiveness was recorded in the Consolidated Statement of Operations for the Deal Contingent Forward or the Deal Contingent Option in the 2019 fiscal year. The causes of ineffectiveness may be the impact of counterparty credit risk, or, for Infineon, the fair value of the foreign currency forward or option, which is not reflected in the change in the fair value of hedged cash flows due to changes in exchange rates. In addition, changes in the timing of the hedged transaction and the contingency component included in the hedging instruments may result in ineffectiveness. Upon completion of the acquisition of Cypress, the effective part of the hedging transaction will be taken into account when determining the goodwill resulting from the transaction.
175Consolidated Financial Statements Notes to the Consolidated Financial Statements
INFINEON TECHNOLOGIES | ANNUAL REPORT 2019

The following table shows the impact of the Deal Contingent Forward and the Deal Contingent Option on items in the Consolidated Statement of Financial Position (before taxes):
€ in millions
Deal Contingent
Forward
Deal Contingent
Option
Total
30 September 2019
Other current assets 91 119 210
Other reserves 91 7 98
Therein hedge reserve 56 84 140
Therein cost of hedging reserve 35 (77) (42)
Other current liabilities – 112 112
Other current liability of €112 million related to the option premium to be paid only in the event of the completion of the planned acquisition of Cypress and the associated exercise of the Deal Contingent Option.
To offset the price risks of highly probable gold purchases in the coming fiscal years, Infineon entered into swaps, which are designated as cash flow hedges. The designated hedged items and the hedging instruments are subject to the same risk. The economic connection is proven by means of a regression analysis. As Infineon carries out highly effective hedging transactions, the Company assumes that as a rule, no significant ineffectiveness will arise. Infineon applies a hedging ratio of 1:1. Ineffectiveness may arise mainly from the impact of counterparty credit risk, or, for Infineon, from the fair value of swap transactions that is not reflected in the change in the fair value of hedged cash flows due to changes in commodity prices.
As in the previous year, no hedge ineffectiveness was recorded in the Consolidated Statement of Operations for these hedging relationships. As in the previous year, no gains or losses were transferred from other reserves to profit or loss as a result of cash flow hedges for future raw material purchases being canceled following the decision that the occurrence of the hedged transaction had become unlikely.
The amounts related to positions designated as hedged items were as follows as of 30 September 2019 and 2018:
€ in millions
Change in the value of the hedged item used to determine
ineffectiveness
Hedging reserve (before taxes)
Cost of hedge reserve (before taxes)
30 September 2019
Hedging of currency risks
Deal Contingent Forward (56) 56 35
Deal Contingent Option (67) 84 (77)
Hedging of commodity price risks (3) 3 –
Total 143 (42)
30 September 2018
Hedging of commodity price risks 3 (3) –
In the 2019 and 2018 fiscal years, no balances remained in other comprehensive income for which hedge accounting is no longer applied.
176Consolidated Financial Statements Notes to the Consolidated Financial Statements
INFINEON TECHNOLOGIES | ANNUAL REPORT 2019

The relevant amounts of the derivative financial instruments designated as hedging instruments as of 30 Septem-ber 2019 and 2018 were as follows:
€ in millions
Carrying amount
Changes in fair value for
the measure-ment of the ineffective-ness in the
reporting period
Changes in fair value of the hedging instrument
recognized in other com-prehensive
income
Hedging costs recog-
nized in other com-prehensive
income (loss)
Amount reclassified from hedge
reserve to profit and loss
Line item in profit or
loss affected by the
reclassifi-cation
30 September 2019
Other current assets:
Hedging of currency risks
Deal Contingent Forward 91 91 56 35 – –
Deal Contingent Option 119 7 84 (77) – –
Hedging of commodity risks 3 3 6 – –
cost of goods sold
Total 213 101 146 (42) –
30 September 2018
Other current liabilities:
Commodity swaps (3) (3) (4) – –
cost of goods sold
Total (3) (3) (4) – –
The following table shows the reconciliation for the reserve for cash flow hedges (before taxes) by risk category:
€ in millions
Hedging of currency
risks
Hedging of commodity
risks
Total
30 September 2018 – (3) (3)
Change in fair value 98 6 104
30 September 2019 98 3 101
27 Financial risk management
Infineon’s activities expose it to a variety of financial risks: market risk (including foreign exchange risk, interest rate risk and price risk), credit risk, financing and liquidity risk. Infineon’s financial risk management program seeks to minimize potential adverse effects on its profitability and liquidity. Infineon uses derivative financial instruments to hedge certain risks to which it is exposed. Financial risk management is carried out by the central Finance & Treasury (FT) department in accordance with policies approved by the Chief Financial Officer. The FT department identifies, evaluates and hedges financial risks in close cooperation with the operating units. The FT department’s policy contains principles for overall risk management as well as policies covering specific areas such as foreign exchange risk, interest rate risk, credit risk, the use of derivative and non-derivative financial instruments, and the investment of excess liquidity.
Market riskMarket risk is defined as the risk of losses resulting from adverse changes in the market prices of financial instruments, including those related to foreign exchange rates, interest rates and other price risks.
Infineon is exposed to various market risks in the ordinary course of business, primarily resulting from changes in foreign exchange rates and interest rates. Infineon enters into a range of derivative financial transactions with various counterparties to limit such risks. Derivative instruments are used only for hedging purposes and not for trading or speculative purposes.
177Consolidated Financial Statements Notes to the Consolidated Financial Statements
INFINEON TECHNOLOGIES | ANNUAL REPORT 2019

Foreign exchange riskForeign exchange risk within the meaning of IFRS 7 is the risk arising from changes to foreign exchange rates. Accordingly, foreign exchange risks are associated with monetary financial instruments that are denominated in a foreign currency that does not correspond to the functional currency, and the foreign currency represents the relevant risk variable. Risks arising from the translation into Infineon’s reporting currency are not risks within the meaning of IFRS 7.
Although Infineon prepares the Consolidated Financial Statements in euros, a varying but significant portion of its revenue as well as cost of goods sold, research and development and product distribution costs are denominated in currencies other than the euro, primarily the US dollar. Fluctuations in the exchange rates of these currencies compared to the euro had an effect on the results of Infineon in the 2019 and 2018 fiscal years.
The Management Board has established policies that require Infineon’s individual legal entities to manage the foreign exchange risk with respect to their functional currency. Group entities prepare a monthly rolling cash flow forecast by currency in order to determine foreign exchange risks. The net foreign exchange positions determined in these forecasts are required to be hedged, usually by entering into internal hedging contracts. Infineon’s policy with respect to limiting short-term foreign currency exposure is to hedge at least 75 percent of its estimated net cash flow for the following two months, at least 50 percent of its estimated net cash flow for the third month and, depending on the nature of the underlying transactions, a portion for the periods thereafter. Part of the foreign currency risk cannot be mitigated due to differences between actual and forecasted amounts. Infineon calculates this remaining risk based on net cash flows considering items in the Statement of Financial Position, actual orders received or placed and all other planned cash receipts and payments.
In order to hedge the majority of the foreign currency risks arising from the purchase price obligation of the planned acquisition of Cypress, Infineon entered in the 2019 financial year into a transaction-dependent euro/US dollar foreign currency forward transaction (Deal Contingent Forward) and a transaction-dependent euro/US dollar foreign currency option trans action (Deal Contingent Option), and accounted for them as cash flow hedges (see note 26).
For the net result related to foreign currency derivatives and foreign currency transactions included within net income see note 26.
Foreign exchange risk at Infineon arises predominantly from US dollar positions. The following table shows the net risk as of 30 September 2019 and 2018:
€ in millions
Currency
US$ Others
30 September 2019
Financial position exposure 67 (114)
Forward exchange contracts (124) 124
Foreign currency exposure from planned transactions (6,600) –
Designated hedging instruments (cash flow hedges) 6,600 –
Net exposure (57) 10
30 September 2018
Financial position exposure (17) (119)
Forward exchange contracts (36) 129
Net exposure (53) 10
P see page 175 ff.
P see page 174
178Consolidated Financial Statements Notes to the Consolidated Financial Statements
INFINEON TECHNOLOGIES | ANNUAL REPORT 2019

The following table shows the effects on profit or loss for the 2019 and 2018 fiscal year and equity as of 30 Septem-ber 2019 and 2018 for continuing operations of a 10 percent shift in exchange rates. The assumed exchange rate changes relate only to financial instruments within the meaning of IFRS 7.
€ in millions
Profit or Loss Equity
plus 10 % minus 10 % plus 10 % minus 10 %
30 September 2019 4 (5) (395) 712
Euro/US dollar 1 5 (6) (395) 712
Other (1) 1 – –
30 September 2018 4 (5) – –
Euro/US dollar 1 5 (6) – –
Other (1) 1 – –
1 The sensitivity calculation assumes a 10 percent strengthening of the euro against the US dollar (plus 10 percent) and a 10 percent weakening of the euro against the US dollar (minus 10 percent)
Interest rate riskIn accordance with IFRS 7, interest rate risk is defined as the risk that the fair value or future cash flows of a financial instrument will fluctuate because of changes in interest rates.
Infineon is exposed to interest rate risk through its financial assets and debt instruments resulting from bond issu-ances and debt financing. Due to the cyclical nature of its core business and the need to maintain high operational flexibility, Infineon holds a relatively high level of liquid financial assets that are invested in short-term fixed-interest instruments. These investments generally have a contract duration of between one and twelve months in order to achieve short-term interest rate returns. The risk to these assets of changing interest rates is not material in the current period of low or zero interest rates.
To reduce the net remaining risks caused by changes in interest rates, Infineon is able to make use of interest rate derivatives in order to align the fixed interest periods of assets and liabilities.
IFRS 7 requires a sensitivity analysis showing the effect of possible changes in market interest rates on profit or loss and equity. Infineon prepares this using the iteration method.
Changes in market interest rates affect interest income and expenses from variable-interest financial instruments. A change in interest rates of 100 basis points would have increased or decreased net interest expense by €22 million in the 2019 fiscal year (30 September 2018: €0 million).
Infineon did not hold any fixed-rate financial assets or liabilities that are measured at fair value through profit or loss. Furthermore, as in the previous fiscal year, Infineon did not hold any fixed-interest financial assets that were measured at fair value through equity.
Other price riskAccording to IFRS 7, other price risk is defined as the risk that the fair value or future cash flows of a financial instrument could fluctuate because of changes in market prices (other than those arising from interest rate risk or currency risk), irrespective of whether those changes are caused by factors specific to the individual financial instrument or its issuer, or by factors affecting all similar financial instruments traded in the market.
Infineon held financial instruments that are exposed to market price risks. A change in the relevant market prices would have had no significant impact on the result of the 2019 and 2018 fiscal years.
Additionally, Infineon is exposed to price risks with respect to raw materials upon which it is dependent. Infineon seeks to minimize these risks through its procurement policy (including the use of multiple sources, where possible) and its operating procedures. In line with these measures, Infineon concluded additional financial derivative contracts for certain commodity supplies (gold) for the following fiscal year in order to mitigate the remaining risk arising from the fluctuation of commodity prices. A change in relevant market prices of 10 percent would have increased or decreased equity by €3 million in the 2019 fiscal year (30 September 2018: €3 million).
179Consolidated Financial Statements Notes to the Consolidated Financial Statements
INFINEON TECHNOLOGIES | ANNUAL REPORT 2019

Credit riskCredit risk arises when a customer or other counterparty of a financial instrument fails to discharge its contractual obligations. Infineon is exposed to this risk as a consequence of its ongoing operations, its financial investments and certain financing activities. Infineon’s credit risk arises primarily from cash and cash equivalents, financial investments, trade receivables and derivative financial instruments. Excluding the impact of any collateral received, the carrying amount of financial investments, cash and cash equivalents and trade receivables corresponds to the maximum credit risk.
Worldwide foreign exchange and interest hedging contracts as well as the investment of liquid assets in cash equivalents and financial investments are entered into with major financial institutions worldwide that have high credit ratings. Infineon assesses the creditworthiness of banks using a methodology that establishes investment limits for individual banks that are updated on a daily basis based on current ratings (S&P, Moody’s or Fitch) and credit default swap premiums. Possible breaches of stipulated investment thresholds result in immediate notification and the requirement to reduce the risk. This methodology is also used to identify a significant increase in credit risk in the context of the recognition of expected credit losses within the meaning of IFRS 9 at the balance sheet date.
Infineon applies the so-called general impairment model in accordance with IFRS 9 for cash and cash equivalents as well as financial investments. Since Infineon invests exclusively in high-quality financial assets from issuers with a rating of at least investment grade in order to minimize default risk, Infineon assumes that its financial assets carry low credit risk arising from the creditworthiness of its contract parties, so that any impairment loss recorded at first-time recognition is limited to the twelve-month expected credit losses. Infineon considers low credit risk to be an internal credit rating “Holding Quality 1”. A change in the internal rating from “Holding Quality 1” to “Holding Quality 0” indicates a significant increase in credit risk. The impairment is calculated using a weighted-probability method. The impairment is calculated as a measure of the probability of default based on the exposure at the balance sheet date, the loss ratio for that exposure, and the credit default swap spread.
The following table provides information on the credit risk for cash and cash equivalents measured at amortized cost, as well as financial investments as of 30 September 2019:
€ in millions 30 September 2019
At amortized cost
Infineon rating
External rating
Basis for the determination of the
loss allowance
Holding Quality 1 A to BBB 1,372
Holding Quality 0 BBB 147
Total 1,519
The twelve-month expected credit losses as of 30 September 2019 amounted to €0 million (see note 9). Lifetime expected credit losses on non-impaired financial assets were negligible in the 2019 fiscal year. Infineon also had no financial assets that were overdue or impaired as of 30 September 2019. There was no reclassification between the impairment stages in the 2019 fiscal year.
Infineon had spread its cash investments over more than ten banks as of 30 September 2019. As of 30 September 2019, no financial institution was responsible for more than 12 percent (30 September 2018: 13 percent) of Infineon’s cash investments. This gave rise to a maximum risk of €139 million (30 September 2018: €199 million) in the event of the default of a single financial institution assuming no deposit insurance scheme is in place. Infineon also held derivative financial instruments with a positive fair value of €215 million at 30 September 2019 (30 September 2018: €3 million).
P see page 150
180Consolidated Financial Statements Notes to the Consolidated Financial Statements
INFINEON TECHNOLOGIES | ANNUAL REPORT 2019

Infineon manages the credit risk with respect to trade receivables through comprehensive credit evaluations for all major customers, the use of credit limits and monitoring procedures. New customers are evaluated for credit-worthiness in accordance with Infineon guidelines. Credit limits are also in place for individual customers and creditworthiness and credit limits are constantly monitored. A further measure taken to reduce credit risk is the use of reservation of title clauses. However, despite continuous monitoring, Infineon cannot fully exclude the possibility of a loss arising from the default of one of its contract parties.
Infineon assigns trade receivables to different risk classes based on external ratings, the analysis of customer balance sheet figures, default probabilities (credit default swaps), payment behavior and country risks. The simplified method is used to determine the expected losses from trade receivables. The expected losses over the entire term of the trade receivables are determined. The allowance is calculated for each customer using a weighted-probability method. In calculating the expected credit losses, for each customer Infineon takes into account a forward-looking probability of default provided by a credit rating agency. Individual allowances are recorded based on case-by-case facts or other risk indicators.
The following table provides information about the credit risk for trade receivables from third parties as of 30 September 2019.
€ in millions 30 September 2019
At amortized cost
Infineon rating
Risk class
External credit rating
Basis for the determination of the
value adjustment
1 low risk A – to AAA 225
2 average risk BBB to BBB + 356
3 above average risk BB + to BBB – 186
4 above average risk (caution)
BB – to BB 61
5 high risk C to B + 22
– individual none 6
– others none 34
Total 890
As of 30 September 2019, expected credit losses on trade receivables amounted to approximately €1 million for all risk classes. The individual allowances on trade receivables (not rated) amounted to €6 million in the 2019 fiscal year (see note 10).
Financing and liquidity riskFinancing and liquidity risk is the risk that an entity will encounter difficulties in meeting obligations associated with financial liabilities.
Liquidity risk could arise from a potential inability of Infineon to meet maturing financial obligations. Infineon’s liquidity management provides that sufficient levels of cash and other liquid assets are available as well as ensuring the availability of funding through adequate levels of committed credit facilities.
The following table discloses the maturity profile for non-derivative financial liabilities and a cash flow analysis for derivative financial instruments with negative fair values. The table shows the undiscounted contractually agreed cash flows that result from the respective financial liability. Cash flows are recognized at the date when Infineon becomes a contractual partner to the financial instrument. Amounts in foreign currencies are translated using the closing rate at the reporting date. The value of financial instruments with variable interest payments is determined using the interest rate from the last interest fixing date before 30 September 2019. The cash outflows of financial liabilities that can be repaid at any time are assigned to the period in which the earliest redemption is possible.
P see page 150
181Consolidated Financial Statements Notes to the Consolidated Financial Statements
INFINEON TECHNOLOGIES | ANNUAL REPORT 2019
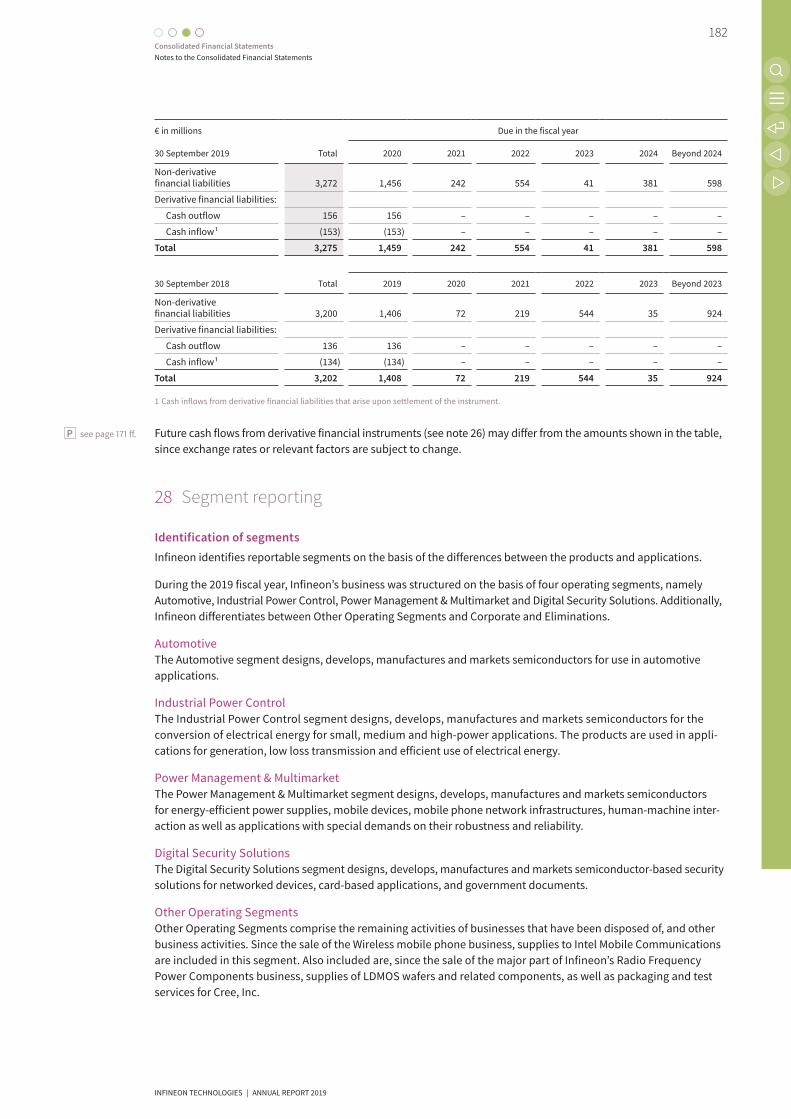
€ in millions 30 September 2019
Due in the fiscal year
Total 2020 2021 2022 2023 2024 Beyond 2024
Non-derivative financial liabilities 3,272 1,456 242 554 41 381 598
Derivative financial liabilities:
Cash outflow 156 156 – – – – –
Cash inflow 1 (153) (153) – – – – –
Total 3,275 1,459 242 554 41 381 598
30 September 2018 Total 2019 2020 2021 2022 2023 Beyond 2023
Non-derivative financial liabilities 3,200 1,406 72 219 544 35 924
Derivative financial liabilities:
Cash outflow 136 136 – – – – –
Cash inflow 1 (134) (134) – – – – –
Total 3,202 1,408 72 219 544 35 924
1 Cash inflows from derivative financial liabilities that arise upon settlement of the instrument.
Future cash flows from derivative financial instruments (see note 26) may differ from the amounts shown in the table, since exchange rates or relevant factors are subject to change.
28 Segment reporting
Identification of segmentsInfineon identifies reportable segments on the basis of the differences between the products and applications.
During the 2019 fiscal year, Infineon’s business was structured on the basis of four operating segments, namely Automotive, Industrial Power Control, Power Management & Multimarket and Digital Security Solutions. Additionally, Infineon differentiates between Other Operating Segments and Corporate and Eliminations.
AutomotiveThe Automotive segment designs, develops, manufactures and markets semiconductors for use in automotive applications.
Industrial Power Control The Industrial Power Control segment designs, develops, manufactures and markets semiconductors for the conversion of electrical energy for small, medium and high-power applications. The products are used in appli-cations for generation, low loss transmission and efficient use of electrical energy.
Power Management & Multimarket The Power Management & Multimarket segment designs, develops, manufactures and markets semiconductors for energy-efficient power supplies, mobile devices, mobile phone network infrastructures, human-machine inter-action as well as applications with special demands on their robustness and reliability.
Digital Security SolutionsThe Digital Security Solutions segment designs, develops, manufactures and markets semiconductor-based security solutions for networked devices, card-based applications, and government documents.
Other Operating SegmentsOther Operating Segments comprise the remaining activities of businesses that have been disposed of, and other business activities. Since the sale of the Wireless mobile phone business, supplies to Intel Mobile Communications are included in this segment. Also included are, since the sale of the major part of Infineon’s Radio Frequency Power Components business, supplies of LDMOS wafers and related components, as well as packaging and test services for Cree, Inc.
P see page 171 ff.
182Consolidated Financial Statements Notes to the Consolidated Financial Statements
INFINEON TECHNOLOGIES | ANNUAL REPORT 2019

Corporate and EliminationsCorporate and Eliminations reflects the elimination of intragroup revenue and profits/losses to the extent that these arise between the segments.
Similarly, certain items are included in Corporate and Eliminations, which are not allocated to the other segments. These include certain corporate headquarters costs and selected topics, which are not allocated to the segments since they arise from corporate decisions and are not within the direct control of segment management.
Furthermore, raw materials, supplies and work in progress of the common frontend production, and raw materials and supplies of the common backend production, are not under the control or responsibility of the operating segment management and are therefore allocated to corporate functions. Only work in progress of backend production and finished goods are allocated to the operating segments.
Chief Operating Decision Maker, definition of Segment Result and allocation of assets and liabilities to the individual segmentsThe Management Board, as joint Chief Operating Decision Maker, decides how resources are allocated to the segments.
Based on revenue and Segment Result, the Management Board assesses performance and defines operating targets and budgets for the segments.
Segment Result is defined as operating income (loss) excluding certain impairments (such as goodwill impairments), impact on earnings of restructuring measures and closures, share-based compensation expense, acquisition-related depreciation/amortization and other expenses, gains (losses) on sales of businesses, or interests in subsidiaries and other income (expense), including litigation costs.
Decisions relating to financing and the investment of cash funds are taken at a Group level and not at a segment level. For this reason, financial income and financial expense (including interest income and expense) are not allocated to the segments.
Neither assets, liabilities nor cash flows per segment are reported to the Management Board, nor is segment performance assessed on this basis.
The exception to this approach is certain inventory information which is regularly analyzed at a segment level. Infineon also allocates depreciation and amortization expense to the operating segments based on production volume and products produced using standard costs.
Segment information
€ in millions
Total Power Embedded Control RF & Sensors
2019 2018 2019 2018 2019 2018 2019 2018
Revenue from contracts with customers:
Automotive 3,503 3,284 2,218 2,111 668 599 617 574
Industrial Power Control 1,418 1,323 1,418 1,323 – – – –
Power Management & Multimarket 2,445 2,318 1,883 1,758 – – 562 560
Digital Security Solutions 642 664 – – 642 664 – –
Subtotal 8,008 7,589 5,519 5,192 1,310 1,263 1,179 1,134
Other Operating Segments 21 10
Corporate and Eliminations – –
Total 8,029 7,599
183Consolidated Financial Statements Notes to the Consolidated Financial Statements
INFINEON TECHNOLOGIES | ANNUAL REPORT 2019

There were limited levels of trading relationships between the operating segments during the 2019 and 2018 fiscal years. Costs are recharged in general without impact on profit or loss.
€ in millions 2019 2018
Segment Result:
Automotive 404 466
Industrial Power Control 251 256
Power Management & Multimarket 585 532
Digital Security Solutions 77 105
Other Operating Segments 4 (4)
Corporate and Eliminations (2) (2)
Total 1,319 1,353
The following table provides the reconciliation of Segment Result to income from continuing operations before income taxes:
€ in millions 2019 2018
Segment Result: 1,319 1,353
Plus/minus:
Impairments (such as on goodwill), net of reversals 1 – (7)
Share-based compensation expense (11) (13)
Acquisition-related depreciation/amortization and other expenses (114) (118)
Gains (losses) on sales of businesses, or interests in subsidiaries, net 2 (1) 272
Other income and expense, net (32) (18)
Operating income 1,161 1,469
Financial income 26 15
Financial expenses (98) (68)
Gain (loss) from investments accounted for using the equity method (6) (5)
Income from continuing operations before income taxes 1,083 1,411
1 Since 1 October 2018 impairments/reversal of impairments on assets are generally shown in segment result (excluding impairments for Goodwill). The previous period’s figures were not adjusted.
2 Without gains and losses from the disposal of assets since 1 October 2018. The previous period’s figures were not adjusted.
In the 2019 fiscal year, €6 million of impairments of assets and assets classified as held for sale was allocated to the Automotive segment, in the 2018 fiscal year €10 million was allocated to the Power Management & Multimarket segment, €1 million to Other Operating Segments and negative €4 million was allocated to Corporate and Eliminations.
Of the €114 million (2018: €118 million) “Acquisition-related depreciation/amortization and other expenses” incurred in the 2019 fiscal year, €56 million (2018: €67 million) was attributable to cost of goods sold, €2 million (2018: €2 million) to research and development expenses, €44 million (2018: €49 million) to selling, general and administrative expenses and €12 million (2018: €0 million) to other operating income/expenses.
€ in millions 2019 2018
Depreciation and amortization:
Automotive 458 407
Industrial Power Control 159 128
Power Management & Multimarket 191 174
Digital Security Solutions 46 46
Other Operating Segments 4 3
Depreciation and amortization allocated to the segments 858 758
Depreciation and amortization not allocated to the segments 87 103
Total depreciation and amortization 945 861
184Consolidated Financial Statements Notes to the Consolidated Financial Statements
INFINEON TECHNOLOGIES | ANNUAL REPORT 2019

€ in millions 30 Septem-ber 2019
30 Septem-ber 2018
Inventories:
Automotive 551 454
Industrial Power Control 201 159
Power Management & Multimarket 338 302
Digital Security Solutions 26 49
Other Operating Segments 2 –
Corporate and Eliminations 583 516
Total 1,701 1,480
Entity-wide disclosures in accordance with IFRS 8The following is a summary of revenue in the 2019 and 2018 fiscal year and of non-current assets by geographic areas for the years ended 30 September 2019 and 2018:
€ in millions 2019 2018
Revenue:
Europe, Middle East, Africa 2,430 2,443 therein: Germany 1,169 1,171
Asia-Pacific (excluding Japan, Greater China) 1,187 1,129
Greater China 2,769 2,599 therein: China 2,159 1,921
Japan 593 534
Americas 1,050 894 therein: USA 862 719
Total 8,029 7,599
The allocation of revenues from external customers to geographic areas is based on the customers’ locations. The average number of employees by geographic region is provided in note 4.
No single customer accounted for more than 10 percent of Infineon’s revenue during the 2019 and 2018 fiscal year.
€ in millions 30 Septem-ber 2019
30 Septem-ber 2018
Non-current assets:
Europe 3,068 2,516 therein: Germany 2,413 2,020
Asia-Pacific (excluding Japan, Greater China) 1,074 969
Greater China 51 42 therein: China 50 41
Japan 2 2
Americas 1,183 1,175 therein: USA 1,175 1,167
Total 5,378 4,704
Non-current assets do not include financial instruments, deferred tax assets and assets from employee benefits.
P see page 143
185Consolidated Financial Statements Notes to the Consolidated Financial Statements
INFINEON TECHNOLOGIES | ANNUAL REPORT 2019

29 Significant events after the end of the reporting period
Issuance of a perpetual dual-tranche hybrid bondInfineon Technologies AG issued a perpetual hybrid bond on 1 October 2019. The hybrid was issued as a dual-tranche bond with a principal amount of €600 million per tranche. Tranche 1 has a non-call period from issuance of 5.5 years and a fixed coupon of 2.875 percent until the first reset date. Tranche 2 has a non-call period of 8.5 years and a fixed coupon of 3.625 percent until the first reset date. The issue price for tranche 1 was 99.385 percent of the principal amount, the issue price for tranche 2 was 99.121 percent of the principal amount, each with the deduction of a discount. The proceeds were received by Infineon on 1 October 2019. The proceeds from the issuance will be used to re-finance the planned Cypress acquisition and for general corporate purposes. On 7 October 2019, the bridge financing for the planned Cypress acquisition (see note 15) was reduced to €3.9 billion.
The hybrid bond is an equity instrument under IAS 32. It has a perpetual maturity and is a non-call bond. The bond can only be cancelled by Infineon, subject to certain conditions. The investors have no cancellation rights and cannot trigger a premature repayment liability for Infineon. Distributions are at Infineon’s sole discretion.
The discounts and transaction costs as well as deferred taxes will be deducted directly from equity in the 2020 fiscal year.
Acquisition of 15 percent of the shares in pmdtechnologies agIn November 2019, Infineon acquired 15 percent of the shares in pmdtechnologies ag (“pmd”), which is based in Siegen (Germany). The shares are included in the consolidated financial statements using the equity method. The purchase price was €44 million.
pmd is a leader in the development of CMOS-based 3D time-of-flight (“ToF”) image sensor technologies, the develop-ment of the associated algorithms and software, as well as in the calibration of the individual components of a ToF camera system. Infineon and pmd have been cooperating for several years in the field of ToF for automotive and smartphone applications. With the acquisition, Infineon strengthens its long-term cooperation with pmd.
30 Additional information in accordance with HGB
Information pursuant to section 161 Stock Corporation Act (AktG)The Declaration of Compliance prescribed by section 161 AktG was drawn up by the Management Board and the Supervisory Board and made permanently available to the public on Infineon’s website. @ www.infineon.com/cms/en/about-infineon/investor/corporate-governance/declaration-of-compliance/
Accounting fees pursuant to section 314, paragraph 1, no. 9 HGBYear-end audit feesAt the Annual General Meeting held on 21 February 2019, the shareholders elected KPMG AG Wirtschaftsprüfungs-gesellschaft (“KPMG”), Munich, as auditor for the 2019 Separate Financial Statements and the Consolidated Finan-cial Statements of Infineon Technologies AG. The audit fees charged by KPMG in the 2019 fiscal year amounted to €1.9 million for the audit of the Consolidated Financial Statements and various Separate Financial Statements including an integrated audit review of the Interim Financial Statements.
Fees for other advisory servicesIn addition to the amounts described above, KPMG charged an aggregate of €0.8 million in the 2019 fiscal year for other audit services which mainly included the provision of a comfort letter as well as the audit of the disclosures in the Sustainability Report.
P see page 154 f.
186Consolidated Financial Statements Notes to the Consolidated Financial Statements
INFINEON TECHNOLOGIES | ANNUAL REPORT 2019
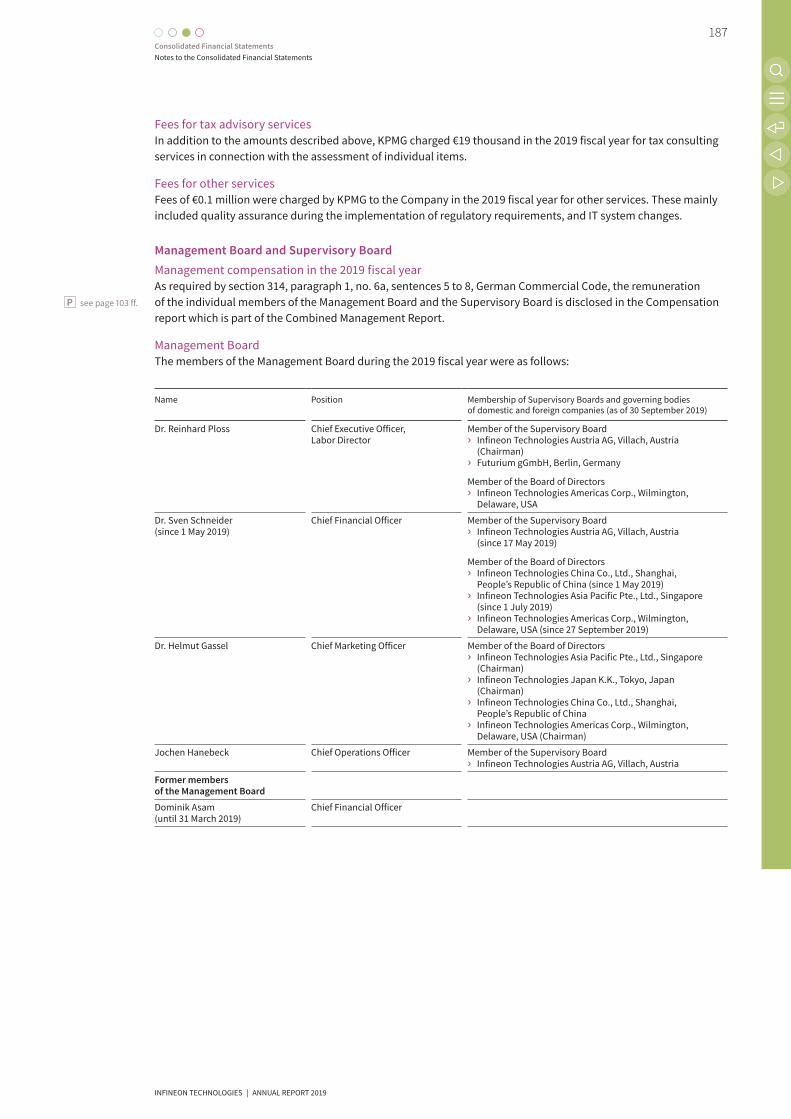
Fees for tax advisory servicesIn addition to the amounts described above, KPMG charged €19 thousand in the 2019 fiscal year for tax consulting services in connection with the assessment of individual items.
Fees for other servicesFees of €0.1 million were charged by KPMG to the Company in the 2019 fiscal year for other services. These mainly included quality assurance during the implementation of regulatory requirements, and IT system changes.
Management Board and Supervisory BoardManagement compensation in the 2019 fiscal yearAs required by section 314, paragraph 1, no. 6a, sentences 5 to 8, German Commercial Code, the remuneration of the individual members of the Management Board and the Supervisory Board is disclosed in the Compensation report which is part of the Combined Management Report.
Management Board The members of the Management Board during the 2019 fiscal year were as follows:
Name Position Membership of Supervisory Boards and governing bodies of domestic and foreign companies (as of 30 September 2019)
Dr. Reinhard Ploss Chief Executive Officer, Labor Director
Member of the Supervisory Board › Infineon Technologies Austria AG, Villach, Austria (Chairman) › Futurium gGmbH, Berlin, Germany
Member of the Board of Directors › Infineon Technologies Americas Corp., Wilmington, Delaware, USA
Dr. Sven Schneider (since 1 May 2019)
Chief Financial Officer Member of the Supervisory Board › Infineon Technologies Austria AG, Villach, Austria (since 17 May 2019)
Member of the Board of Directors › Infineon Technologies China Co., Ltd., Shanghai, People’s Republic of China (since 1 May 2019) › Infineon Technologies Asia Pacific Pte., Ltd., Singapore (since 1 July 2019) › Infineon Technologies Americas Corp., Wilmington, Delaware, USA (since 27 September 2019)
Dr. Helmut Gassel Chief Marketing Officer Member of the Board of Directors › Infineon Technologies Asia Pacific Pte., Ltd., Singapore (Chairman) › Infineon Technologies Japan K.K., Tokyo, Japan (Chairman) › Infineon Technologies China Co., Ltd., Shanghai, People’s Republic of China › Infineon Technologies Americas Corp., Wilmington, Delaware, USA (Chairman)
Jochen Hanebeck Chief Operations Officer Member of the Supervisory Board › Infineon Technologies Austria AG, Villach, Austria
Former members of the Management Board
Dominik Asam (until 31 March 2019)
Chief Financial Officer
P see page 103 ff.
187Consolidated Financial Statements Notes to the Consolidated Financial Statements
INFINEON TECHNOLOGIES | ANNUAL REPORT 2019

The Supervisory Board The members of the Supervisory Board during the 2019 fiscal year, the Supervisory Board position held by them, their occupation, and their membership of other supervisory and governing bodies are as follows:
Name Position Membership of Supervisory Boards and governing bodies of domestic and foreign companies (as of 30 September 2019)
Dr. Wolfgang Eder Chairman
Member of various supervisory and governing bodies
Member of the Supervisory Board › voestalpine AG, Linz, Austria
Johann Dechant 1 Deputy Chairman
Vice-Chairman of the Joint Works Council and Chairman of the Works Council Regensburg, Infineon Technologies AG
Member of the Administrative Board › SBK Siemens-Betriebskrankenkasse, Heidenheim/Brenz, Germany
Peter Bauer Independent Management Consultant, Coach
Member of the Supervisory Board › OSRAM Licht AG, Munich, Germany (Chairman) › OSRAM GmbH, Munich, Germany (Chairman) › Bragi GmbH, Munich, Germany (until 19 December 2018)
Dr. Herbert Diess Chairman of the Management Board, Volkswagen AG, Wolfsburg, Germany
Member of the Supervisory Board › Audi AG, Ingolstadt, Germany (Chairman) › FC Bayern München AG, Munich, Germany › Porsche Austria GmbH, Salzburg, Austria › Porsche Holding GmbH, Salzburg, Austria › Porsche Retail GmbH, Salzburg, Austria › SEAT S.A., Martorell, Spain (Chairman) › Skoda Auto a.s., Mladá Boleslav, Czech Republic (Chairman)
Member of the Board of Directors › FAW-Volkswagen Automotive Co., Ltd., Changchun, People’s Republic of China › Shanghai Volkswagen Automotive Co., Ltd., Anting, People’s Republic of China
Member of the Advisory Board › Porsche Holding GmbH, Salzburg, Austria
Annette Engelfried 1 Labor union secretary IG Metall district management, Berlin-Brandenburg-Saxony
Member of the Supervisory Board › Infineon Technologies Dresden Verwaltungs GmbH, Neubiberg, Germany › Siemens Gamesa Renewable Energy Management GmbH, Hamburg, Germany
Peter Gruber 1 Representative of Senior Management
Chief Financial Officer Operations, Infineon Technologies AG
Member of the Supervisory Board › Infineon Technologies Dresden Verwaltungs GmbH, Neubiberg, Germany
Gerhard Hobbach 1 Member of the Infineon Works Council, Campeon, Infineon Technologies AG
Hans-Ulrich Holdenried Independent Management Consultant
Member of the Supervisory Board › CANCOM SE, Munich, Germany
Member of the Advisory Board › Bridge imp GmbH, Grünwald, Germany
Prof. Dr. Renate Köcher Managing Director Institut für Demoskopie Allensbach GmbH, Allensbach, Germany
Member of the Supervisory Board › BMW AG, Munich, Germany › Robert Bosch GmbH, Gerlingen, Germany › Nestlé Deutschland AG, Frankfurt/Main, Germany
188Consolidated Financial Statements Notes to the Consolidated Financial Statements
INFINEON TECHNOLOGIES | ANNUAL REPORT 2019

Name Position Membership of Supervisory Boards and governing bodies of domestic and foreign companies (as of 30 September 2019)
Dr. Susanne Lachenmann 1 Leading Development Engineer
Géraldine Picaud Chief Financial Officer, LafargeHolcim Ltd., Jona, Switzerland
Member of the Board of Directors › Holcim Group Services Ltd, Holderbank, Switzerland › Holcim Technology Ltd, Jona, Switzerland › Lafarge Maroc SA, Casablanca, Morocco › LafargeHolcim Maroc SAS, Casablanca, Morocco › LafargeHolcim Maroc Afrique SAS, Casablanca, Morocco › Lafarge Africa Plc., Lagos State, Nigeria › Huaxin Cement Co., Ltd., Wuhan, People’s Republic of China
Dr. Manfred Puffer Independent Management Consultant
Member of the Supervisory Board › Athora Lebensversicherung AG, Wiesbaden, Germany › Nova KBM Bank, Maribor, Slovenia › EVO Finance, Madrid, Spain › Oldenburgische Landesbank AG, Oldenburg, Germany
Member of the Board of Directors › Athene Holding Ltd., Pembroke, Bermuda › Catalina Holdings (Bermuda) Ltd., Hamilton, Bermuda
Jürgen Scholz 1 First authorized agent of IG Metall Regensburg
Member of the Supervisory Board › Krones AG, Neutraubling, Germany
Member of the Administrative Board › BKK of BMW AG, Dingolfing, Germany
Kerstin Schulzendorf 1 Expert in the frontend-production, Infineon Technologies Dresden GmbH & Co. KG
Dr. Eckart Sünner Independent Attorney
Diana Vitale 1 Deputy Chairwoman of the Infineon Works Council, Warstein, Infineon Technologies AG
1 Employee representative
189Consolidated Financial Statements Notes to the Consolidated Financial Statements
INFINEON TECHNOLOGIES | ANNUAL REPORT 2019

Supervisory Board committees
Mediation Committee
Dr. Wolfgang Eder (Chairman)
Johann Dechant
Hans-Ulrich Holdenried
Jürgen Scholz
Executive Committee
Dr. Wolfgang Eder (Chairman)
Johann Dechant
Gerhard Hobbach
Hans-Ulrich Holdenried
Investment, Finance and Audit Committee
Dr. Eckart Sünner (Chairman)
Johann Dechant
Dr. Wolfgang Eder
Annette Engelfried
Strategy and Technology Committee
Peter Bauer (Chairman)
Dr. Wolfgang Eder
Peter Gruber
Hans-Ulrich Holdenried
Dr. Susanne Lachenmann
Jürgen Scholz
Nomination Committee
Dr. Wolfgang Eder (Chairman)
Prof. Dr. Renate Köcher
Dr. Manfred Puffer
The members of the Company’s Supervisory Board, individually or in aggregate, do not own more than 1 percent of Infineon Technologies AG’s outstanding share capital as of 30 September 2019.
The business address of each member of the Supervisory Board is: Infineon Technologies AG, Am Campeon 1–15, D–85579 Neubiberg (Germany).
190Consolidated Financial Statements Notes to the Consolidated Financial Statements
INFINEON TECHNOLOGIES | ANNUAL REPORT 2019

Subsidiaries, joint ventures and other companies (not consolidated) as of 30 September 2019
Name of company
Registered office
Share- holdings
in %
thereof Infineon Techno-
logies AG
Equity
(€ in millions)
Net result
(€ in millions)
Foot- note
Fully consolidated subsidiaries:
DICE Danube Integrated Circuit Engineering GmbH & Co. KG Linz, Austria 72 0 4.74 4.69 5
Hitex GmbH Karlsruhe, Germany 100 100 2.16 0.00 5, 11, 12
IFX LLC Wilmington, Delaware, USA 100 0 n.a. n.a. 10
IFX Merger Sub Inc. Wilmington, Delaware, USA 100 0 n.a. n.a. 10
Infineon Integrated Circuit (Beijing) Co., Ltd. Beijing, People’s Republic of China 100 0 15.03 1.58 9
Infineon Semiconductors (Wuxi) Co., Ltd. Wuxi, People’s Republic of China 100 0 42.44 2.74 9
Infineon Technologies (Advanced Logic) Sdn. Bhd. Melaka, Malaysia 100 0 40.52 4.27 5
Infineon Technologies (Kulim) Sdn. Bhd. Kulim, Malaysia 100 0 280.78 74.41 5
Infineon Technologies (Malaysia) Sdn. Bhd. Melaka, Malaysia 100 0 275.32 63.76 5
Infineon Technologies (Wuxi) Co., Ltd. Wuxi, People’s Republic of China 100 0 128.08 10.11 9
Infineon Technologies (Xi’an) Co., Ltd. Xi’an, People’s Republic of China 100 0 7.56 0.44 9
Infineon Technologies 2. Vermögensverwaltungsgesellschaft mbH Neubiberg, Germany 100 0 n.a. n.a. 10
Infineon Technologies Americas Corp. Wilmington, Delaware, USA 100 0 2,572.03 89.22 5
Infineon Technologies Asia Pacific Pte Ltd Singapore, Singapore 100 0 405.00 142.59 5
Infineon Technologies Australia Pty Limited Bayswater, Australia 100 0 1.55 0.12 5
Infineon Technologies Austria AG Villach, Austria 100 0.004 1,010.79 236.06 5
Infineon Technologies Batam PT Batam, Indonesia 100 0 16.67 3.72 5
Infineon Technologies Cegléd Kft. Cegléd, Hungary 100 0 16.67 0.86 5
Infineon Technologies Center of Competence (Shanghai) Co., Ltd. Shanghai, People’s Republic of China 100 0 3.40 0.19 9
Infineon Technologies China Co., Ltd. Shanghai, People’s Republic of China 100 0 177.98 10.97 9
Infineon Technologies Denmark ApS Herlev, Denmark 100 0 5.46 (0.39) 7
Infineon Technologies Dresden GmbH & Co. KG Dresden, Germany 100 100 224.27 0.00 5, 15
Infineon Technologies Dresden Verwaltungs GmbH Neubiberg, Germany 100 0 0.09 0.00 5, 11, 12
Infineon Technologies Epi Services, Inc. Wilmington, Delaware, USA 100 0 1.17 4.83 5
Infineon Technologies Finance GmbH Neubiberg, Germany 100 100 369.89 0.00 5, 11, 12
Infineon Technologies France S.A.S. St. Denis, France 100 0 9.46 0.64 5
Infineon Technologies Holding Asia Pacific Pte. Ltd. Singapore, Singapore 100 0 2,968.53 1,575.48 5
Infineon Technologies Holding B.V. Rotterdam, The Netherlands 100 100 3,382.16 424.92 5
Infineon Technologies Hong Kong Ltd. Hong Kong, People’s Republic of China 100 0 1.79 0.37 5
Infineon Technologies Hong Kong Sales Limited Hong Kong, People’s Republic of China 100 0 25.70 0.43 5
Infineon Technologies India Private Limited Bangalore, India 100 0 14.00 2.46 4
Infineon Technologies Investment B.V. Rotterdam, The Netherlands 100 0 0.12 (0.01) 5
Infineon Technologies Ireland Limited Dublin, Ireland 100 100 870.72 0.14 5
Infineon Technologies Italia s.r.l. Milan, Italy 100 0 3.01 1.67 5
Infineon Technologies IT-Services GmbH Klagenfurt, Austria 100 0 9.32 4.81 5
Infineon Technologies Japan K.K. Tokyo, Japan 100 0 29.85 6.56 5
Infineon Technologies Korea Co., LLC Seoul, Republic of Korea 100 0 4.84 1.28 5
Infineon Technologies Maasstad C.V. Rotterdam, The Netherlands 100 0 24.65 4.65 5
Infineon Technologies Newport Holding Limited Bristol, Great Britain 100 0 34.73 0.00 5
Infineon Technologies Nordic AB Kista, Sweden 100 0 4.98 0.31 5
Infineon Technologies Philippines, Inc. Muntinlupa City, Philippines 100 0 0.28 0.17 5
Infineon Technologies Power Semitech Co., Ltd. Cheonan, Republic of Korea 100 100 52.22 4.04 5
Infineon Technologies Reigate Limited Bristol, Great Britain 100 0 182.39 0.90 5
Infineon Technologies Romania & Co. Societate in Comandita Bucharest, Romania 100 0 3.78 1.54 5
Infineon Technologies Shared Service Center, Unipessoal Lda. Maia, Portugal 100 100 2.88 0.49 5
Infineon Technologies Taiwan Co., Ltd. Taipei, Taiwan 100 0 5.82 1.10 5
Infineon Technologies UK Limited Bristol, Great Britain 100 0 3.72 0.61 5
Infineon Technologies US HoldCo Inc. Wilmington, Delaware, USA 100 0 2,282.70 109.77 5
191Consolidated Financial Statements Notes to the Consolidated Financial Statements
INFINEON TECHNOLOGIES | ANNUAL REPORT 2019

Name of company
Registered office
Share- holdings
in %
thereof Infineon Techno-
logies AG
Equity
(€ in millions)
Net result
(€ in millions)
Foot- note
Infineon Technologies US InterCo LLC Wilmington, Delaware, USA 100 0 1,621.71 94.42 5
Infineon Technologies US Investment LLC Wilmington, Delaware, USA 100 0 0.00 0.00 5
Infineon Technologies Vermögensverwaltungsgesellschaft mbH Neubiberg, Germany 100 100 125.22 0.00 5, 11, 13
Innoluce B.V. Nijmegen, The Netherlands 100 0 3.00 1.67 5
International Rectifier HiRel Denmark ApS Herlev, Denmark 100 0 2.15 0.28 5
International Rectifier HiRel Products, Inc. Wilmington, Delaware, USA 100 0 140.38 45.48 5
International Rectifier Japan Co., Ltd. Tokyo, Japan 100 0 8.06 (0.01) 5
International Rectifier Mauritius, Inc. (in liquidation) Curepipe, Mauritius 100 0 1.39 0.00 5
MOLSTANDA Vermietungsgesellschaft mbH Neubiberg, Germany 100 6 133.40 0.00 5, 11, 12
MoTo Objekt CAMPEON GmbH & Co. KG Neubiberg, Germany 93 0 93.75 34.29 5.16
Rectificadores Internacionales, S.A. de C.V. Tijuana, Mexico 100 0 11.80 1.13 5
Siltectra GmbH Dresden, Germany 100 0 2.79 (3.50) 9
Joint ventures:
Infineon Technologies Bipolar GmbH & Co. KG Warstein, Germany 60 60 52.33 1.28 5
SAIC Infineon Automotive Power Modules (Shanghai) Co., Ltd. Shanghai, People’s Republic of China 49 25 8.06 (25.81) 8
Other companies (not consolidated):1
CHiL Semiconductors Corporation Wilmington, Delaware, USA 100 0 0.00 0.00 5
DICE Danube Integrated Circuit Engineering GmbH Linz, Austria 72 0 0.11 0.00 5
EPOS embedded core & power systems GmbH & Co. KG Duisburg, Germany 100 100 0.67 0.30 5
EPOS embedded core & power systems Verwaltungs GmbH Duisburg, Germany 100 100 0.06 0.00 5
Futurium gGmbH Berlin, Germany n.a. n.a. n.a. n.a. 14
Hitex (UK) Limited Coventry, Great Britain 100 0 1.70 0.16 5
Infineon Technologies Bipolar Verwaltungs GmbH Warstein, Germany 60 60 0.03 0.00 5
Infineon Technologies Campeon Verwaltungsgesellschaft mbH Neubiberg, Germany 100 0 0.07 0.02 5
Infineon Technologies Delta GmbH Neubiberg, Germany 100 100 0.02 0.00 5
Infineon Technologies Gamma GmbH Neubiberg, Germany 100 100 0.02 0.00 5
Infineon Technologies Holding GmbH Neubiberg, Germany 100 100 0.10 0.00 5.11
Infineon Technologies Iberia, S.L.U. Madrid, Spain 100 0 0.15 0.04 5
Infineon Technologies Mantel 26 AG Neubiberg, Germany 100 100 0.04 0.00 5
Infineon Technologies Mantel 27 GmbH Neubiberg, Germany 100 100 0.03 0.00 5, 11
Infineon Technologies Mantel 29 GmbH Neubiberg, Germany 100 100 0.03 0.00 5, 11
Infineon Technologies Mantel 32 GmbH Neubiberg, Germany 100 100 n.a. n.a. 10
Infineon Technologies Mantel 33 GmbH Neubiberg, Germany 100 100 n.a. n.a. 10
Infineon Technologies Polska Sp. z o.o. Warsaw, Poland 100 0 0.08 0.04 6
Infineon Technologies Romania s.r.l. Bucharest, Romania 100 0 0.05 0.01 9
Infineon Technologies RUS LLC Moscow, Russian Federation 100 0 0.21 0.05 9
Infineon Technologies South America Ltda São Paulo, Brazil 100 0 0.10 (0.01) 9
Infineon Technologies Vietnam Company Ltd. Hanoi, Vietnam 100 0 n.a. n.a. 10
IR International Holdings China, Inc. Wilmington, Delaware, USA 100 0 0.00 0.00 5
IR International Holdings, Inc. Wilmington, Delaware, USA 100 0 0.00 0.00 5
KAI Kompetenzzentrum Automobil- und Industrieelektronik GmbH Villach, Austria 100 0 0.09 0.00 9
KFE Kompetenzzentrum Fahrzeug Elektronik GmbH Lippstadt, Germany 24 24 1.71 (0.22) 9
Merus Audio (Hong Kong) Ltd. (in liquidation) Hong Kong, People’s Republic of China 100 0 0.00 0.00 3
Merus Audio, Inc. (in liquidation) Wilmington, Delaware, USA 100 0 0.00 0.00 3
Metawave Corporation Dover, Delaware, USA n.a. 0 n.a. n.a. 14
MicroLinks Technology Corp. Kaohsiung, Taiwan n.a. 0 n.a. n.a. 14
OSPT IP Pool GmbH Neubiberg, Germany 100 100 0.02 0.00 5
R Labco, Inc. Wilmington, Delaware, USA 100 0 0.00 0.00 5
192Consolidated Financial Statements Notes to the Consolidated Financial Statements
INFINEON TECHNOLOGIES | ANNUAL REPORT 2019
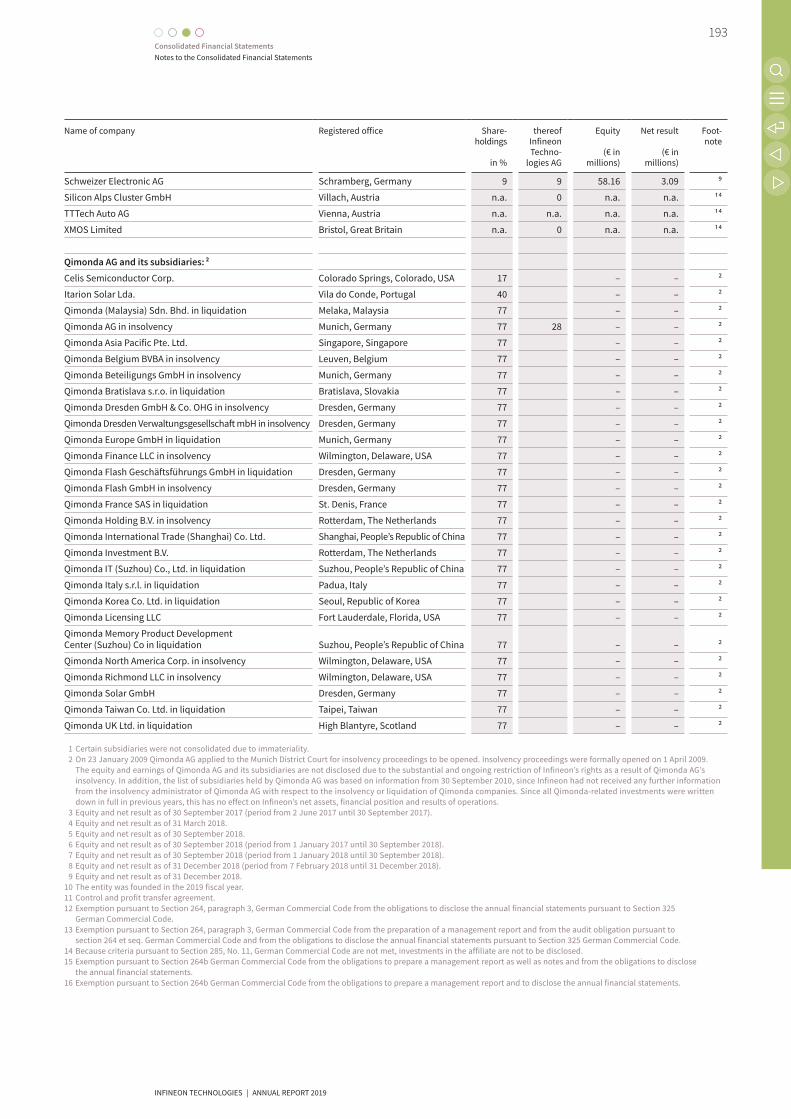
Name of company
Registered office
Share- holdings
in %
thereof Infineon Techno-
logies AG
Equity
(€ in millions)
Net result
(€ in millions)
Foot- note
Schweizer Electronic AG Schramberg, Germany 9 9 58.16 3.09 9
Silicon Alps Cluster GmbH Villach, Austria n.a. 0 n.a. n.a. 14
TTTech Auto AG Vienna, Austria n.a. n.a. n.a. n.a. 14
XMOS Limited Bristol, Great Britain n.a. 0 n.a. n.a. 14
Qimonda AG and its subsidiaries: 2
Celis Semiconductor Corp. Colorado Springs, Colorado, USA 17 – – 2
Itarion Solar Lda. Vila do Conde, Portugal 40 – – 2
Qimonda (Malaysia) Sdn. Bhd. in liquidation Melaka, Malaysia 77 – – 2
Qimonda AG in insolvency Munich, Germany 77 28 – – 2
Qimonda Asia Pacific Pte. Ltd. Singapore, Singapore 77 – – 2
Qimonda Belgium BVBA in insolvency Leuven, Belgium 77 – – 2
Qimonda Beteiligungs GmbH in insolvency Munich, Germany 77 – – 2
Qimonda Bratislava s.r.o. in liquidation Bratislava, Slovakia 77 – – 2
Qimonda Dresden GmbH & Co. OHG in insolvency Dresden, Germany 77 – – 2
Qimonda Dresden Verwaltungsgesellschaft mbH in insolvency Dresden, Germany 77 – – 2
Qimonda Europe GmbH in liquidation Munich, Germany 77 – – 2
Qimonda Finance LLC in insolvency Wilmington, Delaware, USA 77 – – 2
Qimonda Flash Geschäftsführungs GmbH in liquidation Dresden, Germany 77 – – 2
Qimonda Flash GmbH in insolvency Dresden, Germany 77 – – 2
Qimonda France SAS in liquidation St. Denis, France 77 – – 2
Qimonda Holding B.V. in insolvency Rotterdam, The Netherlands 77 – – 2
Qimonda International Trade (Shanghai) Co. Ltd. Shanghai, People’s Republic of China 77 – – 2
Qimonda Investment B.V. Rotterdam, The Netherlands 77 – – 2
Qimonda IT (Suzhou) Co., Ltd. in liquidation Suzhou, People’s Republic of China 77 – – 2
Qimonda Italy s.r.l. in liquidation Padua, Italy 77 – – 2
Qimonda Korea Co. Ltd. in liquidation Seoul, Republic of Korea 77 – – 2
Qimonda Licensing LLC Fort Lauderdale, Florida, USA 77 – – 2
Qimonda Memory Product Development Center (Suzhou) Co in liquidation Suzhou, People’s Republic of China 77 – – 2
Qimonda North America Corp. in insolvency Wilmington, Delaware, USA 77 – – 2
Qimonda Richmond LLC in insolvency Wilmington, Delaware, USA 77 – – 2
Qimonda Solar GmbH Dresden, Germany 77 – – 2
Qimonda Taiwan Co. Ltd. in liquidation Taipei, Taiwan 77 – – 2
Qimonda UK Ltd. in liquidation High Blantyre, Scotland 77 – – 2
1 Certain subsidiaries were not consolidated due to immateriality. 2 On 23 January 2009 Qimonda AG applied to the Munich District Court for insolvency proceedings to be opened. Insolvency proceedings were formally opened on 1 April 2009.
The equity and earnings of Qimonda AG and its subsidiaries are not disclosed due to the substantial and ongoing restriction of Infineon’s rights as a result of Qimonda AG’s insolvency. In addition, the list of subsidiaries held by Qimonda AG was based on information from 30 September 2010, since Infineon had not received any further information from the insolvency administrator of Qimonda AG with respect to the insolvency or liquidation of Qimonda companies. Since all Qimonda-related investments were written down in full in previous years, this has no effect on Infineon’s net assets, financial position and results of operations.
3 Equity and net result as of 30 September 2017 (period from 2 June 2017 until 30 September 2017). 4 Equity and net result as of 31 March 2018. 5 Equity and net result as of 30 September 2018. 6 Equity and net result as of 30 September 2018 (period from 1 January 2017 until 30 September 2018). 7 Equity and net result as of 30 September 2018 (period from 1 January 2018 until 30 September 2018). 8 Equity and net result as of 31 December 2018 (period from 7 February 2018 until 31 December 2018). 9 Equity and net result as of 31 December 2018.10 The entity was founded in the 2019 fiscal year.11 Control and profit transfer agreement.12 Exemption pursuant to Section 264, paragraph 3, German Commercial Code from the obligations to disclose the annual financial statements pursuant to Section 325
German Commercial Code.13 Exemption pursuant to Section 264, paragraph 3, German Commercial Code from the preparation of a management report and from the audit obligation pursuant to
section 264 et seq. German Commercial Code and from the obligations to disclose the annual financial statements pursuant to Section 325 German Commercial Code.14 Because criteria pursuant to Section 285, No. 11, German Commercial Code are not met, investments in the affiliate are not to be disclosed.15 Exemption pursuant to Section 264b German Commercial Code from the obligations to prepare a management report as well as notes and from the obligations to disclose
the annual financial statements.16 Exemption pursuant to Section 264b German Commercial Code from the obligations to prepare a management report and to disclose the annual financial statements.
193Consolidated Financial Statements Notes to the Consolidated Financial Statements
INFINEON TECHNOLOGIES | ANNUAL REPORT 2019

Neubiberg, 18 November 2019Infineon Technologies AG
Management Board
Dr. Reinhard Ploss Dr. Sven Schneider Dr. Helmut Gassel Jochen Hanebeck
194Consolidated Financial Statements Notes to the Consolidated Financial Statements
INFINEON TECHNOLOGIES | ANNUAL REPORT 2019

Further InformationResponsibility Statement by the Management Board
To the best of our knowledge, and in accordance with the applicable reporting principles, the Consolidated Financial Statements give a true and fair view of the assets, liabilities, financial position and profit or loss of the Group, and the Combined Management Report includes a fair review of the development and performance of the business and the position of the Group, together with a description of the principal opportunities and risks associated with the expected development of the Group.
Neubiberg, 22 November 2019
Infineon Technologies AG
Dr. Reinhard Ploss Dr. Sven Schneider Dr. Helmut Gassel Jochen Hanebeck
195Further Information Responsibility Statement by the Management Board
INFINEON TECHNOLOGIES | ANNUAL REPORT 2019

For the Consolidated Financial Statements and Group Management Report we have issued an unqualified auditor’s report. The English language text below is a translation of the auditor’s report. The original German text shall prevail in the event of any discrepancies between the English translation and the German original. We do not accept any liability for the use of, or reliance on, the English translation or for any errors of misunderstandings that may derive from the translation.
Independent Auditor’s ReportTo Infineon Technologies AG, Neubiberg
Report on the Audit of the Consolidated Financial Statements and of the Group Management Report
OpinionsWe have audited the consolidated financial statements of Infineon Technologies AG, Neubiberg, and its subsidiaries (the Group), which comprise the consolidated statement of financial position as at 30 September 2019, and the consolidated income statement, the consolidated statement of comprehensive income, consolidated statement of changes in equity and consolidated statement of cash flows for the financial year from 1 October 2018 to 30 Septem-ber 2019, and notes to the consolidated financial statements, including a summary of significant accounting policies. In addition, we have audited the combined management report of Infineon Technologies AG and of the Group (hereinafter: the “group management report”) for the financial year from 1 October 2018 to 30 September 2019.
In our opinion, on the basis of the knowledge obtained in the audit,
› the accompanying consolidated financial statements comply, in all material respects, with the IFRSs as adopted by the EU, and the additional requirements of German commercial law pursuant to Section 315e (1) HGB [Handels-gesetzbuch: German Commercial Code] and, in compliance with these requirements, give a true and fair view of the assets, liabilities, and financial position of the Group as at 30 September 2019, and of its financial performance for the financial year from 1 October 2018 to 30 September 2019, and
› the accompanying group management report as a whole provides an appropriate view of the Group’s position. In all material respects, this group management report is consistent with the consolidated financial statements, complies with German legal requirements and appropriately presents the opportunities and risks of future development.
Pursuant to Section 322 (3) sentence 1 HGB, we declare that our audit has not led to any reservations relating to the legal compliance of the consolidated financial statements and of the group management report.
Basis for the opinionsWe conducted our audit of the consolidated financial statements and of the group management report in accordance with Section 317 HGB and EU Audit Regulation No 537/2014 (referred to subsequently as “EU Audit Regulation”) and in compliance with German Generally Accepted Standards for Financial Statement Audits promulgated by the Institut der Wirtschaftsprüfer (IDW) [Institute of Public Auditors in Germany]. Our responsibilities under those require-ments and principles are further described in the “Auditor’s Responsibilities for the Audit of the Consolidated Financial Statements and of the Group Management Report” section of our auditor’s report. We are independent of the group entities in accordance with the requirements of European law and German commercial and professional law, and we have fulfilled our other German professional responsibilities in accordance with these requirements. In addition, in accordance with Article 10 (2) point (f) of the EU Audit Regulation, we declare that we have not provided non-audit services prohibited under Article 5 (1) of the EU Audit Regulation. We believe that the evidence we have obtained is sufficient and appropriate to provide a basis for our opinions on the consolidated financial statements and on the group management report.
196Further Information Independent Auditor’s Report
INFINEON TECHNOLOGIES | ANNUAL REPORT 2019

Key Audit Matters in the Audit of the Consolidated Financial StatementsKey audit matters are those matters that, in our professional judgement, were of most significance in our audit of the consolidated financial statements for the financial year from 1 October 2018 to 30 September 2019. These matters were addressed in the context of our audit of the consolidated financial statements as a whole, and in forming our opinion thereon, we do not provide a separate opinion on these matters.
Risks associated with the insolvency of Qimonda AGPlease refer to the notes to the consolidated financial statements for more information on the accounting policies applied. The assessment of the underlying assumptions is presented under note 2 and disclosures on legal risks under note 23.
The financial statement riskFor the risks associated with the insolvency of Qimonda AG, provisions in the amount of EUR 205 million were recognized as at 30 September 2019 (as at 30 September 2018: EUR 185 million). There also are disclosures on contingent liabilities and further explanatory notes in the notes to the financial statements.
With economic effect from 1 May 2006, all material assets and liabilities as well as business activities relating to the memory business were spun off from Infineon Technologies AG to Qimonda AG as a non-cash contribution. On 23 January 2009, Qimonda AG filed an application to open insolvency proceedings with the Munich District Court, which commenced on 1 April 2009. The insolvency of Qimonda AG resulted in various legal disputes between the insolvency administrator and Infineon AG. The focus of this litigation is on claims asserted by the insolvency adminis-trator with respect to the valuation of the non-cash contributions to Qimonda AG. Infineon had the non-cash contributions valued by an independent expert. On 21 September 2018 the court-appointed independent expert presented his preliminary valuation of the earnings value of non-cash contributions (in a range) in the form of an interim report.
The recognition of a provision, explanatory notes on contingent liabilities or further disclosures on risks arising from the insolvency of Qimonda AG are largely dependent upon the estimates and assumptions of the Management Board taking into account the interim report from the court-appointed independent expert. The same applies to the valuation of provisions made. Consequently, there are risks with respect to the presentation of the related risks in compliance with accounting standards as well as their valuation.
Our audit approachIn the course of our audit we assessed the process established by the Company to ensure the documentation, assessment of the outcome of proceedings and reporting of litigation in the financial statements.
We had regular meetings with the Management Board and legal department of the Company to gain an understanding of current developments and reasons for the judgements in question. We obtained a written statement in this regard from the Company. We verified the assessment of the probability of utilization undertaken by the Management Board by inspecting the documents underlying the Management Board’s estimates, in particular the written statement from the court-appointed independent expert.
We obtained an external legal opinion to review the Management Board’s risk assessment.
Furthermore, we consulted the valuation expert appointed by the Company regarding the opinions drawn up in connection with the Company’s defence against the claims asserted by the insolvency administrator and assessed the appropriateness of the method applied with the assistance of a valuation expert.
Finally, we ascertained the completeness of disclosures on contingent liabilities as well as other disclosures in the notes.
Our observationsThe Management Board’s assumptions are reasonable and balanced overall. The disclosures on contingent liabilities and other disclosures in the notes are complete and adequate.
Risks in connection with the financial instruments for hedging USD foreign currency risks as part of the planned acquisition of Cypress Semiconductor Corp. (“Cypress”)Please refer to the notes to the consolidated financial statements for more information on the accounting policies applied. The assumptions underlying the assessment are presented under note 2. Disclosures on the planned acquisition are presented under note 3 and the associated financial instruments under note 26.
197Further Information Independent Auditor’s Report
INFINEON TECHNOLOGIES | ANNUAL REPORT 2019

The financial statement riskOn 2/3 June 2019, Infineon Technologies AG concluded an agreement for the acquisition of Cypress. On 3 June 2019, the Company concluded two deal-contingent EUR/USD hedging transactions. A foreign currency forward trans action (“deal contingent forward”) and a foreign currency option (“deal contingent option”) each with a nominal value in USD equivalent to EUR 3.3 billion were designated as cash flow hedges. The hedging transactions were recognized accordingly as cash flow hedges.
As at 30 September 2019, Infineon reports the accounting effects of the derivative financial instruments concluded to partially hedge the foreign currency risks arising from the planned acquisition of Cypress under other assets in the amount of EUR 210 million and under other liabilities in the amount of EUR 112 million. The change in the fair value of the derivative financial instruments since the designation date resulted in an effect recognized directly in equity of EUR 98 million in financial year 2019.
At the beginning and throughout the hedging transaction, the Company reviews the effectiveness of the hedge with regard to the existence of an economic relationship between the hedged item and the hedging instrument as well as the effects of the default risk on the value of the hedging instrument and the hedged item. In addition, the actual economic hedge ratio of the hedging relationship is continuously checked by the Company. In addition, the Company assesses the completion of the acquisition to be highly probable.
The assessment of the probability of the planned acquisition being completed as well as the evaluation of the effec-tiveness of the hedge and the valuation of the financial instruments require judgement. According to the relevant provisions, an explanation of the derivative financial instruments must be provided in the notes to the consolidated financial statements.
There is the risk for the consolidated financial statements that the financial instruments for hedging foreign currency risk do not meet the requirements for designation as a cash flow hedge pursuant to IFRS 9. Furthermore, there is a risk that the valuation of the financial instruments, due to the associated complexity and judgement required, lies outside of an acceptable range. There is also the risk of incomplete and inappropriate disclosures in the notes.
Our audit approachWith the involvement of our in-house experts, we assessed among other matters the appropriateness of the valua-tion model and the designation option in general. To that end, we first gained an understanding of the planned acquisition by consulting management and employees of the finance department and through an evaluation of the relevant agreements.
We assessed the competence, professional skills and impartiality of the independent consultant engaged by Infineon. The consultant prepared both the conceptual design of the currency hedges and the underlying model for the valuation of the derivatives in a hedge. We examined this model with regard to the accuracy of the model’s approach, appropriate exercise of judgement and the implementation of the modelling. In the course of our audit of the valuation of the derivative financial instruments, we assessed the key underlying contractual parameters and other parameters relevant for the valuation.
We evaluated the Company’s assessment underlying the designation of the financial instruments based on the information on the status of the acquisition available as at the date of issuing the independent auditor’s report. As well as the financing of the total purchase price, this information also included in particular the assessment of the economic relationship between the hedged item and the hedging instrument, the effect of the default risk and the hedge ratio. Furthermore, we incorporated the approval of the extraordinary general meeting of Cypress as well as the interviews with management on obtaining approval from antitrust authorities in our evaluation.
Finally, we assessed whether the disclosures in the notes regarding the planned acquisition of Cypress were complete and accurate.
198Further Information Independent Auditor’s Report
INFINEON TECHNOLOGIES | ANNUAL REPORT 2019

Our observationsThe approach used for the valuation of the derivative financial instruments is appropriate and in line with the applicable accounting policies. The accounting treatment and the description in the notes to the consolidated financial statements are complete and appropriate.
Other InformationThe Management Board is responsible for the other information. The other information comprises the annual report, with the exception of the audited consolidated financial statements and group management report and our auditor’s report.
Our opinions on the consolidated financial statements and on the group management report do not cover the other information, and consequently we do not express an opinion or any other form of assurance conclusion thereon.
In connection with our audit, our responsibility is to read the other information and, in so doing, to consider whether the other information
› is materially inconsistent with the consolidated financial statements, with the group management report or our knowledge obtained in the audit, or
› otherwise appears to be materially misstated.
If, based on the work we have performed, we conclude that there is a material misstatement of this other information, we are required to report that fact. We have nothing to report in this regard.
Responsibilities of Management and the Supervisory Board for the Consolidated Financial Statements and the Group Management ReportThe Management Board is responsible for the preparation of consolidated financial statements that comply, in all material respects, with IFRSs as adopted by the EU, and the additional requirements of German commercial law pursuant to Section 315e (1) HGB and that the consolidated financial statements, in compliance with these require-ments, give a true and fair view of the assets, liabilities, financial position, and financial performance of the Group. In addition, the Management Board is responsible for such internal control as they have determined necessary to enable the preparation of consolidated financial statements that are free from material misstatement, whether due to fraud or error.
In preparing the consolidated financial statements, the Management Board is responsible for assessing the Group’s ability to continue as a going concern. They also have the responsibility for disclosing, as applicable, matters related to going concern. In addition, they are responsible for financial reporting based on the going concern basis of accounting unless there is an intention to liquidate the Group or to cease operations, or there is no realistic alternative but to do so.
Furthermore, the Management Board is responsible for the preparation of the group management report that, as a whole, provides an appropriate view of the Group’s position and is, in all material respects, consistent with the consolidated financial statements, complies with German legal requirements, and appropriately presents the opportunities and risks of future development. In addition, the Management Board is responsible for such arrangements and measures (systems) as they have considered necessary to enable the preparation of a group management report that is in accordance with the applicable German legal requirements, and to be able to provide sufficient appropriate evidence for the assertions in the group management report.
The Supervisory Board is responsible for overseeing the Group’s financial reporting process for the preparation of the consolidated financial statements and of the group management report.
199Further Information Independent Auditor’s Report
INFINEON TECHNOLOGIES | ANNUAL REPORT 2019

Auditor’s Responsibilities for the Audit of the Consolidated Financial Statements and of the Group Management ReportOur objectives are to obtain reasonable assurance about whether the consolidated financial statements as a whole are free from material misstatement, whether due to fraud or error, and whether the group management report as a whole provides an appropriate view of the Group’s position and, in all material respects, is consistent with the consolidated financial statements and the knowledge obtained in the audit, complies with the German legal require-ments and appropriately presents the opportunities and risks of future development, as well as to issue an auditor’s report that includes our opinions on the consolidated financial statements and on the group management report.
Reasonable assurance is a high level of assurance, but is not a guarantee that an audit conducted in accordance with Section 317 HGB and the EU Audit Regulation and in compliance with German Generally Accepted Standards for Financial Statement Audits promulgated by the Institut der Wirtschaftsprüfer (IDW) will always detect a material misstatement. Misstatements can arise from fraud or error and are considered material if, individually or in the aggregate, they could reasonably be expected to influence the economic decisions of users taken on the basis of these consolidated financial statements and this group management report.
We exercise professional judgement and maintain professional skepticism throughout the audit. We also:
› Identify and assess the risks of material misstatement of the consolidated financial statements and of the group management report, whether due to fraud or error, design and perform audit procedures responsive to those risks, and obtain audit evidence that is sufficient and appropriate to provide a basis for our opinions. The risk of not detecting a material misstatement resulting from fraud is higher than for one resulting from error, as fraud may involve collusion, forgery, intentional omissions, misrepresentations, or the override of internal controls.
› Obtain an understanding of internal control relevant to the audit of the consolidated financial statements and of arrangements and measures (systems) relevant to the audit of the group management report in order to design audit procedures that are appropriate in the circumstances, but not for the purpose of expressing an opinion on the effectiveness of these systems.
› Evaluate the appropriateness of accounting policies used by the Management Board and the reasonableness of estimates made by the Management Board and related disclosures.
› Conclude on the appropriateness of the Management Board’s use of the going concern basis of accounting and, based on the audit evidence obtained, whether a material uncertainty exists related to events or conditions that may cast significant doubt on the Group’s ability to continue as a going concern. If we conclude that a material uncertainty exists, we are required to draw attention in the auditor’s report to the related disclosures in the consolidated financial statements and in the group management report or, if such disclosures are inadequate, to modify our respective opinions. Our conclusions are based on the audit evidence obtained up to the date of our auditor’s report. However, future events or conditions may cause the Group to cease to be able to continue as a going concern.
› Evaluate the overall presentation, structure and content of the consolidated financial statements, including the disclosures in the notes, and whether the consolidated financial statements present the underlying transactions and events in a manner that the consolidated financial statements give a true and fair view of the assets, liabilities, financial position and financial performance of the Group in compliance with IFRSs as adopted by the EU and the additional requirements of German commercial law pursuant to Section 315e (1) HGB.
› Obtain sufficient appropriate audit evidence regarding the financial information of the entities or business activities within the Group to express opinions on the consolidated financial statements and on the group management report. We are responsible for the direction, supervision and performance of the group audit. We remain solely responsible for our opinions.
200Further Information Independent Auditor’s Report
INFINEON TECHNOLOGIES | ANNUAL REPORT 2019

› Evaluate the consistency of the group management report with the consolidated financial statements, its conformity with [German] law, and the view of the Group’s position it provides.
› Perform audit procedures on the prospective information presented by the Management Board in the group management report. On the basis of sufficient appropriate audit evidence we evaluate, in particular, the signifi-cant assumptions used by the Management Board as a basis for the prospective information, and evaluate the proper derivation of the prospective information from these assumptions. We do not express a separate opinion on the prospective information and on the assumptions used as a basis. There is a substantial unavoidable risk that future events will differ materially from the prospective information.
We communicate with those charged with governance regarding, among other matters, the planned scope and tim-ing of the audit and significant audit findings, including any significant deficiencies in internal control that we iden-tify during our audit.
We also provide those charged with governance with a statement that we have complied with the relevant independence requirements, and communicate with them all relationships and other matters that may reasonably be thought to bear on our independence, and where applicable, the related safeguards.
From the matters communicated with those charged with governance, we determine those matters that were of most significance in the audit of the consolidated financial statements of the current period and are therefore the key audit matters. We describe these matters in our auditor’s report unless law or regulation precludes public disclosure about the matter.
Further Information pursuant to Article 10 of the EU Audit Regulation
We were elected as group auditor at the shareholders’ meeting on 21 February 2019. We were engaged by the Supervisory Board on 9 May 2019. We have been the group auditor of Infineon Technologies AG without interruption since financial year 1999/2000.
We declare that the opinions expressed in this auditor’s report are consistent with the additional report to the Audit Committee pursuant to Article 11 of the EU Audit Regulation (long-form audit report).
German Public Auditor Responsible for the Engagement
The German Public Auditor responsible for the engagement is Michael Pritzer.
Munich, 22 November 2019
KPMG AGWirtschaftsprüfungsgesellschaft
Andrejewski PritzerWirtschaftsprüfer Wirtschaftsprüfer(German Public Auditor) (German Public Auditor)
201
INFINEON TECHNOLOGIES | ANNUAL REPORT 2019
201Further Information Independent Auditor’s Report
INFINEON TECHNOLOGIES | ANNUAL REPORT 2019

List of AbbreviationsAI Artificial intelligence
ASIC Application-specific integrated circuit
BLDC Brushless direct current
CAN Controller area network
CMOS Complementary metal-oxide-semiconductor
FACTS Flexible alternating current transmission system
FHEV Full hybrid electric vehicles
GaN Galliumnitride
GPS Global positioning system
HMI Human machine interaction
HVDC High-voltage DC transmission
IC Integrated circuit
IGBT Insulated gate bipolar transistor
IPM Intelligent power module
LED Light-emitting diode
LIN Local interconnected network
MEMS Micro-electromechanical system
MOSFET Metal-oxide-semiconductor field-effect transistor
NFC Near-field communication
PHEV Plug-in hybrid electric vehicles
RF Radio frequency
SiC Siliconcarbide
ToF Time-of-flight
TPM Trusted platform module
VSD Variable speed drive
202
INFINEON TECHNOLOGIES | ANNUAL REPORT 2019
Further Information List of Abbreviations

Financial calendarWednesday, 5 February 2020 1Publication of first quarter 2020 results
Thursday, 20 February 2020Annual General Meeting 2020 (Start 10:00 a.m. CET) ICM – International Congress Center Munich (Germany)
Tuesday, 5 May 2020 1Publication of second quarter 2020 results
Tuesday, 4 August 2020 1Publication of third quarter 2020 results
Monday, 9 November 2020 1Publication of fourth quarter and fiscal year 2020 results
1 preliminary
Visit us on the web: www.infineon.com
203Further Information Financial calendar

INFINEON TECHNOLOGIES | GESCHÄFTSBERICHT 2019
204Further Information Imprint
ImprintPublished by: Infineon Technologies AG, Neubiberg (Germany)Editors: Investor Relations, Accounting, Consolidation & ReportingCopy deadline: 22 November 2019Fiscal year: 1 October to 30 September Independent auditors: KPMG AG Wirtschaftsprüfungsgesellschaft, Munich (Germany) Designed by: HGB Hamburger Geschäftsberichte GmbH & Co. KG, Hamburg (Germany)Photography: Cover: Deutscher Zukunftspreis 2015, laureate Infineon,
photographer Ansgar Pudenz, Hamburg (Germany) Page 2, 6 – 7: Werner Bartsch, Hamburg (Germany)
Printing: G. Peschke Druckerei GmbH, Parsdorf (Germany)
NoteThe following were brand names of Infineon Technologies AG in the 2018 fiscal year: Infineon, das Infineon-Logo, AURIX™, CIPOS™, CIPURSE™, CoolGaN™, CoolMOS™, CoolSiC™, iMOTION™, OPTIGA™, OptiMOS™, PrimePACK™, REAL3™, SECORA™, XENSIV™.

Forward-looking statementsThis report contains forward-looking statements about the business, financial condition and earnings performance of the Infineon Group. These statements are based on assumptions and projections resting upon currently available information and present estimates. They are subject to a multitude of uncertainties and risks. Actual business development may there-fore differ materially from what has been expected. Beyond disclosure requirements stipulated by law, Infineon does not undertake any obligation to update forward-looking statements.
Specific disclaimer for Informa Tech – former IHS Markit Technology – reports, data and information referenced in this document:The Informa Tech reports, data and information referenced herein (the „Informa Tech Materials – mostly former IHS Markit Technology Materials“) are the copyrighted property of Informa Tech Research Ltd. and its subsidiaries („Informa Tech“) and represent data, research, opinions or viewpoints published by Informa Tech, and are not representations of fact. The Informa Tech Materials speak as of the original publication date thereof and not as of the date of this document. The infor-mation and opinions expressed in the Informa Tech Materials are subject to change without notice and neither Informa Tech nor, as a consequence, Infineon have any duty or responsibility to update the Informa Tech Materials or this publication as a result. Informa Tech Materials are delivered on an „as-is“ and „as-available“ basis. No representation or warranty, express or implied, is made as to the fairness, accuracy, completeness or correctness of the information, opinions and conclusions contained in the Informa Tech Materials. To the maximum extent permitted by law, Informa Tech and its affiliates, IHS Markit and its Affiliates and their respective, officers, directors, employees and agents, disclaim any liability (including, without limitation, any liability arising from fault or negligence) as to the accuracy or completeness or use of the Informa Tech Materials. Informa Tech and/or IHS Markit will not, under any circumstance whatsoever, be liable for any trading, investment, commercial or other decisions based on or made in reliance of the Informa Tech Materials. The „IHS Markit“ brand and logo have been licensed for use by Informa Tech. The „IHS Markit“ brand and logo and any third-party trademarks used in the IHS Markit Technology Materials are the sole property of IHS Markit Group or their respective third-party owners.
Specific disclaimer for IHS Markit – reports, data and information referenced in this document: The IHS Markit reports, data and information referenced herein (the „IHS Markit Materials“) are the copyrighted property of IHS Markit Ltd. and its subsidiaries („IHS Markit“) and represent data, research, opinions or viewpoints published by IHS Markit, and are not representations of fact. The IHS Markit Materials speak as of the original publication date thereof and not as of the date of this document. The information and opinions expressed in the IHS Markit Materials are subject to change without notice and neither IHS Markit nor, as a consequence, Infineon have any duty or responsibility to update the IHS Markit Materials or this publication. Moreover, while the IHS Markit Materials reproduced herein are from sources considered reliable, the accuracy and completeness thereof are not warranted, nor are the opinions and analyses which are based upon it. IHS Markit and the trademarks used in the Data, if any, are trademarks of IHS Markit. Other trademarks appearing in the IHS Markit Materials are the property of IHS Markit or their respective owners.

INFINEON TECHNOLOGIES AGHeadquarters: Am Campeon 1– 15, D-85579 Neubiberg near Munich (Germany), Phone + 49 89 234 - 0Contact for Investors and Analysts: [email protected], Phone + 49 89 234 - 26655, Fax + 49 89 234 - 955 2987Media Contact: [email protected], Phone + 49 89 234 - 28480, Fax + 49 89 234 - 955 4521Visit us on the web: www.infineon.com