digital innovation in the mining, oil and gas extraction
TRANSCRIPT
Digital Innovation in the Mining, Oil and Gas Extraction, and Construction Industries in Saskatchewan
A Thesis Submitted to the
College of Graduate and Postdoctoral Studies In Partial Fulfillment of the Requirements For the Degree of Master of Public Policy
In the Johnson Shoyama Graduate School of Public Policy University of Saskatchewan
Saskatoon
By
Aaron R. Hertes
© Copyright Aaron R. Hertes, 2021. All rights reserved. Unless otherwise noted, copyright of the material in this thesis belongs to the author.

i
Permission to Use
In presenting this thesis/dissertation in partial fulfillment of the requirements for a Postgraduate degree from the University of Saskatchewan, I agree that the Libraries of this University may make it freely available for inspection. I further agree that permission for copying of this thesis/dissertation in any manner, in whole or in part, for scholarly purposes may be granted by the professor or professors who supervised my thesis/dissertation work or, in their absence, by the Head of the Department or the Dean of the College in which my thesis work was done. It is understood that any copying or publication or use of this thesis/dissertation or parts thereof for financial gain shall not be allowed without my written permission. It is also understood that due recognition shall be given to me and to the University of Saskatchewan in any scholarly use which may be made of any material in my thesis/dissertation.
Requests for permission to copy or to make other uses of materials in this thesis/dissertation in whole or part should be addressed to:
Head of the Johnson Shoyama Graduate School of Public Policy 101 Diefenbaker Place University of Saskatchewan Saskatoon, Saskatchewan S7N 5B8 Canada
OR
Dean College of Graduate and Postdoctoral Studies University of Saskatchewan 116 Thorvaldson Building, 110 Science Place Saskatoon, Saskatchewan S7N 5C9 Canada
ii
Abstract
This thesis discusses the need for a change in perspective in Canadian innovation policy
frameworks, explores the innovation ecosystems perspective and what it might add to public
policy, and applies this perspective to investigate innovation in the mining, oil and gas extraction,
and construction industries in Saskatchewan. The negative multifactor productivity (MFP) growth
experienced in these industries over the last two decades suggests that these industries experience
significant innovation challenges and public intervention may be merited. The study focuses on
digital technology adoption as digital transformation will be key in overcoming several megatrends
that threaten to disrupt Canada’s economy. The study is confined to firms in Saskatchewan for
feasibility and because the industries of study represent a significant share of the provincial
economy. Data was collected in 24 interviews with firms’ representatives. The results provide
several directions for policy intervention in the three industries, some of which would not have
been identified using conventional approaches. This is most evident for the construction industry
where the prevalence of small firms, diversity of technology, and the need for simultaneous
adoption of similar technology by many firms create significant financial, capacity, and
coordination challenges for the industry.

iii
Acknowledgements
I thank the members of my supervisory committee, Dr. Peter W.B. Phillips, Dr. Brian
Wixted, and Dr. Ken Coates, for the guidance given throughout the thesis process, with special
thanks to Dr. Wixted who pushed me to strive for relevance and through many Skype sessions
helped me figure out just what this project was.
I thank all of the JSGS staff for all the support they have given me over the years, with
special thanks to Bethany Penn who handled all the project funds and contracts, and generally
made sure the important things got done on time.
I thank Elaine Robertson and her family, and Dr. Catherine Beaudry and the Partnership
for the Organization of Innovation and New Technologies (4POINT0) for providing me with
funding for this project and supporting me through my time at JSGS.
I thank all of my participants, who will have to go unnamed for ethics reasons, because
without their generous donations of time this project would not have been possible.
I thank Lea Burnard, Rachel Tang, and the staff at the Social Sciences Research Laboratory
for transcribing my interviews.
Finally, I thank my good friend Canute Rosaasen for the feedback and emotional support
he has given me over the past several years. Without him, this thesis would not have been finished.

iv
Dedication
For Jesse and Ben. Never stop growing.

v
Table of Contents
Permission to Use……………….…………….…………………………………….……..……….i Abstract…………………………………………………………………...……...…..……...…….ii Acknowledgements……………………….………………………..…….....……...….…………iii Dedication…………………………………………………………..……………...……….…….iv Table of Contents………………..…………………………….………………………….….……v List of Tables…………………………………………………….…………….….................……vi List of Figures…………………….……………………………..……….…..……………..……vii List of Abbreviations…………………………………….……………………………..……….viii 1. Introduction………………………………………………..……………….…..………….........1 2. Canada’s Innovation Problem: Challenges, Definition, and New Directions..............................5
2.1. Constructing Canada’s Innovation Problem……..………………….….…………..…7 2.2. A New Perspective: Innovation Ecosystems…………………………………………16 2.3. A New Perspective: Consideration of Firm-Level Factors……………………….…20 2.4. A New Perspective: Supporting the Demand Side of Innovation……………………24 2.5. Digital Innovation in Mining, Oil and Gas Extraction, and Construction….………..28
3. Methods…………………………………………………………………………………….….31 4. Results and Discussion……………………………………………………………………..….36 4.1. Mining…………………………………………………………………………….…36 4.2. Oil and Gas Extraction………………………………………………………………46 4.3. Construction……………………………………………………………………..…..57 5. Conclusions and Limitations………………………………………………………………..…71 Bibliography ……………………………….…………………………………………………….76 Appendix: Additional Findings...……………………...……………..………...……………...…86 A.1. Mining.……………………………………….…………………………………......86 A.2. Construction .……………………………………….…………...………………….87 A.3. Oil and Gas Extraction ……………………………….……………………………..88 Certificate of Approval………………………………………………..……………...…………..91 Consent Form…………………………………………………..……………………...…………92 Transcript and Quotation Release Form……………………..……………………...……………95 Original Interview Questions………………………………….…………………………………96

vi
List of Tables
Table 2.1: GDP by industry in Saskatchewan, 2018…………………………………...………..30
vii
List of Figures
Figure 2.1: GDP per Capita (USD 2015, Constant Prices, Constant PPP)…………………....……5 Figure 2.2: Business Profits as a percentage of Operating Revenue……………………………….5 Figure 2.3: Innovative and Innovation-active firms as a percentage of total firms………………..8 Figure 2.4a: GERD Intensity, 2000-2018………………………………………………………….9 Figure 2.4b: R&D intensities by performing sector………………………………………………..9 Figure 2.4c: BERD Intensity, 2000-2018………………………………………………………….9 Figure 2.5: Relative Canada-U.S. ICT Investment…………………………………………….....10 Figure 2.6: Contribution of ICT capital deepening to labour productivity for selected OECD countries……………………...…………..12 Figure 2.7: Contribution of multifactor productivity (MFP) growth to labour productivity growth in selected OECD countries………..…………13 Figure 2.8: Number of programs focusing on specific sectors…………………………………...23 Figure 2.9: Focus of Innovation Programs………………….……………………………………27 Figure 4.1: Mining and Quarrying (Except Oil and Gas) Share of GDP and Exports by Jurisdiction……………………………………...……37 Figure 4.2: Mining and Quarrying (Except Oil and Gas) Share of Total, Indigenous, and Female Employment, 2016…………………...……38 Figure 4.3: Oil and Gas Extraction Share of GDP and Exports by Jurisdiction………….………48 Figure 4.4: Oil and Gas Extraction Share of Total, Indigenous, and Female Employment, 2016…………………………………………48 Figure 4.5: Oil Prices - West Texas Intermediate (WTI) and Western Canadian Select (WCS)….50 Figure 4.6: Construction Share of GDP and Exports by Jurisdiction…………………………….59 Figure 4.7: Construction share of Total, Indigenous, and Female Employment, 2016………..…60

viii
List of Abbreviations
AI = Artificial Intelligence BERD = Business Enterprise Expenditures on Research and Development BIM = Building Information Modelling CAGR = Compound Annual Growth Rate CFI = Canada Foundation for Innovation CIHR = Canada Institutes for Health Research CMIC = Canadian Mining Innovation Council CRCP = Canada Research Chairs Program GDP = Gross Domestic Product GERD = Gross Expenditures on Research and Development GOVERD = Government Expenditures on Research and Development HERD = Higher Education Expenditures on Research and Development ICT = Information Communication Technology IoT = Internet of Things IP = Intellectual Property IPR = Intellectual Property Rights IRAP = Industrial Research Assistance Program MFP = Multifactor Productivity NCE = National Centres of Excellence OECD = Organization for Economic Cooperation and Development PERD = Public Expenditures on Research and Development PPP = Purchasing Power Parity PST = Provincial Sales Tax R&D = Research and Development SIF = Strategic Innovation Fund SPII = Saskatchewan Petroleum Innovation Incentive SR&ED = Scientific Research and experimental development tax credit STI = Science, Technology, and Innovation USD = U.S. Dollars VCCI = Venture Capital Catalyst Initiative WCS = Western Canadian Select WTI = West Texas Intermediate
1
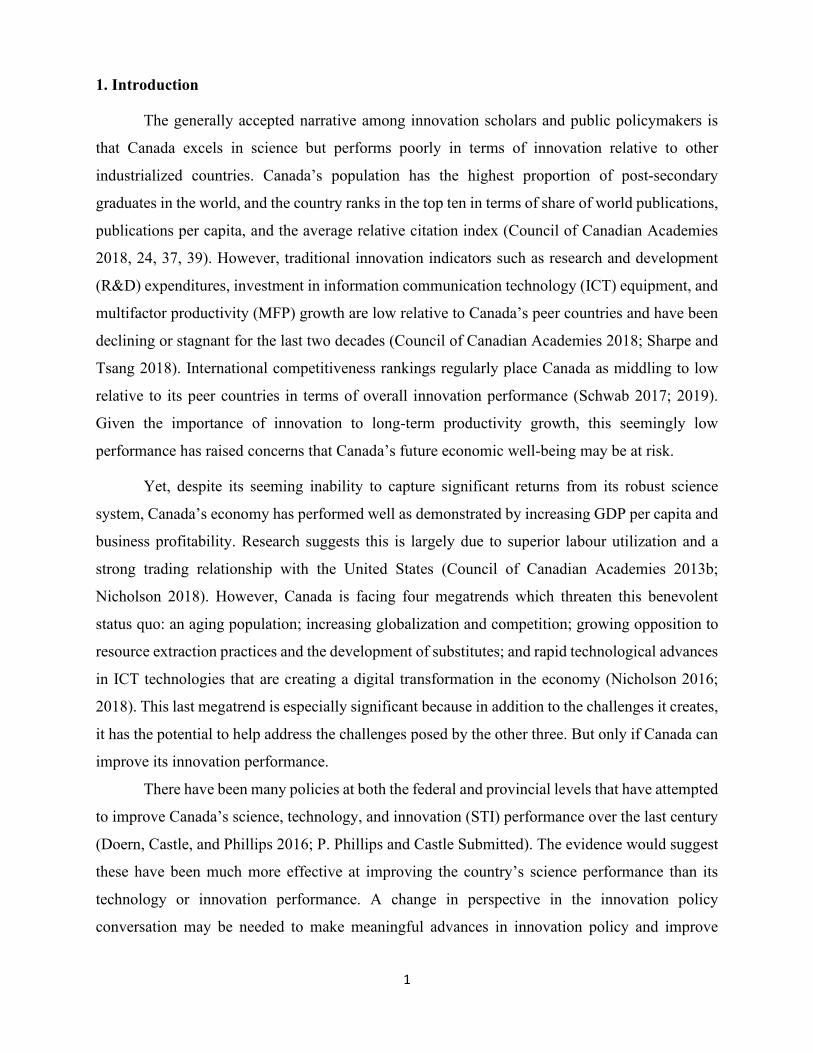
1. Introduction
The generally accepted narrative among innovation scholars and public policymakers is
that Canada excels in science but performs poorly in terms of innovation relative to other
industrialized countries. Canada’s population has the highest proportion of post-secondary
graduates in the world, and the country ranks in the top ten in terms of share of world publications,
publications per capita, and the average relative citation index (Council of Canadian Academies
2018, 24, 37, 39). However, traditional innovation indicators such as research and development
(R&D) expenditures, investment in information communication technology (ICT) equipment, and
multifactor productivity (MFP) growth are low relative to Canada’s peer countries and have been
declining or stagnant for the last two decades (Council of Canadian Academies 2018; Sharpe and
Tsang 2018). International competitiveness rankings regularly place Canada as middling to low
relative to its peer countries in terms of overall innovation performance (Schwab 2017; 2019).
Given the importance of innovation to long-term productivity growth, this seemingly low
performance has raised concerns that Canada’s future economic well-being may be at risk.
Yet, despite its seeming inability to capture significant returns from its robust science
system, Canada’s economy has performed well as demonstrated by increasing GDP per capita and
business profitability. Research suggests this is largely due to superior labour utilization and a
strong trading relationship with the United States (Council of Canadian Academies 2013b;
Nicholson 2018). However, Canada is facing four megatrends which threaten this benevolent
status quo: an aging population; increasing globalization and competition; growing opposition to
resource extraction practices and the development of substitutes; and rapid technological advances
in ICT technologies that are creating a digital transformation in the economy (Nicholson 2016;
2018). This last megatrend is especially significant because in addition to the challenges it creates,
it has the potential to help address the challenges posed by the other three. But only if Canada can
improve its innovation performance.
There have been many policies at both the federal and provincial levels that have attempted
to improve Canada’s science, technology, and innovation (STI) performance over the last century
(Doern, Castle, and Phillips 2016; P. Phillips and Castle Submitted). The evidence would suggest
these have been much more effective at improving the country’s science performance than its
technology or innovation performance. A change in perspective in the innovation policy
conversation may be needed to make meaningful advances in innovation policy and improve

2
Canada’s performance, assuming that it is not already optimized.1 Innovation ecosystems is a
concept that has received increasing attention in the last fifteen years (Adner 2006; Gomes et al.
2018; Granstrand and Holgersson 2020). Though developed as a tool to help managers in the
private sector formulate their business strategies, it emphasizes certain aspects of innovation that
previous models did not, or not to the same extent. Whereas most of these models focused on
system level factors, such as institutional supports, innovation ecosystems focuses on firms and
gives more consideration to the role played by users and the demand side of innovation. The
framework also puts reduced emphasis on geography, though it still firmly grounded in network
concepts. Taking firms as the focal point of innovation policy suggests policies should be oriented
toward addressing the specific challenges firms face rather than focusing solely on environmental
or framework conditions. Building policy from the bottom up in this way can better account for
differences between industries and potentially reveal challenges that top-down perspectives would
not easily identify. With respect to the demand side of innovation, previous models, at least as they
were applied in Canada, tended to focus on the creation of knowledge and the development of new
technology, but tended to ignore the demand side of innovation which is concerned with innovation
adoption and facilitating demand for innovation (Edler 2019). For innovation to be successful,
both sides of the process must be supported.
There is some evidence that the federal government is beginning to shift toward this
perspective. The 2017 Budget introduced the Economic Strategy Tables, which were focused on
needs of technological and industrial sectors, and Innovative Solutions Canada, The Supercluster
Initiative, and several other policies that constitute a step toward demand-side policy (Government
of Canada 2017). The Superclusters Initiative is also reflective of an innovation ecosystems
perspective, much more so than the clusters perspective given the reduced emphasis on geography
and its focus on creating linkages within and between firms (Beaudry and Solar-Pelletier 2020).
But more is needed. As with the old policies, the new policies still have a strong focus on research,
technology development, and commercialization, and only a limited focus on technology adoption
and use.
The goal of this project is to provide insights on how firms in industries that have
traditionally been accepted as non-technologically intensive or low-innovation industries innovate.
The conventional narrative is that these industries do not rely heavily on technology development
1 This is an assumption that seems to be rarely, if ever, questioned.

3
as a business strategy but may be effective adopters. However, looking beyond the statistics and
taking the perspective of the firm suggests this is a simplistic view. If policy instruments are to
effectively support innovation, they must be based on an understanding of the challenges firms
face in these industries both in how they conduct their business and in how they innovate. This
project focuses on digital innovation in the mining, oil and gas extraction, and construction
industries in Saskatchewan. The mining, and oil and gas extraction industries have had persistent
negative MFP growth within the sector for the last two decades and construction has had negative
MFP growth since 2010. Though most of Canada’s poor MFP growth can be explained by a
slowdown in the manufacturing sector (Sharpe and Tsang 2018), the negative within-sector growth
in these industries could be interpreted to suggest these industries face the most severe challenges
when it comes to innovation. There is a limited body of literature that suggests otherwise, at least
for the mining, and oil and gas extraction industries, and the qualitative findings of this study
support the alternative view.
A key concern is how firms in the industries of study engage with digital technologies and
digital innovation. Digital transformation, a more comprehensive structural phenomenon based on
digital innovation, is broadly believed by policymakers and innovation scholars to be key to
increasing productivity growth and to addressing critical issues such as population aging and
sustainability. Understanding barriers to adoption of these technologies may therefore produce
immediate benefits for the industries as well as produce general insight on digital technology
adoption in similar industries.
The study takes place in Saskatchewan primarily for feasibility but has the added benefit
that the industries of study account for a significant share of Saskatchewan’s economy. The
province is also considered to have poor innovation performance in general (Conference Board of
Canada 2020) and so the results of this study may therefore have immediate relevance to at least
one government.
This study was conducted using a series of semi-structured interviews with representatives
of firms in the industries of study. Eligible firms did not have to be based in Saskatchewan but had
to be operating in it. There were between 10 and 20 interviews collected for each industry,
following the principle of saturation. The research questions for this project are: How do firms in
the industries of study innovate? What challenges do they face in the business environment and
how are they adapting? Have they engaged with digital technology and, if so, what challenges have
4
they faced in adoption? Where do the ideas for innovation come from? Have firms taken advantage
of existing innovation policies and what improvements or new supports would they like to see?
The results identify several directions for future policy discussions and research. Firms in
the mining and oil and gas extraction industries tend to be large with extensive resources, and are
both developers and users of their digital innovations. Though conventional supports such as those
for R&D are well-suited to these industries, there are areas in which the public sector can provide
further support. In mining, this may be through helping break down silos between research
institutions, providing greater support for training and reskilling, and creating regulatory stability.
In oil and gas extraction, the greatest role identified for the public sector was to provide
complementary support for innovation by investing in communications infrastructure to support
digital innovation. The approach used in this study excels in a setting like the construction industry
where firms do not undertake much R&D and are primarily users of technological solutions
developed elsewhere. The large variety of potential solutions was identified as a significant barrier
to innovation as firms tend to be small and lack the resources necessary to identify which solutions
they should adopt. In this case, institutions such as industry associations can provide support by
doing research on behalf of firms and providing resources for firms to evaluate which technologies
are most suitable. The public sector can support the ecosystem by investing in large infrastructure
projects and using procurement to incentivize technology adoption, and reforming procurement
platforms and implementing qualification regulations to reduce the burden on firms and incentivize
learning and upskilling.

5
2. Canada’s Innovation Problem: Challenges, Definition, and New Directions
Despite its poor performance on
traditional innovation indicators, Canada has
maintained GDP per capita growth similar to
that of the United States (Figure 2.1) and has
experienced increased business profits over the
last three decades (Figure 2.2). One explanation
for this success is Canada’s close economic
relationship with the world’s technological
leader, the United States, and its superior
utilization of relatively cheap labour. This has
led Canada to fall into a profitable “low-
innovation” equilibrium (Nicholson 2016, S40-
S42; 2018, 15). However, there are four
emerging megatrends which threaten to disrupt
this profitable status quo: an aging population;
increased competition from other countries and
a shift of economic opportunity toward Asian
states; increased opposition to resource
extraction practices and a drive toward
sustainability; and disruption caused by
emerging digital technologies.
In 2017, Canada had the highest labour
force participation rate in the G7 at 66 percent
(Martel 2019, 4). However, the participation rate
has been steadily declining as the population
ages and more people retire than join the labour
force. It is estimated that by 2036, the labour force participation rate will have declined to between
61 percent and 63 percent with wide variation across regions (ibid.,4-5). This decrease in labour
force participation is expected to be accompanied by increased demand for services, particularly
for health care, as the population continues to grow and the baby boom generation ages. If
0
10,000
20,000
30,000
40,000
50,000
60,000
70,000
1990
1992
1994
1996
1998
2000
2002
2004
2006
2008
2010
2012
2014
2016
2018
Canada United States OECD
Figure 2.1: GDP per Capita (USD 2015, Constant Prices, Constant PPP)
Source: OECD (2020b)
0%
2%
4%
6%
8%
10%
12%
Q1
1990
Q1
1992
Q1
1994
Q1
1996
Q1
1998
Q1
2000
Q1
2002
Q1
2004
Q1
2006
Q1
2008
Q1
2010
Q1
2012
Q1
2014
Q1
2016
Q1
2018
Figure 2.2: Business Profits as a percentage of Operating Revenue
Source: Statistics Canada (2020)

6
Canada’s prosperity in the past two decades has in fact depended upon its superior labour
utilization relative to that of the United States, it will require increased labour productivity (GDP
per worker) to offset the loss from a reduced labour force (Nicholson 2018, 23).
Canada’s economy is highly integrated with the United States. Its role is traditionally
understood as largely to supply raw materials to American firms which transform them into
finished products and sell them back to Canada and elsewhere. Many Canadian firms operate as
subsidiaries to American firms (Nicholson 2016, S41). Overall this has been a profitable
arrangement for Canadian firms who have reaped the benefits of close proximity, language, and
business culture (Nicholson 2018, 21). However, as a result, Canadian firms have not had to
develop a global trading perspective. Though this is changing, the shift in economic opportunity
toward East Asia and increased competition from firms in that region as well as from Australia,
Europe, and the United States threatens to put Canada at a disadvantage. The lack of Canadian
multinational firms may also put it at a disadvantage when it comes to acquiring technologies
emerging from new markets unless it is able to increase its ability to absorb such technologies
(ibid., 21).
Canada has a strong comparative advantage in natural resources, but it faces two threats on
this front. First, there is a growing public opposition to what are viewed as unsustainable extraction
practices, particularly in the oil and gas sector. Second, a number of substitute products have
emerged in response to high resource prices in the last two decades and from a desire to create a
secure supply while reducing environmental impact. It is possible for Canada to diversify into
these new markets but it will require departing, in part, from the secure patterns of production that
has sustained it (Nicholson 2018, 22-23).
The last disruptive megatrend Canada faces is from the emergence of digital technologies
such as artificial intelligence (AI), autonomous vehicles, big data analytics, cloud computing,
custom manufacturing and 3D printing, Internet of Things (IoT), robots and drones, social media
and platforms, and more. These technologies create disruption by altering consumer behaviour and
expectations through ubiquitous availability of information, enabling new combinations of
products and services, lowering barriers to entry for firms, creating new venues for business, and
analytics-enabled improvements in product and process design (Vial 2019, 124). The latest
estimates from the World Economic Forum (2018) estimate that the potential global benefits of
this digital transformation to society, economy, and environment will be in excess of $100 trillion

7
(U.S.) by 2025. As of yet there are no estimates for the overall benefits they may bring for Canada
but the most recent estimate of the size of the existing digital economy in Canada in 2017 was
$109.7 billion, or 5.5 percent of the total economy. This is larger than the wholesale and retail
trade sector, the mining, quarrying, and oil and gas extraction sector, and many others. It is
estimated that over the period 2010 to 2017, the digital economy grew by 40.2 percent, far faster
than the total economic growth of 28 percent (Sinclair 2019, 8-9). Even still, this is a conservative
estimate as it only includes digitally-enabled infrastructure, e-commerce transactions, and
digitally-delivered products and does not include the indirect effects such as digitally-enabled
productivity increases. This preliminary evidence suggests the overall benefits of the digital
transformation will be significant. However, this megatrend also poses great challenges for the
future of work in Canada (Policy Horizons Canada 2019). Some work will shift from being long-
term and time-based to a temporary, task-based, gig economy; AI and automation will eliminate
some jobs and fundamentally change others; and deeper changes may occur as technology allows
people to work, earn, and spend in different locations.
The digital transformation, if it is managed properly and its own negative impacts can be
minimized, has the potential to address the problems created by the other three megatrends.
Productivity increases will help offset the losses from an aging population, adoption of these
technologies will help companies grow their absorptive capacity and help adopt further
technology, and they will facilitate the development of new business strategies. But these benefits
will only be realized if Canada is able to overcome its “innovation problem.”
2.1. Constructing Canada’s Innovation Problem
An innovation is most commonly understood by academia and statistical agencies as “a
new or improved product or business process (or combination thereof) that differs significantly
from the firm’s previous products or business processes and that has been introduced on the market
or brought into use by the firm” (OECD 2018, 20). Countries’ innovation performance is typically
measured in a variety of ways. This paper considers Canada’s performance relative to other
countries in terms of innovativeness and innovation activities, innovation inputs, and innovation
outcomes.
8
The OECD defines innovation activities to include “all developmental, financial and
commercial activities undertaken by a firm that are intended to result in an innovation for the firm”
(OECD 2018, 20). For statistical purposes, innovation activities are classified into eight categories:
research and experimental development; engineering, design, and other creative work; marketing
and branding; intellectual property activities; employee training; software development and
database activities; acquisition and lease of tangible assets; and innovation management (ibid., 87-
91). Of these, R&D and innovation management are, by default, innovation activities. The rest are
only considered innovation activities if their undertaking is directly related to a firm’s innovation
efforts. But a firm’s innovation activities may not result in innovation. Firms may develop or begin
to adopt an innovation but ultimately decide to reject it. It is therefore useful to distinguish between
firms that are innovation-active (i.e., that undertake innovation activities) and those that are
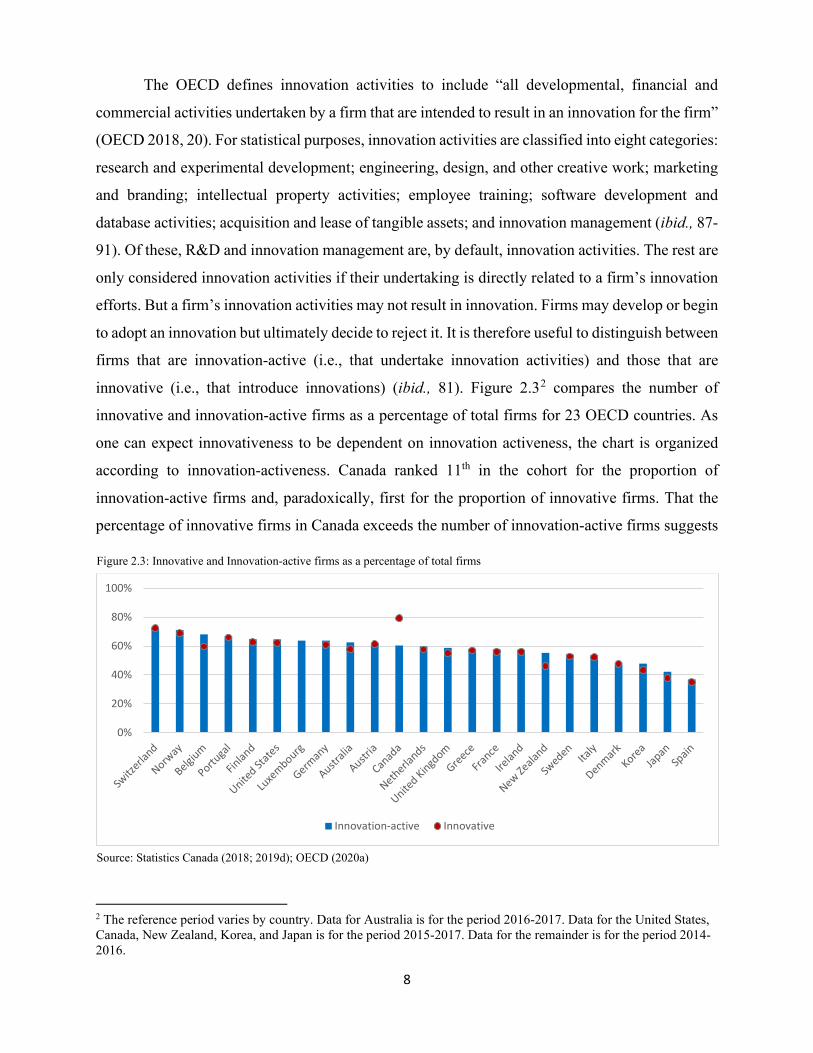
innovative (i.e., that introduce innovations) (ibid., 81). Figure 2.32 compares the number of
innovative and innovation-active firms as a percentage of total firms for 23 OECD countries. As
one can expect innovativeness to be dependent on innovation activeness, the chart is organized
according to innovation-activeness. Canada ranked 11th in the cohort for the proportion of
innovation-active firms and, paradoxically, first for the proportion of innovative firms. That the
percentage of innovative firms in Canada exceeds the number of innovation-active firms suggests
2 The reference period varies by country. Data for Australia is for the period 2016-2017. Data for the United States, Canada, New Zealand, Korea, and Japan is for the period 2015-2017. Data for the remainder is for the period 2014-2016.
0%
20%
40%
60%
80%
100%
Innovation-active Innovative
Figure 2.3: Innovative and Innovation-active firms as a percentage of total firms
Source: Statistics Canada (2018; 2019d); OECD (2020a)
9
there is a large degree of error in the
“innovativeness” statistic. Regardless, Canada
appears to perform reasonably well compared to
its peers on innovation activity. But by itself this
statistic tells us little about the intensity of that
activity. Examining the statistics for research and
development (R&D) expenditures and
information and communication technology
(ICT) investment, two key innovation inputs and
types of innovation activity, are believed to reveal
more about a country’s innovation performance.
R&D is regarded as a key input in the
innovation process both for developing new
technologies and for building absorptive capacity
(Cohen and Levinthal 1989; 1990; Hall, Mairesse,
and Mohnen 2009). The OECD defines R&D as
“creative and systematic work undertaken in order
to increase the stock of knowledge – including
knowledge of humankind, culture and society –
and to devise new applications of available
knowledge” (OECD 2015, 44). It is often a key
source of disruptive innovation and is a
fundamental driver of technological change and
long-term productivity growth. Given this,
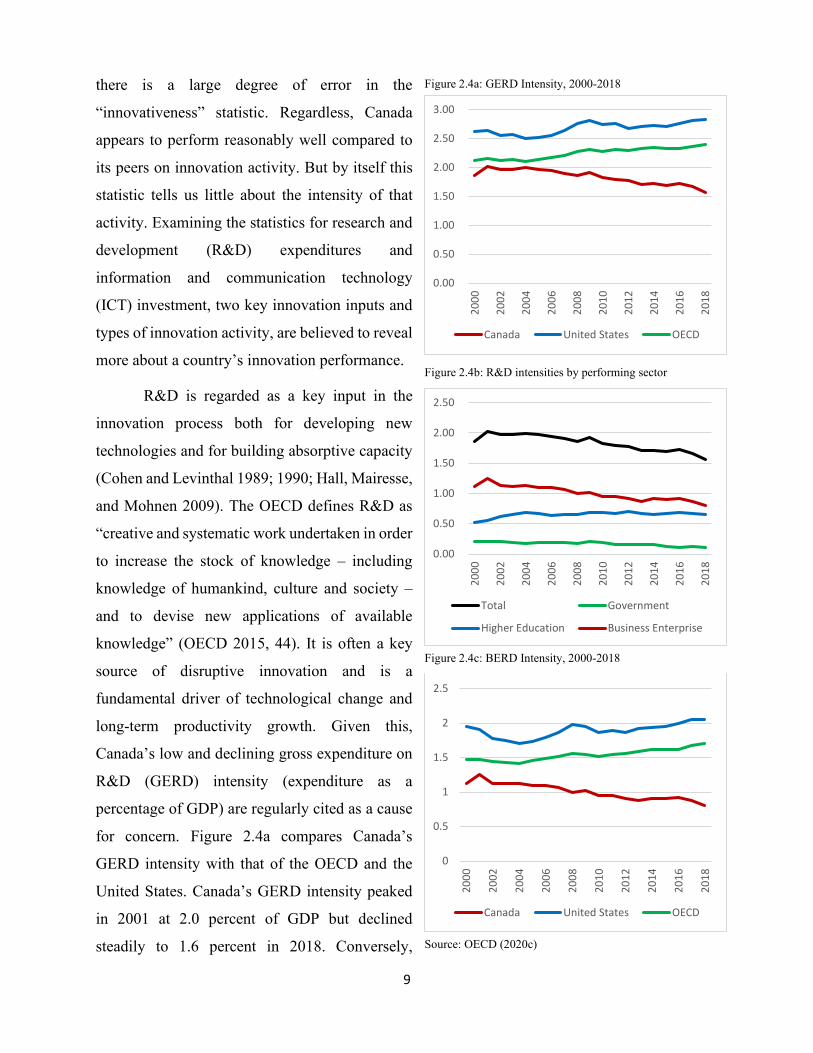
Canada’s low and declining gross expenditure on
R&D (GERD) intensity (expenditure as a
percentage of GDP) are regularly cited as a cause
for concern. Figure 2.4a compares Canada’s
GERD intensity with that of the OECD and the
United States. Canada’s GERD intensity peaked
in 2001 at 2.0 percent of GDP but declined
steadily to 1.6 percent in 2018. Conversely,
0.00
0.50
1.00
1.50
2.00
2.50
2000
2002
2004
2006
2008
2010
2012
2014
2016
2018
Total Government
Higher Education Business Enterprise
Figure 2.4b: R&D intensities by performing sector
Source: OECD (2020c)
0
0.5
1
1.5
2
2.5
2000
2002
2004
2006
2008
2010
2012
2014
2016
2018
Canada United States OECD
Figure 2.4c: BERD Intensity, 2000-2018
0.00
0.50
1.00
1.50
2.00
2.50
3.00
2000
2002
2004
2006
2008
2010
2012
2014
2016
2018
Canada United States OECD
Figure 2.4a: GERD Intensity, 2000-2018

10
GERD intensity for the OECD and the United States increased over the same period from 2.2
percent and 2.7 percent to 2.4 and 2.8 percent, respectively.
GERD can be broken down into performing sectors. Figure 2.4b presents the R&D
intensities for the government (GOVERD/PERD), higher education (HERD), and business
enterprise (BERD) sectors. The decline in GERD has primarily been caused by a decline in BERD
which fell from a high of 1.3 percent of GDP in 2001 to 0.8 percent in 2018, a 36 percent decline.
This is in stark contrast to the increase in BERD intensity in the OECD and the United States
which saw a 15 percent and 7 percent increase over the same period, respectively (Figure 2.4c).
The decline in BERD intensity is worrying because the business sector is the point where most
economic benefits of innovation (e.g. productivity growth, new products, cost reductions) are
realized.
Although R&D is an important source of
disruptive innovation, much of the benefits of
innovation are captured not through the
development and commercialization of
technology, but through its adoption throughout
the economy. ICT adoption has been major
source of productivity growth and a key enabler
of business strategy innovation since the 1990s.
ICT includes hardware, software, and
communications technology. Unlike other
technologies, these can be classified as general-
purpose technologies (Bresnahan and
Trajtenberg 1995; Helpman 1998) the impacts of
which extend far beyond the normal returns from capital investment. Rather, most of their benefit
comes from enabling organizational transformation and other complementary innovations that
improve productivity and enable new products, or provide intangible benefits such as increased
convenience, timeliness, quality, and variety (Brynjolfsson and Hitt 2000, 24-25).
ICT investment is commonly measured in terms of investment per job, investment as a
percentage of GDP, and investment as a percentage of total investment. Figure 2.5 presents
Canada’s investment in ICT as a percentage of the United States’. It shows a persistent and
0%10%20%30%40%50%60%70%80%90%
100%
2000
2001
2002
2003
2004
2005
2006
2007
2008
2009
2010
2011
2012
2013
2014
ICT Investment per Job
ICT Investment as a Share of GDP
ICT Investment as a Share of Total Investment
Figure 2.5: Relative Canada-U.S. ICT Investment
Source: CSLS (2016)
11
increasing investment gap between the two countries. Depending on the measure used, the gap in
2014, the most recent year for which there is data available, was between 33 and 44 percent.
Unfortunately, there are no internationally comparable data for ICT investment. However, there
are comparable data for the contribution of ICT to labour productivity growth. This indicator is
arguably more important for determining Canada’s ICT performance because outcomes, rather
than inputs, are the true measure of innovation success.
There is strong evidence that ICT has a positive but inconsistent effect on labour
productivity growth (see Cardona, Kretschmer, and Strobel (2013) for a meta-analysis). Labour
productivity growth, defined as growth in GDP per hour worked, can be decomposed into the
components labour composition, capital intensity, and multifactor productivity (MFP). Labour
composition reflects changes in the skills of the labour force and is measured as the proportion of
the labour force with post-secondary education. Capital intensity is the quantity of capital services
per worker and includes the benefits of technology that is embodied in capital. MFP is the residual
and represents the effects not captured by capital intensity such as improvements resulting from
changes in business strategy, network effects, economies of scale, etc. ICT investment affects
labour productivity growth through the latter two components. There is no way to decompose MFP
to determine ICT’s contribution, but the overall effect can be partially observed through the
contribution to improvements from capital intensity.
There is evidence that ICT’s contribution to labour productivity growth has slowed since
2008 not only in Canada but for other industrialized countries as well (Cette, Clerc, and Bresson
2015; Mollins and St-Amant 2018). Figure 2.6 compares the contribution from ICT to labour
productivity for 23 selected OECD countries for the periods 2001-2007 and 2010-20173. The chart
is organized according to ICT’s contribution to labour productivity growth. Though there has been
a slowdown in both labour productivity growth and in ICT’s contribution to it in almost every
country, Canada fell from 9th place in terms of absolute contribution and 4th in terms of contribution
as a proportion of labour productivity growth in the cohort in the 2001-2007 period to last both in
terms of absolute contribution (0.06 points) and proportionally (5.4 percent). Thomas (2016, 4)
found that this fall in ICT’s contribution was largely due to a steep decline in ICT capital intensity
3 Or the latest year for which there was data.
12
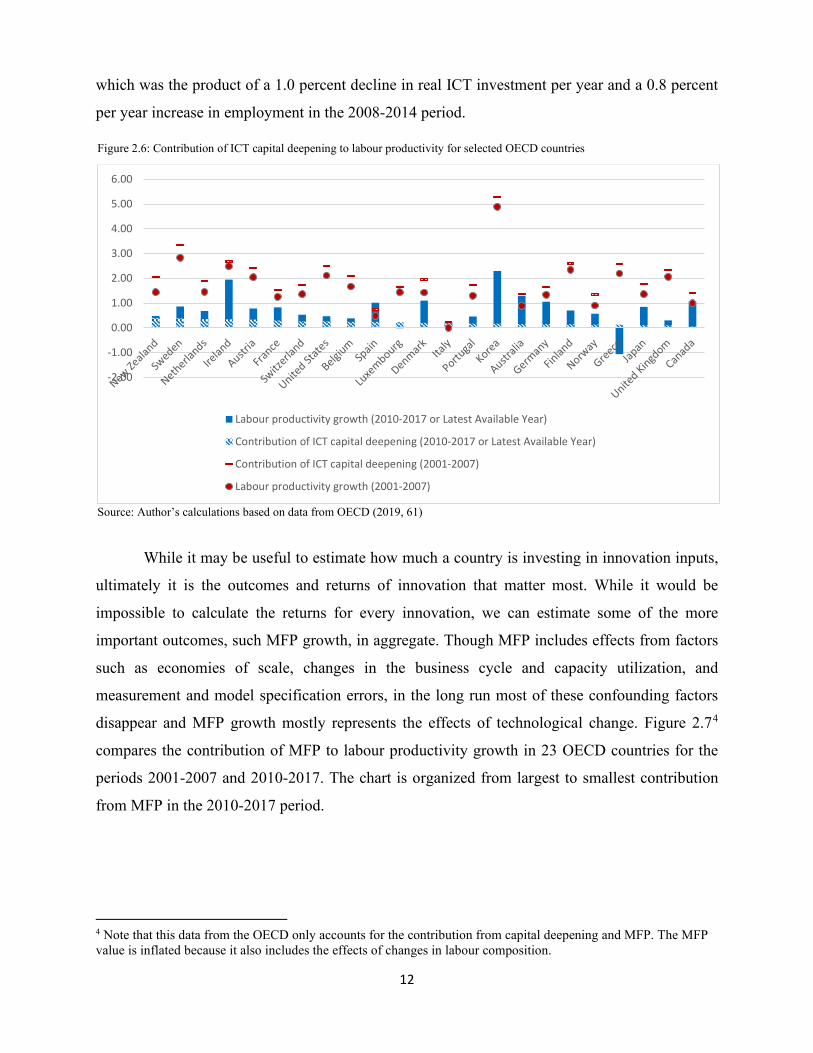
which was the product of a 1.0 percent decline in real ICT investment per year and a 0.8 percent
per year increase in employment in the 2008-2014 period.
While it may be useful to estimate how much a country is investing in innovation inputs,
ultimately it is the outcomes and returns of innovation that matter most. While it would be
impossible to calculate the returns for every innovation, we can estimate some of the more
important outcomes, such MFP growth, in aggregate. Though MFP includes effects from factors
such as economies of scale, changes in the business cycle and capacity utilization, and
measurement and model specification errors, in the long run most of these confounding factors
disappear and MFP growth mostly represents the effects of technological change. Figure 2.74
compares the contribution of MFP to labour productivity growth in 23 OECD countries for the
periods 2001-2007 and 2010-2017. The chart is organized from largest to smallest contribution
from MFP in the 2010-2017 period.
4 Note that this data from the OECD only accounts for the contribution from capital deepening and MFP. The MFP value is inflated because it also includes the effects of changes in labour composition.
-2.00
-1.00
0.00
1.00
2.00
3.00
4.00
5.00
6.00
Labour productivity growth (2010-2017 or Latest Available Year)
Contribution of ICT capital deepening (2010-2017 or Latest Available Year)
Contribution of ICT capital deepening (2001-2007)
Labour productivity growth (2001-2007)
Figure 2.6: Contribution of ICT capital deepening to labour productivity for selected OECD countries
Source: Author’s calculations based on data from OECD (2019, 61)

13
Canada experienced an improvement in MFP growth between the two periods. In the 2001-
2007 period, MFP contributed only 0.34 points (34 percent) to the overall 0.99 percent growth in
labour productivity. At this time, Canada placed 18th in the cohort in terms of absolute contribution
and 19th as a proportion of labour productivity growth. In the 2010-2017 period, MFP growth
recovered somewhat and contributed 0.80 points (75 percent) to labour productivity growth, which
was 1.07 percent per year for the period, placing Canada 3rd in the cohort for absolute contribution
and 5th proportionally. However, this relative improvement was caused by a decrease in the MFP
growth of the rest of the cohort rather than Canada’s improved performance. The increase in MFP
was also offset by a decrease in the contribution from capital intensity which resulted in an
effectively unchanged rate of overall labour productivity growth. Labour productivity and MFP
growth also remain low relative to the period in the late 1990s where Canada’s labour productivity
growth was 3.1 percent per year between 1996 and 2000 and MFP growth contributed 1.6 points
(52 percent). This low productivity growth has persisted since the 2000-2006 period when MFP
growth declined by 1.7 points (106 percent) and labour productivity fell to 1.0 percent per year
(Baldwin and Gu 2007, 16). Figure 2.7 shows a similar decline was not experienced in much of
the rest of the industrialized world until the 2008-2009 financial crisis. The decline in MFP growth
in the post-2000 period has been interpreted as an indicator that Canada was not able to reap the
benefits of technological change at that time and has not been able to recover since (Council of
-2.00
-1.00
0.00
1.00
2.00
3.00
4.00
5.00
6.00
Multifactor productivity (2010-2017) Contribution of capital deepening (2010-2017)
Multifactor productivity (2001-2007) Contribution of capital deepening (2001-2007)
Labour productivity growth (2010-2017) Labour productivity growth (2001-2007)
Figure 2.7: Contribution of multifactor productivity (MFP) growth to labour productivity growth in selected OECD countries
Source: Author’s calculations based on data from OECD (2019, 61)

14
Canadian Academies 2018; Nicholson 2018; Innovation, Science, and Economic Development
Canada 2019).
Statistics describing innovation activities, inputs, and outcomes may be useful for framing
the state of innovation, but they do nothing to identify the causes of poor performance. This
requires the use of theoretical frameworks. One can identify several theoretical frameworks that
have informed innovation policy at the federal and provincial levels5 over the past fifty years both
to interpret the problem behind the statistics and to offers solutions (Doern, Castle, and Phillips
2016, 21-22).
The first is the linear model which was dominant in the post-war period up to the late 1980s.
It emphasised the importance of basic and applied research as the foundation of the innovation
process which flows from basic to applied research, through development and production, to
commercialization and diffusion (Godin 2006, 639). In this model, outputs are assumed to be
proportionate to inputs (Doern, Castle, and Phillips 2016, 21) and the innovation problem is
constructed as insufficient investment on the inputs side. The solution is to provide more incentives
for R&D. Programs such as the Industrial Research Assistance Program (IRAP) and the Scientific
Research and Experimental Development (SR&ED) Tax Credit, key pillars of Canada’s
innovation policy framework, are reflective of this model. IRAP and SR&ED both provide
financial assistance to firms performing R&D, though the former does so through grants and is
focused on SMEs whereas the latter does so through tax expenditures. In addition to funding, IRAP
provides advisory services and now includes a networking and employment component.
Beginning in the late 1980s and continuing to the present, innovation policy was based on
various systems theories of innovation where innovation is theorized as a non-linear, networked,
and collaborative process (Doern, Castle, and Phillips 2016, 22). These theories, which include
national and regional systems of innovation (Niosi, Manseau, and Godin 2000; Niosi, Bas, and
Zhegu 2005) and clusters (Holbrook and Wolfe 2002; Wolfe and Gertler 2003) emphasize not only
the role of R&D, but also the connections between actors, competencies, learning, and the role of
institutions such as universities and governments. Universities, in addition to their research role,
train highly qualified personnel that are a key source of human capital for businesses.
5 Presently, there is a gap in the literature with respect to provincial innovation policy. As such, this study focuses on federal policy. A forthcoming work from Phillips and Castle (Submitted) discusses the state of provincial innovation policy.
15
Governments, in addition to providing financial supports, create regulatory environments that can
help or hinder the innovation process. The connections not only between business, governments,
and academia, but between businesses and other businesses facilitate the knowledge transfer and
learning that is central to the innovation process. During this period there was also a shift in broader
economic policy toward a neoliberal economic paradigm and innovation policies tended to focus
on system conditions, deregulation, and free trade and avoided direct supports. However, there
were several programs and institutions introduced in the late 1980s and early 2000s that provided
direct support to Canada’s innovation system. These included granting organizations and programs
such as the Canada Foundation for Innovation (CFI), Genome Canada, the Canadian Institutes of
Health Research (CIHR), the Canada Research Chairs Program (CRCP), and the collaboratively
focused Networks of Centres of Excellence (NCE). Of these, the NCE was most closely associated
with industrial innovation and was emblematic of the systems perspective. It was established to
connect industry with academia to solve social and economic problems, commercialize more
Canadian research, increase private sector R&D, and increase the stock of highly qualified
personnel. This program, along with other changes to the granting system, represented an
important shift from a focus on basic research to commercial application (Atkinson-Grosjean 2006,
xiii-xiv).
There were few major programs that supported innovation generally introduced in the mid
to late 2000s and early 2010s. Many of the initiatives at this time were focused on specific projects
such as Internet adoption and arctic research. It was not until 2017 that several new, large
innovation programs were introduced. These included the Strategic Innovation Fund (SIF), the
Venture Capital Catalyst Initiative (VCCI), Innovative Solutions Canada, and the Superclusters
Initiative. SIF was modelled as a counterpart to IRAP. The latter provides funding for R&D
projects less than $10 million and the former provides funding for projects greater than $10 million.
SIF absorbed the NCE in 2018. The VCCI was established to provide an urgently needed increase
in the availability of venture capital for start-ups and scale-ups. Innovative Solutions Canada was
established as a pre-commercial procurement program which would provide support for new
technologies that would be beneficial to society. The Superclusters Initiative established five
technology-based, industry-led consortia aimed at incentivizing large-scale industry partnerships
to increase R&D investment in strategic technologies, create new companies, commercialize new
products, processes and services, connect partners to global supply chains, and create a high-
growth business environment. These consortia include digital technologies, protein industries, next
16
generation manufacturing, artificial intelligence, and ocean technology. There was also a shift in
strategic planning for innovation. The Economic Strategy Tables outline directions for federal
support for the agri-food, health/biosciences, tourism, and natural resources sectors and for
advanced manufacturing, digital technologies, and clean technologies.
Although it is too soon to know if the new initiatives will have any impact, the poor
performance suggested by conventional indicators suggests that the policy frameworks
implemented to this point have had little success. It may be time for a shift in perspective.
Innovation ecosystems is a perspective that has emerged in the last fifteen years that may offer
useful insights. Like systems of innovation and clusters, it is a systems theory of innovation, but
one that places emphasis on firms and specific technologies rather than on framework conditions.
2.2. A New Perspective: Innovation Ecosystems
“Innovation ecosystem” is a fuzzy concept and many authors use it without explicitly
defining it (Granstrand and Holgersson 2020, 2). The concept originally stems from the business
ecosystems literature beginning with Moore (1993) who argued that network theories of business
offered little assistance for managers in making strategic decisions because they did not accurately
reflect how firms functioned. Taking inspiration from the idea of biological ecosystems, Moore
suggested that firms do not operate as members of an industry, but as members of business
ecosystems which cross several industries, and that it is competition between ecosystems, rather
than between businesses, that drives technological change. In business ecosystems, “companies
evolve capabilities around a new innovation: they work cooperatively and competitively to support
new products, satisfy customer needs, and eventually incorporate the next round of innovations”
(ibid., 76). This definition stressed the networked nature of innovation, the co-evolution of
capabilities, and cooperation as well as competition. The innovation ecosystems concept emerged
when Adner (2006) expanded the business ecosystem concept to discuss the new risks that arose
in the innovation process as the result of such a networked structure. Adner (2006, 98) defined an
innovation ecosystem as, “the collaborative arrangements through which firms combine their
individual offerings into a coherent, customer-facing solution.” Despite beginning with similar
definitions, the business and innovation ecosystems streams can be differentiated by their focuses.
The business ecosystems literature focuses more on value capture whereas the innovation
ecosystems literature focuses more on value creation (Gomes et al. 2018, 12). Nevertheless, the

17
two streams share many concepts particularly those surrounding ecosystem lifecycles, actors, and
roles.
Moore’s (1993) original work identified four phases of the business ecosystem lifecycle.
In the first phase, birth, a firm develops the idea for an innovation and works with customers and
suppliers to develop a value proposition. Complementor firms attach to the ecosystem at this stage
to develop parallel innovations that complement and add value to the core innovation. In the second
phase, expansion, the ecosystem scales up and expands, often competing with other ecosystems
offering substitute goods for suppliers, customers, and complementors. In phase three, leadership,
ecosystem actors consolidate market power by establishing technical standards and control over
critical components and customers. In the final stage, renewal/death, a mature ecosystem is
challenged by new innovations and ecosystems, or changes in regulations, buying patterns, or
macroeconomic conditions. The dominant ecosystem can respond by trying to stifle the new
ecosystem or influence changing context conditions, adopt the new innovations or regulations, or
fundamentally restructure. Failure to adapt will likely mean the death of the ecosystem. Since
Moore’s original article, many different lifecycle models have been proposed. Thomas and Autio
(2015, 6-7) reviewed and synthesized several of these models and suggest a three stage ecosystem
lifecycle model. The first stage is concerned with early technological development, rulemaking
among actors, resource gathering, the establishment of organizational structures, and co-option of
complementors and suppliers. In the second stage, the ecosystem grows rapidly as network effects
accumulate. Intense competition prompts ecosystem actors to engage in marketing and alliance-
making to drive adoption and acquire greater resources. These activities increase the legitimacy of
the ecosystem. In the third stage, legitimacy has been established and the ecosystem has become
dominant. Activities at this stage shift from a growth and value creation focus to a control and
value capture focus.
Regardless of the model, there are a variety of actors and roles that are necessary for the
ecosystem to carry out the activities at each stage. Moore (1993) stressed the role of suppliers,
producers, complementor firms, and customers. Iansiti and Levien (2004, 70-71) expanded and
clarified the list to include, for example, financiers, operational technology providers, producers
of complementary goods, competitors, customers, regulatory agencies, and media outlets.
However, firms remain the key actors in this perspective. There are a variety of roles these actors
can play. In a recent review of the literature, Dedehayir, Mäkinen, and Ortt (2018) identified four

18
key roles in innovation ecosystems: leadership roles, direct value creation roles, value creation
support roles, and entrepreneurial ecosystem roles. The actors performing these roles may not
remain constant throughout the ecosystem lifecycle, but each is vital for ecosystem success.
Ecosystem leaders, variously called keystones (Iansiti and Levien 2004), platform leaders
(Gawer and Cusumano 2002) and hubs (Iyer, Lee, and Venkatraman 2006), are central firms in
the ecosystem which perform the activities of ecosystem governance, forging partnerships,
platform management, and value management (Dedehayir, Mäkinen, and Ortt 2018, 22-23).
Ecosystem governance activities include defining the role of other actors in the ecosystem and
coordinating their interactions. This is especially important in the earliest phases of ecosystem
development and in ecosystems that lack a common platform.6 Governance also includes
coordinating resource flows among ecosystem actors. This activity is more important in later
stages of ecosystem emergence when resources are abundant enough to require more purposeful
management. Leaders forge partnerships by attracting potential partners to the ecosystem and
acting as intermediary between partners to create relationships and collaboration. The leader is key
in defining a common vision and objectives and sharing those with partners. For platform-based
innovation ecosystems, platform leaders are responsible for designing and building the platform
and generating value in the user community by ensuring access to the platform and compatibility
of new innovations. The final role for ecosystem leaders is managing the value created in the
ecosystem. This includes both the value contributed by the leader themselves, but also ensuring
that other participants are able to share in the overall value. If participants are not able to capture
value for themselves, they will likely leave, and the ecosystem will collapse. An alternative value
management role is for the leader to dominate the system through vertical and horizontal
integration, accruing all value to itself. However, in the long term, this strategy will usually lead
to the ecosystem’s demise.
There are four roles that directly contribute to value creation: suppliers, assemblers,
complementors, and users (Dedehayir, Mäkinen, and Ortt 2018, 23-24). Suppliers produce and
deliver key products, services and technologies to assemblers who combine these inputs to deliver
new products, services and technologies to users. Complementors exist in parallel to suppliers and
assemblers and add value by offering goods and services which are compatible with the platforms
6 Platforms are “products, services or technologies developed by one or more firms, and which serve as foundations upon which a larger number of firms can build further complementary innovations and potentially generate network effects” (Gawer and Cusumano 2014, 420)
19
used by or goods produced by core ecosystem actors. Users are the ultimate purchasers of the
goods and services produced by an ecosystem. Without them, value cannot be created. In addition
to purchasing, they are key in defining the needs which initiate ecosystem development and
providing feedback to improve products and services.
There are two roles which do not create value directly but provide supports for value
creation (Dedehayir, Mäkinen, and Ortt 2018, 24). The first is the “expert” which includes
individual technical experts and consultants, and universities and research organizations. These
actors provide knowledge, inventions, and ideas that are essential in the early stages of ecosystem
development. The second is the “champion” who provides the energy to overcome barriers to
innovation development and strengthen the connections between ecosystem actors.
The three final roles are the entrepreneur, sponsor, and regulator (Dedehayir, Mäkinen, and
Ortt 2018, 24-25). Entrepreneurs are key in the early stages of ecosystem development. They can
be either individuals or firms and can occupy many different roles. First, they often identify
opportunities and engage in partnership forging to exploit those opportunities. While this is similar
to the ecosystem leader role, the entrepreneur may not be the leader as they may not be responsible
for ecosystem governance, or platform or value management. Entrepreneurs are key mediators
between experts and those looking to commercialize technologies and research. Sponsors provide
support for new products through financial assistance, co-developments, purchasing, mentoring,
and education. Regulators are responsible for creating favourable economic, political, and
regulatory conditions.
Innovation ecosystems has much in common with the older systems of innovation and
clusters frameworks, so much so that the concept has been accused of being superfluous and of
adding no value compared to these older systems theories (Oh et al. 2016). Admittedly, the concept
is still maturing, and more efforts have been made in recent years to increase conceptual rigour, as
demonstrated by the reviews referenced in this paper. However, the concept has several redeeming
features that distinguish it from previous frameworks and provide analytical value. First, though
innovation ecosystems, systems of innovation, and clusters all acknowledge the roles played by
firms, research and educational institutions, and governments, innovation ecosystems focuses on
firms and relationships between firms, and is not necessarily concerned with geography whereas
systems of innovation and clusters focus on geographical areas and the relationships between firms
and institutions (Bassis and Armellini 2018, 1064). Second, whereas systems of innovation is

20
focused on providing guidance to support public policy for innovation, innovation ecosystems
provides guidance for managers making strategic management decisions (ibid., 1064). Clusters,
with a basis in value chain and value network concepts, bridge this gap to an extent but whereas
value chain and value networks tend to take the environment as given and recognize only the actors
involved in the chain, innovation ecosystems acknowledges the role of complementors and treats
the environment as constantly evolving and as something that can be actively managed by
exercising influence through regulations, media, customers, innovative complementors,
substitutes, etc. (Gomes et al. 2018, 13-14). Finally, innovation ecosystems puts more emphasis
on the role of users in the system (Autio and Thomas 2014, 3).
Though the innovation ecosystems concept is more practically useful for firms than it is
for public policy, it can add value as a framing device. Much of Canada’s innovation policy has
focused on framework conditions and on supporting upstream activities such as R&D. Applying
the innovation ecosystems perspective suggests that more attention should be given to the
experience of firms and to the downstream activities of users. These insights coincide with ideas
that have recently been made by some innovation policy experts: that more attention be given to
firm-level factors that influence the choice to adopt innovation as a business strategy, and that
more attention be given to the demand side of innovation (Council of Canadian Academies 2009;
2013a; 2013b; Nicholson 2018; Edler 2019).
2.3. A New Perspective: Consideration of Firm-Level Factors
The Council of Canadian Academies (Council of Canadian Academies 2009; 2013a;
2013b) has argued that public policy is too general, has focused too much on symptoms of the
innovation problem rather than on its causes, and that more attention should be given to the factors
that lead firms to choose innovation as a business strategy. These factors include (Council of
Canadian Academies 2009, Chapter 4): the structural characteristics of an industry such as the
number of foreign-controlled firms, the distribution of firm size, and the position of firms in North
American value chains; the intensity of competition in an industry; the climate for new ventures
including the availability of venture financing and commercial skills, the effectiveness of
technology transfer mechanisms; public policy factors such as macroeconomic conditions, trade,
education, regulation, taxation, and specific policies for supporting innovation; and the level of
business ambition. Nicholson (2016; 2018) has argued that close economic integration with the
21
United States and a lower relative cost of labour are the main reasons why many Canadian firms
do not stake more of their business on innovation as these have created a profitable environment
where Canadian firms do not have to rely on innovation to survive. However, the work by the CCA
and Nicholson has, for the most part, focused on systemic factors at the industry level if not at the
national level. An additional possible explanation is that Canadian firms are facing challenges that
prevent them from innovating effectively and that these problems are not visible in the overall
statistics. This is inferred by the distributions underlying the R&D and ICT investment, and MFP
growth statistics which reveal that the poor performance is not widespread but is concentrated in
a few sectors. The evidence here draws on several analyses comparing Canada to the United States.
While a broader international perspective would provide a more balanced comparison, there is a
dearth of such analysis. However, the ones used here serve to illustrate the point.
There are few decompositions of business R&D in Canada. The first, by ab Iorworth
(2005), used OECD data from 1999 to compare business R&D intensities in the agriculture,
utilities, mining, construction, manufacturing, and service sectors in Canada and the United States.
In that year, Canada had an overall business R&D intensity of 1.06 percent, 0.88 points less than
the United States’ business R&D intensity of 1.94 percent. The decomposition revealed that 93
percent of this gap (0.82 points) could be explained by lower R&D intensity in the manufacturing
sector. This was the result of relatively lower R&D intensity in industries such as other
transportation equipment, electrical machinery, and motor vehicles in Canada compared to their
counterparts in the United States, and a smaller economic share of industries with higher R&D
intensities relative to their counterparts in the United States such as office and computer
equipment; radio, telecommunications, and communications equipment; and pharmaceuticals (ab
Iorworth 2005, 22, 26). A further 34 percent (0.30 points) could be explained by lower R&D
intensity in the services sector and the services sector having a smaller share of the economy than
in the United States. The deficit was largely caused by the wholesale and retail trade industry
which suffered from both of these problems (ibid., 22, 28). The overall gap was partially offset by
manufacturing having a larger share in the Canadian economy than in the United States. This
reduced the gap by 26 percent (0.23 points) (ibid., 22). Two analyses by the Council of Canadian
Academies ( 2013b, 27-34; 2018, 73) had similar findings: that the gap between Canada and
similar countries was the result of lower R&D intensities in industries such as auto manufacturing
and chemicals, and a smaller share of the economy of high-R&D-intensity industries such as
pharmaceuticals, aerospace, communications, computers, and instruments. To date, there has been

22
no thorough analysis of why R&D intensities are lower in key industries, nor why other high-
R&D-intensity industries do not have a higher share of the economy.
The Centre for the Study of Living Standards began studying the Canada-U.S. ICT
investment gap in 2005 and has produced several reports that provide incrementally more detailed
investigations with greater levels of industry granularity. In 2004, the investment per worker gap
was 54.9 percent (CSLS 2005, 28), but a decomposition of this gap revealed that over 25 percent
of it could be accounted for by the professional, scientific, and technical services; and
manufacturing sectors which accounted for 14.5 percent and 10.8 percent of the gap, respectively
(ibid., 49). A later analysis by Sharpe and Rai (2013, 17) found that the gap had reduced to 42.2
percent in 2011 but that 92.2 percent of the gap was a result of the gap in software investment
(ibid., 42). Over 60 percent of the total gap was accounted for by the gaps in the information and
cultural industries; and the professional, scientific, and technical services sectors which
contributed 39.1 percent and 22.3 percent to the gap, respectively (ibid., 50). These two sectors
also accounted for almost half of the software investment per worker, contributing 30.1 percent
and 17.2 percent. There was a third major contributor to the software gap, management of
companies and enterprises, which contributed 17.0 percent (ibid., 61). A somewhat most recent
analysis by Thomas (2016a, 9) shows that this gap and the contributions to it persisted through
2013. Sharpe and Rai (2013) suggested possible explanations for the gap including measurement
issues, the larger share of small firms in Canada, and lower managerial education. Thomas (2016a)
suggests these and also includes lower relative labour costs between Canada and the United States
and stricter regulation as reasons for low ICT investment in the information and cultural industries
and professional, scientific, and technical services sectors.
There is only one detailed study that decomposes MFP growth for Canada by sector, by
Calver and Murray (2016). When decomposing productivity growth, one must consider not only
productivity growth within sectors, but also the reallocation of labour between sectors. Even if a
sector has negative productivity growth, if it has higher than average productivity and its share of
total hours worked increases, it will contribute positively to aggregate growth. This reallocation
effects, the within-sector effect, and a combined reallocation-growth effect make up the aggregate
productivity change (Sharpe 2010). For the period 1997-2014, Calver and Murray (2016, 30) find
that there was an overall decline of 1.09 percent per year in MFP. The two industries that
contributed the most to this were the mining and oil and gas extraction (-8.84 points), and the

23
finance, insurance, and real estate sectors (-1.97 points). However, this was offset by productivity
increases in manufacturing (3.69 points), wholesale trade (2.43 points), retail trade (1.39 points),
and information and cultural industries (1.17 points). These contributions were primarily driven
by within-sector changes as the two reallocation effects were offsetting. However, when
determining whether an industry has an innovation problem, it is the within-sector effects that
matter most.
The poor performance in specific sectors suggests that there are challenges common to
firms within those sectors that are preventing them from being effective innovators. Policy should
therefore be targeted to addressing these difficulties where possible. While most of Canada’s
innovation policy takes a general approach by supporting R&D, education, training, technology,
and networking and collaboration between actors and institutions, there is substantial precedent
for targeted programming. Figure 2.8 presents the number of direct-support innovation programs
in Canada by the sector they target. The figure was constructed using a portal on Innovation
Canada’s (2020) website which allows businesses to search for supports using various criteria. A
search on February 10, 2020 for activities under the category, “conduct R&D, innovate, develop a
product or service” returned 301 direct support programs, once duplicates had been removed,
offered at the federal, provincial, and territorial levels and by the private sector. In this value, the
various research facilities operated by the National Research Council have been compressed into
a single program as they are similar enough to be considered redundant. If these are included, the
Figure 2.8: Number of programs focusing on specific sectors
Source: Author's work using data from Innovation Canada (2020)
Non-Targetted, 195
Agriculture/Food, 30
Arts and Media, 27
Biotech/Health/Life sciences, 13
ICT/Digital, 12Clean Tech/Green, 11
Fisheries and Oceans, 6 Tourism, 6
Energy, 5 Forestry, 3Mining, 3
Autonomous Vehicles, 2
Dairy, 2 Defense, 2 Misc., 6

24
number of programs is 361. Figure 2.8 was generated by coding for the sectors that programs
focused on as described in the program’s summary description.
Approximately 10 percent of programs are targeted toward the agriculture or food space,
and 9 percent are targeted toward the arts or media. Biotech, health, or life sciences; ICT/digital;
and clean tech or green tech each account for approximately 4 percent. The rest each account for
less than 2 percent. The remainder, not represented in the figure, are general programs that do not
have a sectoral focus. Though each sector represents a small fraction of overall programming, the
total amount of targeted programming is significant, representing 36 percent (106 programs)7 of
total programming. Note that these proportions should be interpreted cautiously as these values
only reflect the quantity of programs and not their budgetary significance.
Framing innovation policy in terms of sectors may seem to be at odds with innovation
ecosystems as the perspective argues that firms operate as part of ecosystems rather than sectors,
but this is not necessarily problematic. Firms operating in the same sector undertake similar
activities and often use similar technology. It can therefore be expected that they will experience
similar problems. Working with firms to construct problems from the bottom up and creating
policies that address those problems can be expected to lead to policies that are effectively sector
specific. This leads to policies that both address real problems faced by firms while reducing to
risk of policy errors resulting from policymakers’ knowledge gaps. It also overcomes the
difficulties of mapping specific innovation ecosystems and developing policies for them and
allows policies to be developed in a way that is administratively convenient for governments.
2.4. A New Perspective: Supporting the Demand Side of Innovation
Authors such as Nicholson (2018) and Edler (2019) have recently called for increased
attention to users and the demand side of innovation. While Canada’s current framework has a
strong focus on supply side measures, a well-functioning innovation process requires both strong
supply- and demand-side supports. If one side of the process is lacking, the process as a whole
suffers (Mowery 1979, 143). The lack of demand-side supports may be contributing to poor
innovation performance in some sectors.
7 The values in the figure are non-additive as some programs fell into multiple categories.

25
Whereas supply-side policies focus on reducing the costs of innovation and on increasing
the production and exchange of knowledge, demand-side policies increase innovation diffusion by
supporting a user’s ability to ask for and use innovations, help define new functional requirements
for products and services, and improve user involvement in the innovation process (Edler 2019,
7). Correspondingly, the two approaches used different tools. Supply-side instruments include
grants and tax-credits for R&D, financial assistance for commercialization and start-ups, support
for education and training, incentives to support industry-academia relationships, and technology
transfer programs (Nemet 2009, 702; Edler 2019, 5). Demand-side instruments include public
procurement of innovation, price-based instruments such as subsidies or tax incentives for
innovation adoption, awareness measures and information campaigns, innovation-specific
training, initiatives to define needs, support for user-producer interaction and user involvement in
the innovation process, and regulation to reduce uncertainties and signal future expectations (Edler
2019, 9; see also OECD 2011). Support for demonstration projects can be classified as either a
supply- or demand-side measure as they both help developers bring an innovation to market and
increase users’ knowledge of the innovation. Though the two approaches are near opposites in
their focuses and instruments, the justification for the two types of intervention are similar.
Policy intervention can be justified by the many market and system failures that impede
the innovation process (Edler 2009, 4; OECD 2014, 9-10). Supply-side approaches are usually
focused on correcting underinvestment in research created by positive externalities and the quasi-
public nature of knowledge which reduce the ability to appropriate the benefits of costly
investments in research and reduce investment below socially optimal levels. Supply-side policies
such as R&D subsidies can help correct this. Transaction costs that do not vary with the size of
investment reduce the value of investments in smaller projects and start-ups, and lead to socially
suboptimal investment. Supply-side policies such as public pools of venture capital can offset this
deficiency. Demand-side policies that increase demand for innovations can also help by reducing
the uncertainty about potential returns to investment. There may be relatively high search costs,
particularly for small firms or in firms lacking expertise, related to screening innovations and
making decisions on which ones to adopt. These firms may also have greater difficulty articulating
their needs and not know what information is relevant and what is not. These challenges can also
necessitate large marketing costs for supplier firms who need to spend more to reach and convince
potential customers. Supply-side programs for training, technology demonstration programs, and
demand-side programs assisting users in articulating needs or involving them in the innovation

26
process can help reduce these failures. Network effects, path-dependencies, and managerial
inexperience can create high switching costs and lead to technological lock-in for users. These also
create high entry costs for suppliers. These barriers can be reduced through a combination of
subsidies, demonstration, and public procurement. Finally, many innovation projects have high
levels of risk created by high upfront investments, long lags between investment and return, and
uncertainty as to what the returns will be. This can lead to underinvestment in innovations that
may provide social benefits. In this case, the public sector can bear some of the risk through
financing and procurement to leverage investment. In addition to correcting market failures, there
are other reasons by which intervention can be justified (Edler 2009, 4-5). Supporting innovation
to address societal problems can enable new solutions and create a more efficient and effective
public service. Supporting industrial modernization can drive productivity increases and
supporting innovation to create lead markets can help increase competitive advantage both
domestically and abroad. These last two justifications should be used cautiously and should be in
addition to satisfying societal needs.
Many of these reasons have been used to justify innovation policies in Canada. However,
these policies are heavily skewed toward the supply side of innovation. The brief description given
previously of major innovation policies and institutions introduced in the last fifty years illustrates
the focus on R&D, technology development, commercialization, start-ups, and linking businesses
and academia. Figure 2.9 provides a more comprehensive view. Using the same 301 summaries of
support programs for innovation used in Figure 2.8, Figure 2.9 was generated by coding programs
by whether they were focused on supply-side measures, demand-side measures, or a combination.
Supply-side measures included programs focusing on research; innovation development;
commercialization; intellectual property; start-ups; venture capital; collaboration or networks;
technology or knowledge transfer; training, education, mentorship, or advising; hiring or labour;
or clusters or incubators. Demand-side measures included programs focusing on technology
evaluation; improving innovation awareness; or innovation adoption. Programs could be classified
in multiple categories. The combination category includes programs with at least one focus from
both the supply and demand sides, or any program with a technology demonstration component.

27
In all, 82 percent of programs focused on the supply side, 9 percent on the demand side, and 9
percent were some combination of the two. The programs that did not meet any of the classification
criteria are not represented in the figure but can be classified as general business development
supports that did not include explicit mention of supply or demand-side measures. However, these
do not exclude the prospect of innovation and so these results should be interpreted conservatively.
As with the results in Figure 2.8, these results reflect the quantity of programming in each area but
do not reflect the programs’ budgetary significance.
Nicholson (2018, 5-6) has suggested that Canada’s population size relative to other
industrialized countries implies that the country can only be expected to be responsible for 2 to 3
percent of world-first innovations. Canada’s low-R&D intensity industrial structure reinforces this.
A better strategy for Canada, rather than focusing on supplying innovations to the world, may be
to become rapid and efficient adopters of innovations produced elsewhere. This is supported by
evidence that suggests the most value of an innovation is not produced by its commercialization
but through its diffusion (Eaton and Kortum 1995; Bhidé 2006). Achieving such a strategy will
require greater emphasis on demand-side policy supports. This is not to say that these should
substitute for supply-side supports, as both are important to the innovation process, but the
imbalance between the two sides will need to be corrected.
Source: Author's work using data from Innovation Canada (2020)
Figure 2.9: Focus of innovation programs
Supply-Side, 217
Demand-Side, 24
Combination, 24

28
2.5. Digital Innovation in Mining, Oil and Gas Extraction, and Construction
Building on the previous insights, this study seeks to understand the barriers to digital
innovation faced by firms in the mining, oil and gas, and construction industries in Saskatchewan.
Of the four megatrends threatening to disrupt Canada’s profitable low-innovation
equilibrium, the digital transformation has potential to help address the other three. Vial (2019,
121) defines digital transformation as “a process that aims to improve an entity by triggering
significant changes to its properties through combination of information, computing,
communication, and connectivity technologies.” This definition can be applied broadly to society
or to organizations. At the organizational level, digital transformation is often a strategic response
to disruptions that involve altering value creation paths by implementing structural changes to
overcome barriers (ibid., 122). This description implies a complex process that goes beyond
discrete cases of digital innovation, which may involve technological development or adoption of
existing solutions, to include transformation in organizational structures or business models.
Understanding the challenges firms face in this process will be necessary for Canada to become
an effective adopter. Though this study only focuses on three industries in a specific province and
has no pretenses of generalizability beyond those industries in that province, the findings will
contribute to a broader knowledge base in the future.
The study takes MFP growth as its basis for selecting industries of study as MFP growth
is a key indicator of innovation outcomes. Subsequently, the study focuses on the mining, oil and
gas, and construction industries. These were the only sectors to have negative labour productivity
growth in the 2000-2016 period and this was entirely the result of negative MFP growth (Gu and
Macdonald 2020, 35-36). Mining and oil and gas extraction had the greatest MFP loss over the
period and though there were sectors such as utilities that had a greater MFP loss than in
construction, these losses were offset by other factors such as increased capital intensity. That the
MFP decline in these sectors was enough to create a decline in overall labour productivity should
suggest that these are the sectors where the innovation problem is most heavily felt. As noted
previously, studies have found that other factors such as increased investment in marginal
resources and changes in business decision making brought on by high resource prices accounted
for much of the MFP decline in the mining and oil and gas extraction sector in the 2000s (Bradley
and Sharpe 2009a; 2009b). These studies also found that during this time, contrary to the
conventional wisdom regarding MFP growth, the sector was at the leading edge of innovation.
29
This suggests that is resource-intensive economies such as that found in Saskatchewan, MFP
growth may not be as reliable an indicator of innovation performance as it is often believed.
Nonetheless, resource price crashes have reduced the amount of capital firms in the sector have to
invest in innovation and firms may be facing new challenges specific to new digital technologies.
Though the high resource prices in the 2000s were enough to sustain increased standards of living
despite the productivity losses at the time, the importance of the sector to the national economy,
especially in the Western Canadian provinces, make it important to understand the challenges the
sector is facing to ensure that sufficient supports are in place to support its productivity revival.
With respect to productivity performance in construction, there have been few studies. The most
recent, by Harrison (2007), does not provide insight into the contribution of innovation to
productivity growth in the sector but suggests that there might be a high degree of measurement
error that is deflating the productivity estimates. It is uncertain if these errors have been corrected.
The study focuses on Saskatchewan primarily for feasibility. Though the previous
discussion focused on the national innovation narrative, like the industries of focus the province
appears to be a “most likely” case as conventional innovation indicators suggest it has poor
performance and the province is often ranked poorly on innovation scoreboards (Conference Board
of Canada 2020). Phillips and Ballantyne (Submitted) argue that in spite of the indicators,
Saskatchewan is in fact a highly innovative province. Universities and public research institutions
play a significant role in conducting strategic research and investing in large-scale research
infrastructure such as the Canadian Light Source, the largest university-led infrastructure project
in the country. These institutions have been key players in making the province a world leader in
the biosciences. As a result, the province has a very robust agri-food and biotechnology cluster
and is a key player in the global biotechnology innovation system. However, the benefits in other
industries have been less pronounced. This may suggest that, as in Canada overall, the supply-side
approach taken in Saskatchewan may not be sufficient and that there may be demand-side barriers
than are inhibiting the province’s broader innovation performance.
The mining, oil and gas extraction, and construction industries comprise a significant share
of Saskatchewan’s economy and place in the top four industries alongside real estate and rental
and leasing, and agriculture, forestry, fishing, and hunting (Table 2.1). Together, the top four
industries account for just over 50 percent of GDP. Mining, quarrying, and oil and gas extraction
was the largest contributor to Saskatchewan’s GDP in 2018, accounting for 26.4 percent of GDP.
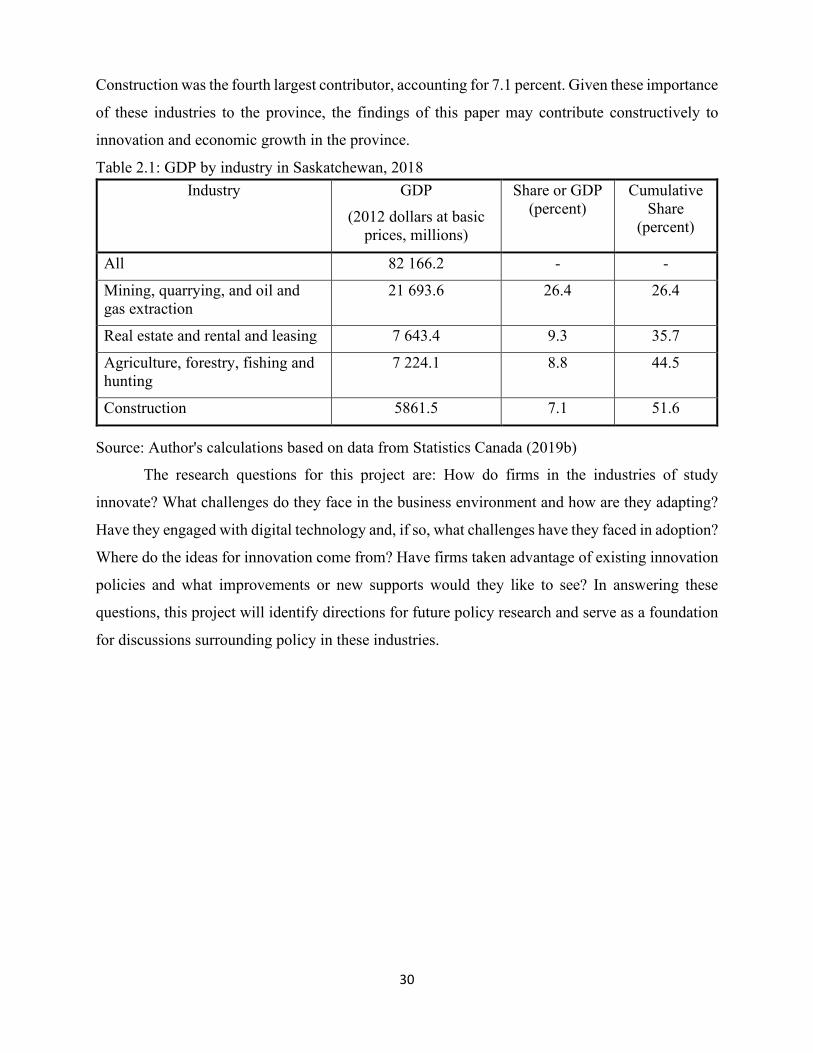
30
Construction was the fourth largest contributor, accounting for 7.1 percent. Given these importance
of these industries to the province, the findings of this paper may contribute constructively to
innovation and economic growth in the province.
Table 2.1: GDP by industry in Saskatchewan, 2018
The research questions for this project are: How do firms in the industries of study
innovate? What challenges do they face in the business environment and how are they adapting?
Have they engaged with digital technology and, if so, what challenges have they faced in adoption?
Where do the ideas for innovation come from? Have firms taken advantage of existing innovation
policies and what improvements or new supports would they like to see? In answering these
questions, this project will identify directions for future policy research and serve as a foundation
for discussions surrounding policy in these industries.
Industry GDP (2012 dollars at basic
prices, millions)
Share or GDP (percent)
Cumulative Share
(percent)
All 82 166.2 - -
Mining, quarrying, and oil and gas extraction
21 693.6 26.4 26.4
Real estate and rental and leasing 7 643.4 9.3 35.7
Agriculture, forestry, fishing and hunting
7 224.1 8.8 44.5
Construction 5861.5 7.1 51.6
Source: Author's calculations based on data from Statistics Canada (2019b)

31
3. Methods
This study was performed using semi-structured interviews with representatives of firms
in the mining, oil and gas, and construction industries in Saskatchewan. Potential participants in
the mining industry were identified using the Saskatchewan Exploration and Development
Highlights 2018 (Saskatchewan Ministry of Energy and Resources 2018). Potential participants in
the oil and gas sector were identified using Oil Allowable Rate of Production Reports
(Saskatchewan Ministry of Energy and Resources 2020). Potential participants in the construction
sector were identified using the Regina Construction Association’s member directory under the
category of “general contractor” (Regina Construction Association 2020). In all three industries,
potential participants only had to be operating in Saskatchewan and not necessarily be
headquartered there.
The goal of the study was to capture 10 to 20 interviews for each industry, following the
principle of saturation. Saturation is reached “when there is enough information to replicate the
study (O’Reilly and Parker 2013; Walker 2012), when the ability to obtain additional new
information has been attained (Guest, Bunce, and Johnson 2006), and when further coding is no
longer feasible (Guest, Bunce, and Johnson 2006)” (Fusch and Ness 2015). The relevant literature
for this study is unclear as to how many interviews this will require. In the broader literature on
saturation, the only clear takeaway is that the sample size required for saturation is highly context
dependent. Mason (2010), for example, found in a study of 532,646 PhD abstracts using qualitative
methods that the mean sample size was 31. However, the standard deviation was 18.7, indicating
a very large variability. Similarly, Guest, Bunce, and Johnson (2006) found in a study of 60
interviews that saturation occurred after the first 12 interviews and that basic themes could be
identified after the first six. 10 to 20 interviews from each of the three industries under study
therefore seemed a reasonable range to achieve saturation. Unfortunately, due to complications
created by the COVID-19 pandemic and events such as the oil price war between Russia and Saudi
Arabia, the lower threshold was not achieved in the mining, and oil and gas extraction industries.
The study was still able to identify several common themes but cannot be considered
comprehensive as a result.
Participants were recruited via email and telephone. Invitations were addressed to
technology and innovation officers within firms. In cases where no such position could be
identified on the firm’s website, invitations were addressed to senior management with instructions

32
to forward the message to individuals within the firm with knowledge of the firm’s technology
experiences, business strategy, and operations in Saskatchewan. A consent form detailing the
study’s goals and procedures was sent to participants either in the initial email or in a follow-up
email if contact was established over the phone. Participants self-selected into the study either by
contacting the researcher, if contact was established through email, or in the initial phone call.
Interviews were not limited to one per firm as people may have differing perspectives and
experiences within the firm. In cases where a firm was represented by multiple participants,
participants could choose to be interviewed individually or together.
Interviews were conducted either over the phone or in person at the participant’s
convenience and as feasibility allowed. The interviews were audio-recorded with participants’
consent. In cases where consent was not given for recording, the interviewer recorded the interview
by hand. The manual records are not a true transcript but were paraphrased to capture key ideas.
After the interview was completed, a copy of the audio-recording was shared with the Social
Science Research Laboratory at the University of Saskatchewan. Laboratory staff transcribed the
interviews and removed any identifying information such as participants’ names or the names of
companies. Afterward, the interviewer read through the transcripts and identified possible
quotations. The transcripts and the list of possible quotations, including stylized versions, were
returned to participants for review. Participants were given the opportunity to alter their transcripts
and quotations to provide clarity or to remove other potentially identifying information. Once
satisfied with the documents, participants signed a release form granting the researcher to use their
quotations. In cases where participants did not sign the release forms, it was assumed the
transcripts were correct and could be included in the analysis, but that permission was not granted
to quote them.
The interviews were semi-structured and generally followed this format: Participants were
asked to describe their business and the challenges they faced in the business environment in the
last several years. They were then asked how the firm was responding to the changes and what
role digital technologies played in this response or in the firm’s business strategy generally. They
were asked what challenges the firm faced in adopting these technologies and how they overcome
or were planning to overcome them. Participants were then asked where they got the ideas for their
digital innovations, what their experiences with new skills or work resulting from the innovations
were, and how employees and management has reacted to the innovations. The last specific
33
questions were whether the firm had used any public policies for innovation or business
development to support their innovation efforts, how effective they thought these programs were,
whether they thought there was a role for the public sector in helping the firm overcome its
challenges, and what support they would find beneficial. Finally, participants were given the
opportunity to discuss any other issues they felt were relevant or to return to previous topics. Other
questions exploring specific topics breached in the interview or topics that repeatedly appeared in
other interviews were also asked.
Data analysis was performed after the interviews had been collected, transcribed, and
approved. Analysis followed a basic interpretive qualitative approach (Merriam 2002; Merriam
and Tisdell 2016, 23-25) and was performed using a two-stage, provisional coding method
(Saldaña 2016, 168-169). This method uses a combination of deductive and inductive coding,
beginning from a list of pre-generated codes and adding, removing, and altering codes as they
emerge during data collection. Initial concepts included types of innovation; innovation activities;
and sources of ideas. These are reviewed in the remainder of this section. Codes relating to
challenges in the business environment, adaptations, types of digital technology engaged with and
adoption challenges, perceptions of innovation policies, and suggestions for improvement were
allowed to emerge during the analysis.
The OECD identifies three general types of innovation (OECD 2018, 70-73). A product
innovation is “a new or improved good or service that differs significantly from the firm’s previous
goods or services and that has been introduced on the market”. Innovations can differ on multiple
characteristics such as having improved quality, technical specifications, reliability, durability,
efficiency, affordability, convenience, usability, user friendliness, or having entirely new
functions. A business process innovation is “a new or improved business process for one or more
business functions that differs significantly from the firm’s previous business processes and that
has been brought into use by the firm.” Business processes include production, distribution and
logistics, marketing and sales, information and communications systems, administration and waste
management, and product and process development. Improvements can be related to any
characteristics mentioned for product innovation but also include implementing new business
strategies, reducing costs, improving quality or working conditions, or meeting regulatory
requirements. A more radical form of innovation involving both product and business process
innovation is business model innovation (OECD 2018, 76-77). This occurs when a firm extends

34
its business to include entirely new products or markets that require new processes, when it
transitions away from one type of business to an entirely new one, or when it switches business
models for its products such as by adopting a digital model.
Innovation activities “include all development, financial, and commercial activities
undertaken by a firm that are intended to result in an innovation for the firm” (OECD 2018, 68).
This can include activities conducted both within the firm or by an external organization (ibid.,
86). There are eight main innovation activities:
• Research and experimental development (R&D) activities include “creative and systematic
work undertaken in order to increase the stock of knowledge and to devise new applications
of available knowledge.” R&D can be either basic or applied research, or experimental
development, and is novel, creative, addresses an uncertain outcome, is systematic, and is
transferable and/or reproduceable (ibid., 87).
• Engineering, design, and other creative work activities cover activities similar to R&D but
do not meet all five criteria for R&D. These can include planning technical specifications,
testing, evaluation, installing equipment, demonstrations, reverse-engineering,
development or new forms or functions, and many others. Whereas R&D is inherently an
innovation activity, engineering, design, and other creative work activities are only
considered innovation activities if they meet the “new or significantly improved” criteria
for innovation (ibid., 87-88).
• Marketing and brand equity activities include market research and testing, pricing
methods, product placement and promotion, advertising, and development of marketing
strategies. As with engineering, design, and other creative work activities, marketing and
brand equity activities are only innovation activities if they meet the “new or significantly
improved” criteria for innovation (ibid., 88).
• Intellectual property (IP) related activities include the protection or exploitation of
knowledge, legal work to apply for register, manage, license out, enforce, sell, etc. a firm’s
intellectual property rights (IPRs), and activities to acquire IPRs from other organizations.
IP-related activities are innovation activities if they are tied to a firm’s other innovation
activities (ibid., 89).
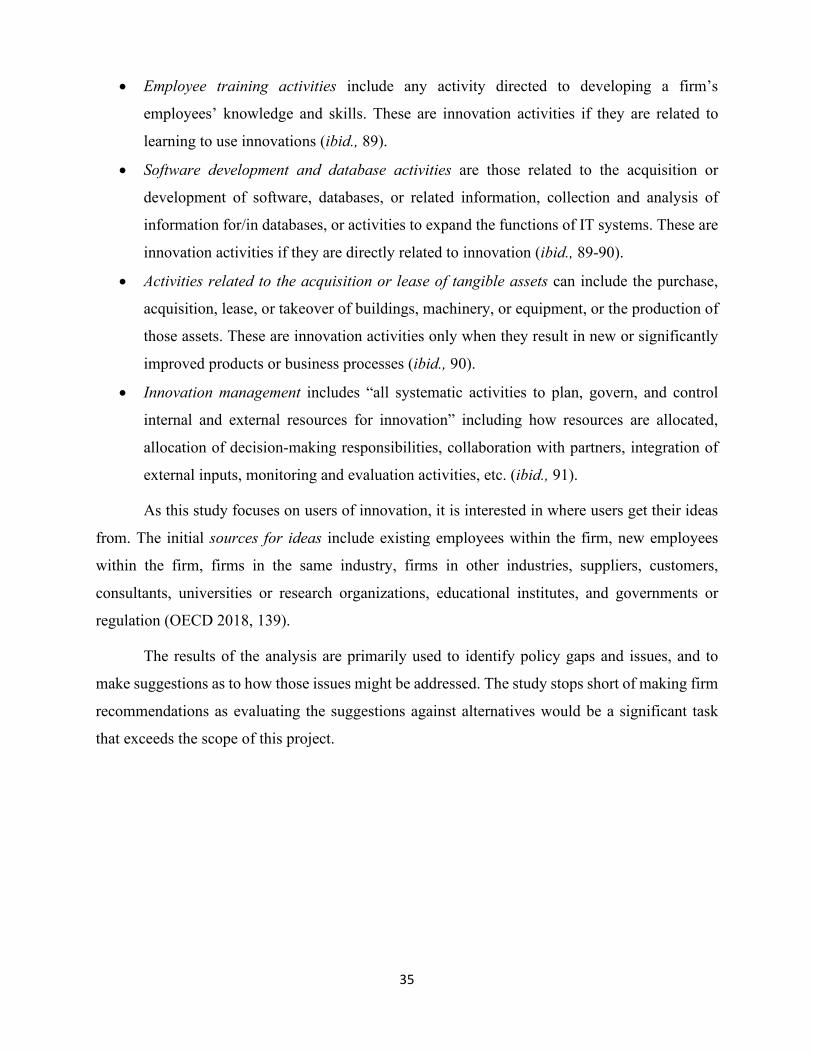
35
• Employee training activities include any activity directed to developing a firm’s
employees’ knowledge and skills. These are innovation activities if they are related to
learning to use innovations (ibid., 89).
• Software development and database activities are those related to the acquisition or
development of software, databases, or related information, collection and analysis of
information for/in databases, or activities to expand the functions of IT systems. These are
innovation activities if they are directly related to innovation (ibid., 89-90).
• Activities related to the acquisition or lease of tangible assets can include the purchase,
acquisition, lease, or takeover of buildings, machinery, or equipment, or the production of
those assets. These are innovation activities only when they result in new or significantly
improved products or business processes (ibid., 90).
• Innovation management includes “all systematic activities to plan, govern, and control
internal and external resources for innovation” including how resources are allocated,
allocation of decision-making responsibilities, collaboration with partners, integration of
external inputs, monitoring and evaluation activities, etc. (ibid., 91).
As this study focuses on users of innovation, it is interested in where users get their ideas
from. The initial sources for ideas include existing employees within the firm, new employees
within the firm, firms in the same industry, firms in other industries, suppliers, customers,
consultants, universities or research organizations, educational institutes, and governments or
regulation (OECD 2018, 139).
The results of the analysis are primarily used to identify policy gaps and issues, and to
make suggestions as to how those issues might be addressed. The study stops short of making firm
recommendations as evaluating the suggestions against alternatives would be a significant task
that exceeds the scope of this project.

36
4. Results and Discussion
This section is divided into three parts, each focusing on one of the three industries of
study. Each part is introduced by a summary of the industry’s importance in the Canadian and
Saskatchewanian economies, its innovation performance according to conventional indicators, and
how the global industry is being affected by the digital transformation and the challenges the
industry faces. As there are no estimates of the effects of the digital transformation in Canada, the
significance must be inferred using global estimates and descriptive statistics. Following the
summaries, the results for each section of the study are presented. These sections discuss recent
challenges in firms’ business environments, some of the initiatives firms have taken to overcome
these challenges, their engagement with digital technologies and digital transformation, the
challenges they have faced in that engagement, and what role they see for public policy in
overcoming those challenges.
4.1. Mining
Globally, the mining industry has long been considered a laggard in embracing the digital
transformation compared to other industries, but this is changing as more companies recognize the
opportunities presented by digital technologies (World Economic Forum 2017, 9; Young and
Rogers 2019, 685). Predictive maintenance, automation, remote operation, troubleshooting,
optimization, platform integration, and worker safety enabled by the application of sensors, big
data, analytics, cloud computing, virtual reality, and mobile technology are core aspects of digital
transformation within the industry. The World Economic Forum Estimates that between 2016 and
2025, the digital transformation in the metals segment of the mining industry and its associated
value chain alone will have created $189 billion (USD) of value for the mining industry and $130
billion of value for the metals industry; will have shifted $106 billion of value to customers,
society, and the environment; will have reduced CO2 emissions by 608 million tonnes; and saved
976 lives and prevented 44,317 injuries. However, the transformation, if fully implemented, is
estimated to eliminate over 330,000 jobs globally (World Economic Forum 2017, 24).
Previous studies have shown that many firms display poor coordination in their digital
transformation efforts and have not adopted clear strategies or objectives to pursue such a goal.
Successful firms have clear transformation strategies and ideas of their technology architectures,

37
governance structures that support investments across the whole firm, investment in platforms and
other technological foundations, and greater digital capabilities such as employment of data
scientists (Sganzerla, Seixas, and Conti 2016, 69-70). These are factors that are largely internal to
the firm. With respect to external factors, governments and communities can help by setting data
standards and regulations, by setting performance-based indicators by which companies can
evaluate the effectiveness of digital innovations, and by establishing digital platforms to better
monitor supply chains and build trust between participants (World Economic Forum 2017, 31).
The importance of the mining industry in Canada varies by province and is a critical
industry in the territories. Figure 4.1 presents the shares of GDP and exports by jurisdiction for the
mining and quarrying industry at the national, provincial, and territorial levels for 2019. Export
data may not accurately reflect provincial shares as it reflects where an enterprise is headquartered
and not necessarily where it operates. Export shares for the territories are shown on the secondary
axis. Though the mining industry only accounted for 1.7 percent of GDP and 4.7 percent of exports
in Canada in 2019, there was strong variation across jurisdictions. Mining held a significant share
of GDP in Nunavut, Northwest Territories, and Saskatchewan, British Columbia, and
Newfoundland and Labrador, and a significant share of exports in the Northwest Territories,
Figure 4.1: Mining and Quarrying (Except Oil and Gas) Share of GDP and Exports by Jurisdiction
Source: Author’s calculations based on data from Statistics Canada (2019a; 2019b; 2019e)
0%
20%
40%
60%
80%
100%
0%
10%
20%
30%
40%
50%
60%
Share of GDP Share of Exports Territories Share of Exports
38
Nunavut, and Saskatchewan. In Saskatchewan, mining accounted for 10.0% of GDP and 13.1% of
exports. Figure 4.2 presents mining’s share of total, Indigenous, and female employment at the
national, provincial, and territorial levels using 2016 census data. In almost all cases, mining
accounts for a higher share of Indigenous employment and a lower share of female employment
than for the overall population. In 2016, the industry accounted for 0.4 percent of overall
employment, 1.2 percent of Indigenous employment, and 0.1 percent of female employment in
Canada, and 1.8 percent of overall employment, 2.6 percent of Indigenous employment, and 0.5
percent of female employment in Saskatchewan. Digital transformation of the mining industry is
expected to have significant employment impacts as many of the jobs in the industry are low-
skilled and highly routinized. The impact will be disproportionately borne by Indigenous people
is the North for whom the industry is a primary employer in many communities (Thomson 2016;
Innovation, Science, and Economic Development Canada 2018; Mining Industry Human
Resources Council 2020).
Between 2015 and 2017, 48.4 percent of mining companies in Canada reported conducting
any kind of innovation activity compared to 60.4 percent of firms overall (Statistics Canada
2019b). There are no equivalent statistics at the provincial level. With respect to productivity
growth, aggregate estimates for the mining and oil and gas extraction sector indicate that for the
sector as a whole labour productivity declined by an average 0.88 percent per year over the 2000-
2016 period. This was entirely caused by a 3.72 percent per year decline in MFP (Gu and
0%
2%
4%
6%
8%
10%
Total Indigenous Female
Figure 4.2: Mining and Quarrying (Except Oil and Gas) Share of Total, Indigenous, and Female Employment, 2016
Source: Statistics Canada (2019c)

39
Macdonald 2020, 35). There are no recent detailed estimates of labour productivity growth for the
mining industry specifically but dated analyses by Bradley and Sharpe (2009a, 16; 2009b, 17) find
that there was a -1.07 percent compound annual growth rate (CAGR) in MFP for the mining
industry in the 2000-2006 period. MFP growth in mining fared better in Canada than the United
States, which saw a -1.68 percent CAGR in MFP, for this period. One possible explanation for the
poor MFP performance is that the industry had poor innovation performance. However, Bradley
and Sharpe (2009a, 43) find that the productivity decline in Canada was not due to a lack of
innovation but was a result of profit-based decision making and expansion of activities into
marginal resource deposits that were influenced by high resource prices. At the time, the mining
industry was at the forefront of technological progress. In recent years, the major segments of the
mining industry in Saskatchewan have experienced a downturn in resource prices and a
corresponding decline in revenue. This development may have affected the industry’s ability to
remain on the technological frontier at a critical moment of technological transformation. Since
high resource prices are no longer sufficient to sustain the prosperity of the industry,
technologically-enabled productivity growth will be key to sustaining the industry’s well-being.
The remainder of this section summarizes the findings for mining firms in Saskatchewan.
Potash and uranium account for a majority of Saskatchewan’s mining industry and the five
interviews, representing five firms, drawn on in this section primarily represent those areas, though
one of the participant firms in the uranium industry was diversified into rare metals as well. As a
result of the low participation rate and the diversity in respondents, saturation was not achieved
and the results here should not be interpreted as comprehensive. Nevertheless, some convergence
was observed and there are findings that provide useful direction for public policy.
Low commodity prices were identified as a significant challenge in recent years in the
potash and uranium industries.8 For the potash industry, downstream disruption in the global
agriculture industry from changing weather patterns and extreme weather such as the fires in
Australia have contributed to this challenge. The problem is further exacerbated by technological
change such as the shift to precision agriculture, itself a facet of digital transformation in the
industry, which creates a dynamic market scenario, and by the competitive structure of the industry
in which potash firms in other countries enjoy regulatory, tax, currency exchange, or other
8 200221_1259, 2; 200316_1505, 4; 200429_1428, 2

40
advantages such as preferable conditions for shipping.9 In the uranium industry the problem is
driven by an about-face in public attitudes toward nuclear energy following the Fukushima disaster
in 2011. Prior to this, one participant stated the world was undergoing a nuclear renaissance and
public interest in nuclear energy was high. Following the disaster, countries around the world
became averse to nuclear energy and the uranium industry has been struggling ever since.10 Low
prices are not an issue in the rare metals industry, which faces very high demand. Rather, the major
challenge in that industry is the domination of the supply chain by Chinese firms, which were
reported to control over 90 percent of end products using rare earth metals.11 This seems to be less
of an immediate concern as the firm has been able to rely on this supply chain to maintain
profitability despite uranium prices being low. It is more likely to be an issue of national security
in the long term as rare earth metals are a key component in computer-based products and emerging
products such as electric vehicles.
Firms are using different strategies to overcome these challenges. In the uranium industry,
one participant reported their firm has reduced production to preserve their finite resources for
when prices increase again.12 Firms in the potash industry are adapting using innovation-based
strategies to reduce costs, improve safety, grow market share, or introduce new products.13
However, one participant reported that their firm’s efforts have been partially negated by public
policies that add costs back through tax or royalty increases. Consequently, the firm has increased
its government outreach to raise awareness of the realities faced in the industry.14 Given that some
of these changes do not target potash firms specifically, one can expect that this problem is
experienced across both the potash and uranium industries.
Digital transformation was identified as an important adaptation strategy by all participants
in the potash industry and by one participant in the uranium industry. Participants were hesitant
to discuss their digital transformation in depth given its importance to competitive advantage but
were willing to discuss a few important digital innovations in general terms. Most of the initiatives
were devoted to improving production processes. Machine learning and AI, and automation are
being adopted in both the potash and uranium industries to optimize production processes and
9 200316_1505, 2-3 10 200429_1428, 2 11 200221_1259, 2 12 200429_1428, 2 13 200228_1527, 1; 200316_1505, 4 14 200316_1505, 2

41
improve maintenance. Companies are implementing these technologies using lessons learned from
other industries such as vehicle automation or from other parts of the supply chain in which they
are vertically integrated.15 One participant from a smaller firm had considered adopting machine
learning for mineral exploration but had decided against it as it was deemed too costly for the
marginal benefits it would bring.16 This suggests there is increasing returns to scale for this type
of technology. Technologies such as cloud computing, 3D modelling, and mobile technology are
also being employed to help employees access data in a more efficient manner and, when used
with machine learning technology, to improve asset management.17 That digital transformation
has become an important strategic pillar should not be surprising. One participant pointed out that
it is impossible to open a mining magazine, attend a conference, or speak with a consultant without
digital transformation being mentioned.18 However, though most participants were enthusiastic
about transformation, the process is still in early stages. A key difference between mining in
Saskatchewan versus technological leaders such as Rio Tinto in Australia is the type of mining
being done. Whereas much of the mining in Australia, particularly for iron and coal, is done using
open pits, potash and uranium mining in Saskatchewan takes place in underground facilities. This
creates technical challenges for innovations relying on internet access or GPS navigation and
partially explains the lag in adoption by Saskatchewan mining firms.
Firms are embracing several different strategies to implement their transformations. The
most developed uses a bottom-up approach where the person responsible for implementing the
firm’s digital transformation collaborates with general managers that run the mine sites to identify
directions for transformation and to identify the best way to implement solutions. Once a solution
has been developed, it can be deployed to other sites. This strategy can help overcome resistance
from employees and helps preserve accountability by involving the people responsible for
production and safety in developing the solutions.19 Other companies use a more top-down strategy
where transformation is driven by the CEO and top management. This strategy requires large
amounts of industry intelligence and efficient lines of communication to support executive
15 200228_1527, 3; 200429_1428, 3 16 200221_1259, 2-3 17 200429_1428, 3, 200506_1258, 3 18 200429_1428, 6 19 200228_1257, 2-4

42
decision making.20 This approach allows for closer integration of innovation with business strategy
and allows for more control over the allocation of resources.
Participants identified several challenges that they had experienced with their firms’ digital
transformations. Challenges with managing the changes were identified in both the potash and
uranium industries, specifically challenges related to bringing different parts of the company
together to make the changes possible. One participant in the potash industry recalled that in the
early stages of their firm’s transformation, different segments of the company would try to take
charge of an innovation and would get into “turf wars” with each other.21 Another participant in
the uranium industry reported that their digital transformation was initially hampered by
communication barriers between data scientists and miners whose different technical backgrounds
prevented them from being able to discuss problems in a common language.22 In both cases the
challenges were resolved by having groups continue to work together until common goals were
defined and a rapport was established, but it required a determined effort. In the latter case,
exposing each group to the other’s context, such as by having data scientists go down into mines
to experience the context in which data is generated and having miners work with data scientists
to learn how data can be used, was an effective method of overcoming the barrier.23
A related potential challenge mentioned by participants in both industries was resistance
from employees related to concerns over job loss created by automation. In one case, the problem
was avoided by holding quarterly town halls where leadership would discuss changes with
employees. While the participant acknowledged that automation would change the nature of jobs,
they argued that job loss could be avoided by retraining existing employees with the skillsets
required by the new jobs. The participant believed that training for skills in this way would create
employees that were more qualified than employees that were newly hired with the required
skillsets as the existing employees would have an appreciation for both the manual and automated
modes of operation.24 However, another participant suggested that automation would reduce the
number of jobs required. In this case, the firm’s reduced production meant that they had laid off
many employees already. The participant pointed out that this created a window of opportunity
where changes could be made with minimal resistance and that no jobs would be lost to the new
20 200316_1505, 6-7; 200429_1428, 5 21 200228_1257, 5 22 200429_1428, 4 23 200429_1428, 4 24 200228_1257, 6
43
technology, only that some jobs would not come back as a result.25 The difference between the
two cases suggests that in the long term automation will reduce the number of jobs available, but
the timing of the job loss will depend on decisions made by the firm on how many jobs to retrain
for and how many to eliminate directly, and the existence of windows of opportunity for when
those jobs could be eliminated.
A third challenge involving personnel is related to the perception of what changes are
possible. One participant recalled that when their firm was first starting out on its digital
transformation, there were several problems that existing employees and managers at the time
believed to be impossible to solve. But this changed when the firm hired a new person who brought
fresh perspective and started collaborating with employees and management and questioning the
insolvability of the problems in question, eventually working toward solutions for many of them.
Though the participant stressed that the firm was not lacking in innovative culture before this
person was hired and that their efforts would not have been successful without a collaborative
approach, the change in personnel was key in overcoming the barrier created by pre-conceived
ideas of what was possible.26
In general, participants emphasized the need for strong leadership, employee involvement,
and building teams with the right balance of creative and practical skills and rapport as being
important for developing a coordinated approach and overcoming resistance within the firm.27 But
these only contribute so far to overcoming technical challenges firms face particularly in the potash
industry where the unique characteristics of the operating environment prevent firms from directly
adopting technology being used in other industries. Firms must invest heavily in R&D, software
development, and engineering to adapt existing technology to the environment. The benefit of this
is that it avoids problems of integrating off-the-shelf technology with existing platforms and the
technology can be customized to user needs which can help overcome resistance from
employees.28 But the rapid pace at which these technologies are evolving and the long
development times required to adapt them often mean that the products of the development process
are obsolete by the time they are ready.29 In cases where the products are still relevant, the
competitive advantage may only be retained for a few years as other companies are working to
25 200429_1428, 3, 5 26 200228_1257, 3-4 27 200228_1527, 5-6; 200316_1505, 7; 200429_1428, 5 28 200228_1257, 2-3 29 200316_1505, 6
44
solve the same problems. Secrecy is therefore the best tool for appropriating the benefits of
innovation.30 Participants reported using the SR&ED tax credit and funding provided through
Mitacs, NSERC, Western Diversification, or forming partnerships with university researchers to
access funding available through the higher education stream to help offset the costs of innovation.
However, in the latter case, collaboration can lead to conflict over ownership of IP.31
When asked what role the public sector could play in helping overcome their innovation
challenges, participants expressed support for more funding for research projects as this can
determine how many projects they invest in in a given year.32 Two participants took this idea
further and expressed interest in establishing a mining tech hub to work on technical problems
faced by mining companies in the province.33 The justification for such a supply-side institution
is uncertain. Such institutions are normally justified to correct underinvestment in R&D, but
mining firms are investing heavily in R&D already and there are a multitude of mining industry
research organizations in Canada. The problem is that these organizations often operate in silos
(Canadian Chamber of Commerce 2013, 37). The possibility of adding another organization
should therefore be approached cautiously. A better approach may be to make use of existing
institutions and build on efforts made by institutions such as the Canadian Mining Innovation
Council (CMIC) in the last decade to promote greater cooperation between existing institutions
and industry. With this in mind, there is also merit to having an institution devoted to firms in
Saskatchewan and the unique problems they face. Saskatchewan Polytechnic’s new Digital
Integration Centre of Excellence is ideally suited to supporting the industry’s research efforts to
overcome these challenges. Such an approach can be justified as a counterweight to the
competitive advantages enjoyed by competitors in other countries. However, given that firms
within Saskatchewan compete on the basis of technology and the ability to solve problems quickly,
it may reduce competition within the province. Justification for the policy would require greater
cost-benefit analysis to determine which scenario creates the greatest returns for firms and the
public.
In addition to helping address R&D challenges, two participants expressed interest in
public support for retraining programs.34 As firms begin to automate more processes, there will be
30 200228_1257, 9; 200316_1505, 6 31 200228_1257, 7; 200316_1505, 8 32 200429_1428, 9 33 200228_1527, 8; 200506_1258, 5 34 200228_1257, 6; 200429_1428, 9
45
reduced demand for equipment operators and increased demand for a variety of technologists.
Policy intervention in this are can be justified as offsetting the transaction cost that is created by
the need for training which may reduce overall investment in technology, and as a means to
maintain or possibly increase social welfare especially in northern communities where such jobs
account for a significant portion of employment. Implementing such a policy will require
leadership from provincial governments which have primary responsibility for education. In
Saskatchewan, the Polytechnic, again, is ideally situated to act in this area. The institution already
provides consulting and training to firms in the province and has capacity to provide training in
both trades and computer skills. Along with the Digital Integration Centre of Excellence, they are
best suited to consult with industry and other institutions to determine what skills are required and
to construct appropriate programs. The Polytechnic should therefore be a leading partner, in
partnership with the provincial government, on consulting with industry, other educational
institutions, and the federal government to determine what skills are required and to construct the
subsequent programs, qualification regimes, and funding options.
Finally, several participants expressed a desire for the public sector to make greater effort
in providing stability for the industry.35 Investments in mining, whether it is for innovation or
expanding operations, require large amounts of capital and often have long lead times before
returns begin to accrue. Having stable regulations, taxes, and royalties can improve the investment
prospects of the industry. One suggestion to improve stability was to introduce tax and royalty
schedules with long time horizons so that firms can have an idea of what their financial obligations
will be several years into the future. Such an approach could be justified as a non-financial measure
to reduce uncertainty, but carries significant feasibility concerns. The exact time horizon would
have to be determined through consultation with the industry and, if extending the policy to the
tax system in addition to the royalty system, would require introducing a parallel tax structure for
mining firms. Such a policy could also be applied to similar industries, such as oil and gas, that
experience similarly long lags. Ideally, there would be a legislated limit for how soon a change in
the schedule can be implemented to give firms time to adjust but this would have to be balanced
against democratic principles to accommodate changes in governments with differing priorities.
Though far from comprehensive, the results begin to provide a rough idea of the nature of
the mining ecosystem in Saskatchewan: Mining firms are both “assemblers” and “users” in the
35 200313_1505, 9; 200506_1258, 5

46
innovation ecosystem for mining as they purchase generic components and engineer them into
context-specific digital technologies. The size of the companies means they frequently have the
technical expertise and financial resources to accomplish much of the innovation themselves. The
public sector supports this through financial programs targeted toward R&D investment. However,
there are points for improvement. There is a need for a “champion” or an “entrepreneur” to bring
together disparate research centres to break down silos and improve information flow. This may
be accomplished by establishing a new institution with such a mandate or by persuading an existing
institution to undertake such a task. Though the role the public sector takes on in this project may
vary, it is a prime actor, or “regulator,” in the area of education. Through curriculum innovation,
the public sector can support both the industry’s shifting expertise requirements as well as the
communities most at risk of job displacement. Finally, the public sector can support the industry
through stable regulations to reduce uncertainty for investments that require decades to pay off.
4.2. Oil and Gas Extraction
The global oil and gas extraction industry has historically been highly engaged with digital
technology adoption. Now, the industry is beginning to use cloud computing, IoT, big data,
analytics, digital twins, augmented and virtual reality, automation, remote operation, mobile
technology, social platforms, and others to improve decision making, optimize production, enable
predictive maintenance to improve life-cycle management, improve safety, and better engage with
customers (World Economic Forum 2017b; Lu et al. 2019). The World Economic Forum Estimates
that between 2016 and 2025, a scenario of total application of these technologies could produce
$1 trillion (USD) of value for firms in the oil and gas value chain with $580-600 billion accruing
to firms in the extraction industry; will produce approximately $640 billion of value to wider
society from cost reductions, productivity improvements, reducing water usage, and lowering
emissions; will reduce CO2 emissions by approximately 1.3 billion tonnes and oil spills by 230,000
barrels; and significantly reduce the number of accidents and injuries. However, the
transformation, if fully implemented, is estimated to have a net displacement of 35,000 jobs
globally (World Economic Forum 2017b, 12-25).
Rather than embracing full transformation and exploiting the full possibilities of new
digital technologies, much of the progress to date has been incremental and focused on improving
existing activities through selective application of technology (World Economic Forum 2017b, 4).

47
Many companies are still in the early phases of digital transformation, focusing on digitization of
existing activities and not yet focusing on how data can be integrated and be used to transform the
company (Lu et al. 2019, 71). There are several factors that have prevented the industry from fully
embracing the transformation (World Economic Forum 2017b, 26; Lu et al. 2019, 86). Data
security and intellectual property regulations have not adapted to networked business models
where data is shared along a value chain, and integration along value chains remains fragmented.
The lack of standardization and integration of data across platforms creates uncertainty concerning
ownership of or access to data. The industry’s conservative culture creates a mistrust of new
technology among leaders and employees. There is a lack of digital skills in the industry and the
industry has a poor reputation among many of the younger generations. There are concerns about
security and the threat of cyberattacks to which new technologies make companies vulnerable.36
The inherent difficulties in assessing the benefits of many technologies and long lag times between
implementation and results make it difficult to determine the ROI for new technologies.
Insufficient supporting platforms and interoperability between technologies can reduce the
benefits. Finally, companies may not have the financial resources to invest in digital
transformation. Measures that companies can take to overcome these challenges include making
digital transformation a priority for executives and developing digital strategies, fostering a culture
of innovation within their companies by encouraging technology use and exchange of ideas,
investing in human capital and development programs, continuing to digitize their core
capabilities, reforming their data architecture, investing in partnerships for innovation, and piloting
new technologies and sharing results. Governments and communities can help by reforming data
standards and regulations to encourage sharing, developing partnerships for innovation within
government, creating regulations to foster a shift to a low-carbon economy, and providing financial
support for innovation (World Economic Forum 2017b, 27-28; Lu et al. 2019, 86).
The oil and gas extraction industry in Canada accounts for a significant share of total
exports and is highly significant in several provinces. Figure 4.3 presents the shares of GDP and
exports by jurisdiction for the oil and gas extraction industry at the national, provincial, and
territorial levels for 2019. Though the oil and gas extraction industry accounted for 5.5 percent of
GDP and 13.4 percent of exports in Canada in 2019, the industry is most significant in Alberta,
36 It should be noted that the risk of cyberattack is not unique to the oil and gas industry but, rather, is a risk for any industry using IoT networks.

48
Newfoundland and Labrador, and Saskatchewan, representing 14.6 percent of GDP in the latter
case. As with mining, export data does not accurately reflect provincial shares as it reflects where
an enterprise is headquartered and not necessarily where it operates. In this case, oil and gas’s
export share in Saskatchewan appears to be 0.2 percent but many firms operating in Saskatchewan
are based in Alberta. GDP shares are therefore a more accurate reflection of the importance of the
industry. Figure 4.4 presents the industry’s share of total, Indigenous, and female employment at
the national, provincial, and territorial levels using 2016 census data. With the exception of
0%
10%
20%
30%
40%
50%
60%
Share of GDP Share of Exports
Source: Author’s calculations based on data from Statistics Canada (2019a; 2019b; 2019e)
Figure 4.3: Oil and Gas Extraction Share of GDP and Exports by Jurisdiction
0%
2%
4%
6%
8%
10%
Total Indigenous Female
Figure 4.4: Oil and Gas Extraction Share of Total, Indigenous, and Female Employment, 2016
Source: Statistics Canada (2019c)

49
Alberta, the industry accounts for less than 1.0 percent of employment for each group in all
jurisdictions.
Between 2015 and 2017, 41.3 percent of oil and gas extraction companies in Canada
reported conducting any kind of innovation activity compared to 60.4 percent of firms overall. The
most recent detailed productivity estimates for the industry from Bradley and Sharpe (2009b, 17)
found that in the 2000-2006 period, there was a -6.67 percent CAGR for MFP in the oil and gas
extraction industry. MFP growth in the industry was worse in Canada than the United States which
saw a -1.85 percent CAGR in MFP over the period (ibid., 24). As with the mining industry, the
industry was at the leading edge of innovation during this period, and the productivity decline in
Canada was a result of high resource prices which induced profit-based decision making and
expansion into more marginal resources (ibid., 40). However, as with the mining industry, the oil
price crash of 2014 and the recent oil price war between Russia and Saudi Arabia may have left
companies without sufficient resources to innovate at a time when they need to most. This also
comes at a time when demand for fossil fuels is expected to slow and decline, and investors are
hesitant to invest in the industry. Digital transformation of the industry will be necessary to adapt
to these challenges and will require proper support.
The results for this section come from eight interviews representing seven firms in the oil
and gas extraction industry. It should be noted that the oil and gas extraction industry in
Saskatchewan is exclusively conventional oil and gas rather than the oil sands found in Alberta,
as the two industries employ very different extraction technologies. The industry is currently
experiencing a business environment that one participant described as the “toughest [the] industry
has seen in a generation”37 caused by low commodity prices and increased costs. Public policies
are key in either creating or exacerbating these challenges.
The oil and gas extraction industry in Canada has faced a challenging economic
environment since 2014 when global oil prices fell from over $100.00 per barrel to approximately
$30.00 per barrel in early 2016. Following the crash, prices remained low as producers struggled
to clear an excess of product in their inventories. Though there was a slight recovery between 2016
and 2020, prices crashed again in March of 2020 amid fears that the COVID-19 pandemic would
trigger a global recession and a price war between Russia and Saudi Arabia (Seskus 2020). These
37 191211_930, 2

50
two events combined to drive oil prices briefly into negative values (Evans 2020). At the time of
writing, prices have recovered slightly and West Texas Intermediate (WTI), one of the North
American benchmarks, is trading at approximately $40.00 per barrel.
The Canadian oil and gas extraction industry faces an even more challenging market than
the one just portrayed as it trades its oil at a discount to WTI. Figure 4.5 compares the prices
between WTI and Western Canadian Select (WCS), the Canadian benchmark, from 2014 to April
2020. Over this period, WCS traded, on average, at a 30 percent discount to WTI (Government of
Alberta 2020). This can be attributed to lower quality, increased competition from U.S. shale
producers, and egress challenges leading to higher transportation costs (Oil Sands Magazine 2018).
Several participants identified the latter problem as the most severe of the three. The lack of
pipelines has driven many firms to transport their product by rail, but an overall scarcity of capacity
remains. Firms have had to reduce operations and capital expenditures, and lay off large portions
of their workforce or reduce hours to reduce costs and avoid shutting down. Overall investment in
the industry has drastically declined.38 The surplus supply and egress challenges have also shifted
value capture not only downstream to oil refiners but to oil producers in the United States who are
taking advantage of arbitrage to purchase inexpensive oil and resell it at the higher world price.
Federal public policies concerning pipeline project approval have played a key role in creating this
situation. One participant argued that these policies have been influenced by intense negative
38 191211_0930, 2; 191211_1007, 2-3, 16, 200403_1302, 2; 200421_1001, 2
$0
$20
$40
$60
$80
$100
$120
Janu
ary
1, 2
014
April
1, 2
014
July
1, 2
014
Oct
ober
1, 2
014
Janu
ary
1, 2
015
April
1, 2
015
July
1, 2
015
Oct
ober
1, 2
015
Janu
ary
1, 2
016
April
1, 2
016
July
1, 2
016
Oct
ober
1, 2
016
Janu
ary
1, 2
017
April
1, 2
017
July
1, 2
017
Oct
ober
1, 2
017
Janu
ary
1, 2
018
April
1, 2
018
July
1, 2
018
Oct
ober
1, 2
018
Janu
ary
1, 2
019
April
1, 2
019
July
1, 2
019
Oct
ober
1, 2
019
Janu
ary
1, 2
020
April
1, 2
020
WTI WCS
Figure 4.5: Oil Prices - West Texas Intermediate (WTI) and Western Canadian Select (WCS)
Source: Government of Alberta (2020)
51
public opinion towards pipelines and the oil and gas extraction industry from some segments of
society and are reflective of a political rather than economic approach.39
The challenges created by low commodity prices are aggravated by an increasingly strict
regulatory environment.40 Increased reporting requirements for carbon emissions have increased
overhead costs for firms as they must hire more staff to do the reporting. Participants did not say
by exactly how much these costs have increased but one participant reported that from the time
they started working at their company 25 years ago to the present, the composition of the company
has shifted from being primarily engineers and geologists to primarily administrators and
accountants. This participant also expressed frustration at the lack of transparency in emissions
reporting and not seeing any clear purpose to it.41 Increased reporting requirements have increased
the time required for project approvals and the delay is often enough that by the time approval
comes through, the window of opportunity for the project has closed and it is no longer viable. 42
Firms are also challenged to comply with multiple overlapping and often conflicting regulatory
regimes at the federal and provincial levels, and sometimes across ministries and agencies. This
diversity creates a burden on companies not only by increasing administration costs to ensure
compliance, but by forcing companies to spend on multiple redundant tests or measurements
because regulations often do not recognize the work done to fulfill requirements for other
regulatory regimes. One participant gave the example of measuring methane emissions which had
to be done multiple times because the protocols across different regulatory regimes were different.
Testing as part of the R&D process often suffers from similar complications.43 Aside from the
problem of multiple regulatory regimes, there is a perceived arbitrariness to some regulations
within regimes. One participant presented the example of needing a permit to operate a drilling rig
within a certain distance of an airport, but a permit was not required to operate a maintenance rig
of similar dimensions. When they tried to report this inconsistency, they found there was no one
to receive their complaint.44
Participants identified several other public policies which are increasing costs in the
industry. Increasing property taxes, utility rates, and costs imposed both directly and indirectly by
39 191211_1007, 2-3, 40 200303_1021, 2; 200421_1259, 1 41 200305_1415, 2-3 42 200305_1415, 2-3 43 200401_1033, 2-3 44 200305_1415, 1-2

52
the carbon tax reduce firm’s margins and increase the risk of firms exiting the market.45 In
Saskatchewan specifically, the provincial government began enforcing Directive 17, a piece of
legislation governing measurement in oil and gas operations, in 2016 with required compliance by
April 1st, 2020. Directive 17 requires that some older models of measurement devices at well sites
be replaced with newer models. But replacing the old devices is costly and the enforcement’s
coincidence with the low oil prices and financial strain created frustration in the industry.46
The challenges posed by the regulatory structure and other public policies, though
challenging in themselves, are primarily additional to the challenges created by low oil prices and
egress challenges and add to an already intolerable situation. Though firms are responding to these
challenges in a variety of ways, their primary goal is to reduce costs. Digital innovation through
automation is a key component to this strategy for most firms, but there are other strategies such
as reducing power costs and reusing instead of venting well gas that though beyond the focus of
this study nevertheless have significant enough public policy aspects that they merit discussion.
These strategies are discussed in the Appendix. The remainder of this section is devoted to
discussing digital innovation in the industry.
Digital transformation in the oil and gas extraction industry is overwhelmingly focused on
applying remote monitoring and operation systems to well sites, pipelines, and other facilities to
improve production processes and administration.47 The major benefit of remote monitoring and
operation is that it reduces downtime. Formerly, when operators drove to well sites to inspect them,
a problem could occur and a site could spend several days underperforming before it was noticed.
With remote monitoring, problems can be detected within moments of their occurrence. In some
instances, operators can fix them remotely, and in cases where the problem cannot be solved
remotely, operators can be dispatched directly to the site. This practice is much more efficient than
routine patrols and reduces driving-related safety risks. The improved monitoring helps reduce
emissions both through improved site management and by reducing vehicle use.48 Remote
monitoring and operation is strongly supported by machine learning, analytics, and cloud
databases. Machine learning algorithms add a degree of automation to the system by monitoring
45 191211_1007, 6; 200305_1415, 2-3 46 200403_1302, 5-6, 11 47 191211_0930, 2; 191211_1007, 3-4; 200303_1021, 2; 200305_1415, 3; 200401_1033, 4; 200403_1302, 4-5; 200421_1001, 2-3 48 191211_0930, 2; 191211_1007, 3-4, 17

53
sites to determine if the conditions are out of the ordinary and alerting an operator if they are.49
Analytics can be used to optimize production, improve demand forecasting and logistics, and
enable predictive maintenance practices.50 Cloud databases act as platforms for analytic systems
and enable employees to share documentation and communicate more efficiently.51
Firms use different strategies to implement these technologies. For example, one larger
firm uses a decentralized approach where different segments of the firm pilot a variety of
technologies and solutions. The lessons learned are then applied to other segments of the company
where they are most relevant.52 In another large firm, the activities were somewhat more
centralized. The workforce and customers are key in generating ideas and creating a demand for
new technologies, but upper management is responsible for vetting the ideas.53 A participant from
a smaller firm explained that once the firm decided to implement the technology, it used a strategy
where the technology is implemented gradually as existing systems need to be replaced.54 Firms
receive ideas for innovation from a variety of sources including employees within the firm,55 from
other firms in the industry,56 and by working with suppliers.57 Firms undertook several activities
in the innovation process itself. Hardware innovation often involved a combination of acquisition
of existing devices and engineering new ones.58 Software innovation was the same, involving a
combination of purchasing and development.59 Three participants reported that their firms
undertook some degree of R&D, in one case to develop new innovations, in another to solve
technical problems with implementation, and in the third case it was both.60 In many cases, training
was a key innovation activity for implementation success.61
Participants identified several innovation challenges, but cost is the most significant.
Sensor systems for individual sites can cost tens of thousands of dollars to engineer and install and
this creates different challenges for firms depending on their size. Smaller firms, though they may
49 191211_1007, 3-4 50 200303_1021, 2; 200401_1033, 5 51 200303_1021, 2 52 200401_1033, 5 53 200303_1021, 4-5 54 200403_1302, 8 55 200303_1021, 5; 200421_1259, 3 56 200403_1302, 4-5; 200421_1001, 3 57 191211_0930, 2-3; 200401_1033, 5-6 58 191211_0930, 4; 191211_1007, 5 59 191211_0930, 4; 200421_1001, 4 60 200303_1021, 5; 191211_1007, 5-6; 200401_1033, 4-5 61 191211_0930, 3; 200305_1415, 5; 200421_1259, 2
54
have only a few dozen sites, struggle to pay the upfront costs of adopting the new technology.62
Larger companies may have hundreds of thousands of sites and may struggle to bear the
cumulative costs.63 The size of individual well sites is also a factor. Since the costs of sensor
systems does not vary greatly with the size of the site, a firm whose sites are larger than average
will enjoy economies of scale than firms with smaller sites do not receive.64 In addition to the
systems at well sites and other facilities, firms often must also bear the cost of installing
communications infrastructure to support the systems.65 Many facilities such as well sites and
pipelines are in remote areas that do not have high speed connectivity. Without this, remote
monitoring and its related technologies cannot function. These challenges are all complicated by
the difficulty of determining the ROI of the system.66 However, the challenge of determining ROI
has been less of a barrier to innovation than it might be in other industries because the pressures
faced by the oil and gas extraction industry necessitate the adoption of these systems.67
The efficiency gains created by remote monitoring and operation may be expected to create
resistance from employees who are concerned about job loss. However, this does not appear to be
the case. Remote monitoring has resulted in a more efficient allocation of labour and more
proactive rather than reactive responses to problems. 68 The technology has necessitated creating
new operational technologist positions within companies. These technologists interpret the
feedback from the monitoring systems and dispatch operators to address problems as they arise.69
The transition to these new roles and learning to use the new technologies in general was reported
to have created a small amount of discomfort but not outright resistance and was perceived to be
greater among older employees,70 but this was overcome through collaboration, training, and
giving employees time to experiment with the new technology.71 In other cases, such as when
firms were developing data strategies, hiring new employees with the requisite skills was
62 200403_1302, 5-6 63 191211_1007, 4; 200303_1021, 4 64 191211_1007, 10-11 65 191211_0930, 2-3; 200305_1415, 3-4; 200401_1033, 4; 66 200303_1021, 4; 200305_1415, 7; 200421_1001, 5; 200421_1259, 3 67 191211_1007, 16 68 191211_1007, 16-17; 200305_1415, 5 69 200305_1415, 5-6 70 200305_1415, 5-6; 200403_1302, 7; 71 191211_0930, 3; 200305_1415, 5-6
55
necessary.72 Overall, firms faced minimal resistance from employees in implementing these
technologies and in some cases reported high employee enthusiasm.73
Other innovation challenges identified by participants included technical challenges of
developing the technologies and the associated learning curve, not being fully aware of the
possibilities created by the new technologies, and having to overcome conservative business
cultures that had a strong preference for existing practices.74 However, in all these cases,
participants recognized that the only way to overcome these challenges were to consistently work
with the new technology and purposefully embrace it.
When asked if their firm had taken advantage of any public policies to support their
innovation efforts, most participants reported that their firms had. Only two firms reported not
taking advantage of innovation policies.75 However, for the firms who had, most of the assistance
was directed not toward digital innovation but toward other types of innovation. These are
discussed in the Appendix. For digital innovation, participants used the SR&ED tax credit and its
provincial counterparts, and the Saskatchewan Petroleum Innovation Incentive (SPII).76 The
SR&ED tax credit, as discussed previously, is a combination of refundable and non-refundable tax
credits for money spent on R&D activities. SPII is a royalty tax credit for innovation projects that
improve oil and gas recovery, manage environmental impacts, increase the value-added in
processing, or commercialize production by-products or waste. The participant who reported using
SPII had no complaints about the program, but one participant who used the SR&ED tax credit
cautioned that applying for the program carried significant administrative burdens. Their firm has
a team of five people dedicated to dealing with SR&ED tax credit and other government
applications. They suggested that the need for this expertise and the lag times between application
and refunds, sometimes taking a year, would be prohibitive to smaller companies applying for the
program.77 The lags involved also make the program of little use to assist with the upfront costs of
innovation.
Overall, participants identified few areas where public support for digital innovation was
desired. Most of the suggestions were related to the regulatory environment in general or to
72 200421_1259, 2 73 200303_1021, 5; 200421_1259, 4 74 191211_0930, 4; 200421_1259, 2; 200403_1302, 4 75 200421_1259, 4; 200421_1001, 5 76 200303_1021, 7; 200401_1033, 7; 191211_1007, 17-18 77 200401_1033, 7-8

56
challenges experienced in other adaptation streams. The two areas that participants saw a role for
the public sector in providing assistance for digital innovation were to help establish
communication infrastructure on which remote monitoring and operation rely, and to provide
general financial assistance or make reforms to existing financial support programs.
Public assistance in establishing communications networks can be justified under the goal
of improving social welfare and supporting industrial modernization as the networks would
provide service not only to firms with operations in remote areas but also to rural communities.
There is an added consideration in Saskatchewan where the entity responsible for developing such
networks is a crown corporation, SaskTel. As part of the Saskatchewan Capital Plan (Government
of Saskatchewan 2020b), the provincial government’s economic stimulus package, SaskTel was
allocated $325 million for 2020 and 2021. Of this, $12 million is earmarked to develop fibre-optic
networks outside of the nine major centres in the province and $78.9 million is for rural wireless
enhancement. The corporation has stated that it will make total investments of approximately $1.4
billion over the next five years (SaskTel 2020b). There is an opportunity at the moment to leverage
this investment to expand broadband networks into remote areas to support digital innovation. As
one participant suggested, such investments could be made through capital partnerships with firms,
reducing the financial burden on any one party.78 Consideration should also be made for SaskTel’s
role in supporting digital innovation over the long term. At the moment, SaskTel’s focus on digital
transformation is primarily internal (SaskTel 2020a, 36), but one participant suggested that the
organization could play a more active role in supporting digital transformation in the oil and gas
industry, and others, by leading the infrastructure implementation and creating a strategy or
division devoted to promoting remote operation and automation technologies.79 Leveraging public
stimulus spending to expand communications networks and repositioning SaskTel as a leader of
digital transformation in the province could be critical to promoting not only the province’s
economic recovery but its long term growth. The window of opportunity for such initiatives will
only be open for a short time and it is crucial that governments and industry do not let it go to
waste.
In addition to establishing communications infrastructure, there was some interest in
reforming existing financial assistance programs and in establishing new ones. Though
78 191211_0930, 4-5 79 200305_1415, 10

57
participants that reported using public programs to assist their digital innovation efforts were
generally satisfied with the programs,80 one participant argued that the SR&ED tax credit
application needs to be simplified because the complexity of the application requires, in the case
of the participant’s firm, spend over a hundred thousand dollars applying for the credit.81 Beyond
the existing programs that provide financial assistance, one participant suggested that targeted
incentives or grants for adopting specific technologies would be beneficial.82 If the assistance was
structured so as to be provided before a project is undertaken, this would help address the problem
of the large upfront costs required for the new technology.
As with mining, oil and gas firms operate as both assemblers and users of their digital
innovations and are able to operate with relative independence. But the public sector’s
responsibility for communications infrastructure in Saskatchewan makes it a key complementor in
the innovation ecosystem for digital technologies. However, the public sector, in its regulator role,
is currently also perceived as an antagonist to innovation and broader economic prosperity. The
balance between support for and constraint on the industry will need to be balanced with
environmental, social, and economic goals. The best supports may be those that benefit the sector
while also creating opportunities for other types of innovation and supporting transition to less
carbon-intensive technologies.
4.3. Construction
The global construction industry has traditionally been slow to adopt innovations. Some of
the reasons for this are the degree to which the industry relies on informal processes, a high degree
of variability between projects and poor knowledge transfer processes, weak project monitoring,
a sequential production process that has little room for cross-functional cooperation in planning,
the lack of collaboration between suppliers and contractors, a relatively conservative innovation
culture, and little attractiveness for young people with technological skills (World Economic
Forum 2016, 14-15; Oesterreich and Teuteberg 2016, 123). However there is growing adoption of
technologies such as equipment and building automation, remote operation, IoT, big data,
analytics, virtual and augmented reality, drones, 3D printing, and mobile technology to achieve
80 191211_1007, 17-18 81 200401_1033, 8 82 200421_1259, 4
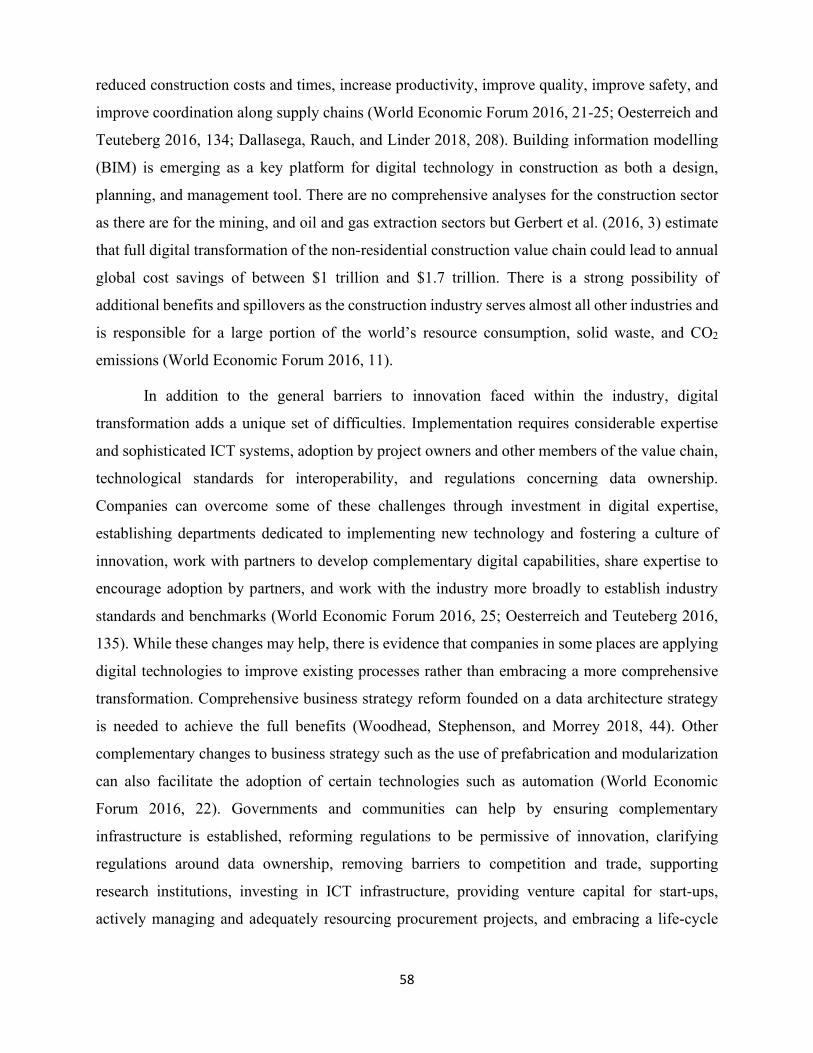
58
reduced construction costs and times, increase productivity, improve quality, improve safety, and
improve coordination along supply chains (World Economic Forum 2016, 21-25; Oesterreich and
Teuteberg 2016, 134; Dallasega, Rauch, and Linder 2018, 208). Building information modelling
(BIM) is emerging as a key platform for digital technology in construction as both a design,
planning, and management tool. There are no comprehensive analyses for the construction sector
as there are for the mining, and oil and gas extraction sectors but Gerbert et al. (2016, 3) estimate
that full digital transformation of the non-residential construction value chain could lead to annual
global cost savings of between $1 trillion and $1.7 trillion. There is a strong possibility of
additional benefits and spillovers as the construction industry serves almost all other industries and
is responsible for a large portion of the world’s resource consumption, solid waste, and CO2
emissions (World Economic Forum 2016, 11).
In addition to the general barriers to innovation faced within the industry, digital
transformation adds a unique set of difficulties. Implementation requires considerable expertise
and sophisticated ICT systems, adoption by project owners and other members of the value chain,
technological standards for interoperability, and regulations concerning data ownership.
Companies can overcome some of these challenges through investment in digital expertise,
establishing departments dedicated to implementing new technology and fostering a culture of
innovation, work with partners to develop complementary digital capabilities, share expertise to
encourage adoption by partners, and work with the industry more broadly to establish industry
standards and benchmarks (World Economic Forum 2016, 25; Oesterreich and Teuteberg 2016,
135). While these changes may help, there is evidence that companies in some places are applying
digital technologies to improve existing processes rather than embracing a more comprehensive
transformation. Comprehensive business strategy reform founded on a data architecture strategy
is needed to achieve the full benefits (Woodhead, Stephenson, and Morrey 2018, 44). Other
complementary changes to business strategy such as the use of prefabrication and modularization
can also facilitate the adoption of certain technologies such as automation (World Economic
Forum 2016, 22). Governments and communities can help by ensuring complementary
infrastructure is established, reforming regulations to be permissive of innovation, clarifying
regulations around data ownership, removing barriers to competition and trade, supporting
research institutions, investing in ICT infrastructure, providing venture capital for start-ups,
actively managing and adequately resourcing procurement projects, and embracing a life-cycle

59
orientation for procurement (World Economic Forum 2016, 44-48; Oesterreich and Teuteberg
2016, 135).
The construction industry accounts for a non-trivial portion of the economy in each
province, but a negligible share of exports. However, the importance is understated as it services
almost all other industries and many of its products are key enablers for the whole economy. Figure
4.6 presents the shares of GDP and exports by jurisdiction for the construction industry at the
national, provincial, and territorial levels for 2019. The industry accounted for 7.2 percent of GDP
and in Canada in 2019, and the share was similar across most jurisdictions. The industry accounted
for 7.0 percent of GDP in Saskatchewan. The industry had negligible export shares in all
jurisdictions. Figure 4.7 presents the industry’s share of total, Indigenous, and female employment
at the national, provincial, and territorial levels using 2016 census data. Construction accounted
for a substantial share of both total and Indigenous employment in almost all jurisdictions, but
only a minor share of female employment. In 2016, it accounted for 7.3 percent of overall
employment, 9.6 percent of Indigenous employment, and 1.9 percent of female employment in
Canada, and 8.4 percent of overall employment, 10.0 percent of Indigenous employment, and 2.2
percent of female employment in Saskatchewan.
0%
10%
20%
30%
40%
50%
60%
Share of GDP Share of Exports
Figure 4.6: Construction Share of GDP and Exports by Jurisdiction
Source: Author’s calculations based on data from Statistics Canada (2019a; 2019b; 2019e)
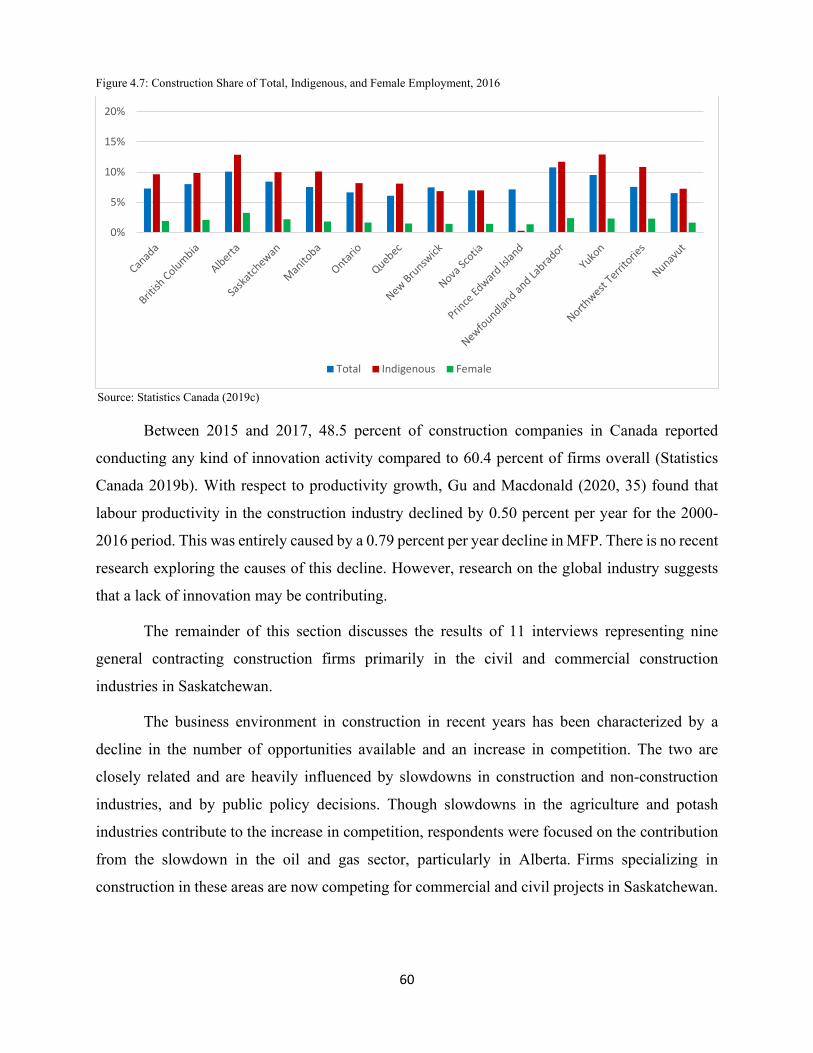
60
Between 2015 and 2017, 48.5 percent of construction companies in Canada reported
conducting any kind of innovation activity compared to 60.4 percent of firms overall (Statistics
Canada 2019b). With respect to productivity growth, Gu and Macdonald (2020, 35) found that
labour productivity in the construction industry declined by 0.50 percent per year for the 2000-
2016 period. This was entirely caused by a 0.79 percent per year decline in MFP. There is no recent
research exploring the causes of this decline. However, research on the global industry suggests
that a lack of innovation may be contributing.
The remainder of this section discusses the results of 11 interviews representing nine
general contracting construction firms primarily in the civil and commercial construction
industries in Saskatchewan.
The business environment in construction in recent years has been characterized by a
decline in the number of opportunities available and an increase in competition. The two are
closely related and are heavily influenced by slowdowns in construction and non-construction
industries, and by public policy decisions. Though slowdowns in the agriculture and potash
industries contribute to the increase in competition, respondents were focused on the contribution
from the slowdown in the oil and gas sector, particularly in Alberta. Firms specializing in
construction in these areas are now competing for commercial and civil projects in Saskatchewan.
0%
5%
10%
15%
20%
Total Indigenous Female
Source: Statistics Canada (2019c)
Figure 4.7: Construction Share of Total, Indigenous, and Female Employment, 2016

61
Public pipeline policies and the carbon tax are believed to have contributed to this problem.83 The
civil and commercial construction industries are also facing increased competition from the
residential construction industry which has been directly affected by the slowdown through
decreased demand in areas with high oil and gas extraction industry presence, and indirectly
affected by the general slowdown in the economy which has reduced consumers’ willingness to
invest in projects. The recent application of provincial sales tax (PST) to construction projects is
believed to have contributed to this as well.84 A reduction in public infrastructure investment in
recent years has increased competition between civil and commercial construction firms as well,
particularly between large and small firms who are now competing for smaller projects.85 The
intensity of competition has set the industry on a “race to the bottom,” 86 as one participant
described it, where competitors frequently bid for jobs at a loss to retain workers and cash flow.87
This has reduced profitability for many firms.88 In addition to their indirect effects through the
market, public policies such as the carbon tax and bonding regulations directly impact firms.89 The
way in which bonding status is currently regulated is particularly concerning as it is central to
many civil construction firms’ business strategies, allowing firms to bid on large civil projects.
Once the status is lost, it is very difficult to get it back because the firm is not able to compete for
the projects it is specialized in. One participant reported that the lack of opportunity and increased
competition in the industry had reduced their financial performance and caused their firm and
several others to lose bonding status in recent years.90
Firms are responding to these challenges in several ways. Two firms reported using
diversification as a strategy. This included diversifying into other regions, other areas of
construction, or, in the case of some large firms, targeting smaller projects. Some firms have gone
so far as to diversify into entirely other areas of business.91 Two firms have not diversify but started
acting more strategically, bidding on jobs they feel they are more competitive in, allocating their
resources to urban areas to take advantage of a greater number of opportunities there, or forming
83 200212_1400, 2; 200221_1324, 2,3 84 200212_1400, 2; 200221_1324, 3, 200323_1259, 2 85 200212_1444, 5; 200220_1059, 2; 200221_1324, 3; 200320_0930, 2 86 200306_1105, 1 87 200212_1444, 5; 200220_1059, 2 88 200128_1600, 1; 200221_1324, 3 89 200128_1600, 1; 200212_1444, 2-3 90 200212_1444, 2-3 91 200212_1400, 2; 200320_0930, 2; 200323_1259, 2

62
partnerships with other companies to ensure a supply of work.92 Two firms reported laying off
personnel in addition to these adaptations.93 These strategies are primarily used by smaller firms.
With respect to digital technologies, no smaller firms reported digital innovation as a strategy, but
three larger firms identified automation, software upgrading, and adoption of new construction
technologies generally as being important to adapting to challenges in the business environment.94
Participants most often reported that their firms were applying digital technologies to
improve information management and communication systems, production processes, and project
administration. Only three firms, all of which were identified as small firms, reported not
implementing any type of digital innovation in recent years. However, even in innovative firms,
much of the innovation is in the early stages and is primarily concerned with digitizing existing
processes rather than transforming the firm around the new capabilities. Project management
software was the most commonly reported innovation. The software is used throughout the
tendering and estimation, and construction phases to reduce paperwork, manage records, and
improve data mobility and collaboration.95 This is the extent of digital innovation in most small
firms though most use some form of digital drawing software and computer assisted estimation,
and some use cloud databases for records management.96 Larger firms are experimenting with
other technology such as BIM, drones, 3D modelling, IoT, equipment automation, remote
monitoring, and predictive maintenance.97 BIM is closely related to project management as it
allows for improved collaboration with project stakeholders and allows a firm to identify potential
conflicts early on in the planning process. Drones are useful tools for surveying, progress reporting,
and capturing data which can be used for modelling and design. IoT sensors enable improved
monitoring for work sites and structures. Equipment automation enables more precise work and
greater ability to monitor and report progress. Remote monitoring of equipment enables predictive
maintenance and improves equipment lifecycles.
New or improved software was overwhelmingly the most common innovation and every
firm reporting some degree of digital innovation reported either purchasing software or, in the case
of some larger firms, developing software internally. Most innovative firms reported conducting
92 200220_1059, 2; 200306_1105, 2 93 200212_1400, 2; 200306_1105, 2 94 200128_1600, 1-2; 200302_1111, 1; 200323_1259, 2-3 95 200121_1103, 3; 200203_1501, 3-4; 200212_1400, 2; 200302_1111, 1 96 200306_1105, 3; 200221_1324, 5; 200220_1059, 2-3 97 200128_1600, 1-2; 200301_1111, 1; 200320_930, 3; 200323_1259, 3-4

63
extensive training and innovation management activities to educate their employees and support
their innovation efforts. No firm reported conducting R&D activities, engineering and design, or
other innovation activities. Suppliers are a key source of ideas in a majority of innovative firms.
Social media and trade show were important channels of communication between suppliers and
firms. Employees, both new and existing, and other construction firms were also identified as a
source of ideas in two cases. Other sources mentioned in at least one case included consultants,
customers, and industry associations. Universities, research and educational institutes, and
government was not mentioned as a source of ideas in any case.
While larger firms are beginning to embrace digital technologies, there are many
challenges that prevent both larger and smaller firms from adopting these technologies. In the pre-
adoption phase, when firms are searching for technological solutions, the large variety of solutions
creates challenges in identifying and selecting the solution best suited to addressing a firm’s
problems. Participants explained that there are hundreds of solutions currently available on the
market, and the available technology continues to evolve at a rapid pace.98 Selecting the most
suitable solution requires a substantial vetting process which poses a significant challenge for firms
of all sizes but more so for smaller firms who often lack the resources or expertise to know which
solutions best meet their needs and understand the implementation requirements such as
integration, training, and activities related to use such as data entry.99 Firms used several vetting
strategies to cope with these challenges including finding out what solutions competitors were
using and then trialling solutions, striking committees involving personnel from several different
parts of the organization to deliberate on solutions then experimenting to find out which worked
best, and, in the case of a larger firm, decentralizing the process to different branches of the firm
and then testing several solutions to decide which are most suitable to be implemented across the
firm.100
Once possible solutions had been identified, firms reported facing significant financial and
time costs in adopting the technologies. This was the most significant barrier to adoption for
smaller firms and was the deciding factor in the three cases of non-adoption. The time costs are
apparent throughout the adoption process such as in the vetting and selection phase, and in the
98 200221_1324, 5; 200302_1111, 1; 200121_1103, 2; 200323_1259, 3 99 200302_1111, 1; 200323_1259, 3; 200121_1103, 2; 200203_1501, 2; 200306_1105, 5 100 200302_1111, 1; 200221_1324, 6; 200323_1259, 5

64
implementation phase when firms have to allocate time and resources to training.101 The latter is
discussed further in the next paragraph. However, participants stressed the significance of the
challenges of high upfront financial costs of acquiring solutions and subsequent yearly
subscription fees.102 One participant suggested there are increasing returns to scale for some
solutions, and that smaller firms might not produce at the point where the benefits created by a
solution outweigh the costs.103 The cost challenges of adopting new technology are compounded
by the increased competition and fewer opportunities, especially for large projects, in the business
environment. One participant suggested that the lack of large projects in Saskatchewan combined
with the financial costs of adoption has prevented the widespread adoption of BIM in the
province.104 The decision to adopt is further complicated by uncertainty over the future of the
industry which makes it difficult to justify large investments, and the industry’s largely
conservative culture which makes it hesitant to adopt new technology.105
Once a firm has decided to adopt a technology, it faces challenges of adoption by its
employees. Training and acquiring the relevant skillsets are key components of implementation in
the construction industry. Some technologies such as BIM or drones require skillsets for which
there are specific education streams from which a firm can hire.106 But most technology requires
employee training for implementation to be successful and determining how to structure that
training can be a challenge.107 Participants from two firms provided detailed accounts of their
processes. In the first case, the firm implemented a new software in stages, first training office
staff who then trained field staff. To balance training with day-to-day responsibilities, training
sessions provided by the software supplier were conducted for one or two hours per week over a
six-month period. Office staff then provided training to field staff on an ad hoc basis, training them
in the aspects of the software that they needed to know. Field staff could also take a certification
program through the supplier to train them in the aspects of the software most relevant for their
job. The certification program was not made mandatory. This strategy allowed the firm to
implement the software without overwhelming employees and overcame the problem of having
101 200121_1103, 2-3; 200203_1501, 2; 200221_1324, 5 102 200121_1103, 2; 200203_1501, 2; 200220_1059, 2-3; 200221_1324, 5 103 200306_1105, 2,5 104 200203_1501, 4 105 200212_1400, 2; 200302_1111, 2; 200203_1501, 3; 200323_1259, 2-3 106 200320_0930, 4 107 200203_1501, 2

65
their field staff being dispersed and unable to attend comprehensive training all at once.108 In the
second case, the firm introduced semi-automated equipment into its operations. The equipment
was initially not used for several years because the employees at the time were busy with other
responsibilities and were overwhelmed when they tried to learn the new equipment. To overcome
this, the firm hired a person specifically tasked to learn to use the equipment, to train operators and
supervisors, and to devise a data management strategy. By doing so, the firm was able to overcome
resistance from the employees who are now highly enthusiastic about using the equipment, though
the whole process took several years to be self-sustaining.109
Resistance from employees who were overwhelmed or too busy to learn to use the new
technology was commonly reported. There tended to be more perceived resistance from older
employees than younger employees, but this was not always the case. Younger employees also
often had difficulty adopting the technology and older employees were sometimes the ones with
the experience to see the benefit of new technology.110 In each case, training was key in
overcoming the issue. Allowing employees to experiment with the new technology was frequently
cited as a key complement to training.111 However, one participant suggested that the variety of
technology can be a source of frustration for employees moving between firms who have to
repeatedly learn to use new technologies that differ slightly from ones used at their previous firms
of employment.112 Throughout the entire adoption process, but especially in cases where training
itself may be a source of resistance, strong support from leadership is key to implementation
success. In some cases, strong leadership may entail communicating with employees that adoption
is a priority and providing adequate resources for training and implementation.113 In two cases in
this study, a change of leadership to personnel who were more enthusiastic or knowledgeable about
new technology was required to ensure proper support.114 Conversely, in one of the cases where a
firm was a non-adopter, the leadership had enjoyed a tenure of several decades and was skeptical
toward new technologies.115
108 200121_1103, 2-3 109 200128_1600, 3-5 110 200302_1111, 1; 200306_1105, 5; 200203_1501, 2; 200128_1600, 5 111 200121_1103, 2; 200221_1324, 5-6; 200128_1600, 5; 200320_0930, 4-5; 200323_1259, 3; 112 200121_1103, 4 113 200320_930, 4-5 114 200302_1111, 1; 200203_1501, 5 115 200306_1105, 4-5

66
Even after adoption and implementation, many technologies such as BIM or some project
management software require adoption by other firms to achieve the network benefits. However,
other firms face the same challenges outlined previously and the need for adoption by partners
introduces new challenges. The uncertainty factor in new technology, the initial decrease in
productivity, and the conservative culture in the industry make some firms hesitant to adopt a
system unless it is already widely adopted in the industry.116 Even if other firms and clients adopt
the system, not all of them may have the same skill level, requiring time to bring partners to a
similar level before achieving the full benefit of the system.117 There are also concerns over
liability and data ownership, or over who is responsible for managing the overall project.118
Overall, firms appeared to be occupied with addressing internal challenges to adoption, but one
firm stated it was trying to overcome the need for adoption by partners by proactively persuading
others to adopt. Progress to date was reportedly slow.119 Another participant speculated that there
was an aggregation occurring among software suppliers and that once a company became
dominant, and a technology became standard, then firms would be more willing to adopt.120
Though no participants reported that their firms had taken advantage of existing innovation
policies, participants from all firms were able to identify a role for the public sector in overcoming
these challenges. One of the most desired roles was for change leadership which had several
different facets for different actors. The most highly desired form of support was for information
on available software to reduce the burden of research on firms. Most participants believed this
role was best suited to industry associations. Financial supports provided by governments for
technology adoption was identified as an important compliment to information supports. Other
possible roles for governments included using public procurement to promote technology
adoption, providing increased financial support to polytechnics for applied research and extension,
introducing a certification system for construction skills, introducing a harmonized tendering
system, increasing transparency in awarding projects, investing in infrastructure projects, and
using best-value approaches.
116 200220_1059, 3; 200323_1259, 2-3 117 200221_1324, 4 118 200302_1111, 1; 200121_1103, 4 119 200302_1111, 1 120 200121_1103, 4

67
Participants suggested that information supports could include information about the
software available on the market and on how to onboard the new software once acquired.121 Most
participants suggested that this role is best suited to industry associations though one participant
cautioned that this may give too much influence to association leaders who may use it to further
their self interest either advertently or inadvertently.122 Bearing this in mind, and other
considerations such as the scale of the task that reviewing available software entails, and that such
a review would be beneficial not only in Saskatchewan but also in other provinces, the Canadian
Construction Association is best positioned to facilitate such a review. The Association already
has a mandate to support innovation within the industry and has a large network through which to
distribute the workload for the initial review. The first step is to work with provincial and local
construction associations to develop a broadly accepted group of evaluation criteria to evaluate the
programs.123 A comprehensive list of existing programs would then need to be developed and
divided among industry association members to undertake the review. In this way, each program
could be reviewed multiple times while reducing the burden on and the influence of any single
firm.
Some firms suggested that governments could offer financial supports such as rebates or
tax incentives to incentivize technology adoption by firms.124 This recommendation has also been
made by the Canadian Construction Association (2020). However, there are several considerations
relevant to the provision of such supports. The first is that it is the upfront cost which most firms
struggle with. Rebates and tax incentives would therefore only serve to benefit firms already in a
position to adopt. A public loans system or investment bank would be a more suitable tool to
overcoming this challenge but at the present time the economic environment and financial state of
the provincial government in Saskatchewan makes these options unadvisable. This would also not
address the problem faced by many small firms where their small scale of operations means many
technologies are more costly than beneficial. A compromise between the two options is to take an
indirect approach and invest more in infrastructure projects to increase the number of opportunities
directly and to stimulate economic activity in the province, courses of action that were in
themselves desired by participants.125 This approach is also more easily justified as it can
121 200121_1103, 5 122 200121_1103, 5; 200212_1400, 5; 200306_1105, 6; 20221_1324, 8 123 200302_1111, 2 124 20221_1324, 8; 200302_1111, 2 125 200203_1501, 6-7; 200212_1444, 5

68
contribute to improving social wellbeing, where industrial upgrading is a secondary outcome. The
$3.1 billion in capital investment announced in the 2020-21 provincial budget (Government of
Saskatchewan 2020a) and projects such as the $4 billion irrigation project at Lake Diefenbaker
(Government of Saskatchewan 2020c) help accomplish this goal. With this in mind, financial
measures incentivizing technology adoption could be used as a signalling tool and to guide
investment. Given the dominance of software in construction innovation, a challenge would be
determining which investments were eligible. The software review could serve as a basis for
determining eligibility.
The large infrastructure investments present a window of opportunity for the provincial
government to make digital transformation a priority in its procurement strategy. SaskBuilds, the
agency responsible for infrastructure procurement in Saskatchewan, considers innovative solutions
as a factor in its best value procurement policy (SaskBuilds 2015), but the policy is focused on
innovations in procurement solutions, not necessarily in underlying technologies. By including
explicit consideration for use of certain technologies, the government can act as a sophisticated
buyer to drive innovation within the industry. As one participant argued, once the public sector
has adopted new design and communication systems such as BIM and a critical mass has been
established, firms can begin to offer those services to other clients.126 The Government of Alberta
implemented such an initiative, the Digital Project Delivery requirements, in 2018 to encourage
the adoption of BIM in the construction industry, the end goal being to improve management of
public infrastructure assets. This could serve as a model for a similar initiative in Saskatchewan.
However, such a program would have to include supports to overcome the challenges associated
with technology adoption, most specifically the financial cost of adoption, training, and integrating
the technology into the firm. Without these supports, imposing technological requirements in
procurement will create a barrier for firms who lack the resources or expertise to adapt.127 Even
so, without other supports to offset the costs related to maintaining the technology such as yearly
fees, such a program could discriminate against smaller firms. A small change that could be made
as a precursor to more radical changes in procurement would be to give more weight to innovation
and technology use as part of best value when awarding projects. This would act as a signal to
firms that digital innovation is a priority.
126 200323_1259, 6 127 200128_1600, 5-6; 200221_1324, 8

69
A related need for policy change in the way the provincial government and crown
corporations do procurement was identified in one case.128 The participant expressed frustration
with the variety of bidding platforms through which government organizations tendered projects.
The variety imposes additional costs on potential bidders who have to either pay a subscription fee
to multiple bidding platforms or be forced to pay for each bid if they are not subscribed to the
platform. Harmonizing platforms between government organizations and Crown corporations will
help to reduce these costs. The participant also expressed frustration with the lack of transparency
in how Crown corporations award projects. Without feedback on why a bid was rejected or another
bid was accepted, firms cannot adjust their strategies to improve. Increasing transparency can help
firms improve and further boost the signal from policy change putting more emphasis on
innovation in the best-value awards system. Though these policy changes are more related to
innovation in the public sector, they would also improve feedback processes and help firms
identify directions for improvement.
There were two suggestions for changes with respect to education and educational
institutions. One participant argued that the lack of professional designations within the industry
limited opportunities for advancement and effectively signalled that education and skills were not
a priority within the industry.129 Introducing regulation to professionalize more occupations in the
industry would allow for greater recognition of skills and greater signalling of qualifications for
employees who are switching jobs, facilitate continuous learning, and provide a basis for
identifying, integrating, and training the skills required by new technologies. Polytechnics will be
key to implementing such a change. One participant also suggested that polytechnics have a role
to play in promoting technology adoption in the industry by performing applied research and
delivering extension programs. 130 The recently established Digital Integration Centre of
Excellence at Saskatchewan Polytechnic is ideally suited to this role.
The benefits of using a perspective informed by innovation ecosystems is more apparent
for the construction industry than for mining or oil and gas extraction. Construction firms are
often users of new technologies and do not play a significant role in technology development.
However, unlike mining and oil and gas extraction firms which tend to be large and endowed
with considerable resources, construction firms are often small and constrained in their ability to
128 200220_1059, 3-4 129 200128_1600, 5 130 200221_1324, 8

70
innovate. The greatest barrier is the large number of technologies available. This creates
challenges as firms lack the capacity to sort through all the options and must often invest in
learning to use multiple technologies. It also prevents the firms from achieving optimal network
benefits from widespread adoption. Institutions such as industry associations can support this
innovation ecosystem by taking on a change leadership role. This mostly involves performing
research on the technologies available and providing informational resources to help firms
evaluate which solutions best suit their needs. The public sector can support the ecosystem by
investing more in large infrastructure projects, increasing cash flow in the industry and
increasing firms’ ability to invest in new technology. Procurement projects can also be structured
to nudge firms toward new technologies. Other complementary initiatives such as harmonizing
procurement platforms, providing feedback on why bids were selected or rejected, and
introducing regulation to improve professionalization within the industry can further improve the
ecosystem by reducing the burden on firms, improving learning opportunities, and creating
incentives to learn new skills.
71
5. Conclusions and Limitations
If conventional indicators are to be believed, decades of public policy intervention have
appeared to produce little success in improving Canada’s innovation performance. This study has
argued that this may be because current models of innovation on which policy is based miss
important factors in the innovation process and that a new model is needed. Taking inspiration
from the innovation ecosystems model, it argues that more attention needs to be given to firms and
the problems they experience, rather than systemic factors, and to the demand-side of the
innovation process. Though the innovation problem narrative primarily exists at the national level,
this study focused on firms in the mining, oil and gas extraction, and construction industries in the
province of Saskatchewan. These industries were chosen because of their poor performance on
conventional innovation indicators. The sub-national focus was chosen primarily for feasibility
but is not believed to detract from the main argument as the province is also generally considered
to have poor innovation performance, and provincial innovation policies have a strong supply-side
focus. The study focused on digital innovation and digital transformation within firms. Digital
transformation is believed to already be a disruptive phenomenon and will continue to be more so
in the future. However, if managed properly it may also be a key tool in addressing other disruptive
trends such as the shift in global economic activity to East Asia, ageing populations, and
sustainability. Data was collected through interviews with senior managers with knowledge of
their firm’s digital innovation and digital transformation initiatives.
Despite operating in different industries, mining, oil and gas extraction, and construction
firms in Saskatchewan face several similar challenges in the business environment and for both
discrete cases of digital innovation and broader digital transformation. All three industries are
experiencing significant financial pressures from low commodity prices or a lack of projects and
public policy has played a role in either creating or aggravating this situation. While this has
created a strong incentive to innovate, it has undermined firms’ ability to do so. Firms are adopting
cost-reduction strategies such as reducing production, laying off employees, and various
innovation strategies to cope with this challenge. The priority given to digital innovation and
digital transformation varies across firms and across industries with larger firms. Firms in the
mining and oil and gas extraction industries generally had greater capacity for innovation and
placed higher priority on it than firms in the construction industry. However, the relatively limited
engagement in the construction sector may be a result of the prevalence of smaller firms in the
72
industry, and this study produced evidence that there is an imbalance between the number of
options for innovation and the capacity to evaluate those options. Statistical analysis would be
required to determine if the size effect or the industry effect is more influential.
There is a high degree of similarity in the digital technologies being adopted across
industries. IoT, machine learning, cloud computing, analytics, mobile technology, and varying
degrees of remote operation and automation were reported in all three industries, though they
appear to be more prevalent in larger firms and in mining and oil and gas extraction. In
construction, innovation is overwhelmingly focused on software for project planning and
management. There was no dominant strategy for implementing the new technology and firms
varied greatly in the degree to which their strategies could be classified as top-down or bottom-up
and centralized or decentralized. However, one common theme that emerged was the need to have
enthusiastic personnel in positions of authority and responsibility to ensure implementation
success. The need to replace personnel in these positions, often with new employees hired from
outside the company, to ensure the right person or people were in place was repeatedly raised by
participants. The importance of these implementation and change management strategies in the
success or failure of digital transformation makes this an important area for future research.
There were several common digital innovation challenges that appeared across all three
industries. The most significant was the matter of the cost of implementation. These include costs
of identifying and researching technologies, developing or acquiring them, training employees,
and, in some cases, follow-up costs such as yearly fees for software. Participants in each industry
suggested that many technologies have scale effects and that for many smaller firms, the benefits
of the new technology do not outweigh the upfront costs required to implement them. The scale
effect does not necessarily vary with firm size but by the size of the projects a firm undertakes or
by the size of its facilities. Another common challenge was overcoming resistance from
employees. Surprisingly, the most significant source of resistance was not concerns over job loss
caused by technological upgrading, but was discomfort with learning a new technology. Firms
most often managed this issue by providing training, often for several months, and allowing
employees to experiment with the new technology, with management providing encouragement,
signalling the importance of adoption, and taking employees concerns seriously. The findings on
employee motivations and attitudes should be taken with a grain of skepticism as the data used for

73
this study primarily came from senior management who may have very different perceptions of
employee attitudes than the employees themselves.
In addition to these common challenges, participants identified several industry-specific
challenges. The need for rural communications networks was a significant challenge for oil and
gas extraction firms, and both mining and oil and gas extraction firms experienced significant
technical challenges in their development and implementation processes. Construction firms,
particularly smaller ones, commonly reported a lack of research capacity and struggled to evaluate
software that would be suitable for their firms. The networked nature of much of the software
made adoption by partners a significant challenge in the construction industry.
Taking a firm-based perspective inspired by innovation ecosystems and developing
policies from the bottom up identified several policy directions that may not have been identified
using traditional frameworks. Some solutions, such as the desire for financial assistance for
research or technology adoption, or stronger supports for training and reskilling were shared across
industries and are typical innovation supports. Others were unique to the circumstances faced in
the industry. One suggestion from a mining industry participant was to establish a research hub to
help overcome some of the technical challenges experienced by firms in the province. Participants
in the oil and gas industry expressed a desire for greater public support in establishing
communication networks to enable remote monitoring and operation. These suggestions too are
not novel. Part of this is because mining and oil and gas extraction firms tend to have considerable
resources and operate on both the supply and demand side of the innovation process. As both the
developers and users of their innovations, they can address many of the demand-side issues from
the supply side and avoid difficulties later in the process. However, the perspective has great value
in industries dominated by small firms, such as construction. Participants in the construction
industry suggested the public sector could provide information support by identifying and
evaluating software on the market to make up for firms’ low research capacity and help them make
decisions about the best technology to adopt. In addition to policy supports for digital innovation,
participants offered suggestions for policy changes that would improve the conditions for
innovation generally. For example, investing in infrastructure projects or pipelines would help
improve the overall financial health of the industry and increase firms’ ability to invest in
innovation.

74
These suggestions provide a foundation by which the public sector can begin to support
digital innovation and digital transformation in these industries. Each of them will require more
thorough consultation and analysis to determine desirability and viability but there is one
considerable barrier that merits discussion here. The current financial strain that the public sector
is experiencing as a result of COVID-19 and the downturn in the economy would normally make
any new policy initiatives undesirable as governments go on the defensive to reduce economic
losses. But not necessarily in this case. Presently, the Government of Saskatchewan budgeted $3.1
billion for capital investment in 2020-21 to stimulate economic recovery in the province. There
exists a window of opportunity where the government can leverage the stimulus spending to shift
the provincial economy in a direction that makes digital transformation a pillar of economic
recovery and growth. Many of the policy directions identified in this study are aligned with
stimulus spending and achieving them is a matter of directing the spending to align with them.
Other initiatives require a longer time frame to implement and require that institutions such as the
Digital Integration Centre of Excellence and industry associations become more involved. Taking
advantage of this opportunity can help set Saskatchewan on a path of digital transformation and
make the province a model to emulate.
The discussion around public policy support for digital innovation and digital
transformation is still largely premature at both the provincial and federal levels. Publications from
the Government of Saskatchewan and industry associations give little indication that digital
transformation is a priority. There is somewhat more emphasis from the Federal Government and
high level plans such as the Innovation and Skills Plan (Innovation, Science, and Economic
Development Canada 2019, iv-v) and the Economic Strategy Tables (Innovation, Science, and
Economic Development Canada 2018, 12-20) have begun to indicate awareness of the need for
digital skills and supporting infrastructure, but there is nothing in the way of detailed industry
plans and most of the support is oriented toward research. However, firms, at least in the industries
of study, are for the most part very interested in digital innovation, though digital transformation
is still in early stages. The findings presented here provide a starting point for possible government
interventions than can support digital innovation and spur digital transformation at a time when
stimulus spending has created a window of opportunity where they may be most smoothly
implemented.

75
Though this study provides several insights on how to support digital transformation, it has
several limitations. First, the study only focuses on three industries in one province. The same
industries in other jurisdictions may experience different challenges than the ones found here and
may require different types of public policy intervention. Other industries will almost certainly
have entirely different needs and more work will be needed to identify those needs and determine
appropriate policy interventions. Second, as a result of the COVID-19 pandemic, this study failed
to achieve saturation in the industries of study. Despite achieving a degree of convergence in all
three industries, the results reported cannot be taken as comprehensive even within the industries
of study. Third, the self-selection procedure used in this study likely skewed the sample toward
firms that are engaging in digital innovation. This study is therefore only able to provide limited
insight on why firms may not be engaging in digital innovation and what barriers may be
preventing them from doing so. Fourth, as mentioned previously, the individuals participating in
this study were primarily managers in vide-president or director positions. Their views on such
things such as levels and reasons for employee resistance may therefore not be accurate.
76
Bibliography Adner, Ron. 2006. “Match Your Innovation Strategy to Your Innovation Ecosystem.” Harvard
Business Review 84 (4): 98–107.
Atkinson-Grosjean, Janet. 2006. Public Science, Private Interests: Culture and Commerce in
Canada’s Networks of Centres of Excellence. Toronto: University of Toronto Press.
Autio, Erkko, and Llewellyn D W Thomas. 2014. “Innovation Ecosystems: Implications for
Innovation Management.” In The Oxford Handbook of Innovation Management, by Mark
Dodgson, David M. Gann, and Nelson Phillips, 204–28. Oxford University Press.
Baldwin, John R., and Wulong Gu. 2007. “Long-Term Productivity Growth in Canada and the
United States.” Canadian Productivity Review, no. 13.
https://doi.org/10.2139/ssrn.1507872.
Bassis, Nihad Faissal, and Fabiano Armellini. 2018. “Systems of Innovation and Innovation
Ecosystems: A Literature Review in Search of Complementarities.” Journal of
Evolutionary Economics 28 (5): 1053–80. https://doi.org/10.1007/s00191-018-0600-6.
Beaudry, Catherine, and Laurence Solar-Pelletier. 2020. “The Superclusters Initiative: An
Opportunity to Reinforce Innovation Ecosystems.” IRPP Study October (79): 34.
Bhidé, Amar. 2006. “Venturesome Consumption, Innovation, and Globalization.” In
Perspectives on the Performance of the Continental Economies, 169–222. The MIT
Press. https://doi.org/10.7551/mitpress/9780262015318.003.0007.
Bradley, Celeste, and Andrew Sharpe. 2009a. “A Detailed Analysis of the Productivity
Performance of Mining in Canada.” Ottawa: Centre for the Study of Living Standards.
http://www.csls.ca/reports/csls2009-7.pdf.
———. 2009b. “A Detailed Analysis of the Productivity Performance of Oil and Gas Extraction
in Canada.” Ottawa: Centre for the Study of Living Standards.
http://www.csls.ca/reports/csls2009-8.pdf.
Bresnahan, Timothy F., and M. Trajtenberg. 1995. “General Purpose Technologies ‘Engines of
Growth’?” Journal of Econometrics 65: 83–108.
Brynjolfsson, Erik, and Lorin M. Hitt. 2000. “Beyond Computation: Information Technology,
Organizational Transformation and Business Performance.” The Journal of Economic
Perspectives 14 (4): 23–48.

77
Calver, Matthew, and Alexander Murray. 2016. “Decomposing Multifactor Productivity Growth
in Canada by Industry and Province, 1997-2014.” Ottawa: Centre for the Study of Living
Standards. http://www.csls.ca/reports/csls2016-19.pdf.
Canadian Chamber of Commerce. 2013. “Mining Capital: How Canada Has Transformed Its
Resource Endowment Into a Global Competitive Advantage.” https://mining.ca/wp-
content/uploads/2019/03/ChamberofCommerceMiningCapital.pdf.
Canadian Construction Association. 2020. “Supporting Innovation.” #Construction4CDNs. 2020.
https://www.construction4cdns.ca/innovation.
Cardona, M., T. Kretschmer, and T. Strobel. 2013. “ICT and Productivity: Conclusions from the
Empirical Literature.” Information Economics and Policy 25 (3): 109–25.
https://doi.org/10.1016/j.infoecopol.2012.12.002.
Cette, Gilbert, Christian Clerc, and Lea Bresson. 2015. “Contribution of ICT Diffusion to Labour
Productivity Growth: The United States, Canada, the Eurozone, and the United Kingdom,
1970-2013.” International Productivity Monitor, no. 28: 81–88.
Cohen, Wesley M., and Daniel A. Levinthal. 1989. “Innovation and Learning: The Two Faces of
R&D.” The Economic Journal 99 (397): 569–96.
———. 1990. “Absorptive Capacity: A New Perspective on Learning and Innovation.”
Administrative Science Quarterly 35 (1): 128–52. https://doi.org/10.2307/2393553.
Conference Board of Canada. 2020. “Innovation Provincial Rankings - How Canada Performs.”
2020.
https://www.conferenceboard.ca/hcp/provincial/innovation.aspx?AspxAutoDetectCookie
Support=1.
Council of Canadian Academies. 2009. “Innovation and Business Strategy: Why Canada Falls
Short.” Ottawa: Council of Canadian Academies.
———. 2013a. “Innovation Impacts: Measurement and Assessment.” Ottawa: Council of
Canadian Academies.
———. 2013b. “Paradox Lost: Explaining Canada’s Research Strength and Innovation
Weakness.” Ottawa: Council of Canadian Academies.
———. 2013c. “The State of Industrial R&D in Canada.” Ottawa: Expert Panel on the State of
Industrial R&D in Canada Staff.
78
———. 2018. “Competing in a Global Innovation Economy: The Current State of R&D in
Canada.” Ottawa: Expert Panel on the State of Science and Technology and Industrial
Research and Development in Canada.
CSLS. 2005. “What Explains the Canada-US ICT Investment Intensity Gap?” Centre for the
Study of Living Standards. http://www.csls.ca/reports/csls2005-06.pdf.
Dallasega, Patrick, Erwin Rauch, and Christian Linder. 2018. “Industry 4.0 as an Enabler of
Proximity for Construction Supply Chains_ A Systematic Literature Review.” Computers
in Industry 99: 205–25. https://doi.org/10.1016/j.compind.2018.03.039.
Dedehayir, Ozgur, Saku J. Mäkinen, and J. Roland Ortt. 2018. “Roles during Innovation
Ecosystem Genesis: A Literature Review.” Technological Forecasting and Social
Change 136 (November): 18–29. https://doi.org/10.1016/j.techfore.2016.11.028.
Doern, G. Bruce, David Castle, and Peter W.B. Phillips. 2016. Canadian Science, Technology,
and Innovation Policy: The Innovation Economy and Society Nexus. Montreal and
Kingston: McGill-Queen’s University Press.
Eaton, Jonathan, and Samuel Kortum. 1995. “Engines of Growth: Domestic and Foreign Sources
of Innovation.” National Bureau on Economic Research Working Paper Series, no. 5207.
https://www.nber.org/papers/w5207.pdf.
Edler, Jakob. 2009. “Demand Policies for Innovation in EU CEE Countries.” Manchester
Business School Working Papers, no. 579: 40.
———. 2019. “A Costly Gap: The Neglect of the Demand Side in Canadian Innovation Policy.”
IRPP Insight, no. 28.
Evans, Pete. 2020. “Oil Price Goes into Negative Territory as Traders Get Squeezed Running for
the Exits.” CBC. 2020. https://www.cbc.ca/news/business/oil-price-monday-1.5538048.
Fusch, Patricia I., and Lawrence R. Ness. 2015. “Are We There Yet? Data Saturation in
Qualitative Research.” The Qualitative Report; Fort Lauderdale 20 (9): 1408–16.
Gawer, Annabelle, and Michael A. Cusumano. 2002. Platform Leadership: How Intel, Microsoft,
and Cisco Drive Industry Innovation. Boston: Harvard Business School Press.
———. 2014. “Industry Platforms and Ecosystem Innovation.” Journal of Product Innovation
Management 31 (3): 417–33. https://doi.org/10.1111/jpim.12105.
Gerbert, Philipp, Santiago Castagnino, Christoph Rothballer, Andreas Renz, and Rainer Filitz.
2016. “Digital in Engineering and Construction: The Transformative Power of Building
Information Modeling.” Boston Consulting Group.

79
http://futureofconstruction.org/content/uploads/2016/09/BCG-Digital-in-Engineering-
and-Construction-Mar-2016.pdf.
Godin, Benoît. 2006. “The Linear Model of Innovation: The Historical Construction of an
Analytical Framework.” Science, Technology, & Human Values 31 (6): 639–67.
Gomes, Leonardo Augusto de Vasconcelos, Ana Lucia Figueiredo Facin, Mario Sergio Salerno,
and Rodrigo Kazuo Ikenami. 2018. “Unpacking the Innovation Ecosystem Construct:
Evolution, Gaps and Trends.” Technological Forecasting and Social Change 136
(November): 30–48. https://doi.org/10.1016/j.techfore.2016.11.009.
Government of Alberta. 2020. “Economic Dashboard - Oil Prices.” 2020.
https://economicdashboard.alberta.ca/OilPrice.
Government of Canada. 2017. “Budget 2017: Building a Strong Middle Class.” Government of
Canada. https://www.budget.gc.ca/2017/docs/plan/budget-2017-en.pdf.
Government of Saskatchewan. 2020a. “2020-21 Budget Builds A Strong Saskatchewan With
$3.1 Billion Of Capital Investment.” Government of Saskatchewan. 2020.
https://www.saskatchewan.ca/government/news-and-media/2020/june/15/budget-finance-
capital.
———. 2020b. “2020-21 Saskatchewan Capital Plan: Building A Strong Saskatchewan.”
———. 2020c. “Saskatchewan Announces $4 Billion Irrigation Project At Lake Diefenbaker.”
Government of Saskatchewan. 2020. https://www.saskatchewan.ca/government/news-
and-media/2020/july/02/irrigation-project.
Granstrand, Ove, and Marcus Holgersson. 2020. “Innovation Ecosystems: A Conceptual Review
and a New Definition.” Technovation 90–91: 1–12.
https://doi.org/10.1016/j.technovation.2019.102098.
Gu, Wulong, and Ryan Macdonald. 2020. “Business Sector Intangible Capital and Sources of
Labour Productivity Growth in Canada.” http://epe.lac-
bac.gc.ca/100/201/301/weekly_acquisitions_list-ef/2020/20-
07/publications.gc.ca/collections/collection_2020/statcan/11f0019m/11f0019m2020005-
eng.pdf.
Guest, Greg, Arwen Bunce, and Laura Johnson. 2006. “How Many Interviews Are Enough?: An
Experiment with Data Saturation and Variability.” Field Methods 18 (1): 59–82.
https://doi.org/10.1177/1525822X05279903.

80
Hall, Bronwyn H., Jacques Mairesse, and Pierre Mohnen. 2009. “Measuring the Returns to
R&D.” NBER Working Paper Series Working Paper 15622.
https://www.nber.org/papers/w15622.pdf.
Harrison, Peter. 2007. “Can Measurement Error Explain the Weakness of Productivity Growth in
the Canadian Construction Industry?” Ottawa: Centre for the Study of Living Standards.
Helpman, Elhanan. 1998. “Introduction.” In General Purpose Technologies and Economic
Growth, 1–14. Cambridge: The MIT Press.
Holbrook, Adam J., and David A. Wolfe. 2002. “Introduction: Knowledge, Clusters and
Regional Innovation: Economic Development in Canada.” In Knowledge, Clusters and
Regional Innovation: Economic Development in Canada, 1–8. Montreal: McGill-Queen’s
University Press.
Iansiti, Marco, and Roy Levien. 2004. “Strategy as Ecology.” Harvard Business Review 82 (3):
68–78.
Innovation Canada. 2020. “Support for Your Business.” 2020. http://innovation.canada.ca.
Innovation, Science, and Economic Development Canada. 2018. “Canada’s Economic Strategy
Tables: Resources of the Future.”
https://www.ic.gc.ca/eic/site/098.nsf/vwapj/ISEDC_ResourcesFuture.pdf/$file/ISEDC_R
esourcesFuture.pdf.
———. 2019. “Building a Nation of Innovators.”
https://www.ic.gc.ca/eic/site/062.nsf/vwapj/ISEDC_19-044_INNOVATION-
SKILLS_E_web.pdf/$file/ISEDC_19-044_INNOVATION-SKILLS_E_web.pdf.
Iorworth, Aled ab. 2005. “Canada’s Low Business R&D Intensity: The Role of Industry
Composition.” Finance Canada.
Iyer, Bala, Chi-Hyon Lee, and N. Venkatraman. 2006. “Managing in a ‘Small World
Ecosystem’: Lessons from the Software Sector.” California Management Review 48 (3):
28–47. https://doi.org/10.2307/41166348.
Lu, Hongfang, Lijun Guo, Mohammadamin Azimi, and Kun Huang. 2019. “Oil and Gas 4.0 Era:
A Systematic Review and Outlook.” Computers in Industry 111: 68–90.
https://doi.org/10.1016/j.compind.2019.06.007.
Martel, Laurent. 2019. “The Labour Force in Canada and Its Regions: Projections to 2036.”
Insights on Canadian Society, no. 1.

81
Mason, Mark. 2010. “Sample Size and Saturation in PhD Studies Using Qualitative Interviews.”
Forum Qualitative Sozialforschung / Forum: Qualitative Social Research 11 (3).
https://doi.org/10.17169/fqs-11.3.1428.
Merriam, Sharan B. 2002. “Basic Interpretive Qualitative Research.” In Qualitative Research
and Practice, 37–39. San Francisco: Jossey-Bass.
Merriam, Sharan B., and Elizabeth J. Tisdell. 2016. Qualitative Research: A Guide to Design
and Implementation. 4th ed. San Francisco: Jossey-Bass.
Mining Industry Human Resources Council. 2020. “The Changing Nature of Work: Innovation,
Automation and Canada’s Mining Workforce.” https://mihr.ca/wp-
content/uploads/2020/05/MIHR_Innovation_Report_EN_WEB.pdf.
Mollins, Jeff, and Pierre St-Amant. 2018. “The Productivity Slowdown in Canada: An ICT
Phenomenon?” International Productivity Monitor, no. 35: 18.
Moore, James F. 1993. “Predator and Prey: A New Ecology of Competition.” Harvard Business
Review May-June: 75–86.
Mowery, David. 1979. “The Influence of Market Demand upon Innovation: A Critical Review of
Some Recent Empirical Studies.” Research Policy 8: 102–53.
Nemet, Gregory F. 2009. “Demand-Pull, Technology-Push, and Government-Led Incentives for
Non-Incremental Technical Change.” Research Policy 38 (5): 700–709.
https://doi.org/10.1016/j.respol.2009.01.004.
Nicholson, Peter. 2016. “Canada’s Low-Innovation Equilibrium: Why It Has Been Sustained and
How It Will Be Disrupted.” Canadian Public Policy 42 (1): S39–45.
https://doi.org/10.3138/cpp.2015-019.
———. 2018. “Facing the Facts: Reconsidering Business Innovation Policy in Canada.” IRPP
Insight, no. 22: 36.
Niosi, Jorge, Thoms Gabriel Bas, and Majlinda Zhegu. 2005. Canada’s Regional Innovation
Systems. Montreal and Kingston: McGill-Queen’s University Press.
Niosi, Jorge, André Manseau, and Benoît Godin. 2000. Canada’s National System of Innovation.
Montreal and Kingston: McGill-Queen’s University Press.
OECD. 2011. Demand-Side Innovation Policies. OECD.
https://doi.org/10.1787/9789264098886-en.

82
———. 2014. “Intelligent Demand: Policy Rationale, Design and Potential Benefits.” OECD
Science, Technology and Industry Policy Papers 13. Vol. 13. OECD Science, Technology
and Industry Policy Papers. OECD. https://doi.org/10.1787/5jz8p4rk3944-en.
———. 2015. Frascati Manual 2015. Guidlines for Collecting and Reporting Data on Research
and Experimental Evelopment. https://doi.org/10.1787/9789264239012-en.
———. 2018. Oslo Manual 2018 - Guidelines For Collecting, Reporting And Using Data On
Innovation 4th Edition. 4th ed.
Oesterreich, Thuy Duong, and Frank Teuteberg. 2016. “Understanding the Implications of
Digitisation and Automation in the Context of Industry 4.0: A Triangulation Approach
and Elements of a Research Agenda for the Construction Industry.” Computers in
Industry 83 (December): 121–39. https://doi.org/10.1016/j.compind.2016.09.006.
Oh, Deog-Seong, Fred Phillips, Sehee Park, and Eunghyun Lee. 2016. “Innovation Ecosystems:
A Critical Examination.” Technovation 54 (August): 1–6.
https://doi.org/10.1016/j.technovation.2016.02.004.
Oil Sands Magazine. 2018. “Differentials Explained: Why Alberta Crude Sells at a Deep
Discount.” Oil Sands Magazine. 2018. https://www.oilsandsmagazine.com/market-
insights/crude-oil-pricing-differentials-why-alberta-crude-sells-at-deep-discount-to-wti.
O’Reilly, Michelle, and Nicola Parker. 2013. “‘Unsatisfactory Saturation’: A Critical
Exploration of the Notion of Saturated Sample Sizes in Qualitative Research.”
Qualitative Research 13 (2): 190–97. https://doi.org/10.1177/1468794112446106.
Phillips, Peter, and Anne Ballantyne. Submitted. “Saskatchewan: Where Innovation Is a Contact
Sport.” In Science, Technology & Innovation Policy in the Canadian Provinces and
Territories. Under review at University of Toronto Press.
Phillips, Peter, and David Castle, eds. Submitted. Science, Technology & Innovation Policy in
the Canadian Provinces and Territories. Under review at University of Toronto Press.
Policy Horizons Canada. 2019. “The Future of Work Five Game Changers.” Policy Horizons
Canada. https://horizons.gc.ca/wp-content/uploads/2019/06/Report-
TheFutureofWorkFiveGameChangers-20190618-EN-for-merge.pdf.
Regina Construction Association. 2020. “Member Directory.” 2020.
https://www.rcaonline.ca/members/member-directory/.

83
Saskatchewan Ministry of Energy and Resources. 2018. “Saskatchewan Exploration and
Development Highlights 2018.” Regina: Government of Saskatchewan.
https://publications.saskatchewan.ca/#/products/10603.
———. 2020. “Oil Allowable Rate of Production (ARP) Report - Overproduction
Management.” 2020. https://publications.saskatchewan.ca/#/categories/1073.
SaskBuilds. 2015. “Best Value Procurement Policy.” SaskBuilds.
http://www.saskbuilds.ca/PrioritySK/Files/Policy%20Documents/Best%20Value%20Pro
curement%20Policy%202020420.pdf.
SaskTel. 2020a. “Finding True North: 2019/20 Annual Report.” SaskTel.
https://www.sasktel.com/wps/wcm/connect/85ea499c-78c2-4b51-8e32-
eafdc6dbafb4/SaskTel_AnnualReport_2019_20_Final.pdf?MOD=AJPERES&CVID=nc
WiuDs.
———. 2020b. “SaskTel Investing $324 Million in Saskatchewan in 2020-2021.” 2020 News
Releases. 2020. https://www.sasktel.com/about-us/news/2020/sasktel-investing-324-
million-in-sk-2020-2021.
Schwab, Klaus. 2017. “The Global Competitiveness Report 2017-2018.” World Economic
Forum. http://www3.weforum.org/docs/GCR2017-
2018/05FullReport/TheGlobalCompetitivenessReport2017%E2%80%932018.pdf.
———. 2019. “The Global Competitiveness Report 2019.” World Economic Forum.
http://www3.weforum.org/docs/WEF_TheGlobalCompetitivenessReport2019.pdf.
Seskus, Tony. 2020. “Crude Price Plummet Raises Spectre of Spending Cuts, Job Losses in
Canadian Oilpatch.” CBC. 2020. https://www.cbc.ca/news/business/canadian-oilpatch-
price-plunge-1.5491173.
Sganzerla, Clau, Constantino Seixas, and Alexander Conti. 2016. “Disruptive Innovation in
Digital Mining.” Procedia Engineering 138: 64–71.
https://doi.org/10.1016/j.proeng.2016.02.057.
Sharpe, Andrew. 2010. “Can Sectoral Reallocations of Labour Explain Canada’s Absymal
Productivity Performance?” International Productivity Monitor, no. 19: 40–49.
Sharpe, Andrew, and Vikram Rai. 2013. “Can the Canada-U.S. ICT Investment Gap Be a
Measurement Issue?” Ottawa: Centre for the Study of Living Standards.
Sharpe, Andrew, and John Tsang. 2018. “The Stylized Facts about Slower Productivity Growth
in Canada.” International Productivity Monitor, no. 35: 21.
84
Sinclair, Amanda. 2019. “Measuring Digital Economic Activities in Canada: Initial Estimates.”
Latest Devlopments in the Canadian Economic Accounts, no. 13.
Statistics Canada. 2019a. “Gross Domestic Product (GDP) at Basic Prices, by Industry,
Provinces and Territories.” 2019.
https://www150.statcan.gc.ca/t1/tbl1/en/cv.action?pid=3610040201.
———. 2019b. “Innovation Activities Conducted, by Industry and Enterprise Size.” 2019.
https://www150.statcan.gc.ca/t1/tbl1/en/tv.action?pid=3310018401.
Thomas, Jasmin. 2016a. “Explaining Industry Differences in IT Investment per Worker Between
Canada and the United States, 2002-2013.” Ottawa: Centre for the Study of Living
Standards.
———. 2016b. “New Evidence on the Canada-U.S. ICT Investment Gap, 1976-2014.” Ottawa:
Centre for the Study of Living Standards.
Thomas, Llewellyn D W, and Erkko Autio. 2015. “The Processes of Ecosystem Emergence.”
Academy of Management Proceedings 2015 (1): 10453.
https://doi.org/10.5465/ambpp.2015.10453abstract.
Thomson, Raymond. 2016. “Twenty-First Century Digital Transformation of Work and Jobs in
Northern Saskatchewan.”
Vial, Gregory. 2019. “Understanding Digital Transformation: A Review and a Research
Agenda.” The Journal of Strategic Information Systems, SI: Review issue, 28 (2): 118–
44. https://doi.org/10.1016/j.jsis.2019.01.003.
Walker, Janiece L. 2012. “The Use of Saturation in Qualitative Research.” Canadian Journal of
Cardiovascular Nursing 22 (2): 37–41.
Wolfe, David A., and Meric S. Gertler. 2003. “Clusters Old and New: Lessons from the ISRN
Study of Cluster Development.” In Clusters Old and New: The Transition to a
Knowledge Economy in Canada’s Regions, 1–36. Montreal and Kingston: McGill-
Queen’s University Press.
Woodhead, Roy, Paul Stephenson, and Denise Morrey. 2018. “Digital Construction: From Point
Solutions to IoT Ecosystem.” Automation in Construction 93: 35–46.
World Economic Forum. 2016. “Shaping the Future of Construction Full Report.” World
Economic Forum.
http://www3.weforum.org/docs/WEF_Shaping_the_Future_of_Construction_full_report_
_.pdf.
85
———. 2017a. “Digital Transformation Initiative: Mining and Metals.” World Economic
Forum. http://reports.weforum.org/digital-transformation/wp-
content/blogs.dir/94/mp/files/pages/files/wef-dti-mining-and-metals-white-paper.pdf.
———. 2017b. “Digital Transformation Initiative: Oil and Gas Industry.” World Economic
Forum. http://reports.weforum.org/digital-transformation/wp-
content/blogs.dir/94/mp/files/pages/files/dti-oil-and-gas-industry-white-paper.pdf.
———. 2018. “Digital Transformation Initiative: Unlocking $100 Trillion for Business and
Society from Digital Transformation.” World Economic Forum.
http://reports.weforum.org/digital-transformation/wp-
content/blogs.dir/94/mp/files/pages/files/dti-executive-summary-20180510.pdf.
Young, Aaron, and Pratt Rogers. 2019. “A Review of Digital Transformation in Mining.”
Mining, Metallurgy & Exploration 36 (4): 683–99. https://doi.org/10.1007/s42461-019-
00103-w.

86
Appendix: Additional Findings
In addition to the findings related to digital innovation and public policy, participants also
discussed other issues that, while not related to digital innovation, are strongly related to public
policy. There were also two participants whose firms did not meet the exact industry criteria for
inclusion despite being invited to participate through the participant search strategy. In the interest
of honouring participants’ concerns and their interest in participating in the study, these views and
cases will be discussed here.
A.1. Mining
The search for mining industry participants resulted in the inclusion of a participant whose
firm produces a potash by-product rather than the mineral itself. Unlike other mining participants,
who reported experiencing significant challenges resulting from low commodity prices, this
participant reported that their firm faced few challenges in the business environment as their
market had stable supply and demand for the foreseeable future.131 However, the firm has in recent
years adopted new smart logistics systems which have greatly increased the efficiency with which
they can supply product to their customers. The new system is based on a cloud database that
gathers data from IoT networks. The networks enable the firm to track its shipments and to
remotely monitor the inventories of their customers using cameras and analytics programs which
notify the firm when resupply is needed. This allows the firm to smooth out their distribution of
shipping over time instead of having high and low intensity periods of resupply. 132 The new
system has also enabled the firm to optimize performance and reduce costs using analytics to
determine ideal load sizes, levels of production, where new warehouses may be required, and
general allocation of resources.133
The new system was implemented using a top-down approach and encountered some
resistance from some of the long-term employees who were disinclined to learn to use the new
system. The firm was able to overcome this resistance by having some early adopters who
championed for the new system and encouraged others to use it. However, there were several
131 200310_1500, 2 132 200310_1500, 2 133 200310_1500, 4
87
employees who remained resistant and these were eventually replaced.134 The employees who
adopted the new system reportedly did so with ease as the skills required for the old system
transferred well. There was some difficulty in learning how to use the analytics side of the system
and the data that was being generated. This was reportedly overcome through perseverance and
continued support from upper management.135 The greatest challenge experienced with the new
system was having customers see the value in it and want to adopt it. Though the benefits for the
supplier were significant, customers are divided on how much value the system creates and faced
difficulty determining whether the returns would exceed the costs. The firm is currently beta
testing the system with its customers and trying to determine an appropriate valuation of the
system, but the participant suggested that the system might become a mandatory part of the firm’s
contracting.136
The participant stated that the firm has not taken advantage of any innovation policies in
implementing this technology, and that they were not aware that any existed. They did not believe
that any public intervention was needed to help them overcome the challenges they faced and that
it was management’s responsibility to resolve them.137
A.2. Construction
As in the search for mining participants, the search for participants in the construction
industry resulted in the inclusion of a participant whose firm operated in the commercial retail real
estate development and property management industry, downstream from construction itself. The
greatest problem faced by the firm is downstream disruption in the retail sector as more customers
shop online and fewer brick-and-mortar retailers are able to afford rent.138 The firm has prioritized
building automation as a means to improve efficiency and reduce costs through improved energy
management, and to improve customer service.139 These systems are not new to the industry,
having been used since at least the 1980s, but are ever-increasing in sophistication and have long
been considered a key pillar of competition.140 The IoT systems underpinning the new technology
134 200310_1500, 5 135 200310_1500, 4 136 200310_1500, 3 137 200310_1500, 5-6 138 200203_0759, 1-2 139 200203_0759, 3 140 200203_0759, 3

88
allow for improved remote monitoring of building environments, allow operators to troubleshoot
problems as they arise, and enable optimization through analytics. The greatest challenge
experienced with the new systems are the cyber-security risks. To reduce risk, the firm isolates its
operational and enterprise systems from each other and has hired a third party specializing in
security to assist with operations management and developing security protocols such as restricting
systems access to specific individuals, and to educate employees about cyber-security risks.141 The
participant was uncertain if the firm had taken advantage of any innovation policies but believed
there may be a role for the public sector to provide financial incentives or assistance for cyber-
security education.142
A.3. Oil and Gas Extraction
In the oil and gas extraction industry, digital innovation was one strategy firms were using
to reduce costs, but several participants also discussed efforts to capture gas produced at wells and
either sell it or use it to generate power instead of flaring. This helps firms’ financial situation
either by increasing revenue or reducing power costs and helps them stay in compliance with
increasingly strict regulations governing carbon emissions levels.143 However, there are technical
challenges with using gas for power generations and policy barriers that prevent firms from selling
the gas or the power if they are able to successfully generate it. When generating power, gas is
often contaminated with water, CO2, and various hydrocarbons. Unless a miniature refinery is
installed, generators will foul and stop working but this solution is often prohibitively expensive.
In cases where the gas is clean enough to produce power without extra processing, wells will often
not produce enough gas or will not produce consistently enough for power generation to be
economical as the costs imposed by SaskPower on firms seeking to produce power are significant.
In addition to the cost of installing generators, one participant reported that the cost of grid
upgrades at facilities were prohibitively high, running up to $100,000 in the example given. These
costs would have required between five to seven years to pay off, assuming that the well’s gas
performance remained consistent, which is often not the case.144 In cases such as these, firms may
choose not to sell the power to the grid and use it for another purpose locally, or they may choose
141 200203_0759, 4-5 142 200203_0759, 5-6 143 191211_1007, 14-15; 200305_1415, 7; 200401_1033, 2 144 191211_1007, 14-15

89
to sell the gas directly. But selling the gas faces similar problems as it usually requires pipelines
and the cost of installation can be in the millions.145
Participants expressed frustration in the face of these challenges as they are facing
increasing pressure from regulations to reduce emissions but are trapped by other public
institutions who, at least in Saskatchewan, have monopolies on power generation and energy
distribution but who are seemingly not willing to share the costs of reducing emissions.146 One
participant expressed concern that such initiatives may be counterproductive as the emissions
embedded in manufacturing and constructing pipelines or power generation facilities may be
greater than the emissions created by the well sites as they are now.147 Participants also expressed
a general frustration with SaskPower which is reportedly very difficult to engage with when
proposing power generation projects.148 One participant recalled an experience when their firm
was attempting to install a power generation facility at one of their sites, and they received an
approval from SaskPower but then received a notification from another department of which they
had not been made aware that the project had not been approved by them.149 This suggests a degree
of institutional fragmentation and a lack of communication between departments within the crown
corporation. Not surprisingly, participants expressed a desire for streamlining of this approval
process.
Participants expressed a desire for a rationalization of the regulatory environment
generally.150 As mentioned in the oil and gas findings, participants reported operating under
multiple and often conflicting regulatory regimes. The examples given in this section demonstrate
how some of these conflicts can directly undermine important goals such as reducing carbon
emissions. With this goal in mind, one participant suggested that such rationalization should be
undertaken with the idea of the role of oil and gas a part of an energy system which includes
renewable and nuclear energy sources rather than pitting sources against each other. Only by doing
this, they argued can Canada effectively reduce its carbon footprint. 151 Another participant
suggested a strategy that would be a part of this and that is increasing advocacy by governments
145 200305_1415, 8 146 200305_1415, 7, 10 147 191211_1007, 15 148 200421_1259, 5 149 191211_1007, 14 150 200401_1033, 2; 200421_1259, 4 151 200401_1033, 9

90
in oil and gas producing provinces to raise awareness of the role of oil in such a system and the
economy generally.152
152 191211_1007, 11-12

91
Certificate of Approval

92
Consent Form Supervisor: Peter WB Phillips Distinguished Professor Johnson Shoyama Graduate School of Public Policy University of Saskatchewan (306) 966 4021 [email protected]
Student Researcher: Aaron Hertes MPP Student Johnson Shoyama Graduate School of Public Policy University of Saskatchewan [email protected]
You are invited to participate in a research study entitled: Innovation and Attitudes Toward Digital Technologies in Traditional Industries in Saskatchewan Project leaders: Aaron Hertes, MPP Student Summary of the Project: The study in which you have been invited to participate is concerned with investigating how businesses in traditional industries in Saskatchewan are planning to respond to emerging digital technologies such as cloud computing, Internet of Things, artificial intelligence, and the continuing automation of production processes. These technologies are expected to drastically improve productivity, to produce large economic benefits, and to have far reaching effects on jobs and employment that will necessitate a rethinking of how we view work. But our knowledge of these changes so far, especially as they pertain to Canada and traditional industries such as mining, oil and gas, and construction, remains limited. The goal of this study is to understand how aware of these new technologies businesses are and how they are responding to or planning to respond to them. The findings of this study will be used to inform government policy to identify the best way to support businesses through this turbulent transition. We would like to interview you and/or other people in your organization who are broadly familiar with your business’s strategy to hear your opinions on this subject. Participation will take between 20 and 30 minutes of your time. Interviews can be conducted either in person or over the phone, at your convenience. This project is being conducted by Aaron Hertes, a graduate student of public policy at the Johnson Shoyama Graduate School of Public Policy in Saskatoon, for a Master’s Thesis. Dr. Peter Phillips is supervising the project. Procedure: If you are interested in having this conversation, please email Aaron Hertes at [email protected] to arrange a time and location that would work best for you. This interview will take approximately 20-30 minutes.

93
Participation in the interview is voluntary, and you can decide to not participate at any time by informing the researcher that you no longer wish to proceed. You can withdraw from the interview at any time, without giving a reason. In addition, you can decline to answer any specific questions with which you are uncomfortable. Declining to answer any particular question will not undermine the integrity of the interview. With your permission, the interview will be audio recorded. You can have the recording device turned off at any time without giving a reason by informing the interviewer. Before the interview begins, you will be explicitly asked for consent, which will be recorded on the audio recorder, for the use of audio data for the purpose of reporting the study’s findings and for consent to use anonymous quotations. The interviews will be conducted in locations that will ensure your privacy such as an office, if the interview is done in person, or in a room at Johnson Shoyama Graduate School set aside for such interviews if done over the phone. After your interview, and prior to the data being included in the final report or any publications, you will be given the opportunity to review the transcript of your interview, and to add, alter, or delete information from the transcripts as you see fit. Your confidentiality will be ensured through the anonymization of interview transcripts in which all identifying information will be removed. Participants’ transcripts will be assigned an identification number in place of information related to the participant. A master key connecting the identification numbers to their corresponding participants will be kept in a locked cabinet accessible only to Aaron Hertes to allow the researchers to contact participants to give them the opportunity to review their transcripted interviews and proposed anonymous quotations. Participants will have two weeks to review and revise their transcripts and the proposed quotations, and to grant permission for use. If participants do not return the transcript revisions to the interviewer, the transcript will be assumed to be accurate and will be used as such. However, explicit permission to use anonymous quotations will be required for them to be included in the publication. If the consent to use anonymous quotations is granted, these data will be used only for the purposes associated with publications, and/or sharing with other researchers. Your right to withdraw data from the study will apply until June 30th, 2020. After this date the master key will be destroyed and it will not be possible to withdraw your data. Risks and Benefits: There are no known or anticipated risks from participation in this study including risks to relationships with your employer or fellow employees. Also, there are no direct benefits to you for participating in this research. However, the results of this research will help to improve or put in place policies that your business may find beneficial. An industry report will be prepared and provided to participants upon completion of the project so that you are aware of any findings and recommendations arising from the study. Confidentiality and Data Security: All information you provide is considered completely confidential. Your name will not appear in any publication resulting from this study; however, with your permission anonymous quotations may be used. In these cases, participants will be referred to as Participant 1, Participant 2, etc.; all identifying information such as the business name will be removed with the exception of the industry to which the business belongs as differentiating between industries is a key part of the study. The Social Science Research Laboratory at the University of Saskatchewan will transcribe and anonymize the recordings. However, with the goal of contacting you later and asking for your permission to use anonymous quotations, a master list will be created that will be used to connect individuals with their data. Aaron Hertes will be the only one

94
in possession of this master list, which will be stored in a locked cabinet. Transcripts will be stored on the University of Saskatchewan One Drive and shared only with Peter Phillips; consent records and emails will be stored on the University of Saskatchewan Cabinet server separate from the master list and the transcripts to ensure they cannot be connected to your data. Once Aaron’s program of studies is complete, Peter Phillips will assume possession and responsibility for the data and research materials. The master list will be destroyed on June 30th. No one outside of the research team will have access to this information. You will not be able to be identified in any way. The data will be stored for five years, post publication, on a University of Saskatchewan password-protected computer. After the required storage period, all the data related to the study will be deleted with software that does not allow data recovery. Contact Information and Research Ethics Clearance If you have any questions about participation or would like additional information to assist you in reaching a decision about participation, please contact Aaron Hertes via email at [email protected]. This research project has been approved on ethical grounds by the University of Saskatchewan Behavioural Research Ethics Board (BEH ID 1582). Any questions regarding your rights as a participant may be addressed to that committee through the Research Ethics Office [email protected] (306) 966-2975. Out of town participants may call toll free (888) 966-2975. Thank you for your assistance in this project. Please do not hesitate to contact Aaron Hertes for any questions you may have. Please keep a copy of this Consent Form for your own record. Sincerely, Peter W. B. Phillips, [email protected] Aaron Hertes, [email protected]

95
Transcript and Quotation Release Form I have had the opportunity to review and edit my interview transcript and confirm that it accurately reflects my statements to the interviewer. ____________________________________ _Aaron Hertes________________________ Participant Name Interviewer Name ____________________________________ ____________________________________ Signature Signature ____________________________________ ____________________________________ Date Date I have had the opportunity to review and edit the quotations proposed by the interviewer and confirm that they accurately reflects my statements to the interviewer. I grant permission for these quotations to be used anonymously for the research publication and to be shared with other researchers. ____________________________________ _Aaron Hertes________________________ Participant Name Interviewer Name ____________________________________ ____________________________________ Signature Signature ____________________________________ ____________________________________ Date Date

96
Original Interview Questions Drawing interview questions directly from these categories would result in an interview that is impossibly long. Instead, respondents will be asked general questions such as what their firm does, how it does it, what the business environment is like, what changes are currently taking place in that environment and what they are doing to respond to those changes, what technologies are emerging in their industry and how they plan to respond, and their perceptions of the usefulness of current innovation policies to their business. Sub-questions under each of these areas will explore themes such as firm structure and business strategy, specific instances of innovation, etc. as the opportunity presents itself. I am conscious that different respondents will have different interpretations of these questions and will therefore tailor them to the specific circumstances of the interview.
1. Can you tell me about your firm? a. What does it do? b. How does it do it? c. How big is it? (e.g. how many employees, revenue) d. How long has it been in operation?
2. What is the business environment like? a. How many competitors? b. Intensity of competition?
3. What changes are currently taking place in the environment? a. What sorts of technologies are emerging in your industry? b. What is your firm doing to respond to these changes? c. Where did these ideas come from? d. What sorts of challenges are you facing/anticipating?
4. What strategy will you pursue going into the future? a. How are you going to make more money? b. What sorts of challenges do you expect to face?
5. How useful does your firm find current innovation policies? a. What about other government policies? b. What would you recommend to improve them?