digital disruption: what do governments need to do
TRANSCRIPT
Digital Disruption: What do governments
need to do?Productivity CommissionResearch Paper
June 2016
Commonwealth of Australia 2016
ISBN 978-1-74037-584-9 (PDF)
Except for the Commonwealth Coat of Arms and content supplied by third parties, this copyright work is licensed under a Creative Commons Attribution 3.0 Australia licence. To view a copy of this licence, visit http://creativecommons.org/licenses/by/3.0/au. In essence, you are free to copy, communicate and adapt the work, as long as you attribute the work to the Productivity Commission (but not in any way that suggests the Commission endorses you or your use) and abide by the other licence terms.
Use of the Commonwealth Coat of Arms For terms of use of the Coat of Arms visit the ‘It’s an Honour’ website: http://www.itsanhonour.gov.au
Third party copyright Wherever a third party holds copyright in this material, the copyright remains with that party. Their permission may be required to use the material, please contact them directly.
Attribution This work should be attributed as follows, Source: Productivity Commission, Digital Disruption: What do governments need to do?
If you have adapted, modified or transformed this work in anyway, please use the following, Source: based on Productivity Commission data, Digital Disruption: What do governments need to do?.
An appropriate reference for this publication is: Productivity Commission 2016, Digital Disruption: What do governments need to do?, Commission Research Paper, Canberra.
Publications enquiries Media and Publications, phone: (03) 9653 2244 or email: [email protected]
The Productivity Commission
The Productivity Commission is the Australian Government’s independent research and advisory body on a range of economic, social and environmental issues affecting the welfare of Australians. Its role, expressed most simply, is to help governments make better policies, in the long term interest of the Australian community.
The Commission’s independence is underpinned by an Act of Parliament. Its processes and outputs are open to public scrutiny and are driven by concern for the wellbeing of the community as a whole.
Further information on the Productivity Commission can be obtained from the Commission’s website (www.pc.gov.au).
CONTENTS iii
Contents
Introduction from the Chairman 1
Findings 5
1 Digital and disruptive 13
1.1 The focus of the study 13
1.2 What is disruptive technology? 15
1.3 How fast is the pace of change? 21
1.4 The economic impact of new technologies 27
1.5 What role does government play? 32
2 Markets and competition 35
2.1 Impacts on the structure of the economy 36
2.2 Market structures 46
2.3 Conduct of firms and industry 56
2.4 Market performance 63
3 Workers and society 69
3.1 Automation will replace some jobs, but there are limits 70
3.2 Internet platforms and the nature of employment 76
3.3 Skilled workers will be needed to use technology 80
3.4 Automation and structural adjustment 87
3.5 Trends in labour income 92
3.6 Technology can enable participation in the workforce 94
4 Government roles 97
4.1 Government activities that influence development and adoption of technology 98
4.2 Managing the adverse impacts of digital technologies 111
4.3 How digital technology can improve governments’ own processes 120
4.4 More changes are needed to diffuse digital technologies in government 129

iv DIGITAL DISRUPTION: WHAT DO GOVERNMENTS NEED TO DO?DIGITAL DISRUPTION: WHAT DO GOVERNMENTS NEED TO DO?
Appendixes
A Conduct of the study 137
B Case study: digital intermediaries and platforms 139
C Case study: advanced manufacturing 161
D Case study: transport technologies 171
E Case study: energy technologies 195
References 217

ACKNOWLEDGEMENTS v
Acknowledgements
In conducting this study the Commission has engaged with a range of stakeholders through meetings and a focused roundtable. Some parties also provided written input. The Commission is grateful to all those who have given their time to share their experiences and expertise.
The report was produced by Lawson Ashburner, Rosalyn Bell, Brent Carney, Jenny Gordon, Timothy Hewett, Paulene McCalman and Daniel McDonald, with refereeing by Ralph Lattimore. The study was overseen by Commissioner Jonathan Coppel.


INTRODUCTION FROM THE CHAIRMAN 1
Introduction from the Chairman
The disruptive potential of digital technologies has become a hot topic in recent years. There are calls for governments to add or remove regulations, invest in digital start-ups, and protect the jobs of workers threatened by new ways of doing business. This research paper reviews and interprets expert opinion on disruption in order to inform governments about the policy tasks posed by digital technologies. For the Commission, this review sets a broader framing for the formal inquiries into Data Availability and Use, and Intellectual Property Arrangements. It also provides context for important work that we expect to come to us on productivity growth in a time of apparent digital transformation.
With rapid advances in computing power, connectivity, mobility, and data storage capacity over the last few decades, digital technologies offer opportunities for higher productivity growth and improvements in living standards. But they also pose risks of higher inequality and dislocation of labour and capital. Speculation about the effects of technologies often suffer from extreme optimism or pessimism. In the 1930s, several countries were enthusiastically experimenting with using new rocket technology to deliver mail, and in 1959, the United States trialed mail delivery via cruise missile, a proposition that could now be regarded as comical. The Commission has attempted to avoid the overly excited or dire views of the impacts of current digital technologies, while recognizing their potential where evident.
There is nevertheless a serious debate amongst economists on whether we are extracting less benefit from today’s digital disruption than from previous disruptions or industrial revolutions of the 1870s, 1920s or even 1980s. The data suggests this is so — Australia, and indeed other advanced economies, has yet to see digital technologies drive significant productivity growth or result in substantial disruption at a sector or economy-wide level.
This is not a matter of minor technical interest. Productivity in its clearest form — multifactor productivity — has not recorded the kind of growth that would be expected from a period of change described as ‘disruptive’. While measurement of the productivity of new technologies is often problematic, US analysis indicates that measurement issues do not sufficiently explain the drop off in productivity. The open and critical questions are: whether the current economic lassitude is primarily a delay before the onset of significant social and economic changes driven by digital disruption; whether government policies (or lack of them) might themselves be frustrating the realization of the benefits; or whether the effects of this disruption are less fundamental than initially thought.

2 DIGITAL DISRUPTION: WHAT DO GOVERNMENTS NEED TO DO?
The scope for pro-productivity policies — drawing on both digital and non-digital opportunities — will be examined in the Commission’s future work. This report contributes to that task by exploring the potential impacts and challenges of digital technology for markets and competition, workers and society, and the way governments operate. With a few exceptions, governments across Australia have, to date, evidenced largely reactive responses to dealing with digital technologies. Despite promising statements, we have also been unremarkable in our adoption of technologies to improve public sector processes and service delivery.
In a short paper such as this, we do not seek to answer big policy questions in any comprehensive way but rather provide an informed direction about where policy may need to go. And while we hope to avoid ‘rocket mail’ errors, we expect that not every Finding reached in this report will ultimately prove accurate. But absence of conjecture in this space would be both timid and unhelpful to the development of a productivity policy agenda.
The Commission anticipates digital technologies will continue and likely accelerate changes in Australia’s economy. Digital technologies offer greater scope for more distributed production, and facilitate the trend toward more service elements — pre- and post-production services — in manufactured and other goods. Data is a new source of market power but, in the face of the digital economy, advantage may also only be short lived. How governments deal with market power will be important for both those who control, and those who want to use, data and networks.
Digital platforms are enabling greater utilization of assets, including research and household assets. Where governments enable this, firms, households and consumers stand to benefit from a greater product range, new sources of income and often lower prices. More generally, digital platforms afford more power to consumers than in the past — they can share views on products and make more informed consumer choices. Some regulations aimed at improving consumer information may become redundant; those aimed at ensuring information is authentic and platforms are not gamed, may become critical.
There is much governments can do to enable the creation and take-up of digital reform opportunities without favoring particular technologies. In markets that are currently highly regulated but where digital technologies allow more producers — electricity generation is one such case — governments will need to review the institutional and regulatory arrangements to ensure that new technologies can compete for market share. More generally, standards to support interoperability of digital technologies and ensuring investment in enabling infrastructures (such as reliable and readily upgradeable communications networks), can help with rapid technological diffusion.
There will be adjustments that come with digital disruption. Some workers will struggle to adjust to changes in demand for their skills and new, more flexible but less reliable, work options. Australia’s social safety net will remain important in mitigating risks for workers and lessening the effects of a widening distribution in incomes. Broader protections for an individual’s rights (such as with control of personal information) and to support society’s

INTRODUCTION FROM THE CHAIRMAN 3
moral and ethical mores (relevant to technological advancements into artificial intelligence, remote sensing and medical research) will require ongoing government attention informed by scientific evidence.
Digital technologies offer governments scope to improve their own service delivery, including through better assessment of risk in regulatory activities, integration of human services, and infrastructure management. Digital technologies will also make governments more publicly accountable than in times past and raise pressure for greater transparency. By showing leadership in their own practices, re-designing regulation to enable rather than block the adoption of digital technologies, and mitigate community-level risks where practical, governments can do more than they appear to envisage today.
Peter Harris Chairman


FINDINGS 5
Findings
Impacts of disruption on markets and competition
FINDING 2.1
The distinction between services and manufacturing is declining, with design and pre and post sales service parts of the production cycle becoming increasingly important sources of value added. This has implications for: • the importance of scale in production • the types of capital firms need • how much work happens within the firm and how much is outsourced • the types of jobs that will be created and replaced • the dynamics of the business cycle.
It also has implications for the National Accounts, including adjusting for changes in quality, and the long term comparability of industry classifications.
FINDING 2.2
Clarity in how and when infrastructure investment decisions will be made assists firms that are developing and adapting new technologies. Uncertainty around future technology and infrastructure needs is not a reason for inaction by governments — the costs of inaction, in terms of slower diffusion in technology, can be widespread and significant.

6 DIGITAL DISRUPTION: WHAT DO GOVERNMENTS NEED TO DO?
FINDING 2.3
Digital technologies are allowing firms to outsource more of their production. This outsourcing is based on access to skills as much as low cost labour, offering greater opportunities to firms in high labour cost economies. Trade policy has been slow to adapt. Substantial increases in outsourcing across international borders may necessitate government attention to: • secure movement of data across borders • regulatory requirements for delivery of service exports in other countries • barriers to outsourcing imposed by differential treatment across industries and
products in bilateral and regional trade agreements and in behind-the-border policies
• workability of rules of origin with many disparate sources of inputs to production.
FINDING 2.4
Digital platforms allow households and non-market organisations, such as research facilities, to engage more in the market economy by ‘sharing’ access to their under-utilised assets. This poses structural adjustment issues for industries that have traditionally faced little competition due to regulations, such as taxis and short-term accommodation. More effective utilisation of under-employed assets, whether market or non-market, is a positive economic outcome.
FINDING 2.5
Digital technologies are changing the sources of market power, with control over data and networks providing new means for firms to hinder entry and extract rent from customers. • The length of time and extent to which firms can exercise market power is highly
uncertain, requiring active monitoring rather than pre-emptive action. • New regulatory tools may be needed to address these very different sources of
market power arising with the digital economy. Aspects of third party access regimes could be explored as a relevant approach.
FINDING 2.6
Digital platforms can help overcome information asymmetries, which have been a common justification for regulation. This can allow governments to reduce the restrictiveness of regulations seeking to provide consumer protection, subject to confidence in the information provided.

FINDINGS 7
FINDING 2.7
Like previous waves of technology, digital technologies should translate to productivity improvements. Indeed, the low marginal cost of replication means that intangible inputs should fall in price, boosting firm profits. However: • consumers may capture a larger share of growth in productivity where this is
delivered in terms of higher quality products, and where enhanced competition drives down prices
• some digital products can be difficult to monetise • the value of data and networks can result in a winner-take-all model in some digital
services.
Impacts of disruption on workers and society
FINDING 3.1
Developments in digital technologies, such as sensors and machine learning, are expected to widen the boundary of the types of tasks that can be automated. But there remain tasks that have proven difficult to automate, including those requiring perception, or creative and social intelligence. Just because a job can be automated does not mean that it will be.
FINDING 3.2
The 'gig' economy is in its infancy, making its future effect on the nature of employment uncertain. But if the gig economy develops quickly and its spread is wide, there will be risks that need to be managed. While governments need to address real concerns, blocking these technologies is not an appropriate response.
In the longer term, depending on the scale of change, governments may need to consider whether: • changes to workplace relations regulations are required to accommodate a
growing category of employment • the income support system needs to be changed to ensure it is not a barrier to
workforce engagement and helps reduce income volatility for low income workers.

8 DIGITAL DISRUPTION: WHAT DO GOVERNMENTS NEED TO DO?
FINDING 3.3
Simply increasing the share of STEM graduates is unlikely to resolve the low rates of adoption of digital technologies by firms. Given the relatively high underemployment of STEM graduates and apparent underutilisation of STEM skills, the current approaches are not delivering the problem-solving skills needed for technology rich work environments. Beyond delivering a high competency in literacy and numeracy at the school level, initiatives could include reviewing teaching methods, increasing flexibility of university degrees and improving information on employment outcomes for students to help inform student choice.
FINDING 3.4
The automation of many tasks in the workplace, with large labour-saving technological advances, has not led to unemployment rates trending upwards over long periods of time. However, there is concern in parts of the community that the pace of change will accelerate, leading to substantial unemployment in the future. But dire employment scenarios remain speculative given the considerable uncertainty about the impact of automation on employment.
Past experience with structural change suggests some workers will find it difficult to secure new jobs. Government should focus their efforts on assisting displaced workers and resist pressure for industry protection or assistance.
FINDING 3.5
Wages in Australia have increased at all income levels in recent decades, however they have increased more in higher deciles. Technological change that increases demand for high skilled workers has played a role in the widening of the wage distribution.
Ensuring the benefits from future technological change are shared will be an ongoing policy challenge for government. Raising the supply of skilled workers will be part of the solution, along with the continued role of Australia’s tax and transfer system in reducing income inequality.
FINDINGS 9
Implications of disruption for how governments operate
FINDING 4.1
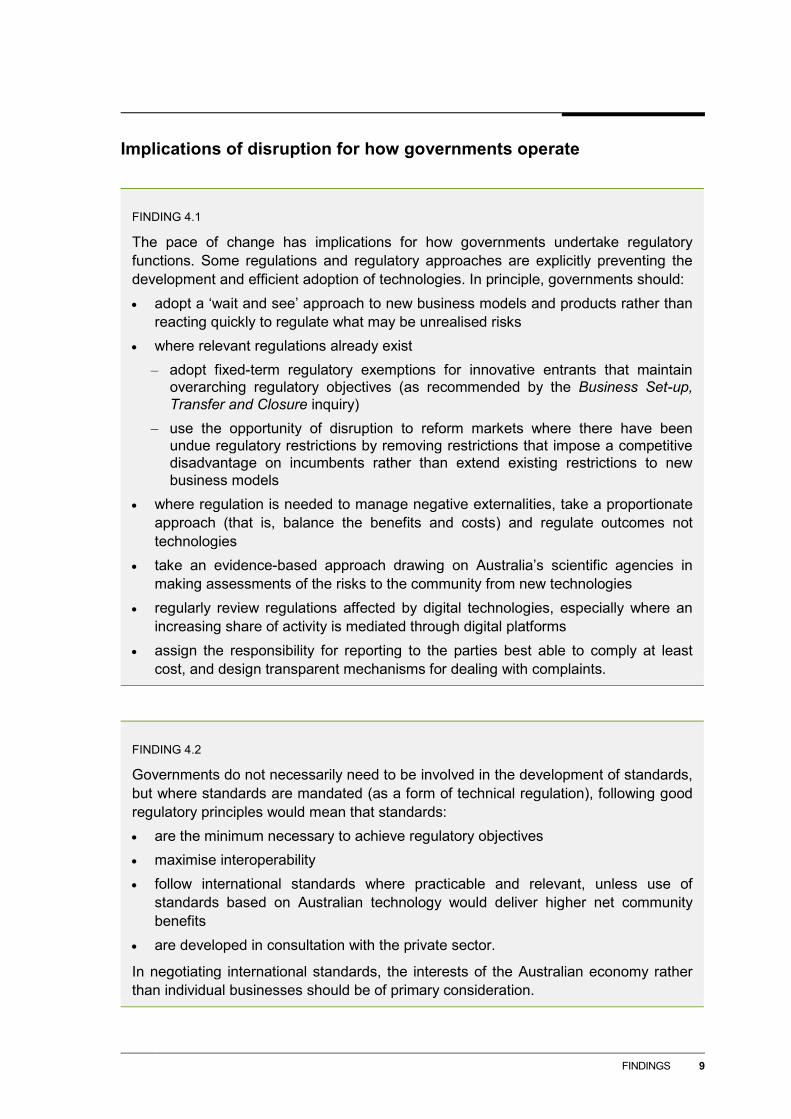
The pace of change has implications for how governments undertake regulatory functions. Some regulations and regulatory approaches are explicitly preventing the development and efficient adoption of technologies. In principle, governments should: • adopt a ‘wait and see’ approach to new business models and products rather than
reacting quickly to regulate what may be unrealised risks • where relevant regulations already exist
– adopt fixed-term regulatory exemptions for innovative entrants that maintain overarching regulatory objectives (as recommended by the Business Set-up, Transfer and Closure inquiry)
– use the opportunity of disruption to reform markets where there have been undue regulatory restrictions by removing restrictions that impose a competitive disadvantage on incumbents rather than extend existing restrictions to new business models
• where regulation is needed to manage negative externalities, take a proportionate approach (that is, balance the benefits and costs) and regulate outcomes not technologies
• take an evidence-based approach drawing on Australia’s scientific agencies in making assessments of the risks to the community from new technologies
• regularly review regulations affected by digital technologies, especially where an increasing share of activity is mediated through digital platforms
• assign the responsibility for reporting to the parties best able to comply at least cost, and design transparent mechanisms for dealing with complaints.
FINDING 4.2
Governments do not necessarily need to be involved in the development of standards, but where standards are mandated (as a form of technical regulation), following good regulatory principles would mean that standards: • are the minimum necessary to achieve regulatory objectives • maximise interoperability • follow international standards where practicable and relevant, unless use of
standards based on Australian technology would deliver higher net community benefits
• are developed in consultation with the private sector.
In negotiating international standards, the interests of the Australian economy rather than individual businesses should be of primary consideration.

10 DIGITAL DISRUPTION: WHAT DO GOVERNMENTS NEED TO DO?
FINDING 4.3
Governments contribute to promoting innovation across the economy by delivering a low-cost operating environment for innovative activities. This could include: • removing disincentives for universities to work collaboratively with business and
encouraging the sharing of knowledge • ensuring transparent policy objectives and predictability in those areas most
affected by developments in technologies • improving the functioning of cities to attract and retain highly-skilled workers and
innovative firms.
FINDING 4.4
To improve the reliability and usefulness of information provided by digital intermediaries governments could: • reduce regulations aimed at the provision of information on a product or service,
where consumers are more effectively able to get this information through another avenue (such as an online rating system)
• encourage digital platforms to develop industry standards to improve the reliability of feedback and right of reply and prevent the use of gag clauses on consumers
• encourage industries to develop a common or standardised language around product offerings to assist consumers in making comparisons
• ensure existing broader governance structures for consumer complaints are sufficient to give consumers and businesses confidence in the use of digital intermediaries.
FINDING 4.5
Digital technologies allow for more pervasive collection of data on individuals and firms and can be a medium for harassment and security breaches. This may change what is needed in order to: • protect individuals privacy • prevent the unlawful use of information • maintain the integrity of digital networks.
The case for government action in these areas relies on ensuring that the likely benefits of any restrictions outweigh the costs of restrictions to the community.
FINDINGS 11
FINDING 4.6
There remains further scope for regulators to adopt new technologies that reduce the burdens incurred in obtaining regulatory outcomes, undertake more effective risk-based assessment, and substantially improve engagement and the targeting of monitoring and enforcement activity.
FINDING 4.7
Better information systems and scope to monitor services delivered and their outcomes could improve the efficiency and timeliness of human service delivery by: • allowing consumer choice to play a greater role in the delivery of human services • using linked information on services and customers to better target service delivery
and introduce more integrated services • reducing the cost and improving the safety of people involved in areas such as
environmental management and emergency services.
FINDING 4.8
Technologies embedded in infrastructure and greater use of digital platforms to link infrastructure with users and suppliers offer governments considerable scope to: • assess infrastructure usage and the responsiveness of demand to pricing and to
introduce efficient pricing technology • augment and maintain public infrastructure in ways that minimise disruption to its
use • optimise investment in public infrastructure, better matching the build requirements
to evolving needs.

12 DIGITAL DISRUPTION: WHAT DO GOVERNMENTS NEED TO DO?
FINDING 4.9
Governments (particularly at a subnational level) have already made increasing use of digital technologies in on-the-ground service delivery. Some adoption of technology in regulatory processes is also evident. There remain, however, issues that governments need to confront before the benefits of digital technologies can be more widely realised. • A risk averse culture in the development of policies that are wide-reaching within
the relevant jurisdiction could be assuaged by measures such as: greater use of policy trials, relying on precedents from other jurisdictions; and drawing on recommendations and advice of independent agencies.
• Skill sets within the public service need to evolve in tandem with technological change. The capacity of agencies to recruit staff with relevant skills and shed those with inadequate skills could be enhanced by more flexible performance management and termination conditions in agency enterprise agreements.
• A sharing of data and cooperation between agencies would improve capacities to solve complex problems that do not fit neatly into the competencies of a single agency.
• Governments need to find ways to: – exploit, in their program delivery and policy making processes, the increased
transparency that comes with digital technologies – avoid locking in details of policy responses at early stages without scope for
genuine re-evaluation ‘en route’ to the end objective.

DIGITAL AND DISRUPTIVE 13
1 Digital and disruptive
Key points • While new digital technologies will disrupt the activities of many firms, the Commission’s
interest in disruption is where new technologies drive substantial changes across the economy that can leave labour and/or capital underutilised for long periods.
• The current wave of disruptive technologies are mostly digital in nature, enabled by technologies such as the internet, cloud computing and sensors. These technologies affect firms, households and the economy by:
– reducing transactions costs for information exchange
– generating and maintaining data as a valuable resource
– increasing the automation of tasks
– allowing new business models facilitated by digital platforms, cloud computing and sensor technology
– bringing household and other assets into the market economy.
• Only a small proportion of Australia businesses are innovative, and Australia ranks poorly within the OECD by measures of information and communications technology research and development, and patenting. Australian businesses have a greater tendency to adopt new technologies from elsewhere than to develop their own.
• Australian households and consumers are generally fast adopters of new technologies, but businesses and governments lag behind.
• By some measures, technologies are developed and adopted more quickly now than in previous eras. In part, this may be because digital technologies are often low cost to replicate and have been able to use existing infrastructure.
• Major advances in technology can take some time to deliver higher productivity growth, but the gains were considerable through the 1930s to the 1970s. While computers and communication improvements boosted productivity growth in Australia in the 1990s, further advances in digital technologies have yet to yield measurable productivity gains.
1.1 The focus of the study
New technologies have altered existing modes of production and consumption throughout history. Since the late 18th century, there have been three distinct periods of technical progress (the industrial revolutions) — the first driven by steam power, the second by electrification and the internal combustion engine, and the third by information technology (robots and computers). Some (Schwab (2016a), for example) believe we are in a fourth

14 DIGITAL DISRUPTION: WHAT DO GOVERNMENTS NEED TO DO?
industrial revolution, driven by the continued development of digital technologies (with widespread use of sensors and interconnections). Many of the changes associated with these ‘revolutions’ are incremental, adopted over time as capital is replaced, new skills are acquired, and consumer preferences change. However, some technologies are adopted at a pace or scale that means they are ‘disruptive’ — fundamentally changing the way the economy and society operates, sometimes in a relatively short space of time.
This report focuses on the role of government in the face of potentially disruptive technological change. Governments establish the legal and regulatory systems that govern the operation of the economy. They provide key inputs into the economy by educating the labour force and providing public infrastructure and services. They also negotiate (through democratic processes) and maintain (through social expenditure and justice) an underpinning social compact with the community. Disruptive technologies have implications for each of these roles.
Report structure
This report examines the potential impacts of disruptive technology on markets and competition, workers and society, and the way governments operate. It draws upon examples from a range of digital and associated technological developments that are likely to be ‘disruptive’, in particular:
• Digital intermediaries: digital platforms, such as Uber, Airbnb, Freelancer, Airtasker eBay and Seek, offer a range of functionalities for producers, consumers and the community (social uses) with lower transaction costs and potentially reduced information asymmetries. Some facilitate greater utilisation of household and other assets — for example, Airbnb allows ‘hosts’ to rent all or part of their homes.
• Advanced manufacturing: the combination of new or novel materials and digitally advanced design and production methods, including computer-aided design, 3D printing, advanced robotics and the application of the ‘internet of things’ (IoT) to manufacturing.
• Transport technologies: revolving around sensors in vehicles that allow for autonomous, semi-autonomous, and/or remotely operated vehicles and aircraft, as well as providing a new source of data to manage infrastructure assets more efficiently. These technologies have the potential to change the delivery of transport services and the use of transport infrastructure.
• Energy technologies: which combine advances in information and communication technology) with distributed energy generation (notably solar and wind) and improved storage technologies. The current regulatory and physical infrastructure for energy supply supports a centralised energy transmission and distribution network, raising questions about how these advances in technology will play out.
Appendixes B to E discuss each of these areas in more detail. Other technological developments — such as those in medical research — could prove equally disruptive to society. But in an attempt to keep the scope of this report manageable, the Commission has

DIGITAL AND DISRUPTIVE 15
contained its focus to those technologies most likely to require a significant response from multiple levels of governments.
The remainder of this chapter examines the nature of disruptive technology, investigates the pace of technological change and briefly outlines the role for governments that is further explored throughout the report. Chapter 2 focusses on the impacts of disruptive technologies on markets and competition, with an emphasis on evolution of market structures and the structure, conduct and performance of firms. The labour market and social impacts of disruptive technology are explored in chapter 3. Finally, chapter 4 considers a proactive role for government in using and facilitating the adoption of socially beneficial disruptive technologies.
1.2 What is disruptive technology?
The term ‘disruptive technology’ was popularised by Christensen (1997). Christensen’s definition of disruption is a relatively narrow concept whereby technology evolves through quality improvements to inferior but low-priced products (box 1.1). The key element to Christensen’s model is that disruptors ‘sneak’ into an existing market, and compete directly with incumbents once a foothold has been established. While the theory has been influential, it has been criticised for lacking rigorous empirical backing (Lepore 2014), and for conflating business model, product and technological innovation (Markides 2006). King and Baatartogtokh (2015) go further, claiming that only 9 per cent of the case studies Christensen and Raynor (2003) present in support of the theory actually feature all of its tenets.
Regardless, Christensen’s approach ignores the reality that the introduction of higher quality products can also be disruptive. Apple’s iPhone was, from its introduction, a superior and more expensive alternative to the smartphones and mobile phones produced by market leaders such as Nokia, Motorola and Research in Motion (Blackberry). The iPhone, together with smartphones based on the Android operating system, proceeded to disrupt the market. Between 2009 and 2014, Apple’s share of the global mobile phone market grew from 2 to 10 per cent, while Nokia’s contracted from 36 to 10 per cent (Statista 2016). In a similar vein, ridesharing company Uber offers quality improvements over taxi services (at least in the eyes of some consumers), but at a lower cost. Uber has experienced rapid growth since launching in Australia in October 2012, with its UberX service capturing around 6 per cent of the total ‘rides’ in the point-to-point transfer market in August 2015 (Deloitte Access Economics 2016).

16 DIGITAL DISRUPTION: WHAT DO GOVERNMENTS NEED TO DO?
Box 1.1 The different meanings of ‘disruptive technology’ The Christensen model of disruptive technology, later renamed ‘disruptive innovation’, defines a process through which ‘disruption’ takes place. A small firm enters a market by providing cheaper and inferior (but typically more technologically advanced) products at lower-value to consumers. Incumbent firms, meanwhile, remain concerned with the demands of their more profitable high-end customer base and initially pay little attention to the new entrant. Once the entrant has established a foothold, technological improvements allow it to improve the quality of its products while maintaining its price advantage. In this way, the entrant out-competes the incumbents and disrupts the market.
This model is able to describe the process through which some industries have experienced disruption. For example, the personal computer (PC) emerged in the early 1980s as a lower-powered, cheaper alternative to minicomputers. Because this new technology initially appealed mostly to small businesses and individuals, minicomputer producers continued to cater to their established customer base of larger businesses and universities.1 Technological advances then improved the computing power of the PC, which largely displaced minicomputers.
Elsewhere, ‘disruptive technology’ has different connotations. Although he used the term ‘creative destruction’, Schumpeter (1942) is well known for his observation that capitalist systems progress by creating new structures while destroying existing ones. McKinsey Global Institute (2013) adopt an understanding of disruption along these lines, noting the potential for technology to ‘ … disrupt the status quo, alter the way people live and work, rearrange value pools, and lead to entirely new products and services’, but also note that ‘technology often disrupts, supplanting older ways of doing things and rendering old skills and organisational approaches irrelevant’.
Each of these definitions focuses on the technologies themselves and the economic rewards that they may bring. While these definitions are appropriate to the context within which they are used, for the Commission’s purposes they place insufficient focus on the impact of these technologies on firms, workers and the business of governing.
Sources: Christensen, Raynor and McDonald (2015); McKinsey Global Institute (2013); Schumpeter (1942); Trout (2015).
Christensen considers these innovations, which compete directly with incumbent firms from the outset, to be ‘sustaining’ rather than disruptive (Christensen, Raynor and McDonald 2015). But in terms of economic impact, both are disruptive — and for reasons that go beyond their challenging of dominant incumbents. For example, smartphones changed the standard functioning of the mobile phone by combining in one compact device many features that were once only provided by multiple devices (a phone and a music player, computer, book, diary, Wi-Fi dongle, GPS unit, and a still and movie camera) and by actively encouraging the development of third party applications. This affected the demand for competing products (for example, point and shoot cameras) from other businesses. It also fostered an array of new digital intermediaries, especially those
1 In 1983, Digital Equipment Corporation’s CEO Kenneth Olsen told Business Week ‘The personal
computer will fall flat on its face in business’.
DIGITAL AND DISRUPTIVE 17
requiring mobile internet access — of which ridesharing services (such as Uber) is one, as are digital repositories such as Flickr. These new markets have considerable potential for growth, with 70 per cent of Australians now using a mobile phone to go online and 50 per cent using a tablet (ACMA 2015). Ridesharing services, meanwhile, have challenged the role of government in the tightly regulated taxi industry.
The Commission’s definition of disruption
A general and more policy-relevant characterisation of disruptive technologies is that they are developments that drive substantial change across the economy for many firms, households or workers, with impacts that impose significant costs of adjustment as they make capital obsolete and leave some workers significantly underutilised for some time. In other words, ‘big, sometimes fast and always unruly’. This goes far beyond consideration of the factors that might explain why incumbent firms fail to respond to new competitors.
New technologies offer opportunities for the creation of innovative businesses, a greater range of products, and new ways for governments to address policy problems. In this way, they can generate higher productivity growth and improve living standards (measured or not). However, technological change involves winners and losers. People whose skills lock them into a dwindling occupation may find it hard to maintain employment. Capital equipment may be rendered obsolete well before the completion of its originally anticipated lifetime — a cost borne by its owners. Formerly viable businesses may fail. In many cases, firms and workers adapt relatively quickly, without the more widespread changes to business models and the redeployment of capital and labour in the economy that is characteristic of disruptive technologies.
But sometimes firms do not or cannot adapt, because of short-sightedness (as in Christensen’s model), economic considerations (such as insufficient scale to justify new capital investment or locked-in production methods and processes), or unduly burdensome regulation. Likewise, workers sometimes find themselves with outdated skills and unable to find employment. It is in these instances, where product and factor markets exist in a state of sustained disequilibrium, that technological change is disruptive.
Hence, disruption is not merely about new firms challenging incumbents, and nor is it exclusive to product markets. In some instances, new production technologies result in the introduction of new or higher quality products. In others the products remain relatively unchanged, but production processes change and costs fall. The development of cheaper clothing and food production methods provides an historical example of such changes. An emerging example is the potential for distributed electricity production technologies (appendix E) to strand the existing assets of the centralised electricity network.
The development of disruptive technologies is both inevitable and unavoidable. Governments can resist such developments by dictate and regulation. Indian automobile manufacturing technology may be an exemplar of the effects of such resistance. A more

18 DIGITAL DISRUPTION: WHAT DO GOVERNMENTS NEED TO DO?
positive stance for governments is to focus on maximising the net benefits of technological change to the community.
Digital disruption
Given the rapid advances in computing power, connectivity, mobility and data storage capacity, it is unsurprising that the vast majority of modern disruptive technologies are of a digital nature. Indeed, many other cutting edge technologies (gene sequencing, for example) are only possible through the advances in computing and data analytics.
Digital technologies are particularly interesting as:
• while they often require substantial upfront investment to develop, they generally allow replication at very low additional cost
• many have ‘network’ features in that their value to each user increases as they become more widely used
• they add value by enhancing the gathering, processing, storage and transmission of data and provide the delivery of information in digital form
• along with communication technologies, they affect the way individuals interact with each other and with businesses and government, changing how households consume, engage with civil society, and supply their labour.
There are several technologies, known as enabling technologies, that are fundamental to digital disruption because they enable subsequent technological innovation (potentially of further enabling technologies):
• The internet and its supporting infrastructure, such as broadband, software and associated hardware (computers, tablets, smartphones and routers). The internet enables the collection and distribution of information at low marginal cost, which allows people and businesses to be connected at all times.
• Cloud computing — which utilises internet connectivity to provide on-demand computing power and more efficient use of distributed computing infrastructure. Cloud computing can provide the data storage and computing power for the processing and analysis of large-scale, complex and rapidly collected data (known as big data) (Hashem et al. 2015).
• Sensor technologies — which when sufficiently low in cost and high in quality can be used in a wide variety of digital applications. The IoT refers to the networks created through the embedding of sensors and internet connectivity hardware into consumer goods, public infrastructure and production machinery. The IoT enables the collection of data, the automation and improvement of production processes and infrastructure management, and the development of new consumer goods and services.

DIGITAL AND DISRUPTIVE 19
While some changes brought on by digital technologies are disruptive, others are gradual and evolutionary in nature. This study deals with both, noting, in particular, the following ways that digital technologies affect the economy:
• By reducing the costs of information transmission, digital technologies have driven the emergence of products that feature both a good and a service component. For example, Rolls-Royce has moved from selling commercial aeroplane engines to supplying a fixed-term rental service that features monitoring and maintenance (The Economist 2009a), facilitated by the transmission of real-time data to Rolls-Royce’s service centres. Digitally-driven online shopping can substitute for functions provided at higher cost by brick-and-mortar stores. Many products purchased online can now be customised, and detailed order information (such as delivery time estimates and automatic email and SMS updates) is frequently provided.
• The digitally-enabled collection, processing and application of data has created a new and valuable resource — one where almost boundless accumulation is possible and where use by one party does not reduce availability to others (often referred to as non-rivalrous in consumption). Data is collected as a by-product of digitisation, but much of it remains underutilised. For example, less than 1 per cent of the data generated by the 30 000 sensors on an offshore oil rig is used — and this is primarily to find irregularities in production rather than for improving prediction and optimisation decisions (McKinsey Global Institute 2015). While big investments are required to build a data resource and analytical capacities, the marginal cost of using them to produce new products (information) is generally low. Once the initial investment in collecting and managing data is made, the introduction of new data-based products can be rapid.
• Digital technologies allow for the increasing automation of tasks and the replacement of workers with capital. This trend (and the anxiety it generates within the community) has long been a feature of technological change. For example, 19th century textile workers (the Luddites) smashed labour-saving textile-weaving technologies out of fear that they would leave them without work. Presently, the replacement is of lower-level cognitive tasks, such as administrative tasks, but this could expand to more advanced but routine cognitive tasks (Frey and Osborne 2013).
• New, digitally-enabled business models are now emerging across many sectors. Digital platforms and improvements in communication technologies are reducing transactions costs and information asymmetries. For example, software businesses have traditionally relied on large and efficient sales and distribution teams to gain market penetration. But Atlassian, a business solutions firm, invests in product development and operates at lower cost by listing all sales-related information online (Macmillan 2014).
• Digital technologies offer greater scope for the market use of household assets, including labour. Digital intermediaries allow more, as well as a broader variety, of people to engage in paid work, and to use underutilised assets in market activities.

20 DIGITAL DISRUPTION: WHAT DO GOVERNMENTS NEED TO DO?
Disruption to Australian businesses
On an economy-wide basis, the proportion of businesses introducing innovative approaches or products — and are therefore in a position to disrupt others — appears to be relatively low (figure 1.1). Moreover, the protection of intellectual property rights through patent applications is sought by a very small proportion (0.1 per cent) of Australian businesses. This rate is below the reported rate of new to the world innovations of any variety, reflecting that patents are only one way of protecting intellectual property (PC 2016b).
Figure 1.1 Innovative business activity
Proportion of all actively trading Australian businesses, 2012-13a
a Businesses may be counted in more than one category. Excludes adoption of innovations that are neither new to the world or Australia.
Source: Productivity Commission estimates based on ABS (Innovation in Australian Business, 2012-13, Cat. no. 8158.0).
However, more Australian firms are adopters of new technology, with around 14 per cent of surveyed businesses reporting the adoption of a product, process and/or approach that is ‘innovative’ for their business but not necessarily for others during 2012–2013 (PC 2015b).
The Global Innovation Index places Australia 17th of 141 countries based on 79 indicators. This ranking is near to comparable countries such as New Zealand (15th) and Canada (16th) but lags the United Kingdom (2nd) and the United States (5th) (Cornell University, INSEAD and WIPO 2015). Across all OECD countries, high growth innovative businesses typically account for around 2-6 per cent of all businesses (PC 2015b).
1.6%
0.7%
0.3%0.2%
1.1%
0.5%
0.2% 0.2%0.1% 0.04%
Product or service
Operational process
Marketing process
Organisational appoach
Type of innovation Other indicators
New to world
New to Australia only
Patent applications by residents
Patents granted
to residents

DIGITAL AND DISRUPTIVE 21
Looking specifically at the ICT sector, Australia performs poorly among OECD countries by innovation measures. Australia ranks 27th in the OECD for ICT sector business R&D expenditure as a proportion of GDP, and, while a weak indicator of much innovative activity, the proportion of Australian patent applications related to ICT (29 per cent) is below the OECD average (37 per cent) (OECD 2015a).
1.3 How fast is the pace of change?
Is the current phase of technological disruption more profound than in the past? Optimists have termed the current era the ‘fourth industrial revolution’ (Schwab 2016a) and the ‘second machine age’ (Brynjolfsson and McAfee 2014). Conversely, Gordon (2015) argues that technologies introduced between 1870 and 1970, such as electricity, the telephone and the motor vehicle, had a far greater impact on the standard of living.
Because there are many aspects to technological change, there is no definitive measure of its pace. Several metrics are available, but their meaning should be interpreted with caution.
The rate of new patent applications is one measure of the rate at which new technologies are developed. Internationally on a per-capita basis, this rate has trended upwards over the past several decades. The growth has been slower in Australia, which has diverged from the global trend post 2008 (figure 1.2).2 But this measure says nothing about the pervasiveness of the patented innovations. Moreover, changes to intellectual property rights frameworks, corporate strategies around patenting, and competitive pressures may influence the metric. For example, the recent ‘smartphone patent wars’ fought between smartphone manufacturers (notably Apple and Samsung) led to the industry accounting for one in every six active patents in 2012 (Brachmann 2015).
2 Because patents are country-specific, products that are traded internationally will typically be patented
many times over — hence, the measure will be inflated by increases in international trade and the interconnectedness of economies. This problem is avoided by considering patents filed in the developer’s resident country only.

22 DIGITAL DISRUPTION: WHAT DO GOVERNMENTS NEED TO DO?
Figure 1.2 Patent applications per capita have increased internationally,
but not in Australiaa
1985-2014
a Patent applications filed in resident country only.
Source: Productivity Commission estimates based on Worldometers (2016), World Bank databank and WIPO statistics database.
Diffusion of technologies
Measures of diffusion are a better indicator of the pace of technological change as they focus on the usage of new technologies. Diffusion is commonly measured by the rate of household penetration (the proportion of households using the technology). For some technologies, business or government penetration may be a more relevant measure.
Diffusion curves generally follow a distinctive S shape, with the rate of adoption initially increasing as the technology becomes established but then slowing as the market approaches saturation. The shape of each diffusion curve is unique, but the most important difference is in the time taken to reach ‘take-off’, which Rogers (2003) estimates to be at around the 10 to 25 per cent adoption rate.3 However, this is complicated by the difficulties involved in determining when a technology comes into existence (Williamson et al. 2015).
3 Take-off is the household share at which the technology will reach widespread adoption. However, there
are technologies that reach this level of household penetration that then go out of fashion or become superseded by superior technologies.
0
50
100
150
200
250
300
1985 1990 1995 2000 2005 2010
Pate
nts
per
mill
ion
peop
le
World Australia

DIGITAL AND DISRUPTIVE 23
The rate of technological diffusion has generally increased over time — that is, diffusion curves in recent years are shorter than they were 50 to 100 years ago (figure 1.3). This may partly be due to a shift away from technologies that require significant new public infrastructure to facilitate their adoption (such as electricity, the telephone and automobiles) toward those that do not (such as microwaves and air conditioning) — a pattern examined further in chapter 2.
The internet is notable in that it was able to make use of existing physical infrastructure in the form of the copper telephone network. This allowed a faster diffusion as enabling infrastructure networks have tended to diffuse at comparable rates over time (figure 1.4).
Australian consumers are noted as fast adopters of new technology. By 2012, 57 per cent of Australians had upgraded to a smartphone, a significantly faster adoption rate than the United States, United Kingdom, France, Italy, Spain and Germany (Lunden 2012). Only South Korea and Israel reported a higher proportion of users of directions/map smartphone geolocation services in 2013 (OECD 2015a). Wearable technology (such as smart watches and fitness monitors) have also been adopted quickly by Australian consumers (Polites 2013). Twenty-five years after the World Wide Web became publicly available, over 90 per cent of adult Australians use the internet (ACMA 2015). In May 2014, there were approximately four networked devices per person in Australia, which is forecast to increase to almost nine devices per person in 2019 (Cisco 2015).
Figure 1.3 The household diffusion of selected technologies
Source: Williamson et al. (2015).
0
20
40
60
80
100
1900 1914 1929 1944 1959 1974 1989 2004
Prop
ortio
n of
US
hous
ehol
ds(p
er c
ent)
Stove Telephone Electricity AutomobileRadio Clothes washer Refridgerator Clothes dryerDishwasher Air conditioning Colour TV MicrowaveVCR Computer Mobile phone Internet

24 DIGITAL DISRUPTION: WHAT DO GOVERNMENTS NEED TO DO?
Figure 1.4 The diffusion of public infrastructure networks in the United
States
Source: Williamson et al. (2015).
Other factors can affect the rate at which technologies diffuse. As well as providing and maintaining public infrastructure, governments regulate industries and have historically played a role in setting standards to facilitate compatibility between products. These functions, which are discussed in chapters 2 and 4, have the potential to either facilitate or hinder adoption.
New technologies almost always represent the aggregation of many different parts, each with a different set of factors governing its development. The history of the internet traces back to the 1950s and required (among other things) the development of packet-switching technology in the 1960s and the internet protocol suite (TCP/IP) standard in 1982 (Greenstein and Prince 2007). The lagged development of just one component relative to others can affect the development of a new technology. For example, battery performance has been a limiting factor in the development of many mobile products, from electrical cars to wireless devices. Indeed, sales of electrical cars exceeded petrol cars in the United States at the turn of the 20th century. However, petrol cars offered cheaper and easier energy storage in the form of fuel tanks, enabling longer distance travel. Improvements in the internal combustion engine and associated falls in price led the petrol car to quickly become dominant (Sanchez 2014).
For these reasons, the path from invention to innovation is usually non-linear and difficult to predict. For example, forecasts of the future size of the IoT (by number of connected devices) over the past several years have differed by an order of magnitude (figure 1.5). Assessing the economic impact of IoT is yet more complex, because the use of these
0
20
40
60
80
100
1790 1810 1830 1850 1870 1890 1910 1930 1950 1970
Satu
ratio
n le
vel (
per c
ent)
Canals Railways Telegraphs Old pipelines Roads

DIGITAL AND DISRUPTIVE 25
devices must be taken into account. On this front, Cisco (2015) estimates that internet traffic from non-PC devices will rise from 40 per cent in 2014 to just under 70 per cent in 2019.
The annual global economic value of the IoT has been forecast by McKinsey Global Institute (2015) to reach between $3.9 trillion and $11.1 trillion (US dollars, undiscounted) in 2025.4 This forecast is, however, contingent on continued falls in the costs of technological hardware, interoperability between devices (which is responsible for 40 per cent of the estimate), favourable government policy in areas such as privacy, security and safety regulations and, of course, the willingness of consumers and firms to adopt the new technology.
Figure 1.5 Projections of the size of the internet of things have declined
over time Forecasts of global size (number of connected devices) in 2019-2020
Sources: Adshead (2014); Cisco (2015); Ericsson (2015); Gartner (2015); Juniper Research (2015); Postscapes (2014).
Diffusion curves have limitations as a measure of the pace of technological change. The ‘have or have not’ dichotomy used to report adoption has been criticised as simplistic where it relates to complex technologies that can be engaged with at different levels (Guerrieri and Bentivegna 2011). Exogenous factors also impact on the diffusion of technologies. The advent of the Great Depression (1929) and the Second World War (1939) appear to have slowed or even reversed the household diffusion of electricity, the 4 This figure includes consumer surplus, a measure of the value of a product to consumers over and above
its price. Hence, the figure is not comparable with measures of revenue or output, such as GDP.
0
50
100
150
200
2009 2010 2011 2012 2013 2014 2015
Num
ber
of c
onne
cted
dev
ices
(b
illio
ns)
Year of forecast
IntelEricssonCiscoGartnerIDCJuniper ResearchHammersmith Group

26 DIGITAL DISRUPTION: WHAT DO GOVERNMENTS NEED TO DO?
automobile and the telephone. Finally, diffusion curves largely focus on the consumer impact of new technologies. The transistor is considered by some to be the most important invention of the 20th century (Gaudin 2007), but it appears in a wide variety of products, each of which had their own adoption pathway. For this reason, building diffusion curves for intermediate technologies is challenging.
And what of improvements in technologies as they diffuse? Some, such as household electrification,5 have remained virtually unchanged since their adoption, while others, such as computers, have undergone rapid progress. To some extent, this aspect is captured by distinguishing between infrastructure and devices, as infrastructure tends to change slowly and often incrementally while devices can progress rapidly. However, the internet is again atypical in this regard — the introduction of ADSL technology allowed much faster data transmission through the copper telephone network than could previously be achieved through dial-up access.
Business and government uptake
Australian firms, in general, lag households in their adoption of new technology. While only a partial indicator of technological penetration (because the internet is only one form of digital technology), the use of the internet by Australian firms has also lagged that of households. While the proportion of businesses and households with internet access is comparable (ACMA 2015), in 2013 only around 30 per cent of Australian businesses took orders from consumers over the internet (Webster 2015). Around half place orders with suppliers, but just under 20 per cent have formal ordering processes or online payment facilities (Webster 2015). In 2014, Australia was ranked 14th in the OECD for the proportion of the population using the internet (above average) but 20th in the OECD for the proportion of businesses with a website or homepage (below average) (OECD 2015a, 2016b).
Within the OECD, the pattern of adoption of ICT by businesses has been relatively consistent between different types of ICT (figure 1.6). Generally speaking, cross country differences emerge during the early to mid-stage of the adoption process, but convergence occurs as the technology becomes widespread.
As with businesses, Australian governments have been slow in their uptake and usage of digital technologies. Only around 60 per cent of Australian federal and state government consumer transactions are completed using digital channels. Deloitte Access Economics (2015a) estimate that increasing this to 80 per cent over a ten year period would cost around $6.1 billion, but yield a benefit to government of around $17.9 billion and a benefit of $8.7 billion to consumers in present value terms (a net benefit of $20.5 billion). The United Nations E-Government Survey’s (2014) E-Government Development Index takes 5 Electricity voltage and frequency remain largely the same, but there have been major advances in
production efficiency, safety, sources of generation, and network architecture.

DIGITAL AND DISRUPTIVE 27
into account the availability of online services, human capacity to use these services and telecommunications infrastructure. The index places Australia 2nd in the world, but this high ranking is a result of good performance in the human capacity criteria (2nd). Australia scores 9th in online service delivery and 14th in telecommunications infrastructure.
Figure 1.6 The diffusion of ICT and associated activities throughout
businessesa
OECD countries, 2014
a Businesses with 10 or more employees.
Source: OECD (2015a).
1.4 The economic impact of new technologies
A framework for growth and technological change
New inventions require market demand to become innovations that are capable of being disruptive. And while preferences change over time, many do not change quickly. The overall effect on an economy also depends on how the collective changes flow through to income growth and demand, which then drives further investment. Changes in production technologies affect the relative demand for different types of labour which can lead to changes in relative wages. But improvements in productivity (reducing the unit cost of production) allow for increases in absolute wages as well as profits (return on capital). This increase in income raises demand, which, although demand increases more for some
0
20
40
60
80
100
Prop
ortio
n of
bus
ines
ses
usin
g te
chno
logy
(per
cen
t)
Minimum/Maximum 1st/3rd quartiles Mean

28 DIGITAL DISRUPTION: WHAT DO GOVERNMENTS NEED TO DO?
products (and workers) more than others, creates a virtuous cycle by attracting capital, creating new jobs and boosting income. To the extent that Australian firms improve their productivity faster than competitors overseas, they can expand their markets, which contributes to a virtuous cycle. It is the combination of all these technologically-induced changes that determine the economy-wide impacts of technological advances. Figure 1.7 summarises these interactions.
What may be novel in this model of technical progress is the role of digital technologies in bringing new resources into the economy. This includes the role of data, which is both an input into and an output of new technologies and is a growing resource. It also includes the use of underutilised assets (particularly those of households) into production. Like electrification, which freed labour from household production to allow greater market production, digital technologies allow more workers to participate in the market economy. Digital platforms allow workers to combine the use of personal assets with their labour (for example, as Uber drivers, boat crews, and Airbnb hosts). Just as containerisation transformed international trade by lowering the cost of trade between countries, digital technologies remove a major cost barrier to trade between (previously unconnected) individuals. (Chapter 2 discusses the extent to which the sharing economy represents an increase in utilisation rather than simply an alternative means of engagement in the market place.)
Figure 1.7 How new technologies drive growth
A stylised framework

DIGITAL AND DISRUPTIVE 29
New technologies and productivity growth
Periods of rapid technical progress may be associated with accelerated productivity growth. However, this impact may be realised after a delay, potentially because the co-existence of new and old technologies can act to the detriment of each system’s performance (David 1990), or because the costs of disruption may offset the gains for early adopters. The lag can be substantial. This is evident in the second industrial revolution, where the upswing in multi-factor productivity (MFP) growth beginning in the 1920s through to the 1970s is related to the introduction of enabling technologies such as electricity, the internal combustion engine and the telephone (Gordon 2015). The third industrial revolution looks like a weaker affair, with MFP growth markedly slower after the 1970s (figure 1.8).6
Figure 1.8 Today’s productivity growth is low by historical standards
US annual MFP Growth
Source: Gordon (2015).
Although ICTs emerged in the mid-1970s, there was little evidence of their impact on productivity growth in the United States until the mid-1990s — leading Solow (1987, p. 36) to quip ‘You can see the computer age everywhere but in the productivity statistics’.
6 There are problems with examining productivity growth by decades. Ideally, productivity growth is
measured across cycles (peak to peak or trough to trough) as utilisation of production capacity and labour is sensitive to the business cycle. Hence, if decades start and end at very different points on the cycle then decadal measures can be highly misleading (Barnes et al. 2013). Nevertheless, the period of strong productivity growth between the post-war mid 1930s and pre-oil crisis mid 1970s is clear.
1890-2014 Average
0
0.5
1
1.5
2
2.5
3
3.5
4
1900 1910 1920 1930 1940 1950 1960 1970 1980 1990 2000 2014
Annu
al M
FP g
row
th (
per
cent
)

30 DIGITAL DISRUPTION: WHAT DO GOVERNMENTS NEED TO DO?
However, when looking at productivity cycles rather than decades, Australia experienced a surge in productivity growth in the 1990s, the US from the mid-1990s to early 2000s, while for Europe, if they had a period of strong productivity growth, this was in the 1980s more than 1990s (figure 1.9). For Australia, major policy reforms (opening of the economy, privatisation, and National Competition Policy) played a major role, but ICT has been estimated to have contributed around one to two tenths of the total acceleration (PC 2004). There is some evidence that the contribution of ICT to the US productivity growth was more substantial, as labour productivity in the ICT-using market sector accelerated by 3.5 per cent per annum in the United States, between the periods 1990–1995 and 1995–2001 (Draca, Sadun and van Reenen 2007). Clearly the effect of ICT was not ubiquitous as labour productivity in the ICT-using market sector decelerated by 0.1 per cent in Europe in the same period. Some argue that the differences arose from greater capacity in US than European businesses to change their business models to take advantage of improvements in ICT. However, empirical attribution of productivity growth to particular sources is a difficult task.7
Views differ as to whether ICT can continue to deliver productivity gains. Optimists argue that the ICT transformation still has a long way to run (Brynjolfsson and McAfee 2012) and that forthcoming advances in semiconductor technologies may herald a resurgence in productivity growth (Bryne, Oliner and Sichel 2013). Some have attributed the productivity slowdown to measurement error, although Bryne, Fernald and Reinsdorf (2016) found no evidence that such errors have worsened since the 1990s. However, as well as questioning the extent to which ICT was the source of the 1990s boom, Gordon (2015) notes that price to performance ratios of ICTs were abnormally low in this period and have risen over the past 15 years, suggesting a diminishing productivity impact.
7 As Draca, Sadun and van Reenen (2007) note in their meta-analysis of a large number of empirical
studies that sought to estimate the productivity impact of ICTs, causality is difficult to establish, and empirical work faces problems with the measurement of ICT investment.

DIGITAL AND DISRUPTIVE 31
Figure 1.9 Productivity growth in Australia, the United States and
Europe Annual growth, per cent
Australia
United States
Europea,b
a No data available after 2008 and no MFP available prior to 1982. b Austria, Belgium, Denmark, Spain, Finland, France, Germany, Italy, Netherlands and the United Kingdom.
Sources: ABS (Estimates of Industry Multifactor Productivity, 2013-14, Cat. no. 5260.0.55.002); EU KLEMS database; US Bureau of Labor Statistics database.
-5
-2.5
0
2.5
5
1974-75 1984-85 1994-95 2004-05
-5
-2.5
0
2.5
5
1974-75 1984-85 1994-95 2004-05
-5
-2.5
0
2.5
5
1974-75 1984-85 1994-95 2004-05
Labour productivity Multifactor productivity
32 DIGITAL DISRUPTION: WHAT DO GOVERNMENTS NEED TO DO?
1.5 What role does government play?
Governments have three main policy tools — they regulate, tax and spend. Their formulation and implementation of these policy levers shapes how, and whether, markets develop, adopt and diffuse new technologies. Governments play a major role in setting the frameworks within which markets operate, through broad regulation such as competition policy and consumer law, and through specific legislation that governs the conduct of particular activities, firms, industries or workers (North 1991). Government procurement and investment can directly drive the development of certain technologies over others, while taxes, subsidies and transfers can incentivise firms and consumers to develop and/or adopt new technologies and to adapt as they become widespread.
Policies can have unintended outcomes, and lobbying can bias policy to favour some technologies over others. It is important for governments to be aware of vested and conflicting interests and to anticipate how a policy will influence decisions and incentives in practice. Where this is not clear, policy trials or real-time evaluations are advised, so that policies that may generate poor outcomes can be avoided, adjusted or quickly reversed.
This study considers how the key roles of governments need to change, if at all, to better respond to disruptive technologies. These roles are as:
• a regulator of the frameworks in which firms and markets operate, pertaining to issues such as market power and information provision to consumers
• an enabler of new technology development and adoption — establishing public infrastructure, setting standards to ensure interoperability between technologies, and investing in education and training to ensure the workforce is appropriately skilled
• a mitigator of risks — smoothing the structural adjustment process for workers and firms by ensuring the social safety net evolves with changing work practices, and safeguarding individuals’ privacy and security
• a producer of public services for the community.
These roles are reflected in figure 1.10.

DIGITAL AND DISRUPTIVE 33
Figure 1.10 Digital technologies and the roles of governments


MARKETS AND COMPETITION 35
2 Markets and competition
Key points • The distinction between industries that make things and those that provide services is
diminishing. More of the value added in a product is coming from the pre and post production phases of R&D and design, marketing and after sales service.
• While many digital technologies have been able to expand by using existing infrastructure (such as the internet using the copper telephone lines), investment in infrastructure is important to support adoption of some digital technologies.
– Broadband communication is critical, but so are sensor and communication systems that support interoperability of technologies.
• Digital technologies can reduce the physical capital requirements of firms and change the scope of activities performed within the firm by: – using digital information transported by the internet instead of embodied in tangible goods
such as books and CDs, which require manufacturing and physical transportation – allowing firms to outsource more elements of production – changing the role of scale in production, with more tailored production technologies
supporting shorter and more responsive production runs – increasing the share of intangible to tangible capital in production – creating more distributed and highly valuable networks.
• While digital technologies can boost competition, control over networks and data can pose a barrier to entry for new firms. However, access to networks and data can also allow existing firms to compete in new product markets.
• Digital platforms support distributed production, including through the so-called sharing economy, which brings household and other non-market resources into the market economy. This increases the utilisation of assets, improving the overall efficiency of the economy but undermining some traditional markets.
– Social media and aggregator websites are increasing consumer access to information on the quality of products and the firms that supply them. This enhances their ability to impose market discipline on poor performers, reducing the need for regulatory approaches to consumer protection. Some regulation to ensure information quality may be required.
• Innovation in, and adoption of, digital technologies should drive productivity growth, but some firms may struggle to monetise their innovations. Improvements in quality often boost consumer surplus more than firm profits. Low marginal costs of production and market power from networks and data can see a winner-take-all outcome in digital services.
• While only one factor among many, digital technologies could contribute to the widening distribution of income, which can affect the overall level of demand if firms fail to invest. Such a vicious cycle would hamper the prospects for widespread productivity growth.

36 DIGITAL DISRUPTION: WHAT DO GOVERNMENTS NEED TO DO?
This chapter examines the effect of digital technology on the structure, conduct and performance of firms. It seeks to answer four questions: • Is digitisation fundamentally changing what is produced and how it is produced? • What might firms look like in the future? • How is the nature of competition changing? • To what degree will digital technologies boost productivity growth?
Many analyses of the impact of technology look at how specific technologies will produce new products or change production processes, and draw implications for the effects on product markets. This chapter draws on this approach across the four areas of technological advance discussed in four case studies undertaken for this report on digital platforms, advanced manufacturing, energy and transport. Yet the net effect of any technology on product markets will depend on how it fits into the broader system of production and consumption. Hence, this chapter begins by looking at this broader impact on the structure of the economy (section 2.1), before returning to look at the implications for the structure of firms (section 2.2), their conduct (section 2.3), and their performance (section 2.4).
2.1 Impacts on the structure of the economy
Chapter 1 outlined five ways in which digital technologies could disrupt the economy: through increasing the scope to combine technologies and goods and services into new products; the growing contribution of data and networks to value adding; by the automation of many tasks with robotics and artificial intelligence (AI); supporting new business models; and greater use of non-market, including household, assets (the sharing economy). At a broad level, these disruptive trends are accelerating the shift in economic activity towards services. The pace of change depends in large part on access to supporting communication and other infrastructure. Ultimately, the economic impact depends on whether digital technologies can drive a virtuous cycle of productivity gains, income growth and demand. This section looks at these issues.
A shift toward services
Services make up almost 70 per cent of Australian production (GDP), and 65 per cent of household consumption (figure 2.1).8 While the share of services in GDP has increased by 8 percentage points over the past three decades (up from 62 per cent in 1984) (figure 2.1), the share of services in household consumption has risen faster (up from 53 per cent in 1984 to 65 per cent in 2014 (Kent 2015)). Services account for an even larger share of total employment — almost 80 per cent of all employed persons in 2015, up from 76 per cent in 1984, and 58 per cent in 1973 (PC 2015a; SCEFPA 2007). This partly reflects the higher 8 Owner occupied housing makes up a substantial share of household consumption, but is not included as
production by a service industry.

MARKETS AND COMPETITION 37
labour-intensity of service industries compared with other industries, such as agriculture, mining and manufacturing.
Figure 2.1 Services industries are increasing as a proportion of GDP and
employmenta
a Services are defined as all industries except Agriculture, forestry and fishing, Mining, and Manufacturing.
Source: Productivity Commission estimates based on ABS (Australian National Accounts: National Income, Expenditure and Product, Dec 2015, Cat. no. 5206.0).
The relative decline in employment and activity in agriculture and manufacturing and rise in services is common across developed economies. It has been driven by:
• more rapid growth in productivity in agriculture and manufacturing than in services, which frees people to work in other industries
• the higher responsiveness of demand for discretionary services to rising income levels. For example, household expenditure on arts and recreation increased from 3.8 per cent to 5.2 per cent of household expenditure in the 30 years from 1984 (Kent 2015)
• the growth in international trade, as the lower cost of labour (and in some cases less stringent environmental and other regulatory requirements) in developing countries reduces the competitiveness of manufacturing in developed countries.
It is likely that digital technologies will accelerate this shift to services. Services are increasingly embodied in the manufacturing process, referred to as the ‘servicification’ of manufacturing (CEDA 2014). The concept of manufacturing continues to broaden beyond the factory floor and into the entire value chain (appendix C). In particular, pre- and post- production activities, such as research and development (R&D), and marketing and customer service, are generating more of the added value. Customisation adds value for consumers. For example, Shoes of Prey is an online women’s shoe manufacturer that

38 DIGITAL DISRUPTION: WHAT DO GOVERNMENTS NEED TO DO?
allows customers to design their own shoes. Customers can see and feel samples of different fabrics and leather, colours, designs of heels, and trimmings at the firm’s ‘retail presence’ within large department stores (Stafford 2013). For products such as music, movies and books, significant market share is now delivered in digital format via the internet. The range of choice, speed of delivery, and the additional information to guide choice, all add service components to what had previously been a physical product.
This pattern of a declining share of total value added coming from the more capital intensive ‘production’ phase of the value chain while the more service intensive elements of the value chain rise is referred to as the deepening ‘smile’ (figure 2.2). Advanced manufacturing techniques, such as 3-D printing, which enable more customised, smaller production runs, contribute to this trend. However, this is not to say that the share of production value added will decline significantly for all manufactured goods. For example, it is likely to remain high for transport equipment and other major engineering equipment (such as fast trains, aircraft, milling machines and tunnel borers).
Figure 2.2 The evolution of the value chain in production
The deepening ‘smile’
Source: Veugelers (2013), figure 16, p. 27.
Better information — from the collection, storage and analysis of data — is a major contributor to servicification of manufacturing. But it also directly leads to better products and processes in all industries. For example, information about the growth potential of

MARKETS AND COMPETITION 39
each square metre of agricultural land can be gathered during soil preparation, seeding, weed control, and harvesting, which can reduce the inputs required for production. The software that allows this is a service, even if embedded in a tractor. Data, or rather the information service it supports, is also a final consumption product. People use a range of internet-based platforms to inform their consumption choices — over restaurants, places to stay, shows to see and so on. Data is a valuable resource, with data brokers (such as Acxiom) offering to turn data into services, such as targeted advertising and market analysis.
Servicification, and the expansion of the service sector more generally, have a number of implications for the structure of the economy. These include less need for scale in fixed capital, greater need for design and other intangible capital inputs, and changes in the skill mix required. Servicification also has implications for measurement. The output of services is more difficult to measure than the output of manufacturing or agriculture, as quality differences are less easy to assess (Bean 2016). As adoption of digital technologies increases, such measurement challenges are likely to further test the ability of the National Accounts to reflect what is going on in the economy.
FINDING 2.1
The distinction between services and manufacturing is declining, with design and pre and post sales service parts of the production cycle becoming increasingly important sources of value added. This has implications for: • the importance of scale in production • the types of capital firms need • how much work happens within the firm and how much is outsourced • the types of jobs that will be created and replaced • the dynamics of the business cycle.
It also has implications for the National Accounts, including adjusting for changes in quality, and the long term comparability of industry classifications.
Communication infrastructure underpins the rate of digital transformation
The diffusion of digital technology through an economy is more rapid when the underlying infrastructure is in place, making diffusion over years rather than decades possible. The rapid takeup of the smart phone was underpinned by existing internet infrastructure, and the ease of diffusion of software which, unlike hardware, can be easily and often remotely upgraded (Williamson et al. 2015). Marr (2016) estimates that there will be 6.1 billion smartphones and over 50 billion smart connected devices by 2020 and, although other projections for the internet of things are around half this (chapter 1), it is still a major change in product functionality.

40 DIGITAL DISRUPTION: WHAT DO GOVERNMENTS NEED TO DO?
Where new products are delivered digitally or require wireless connection, the pace of change is dependent on the accessibility, speed, and reliability of communication infrastructure. For example, distributed computing (sharing computational tasks out to many computers, as Google does to answer search inquiries) relies on the network of servers connected by the internet (the cloud). The pace of adoption also depends on firms’ ability and willingness to adjust. This is affected by the extent of competition in any part of the market and the access that firms have to the infrastructure that supports digital communication — connectivity is key.
The question of the ‘digital divide’ — differential access to the internet — has most commonly been raised in relation to social impacts (for example, Barr 2014; Norris 2001). But it also can have impacts on firms and industries. The OECD (2016c), for example, points to the lower uptake of digital technologies by smaller firms, noting that while access to technology has increased, they ‘lack the skills to effectively use ICT’ (p. 53). ICT access alone, without effective skills to use it, does not deliver economic benefits:
The access dimension of ICT has no effect on per capita GDP, labour productivity and employment (with the only exception of employment in services where it has a positive impact). ICT empowerment matters for per capita GDP and job creation (aggregate and in the two macro sectors of manufacturing and services) but not for labour productivity. (Evangelista and Guerrieri 2014, p. 25)
Location can also be a barrier to diffusion. Greenstein and Prince (2007) found some differences in access to the internet between urban and rural areas in the United States. What was interesting was that these differences were small, largely because the internet has been able to use the existing, widespread, fixed line network.
Internet infrastructure grew because it is malleable, not because it is technically perfect. It is better thought of as a cheap retrofit on the top of existing communications infrastructure. No single solution was right for every situation, but a TCP/IP solution could be found in most places. The US telephone system provided a fertile ground because [its] backbone used existing infrastructure when possible. What existing infrastructure will the next generation of Internet use? (Greenstein and Prince 2007, p. 189)
There has been a major shift in ICT infrastructure that facilitates the further development of digital technologies (Melody 2007). This is a shift from a vertically integrated structure where firms provided the poles and wires, and satellites and towers, along with the network management and the communication services, to a horizontal structure, where providers specialise in one of the layers (figure 2.3). The development of the internet protocol is at the heart of this change, as it breaks the nexus between owning the infrastructure (layer 1) and managing the network (layer 2). This then allows a greater diversity of players in the provision of communication services (layer 3), and in information content services (layer 4). Competition in these last two layers is delivering a much greater diversity of services to consumers.
It should be noted that protocols and standards for routing and service quality play a pivotal role, which means that governments can have considerable impact on the nature of

MARKETS AND COMPETITION 41
the market. It also means that international agreements matter for the connectivity of communication systems. These issues are discussed in chapter 4.
Figure 2.3 Communication infrastructure and markets
From vertical to horizontal markets
Source: Melody (2007), figure 3.1, p. 61.
Does Australia’s communication infrastructure support expansion of digital technologies?
Digital technologies work best when diffused across the whole economy. Katz (2014) listed the requirements as: • affordable — so that it is scalable • ubiquitous — reaching most of the population • accessible by both fixed and mobile technology • reliable and able to deliver digital content at speed.
Australia has scored well in an index of 25 indicators against these four requirements for digital technologies to work well (Katz, Koutroumpis and Callorda 2014). However, it has clearly fallen back in recent years (figure 2.4).

42 DIGITAL DISRUPTION: WHAT DO GOVERNMENTS NEED TO DO?
Figure 2.4 Digitisation index, selected industrial countries
1995 to 2011
Source: Katz et al. (2014), figure 2, p. 36.
Consistent with this decline, a number of commentators have raised concerns about the ability to fully harness the value of digital technologies with the current Australian infrastructure. Akami Technologies ‘State of the Internet’ report (Akami 2015) found that in terms of broadband speed Australia ranks in the bottom third of the 107 countries in the study, due in large part to much slower growth than other countries. Akami predicts an improvement with the completion of the National Broadband Network, reporting that ‘in 2020 roughly 38 per cent of Australian homes are expected to have [download] access at speeds of 25 to 500 Mbps’ (p. 34). While this may lift Australia’s ranking in terms of access, it still requires firms to have the capabilities to use the available infrastructure. As discussed in chapter 1, many Australian firms are slow adopters of digital technologies.
What other infrastructure is required to support digital technologies?
Some technologies can require additional infrastructure before they can be adopted. Self-driving cars, for example, may be limited to areas that have particular road conditions and markings (box 2.1). Distributed electricity systems require meters that can record and control the input from the grid into a premise and the output from the premise into the grid (appendix E).

MARKETS AND COMPETITION 43
Box 2.1 Infrastructure technology needed for autonomous vehicles There is a range of potential technology and design features that may need to be embedded in infrastructure to facilitate the adoption of autonomous and connected vehicle operations.
The progression of the adoption of autonomous technologies will in part be path dependent on the availability of suitable infrastructure and the regulations in place governing how it is to be used. However, generally there is a need for infrastructure providers to consider the following:
• Wireless connectivity. Autonomous vehicle functions depend on a range of wireless communications for their operation, including the global positioning system (GPS), wireless internet and short-range vehicle-to-vehicle (V2V) and vehicle-to-infrastructure (V2I) communications.
– Issues that need to be addressed in developing infrastructure include: interference with GPS signals (such as in tunnels); lack of mobile internet coverage along roadways (such as in regional areas); the allocation of spectrum for V2V and V2I purposes; and the installation of physical infrastructure for V2I communications, such as cabling and transmitters.
– While single autonomous vehicles can operate using their own sensors, fully automated driving systems will require the continuous transmission of large streams of data to coordinate traffic and optimise road usage. Such a system would require communication infrastructure to have sufficient coverage, capacity and reliability.
• Road markings and design. Changes may also be required to the physical characteristics of roads, such as geometry, lane widths, lane markings and road side barriers, and traffic signalling and intersection design.
– Auto-steering functions and lane-departure warning systems (already available on some vehicles) use sensors to monitor that the vehicle is within its lane. However, the lack of line markings, or line markings that do not meet a certain standard, may inhibit where these functions can be used.
– One of the key limitations identified with autonomous vehicle operation is the interaction with conventional vehicles, particularly at intersections and merging lanes. This impediment could lead to the use of dedicated lanes for vehicles operating in autonomous mode, most likely on highways, where autonomous driving could alleviate risks associated with driver fatigue. Truck platooning lanes on highways is a potential initial development of this conditional automation. Infrastructure planners should consider the planning for this potential ‘duplication’ of infrastructure.
• Sensors. There is already a range of sensors in use, including speed and red light cameras, tolling sensors, traffic light sensors, and weigh-in-motion sensors for heavy vehicle monitoring. Some of these are embedded into road surfaces, while others are mounted along roadsides or on gantries over lanes. Increased use of autonomous vehicles and cooperative intelligent transport systems is likely to require substantially greater installation of various types of sensors.
Source: Appendix D.
There will always be uncertainty about infrastructure requirements because the timing and exact nature of the infrastructure needed to support adoption of new technologies will vary with the technology and general market conditions. In some respects, this is a chicken and

44 DIGITAL DISRUPTION: WHAT DO GOVERNMENTS NEED TO DO?
egg issue. An overarching framework that sets out how infrastructure providers make their investment decisions would assist firms developing new technologies, such as autonomous vehicles and distributed power. This should include clarity on the regulatory framework that will apply and interoperability standards. It should also flag areas of future investment that would link to, or otherwise affect, the infrastructure being proposed. For example, distributed energy networks where electricity is generated and purchased locally can require a regulatory system that is different from the current regulations which are based around a monopoly transmission system (appendix E). A commitment to a regulatory system that supports the distributed model may be needed before such a system can fully develop.
FINDING 2.2
Clarity in how and when infrastructure investment decisions will be made assists firms that are developing and adapting new technologies. Uncertainty around future technology and infrastructure needs is not a reason for inaction by governments — the costs of inaction, in terms of slower diffusion in technology, can be widespread and significant.
Broader implications for the economy
The effect of digital technologies on the economy depends on the extent and speed of changes in the: • product mix — as some existing products are replaced by new products • number, age and size of firms — as some existing firms are displaced by new entrants
and others evolve to take advantage of opportunities • demand for labour — as automation replaces some jobs and reduces the need for
others, new jobs emerge, and as the skills needed change.
There has been much excitement (particularly from management consultants, such as McKinsey Global Institute (2013) and Boston Consulting Group (Evans and Forth 2015)) about the opportunities offered by the digital economy. PwC (2014) estimates that ‘an ecosystem based on innovation and digital technologies’ can raise Australia’s GDP by $37 billion in 2024 and $136 billion in 2034, creating 540 000 jobs. However, it is unclear what assumptions are being made in generating these predictions, whether they are discounted, and whether the estimates account for the degree to which digital technologies crowd out other parts of the economy. To date, there is little evidence that digital disruption has had any significant economy-wide impacts. Rather there has been a gradual trend toward: • growth in the share of services in consumption and in digital-reliant products in this
service mix (see above) • a decline in the average number of employees per firm (see below)

MARKETS AND COMPETITION 45
• polarised growth in the demand for labour, reflected in wage stagnation for medium and lower-skilled workers and wages growth for high-skilled workers, and in slower growth in hours worked than in potential labour supply (chapter 3).
These trends are more evident in the United States than in Australia. The sustained and unprecedented rise in commodity prices and associated investment boom in Australia, which peaked in 2012, may well have delayed the emergence of these trends.
Somewhat surprisingly, the view that digital technologies favour start-ups is not consistent with the evidence that the average age of firms in the United States is increasing. Hathway and Litan (2014) found that in the United States the share of firms over 16 years of age rose from 23 per cent in 1992 to 34 per cent in 2011. They suggest that the prominence given to digital start-ups reflects hype more than evidence, and that if anything the United States economy is getting less rather than more entrepreneurial. In Australia, the rate of innovative start-ups is very low (PC 2015b).
In any case, digital technologies affect the broader economy through more than entrepreneurial forces. They can also change labour demand (chapter 3) and, as discussed below, the role of capital. Some economists (for example, Brynjolfsson, McAfee and Spence 2014; Haldane 2015) have raised concerns about the impact of these trends on the distribution of wage income between workers, labour’s share of income, and the distribution of work (labour market participation, unemployment and underemployment). This may be relevant because the growth and distribution of income affects the patterns of demand and the investment in skills that support a market economy (OECD 2016c). This may hamper the positive linkages between productivity growth and the growth in income and demand that absorbs the labour replaced by labour saving technologies (chapter 1, figure 1.7).
These factors may have contributed to the sustained low growth in demand feeding into low investment in the United States. However, other factors behind the low investment (relative to global savings), such as population ageing, precautionary savings, and exchange rate policies, may be playing a greater role (Summers 2015).9 Moreover, Australia has not experienced chronically weak aggregate demand, notwithstanding many technology shocks being common to Australia and the United States.
For the moment at least, optimism about the productivity benefits of technology is a more realistic stance. Nevertheless, it is sensible to continue to critically assess any dynamic
9 Summers (2015) resurrected the term secular stagnation for this phenomenon. This sparked off
considerable debate about whether the US economy would recover through the usual adjustment processes of low interest rates (and falling prices for underutilised resources) stimulating investment, or whether the lower bound of a zero nominal interest rate would hamper this adjustment mechanism and the efficacy of monetary policy (Teulings and Baldwin 2014). That is, whether the real interest rate required to equate savings and investment with full employment is negative. Estimates by Hamilton et al. (2016), suggest that this rate is likely to be positive, but lower than it has been for much of the past.

46 DIGITAL DISRUPTION: WHAT DO GOVERNMENTS NEED TO DO?
between aggregate demand, technology change, asset accumulation and income distribution.
Implications for inflation and policy tools
A little bit of inflation is a very useful thing in an economy. As prices tend to be sticky downwards, inflation facilitates the change in relative prices needed to clear factor and product markets. It erodes the exchange value of debt, assisting firms and governments at the expense of households who fund the debt. As most debt is held by higher income households, inflation acts as a progressive ‘tax’. One aspect of digital technology appears to be that it puts downward pressure on prices through:
• replacing market products with ‘free’ products (data is provided in exchange)
• increasing price competition, so higher quality products are delivered at the same or a lower price — raising real GDP (although this may not be measured well), but not nominal GDP
• any downward pressures on aggregate demand (to the extent that the income distribution effects set out above have validity).
This has implications for accurate measurement of inflation, and hence the measurement of growth in real GDP. To the extent that digital technologies are delivering unmeasured improvements in quality and increasing the share of production that occurs outside the market economy (as with open source), productivity growth could be higher than suggested by the national accounts (Bean 2016). While a good outcome for households, for governments it means lower tax revenues (as nominal GDP growth is slower), while very low inflation (or deflation) reduces the scope for effective monetary policy.
2.2 Market structures
Market structures depend on the scale and business model of firms in the market. Digital technologies could be disrupting the structure of markets in at least three ways:
• By reducing transactions costs in outsourcing across all parts of the value chain, from R&D to distribution, digital technologies are allowing firms to act more like organising agents, changing their structure.
• Digital technologies are changing the role of networks, which can provide a different source of market power, and affect the value of clustering for firms.
• Digital platforms are enabling household production using household assets to enter the market economy, and greater sharing of non-market assets such as research facilities and public equipment.
MARKETS AND COMPETITION 47
The structure of the firm
Digital technologies offer firms the opportunity to improve their business models as well as their products and production technologies. Indeed, some argue that digital technologies will be most disruptive where they change business models, as they allow firms to exploit old technologies in new ways (Hershan 2015). McKinsey and Company claim:
… business models are less durable than they used to be. The basic rules of the game for creating and capturing economic value were once fixed in place for years, even decades, as companies tried to execute the same business models better than their competitors did. But now, business models are subject to rapid displacement, disruption, and, in extreme cases, outright destruction. (de Jong and van Dijk 2015)
Since there has been an ongoing management literature advocating new business models for decades, this exuberance may be somewhat misplaced. Nevertheless, that does not repudiate the notion that digital technologies may lead to further evolution in the ways firms undertake their activities.
On the demand side, firms have new mechanisms to strengthen customer loyalty and increase demand for their products. These provide:
• consumers with an easier capacity to review the quality of service provision or the product they are purchasing (reflecting the low transactions costs of digitally-enabled transfers of information). Not only does this provide firms with information they can use for business improvement, but it recognises that consumer empowerment is now a service in its own right — people value ‘having a say’
• a capacity to aggregate consumer ratings of products to provide a credible signal of the firm’s quality (as in eBay ratings)
• easier scope for loyalty programs and customer-tailored rewards based on the customer’s specific consumption patterns
• the potential to keep consumers informed about new product lines of specific interest to them.
On the supply side, digital technologies have led to two major changes (explored further below):
• lowering transaction costs, allowing firms to outsource inputs only when needed, rather than seeking to own labour and capital assets. This lowers costs and increases flexibility
• shifting investment toward intangible capital — knowledge and skills — as the major assets of a firm.

48 DIGITAL DISRUPTION: WHAT DO GOVERNMENTS NEED TO DO?
Digital technologies allow firms to outsource more elements of production
Digital technologies allow firms to work as an organising platform (researching the market, designing and testing a product, manufacturing, sales, delivery, after-sales service, and sometimes disposal). Potentially firms could outsource all but coordination of these activities. For example, Ponoko is a New Zealand on-demand manufacturing firm producing tailored products according to client instructions, with 12 digital making centres operating in the United States, Europe, and New Zealand.
Supplying firms, including self-employed individuals, can in principle be located anywhere. Digital platforms (such as Freelancer and Mechanical Turk) provide matching services to assist firms find the right sources. These platforms allow a firm to post a task it needs done (such as code for a specific application), a set of skills it needs for a short-term assignment, or even a problem it needs to solve. Suppliers can bid for the work, or in the case of problem solving, an open source challenge can be used, motivated by a prize, or just the kudos of coming up with the best solution (which may lead to paid work).
These developments mean supply chains can become even more global. This is a continuation of a longer-term trend facilitated by declines in trade barriers and reductions in transport costs (containerisation was a major innovation). Information technology added to the trend, as improved communications made more jobs subject to offshoring (Blinder 2006). While there are always some goods and services that need to be produced close to where they are consumed (aged care, for example), many services can be produced anywhere — R&D can occur in California, data-analysis in India, marketing campaign design in Britain, and after-sales support in Vietnam. The shift of firm activity to pre and post-production may reverse some of the shift to low-wage countries as skill is often more important in these phases.
Employees can also be located around the world, providing firms with access to knowledge and skills in foreign countries — a source of collaboration for firms with global value chains. A global spread of employees could see an expansion of trade in services beyond digital delivery where employment and outsourcing arrangements facilitate service delivery into other countries’ markets. For example, a mix of remote and local delivery has expanded the opportunities for Australian universities to provide higher education in other countries. With a distributed production model, trade in services, and potentially goods, may not require the same physical presence in terms of significant invested capital in a country (as has been the case with much foreign direct investment). However, such developments may face behind-the-border barriers to trade. For example, it may be difficult for a firm to understand and meet the local requirements (for example, in relation to workplace relations and corporations law) in each country in which they have employees.
Trade agreements can help to address some of these barriers by improving consistency in requirements, such as product and labelling standards. Agreements on the movement of data across borders is one area that could be usefully addressed in trade agreements

MARKETS AND COMPETITION 49
(Head 2016). However, trade agreements can introduce other barriers. For example, bilateral and regional trade agreements often apply rules of origin in formulating tariffs or other market access requirements (PC 2010). Distributed production models can make it difficult to determine the value added in each country, which increases the transactions costs of applying rules of origin. The logical solution is to reduce the requirements, but changing parts of agreements without opening up other areas can be difficult.
More generally, digital technologies have made multilateral action to reduce barriers to trade in services even more important for economic growth prospects. The World Trade Organisation is promoting the development of a Trade in Services Agreement (TiSA), as the General Agreement on Trade in Services was developed in a world with no internet connection. Cross-border e-commerce and the flow of data are areas where governments have been imposing restrictions to assist local ICT firms and to protect privacy. This has raised concerns in the ICT industry that restrictions will preclude other solutions to privacy:
Any TiSA agreement that does not enact strong and enforceable measures against ‘data protectionism’, even one motivated by social policy goals like privacy, will not be a truly forward looking agreement. (Cory and Ezell 2016, p. 7)
FINDING 2.3
Digital technologies are allowing firms to outsource more of their production. This outsourcing is based on access to skills as much as low cost labour, offering greater opportunities to firms in high labour cost economies. Trade policy has been slow to adapt. Substantial increases in outsourcing across international borders may necessitate government attention to: • secure movement of data across borders • regulatory requirements for delivery of service exports in other countries • barriers to outsourcing imposed by differential treatment across industries and
products in bilateral and regional trade agreements and in behind-the-border policies
• workability of rules of origin with many disparate sources of inputs to production.
Digital technologies are increasing intangible’s share of firm assets
Knowledge is increasingly the main source of advantage for a firm, whether embedded in the firm’s organisational arrangements, software and systems, algorithms, or its employees. Building this knowledge requires investments in R&D, computers and software (in house development as well as purchased externally), learning by trial and error, training, and the collection, storage, curation and analysis of data. The resulting intangible capital includes intellectual property (IP), firm level knowledge, organisational processes, data resources, and reputation and associated goodwill (OECD 2013d). Although outsourcing of

50 DIGITAL DISRUPTION: WHAT DO GOVERNMENTS NEED TO DO?
knowledge inputs is increasing, some aspects of intangible capital — such as specialised skills and company knowledge — cannot easily be outsourced (The Economist 2013a).
A substantial share of intangible investment is not measured as investment by the firm, but rather as current expenditures. Some, such as software, also have a relatively high rate of depreciation, so estimating the trends in intangible capital is difficult (van Ark et al. 2009). Barnes and McClure (2009) found that investment in intangibles had grown at 1.3 times the rate of investment in tangible capital between 1974-75 and 2005-06, to make up almost half of the capital in Australia.10 Intangible capital has been estimated to make up around half of the capital stock in many developed countries (van Ark et al. 2009).
Implications for the structure of firms
These trends in outsourcing and intangible capital investment may see a lower share of economy-wide physical capital and employment in very large firms (see below). It also suggests that as digital technology enables entry of new firms the average age of firms will decline. Certainly the average age of the companies on the S&P 500 has fallen (figure 2.5), although, as mentioned earlier, overall the average age of firms in the United States has risen (Hathway and Litan 2014). In Australia the rate of firm setups and closures have both declined slightly in the past decade, although the rise in the number of firms would be consistent with the average age having fallen (PC 2015b). However, Department of Industry data suggests that the average age of firms may well be rising as the share of firms over six years of age has risen steady from 45 per cent in 2001-02 to 65 per cent in 2013-14 (Hendrickson, personal communication 3 June 2016).
10 This relative rate of growth may have declined in Australia as investment in physical capital accelerated
sharply between 2008 and 2012 with the mining investment boom. Undermeasurement of the growth in the capital stock will overstate measured productivity growth, but does not affect the estimates of GDP growth.

MARKETS AND COMPETITION 51
Figure 2.5 Average age of companies listed on the S&P 500
1960 to 2013, and projected to 2025
Source: Foster (2012), figure 1, p. 2.
Employment growth across most OECD countries appears to be concentrated more in young firms than in mature firms (Criscuolo, Gal and Menon 2015). Henrickson et al. (2015) examined the sources of employment growth in the Australian economy from 2006 to 2011, finding that the majority of jobs were created by young firms (figure 2.6). However, while new entries associated with digital transformation may partly contribute to these patterns, other factors unrelated to this are also likely to be at work:
• When incumbent firms ‘spin-off’ a section to create a new firm, this reduces their employment numbers while increasing those in the young firm category.
• New firms generally aspire to grow, but they disappear from the statistics if they get smaller. In addition, many young firms are in industries (for example personal services such as hairdressing), where digital technologies are not critical.
• New companies making initial public offerings have performed very poorly in job creation (in the United States at least). Of the 1600 businesses that went public from 2001 to 2014 in the United States, the median company grew its total employment by 51 people — trivial against the background of the US labour market (Davis 2015, p. 9).
• The size of some enterprises is inherently limited by the physical proximity of its customers (a fast food company, a cinema, petrol station and so on). Additional demand is met by new enterprises — including franchises, which are counted as new firms.

52 DIGITAL DISRUPTION: WHAT DO GOVERNMENTS NEED TO DO?
It is also important not to conflate where job creation occurs with the view that start-ups per se are drivers of equilibrium employment in an economy. If, for example, there were technological or regulatory constraints on new firms, established firms would continue to grow in size, with wages falling to the extent that the productivity of older firms was lower (which is certainly not clear cut).
Hence, attributing employment growth to innovative start-ups is fraught.
Figure 2.6 Contribution to employment growth by young and mature
firms 2001-2011
a Young firms are less than 6 years old.
Source: Hendrickson et al. (2015), figure 2.5, p. 11.
The decline in the number of American corporations listed on US stock markets from over 8000 in 1997 to less than 4500 in 2014 also reflects changes in business models (Davis 2015). Davis argues that falling transactions costs due to improvements in ICT, along with changes in consumer tastes (for more customised and boutique products) and declines in non-labour inputs, have contributed to a decline in vertical integration. The lower capital requirements mean that ‘going public is no longer an inevitable step for business’ (Davis 2015, p. 6), with more firms financed by private equity. This reduces the transparency of firms, as the reporting requirements of public companies are more stringent than those imposed on private companies.
-10
-5
0
5
10
15
Net
em
ploy
men
t gor
wth
con
trib
utio
n (p
er c
ent)
Incumbent Exit Entrant Total
Young
Mature

MARKETS AND COMPETITION 53
The network economy
Networks are ubiquitous in infrastructure such as transport, electricity and telecommunications. Digital technologies support the wider development of complex networks as they allow market participants to engage directly and in groups. Digital intermediaries play an important role in facilitating the development of networks, in a social context as well as for production.
Networks, along with data, are a defining characteristic of digital technologies and a key source of disruption. Tom Wheeler, the chairman of the US Federal Communications Commission argued:
It has been suggested that we are living through the greatest network revolution in history. On this the jury is still out. The reverse telescope of history makes prior experiences seem much smaller than they were. Each of the preceding changes enabled by print, transportation and electronic communication were destabilizing and redefining. We should expect nothing less today.
What is clear about our network revolution, however, is that the new information networks are the new economy. Whereas earlier networks enabled the economic activities of their eras, our network revolution defines virtually all aspects of the current economy. (Wheeler 2013, p. 1)
Wheeler identified three effects of digital networks:
• end of ‘tyranny of place’ — information comes to the user wherever they are rather than the user having to go to the source of information
• continual acceleration of the velocity at which information is utilised and transmitted electronically
• a reversal in the flow of activity from the central point to a more distributed model — networks as a ‘centrifugal force’ — decentralising economic and creative activity.
These effects should work to stimulate competition, but access to networks can also be used to restrict competition. Melody (2007) warns that market developments are delivering highly concentrated network oligopoly markets that can capture ‘the productivity gains from the new economy for themselves’ (p. 69). He argues that governments need to play an active role to ensure that the benefits of digital transformation are widespread:
If economies and societies are going through a transformation to a condition where information and knowledge take on increasing importance, and are provided over next generation networks, then presumably there will be a definable set of public information needs essential to the maintenance of participatory democracy. … A rich public information commons in the new electronic space will be essential if new knowledge economies are to be inclusive rather than exclusive and fragmented. How it is defined and developed will be determined by government policies. (pp. 70–71)

54 DIGITAL DISRUPTION: WHAT DO GOVERNMENTS NEED TO DO?
Physical co-location networks continue to matter
One of the conundrums of digital technologies is that while they enable distributed production models, the value of clustering of firms appears to have risen. Clustering is particularly evident in service-based production — finance in New York and London, high-tech in Israel, Silicon Valley and Berlin (Porter 1998, 2000; The Economist 2009b). So while supply chains may become more global, firms are likely to continue to cluster.
Unlike industries of mass production where access to physical infrastructure (such as ports and roads) could lead to clustering, the reasons revolve much more around the attractiveness of a deep talent and ideas pool. Physical proximity means that, while firms can be loath to lose highly skilled workers to nearby firms, they all benefit from a deeper labour market, as talented people are attracted to locations where there are a number of job opportunities.11 Hence, the firm’s investment in a worker is less likely to be lost to the cluster as a whole. Informal contacts that come with living in the same neighbourhoods also generate a broader ideas base that a firm can draw on. High tech clusters tend to locate around universities, and the two-way flow of workers between the university and private sector is generally seen as a way to promote innovative activity (Andes 2016).
This makes liveable cities that can attract high skilled workers an important component of any government’s innovation strategy. This issue is considered in chapter 4.
The sharing economy
The ‘sharing’ economy or as some prefer, the ‘access economy’, uses digital platforms to bring together owners of assets with those who want to consume them.12 These platforms enable an increase in the use of some assets — in particular non-market assets — which can improve the overall efficiency of the economy. In bringing more suppliers and consumers into a market (or creating a new market that competes with an existing market), the sharing economy also undermines some traditional markets, particularly those where firms have relied on restrictions to market entry (such as through licence caps or other regulatory requirements).
There are already platforms for sharing assets such as vehicles, machinery, tools, clothes and houses. The potential scale of activity is considerable. For example, it has been estimated that vehicles in the United States currently sit unused for an average 95 per cent of the time (Bates and Leibling 2012). For Australia, the Grattan Institute (2015) estimated
11 There was a major antitrust suit involving four large Silicon valley businesses (including Apple and
Google), in which they conspired not to hire workers from the other firms in order to reduce pressure on wages. This was settled out of court with substantial payments to affected workers (Musil 2015).
12 Sharing is somewhat of a misnomer as it is more about renting out assets or hiring labour. Some commentators, such as Blanchard (2015), object to the term sharing as they feel it gives the activity an unwarranted positive attribute.

MARKETS AND COMPETITION 55
that there are around 11.5 million spare bedrooms, representing $5 billion of foregone income if these rooms were rented out for 1.5 weeks per year. However, the extent to which households are interested in making their assets available is highly uncertain. People value privacy and social familiarity (not everyone wants strangers in the bathroom) and control over their assets (a clean car, driven responsibly). It is therefore important not to overstate the market prospects of household asset sharing.
Sharing of research infrastructure is also facilitated by digital technology. For example MIT has created ‘remote online laboratories’ where experiments can be run via the internet. Harvard has ‘eagle-I’, which is a directory where information and data and equipment can be listed for sharing (Berry 2016). In Australia, the Commonwealth Scientific and Industrial Research Organisation (CSIRO) additive manufacturing centre, Lab22, provides access to metal 3D printing — reducing the cost of capital investment and associated risk to firms (CSIRO 2016a). There is also scope for much greater sharing of assets, such as magnetic resonance imaging machines and specialist technical equipment, in both public and private hospitals (Schiller 2014).
These types of activity disrupt existing industries only where they compete with the current business models. This is the case for taxis with Uber and short-term accommodation with Airbnb. However, to the extent that the service offered is different, and cost structures and hence prices are lower, the activities can increase the level of market activity, rather than displace other services. For example, Deloitte Access Economics (2016) found that 61 per cent of UberX rides in Australia were new (in the sense that they would not have occurred in the absence of Uber), with 36 per cent induced by the differentiated service offering and 25 per cent due to the lower price (p. 22). On the other hand, analysis by The Economist found substitution for taxis to be the dominant outcome of Uber in New York, although it was still the case that Uber grew the market (The Economist 2015b).
In many cases, these new platforms are also used by existing market participants to improve their business models. For example some taxi drivers also drive for Uber, and many bed and breakfast accommodation providers and property owners who previously listed through real estate agents, now list on Airbnb. Issues arise when incumbents face a higher cost structure than the new entrants, not because these new entrants are using an existing asset, but because incumbents have to comply with regulations while the new entrants do not.
New entrants may face less regulation than incumbents
The Commission has long argued that regulation designed to restrict competition should be removed (Banks 2012). The taxi industry has been a particular target due to the restrictions on the number of licences issued in most states and territories. But the industry also has a wide range of regulatory requirements imposed with the objectives of ensuring passenger and driver safety. Incumbents were willing to bear the cost of these regulations because the restriction on entry meant that they could pass them onto customers through higher prices. With the sharing economy, new entrants may be free from restrictions that the traditional

56 DIGITAL DISRUPTION: WHAT DO GOVERNMENTS NEED TO DO?
industry face, such as requirements for taxis to install cameras, and for hotels to have disability-accessible rooms. So, in addition to removing the rationale for restricting entry, the sharing economy raises issues about ensuring a level playing field between the traditional industry players and the new entrants. Blanchard (2015), for example, pointed to the scope for new entrants to avoid taxes and regulations to the detriment of the public. The implications for regulation are considered in chapter 4.
FINDING 2.4
Digital platforms allow households and non-market organisations, such as research facilities, to engage more in the market economy by ‘sharing’ access to their under-utilised assets. This poses structural adjustment issues for industries that have traditionally faced little competition due to regulations, such as taxis and short-term accommodation. More effective utilisation of under-employed assets, whether market or non-market, is a positive economic outcome.
2.3 Conduct of firms and industry
The conduct of firms depends on the level of competition or contestability in an industry. This in turn is affected by:
• the cost of entry for new firms, which with digital technologies includes competitors from other industries and the household sector
• control over important assets, which with digital technologies are increasingly data, networks, and IP assets
• the power of consumers, which is affected by the extent of information, with digital technologies offering scope to reduce information asymmetries.
Lower physical capital requirements for entry
Digital technologies are changing the need for large physical capital inputs in many areas. Advanced manufacturing techniques, digital platforms, cloud storage, and a growing share of knowledge-based content in products, are reducing the physical capital needed to support production. For example, 3-D printing enables a significantly smaller scale for competitive production, and is part of the trend toward more distributed production (WIPO 2015).
Falling communication costs due to digital technologies also enable firms to rent the services of specialist providers, including for capital services such as data storage (in the cloud), as well as for technical skills. These features reduce the start-up capital requirements making entry easier for new firms, with scope to significantly increase

MARKETS AND COMPETITION 57
competition. Markets can also be more contestable as a firm’s customer base (data and/or network) can give them an advantage when moving into different markets.
Nevertheless, the production of many goods will continue to exhibit high capital intensity, strong economies of scale and centralised assembly (for example, the Tesla mega-factory). Moreover, the growth of digital giants such as Google, Apple, Microsoft, Amazon, and Facebook is testimony to the fact that businesses can still reap economies of scale, even if it is not necessarily through the deployment of concentrated physical capital (The Economist 2012). The exploitation of weightless capital, such as specialist knowledge, proprietary software paired with hardware, the creation of de facto industry standards (Android, iOS), and brand recognition are new sources of scale economies, while difficulties of moving from one technology to another can lock in customers (for example, for Gmail, Facebook and Microsoft Office users). Big is different, not dead.
And smaller workforces
Along with a lower share of tangible capital, many firms — even those with big asset valuations and outputs — are requiring less labour. As Davis (2015) noted: ‘It is possible to be radically tiny in employment, but still globally prominent and even dominant in one’s industry segment’ (p. 7). In the United States, employment in many large corporations fell after the 1960s following the adoption of new business models and competition from new businesses and product types. For instance, at its peak in 2005, the Blockbuster video rental chain had 80 000 employees in the United States — its digital successor, Netflix, has only 2200 employees (ibid p. 6).
The number of staff needed to provide location-specific services appears also to have fallen. Hathway and Litan (2014) found that while older firms were growing in size in the United States, the ratio of firm size to enterprise size (workplaces) grew consistently over the last decade, suggesting that firms expand by having more workplaces, but with fewer people in each location.
These patterns have yet to be observed in Australia. The share of private non-financial sector employment in small firms (those employing less than 20 employees) fell from 2007 to 2013 in Australia, while the shares for medium and large firms grew over this period (Nicholls and Orsmond 2015). More recent official data covering the period from 2008-09 to 2013–14 found that the employment shares of large firms (100+ employees) grew particularly strongly in mining, and private education and training services.13 Nevertheless, some behemoth firms in the Australian economy have shrunk with vertical and horizontal disintegration and competition (many formerly public utilities, including Telstra). As in the United States, businesses like Netflix and Stan have led to the virtual extinction of brick and mortar retail video outlets. As one commentator put it colourfully:
13 Based on ABS 2015, Australian Industry, 2013-14, Cat. no. 8155.0.

58 DIGITAL DISRUPTION: WHAT DO GOVERNMENTS NEED TO DO?
The DVD rental store, that cultural icon of nostalgia, romance and voyeurism, is leaving comparable victims of the internet – milk bars, music stores, broadsheet papers, travel agents and even post offices – in its wake. (Lewis 2015)
The same trend toward a reduction in firm size or workplaces in terms of employees may spread to other Australian businesses.
Market power in the control of data and networks
For many firms, data and the networks to collect and disseminate data are key to market success. For example, the internet of things (IoT) offers scope to collect an enormous amount of information, not just about the performance of a product, but about the behaviour of users. This data can be used to enhance the value of a product (box 2.2 and appendix C). But it can also be used to resist market entry and extract rents from customers.
Box 2.2 Trumpf manufacturing Trumpf, a manufacturing company from Stuttgart, Germany, is a provider of machine tools — essentially, they make things that make things. But they have also launched an online platform that connects machines built by both themselves and others, and use the data they collect to assist customers in organising their production – from automatically ordering materials when supplies are low to predicting when machines might need a spare part. Not only is this a valuable customer service – from which Trumpf can profit – but it also produces a stream of data that can be used to improve and innovate in Trumpf’s core business.
Source: The Economist (2015a).
Data and networks have characteristics that, in the words of Brynjolfsson, McAffee and Spence (2014), lead to ‘some weird and wonderful economics’. These are:
• both data and networks are non-rival in consumption — one person’s use does not prevent another from using the same resource, which is one characteristic of apublic good (the other being non-excludability)
• both data and networks grow with use — in comparison, physical capital depreciates with use. This makes data and networks more like human capital, which learns by doing
• the value adding potential of data and networks tends to rise with the volume of data and numbers of members of networks — giving advantages of scale
• data are non-fungible — one piece of data cannot be substituted for another as each carries different information
• data are experience goods — the value of information can only be revealed by knowing the information itself. But once this value has been revealed by data analytics, the

MARKETS AND COMPETITION 59
information can be shared at no or low cost (MIT Technology Review Custom and Oracle 2016).
Control can come in various forms. It can be ownership of the data generated by the business. The ASX, for example, controls the data it generates on stock exchange trades (box 2.3). Data kept in proprietary forms can also restrict usefulness even if notionally available to other users (Connolly 2016). In addition, some businesses are attempting to reduce openness through championing stronger protection of intellectual property (IP). Extension of copyright, low levels of inventiveness required for patents, and buying up of rivals can extend the control of firms over IP that reduces competition (The Economist 2016). The use of geoblocking is an example where geographic restrictions on digital access allow firms to price discriminate across markets, despite very similar costs of supply. The Commission’s draft report on Intellectual Property Arrangements has recommended that government make it clear that circumventing geoblocking technology is not an infringement of copyright, and that Australia should avoid international obligations that would preclude such practices (PC 2016b).
The high price earnings ratios for some firms (such as Google at 31 and Facebook at 78, compared with the long-run S&P average of 15)14 indicate an expectation of high future profits that can only be justified if the firms can find a way to monetise the information they collect.
Transaction data and ‘sensors’ (simply ways in which data are collected) can provide information from many disparate sources for central analysis and a wide range of applications. This has excited many management consultants, albeit in ways that have sometimes led to colourful but obscure descriptions. For example, Boston Consulting Group (Evans and Forth 2015), describe the opportunities offered as ‘a stacked ecosystem [that] blows up the classic trade-off between efficiency and innovation’ (p. 15).
Clearly, adding value to data will grow as the IoT expands and as firms increasingly manage and use their data holdings. Some of this value is from the insights about behavioural relationships, which can be useful for other firms and organisations, including government. But some of the value relies on maintaining and building the network of customers. The extent to which a firm can extract rents depends on the cost to customers of switching networks. It is worth noting that switching costs are likely to be low for consumers if the provider is in the same network and if the information is easily shared. Hence, interoperability of systems can be both an advantage and a disadvantage for firms.
14 As at 23 May 2016, (NASDAQ 2016).

60 DIGITAL DISRUPTION: WHAT DO GOVERNMENTS NEED TO DO?
There is an efficiency – market power trade-off
A single digital platform can come to dominate the market when participants on each side of the market — suppliers and consumers — wish to use the platform that most other participants are using. When participants can only reasonably join one platform (‘single home’) then the market has ‘tipped’ and entry by a new platform may be very difficult (appendix B). If, as is often the case, there are positive network effects (more users makes the platform more useful) and participants can only choose a single platform, the introduction of more platforms could reduce the efficiency of the existing platform. This is because more participants increases the probability of an optimal match.
The sustainability of market power is uncertain
Customer switching can be easier in a digital world due to lower costs of discovering alternative providers. New providers may be able to quickly amass a critical number of users to challenge incumbents. With adequate capital, firms can build out an initial network through cheap introductory offers and initial subsidies (for example Lyft has taken on Uber in California).
Markets for digital services can also be highly contestable. For example, while both Google and Facebook are dominant providers in their quite different markets, they both compete for advertising revenue (Thépot 2012).15 In these ways, market power is tempered. Hence the sustainability of models to extract rent from monopoly control of information is an open question.
Existing regulation may be adequate to address restraints of trade that come from control of data and networks (appendix B). The ASX, for example, was found in breach of consumer law when it attempted to restrict the use of data it provided the market for a downstream information service (box 2.3). Targeted regulation has been used to address market power. For example, a 2007 Australian Competition and Consumer Commission decision granted third-party access to Foxtel’s digital set top units to bring competitive pressures to bear on Foxtel’s pricing (ACCC 2007). Nevertheless, vigilance is still required. Any exclusivity arrangements that serve to prevent data or network access should be carefully monitored.
The Commission is looking at the issues of access to, and control of, both public and private sector data as part of an inquiry into Data Availability and Use.
15 At that time Google had 85 per cent of the search engine market share in 2012, and Facebook had a
65 per cent share of the social networking market.

MARKETS AND COMPETITION 61
Box 2.3 ASX Operations and Pont Data More than two decades ago, it was recognised in Australia that commercial controls over the flow of computerised information can breach competition law.
The pivotal case in 1990 involved the dissemination of information collected through Australia’s stock exchange. ASX was the monopoly provider of stock exchange services. It collected vast amounts of trading data such as market volume, prices, order depth, and clearing and settlement.
One part of ASX (JEC Data Services) supplied wholesale data to another business, Pont Data, which sold it in a repackaged form to its clients. Another part of ASX (JCNET) provided services that competed with Pont Data, albeit not profitably so. ASX forced Pont Data, to sign a new agreement that placed restrictions on data use, raised the price, and required Pont Data to pass on customer information to the ASX. As the sole supplier of data essential to Pont Data’s business, this constrained Pont Data’s ability to compete with the ASX’s own information services.
In a case before the Federal Court of Australia it was found that the new agreement would be likely to have the effect of substantially lessening competition in the information market. The agreement was thus invalidated, creating an important precedent concerning the potential abuse of market power in restricting information flows.
Sources: ASX Operations Pty Ltd v Pont Data Australia Pty Ltd (No 1) (1990) 27 FCR 260; Pont Data Australia Pty Limited v. Asx Operations Pty Limited and Australian Stock Exchange Limited [1990] FCA 30; and Australian Competition Law (1990).
FINDING 2.5
Digital technologies are changing the sources of market power, with control over data and networks providing new means for firms to hinder entry and extract rent from customers. • The length of time and extent to which firms can exercise market power is highly
uncertain, requiring active monitoring rather than pre-emptive action. • New regulatory tools may be needed to address these very different sources of
market power arising with the digital economy. Aspects of third party access regimes could be explored as a relevant approach.
Growing power to consumers
Digital platforms, including social media and aggregator websites, are increasing consumer access to information on the quality of products and on the firms that supply them. Comparator websites, or aggregators, bring together information that facilitate consumer search. But it is the ability of consumers to exchange information on the performance of a product and supplier that substantially reduces the degree of information asymmetry between consumers and producers. This enhances the ability of consumers to impose

62 DIGITAL DISRUPTION: WHAT DO GOVERNMENTS NEED TO DO?
market discipline on poor performers, reducing incentives for firms to over promise where the majority of sales are to once-off consumers.
Aggregators and comparison sites may reduce search costs
Digital intermediaries (and the platforms they operate) lower search costs by collating and cataloguing all (or a portion of) agents in one place (appendix B). This makes comparison between products easier, particularly where they break down complex products and encourage standardised offerings. Aggregators can also bundle complementary products.
By facilitating comparisons, these websites encourage competition on price, rather than just on features or quality. Digital intermediaries can also apply algorithms to rank products and services based on quality or other criteria, or to provide individualised searches based upon a consumer’s taste or needs (Riemer et al. 2015).
There is some evidence that service providers, such as private health insurance companies, are structuring their products in a less complex way so that they can feature on aggregator websites (ACCC 2014b).
Peer review systems can reduce information asymmetry
In non-digital markets where transactions are infrequent, an individual consumer trying to discover whether a good or service has the required quality must rely on the signals of reliability provided by warranties and branding, recognition that statutory consumer protections set floors to product quality, and on information about products and providers based largely on word of mouth.
Digital platforms greatly expand the sources of information, and allow businesses without brand reputation to compete more easily with the big brands. Many digital intermediary businesses include two-way online rating systems for service providers and customers, collating the data to reduce information asymmetries between service providers and customers.
To attract and retain customers, platform providers have an incentive to provide safeguards to consumers by screening and disciplining providers. They also benefit their listed providers by ensuring consumers make payments and poorly behaving consumers can be excluded from the service.
Where these online rating systems are operating effectively and consumer/product safety objectives are satisfied, there is scope for regulators to scale back their role in markets. Some occupational licencing may be a case in point (box 2.4). However, users of comparison sites and other sources of information need to be assured that, unless otherwise disclosed, the information is unbiased and that consumers are offered choices that they understand. The policy challenges in making these information systems work effectively are discussed in chapter 4.

MARKETS AND COMPETITION 63
Box 2.4 Digital platforms may reduce the need for occupational
licensing Occupational licensing is one area where the combination of task matching and scope for online rating systems may reduce the need for regulator involvement. The scope for this will be occupation-dependent, as the risks vary across occupations. For example, a customer satisfaction rating system might be an effective mechanism to deter defective outdoor plumbing and enable redress, but the consequences of defective electrical work may be considered sufficiently large as to still warrant professional accreditation of electricians. The increased automation of some tasks (such as some accounting, legal and medical services), and the re-orientation of some jobs to be more about tasks and less about career paths, could also warrant a reconsideration of occupational licensing.
FINDING 2.6
Digital platforms can help overcome information asymmetries, which have been a common justification for regulation. This can allow governments to reduce the restrictiveness of regulations seeking to provide consumer protection, subject to confidence in the information provided.
2.4 Market performance
Technical progress is a major source of productivity growth, and is largely responsible for sustained growth in incomes. As noted in chapter 1, periods of high productivity growth often lag periods of major technical advances, as many factors affect the adoption profiles of new technologies. Other sources of productivity growth are more about lifting the level of productivity toward the potential. These include improving the utilisation of existing resources, investing in complementary capital and labour skills where gaps occur, increasing scale allowing the adoption of more efficient technologies, and competition that encourages firms to improve their efficiency (lower costs or boost output). Firms adopt and develop new technologies when they have an expectation of higher profits.16
An improvement in the productivity of a firm will improve a firm’s profits, but it is quite possible for a firm to improve its profits without improving its productivity. For example, when relative prices change, firms that target the market segments with rising prices earn 16 In a highly competitive market where any gains are quickly competed away the incentives for innovation
can be lower (Schumpeter 1942). However, innovation can be essential for a firm to survive in a competitive market (Arrow 1962). Aghion and Griffith (2008) found that there is an inverse U shaped relationship between competition and innovation — at low levels of competition an increase stimulates innovation, but at high levels of competition an increase in competition can dampen innovative activity, with the turning point varying across industries. What is clear is that competition forces firms that are well behind their potential productivity to improve or go out of business.

64 DIGITAL DISRUPTION: WHAT DO GOVERNMENTS NEED TO DO?
more profits than those that do not. At the level of the economy, changes in relative prices can shift economic activity toward industries that have a lower level of productivity (but higher prices). Digital technologies may sometimes facilitate these resource movements by making it easier for consumers to access services they value, even if the productivity levels of such services are lower than average. This is still a positive outcome for consumers. Nevertheless, it is the use of digital technologies to release labour and capital from some tasks so that they can go toward delivering additional goods and services that increases productivity and living standards. They may also indirectly promote productivity by pushing firms toward the frontier through improved utilisation rates and greater competition.
Scope for productivity improvement
There are mixed views on the effect of the digital ‘revolution’ on the outlook for productivity. Some commentators, such as Schwab (2016a), are optimistic:
The fourth industrial revolution has the potential both to increase economic growth and to alleviate some of the major global challenges we collectively face. (p. 35)
The justification given for such optimism rests on the potential for digital technology to: bring developing countries into world markets; better manage negative externalities, not least through advances in renewable energy; reform organisational structures and management; and drive firms to be innovative through improved competition (Schwab 2016a).
Others, such as Gordon (2012) are less optimistic, arguing:
Invention since 2000 has centered on entertainment and communication devices that are smaller, smarter, and more capable, but do not fundamentally change labour productivity or the standard of living in the way that electric light, motor cars, or indoor plumbing changed it. (p. 9)
The evidence on the impact of ICT on productivity, discussed in chapter 1, showed mixed results. The lags for technology uptake can also be substantial as noted by Gordon (2012). Nevertheless, a case can be made that digital technologies should boost productivity growth rates at least for a period.
Investment in digital technologies should increase productivity growth
Digital technologies should boost productivity growth through:
• increasing the utilisation rates of assets — through outsourcing and specialisation, sharing of research and public assets and, to a lesser extent, household assets
• lowering the costs of production — in particular through improvements in information to optimise production across the value chain and within each element of the value chain, but also through access to open source digital products and problem solvers that

MARKETS AND COMPETITION 65
firms can utilise to reduce their costs (box 2.5). Firms may also need less physical capital, and the costs of digital replication are usually very small relative to the initial development cost
• providing new and better products that are quicker to market and lower cost to develop and replicate. Open source code and agreement on standards allow firms to build new products that are interoperable. The scope for government to improve its services through use of digital technologies is also considerable (Wheeler 2013). These opportunities are discussed in chapter 4.
Box 2.5 Open source and creation of the commons One of the unique outcomes of digital technologies is the emergence of open source software for use by all at no charge and with full rights to the code, the ability to modify the code and to re-distribute it. The key element of open source is relaxed or no copyright protection. Linux, which is a freely available operating system, is the best known example (and Android, as used in many smart phones, is based on its kernel). But there are many others, such as the Apache HTTP webserver, GIMP (image manipulation), Drupal (a content-management tool for the web) and MySQL (a relational database system). R is one of the most popular statistical packages used by researchers across multiple disciplines.
Open source code continues to evolve as people develop new features and solve interconnection and other problems. Digital networks allow open source software to develop rapidly by involving the work of thousands of geographically-scattered programmers and by providing a vehicle for the widespread diffusion of the product. (Freeware can also provide benefits to people, but freeware may not allow access to the code or permission to modify it. It is often used as an entry level product that can be upgraded at a price.)
Firms, not-for-profit organisations and governments are using the networks to seek solutions to problems through hackathons and prizes. From 2014, the Australian Government, for example, has run hackathons (GovHack) encouraging people to compete to develop innovative uses of open government data. The viability of this model depends on the willingness to participate and there are examples where freelancers have felt exploited, due to lack of IP rights over their ideas and little or no payment for commercially valuable code.
The wider the network involved the wider range of diverse skills and insights that can be applied to solving the problem. More broadly, internet platforms support very large volumes of free content, posted by people hoping it will attract followers and hence advertising dollars, launch a music career, or just for self-publicity.
As an example of the kind of gains that are available from more efficient matching of producers and consumers, Cramer and Krueger (2016) recently estimated that Uber drivers have a passenger on average 50 per cent of the time they have the app turned on, compared to taxi drivers’ average utilisation rate of 30 per cent. Ignoring fixed costs, this converted into a cost advantage for Uber drivers of between 28 and 37 per cent, depending on the city. However, the benefits went beyond the parties to the transaction, as Uber drivers in Los Angles drove only 0.56 miles on average without a passenger, while taxis drove 1.46 miles. Hence, for a given distance travelled, there are also gains in reduced pollution and congestion.

66 DIGITAL DISRUPTION: WHAT DO GOVERNMENTS NEED TO DO?
There is evidence to suggest that digital technologies can deliver productivity growth at the firm level, particularly in services. A recent study by the Andrews et al. (2015) found that the most advanced firms in a set of OECD countries were achieving high rates of labour productivity growth, averaging annual rates of 3.5 per cent in manufacturing and 5 per cent in services. However, the gap between these firms and the rest has widened considerably over the 2000s, with the remainder averaging labour productivity growth of 0.5 per cent in manufacturing and –0.1 per cent in services. The gap has widened further since 2008, implying a ‘breakdown of the diffusion machine’. Andrews et al. (2015) suggest that low take up rates by smaller firms could be due to poor skills, difficulties accessing finance and a risk averse culture, but also speculate that it could be due to the ‘winner take all’ effect of digital technology (see below).
Implication for profits (return on capital)
In 2013, 14 out of the top 30 companies by market capitalisation were platform based companies (Van Alstyne 2015). Although the market capitalisation of these types of firms can be volatile, the high price to earnings ratios discussed earlier suggest expectations of considerable growth in output and profits.
Monetising some digital products can be difficult
Some firms’ approach to monetising the networks they have built has been described as a ‘heroin’ strategy — get the user hooked on the product (such as social media) and then increase the price. This price might be less in terms of a fee for service and more in exposure to advertising, but some have questioned how much activity advertising revenue can support (Clemons 2009). Beyond the sale of data or of other services to the client base, several other strategies to monetise digital services have emerged:
• pay for premium content — this could be delivered sooner than free content, or have additional content
• pay for advertising free content — the premium content is free from advertisements
• ‘tip jar’ strategy — asking for small amounts to support content development.
Brynjolfsson and Oh (2012) estimated the annual value of free services. Using time spent on non-market activities as a measure of value they estimated Google’s value to consumers at US$106 billion over the period 2002–2011, and this has been rising over time. Such benefits contribute to consumer surplus (that is what consumers would have been willing to pay, relative to what they actually have to pay), but are not included in the national accounts.17 However, little of this estimated value would have been able to be captured in
17 This is the usual practice, and indeed, adding such estimates to GDP to measure changes in wellbeing is
fraught as the time cost may well overstate the actual willingness to pay.
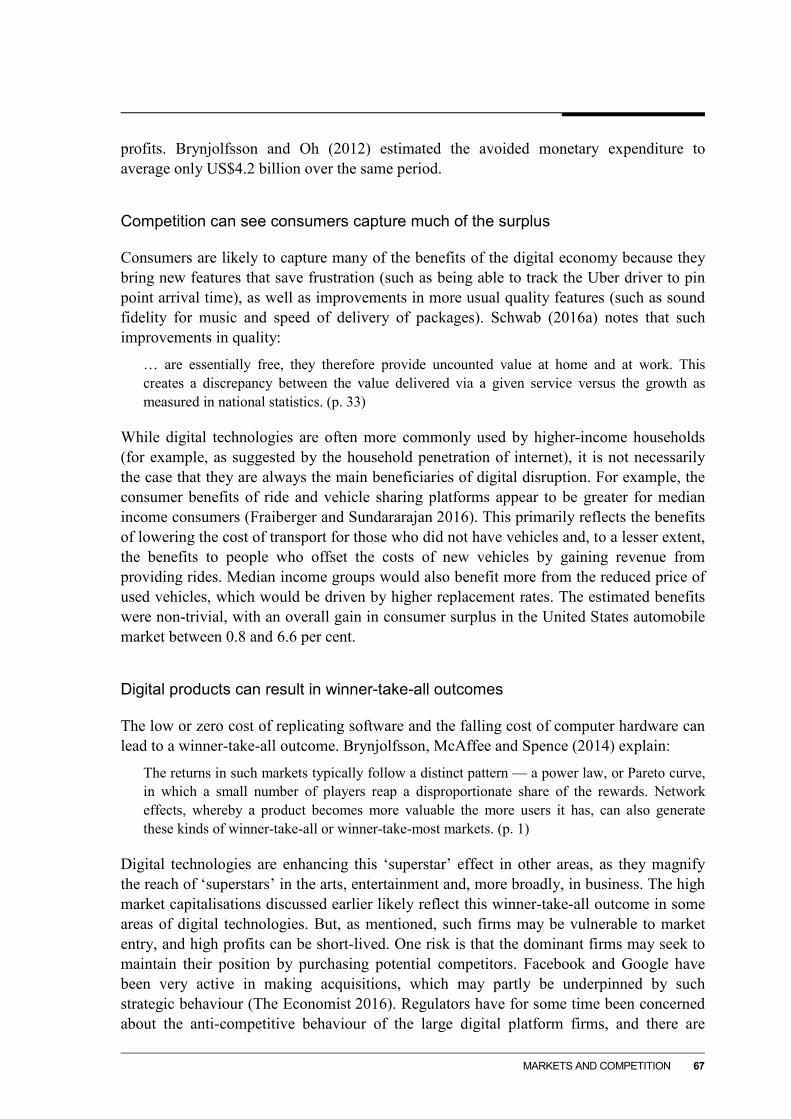
MARKETS AND COMPETITION 67
profits. Brynjolfsson and Oh (2012) estimated the avoided monetary expenditure to average only US$4.2 billion over the same period.
Competition can see consumers capture much of the surplus
Consumers are likely to capture many of the benefits of the digital economy because they bring new features that save frustration (such as being able to track the Uber driver to pin point arrival time), as well as improvements in more usual quality features (such as sound fidelity for music and speed of delivery of packages). Schwab (2016a) notes that such improvements in quality:
… are essentially free, they therefore provide uncounted value at home and at work. This creates a discrepancy between the value delivered via a given service versus the growth as measured in national statistics. (p. 33)
While digital technologies are often more commonly used by higher-income households (for example, as suggested by the household penetration of internet), it is not necessarily the case that they are always the main beneficiaries of digital disruption. For example, the consumer benefits of ride and vehicle sharing platforms appear to be greater for median income consumers (Fraiberger and Sundararajan 2016). This primarily reflects the benefits of lowering the cost of transport for those who did not have vehicles and, to a lesser extent, the benefits to people who offset the costs of new vehicles by gaining revenue from providing rides. Median income groups would also benefit more from the reduced price of used vehicles, which would be driven by higher replacement rates. The estimated benefits were non-trivial, with an overall gain in consumer surplus in the United States automobile market between 0.8 and 6.6 per cent.
Digital products can result in winner-take-all outcomes
The low or zero cost of replicating software and the falling cost of computer hardware can lead to a winner-take-all outcome. Brynjolfsson, McAffee and Spence (2014) explain:
The returns in such markets typically follow a distinct pattern — a power law, or Pareto curve, in which a small number of players reap a disproportionate share of the rewards. Network effects, whereby a product becomes more valuable the more users it has, can also generate these kinds of winner-take-all or winner-take-most markets. (p. 1)
Digital technologies are enhancing this ‘superstar’ effect in other areas, as they magnify the reach of ‘superstars’ in the arts, entertainment and, more broadly, in business. The high market capitalisations discussed earlier likely reflect this winner-take-all outcome in some areas of digital technologies. But, as mentioned, such firms may be vulnerable to market entry, and high profits can be short-lived. One risk is that the dominant firms may seek to maintain their position by purchasing potential competitors. Facebook and Google have been very active in making acquisitions, which may partly be underpinned by such strategic behaviour (The Economist 2016). Regulators have for some time been concerned about the anti-competitive behaviour of the large digital platform firms, and there are

68 DIGITAL DISRUPTION: WHAT DO GOVERNMENTS NEED TO DO?
examples of actions in the European Union and United States against Google (Thépot 2012).
FINDING 2.7
Like previous waves of technology, digital technologies should translate to productivity improvements. Indeed, the low marginal cost of replication means that intangible inputs should fall in price, boosting firm profits. However: • consumers may capture a larger share of growth in productivity where this is
delivered in terms of higher quality products, and where enhanced competition drives down prices
• some digital products can be difficult to monetise • the value of data and networks can result in a winner-take-all model in some digital
services.

WORKERS AND SOCIETY 69
3 Workers and society
Key points • Developments in digital technologies, such as sensors and machine learning, are expected
to broaden the types of tasks that can be automated. But there remain tasks that have proven difficult to automate. Moreover, just because a job can be automated does not mean that it will be.
• On-demand or ‘gig’ employment provides benefits for some workers, with increased flexibility of employment, ability to supplement or smooth income, and by making it easier for some demographic groups to find work. However, there is concern in the community that gig employment may, in the future, represent a major shift in employment relations, with workers bearing more risk associated with insecure employment. The size of any shift is uncertain at this stage, particularly as the gig economy is still in its infancy.
• Workers with an ability to acquire new skills will adjust more easily to changing labour demand. Governments can assist in skills development by:
– implementing teaching methods shown to lead to better learning outcomes
– reviewing how their schools currently interact with the business community to deliver entrepreneurship and STEM learning
– improving information on the employment outcomes for students across skill sets and educational institutions to better inform student choice.
• Historically, many displaced workers find it difficult to secure new jobs and require assistance. Governments should target workers rather than employers to promote structural adjustment. Pressure for industry protection should be resisted as it reduces rather than creates overall job opportunities.
• Labour force participation is affected by a range of factors and the effect of technology on participation is likely to be minor.
• The automation of many tasks in the workplace, with large labour-saving technological advances, has not led to unemployment rates trending upwards over long periods of time. Over the long-term, it is conceivable that job losses may overtake job creation, but there remains considerable uncertainty about the impact of automation on employment and dire employment scenarios remain speculative.
• Disruptive technologies may further increase wage inequality. This may arise from a widening gap in the productivity performance of firms (and the corresponding returns to labour) and from higher wages to those with talents and skills in short supply. Raising the supply of skilled workers will be part of the solution. While Australia’s tax and transfer system will continue to play a role in redistributing income, in the longer term, governments may need to evaluate the merits of more radical policies, including policies such as a universal basic income.

70 DIGITAL DISRUPTION: WHAT DO GOVERNMENTS NEED TO DO?
This chapter examines the effect of digital technology on the labour market and society. In particular, it focuses on:
• the effect of automation on the labour market
• the development of the gig-economy on the nature of employment
• the skills workers are likely to need
• structure adjustment issues
• trends in labour income
• technology assisting some workers participate in the labour market.
3.1 Automation will replace some jobs, but there are limits
Automation of tasks has been occurring for centuries (Frey and Osborne 2013). The automation of glass bottle production in the early 20th century provides one small historical illustration of the powerful influences of automation, its capacity to underpin subsequent automation, and its sometimes surprising labour market impacts (box 3.1).
Box 3.1 Automation of glass bottle production — an historical
example Prior to the 1900s, most glass bottles were hand blown by highly paid skilled tradesman supported by low wage child labour. Glass bottles were of mixed quality and very expensive. The first fully automatic commercial bottling machine was developed in 1903 and could produce 17 280 pint bottles per day compared with around 2880 made manually by six men and boys. Automatically made bottles cost around one twentieth of manually made bottles. With the development of automatic glass bottle-making machines, it was not long before the majority of bottles were machine made. Their uniformity allowed the subsequent development of food packaging standards and the automation of filling and packing. Child labour in the bottling industry — much deplored as a social problem at the time — disappeared rapidly.
Source: American Society of Mechanical Engineers (1983).
Routine tasks are more susceptible to automation as the nature of the task can be easily codified. These tasks are generally characteristic of low and middle-skilled jobs or activities. Modern examples of automation include electronic road toll collection, robot welders and software programs such as MYOB, which have replaced manual book keeping tasks.
While automation can affect jobs across the full skill spectrum, the evidence suggests that it has less often affected occupations that involve non-routine tasks, complex cognition (such as managerial work) and the need for personal and social skills (such as child care) (Autor 2015; Gratton 2015).

WORKERS AND SOCIETY 71
High-skilled jobs have also tended to be complementary to new technology — raising productivity and the demand for suitably skilled workers (Autor 2015; Coelli and Borland 2015). For example, advanced manufacturing using 3D printing processes needs designers and engineers that are capable of using specialised computer software. In addition to computing skills, 3D printing processes also require a different design thought process to traditional manufacturing as more complex shapes are possible and mathematical programs can be used to optimise design features (appendix C).
This changing composition of work is sometimes described as ‘job polarisation’ or ‘hollowing out of work’: where middle-skilled jobs have been declining as a share of employment relative to high- and low- skilled jobs (Autor 2015; Coelli and Borland 2015; Gratton 2015). The loss of low- and middle-skilled jobs in the areas of manufacturing and clerical work has been intensified by the offshoring of such tasks (chapter 2). However, in Australia, trends in job losses have shifted back and forth over the past 40 years, with some observable impact from technology on middle-skilled jobs but no persistent ‘hollowing out’ (Coelli and Borland 2015).
Automation is not the only way in which digital technologies can lead to changes in the skill mix. For instance, there were large numbers of employees in typing pools in many enterprises prior to the 1980s, who were actively engaged in converting written notes — provided by higher-skilled employees — to typed material. The advent of word processing software — initially through mainframes and dumb terminals, and then through the widespread diffusion of personal computers — meant that higher-skill workers undertook their own typing. The routine task of typing did not disappear, but responsibility shifted to skilled employees.
Automation is also not the only way in which routine tasks can be displaced by technology. While there are commercial automatic ironing machines, these are not yet practical for domestic use. However, iron-free garments — a textile technology — is a substitute that precludes (or at least minimises) the need for ironing — by human or other means.
Technological advances may enable automation of some non-routine tasks
While automation has often applied to tasks that are principally routine in nature, the advent of new digital technologies, such as machine learning and robotics means that some non-routine tasks are also likely to be amenable to automation (Frey and Osborne 2013). Driverless vehicles are a good example of the increasing scope of automation. In the mid-2000s, it was thought that driving a vehicle was so reliant on subtle perception that machines could never undertake the task. A little over ten years later, there have been multiple successful trials of driverless vehicles throughout the world, including in South Australia, which the state government has subsequently amended its road rules to accommodate (Cowan 2016; Frey and Osborne 2013).

72 DIGITAL DISRUPTION: WHAT DO GOVERNMENTS NEED TO DO?
In the near to medium term, machine learning is expected to expand the scope of automation into some non-routine cognitive tasks. The availability of data, coupled with advances in algorithms and computing power, has helped codify non-routine tasks by being able to specify (often in the form of patterns) the many contingencies a technology must recognise and manage in order to be an adequate substitute for labour (Frey and Osborne 2013). For example, some US law firms are using language-analysis software to identify and summarise general concepts in legal documents (Markoff 2011). Similarly, pattern recognition, an essential skill in pathological diagnosis, may soon be automated in a comprehensive range of pathology services (Crawford, Jaiprakash and Roberts 2016).
Improvements in technology are also allowing robotics to extend into a greater range of non-routine manual tasks. For example, an Australian bakery has introduced a robotic arm solution to apply icing eyes, nose and bellybutton on gingerbread babies — formerly a manual task because of the random placement of biscuits on a tray. The vision system used in the robotic arm allows the machine to identify the exact location of the biscuits, creating an accurate positioning of the dispensing nozzle for each biscuit (Sage 2014). In addition to advances in technology, physical environments are also increasingly designed and organised to support automation of non-routine manual tasks (for example, by designing warehouses free of obstacles to facilitate the use of robots and driverless machinery) (Frey and Osborne 2013).
Not everything that can be automated will be automated
Frey and Osborne (2013) identified three task areas that have so far proven difficult to automate:
• perception and manipulation tasks (such as identifying objects and moving them in an unstructured or cluttered working space)
• creative intelligence tasks (such as artistic design, musical composition, cooking)
• social intelligence tasks (such as negotiation, persuasion and care).
Difficulty in codifying these tasks places limits on the extent of automation. Not all tasks can be reduced to a series of patterns, and not all patterns are easy for machines to work with. Some patterns — such as unstructured images and video — are poorly suited to mathematical modelling (Szeliski 2010). Environments that contain a number of irregular objects (such as households) and tasks in which the underlying processes are difficult to specify (such as creative design and social interaction) are less suited to the current generation of computational methods and robotics (Frey and Osborne 2013).
The improvements needed for artificial intelligence to match humans at complex tasks require significant advances across multiple fields — not only in computing power but also a better understanding of the human brain and its development. Further, there are significant barriers to coding human values and customs, which underpin creative and social intelligence (Frey and Osborne 2013). Some experts have estimated that artificial

WORKERS AND SOCIETY 73
intelligence and robotic technology will have no significant impact on employment for at least 20 to 25 years (MHFI 2014).
There is also a concern that artificial intelligence can have unintended outcomes. In particular, if it draws on people’s decision-making patterns, machine learning may emulate human biases. For instance, if past human decisions for forming recruitment shortlists built in biases against age, gender or race, then machine learning that emulated human decisions could replicate those biases. Human intervention is needed to short-circuit such tendencies (Prof. Alan Winfield, personal communication, 28 January 2016).
Furthermore, the uptake of technology takes time and is strongly dependent on changes in consumer preferences and their attitudes to technology. The wider community is more likely to ‘trust’ and adopt technology when the consequence of something going wrong is relatively small. For example, it is one thing for a credit assessment to go awry, but quite another for a self-driving vehicle to make an error (MHFI 2014). Even when machines are able to perform risky tasks more reliably than humans, trust needs to be earned and new ways of thinking about accountability and liability need to be developed — both of which take time. Regulatory frameworks also play a role in the introduction of technology (chapter 4).
Which occupations are likely to be automated?
The broader reach of automation means that more types of tasks may be replaced by machines or software than previously thought. Combined with conjectures on the likelihood of future advances, Frey and Osborne (2013) outline the type of tasks that are likely (with varying probability) to be computerised. Using this detailed projection, they map these task characteristics to occupations to predict the extent to which different occupations are likely to be automated in the United States. In their forecasts, they predict that 47 per cent of United States employment has a high risk of being automated over a decade or two.
In an Australian context, the comparable estimate is that over the next 10 to 15 years, nearly 40 per cent of jobs are at risk of automation (Durrant-Whyte et al. 2015). In both the United States and Australian cases, the findings relate to gross, not net employment. The automation of jobs does not necessarily equate with any increase in average unemployment rates, since new jobs are often created. Unemployment rates in Australia and other countries have not trended upwards over long periods of time, notwithstanding the large labour-displacing technological advances that have occurred. (Whether that remains true for the future is a source of debate — see below.)
While there are significant caveats to these types of estimates (Brundage 2013; Piesing 2013), they are useful in that they highlight that:
• occupations more likely to be disrupted by technical change are labourers, machinery operators and drivers and clerical workers

74 DIGITAL DISRUPTION: WHAT DO GOVERNMENTS NEED TO DO?
• personal service workers and professionals are most likely to remain unaffected
• while most professionals and personal service workers have a lower probability of computerisation, there are some jobs in these occupations groupings that are at higher risk of automation (Durrant-Whyte et al. 2015) (figure 3.1).
Figure 3.1 Which occupations are likely to be automated? a
a The number of jobs by profession group likely to be automated at each level of probability.
Source: Durrant-Whyte et al. (2015).
PwC (2015) — also using Frey and Osborne’s approach — project that around 44 per cent of current jobs are at high risk of being affected by computerisation and technology. They predict that the three main jobs with the greatest probability of computerisation in Australia over the next 20 years are accounting clerks and bookkeepers, checkout operators and cashiers, and general office administration workers.
A further recent estimate of job replacement, based on analysis of the task content of individual jobs rather than occupations, is less pessimistic, however. Arntz, Gregory and Zierahn (2016) estimate that just 9 per cent of jobs (on average, across 21 OECD countries) are at high risk of automation but that a further 20 to 35 per cent are at risk of having at least half the component tasks change significantly because of automation. As with the other studies, they also conclude that automation risk is highest where work relies less on face-to-face interactions, and for low skilled jobs.
0
200
400
600
800
1000
1200
1400
1600
1800
0.0 0.2 0.4 0.5 0.7 0.8
Tota
l em
ploy
men
t ('0
00)
Probability of automation
Labourers
Machinery operators and drivers
Sales workers
Clerical administrative workers
Community and personal service workers
Technicians and trades workers
Professionals
Managers

WORKERS AND SOCIETY 75
Age and the risk of technological redundancy
People with low or obsolete skills have long been more exposed to unemployment or underemployment, as indicated by the employment outcomes associated with the decline in lower-technology manufacturing industries (such as textiles, clothing and footwear). This suggests two vulnerable groups of different ages:
• young people with little experience and low skills
• older people in industries subject to major structural change, and who are unable to acquire new skills readily. The growth in the numbers of people on the Disability Support Pension seems to have in part been driven by long-term unemployment among such cohorts (Lattimore 2007).
Some consider that this vulnerability may extend to surprising new groups — such as university graduates (Healy 2015; Nelson 2015; Ting 2015). In 2014, only 68 per cent of bachelor graduates had a full time job four months after graduating — the lowest figure since 1992 and well below the 91 per cent peak in 1989 (figure 3.2). Part of the reason for this may be continued weakness in the economy, imbalances between supply and demand at the occupational level as a result of the large expansion of the tertiary sector, and the likelihood that the average quality of graduates has fallen as people with less latent ability acquire qualifications.
Figure 3.2 Graduatesa working full-time as a proportion of those
available for full-time employment Approximately four months after course completion
a Bachelor degree. b Grey areas indicate recessions.
Source: Graduate Careers Australia (2015b).
50
55
60
65
70
75
80
85
90
95
100
1982 1986 1990 1994 1998 2002 2006 2010 2014

76 DIGITAL DISRUPTION: WHAT DO GOVERNMENTS NEED TO DO?
But some claim that technology may be playing a role too. Previously, part of the cost of training and developing new graduates could be recouped through these employees undertaking routine and low-skill tasks, such as document discovery (lawyers), low-level audit work (accountants) or basic market research (marketing). However, the increased automation of these tasks, such as through software to assist in document search, is making much of this work redundant and, in turn, reducing the incentive for employers to hire as many of these entry level workers (Markoff 2011).
However, while technology may have weakened demand in some fields, it is not clear how many fields this will apply to. Moreover, there are two other mechanisms for adjustment. First, as demand imbalances occur, new cohorts of younger people can acquire qualifications with better labour market prospects. Second, wages are more readily flexible downwards for higher-skilled jobs (where minimum wages do not bind), so wage flexibility may also increase job prospects over time. It is unlikely that, as a group, highly qualified young people will be disadvantaged disproportionately by digital disruption.
FINDING 3.1
Developments in digital technologies, such as sensors and machine learning, are expected to widen the boundary of the types of tasks that can be automated. But there remain tasks that have proven difficult to automate, including those requiring perception, or creative and social intelligence. Just because a job can be automated does not mean that it will be.
3.2 Internet platforms and the nature of employment
Technology has enabled various parts of the production of goods or the delivery of services to be broken into job segments and outsourced. Since the 1990s, information and communication technology has made it possible to offshore services that could be delivered electronically over the internet, such as software programming (chapter 2).
The rise of platform websites (such as Uber, Freelancer, Airtasker and 99designs) and the spread of mobile internet connectivity extends the ability of businesses to breakdown jobs into components, buying in ‘tasks’ as needed. This model of hiring labour on demand is considered to be part of the emerging ‘gig economy’. These arrangements can help improve productivity by more accurately matching and scaling resources to the needs of the business. In the gig economy, workers are employed for particular tasks or for a temporary increase in workflow, reducing the average input intensity of production. This has the potential to change the nature of the employment relationship.

WORKERS AND SOCIETY 77
The gig economy remains small and growth is uncertain
While the number of gig economy platforms has proliferated in recent years, they currently are a small source of employment relative to other types of employment. Most people gaining employment through platform websites are employed as independent contractors. While the data is somewhat out of date to track progress in an emerging field, the proportion of independent contractors has remained constant in recent times (figure 3.3). The Grattan Institute estimate that fewer than 0.5 per cent of adult Australians (80 000 people) work on peer-to-peer platforms more than once per month (Minifie 2016).
Determining the true growth in the number of people who are using these platforms as a source of employment is difficult, particularly initially, as some existing independent contractors may use the digital platforms as a marketing tool to promote their business. However, these platforms are likely to have also attracted new workers. Platforms also allow workers to pick up a second job, which would not necessarily be reflected in the statistics that report only the form of primary employment.
Figure 3.3 Stability in the forms of employment
2009–2013, per cent of total workers
Source: PC (2015e).
The development of a gig economy will suit some workers as it can:
• offer people increased flexibility in employment arrangements, such as the total number of hours worked or when and where those hours are worked
61.4 61.6 62.4 63.4 63.3
9.6 9.8 9.0 8.5 8.5
19.8 19.3 19.3 19.0 19.4
9.1 9.2 9.2 9.0 8.8
0
20
40
60
80
100
2009 2010 2011 2012 2013
Shar
e of
wor
kers
(per
cen
t)
Ongoing employees Independent contractors
Casual workers Other business operators

78 DIGITAL DISRUPTION: WHAT DO GOVERNMENTS NEED TO DO?
• offer people the ability to supplement and smooth income. Early evidence from the US suggests platforms are primarily used as a secondary source of income, with earnings mostly making up for shortfalls and volatility in non-platform income (JPMorgan 2016)
• make it easier for some demographic groups to find work (section 3.6).
But there are also concerns about this type of employment. While some people enjoy the flexibility of employment arrangements that allow them to combine work with study or family commitments, many people value security of employment and stability of income. Trends in some industries, however, may mean that some employees find that they need to move to independent contracting arrangements to maintain employment in the industry. For example, some journalists have moved from being employed by news media outlets to freelancing and some designers are now competing for work through platforms (such as 99designs) rather than being employed by a graphic design firm (Lacy 2012).
There is also concern that workers will be worse off, as entitlements that employees receive are not necessarily provided to independent contractors (such as paid leave, minimum wages and protection from unfair dismissal). The gig economy may, therefore, be seen was a way to lower costs, with firm overheads (and, in some cases, employee entitlements) shifted to the contract worker.
Independent contractors do, however, have some broad protection under the law (such as work health and safety, discrimination, and unfair or harsh contracts laws) (see appendix B) (PC 2015e). However, if issues arise, modifications to regulatory protections may be required. As outlined in the Productivity Commission’s Workplace Relations Framework inquiry, sham contracting — the process of misclassifying employees as independent contractors — can disproportionately affect vulnerable workers. And while the Fair Work Act 2009 (Cth) has sections that prohibit sham contracting, the Commission’s inquiry found that the requirement that an employer must have been ‘reckless’ for them to be prosecuted for misrepresenting the nature of an employment contract is too high a threshold for legal action. The Commission recommended that changing from a test of ‘recklessness’ to a test of ‘reasonableness’ would help discourage sham contracting (PC 2015e).
The nature of the Australian social welfare system, with access to unemployment benefits and Medicare, helps to mitigate the impact on workers of short-term and periodic employment. But there are still rigidities in the system, reflecting its design for a labour market where workers were usually in full-time, or permanent part-time, employment. The means testing of income support can result in high effective marginal tax rates, and while aiming to assist in smoothing income, payment adjusts can occur with a lag, and the problem of needing to seek return of overpayments could be exacerbated. These features of the income support system could reduce the incentives to seek work opportunities that deliver a highly variable income. Changes to the social safety net may be needed to manage the outcomes of intermittent employment, and to allow people to access what employment they can through the ‘gig’ economy. Some countries are trialling a universal basic income as part of their income support system (box 3.2).

WORKERS AND SOCIETY 79
Box 3.2 Universal basic income A universal basic income (UBI) — a payment unconditionally granted to all individuals, without any means test or activity requirement — has been raised as a possible method to ensure a minimum income level (Carnegie 2016; Reeves 2016; Tanner 2015). Depending on the design, a UBI payment could have some positive features, as it:
• eliminates poverty traps that low income earners may fall into due to the conditions and inflexibility of welfare payments
• provides persistent and predictable wage support, an arrangement that would suit those involved in the gig economy or other intermittent work
• has the potential to improve work incentives as it lowers the effective marginal tax rate associated with the loss of welfare payments as wages increase
• is relatively inexpensive to oversee and administer compared to means-tested programs (Reeves 2016; Tuffley 2016).
The cost of a UBI program would have large implications for the federal budget. Gross UBI payments, however, are not reflective of total net cost, as a number of current social security payment could be altered or removed (Harford 2013). Furthermore, the design of any UBI — such as whether the payments are made to households or individuals — would also have an impact on cost. But overall, the costs of a UBI are substantial.
The net effect of a UBI on employment is also unclear. While some work incentives are stronger under a UBI (owing to lower effective marginal tax rates), an unconditional payment without any activity test may discourage some people from participating in the workforce altogether (Scutella 2004). And while a UBI can mitigate some of the financial impacts of long-term unemployment, it does not address the social and physical consequences that may also present, such as social isolation, low self-esteem and depression (SCOEEWR 2000).
Several UBI trials are currently underway or planned internationally. The Netherlands is trialling four types of UBI over the next two years, with the first giving citizens around A$1250 per month unconditionally and the option to earn as much additional income as desired (Tuffley 2016). Other countries, including Canada and Finland, are also planning to conduct trials. However, Swiss voters rejected plans to introduce a flat monthly payment of around A$3380 to all adults and A$845 to children in June 2016.
The extent to which employer-employee arrangements will be replaced with independent contracting and what this means for employment and income security are still open questions. Some commentators have expressed concern that the spread of on-demand labour will become extensive, creating a workforce of independent contractors (Hanauer and Rolf 2015; Harris and Krueger 2015). However, firms are less likely to use independent contractors where there is:
• high interdependence between workers
• concern about the expropriation of valuable intellectual property
• difficulty in specifying or verifying the quality of work provided
• a need to have ongoing involvement with the business to develop valuable firm-specific skills (for instance in understanding a business’s specific procedures and routines, how to use a business’s capital, and knowledge of the preferences of specific customers)

80 DIGITAL DISRUPTION: WHAT DO GOVERNMENTS NEED TO DO?
• a significant cost in re-contracting compared with maintaining ongoing employment
• a need to establish loyalty to the business to achieve maximum productivity and commitment (which are not necessarily always easily observable at any one time)
• scope to reduce wages in exchange for higher job security
• a relatively straightforward capacity to dismiss underperforming employees.
Consistent with the view that not all types of jobs are suited to independent contracting, the Grattan Institute found that internet platforms have tended to develop in sectors and occupations in which independent contractors are already common. They suggest that this is because platforms suit tasks that businesses only need infrequently and do not involve complex teamwork with colleagues or deep knowledge of a specific workplace (Minifie 2016).
FINDING 3.2
The 'gig' economy is in its infancy, making its future effect on the nature of employment uncertain. But if the gig economy develops quickly and its spread is wide, there will be risks that need to be managed. While governments need to address real concerns, blocking these technologies is not an appropriate response.
In the longer term, depending on the scale of change, governments may need to consider whether: • changes to workplace relations regulations are required to accommodate a
growing category of employment • the income support system needs to be changed to ensure it is not a barrier to
workforce engagement and helps reduce income volatility for low income workers.
3.3 Skilled workers will be needed to use technology
As discussed, certain jobs are expected to disappear with the take up of new technologies. At the same time, there will be a greater demand for people with a high level of technical proficiency of existing skills (such as engineers) or emerging competencies (such as data analysts). These changes will require a wide variety of skills and competencies, both specific and general. As highlighted by Williamson et. al. (2015), the focus needs to be on future skills and competencies, not on past technologies:
Australia needs to adapt to the shifting foundations. It needs to change its strategy from focusing upon what worked well in the past, or business sectors that have been demonstrated to have strengths in the past. Instead Australia should create and sustain the capacity, skills, culture and the will to adopt, adapt, and develop its future source of prosperity and well-being: Australia’s bright future can be envisaged, created and achieved through new technology. (p. 174)

WORKERS AND SOCIETY 81
Depth of knowledge is important
The ‘ideal’ worker will have skills and competencies with a depth of expertise in at least one particular field. While some non-routine tasks have been identified as likely to become redundant, the availability of people with business and entrepreneurial skills and skills in science, technology, engineering and maths (STEM) seem to be universally accepted as necessary skills for the future (PC 2015b). The arts, design and creativity skills are also increasingly seen as important and unlikely to be automated in the near future (PC 2015b; Williamson et al. 2015). While an innovative economy requires the development and use of skills in many disciplines and at a variety of levels, ‘there is no skills-related silver bullet’ (OECD 2015b, p. 65).
STEM skills are seen, in Australia and overseas, as essential to developing innovation and supporting economic growth. The Office of the Chief Scientist (2014) reported estimates that 65 per cent of Australia’s economic growth per capita can be attributed to improvements in the use of capital, labour and technology innovation largely made possible by STEM in the 40 years to 2005. PwC (2015) has estimated that shifting 1 per cent of the workforce into STEM roles would add $57.4 billion to GDP (net present value over 20 years ignoring the costs of implementation).18
STEM encompasses a broad range of skills, but from observations of emerging technologies there are areas of growing importance. Some examples include:
• The rapid collection of large data sets has led to the need for data scientists with skills in the manipulation and statistical analysis of big data.
• Similarly, these big data sets have also given rise to the development of machine to machine learning and artificial intelligence — increasing the demand for high level maths and computer programing skills.
• In advanced manufacturing, composites, robotics, nanotechnology, and the advent of 3D printing have increased the need for designers and engineers who are capable of using certain computer software and have a greater understanding of material science and quality assurance systems.
• In the energy sector, the emergence of household solar photovoltaic, battery storage and smart metering will require installation technicians for connection and maintenance of this infrastructure. Knowledge of new technologies, as well as skills in data analytics and information and communications technology (ICT), will also be required.
Creativity and design skills are important as they are a fundamental part of the innovation process. Skills associated with creativity are not only important for finding novel and innovative solutions, they are also skills that are unlikely to be made redundant by 18 Beyond noting that it used a compatible general equilibrium model, PwC does not specify how its
estimate was derived. Most critically, it does not indicate the nature of the shock that was applied to achieve its estimate, and the validity of its assumptions. In that context, the estimate should be treated cautiously.

82 DIGITAL DISRUPTION: WHAT DO GOVERNMENTS NEED TO DO?
disruptive technology such as automation. The Australian Council of Learned Academies highlighted the importance of creativity in the context of high level scientific skills:
Australia’s education systems must develop high levels of scientific and technological literacy, as well as inculcate creativity and a willingness to tinker, which can facilitate the ‘learning by doing’ that underpins technological change. (Williamson et al. 2015, p. 16)
Generic business and entrepreneurial skills, such as business planning, marketing, project management and networking, are also key skills for the future (PC 2015b). Furthermore, it is the combination of business skills and acumen and technological developments that creates new business models, new markets and new sources of economic growth.
Figure 3.4 Proficiency in problem solving in technology-rich
environments among adults Proportion of 16-65 year olds with the highest two levels of proficiencya
a Problem solving in technology-rich environments is defined as the ability to use digital technology, communication tools and networks to acquire and evaluate information, communicate with others and perform practical tasks. Proficiency level 2 and 3 are the highest two levels of proficiency. Adults at level 3 can complete tasks involving multiple applications, a large number of steps, impasses, and the discovery and use of ad hoc commands in a novel environment. They can establish a plan to arrive at a solution and monitor its implementation as they deal with unexpected outcomes and impasses. At level 2, adults can complete problems that have explicit criteria for success, a small number of applications, and several steps and operators. They can monitor progress towards a solution and handle unexpected outcomes.
Source: OECD (2013c).
At a more fundamental level, all workers need the skills to interact with digital technology, whether it is maintaining records in caring professions, taking orders in retail, or operating equipment in the processing plant. The OECD (2016c) points to the lack of these type of skills as a possible factor behind the low adoption of digital technologies by many firms. At the top end of the skills proficiency spectrum, Australian adults rank well internationally with an above average level of proficiency in problem solving in technology-rich environments (figure 3.4). More concerning, however, is the ‘reasonably
05
1015202530354045

WORKERS AND SOCIETY 83
large’ proportion of adults across OECD countries who have either no experience in the use of computers or at most a very low level of familiarity with computer devices and applications (OECD 2013c, p. 90). OECD survey results indicate that around 20 per cent of Australian adults have no or limited computer experience or did not possess basic ICT skills, such as the capacity to use a mouse or scroll through a web page.
The STEM paradox
While most recognise the importance of STEM skills, there is a paradox in terms of their employment outcomes. Health care graduates have very high employment rates four months after graduating, as do mining engineers and surveyors (Graduate Careers Australia 2014). However, employment outcomes for all other graduates in the STEM industries are below the average outcomes for graduates as a whole, in some cases by large margins (as in the life sciences, chemistry and the physical sciences). Mathematics and computer science qualifications have short-run employment outcomes that are just below the average.
Employment outcomes improve significantly three years after graduation, although the most recent evidence shows that nearly one in five people with bachelor degrees in the natural and physical sciences have not got a full-time job (Graduate Careers Australia 2015a).19 The comparable ‘underemployment’ rate was around 3 per cent and 6 per cent for graduates in information technology, and engineering and related technologies respectively.
Moreover, a significant share of people completing STEM degrees and in full-time employment do not consider that their qualification is important to their main job. For example, around 30 per cent of people with an information technology qualification do not think it is relevant to their job, compared with around 25 per cent of those completing a bachelor’s degree in the natural and physical sciences (Graduate Careers Australia 2015a). Other data from the ABS Population Census shows that as a group (including those who have graduated many years ago), only around one in two people with university qualifications in science are professionals, and around 60 per cent for those qualifying in mathematics (Office of the Chief Scientist 2016). This may not be a problem per se if their skills bring benefits to management, but many more work in areas unlikely to involve their technical skills.20
Outcomes for people having completed postgraduate degrees were not qualitatively different. For example, around 15 per cent of postgraduate students available for full-time
19 The statistics relate only to those who are available for full-time employment, and so avoids the problem
of conflating poor labour market outcomes and the continuation of further study. 20 For example, altogether 22 per cent of university-qualified science graduates were employed as Sales
Workers, Labourers, Clerical and Administrative Workers, Machinery Operators and Community and Personal Services Workers. A greater share of non-STEM graduates had professional occupations.

84 DIGITAL DISRUPTION: WHAT DO GOVERNMENTS NEED TO DO?
work in the natural and physical science field did not have full-time work three years after graduation (considerably below the average), and of those who did get such work, about 15 per cent did not think their qualification was relevant (Graduate Careers Australia 2015a).
So, many people with STEM jobs do not attain full-time employment, and if they do, do not necessarily bring their skills to bear. Accordingly, labour supply initiatives to encourage more STEM skills may also need to consider any barriers on the demand side.
But adaptability is also important
Social and economic trends combined with technological change will require more people to have a capacity to apply their skills across a range of fields and different situations. This need not involve further training, but could include multidisciplinary collaboration (tacit or explicit) and learning by doing. This provides a foundation to understand problems from other perspectives and to see connections and opportunities that would not be possible from a single view. Such knowledge (and the capacity to acquire it) is likely to be complementary to hard skills like coding or mathematics.
Having both a depth and breadth of skills should better equip workers to deal with the changing nature of the labour market. It should better facilitate the adjustment process of workers moving from one field of work into another field — gaining and developing experience and knowledge during the process. Workers may change fields of specialisation voluntarily as the nature of the work on offer changes or skills in a secondary field are developed over time (for example, developments in robotics have facilitated some workers moving into the field of artificial intelligence) (Durrant-Whyte 2016).
More generally across the workforce as a whole, a breadth of skills and the ability to retrain also provide for a more adaptable labour force if work in particular areas becomes redundant due to technological change (structural adjustment is addressed below). The Warren Centre notes that ‘workers and entrepreneurs who can navigate uncertainty fare better than rigid and inflexible employees and business owners’ (Comment 4, p. 6).
What might governments need to do for skills development?
The Australian education system will need to create workers with the skills and competencies required to thrive in a continuously changing environment. The most important skill is the ability to acquire new skills — life-long learning. This requires good literacy and numeracy. More specifically, the role of governments in boosting STEM and entrepreneurial skills comes from the need to:
• build skills that enable the workforce and the wider community to adapt to future economic opportunities and the pace of technological change

WORKERS AND SOCIETY 85
• capture beneficial spillovers from entrepreneurs and increase the propensity for entrepreneurial and innovative activity (PC 2015b).
The policy responses to these objectives will depend on the timeframe. Measures with potentially longer-term impacts on skills availability include education and training programs in universities (medium term) and in schools (long term).
Universities and publicly-funded research institutions have a role in educating and training individuals in STEM and other competencies, including business and entrepreneurial skills. Universities have discretion under Australian Government funding arrangements as to whether, and how they offer programs — with many currently offering entrepreneurship and STEM programs. In the recent inquiry into Business Set-up, Transfer and Closure, the Commission came to the view that there is scope for universities to consider the potential for greater flexibility, including:
• the length and structure of courses and degrees to better accommodate practical entrepreneurial experience for students (enabling them to move in and out of study and business)
• ensuring that entrepreneurship programs are delivered by people with the right skills and experience (such as entrepreneurs). This will require universities to ensure their selection criteria for recruitment has an increased focus on entrepreneurial skills, rather than just academic publications (PC 2015b).
The Commission also found that with respect to entrepreneurship and STEM learning in schools, there does not appear to be strong evidence in support of additional government initiatives (PC 2015b) (box 3.3).
Any strengthened government requirements for such learning in schools would necessitate a change in the Australian Curriculum. However, there are wider considerations in setting the curriculum, and curriculum changes may not necessarily address a fundamental issue of how STEM learning is delivered by schools and their teachers, including having STEM qualified teachers. The OECD (2015b) supports revisiting teaching methods of traditional subjects such as maths. It notes that metacognitive methods that integrate an explicit reflection of students’ understanding have been shown to lead to better learning outcomes. Similarly, Williamson et al. (2015) argue that greater opportunities for ‘hands on tinkering and building’ should be provided at every stage of training and education (p. 139).

86 DIGITAL DISRUPTION: WHAT DO GOVERNMENTS NEED TO DO?
FINDING 3.3
Simply increasing the share of STEM graduates is unlikely to resolve the low rates of adoption of digital technologies by firms. Given the relatively high underemployment of STEM graduates and apparent underutilisation of STEM skills, the current approaches are not delivering the problem-solving skills needed for technology rich work environments. Beyond delivering a high competency in literacy and numeracy at the school level, initiatives could include reviewing teaching methods, increasing flexibility of university degrees and improving information on employment outcomes for students to help inform student choice.
Box 3.3 STEM learning in schools The Australian Government and various state and territory governments have several initiatives to support the development of STEM skills in schools and universities and within the community:
• The Australian Government has committed $12 million of extra funding to foster primary and secondary student engagement with STEM (Australian Government 2016b). Specific initiatives are ‘Mathematics by inquiry’ programmes for primary and secondary schools, the ‘Coding across the curriculum’ programme, the provision of seed funding to pilot an innovation-focused ‘P-TECH’ styled education facility for secondary schools, and summer schools for STEM students. Some of these initiatives have now commenced, with others to follow shortly.
• As part of its National Innovation and Science Agenda (Australian Government 2016c, 2016d), the Australian Government will invest $48 million over five years to encourage Australians of all ages to engage with STEM in education and society by expanding the Prime Minister’s Prizes for Scientists, supporting Australian students in international STEM competitions, and developing play-based learning apps and resources to encourage STEM in preschool age children. An additional $13 million in funding will also be committed to encourage more women to embark on, and remain in, STEM related careers. These initiatives will both commence in 2016-17.
• The Queensland Government’s STEM Strategy (Jones 2015) includes support to address challenges such as the retention of students, performance of students, teacher capability, and valuing the teaching profession. This includes ‘STEM in Action’ grants of $15 000 to schools to implement research-informed innovations in STEM.
• Education ministers have recently agreed to collaborate nationally in developing a STEM school education strategy for increasing STEM participation in schools (Education Council 2015).
WORKERS AND SOCIETY 87
3.4 Automation and structural adjustment
As discussed above, numerous studies have highlighted the types of industries and jobs susceptible to automation (Angus 2015; Durrant-Whyte et al. 2015; Frey and Osborne 2013). Some of these have offered unsettling predictions for future employment (Brynjolfsson and McAfee 2014):
Rapid and accelerating digitization is likely to bring economic rather than environmental disruption, stemming from the fact that as computers get more powerful, companies have less need for some kinds of workers. Technological progress is going to leave behind some people, perhaps even a lot of people, as it races ahead. (p. 11)
However, it is important to note that these studies have primarily focused on one side of the equation — the substitution of labour with automating technology. While technology is labour-saving for some jobs, it is also generally complementary to high-skilled labour, thereby raising productivity and the demand for these skilled workers. Furthermore, productivity savings arising from technological progress are also returned to the economy — as lower prices, higher wages for the remaining employees, and/or higher profits — to create new demand (Autor 2015). To date, higher demand has led to new jobs, which has more than offset job losses from technological change (van Ark, Frankema and Duteweerd 2004) (see chapter 1, figure 1.1 for a description of the cycle). Australia’s employment to population ratio has not declined nor has the unemployment rate trended upwards over long periods of time, notwithstanding the large labour-displacing technological advances that have occurred (figure 3.5).
Despite this, technology has reduced the need for labour input, but that has been achieved through a long term decline in the average weekly hours worked, rather than a reduction in the number of jobs per capita or a rise in the unemployment rate. Over the longer term, there has been a downward trend in the average hours worked. From 12 hours a day six days per week during the first industrial revolution, the average weekly (paid) hours worked in Australia were 32 hours per week in 2015, down from approximately 42 hours in 1967 (ABS 2016; ACTU 2012; RBA 1996).

88 DIGITAL DISRUPTION: WHAT DO GOVERNMENTS NEED TO DO?
Figure 3.5 Employment to population ratio and unemployment ratea,b
1901 to 2016
a The unemployment rate did rise substantially between 1973-74 to 1977-78 from around 2 to approximately 6 per cent. The increase in the structural rate of unemployment has been attributed, in part, to the first oil shock and rigid institutional arrangements in the labour market (Commonwealth of Australia 2004). b Unemployment rate data from prior to 1966 are from Butlin (1977), employment to working age population ratio data prior to 1966 are Productivity Commission estimates based on Butlin (1977) and ABS Cat. no. 3105.0.65.001, all data from 1966–1978 are from ABS Cat. no. 6204.0.55.001 (seasonally adjusted), all data from 1978 onwards are from ABS Cat. no. 6202.0 (seasonally adjusted).
Sources: ABS (Australian Historical Population Statistics, 2014, Cat no. 3105.0.65.001); ABS (Labour Force, Australia, April 2016, Cat. no. 6202.0); ABS (Labour Force Historical Timeseries, Australia, 1966 to 1984, Cat. no. 6204.0.55.001); Butlin (1977); Productivity Commission estimates.
But historical precedents are only so useful — there is always the possibility that ‘this time is different’. On this question, opinion is divided.
Some argue that unemployment is not likely to trend upwards due to technological change because:
• the current wave of technical change is similar to past transitions — jobs are being automated at a comparable pace to that of the last century (Miller and Atkinson 2013)
• automation will be limited as many of the tasks currently bundled into jobs cannot readily be unbundled — with machines performing the middle-skill tasks and workers performing only a low-skill residual — without a substantial drop in quality (Autor 2015)
• there are considerable limitations to the extent of automation with large advances required before they become widespread (section 3.1)
40
45
50
55
60
65
0
5
10
15
20
25
1901 1911 1921 1931 1941 1951 1961 1971 1981 1991 2001 2011
Empl
oym
ent t
o w
orki
ng a
ge
popu
latio
n ra
tio (p
er c
ent)
Une
mpl
oym
ent r
ate
(per
cen
t)
Unemployment rate Employment to working age population ratio

WORKERS AND SOCIETY 89
• factors other than technology (such as the ageing population) will also influence what jobs will be created in the future (such as aged care), often requiring skills that are difficult to automate (Gahan 2016).
Others argue that we are approaching a turning point, where sophisticated automation and enhanced competencies of artificial intelligence and machine intelligence will lead to the replacement of large sections of the workforce simultaneously (Bostrom 2014; Brynjolfsson and McAfee 2012; Cookson 2016). If the economy enters a phase where machines start to outperform humans at most tasks, there are concerns that demand for labour will fall well short of what is needed for full employment (Arthur 2011; Bostrom 2014).
In addition, some question whether the historical mechanism of new job creation born out of productivity savings and demand growth will continue (Haldane 2015). Over the long-term, job losses could overtake job creation if the virtuous cycle of productivity to income growth to growth in demand is constrained (chapter 2). In the near term, it is likely that savings from higher labour productivity will continue to create new demand and new jobs, particularly if there are many areas where automation is a long way off (Miller and Atkinson 2013).
Structural adjustment issues
Even if jobs grow in aggregate, some adjustment within the labour market is inevitable. Higher wages and better working conditions create incentives for people to undertake extra training or develop skills — particularly when these skills are in short supply. Geographic labour mobility appears to be strong in Australia, with labour responding to market signals and moving to areas with better employment and income prospects (PC 2014a). However, areas of high unemployment persist, suggesting some barriers to adjustment remain.
A key question is whether adjustment will be balanced, with new jobs emerging to utilise the labour being released or whether there will be some groups of workers who are not readily absorbed by the changing labour market. Improvement in aggregate outcomes can mask different outcomes at the industry or regional level.
Past experience suggests mixed results. Out of all Australian workers who involuntarily lose their jobs due to economic reasons (such as corporate downsizing or firm closure), 30 per cent are still unemployed after one year, and 20 per cent are yet to find work after two. Older workers, women, and workers previously employed in casual jobs typically face greater difficulties in finding a new job (OECD 2016a).
Once re-employed, workers often experience significant changes in wages. After two years, over 30 per cent of displaced workers still have weekly wages more than 10 per cent lower than their wage before displacement. One possible explanation for wage loss may be skill mismatch. Approximately 12 per cent of all displaced workers experienced a skill downgrading in their new job (OECD 2016a). One cause could be a cascading job problem

90 DIGITAL DISRUPTION: WHAT DO GOVERNMENTS NEED TO DO?
— where displacement across the skill spectrum has a ‘trickle down’ effect as people dislodged take a job at the next level down and displace the workers at that skill level.
New jobs may not necessarily be created in the same location where jobs are lost. Industries where employment is projected to contract the most (manufacturing, mining and agriculture, and forestry and fishing) make up a disproportionate share of many remote and regional economies (Cunningham and Davis 2011; Department of Employment 2016). Conversely, projected employment growth in professional services and education and training (two of the three largest growth industries, the other being health care and social assistance) is generally expected be strongest in Melbourne, Sydney, Brisbane and the central coast of New South Wales, and weakest in remote areas and some regional centres, including Bunbury, Shepparton and Townsville (Cunningham and Davis 2011; Department of Employment 2016). And while overall labour supply appears to be geographically mobile (and is especially mobile in the mining industry), at the individual level, personal and locational factors (such as family circumstances, housing, and level of education) can present barriers to a person’s ability to move (Cunningham and Davis 2011; PC 2014a).
Governments may also face pressures to protect some kinds of jobs. Politically powerful and well-organised groups have mounted effective campaigns to resist change in the past, and may be able to pressure government for protection or assistance in the future (PC 2001). However, intervention such as tariffs, anti-dumping or operational subsidies, only protect the jobs of a few and can represent a substantial cost to the taxpayer or to other industries and their workers (for example, PC 2016a).
Determining the type and amount of assistance to help workers adjust to disruptive technologies is difficult. Previous work by the Commission and others have developed principles to guide governments’ response to structural-adjustments stemming from policy reform. And while the expected response is likely to differ compared to structural adjustment that is a result of market mechanisms (such as disruptive technologies), the principles are applicable where the disruption is concentrated in particular geographic locations or groups of workers (box 3.4). In addition, preventative strategies — such as encouragement for people in declining industries to develop skills that might increase job mobility — could be trialled and evaluated. Encouragement need not be direct government funding to particular groups, but might take other forms, such as active outreach by educational institutions, and awareness campaigns for at-risk employees.

WORKERS AND SOCIETY 91
Box 3.4 Principles for structural adjustment A strong social safety net should be the primary mechanism by which assistance is provided. The social security and tax systems have long been the standard vehicles for assisting those made unemployed and moderating adverse distributional impacts of adjustment.
Additional assistance may be warranted if the effects of the change are large and concentrated in vulnerable regions/groups. The social security and tax systems are not designed to handle all contingencies. In some circumstances, there may be a role for additional measures in pursuit of equity or to further facilitate adjustment, particularly where the effects are large and are concentrated on vulnerable groups or regions.
Adjustment assistance should facilitate adjustment and be as non-distortionary as possible. When assistance impedes change, the most significant adverse impacts are often on the region’s or industry’s capacity to innovate. Adjustment assistance should be closely targeted at the impediments to adjustment, such as lack of information or barriers to relocating resources.
Adjustment assistance should be provided transparently and continuously evaluated. To ensure accountability, the method of compensation must be transparent, and the groups affected should be clearly identified and targeted (if possible).
Where possible, assistance should be targeted at individuals, families or communities – not businesses. Compared with business, individuals and communities face significant barriers to change, with capital often specific to location (such as housing) and skills often specific to a particular business in that location. Accordingly, adjustment is more difficult for these groups and they should be the target of any assistance.
Sources: McColl and Young (2005); NCOA (2014); PC (1999a, 1999b, 2001); Walsh and O’Neil (2011).
FINDING 3.4
The automation of many tasks in the workplace, with large labour-saving technological advances, has not led to unemployment rates trending upwards over long periods of time. However, there is concern in parts of the community that the pace of change will accelerate, leading to substantial unemployment in the future. But dire employment scenarios remain speculative given the considerable uncertainty about the impact of automation on employment.
Past experience with structural change suggests some workers will find it difficult to secure new jobs. Government should focus their efforts on assisting displaced workers and resist pressure for industry protection or assistance.

92 DIGITAL DISRUPTION: WHAT DO GOVERNMENTS NEED TO DO?
3.5 Trends in labour income
As discussed, technology can change the nature of labour requirements — including reducing the demand for some types of workers (such middle-skilled workers), requiring workers for less hours (increased demand for part-time workers), and increasing the demand for highly-skilled workers as well as those in the lower-skilled jobs. These changes can have flow on effects to the distribution of labour income.
Wages in Australia have increased at all income levels over the past two decades, but more at the top
Over recent decades, average real incomes have increased substantially in Australia for full-time, part-time, and self-employed workers (Greenville, Pobke and Rogers 2013). While growth in income has been experienced across the income distribution, growth in earnings has been much higher at the top for full-time workers. Between 1988–99 and 2009-10, weekly incomes increased by approximately 85 per cent for those in the highest income decile, compared to approximately 38 per cent in the lowest (figure 3.6). In contrast, growth in part-time average incomes has been more evenly spread among part-time workers, with strong growth in average weekly earnings at the bottom three deciles (Greenville, Pobke and Rogers 2013).
Figure 3.6 Change in average weekly full-time labour earnings by decile
1988-89 to 2009-10 (real 2011-12 dollars)
Source: Greenville, Pobke and Rogers (2013).
Previous Commission research found that given relatively stable working hours among full-time workers, the growth in average incomes appears to be driven by substantial increases in average hourly wages. For part-time workers, rising average wages and
0 20 40 60 80 100
1
2
3
4
5
6
7
8
9
10
percentage change FT worker income

WORKERS AND SOCIETY 93
working hours have both contributed to rising hourly wages (Greenville, Pobke and Rogers 2013).
The role of technology
There is widespread agreement that technical change has increased demand for high-skill workers, most of whom earn wages at the higher end of the income distribution (Acemoglu and Autor 2011; Goldin and Katz 2010; OECD 2011). But as wages are set by both supply and demand for skills, an increase in demand for high-skilled labour explains only part of the picture. The supply of skilled labour also matters. In the United States, a sharp decline in the growth rate of college educated workers in 1980s has contributed to a widening in the college-skill premium (Goldin and Katz 2010). However, in Australia, there has been strong growth in the proportion of the working aged population with a bachelor degree qualification over the past two decades (ABS 2015).
While increased demand for skilled labour has been a factor in the widening of the wage-income distribution, there are a range of other factors, such as globalisation and de-unionisation, that are likely to have also contributed (Checchi and García-Peñalosa 2008; OECD 2012). Furthermore, preliminary OECD research (2016c) suggests the increase in the distribution of wages may also be driven by more productive firms capturing innovation rents (‘winner-takes-all’), allowing those firms to pay higher wages.
Addressing a widening income distribution
A widening in the distribution of income has potential social ramifications. Yet the solution is not to impede change but instead to ensure that prosperity is shared through the development of appropriate structures.
Raising the rate of educational attainment will play a role. Continually increasing the effectiveness of primary and secondary education, as well as equipping workers with relevant skills (section 3.3) will assist in ensuring a more equitable distribution of labour income (Autor and Acemoglu 2012). But there are concerns that ‘more and better education’ may only be a partial solution. For many, barriers to education also include physical location and socioeconomic factors, which will need to be overcome (Aird et al. 2010; Scommegna 2013).
Australia has one of the most progressive tax and transfer system in the world and redistribution through this system addresses some current inequality — and will likely do so into the future (Commonwealth of Australia 2008; PC 2015d). Taxes (which are levied progressively) and direct payments and in-kind government payments (such as subsidised healthcare and education) have a significant redistributive effect on final income (Greenville, Pobke and Rogers 2013).

94 DIGITAL DISRUPTION: WHAT DO GOVERNMENTS NEED TO DO?
FINDING 3.5
Wages in Australia have increased at all income levels in recent decades, however they have increased more in higher deciles. Technological change that increases demand for high skilled workers has played a role in the widening of the wage distribution.
Ensuring the benefits from future technological change are shared will be an ongoing policy challenge for government. Raising the supply of skilled workers will be part of the solution, along with the continued role of Australia’s tax and transfer system in reducing income inequality.
3.6 Technology can enable participation in the workforce
While a range of factors affects labour force participation, the effect of technology on participation is likely to be minor compared to expected demographic trends (box 3.5). But technology may have larger effects on labour supply among certain demographics, when it improves their ability to enter the labour market.
Box 3.5 Long-term trends in labour force participation Short- and long-term labour force participation rates are affected by several factors, including educational attainment, real wages, Australia’s migrant intake, availability of welfare payments and cultural expectations (such as the role of women in raising children and their participation in the workforce during this time).
Over the previous three decades, Australia’s labour force participation has grown, with strong growth in female participation offsetting the decline in male participation. General education levels among the labour force are increasing as more people complete post-secondary education and as more skilled migrants arrive in Australia. However, over the next 40 years, the proportion of the population participating in the labour force is expected to decline due to population ageing. Sources: Connolly, Davis and Spencer (2011); Hajkowicz et al. (2016); Greenville, Pobke and Rogers (2013); The Commonwealth of Australia (2015).
Technology decreases the costs of job search
Technology has lowered the transactions costs of entering the labour market. Throughout the 2000s, the majority of job advertisements migrated from off-line sources, such as newspaper classifieds, to internet job sites (ANZ 2016).

WORKERS AND SOCIETY 95
By offering more open access to job listings, as well as company and career information, the shift to internet-based job search has reduced the cost of looking for a job (Stevenson 2008). In turn, employer and employee matching has improved, as candidates can undertake more comprehensive search processes and better assess if a job is suitable (Mang 2012). Compared to other job-search methods, internet-based job search has also been shown to lower unemployment duration by approximately 25 per cent (Kuhn and Hani 2011).
New ways of engaging and sharing information online may further these trends. Personal and professional networking websites, such a Facebook and LinkedIn, help employees leverage personal connections in their job search — historically a highly effective method (Kuhn 2014). The rise of employer-review platforms may further help employees assess if an employer is right for them (appendix B).
Technology introduces new opportunities for workers on the fringe of the labour market
As discussed above, the gig economy is expanding the scope of work that can be undertaken on a part-time or freelance basis. Offering greater control over working hours may improve engagement among those for whom standard forms of employment are not suitable, for example, those seeking a flexible transition into or out of employment, and among the underemployed.
Of the 1.6 million Australians who are un- or underemployed, about 800 000 reported they are impeded by ‘ill-health or disability’, ‘unsuitable hours or location’ or ‘considered too old’, among other reasons (Minifie 2016). The greater use of technology (in particular information and communication technology) has and will continue to facilitate opportunities for workers who have traditionally found labour market participation difficult. More industries may introduce ‘telecommuting’ or other work-from-home arrangements as the need for workers to be co-located is reduced. Developments in assistive technology — such as mobility aids, communications and information equipment — are likely to promote employment among people with disabilities. New technologies such as simplified touch screen and automated vehicles can assist workers to participate effectively where disabilities had previously precluded them from employment (King 2011b). Apps such as AntzFree allow people with limited use of their arms to control their devices (Hasse 2016). Talkitt translates unintelligible speech for people with speech challenges into intelligible speech. Greater geographic flexibility also widens the area over which workers can seek employment, transforming some labour supply markets from regional to national markets.
Governments can assist workers with a disability in accessing the hardware and software they need to participate. Improved broadband access, and training in the skills to engage, may also assist some workers to participate in the labour market. The National Disability Insurance Scheme has developed a strategy for the adoption of assistive technology, and in trial sites 39 per cent of participants’ broader plans include assistive technology, rising to 45 per cent for those aged over 45 years (NDIA 2015).


GOVERNMENT ROLES 97
4 Government roles
Key points • Governments influence the development and pace of adoption of new technologies.
– Risk-based approaches are needed to ensure regulatory frameworks do not act as barriers while maintaining regulatory objectives. Similarly, a light touch to standards is required, with attention on improving interoperability of technologies.
– Governments can encourage innovation by: being adopters of innovative technology; delivering a business environment that is consistent, understood and not unnecessarily regulated; and removing regulatory and network impediments to innovation. Data — held in both the public and private sector — is a resource for future innovation, and governments can improve its accessibility.
• Governments have a role in mitigating adverse economic impacts and risks to individuals, consumers and the environment that may arise from digital disruption. – Digital platforms can provide consumers with more information. This reduces the need for
some regulation to protect consumers but can require frameworks to: ensure information integrity; uphold quality and safety standards; and address negative impacts on the broader community.
– New technologies can raise social concerns, such as with risk-based pricing of insurance, stem cell technology and the ethics of some robot uses. Yet governments should ensure that restrictions on the use of new technologies are essential to safety or a similar public interest objective and actually reflect the risks involved.
– With more pervasive collection of data, different measures may be needed to ensure adequate privacy protections. Cyber security is essential for the full value of the digital economy to be realised.
• There are numerous examples, particularly in on-the-ground service delivery, of Australian governments using technology in innovative ways. But governments continue to lag households in their technology uptake and there remains considerable scope to use digital technologies to improve processes. – New technologies can make regulation and engagement with regulators less
burdensome and more efficient, and improve compliance monitoring. – Automation and integration of human service delivery could reduce costs, allow better
targeting of services, and facilitate greater consumer choice. – Use of remote monitoring, such as through remotely piloted aircraft and embedded
sensors, could improve the provision of government services, including better planning, management and funding of public infrastructure.
• Changes are needed to enable digital technologies within government, including through: procurement policies; development of skills, culture and coordination across agencies; and a shift to more open policy development processes. Governments need to use digital technologies to improve transparency and enhance confidence in government policies and processes.

98 DIGITAL DISRUPTION: WHAT DO GOVERNMENTS NEED TO DO?
The focus of this chapter is on what governments may need to do to: facilitate the adoption of and innovation in digital technologies; manage or mitigate the risks posed by these technologies; and harness these technologies to improve their own functions.
4.1 Government activities that influence development and adoption of technology
Governments can retard, facilitate or act neutrally in the adoption and development of new technologies. Of particular importance is the creation of environments in which innovation and adoption of digital technologies is possible. The key aspects of government activities that influence these environments include: adaptability of regulatory frameworks and standards; the availability of resources such as data, on which new business models can be formed; and the focus and predictability of the policy environment, including government policies aimed at directly promoting innovation.
Regulatory frameworks need to be adaptive
There are compelling grounds for regulation, for example to reduce information asymmetries, limit abuse of market power, address externalities (such as pollution), or achieve social goals. But regulation can explicitly or indirectly hinder the development and adoption of some technologies, or intentionally or unintentionally restrict how an activity is undertaken. It can also protect incumbent firms from competition. Getting the most from technological change requires an adaptive regulatory approach.
New business models using digital technologies may not fit neatly within existing regulatory regimes and some operate in regulatory grey areas (PC 2015b). Concerns raised mainly relate to consumer protection, taxation, and inequitable treatment between novel and traditional business models. These concerns have typically emanated most loudly from incumbent competitors in more heavily regulated markets (chapter 2). As noted by Samuel (former chair of the Australian Competition and Consumer Commission and current head of the Victorian Taxi Services Commission):
The strongest resistance comes from those vested interests who have operated in the comfortable business environment of limited competition, either price or quality related …
And the transformation is really only disruptive in industries where technology and business models are attacking arcane paradigms, in many cases protected by burdensome regulations designed to protect incumbents from the harsh disciplines of competition. (Schliebs 2016)
Rather than extending existing regulations, governments should use such disruption as an opportunity to reassess risk and adjust regulation accordingly. New business models may well pose less risk than existing models. The Commission, in its inquiry into Business Set-up, Transfer and Closure (PC 2015b), recommended that all jurisdictions should have a framework for providing fixed-term exemptions from regulatory requirements that inhibit

GOVERNMENT ROLES 99
the entry of new businesses (with regulators able to impose conditions to protect consumers, public safety or the environment). Accordingly, the presumption would be in favour, not against, new entry, but new entrants would be required to satisfy policy objectives (such as ensuring consumer safety objectives are met). Such a framework would provide new entrants with greater regulatory certainty, ensure regulatory objectives are maintained and motivate a review of the merits of retaining certain regulatory requirements for all businesses. A key feature of this framework is a regulatory focus on outcomes and not the technology used. This puts the emphasis on monitoring outcomes, such as emissions, service quality, and any harm that results from the use of products.
Where there is considerable uncertainty about the impacts on individual consumers or market segments, an alternative is to use a ‘regulatory sandbox’. This approach, which is being tested for fintech in the United Kingdom and in Australia (by the Australian Securities and Investments Commission), allows firms to offer new products free from some regulation to a sample of consumers, but subject to a set of criteria aimed at managing risk.
A regulatory pause for new products and business models, where the risk is clearly not catastrophic, gives firms an incentive to ensure they do manage their risks. And where these are different from incumbents, this avoids burdening new business with the same regulatory approach in an attempt at some sort of equality of treatment. Simply extending regulation without an assessment of its consequences and differences in risk between traditional and novel business models will merely quash innovative new approaches, ensure consumers pay higher prices than they otherwise would, and reduce choice. For example, taxi regulations governing kerbside hailing of taxis to protect drivers and ensure customers that drivers are legitimate may not be necessary for pre-booked ridesharing services, and so regulations might remain relevant to the former business model, but be an unnecessary restriction on the latter. The regulatory responses to Uber illustrate how regulation can accommodate or quash new business models (box 4.1).
Adaptive regulation is risk based
A risk-based approach requires regulators to focus their efforts on activities or technologies that present the greatest risk — based on both the likelihood of a firm failing to meet a regulatory objective and consequences or severity of harm that occurs if the objective is not met. That is, different technologies and/or business models are recognised as presenting different levels or types of regulatory risk. Some risks may be catastrophic, such as unregulated medications that can result in the loss of lives. Other adverse events may involve less significant costs. For example, unless the sharing economy grows considerably in size, the potential evasion of tax payments by new participants may not involve sufficient losses to warrant new compliance measures.
However, where the advantage of a new business model is driven by the scope to avoid taxes, ensuring a level playing field is an important role for regulators. One advantage of digitally intermediated markets is that electronic payments are easy to track and so the cost

100 DIGITAL DISRUPTION: WHAT DO GOVERNMENTS NEED TO DO?
of ensuring equitable treatment is lower than in other areas of black market activity. In seeking to enforce regulations, governments need to assign the responsibility to those entities that have control. This applies in reporting income to tax authorities, and in managing risk, such as through implementing checks on subcontractors who deliver services intermediated by the platform. On this basis, digital platforms that only provide a marketplace should have less responsibility than those that offer rankings or value add products. Customers should be fully informed as to how the responsibility, and any application for redress, is assigned where services are intermediated by a platform provider.
Box 4.1 Regulatory responses to Uber Uber, which is a ride sharing service, has proven to be disruptive to existing regulated taxi services. As Samuel was recently quoted:
What is the Uber disruption all about? It is not a digital disruption, rather it is a business model disrupting an arcane, over-regulated, anti-competitive business model that a long time ago ceased to meet the needs of its customers. (Schliebs 2016)
State and Territory Governments have generally been reviewing their regulatory regimes, but regulatory responses to date are mixed:
• The ACT and New South Wales have both announced changes to allow ridesharing services, subject to some compliance obligations such as licensing, background checks, vehicle inspections and maintenance and insurance requirements. To offset the impact on the taxi industry, the ACT has reduced annual fees for taxi licences and hire car licences, while New South Wales will offer compensation financed by a $1 levy on taxi and Uber fares for the next five years.
• Western Australia and South Australia have also announced interim changes to allow the operation ridesharing services, commencing later this year. In Tasmania, bills to allow ridesharing services have passed the Lower House.
• The Victorian and Queensland Governments are still considering any regulatory responses to legalise the operation of ridesharing services. The Queensland parliament passed legislation in April 2016 to increase the penalties for illegal taxi services. In Victoria, an Uber driver was found guilty in December 2015 of operating a hire car without the right authority, but this was overturned on appeal in May 2016. While the decision was based on a legal technicality, it nevertheless suggests that Uber services can now be provided legally in Victoria unless the Government amends legislation or a successful appeal occurs.
• The Northern Territory Government has reportedly decided not to change regulations to permit ridesharing services.
The Uber case illustrates that seemingly disruptive new practices can be resolved relatively quickly, although a number of Australian jurisdictions are yet to act, and of those that have, there is apparently substantial variation in views of the risks posed by the new market entrant.
Sources: Baines (2016); Burke (2016); Daly (2016); Minifie (2016); Taylor (2016); Younger (2016).
A risk-based approach prompts regulators to recognise that there is a trade-off between administrative and economic efficiency costs and elimination of risk. Moreover, it is unclear that all risk can ever be eliminated. For example, reducing risk by restricting access

GOVERNMENT ROLES 101
to short term loans on digital platforms can increase risks elsewhere, in unregulated digital and non-digital forms. Although no two risk-based approaches are exactly alike, a well-designed and implemented risk-based approach has a number of core elements (PC 2013d) — these are described and illustrated (using ridesharing as an example) in box 4.2.
A key challenge for governments in adopting a risk-based approach is assessing what might happen without intervention. For new technologies with any credible risk of harm for people or standards of living, governments can draw on scientific agencies to assess the risks. Where products and/or business models are new to the world, or there is yet little evidence of the risks posed, unbiased expert opinion can be needed to sort through the under or over stating of risks by interested parties and to correct any community biases.
FINDING 4.1
The pace of change has implications for how governments undertake regulatory functions. Some regulations and regulatory approaches are explicitly preventing the development and efficient adoption of technologies. In principle, governments should: • adopt a ‘wait and see’ approach to new business models and products rather than
reacting quickly to regulate what may be unrealised risks • where relevant regulations already exist
– adopt fixed-term regulatory exemptions for innovative entrants that maintain overarching regulatory objectives (as recommended by the Business Set-up, Transfer and Closure inquiry)
– use the opportunity of disruption to reform markets where there have been undue regulatory restrictions by removing restrictions that impose a competitive disadvantage on incumbents rather than extend existing restrictions to new business models
• where regulation is needed to manage negative externalities, take a proportionate approach (that is, balance the benefits and costs) and regulate outcomes not technologies
• take an evidence-based approach drawing on Australia’s scientific agencies in making assessments of the risks to the community from new technologies
• regularly review regulations affected by digital technologies, especially where an increasing share of activity is mediated through digital platforms
• assign the responsibility for reporting to the parties best able to comply at least cost, and design transparent mechanisms for dealing with complaints.

102 DIGITAL DISRUPTION: WHAT DO GOVERNMENTS NEED TO DO?
Box 4.2 Core elements of a risk-based approach to regulation • Defining desired outcomes and identifying risks — For example, the desired outcome
from use of a ride sharing car service may be a safe journey; risks may include that the driver has poor or dangerous driving abilities, that a vehicle is of low quality, or that personal safety of the driver or passenger may be violated by sharing a vehicle with an unknown person.
• Determining the community appetite for the particular risks — In some cases, determining community tolerances for risks can be difficult to determine. The popularity of legal ride sharing services suggests that the community is tolerant of whatever risks are perceived to exist, in part because the supplier and regulations have addressed the substantive risks (as noted below).
• Risk assessment — A risk assessment should include determination of the likelihood and potential impact of an adverse event, the expected value of that impact and the costs and benefits of any regulatory action or inaction. For the three potential risks associated with ride sharing services discussed above, the likelihood of an adverse event seems to be low. The fact that all Australian drivers are required to demonstrate a minimum level of competency to hold a licence, that the quality of cars is regulated through standards, vehicle registration processes and by some ride sharing services themselves, and that many ride sharing services have a rating scheme to make transparent any problems with particular drivers (or riders), may serve to substantially reduce the likelihood of such risks. The accident, personal safety and other risks of ride sharing services compared with taxis, public transport and private methods of transport do not appear to have been systematically assessed in Australia or overseas yet (LaFrance and Eveleth 2015), but it is not clear why ride-sharing could be expected to be higher. Further, the pre-booking and prepaid nature of many rideshare services reduces the risks associated with not knowing the identity of drivers and customers. Privacy concerns have been raised in the United States, but Uber has taken action to address some of these following court actions (Ribeiro 2016).
In terms of possible costs and benefits of any regulatory action, Minifie (2016) notes that holders of recently purchased taxi licences in Melbourne may incur substantial losses on their investment if ride sharing services were immediately permitted in that city. Minifie also notes substantial benefits for the community associated with lower priced (and often more reliable) transport services.
• Prioritising risks — To assist in compliance monitoring and enforcement, the information generated by risk assessments should be used to prioritise risks. For example, ride sharing services without any background checks on drivers or that do not enable consumer ratings may be of higher risk.
• Implementation and allocation of resources — Compliance and enforcement measures chosen should be appropriate to the level and nature of risk and reflect the prioritising of risks. For example, a suspended driver operating a ride sharing service should arguably attract higher penalties than other private drivers caught driving when suspended. Consideration of alternative ways to achieve the same/similar desired outcomes is important.
• Reviewing outcomes — Once adopted, a risk-based approach should be regularly reviewed to improve the quality of information on risk levels and likelihoods — recognising that some risks may dissipate over time, new risks may emerge with changing business and economic conditions, and some risks may be interconnected.

GOVERNMENT ROLES 103
Standards
Standards play an important role in facilitating the adoption of new technologies. Mandatory minimum standards are set to ensure products and processes meet a threshold for product performance and/or safety and to avoid undue risks for consumers. The claim of meeting a standard, such as a product energy rating, is also enforced by certain regulators. In this way, standards help address information asymmetries between producers and consumers. For firms, compliance with developed standards is often used as a marketing point. In addition to this role in quality assurance, standards can also facilitate interoperability. This can be important for all technologies, but because of the network characteristics, interoperability is particularly important for innovation and adoption of digital technologies. Some have estimated that interoperability of devices (primarily in factories, cities and retail environments) is needed to enable around 40 per cent of the potential value of the internet of things (ACMA 2015). The ability of sensors to link to communication channels, for example, is needed for the use of autonomous vehicles (appendix D). In some sectors (such as healthcare), proprietary protocols and interfaces can greatly restrict interoperability and data sharing, to the detriment of efficient and effective service provision (Cantwell and McDermott 2016).
Some standards are enshrined in legislation or implemented as binding regulations — for example, the compliance standards for new vehicles set by the Australian Design Rules, and automotive emission standards. However, many — including those developed by the accredited non-government body, Standards Australia — are not legally binding unless referred to in legal instruments, such as regulations.
With growing cross-country digital connections and the globalisation of production, the importance of international standards is increasing. There is a range of international standards organisations that facilitate development of common international standards, including the International Organization for Standardisation (ISO) and the International Electrotechnical Commission. The World Trade Organization Treaty on Technical Barriers to Trade requires that there should be harmonisation and the adoption of international standards where they are available, and there are no regional or national characteristics justifying alternatives.
Standard setting can give an advantage to incumbent firms
While standards can facilitate the development and implementation of new technologies, they can also lock in existing technologies and stifle innovation, particularly if they are overly complex. The Competition Policy Review noted that:
… on occasion, the way standards are adopted or referenced in law provide unnecessarily high or differential requirements for goods or services, dampening competition or creating barriers to market entry and innovation. (Harper et al. 2015, p. 136)
A ‘proprietary’ standard evolves where one firm’s product becomes so dominant within the market that the specifications of that product become a de facto standard that is adopted by

104 DIGITAL DISRUPTION: WHAT DO GOVERNMENTS NEED TO DO?
other businesses. Examples of proprietary or de facto standards include products such as Windows operating systems, and more historically, VHS videocassette recorders and mains electricity voltages. Interoperability can be constrained by use of proprietary systems. For example, the scope to improve health care relies on all those involved in the management of a person’s health being able to share information. As Cantwell and McDermott (2016), in setting out the need for adoption of public rather than proprietary standards, explain:
Rather than continuing to be constrained by the high-cost, proprietary status quo, health systems and providers should demand and adopt a platform that is standards-based, addresses one-to-many communication, allows two-way data exchange in real time, and enables plug-and-play integration of devices and systems. (p. 2)
Electricity markets are one area where there is a need for standards that enable interoperability with emerging technologies and do not give advantage to incumbent distributors. In particular, smart meters should be subject to an appropriate minimum standard (preferably internationally accepted) that supports interoperability with add-on technologies, and allows several parties to access data (PC 2013b). Distributors should not have a monopoly on the provision of advanced metering infrastructure, with third parties also able to install add-on technologies and higher-functionality smart meters.
A light touch to standards is required
As many standards are developed by non-government organisations, or evolve as de facto standards, the role for government often requires a light touch aimed at facilitating new standard setting and adoption. Williamson et al. (2015) drew the following conclusion about the design of new standards:
A larger number of simple and lightweight standards of limited scope has led to an explosion of innovation on the internet, and seems a valuable approach more generally to enable the adoption and development of new technologies. (p. 205)
Standards Australia told the Productivity Commission that the role for government should be to:
• be proactive in working with industries, community interests and third sector partners; • be open to changes to policy settings and structures to enable change; • approach potential change from disruption through a best practice regulatory lens; • engage and consult with Australian industry to allow for opportunities to be embraced in all
sectors; • adopt international practices where we can when looking at disruptive change.
(Comment 3, p. 2)
Where there is a stronger case for government involvement in standard setting — for instance, for public infrastructure, or where safety objectives justify mandated technical standards in regulation — similar approaches should be adopted as for other standards and regulation more generally. That is, standards should be the minimum necessary to achieve the regulatory objectives, should be outcome focused and not overly complex or
GOVERNMENT ROLES 105
prescriptive. For example, the outcome focused strengthening of motor vehicle emission standards to an announced timetable (cheating by manufacturers aside) has motivated the development of more efficient engines (Lutsey 2012).
Adoption of relevant international standards is one way to ensure interoperability of technology across country borders. In those areas where Australia is making a substantial contribution to technology development or its application, and standards would likely have a significant impact on that contribution, the government should ensure that international standards do not inhibit technological development or impose additional costs on Australian businesses or the community. Where Australian technology is considered to be superior to that overseas, the government should advocate for international standards to be based on Australian technology, provided this is likely to deliver net benefits to the community as a whole (not just to individual businesses).
Timeliness is also important and standards should be subject to regular review to ensure that they remain relevant and are not unnecessarily impeding the adoption of new technologies.
FINDING 4.2
Governments do not necessarily need to be involved in the development of standards, but where standards are mandated (as a form of technical regulation), following good regulatory principles would mean that standards: • are the minimum necessary to achieve regulatory objectives • maximise interoperability • follow international standards where practicable and relevant, unless use of
standards based on Australian technology would deliver higher net community benefits
• are developed in consultation with the private sector.
In negotiating international standards, the interests of the Australian economy rather than individual businesses should be of primary consideration.
Improving the availability of data
Digital technologies are largely about exploiting the collection, transmission, storage and analysis of data. Data as a key input into business is a distinguishing feature of the current wave of transformative business models (chapter 2). For example, a peer-to-peer business mediated through a digital platform sorts through large quantities of customer and supplier data to find a match (Riemer et al. 2015).
Data can also be an important output of some technologies. Mobile phones, for example, generate massive quantities of data that phone network providers collate. This, in turn, can

106 DIGITAL DISRUPTION: WHAT DO GOVERNMENTS NEED TO DO?
be used for purposes as diverse as traffic flow monitoring and national security. Sensors in all sorts of places generate huge quantities of data that could be used to improve the delivery and quality of products or services. However, much of this data generated by digital technologies is not yet used — Geoscience Australia (2015), for example, indicate that limited capacity to integrate different data streams and to process the sheer volume of satellite data are preventing its full value from being realised.
With the growing importance of data to the economy, the scope of governments’ role with regard to data is becoming more apparent. This may include: establishing data ownership frameworks; requiring public provision of data in specific circumstances; protecting data privacy and security (section 4.2); and making use of data for improving government activities (as discussed in section 4.3). The Commission is examining the roles for governments in its current Data Availability and Use inquiry.
Government roles in data ownership frameworks
Unlike physical property, the ownership of data can be less clear cut (given it can be held simultaneously by multiple parties). The most obvious contention is between those who collect data (or commission its collection) and the parties that are the subject of the data. Issues about the rights of data subjects are important because they can affect what data collectors can do with data, whether that be in-house analysis or sale to third parties. As with other assets, governments can have a role in establishing guidelines or laws on what constitutes ownership of data, how that ownership may be transferred, and the circumstances under which the right to use data may be implied, assumed or granted. Ideally, any such guidelines or laws would be clear, consistent between jurisdictions (given the boundary-free nature of much data use), and take into account the variety of ways that data is now being generated through technology.
Government roles in data access
Because data is an increasingly important resource for new technologies and business models, there can be large potential benefits from increasing access to, and use of, data. These benefits can accrue to businesses — for instance, through the adoption of more efficient business processes or through exploiting new market opportunities. But there can also be wider benefits, including: evidence-based policy design; improved outcomes for consumers through new product offerings; greater competition; and increased access to information, which can reduce search costs and information asymmetries.
Where datasets could be used to generate benefits for the community (not just for the data holder), governments may consider ways to ensure such datasets are broadly accessible, including to researchers. Whether this data is held by a public sector agency or a private entity, has been collected for a specific purpose under contract or legislation, is of a private or commercial-in-confidence nature, and is in a state that could be readily analysed, are among some of the considerations in making a dataset available to third parties. While

GOVERNMENT ROLES 107
improved access to some datasets is likely to provide potential benefits, it also has attendant costs. Accordingly, there are questions for governments about determining which datasets should be prioritised for release; the format in which they are released, including the appropriate degree of de-identification, processing and cleaning. Access may also be virtual, where the data can be queried while records on any individual or business remain encrypted or otherwise protected. How data provision is funded, including which data is provided freely and where user charges are appropriate is another important consideration.
Innovation policy needs to evolve
Innovation — as the source of technological progress — has always drawn on preceding scientific developments, combining knowledge in new ways to develop better products, and new ways of producing and delivering these products to consumers. However, innovation is itself changing in terms of the fields of inquiry, who is undertaking it, where it is being undertaken and how. As discussed in chapter 2, digital technologies have increased the scope for entrepreneurs to harvest the existing research findings to develop new products. Digital technologies also enhance the scope for research into improved manufactured goods (such as pharmaceuticals and batteries) and services (such as logistics, and medical practice), although investment in research in these areas is often larger and needs to be more patient.
Given these developments, government involvement may need to change in order to best enable innovation and maximise its benefits. Government involvement in innovation currently includes:
• Developing technology directly. Governments are the main funders of transformative and ‘blue-sky’ research through universities, cooperative research centres, and organisations such as the Commonwealth Scientific and Industrial Research Organisation (CSIRO). This study does not seek to address the adequacy of either the quantum or allocation of government funding for research.
• Adopting technology in their service delivery and other processes. How governments go about incorporating digital technologies into their three core functions — regulation, taxation and spending — influences the cost and the effectiveness of their activities. Government innovation in its own functions is discussed in more detail in section 4.3.
• Creating environments that enable others to create and adopt technology. Governments set the policy environment within which others develop and adapt innovative technology. As discussed, regulation plays a key role in managing the risks posed by new technologies, and a permissive rather than restrictive approach supports more innovative activity. But government can also be more proactive, which is the focus of this section.
In addition to ensuring the broad economic framework remains conducive to innovation, governments usually want to be proactive in encouraging innovation. However, as outlined in numerous Commission inquiries (PC 2007, 2015b), there should be clear and credible

108 DIGITAL DISRUPTION: WHAT DO GOVERNMENTS NEED TO DO?
rationales for government to provide public support for innovative activities and the likelihood that such action will provide net national benefits. These help safeguard against governments fulfilling requests for industry assistance under the guise of innovation policy, or introducing a new set of distortions (an issue discussed further below).
The role of collaborative networks
While much innovative activity is freed from locational constraints by use of digital technologies that are less reliant on physical resources, the value of networks and clustering remain (chapter 2). The effectiveness of, and need for, government incentives in establishing such networks is questionable. In its Business Set-up, Transfer and Closure inquiry report, the Commission concluded that the creation of an innovative ecosystem cannot be driven by government — they are but one player in a much broader system (PC 2015b).
Yet the very low levels of collaboration between the research community and business in Australia suggest the presence of barriers, some of which government may be able to lower (when last included in the OECD survey, Australia was worst out of 33 OECD countries on the share of businesses that collaborate with research institutions — OECD 2013b). These barriers range from perceptions of high transaction costs relative to expected benefits, to the reward structure facing academics (where performance is measured in terms of publications and tenure is highly valued). In these situations, government may be able to play a role in facilitating greater research co-operation and collaboration. Co-operative research centres (CRCs) are an example of a long-established Australian government initiative to foster collaborative arrangements between the research community and industry. But CRCs tend to suit large scale, long-term research projects and large firms, which can make a substantial financial contribution and bring the technology to market (PC 2007). The changing nature of the players in the innovation space suggests a different approach is needed that can involve small firms and organisations seeking to collaborate in new and emerging technologies (PC 2015b).
One approach is to lower the transaction costs of establishing collaboration. Having a central hub can increase the probability of finding the required matching skills, ideas and venture capital, although innovation is now often undertaken through a range of smaller sites and hubs, or over widely distributed networks. Government policies should facilitate and not impede the development of virtual and physical hubs where researchers, entrepreneurs and firms can meet to bring a product from conception to market. However, given the proliferation of private sector innovation hubs, it is unclear that there is a need for governments to be proactive in either the creation or operation of hubs (PC 2015b). Indeed, governments need to take care not to create a plethora of networks that crowd each other out and undermine the benefits that each network brings (OECD 2015b).

GOVERNMENT ROLES 109
Investment may be hindered by thin markets but government intervention may not help
Also open to question is the effect government can have on investment in innovative technologies. The Australian Government’s Innovation Statement (Turnbull 2015) sets out a proactive approach to supporting innovation. The 2016 budget introduced new tax concessions for eligible investors in young businesses that include both an exemption on capital gains tax for investments and a non-refundable carry forward tax offset on investments in a qualifying ‘early stage innovation company’ (ATO 2016). It will be important to evaluate the effectiveness of these measures in stimulating innovative activity in the coming years.
Other approaches include the provision of early stage grants or concessional loans. While government notionally gains a return in eventual tax revenue paid by successful businesses (that would otherwise not have eventuated) or repayment of loans, it is far from clear that the potential returns justify these kinds of policies or that they will necessarily become self-sustaining (that is, have a net positive effect on the budget bottom line).
Such programs are usually premised on claims that traditional investors, such as banks and superannuation funds are excessively risk averse when faced with highly uncertain prospects of early stage projects. Moreover, the asymmetric treatment by government of tax losses and profits is likely to reduce incentives for risky investments, and the pragmatic limitations of addressing this asymmetry is sometimes used to justify alternative policies.
A critical mass of investment opportunities can increase the attractiveness of an area to early stage investors and make worthwhile the time and costs spent understanding the market opportunities and local regulatory environment. One claim often made is that government investment can help achieve this critical mass by boosting the attractiveness of the investment environment to venture capital. Yet often, government investment ends up taking on the downside risk, but does not benefit from the upside. For example, the Australian government venture capital investment scheme that ran from 1998 to 2014 returned 42 cents in the dollar for the government and $1.13 per dollar for the private sector investors (PC 2015b). There is also little evidence internationally to either support or refute the importance of government policy in developing a thriving local venture capital market. Among possible exceptions is Israel, where government investment in venture capital, coupled with considerable government investment in R&D and defence procurement, appears to have resulted in the development of a sustainable venture capital industry.
But funding is often not the missing ingredient in driving innovation. In contrast with innovations that require costly physical prototypes, digital innovations often have lower development costs that can be more readily financed by entrepreneurs themselves (mortgages on homes, credit cards and family are common sources of seed funding (PC 2015b)). A number of studies have found that there is a shortage of the skills needed to

110 DIGITAL DISRUPTION: WHAT DO GOVERNMENTS NEED TO DO?
bring products to market in Australia (PC 2015b). Options to promote skills development are examined further in chapter 3.
Policy uncertainty can hold back innovation
Large-scale capital investments in technologies are difficult for firms to make unless they have some confidence that the regulatory regime will not undermine their business model. As one commentator recently noted:
There should be a focus on creating policy and regulatory stability. Entrepreneurs are good at optimising new technology and business models to deliver the best outcomes, but they cannot hit a moving target created by political, policy, or regulatory instability. (Blackhall 2016)
The need for certainty is exacerbated by the often long time frames involved in investments and in some cases, because the timing or nature of technology adoption reflects regulatory requirements. For example, Australia’s energy future is path dependent, so clarity about standards, trading rules and other regulations that will govern market conduct for some years will assist the development and adoption of technologies that support more distributed production models (appendix E).
Projects where technology takes a very long time to either be implemented or to generate positive outcomes for its developer are also influenced by policy uncertainty. The Australian Industry Group (Comment 5) noted that changes to the National Broadband Network that followed the change in Australian Government in 2013 created considerable uncertainty for businesses. As a further example, greater certainty about the timing of moving to a low carbon economy, even if there remained uncertainty about the implicit carbon price to achieve this, would assist markets to determine lower cost pathways to reducing greenhouse gas emissions. Similarly, clarity on the responsibility of producers or consumers for a product over the various phases of its life cycle would assist the market to move toward the ‘circular’ economy (where all materials are eventually recycled, thereby removing what may be an eventual limit to economic growth) (Schwab 2016b).
Policy certainty, however, is not an end in itself. Governments should not, for the sake of preserving certainty, be trapped by regulations set in different environments or where the initial regulation was mistaken. If they were so trapped, Uber would remain illegal. There is therefore a tension between the desirability that regulation adapts to the digital economy and the value of certainty. Outcomes-focused regulation is a major step. But clearly there are situations when changes are needed, even if this undermines certainty. The other important implication is that policymakers should undertake more analysis prior to regulating, particularly where the regulatory outcomes are hard to reverse.
Improving the quality of cities to attract high tech firms benefits all
One of the consequences of the importance of physical clusters for innovative start-ups and innovative activity is that higher skilled employment is likely to remain concentrated in

GOVERNMENT ROLES 111
cities (CEDA 2015). The attractiveness of Australian cities to highly skilled labour will play a role in the overall level of digital innovation in the Australian economy. This is an area where government policy and investment plays a key role (Kelly and Donegan 2015). High rates of population growth in Australia’s major cities are putting pressure on infrastructure, with congestion imposing considerable costs (BITRE 2015a).
Delivering more liveable cities benefits all who live there, but has the added bonus of being more likely to retain and attract the digital and other entrepreneurs who are important for driving innovation. There are many aspects to the ‘liveability’ of a city, including: population density; infrastructure and facilities (including transport, health and education facilities); cultural venues and events; community sense of connectedness and security; and environmental aspects (such as green space, air quality and natural landscape). Many of these aspects of liveable cities overlap with those evident in thriving entrepreneurial communities — in particular, proximity to large research or academic institutions, low cost capital, or proximity to infrastructure or highly skilled labour (PC 2015b). These features should provide focus to attempts to improve city liveability.
FINDING 4.3
Governments contribute to promoting innovation across the economy by delivering a low-cost operating environment for innovative activities. This could include: • removing disincentives for universities to work collaboratively with business and
encouraging the sharing of knowledge • ensuring transparent policy objectives and predictability in those areas most
affected by developments in technologies • improving the functioning of cities to attract and retain highly-skilled workers and
innovative firms.
4.2 Managing the adverse impacts of digital technologies
Governments need to balance the desirability of measures that manage any adverse impacts of disruptive technologies with any forgone social and economic benefits from the delayed or averted adoption of new technologies. The potential adverse impacts on competition have been discussed in detail in chapter 2, and those on the labour market in chapter 3. This section picks up some other broader areas where potential adverse impacts need government attention, including: consumer protection, social concerns arising from new technologies, privacy protection and cyber security.

112 DIGITAL DISRUPTION: WHAT DO GOVERNMENTS NEED TO DO?
Consumer protection
New technologies can pose new risks, and the task of governments and their regulators is to assess these risks and set regulatory requirements that are proportionate to the risk posed.
As discussed in chapter 2, Australian Consumer Law provides a broad framework for how all Australian businesses deal with consumers. It is designed to enhance market outcomes by: protecting consumers from unconscionable or deceptive conduct, and from unsafe or defective goods and services; providing consumers with remedies when they suffer loss from such conduct or products; and assisting consumers in making better purchasing decisions by providing product information.
Beyond this, there is a range of industry specific regulations in place, including business licensing, that provide further protection when it is considered to be difficult for a consumer to assess the attributes of a particular product or service prior to purchasing or the risk of detriment to the consumer is high. Such products need to be considered on a case-by-case basis. For example, cars are required to comply with Australian Design Rules (ADRs) and the adoption of fully autonomous vehicles will require alteration to ADRs to incorporate the new technology.
But, more broadly, autonomous vehicles provide many regulatory challenges, as set out in the recent discussion paper by the National Transport Commission (2016b). For example, road rules that specify requirements that a driver must be in control of a vehicle may be redundant if vehicles are entirely autonomous. Differences between jurisdictions’ rules may be problematic for vehicles where compliance is software-based. Person-driven vehicles will need to coexist with autonomous vehicles during a transition period, although at some stage, the involvement of people in vehicle movement may need to be limited if the advantages of autonomous vehicles are to be maximised.
Such changes pose major regulatory and social issues, including in the determination of accident liability. Autonomous vehicles add new and more complex dimensions to liability assessment, including: defects in vehicle software or between-vehicle interactions; sensors in road or traffic infrastructure; and the rights of police and courts to the technology-generated data to assess liability. Until these regulatory issues are resolved, fully autonomous vehicles are likely to remain restricted to managed trials or private sites, such as Rio Tinto’s mining operations in the Pilbara.
Remotely piloted aircraft (RPAs), or drones, can also pose a risk to the public in terms of violation of privacy and the potential for collisions. The current regulatory framework predates (and did not foresee) the advent of the relatively small and easy to fly devices. One consequence of the outdated regulation is the anomalous situation whereby an RPA used for recreational purposes is regulated differently (and as if it posed a lower risk to the community) than one used in a similar way but for commercial purposes. The deficiencies of the existing regulatory framework have been widely acknowledged, but amendments to the regulation (which come into effect in September 2016) have taken several years to

GOVERNMENT ROLES 113
develop and are only partial. Notable modes of operation not permitted under the new regulations are autonomous flights and flights that are outside line-of-sight (appendix D).
More information for consumers can reduce the need for regulatory action
Sharing of consumer ratings of products and providers through digital platforms can reduce consumers’ purchasing risks (chapter 2). This reduction in information asymmetry imposes market discipline on providers in ways that were not possible when consumers could not share information on their experiences with infrequent purchases. The combination of digital platforms for service provision and use of social media may therefore reduce the need for regulatory oversight of some markets.
A persuasive illustration is that in the sharing economy, the expansion of transactions and the information exchange on performance can remove the need for regulation of minimum service quality and quantity restrictions — taxis, Uber and Lyft being exemplars (Koopman, Mitchell and Thierer 2014). Indeed, in some cases, pre-emptive regulations of the kind that have made ride-sharing services unlawful have impeded innovation and consumer choice. Of course, well before the advent of ride sharing, economists argued for deregulation of taxis because restrictions on licences increased prices. So, many of the gains that would occur from deregulation of ride services could have been gained through deregulation of taxis before the advent of the digital economy. One of the indirect effects of the digital age is that the conspicuous benefits of choice and service variety have strengthened the position of those in favour of less regulated markets. (The impending end of restrictions on parallel importation of books in Australia is another example.)
While the prohibition of ride-sharing services and the maintenance of quotas on taxi plates is a clear regulatory failure, examples like this cannot be generalised uncritically. For instance, it may be that some forms of regulation of ride sharing services might be justified — even if it amounts to monitoring. For example, are existing remedies for precluding exploitation of drivers effective? Is safety, in fact, adequate? Can we leave it to the discretion of the platform owners to ensure adequate insurance and driver background checks (which vary between competing providers)? Is surge pricing optimal? The answers to these questions might all be yes (especially when set against the background that product liability laws, driver licensing, motor vehicle registration and the common law can still protect consumers), but it is important to ask them. (Box 4.2 provides the framework to do this.)
The most important facet underpinning the scope for lower regulated consumer protections in the digital age is freely available and reasonably reliable information. In some cases, this may sometimes be difficult to achieve because consumers do not have the expertise to make the judgments (‘credence’ goods, such as pharmaceutical products that might have adverse health effects that are hard to isolate from other factors or products affecting a person’s health). But even for those products where consumers can assess quality, industry-developed standards or a regulatory framework may still be needed to assure consumers that the information provided is not fabricated.

114 DIGITAL DISRUPTION: WHAT DO GOVERNMENTS NEED TO DO?
But regulators may still need to ensure that information is reliable
While digital platforms allow the exchange of information, they can also be used to post misinformation, and risks arise if participants are able to game the system by posting positive ratings about their own products and negative ones about rivals. Consumers disgruntled for reasons unrelated to service quality (for example, hotel guests who are not permitted to smoke on the premises) may also post negative or misleading comments about the service. Yelp (a restaurant review site) identifies roughly 16 per cent of its reviews as being fake or suspicious, with this percentage growing over time (Luca 2011).
Most systems have some scope to identify such behaviour. For example, platform providers have information that can allow identification of consumers who provide inappropriate feedback, and enable a response by providers (appendix B). To manage this risk, Uber have reworked how passenger assessments are processed to give the drivers a right of reply. However, there are examples where providers can block negative feedback. For example, some short-term rental accommodation and online product providers have included gag (or non-disparagement) clauses in their contracts or purchase orders, threatening legal or financial penalties. California is one jurisdiction that has banned such clauses.
One aspect that can allow misleading and deceptive conduct to emerge is where product diversity has proliferated (such as in insurance and financial products) and it is difficult for consumers to make like-with-like comparisons. Some comparator websites can engage in misleading and deceptive conduct if the comparisons are incomplete, biased or driven by undisclosed commercial imperatives (ACCC 2014b). A recent example involved Energy Watch, which purported to provide objective comparisons of retail pricing for electricity and gas for consumers and businesses. However, Energy Watch’s comparisons only related to its ‘preferred’ providers, with whom it had a commercial relationship, and the estimated savings were found to be falsely represented (Polites and Adams 2012).
Given these emerging problems, there may remain a need for governments to ensure the operation of digital platforms is consistent with the principles of consumer protection and public safety. This could include: encouraging industry standard setting, including more consistency in language used to describe product features to improve comparability; and providing clarity for consumers and service providers who use platforms in how to make complaints and the redress available. This should include how to make complaints — such as about misinformation or restrictive trade practices — in regard to the operation of the platform itself.
GOVERNMENT ROLES 115
FINDING 4.4
To improve the reliability and usefulness of information provided by digital intermediaries governments could: • reduce regulations aimed at the provision of information on a product or service,
where consumers are more effectively able to get this information through another avenue (such as an online rating system)
• encourage digital platforms to develop industry standards to improve the reliability of feedback and right of reply and prevent the use of gag clauses on consumers
• encourage industries to develop a common or standardised language about product offerings to assist consumers in making comparisons
• ensure existing broader governance structures for consumer complaints are sufficient to give consumers and businesses confidence in the use of digital intermediaries.
The sharing economy has risks that need to be managed
Although digital technologies are improving the information available for informed consumer choice, there will be times when competitive pressures will not be sufficient to prevent consumers receiving a service or product that is unsafe or of lower quality than expected. Nor will rating systems always be sufficient to prevent these outcomes. In particular, regulation may still be needed where the activity has adverse impacts on people other than those involved in the exchange. For example, short-term rental accommodation can increase the wear and tear on common areas in apartment complexes, and anti-social behaviour and noise of short term tenants may be disruptive to other residents. While it is unclear how widespread such problems are, and there are some indications that complaints are very low compared with the sharing activity happening (Minifie 2016), there are almost certainly more adverse impacts than there would be without such activity and potentially less scope for those affected to directly seek redress.
A regulatory regime suitable for the level of risk imposed by the activities is required. For example, where Airbnb is used to rent out a room with the host remaining on-site, consumer safety could require initial vetting of potential hosts. Where Airbnb is used instead of a real estate agency to manage short-term rental accommodation, greater attention to managing the impacts on nearby residents may be needed. A recent study by the Grattan Institute (Minifie 2016) looked at the regulatory issues with the sharing economy in detail and makes a number of sensible recommendations in regard to regulatory requirements for new providers in the sharing economy.
The priority for governments in dealing with new business models should be to manage the potential costs and benefits to the community rather than protecting incumbent businesses from competition. In the context of Airbnb, for example, this would mean regulating (or more effectively enforcing existing regulations) for congestion, noise levels and consumer

116 DIGITAL DISRUPTION: WHAT DO GOVERNMENTS NEED TO DO?
protection in the same way that these issues are regulated more generally. Governments should also ensure there is a timely, transparent and effective avenue for handling community complaints.
More generally, existing regulations should not necessarily be imposed on potential new entrants, particularly where new entrants present negligible risk to consumers or others. Koopman et al. (2014) suggest:
The better alternative is to level the playing field by ‘deregulating down’ to put everyone on equal footing, not by ‘regulating up’ to achieve parity. Policymakers should relax old rules on incumbents as new entrants and new technologies challenge the status quo. By extension, new entrants should only face minimal regulatory requirements as more onerous and unnecessary restrictions on incumbents are relaxed. (p. 19)
That said, there are many areas where regulation remains justified, and just because it is intermediated through a digital platform does not mean that regulation should be removed (Blanchard 2015). For example, it is hard to see a case for deregulation of prostitution (where the regulation is to protect the sex worker from exploitation and for the health of the client and worker) simply because it is intermediated through a digital platform. Rather, such regulations should be extended to services intermediated through digital platforms.
Social concerns
New technologies can raise community concerns that go beyond the issues of consumer and community protection. These include questions about the moral or ethical acceptability of products supported by new technologies. Governments’ role when it comes to all new technologies is to set the bar based on well-informed community preferences. An ethical dimension also arises with the ability of insurance firms to use digital technologies to much more accurately assess, and hence price, individual risk.
Moral and ethical considerations
Regulatory restrictions on activity for moral or ethical considerations are a complex area. Some restrictions, such as those on human cloning, initially appear straightforward, but can also affect all the (more broadly beneficial) steps toward a technology that would make this possible (such as stem cell research). Some restrictions may be precautionary in the absence of data on the risk posed by new technologies, but they may also be based on fear, rather than a rational assessment of the potential risks posed.
The ethics of robots have been raised in a number of forums (for example, Deng 2015; Russell et al. 2015). While robots can be programed to make choices under specific circumstances, it may not be possible to design robots that would replicate an ethical choice when faced with two ‘bad’ choices. For example, autonomous vehicles may need to decide whether to hit a pedestrian or put its occupants at risk of death. Moral questions also
GOVERNMENT ROLES 117
arise over the use of robots in warfare. For those countries that are able to use them, robots reduce loss of life resulting from war, but also may reduce the incentives to avoid warfare. The circumstances under which robots are trained to refuse instructions (largely on moral or ethical grounds) is the subject of current research (Briggs and Scheutz 2015).
It is important that in determining the need for regulating new technologies, governments make informed decisions based on realistic assessments of risks to the community — not simply regulate as a reaction to pressure from community interest or business groups with particular ethical or commercial concerns. Further, where restrictions are imposed for precautionary reasons, these should be subject to subsequent review as knowledge about the risks posed by new technologies evolves.
Implications of better pricing of risk in insurance markets
Digital technologies allow the collection of information in ways that were not previously possible. For example, Fitbits collect information on people’s daily activity, heart rate and other health related information. Sensors in motor vehicles can report on a driver’s use of a vehicle, including their speed and driving habits. These technologies reduce information asymmetries if the individual is willing to share this information with their health or motor vehicle insurance companies. With enough members in the network, insurance companies can use this information to better model the sources of risk for claims, identifying the behaviours that decrease the expected claims and those that increase them.
In general, this would be a desirable outcome and could reduce some forms of statistical discrimination. For example, while a certain group, say young males, may be more dangerous on average than other drivers, gender and age cannot be changed, and so insurance based on these classes cannot achieve behavioural change. In contrast, were it possible to set lower premiums for drivers whose behaviours were safer (using telematics for example), then the insurance market would be less discriminatory and more efficient. That is, prices of some insurance products could fall for low risk people (who have healthy lifestyles and are safe drivers, for example). Those who are a higher risk would face higher prices. Some who can reduce this risk will continue to purchase insurance and see the price they pay fall over time as a reward for their low claim behaviour. But others, who do not see the link between their actions and risk, or for who the risk is unavoidable, may as a result take out less insurance.
While more efficient pricing of risk has some good outcomes (a higher rate of better behaviour), several policy issues remain:
• Governments mandate some insurance (for example, third party personal injury motor vehicle insurance) because it is often not possible to recover costs from a negligent driver who is uninsured. However, risk-rated mandatory insurance may involve premiums that lock some people (in certain age, ethnic or income groups) out of certain activities (such as being able to legally drive). That this outcome is socially unacceptable is reflected in current state-based settings for compulsory third party

118 DIGITAL DISRUPTION: WHAT DO GOVERNMENTS NEED TO DO?
premiums, which do not allow risk rating based on observable driver characteristics (with the limited exception of premium penalties if accidents occur, and higher rates, at least in New South Wales, for young drivers). Under such settings, the sophistication in insurance that would be allowed by more data and better analytical methods is moot.
• Depending on any regulatory arrangements in given insurance markets, some of the information used by insurers in setting premiums may be more aimed by individual insurers at ‘skimming off’ the lowest risks rather than achieving efficient risk pooling. For instance, it may be that Fitbits indicate whether a person engages in activities that reduce their risks, but not owning a Fitbit could also signal aspects of a person that reflect unchangeable characteristics that are associated with claims, such as someone with a prior degenerative disease.
For governments, the consequences of these types of trends could be that it becomes increasingly the insurer of last resort. This may not be through a formal insurance product, but rather the health and income safety nets and the National Disability Insurance Scheme (NDIS). In regard to natural disasters, governments may also face pressure to assist those who have been priced out of the insurance market due to their individual risk factors. Such responses could see insurance coverage shrink further and shift more risk back to governments.
Protecting privacy
The technologies that enable a more connected society also enable more pervasive monitoring of citizens by governments and, increasingly, by private entities.
Governments protect information that they collect on individuals, such as that amassed in the delivery of human and other government services. They may also limit the application of any information collected for uses deemed socially acceptable. Governments are also responsible for regulating to protect individuals’ identities and privacy more generally. Legal protection of privacy in Australia currently comprises a mix of Commonwealth and state and territory legislation. The main national legislation is the Privacy Act 1988 (Cth), which was drafted when the digital age was in its infancy in Australia — notwithstanding a review in 2008 and some subsequent amendments. There has been enormous growth and change in personal data collection and use in the decades since the Act’s inception.
Firms can sometimes know more about someone than their friends and family due to the information they can collate and analyse from internet search engines, social media, and personal devices, such as smart phones and Fitbits. A recent study found that a computer algorithm based on Facebook likes could be a better predictor of a subject’s self-rating on a personality test than a personality questionnaire completed by family or friends (Youyou, Kosinski and Stillwell 2015).
Filming for real time viewing and reproduction is also a substantial source of privacy concerns. Risks to privacy are posed by the use of:

GOVERNMENT ROLES 119
• surveillance cameras by businesses to monitor employees and customers in commercial premises and by governments to monitor citizens in public areas
• mobile phones and other compact recording devices (such as dash or helmet cams) to record interactions between citizens
• drones, particularly the ability for surveillance of activity on private property (see appendix D).
The need for privacy protection is evidenced in a range of ways, including examples of data use for unsolicited marketing, through to data theft or misuse for the purposes of fraud or the commission of other crimes. Some individuals may also place an intrinsic value on privacy above any financial loss suffered by a violation of privacy. On the flip side, many consumers appear willing to trade off reductions in privacy for services that businesses can provide for them using their data. In such situations, the key issue is what constitutes informed consent.
Whether the legislative protections to privacy are still affording the protections intended and whether they may be unnecessarily restricting the availability and productive use of data will be explored in the current Commission inquiry into Data Availability and Use.
Cyber security
The interconnectedness of products (such as through the internet of things) and people, and the reliance of broad classes of products and services on technologies such as the Global Positioning System, increases the importance of appropriate cyber security measures. Confidence in the security of online systems is essential to fully realising the potential of the digital economy (and is already critical in closed communication systems used to operate the national electricity market, telecommunications, public transport and other infrastructure). As Williamson et al. (2015) noted:
In an increasingly networked and interoperable world, private, public, and civil institutions become more dependent on information systems and more vulnerable to attack by cybercriminals, hackers, online activists, nation-states, and even their own employees …
As a result of these interconnected systems, cybersecurity will remain a major issue. For example, information systems are now vitally important to government, industry and society but there is an increasing risk of information security breaches amplified by the interconnectivity of the networked structure of information technology. A safe, secure and trusted e-commerce process is essential to economic growth as online commerce continues to grow rapidly in Australia and globally. However, crime follows opportunity and on-line risks pose a serious threat to individuals, businesses, industry and governments. (p. 135)
There are also concerns about the ability to anonymously use digital platforms to bully, harass or defame people. For example, National Disability Services commented that:
There are known risks to all consumers whose presence and information are available online. These include financial theft, fraud, identity theft and bullying. Some people with disability

120 DIGITAL DISRUPTION: WHAT DO GOVERNMENTS NEED TO DO?
may be particularly vulnerable to these risks and become the target of scams. If people with disability are expected to use online systems to access support, information and social networks, there will need to be extra vigilance to ensure their privacy and safety are properly respected and protected. (Comment 1, p. 4)
Controlling such actions imposes costs, but can be needed to maintain the use and integrity of digital social and other networks. New Zealand, for example, has recently introduced a law to punish trolling and other uses of electronic media to intimidate people.
In Australia, a number of measures have been introduced to address cyber security. The Australian Cyber Security Centre, established in 2014, is a hub for private and public sector collaboration on cyber security issues. Recently, the Government announced a new cyber security strategy (Commonwealth of Australia 2016). The strategy includes a number of initiatives aimed at improving cyber defences, fostering development of the cyber security industry and addressing the shortage of skilled professionals, and improving national cyber security awareness.
While there is clearly a need for adequate cyber security measures to protect citizens and facilitate trust in online transactions, risk cannot be entirely eliminated, nor may it be cost effective or socially desirable (depending on how security is achieved) to do so. The business case for public cyber security investments should be properly scrutinised to ensure public money is delivering a net benefit.
FINDING 4.5
Digital technologies allow for more pervasive collection of data on individuals and firms and can be a medium for harassment and security breaches. This may change what is needed in order to: • protect individuals privacy • prevent the unlawful use of information • maintain the integrity of digital networks.
The case for government action in these areas relies on ensuring that the likely benefits of any restrictions outweigh the costs of restrictions to the community.
4.3 How digital technology can improve governments’ own processes
The technologies being developed and applied in the private sector and (on an ad hoc, often small scale) in the public sector over recent years, offer scope for all levels of government to fundamentally change the way they function, including through the:
• digitisation of transactions and engagement with government

GOVERNMENT ROLES 121
• use of data generated by technology to improve government functions
• inclusion of technology directly in public infrastructure and government service delivery.
How these developments can be used by governments are illustrated below by considering five particular areas of government functions — government engagement, regulator behaviour, human service delivery, public amenity and environmental management, and public infrastructure management. These areas were chosen as they offer potential for substantial improvement in the efficacy of government functions.
Citizens are increasingly demanding faster, more efficient and higher quality government services (Pomeroy and Fahy 2015). In addition to direct benefits to taxpayers and those using government services, there is also some potential for secondary flow-on benefits to the broader community from government adoption of technologies. For example, government adoption of new technology can: bring the scale needed for a technology to be advanced; boost use by firms and not-for-profit organisations where they benefit from interoperability or where regulatory compliance is made easier by adopting similar technology; and send a message to the community and firms that the technology is of value and of comparatively low risk (because governments are traditionally seen as highly conservative).
More effective engagement at a lower cost
Digital technologies utilising, for example, connectivity and real-time information sharing, can give governments, and their regulators, near-immediate access to networks of people and organisations. Where used, these technologies have made engagement more targeted and streamlined:
• Governments getting information to people — government agencies provide information through a variety of digital channels including email, text messages, websites, social media and databases. Online sources of news — often through smartphones — surpass traditional print, radio and TV media for many citizens. In the United States, Facebook was the top source for political news in 2015 amongst people born in the period from the 1980s to 2000 (Mitchell, Gottfried and Matsa 2015). Facebook also appears to be a major source of news for Australians, and many use it to follow a political party or politician (Newman, Levy and Nielsen 2015).
• Governments service providers — such as in public transport or municipal services — often use online technologies in ways similar to private businesses to elicit and address feedback about specific services, or simply to provide accessible information. For instance, the city of Melbourne provides data on energy used and generated by the council’s assets, parking bay availability, the location of public barbecues and outdoor

122 DIGITAL DISRUPTION: WHAT DO GOVERNMENTS NEED TO DO?
furniture, among many other facets of its services and responsibilities.21 Other agencies — such as major policy departments — tend to follow more program specific, strategically timed practices to disseminate information.
• People giving information back to governments — digital communications usually make it easier for people to make information requests of governments and provide feedback to governments on their policies, programs and experiences with these. For example, some new government policies are developed with a Facebook page to receive stakeholder input. (The evidence that individuals and businesses have effectively used technologies to engage with governments is less apparent — PC 2013d.)
Some digital technologies offer cost savings for governments and for those engaging with government. For example, of the estimated 811 million transactions businesses and households have each year with Commonwealth and state government agencies, approximately 40 per cent are still completed using traditional, non-digital approaches, despite the 40-fold higher per transaction cost (figure 4.1). Deloitte Access Economics (2015a) project that in 10 years’ time, more transactions will be undertaken using lower cost per-transaction approaches, resulting in considerable savings to governments. While such cost savings are worth pursuing, the greatest benefit will come in applying digital technology to improve government activities.
Figure 4.1 Government transaction volume and costs
Source: Deloitte Access Economics (2015a).
21 See https://data.melbourne.vic.gov.au/data
GOVERNMENT ROLES 123
The Australian Taxation Office (ATO) has been a leader in the introduction of digital technologies to improve its engagement with the community. Australians have been able to lodge income tax returns online since 1999, and increasingly data linkages have been used to pre-fill tax returns, streamline processes and enhance compliance. The ATO move to single-touch payroll systems from mid-2017 will further streamline the collection of income tax. This technology means tax collection can be easier and more streamlined for the community. As an additional benefit, it also provides government with a substantial body of information on Australian taxpayers that could enable improvements in the efficiency and effectiveness of the tax and transfer system.
More efficient regulatory functions
Governments have invested in reducing the burden of regulations, but it is often how regulators implement these that imposes the most costs on business (PC 2014c). In particular, risk-based outcome-focused approaches are seen as best practice, as they give the greatest return to regulatory effort. Digital technologies offer scope (with digital platforms and greater use of sensor technology, for example) for regulators to more closely monitor compliance and have regulatory solutions better tailored to risks. This would enable more efficient and effective outcomes across the main regulatory activities:
• Communication and education. Technology could improve the information available to individuals and businesses on their compliance obligations. Information may also be better tailored to individual circumstances or characteristics and disseminated in a more accessible and/or timely manner. While almost all regulators have their own website, there remains considerable scope to increase other digital forms of communication, including social media (PC 2013d).
• Monitoring. Increased connectivity, combined with the internet of things and a variety of technology (including micro cameras and sensors), could facilitate greater use of real time remote monitoring. The range of applications for such monitoring could eventually include areas such as food safety, health and environmental regulations.
• Enforcement. New technologies could also be used to facilitate enforcement strategies, such as automated warnings or the remote disabling of services. Road use is one area where sensors are being deployed to improve enforcement (box 4.3).
• Risk-based assessment. Increased data collection and analytics could allow more targeted compliance monitoring through better assessment of the risks posed by classes of businesses, as well as particular entities.

124 DIGITAL DISRUPTION: WHAT DO GOVERNMENTS NEED TO DO?
Box 4.3 Using technology to improve road use compliance and enforcement
The introduction over time of various detection technologies such as speed cameras, breathalysers and registration plate detection systems has markedly improved the capacity of police to detect traffic infringements. A further step change in ensuring regulatory compliance could be achieved through the direct monitoring, or effectively, self-reporting, of connected vehicles.
Intelligent transport systems (ITS), for example, are already in use in Australia (and other countries) by governments and the private sector. In particular, telematics is already commonly used by transport companies to monitor the speed and location of their individual vehicles. It is also used to a limited extent for regulatory purposes, with the monitoring of some heavy vehicles.
Ultimately, it is conceivable that autonomous and/or connected vehicles could be programmed such that they could not be operated in contravention of some regulations (such as speed limits). Violations would subsequently represent a software breach or malfunction rather than a driver transgression. This could have substantial impacts on the nature and cost of enforcing road rules. It could also have revenue implications for governments, given that fines for traffic offences can represent significant sources of revenue. Obsolescence of traditional compliance approaches is likely a longer-term proposition, given the pace of the private vehicle fleet turnover and potential objections by citizens to excessive government surveillance. However, wider-adoption of automated vehicle monitoring has the potential to offer significant gains in the shorter term, particularly in the areas of monitoring compliance in heavy vehicles.
Source: Appendix D.
Scope to improve taxation compliance
Even where business models based on disruptive technology are not driven by a desire to avoid taxes, some do not fit well into the existing tax regime, which was designed with a particular transaction template in mind (Barry and Caron 2015).
The growth of the sharing economy and new business models that are emerging based on digital platforms increases the number of parties subject to tax and the range of deductions against income earned that may need consideration. For example, estimates variously put the number of Airbnb properties in Australia at 40 000 to 75 000, with the average host earning about $7100 per year over 51 nights (Heber 2015; Redrup 2015). Each owner potentially represents a new declarer of rental income, claimant of rental property expenses and payer of capital gains tax. For some of these digital platforms (for example, Airtasker), tax obligations may now be more apparent as the platforms are recording transactions that may otherwise have gone unrecorded and untaxed. For other new business models, the ATO has a targeted data matching scheme to prevent tax evasion by sharing economy participants.
Recently the ATO decreed that Uber drivers will be treated like taxi drivers and required to collect GST on all services, even though individual drivers would mostly be below the

GOVERNMENT ROLES 125
GST income threshold — Uber (2016a) report they have over 20 000 drivers across Australia. Digital transactions are easier to track than non-digital ones and hence to link income to individuals. But sharing platforms that work more on a barter system (or bitcoin) could see growth in non-market production that sits outside the taxed economy.
FINDING 4.6
There remains further scope for regulators to adopt new technologies that reduce the burdens incurred in obtaining regulatory outcomes, undertake more effective risk-based assessments and substantially improve engagement, monitoring and compliance.
More effective human services
The provision of human services accounts for a major share of Australian governments’ expenditure and, with an ageing population, is anticipated to grow strongly (PC 2013a). Just as innovative technology allows governments to provide other services more efficiently and effectively, human service delivery can also be enhanced (Gill, Dutta-Gupta and Roach 2014). For example, single digital portals for accessing information and applying for services, such as aged care, can improve efficiency and accessibility. Wearable technologies can transmit information to assess service needs, while telemedicine can bring better health services to remote or hazardous locations. Such technologies are already being adopted widely.
When combined with other policy innovations, data sharing lies at the heart of more effective and efficient human services. Better information for consumers on the services offered by providers, and the outcomes they achieve, could improve consumers choice over services and providers. For example, fewer people may seek treatments such as knee arthroscopies, if they realised that these have little if any therapeutic effect (PC 2015c). Access to comparable information on the live birth outcomes of fertility clinics by age and health of the women seeking treatment, would also assist women to make a more informed decision about treatment, including over choice of clinic (Choice 2015).
Networks of providers that share client data, coordinate client services, and learn from the analysis of that data, can also better target scarce resources to where they will make the biggest difference to people’s lives.
Integration of data across service areas gives service providers a fuller picture of needs at the individual, household and community levels. Joined-up data (longitudinal data and comparative data (treatment and non-treatment groups)) provides researchers and policy makers with a much richer resource to test and develop treatments and policies. Data sharing can support more targeted delivery of services, allow experiments to test the effectiveness of new approaches, and identify services that add to health and other outcomes and those that do not (Duckett and Breadon 2015; PC 2015c).

126 DIGITAL DISRUPTION: WHAT DO GOVERNMENTS NEED TO DO?
Digital technologies substantially reduce transaction costs involved in sharing data. But investment in data and network development is required to join up the data and to deliver an integrated service. Paying for this is often an obstacle for human service delivery, particularly where providers are paid on a fee-for-service basis. While voluntary approaches can work, government investment may be needed to ensure cooperation in coordinating service delivery to clients. The greater effectiveness of integrated human service delivery for communities that face major disadvantages may particularly warrant investment by governments and firms (Burton 2012).
Health care is particularly amenable to digitally-enabled information exchange. Electronic health records that allow patient information to be linked across medical and related providers offer better scope for service coordination, enable quicker assessments of health needs and better targeting for early intervention in healthcare. This could substantially improve client outcomes and, over the longer term, lower costs. Yet the uptake of electronic health records in Australia, as in many other countries, has been slow (Lakbala and Dindarloo 2014). To get patients and practitioners to support electronic records, they need to see the benefits. However, incomplete records and low uptake undermine the benefits of the system and therefore the motivation of clinicians and patients to participate (the ‘chicken and egg’ problem), as is characteristic of many other information networks. There are other important constraints on the wider use of electronic records, such as concerns about privacy, cost, complexity, training and the real benefits (Department of Health and Ageing 2011). For instance, some specialists (such as psychiatrists) are particularly concerned about the sensitive information that may be disclosed to others. Others integrate less with other physicians (such as in ophthalmology) and therefore identify fewer benefits from information exchange. As discussed under standards, interoperability issues between health care providers also need to be resolved to achieve greater use of digital technologies.
Digital technologies may also support improved governance for many human services. The ability to monitor performance of providers and to make more reliable comparisons (such as those that adjust for the particular client group) improves the ability of governments to benchmark performance. Publication of provider performance enables more informed customer choice. The ability to monitor service delivery outcomes allows greater scope for client-directed services, giving clients greater control over services received. The Commission’s current Human Services study and inquiry will further examine these issues.
Delivery of public amenity and environmental management services
Digital technologies can also be harnessed by governments to improve the management of public assets and for the more efficient provision of services.
Increasingly around the world, remotely piloted aircraft (RPAs) are being used (largely by the private sector to date) as a lower cost, higher resolution (than satellite imagery) means of environmental management. In Western Australia private companies are using RPAs for

GOVERNMENT ROLES 127
environmental management, as more cost effective alternatives to satellite and airborne remote sensing platforms (Astron 2015). Australian governments expend considerable resources monitoring national and state forests — for example, New South Wales spent around $10 million in 2010-11 on harvest planning, management and pre-harvest surveys (Montreal Process Implementation Group for Australia and National Forest Inventory Steering Committee 2013). In addition to monitoring the quality and nature of timber stocks and canopy gaps, RPAs can be used to measure carbon for climate change mitigation efforts.
Monitoring and management by emergency services, particularly in the aftermath of bushfires, floods and earthquakes, is another potentially useful application of RPAs, and some Australian government agencies are already using them on an ad hoc basis. The technology is also used overseas — for instance, in California, drones are being used as a safer alternative approach for wildfire observation (Ross 2013). The skills required to operate such equipment may be the primary limitation on widespread adoption of such technology.
Remote monitoring, such as through sensor technology, can also be used by governments to improve urban services. For example, Singapore is trialling sensor technology on rubbish bins to improve bin location, alert waste collectors as to when bins need emptying, and enable monitoring of waste collection services (Zengkun 2015). The ACT Government similarly is trialling solar-powered self-compacting rubbish bins in public spaces, that provide real time information to waste collectors on fullness levels (ACT Territory and Municipal Services 2016).
Transport and parking apps on smart phones are another example of the use of digital technology to improve public amenity. For example, the City of Perth (2016) offers a website and mobile app that informs drivers of vacant parking spots — reducing searching time. Transport for NSW has publicly released large quantities of its data enabling the development of a range of apps to provide travellers with real time public transport, road and traffic information.
FINDING 4.7
Better information systems and scope to monitor services delivered and their outcomes could improve the efficiency and timeliness of human service delivery by: • allowing consumer choice to play a greater role in the delivery of human services • using linked information on services and customers to better target service delivery
and introduce more integrated services • reducing the cost and improving the safety of people involved in areas such as
environmental management and emergency services.
128 DIGITAL DISRUPTION: WHAT DO GOVERNMENTS NEED TO DO?
Optimising public infrastructure
The importance of public infrastructure, such as communications, electricity and transport networks in enabling the widespread uptake of technology was discussed in chapter 2. But digital technologies offer the scope to substantially improve the management of public infrastructure assets, including decisions about maintenance, augmentation and demand management.
Optimising maintenance and augmentation
The likely developments in technology (digital and otherwise) are considered to varying degree by governments in planning for future infrastructure. Important considerations include the opportunities for incorporating technology (such as sensors) into new infrastructure, the scope for upgrading and retrofitting infrastructure over time, as well as what expected technology developments are likely to mean for future infrastructure usage. Technology embedded in infrastructure and greater use of digital platforms provide large quantities of near-real time data on the stresses on infrastructure assets and the level of use (Atkinson et al. 2016). This technology, and the data it generates, enables quicker assessments of infrastructure capacity needs that support more targeted investment in infrastructure upgrades (appendix D). This can be particularly important in energy networks, which are largely designed to cater for periods of peak use (appendix E). Such data also allows for maintenance to be scheduled to minimise disruptions.
Robotic systems are being used on a small scale in Australia and overseas for more timely and efficient maintenance of infrastructure, such as bridges and hydro-dams. For example, US agencies have been investigating the use of robots in hydro dam inspection and maintenance, and Queensland Urban Utilities are using remote controlled drones for a safer approach to inspecting their highest dams (Utility Magazine 2014). The usefulness of these technologies for these purposes is known — what remains uncertain is the speed at which they will become a routine part of infrastructure assessment and maintenance. But there is scope for greater automation of large-scale maintenance of public infrastructure.
Improving demand management
Digital technologies provide real time information on use (rather than just time of day) that can be used to smooth utilisation of infrastructure. For example, changing the direction of lanes on bridges could be automated to reflect traffic conditions (rather than current, largely time-of-day arrangements). Pricing can also be used to manage demand and reduce congestion. Pricing can contribute to the more efficient use of infrastructure and could reduce the need for costly infrastructure expansions, lowering the overall cost of service provision. Prime examples are the use of telematics — which allows remote monitoring and tracking of vehicles — in road use charging (appendix D) and the use of smart meters in electricity networks (appendix E).

GOVERNMENT ROLES 129
While digital technologies can be used to optimise use, they also can change the way infrastructure is funded. The use of new technology to facilitate more cost reflective user charging, particularly in relation to roads and electricity networks, has been previously advocated by the Commission (PC 2013b, 2014b) and, more recently, by Infrastructure Australia (2016).
FINDING 4.8
Technologies embedded in infrastructure and greater use of digital platforms to link infrastructure with users and suppliers offer governments considerable scope to: • assess infrastructure usage and the responsiveness of demand to pricing and to
introduce efficient pricing technology • augment and maintain public infrastructure in ways that minimise disruption to its
use • optimise investment in public infrastructure, better matching the build requirements
to evolving needs.
4.4 More changes are needed to diffuse digital technologies in government
Some argue that governments are inherently slow or inept in applying digital technologies (Fishenden and Johnson 2014, p. 2), and indicate that greater application of digital technologies, if adopted well, could fundamentally change the way that governments operate (Johnson 2014). Commentators point to apparent obstacles to the adoption of such technologies — risk aversion, inadequate skills, outdated procurement practices, siloed departments, poor cooperation between governments, and the lack of commercial imperatives for change.
While Australian governments are lagging households (but on a par with the private sector businesses) in their low rates of adoption of new technologies, there is little evidence that they are passive in adopting digital technologies. Nor is there much in the literature to suggest that bureaucracies are inherently lacking in innovation or opposed to change (Ritchie 2014). It is clear from the discussion in this report that Australian governments (particularly at the subnational level) have already made increasing use of digital technologies in on-the-ground service delivery — sometimes in novel ways. Exemplars are the release of data for private development of apps, and the use of drones and sensor technology in managing infrastructure. At least some Australian jurisdictions have developed regulatory regimes that have allowed the entry of ride-sharing (a permissiveness that is not true of many other countries). Many routine, but important, processes of government have been automated through online tools (such as eTax). It is also clear that governments intend to exploit further the benefits of such technologies, even if there are obstacles to their immediate implementation (e-health being a classic example). This

130 DIGITAL DISRUPTION: WHAT DO GOVERNMENTS NEED TO DO?
counters claims that Australian governments are doing little, but does not rule out the possibility that they are not doing enough.
Some argue that governments need to be ‘agile’ to realise the benefits of innovative technologies. For example, a UK civil servant who is an advocate for a different model of bureaucratic decision-making argued that ‘agile is a mindset, a culture, around delivering small steps forward fast and often’ (Ollerhead 2015). Of course, the ‘Agile Manifesto’ that initially originated in software development decades ago might sometimes be useful for government policy making (GAO 2012). Few would contest the value of agility if it entails breaking tasks into manageable components executed efficiently, engaging and collaborating with diverse stakeholders to develop and test new policies, demonstrating early working versions of a policy (trials) and a willingness to change policy direction as new information becomes available. The challenge is to operationalise that in a way that policymakers would see as implementable.
Actual experiences of the application of Agile methods in the United Kingdom found many positives, but also some defects (NAO 2012). The extent to which it can apply to policy formation, rather than policy delivery is also less clear (for example, working models can be hard to trial and the scope for collaboration with external parties is sometimes constrained). Further, many government initiatives should be slow, cautious and deliberative, as demonstrated by decisions about public infrastructure (PC 2014b) and big social programs, such as the NDIS, where careful implementation is required (PC 2011). Regulatory history is replete with examples of ill-thought out, ostensibly agile responses to emerging problems.
Regardless of the pace at which initiatives are developed and introduced, there remain genuine issues that confront governments in fully realising the benefits of digital technologies, and the solutions are not necessarily straightforward.
Changing a risk-averse culture
The public service role should be about identifying the risk factors and risk tolerance levels around new technologies, not about trying to eliminate all risk. However, the willingness to adopt new technologies and innovative approaches (particularly in national level policy making) is often stifled by risk aversion and a belief that failure is unacceptable — the status-quo is often considered easier and less risky to manage than exploring other options. Mazzucato (2014) notes that the public discourse on innovation and risk taking focuses almost exclusively on failures of government. In this light, Ritchie (2014) notes aversion to change is not necessarily surprising as incentive mechanisms emphasise avoiding negative feedback rather than gaining positive outcomes.
While a greater weight on bipartisan politics, or senior managers and elected officials providing some backing for public servants, or a media less driven by a ‘gotcha’ mentality might help, none of these are realistic eventualities on a broad scale. Rather, some possible strategies are:

GOVERNMENT ROLES 131
• Encouraging internal units within departments whose purpose is to be innovative (for example, nudge units that exploit the low costs of randomised experiments using different online forms to test the best approaches to encouraging tax compliance or organ donorship). To be successful, these units would have to be seen as an integral part of delivering on an agency’s core functions — not simply as a specialist unit doing side projects.
• Drawing on precedent in other jurisdictions locally or globally provides a basis for innovative policies (for example, decisions by the ACT and NSW Governments on Uber provide legitimacy to ride sharing services and an example for other governments to follow). A Behavioural Insights Team was developed in the United Kingdom in 2010, and the imprimatur and respectability it received from the British Government made it easier to set up similar units in the Victorian and NSW Departments of Premier and Cabinet, and most recently the Behavioural Economics Team of the Australian Government.
• Providing the Minister with a good faith defence. For instance, the Office of the Australian Information Commissioner provides public sector agencies with advice on privacy. If an agency following the advice of the Commissioner were subsequently found to have contravened privacy, then the responsible minister can legitimately argue that the relevant agency reasonably acted in good faith on advice from an expert body.
• Drawing on recommendations and stakeholder engagement processes by external independent bodies for innovative, but risky, policy options (in part, a role of the Productivity Commission).
• Trials that can test new ideas before their rollout — they can be both innovative and cautious at the same time. Leading government agencies around the world are increasingly investigating (and using) policy experiments or trials in order to learn what policy features are effective once implemented on the target population and adapt the policy design to make best use of this information. In this way, governments can experiment on a small scale with initiatives that make particular assumptions about policy implications, and roll them out on a larger scale if the policy is found to be effective in meeting its objectives. Breckon (2015) sets out how and when experiments can best be used by governments.
• Attempting to obtain agreement from all relevant parties (such as all states and territories) for a new policy. Each can defuse the blame if the policy fails, and inevitably (in the case of states and territories) the failure will be the responsibility of all sides of politics, given that states rarely share a single political ideology.
• Adopt measures that make lobbying more transparent, reducing the returns from hidden advocacy against policy innovations.
Of course, factors such as leadership and crises that necessitate action (because the status quo is no longer feasible) can be sources of innovation, but these cannot be manufactured.

132 DIGITAL DISRUPTION: WHAT DO GOVERNMENTS NEED TO DO?
Government procurement
Procurement on behalf of the Australian Government is governed by the Commonwealth Procurement Rules, which mandate the use of AusTender, the Australian Government’s centralised web-based procurement information system. There are standardised contracts for lower-risk, lower-value tenders and procurement panels are often used for regular ongoing purchasing. In recent inquiries into the process, concerns have been raised over the complexity and liability issues around contracts, and the cost to business of participating in multiple procurement panels (Senate Finance and Public Administration Committee 2014). Furthermore, Fishenden and Johnson made the following observation:
… industrial age procurement processes are not only a significant driver of red tape but are out of sync with the dynamics, timeframes and innovation required in digital government administration. (2014, p. 11)
Government policy has recently placed a greater emphasis on the use of coordinated (whole-of-government) and cooperative (multi-agency) procurement arrangements. A downside of the larger-scale procurement models is their tendency to favour large, established firms, because smaller enterprises may be unable to deliver goods and services on the scale required. While this may be desirable if larger firms can access economies of scale to deliver at lower costs, it also limits the competitiveness of the tender process.
The Digital Marketplace was announced as part of the recent National Innovation and Science Agenda (Australian Government 2016a). Currently under development (led by the Digital Transformation Office), the Digital Marketplace will break large-scale information and communication technology (ICT) procurement requirements into individual components which smaller suppliers are able to deliver. The project is based on the recently launched UK Digital Marketplace.
However, there remain — for legitimate reasons — limits on the extent to which procurement can be used to enhance public sector adoption of technology. For example, the Australian Government Cloud Computing Policy, adopted in October 2014, mandates a ‘cloud first’ approach, meaning agencies must adopt cloud technology where it is fit for purpose, provides adequate protection of data and delivers value for money. However, due to the security issues surrounding cloud computing, many suppliers are not permitted to supply cloud services to Australian Government agencies.
Development of skills
The skill sets required within the public service need to evolve in tandem with technological change. At a minimum, a core set of public servants need to be able to understand new technology sufficiently to assess its risks and likely impacts, and provide appropriate advice. In many instances, governments face no greater problems in acquiring skills than does the private sector — they employ or contract people with expertise. The

GOVERNMENT ROLES 133
issue then is to ensure an adequate supply of people with the right expertise at the economy-wide level (chapter 2).
Staff who are willing to try new approaches need to be supported by management (Ryan and Ali 2015). There are no obvious obstacles to appointing senior bureaucrats familiar with the new technologies or developing champions for technological innovation across the public sector (indeed, this has already happened in some agencies). A reoccurring message, however, from the Commission’s regulatory and policy reform work has been that even where senior bureaucrats are supportive of change, the practical implementation by middle level and front-line staff often lags (PC 2013d).
One (relatively modest) obstacle to technological diffusion is that public sector performance management systems are often cumbersome, and not suited to shedding people whose performance in new working environments may be inadequate. Given budget constraints, this limits new hires. Recent significant re-structuring and downsizing in the Commonwealth public service suggests that public sector agencies are able to shed people without adequate skills through standard redundancy arrangements. Nevertheless, the Commission’s report into workplace relations indicated that the removal of terms that specify unnecessarily lengthy, costly and inflexible performance management and termination processes from agency enterprise agreements would better enable workplace restructuring, but also noted that this would come at some cost (PC 2015e).
Better coordination between agencies within governments
Increasingly, appropriate policy responses do not fit neatly with the competencies and responsibilities of any single agency. Good policy design and implementation therefore necessitates good coordination between government agencies, and a single entry point of contact/advice — that is, improved ‘horizontal governance’ (OECD 2015b, p. 240).
Better coordination between national, state and territory and local governments is also necessary to realise the benefits from technology-enabled information sharing. While national policy makers may have the data or analysis to inform regional level policy making, regional agencies may have better information on local needs that could inform and improve the effectiveness of national policy. For example, a national government may finance a public research body developing blue sky technology, while a regional initiative to link up firms in the area with the research facility could help extract more economic benefits from the national investment (OECD 2015b). The Productivity Commission (2015b) similarly highlighted the importance of local involvement in the implementation of innovation policies. Clarity on the roles of particular levels of government and government agencies sets the stage for better coordination and avoiding wasteful duplication.

134 DIGITAL DISRUPTION: WHAT DO GOVERNMENTS NEED TO DO?
Improving policy making processes
The adoption of technological tools that use connectivity and real-time information sharing can (in some policy areas) give agencies timely access to information and the ability to change direction quickly and pursue policy goals more effectively. This can allow policy makers to engage with networks of people and organisations more effectively in policy design and implementation. Such engagement is essential to ensure policies are appropriately targeted, reflect tradeoffs that citizens are prepared to accept (for example, between quality and price) and are able to deliver outcomes valued by the community. New communication technologies allow government to include a diversity of stakeholders in policy development processes who are affected by policy changes, but lack an organised representative organisation. Such engagement can reduce capture by vested interests and enable more innovative policies than those that emerge from traditional processes involving just the central players (OECD 2015b).
Small changes in policy design can have significant implications for policy effectiveness and efficiency (OECD 2015b). Small scale, frequent milestones are important to gather and evaluate information, enabling responsive changes in direction. Rapid changes in technology mean there needs to be a much stronger focus than in the past on diagnostic monitoring and evaluation, and these processes need to be embodied in programs and policies from the outset. This is particularly important for new and emerging areas of policy where the scope for learning and identifying good practices is greatest.
Using digital technologies for more accountable government
Accountability of governments largely rests on timely (and relatively complete) divulgence of reliable information about their actions, and some responsiveness to the resulting feedback. As highlighted above, digital technologies have made it easier for governments to convey information to people, easier for people to find out about government activities, and easier to provide feedback and other information to governments. This includes greater scope for real-time monitoring of, and commentary about, government activities and services.
These developments are likely to make governments more publicly accountable than in the past as any apparent lack of transparency by a government in its policy making and processes is considered indicative of a potential problem. Australia has recently joined the Open Government Partnership (with 68 other countries) to implement open government reforms.22 Many of the suggestions emerging from the Partnership appear to be pragmatic and specific (for example, online divulgence of grants).
Any vision that open government initiatives enabled by technology will fundamentally transform policymaking is, however, likely to be idealistic, and indeed designers of 22 See https://ogpau.govspace.gov.au/
GOVERNMENT ROLES 135
accountability tools need to be mindful of their potentially perverse effects. For example, tools such as TheyWorkForYou.com and GovTrack.us apparently elicited strategic behaviour by UK and US politicians respectively to make them be seen to be more politically active in debates and leadership, even when they were not (Tauberer 2014).
Furthermore, most policy makers and politicians still evidently feel the pressure to respond quickly to problems as they arise, locking in details of policy responses at early stages without scope for consideration of alternative options or re-evaluation on-route to the end objective (PC 2012). Another consequence of such an approach is a tendency for some governments to react to an apparent problem with more regulation, rather than take the risk that the problem may escalate before a more appropriate policy or market solution is found. Nevertheless, greater divulgence is very likely to increase the scope for citizen participation and provide more useful information about the activities and performance of government agencies.
FINDING 4.9
Governments (particularly at a subnational level) have already made increasing use of digital technologies in on-the-ground service delivery. Some adoption of technology in regulatory processes is also evident. There remain, however, issues that governments need to confront before the benefits of digital technologies can be more widely realised. • A risk averse culture in the development of policies that are wide-reaching within
the relevant jurisdiction could be assuaged by measures such as: greater use of policy trials, relying on precedents from other jurisdictions; and drawing on recommendations and advice of independent agencies.
• Skill sets within the public service need to evolve in tandem with technological change. The capacity of agencies to recruit staff with relevant skills and shed those with inadequate skills could be enhanced by more flexible performance management and termination conditions in agency enterprise agreements.
• A sharing of data and cooperation between agencies would improve capacities to solve complex problems that do not fit neatly into the competencies of a single agency.
• Governments need to find ways to: – exploit, in their program delivery and policy making processes, the increased
transparency that comes with digital technologies – avoid locking in details of policy responses at early stages without scope for
genuine re-evaluation ‘en route’ to the end objective.
As digital technologies deliver better outcomes for consumers by disrupting some long-established ways of doing business, there are equal aspirations that digital technologies can also improve how government functions. Taking a considered approach to the opportunities offered should see considerable improvements in the productivity of the public sector, as well as in the private sector.


CONDUCT OF THE STUDY 137
A Conduct of the study
In preparing this research paper, the Commission asked for Participant comments (table A.1), consulted with a range of organisations, individuals, industry bodies, government departments and agencies (table A.2). The Commission also held a roundtable in Melbourne on 22 March 2016 (table A.3). The Commission is most grateful for the input stakeholders provided throughout this study.
Table A.1 Participants comments
Individual/organisation Comment No.
National Disability Services 1 Gas Energy Australia 2 Standards Australia 3 The Warren Centre 4 AiGroup 5 Leading Age Services Australia 6 All Rise Say No to Cyber Abuse 7 MI-Fellowship 8 Department of Infrastructure and Regional Development 9 Ray Keefe 10 Intel Australia 11 Large Format Retail Association 12
Table A.2 Consultation
Individual/organisation
A.T Kearney – Robert Feeney Australian Communications and Media Authority Centre for Digital Business — Marie Johnson CSIRO — Mark Paterson, Simon Dunstall and Andrew Reeson Department of Industry (Energy Division) Department of Industry, Innovation and Science Department of Infrastructure and Regional Development Red Analytics — Charles Gretton Stephen King Department of Social Services Digital Transformation Office ITS Australia

138 DIGITAL DISRUPTION: WHAT DO GOVERNMENTS NEED TO DO?
Table A.3 Roundtable — Disruptive technologies and the role of the
government, 22 March 2016
Individual/organisation
University of Melbourne Prof Peter Gahan Grattan Institute Dr Jim Minifie Oracle Mr Grahame Coles Lateral Economics Dr Nicholas Gruen Uber Mr Ben Brooks Seek Mr Isar Mazer Intersective Mr Wes Sonnenreich Dept of Employment Ms Rose Verspaandonk IP Australia Dr Benjamin Mitra-Kahn Bureau of Communications Research Ms Leonie Holloway National Transport Commission Mr Neil Wong Office of the Australian Information Commissioner Ms Este Darin-Cooper ANU and CSIRO Data61 Prof Bob Williamson Australian Information Industry Association Ms Suzanne Roche Dept of Industry, Innovation and Science Mr Tim Bradley Dept of Industry, Innovation and Science Mr Emmanuel Njuguna Dept of Infrastructure and Regional Development Mr Ross Slater Dept of Social Services Mr Phil Brown

DIGITAL INTERMEDIARIES AND PLATFORMS 139
B Case study: digital intermediaries and platforms
New digital intermediaries are enabling hitherto unconnected agents to connect. These digital ‘platforms’ are third parties that facilitate transactions between market participants using applications or software (and associated hardware) (box B.1). For example, 99Designs — an online graphics design marketplace — has made it easier and cheaper for small businesses to contract with graphic designers on small tasks, such as logo and website design. Both of these factors are bringing new competition to markets which may have been dominated by a small number of businesses.
The matching of buyers and sellers is only part of the story. The functions and services of some intermediaries have moved beyond simple matching of participants and into other areas, such as information sorting and analysis. Such expansion has traditional analogues — for example, store-linked credit cards provide both payment services and granular data to the firm on customer spending habits, assisting to better target advertising. However, digital intermediaries can collect data on a scale that few traditional intermediaries could, allowing greater (and more efficient) expansion into other parts of the value chain — such as product creation, transaction support, and product delivery, amongst others (box B.5).
Box B.1 Intermediaries and platforms Whenever two market participants interact through an intermediary controlled by a third party, they are using a platform. Platforms are common – they are present in finance (credit cards), retail (department stores), communications (mobile carriers), media (TV networks), and IT (operating systems).
The terms ‘digital intermediary’ and ‘digital platform’ are sometimes used interchangeably. Both serve to connect two sides of a market, whether that is buyers and sellers, advertisers and viewers, or app developers and users. However, as many digital platforms offer services beyond the matching of participants (such as recommendations, payments and distribution services), this study takes the view that the term ‘digital intermediary’ better captures the range of functions and services they provide. While most digital platforms connect their users at much lower transactions costs through the internet, it is these additional services that expand the role to ‘digital intermediaries’.
Source: King (2013).

140 DIGITAL DISRUPTION: WHAT DO GOVERNMENTS NEED TO DO?
B.1 What do digital intermediaries do?
Multiple technologies underpin the growth of digital intermediaries
The digital economy has grown rapidly in recent years. Deloitte (2015b) valued the Australian digital economy at 5.9 per cent of GDP in 2015, up from 3.6 per cent of GDP in 2011 and expected to grow to 7.3 per cent by 2020. Continued development and use of internet platforms, social media and mobile apps are expected to be important drivers of growth.
The rise of digital intermediaries has been supported by progressive improvements in communications technologies, such as the internet, home and office computers, and mobile devices over the last several decades (Deloitte Access Economics 2015b). This reduces the cost of sending and receiving communications, and allows the transmission of digital products. More recently, other technologies such as data storage in the cloud, ‘big-data’ analytics, and machine learning are expanding the scope of functions that digital intermediaries provide. For example, iTunes offers their customers the option of storing all their music remotely in the cloud, to be streamed on any connected device as needed (Apple 2016).
The functions of digital intermediaries
The functions of digital intermediaries are varied, but can be roughly categorised as ‘matching’, ‘analysis and sorting’, and adding product value. Any one intermediary can provide one, some, or all of these services.
Matching market participants
Digital intermediaries, and the platforms they operate, help match market participants and lower search costs. For firms seeking inputs or customers, and consumers seeking final products, sorting through available products and services is a costly process requiring time, money and other resources. Rarely are such searches exhaustive.
Digital intermediaries help participants find better matches by lowering the cost of search. One way is through collating and cataloguing all (or a portion of) agents in one place, which facilitates comparison of product offerings. But digital intermediaries may also offer:
• filtering or re-ordering offerings in a systematic way, such that the user can better distinguish between possible matches
• allowing ‘intent casting’, where the platform allows the user to describe their specific need (intent) to other users of the platform
DIGITAL INTERMEDIARIES AND PLATFORMS 141
• aggregating results from multiple platforms in the one place, enabling easy comparison before routing the user to a specific supplier’s platform for purchase (Riemer et al. 2015).
Lowering search costs improves welfare by reducing the amount of resources expended on search, improving the quality of matches, and by encouraging new entrants into a market (or creating markets) where previously it was too costly for market participants to transact (Bakos 1998) (box B.2).
Box B.2 Matching platforms Airbnb is a website where people can list, find and book accommodation. In particular, the platform has greatly reduced the cost of searching for, connecting and transacting with private, non-professional accommodation providers, rapidly expanding this market.
Skyscanner is a ‘meta-search’ website for flights and other travel services that aggregates and filters results from multiple platforms and distribution channels. Skyscanner does not process transactions itself, but rather channels consumers to the appropriate site.
Sources: Airbnb (2016); Riemer et al. (2015); Skyscanner (2016).
Data analysis and overcoming information asymmetry
Digital intermediaries can collect vast amounts of data, which can be used to both improve the quality of searches on their platform and offer new services that help overcome market inefficiencies (Riemer et al. 2015). Examples of data collected include producer listings, consumer feedback and reviews, and customer transaction data (Mangalindan 2012).
One way matches are improved is through ranking and recommending. Information asymmetry is a feature in most markets, with the producer having better information than the consumer. For example, it is difficult to know the quality of an accommodation provider prior to booking, in particular for small, non-branded providers. These asymmetries mean that simply cataloguing and filtering possible options in a neutral way may not result in an efficient match. A digital intermediary can use algorithms to rank products and services based on quality or other criteria or provide individualised searches based upon a consumer’s taste or needs (Riemer et al. 2015). These are then presented to the customer in a structured way, often as an ordered list. This can have an effect on how consumer perceive search results, with research showing that users trust and choose higher-ranked results more than lower-ranked results (Epstein and Robertson 2015). Such discrimination could be for a fee, for example, a supplier paying for their ad to be shown at the top of a list. Ideally, ranking and recommending provides a way to guide users towards a better match, while rewarding high-quality providers who receive the best feedback from consumers (Riemer et al. 2015). However, it could mislead consumers if it reflects providers who pay extra to promote their listing to the top of the list and this is not disclosed. Either way, ‘AAA plumbing’ is no longer enough to ensure your company is seen first.

142 DIGITAL DISRUPTION: WHAT DO GOVERNMENTS NEED TO DO?
Box B.3 Review platforms Review platforms are sites, sections of sites or applications that publish reviews (generally in the form of ratings or comments) on a range of goods and services. Reviews are mostly generated by ‘everyday consumers’ who have experienced or purchased the product, as opposed to specialist reviewers with intricate product knowledge.
Review platforms have expanded the opportunity for consumers to access independent information about a product. Prior to the internet, independent reviews were largely restricted to specialist reviewers who mostly focused on expensive goods and services (for example, cars or high-end restaurants) and for many products consumers were limited to the views and recommendations of family and friends. With online review platforms, the low cost of both publishing and accessing reviews enables many more independent reviews to be written on a wider variety of goods and services, including goods and services located overseas. Consumer reviews can now easily be found on small local restaurants, home goods, books, movies and tourism companies, to name but a few.
Sources: ACCC (2013); Luca and Zervas (2015); Segal (2011).
Ranking and recommending products requires a lot of information, both about the product and the customer. Digital intermediaries achieve this not by going out and assessing products themselves, but by encouraging platform participants to share information (box B.3). Some examples include TripAdvisor and Amazon (box B.4).
Independent recommendations are seen as a trustworthy source of information — consumers’ trust of online reviews ranks second only to recommendations from people they know (Nielsen 2009). The sentiments expressed in online reviews can therefore have a noticeable impact on a business’s bottom line. One study found that a one-star increase on Yelp (a restaurant review website) leads to a 5 to 9 per cent increase in revenue. The increase in revenue was higher for restaurants that are unbranded or not affiliated with a chain (Luca 2011).
Box B.4 Data analysis and recommendation platforms TripAdvisor is the world’s largest online travel website, helping travellers to research and review travel related services including accommodation providers, restaurants and bars, and sights and attractions. It relies heavily on user-generated content such as ratings, reviews and photos to provide structured search results and recommendations to travellers.
Amazon is an online retailer and marketplace (amongst other things). Amazon uses recommendation algorithms to personalise the shopping experience of each customer – the online store will look radically different for an early 20’s software engineer who reads a lot of sci-fi compared with that for a middle aged mother into thrillers. These recommendations are based on a number of simple elements: what the user has previously purchased, products in their virtual shopping basket, products they have rated and reviewed, and what similar customers have viewed and purchased.
Sources: Linden, Smith and York (2003); Mangalindan (2012); TripAdvisor (2016).
DIGITAL INTERMEDIARIES AND PLATFORMS 143
New products and the creation of digital ecosystems
Some digital intermediaries offer services extending into other parts of the value chain (box B.5). This can create a product ‘ecosystem’, where the intermediary offers a suite of individual product or services that can interact with each other as a complete system.
The movement by digital intermediaries into services beyond matching is in part driven by their access to data. As the intermediary collects better information, it gains a clearer picture of tastes and trends in the marketplace. Sometimes this data is used to sell new information services to existing producers, for example matching ads with specific customers, or helping identify why suppliers may be struggling to sell certain products or services (ACCC 2014b). In other cases, the digital intermediary may use their data to enter the market themselves and offer products and services more efficiently than incumbent suppliers.
Box B.5 Digital intermediaries in other parts of supply chain Netflix, a provider of on-demand streaming services, offers other services beyond cataloguing and delivering available video content. They take a product that is often owned by another party (such as the movie studios) and provide digitisation and distribution services. Further, the product is not delivered by the movie studio, but by Netflix itself. This new distribution model can influence how the original products are made.
eBay, an e-commerce company, developed the internet payment platform PayPal to provide a degree of protection between market participants – buyers would not have their money transferred until goods were sent, and sellers could be confident to send goods in the knowledge that they would be paid. PayPal also keeps the buyer’s financial information (such as credit card or bank account numbers) private.
Sources: Netflix (2016); PayPal (2016).
B.2 What areas and markets are affected and how?
The proliferation of digital intermediaries and their use in product ecosystems is having some positive effects. The detailed data they collect can assist in the development of new and innovative products, and help to identify areas where efficiency gains can be made. For example, Trumpf, a manufacturer of metalworking machines, operates an online intermediary that connects customers’ machines and uses the data collected to help better organise production, such as by ordering directly from the supplier when materials are running low (The Economist 2015a).
However, some of the activities of digital intermediaries may also disrupt incumbents. The movement of digital intermediaries into existing markets can change the way participants interact and shift the balance of power. This may lead to competition concerns such as ‘tipping’, especially when strong network effects are present. Further, as businesses shift to

144 DIGITAL DISRUPTION: WHAT DO GOVERNMENTS NEED TO DO?
an ‘information-first’ strategy in order to compete, the collection and control of data becomes paramount – with possible privacy implications as digital intermediaries collect individualised data on a hitherto unprecedented scale.
Impacts on competition
Digital intermediaries are having significant positive impacts on competition.
By breaking down complex products through standardised offerings, aggregator and comparison sites can facilitate like-for-like comparison. This can encourage competition on price terms, rather than on features or quality (which can be created in the eye of the beholder). There is some evidence that service providers, such as private health insurance companies, are structuring their products in a less complex way so that they can feature on aggregator websites (ACCC 2014b).
When review platforms are independent (or transparent about their commercial relationships) they promote competition by helping consumers become better informed. Review platforms reward high quality and good value products, and help expose bad dealings or poor value. This aggregation of consumer experience is particularly effective in improving competition in markets where most consumer transactions are one-off. The lower costs of developing a reputation for quality assists small businesses and new entrants — helping them compete with larger businesses or incumbents with less need for costly branding or advertising. However, review platforms are not free from issues and can be manipulated (see below).
Finally, by enabling new market entry, some industries are seeing significant competition for the very first time. For example, services such as Uber are putting pressure on the taxi industry to improve services and, where possible, cut prices. Online retail platforms are introducing greater competition (particularly from international suppliers) to some established retail markets, such as for entertainment goods, and are challenging the department store business model (Deloitte 2012).
Despite these positive competition effects, digital intermediaries also raise some anticompetitive concerns.
‘Network effects’ can entrench incumbents
‘Network effects’ are the externalities created and correlated with the number of users on a platform. Network effects can be positive or negative, and need not be identical for both sides of the platform. For example, having an email account provides benefits to the account holder that can multiply as more people with whom they wish to communicate similarly have an email account. However, email addresses get picked up by third parties and can attract large volumes of unsolicited and unwanted mail (spam), reducing the

DIGITAL INTERMEDIARIES AND PLATFORMS 145
usefulness of the email account to account holders without offering compensation or choice.
When positive externalities exist for both sides of the platform, feedback loops can result. Participants on each side will wish to use the platform that most other participants are using and a single platform can come to dominate the market. When participants can only reasonably join one platform (for example, when the payoff of joining that particular platform far exceeds the likely payoff of other platforms) then the market may ‘tip’ and entry by a new platform is very difficult (box B.6).
Monopoly control of a platform raises the usual competitive issues – the platform can charge a price above average cost, leading to deadweight loss and transfers of surplus between participants. A monopoly platform that faces little threat from other new platforms starting up has less incentive to innovate than those seeking to enter the market. However, unlike with many markets, introducing platform competition may not increase the efficiency of the market. If there are positive network effects and participants can only choose a single platform, the introduction of more platforms could result in an inferior outcome — for example, when the two parties who would make an optimal match are using different platforms. In the past, the Australian Competition and Consumer Commission (ACCC) has considered these issues when assessing authorisation clearance for mergers (box B.7).

146 DIGITAL DISRUPTION: WHAT DO GOVERNMENTS NEED TO DO?
Box B.6 Single vs. multi homing and tipping equilibrium Many markets have multiple platforms for participants to choose from. For example, large cities will often have shopping centres (a type of platform) in which both retail outlets can rent space and customers can patron. Online marketplaces are another example, with Amazon, eBay and Gumtree, amongst others, all offering online retail platforms.
‘Multi-homing’ refers to participants who are engaged with more than one platform. A consumer who searches each of Amazon, eBay and Gumtree before purchasing, or a retailer who lists their products for sale on multiple sites, is said to multi-home across platforms.
In contrast, ‘single-homing’ is where the participant chooses to interact with only one platform. This is often the case where it is costly (either financially, or in terms of time and skills) to switch platforms. For example, a consumer may choose to shop only at a single shopping centre when driving to another involves too much time and money. On the internet, many people will choose to only use a single internet-dating platform, as the time and effort needed to set up multiple profiles, along with any subscription cost, discourages use of multiple platforms.
When there are positive network effects and both sides of a market single-home, a ‘tipping’ equilibrium, where all participants choose to use the one platform, can result. To see this, consider the diagram to the left below. Participant Y cannot sell goods to A, B and C. Likewise, D can only purchase from Y. In order to expand their market, both D and Y would have an incentive to switch to platform 1. Over time, as participants move to the most popular platform, a single, monopoly platform emerges.
Tipping is less common when one (or both) sides of the market multi-home. Above and right, when sellers X and Y both multi-home, all participants are able to buy and sell from each other, even though A, B, C and D are single-homing. In equilibrium, multiple platforms can exist. However, multi-homing does not always avoid the tipping problem. Tipping is still possible if the multi-homing side does not generate any positive externalities or the single-homing side generates positive externalities for their own side of the market.
Source: King (2013).
A
Platform 1
X
B
Platform 2
Y
A
Platform 1
X
B
Platform 2
Y
Single homing Multi homing
A
Platform 1
X
D
Platform 2
Y
‘Tipping’ equilibrium
B C A
Platform 1
X
D
Platform 2
Y
B CA
Platform 1
X
D
Platform 2
Y
Initial
B C
Single homing Multi homing
DIGITAL INTERMEDIARIES AND PLATFORMS 147
Box B.7 Expedia take-over of Wotif.com In 2014, Expedia proposed a takeover of Wotif.com - a digital intermediary offering hotel bookings, travel packages and other travel services. The acquisition would see the merger between the second and third largest online travel agencies in Australia, leaving only one large competitor in the online travel market.
With the removal of Wotif.com as a competitor, there were concerns that a significant competitive constraint on Expedia and other online travel agencies would be removed, leading to an increase in commission rates. Small hotels in particular rely on online travel agencies for up to 50 per cent of their total bookings. Some argued that customers would ‘single home’ on the large online travel platform.
The Australian Competition and Consumer Commission found that while the market share would be predominately held by the two largest online travel agencies, smaller websites (including tourism sites and the accommodation provider’s own site) could constrain pricing by the dominant firms. This was because many consumers did in fact multi-home – a task made much easier by aggregator sites such as TripAdvisor, which would simultaneously search and compare prices from multiple distribution channels. Sites such as these provide a pathway for new entry by other online travel agencies or for direct sales via the accommodation provider’s own website.
Sources: ACCC (2014a, 2015).
Markets with strong, positive network effects have parallels with markets characterised by natural monopoly. In both cases, it is efficient for one supplier to serve the entire market. Most natural monopolies are subject to government regulation. For example, prices for the distribution and transmission of electricity are set by a national regulator (PC 2013b).
As explained in box B.6, multi-homing across platforms can both introduce platform competition (when other platforms are on offer) and preserve positive network effects. But the winner-takes-all nature of the market creates an incentive for each platform encouraging the market to ‘tip’ in their favour, for example, by requiring providers to enter into exclusivity agreements. Such arrangements need to be carefully monitored and action taken against potential anticompetitive behaviour.
Targeted regulation can also address some market failures. The ACCC has powers to accept undertakings from parties whose actions may be in breach of certain provisions of the Competition and Consumer Act 2010 (Cth) (CCA), such as anticompetitive behaviour. For example, in 2007 the ACCC approved an undertaking that granted third-party access to Foxtel’s digital set top units, which serves as a platform for subscription television channels to reach audiences (ACCC 2007). The National Access Regime also facilitates third party access to certain services provided by significant infrastructure facilities, however its use should be limited to exceptional cases (PC 2013c).

148 DIGITAL DISRUPTION: WHAT DO GOVERNMENTS NEED TO DO?
Those who control data, control the market
Data is a key input into nearly all functions that digital intermediaries provide. The quality of a digital intermediary’s rank and recommendation algorithms will turn on how much they know about the preferences and actions of their customers and suppliers. Information is also key to digital intermediaries moving into new areas — it is the informational advantage that helps them offer products more efficiently, with less risk or, in some cases, offer product ‘ecosystems’ in a way that a single supplier cannot (box B.8).
Google’s autocomplete — suggestions or predictions to a partially completed phrase — is one example. Suggestions are based upon real searches, with popularity heavily influencing what is shown. But other factors are also used to increase the accuracy of autocomplete suggestions, including a user’s location, language, previous search history and the recent popularity (or ‘freshness’) of a search term (Sullivan 2011). Providing such services requires incredible amounts of highly granular data. Moreover, data flow also needs to be high — for Google’s autocomplete to work, it needs to know not just what has been historically popular, but what is popular now.
Box B.8 How Netflix uses big data to create content Netflix collects a lot of data. Its library of 7200 unique media and entertainment titles are annotated with over 70 000 unique micro-genres describing the amount of action, romance, tone, talent, colour and scenery (amongst many others) within each show, then all linked together via data on the viewing habits, reviews and recommendations left by over 69 million subscribers. Although Netflix do not publish up-to-date information on the data they keep, in 2006 they held a competition – with a $1 million prize – to write an algorithm that best predicts user-generated ratings based upon their previous movie ratings. The anonymised dataset made available to competitors consisted of over 100 million ratings from nearly half a million users.
Although the winning algorithm of the Netflix prize was never implemented, the idea that user reviews of a film can predict the popularity of a show ex-ante has endured. Netflix has used their data to both licence existing shows as well as commission original productions, such as the ‘House of Cards’ and ‘Orange is the New Black’ TV series. And they have been successful: while across all networks the success rate for new series (the proportion of series commissioned for a second season) is around 35 per cent, across Netflix original productions the success rate is closer to 70 per cent.
Netflix has also used user data when promoting their original content. For ‘House of Cards’, Netflix made ten different versions of the trailer, each targeted towards a different audience. Fans of the actor Kevin Spacey were shown trailers featuring him, while women who had watched ‘Thelma and Louise’ saw trailers emphasising the show’s female characters.
Sources: Bennett and Lannig (2007); Bulygo (2013); Carr (2013); Netflix (2015).
A feedback loop between data and product quality can thus be established — lots of data enables a business to improve product quality, which in turn attracts more customers, generates more data, enabling further improvements to products, and so forth. If the

DIGITAL INTERMEDIARIES AND PLATFORMS 149
quantity and flow of data to an incumbent is large enough, new business may find that they are unable to compete. One or a few firms may come to dominate the market.
Indeed, a small number of digital intermediaries are already dominating some markets: in the United States, Facebook accounted for 45 per cent of all social media logins in 2014, and Google 65 per cent of search queries (Statista 2015; Sterling 2015). In Australia, real estate website realestate.com.au accounted for 75 per cent of all property search website visits nationally (Roy Morgan Research 2015). While the factors that led to market dominance and entrenchment vary from case-to-case, the data advantage of market leaders is critical.
The ‘gig’ economy’s use of platforms
Plummeting search and matching costs with the use of digital intermediaries have given rise to the ‘gig’ economy — where workers or capital owners contract over a digital intermediary to do small tasks or short-term rentals known as ‘gigs’ (box B.9). Also known as the ‘on-demand’ or, in specific cases, the ‘sharing’ economy, the global market was estimated at $26 billion in 2013, with rapid growth (The Economist 2013b). At present, the gig economy is mostly limited to micro-tasks, or other low- to medium-value transactions. There is little evidence of large, complex transactions occurring over these platforms, partly as information asymmetries still remain high, avenues for recourse are fewer, and many platforms use standard-form contracts. However, there are a number of platforms emerging (such as Expert360 in Australia) that match people with professional consultancy, marketing and finance skills.
Avenues for feedback and review are essential to quality control in the gig economy. Gig economy platforms often do not actively recommend any user over another. Instead, reputations are developed through repeated ratings and feedback from the platform community (Hewett 2016), which both sides can then review before agreeing to the transaction. Some platforms, such as CrowdFlower, may embed hidden tasks with known answers inside a job. How accurately the user responds to the hidden task is used to help determine whether the user’s work can be trusted, or is to be discarded (CrowdFlower 2015).
Chapter 3 of this report discusses the gig economy in more detail.

150 DIGITAL DISRUPTION: WHAT DO GOVERNMENTS NEED TO DO?
Box B.9 Labour in the ‘gig’ economy Gig economy platforms come in two varieties: labour platforms for engaging temporary labour, and capital sharing platforms for renting of capital, such as a spare room on Airbnb. Some examples of gig economy platforms are:
Mechanical Turk
Contracts out ‘human intelligence tasks’ – tasks which may be simple for a human to complete, yet machines find difficult , such as data cleaning and image tagging. Each task takes a couple of seconds to a few a minutes to complete.
CrowdFlower
Crowd sourced data collection and cleaning, sometimes combined with artificial intelligence Typical users are data scientists seeking to develop models and train machine learning algorithms.
99designs
An online graphics design marketplace. 99designs has made it cheaper and easier for some small businesses (who previously may not have been able to afford professional design firms) to contract directly with graphic designers. The platform challenges traditional graphic design businesses as it relies on designers presenting completed design work with only a possibility of payment.
Airtasker
An online marketplace for small jobs and everyday tasks. Users post a task and an indicative price, before Airtasker workers make offers to complete the task.
Sources: 99 Designs (2016); Airtasker (2016); Cannon and Summers (2014); CrowdFlower (2015); Folbre (2013); Mechanical Turk (2016); PC (2015b).
Implications for consumer protection
Digital intermediaries disrupt the traditional model of consumer protection by introducing new mechanisms to mitigate the risk of unscrupulous providers. At the same time, some features of digital intermediaries create consumer protection concerns, and the legal responsibility of the digital intermediaries for poor outcomes can be unclear.
Digital platforms have multiple ways to help protect consumers
Review platforms have expanded the amount of information available to consumers on a variety of products and services (box B.3). Many platforms have review systems integrated into their product offering, with the aim of ensuring minimum standards. For example, Uber has an anonymous feedback system that it uses to deactivate drivers who provide a consistently poor experience (Cook 2015). In largely unregulated industries, these

DIGITAL INTERMEDIARIES AND PLATFORMS 151
mechanisms in many cases mimic the outcomes that regulation would achieve (Deloitte Access Economics 2015c).
Aside from reviews, platforms can also encourage users to complement their ratings with more traditional ‘ticks of approval’. For example, Airtasker users can register for AirtaskerPRO, in which they undergo a video interview with an Airtasker manager who approves (or otherwise) an enhanced profile to signal increased quality (Deloitte Access Economics 2015c).
There are also strong incentives for a platform to police their users – reviews and reputation, in a new industry for which there may be some scepticism, are critical. Low barriers to entry may make it easier for other firms to displace unscrupulous digital intermediaries, while low capital reserves of many market participants (especially if they are not yet profitable) may make it difficult to ride out a crisis.
But consumer-to-consumer transactions are subject to fewer protections
With lower entry costs, digital intermediaries provide greater scope for private sellers to enter the market. Transactions with private sellers who are not running an online business are called ‘consumer-to-consumer’ transactions. Examples of consumer-to-consumer transactions include buying a set of golf clubs on eBay, or having someone assist with moving house for a fee (Consumer Affairs Victoria 2015).
Australian Consumer Law (ACL) does not apply to consumer-to-consumer transactions (section B.3). The buyer is still guaranteed title of the item (unless stated otherwise), meaning that the seller is required to ensure that no one will try to repossess or take back the item, and that there is no money owing from its initial purchase. However, many of the usual consumer guarantees, such as replacements and repairs, may not apply (Consumer Affairs Victoria 2015).
The legal liability of digital intermediaries may not match public expectations
Digital intermediaries have varying degrees of control over the product and services offered on their platforms (figure B.1). At one end of the scale the intermediary offers a simple digital marketplace, with suppliers free to sell (almost) all legal goods and services at a price and quality they choose (such as on eBay or Gumtree). They are essentially online publishers — electronic versions of bulletin boards or the Yellow pages. At the other end are intermediaries that exercise significant control over the products and services offered over their platform. For example, Uber sets driver, and car make and model requirements; requires drivers to pass a background check; and sets the price charged (Uber 2016b). In the middle are digital intermediaries that may restrict or set different product attributes to varying degrees.

152 DIGITAL DISRUPTION: WHAT DO GOVERNMENTS NEED TO DO?
As control over a product increases, so does the capacity for the digital intermediary to ensure consumers are protected. A digital intermediary that decides key product attributes could reasonably be expected to make sure that the aspects of a product under their control do not breach the ACL. Further, as the digital intermediary becomes active in the delivery of their services (such as monitoring suppliers or fielding complaints from consumers), they could be expected to know whether the ACL is, or is likely to, be breached. In such situations caveat emptor — or ‘buyer beware’ — may not be acceptable, with the intermediary expected to take greater responsibility for transactions over their platforms.
Figure B.1 Varying degrees of product control
Digital intermediaries differ in how much they control the products and services offered over their platforms
Sources: Airbnb (2016); Airtasker (2016); Cook (2015); Craigslist (2016); PC (2015b).
Review systems increase scope for misleading or deceptive conduct
The credibility of online reviews is paramount, yet they can easily be undermined by business posting fake or fraudulent reviews about themselves or their competitors. For example, there have been cases of businesses employing ‘professional reviewers’ to post fake 5 star reviews for as little as 25 cents (US) per review (Luca and Zervas 2015). Yelp, a popular review platform, identifies roughly 16 per cent of its reviews as being fake or suspicious, with this percentage growing over time. A 2015 study found that restaurants with weak reputations (or have received a flurry of bad reviews) are more likely to commit review fraud (Luca and Zervas 2015). Restaurants that faced an increase in competition were also more likely to receive unfavourable fake reviews.
Conflicts of interest can also exist between businesses and review platforms. For example, businesses may advertise on the review site, or may pay a commission for every purchase made over the platform. Some review sites will promote a business to the top of search

DIGITAL INTERMEDIARIES AND PLATFORMS 153
results for a fee or prevent negative reviews from being automatically uploaded, regardless how consumers have chosen to sort results (ACCC 2013). Where such commercial relations between the review platform and the reviewed business are not clear, there is potential for consumers to be misled. These actions would not only diminish the trust in, and value of, review platforms, they may also be illegal.
Implications for privacy and data collection, storage and use
Digital intermediaries are well placed to collect vast amounts of data about the people and business that use their platforms. Popular intermediaries, such as twitter and Facebook, can see up to a billion pieces of content shared each day. This content (anything from a status update or tweet through to photos and ‘likes’) is often geo-coded and interlinked together through tagging or linking friends into posts (Franky 2010; Oreskovic 2015). Other intermediaries can be privy to anything from your purchasing history (for example, Amazon) to real-time updates on your location (for example, Uber) (Gross 2015).
When consumers engage with a platform, they explicitly or implicitly hand over information about themselves and their habits to another party. Often, consumers may be unaware of what they are consenting to, inadvertently handing over other data, such as search history.
Considered in isolation, this data may seem innocuous – a kind of background ‘static’ to daily life: a single cab trip, online purchase, or Facebook update. But when enough of these individual pieces of data is collected, or when it is combined with a person’s ‘digital footprint’ – the sum of all the public content available about an individual online – this data can be used to make intimate predications about people’s lives (box B.10).
Most holders of big data have some privacy protections in place to prevent individuals from being personally identified. One such method is de-identification, where details such as names and address are scrubbed from records (or stored separately) and user data is instead linked through a unique identification number. However, if not appropriately anonymised, records held about transactions, whereabouts or other activity can still reveal enough information about a person such that a specific individual can be identified (box B.11). This highlights the importance of using appropriate de-identification techniques.
The data collected by platforms, combined with advances in computing power, can also be used to find correlations between individuals’ behaviour, appearance and other traits and make probabilistic guesses about people and their behaviour (Fiske and Neuberg 1990). This creates concerns that ‘statistical profiling’ may be taken to new extremes.
The Commission’s upcoming inquiry report into Data Availability and Use will discuss the issue of data privacy in more detail.

154 DIGITAL DISRUPTION: WHAT DO GOVERNMENTS NEED TO DO?
Box B.10 Does a computer know you better than your mum? Intimate details about our lives can be predicted with remarkable accuracy by analysing our digital records. What’s more, predications can be made using only one facet of our digital presence – a 2007 study used personal website browsing data to correctly predict a user’s gender with nearly 80 per cent accuracy and a user’s age group (<18, 18-24, 24 – 35, 35 – 49, >49) with over 60 per cent accuracy.
People may choose to keep some sensitive information about themselves private, such as sexual orientation or political leanings, yet such information may be predicted using publically available information – such as ‘likes’ on their Facebook page. Using a dataset of 58 000 volunteers, researchers from Cambridge were able to use Facebook ‘likes’ to accurately discriminate between male and females in 93 per cent of cases, Caucasians or African Americans in 95 per cent of cases, homosexual and hetero-sexual men in 88 per cent of cases, and between democrats and republican voters in 85 per cent of cases. Other traits could also be predicted, albeit with less accuracy: drug use could be predicated with 65 per cent accuracy, and cigarette smoking with 73 per cent accuracy.
Using Facebook ‘likes’, computers can be trained to identify personality groups with greater accuracy then make more accurate personality judgments than friends, family and even spouses. Based upon self-other agreement (that is, the extent to which an external assessment agrees with an individual’s self-assessment) computer predications (on average) needed less than 10 ‘likes’ to outperform a work colleague, 70 to outperform a friend, 150 to outperform a family member, and 300 to outperform a spouse.
Sources: Hu et al. (2007); Kosinski, Stillwell and Graepel (2013); Youyou, Kosinski and Stillwell (2015).
Box B.11 The limits of anonymisation Using the de-identified credit card records of 1.1 million individuals (showing only time of purchase and location), researchers were able to re-identify individuals in 90 per cent of cases using only four pieces of known information (for example, that a person went to the supermarket on the 29th October, went to a bakery and topped up her travel card on the 30th and purchased fuel on the 31st).
Re-identification has also been demonstrated using seemingly innocuous records: in 2008, anonymised Netflix movie ratings data of 500 000 subscribers was used to successfully identify some individuals, while in 2014, Kourtney Kardashian and Ashlee Simpson’s taxi records were identified out of an ‘anonymised’ release of New York’s Taxi and Limousine Commission records.
Source: de Montjoye, Radaelli and Kumar Singh (2015).
B.3 How are digital intermediaries regulated and why?
There is no single law or body overseeing digital intermediaries, although their activities may variously be covered by parts of Commonwealth and state legislation. These laws and regulations are too numerous to list in this report, however, there is some primary

DIGITAL INTERMEDIARIES AND PLATFORMS 155
legislation that is likely to cut across most digital intermediaries. At the national level, generic consumer protection is provided under Australian Consumer Law (ACL) (section B.3). States and territories are responsible for other protections that may be relevant (depending on the purpose of the digital intermediary) such as industry standards, building standards, health standards and occupational licensing. However, if the transaction is between two individuals, the rights of the buyer are less clear (Nicholls 2015).
Protecting consumers of digital platforms
Competition and Consumer Act
The CCA generally applies to all sectors in the Australian economy. Depending on the activities the digital intermediary is engaged in, they may be covered under different aspects of the CCA, including (ACCC 2016):
• product safety and labelling
• unfair market practices
• price monitoring
• industry codes
• industry regulation (such as telecommunications)
• mergers and acquisitions.
The Australian Competition and Consumer Commission is the independent statutory authority that enforces the CCA, and other related legislation.
Australian Consumer Law
The ACL is the national law governing consumer protection and fair trading in Australia, as well as unfair contract terms. The ACL protects consumers by placing a number of requirements and responsibilities on suppliers, manufactures and importers. Broadly, these relate to (Australian Capital Territory Office of Regulatory Services et al. 2010):
• consumer guarantees — including refunds, replacements and repairs
• product safety — including standards, bans and safety warnings
• unfair business practices — such as misleading or deceptive conduct, unconscionable conduct and misleading representations
• sales practices — such as unsolicited agreements, pyramid schemes, and proof of transaction
• unfair contract terms — any terms deemed ‘unfair’ in standard form contracts.

156 DIGITAL DISRUPTION: WHAT DO GOVERNMENTS NEED TO DO?
While the law is common across Australia, each state and territory has its own regulator responsible for compliance and enforcement in its jurisdiction, and can exercise its powers and functions independently (Deloitte Access Economics 2015c).
Whether or not a digital intermediary is currently liable under the ACL will depend on the nature of the relationship between the consumer, the intermediary and the supplier of the goods or services. Such judgments require consideration of the specific facts at hand (Deloitte Access Economics 2015c). For example, a 2013 High Court decision extended the ‘publishers’ exemption’ — a general exemption to most of the media as publishers of news and current affairs from liability for publishing misleading or deceptive material — to Google’s search results. It is not clear to what extent this exemption would (or should) extend to other intermediaries who claim to be information publishers (King 2015).
The ACL does apply if the conduct of a private seller is interpreted by a court as carrying out a business even if it is not advertised as such. For example, if the seller is making regular or repeated sales, intends to make a profit or pays for their online selling presence, then they may be carrying out a business (ATO 2013). However, establishing this can be costly for the consumer, reducing the likelihood of enforcement.
In dealing with complaints/issues, regulator responses can include industry education, advice and persuasion, and formal written warnings used. As the severity or consequences of an offense escalate, other more targeted and interventionist tools can be used, such as court enforceable undertakings, disqualification orders, and criminal convictions and fines (Australian Capital Territory Office of Regulatory Services et al. 2010; Deloitte Access Economics 2015c).
Protecting workers in a gig economy
The Fair Work Act
The Fair Work Act 2009 (Cth) (FW Act) is the primary instrument in Australia’s industrial relation system. The FW Act governs the employee/employer relationship (including enterprise bargaining), as well as setting out minimum standards, employee entitlements and protections (PC 2015e).
Whether or not gig economy workers are fully covered by the FW Act will turn on the specifics of the relationship between the parties. Where workers are classified as ‘independent contractors’, they will fall outside the scope of many of the protections the FW Act provides – such as maximum work weeks, sick leave, fair dismissal and minimum wages. However independent contractors are still covered by some aspects of the FW Act (such as adverse action, coercion and abuses of freedom of association) and other legislation (such as the national unfair contracts scheme) (PC 2015e).

DIGITAL INTERMEDIARIES AND PLATFORMS 157
Protecting privacy
Privacy and data protection
The Australian privacy and data protection landscape is complex.
The Privacy Act 1988 (Cth) and state and territory legislation regulates the collection, use and disclosure of personal information. Together, they provide the main framework governing personal information in Australia. Other legislation at the federal level (and in some states) regulates the collection and use of data in the health and telecommunications sector. Legislation creating or governing the actions of different government agencies will often contain provisions that specify how or when the agency can collect, use and disclose information.
In 2010, the Australian Government established the Office of the Australian Information Commissioner with the objective of a whole-of-government approach to information policy.
B.4 Are current government approaches appropriate or is more needed?
National competition laws are appropriate, but industry specific regulation may need to change
The competition issues identified above are mostly different slants on traditional issues. The key provisions of the CCA covering abuse of market power, unfair market practices and mergers and acquisitions, are broad conduct or outcomes based regulations. These are not industry-specific, and will continue to apply to digital intermediaries. The 2015 Competition Policy Review (Harper review) examined the competition provisions of the CCA and did not identify any specific changes needed in response to digital intermediaries (Harper et al. 2015).
The more significant competition issues with digital intermediaries concern industry-based regulation that either restricts entry or protects incumbents (Deloitte Access Economics 2015c). New technologies and businesses may not fit within the existing regulations, sometimes as they were simply not considered at the time the regulation was drafted (PC 2015b). Industry regulation is often prescriptive, requiring the market participant to undertake certain steps in pursuit of the desired regulatory outcome. New business models operating outside the regulatory framework may then have an unfair advantage as they do not have to incur the cost of regulatory compliance.
Assessments of sector-specific regulation is beyond the scope of this report. In general, the Commission has previously found that the same regulatory requirements should govern

158 DIGITAL DISRUPTION: WHAT DO GOVERNMENTS NEED TO DO?
businesses operating in a similar manner and with similar risks to the community (PC 2015b). However, despite offering very similar products, not all business models present the same risks to the community. For example, some properties for rent on Airbnb have more in common with a coastal holiday rental than a large motel. The Commission previously made the following recommendation:
When considering the regulatory response to new business models, governments should assess the perceived risk level of the new business as well as reassessing the need to retain all current regulatory requirements for existing businesses in order to achieve the desired net benefits for the community. (PC 2015b, p. 219)
For further discussion on these issues see the Commission’s 2015 inquiry report on Business Set-up, Transfer and Closure.
Responsibility for consumer protection should rest with the party in a position to breach that provision
A commonly accepted principle of efficient risk management is that risk should be allocated to the party in the best position to manage it (PC 2014b). This principle is premised on the idea that the party who has most control over the decisions, actions and behaviour that give rise to the risk is also in the best position to take steps to minimise the likelihood of that risk eventuating or, if it does, its magnitude. In other words, allocating risk in this way reduces its expected value.
In a similar vein, responsibility for complying with consumer protection provisions should rest with the party who is in a position to breach that provision (Deloitte Access Economics 2015c). Accordingly, digital intermediaries should differ in their responsibility. Simple matching platforms may be in a poor position to take steps that reduce the risk of consumer harm however, if they provide other services, such as marketing, financial support, or quality control, then their consumer protection responsibilities may need to be broadened.
The suitability of review platforms as an alternative to regulation will require ongoing assessment
The ability for review platforms to provide accurate information to consumers and to discipline unscrupulous providers is critical to their substituting for more interventionist regulation.
Digital intermediaries already have an incentive to ensure their review platforms are accurate. If customers have several experiences that do not match up to expectations, then they may conclude that the site’s review system is unreliable and move to competing platforms.

DIGITAL INTERMEDIARIES AND PLATFORMS 159
The ACCC considers businesses posing as customers and publishing reviews about themselves to be misleading conduct, as is publishing negative reviews about a competitor without experiencing the product or service (ACCC 2013). However, as there is some evidence to suggest fake reviews make up a substantial proportion of even the most popular review sites, it is not yet clear if such market-based discipline will prove effective.
The ability for review platforms to achieve equal or superior outcomes (on a cost-benefit basis) as direct regulation should therefore be monitored and evaluated.
The collection and use of data creates issues for privacy and competition
As discussed above, data collection by digital intermediaries leads to some privacy and competition concerns. The Commission is currently conducting an inquiry into Data Availability and Use, in which these issues and the appropriate action for government will be discussed in more detail. The inquiry final report is expected to be handed to the Australian Government in March 2017.


ADVANCED MANUFACTURING 161
C Case study: advanced manufacturing
This appendix examines a number of key enabling technologies employed in advanced manufacturing that have the potential to fundamentally transform the way business is undertaken, in particular, it includes an: • examination of what advanced manufacturing is and how it is challenging longstanding
concepts of manufacturing activity • outline of two potentially disruptive technologies: the internet of everything and 3D
printing in the context of advanced manufacturing • analysis of the likely impact of these technologies on advanced manufacturing,
including changes in the demand for labour and capital.
C.1 What is advanced manufacturing?
Despite the term being used frequently, there is no universal definition of advanced manufacturing. Sometimes the nature of the definition or the elements included reflect how a person or organisation is engaged in advanced manufacturing – so the focus or the emphasis will vary. This reflects the diverse nature of advanced manufacturing. The Australian Government’s definition of advanced manufacturing is conceptually more closely associated with an activity than sector:
… the use of, and coordination of, information, automation, computation, software, sensing and networking to develop new or modify existing manufactured product, as well as related services and inputs. It includes businesses that adopt innovative technologies or business practices to improve or develop high-value manufactured products, processes or services. (Department of Industry, Innovation and Science 2015, p. 26)
Advanced manufacturing encompasses both processes and products that use new or novel materials or ways of doing things to solve problems more effectively and efficiently. Advanced manufacturing processes based on digital technologies include: design and analysis using computer aided software; information technologies to coordinate processes and collect data; high performance computing for modelling, simulation or analysis; 3-D printing; advanced robotics and artificial intelligence. Advanced manufacturers utilise these technologies and innovative practices to make production processes cheaper or to make new or better products. These include products that are: • more environmentally friendly or less harsh on the environment such as the
development of alternatives to pesticides used in agriculture • more durable or higher quality, reducing the need for replacement

162 DIGITAL DISRUPTION: WHAT DO GOVERNMENTS NEED TO DO?
• more effective, for example, customised dental crowns or hip replacement implants.
A broad concept blurring traditional boundaries between manufacturing and services
Advanced manufacturing is a broad concept extending beyond the factory floor of making things — the traditional way of thinking about manufacturing. Advanced manufacturers incorporate bundles of services into manufacturing products leading to a ‘servicification’ of manufacturing and a blurring of traditional boundaries between manufacturing and services (CEDA 2014).
This way of operating acknowledges the importance of the whole production process and the interdependence of each step in developing, creating and delivering a product. This is known as the ‘value chain’ — the full range of activities that firms engage in to bring a product to the market, starting from the development and design of a manufacturing idea through to after-sales customer-support and feedback from customers (CEDA 2014). These activities may be performed by the same firm or contracted out to several different firms.
Developments over recent decades in international trade (such as reduction in trade barriers, lower costs of communication and improvements in logistics, and with these developments, a growing trend towards export of services) have led to manufacturing businesses expanding their value chains to be global with a network of geographically dispersed manufacturing facilities that are coordinated using information technology — distributed production. These developments have enabled firms to:
• capture cost advantages by sourcing inputs from low-cost or more efficient producers, domestically or internationally, and within or beyond the firm’s boundaries
• gain access to growing foreign markets through a physical presence allowing businesses to develop a greater understanding of the operation of these markets
• gain access to knowledge bases in foreign countries through employing skilled workers and collaborating with universities, research centres and suppliers (OECD 2013a).
The Prime Minister’s Manufacturing Taskforce (non-government members) (2012) noted the changing nature of manufacturing:
Modern manufacturing has strong vertical and horizontal links with associated services including in applied research, engineering, industrial design, process improvement, through-life client support and product stewardship. In recent decades, the divisions between manufacturing and these associated services have increasingly blurred. (p. 2)
A driving motivation behind the shift to embodied services in manufacturing is that these service activities are considered to be generating more value added while the production or manufacturing phase of a firm’s activities are reducing over time (Ye, Meng and Wei 2015) (figure C.1).

ADVANCED MANUFACTURING 163
Figure C.1 Changing nature of manufacturing activities
Source: Veugelers (2013).
C.2 Enabling technologies in advanced manufacturing
This section outlines two enabling technologies in advanced manufacturing: the internet of everything and 3D printing.
The internet of everything in advanced manufacturing
A number of digital technologies have been identified as key enablers — with potentially disruptive capabilities — for advanced manufacturing, including:
• the internet of things and machine to machine connections
• cloud computing
• big data
• analytical software.
Collectively these are increasingly becoming known as the internet of everything — the networked connection of people, process, data and things (Cisco 2016). Common examples of products enabled by these technologies are generally consumer based products including

164 DIGITAL DISRUPTION: WHAT DO GOVERNMENTS NEED TO DO?
mobile phones, wearable fitness devices and smart televisions and fridges. Even though the development of these enabling technologies is driven by other markets, when adopted by manufacturers, these digital solutions are predicted to offer solutions necessary to respond to global economic drivers (CEDA 2014).
What is the internet of things?
The internet of things (IoT) is a group of objects or ‘things’ with network connectivity and computing capability — enabled by embedded information and communication technology such as sensors and actuators — facilitating these objects to collect, exchange and analyse data (Internet Society 2015). This exchange can occur over the internet and/or via other means such as radio frequency identifiers (RFID), near field communication (NFC), or Bluetooth. The key concept is that network connectivity and computing capabilities extend to a range of ‘things’ that are not ordinarily considered to be computers and that connectivity and collection of data is likely to occur with minimal human intervention (OECD 2015a).
In a manufacturing setting, sensors can be spread across the factory floor monitoring and recording a variety of attributes such as temperature or location. This data is then fed back through a network to computers that analyse it, and signals are sent to adjust and improve processes. Potentially every part of a product can have a sensor allowing the possibility to track some aspect of performance. For example, a General Electric sodium nickel battery factory in the United States has over 10 000 sensors. General Electric found that some battery parts failed quality tests after spending too much time on the manufacturing line. Subsequently, the amount of time particular parts spend in factory ovens and elsewhere on the production line are tracked and ‘alarms flash’ when parts approach a certain time limit (Fitzgerald 2013). Monitoring is not restricted to the factory floor, with the potential to track products throughout the supply chain and post-sale.
Advances in digital technology have increased the functionality of machines from basic monitoring and recording (ascertaining the nature of an environment in the factory such as temperature or humidity) to making decisions that change or control that environment (for instance adjusting settings, such as opening and closing vents, within a factory based on the weather forecast to maintain ideal temperature or humidity in the factory). These tasks or actions can be undertaken remotely or with limited human intervention (OECD 2015a).
While the connectivity between ‘things’ is projected to increase there is much debate about the pace and scale of this change, with estimates of the likely number of connected devices varying widely (chapter 1). Despite this, there is a growing consensus that IoT will be characterised by a rapid increase in the number of connected devices and an evolution in the range of associated applications and services on offer as a consequence.

ADVANCED MANUFACTURING 165
Big data, cloud computing and analytical software
Physical objects embedded with sensors facilitate the collection of data — extremely large quantities of data. Big data is an evolving term that describes any voluminous amount of structured, semi-structured and unstructured data that has the potential to be analysed for information. Big data can be characterized by the ‘3Vs’: extreme volume of data; wide variety of types of data; velocity at which the data needs to be processed (figure C.2).
Figure C.2 Characteristics of big data – 3Vs
Source: Adapted from Soubra (2012).
The need for cloud computing has been, in part, driven by the growth in big data. Because data sets have become too big to store and analyse using traditional methods, new approaches have emerged — cloud computing. Cloud computing is a general term for the delivery of hosted services over the internet. It enables companies to consume computer resources as a utility — just like electricity — rather than having to build and maintain computing infrastructure in-house. Cloud computing is attractive to businesses as:
• it allows firms to incrementally change their computer storage needs as their demand changes. Maintaining in-house computer infrastructure requires lumpy investment in computer capacity as well as the physical space to store infrastructure
• it provides access to information, via the internet, outside the physical business offices or factory allowing monitoring of manufacturing processes from remote locations.

166 DIGITAL DISRUPTION: WHAT DO GOVERNMENTS NEED TO DO?
Artificial intelligence and robots
Big data and cloud computing have provided a demand for analytical software technologies such as artificial intelligence. With artificial intelligence, computing software examines numerous previous examples of different scenarios and ‘learns’ patterns to enable it to recognise likely future scenarios. For example, a heart rate monitor can be provided with examples of normal heart rate signals allowing it to recognise irregular signals in the future.
Artificial intelligence enables computers to perform tasks that only humans could previously do. Placing artificial intelligence technology in machines — combining it with sensors, IoT and cloud computing — creates robots that can copy a wide range of human capabilities, including visual as well as analytical tasks. It is this technology that allows production processes to be automated, but it can also feature in the pre-and post-production phases of the product life.
3D printing in the advanced manufacturing
3D printing, or additive manufacturing, is a process whereby three dimensional objects are printed from digital information using specialised software applications. The design information, which is captured in ‘slices’, is sent to a 3D printer — much like a laser printer. That information is printed by adding layers on top of layers or slice by slice (figure C.3).
Although the full capabilities of 3D printers are yet to be realised, a diverse range of material can be used in printing including plastic, metal, food products and human tissue (Deloitte 2013; King et al. 2014). There are many applications for 3D printing including automotive, aviation, footwear, jewellery and medical — although some applications are at different stages of advancement.
While there have been large technological developments in 3D printing in recent years, 3D printers largely remain the domain of hobbyists and advanced industry and academia. Recent consumer demand for 3D printing, usually printing in plastic, has been driven by substantial falls in price. In contrast, 3D printers used in industrial settings with high technical specification are considerably more expensive and consequently their use is not cost-effective for some applications. For example, 3D printing with metal is much more complex than using other materials such as plastic. The equipment also has a high capital cost in the range of $1 million per unit. Due to these challenges, Australian industry has been slow to adopt metal 3D printing (CSIRO 2016a).

ADVANCED MANUFACTURING 167
Figure C.3 How 3D printing works
1 A laser source sends a laser beam to solidify the material.
2 The elevator raises and lowers the platform to help lay the layers.
3 The vat contains the material used to create the 3D object.
4 The 3D object is created as parts are layered on top of each other.
Source: Based on Deloitte (2013).
3D printing offers a range of benefits to manufacturers
By its nature, 3D printing uses the material needed and reduces the amount of waste material. Unused material can be recycled for another project (3Designs Products 2016).
Developing prototype designs using 3D printing is faster and reduces costs, especially for low volume products. Traditional prototype manufacturing requires tooling and machining by people — a process that can take weeks for one iteration. Changes to designs, that flow through to patterns, moulds or dies, are often required. These changes can be costly. Then there is the additional time taken to manufacture another prototype. In contrast, 3D printing uses designs developed in a specialised computer program and often take only hours to print. Prototype iterations are faster using 3D printing as there is no time taken in retooling — instead changes are made to the computer design (3Designs Products 2016). For example, Timberland shoes, using 3D design and printing processes, can design a new shoe sole in approximately 90 minutes at a cost of $35 — a process that previously took one week and cost $1200 (King et al. 2014).
3D printing offers the possibility of product customisation at a market competitive price as 3D digital design can be created or altered to customer specifications without the costs associated with traditional manufacturing moulding and tooling. Customised products include jewellery, dental and medical tools and aids. For example, using a 3D scanner to
168 DIGITAL DISRUPTION: WHAT DO GOVERNMENTS NEED TO DO?
map a patient’s mouth, a mouthpiece can be designed to reduce pauses in breath during sleep (sleep apnoea). The mouthpiece, printed from lightweight titanium and coated with medical grade plastic, is customised for each patient. The mouthpiece retails for $1700 with rebates available from private health insurers (CSIRO 2016b).
3D printing also opens the possibility of designing parts with complex geometric shapes — shapes that are simply not possible using standard construction methods:
The limitations of standard machining have constrained product design for years. With the improvements in additive manufacturing, now the possibilities are endless. Geometry that has been historically difficult or impossible to build; like holes that change direction, unrealistic overhangs, or square interior cavities, is now possible and actually simple to construct. (Yakos 2014, p. 1)
Software can be used to design parts through consolidation of a number of parts, reducing the weight through lattice and mesh structures and creating unconventional shapes. It can also determine where to put material to optimise the strength to weight ratio.
C.3 What does this mean for advanced manufacturing?
Increasing demand for highly skilled workers
As technology progresses, developments in robotics, machine learning and artificial intelligence are contributing to the greater range of tasks and jobs becoming automated. Technological change and automation will increase the demand for certain skills related to advanced manufacturing, with others declining. As outlined in chapter 3, the availability of people with entrepreneurial and relevant STEM (science, technology, engineering and mathematics) skills seem to be universally accepted as necessary to support future innovation and economic growth. The changing demand for particular skills in advanced manufacturing was summarised by CEDA:
… this transition will most likely mean fewer overall jobs in what is described as traditional manufacturing. However, these new jobs will be higher skill, higher paying and make a bigger contribution to the economy. (2014, p. 4)
As described above, the move towards the ‘internet of everything’ has led to the rapid collection of large data sets. This has created a demand for data scientists with skills in statistical analysis of big data. Similarly, these big data sets have also given rise to the development of machine to machine learning and artificial intelligence – increasing the demand for high level math and computer programing skills.
Creative and design skills are also becoming an increasingly important element of STEM, since creativity is an essential part of innovation. Skills associated with creativity and perception are not only important for finding novel and innovative solutions, they are also skills that are unlikely to be made redundant by automation (chapter 3). One example of

ADVANCED MANUFACTURING 169
this is in the field of 3D printing. Advanced manufacturing using 3D printing processes needs designers and engineers who are capable of using computer software for design. In addition to computing skills, it requires a different design thought process to traditional manufacturing as more complex shapes are possible and mathematical programs can be used to optimise design features:
Part of the education process involves designing for manufacturing, with previous constraints posed by designing for machining or moulding removed. For some engineers/designers who have had to create with these constraints in mind, it can take a little adjustment when additive manufacturing is introduced. … you spend years learning all of the things that you cannot do in the name of conforming to traditional manufacturing methods (Balinski 2014, p. 2).
3D printing has applications in many industries, often requiring engineering and design skills combined with knowledge of that particular industry. For example, 3D printing of health products (such as prosthetics) will require a biomedical background in order to innovate and develop new products (Angeles 2013).
Nature of production and changing capital requirements
Advanced manufacturing techniques may mean the competitive advantage of countries with low-cost production may decline in the future for some manufactured products or processes. This will be more the case for products that involve shorter production runs, more design changes, and more expensive material inputs. As described above, the distinction between industries that make things and those that provide services is diminishing, with less of the firm value added coming from the manufacturing part of the production cycle (figure C.1).
This has implications for the importance of scale in the overall production process, as well as the types of capital needed by firms and how much work will be outsourced.
• Advanced manufacturing requires highly specialised capital that is often costly and needs correctly skilled labour to operate or oversee its use.
• There may be greater scope for firms to rent the services of specialist providers, reducing the physical capital needed to support production. For example, the ability of 3D printers to produce many different products will support business models that rent or contract out the production phase. This will allow sharing of facilities across firms — for example, the Commonwealth Scientific and Industrial Research Organisation have a $6 million metal 3D printing facility (called Lab 22) available for industry use for a fee (CSIRO 2016a). Some universities are similarly renting out scientific and computing laboratories and data analytic facilities for businesses to use (University of Melbourne 2016; University of Technology Sydney 2016).
• Digital technologies allow some firms to work more as an organising platform (researching the market, designing and testing a product, manufacturing, sales, delivery, after-sales service, and sometimes disposal). These features make entry easier for new firms, with scope to significantly increase competition.

170 DIGITAL DISRUPTION: WHAT DO GOVERNMENTS NEED TO DO?
• 3D printing may weaken some economies of scale that exists in traditional high volume manufacturing, but this is likely to be in niche markets (Hall 2013).
Broader policy issues
Advances in digital technologies also present a range of policy issues (including cyber security, privacy and ethics) that affect the advanced manufacturing sector.
• While the IoT presents opportunities for advanced manufacturing businesses, it also raises the possibility of cyber security attacks on businesses. Manufacturing firms developing state of the art technology could become targets for cyber-attacks ,with their intellectual property stolen, used or sold (Internet Society 2015).
• Manufacturing businesses may need to devise safeguards in products with internet connectivity to provide consumers with some level of protection from cyber threats. For example, cyber-attacks on Fitbit user accounts allowed hackers access to emails and passwords (often used for a number of online accounts), along with location information (for example, where a person lives, travel routes and exercise locations), and when Fitbit users were at these places or undertaking particular activities. (Spary 2016).
• Large networks of sensor-enabled devices are designed to collect data about operating environments, which can include data related to people. Both the customer and the manufacturer benefit from this data. But when businesses analyse data collected or match with other data streams to provide a more detailed picture of a customer, privacy issues are often raised (Internet Society 2015).
• 3D printing currently offers many benefits in medicine but it also raises ethical issues. A key aspect of 3D bio-printing is the personalised nature of the treatment, making it difficult test the safety and effectiveness of the treatment. The safety and effectiveness of bone replacement (such as hips or knees) with custom printed titanium are well established. But printed organs from emerging materials such as stem cells raises questions of safety and the necessary regulatory framework that would be required (Dodds 2015).
• Artificial intelligence raises the possibility of copying human biases that might be embedded in data. For example, if past human decisions for forming recruitment shortlists built in biases against age, gender or race, then machine learning that emulated human decisions could replicate those biases. Human intervention is needed to short circuit such tendencies (Prof. Alan Winfield, personal communication, 28 January 2016).
• 3D printing makes it easier to copy designs and produce replacement parts. This raises intellectual property issues and requires consideration of whether the current regulatory system will remain fit for purpose. These issues are being explored in the Commission’s inquiry into Intellectual Property Arrangements (PC 2016b).

TRANSPORT TECHNOLOGIES 171
D Case study: transport technologies
D.1 What is the technology?
There is a range of transport technologies with both digital and non-digital aspects that could have disruptive economic and social effects if and when they are broadly adopted. In the main, these technologies involve autonomous, semi-autonomous, and/or remotely operated vehicles.
Autonomous (and semi-autonomous) road transport
Perhaps the most anticipated future transport technology is the driverless car. Autonomous vehicle use on the public road network could have wide ranging disruptive effects for both passenger and freight transport if and when adopted. However, it is not a binary choice between driver-controlled vehicles and fully autonomous ones — vehicles can also incorporate semi-autonomous functions that automate parts of the driving task. The level of vehicle automation can be defined according to the SAE International Standard J3016 issued in 2014, which outlines six levels of diver automation (table D.1).
Low level semi-autonomous vehicles have features that assist the driver or automate part of the driving task, but the driver still fully monitors the driving task. For example, some vehicles have been equipped with ‘active’ or ‘adaptive’ cruise control that uses sensors to adjust a vehicle’s speed to maintain a set distance behind the vehicle ahead (similarly, some vehicles are already being fitted with sensors that alert drivers to potential obstacles or activate emergency braking). More advanced features include automated steering where a combination of sensors, cameras and global positioning system (GPS) mapping are used to keep the vehicle on the road.
More autonomous vehicles automate particular tasks and provide enhanced safety features, with virtually full automation in particular environments, such as a specially designed highway. However, they still require a driver to perform some driving tasks and take overall responsibility for control of the vehicle.
Fully autonomous vehicles are designed to navigate roads and obstacles using a similar array of technology to semi-autonomous vehicles — potentially including sensors, cameras, satellite navigation, remote vehicle monitoring and inter-vehicle and vehicle to infrastructure communications — but be sufficiently advanced as to require no onboard driver responsibility.

172 DIGITAL DISRUPTION: WHAT DO GOVERNMENTS NEED TO DO?
Table D.1 SAE International Standard J3016 — levels of driving
automation
Level Definition Execution of steering and acceleration/ deceleration
Monitoring of driving
environment
Fallback performance
of dynamic driving task
System capability
(driving modes)
Human driver monitors the driving environment No automation (level 0)
The fulltime performance by the human driver of all aspects of the dynamic driving task, even when enhanced by warning or intervention systems
Human driver
Human driver
Human driver
Some driving modes
Driver assistance (level 1)
The driving-mode specific execution by a driver assistance system of either steering or acceleration/deceleration using information about the driving environment and with the expectation that the human driver perform all remaining aspects of the dynamic driving task
Human driver and
system
Human driver
Human driver
Some driving modes
Partial Automation (level 2)
The driving-mode specific execution by one or more driver assistance systems of both steering and acceleration/ deceleration using information about the driving environment and with the expectation that the human driver perform all remaining aspects of the dynamic driving task
System Human driver
Human driver
Some driving modes
Automated driving system monitors the driving environment Conditional automation (level 3)
The driving-mode specific performance by an automated driving system of all aspects of the dynamic driving task with the expectation that the human driver will respond appropriately to a request to intervene
System System Human driver
Some driving modes
High automation (level 4)
The driving-mode specific performance by an automated driving system of all aspects of the dynamic driving task, even if a human driver does not respond appropriately to a request to intervene
System System System Some driving modes
Full automation (level 5)
The fulltime performance by an automated driving system of all aspects of the dynamic driving task under all roadway and environmental conditions that can be managed by a human driver
System System System All driving modes
Source: SAE International (2014).

TRANSPORT TECHNOLOGIES 173
There are different approaches to developing autonomous vehicles. The evolutionary approach incorporates new technology into conventional vehicles that automates various functions. This could include post-manufacture software updates that increases automation of vehicles as technology advances. Such an approach allows various levels of automation to be activated in a vehicle, depending on the infrastructure and regulatory settings in a particular country. Another approach is the development of fully-automated vehicles for use within limited settings (such as low-speed urban environments, or on dedicated motorways), with their use being extended more widely as technology evolves.
Another aspect to the increased use of technology in vehicles is communication connectivity between vehicles and between vehicles and infrastructure (intelligent transport systems). This can be used to both facilitate autonomous and semi-autonomous vehicle operations, as well as communications with non-autonomous vehicles.
Many car manufacturers, component suppliers and other tech companies are currently developing semi-autonomous and fully autonomous vehicles for use on public roads (box D.1).
The timeline for the roll-out of autonomous vehicles is uncertain. Many semi-autonomous features are already available and manufacturers are actively developing the technology, but there are numerous obstacles to overcome. The National Transport Commission (2016a, p. 19) notes that ‘fully automated vehicles are potentially many decades from implementation’. This is because of range of factors, including the refinement of the technology, the state of infrastructure, social acceptability and regulatory impediments.

174 DIGITAL DISRUPTION: WHAT DO GOVERNMENTS NEED TO DO?
Box D.1 Current initiatives to develop autonomous cars Many companies are in the process of developing and testing autonomous car technology or offering semi-autonomous features in vehicles. For instance, CB Insights recently reported on the work of 30 different companies to develop autonomous vehicles, Examples of companies’ activities include:
Google has been working on its self-driving car project since 2009, which is aimed at developing a fully autonomous vehicle. It is currently conducting on-road testing in urban environments in California and Texas using both modified conventional vehicles and purpose-built prototypes. As at the end of 2015, their test vehicles had travelled over 1.3 million miles in autonomous mode. All vehicles have a driver on board who resumes control of the vehicle as required.
In pursuing a fully autonomous vehicle, in addition to the goal of increasing mobility of non-drivers, Google make the point that semi-automation leads to driver inattention and does not have the potential safety benefits of fully autonomous vehicles.
Tesla
Tesla vehicles are most noted for their electric motors and battery technology, however, their vehicles also include an ‘Autopilot’ feature, which semi-automates the driving task under highway conditions. It allows the vehicle to steer within its lane, change lanes when the indicator is pressed and maintain speed using active cruise control. Future updates to improve the autonomous capabilities of vehicles will be delivered to vehicles though wireless software updates.
Volvo
Volvo vehicles already incorporate a range of technology-based safety features, including automatic braking. It is also developing autonomous vehicles and plans to conduct a large scale trial of its autopilot equipped vehicles through its Drive Me trial commencing in 2017 with 100 customers using the vehicles on Swedish roads, and further plans for similar trials in China and the United Kingdom.
In Australia, Volvo demonstrated its driverless cars in South Australia in November 2015 as part of the Australian Driverless Car Initiative. Volvo has also undertaken research on kangaroo detection technology.
Sources: CB Insights (2016); Google (2016); Tesla Motors (2016a); Volvo (2016).
Intelligent Transport Systems
Intelligent Transport Systems (ITS) is a collective term for the use of information and communications technologies in transport vehicles and infrastructure. ITS covers a range of technologies with applications including:
• Infrastructure monitoring and management. ITS infrastructure applications include road network managements tools such as: monitoring systems (including cameras or sensors) that can be used to monitor traffic levels, congestion and identify traffic

TRANSPORT TECHNOLOGIES 175
incidents; and management tools, such as electronic warning signage, variable speed limit setting and adaptive traffic signalling. Management systems of this type are already being adopted to address congestion in urban traffic networks. For example, the Sydney Coordinated Adaptive Traffic System (SCATS), which uses sensors to adjust traffic signals in a synchronised manner in response to traffic flows, has been sold by the NSW Government to 27 other countries (NSW Government Roads and Maritime Services 2015).
• Telematics. This refers to remote monitoring of vehicles through wireless communications. It is currently commonly used for monitoring the location of vehicles via GPS, including for fleet and logistics management, employee surveillance, anti-theft purposes and customer interaction, such as tracking the arrival of a taxi or delivery. Telematics can also be used for regulatory purposes — for example, the Intelligent Access Program, which monitors participating heavy vehicles’ compliance with road access conditions (Department of Infrastructure and Regional Development 2015). Another application is remote monitoring for vehicle diagnostic purposes to alert owners to when maintenance is required or notify authorities when the vehicle has been involved in an accident — this could include elements of the ‘Internet of Things’, which refers to internet connectivity between machines (see appendix C on advanced manufacturing).
• Vehicle-to-infrastructure and vehicle-to-vehicle communications. Those technologies involving automated wireless communication between vehicles and/or infrastructure are referred to as Cooperative Intelligent Transport Systems (C-ITS). There is a large scope for safety and efficiency improvements from cooperative technologies. For example, cooperation between vehicles offers better scope for crash avoidance and could contribute to increased traffic flows and better fuel efficiency through coordinated movements. ‘Platooning’, where trucks travel on motorways in a tight, coordinated convoy is one example of the potential use of vehicle-to-vehicle communications. Implementation of C-ITS is likely to significantly precede widespread use of fully autonomous vehicles, but will have substantial impacts in and of itself.
Remotely piloted aircraft
Remotely piloted aircraft (RPAs) — also referred to as remotely piloted aircraft systems (RPAS), unmanned aerial vehicles (UAVs) and, commonly, drones — are not a futuristic or prototype technology like driverless cars, but are already widely employed. However, RPAs may have more disruptive effects as the technology improves and becomes cheaper and their use becomes more common.
RPAs range from small devices that can be flown for only short times at low altitudes to large, long-range, high-altitude, fixed-winged aircraft. Small simple drones may be piloted by maintaining a line of sight and simply observing the aircraft. More sophisticated methods of piloting RPAs include onboard cameras that allow them to be piloted from a first person view and autonomously via satellite navigation.

176 DIGITAL DISRUPTION: WHAT DO GOVERNMENTS NEED TO DO?
RPAs used for civilian and commercial purposes often have cameras or other imaging equipment installed that can record or stream footage. They can also be configured to carry small payloads. Potential applications include:
• mapping and surveying applications
• filming and photography applications, including real estate photography, sports and news broadcasting
• infrastructure monitoring, for example, of power lines and dams
• agricultural applications, such as monitoring crops, livestock and water, and applying chemicals
• emergency services applications such as evaluating natural disasters (including for insurance assessment) and search operations
• parcel delivery.
Another high profile use of RPAs is for military applications, where they are used for both surveillance and as weapons platforms.
Other remote and autonomous vehicle applications
There are also a range of other current and potential commercial applications for remote and/or autonomously operated vehicles, or for the application of C-ITS. These applications include:
• Mining. Driverless vehicles are already in use in some mines. Examples include the use of driverless trucks to move ore in Rio Tinto’s Pilbara mine (Diss 2015) and driverless load-haul-dump vehicles in the Northparkes underground gold and copper mine in central west NSW (Fitzgerald 2015).
• Rail. Driverless trains present fewer challenges than driverless cars — there is no steering and rail networks are a more restricted system than the public road network. Driverless trains are already being trialled in the mining sector and are proposed for introduction to parts of the Sydney urban rail network (NSW Minister for Transport 2013). Rail networks are also being equipped with increasingly sophisticated network management and communication systems. The Advanced Train Management System, which uses cooperative communications and telematics in place of traditional signalling systems, is being trialled on some Australian lines and has potential safety and capacity benefits (Department of Infrastructure and Regional Development 2015).
• Freight handling. Automated systems for material handling at warehouses and storage sites are already in place. One example is the use of Autostrads, which are driverless machines that move shipping containers between cranes, trucks and container stacks. This technology has been rolled out by Patrick at its terminals at the Port of Brisbane (commencing in 2005) and more recently (2015) at Port Botany (Asciano 2015).

TRANSPORT TECHNOLOGIES 177
• Aviation. Semi-autonomy — auto-pilot — has long been a feature of flying aircraft and drones — unmanned aerial vehicles (UAVs) or RPAs — are already a reality. In addition, improvements in communication, navigation and surveillance technologies, primarily around the use of satellite-based systems are delivering benefits. These systems include automated communications between aircraft and with air traffic control services and ground monitoring systems for tracking aircraft and vehicles movements around airports (Department of Infrastructure and Regional Development 2015).
• Shipping. Satellite-based systems are used for a range of maritime purposes including navigation, safety and surveillance. Autonomous or remotely piloted ships offer similar future challenges and opportunities to land and air-based forms of transport.
• Agriculture. In addition to the potential applications of RPAs for agricultural tasks, digital technologies are leading to the increasing automation of agricultural vehicles. For example, GPS-enabled auto steering functions on tractors and other machines offer efficiency gains through increased precision in sowing, harvesting and spraying applications.
D.2 What areas and markets are affected and how?
The adoption of new transport technologies will have a wide range of market and social impacts.
As in many cases of new technology adoption, there may be substitution between labour and capital from vehicle automation, with particular jobs — for instance, taxi (and Uber) drivers, couriers and truck drivers — made redundant, if and where full automation occurs. However, while there would be labour market structural adjustment, the aggregate effects on labour are less clear. Labour market issues from technology adoption are discussed in more detail in chapter 3. There are also likely to be a range of economic and social impacts that are specific to the uptake of these particular technologies.
Driverless cars would have wide-ranging effects
Many of the advances in vehicle connectivity and partial automation are not particularly disruptive, but more an evolution, building on previous advances in vehicle technology, and introducing a range of new issues to address. As the International Transport Forum noted:
Incremental advances in automation in conventional vehicles are unlikely to fundamentally change vehicle market dynamics. It seems likely that individuals will buy and own such upgraded cars much as they do today. Automated driving will be available for certain situations — for instance when driving on motorways, parking a car, or handling stop-and-go traffic in case of congestion). Because the human driver must resume active control when prompted to do so, such conditional automation raises particularly difficult issues of human-machine interaction that have not been satisfactorily solved. (2015, p. 6)

178 DIGITAL DISRUPTION: WHAT DO GOVERNMENTS NEED TO DO?
However, the potential introduction of fully autonomous vehicles could have more disruptive effects. As the International Transport Forum concluded:
Fully self-driving cars on the other hand, will not face the same issue of human-machine coordination, although their use will likely be confined to contexts where the vehicle can confidently handle the full range of driving complexity. Such highly specific contexts include particular routes and low-speed operations. Self-driving cars have a much higher potential for disruption. They may be deployed in fleet-wide systems that would fundamentally reshape individual travel and have an impact on industries such as public transport and taxis. (2015, p. 6)
Fully autonomous vehicles, if and when they become a widely adopted commercial reality, will represent an evolution of transport technology, not only because they remove the need for a driver, but because they can be programmed to optimise the use of transport infrastructure, improving the volume of traffic that can be carried and reliability of travel times. Along the way to this possible future, developments of advanced safety features and semi-autonomous driver aids should also improve transport safety and the efficiency with which transport infrastructure is used.
Some of these possible effects — transport demand, infrastructure, road safety and third party service providers — are discussed below.
Transport demand
Significant changes in the way that vehicles operate could have large, and disruptive, effects on demand for transport, although the nature and magnitude of these impacts is highly uncertain.
The automation of vehicles could make private vehicle travel a more attractive proposition leading to increased vehicle traffic. This could occur because:
• they make the driving task less ‘demanding’ on the driver, and increase the ability of the ‘driver’ to engage in other tasks while in transit, which could encourage longer and/or more frequent journeys
• fully autonomous vehicles could facilitate increased vehicle access and use by those unable to drive a conventional vehicle (such as children; those with a disability; and the very elderly)
• vehicles could undertake tasks while no one is in the vehicle (such as picking up shopping)
• there could be a substitution from public transport, such as buses or trains, towards private vehicles.
Substantial, and disruptive, impacts on demand are likely to depend on the adoption of fully autonomous vehicles, as these vehicles could increase accessibility to non-drivers and be more substitutable with other forms of transport. This need not mean more vehicles in

TRANSPORT TECHNOLOGIES 179
total, but rather more on the road at any point in time — estimates suggest that private vehicles are in use for only around 5 per cent of the time (Barter 2013). Uber is already increasing the use of conventional vehicles, but driverless vehicles remove the restriction on transport service provision of driver availability.
The effects on mass-transit forms of transport in highly congested cities may be small, or perhaps positive if autonomous vehicles encourage the use of hub and spoke style transport models. However, the effects could be more significant on bus and light rail networks in lower density cities, where more flexible and responsive autonomous vehicle services might be competitive. Of course, on the flip side, autonomous technologies may also be adopted for public transport. For example, autonomous buses could allow for more flexible and responsive services, akin to shared taxis.
Taxis are an interesting case, as they are a close substitute for a fully autonomous vehicle from a passenger’s perspective. Taxis and other hire vehicles are therefore ripe for being converted to fully-autonomous operation, potentially reducing costs and increasing the competitiveness of taxi services with other forms of public transport and privately-owned vehicles. Indeed, a potential outcome from the availability of fully autonomous vehicles could be a change in vehicle ownership models, such as a decrease in rates of private vehicle ownership, with travellers instead engaging the services of an autonomous vehicle on a fee-per-trip basis. This outcome would be reflective of the increasing transformation of goods into services seen across a range of sectors in the economy (see discussion in appendix C), whereby rather than a consumer simply purchasing an item, manufacturers, or third party businesses, use those items to instead provide a service to consumers.
Of course, other factors, including other technology, also affects demand for transport. For example, an increase in broadband connectivity is facilitating alternative means for people to go about their business and engage with others. Better connectivity enables working remotely or ‘telecommuting’ (which may reduce demand for transport to some work hubs) and online shopping (which may reduce demand for transport to shopping centres).
Infrastructure
While adoption of the vehicles is still some way off, the long asset lives of road and other transport infrastructure means that the expected technical features of future vehicles and likely demands on transport infrastructure need to be considered in current infrastructure planning.
The design of infrastructure and incorporation of certain technologies and other features is likely to be necessary to facilitate or enhance the operation of autonomous and connected vehicles (Hillier, Wright and Damen 2015). This could include:
• Road markings and design. Changes may be required to the physical characteristics of roads, such as geometry, lane widths, lane markings and road side barriers, and traffic signalling and intersection design. The lack of line markings, or line markings that do

180 DIGITAL DISRUPTION: WHAT DO GOVERNMENTS NEED TO DO?
not meet a certain standard may inhibit where auto-steering or lane departure warning systems can be used. One of the key limitations identified with autonomous vehicle operation is the interaction with other conventional vehicles, particularly at intersections and merging lanes. This impediment means that dedicated lanes may be necessary for vehicles operating in autonomous mode, most likely on highways, where autonomous driving could alleviate risks associated with driver fatigue. Truck platooning lanes on highways is a potential initial development of this conditional automation. Infrastructure planners should consider how this potential ‘duplication’ of infrastructure can best be planned for.
• Communications connectivity. The dependence of autonomous vehicle technologies on connectivity is likely to raise a range of issues including continuity of coverage, allocation of spectrum and the installation of physical infrastructure such as cabling and transmitters. Automated driving systems are dependent on the continuous transmission of large streams of data, so communication infrastructure needs to have sufficient coverage, capacity and reliability, meet standards to ensure interoperability and ensure the privacy and security of data (Catapult Transport Systems 2015).
• Sensors. There are already a range of sensors in use, including speed and red light cameras, tolling sensors, traffic light sensors, and weigh-in-motion sensors for heavy vehicle monitoring. Increased use of autonomous vehicles and cooperative ITS is likely to require substantially greater installation of various types of sensors.
The adoption of autonomous vehicles could have conflicting effects on overall demand for infrastructure. On the one hand, the availability of driverless vehicles could lead to an increase in vehicle movements, potentially increasing vehicle congestion and demand for road infrastructure. But on the other hand, these new technologies could bring efficiency benefits that increase the capacity and utilisation of infrastructure. For instance, synchronised vehicle movements dues to automation and connectivity could increase traffic flow reducing congestion. Similarly, automation could allow vehicles to travel in narrower lanes.
The use of fully autonomous vehicles could also lead to a reduction in the need for ancillary infrastructure. For example, if driverless vehicles led to a greater service-based model for transport there may be less need for on and off road car parks. Also, vehicles may be parked at larger purpose built facilities in lower density areas rather than the diffuse network of smaller car parks and street parking necessary to allow parking at or near travellers’ destinations.
Safety
Apart from issues of convenience, accessibility or labour issues, one of the largest potential gains from improved vehicle technology is reductions in road accidents. Accidents have large economic and social costs. Improvements in vehicle safety technology, along with changes in regulations and the technological capacity to enforce them, have contributed to a declining trend in road accident deaths and injuries. Nevertheless, the economic cost of

TRANSPORT TECHNOLOGIES 181
road trauma in Australia is still estimated at around $27 billion per year and over 1000 people still die on Australian roads each year (BITRE 2014). And, many, or most, accidents are the result of driver inattention or error.
Some researchers have suggested that fully autonomous vehicles could dramatically reduce the number of road deaths, perhaps in the vicinity of 80 to 90 per cent (BITRE 2014). This is why, as mentioned above, Google considers fully autonomous vehicles to be safer, arguing that in semi-autonomous vehicles, drivers can be inattentive and not ready to resume control when required.
Employing new technologies in road transport could continue the downward trend in road trauma. BITRE (2014) estimates that the introduction of side airbags and electronic stability control have already reduced fatalities by around 9 per cent compared to what they might otherwise have been. Autonomous emergency braking is one semi-autonomous feature that could improve vehicle safety. Connectivity between vehicles and infrastructure (C-ITS), even in the absence of full automation, could also facilitate emergency crash avoidance features in vehicles. Connectivity could also facilitate more timely emergency response to traffic accidents. For example, the European Parliament has voted to mandate that all new cars from April 2018 be equipped with eCall, which automatically places an emergency call in the case of a serious accident (European Commission 2015).
Enhanced use of telematics, or vehicle monitoring, could also improve vehicle safety through improved monitoring, and potentially enforcement, of road speed limits and other regulatory requirements. To date, regulatory telematics in Australia is limited to monitoring devices in some heavy vehicles. Further developments could involve real time monitoring and response (such as immobilising non-compliant vehicles).
A number of commentators have raised potential ethical issues around how fully autonomous vehicles would respond in emergency situations (for example, Buchanan 2015; Millar 2014). These issues typically revolve around the decision-making algorithms vehicles will use in the advent of emergency, such as the weight placed on the safety of vehicle passengers compared to other road users.
While automated vehicles are posited to lead to enhanced safety outcomes, the emergence of the technology poses some additional safety concerns, primarily during the transitionary phase where there is a mix of autonomous and conventional vehicles on the road. During driverless vehicle trials, the cars have frequently been involved in accidents. Typically, these have involved the driverless vehicle being struck from behind by inattentive drivers, which has been attributed to the conservative parameters the vehicles are operated under, including vehicles travelling relatively slowly or braking sharply (in contrast to the slower reaction times of human drivers) when an obstacle is detected ahead. Similarly, autonomous vehicles have evidenced difficulty during trials in undertaking driving tasks that require a reactive response from other drivers, such as merging lanes (Naughton 2015).

182 DIGITAL DISRUPTION: WHAT DO GOVERNMENTS NEED TO DO?
Other effects
The introduction of information and communications technology, such as telematics, into vehicles has a number of other implications:
• Insurance. Widespread adoption of telematics could change the market for insurance. One of the key issues with insurance is the information asymmetry between insurers and customers. Increased use of telematics and other technologies has the potential to reduce these information gaps and allow more tailored insurance products that reflect vehicle use, such as when and where it is driven. The challenge for regulators is whether this will undermine the requirement for motor vehicles to have compulsory third party personal injury insurance. Pooling of risk across vehicles keeps this insurance affordable for people who have a higher risk profile, as only limited information is taken into account. If insurers can better price to risk profile, then governments may need to act as insurer of last resort, so that third parties who are injured can access financial compensation.
• Regulation and compliance. The use of technology to detect traffic infractions has progressively increased, but is based on external detection of vehicle use. Telematics could be used to have vehicles self-report rule violations. In the case of fully autonomous vehicles, the burden of compliance may shift from vehicle users to other parties, such as manufacturers, software providers or other service providers. Increased regulatory compliance of autonomous cars could have substantial revenue implications for some jurisdictions though, since this is an outcome of safer behaviours, it should not be seen as a problematic outcome (box D.2).
• Privacy and cyber security. The development of connected and autonomous vehicles and smart infrastructure will generate an increasing quantity of data on road users, raising potential privacy concerns for users, depending on the use and maintenance of that data by data collectors governments and third parties (either though purchase or unauthorised access to data). In addition to privacy concerns, malicious attacks on operating systems have the potential for substantial economic and safety impacts.
• Technology providers. The development and roll-out of connected and/or autonomous vehicles is likely to provide a range of new market opportunities for technology providers beyond traditional vehicle and component manufacturers.

TRANSPORT TECHNOLOGIES 183
Box D.2 Government revenue implications of autonomous vehicles One potential ‘side’ effect of the uptake of autonomous vehicles could be a reduction in government revenue from fines for traffic infringements. These fines can make a significant contribution to a government’s revenue, particularly for smaller jurisdictions with more limited revenue raising options, such as local governments.
As an example, in 2014-15, the face value of traffic infringement notices issued in New South Wales was as follows:
Offence Face value of notices ($) Number of notices
Police issued speeding offences 68 186 515 209 078
Speed camera detected offences 96 572 081 485 190
Red light camera offences 73 818 461 168 875
Seat belt offences 6 853 153 21 574
Mobile phone offences 11 076 823 35 369
Parking offences 179 666 314 1 272 493
Total 436 173 347 2 192 579
In total, this represents potential revenue of around $436 million, although it may not all be recovered and there are considerable enforcement and administration costs associated with its collection. Nevertheless, it represents a substantial sum and is equivalent to around 0.5 per cent of NSW Government revenue. However, in the case of parking offences, these are predominately issued by local governments. Further, council-issued fines are not uniformly distributed across councils, and for those councils that issue larger numbers of fines, such as the City of Sydney and Waverly councils, the revenue from fines can make up around 5 per cent of annual council revenue.
The roll-out of connected vehicles over time and the potential use of this technology for compliance and enforcement (such that the chance of being caught for breaches converges to 100 per cent as vehicles self-report) could also mean that vehicles will use technology to avoid breaches. This could change the traffic rule compliance model and the scope for revenue from fines, although the scope and timing of this is uncertain. The introduction of fully autonomous vehicles could have even more dramatic impacts on traffic compliance. It could also substantially alter demand for car parking, and hence, parking revenue for some local governments.
Source: OSR (2016).
Drones raise privacy and safety concerns
The use of drones, or RPAs, has the potential for substantial productivity gains across a range of areas, either by substituting for much more expensive conventional aerial usage, or through innovative applications where conventional aircraft were never practicable. However, there are also concerns about privacy and safety issues that arise from their operation.

184 DIGITAL DISRUPTION: WHAT DO GOVERNMENTS NEED TO DO?
Because drones are often equipped with cameras, they can be used to record the activities or property of individuals, organisations or governments, creating actual or perceived breaches of privacy. Beyond voyeurism, drone-based surveillance may be employed in the commission of crime.
Apart from safety concerns associated with malicious acts, there are also safety concerns from the physical operation of drones. Given their relative accessibility and unregulated use by amateur operators, they may represent a safety risk to other aircraft. For example, they have been cited as a potential risk to aircraft involved in fighting bushfires (CASA 2016a). They could also present a risk to people and property from crashing or mishandling, particularly if they become more prevalent and/or larger.
Other areas of automation generally have more localised disruptive effects
Applications such as mining, freight handling and rail typically offer more immediate scope for the adoption of autonomous vehicle technologies. These applications can have productivity benefits for adopting industries, reduce demand for labour, and potentially improve safety by removing workers from dangerous work environments.
However, the effects are not likely to be disruptive on the broader economy. That is not to say that these innovations will not have localised disruptive effects, such as on workers and service providers engaged in the traditional industry. But, these effects are more akin to the continuation of the long-term capital deepening that has occurred in many industries.
D.3 How is it regulated and why?
Vehicle use is subject to relatively high levels of regulation, much of which is targeted at safety-related objectives.
Road vehicle regulation
Vehicles registered for use on roads are heavily regulated: vehicles must be manufactured in accordance with Australian Design Rules (ADRs), be kept in a roadworthy condition, and have compulsory third party personal injury insurance cover; drivers are required to be licensed, having demonstrated a level of proficiency by passing a test; and drivers are required to comply with road rules which govern how, where and when vehicles may be operated on the road network.
In Australia, road transport is primarily regulated at the state and territory level, albeit with a high degree of harmonisation.

TRANSPORT TECHNOLOGIES 185
The main area of Australian Government vehicle regulation is in setting the ADRs, which are administered under the Motor Vehicle Standards Act 1989 (Cth). The ADRs are national standards that covers areas such as vehicle safety (occupant protection, lighting, braking), anti-theft security and engine emissions. A new vehicle needs to be ADR-compliant when first registered for use on Australian roads. There is an established consultation process for reviewing and developing ADRs. New or amended ADRs may also be subjected to a vote by Transport and Infrastructure Council Ministers, before a determination by the Australian Government Minister for Infrastructure and Regional Development. The Australian Government also has a policy for harmonisation with international regulations, primarily United Nations vehicle regulations.
States and territories are generally responsible for regulating driver licensing and registration, and for enforcing road rules. There is a considerable degree of harmonisation between jurisdictions and some aspects, such as elements of heavy vehicle regulation have been moved to administration by a national regulator. The Australian road rules are maintained and reviewed by the National Transport Commission and generally adopted by each state and territory, although there are some differences between jurisdictions.
Regulatory changes to facilitate autonomous vehicles
For vehicles to operate in autonomous modes on Australian roads, a number of regulatory changes will be needed. These barriers are currently the subject of a review by the National Transport Commission (NTC) following a request by the Transport and Infrastructure Council. An issues paper for the review was released in February (NTC 2016a) and a discussion paper in May (NTC 2016b).
The main regulatory changes required are adaptation of the Australian road rules to permit vehicles to operate without a driver; and the adaptation of the ADRs to set appropriate standards for autonomous features for use in Australia.
• The role of the driver has an obvious primacy in the Australian road rules. The driver is responsible for the operation of the motor vehicle and is subject to penalties where a vehicle is operated in breach of the rules. Rules may need to be changed to allocate responsibility for rule breaches to a range of vehicle operators and providers of facilitating services. The NTC has proposed that over the medium term governments should move to expand the meaning of a driver to include an automated driving system (while ensuring that a legal entity is responsible for the system). Of more imminent concern, the NTC noted that lack of clarity around the concept of control for conditionally or highly automated vehicles was an issue, and proposed that governments should develop national enforcement guidelines that clarify the meaning of ‘control’ and ‘proper control’ (NTC 2016b).
• Given the current initiatives to maintain a degree of harmonisation between the ADRs and international standards, changes to ADRs to facilitate autonomous vehicle technology are likely to primarily involve the adoption of international standards. As modern car manufacture is a globally integrated business with manufacturers actively

186 DIGITAL DISRUPTION: WHAT DO GOVERNMENTS NEED TO DO?
pursuing these technologies, and other countries are looking to change regulations to facilitate these technologies, there is likely to be considerable momentum for the necessary changes to international standards. Harmonisation of the ADRs with new international standards will need to be timely and responsive to the commercialisation of the technology. In the meantime as standards develop, non-traditional vehicle designs could be facilitated through exemptions (NTC 2016b).
South Australia is the first Australian jurisdiction to introduce legislation explicitly aimed at facilitating autonomous vehicles. The Motor Vehicles (Trials of Automotive Technologies) Amendment Bill 2015 was introduced to the South Australian Parliament in September 2015. The bill is to amend the Motor Vehicles Act 1959 (SA) to allow for the responsible Minister to authorise trials of automotive technologies on public roads and to provide exemptions from provisions of the Act.
However, explicit legislation is not necessary to facilitate trials. Rather it represents an alternative approach to general exemption powers (NTC 2016a). Other states and territories are also active in this space, including activity to encourage and facilitate trials. The NTC (2016b) has identified the potential for inconsistent conditions for on-road trials across the states and territories as an issue and proposed that governments should introduce national guidelines to support a consistent approach between jurisdictions.
Regulators in other countries are also addressing the operation of autonomous vehicles (box D.3).

TRANSPORT TECHNOLOGIES 187
Box D.3 Regulatory responses to autonomous vehicles in other
countries Trials of autonomous vehicles are being undertaken in numerous countries, including the United States, United Kingdom, Japan, Singapore. To facilitate these, a number approaches have been adopted. In some cases, there are specific regulations governing testing, in others there appears to be a lighter touch code of practice style approach, while in others there appears to be less specific exemption process.
Most European countries have implemented some sort of process for allowing the testing of autonomous vehicles, often involving an exemption process, In the United Kingdom, the Department for Transport has developed a code of practice that sets out requirements for approval of on-road trials, which includes having appropriate insurance cover.
In the United States, the National Highway Traffic Safety Administration has released a statement of policy, which makes recommendations to US states on how trials should be governed with a particular focus on safety. California has been a relatively active jurisdiction in establishing regulations for testing of autonomous vehicles on public roads and currently a dozen different companies have been issued testing permits under its Autonomous Vehicle Tester Program. Under the program, testers are required to report accidents within 10 days and submit annual reports summarising the disengagement of the technology during testing.
Beyond testing, regulatory responses to facilitate the actual use of autonomous vehicles are much less advanced. However, California released draft regulations on the deployment of autonomous vehicles for public operation in December 2015. Amongst other things, the draft regulations include third-party testing prior to deployment, ongoing reporting requirements, privacy and cybersecurity protections and the requirement for a licensed driver in the vehicle.
Sources: California Department of Motor Vehicles (2016); ITF (2015); NTC (2016a).
RPA regulation
In the case of civilian operated RPAs, the key areas of regulation are around safety and privacy issues. Safety regulations are administered by the Civil Aviation Safety Authority (CASA). Privacy issues are primarily dealt with under the Privacy Act 1988 (Cth) administered by the Office of the Australian Information Commissioner.
Currently, the way in which the use of RPAs is regulated is dependent on what they are used for. For RPAs used for recreational purposes, as with traditional model aircraft, the operator is not required to have any qualifications or accreditations, but operation must comply with a number of restrictions. These include: operation within line-of-sight during daylight; not flying within 30 metres of vehicles, buildings or people; not flying over populous areas; not flying higher than 120 metres in controlled airspace; and not flying within 5.5 kilometres of an airfield.
If an operator wishes to use an RPA commercially, they currently need to be authorised by CASA. This involves obtaining both a UAV controller’s certificate (or ‘remote pilot’s licence’) for the individual and a UAV operator’s certificate (UOC) for the operating business or entity. In addition, if the RPA is to operate outside the ‘default area’ (which is

188 DIGITAL DISRUPTION: WHAT DO GOVERNMENTS NEED TO DO?
the same as that applying to recreational fliers), then additional flight authorisations are required. In addition to submitting application forms, applicants for operator’s certificates are required to develop operations, flight and maintenance manuals, while applicants for a controller certificate need to demonstrate appropriate qualifications, such as completion of a training course by a CASA approved training organisation. As at March 2016, there is a waiting period of around 6 months for a UOC, with fees of around $2300.
CASA has acknowledged that the regulation is becoming outdated and that application processes are onerous and time consuming (Skidmore 2015). It recently announced that amended regulations will come into effect on 29 September 2016 (CASA 2016b). The amendments create new weight classifications of RPAs and create exclusions from the need to hold a controller’s and/or operator’s certificate for some commercial or commercial-like uses of RPAs. This will cover the use of ‘very small’ (less than 2 kg) RPAs in compliance with a set of standard operating conditions (broadly similar to the restrictions imposed on recreational users noted above). Operators will still need to notify CASA prior to their first flight. Private land holders will also be able to carry out commercial-like activities using ‘small’ (2-25 kg) RPAs — or ‘medium’ (25-150 kg) RPAs with a remote pilot licence, but without a UOC — provided none of the parties involved receive any remuneration.
These changes will allow a subset of lower-risk commercial RPA uses under a less onerous regulatory regime. However, notable modes of operation not permitted under the relaxed regulations are autonomous flights and flights that are outside line-of-sight. CASA (2016b) notes that it is still in the process of developing new suitable regulations for autonomous flight.
Addressing privacy concerns
Recently, the House of Representatives Standing Committee on Social Policy and Legal Affairs (2014) completed an inquiry into drones and the regulation of air safety and privacy. The inquiry primarily focused on privacy concerns around the use of RPAs. Privacy laws are complex and covered by the Commonwealth Privacy Act 1988, as well as various state and territory legislation and common law. Various Commonwealth, state and territory surveillance regulations also potentially provide some privacy protections from RPA use. The inquiry noted that the Privacy Act does not provide Australians with comprehensive privacy protections and there are gaps and inconsistencies in the patchwork of regulations across Australia. Further, that because of the complexity of the regime, RPA users are unlikely to be aware of breaches and that regulatory compliance will be difficult to enforce. The Committee made a number of recommendations — including: the introduction of additional regulation to provide protections against privacy invasive technologies; simplification and harmonisation of Australia’s privacy regime; and issues around the use of RPA for surveillance by law enforcement agencies. To date, it is not clear that there have been any regulatory developments in respect of these issues.

TRANSPORT TECHNOLOGIES 189
D.4 What supporting infrastructure is needed?
While many of the barriers to adoption of autonomous and remotely operated vehicles would appear to be regulatory, the ubiquitous use of autonomous vehicles on public roads is likely to have a particular impact on infrastructure needs, both in a quantity sense, but also in terms of the incorporation of technological — or ITS — features in transport infrastructure to fully enable new technologies.
Provision of public infrastructure
Infrastructure often has long lead times for development and a long asset life. Governments have to consider the likely developments in technology at the infrastructure planning stage, taking into account the scope for upgrading and retrofitting infrastructure over time as well as what technology means for future infrastructure usage. However, the lumpiness and scale of investments in public infrastructure and its susceptibility to government budgetary pressures, means this is also an area where it is difficult to predict the speed at which innovative technology currently used on a small scale will be adopted more broadly.
New technologies could impact on infrastructure planning and investment in a number of ways, including: planning; construction and maintenance; more efficient utilisation; and improved infrastructure pricing.
Planning for future infrastructure needs
Planning for the provision of future infrastructure needs is hampered by the combination of factors including long asset lives, the political environment of infrastructure decision making and uncertainty about future infrastructure needs. The uptake of new technologies could impact on infrastructure planning through induced changes in demand for infrastructure, and improvements in planning capability, particularly through enhanced data analytics.
Technology embedded in infrastructure and greater use of digital platforms both provide large quantities of near-real time data that should enable quicker assessments of infrastructure needs, supporting more targeted investment in upgrading infrastructure and more timely and efficient maintenance of public infrastructure.
This view was expressed by National ICT Australia in their submission to a House of Representatives inquiry into Smart ICT:
… by collecting data from current infrastructure systems (such as transport networks) and building evidence-based data-driven models, infrastructure performance can be more effectively measured and operating inefficiencies identified. Medium-to-longer term large-scale planning decisions can now be made with far greater certainty. (NICTA 2015, p. 9)

190 DIGITAL DISRUPTION: WHAT DO GOVERNMENTS NEED TO DO?
There are longstanding plans of governments to develop an ITS framework, although progress to date has been limited (box D.4).
With respect to roads and related infrastructure, planning should consider the likely impact of technological change on future demand for roads, ancillary infrastructure (such as car parking) and competing infrastructure (such as public transport). Of course, these assessments are fraught with difficulty given the uncertainty around the nature and timing of potentially disruptive technologies. However, a failure to plan for the digital upgrading of infrastructure could create time delays in providing infrastructure. As Atkinson et al. (2016) concluded:
It’s time for societies to accelerate the creation of smart infrastructure. Doing so will generate an array of economic and social benefits. But without a clear and articulate goal of transforming traditional infrastructure into digital infrastructure, and the associated policies needed to do that, this needed transition will lag. (p. 26)
Box D.4 Intelligent transport systems framework Some work has been undertaken by governments to address the infrastructure needs that will facilitate the adoption of automated and connected vehicles. In November 2011, the then Standing Council on Transport and Infrastructure agreed on a policy framework for Intelligent Transport Systems. The stated objectives of the framework were to:
• guide the consistent implementation, integration and uptake of ITS nationally across all land transport modes;
• promote innovation and competition through interoperable and, where possible, open access and open architecture ITS solutions;
• provide standardisation for important national and interdependent supplier/provider systems;
• provide an umbrella for specific sectoral initiatives, which will continue to be developed consistent with the principles and objectives of this framework; and
• facilitate the efficient and rapid uptake of ITS that meet consumer demands, driven by the perceived usefulness and benefits of the technology. (SCOTI 2012, p. 5)
The framework outlined a number of policy principles, identified some key issues and set out a range of priority action areas, including developing specifications for national ITS architecture; developing a national C-ITS strategy, including standards development; and arranging for the 5.9GHz band spectrum embargo to be lifted by the Australian Communications and Media Authority. Other actions identified in the framework include: developing government and industry linkages; monitoring innovative developments overseas, particularly in Europe, the United States and Japan; considering the privacy implications of ITS developments; economic analysis of smart infrastructure; standards development; research and development strategies; and governance arrangements.
There does not appear to have been substantial progress to date in accordance with the framework, although Austroads has completed Stage 1 of the development of a National ITS architecture, modelled on European ITS Framework Architecture (known as FRAME). However, the Department of Infrastructure and Regional Development is currently leading a review and update of the framework, which is scheduled to be completed during 2016.
Sources: SCOTI (2012), Department of Infrastructure and Regional Development (2015), Austroads (2016).

TRANSPORT TECHNOLOGIES 191
More immediately, planning should also consider design elements of new infrastructure that will facilitate the advent of autonomous vehicles in the most cost effective way, including: design features that are likely to assist/frustrate autonomous vehicle use; and compatibility issues, such adopting appropriate standards and the allocation of spectrum.
Construction and maintenance
Infrastructure projects are prone to cost and time overruns (PC 2014b). New technologies can be adopted in the construction phase of new infrastructure that could potentially improve planning and management.
The recent House of Representatives Standing Committee on Infrastructure, Transport and Cities (2016) inquiry into Smart ICT recommended that future major infrastructure projects (those costing more than $50 million) procured by the Australian Government should require the use of building information modelling (BIM). BIM is a three dimensional digital representation of the project. In addition to providing enhanced visualisation of the project, it can also be used for a range simulation and analytical processes that can improve the physical construction.
New technologies can also assist in the ongoing maintenance of infrastructure. Maintenance of public infrastructure currently imposes substantial costs on government (or is neglected due to insufficient funds). For instance, maintenance of public road infrastructure currently costs the Australian governments around $2.5-$3 billion per year (BITRE 2015b) — a large part of which is site-based labour costs. There is scope for technology to both reduce these costs and enable more timely maintenance activity.
There are already instances of the use of new technology for these tasks. Sensor technology and drones are currently used in isolated cases for assessment of infrastructure maintenance needs. For example, drones are used to inspect infrastructure (such as power lines and dam walls) more quickly, cheaply and/or safely. Sensor technology is also likely to become more sophisticated — for example, researchers in the United States and Germany are developing a ‘sensor skin’ (flexible fabric with electrical properties that could adhere to infrastructure) that could be used to detect cracks in public infrastructure (such as the undersides of bridges) almost immediately when they occur (Brehm 2011).
Robotic systems are being used on a small scale in Australia and overseas for more timely and efficient maintenance of transport infrastructure, such as bridges. For example, the University of Technology Sydney developed robotic systems for steel bridge maintenance, which the NSW Government deployed from 2013 to 2015 to clean the Sydney Harbour Bridge prior to repainting (Sabre Autonomous Solutions 2016).

192 DIGITAL DISRUPTION: WHAT DO GOVERNMENTS NEED TO DO?
Improving infrastructure usage
The adoption of new technologies has the potential to improve the capacity and efficiency of infrastructure usage. This could increase the effective life of an asset and/or reduce the need to replace or duplicate existing infrastructure.
In its recently released Australian Infrastructure Plan, Infrastructure Australia made the following observation about the role of technology in improving the efficiency of existing infrastructure:
Technology will be essential to making better use of our infrastructure. It boosts productivity growth by providing the means to extract more value from existing resources and future investments. Cultural change is required in governments to better understand and utilise emerging – sometimes disruptive – technologies to improve the efficiency of infrastructure and provide flexible, customer-focused solutions. In particular, embedding technology in infrastructure provides operators with rich data on network performance and use, enabling major efficiency and reliability improvements, and better decisions on the infrastructure that can best drive productivity growth. (Infrastructure Australia 2016, p. 15)
As Infrastructure Australia noted, improving infrastructure utilisation will often involve embedding new technology into infrastructure, resulting in a convergence between communications networks and other infrastructure. These upgrades can increase the capacity of infrastructure for its existing use, or better facilitate the use of the infrastructure with new technologies. The use of intelligent transport systems (ITS) to increase the increase the capacity of infrastructure, including roads and rail lines, through better coordination of vehicles is a good example of this.
Infrastructure Australia also made a number of recommendations on the use of technology and data to improve infrastructure efficiency, including:
Governments should increase funding for investments in projects and technologies that make better use of existing infrastructure. (Recommendation 1.7, p. 27)
Infrastructure operators should generate, collect and use data to drive greater productivity in infrastructure service delivery. (Recommendation 1.8, p. 29)
Problems with infrastructure provision and pricing
Another potential use of new technologies is to change the way in which infrastructure is provided and funded through more cost reflective user charging. Difficulties in user charging have been partly responsible for the difficulties associated with the provision of public infrastructure.
Traditionally, governments have provided (or funded) infrastructure for a range of reasons. This includes social equity objectives, where a minimum level of service is provided across society, irrespective of different groups’ capacity to pay or the cost of providing the service. Governments may also be the provider of infrastructure because of the high fixed costs of infrastructure deter private sector provision; the public good nature of some

TRANSPORT TECHNOLOGIES 193
infrastructure, where it is non-rivalrous (that is, consumption by one person will not diminish consumption by others) and non-excludable (where it is difficult to exclude anyone from benefiting from the good); or there are externalities, that is there are costs, or benefits, imposed on third parties that are not reflected in market prices.
Delivering public infrastructure is beset with difficulties. In its Public Infrastructure inquiry examining the provision, funding and financing of public infrastructure (PC 2014b), the Commission noted infrastructure projects had often delivered poor value for money because of inadequate project selection and that there was an urgent need to reform processes for assessing and developing public infrastructure projects. The Commission identified that poor decision making by governments stemmed from deficiencies in using coherent decision-making frameworks to assess potential projects, especially:
• scoping and developing transparent cost–benefit analyses
• appropriate long-term planning for corridors, rigorous demand forecasting, investigating project risks fully (including latent risks borne by governments)
• providing opportunities for users rather than taxpayers to fund projects
• efficiently allocating risks between public and private partners. (PC 2014b, p. 8)
In addition to the poor practices in infrastructure project development, projects are also subject to sovereign risks, particularly where projects have very long implementation time lines and there is a change in government. An example of this was changes to the National Broadband Network that followed the change in Australian Government in 2013. These changes, and the uncertainty created for businesses, including that generated during the preceding election campaign was cited as a particular concern by the Australian Industry Group (2015).
These problems are endemic to infrastructure, both traditional infrastructure and that exploiting or facilitating new technologies. However, utilising new technologies can assist in infrastructure planning and provide scope for better funding through more cost reflective user charging. The use of new technology to facilitate the latter has been previously advocated, particularly in relation to roads, including by the Commission, which recommended that governments undertake pilot studies on how telematics could be used for direct road user charging for cars (PC 2014b). And, more recently, Infrastructure Australia (2016) recommended that:
The Australian Government should initiate a public inquiry, to be led by a body like the Productivity Commission or Infrastructure Australia, into the existing funding framework for roads and development of a road user charging reform pathway. (Recommendation 5.3, p. 87)
Digital technologies offer the scope to use real time pricing (rather than just time of day) to smooth utilisation of infrastructure. This can contribute to the more efficient use of infrastructure and could reduce the need for costly infrastructure expansions, and lower the overall cost of service provision.

194 DIGITAL DISRUPTION: WHAT DO GOVERNMENTS NEED TO DO?
Using telematics to charge road users based on where and when they use roads could enable substantial efficiency improvements in the way governments recover the costs of road infrastructure. There is currently a rudimentary system of cost-reflective user charges, collected through registration and fuel charges for heavy vehicles (and many would argue for light vehicles) across Australia, but the Commission previously noted that inefficient road use is occurring because the current system of charges are based on costs that are averaged across road networks and vehicle types (PC 2014b). Telematics makes it feasible to monitor and charge users of (heavy and light) vehicles for use of road networks.
Other jurisdictions are also trialling new user charging models for roads using telematics. For example, the US state of Oregon has introduced a voluntary telematics-based distance charge for cars that provides a credit on user’s road charge bills to offset the tax they pay on fuel purchases (Walford 2015).

ENERGY TECHNOLOGIES 195
E Case study: energy technologies
The emergence of new technologies related to the efficient generation, distribution, storage and use of energy can be highly disruptive to existing industries and markets. Changes in the way energy is used and managed have the potential to greatly benefit consumers, and society as a whole, by allowing for lower costs of generation, distribution and transmission, more information around access to energy at particular times, increased efficiency in the usage of energy infrastructure and improved environmental sustainability.
Potentially disruptive energy technologies that have been (or are in the process of being) developed include generation technologies (that facilitate the creation of energy) and enabling technologies (that support the storage, distribution or use of energy). Many of these technologies promote the decentralisation of energy generation, by allowing electricity to be created and stored on-mass at a smaller-scale in each location, and in a manner that is relatively cheap and proximate to users.
E.1 Energy markets in Australia
The Australian energy industry is comprised of four distinct yet connected parts — generation, transmission, distribution and retail. Historically, each of these interlinking sectors have been controlled by the state. More recently, deregulation has opened up some parts (in some states) to private ownership and competition.23
• Generation — from a range of fossil fuel and renewable sources. Electricity generators sell their output through the wholesale market. This sector is highly deregulated and open to competition and private investment.
• Transmission — the bulk transfer of electricity via high voltage transmission lines from generators to sub-stations near demand centres. Each state has a single transmission network service provider (TNSP). These are heavily regulated natural monopolies (box E.1) and are sometimes state-owned. There are six interconnectors linking the grid.
• Distribution — the final stage transfer from sub-stations to end users. Distribution network service providers (DNSPs) are natural monopoly businesses. DNSPs in most
23 For example, the Queensland generation sector has a mixture of government and private ownership, while
transmission and distribution are entirely government owned, and the retail sector is comprised of 27 privately-owned licenced retailers (Queensland Government 2016).

196 DIGITAL DISRUPTION: WHAT DO GOVERNMENTS NEED TO DO?
of Australia are regulated by the Australian Energy Regulator (AER). Those in Western Australia are regulated by the Economic Regulation Authority.
• Retail — packaging of electricity purchased in the wholesale market with transmission and distribution services for sale to customers. Retailers are responsible for managing risk and hedging exposure of end users to price fluctuations. This sector is highly deregulated and competitive.
Box E.1 Natural monopoly in transmission and distribution A natural monopoly exists when a single firm can serve a particular market at a lower cost than any other combination of two or more competing firms. This occurs in both electricity transmission and distribution networks.
The high fixed capital costs associated with transmitting and distributing energy create a significant barrier to entry in these sectors. Despite the significant initial cost of establishing infrastructure, marginal operating costs are low, and long run average costs fall as more users are connected to a network. It is therefore most efficient for a single network firm to fully exploit the available economies of scale in a particular geographic area.24 In Australia, it is typical for only one transmission and distribution network to service a given area.
Like any monopoly, there is a risk that unregulated TNSPs and DNSPs could charge monopoly prices (over and above the competitive market price) or provide services at a lower standard compared with a competitive market scenario. In order to prevent this, these sectors are regulated in most of Australia by the Australian Energy Regulator (AER). The AER periodically assesses TNSPs and DNSPs in order to set a ceiling on the prices they charge. When calculating the allowed revenue of a network business, the AER forecasts the revenue required to cover efficient costs and provide a ‘commercial return’ on capital.
Sources: AER (2016); OECD (1993); PC (2013b).
The demand for electricity by individuals and businesses constantly changes, influenced by various factors including weather conditions and time of day. Despite fluctuating demand, end users of electricity expect a reliable supply and have a very low tolerance for blackouts or brownouts. As a result, networks are designed with the capacity to meet peak demand. For generation, this leads to the creation of peak load power plants — designed for when demand is particularly high — which may operate for as little as a few hours per year in some cases. Likewise, the transmission and distribution system is built to operate at a capacity far greater than what is needed to meet average usage.
Since they are only occasionally required to supply electricity, these peak load power plants can be highly costly to operate, and peaks in demand can therefore lead to large price spikes in electricity markets (box E.2).
24 Other justifications for natural monopolies in electricity networks relate to safety and reliability, location
of generators and limited bargaining power of users (PC 2013b).

ENERGY TECHNOLOGIES 197
Box E.2 Wholesale electricity prices The wholesale price of electricity is determined in the National Electricity Market (NEM), where electricity is purchased by retailers. Unlike other aspects of electricity provision, the NEM is considered relatively competitive and prices are mostly unregulated.
• Electricity is traded in a ‘gross pool’ spot market25 in 5 minute intervals.
• A spot price ceiling and floor are set each year ($13 800 per MW/h and -$1000 per MW/h in 2015-16).
There is not perfect arbitrage between markets, so price differential between states can persist. For example, the following is a market snapshot for 2 pm on 14 January 2016. The day saw temperatures approaching 40 degrees Celsius across New South Wales, but much milder conditions across Victoria and South Australia, leading to a divergence of prices.
State Pricea Demandb
New South Wales $5 022.74 12 635.04
Queensland $309.27 7 410.99
South Australia $19.57 111.64
Tasmania $95.29 945.45
Victoria $20.32 5 410.38 a 30 minute Price ($/MWh) b Demand (MW).
Large price fluctuations in wholesale markets cause retailers to hedge their exposure, either through derivatives or natural hedges. This allows for a more stable, averaged price to be delivered to customers (NSW end users do not pay 200 times the amount Victorians pay for electricity — both pay a weighted average).
Sources: AEMO (2016); RBA (2010).
The National Electricity Market
The National Electricity Market (NEM) is the wholesale electricity market and associated transmission grid.26 There are several key institutions responsible for its operation:
• The Australian Energy Market Commission (AEMC) is responsible for the National Electricity Rules and the National Electricity Objective set out under the National Electricity Law. These promote efficient investment, operation and use of electricity services for consumers, regarding the price, quality, safety, reliability, and security of the national electricity system (AEMC 2016).
25 An electricity trading arrangement where generators are required to sell all of the energy they produce. 26 The NEM covers Queensland, New South Wales, Victoria, South Australia and Tasmania. Western
Australia and the Northern Territory have their own separate markets.

198 DIGITAL DISRUPTION: WHAT DO GOVERNMENTS NEED TO DO?
• The Australian Energy Regulator regulates energy markets and networks under national energy market legislation and rules. Responsibilities of the AER include:
– setting prices charged for using energy networks to transport energy to customers
– monitoring wholesale electricity and gas markets
– regulating retail energy markets in the ACT, South Australia, Tasmania, New South Wales and Queensland
– assisting the Australian Competition and Consumer Commission with energy-related issues arising under the Competition and Consumer Act 2010 (Cth), including enforcement, mergers and authorisations.
• The Australian Energy Market Operator (AEMO) is responsible for the administration and day-to-day operation of the wholesale electricity market. It oversees system security of the NEM. In addition, it is responsible for national transmission planning and the establishment of a short term trading market for gas.
Objectives of energy market regulation
As noted above, the energy sector and associated technologies are subject to regulation from all levels of government. The regulatory frameworks and supporting institutions and structures are well described in PC (2013b). These frameworks and structures are designed to: facilitate efficient markets and competition; reduce negative environmental impacts and promote clean energy; and provide standards for interoperability and protection of consumers and the general public. Examples of these include:
Facilitating efficient market operation — the electricity transmission and distribution providers operate as natural monopolies within their geographic markets and are heavily regulated to maintain service standards and limit prices charged (box E.1).
Reducing negative environmental impacts — State governments have, for some years, regulated solar feed-in tariffs to provide incentives to households to adopt solar PV (Marchment Hill Consulting 2015). The generosity of most of these have been wound back, with only some states still mandating defined minimum rates. Feed-in tariffs and Australia's Renewable Energy Target have assisted renewable energy commercialisation and have contributed to the expansion of the Australian renewable energy sector. Wood and Blowers (2015a) demonstrated that generous government subsidies for solar PV are a comparatively expensive way to achieve a reduction in greenhouse gas emissions.
Imposing minimum standards and protecting consumers — The Clean Energy Council sets regulatory guidelines around the design, installation, safety, performance and reliability of energy technology, such as solar PV. The National Energy Customer Framework sets a range of consumer protections, including the establishment of minimum terms and conditions for gas and electricity retail contracts.

ENERGY TECHNOLOGIES 199
E.2 Key technology changes
Solar and other renewable energy technologies
Renewable energy represented nearly half of the world’s total new power generation capacity in 2014, largely due to growth in solar power (IEA 2015). Photovoltaic (PV) solar cells directly convert sunlight into energy through a process known as the PV effect.27 This was first utilised in the 1950s to generate electricity for items such as space satellites, and later, for small personal devices such as battery-powered calculators and watches (NREL 2014). Over time, solar PV cell technology has progressively improved, allowing electricity to be produced more efficiently and at a lower cost.28 This has allowed solar PV panels to be successfully implemented on all continents, regardless of irradiation (Confais, Fages and Van Den Berg 2015).
Figure E.1 Australian PV installations: total capacity (kW)
January 2006 to January 2016a
a A variety of government subsidies for solar have been in place since at least 2000. Production in China from around 2009 lowered the costs of photovoltaic modules and allowed a worldwide increase in demand.
Source: APVI (2016).
27 The PV effect describes the process of an electrical voltage being produced when two dissimilar materials
in close contact are struck by light or radiation (Encyclopaedia Britannica Online 2015). 28 The costs related to solar PV have fallen by 80 per cent in the previous five years (MacGill 2015).

200 DIGITAL DISRUPTION: WHAT DO GOVERNMENTS NEED TO DO?
Solar PV is currently installed in 14 per cent of Australian households, as well as over 15 000 businesses and a number of utility companies at large-scale power stations (REN21 2015, p. 60). These figures are expanding rapidly (figure E.1), and Australia ranked 7th globally for newly added solar PV capacity in 2014.29 New technologies continue to be developed that allow PV cells to be utilised in more creative and flexible ways, such as through integration with rooftop tiles and sections of buildings, embedded in roads or bike paths, or as ‘floatovoltaics’ suspended over water.
Solar energy can also be utilised through concentrated solar thermal (CST) technology. CST generates electricity by using sunlight to heat a fluid (such as water or oil), which in turn produces steam and drives a turbine. CST is still in the development phase in Australia, but has the potential to greatly expand if technology costs continue to fall. Australia has been identified as an ideal location for all forms of large-scale solar power generation due to high solar radiation per square metre and an abundance of open spaces. The Australian Solar Institute predicts that solar thermal could constitute 30 to 50 per cent of Australia’s total power consumption by 2050 (CEC 2014b).
In 2014, the various forms of solar accounted for around 16 per cent of all electricity generated by renewable sources in Australia (figure E.2). This was significantly less than some other energy technologies — including hydroelectricity30 — which was responsible for the largest share (around 46 per cent) of renewable generation.
Figure E.2 Australian renewable energy generation in 2014
Source: CEC (2014a).
29 This contributed towards the 40 GW of solar PV capacity added by all countries over the period, adding
to the previous worldwide total of 138 GW (REN21 2015, p. 60). 30 Hydro technology generates electricity by using flowing water to drive a turbine.

ENERGY TECHNOLOGIES 201
Like solar, wind represents an intermittent source of energy — but has the added disadvantage that it is often not available when needed most (for example, for air conditioning in summer). Other forms of renewable energy used in Australia include bioenergy, geothermal energy and marine energy, all of which may be disruptive to traditional non-renewable industries. The success of many of these renewable energy technologies relies on the development of supporting technologies — such as those related to the storage of energy.
Batteries and storage technologies
Energy storage technologies absorb electrical energy and convert it into a form that can be stored for a period of time, converted back to electrical energy, and later released. New storage technologies have the potential to fundamentally disrupt the way electricity has been previously generated and delivered (AECOM 2015). These have applications in a diverse range of fields, and so the potential benefits — and corresponding disruption — may therefore be experienced in a variety of sectors and on a large scale.
As described by the Clean Energy Council:
Experts, analysts and banks are tipping energy storage to make a big impact on the electricity market over the next decade. Storage has the potential to revolutionise the Australian energy sector. It allows consumers to more fully manage their energy use, complement their onsite renewable energy generation, help with the management of peak demand and fundamentally change the role of networks and the traditional energy system. (2014a)
The most versatile and commonly used energy storage technology is electrochemical storage in the form of batteries. The most commonly used batteries are either non-rechargeable (for example, alkaline batteries) or contain toxic elements that require special handling after use (for example, lead-acid batteries). A technology that avoids these issues is the Lithium ion (Li-on) battery.
Li-on batteries have a high energy density, long lifespan and operate at a wider range of temperatures than other rechargeable batteries (CSIRO 2015a, p. 31). These characteristics have allowed Li-on batteries to become the most common battery used in computers, mobile phones and other consumer electronics. Li-on battery technology will potentially enable the wider uptake of disruptive technologies in a range of sectors. For example, at the household level, Li-on batteries enable the use of plug-in electric vehicles as well as storage technologies such as the Tesla Powerwall (box E.3).
At a larger scale, improvements to Li-on and other energy storage technologies have implications for renewable energy and stationary grid storage. For example, advanced batteries have the potential to improve frequency regulation (by storing excess power during periods of high demand) and peak load shifting (by facilitating the transfer of electrical charge from one part of the grid to another).

202 DIGITAL DISRUPTION: WHAT DO GOVERNMENTS NEED TO DO?
A disadvantage of Li-on batteries is their cost. They are currently relatively expensive to produce compared to lead-acid and other less efficient batteries. However global production of Li-on batteries is increasing, and costs are falling.31 The construction of large factories, such as the US$5 billion Gigafactory by Tesla Motors, will create economies of scale and are expected to further drive down prices and increase adoption of Li-on technology in the next few years (CEC 2014a). Research is also currently underway to improve Li-on battery performance. Improvements in energy density, longevity and production costs have the potential to widen the number of possible applications and increase overall Li-on battery use.
Box E.3 Tesla Powerwall The Tesla Powerwall home battery is a household technology enabled by Li-on battery storage and has the potential to be highly disruptive. The Powerwall is a battery module that enables large amounts of electricity to be stored at the user’s home. The battery can be charged using electricity from solar panels, or from the grid during non-peak energy use periods when rates are low. This stored electricity can then be used to power the home during peak hours.
The ability to store solar energy for use at a later time enables users to benefit fully from generating their own electricity. This allows users to avoid selling excess electricity to the grid (at a feed-in tariff rate) only to buy the equivalent amount of electricity back at a higher (retail) price. As well as reducing energy bills for consumers, household energy storage technologies such as the Powerwall allow for improved energy security (as electricity can be supplied during outages), and wider environmental benefits through the efficient use of solar energy.
Various models of the Powerwall will be available in Australia for use by households and businesses with differing energy needs. The 7 kWh Powerwall cycles daily and is expected to be most popular for households aiming to manage peak and off-peak energy use, whereas the 10 kWh Powerwall will be more suited to rural properties as a back-up solution, due to its weekly cycling. The 100 kWh Powerpack is designed for commercial users with large energy needs and can be grouped to scale up to 10 MWh.
A Bloomberg New Energy Finance study suggests that, even before the Powerwall was released for sale, Tesla’s move into the battery sector led to a reduction in Australian prices of energy storage products. The Powerwall was released in Australia on 10 December 2015.
Sources: Reilly (2015); Tesla Motors (2016b).
Redox-flow batteries are another form of energy storage with the potential to disrupt traditional energy markets. These store electricity in two tanks of liquid separated by a membrane (The Guardian 2015). The advantage of flow batteries is that energy density can be increased simply by increasing the size of the liquid tanks, meaning large amounts of energy can be stored for long periods. The main disadvantage of this is that flow batteries can be much bulkier than Li-on batteries.
31 The Climate Council found that battery costs fell by 14 per cent per year on average between 2007 and
2014, and that Li-on batteries are predicted to reach prices as low as US$200/kWh even without further technological improvements (Stock, Stock and Sahajwalla 2015).

ENERGY TECHNOLOGIES 203
Like Li-on technology, the technology associated with other advanced battery types (including sodium sulphur, advanced lead acid, redox flow and nanowire) is being constantly improved. A team of researchers from Harvard are currently developing a flow battery that uses non-toxic organic materials, which performs as well as vanadium-based flow batteries and costs less (The Guardian 2015). This has significant potential for use in large-scale energy storage for homes and businesses.
In Australia, the Commonwealth Scientific and Industrial Research Organisation (CSIRO) has developed the ‘UltraBattery,’ which combines a lead-acid battery with a supercapacitor. The UltraBattery can be manufactured at a cost 70 per cent lower than other batteries with comparable performance, and has applications including hybrid-electric and conventional vehicles, renewable energy storage and remote area power supply (CSIRO 2015b). While each technology is suited to specific applications in energy markets, recent market trends have seen a greater focus on Li-on batteries due to rapid cost decreases and the technological advantages highlighted above (IRENA 2015).
Storage technologies can also facilitate the use of renewable energy technologies such as those described above. The ability to store energy generated intermittently by wind and solar technologies is highly useful for ensuring reliable supply. Renewable energy stored during times of low demand can be later released into the grid as needed.
Digital monitoring and smart meters
Another technology that enables the use of other disruptive energy technologies is digital metering. A digital meter or ‘smart meter’ is an electronic device that records the consumption of electricity by a household or business at regular intervals.32 This information is then automatically relayed to energy distributors and retailers for the purposes of monitoring and billing. Smart meters have a number of positive features — in particular, they:
• make it possible to have electricity prices that more closely reflect the cost of supply (such as higher prices in peak use times), and a reduction in cross-subsidies between electricity users
• provide near real-time information on consumption to the energy retailer and to users — reducing meter reading costs and allowing households to adjust their usage patterns (for example, in response to prices that vary between use periods)
• allow connections to smart appliances (such as through ‘set and forget’ controls on household electrical equipment) that involve ‘two-way communication’ between electricity consumers and the grid
• can increase reliability through improved fault detection, enable quicker restoration of power following an outage, and can receive and carry out remotely issued commands
32 In Australia, this is typically every 30 minutes (Origin Energy 2015).

204 DIGITAL DISRUPTION: WHAT DO GOVERNMENTS NEED TO DO?
such as ‘disconnecting’ and ‘reconnecting’ power supplies with changes in building ownership (Origin Energy 2015).
Smart meters were rolled out as mandatory in Victoria from 2009 in a problematic process that included failings in community engagement, regulatory arrangements and estimates of benefits and costs (PC 2013b). Some other states and territories have also introduced smart meters, but on a non-mandatory basis.
The disruptive potential of smart meters arises partly from their scope to change the way households in particular use energy. The availability of near real-time information on use allows energy providers to optimise their infrastructure and consumers to optimise their usage patterns. There is potential for reduced overall consumption, the return of more energy back to the grid, and an increased uptake of renewable energy technologies (OECD 2015a, p. 261).
The potential disruption is augmented where connectivity between digital monitors such as smart meters and other digital energy technologies on a large scale enables the development of the ‘smart grid’:
The smart grid provides advanced communication, automation and control of the entire electric system from generating plants to the operation of electric equipment inside homes, commercial buildings and industrial plants. Smart grid programs improve utility system efficiency and reliability, reduce utility operating costs, enhance customer participation in energy management, and reduce the need for new generating plants, carbon dioxide emissions and energy consumption. (SGRC 2015)
Examples of how digital metering can facilitate other (potentially disruptive) energy technologies as part of a wider smart grid include:
• cheap sensors and LEDs that allow devices such as air-conditioners to be monitored and controlled remotely
• plug-load sensors and ‘smart outlets,’ which help to reduce the amount of ‘vampire power’33 used by gadgets and electronics
• mobile phone applications, such as ‘Wattcost,’ that enable users to quickly switch between utility providers depending on current market prices, as well as monitor and control major appliances for the purposes of safety, cost minimisation and environmental sustainability (Wattcost 2014)
• household energy management systems, such as ‘Reposit Power,’ that facilitate automatic trading of energy directly on the wholesale market for owners of solar PV and batteries (Reposit Power 2016).
33 Vampire power, also called standby power, refers to the electric power consumed by appliances while
they are switched off or in a standby mode.

ENERGY TECHNOLOGIES 205
E.3 What areas are affected and how?
Some of the technologies described above, when examined on their own, cannot necessarily be described as ‘disruptive.’ For example, renewable energy technologies such as solar PV have been established and in use for a long period. Advancements in these technologies may result in a higher market share for renewable energy sources, but will still operate within the traditional market structure, and could therefore be described as having an ‘evolutionary’ rather than ‘revolutionary’ impact on energy markets.
However, widespread disruption may take place when the above technologies are used in combination. For example, combining new generation technologies with complementary technologies in storage, information and communication creates significant disruptive potential.
The traditional business model of centralised power generation by predominantly non-renewable energy sources is more than a century old, and has the potential to be greatly disrupted — creating both risks and opportunities for a wide range of individuals, businesses and the wider community.
Supply side impacts
Decentralisation of energy supply
The current approach to regulation and support of energy technologies is largely based on the traditional model of electricity generation and provision. For over a century, the majority of Australia’s energy has been generated by a small number of centralised, large-scale plants, and transmitted and distributed to end users via extensive networks of poles and wires. However, the growing uptake of solar PV, supported by improvements in battery storage and digital monitoring technologies present a fundamental and systemic threat to this traditional model. As described by Paterson (2015):
We are witnessing the beginnings of a radical transformation of our whole approach to electricity … From a centralised, analogue and fossil-fuel driven power delivery system where customers have fewer choices to a distributed, digitised and low-carbon electron transaction system where customers have almost infinite choice.
In particular, the combination of these developments allow a significant decentralisation of energy supply with the potential for Australia’s electricity system to shift from relatively few sources of generation to millions of generation sources. That is, energy markets are moving to a model of distributed energy resources (DER). In this model, households with installed solar PV can be viewed as ‘prosumers,’ with the ability to both consume and produce electricity, and to actively engage in energy markets.
DER often rely on intermittent sources of energy such as solar, tend to be connected to local distribution systems rather than to the NEM, allow growing numbers of individuals to

206 DIGITAL DISRUPTION: WHAT DO GOVERNMENTS NEED TO DO?
move ‘off-grid’ (box E.4), and are generally non-dispatchable.34 DER could increasingly meet the energy requirements of off-grid locations, such as remote rural areas, eliminating the need for expensive infrastructure required to transfer energy across long distances (Confais, Fages and Van Den Berg 2015). As storage technologies continue to improve, this could have significant benefits for sectors such as the mining industry, which could utilise solar and avoid the high costs associated with transporting diesel fuel across large distances (CEC 2014a). In areas where transmission line capacity is close to being reached, distributed energy generation and battery storage could be a better alternative to building new transmission infrastructure.
An associated potential benefit of DER could be better energy independence and reliability. Households and businesses with the capability to meet their energy requirements in a self-sufficient way avoid the blackouts, power quality problems and electricity price spikes associated with reliance on the grid. It has been suggested that the uptake of renewable energy and storage technologies could also provide national security benefits, by reducing reliance on fossil fuels and fuel imports (Rogers 2012).
The impacts of such a shift toward decentralisation may not be manageable at the level of any one subsection of the energy market, and incremental adjustments to current systems may not be sufficient. Governments may therefore be required to undertake a whole-of-system approach and consider new ‘market architectures’ alongside new regulatory infrastructure to facilitate the evolution of energy markets.
A more decentralised energy supply could place existing regulatory frameworks under pressure, and in the long term, has the potential to redefine traditional boundaries of monopoly services, as well as the scope and role of networks. There will also likely be new roles for retailers, a need for governments to reconsider competition regulation and new instances where consumer protection might be needed. For instance, some incumbents have recently attempted to create barriers to new energy technologies that threaten existing business models. In order to discourage the installation of solar PV and household battery storage, some energy companies have campaigned to significantly increase the fixed charge element of electricity tariffs, while others have imposed outright bans from the grid on storage and electrical vehicles (Parkinson 2015b).
Renewable energy options to augment supply
The contribution of renewable and non-renewable energy sources to energy generation could be expected to change in the future with improvements in renewables and battery technologies in particular and further decreases in the prices of these. Increased adoption of renewable energy technologies (both small and large scale) and improved storage technology — enabling the storage of electricity from intermittent sources such as wind
34 Dispatchable sources of generation can be switched on or off, or have their power output adjusted
according to an order.
ENERGY TECHNOLOGIES 207
and solar and for energy to be fed into the grid as needed — could contribute to an increase in not just the share of renewables but also total energy supply. Installation of small-scale generation, such as solar PV panels mounted on roof-tops and other infrastructure, adds to electricity supply and reduces demand for power from the grid.
Improved batteries and storage technologies will also have implications for the operation of electricity grids, particularly in peak demand periods. During periods of low demand when production exceeds consumption, some power plants either reduce output, shut down completely, or use storage technologies to manage surplus electricity.
Common storage techniques include pumped hydro-electric storage (PHES) and compressed air energy storage (CAES). Both of these technologies convert electrical energy into potential energy, which can be used to drive turbines and supply power back to the grid during peak periods. However, these are somewhat limited in their applicability — PHES requires specific topography in order to function while CAES can require specific geological conditions and the few operating are comparatively small scale. Advanced batteries could allow for greater flexibility in grid energy storage.
Implications for supply reliability
Traditionally, networks have not been designed for two-way transmission at the distribution level, and in some areas where there have been high concentrations of rooftop solar panel installations, problems such as voltage control and harmonic imbalances have occurred (PC 2013b). Widespread uptake of distributed energy systems may therefore require network augmentation, although capacity and reliability issues could also be partly addressed by the use of more advanced metering and storage technologies. Advanced energy storage technologies could facilitate frequency regulation in a cost effective way (utility companies aim to keep the frequency of electricity on the grid at a relatively constant current, as the supporting infrastructure operates most efficiently within a specific range).
Demand side impacts
Smart meters and associated monitoring technologies such as smart phone apps potentially make it easier for consumers to switch between energy providers, so long as the technologies are not tied to particular energy providers. These technologies also eliminate the need for estimated bills and manual meter readings, enabling consumers to make more informed choices and to only be charged for the electricity they actually use. Smart meters also allow utility companies to quickly and easily connect or disconnect power remotely. These capabilities have the potential to greatly improve competition — leading to improved services and lower prices for consumers.
Peaks in demand for energy often correspond with optimal periods for producing energy through household solar PV. In Australia, the vast majority of peaks occur during summer

208 DIGITAL DISRUPTION: WHAT DO GOVERNMENTS NEED TO DO?
(ESAA 2015). Increased uptake of solar PV could therefore further assist in lowering peak demand, leading to lower network costs. Because transmission and distribution networks are designed to handle peak demand, less investment in generation and transmission network infrastructure would be required if the peak in demand could be reduced.
Over the longer term, as the uptake of renewable energy increases and battery technology becomes more affordable, an increasing number of energy users may ‘leave the grid’ entirely (CSIRO 2013) (box E.4).
Box E.4 Going ‘off grid’ The decision to defect from the traditional centralised electricity network and go ‘off-grid’ is one option available to Australian electricity users. Off-grid systems allow for energy provision through stand-alone power systems (such as solar PV panels combined with battery storage) or mini-grids, which are centralised electricity generation systems for a local area, and often reliant on renewable or hybrid sources and energy storage technologies.
Electricity users may go off-grid for a variety of reasons, including:
• relative power costs
• privacy concerns related to information collected by smart meters
• energy independence and security of supply.
Energy users incur an initial cost of installing the technologies required to meet energy demands from off-grid power sources, such as solar PV and battery storage. For example, the cost of going off-grid for an average household — consuming around 19kWh per day — was estimated at $39 000 in 2014. However, the household then avoid bills associated with use of the grid. A ‘breakeven point’ occurs where these cumulative savings fully offset the costs of going off-grid. As costs associated with battery storage and renewable energy technologies continue to fall, going off-grid will become financially viable for an increasing number of energy users. Some estimates suggest that going off-grid could become economically optimal for the average Australian household by 2018. CSIRO have estimated that by 2050, one third of Australians may be off-grid.
Going off-grid could be particularly attractive for the owners of new homes, who are required to pay a fee in order to be connected to the grid. These fees can be particularly high in rural areas, due to the significant cost of extending power lines. For these reasons, some new and proposed suburbs — such as ‘Huntlee’ in NSW — are relying on locally produced renewable energy and operating entirely off-grid.
Sources: CSIRO and Energy Networks Association (2015); Parkinson (2015a, 2016); Stock, Stock and Sahajwalla (2015).
Electricity pricing
Increased storage options in combination with renewable energy technologies could enable reductions in wholesale electricity prices. A reduction in wholesale prices has been very significant in certain areas in recent years, such as in the Pacific Northwest in the United States where excess wind energy during off-peak times has led to negative electricity

ENERGY TECHNOLOGIES 209
pricing and forced curtailment. Similar decreases in electricity prices have also been reported in the United Kingdom, Germany and Spain (King 2011a). However, effects on prices will also reflect the supply-side responses of traditional forms of energy generation.
Part of what is driving the increased popularity of DER is the relatively high price of electricity in Australia combined with cheaper PV solar panels (following dramatic decreases in the price of polysilicon) and Li-on batteries in recent years (Griffith 2015). Network costs are responsible for 53 per cent of retail prices on average (CSIRO and Energy Networks Association 2015). However, the approach taken by the AER for setting electricity prices has provided network businesses with perverse incentives. The method used to calculate allowed revenues has encouraged unnecessary construction and ‘gold plating’ of poles and wires in the NEM. A Senate report identified this over-investment in network infrastructure as a key reason for increases in electricity prices in recent years and made a number of recommendations to reform energy network regulation (Senate Environment and Communications References Committee 2015).35
Network companies have been incentivised to provide inflated estimates of demand in order to justify price increases. In reality, demand in the NEM reached a maximum in 2008, and both peak and general demand have since fallen. It could therefore be argued that governments have indirectly encouraged disruption of the electricity sector through inefficient regulation.
As electricity prices increase, more users may leave the grid (box E.4). The prospect of large numbers of energy consumers going off grid would be highly disruptive to traditional utility companies. Network providers of electricity would face reduced revenues due to a lower total volume of power flowing through the grid and potentially have stranded infrastructure assets (Macdonald-Smith 2015). This may lead to a problematic ‘death spiral’ — as network businesses charge higher prices to recover their costs from a smaller customer base, increasing costs for those who remain on the grid, and thus increasing the appeal of going off-grid. It could also raise equity issues, as the individuals who remain on the grid may be those who can least afford to leave. However, there are some counter-balancing forces:
• Those who leave the grid first may be those located in rural or remote areas. These areas are the most expensive to connect to the grid, and so this trend may lead to a reduction in the average connection cost.
• In order to feed in electricity to the network, customers must be connected to the grid. If a user leaves the grid, they will lose the ability to sell any excess generated power.
How these various factors play out in practice warrants further attention of governments in coming years and may necessitate a restructuring in electricity pricing arrangements.
35 This inquiry recommended an independent review to determine how future imprudent capital expenditure
and surplus network assets could be excluded from a network company’s asset base, and calls on the AEMC and AER to review their own roles, guidelines and processes.

210 DIGITAL DISRUPTION: WHAT DO GOVERNMENTS NEED TO DO?
Current fixed pricing models for household electricity exacerbate the peaks in demand because they mean that those who use electricity less at peak times (often low-income consumers) subsidise those who use electricity more at peak times. There is a strong case for variable time-based pricing that reflects demand (PC 2013b).
Smart meters provide the technical means to implement time-based pricing. This could lead to consumers altering their electricity use in response to price changes, leading to lower peaks in demand and a reduction in average retail electricity prices. Such outcomes have not, however, been evident in recent years. Wood (2013) reports that while average household consumption of electricity has declined 7 per cent since 2006, average electricity bills have increased over 85 per cent. This reflects, in part, pricing that attempts to recover the large fixed costs of electricity infrastructure. This charging issue will be exacerbated if significant numbers of households or businesses are able to operate off grid.
As a wider variety of technologies for the production and consumption of energy become available, incentivising end-users to make efficient usage and investment decisions will become increasingly important. One way this could be achieved is by facilitating efficient price signals through electricity tariff reform. The current approach of governments has been criticised, as the price paid for electricity often does not reflect the cost of supply, and there is often no incentive for end-users of electricity to consume less during times of peak demand (Wood and Blowers 2015a, p. 7). More cost-reflective pricing, combined with increased retail tariff certainty (for instance over a medium term of around five years) may be required to support efficient DER investments (Entura 2014, p. 58).
New opportunities in service provision and research
Some have suggested that since optimisation of existing battery technologies is likely to be driven from overseas, Australia could benefit from focusing on developing world class safety and performance test frameworks for new or step change technologies (AECOM 2015). However, comparatively high uptake of solar PV in Australia, combined with one of the most geographically dispersed electricity networks in the world could provide strong motivations for further development of battery technology in Australia.
Solar PV also creates new opportunities for energy delivery and for the services that would install, maintain and operate these new facilities. Since solar technologies produce intermittent energy and rely on sunlight, new solutions would be required to deliver consistent electricity to meet demand (Confais, Fages and Van Den Berg 2015).
Environmental benefits
Smart meters improve the ability of consumers to manage their energy use in order to reduce greenhouse gas emissions (OECD 2015a).

ENERGY TECHNOLOGIES 211
Further use of renewable energy technologies will have environmental benefits through a reduced reliance on greenhouse gas intensive, non-renewable resources. There was a ‘landmark decoupling’ of economic growth and growth in carbon dioxide emissions in 2014 — as rising energy use was met with relatively stable CO2 emissions. Some have attributed this to the increased use of renewable energy in China, and efforts of OECD nations to promote renewable energy and energy efficiency (REN21 2015).
Reductions in carbon emissions could also be achieved through the wider uptake of storage technologies. Battery technologies allow for energy produced by renewable sources to be smoothly integrated into the traditional power supply. Improved storage technologies would also reduce the need for energy and fuel transportation, as more energy could be consumed at the point of generation. An increased uptake of associated technologies such as electric vehicles would also significantly reduce emissions attributable to fuel combustion.
E.4 What do governments need to do?
The emergence of new and disruptive technologies presents a regulatory challenge. As highlighted in a report commissioned by the Clean Energy Council:
The electricity supply system is moving from a highly linear, centralised system of assets, markets, information, regulatory relevance and authority, and planning to a decentralised and competitive customer focussed energy ecosystem. Small scale renewables, storage and demand side management will be significant components of this ecosystem. This transformation is putting significant strain on the current regulatory framework – a situation that appears to be occurring across the world, not just in Australia. (Marchment Hill Consulting 2015)
As noted above, Australia’s transition towards a highly distributed energy system will require systemic change. Various changes will be required to:
• ensure that the demand for energy by end-users is instantaneously balanced with total supply. This task may be highly complex, as it will require the co-ordination of millions of possible sources of generation and storage with existing grid infrastructure
• optimise the use of existing large-scale electricity resources for generation, distribution and transmission, while minimising the need for expensive augmentation
• incentivise end-users of electricity to participate in automated and digital solutions on a large scale. Changes will be required to ensure that energy customers receive the services they value, while providing new services to, and minimising their own negative impacts upon, the energy system. To incentivise such behaviour, end-users should receive a fair share of the new whole-of-system value created as a result.

212 DIGITAL DISRUPTION: WHAT DO GOVERNMENTS NEED TO DO?
These outcomes may be unachievable without a comprehensive redesign of existing platforms, regulation and markets — all elements of the broader system architecture.36 The ‘architecture’ of the electrical grid encompasses information systems, data management, grid control frameworks, communications networks, and the structure of industry, regulation and markets, as well as external elements that interact with the grid including buildings, microgrids and DER (Taft and Becker-Dippmann 2015, p. 10).
Developing a ‘smarter’ grid
A key change that may be required for Australia to reap the maximum benefits of new energy technologies is a move towards a ‘smart grid.’ From a technological standpoint, this would involve the development of a digital communication overlay in order to facilitate various forms of interaction with the grid.37 Many of the benefits of such technology are created by enabling the various distributed participants of the energy network to interact and trade in mutually beneficial ways. As described by Kiesling (2009), the development of a smart grid enables a variety of functionalities. These include:
• transactive coordination of the system
• interconnection of DER
• demand response to dynamic pricing
• the ability of consumers to act as ‘prosumers’
• the ability to program consumer devices to respond autonomously to price signals.
Examples of government intervention to develop smarter and more ‘transactive’ electricity grids are already underway. Jurisdictions currently looking to develop smart grids and increase the use of DER include the Netherlands, as well as the US states of California and New York. Each of these cases involve forward-looking, large-scale changes to the existing energy market architecture. In the case of New York:
… the New York Public Service Commission (PSC) initiated the REV [Reforming the Energy Vision] proceeding to ‘transform New York’s electric industry, with the objective of creating market-based, sustainable products and services that drive an increasingly efficient, clean, reliable, and customer-oriented industry.’ To do so, the PSC seeks to ‘reorient both the electric industry and the ratemaking paradigm toward a consumer-centered approach that harnesses technology and markets.’ (MDPT 2015, p. 14)
The New York PSC has recognised the potential benefits of establishing a smart grid and allowing end-users to make choices with an improved electricity pricing structure. Placing
36 System architecture is a discipline for describing, analysing and communicating structural representations
of complex systems (Taft and Becker-Dippmann 2015, p. 9). 37 Smart grids use digital switching networks, remote sensing and monitoring in wires and transformers,
fault detection, devices for automated fault repair and intelligent end-user devices (Kiesling 2009).

ENERGY TECHNOLOGIES 213
DER on ‘competitive par’ with centralised power generation may become an integral part of creating a more efficient and secure energy system (MDPT 2015).
New market platforms for prosumers
The rise of new technologies is leading to the rapid entry of new participants in energy markets, creating additional uncertainty in the future responsiveness of markets. Investment decisions traditionally made by relatively few utility companies regarding sources of electricity generation may increasingly be determined by the potentially millions of end-users of electricity (CSIRO and Energy Networks Association 2015).
The CSIRO has modelled four potential future energy market scenarios as part of the Future Grid Forum (CSIRO 2013). Each scenario involves a transition from network-centric to customer-centric energy, and a move to systems that are increasingly decentralised, decarbonised, and open to competition. According to these projections, almost 50 per cent of total generation supply could be fed into Australia’s low voltage electricity networks by 2050. Given this, whole-of-system optimisation is unlikely without the creation of new market platforms for quantifying, monetising and transacting the system value facilitated by millions of ‘prosumers.’ Under such a system, end-users may need to be incentivised to provide various energy services, including dispatchable supply, load reduction and power quality services. It may also be necessary for governments to ensure structures are in place to enable new market participants to interact safely.
The potential use of a ‘Virtual Power Station’ (VPS) that links and remotely controls DER and load control systems from a central control point, with electricity produced in the VPS being fed into the grid as required, is being investigated (CSIRO 2016c). Such a web-based system would allow for the optimisation and efficient use of DER by intelligently co-ordinating energy use and storage, while allowing for flexibility and minimising the costs associated with transmission. The VPS would avoid issues related to intermittent generation, and allow energy created by a network of distributed and fluctuating sources to be combined as one smooth, reliable energy source.
Setting technical standards
Distributed energy systems, drawing on a range of DER and facilitated by a smart network to optimise both production and consumption, can only develop if the regulatory system supports the interoperability of the required technology. Australia’s energy future is path dependent, so clarity around technical standards and other regulations will assist the development and adoption of suitable technologies. The Clean Energy Council (CEC) is currently responsible for setting standards and regulation around solar PV technology. However, changes may be required to ensure similar coverage of battery storage and other DER technologies.

214 DIGITAL DISRUPTION: WHAT DO GOVERNMENTS NEED TO DO?
The CEC suggests that current Australian standards for battery installations may be outdated and do not provide sufficient coverage of new devices (CEC 2016). In 2015, the CEC commissioned the CSIRO to undertake research regarding assessment of energy storage safety and standards. This is intended to inform the development of standards, system installation and recycling practices for battery products in Australia. However, the CEC notes that, while the above research is underway, there is currently no regulatory requirement for installers of battery systems to possess qualifications or to install products of a given standard. Accordingly, the CEC has stated that there is a ‘clear role for government’ in establishing an ‘appropriate’ regulatory framework (CEC 2016, p. 3).
Promoting competition and access to data
A range of barriers currently distort the energy market and reinforce the advantage of incumbent firms (CEC 2016). For instance, there may be scope for governments to prevent utilities from discouraging households in the export of solar power to the grid.38
There may also be benefits associated with government regulation to ensure end-users have access to their own energy use data. Currently, data related to energy use is owned by retailers and information shared with consumers is limited. Facilitating access to data would reduce information asymmetry and allow consumers of electricity to make more informed choices. A potential benefit of such a change, and part of the reason why retailers may be hesitant to release such data freely, is that consumers could more easily discriminate between retailers when determining which energy provider would best suit their needs. This could increase competition and promote community-wide benefits through lower prices and improved service quality.
The importance of informed consumers was emphasised by the AEMC through its ‘Power of Choice’ review (2012). The AEMC highlighted the need for effective communication and education strategies by governments in order to build consumer confidence regarding new energy markets and technologies. A means of achieving this proposed by the AEMC is by updating the National Electricity Rules (NERs) to clarify obligations of retailers to provide access to consumption information. However, as noted by the AEMC, the increased availability of web-based portals and mobile apps has improved the channels through which consumers are able to access, view and use their data (AEMC 2012). In light of recent trends, increased clarity and transparency of the NERs may improve consumers’ access to data, as well as understanding and awareness of their energy use.
38 For example, Queensland companies Ergon and Energex introduced rules encouraging smaller solar
systems that do not feed electricity back to the grid, in order to promote grid stability (Tlozek 2014).
ENERGY TECHNOLOGIES 215
Setting efficient tariffs
The setting of efficient feed-in tariffs for energy generated by solar PV may also become increasingly important. One example of a jurisdiction with well-established solar feed-in tariff arrangements is Germany. Germany has the second highest solar PV capacity of any country in the world, partly attributable to its legislated generous, uniform and stable feed-in tariff program. By contrast, Australia currently has inconsistent feed-in tariffs across states, which have reduced significantly over time. There may be scope for exploring a national, legislation-based approach. An effective feed-in tariff may be required to incentivise efficient investment by end-users, as highlighted by the CEC:
The commercial case for battery storage is compelling, and does not therefore require a subsidy. Battery storage simply requires tariffs that can allow consumers to realise the economic benefits of an investment in the technology. (2016, p. 2)
As part of its inquiry into Electricity Network Regulation, the Commission recommended that state and territory governments set feed-in tariffs that ‘approximate the wholesale price of electricity at times of peak and non-peak demand’ (PC 2013b, p. 522). To facilitate efficient levels of investment in DER, users must be able to realise the value of these technologies, with a level of certainty that future structural changes to tariffs will not be detrimental to those investments (CEC 2016). A certain level of consistency and certainty regarding feed-in tariffs will be required to achieve this.
Disruption caused by new energy technologies will also have implications for the tariffs charged to end-users for accessing electricity from the grid. As described above, decreases in the cost of DER may lead to significantly reduced demand for electricity from the grid, potentially leading to stranded assets and a problematic ‘death spiral.’ For instance, there may be potential for increased cross-subsidies among customers if cost-reflectivity of tariffs is not addressed (CSIRO and Energy Networks Association 2015). High-income households with the ability to afford solar PV and batteries may benefit from lower electricity costs, while lower wealth households who cannot afford these technologies will perversely cross-subsidise wealthier households by paying higher bills. Reconsideration of current methods of cost-recovery of energy infrastructure may therefore be required.
Facilitating investment in energy technologies
There may be merit in encouraging existing retailers and network companies to support and collaborate with innovative renewable energy companies. In the United Kingdom, tax incentives for start-up businesses support community and crowd funding business models for renewables. In the United States, ARPA-E grants support the feasibility assessment of new energy technologies.
It has also been argued that a more stable approach to energy technology investment should be adopted in Australia. For example, changing of the RET has led to investor uncertainty, as described by the Clean Energy Council:

216 DIGITAL DISRUPTION: WHAT DO GOVERNMENTS NEED TO DO?
The review of the Renewable Energy Target (RET), which was announced in February 2014 and continued beyond the end of the year, essentially froze new investment in large-scale renewable energy in Australia last year. According to Bloomberg New Energy Finance, new investment in large-scale projects such as solar and wind farms was down by 88 per cent in 2014 compared to the year before. (CEC 2014a)
There may therefore be scope for Government to provide increased certainty and consistency for investment.

REFERENCES 217
References
3Designs Products 2016, The benefits of 3D printing, http://www.3designproducts.ca/ benefits_of_3d_printing.html (accessed 11 January 2016).
99designs 2016, About, http://99designs.com.au/about (accessed 11 January 2016).
ABS (Australian Bureau of Statistics) 2015, Education and Work, Australia, May 2015, November, Cat. no. 6227.0.
—— 2016, Labour Force, Australia, May.
ACCC (Australian Competition and Consumer Commission) 2007, Assessment of Foxtel’s Special Access Undertaking in relation to the Digital Set Top Unit Service.
—— 2013, What you need to know about: Online reviews—a guide for business and review platforms.
—— 2014a, Statement of Issues - Expedia, Inc. proposed acquisition of Wotif.com Holdings Limited.
—— 2014b, The Comparator Website Industry in Australia.
—— 2015, Public Competition Assessment - Expedia, Inc proposed acquisition of Wotif.com Holdings Limited.
—— 2016, Legislation, https://www.accc.gov.au/about-us/australian-competition-consumer-commission/legislation (accessed 20 April 2016).
Acemoglu, D. and Autor, D. 2011, Handbook of Labor Economics, vol. 4.
ACMA (Australian Communications and Media Authority) 2015, The Internet of Things and the ACMA’s Areas of Focus: Emerging Issues in Media and Communications, Occasional paper, 11 January.
ACT Territory and Municipal Services 2016, Smart bin, http://www.tams.act.gov.au/ recycling-and-waste/smart-bin (accessed 8 June 2016).
ACTU (Australian Council of Trade Unions) 2012, History of unions, http://www.actu.org.au/about-the-actu/history (accessed 7 June 2016).
Adshead, A. 2014, Data set to grow 10-fold by 2020 as internet of things takes off, Computer Weekly, http://www.computerweekly.com/news/2240217788/Data-set-to-grow-10-fold-by-2020-as-internet-of-things-takes-off (accessed 5 April 2016).
AECOM 2015, Energy Storage Study - Funding and Knowledge Sharing Priorities, 13 July, Sydney.
218 DIGITAL DISRUPTION: WHAT DO GOVERNMENTS NEED TO DO?
AEMC (Australian Energy Market Commission) 2012, Power of choice review - giving consumers options in the way they use electricity, 30 November, Sydney.
—— 2016, AEMC - National Electricity Market, http://www.aemc.gov.au/Australias-Energy-Market/Markets-Overview/National-electricity-market (accessed 27 April 2016).
AEMO (Australian Energy Market Operator) 2016, AEMO Home, http://www. aemo.com.au/ (accessed 14 January 2016).
AER (Australian Energy Regulator) 2016, Our Role in Networks, https://www.aer.gov.au/networks-pipelines/our-role-in-networks (accessed 8 April 2016).
Aghion, P. and Griffith, R. 2008, Competition and Growth: Reconciling Theory and Evidence, MIT Press, Cambridge MA.
Airbnb 2016, About us, Airbnb, https://www.airbnb.com.au/about/about-us (accessed 11 January 2016).
Aird, R., Miller, E., van Megen, K. and Buys, L. 2010, Issues for Students Navigating Alternative Pathways to Higher Education: Barriers, Access and Equity, Adult Learner Social Inclusion Project, Queensland University of Technology.
Airtasker 2016, About Us, https://www.airtasker.com/about/ (accessed 24 February 2016).
Akami 2015, State of the Internet Report | Akamai, https://www.akamai.com/us/en/our-thinking/state-of-the-internet-report/ (accessed 2 May 2016).
Van Alstyne, M. 2015, Why platforms beat products every time | MIT Sloan Executive Education, http://executive.mit.edu/blogpost/why-platforms-beat-products-every-time (accessed 3 May 2016).
American Society of Mechanical Engineers 1983, Owens ‘AR’ Bottle Machine designated as an International Historic Engineering Landmark, https://www.asme.org/getmedia /a9e54878-05b1-4a91-a027-fe3b7e08699e/86-Owens-AR-Bottle-Machine.aspx (accessed 26 May 2016).
Andes, S. 2016, How firms learn: industry specific strategies for urban economies, Brookings Institution.
Andrews, D., Criscuolo, C. and Gal, P.N. 2015, Frontier Firms, Technology Diffusion and Public Policy: Micro Evidence from OECD Countries, The Furture of Productivity: main background papers, Organisation for Economic Cooperation and Development, Paris.
Angeles, S. 2013, ‘10 3D printing jobs on the rise’, Business News Daily, 18 September, http://www.businessnewsdaily.com/5125-3d-printing-jobs.html (accessed 13 January 2016).
Angus, C. 2015, Future Workforce Trends in NSW: Emerging Technologies and Their Potential Impact, Briefing Paper, Parliament of NSW.

REFERENCES 219
ANZ (Australia and New Zealand Banking Group) 2016, ANZ Job Advertisement Series, ANZ, http://www.media.anz.com/phoenix.zhtml?c=248677&p=irol-jobad&nyo=0 (accessed 9 May 2016).
Apple 2016, iTunes Match, http://www.apple.com/au/itunes/itunes-match/ (accessed 20 April 2016).
APVI (Australian Photovoltaic Institute) 2016, Australian Photovoltaic Institute - Market Analyses, http://pv-map.apvi.org.au (accessed 2 May 2016).
Arntz, M., Gregory, T. and Zierahn U. 2016, ‘The risk of automation for jobs in OECD countries: a comparative analysis’, reported in OECD, Automation and Independent Work in a Digital Economy, Policy brief on the future of work, May.
Van Ark, B., Frankema, E. and Duteweerd, H. 2004, Productivity and Employment Growth: An Empirical Review of Long and Medium Run Evidence, Groningen Growth and Development Centre.
——, Hao, J., Corrado, C. and Hulten, C. 2009, ‘Measuring Intangible Capital and Its Contribution to Economic Growth in Europe’, The Conference Board.
Arrow, K. 1962, ‘The economic implications of learning by doing’, Review of Economic Studies, vol. 29, pp. 155–173.
Arthur, B. 2011, The Second Economy, McKinsey Quarterly.
Asciano 2015, Patrick Terminals & Logistics Update May 2015, http://asciano.com.au/news/articles/news/a/welcome-from-alistair-field (accessed 6 June 2016).
Astron 2015, Drones deliver for environmental monitoring, http://www.astron.com.au /news/drones-deliver-for-environmental-monitoring/ (accessed 28 April 2016).
Atkinson, R., Castro, D., Ezell, S., McQuinn, A. and New, J. 2016, A Policymaker’s Guide to Digital Infrastructure, May, Information Technology & Innovation Foundation.
ATO (Australian Taxation Office) 2013, Hobby or business - how do you tell the difference?, https://www.ato.gov.au/Business/Starting-your-own-business/In-detail/Get ting-started/Online-selling---hobby-or-business-/?page=2 (accessed 8 January 2016).
—— 2016, Tax Incentive for Early Stage (Angel) Investors, https://www.ato.gov.au /General/New-legislation/In-detail/Tax-Incentive-for-Early-Stage-(Angel)-Investors/ (accessed 5 May 2016).
Australian Capital Territory Office of Regulatory Services, Australian Competition and Consumer Commission, Australian Securities and Investments Commission, Consumer Affairs and Fair Trading Tasmania, Consumer Affairs Victoria, New South Wales Fair Trading, Northern Territory Consumer Affairs, Office of Consumer and Business Affairs South Australia, Queensland Office of Fair Trading and Western Australia Department of Commerce, Consumer Protection 2010, Compliance and enforcement: How regulators enforce the Australian Consumer Law, Commonwealth of Australia.

220 DIGITAL DISRUPTION: WHAT DO GOVERNMENTS NEED TO DO?
Australian Competition Law 1990, ASX Operations Pty Ltd v Pont Data Australia Pty Ltd (No 1), http://www.australiancompetitionlaw.org/cases/asx.html (accessed 12 May 2016).
Australian Government 2010, How much Australia emits, http://www.aph.gov.au /About_Parliament/Parliamentary_Departments/Parliamentary_Library/Browse_by_Topic/ClimateChange/whyClimate/human/howMuch (accessed 13 December 2015).
—— 2016a, Digital Marketplace, http://www.innovation.gov.au/page/digital-marketplace (accessed 21 April 2016).
—— 2016b, Restoring the Focus on STEM in Schools initiative, Students First, https://www.studentsfirst.gov.au/restoring-focus-stem-schools-initiative (accessed 18 February 2016).
—— 2016c, Welcome to the Ideas Boom: Expanding Opportunities for Women in Science, Technology, Engineering and Mathematics, National Innovation and Science Agenda.
—— 2016d, Welcome to the Ideas Boom: Inspiring a Nation of Scientists, National Innovation and Science Agenda.
Australian Industry Group 2015, Digital Policy Priorities Statement, November.
Austroads 2016, National ITS Architecture, http://www.austroads.com.au/road-operations /network-operations/national-its-architecture (accessed 3 May 2016).
Autor, D. 2015, ‘Why are there still so many jobs? The history and future of workplace automation’, Journal of Economic Perspectives, vol. 29, no. 3, pp. 3–30.
—— and Acemoglu, D. 2012, ‘What does human capital do? A review of Goldin and Katz’s “the race between education and technology”’, Journal of Economic Literature, vol. 50, no. 2, pp. 426–463.
Baines, R. 2016, ‘Uber go-ahead in Tasmania a step closer after Lower House passes bill’, ABC News, 7 April, http://www.abc.net.au/news/2016-04-07/uber-go-ahead-passes-tasmanian-parliament/7308778 (accessed 6 May 2016).
Bakos, Y. 1998, ‘The emerging role of electronic marketplaces on the internet’, Communications of the ACM, vol. 41, no. 8.
Balinski, B. 2014, ‘Education remains important as additive manufacturing booms’, Manufacturers’ Monthly, 28 May, http://www.manmonthly.com.au/features/education-remains-important-as-additive-manufactur (accessed 13 January 2016).
Banks, G. 2012, Advancing the Reform Agenda: selected speeches, Productivity Commission, Canberra.
Barnes, P. and McClure, A. 2009, Investments in Intangible Assets and Australia’s Productivity Growth, Staff Working Paper, March, Productivity Commission, Canberra.
——, Soames, L., Li, C. and Munoz, M. 2013, Productivity in Manufacturing: Measurement and Interpretation, Productivity Commission, Canberra.

REFERENCES 221
Barr, P.N. 2014, ‘The digital divide is narrowing but more needs to be done’, The Conversation, 5 October, http://theconversation.com/the-digital-divide-is-narrowing-but-more-needs-to-be-done-25994 (accessed 10 May 2016).
Barry, J. and Caron, P. 2015, Tax regulation, transportation innovation and the sharing economy.
Barter, P. 2013, ‘Cars are parked 95% of the time’. Let’s check!, http://www.reinventingparking.org/2013/02/cars-are-parked-95-of-time-lets-check.html (accessed 19 May 2016).
Bates, J. and Leibling, D. 2012, Spaced Out: Perspectives on Parking Policy, RAC Foundation, http://www.racfoundation.org/research/mobility/spaced-out-perspectives-on-parking (accessed 3 May 2016).
Bean, C. 2016, Independent Review of UK Economic Statistics, March.
Bennett, J. and Lannig, S. 2007, The Netflix Prize, Proceedings of KDD Cup and Workshop.
Berry, D. 2016, ‘The sharing economy comes to scientific research’, The Conversation, 11 April, http://theconversation.com/the-sharing-economy-comes-to-scientific-research-55368 (accessed 13 April 2016).
BITRE (Bureau of Infrastructure, Transport and Regional Economics) 2014, Impact of road trauma and measures to improve outcomes, December, Report 140, Canberra.
—— 2015a, Traffic and congestion cost trends for Australian capital cities, Information Sheet 74, Canberra.
—— 2015b, Yearbook 2015: Australian Infrastructure Statistical Report, Canberra.
Blackhall, L. 2016, ‘Innovation nation? Why supporting science could help Australia to become something more than just a “lucky country”’, APPS Policy Forum, 17 May, http://www.policyforum.net/innovation-nation/ (accessed 20 May 2016).
Blanchard, O. 2015, Stop calling it the ‘Sharing Economy.’ That isn’t what it is., http://olivierblanchard.net/stop-calling-it-the-sharing-economy-that-isnt-what-it-is/ (accessed 6 May 2016).
Blinder, A.B. 2006, ‘Offshoring: The Next Industrial Revolution’, Foreign Affairs, vol. 85, no. 2, pp. 113–128.
Bostrom, N. 2014, Superintelligence: Paths, Dangers, Strategies, 1st edn, Oxford University Press.
Brachmann, S. 2015, ‘Smartphone innovation has soared because of patents’, IPWatchdog, 17 March, http://www.ipwatchdog.com/2015/03/17/smartphone-innovation-has-soared-because-of-patents/id=55667/ (accessed 14 April 2016).
Breckon, J. 2015, Better Public Services Through Experimental Government, March, Alliance for Useful Evidence.

222 DIGITAL DISRUPTION: WHAT DO GOVERNMENTS NEED TO DO?
Brehm, D. 2011, ‘Sensing skin’ could monitor the health of concrete infrastructure continually and inexpensively, https://cee.mit.edu/news/releases/2011/sensing-skin (accessed 2 May 2016).
Briggs, G. and Scheutz, M. 2015, ‘Sorry, I can’t do that’: developing mechanisms to appropriately reject directives in human-robot interactions, Human-Robot Interaction Laboratory, Tufts University, Massachusetts.
Brundage, M. 2013, ‘What Undercover Boss and the Jetsons Tell Us About the Future of Jobs’, Slate, http://www.slate.com/blogs/future_tense/2013/09/27/researchers_claim_ many_jobs_at_risk_for_automation_here_s_what_they_missed.html (accessed 23 February 2016).
Bryne, D., Oliner, S. and Sichel, D. 2013, Is the Information Technology Revolution Over?, Working Paper, Finance and Economics Discussion Series, Federal Reserve Board Divisions of Research & Statistics and Monetary Affairs.
Brynjolfsson, E. and McAfee, A. 2012, Race Against The Machine: How The Digital Revolution Is Accelerating Innovation, Driving Productivity, and Irreversibly Transforming Employment and the Economy, Research Brief, The MIT Center for Digital Business.
—— and —— 2014, The Second Machine Age: Work, Progress, and Prosperity in a Time of Brilliant Technologies, W. W. Norton & Company, London.
——, —— and Spence, M. 2014, ‘New World Order: Labor, Capital, and Ideas in the Power Law Economy’, Foreign Affairs.
—— and Oh, J.H. 2012, The Attention Economy: Measuring the Value of Free Digital Services on the Internet, Thirty Third International Conference on Information Systems, Orlando.
Buchanan, B. 2015, ‘Of cats and cliffs: the ethical dilemmas of the driverless car’, The Conversation, 28 October.
Bulygo, Z. 2013, ‘How Netflix Uses Analytics To Select Movies, Create Content, and Make Multimillion Dollar Decisions’, Kissmetrics Blog, https://blog.kissmetrics. com/how-netflix-uses-analytics/ (accessed 11 January 2016).
Burke, G. 2016, ‘Taxi drivers vs Uber: Ridesharing drivers face heftier penalties under new Queensland laws’, ABC News, 21 April, http://www.abc.net.au/news/2016-04-21/taxi-drivers-vs-uber-ride-sharing-drivers-face-heftier-penalties/7344300 (accessed 6 May 2016).
Burton, J. 2012, Integrated service delivery for Aboriginal and Torres Strait Islander children and families, March, Secretariat of National Aboriginal and Islander Child Care Inc. (SNAICC).
Butlin, M.W. 1977, A preliminary annual database 1900/01 to 1973/74, Research Discussion Paper, 7701, Reserve Bank of Australia.

REFERENCES 223
Byrne, D.M., Fernald, J. and Reinsdorf, M. 2016, Does the United States have a Productivity Slowdown or a Measurement Problem.
California Department of Motor Vehicles 2016, Autonomous Vehicles in California, https://www.dmv.ca.gov/portal/dmv/detail/vr/autonomous/auto (accessed 10 May 2016).
Cannon, S. and Summers, L.H. 2014, ‘How Uber and the Sharing Economy Can Win Over Regulators’, Harvard Business Review, https://hbr.org/2014/10/how-uber-and-the-sharing-economy-can-win-over-regulators/ (accessed 24 February 2016).
Cantwell, E. and McDermott, K. 2016, Making technology talk how interoperability can improve care, drive efficiency, and reduce waste, Healthcare financial management association.
Carnegie, M. 2016, ‘Let’s trial an Australian basic income for all’, The Australian, 10 February, http://www.theaustralian.com.au/opinion/lets-trial-an-australian-basic-income-for-all/news-story/68afe8006212521925f80dbe67822631 (accessed 27 April 2016).
Carr, D. 2013, ‘Giving Viewers What They Want’, The New York Times, 24 February, http://www.nytimes.com/2013/02/25/business/media/for-house-of-cards-using-big-data-to-guarantee-its-popularity.html?_r=1 (accessed 8 January 2016).
CASA (Civil Aviation Safety Authority) 2016a, Big fines for flying drones near bushfires, https://www.casa.gov.au/standard-page/big-fines-flying-drones-near-bushfires (accessed 19 May 2016).
—— 2016b, Part 101 Amendments - Cutting red tape for remotely piloted aircraft, https://www.casa.gov.au/aircraft/standard-page/part-101-amendments-cutting-red-tape-remotely-piloted-aircraft (accessed 19 April 2016).
Catapult Transport Systems 2015, The Transport Data Revolution: Investigation into the Data Required to Support and Drive Intelligent Mobility, March.
CB Insights 2016, 30 Corporations Working on Autonomous Vehicles, https://www.cbinsights.com/blog/autonomous-driverless-vehicles-corporations-list/ (accessed 6 June 2016).
CEC (Clean Energy Council) 2014a, Clean Energy Australia Report 2014.
—— 2014b, Concentrated Solar Thermal, https://www.cleanenergycouncil.org.au/ technologies/concentrated-solar-thermal.html (accessed 25 November 2015).
—— 2016, Accelerating the Uptake of Battery Storage, March.
CEDA (Committee for Economic Development of Australia) 2014, Advanced Manufacturing: Beyond the production line, April.
—— 2015, Australia’s Future Workforce?
Checchi, D. and García-Peñalosa, C. 2008, Labour Market Institutions and Income Inequality, Working Paper Series, Luxembourg Income Study.

224 DIGITAL DISRUPTION: WHAT DO GOVERNMENTS NEED TO DO?
Christensen, C.M. 1997, The Innovator’s Dilemma, Harvard Business School Press, Cambridge, MA.
—— and Raynor, M.E. 2003, The Innovator’s Solution: Creating and Sustaining Successful Growth, Harvard Business School Publishing Corporation, Boston, MA.
——, —— and McDonald, R. 2015, ‘What Is Disruptive Innovation?’, Harvard Business Review, https://hbr.org/2015/12/what-is-disruptive-innovation (accessed 11 April 2016).
Choice 2015, IVF clinics and success rates, https://www.choice.com.au/health-and-body/reproductive-health/conception/articles/ivf-clinics-and-success-rates (accessed 9 June 2016).
Cisco 2015, Fixed and Mobile IP Network Traffic Forecast - VNI, http://www. cisco.com/c/en/us/solutions/service-provider/visual-networking-index-vni/index.html (accessed 5 April 2016).
—— 2016, Internet of Everything FAQ, http://ioeassessment.cisco.com/learn/ioe-faq (accessed 11 April 2016).
City of Perth 2016, Bay Availability, City of Perth Parking, http://www. cityofperthparking.com.au/bayavailability (accessed 27 May 2016).
Clemons, E. 2009, ‘Business Models for Monetizing the Internet: Surely There Must be Something other than Advertising’, Journal of Management Information Systems, vol. 26, no. 2, pp. 15–41.
Coelli, M. and Borland, J. 2015, Job Polarisation and Earnings Inequality in Australia, 24 February, University of Melbourne.
Commonwealth of Australia 2004, Trends in the unemployment rate over recent decades, Budget paper no. 1, Budget 2004-05.
—— 2008, Architecture of Australia’s Tax and Transfer System.
—— 2015, 2015 Intergenerational Report Australia in 2055.
—— 2016, Australia’s Cyber Security Strategy, Department of the Prime Minister and Cabinet.
Confais, E., Fages, E. and Van Den Berg, W. 2015, Think Act - Solar PV Will Change the Utility Landscape, Roland Berger Strategy Consultants.
Connolly, B. 2016, Government’s fintech data access plan doesn’t go far enough: InvestmentLink CTO, CIO, http://www.cio.com.au/article/597216/government-fintech-data-access-plan-doesn-t-go-far-enough-investmentlink-cto/ (accessed 3 June 2016).
Connolly, E., Davis, K. and Spence, G. 2011, Trends in Labour Supply, June, Reserve Bank of Australia.
Consumer Affairs Victoria 2015, Buying from a private seller online, https://www.consumer.vic.gov.au/shopping/online-shopping/buying-from-a-private-seller-online (accessed 8 January 2016).

REFERENCES 225
Cook, J. 2015, Uber’s internal charts show how its driver-rating system actually works, Business Insider Australia, http://www.businessinsider.com.au/leaked-charts-show-how-ubers-driver-rating-system-works-2015-2?r=UK&IR=T (accessed 20 April 2016).
Cookson, C. 2016, ‘Intelligent machines threaten mass job losses, experts warn’, Australian Financial Review, 15 February, http://www.afr.com/technology/intelligent-machines-threaten-mass-job-losses-experts-warn-20160214-gmu2ww (accessed 18 April 2016).
Cornell University, INSEAD and WIPO 2015, The Global Innovation Index 2015: Effective Innovation Policies for Development, World Intellectual Property Organisation, Geneva.
Cory, N. and Ezell, S. 2016, Crafting an Innovation-Enabling Trade in Services Agreement, June, Information Technology & Innovation Foundation.
Cowan, P. 2016, South Australia becomes first state to allow driverless cars, 31 March, http://www.itnews.com.au/news/south-australia-becomes-first-state-to-allow-driverless-cars-417606 (accessed 24 May 2016).
Craigslist 2016, About, http://www.craigslist.com.au/about/ (accessed 2 May 2016).
Cramer, J. and Krueger, A.B. 2016, ‘Disruptive Change in the Taxi Business: The Case of Uber’, American Economic Review: Papers and Proceedings, vol. 106, no. 5, pp. 177–182.
Crawford, R., Jaiprakash, A. and Roberts, J. 2016, ‘Digital diagnosis: intelligent machines do a better job than humans’, The Conversation, 18 January, theconversation.com/digital-diagnosis-intelligent-machines-do-a-better-job-than-humans-53116 (accessed 18 April 2016).
Criscuolo, C., Gal, P.N. and Menon, C. 2015, The Dynamics of Employment Growth: New Evidence from 18 Countries, 14, OECD Science, Technology and Industry Policy Papers, OECD, Paris.
Crowdflower 2015, Our company, http://www.crowdflower.com/company (accessed 24 February 2016).
CrowdFlower 2015, Guide to: Test Question Data, CrowdFlower Success Center, https://success.crowdflower.com/hc/en-us/articles/201855809-Guide-to-Test-Question-Data (accessed 20 April 2016).
CSIRO (Commonwealth Scientific and Industrial Research Organisation) 2013, Change and Choice - The Future Grid Forum’s Analysis of Australia’s Potential Electricity Pathways to 2050.
—— 2015a, Electrical Energy Storage: Technology Overview and Applications, 8 July.
—— 2015b, UltraBattery, http://www.csiro.au/en/Research/EF/Areas/Energy-storage/UltraBattery (accessed 7 April 2016).
—— 2016a, Lab 22 offers 3D printing, http://www.csiro.au/en/Research /MF/Areas/Metals/Lab22 (accessed 30 March 2016).
226 DIGITAL DISRUPTION: WHAT DO GOVERNMENTS NEED TO DO?
—— 2016b, Putting sleep apnoea to bed with 3D mouthguard, http://www.csiro.au/en/Research/MF/Areas/Metals/Lab22/Mouthguard (accessed 7 January 2016).
—— 2016c, Virtual Power Station, http://www.csiro.au/en/Research/EF/Areas/Electricity-grids-and-systems/Intelligent-systems/Virtual-power-station (accessed 13 April 2016).
—— and Energy Networks Association 2015, Electricity Network Transformation Roadmap: Interim Program Report.
Cunningham, M. and Davis, K. 2011, Labour Market Outcomes in Regional Australia, Bulletin – September Quarter 2011, Reserve Bank of Australia.
Daly, N. 2016, ‘Ride-sharing company Uber banned by Northern Territory Government’, ABC News, 23 February, http://www.abc.net.au/news/2016-02-22/nt-govt-bans-ride-sharing-company-uber/7190848 (accessed 6 May 2016).
David, P.A. 1990, ‘The dynamo and the computer: an historical perspective on the modern productivity paradox’, The American Economic Review, vol. 80, no. 2, pp. 355–361.
Davis, J. 2015, Capital markets and job creation in the 21st Century, December, Centre for Effective Public Management at Brookings.
Deloitte 2012, Digital disruption: Short fuse, big bang?, http://www2.deloitte.com/au/en/pages/building-lucky-country/articles/digital-disruption-harnessing-the-bang.html (accessed 23 February 2016).
—— 2013, Disruptive manufacturing: The effects of 3D printing, Canada.
Deloitte Access Economics 2015a, Digital Government Transformation.
—— 2015b, The Connected Continent II: How Digital Technology Is Transforming The Australian Economy.
—— 2015c, The sharing economy and the Competition and Consumer Act,.
—— 2016, Economic Effects of Ridesharing in Australia, Deloitte Access Economics.
Deng, B. 2015, ‘Machine ethics: The robot’s dilemma’, Nature, vol. Vol. 523, No. 7558.
Department of Employment 2016, Employment projections for the five years to November 2020, Department of Employment.
Department of Health and Ageing 2011, The eHealth readiness of Australia’s medical specialists, 30 May.
Department of Industry, Innovation and Science 2015, Australian Government Regulation Changes Impacting Growth Sectors, August.
Department of Infrastructure and Regional Development 2015, Submission to the House of Representatives Standing Committee on Infrastructure and Communication Inquiry into the role of Smart Information and Communication Technology in the design and planning of infrastructure, July.

REFERENCES 227
Diss, K. 2015, ‘Driverless trucks move iron ore at automated Rio Tinto mines’, ABC News, 18 October, http://www.abc.net.au/news/2015-10-18/rio-tinto-opens-worlds-first-automated-mine/6863814 (accessed 2 May 2016).
Dodds, S. 2015, ‘3D printing raises ethical issues in medicine’, ABC News, 11 February, http://www.abc.net.au/science/articles/2015/02/11/4161675.htm (accessed 8 June 2016).
Draca, M., Sadun, R. and van Reenen, J. 2007, ‘Productivity and ICTs: a review of the evidence’, The Oxford Handbook of Information and Communications Technologies, Oxford University Press, Oxford, pp. 100–147.
Duckett, S. and Breadon, P. 2015, Questionable Care: Avoiding Ineffective Treatment, August, Grattan Institute.
Durrant-Whyte, H. 2016, ‘Rise of the machine’, Australian Academy of Science, ANU, https://www.science.org.au/news-and-events/events/public-speaker-series/bots-bacteria -booze-science-everyday/rise-machines (accessed 9 February 2016).
——, McCalman, L., O’Callaghan, S., Reid, A. and Steinberg, D. 2015, The Impact of Computerisation and Automation on Future Employment, 16 June, Australia’s future workforce?, CEDA.
Education Council 2015, ‘Communiqué’, presented at Fifth Education Council Meeting, Brisbane, 29 May.
Encyclopaedia Britannica Online 2015, Photovoltaic Effect, Encyclopedia Britannica Inc., http://www.britannica.com/science/photovoltaic-effect (accessed 24 November 2015).
Entura 2014, Analysis of Demand-Side Management Opportunities FPDI TA-1C, 25 November, Clean Energy Council.
Epstein, R. and Robertson, R.E. 2015, ‘The search engine manipulation effect (SEME) and its possible impact on the outcomes of elections’, Proceedings of the National Academy of Sciences of the United States of America, vol. 112, no. 33.
Ericsson 2015, Ericsson Mobility Report: On the Pulse of the Networked Society, Ericsson.
ESAA (Energy Supply Association of Australia) 2015, Heatwaves and Electricity Supply, Fact Sheet, January.
European Commission 2015, eCall in all new cars from April 2018, https://ec.europa.eu/digital-agenda/en/news/ecall-all-new-cars-april-2018 (accessed 21 December 2015).
Evangelista, R. and Guerrieri, P. 2014, The economic impact of digital technologies in Europe, paper prepared for the SIE meeting October 2014, Trento.
Evans, P. and Forth, P. 2015, Borges’ Map Navigating a World of Digital Disruption, bcg.perspectives, Boston Consulting Group.
Fishenden, J. and Johnson, M. 2014, A Tale of Two Countries: the Digital Disruption of Government, October.

228 DIGITAL DISRUPTION: WHAT DO GOVERNMENTS NEED TO DO?
Fiske, S.T. and Neuberg, S.L. 1990, ‘Advances in Social Psychology’, Advances in experimental Social Psychology, vol. 23.
Fitzgerald, B. 2015, ‘Northparkes driverless trucks head deep underground’, The Australian, 3 December.
Fitzgerald, M. 2013, An Internet for Manufacturing, MIT Technology Review, http://www.technologyreview.com/news/509331/an-internet-for-manufacturing/ (accessed 11 January 2016).
Folbre, N. 2013, The Unregulated Work of Mechanical Turk, The New York Times: Economix, 18 March, http://economix.blogs.nytimes.com/2013/03/18/the-unregulated-work-of-mechanical-turk/?_r=0 (accessed 24 February 2016).
Foster, R. 2012, Creative Destruction Whips through Corporate America, Innosight Executive Briefing.
Fraiberger, S. and Sundararajan, A. 2016, Peer-to-Peer Rental Markets in the Sharing Economy, Working paper, NET Institute.
Franky, B. 2010, Facebook Statistics: The Numbers Game Continues, The blog Herald, http://www.blogherald.com/2010/08/11/facebook-statistics-the-numbers-game-continues/ (accessed 22 December 2015).
Frey, C. and Osborne, M. 2013, The Future of Employment: How Susceptible Are Jobs to Computerisation?, 17 September, Oxford Martin School, University of Oxford.
Gahan, P. 2016, Will a robot take your job?, https://pursuit.unimelb.edu.au/articles/will-a-robot-take-your-job (accessed 21 April 2016).
GAO (United States Government Accountability Office) 2012, Software Development: Effective Practices and Federal Challenges in Applying Agile Methods, July.
Gartner 2015, ‘Gartner Says 6.4 Billion Connected “Things” Will Be in Use in 2016, Up 30 Percent From 2015’, Gartner, 10 November, http://www.gartner.com /newsroom/id/3165317 (accessed 5 April 2016).
Gaudin, S. 2007, ‘The transistor: The most important invention of the 20th century?’, Computer World, 12 December, http://www.computerworld.com/article/ 2538123/computer-processors/the-transistor--the-most-important-invention-of-the-20th-century-.html (accessed 15 April 2016).
Geoscience Australia 2015, Next Generation Architectures to Unlock Satellite Data.
Gill, S., Dutta-Gupta, I. and Roach, B. 2014, The Technology Opportunity for Human Services, http://datasmart.ash.harvard.edu/news/article/the-technology-opportunity-for-human-services-470 (accessed 29 April 2016).
Goldin, C. and Katz, L. 2010, The Race Between Education and Technology, Belknap Press.
Google 2016, Google Self-Driving Car Project, https://www.google.com/selfdrivingcar/ (accessed 10 May 2016).

REFERENCES 229
Gordon, R. 2012, ‘Is US economic growth over? Faltering innovation confronts the six headwinds’, Centre for Economic Policy Research Policy Insight, vol. 63.
—— 2015, ‘Secular stagnation on the supply side: US productivity growth in the long run’, Digiworld Economic Journal, vol. 100, no. 4, pp. 19–45.
Graduate Careers Australia 2014, GradStats: Employment and Salary Outcomes of Recent Higher Education Graduates, December.
—— 2015a, Beyond Graduation 2014: A report of graduates’ work and study outcomes thre years after course completion.
—— 2015b, Graduate Destinations 2014.
Grattan Institute 2015, Regulating the peer-to-peer economy, http://grattan.edu.au/grattan-tv/regulating-the-peer-to-peer-economy/ (accessed 3 May 2016).
Gratton, L. 2015, Reshaping Work for the Future, June, Australia’s future workforce?, CEDA.
Greenstein, S. and Prince, J. 2007, ‘Internet diffusion and the geography of the digital divide in the United States’, The Oxford Handbook of Information and Communications Technologies, Oxford University Press, Oxford, pp. 168–195.
Greenville, J., Pobke, C. and Rogers, N. 2013, Trends in the Distribution of Income in Australia, Staff Working Paper, Productivity Commission, Canberra.
Griffith, C. 2015, ‘Tesla flicks the switch on Powerwall sales’, The Australian, 10 December, http://www.theaustralian.com.au/business/technology/tesla-flicks-the-switch-on-powerwall-sales/news-story/ce87cb33129937c7eab808f3a8fe4215 (accessed 13 December 2015).
Gross, G. 2015, ‘Privacy group complains about Uber data collection’, PC World, 22 June, http://www.pcworld.com/article/2939092/privacy-group-complains-about-uber-data-collection.html (accessed 23 December 2015).
Guerrieri, P. and Bentivegna, S. 2011, The Economic Impact of Digital Technologies: Measuring Inclusion and Diffusion in Europe, Edward Elgar Publishing, Cheltenham.
Hajkowicz, S., Reeson, A., Rudd, L., Bratanova, A., Hodgers, L., Mason, C. and Boughen, N. 2016, Tomorrow’s digitally enabled workforce: Megatrends and scenarios for jobs and employment in Australia over the coming twenty years, January, CSIRO.
Haldane, A. 2015, ‘Labour’s share’, presentation to the Trade Union Congress, 12 November.
Hall, K. 2013, ‘How 3D printing impacts manufacturing’, Computer Weekly, February, http://www.computerweekly.com/feature/How-3D-printing-impacts-manufacturing (accessed 8 June 2016).
Hamilton, J., Harris, E., Hatzius, J. and West, K. 2016, The Equilibrium Real Funds Rate: Past, Present and Future, 11 May.

230 DIGITAL DISRUPTION: WHAT DO GOVERNMENTS NEED TO DO?
Hanauer, N. and Rolf, D. 2015, ‘Shared Security, Shared Growth’, Democracy Journal, http://www.democracyjournal.org/37/shared-security-shared-growth.php (accessed 16 November 2015).
Harford, T. 2013, A Universal Income Is Not Such A Silly Idea, http://timharford.com/ 2013/11/a-universal-income-is-not-such-a-silly-idea/ (accessed 3 May 2016).
Harper, I., Anderson, P., McCluskey, S. and O’Bryan, M. 2015, Competition Policy Review, Final Report, March.
Harris, S.D. and Krueger, A.B. 2015, A Proposal for Modernizing Labor Laws for Twenty-First-Century Work: the ‘Independent Worker’, December, The Hamilton Project, Brookings Institute.
Hashem, I.A.T., Yaqoob, I., Anuar, N.B., Mokhtar, S., Gani, A. and Ullah Khan, S. 2015, ‘The rise of “big data” on cloud computing: review and open research issues’, Information Systems, vol. 47, pp. 98–115.
Hasse, J. 2016, ‘Living the Future: New Developments in Assistive Technology’, Getting Hired, 18 April, http://blog.gettinghired.com/Home/tabid/159/entryid/168/living-the-future-new-developments-in-assistive-technology.aspx (accessed 24 May 2016).
Hathway, I. and Litan, R. 2014, The other aging of America: the increasing dominance of older firms, July, Economic Studies at Brookings.
Head, B. 2016, Trade in services deal still distant, InnovationsAus.com, http://www.innovationaus.com/2016/05/Trade-in-services-deal-still-distant (accessed 18 May 2016).
Healy, J. 2015, ‘Graduating into a weak job market: why so many grads can’t find work’, The Conversation, 29 July, http://theconversation.com/graduating-into-a-weak-job-market-why-so-many-grads-cant-find-work-45222 (accessed 26 May 2016).
Heber, A. 2015, ‘How Airbnb is pushing to change the law for Australia’s sharing economy’, Business Insider Australia, 28 July, http://www.businessinsider. com.au/airbnb-is-pushing-for-national-rules-on-holiday-rentals-2015-7 (accessed 5 May 2016).
Hendrickson, L., Bucifal, S., Balaguer, A. and Hansell, D. 2015, The employment dynamics of Australian entrepreneurship, Department of Industry and Science Economics Research Paper 4/2015, 4, Canberra.
Hershan, D. 2015, The great business model disruption, Right Lane, http://www.rightlane.com.au/the-great-business-model-disruption/ (accessed 20 April 2016).
Hewett, J. 2016, ‘Sharing your economy with Airtasker’, 20 April, http://www.afr.com/opinion/columnists/sharing-your-economy-with-airtasker-20150420-1mp2c3 (accessed 20 April 2016).
Hillier, P., Wright, B. and Damen, P. 2015, Readiness for Self-driving Vehicles in Australia, Workshop Report, February, ARRB Group Ltd.

REFERENCES 231
House of Representatives Standing Committee on Infrastructure, Transport and Cities 2016, Smart ICT: Report on the inquiry into the role of smart ICT in the design and planning of infrastructure, Final Report, March, Canberra.
House of Representatives Standing Committee on Social Policy and Legal Affairs 2014, Eyes in the sky: Inquiry into drones and the regulation of air safety and privacy, July, Canberra.
Hu, J., Hua-Jun, Z., Hua, L., Cheng, N. and Zheng, C. 2007, ‘Demographic Prediction Based on User’s Browsing Behavior’, Presented at International World Wide Web Conference Committee, Banff, Alberta, Canada, 5 August.
IEA (International Energy Agency) 2015, World Energy Outlook 2015 Executive Summary, Paris.
Infrastructure Australia 2016, Australian Infrastructure Plan, February.
Internet Society 2015, The Internet of Things: An Overview - understanding the issues and challenges of a more connected world, October.
IRENA (International Renewable Energy Agency) 2015, Battery Storage for Renewables: Market Status and Technology Outlook, January.
ITF (International Transport Forum) 2015, Automated and Autonomous Driving: Regulation under uncertainty, May, Paris.
Johnson, M. 2014, The Digital Disruption of Government, 6 April, Centre for Digital Business, http://www.centre-for-digital-business.com/2014/04/the-digital-disruption-of-government/ (accessed 11 March 2016).
Jones, K. (Queensland Minister for Education and Minister for Tourism, Major Events, Small Business and the Commonwealth Games) 2015, Grants recognise STEM in action at Queensland schools, 8 July, Media Statement, http://statements. qld.gov.au/Statement/2015/7/8/grants-recognise-stem-in-action-at-queensland-schools (accessed 18 February 2016).
De Jong, M. and van Dijk, M. 2015, Disrupting beliefs: A new approach to business-model innovation, McKinsey & Company, http://www.mckinsey.com/business-functions/strategy-and-corporate-finance/our-insights/disrupting-beliefs-a-new-approach-to-business-model-innovation (accessed 20 April 2016).
JPMorgan 2016, Paychecks, Paydays, and the Online Platform Economy: Big Data on Income Volatility, February, JPMorgan Chase Institute.
Juniper Reseach 2015, ‘Internet of things’ connected devices to almost triple to over 38 billion units by 2020, http://www.juniperresearch.com/press/press-releases/iot-connected-devices-to-triple-to-38-bn-by-2020 (accessed 5 April 2016).
Katz, R. 2014, Economic and Social Impact of Broadband and Development of Digital Agendas, 11 March, ITU/BDT Regional Economic and Financial Forum of Telecommunications/ICTs for Latin America and the Caribbean, Columbia Business School, San Jose, Costa Rica.

232 DIGITAL DISRUPTION: WHAT DO GOVERNMENTS NEED TO DO?
Katz, R., Koutroumpis, P. and Callorda, F. 2014, ‘Using a Digitization Index to Measure the Economic and Social Impact of Digital Agendas’, Info, vol. 16, no. 1, pp. 32–44.
Kelly, J. and Donegan, P. 2015, City Limits: Why Australia’s cities are broken and how we can fix them, Melbourne University Publishing.
Kent, C. 2015, ‘Australian Economic Growth – The How, What and Where’, Address to the National RSL Clubs Conference, Reserve Bank of Australia, Hobart 11 March.
Kiesling, L. 2009, A Smart Grid is a Transactive Grid, April, Kellogg School of Management, Northwestern University.
King, A.A. and Baatartogtokh, B. 2015, ‘How useful is the theory of disruptive innovation?’, MIT Sloan Management Review, vol. 57, no. 1, p. 77.
King, C. 2011a, How Renewable Energy is a Disruptive Technology, https://gigaom.com/2011/12/30/how-renewable-energy-is-a-disruptive-technology/ (accessed 11 December 2015).
King, R. 2011b, ‘Getting people with disabilities back to work’, Bloomberg, 6 July, http://www.bloomberg.com/news/articles/2011-07-06/getting-people-with-disabilities-back-to-work (accessed 21 April 2016).
King, S., Hine, D., Brea, E. and Cook, H. 2014, Make for Asia - The emerging Asian middle class and opportunities for Asian manufacturing, CSIRO.
King, S., P. 2013, ‘Two-sided markets’, Australian Economic Review, vol. 46, no. 2, pp. 247–258.
—— 2015, ‘A caring, sharing economy?’, 26 March, https://theconversation.com/a-caring-sharing-economy-39393 (accessed 15 December 2015).
Koopman, C., Mitchell, M. and Thierer, A. 2014, The Sharing Economy and Consumer Protection Regulation: The Case for Policy Change, Working Paper, Mercatus Center George Mason University, Virginia.
Kosinski, M., Stillwell, D. and Graepel, T. 2013, ‘Private traits and attributes are predictable from digital records of human behavior’, Proceedings of the National Academy of Sciences of the United States of America, vol. 110, no. 15, pp. 5802 – 5805.
Kuhn, P. 2014, The Internet as a Labor Market Matchmaker, World of Labour, Institute for the Study of Labor, http://wol.iza.org/articles/internet-as-a-labor-market-matchmaker/long (accessed 29 April 2016).
—— and Hani, M. 2011, Is Internet Job Search Still Ineffective?, September, Discussion Paper Series, Institute for the Study of Labor.
Lacy, S. 2012, ‘Get over it, haters: 99designs has tipped’, Pando Daily, 24 January, http://pando.com/2012/01/24/get-over-it-haters-99designs-has-tipped/ (accessed 27 April 2016).
LaFrance, A. and Eveleth, R. 2015, ‘Are Taxis Safer Than Uber?’, The Atlantic, 3 March, http://www.theatlantic.com/technology/archive/2015/03/are-taxis-safer-than-uber/ 386207/ (accessed 27 May 2016).

REFERENCES 233
Lakbala, P. and Dindarloo, K. 2014, ‘Physicians’ perception and attitude toward electronic medical record’, SpringerPlus, vol. 3, no. 63.
Lattimore, R. 2007, Men Not at Work: An Analysis of Men Outside the Labour Force, Productivity Commission Staff Working Paper, Canberra.
Lepore, J. 2014, ‘The disruption machine’, The New Yorker, 23 June, http://www.newyorker.com/magazine/2014/06/23/the-disruption-machine (accessed 28 April 2016).
Lewis, D. 2015, ‘Technology killed the video store’, Sydney Morning Herald, 10 May.
Linden, G., Smith, B. and York, J. 2003, Amazon.com Recommendations - Item-to-Item Collaborative Filtering, Industry Report, http://www.cs.umd.edu/mwg-internal/de5fs23hu73ds/progress?id=qMEqqmNR3c (accessed 11 January 2016).
Luca, M. 2011, Reviews, Reputation, and Revenue: The Case of Yelp.com, Harvard Business School, http://hbswk.hbs.edu/item/reviews-reputation-and-revenue-the-case-of-yelp-com (accessed 8 January 2016).
—— and Zervas, G. 2015, Fake It Till You Make It: Reputation, Competition, and Yelp Review Fraud, 20 July.
Lunden, I. 2012, Kantar Worldpanel: Android Dominates Smartphone Sales Overall; In U.S. iOS Closing In, TechCrunch, May, http://social.techcrunch.com/2012 /05/15/kaiser-worldpanel-android-dominates-smartphone-sales-overall-in-u-s-ios-closing-in/ (accessed 18 May 2016).
Lutsey, N. 2012, ‘New Automobile Regulations: Double the Fuel Economy, Half the CO2 Emissions, and Even Automakers Like It’, ACCESS Magazine, vol. 41, http://www.accessmagazine.org/articles/fall-2012/new-automobile-regulations/ (accessed 5 May 2016).
Macdonald-Smith, A. 2015, ‘How battery-powered homes are unplugging Australia’, The Sydney Morning Herald, 1 August, http://www.smh.com.au/business/energy/how-batterypowered-homes-are-unplugging-australia-20150731-giogk2.html (accessed 11 December 2015).
MacGill, I. 2015, ‘With big solar Australia could be backing a winner, but it still needs leadership’, The Conversation, 11 September.
Macmillan, D. 2014, ‘Atlassian, the $3.5bn company with no salespeople’, 9 April, http://www.theaustralian.com.au/business/wall-street-journal/atlassian-the-35bn-company-with-no-salespeople/story-fnay3ubk-1226878795477?login=1 (accessed 4 April 2016).
Mang, C. 2012, Online Job Search and Matching Quality, May, Discussion Paper Series, Institute for the Study of Labor.
Mangalindan, J. 2012, Amazon’s recommendation secret, Fortune, http://fortune.com/ 2012/07/30/amazons-recommendation-secret/ (accessed 5 May 2016).

234 DIGITAL DISRUPTION: WHAT DO GOVERNMENTS NEED TO DO?
Marchment Hill Consulting 2015, Clean Energy Council Future-Proofing in Australia’s Electricity Distribution Industry Project - Review of Policies and Incentives, July.
Markides, C. 2006, ‘Disruptive innovation: in need of better theory’, Journal of Product Innovation Management, vol. 23, no. 1, pp. 19–25.
Markoff, J. 2011, ‘Armies of expensive lawyers, replaced by cheaper software’, New York Times, 4 March, http://www.nytimes.com/2011/03/05/science/05legal.html?_r=0 (accessed 18 April 2016).
Marr, B. 2016, Big Data: 20 Mind-Boggling Facts Everyone Must Read, Forbes, http://www.forbes.com/sites/bernardmarr/2015/09/30/big-data-20-mind-boggling-facts-everyone-must-read/ (accessed 18 April 2016).
Mazzucato, M. 2014, The Entrepreneurial State, Anthem Press, London.
McColl, J.C. and Young, M.D. 2005, Managing Change: Australian structural adjustment lessons for water, 16/05, CSIRO.
McKinsey Global Institute 2013, Disruptive Technologies: Advances that will transform Life, Business, and the Global Economy, May, McKinsey & Company.
—— 2015, The Internet of Things: Mapping the Value Beyond the Hype, 6 January, McKinsey Global Institute.
MDPT (MDPT Working Group) 2015, Report of the Market Design and Platform Technology Working Group, 17 August.
Mechanical Turk 2016, Worker website FAQ, Amazon mechanical turk, https://www.mturk.com/mturk/help?helpPage=worker (accessed 24 February 2016).
Melody, W. 2007, ‘Markets and Policies in New Knowledge Economies’, The Oxford Handbook of Information and Communications Technologies, Oxford University Press, pp. 55–74.
MHFI (McGraw Hill Financial) 2014, Hype vs. Reality: A Roundtable Discussion on the Impact of Technology and Artificial Intelligence on Employment, 21 September, MHFI Global Institute.
Millar, J. 2014, ‘Should your robot driver kill you to save a child’s life?’, The Conversation, 1 August.
Miller, B. and Atkinson, R. 2013, Are Robots Taking Our Jobs, or Making Them?, The Information Technology and Innovation Foundation.
Minifie, J. 2016, Peer-to-Peer Pressure - Policy for the Sharing Economy, April, Grattan Institute.
MIT Technology Review Custom and Oracle 2016, The Rise of Data Capital, MIT Technology Review.
Mitchell, A., Gottfried, J. and Matsa, K. 2015, Facebook Top Source for Political News Among Millennials, Pew Research Center, http://www.journalism.org/2015

REFERENCES 235
/06/01/facebook-top-source-for-political-news-among-millennials/ (accessed 31 May 2016).
De Montjoye, Y.-A., Radaelli, L. and Kumar Singh, V. 2015, ‘Unique in the shopping mall: On the reidentifiability of credit card metadata’, Science, vol. 347, pp. 536 – 539.
Montreal Process Implementation Group for Australia and National Forest Inventory Steering Committee 2013, Australia’s State of the Forests Report 2013, December, ABARES, Canberra.
Musil, S. 2015, ‘Apple, Google offer $415 million to settle antipoaching suit’, CNET, 15 January, http://www.cnet.com/news/apple-google-offer-415-million-to-settle-poaching-lawsuit/ (accessed 23 May 2016).
NAO (United Kingdom National Audit Office) 2012, A snapshot of the use of Agile delivery in central government.
NASDAQ 2016, Facebook, Inc, (FB), Alphabet inc (GOOG), http://www.nasdaq. com/symbol/fb/pe-ratio (accessed 23 May 2016).
Naughton, K. 2015, ‘Humans are slamming into driverless cars’, Australian Financial Review, 22 December.
NCOA (National Commission of Audit) 2014, Towards Responsible Government: The Report of the National Commission of Audit.
NDIA (National Disability Insurance Agency) 2015, Assistive Technology Strategy, October.
Nelson, F. 2015, ‘Law graduate unemployment hits record high’, Lawyers Weekly, 9 January, http://www.lawyersweekly.com.au/news/16023-law-graduate-unemployment-hits-record-high (accessed 26 May 2016).
Netflix 2015, Netflix letter to shareholders, http://files.shareholder.com/mwg-internal/de5fs23hu73ds/progress?id=KGQb/7jUHB (accessed 11 January 2016).
—— 2016, Investor Relations, Netflix, http://ir.netflix.com/ (accessed 2 May 2016).
Newman, N., Levy, D. and Nielsen, R.K. 2015, Digital News Report 2015: Tracking the Future of News, Reuters Institute.
Nicholls, R. 2015, ‘Who bears the cost when your Uber or Airbnb turns bad?’, The Conversation, 27 April, https://theconversation.com/who-bears-the-cost-when-your-uber-or-airbnb-turns-bad-39699 (accessed 5 January 2016).
Nicholls, S. and Orsmond, D. 2015, The Economic Trends, Challenges and Behaviour of Small Businesses in Australia, Conference 2015, Reserve Bank of Australia, http://www.rba.gov.au/publications/confs/2015/nicholls-orsmond.html (accessed 23 May 2016).
NICTA (National ICT Australia) 2015, Submission to the House of Representatives Standing Committee on Infrastructure and Communications Inquiry into the Role of Smart ICT in the Design and Planning of Infrastructure, July.
236 DIGITAL DISRUPTION: WHAT DO GOVERNMENTS NEED TO DO?
Nielsen 2009, Global advertising consumers trust real friends and virtual strangers the most, http://www.nielsen.com/us/en/insights/news/2009/global-advertising-consumers-trust-real-friends-and-virtual-strangers-the-most.html (accessed 11 January 2016).
Norris, P. 2001, Digital Divide: Civic Engagement, Information Poverty, and the Internet Worldwide, Cambridge University Press.
North, D. 1991, ‘Institutions’, Journal of Economic Perspectives, vol. 5, no. 1, pp. 97–112.
NREL (National Renewable Energy Laboratory) 2014, Solar Photovoltaic Technology Basics.
NSW Government Roads and Maritime Services 2015, SCATS, http://www.scats.com.au/ (accessed 8 December 2015).
NSW Minister for Transport (Berejiklian, G.) 2013, North West Rail Link to be state of the art, http://www.transport.nsw.gov.au/media-releases/north-west-rail-link-be-state-art (accessed 6 June 2016).
NT Government (Northern Territory Government) 2016, ANZ job advertisements, Economic Brief, Department of Treasury and Finance, January.
NTC (National Transport Commission) 2016a, Regulatory Barriers to More Automated Road and Rail Vehicles, Issues paper, February.
—— 2016b, Regulatory Options for Automated Vehicles, Discussion paper, May.
OECD (Organisation for Economic Co-operation and Development) 1993, Glossary of Industrial Organisation Economics and Competition Law, Paris.
—— 2011, Divided We Stand: Why Inequality Keeps Rising, Paris.
—— 2012, Inequality In Labour Income – What Are Its Drivers and How Can It Be Reduced?, OECD Economics Department Policy Notes, 8, Paris.
—— 2013a, Interconnected economies: Benefiting from global value chains: Synthesis report, Paris.
—— 2013b, OECD Science, Technology and Industry Scoreboard 2013, OECD Publishing, Paris.
—— 2013c, OECD Skills Outlook 2013: First Results from the Survey of Adult Skills, http://www.oecd.org/site/piaac/chapter2proficiencyinkeyinformation-processingskillsamongworking-ageadults.htm (accessed 17 May 2016).
—— 2013d, Supporting Investment in Knowledge Capital, Growth and Innovation: Knowledge-based capital, innovation and resource allocation, http://www.oecd-ilibrary.org/industry-and-services/supporting-investment-in-knowledge-capital-growth-and-innovation/knowledge-based-capital-innovation-and-resource-allocation_978926 4193307-5-en (accessed 26 April 2016).
—— 2015a, OECD Digital Economy Outlook 2015, 15 July, Paris.
—— 2015b, The Innovation Imperative: Contributing to Productivity, Growth and Well-Being, 14 October, Paris.

REFERENCES 237
—— 2016a, Back to Work: Australia - Improving the Re-employment Prospects of Displaced Workers, 7 April, Paris.
—— 2016b, ‘Seizing the Benefits of Digitalisation for Growth and Well-Being’, presentation at Meeting of the Council at Ministerial Level.
—— 2016c, The Productivity-Inclusiveness Nexus, C(2016)/REV1, Paris.
Office of the Chief Scientist 2014, Benchmarking Australian Science, Technology, Engineering and Mathematics, November, Australian Government, Canberra.
—— 2016, Australia’s STEM Workforce: Science, Technology, Engineering and Mathematics.
Ollerhead, L. 2015, Open policy making: The limits of agile - can we apply it to policy making, 27 January.
Oreskovic, A. 2015, ‘Here’s another area where Twitter appears to have stalled: tweets per day’, Business Insider Australia, 16 June, http://www.businessinsider.com.au/twitter-tweets-per-day-appears-to-have-stalled-2015-6?r=US&IR=T (accessed 23 December 2015).
Origin Energy 2015, Smart Meters: Revolutionising Electricity Supply - Origin Energy, https://www.originenergy.com.au/blog/about-energy/smart-meters-revolutionising-electricity-supply.html (accessed 10 December 2015).
OSR (NSW Government Office of State Revenue) 2016, Data and statistics, http://www.osr.nsw.gov.au/info/statistics (accessed 15 April 2016).
Parkinson, G. 2015a, Should Australian Households Quit the Electricity Grid?, Renew Economy, http://reneweconomy.com.au/2015/should-australian-households-quit-the-electricity-grid-30082 (accessed 6 April 2016).
—— 2015b, ‘Tesla’s Powerwall will give its first taste of disruption to Australia’s energy market’, The Guardian, 18 September, http://www.theguardian.com/ commentisfree/2015/sep/18/teslas-powerwall-will-give-its-first-taste-of-disruption-to-australias-energy-market (accessed 12 April 2016).
—— 2016, ‘Is going off the grid selfish? For many, it’s the only option that makes sense’, The Guardian, 22 January, http://www.theguardian.com/commentisfree/2016/jan/22/is-going-off-the-grid-selfish-for-many-its-the-only-option-that-makes-sense (accessed 7 April 2016).
Paterson, M. 2015, The (r)evolution of Australian and global electricity systems, http://www.slideshare.net/informaoz/mark-paterson (accessed 9 June 2016).
PayPal 2016, Why Should I Use PayPal on eBay?, https://www.paypal.com/cgi-bin/webscr?cmd=xpt/Help/general/TopQuestion8-outside (accessed 11 January 2016).
PC (Productivity Commission) 1999a, Regulation of the Taxi Industry, Commission Research Paper, Canberra.
—— 1999b, Structural Adjustment: Exploring the Policy Issues, Workshop Proceedings, AusInfo, Canberra.

238 DIGITAL DISRUPTION: WHAT DO GOVERNMENTS NEED TO DO?
—— 2001, Structural Adjustment: Key Policy Issues, Commission Research Paper, Canberra.
—— 2004, ICT Use and Productivity: A Synthesis from Studies of Australian Firms, Commission Research Paper, Canberra.
—— 2007, Public Support for Science and Innovation, Research Report, Canberra.
—— 2010, Bilateral and Regional Trade Agreements, 13 December, Canberra.
—— 2011, Disability Care and Support, Report no. 54, Canberra.
—— 2012, Regulation Impact Analysis: Benchmarking, Research Report, Canberra.
—— 2013a, An Ageing Australia: Preparing for the Future, Commission Research Paper, Canberra.
—— 2013b, Electricity Network Regulatory Frameworks, Report no. 62, Canberra.
—— 2013c, National Access Regime, Report no. 66, Canberra.
—— 2013d, Regulator Engagement with Small Business, Research Report, Canberra.
—— 2014a, Geographic Labour Mobility, Research Report, Canberra.
—— 2014b, Public Infrastructure, Inquiry Report No. 71, Canberra.
—— 2014c, Regulator Audit Framework, Canberra.
—— 2015a, Barriers to Growth in Service Exports, Research Report, Canberra.
—— 2015b, Business Set-up, Transfer and Closure, Final Report 75, Canberra.
—— 2015c, Efficiency in Health, Commission Research Paper, April, Canberra.
—— 2015d, Tax and Transfer Incidence in Australia, Commission Working Paper, Canberra.
—— 2015e, Workplace Relations Framework, Final Report 76, Canberra.
—— 2016a, Developments in Anti-Dumping Arrangements, Commission Research Paper.
—— 2016b, Intellectual Property Arrangements, Draft Report, Canberra.
Piesing, M. 2013, ‘Predicting the future of artificial intelligence has always been a fool’s game’, Wired.co.uk, 30 March, http://www.wired.co.uk/news/archive/2013-03/29/predicting-artificial-intelligence (accessed 23 February 2016).
Polites, D. and Adams, K. 2012, ACC on Energy (Watch), 13 September, Clayton Utz Insights.
Polites, H. 2013, ‘Australia already a leader in the adoption of wearable tech: study’, The Australian, 19 September, http://at.theaustralian.com.au/link/33d2196d3eba26ca 5e352483d67fcacf?domain=theaustralian.com.au (accessed 15 April 2016).
Pomeroy, S. and Fahy, R. 2015, Responding to digital disruption: 6 lessons government organisations can learn from Westpac New Zealand and Woolworths, Conference Paper, October.

REFERENCES 239
Porter, M.E. 1998, ‘Clusters and the new economics of competition’, Harvard Business Review, vol. November - December, pp. 77 – 90.
—— 2000, ‘Location, Competition, and Economic Development: Local Clusters in a Global Economy’, Economic Development Quarterly, vol. 14, no. 1, pp. 15 – 34.
Postscapes 2014, Internet of Things Market Forecast, Postscapes, http://postscapes.com/internet-of-things-market-size (accessed 5 April 2016).
Prime Minister’s Manufacturing Taskforce 2012, Smarter Manufacturing for a Smarter Australia: A Report of the Non-Government Members, August.
PwC (PricewaterhouseCoopers) 2014, Expanding Australia’s Economy: How digital can drive the change, PricewaterhouseCoopers.
—— 2015, A Smart Move - Future Proofing Australia’s Workforce by Growing Skills in Science, Technology, Engineering and Maths (STEM), April.
Queensland Government 2016, Electricity in Queensland, https://www.business.qld.gov.au/industry/energy/electricity-industry/electricity-queensland (accessed 8 April 2016).
RBA (Reserve Bank of Australia) 1996, Australian Economic Statistics 1949-1950 to 1996-1997, Occasional Paper No. 8.
—— 2010, How are Electricity Prices Set in Australia?, 6 July.
Redrup, Y. 2015, ‘Australian listings on Airbnb double in 12 months’, Financial Review, 29 May, http://www.afr.com/real-estate/australian-listings-on-airbnb-double-in-12-months-20150527-ghat2s (accessed 5 May 2016).
Reeves, R.V. 2016, Time to Take Basic Income Seriously, Brookings, http://www.brookings.edu/research/opinions/2016/02/23-time-to-take-basic-income-seriously-reeves (accessed 27 April 2016).
Reilly, C. 2015, Tesla Powerwall Home Battery Coming to Australia Within Months, CNET, http://www.cnet.com/au/news/tesla-powerwall-home-battery-coming-to-australia-by-late-2015/ (accessed 6 April 2016).
REN21 2015, Renewables 2015 Global Status Report, Paris.
Reposit Power 2016, Reposit makes your energy smarter. Much smarter., http://www.repositpower.com/ (accessed 8 June 2016).
Ribeiro, J. 2016, ‘Uber to pay $20,000 in settlement on privacy issues with New York attorney general’, PCWorld, 6 January, http://www.pcworld.com/article/ 3019981/security/uber-to-pay-20000-in-settlement-on-privacy-issues-with-new-york-attorney-general.html (accessed 27 May 2016).
Riemer, K., Gal, U., Hamann, J., Gilchriest, B. and Teixeira, M. 2015, Digital Disruptive Intermediaries: Finding new digital opportunities by disrupting existing business models, Australian Digital Transformation Lab.

240 DIGITAL DISRUPTION: WHAT DO GOVERNMENTS NEED TO DO?
Ritchie, F. 2014, Resistance to change in government: risk, inertia and incentives, Economic Working Paper Series, 1412, Faculty of Business and Law, University of the West of England, Bristol.
Rogers, E. 2003, Diffusion of Innovations, 5th edn, Simon and Schuster, New York.
Rogers, M. 2012, Energy = Innovation: 10 Disruptive Technologies, McKinsey & Company.
Ross, J. 2013, ‘Firefighting drones could do the dangerous work’, The Australian, 24 October, http://www.theaustralian.com.au/higher-education/firefighting-drones-could-do-the-dangerous-work/story-e6frgcjx-1226745417741 (accessed 28 April 2016).
Roy Morgan Research 2015, Domain vs REA: apples for apples audience numbers from Roy Morgan Research, http://www.roymorgan.com/findings/6088-property-search-websites-realestate-vs-domain-december-2014-201502222305 (accessed 5 January 2016).
Russell, S., Hauert, S., Altman, R. and Veloso, M. 2015, ‘Robotics: Ethics of artificial intelligence’, Nature, vol. 521, no. 7553, pp. 415–418.
Ryan, K. and Ali, A. 2015, The new government leader: mobilizing agile public leadership in disruptive times, A GovLab report, Deloitte.
Sabre Autonomous Solutions 2016, The Sydney Harbour Bridge, http://www.sabreautonomous.com.au/sab15/project/shb/ (accessed 20 May 2016).
SAE International 2014, Automated Driving: Levels of Driving Automation are Defined in New SAE International Standard J3016.
Sage 2014, Gingerbread Icing Robot Cell, http://www.sageautomation.com/success-stories/Pages/GingerbreadIcingRobotCell.aspx (accessed 8 January 2016).
SCEFPA (House of Representatives Standing Committee on Economics and Finance) 2007, Servicing our future: Inquiry into the current and future directions of Australia’s services export sector, May.
Schiller, B. 2014, The Sharing Economy Comes To Hospitals To Help Cut Costs, Co.Exist, http://www.fastcoexist.com/3038465/the-sharing-economy-comes-to-hospitals-to-help-cut-costs (accessed 24 May 2016).
Schliebs, M. 2016, ‘ACCC boss Graeme Samuel goes on attack over digital companies’, The Australian, 8 March, http://www.theaustralian.com.au/business/accc-boss-graeme-samuel-goes-on-attack-over-digital-companies/news-story/bab5bdff09e47810dcb5c 987865bb1a6 (accessed 8 March 2016).
Schumpeter, J. 1942, Capitalism, Socialism and Democracy, Harper and Brothers, New York.
Schwab, K. 2016a, The Fourth Industrial Revolution, World Economic Forum, Geneva.
—— 2016b, The Fourth Industrial Revolution, World Economic Forum, Geneva.

REFERENCES 241
SCOEEWR (House of Representatives Standing Committee on Employment, Education and Workplace Relations) 2000, Age counts: An inquiry into issues specific to mature-age workers.
Scommegna, P. 2013, The Barriers to a College Degree, Population Reference Bureau, http://www.prb.org/Publications/Articles/2013/us-college-attainment.aspx (accessed 26 April 2016).
SCOTI (Standing Council on Transport and Infrastructure) 2012, Policy Framework for Intelligent Transport Systems in Australia.
Scutella, R. 2004, Moves to a Basic Income-Flat Tax System in Australia: Implications for the Distribution of Income and Supply of Labour, 5/04, Working Paper, Melbourne Institute of Applied Economic and Social Research.
Segal, D. 2011, ‘A Rave, a Pan, or Just a Fake?’, The New York Times, 21 May, http://www.nytimes.com/2011/05/22/your-money/22haggler.html (accessed 12 January 2016).
Senate Environment and Communications References Committee 2015, Performance and Management of Electricity Network Companies, Final Report, June.
Senate Finance and Public Administration Committee 2014, Commonwealth Procurement Procedures, July.
SGRC (Smart Grid Research Consortium) 2015, Smart Grid Consulting and Business Case Analysis, http://smartgridresearchconsortium.org/about.htm (accessed 10 December 2015).
Skidmore, M. 2015, ‘Governing the use of RPAs – Safety & Regulation’, https://www.casa.gov.au/standard-page/governing-use-rpas-%E2%80%93-safety-regulation-0 (accessed 21 January 2016).
Skyscanner 2016, About Skyscanner, http://www.skyscanner.com.au/aboutskyscanner.aspx (accessed 11 January 2016).
Solow, R. 1987, ‘We’d better watch out’, New York Times Book Review, 12 July, p. 36.
Soubra, D. 2012, The 3Vs that define Big Data, Data Science Central, 5 July, http://www.datasciencecentral.com/forum/topics/the-3vs-that-define-big-data (accessed 11 January 2016).
Spary, S. 2016, ‘Online Criminals Are Targeting Fitbit User Accounts’, BuzzFeedNews, 7 January, https://www.buzzfeed.com/saraspary/online-criminals-are-targeting-fitbit-user-accounts?utm_term=.wddQR27Z9#.fuA8Qbed2 (accessed 8 June 2016).
Stafford, P. 2013, Online retailer Shoes of Prey teams up with David Jones to launch in-store sales booths, http://www.smartcompany.com.au/finance/economy/30027-online-retailer-shoes-of-prey-teams-up-with-david-jones-to-launch-in-store-sales-booths/ (accessed 4 April 2015).

242 DIGITAL DISRUPTION: WHAT DO GOVERNMENTS NEED TO DO?
Statista 2015, Leading social media websites in the United States in October 2015, based on share of visits, http://www.statista.com/statistics/265773/market-share-of-the-most-popular-social-media-websites-in-the-us/ (accessed 5 January 2016).
—— 2016, Mobile phone market share worldwide 1997-2014, http://www. statista.com/statistics/271574/global-market-share-held-by-mobile-phone-manufacturers-since-2009/ (accessed 11 April 2016).
Sterling, G. 2015, Google Controls 65 Percent Of Search, Bing 33 Percent [comScore], Search Engine Land, http://searchengineland.com/google-controls-65-percent-of-search-bing-33-percent-comscore-228765 (accessed 5 January 2016).
Stevenson, B. 2008, The Internet and Job Search, March, NBER Working Papers, National Bureau of Economic Research.
Stock, A., Stock, P. and Sahajwalla, V. 2015, Powerful Potential: Battery Storage for Renewable Energy and Electric Cars, Climate Council of Australia.
Sullivan, D. 2011, How Google Instant’s Autocomplete Suggestions Work, Search Engine Land, http://searchengineland.com/how-google-instant-autocomplete-suggestions-work-62592 (accessed 11 January 2016).
Summers, L.H. 2015, ‘Demand side secular stagnation’, American Economic Review, vol. 105, no. 5, pp. 60–65.
Szeliski, R. 2010, Computer Vision: Algorithms and Applications, http://szeliski.org/Book/drafts/SzeliskiBook_20100903_draft.pdf (accessed 18 April 2016).
Taft, J.D. and Becker-Dippmann, A. 2015, Grid Architecture, January, Pacific Northwest National Laboratory.
Tanner, M. 2015, The Pros and Cons of a Guaranteed National Income, Cato Institute.
Tauberer, J. 2014, Unintended Consequences and the Limits of Transparency, https://opengovdata.io/2014/unintended-consequences/ (accessed 30 May 2016).
Taylor, J. 2016, ‘The weird old law that makes Uber legal in Victoria’, Crikey, 20 May, http://www.crikey.com.au/2016/05/20/one-weird-part-law-made-uber-technically-legal-victoria/ (accessed 27 May 2016).
Tesla Motors 2016a, Blog, https://www.teslamotors.com/en_AU/blog (accessed 10 May 2016).
—— 2016b, Powerwall - Tesla Home Battery, https://www.teslamotors.com /en_AU/powerwall (accessed 6 April 2016).
Teulings, C. and Baldwin, R. 2014, Secular Stagnation: Facts, Causes and Cures, VoxEU.org, Centre for Economic Policy Research, London.
The Economist 2009a, ‘Britain’s lonely high-flier’, The Economist, http://www.economist. com/node/12887368 (accessed 19 April 2016).

REFERENCES 243
—— 2009b, ‘Clustering’, The Economist, 24 October, http://www.economist. com/node/14292202 (accessed 24 February 2016).
—— 2012, ‘Survival of the biggest’, The Economist, http://www.economist. com/news/leaders/21567355-concern-about-clout-internet-giants-growing-antitrust-watchdogs-should-tread (accessed 23 May 2016).
—— 2013a, ‘The man who showed why firms exist’, The Economist, September, http://www.economist.com/news/leaders/21584985-anyone-who-cares-about-capitalis m-and-economics-should-mourn-death-ronald-coase-man (accessed 24 February 2016).
—— 2013b, ‘The rise of the sharing economy’, The Economist, 3 September, http://www.economist.com/news/leaders/21573104-internet-everything-hire-rise-sharing-economy (accessed 9 May 2016).
—— 2015a, ‘Does Deutschland do digital?’, The Economist, 21 November, http://www.economist.com/news/business/21678774-europes-biggest-economy-rightly-worried-digitisation-threat-its-industrial (accessed 24 February 2016).
—— 2015b, ‘Substitutes or complements?’, The Economist, http://www.economist. com/blogs/graphicdetail/2015/08/taxis-v-uber (accessed 23 May 2016).
—— 2016, ‘Mark Zuckerberg prepares to fight for dominance of the next era of computing’, The Economist, 9 April.
The Guardian 2015, ‘Tesla’s Powerwall to flow batteries: a guide to the energy storage revolution’, The Guardian, 27 October.
Thépot, F. 2012, Market Power in Online Search and Social-Networking: a Matter of Two-Sided Markets, 4/2012, CLES Working Paper Series, Centre for Law, Economics and Society.
Ting, I. 2015, ‘Gen Y: Australia’s most educated generation faces worst job prospects in decades’, The Sydney Morning Herald, 8 November, http://www.smh.com. au/business/the-economy/generation-y-overqualified-but-unprepared-for-work-20151106-gkt2ud.html (accessed 26 May 2016).
Tlozek, E. 2014, Electricity Providers ‘Trying to Block Solar From Grid’, ABC News, http://www.abc.net.au/news/2014-07-08/qld-providers-trying-to-block-solar-from-grid-groups-says/5579874 (accessed 13 April 2016).
TripAdvisor 2016, About TripAdvisor, http://www.tripadvisor.com/PressCenter-c6-About_Us.html (accessed 11 January 2016).
Trout, J. 2015, Big Brands Big Trouble: Lessons Learned the Hard Way, 3rd edn, Westland, Chennai.
Tuffley, D. 2016, ‘What to do when machines take our jobs? Give everyone free money for doing nothing’, The Conversation, 5 April, https://theconversation.com/what-to-do-when-machines-take-our-jobs-give-everyone-free-money-for-doing-nothing-56911 (accessed 27 April 2016).

244 DIGITAL DISRUPTION: WHAT DO GOVERNMENTS NEED TO DO?
Turnbull, M. (Prime Minister) 2015, National Innovation and Science Agenda, Media Release, 7 December.
Uber 2016a, Answers to Questions on Notice From a Public Hearing Held in Sydney on 18 November 2015 for the Senate Economics References Committee Inquiry into Corporate Tax Avoidance, 19 February.
—— 2016b, Want to drive with uber?, https://www.uber.com/driver-jobs (accessed 20 April 2016).
UN (United Nations) 2014, United Nations E-Government Survey 2014, United Nations Department of Economic and Social Affairs, https://publicadministration. un.org/egovkb/en-us/Reports/UN-E-Government-Survey-2014 (accessed 27 April 2016).
University of Melbourne 2016, Computer Laboratories for Hire, http://www.ms.unimelb. edu.au/~ahlabman/index.php?page_ref_id=293 (accessed 9 June 2016).
University of Technology Sydney 2016, Hire our research facilities, http://www.uts. edu.au/working-uts/expertise-and-facilities/hire-our-research-facilities (accessed 9 June 2016).
Utility Magazine 2014, Drone Fleet May Inspect QLD Reservoirs, http://www.utilitymagazine.com.au/drone-fleet-may-inspect-qld-reservoirs/ (accessed 2 May 2016).
Veugelers, R. 2013, Trends, challenges and prospects for manufacturing in Europe, Manufacturing Europe’s future, Bruegel Blueprint Series.
Volvo 2016, Autonomous Driving News, http://www.volvocars.com/intl/about/our-innovation-brands/intellisafe/intellisafe-autopilot/news (accessed 10 May 2016).
Walford, L. 2015, How Oregon will charge for road use with connected car toll devices, http://www.autoconnectedcar.com/2015/03/how-oregon-will-charge-for-road-use-with-connected-car-toll-devices/ (accessed 2 May 2016).
Walsh, C. and O’Neil, M. 2011, Assisting Regions and Communities to Cope with Structural Change: Context, Objectives, Principles and Good Practice, Economic Issues, South Australian Centre for Economic Studies.
Wattcost 2014, Wattcost, https://www.wattcost.com/ (accessed 10 December 2015).
Webster, E. 2015, ‘Australia’s transitioning economy and the myth of digital disruption’, The Conversation, 8 May, http://theconversation.com/australias-transitioning-economy-and-the-myth-of-digital-disruption-40757 (accessed 27 April 2016).
Wheeler, T. 2013, Net Effects: The Past, Present and Future Impact of our Networks, Federal Communications Commission.
Williamson, R.C., Nec Raghnaill, M., Douglas, K. and Sanchez, D. 2015, Technology and Australia’s Future: New Technologies and Their Role in Australia’s Security, Cultural, Democratic, Social and Economic Systems, September, Australian Council of Learned Academies.

REFERENCES 245
WIPO (World Intellectual Property Organization) 2015, World Intellectual Property Report 2015.
Wood, T. 2013, Shock to the system: dealing with falling electricity demand, December, Grattan Institute.
—— and Blowers, D. 2015a, Fair Pricing for Western Australia’s Electricity, November, Grattan Institute.
—— and —— 2015b, Sundown, sunrise - How Australia can finally get solar power right, May, No. 2015-2, Grattan Institute.
Worldometers 2016, World Population by Year, http://www.worldometers.info/world-population/world-population-by-year/ (accessed 15 April 2016).
Yakos, D. 2014, Top 10 Benefits of 3D printing, https://blog.dragoninno vation.com/2014/12/30/top-10-benefits-3d-printing-salient-technologies/ (accessed 11 January 2016).
Ye, M., Meng, B. and Wei, S. 2015, Measuring smile curves in global value chains, 27 August, Institute of Developing Economies.
Younger, E. 2016, ‘Melbourne Uber driver beats fine in landmark case effectively legalising service in Victoria’, ABC News, 18 May, http://www.abc.net.au/news/2016-05-18/melbourne-uber-driver-wins-appeal-for-operating-in-state/7425116 (accessed 18 May 2016).
Youyou, W., Kosinski, M. and Stillwell, D. 2015, ‘Computer-based personality judgments are more accurate than those made by humans’, Proceedings of the National Academy of Sciences of the United States of America, vol. 112, no. 4, pp. 1036 – 1040.
Zengkun, F. 2015, ‘NEA’s move to fit bins with sensors means they can be emptied faster’, The Straits Times, 21 May, http://www.straitstimes.com/ singapore/environment/pilot-project-to-fit-rubbish-bins-with-smart-sensors-launched-by-nea (accessed 5 May 2016).