diffusion mechanisms of c in 100, 110 and 111 fe surfaces...
TRANSCRIPT

lable at ScienceDirect
Acta Materialia 136 (2017) 303e314
Contents lists avai
Acta Materialia
journal homepage: www.elsevier .com/locate/actamat
Full length article
Diffusion mechanisms of C in 100, 110 and 111 Fe surfaces studiedusing kinetic activation-relaxation technique
Oscar A. Restrepo a, d, *, Charlotte S. Becquart b, Fedwa El-Mellouhi c, Othmane Bouhali d,Normand Mousseau a
a D�epartement de Physique and Regroupement Qu�eb�ecois sur Les Mat�eriaux de Pointe, Universit�e de Montr�eal, Case Postale 6128, Succursale Centre-ville,Montr�eal, QC H3C 3J7, Canadab Univ. Lille, CNRS, INRA, ENSCL, UMR 8207, UMET, Unit�e Mat�eriaux et Transformations, F 59 000 Lille, Francec Qatar Environment and Energy Research Institute, Hamad Bin Khalifa University, PoBox 3411, Doha, Qatard Texas A&M University at Qatar, Doha, Qatar
a r t i c l e i n f o
Article history:Received 3 February 2017Received in revised form4 July 2017Accepted 4 July 2017Available online 7 July 2017
Keywords:KMCMDFe-CSurface diffusionMigration energy
* Corresponding author. D�epartement de Physique asur Les Mat�eriaux de Pointe, Universit�e de Montr�eal,Centre-ville, Montr�eal, QC H3C 3J7, Canada.
E-mail address: [email protected] (O.A. Restrepo
http://dx.doi.org/10.1016/j.actamat.2017.07.0091359-6454/© 2017 Acta Materialia Inc. Published by E
a b s t r a c t
The physics of Fe-C surface interactions is of fundamental importance to phenomena such as corrosion,catalysis, synthesis of graphene, new steels, etc. To better understand this question, we perform anextensive characterization of the energy landscape for carbon diffusion from bulk to surfaces for bcc ironat low C concentration. C diffusion mechanisms over the three main Fe-surfaces e (100), (110) and (111)e are studied computationally using the kinetic activation-relaxation technique (k-ART), an off-latticekinetic Monte Carlo algorithm. Migration and adsorption energies on surfaces as well as absorptionenergies into the subsurfaces are predicted and then compared to density functional theory (DFT) andexperiment. The energy landscape along C-diffusion pathways from bulk to surface is constructedallowing a more extensive characterization of the diffusion pathways between surface and subsurface. Inparticular, effective migration energies from (100), (110) and (111) surfaces, to the bulk octahedral site arefound to be around ~1.6 eV, ~1.2 eV and ~1.3 eV respectively suggesting that C insertion into the bulkcannot take place in pure crystalline Fe, irrespective of the exposed surface.
© 2017 Acta Materialia Inc. Published by Elsevier Ltd. All rights reserved.
1. Introduction
Carbon interaction with iron surfaces is associated with severalprocesses such as steel fabrication, metal dusting corrosion [1],iron-based catalyst used in Fisher-Tropsch synthesis [2], design ofnewmaterials for fission reactors [3], and synthesis of high-qualitygraphene sheets and carbon nanotubes [4e6]. In spite of consid-erable experimental and computational efforts [7e10], atomisticdetails regarding the carbon surface diffusion as well as adsorption,absorption, insertion and segregation pathways are still lacking. Forinstance, it is known that the mechanisms by which catastrophicmetal dusting corrosion in steels happens can be generallyexplained in three steps: first, the formation of a cementite layer atthe metal surface; followed by, cementite decomposition that leads
nd Regroupement Qu�eb�ecoisCase Postale 6128, Succursale
).
lsevier Ltd. All rights reserved.
to graphite nucleation; and in a final step, the precipitation of ironparticles in the coke which acts as catalyst for additional graphitedeposition [11]. However, the exact atomistic mechanisms are notwell understood. Similarly, in Fisher-Tropsch synthesis C depositionand diffusion is undesirable because the metal catalytic activity canbe reduced [12]. Therefore, an explicit understanding of themechanisms of diffusion could help to solve this problem.
In recent years, carbon interaction with iron surfaces has alsobeen linked to fashionable applications, contributing to revivingthe interest in these fundamentals problems. For example, Vinog-radov et al. [4] performed in situ epitaxial graphene growth on (110)Fe-surface using chemical vapor deposition (CVD) at relatively lowtemperatures. This graphene monolayer exhibited a novel period-ically corrugated pattern on (110) Fe-surface, and was obtained bygoing beyond the thermodynamic equilibrium conditions duringthe CVD process to avoid formation of carbide phases.
Several experimental and theoretical studies made predictionsregarding C migration energies on and through Fe-surfaces[6e10,12]. Adsorption and segregation of carbon atoms on (100)

O.A. Restrepo et al. / Acta Materialia 136 (2017) 303e314304
Fe-surface, for instance, has been studied using low-energy elec-tron diffraction [13,14]. Similarly, C segregation, carbide formationand graphite formation at higher coverage have been observed on(111) Fe-surface [15,16], although details are still lacking. On thecomputational side, studies use static energy calculations witheither density-functional theory (DFT) or empirical potentialmodels, generally coupled with tools such as nudge elastic bandmethod (NEB) [17,18] to refine the diffusion pathway. For instance,Jiang and Carter did DFT studies of C adsorption and diffusion in Fe(100) and (110) surfaces at a coverage of 0.25 monolayers (ML) [10].Later, Riikonen et al. repeated the DFT study at different C con-centrations and added diffusion pathways on the (111) Fe-surface[6], finding good agreement with Jiang and Carter. A recent DFTwork, however, indicates significant finite size-effects affecting theheight of the calculated energy barriers [19,20] suggesting that thisissue needs to be revisited using sufficiently large simulation boxes.Furthermore, DFT predicts that C atoms bind strongly to (100) and(110) Fe-surfaces, while the interaction with the (111) Fe-surface isweaker [6]. It also predicts a large barrier of surface diffusion on(100) (due to the stronger bonding between C and the surface), anda less significant barrier for diffusion through the (111) subsurface,thanks to the hollow sites easing the C diffusion to subsurface. It isalso well known from DFT that C prefers high coordination sites[6,10], i.e., instead of the three-fold (TF) site C prefers the hollow (H)on the (100) surface while for (110) surface, the long-bridge (LB)site is preferred.
An extensive characterization of the possible diffusion pathwaysof C adsorbed on various Fe-surfaces either on the surface or to-wards the bulk of iron is still missing. Such a work would provide acomplete picture of the various diffusion mechanisms and evaluatethe possible richness of the energy landscape associated with thisphenomenon. To achieve this goal, we employ the kineticactivation-relaxation technique (k-ART) [21e24], coupled with areliable and well-tested CeFe embedded-atom method (EAM)empirical potential [25,26].
Using this approach, we characterize the energy landscape of a Catom diffusing from bulk bcc-Fe on and through (110), (110) and(111) Fe-surfaces. Following the evolution of the energy landscapeover timescales ranging from tenths of microseconds to millisec-onds, we generate a detailed picture of the various mechanismsthat are subsequently compared to DFT and experimental resultspublished so far.
2. Methodology
2.1. Overview of k-ART
Weuse the k-ARTcoupledwith the Ackland-Mendelev-Becquartembedded atom method (EAM) potential for FeeC interactions forthe characterization of the C-diffusion on and through three mainFe-surfaces namely (100), (110) and (111). K-ART is an off-lattice on-the-fly kinetic Monte-Carlo (KMC) algorithm with topologicalclassification developed to explore the energy landscape and long-time kinetics of complex systems at the atomic scale, fully includinglong-range elastic events and disordered environments [21,27,28].
While a detailed description of k-ART can be found inRefs. [21,27,28], we provide here a brief overview of the method. K-ART uses a topological characterization of the local environmentsurrounding each atom to classify configurations. At the beginningof each KMC step, the local environment surrounding each atom isevaluated using a topological approach. Local graphs are con-structed by connecting a list of atoms enclosed in a sphere of 6 Åsurrounding the chosen atom with being generated between eachatom and their neighbors distant by at most 2.7 Å. These graphs arethen analyzed with the NAUTY code [29,30], that returns the
automorphic class associated with the graph and the correspon-dence with a reference graph.
The algorithm proceeds as follows. (1) After an event, the localtopology of atoms involved in the event is computed. (2) If thetopology is known, events associated with it are inserted in anactive list; if the topology is new, event searches are launched usingthe activation-relaxation technique (ART nouveau), an open-endedmethod, to identify diffusion mechanisms and energy barriers[31e33]. (3) A first classification of the active events is generated,with events ordered by their rate, computed as ri ¼ neEb=kBTwhere,n, is a prefactor or constant attempt frequency set to 1013 s�1, kB theBolzmann's constant, T the temperature and Eb ¼ Esad e Emin, is theactivation energy for an event defined as the energy differencebetween the initial minimum Emin and the saddle Esad (i.e., thebarrier crossed between two adjacent minima). (4) All events withan occurrence probability of 1 in 10 000 or higher are fully recon-structed and relaxed, using ART nouveau, to ensure that elastic andlocal deformation effects are exactly taken into account [28]. (5)Incorporating these updated barriers in the event list, a time step isdrawn from a Poisson distribution, Dt ¼ �logðmÞ=P
iri, where m is a
random number in (0,1), and an event is selected at randomwith aweight proportional to its rate, according to standard KMC [24]. (6)After the time is brought forward and the event applied, a new stepcan be launched, starting at (1). As discussed in Refs. [21,28], atomscharacterized by the same automorphic class share the same eventlists, allowing k-ART to be applied to a range of environments, frombulk to surface and crystalline to amorphous materials.
2.2. Handling flickering states
Flickering states are states of similar energy separated by low-energy barriers that can dominate event-based KMC simulationsand slow system evolution to a halt. To avoid being trapped bythese states, k-ART incorporates the basin-auto constructing meanratemethod (bac-MRM), which computes an on-the-fly statisticallycorrect analytic solution of the system's average residence time inthe connected region of flickering states and of its escape rate as theenergy landscape is explored [28,34]. Since the kinetics betweenstates of similar energy separated by a barrier below the basinthreshold is resolved statistically, no specific pathway is availablefor the in-basin motion. To fully characterize kinetics at all relevanttimescales, we therefore proceed by slowly raising the basinthreshold. We start all simulations with a low basin factor of 0.1 eVand we increase it as flickers appear. For example, for the (100)surface no flickering state is found while for (110), we increase thebasin factor to 0.2 eV because of flickers with barriers of 0.11 eV,0.06 eV and 0.13 eV. The (111) surface is rich with flickers and,therefore, the basin factor is increased up to 0.60 eV after fullcharacterization of the landscape (even with a basin factor of0.50 eV, the system remains trapped with a basin barrier of 0.57 eVand an inverse barrier of 0.11 eV).
2.3. Force-field
In order to access sufficient length and time scales, we employan empirical force-field to describe the system. The FeeFe in-teractions are handled by the Embedded Atom Method (EAM)interatomic potential developed by Ackland and Mendelev [35]while the FeeC interaction part was developed by Becquart andcollaborators [25,26]. The combined potential provides a goodagreement with DFT calculations in bulk systems [36]. For example,the FeeC potential has been used with success over different sys-tems for the computation of different properties like the formationof carbon Cottrell atmospheres in bcc-iron [37] and the elasticconstants of the martensite [38], as well as model the effect of the

O.A. Restrepo et al. / Acta Materialia 136 (2017) 303e314 305
stress field of an edge dislocation on carbon diffusion [39]. ThisEAM potential is linked to k-ART package through the LAMMPSlibrary, which is used as the force-calculation engine [40,41].
2.4. Samples used
The simulated systems consist of three bcc-Fe slabs with a lat-tice constant of 2.855 Å and (100), (110) and (111) surfaces orientedalong the x axis. Periodic boundary conditions are applied in alldirections except along x, which is kept normal to the surface ofinterest. The first slab, Fe (100), has a surface area of22.843 � 22.846 Å2 and counts 1024 Fe-atoms and 16 layers; thesecond, Fe (110), a surface area of 20.188 � 14.275 Å2 with 1300 Fe-atoms and 26 layers; the last, Fe (111), has a surface area of24.228 � 20.982 Å2 for 1080 Fe-atoms and 30 layers.
2.5. Thermal effects
For all simulations, the temperature is set to 600 K. This valuecorresponds to the onset temperature for phenomena such ascorrosion [7,11]. The choice of temperature does not affect Cdiffusion in the bulk, which is associated with a single mechanism.However, the specific diffusion pathways at surfaces, where manymechanisms are found, might be affected. Nevertheless, the energylandscape is not affected by temperature, and the general analysis isapplicable for conditions away from melting.
2.6. Data analysis
The square displacement is computed according to
SDðtnÞ ¼PN
i¼1ðxiðtnÞ � xið0ÞÞ2, where N is the number of particlesand xiðtnÞ is the position atom i at KMC step n and time tn. Thediffusion coefficient over a total of M steps can be computed using
Einstein's formula D ¼
16t2M
!PMn¼1SDðtnÞDtn, where a time average
is considered according to the ergodic hypothesis (We consider 3Ddiffusion as 2D and 3D diffusion show the same time relation anddiffer only by a small constant in the prefactor. Since uncertaintiesin the diffusion due the statistics (limited number of steps) and thechoice of a fixed prefactor are much larger than this 4/6 factor).Also, D is computed after the C atom reaches the surface. In bulk,with the prefactor mentioned above, k-ART predicts an approxi-mated C diffusion coefficient of D ~4.8 � 10�14 m2/s.
2.7. Geometry and events summarized from DFT literature
The diffusion pathway of a single C atom in a perfect crystal israther simple [26,42]: as shown in Fig.1, the C atom jumps betweenoctahedral sites (OS) via a transition state located in the middle ofthe pathway, in a tetrahedral site (s), with a 0.815 eV barrier, inagreement with DFT calculations [36]. Similarly, according to DFT[6,10], the C diffusion pathways over the three main surfaces arealso simple: diffusion from a stable site to another stable sitehappens in one step over (100) and (110) and in two steps or moreover the (111) surface, as predicted in Refs. [6,10].
According to DFT calculations, C atoms at surfaces are expectedto adsorb at sites of maximum coordination, i.e., those sites with amaximum number of Fe neighborsd i.e. hollow (H), long bridge(LB) and quasi four fold (GS) on (100), (110) and (111) surfaces,respectively [6,10]. In Fig. 1, we observe that the number of sym-metric events from each one of these high-coordination sites (i.e.events having the same barrier associated but going to a symmet-rically equivalent direction) is four for the bulk and for both (100)and (110) surfaces. On the (111) surface, we observe six possible
events: four are from the GS site (see for example, from the GSposition at the center of the cell, two jumps to symmetrical posi-tions A plus two jumps to symmetrical positions GS at right) andthe other two are from A to GS symmetrical positions at left andright. Using these states a simple catalog can be constructed.
In what follows, and to facilitate comparison, we use the nota-tion of Jiang and Carter [10] to label the various geometrical pointsthat are presented in Fig.1 for the bulk and (100) and (110) surfaces;for (111) surface, we use our own notation as Jiang and Carter didnot study this surface.
3. Results and discussion
In the simulations presented here, ART events are centered on Catoms only, leaving aside the Femotion in the bulk or at the surface.This allows us to better focus on the mechanisms of interest,without affecting the C-related kinetics. With this approach, Featoms can move, but in relation with a C-diffusion jump only. Wenow provide a more detailed characterization of the kineticsobserved for each of the three surfaces.
3.1. Diffusion from bulk to the (100) Fe-surface
Fig. 2 shows the geometries and the diffusion mechanismsrelated to the (100) Fe-surface as well as the diffusion pathways andenergy landscape computed with k-ART. More precisely, Fig. 2ashows a superposition of the all C minima visited during the KMCsimulation. These points correspond to the adsorption sites mostvisited on the (100) surface. Fig. 2b shows the diffusion mecha-nisms from the subsurface to the surface and across the surface, andpanel c, d and e present the evolution of the respective minimumand saddle energies over three different representative intervals.
The k-ART simulations identify two local metastable minimalocated at bridge position B (on the surface) and Bˋ (situated 0.92 Åabove the surface), as seen Fig. 2b and d. K-ART finds therefore twopathways connecting H sites. The first path, through B, involves afirst barrier at 0.80 eV while the second pathway goes through a1.04 eV barrier into Bˋ. With a 0.03 eV barrier to get into a new Hsite, B0 lifetime is only 60 fs at 600 K, resulting in an effective single-step pathway connecting H sites. Nevertheless, with an energydifference of 0.24 eV between the pathway's barriers, the first path,going through B, occurs most of the times, as going through B0
occurs only in 1.0% of all KMC steps at 600 K. This picture isconsistent with results from DFT for the (100) surface, that predictmotion between two hollow sites in one stepwith a transition state(saddle) located at the bridge (B) site but a larger barrier of 1.3 eV[10] compared to the EAM barrier of 0.80 eV and 1.04 eV. Althoughthe environment around the B site is rougher with the EAM, theoverall pathway corresponds to the saddle geometrical positionpredicted by DFT. DFT pathways are typically generated from pre-built trajectories using for instance the NEB. This may explain whythe B0 site has not been observed with ab initio techniques.
Fig. 2c shows the energy landscape for diffusion from the bulk tothe surface: during steps 208e210, the C atom moves from a OS1state (at 0.81 eV located into the second layer) to state B (at 0.56 eVon surface) by crossing a small barrier of 0.35 eV and from it to theground state H with a smaller barrier of 0.25 eV. Surface to sub-surface diffusion can be understood by following the same energylandscape while reverting the pathways. In this case, an effectivereverse barrier of 1.16 eV is computed by moving backward from Hto OS1, i.e. from steps 210 to 208 (this is also observed in Fig. 2e atstep 7704). Including the jump from the second layer to OS2 to thebulk, an effective reverse barrier of 1.63 eV needs to be crossed forinserting a C atom from the (100) surface to the bulk according toour results. This insertion is very improbable because of the high

Fig. 1. Top: views of C diffusion pathways as predicted by DFT [10,12] on the three main surfaces; the C atom (in red) jumps to dotted circles via saddle points (s) shown as small reddotted circles. Fe atoms are represented by yellow spheres in the first layer, blue in the second layer and orange in the third layer. Bottom left: a path in bulk Fe. The orange spheresare Fe atoms at the center of the cell. Bottom right: equivalency table between various notations found in the literature: C-1 and C-2 is the notation used by Riikonen et al. [6]; H, B,LB, SB, TF is used by Jian & Carter [10]. On the (111) surface, e, d is the notation used by Liu Xing-wu et al. [12] and GS and A is our notation for similar points. Note that some of thepoints are near and not perfect equivalents. (For interpretation of the references to colour in this figure legend, the reader is referred to the web version of this article.)
O.A. Restrepo et al. / Acta Materialia 136 (2017) 303e314306
asymmetry: while the jump from the OS1 to OS2 state requirescrossing a 0.82 eV barrier, the inverse pathways involves a muchlower 0.35 eV barrier; as is shown in Fig. 2e.
A comparison of the barriers and inverse barriers energiescomputed with k-ART-EAM and ab initio results found in theliterature for the (100) system is presented in Table 1 while Table 2provides the C atom distances to the surface for the differentpossible configurations found in this work. Exact comparison toDFT is difficult because most authors only give relative bond dis-tances or even only the layer separation. Nevertheless, whencomparison is possible, the EAM potential matches the DFT resultsrelatively well.
Now that the atomic mechanisms of diffusion over the (100)surface have been clarified, we can analyze their relation to effec-tive diffusion. Fig. 3 shows the total square displacement, SD, for the(100) surface as well as the partial square displacements SDx, SDy
and SDz for C diffusion along x, y and z directions and the barriersselected at each time step. The displacement is isotropic over the(100) surface as can be inferred from the geometry of the surface.The diffusion coefficient over the (100) surface computed usingEinstein's formula is Dz 2� 10�14 m2/s, which is of the same orderas in the bulk. Over the surface the four energy barriers (bluecrosses) are always chosen by sets of two: (0.80, 0.25) eV for thefirst path and (1.04, 0.03) eV for the second path, in agreement withplots in Fig. 2d and e.
Over a total of 9381 KMC steps, a diffusion time of 663 ms hasbeen obtained with an average time step of 0.07 ms Activationbarriers for the individual jumps encountered in surface-subsurface diffusion are also given in Table 1.
3.2. Diffusion from bulk to the (110) Fe-surface
Surface diffusion mechanisms and their relation to the energy
landscape for the (110) surface system are shown in Fig. 4. In (a), wepresent a superposition of all the minima visited after the C atomreaches the (110) surface. They correspond to the high-symmetryadsorption sites. Of the three Fe surfaces investigated in thiswork, the (110) surface has the greatest similarity with planesfound in fcc structures, a similarity that makes it an ideal surface forthe growth of a graphene layer [4]. This advantage is enhanced bythe partial match of the surface with graphene and a FeeFe dis-tance close to the graphene lattice constant of 2.48 Å. Not sur-prisingly, such growth has been observed experimentally incorrosion as well as in practical applications for graphene produc-tion [4].
In Fig. 4b we present details of the diffusion mechanisms fromthe bulk to the (110) surface, with the corresponding minimum andsaddle energies shown in Fig. 4c. The diffusion from the bulk(second layer) to the surface goes as follows: from an octahedralsite, OS2, in second layer at 2.09 Å beneath the surface, the C atomjumps to an OS1 positioned between the first and second layer at0.90 Å beneath the surface, with a reduced barrier of 0.75 eV. At thisposition the C atom pushes the Fe atom 0.58 Å out of the surface(orange dotted circle), in agreement with the 0.50 Å predicted byDFT [10]. From this site, the C atom moves to position A, at 0.26 Åabove the top layer and 0.14 eV above ground state by crossing a0.66 eV barrier (saddle point at S2). From A, the C atom can thenreach the ground state LB at 0.78 Å above the surface, overcoming asmall 0.04 eV barrier.
As observed in Fig. 4b,d, surface diffusion takes place with the Catom jumping from the LB site to any of the two threefold positions,TF, and from TF to TF in any other neighbor unit cell. This is done intwo or more steps by crossing an effective barrier of 0.58 eV via anintermediate step at position A (see Fig. 4d) and the saddle positionS1. The two TF states symmetric to A in the same cell are separatedby a barrier of 0.06 eV and the barrier from TF to A is 0.13 eV. As

Fig. 2. a) Top and lateral views of the all C positions visited on the Fe (100) surface and subsurface. b) Diffusion mechanism from the bulk to the surface and across the surface. Redspheres represent the C atom, yellow spheres represent Fe in the first layer and blue spheres, Fe in the second layer. The C positions are marked as: octahedral site OS, hollow H, andbridge positions B and Bˋ. Bottom panels: Energy at the local minima and connecting saddle points as a function of KMC steps. Minimum and saddle energies are given over 3intervals corresponding to: c) jumps from the bulk to the subsurface; d) jumps on the surface; e) jump from the surface back to the subsurface. dE ¼ E e EGS, where EGS is thelowest energy found in the simulation. (For interpretation of the references to colour in this figure legend, the reader is referred to the web version of this article.)
O.A. Restrepo et al. / Acta Materialia 136 (2017) 303e314 307
mentioned before, the states in which bac-MRM is used produce adiscontinuity because the dynamics is lost. This discontinuity ismarked with a red dot in Fig. 4d, which indicates that the minimumfrom the previous step is not the same as the one fromwhich the Carrives to the present KMC step.
Diffusion from the surface to the bulk beyond the second layerhas not been observed during the k-ART simulations. However, theC atom visited a few times the OS1 position between first andsecond layer by crossing an effective barrier of 1.03 eV from H. Thisis expected as the barrier to move from A to OS1 is 0.99 eV versus0.13 eV to move back to the LB site on the surface. If the C atomjumps to OS1, the barrier to go deeper into bulk to OS2 is 0.85 eVversus 0.66 eV to go back to A. With an energy asymmetry of 0.4 eVbetween the surface LB and the OS closest to the surface, the totalbarrier needed to be crossed for the C atom to move from thesurface LB to bulk, beyond the second layer, is therefore about1.25 eV. Such an energy can be associated with a timescale of 0.01 s,which is about 50 times longer than our simulation. A summaryand comparison of barrier and inverse barrier energies to DFT andto experiment for the (110) system are found in Table 1. Distances ofC atomic positions to the (110) Fe surface are found in Table 2.
The total and partial square displacements as well as the energybarrier distribution for C diffusion from bulk to the (110) surface areshown in Fig. 5. The C atom reaches the surface after 32.4 ms at KMCstep 692. Dominated by a 0.58 eV barrier, surface diffusion is much
more rapid as indicated by the KMC simulation: after an additional5000 steps, the simulations end with a total time of 38.5 ms leadingto a surface diffusion coefficient of D z 8 � 10�13 m2/s, approxi-mately one order of magnitude larger than for bulk.
3.3. Diffusion over the (111) surface
The (111) Fe-surface is the most complex of the three studiedhere. While its topology is simple, its low density provides manymetastable sites for C adatoms. Fig. 6 shows the unitary cell(divided in two triangles (1) and (2)) and all the minima foundwiththeir symmetries. GS is the ground state, A and Aˋ are local minima0.13 eV and 0.74 eV above GS, while B, Bˋ and Bˋˋ are 0.31 eV, 0.36 eVand 0.80 eV above GS respectively. These states are associated witha number of low-energy barriers leading to flickers, i.e. pathwaysthat do not evolve the system. For example, in the case of themetastable flickering states in triangle (1), A and B are separated bya barrier and reverse barrier of 0.18 [0.09] eV. Now, A is separatedfrom the GS by a barrier and inverse barrier of 0.40 [0.13] eV and Bby 0.44 [0.13] eV, respectively. Most of the time, therefore, the Catom will hop between these states, without leaving the cell.
To have an effective diffusion on the (111) surface, the C atomhas to cross from one triangle (1) to another triangle (1) by passingvia Aˋ in triangle (2) (0.61 Å over the surface) with a barrier of0.82 eV. Three full possible paths are shown in Fig. 7. Another two
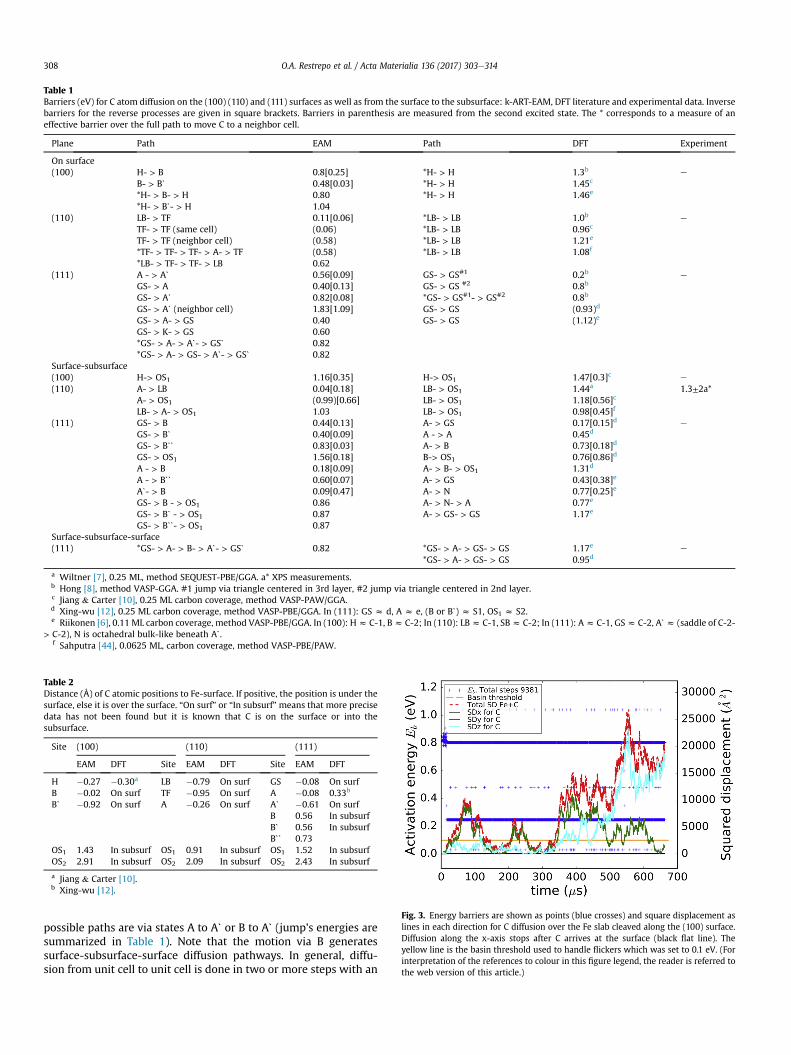
Table 1Barriers (eV) for C atom diffusion on the (100) (110) and (111) surfaces as well as from the surface to the subsurface: k-ART-EAM, DFT literature and experimental data. Inversebarriers for the reverse processes are given in square brackets. Barriers in parenthesis are measured from the second excited state. The * corresponds to a measure of aneffective barrier over the full path to move C to a neighbor cell.
Plane Path EAM Path DFT Experiment
On surface(100) H- > B
B- > Bˋ*H- > B- > H*H- > Bˋ- > H
0.8[0.25]0.48[0.03]0.801.04
*H- > H*H- > H*H- > H
1.3b
1.45c
1.46e
e
(110) LB- > TFTF- > TF (same cell)TF- > TF (neighbor cell)*TF- > TF- > TF- > A- > TF*LB- > TF- > TF- > LB
0.11[0.06](0.06)(0.58)(0.58)0.62
*LB- > LB*LB- > LB*LB- > LB*LB- > LB
1.0b
0.96c
1.21e
1.08f
e
(111) A - > AˋGS- > AGS- > AˋGS- > Aˋ (neighbor cell)GS- > A- > GSGS- > K- > GS*GS- > A- > Aˋ- > GSˋ*GS- > A- > GS- > Aˋ- > GSˋ
0.56[0.09]0.40[0.13]0.82[0.08]1.83[1.09]0.400.600.820.82
GS- > GS#1
GS- > GS #2
*GS- > GS#1- > GS#2
GS- > GSGS- > GS
0.2b
0.8b
0.8b
(0.93)d
(1.12)e
e
Surface-subsurface(100) H-> OS1
A- > LBA- > OS1LB- > A- > OS1
1.16[0.35]0.04[0.18](0.99)[0.66]1.03
H-> OS1 1.47[0.3]c e
(110) LB- > OS1 1.44a 1.3±2a*LB- > OS1 1.18[0.56]c
LB- > OS1 0.98[0.45]f
(111) GS- > BGS- > BˋGS- > BˋˋGS- > OS1A - > BA - > BˋˋAˋ- > BGS- > B - > OS1GS- > Bˋ - > OS1GS- > Bˋˋ- > OS1
0.44[0.13]0.40[0.09]0.83[0.03]1.56[0.18]0.18[0.09]0.60[0.07]0.09[0.47]0.860.870.87
A- > GSA - > AA- > BB-> OS1A- > B- > OS1A- > GSA- > NA- > N- > AA- > GS- > GS
0.17[0.15]d
0.45d
0.73[0.18]d
0.76[0.86]d
1.31d
0.43[0.38]e
0.77[0.25]e
0.77e
1.17e
e
Surface-subsurface-surface(111) *GS- > A- > B- > Aˋ- > GSˋ 0.82 *GS- > A- > GS- > GS
*GS- > A- > GS- > GS1.17e
0.95de
a Wiltner [7], 0.25 ML, method SEQUEST-PBE/GGA. a* XPS measurements.b Hong [8], method VASP-GGA. #1 jump via triangle centered in 3rd layer, #2 jump via triangle centered in 2nd layer.c Jiang & Carter [10], 0.25 ML carbon coverage, method VASP-PAW/GGA.d Xing-wu [12], 0.25 ML carbon coverage, method VASP-PBE/GGA. In (111): GS z d, A z e, (B or Bˋ) z S1, OS1 z S2.e Riikonen [6], 0.11 ML carbon coverage, method VASP-PBE/GGA. In (100): Hz C-1, Bz C-2; In (110): LBz C-1, SBz C-2; In (111): Az C-1, GSz C-2, Aˋz (saddle of C-2-
> C-2), N is octahedral bulk-like beneath Aˋ.f Sahputra [44], 0.0625 ML, carbon coverage, method VASP-PBE/PAW.
Table 2Distance (Å) of C atomic positions to Fe-surface. If positive, the position is under thesurface, else it is over the surface. “On surf” or “In subsurf” means that more precisedata has not been found but it is known that C is on the surface or into thesubsurface.
Site (100) (110) (111)
EAM DFT Site EAM DFT Site EAM DFT
H �0.27 �0.30a LB �0.79 On surf GS �0.08 On surfB �0.02 On surf TF �0.95 On surf A �0.08 0.33b
Bˋ �0.92 On surf A �0.26 On surf Aˋ �0.61 On surfB 0.56 In subsurfBˋ 0.56 In subsurfBˋˋ 0.73
OS1 1.43 In subsurf OS1 0.91 In subsurf OS1 1.52 In subsurfOS2 2.91 In subsurf OS2 2.09 In subsurf OS2 2.43 In subsurf
a Jiang & Carter [10].b Xing-wu [12].
Fig. 3. Energy barriers are shown as points (blue crosses) and square displacement aslines in each direction for C diffusion over the Fe slab cleaved along the (100) surface.Diffusion along the x-axis stops after C arrives at the surface (black flat line). Theyellow line is the basin threshold used to handle flickers which was set to 0.1 eV. (Forinterpretation of the references to colour in this figure legend, the reader is referred tothe web version of this article.)
O.A. Restrepo et al. / Acta Materialia 136 (2017) 303e314308
possible paths are via states A to Aˋ or B to Aˋ (jump's energies aresummarized in Table 1). Note that the motion via B generatessurface-subsurface-surface diffusion pathways. In general, diffu-sion from unit cell to unit cell is done in two or more steps with an

Fig. 4. a) Top and lateral views of the all C positions visited on the Fe (110) surface and subsurface. b) Diffusion mechanisms from bulk to Fe (110) surface and over surface. The redspheres represent the C atom positions on the surface, i.e. the octahedral site OS1 and OS2; the ground state long bridge site LB; threefold TF and position A. S1 is a saddle point onthe surface at the short bridge SB position and S2 is a saddle point between the subsurface and the surface. The yellow spheres represent Fe atoms at the surface, and the blue ones,Fe atoms at the subsurface; the dashed orange circle represents the Fe new position when C is at the OS1 site. c) Plot of the energy landscape for jumps from subsurface-to surfaceand d) energy landscape for jumps on the surface. The energy is measured with respect to the lowest-energy found in the simulation. (For interpretation of the references to colourin this figure legend, the reader is referred to the web version of this article.)
Fig. 5. Energy barriers are shown as points (blue crosses) and square displacement aslines in each direction for C diffusion over the Fe slab cleaved along the (110) surface;predicted using k-ART at 600 K, surface reached at time t ¼ 32.4 ms? The yellow line isthe basin threshold used to handle flickers, in bulk set to 0.1 eV and in surface reset to2 eV. (For interpretation of the references to colour in this figure legend, the reader isreferred to the web version of this article.)
O.A. Restrepo et al. / Acta Materialia 136 (2017) 303e314 309
effective barrier of 0.82 eV. K-ART also predicts an additionalpathway for C diffusion (also not shown) with a 1.83 eV barrier,much too large to be kinetically relevant at 600 K.
3.4. Diffusion from bulk to the (111) surface
In contrast to the other two surfaces, multiple diffusion pathsfrom the bulk to the (111) surface are possible. Fig. 7 shows top andside views of three different pathways, with their respective en-ergies. Starting by the path shown in Fig. 7a,d, we see that the Catom jumps from an octahedral site OS3 in the fifth layer to a GS onthe surface by crossing three consecutive barriers of 0.79 eV,0.38 eV and 0.1 eV. Similarly for the second path shown in Fig. 7b,e,the C atom jumps from the fifth layer to the surface in four stepswith barriers of 0.74 eV, 0.37 eV, 0.1 eV. In the third path, the Cjumps in four steps with barriers of 0.67 eV, 0.42 eV, 0.03 eV and0.09 eV.
Surface to subsurface diffusion can be obtained as before byreverting the pathways shown in Fig. 7d,e,f while analyzing allpathways, even those that have not been visited but are in the eventcatalog. The dominant jumps here start from the GS to the sub-surface positions B, Bˋ and Bˋˋ with barriers of 0.44 eV, 0.40 eV and0.83 eV respectively. The C atom at the locations B, Bˋ and Bˋˋ

Fig. 6. Minima energy positions found with k-ART on the (111) surface unit cell. Thearrows indicate 3 full paths between two ground states: GS to GSˋ. In red, C atoms atstates GS, A, and Aˋ over the surface and gray C atoms at states B, Bˋ and Bˋˋ in thesubsurface, between the first and second layers. The small dotted circles are somerepresentative saddle points. Yellow represent Fe-atoms in the first layer, blue Fe-atoms in the second layer and orange Fe-atoms in the third layer. (For interpretationof the references to colour in this figure legend, the reader is referred to the webversion of this article.)
O.A. Restrepo et al. / Acta Materialia 136 (2017) 303e314310
distorts the unit cell by displacing the Fe atoms to F, Fˋ and Fˋ po-sitions (Fig. 7a,b,c). These displacements are responsible for thedifference of energies between symmetrical points like B and Bˋ,both located 0.56 Å beneath the surface (the second and third Fe-layers are at 0.8 Å and 1.57 Å). The point Bˋ, 0.73 Å beneath thesurface, appears one step before the C atom jumps from the sub-surface to the surface while the B point appears after the C atom isat surface.
Due to presence of a high number of flickering states, in triangle(1), the simulation was limited to following the C atom movementover a limited number of cells, preventing us from extracting asignificant diffusion coefficient from the square displacement. Fromthe dominant barriers, however, we can conclude that the (111)surface C diffusion coefficient should be of the same order ofmagnitude as that in the bulk because the effective barrier issimilar.
3.5. Catalog generation for C diffusion from bulk to Fe-surfaces
As explained above, k-ART is a powerful technique that createsan on-the-fly reusable event catalog that provides a full descriptionof the energy landscape at each step during the system's evolution.This full catalog is useful to assess the wealth of barriers andpossible events that could be selected at other temperatures. Fig. 8,for example, presents the evolution of the energy landscape as afunction of KMC steps as a single C atom migrates from an inter-stitial site in Fe bulk to the surface. For simplicity, only events with abarrier of 5 eV or less and associated with the C atom are consid-ered, leaving aside, as discussed above, all isolated Fe surface mo-tions. Also, symmetric events are plotted only once in the plots.Plots in Fig. 8 show the distribution of energy barriers (red) and thebarrier energy for the selected event (blue). Most of the time,following Boltzmann's distribution, energy barriers within a fewelectron-volts (around kTz0:051 eV at 600 K) of the minimum-energy diffusion mechanism are selected, even though all barriersare included in the catalog.
In the bulk, the event catalog counts four events, associatedwithequivalent jumps to neighbouring octahedral positions throughtetrahedral sites. The event catalog gets richer once the C atomreaches the surface. In Fig. 8a, a total of six different energy barriersare observed for surface and (100) subsurface jumps. The insetdetail of Fig. 8a around KMC step 355 shows that cell-cell diffusionis done in two steps crossing barriers of 0.8 eV and 1.03 eV; inagreement with what it is explained in Fig. 2. We observe a similarresult for the (110) surface, where k-ART identifies eleven differentenergy barriers (see detail in Fig. 8b at KMC steps 800e815) butwith a maximum of five events per KMC step. These barriers linktwo local energyminimum configurations that can be occupied by aC atom on the perfect (110) surface and one local minimum insubsurface; as explained in Fig. 4. The third catalog analyzed cor-responds to diffusion from bulk to (111) surface. In Fig. 8c, weobserve 13 different energy barriers. As before, most of themcorrespond to flickers and only a few are responsible for diffusionon the surface or to subsurface. A maximum of seven events perstep is observed, showing the relative complexity of this surface.
Barriers of more than 1.5 eV are also observed in the (110) and(111) catalogs, these events correspond to a displacement of the Catom beyond a second neighbor or to subsurface and their occur-rence probability is several orders of magnitude smaller than theselected events at 600 K. The overall information gained from k-ART, in particular the jumps from the surface to the subsurfacecombinedwith our detailed knowledge of the bulk diffusion (whichcounts only four events), ensures that all relevant pathways be-tween the bulk and the surface for the system studied here areidentified. The most relevant of these events are summarized inTable 1 for the three surfaces.
3.6. Comparison to experiments and ab initio calculations
In this paper, we have produced an extensive characterization ofthe energy landscape and diffusion kinetics of C migration in Fesystems with surfaces. Before discussing the physical meaning ofthe results presented here, however, we first compare with previ-ously available DFT and experimental data.
Table 1 displays the barrier energies computed with k-ART-EAMand ab initio results found in the literature. For (100) surface, theminimum B predicted by the EAM approximately corresponds tothe saddle geometrical position predicted by DFT. Similarly, ab-sorption and adsorption sites for (110) surface are in good agree-ment geometrically with the results of DFT [6,10]. In both cases,however, k-ART-EAM predicts a slightly more rugged energylandscape than DFT, with metastable points such as point A, for the(110) surface, that is located below the ground state LB site, andpoint Bˋ on the (100) surface. This difference could be due to anincomplete sampling or finite size effects with DFT or to impreci-sions in the EAM forcefield. More DFT calculations are requiredclarify this question.
For states common to both approaches, there often remainssome energy difference. The 0.58 eV barrier for unit cell to unit celldiffusion on the (100) surface, for instance, is well below thatpredicted by DFT which predict them to be around 0.96e1.21 eV[6,8,10]. In general, for these surfaces, the EAM potential predictsenergy barriers about 30%e40% lower than DFT. However, sincemost of the experimental results in various materials predict afaster surface than bulk diffusion, often by several orders ofmagnitude, effective barriers should be lower at the surface, sup-porting the EAM predictions [43].
On the (111) surface, ab initio results predict three stable ge-ometries for adsorption. This leads to several diffusion paths witheffective barriers from 0.80 eV to 1.17 eV [6,12]. In contrast, the EAMpredicts a total of 6 possible geometries for adsorption: three on the

Fig. 7. a), b), c) Top and side views of the 3 different possible pathways for C diffusion from the bulk to the (111) surface. In gray, C positions in the subsurface and in red on surface. F,Fˋ and Fˋˋ indicate the corresponding Fe-displacements when C are at B, Bˋ and Bˋˋ. The small yellow spheres correspond to the rest of the crystal. d), e), f), energies corresponding tothe three paths represented in a), b) and c). (For interpretation of the references to colour in this figure legend, the reader is referred to the web version of this article.)
O.A. Restrepo et al. / Acta Materialia 136 (2017) 303e314 311
surface plus three more for absorption into the subsurface, thus thenumber of paths increases. Nevertheless, the effective EAM barrierof 0.82 eV is close to the DFT results. Similarly, geometrical loca-tions of A and GS are approximately in agreement with DFT eventhough the latter predicts that A is 0.33 Å below the surface whileEAM finds A 0.08 Å above the surface. This is why Table 1 presentsall the jumps and paths using A as going to the subsurface, as A is a“semi-subsurface” site in DFT. Moreover, the EAM's GS is notaligned with two Fe atoms at the top surface but is barely pushedinto the triangle (1) (compare Figs. 1 and 6). Recent ab initio resultscomputed by Riikonen et al. [6] suggest that the lowest energy stateis A, with GS 0.05 eV higher in energy, while according to the EAMpotential A is 0.27 eV above GS. Finally, DFT identifies Aˋ in thetriangle (2) as a saddle point while in k-ART-EAM it is a minimum.The overall pathway and saddle point correspond relatively, well,nevertheless, as Aˋ is 0.74 eV above the GS.
Authors from Ref. [6] predict that even at a low coverage (0.22ML) of the (110) surface, repulsion between C atoms is strong, butallowing dimer and graphene formation. Besides, they propose thatat higher C concentration, C atoms are pushed out to the vacuum,hence reducing the barrier energy. They found a diffusion barrier of1.21 eV at 0.11 ML which is higher than the 0.96 eV or 1.0 eV pro-posed in Ref. [10] and ref [7]. A more recent DFT calculation using amuch lower coverage of 0.0625 ML [44], predicts a lower barrier of1.08 eV. Besides, with this same coverage DFT predicts also lowerbarriers and inverse barriers of 0.98 [0.45] eV to go into the (110)subsurface, compared to 1.18 eV [10], or 1.44 eV [7]. Coverageobviously affects the barrier and makes comparison between oursimulations, done at very low coverage and in large systems thatdecrease size effects, and DFT difficult.
Table 3 presents the energy difference between configurationswith the C atom on surface and C atom deep into bulk, Ebulk - EGS, as

Fig. 8. Energy barriers, Eb, for C-events contained in the catalog at each KMC-step for diffusion from bulk (gray area) to surfaces. Only events involving C are allowed. The red crossesare the full list of energy barriers available at each step and the blue dots are the energy barriers of the selected C-event. Inset figures show zooms of particular intervals when the Catom is on each surface. (For interpretation of the references to colour in this figure legend, the reader is referred to the web version of this article.)
Table 3Energy difference (in eV) between states of C atom into bulk and on surface, Ebulk -EGS; total effective energy barrier Eeff, for C atom to jump from surface to the bulkbeyond the third layer; and surface energy Esurf (in meV/Å2). Diffusion coefficient inbulk: D ~4.8 � 10e14 m2/s.
Surface Ebulk-EGS Eeff Esurf D
EAM EAM EAM DFT k-ART
(100) ~0.7 ~1.6 109 140a, 156b ~2.2 � 10�14
(110) ~0.4 ~1.2 101 140a, 152b ~7.8 � 10�13
(111) ~0.5 ~1.3 123 160a, 175b
a Riikonen [6].b Chakrabarty [19].
O.A. Restrepo et al. / Acta Materialia 136 (2017) 303e314312
well as the effective energy barrier, Eeff, required for a C atom tomove from the surface to the bulk beyond the third layer as pre-viously described in Figs. 2, 4 and 6 and the surface energies, Esurf. Ineach case the effective barrier Eeff, is larger than the diffusion bar-rier on surface, into subsurface (between first and second layers)and inside the bulk. This clearly indicates that once a first C atomarrives to the surface it should be difficult for it to move into thebulk. The numbers are givenwith only one digit because Ebulk variesaccording to the exact octahedral point close to surface and thatvariation emerges as a consequence that the C atom approximatesto the surface. Esurf also confirms that the (110) surface is the mostunstable, while the (110) surface is the most stable. Diffusion co-efficients are also summarized in Table 3. We emphasize that thesediffusion coefficients are bare approximations and that to havemore precise coefficients more KMC steps are required to enhancethe statistics.
Comparison of similar events in the (100) and (110) systemsevaluatedwith DFT showgood agreement between them. However,
comparisons for the (111) system, both from surface and to sub-surface, show large differences between ab initio calculations. Forexample, Riikonen et al. [6] predict a barrier and reverse barrier of0.43 [0.38] eV at 0.11ML for events like A- > GSwhile Xing-wu et al.[12] predict 0.17 [0.15] eV at 0.25 ML; this difference could be aquestion of coverage. Nevertheless, for all authors the full diffusionpath is with an effective barrier around 0.8e1.17 eV, in goodagreement with the effective barrier found by k-ART of 0.82 eV. Asobserved in Table 1, k-ART has found more minima than all the DFTresults found in the literature. Computations in DFT are limited tothe fact that initial and final minima must be previously known, asthe NEB method is used to get the saddle points. In contrast, k-ARTexplores all possible minima and the uncertainty comes mainlyfrom the empirical potential. The newminima found by k-ART mayvery well be artifacts from the potential and this needs to be furtherinvestigated. Furthermore, we believe that, in general, the largedifferences between DFT results for similar events are due to theDFT calculation settings, for example the carbon coverage andsupercell size used in these calculations. Such problems do not arisein our simulations as k-ART simulations implemented with anempirical potential can be done on large simulation boxes. Inaddition, Ref [6]’s predicts a second diffusion path via the subsur-face with a lower energy barrier of 0.48 eV and Ref [12]’s predictsanother subsurface pathway with a 0.73 eV barrier, after carefulanalysis of the symmetries, we believe that these two barriers areassociated with flickering oscillations rather than to jumps leadingto real diffusion.
Experimental results for the migration energies on any of thesurfaces are not available to our knowledge. Only one paper reportsan energy barrier associated to surface to (110) subsurface diffusionbased on the XPS technique [7]. This experimental energy barrier isconsistent with both DFT and our results.

O.A. Restrepo et al. / Acta Materialia 136 (2017) 303e314 313
Finally, while the mechanisms and the general conclusions forthe three systems should hold generally, note that the surface en-ergies predicted by the EAM potential differ from that obtainedwith DFT by up to ~40%, generally from the low side. This meansthat the real overall insertion rate could be higher than found here.
4. Discussion
Accessing large time scale and system sizes, k-ART simulationspresented here provide a detailed characterization of the C kineticsbetween Fe surfaces and bulk and the associated energy land-scapes, showing a relatively complex picture even for the simplestof surfaces. This picture is well characterized with k-ART, since thecatalog is updated and expended at every step, as new topologiesare explored.
For Fe(100), for example, two dominant pathways are found forC surface diffusion, one going slightly above the surface, with a netbarrier of 1,04 eV, one slightly below, preferred with a 0,80 eVbarrier. While additional pathways also exist in subsurface, they areunlikely since interstitial positions inside the Fe are much costlierthan at the surface and the asymmetric barriers favor expulsion ofthe impurity.
Fe(110) is slightly rougher, and C diffusion in a three-step pro-cess, crossing first two low barriers, before jumping over a 0.58 eVbarrier, that dominates the kinetics. While diffusion into the bulk iseasier from this surface, with a net barrier of about 1.25 eVcompared with 1.63 eV for (100), even at 600 K, this path is rarelysampled.
For both of these surfaces, we find a single pathway for inser-tion, as all sites below surface have the same symmetry. This is notthe case for Fe(111) which shows a much richer energy landscapedue to its lower density packing. Surface diffusion can take placethrough six different pathways, with one going fully through sub-surface. In spite of this richness, surface diffusion kinetics is com-parable to Fe(100), with minimum effective barriers of 0.82 eV.
As interesting, however, is the existence of three differentrelevant insertion pathways from this surface associated withdifferent entry points. While, the net effective barrier to the bulk isalmost identical for these three mechanisms, their existence mightaffect C diffusion in the presence of impurities, for example.
As indicated in the results section, we focus our discussion onthe most probable mechanisms. Other C diffusion mechanisms,with barriers between 1.3 and 1.8 eV are also identified with k-ART.Since these are much rarer, however, we did not discuss them herein details, but the presence of strain, defects or other impuritiescould lower the barrier and make them relevant.
Our simulations also suggest that crystalline Fe plays little rolein C diffusion. Indeed, while pure Fe diffusion was not allowed, Fesituated in the vicinity of the C atom were allowed to partake intoevents and even dominate the move. Yet, such events involve highbarriers and do not contribute to C diffusion suggesting that for aperfect crystal, C diffusion takes place mostly without disturbingthe lattice, even at surfaces.
As discussed in the previous section, results obtained here usingEAM potential are in general agreement with experiments and DFTcalculations. Using larger cells, to decrease finite-size effects, andoffering an extensive characterization of the energy landscape,however, these simulations offer a more complete picture of Cdiffusion at the surface and into the bulk and demonstrate the needfor defects and other impurities to facilitate C insertion into Fe.
5. Conclusion
A characterization of the C atom diffusion from the bulk to thethree crystalline bcc iron surfaces e (100), (110) and (111) e has
been done using k-ART implemented with an EAM potential. Themore complete energy landscape generated here and obtainedwithsimulations that reached several milliseconds allows us to identifynew mechanisms for C diffusion from bulk to the surfaces and onthe surfaces.
The C most stable configurations at the three Fe-surfaces are ingood agreement with the predictions of DFT even though barrierenergies differ by up to 40%. The agreement is even better for theenergy barriers corresponding to surface to subsurface diffusionwith a difference about 20% or less compared to DFT. This differencemeans that our simulations tend to predict lower insertion ratesand favor surface diffusion, in agreement with experimental ob-servations for the (110) surface, suggesting that DFT's results mightsuffer from possible biases of DFT, linked in particular to finite sizeeffects, that lead to incorrect barriers. Moreover, our approachprovides a detailed and reliable representation of the diffusionpaths from surface to subsurface, including rare pathways that areorders of magnitude less likely to occur in pure Fe than the domi-nant ones. This allows us to conclude that, at 600 K, (100) and (110)will show unique diffusion paths while (111) should present morecomplex, multistep, multipathway diffusion mechanisms.
The effective barrier Eeff, of ~1.6, ~1.2 and ~1.3 predicted by k-ARTfor diffusion from surface to the bulk inside are larger than (1) thediffusion barrier on surfaces, (2) into subsurface and (3), inside thebulk, which clearly indicates that once a first C atom arrives to thesurface it should be difficult for it to move into the bulk. Byproviding an extensive characterization of the CeFe landscape,these results also indicate that further study in the presence ofdefects and additional impurities are therefore needed to establishC insertion mechanism.
Overall, these results provide a much deeper understanding of Cdiffusion and insertion in bulk bcc iron. They also demonstrate theneed for unbiased and extensive approaches for sampling the en-ergy landscape and diffusion mechanisms of even apparentlysimple systems such as a single C in iron. A need that is even moreimportant whenwemove to themore complex environments, withdefects and impurities, that seem necessary to see C diffusing intobulk Fe.
Acknowledgements
This work is supported by the Qatar National Research Fund(QNRF) through the National Priorities Research Program (NPRP 6-863-2-355). This work was also supported in part by grants fromthe Natural Sciences and Engineering Research Council of Canada(NSERC). We are grateful to Calcul Qu�ebec/Compute Canada (CQ/CC) for generous allocations of computer resources. The k-ARTpackage is available for distribution by contacting the authors.
References
[1] G.Y. Lai, High-temperature Corrosion and Materials Applications, ASM Inter-national, 2007. Chapter 5, Carburization and Metal dusting, page 97. ISBN1615030557, 9781615030552, Length 461 pages.
[2] R.B. Anderson, The Fischer-tropsch Synthesis, Academic Press, New York,1984.
[3] P. Yvon, F. Carr�e, Structural materials challenges for advanced reactor systems,J. Nucl. Mater. 385 (2009) 217.
[4] N.A. Vinogradov, A.A. Zakharov, V. Kocevski, J. Rusz, K.A. Simonov, O. Eriksson,A. Mikkelsen, E. Lundgren, A.S. Vinogradov, N. Mårtensson, A.B. Preobrajenski,Formation and structure of graphene waves on Fe(110), Phys. Rev. Lett. 109(2012) 026101.
[5] A.J. Page, F. Ding, S. Irle, K. Morokuma, Insights into carbon nanotube andgraphene formation mechanisms from molecular simulations: a review, Rep.Prog. Phys. 78 (2015) 036501.
[6] S. Riikonen, A.V. Krasheninnikov, R.M. Nieminen, Submonolayers of carbon ona-Fe facets: an ab initio study, Phys. Rev. B 82 (2010) 125459.
[7] A. Wiltner, Ch. Linsmeier, T. Jacob, Carbon reaction and diffusion on Ni(111),Ni(100), and Fe(110): kinetic parameters from x-ray photoelectron

O.A. Restrepo et al. / Acta Materialia 136 (2017) 303e314314
spectroscopy and density functional theory analysis, J. Chem. Phys. 129 (2008)084704.
[8] S. Hong, Surface energy anisotropy of iron surfaces by carbon adsorption, Curr.Appl. Phys. 3 (2003) 457.
[9] X.W. Liu, C.F. Huo, Y.W. Li, J. Wang, H. Jiao, Energetics of Carbon deposition onFe(100) and Fe(110) surfaces and subsurfaces, Surf. Sci. 606 (2012) 733.
[10] D.E. Jiang, E.A. Carter, Carbon atom adsorption on and diffusion into Fe(110)and Fe(100) from first principles, Phys. Rev. B 71 (2005) 045402.
[11] D.J. Young, J. Zhang, Understanding metal dusting mechanisms, ECS Trans. 16(3) (2009).
[12] L. Xing-wu, L. Yong-wang, W. Jian-guo, H. Chun-fang, Energetics of Carbondeposition on Fe(100) and Fe(110) surfaces and subsurfaces, J. Fuel Chem.Technol. 40 (2012) 202.
[13] H.J. Grabke, G. Tauber, H. Viefhaus, Equilibrium surface segregation of carbonon iron (100) faces, Scr. Metall. 9 (1975) 1181.
[14] H.J. Grabke, G. Tauber, H. Viefhaus, Equilibrium surface segregation of dis-solved nonmetal atoms on iron(100) faces, Surf. Sci. 63 (1977) 377.
[15] W. Arabczyk, F. Storbeck, H.J. Müssig, Electron spectroscopy studies on carbonsegregation from a mono-crystalline a-Fe(111) specimen, Appl. Surf. Sci. 65/66 (1993) 94.
[16] W. Arabczyk, D. Moszy�nski, U. Narkiewicz, The comparison of the differentadsorption states of non-metals on the iron surface, Vacuum 54 (1999) 3.
[17] G. Henkelman, H. Jonsson, A climbing image nudged elastic band method forfinding saddle points and minimum energy paths, J. Chem. Phys. 113 (2000)9901.
[18] G. Henkelman, H. Jonsson, Improved tangent estimate in the nudged elasticband method for finding minimum energy paths and saddle points, J. Chem.Phys. 113 (2000) 9978.
[19] A. Chakrabarty, O. Bouhali, N. Mousseau, C. Becquart, F. El-Mellouhi, Insightson finite size effects in ab initio study of CO adsorption and dissociation on Fe110 surface, J. Appl. Phys. 120 (2016) 055301.
[20] A. Chakrabarty, O. Bouhali, N. Mousseau, C. Becquart, F. El-Mellouhi, Influenceof surface vacancy defects on the carburisation of Fe 110 surface by carbonmonoxide, J. Chem. Phys. 145 (2016) 044710.
[21] N. Mousseau, L.K. B�eland, P. Brommer, F. El-Mellouhi, J.F. Joly, G.K. N'Tsouaglo,O. Restrepo, M. Trochet, Following atomistic kinetics on experimental time-scales with the kinetic ActivationeRelaxation Technique, Comput. Mater. Sci.100 (2015) 111.
[22] P. Brommer, N. Mousseau, Comment on “mechanism of void nucleation andgrowth in bcc Fe: atomistic simulations at experimental time scales, Phys. Rev.Lett. 108 (2012) 219601.
[23] A.F. Voter, Classically exact overlayer dynamics: diffusion of rhodium clusterson Rh(100), Phys. Rev. B 34 (1986) 6819.
[24] A. Voter, Introduction to the kinetic monte carlo method, Radiat. Eff. Solids235 (2007) 1.
[25] C. Becquart, J. Raulot, G. Bencteux, C. Domain, M. Perez, S. Garruchet,H. Nguyen, Atomistic modeling of an Fe system with a small concentration ofC, Comput. Mater. Sci. 40 (1) (2007) 119.
[26] R. Veiga, C. Becquart, M. Perez, Comments on “Atomistic modeling of an Fesystem with a small concentration of C”, Comput. Mater. Sci. 82 (2014) 118.
[27] F. El-Mellouhi, N. Mousseau, L.J. Lewis, Kinetic activation-relaxation tech-nique: an off-lattice self-learning kinetic Monte Carlo algorithm, Phys. Rev. B78 (2008) 153202.
[28] L.K. B�eland, P. Brommer, F. El-Mellouhi, J.F. Joly, N. Mousseau, Kineticactivation-relaxation technique, Phys. Rev. E 84 046704 (2011).
[29] B.D. McKay, Practical graph isomorphism, Congr. Numer. 30 (1981) 45.[30] B.D. McKay, A. Piperno, Practical graph isomorphism, II, J. Symb. Comput. 60
(2014) 94.[31] G. Barkema, N. Mousseau, Event-based relaxation of continuous disordered
systems, Phys. Rev. Lett. 77 (1996) 4358.[32] R. Malek, N. Mousseau, Dynamics of Lennard-Jones clusters: a characterization
of the activation-relaxation technique, Phys. Rev. E 62 (2000) 7723.[33] E. Machado-Charry, L.K. B�eland, D. Caliste, L. Genovese, T. Deutsch,
N. Mousseau, P. Pochet, Optimized energy landscape exploration using the abinitio based activation-relaxation technique, J. Chem. Phys. 135 (2011)034102.
[34] B. Puchala, M.L. Falk, K. Garikipati, An energy basin finding algorithm for ki-netic Monte Carlo acceleration, J. Chem. Phys. 132 (2010) 134104.
[35] M. Mendelev, S. Han, D. Srolovitz, G. Ackland, D. Sun, M. Asta, Development ofnew interatomic potentials appropriate for crystalline and liquid iron, Philos.Mag. 83 (2003) 3977.
[36] C. Domain, C.S. Becquart, Ab initio study of foreign interstitial atom (C, N)interactions with intrinsic point defects in a-Fe, J. Foct, Phys. Rev. B 69 (2004)144112.
[37] R.G.A. Veiga, M. Perez, C.S. Becquart, C. Domain, Atomistic modeling of carbonCottrell atmospheres in bcc iron, J. Phys. Condens. Matter 25 (2013) 025401.
[38] N. Gunkelmann, H. Ledbetter, H.M. Urbassek, Experimental and atomisticstudy of the elastic properties of a0 FeeC martensite, Acta Mater. 60 (12)(2012) 4901.
[39] R. Veiga, M. Perez, C. Becquart, E. Clouet, C. Domain, Comparison of atomisticand elasticity approaches for carbon diffusion near line defects in a-iron, ActaMater. 59 (2011) 6963.
[40] S. Plimpton, Fast parallel algorithms for short-range molecular dynamics,J. Comput. Phys. 117 (1995) 1.
[41] Lammps web site. http://lammps.sandia.gov/index.html.[42] O.A. Restrepo, N. Mousseau, F. El-Mellouhi, O. Bouhali, M. Trochet,
C.S. Becquart, Diffusion properties of FeeC systems studied by using kineticactivationerelaxation technique, Comput. Mater. Sci. 112 (2016) 96.
[43] Helmut Mehrer, Diffusion in Solids Fundamentals, Methods, Materials,Diffusion-controlled Processes, Springer Berlin Heidelberg, New York, 2007.
[44] I.H. Sahputra, A. Chakrabarty, O. Restrepo, O. Bouhali, N. Mousseau,C.S. Becquart, F. El Mellouhi, Carbon adsorption on and diffusion through theFe(110) surface and in bulk: developing a new strategy for the use ofempirical potentials in complex material set-ups, Phys. Status Solidi B (2016)1e11.