differing neuropsychological and neuroanatomical ......differing neuropsychological and...
TRANSCRIPT
Neuropsychologia 43 (2005) 833–846
Differing neuropsychological and neuroanatomical correlates ofabnormal reading in early-stage semantic dementia and dementia
of the Alzheimer type
Brian T. Golda,b,e,∗, Dave A. Balotab, Michael J. Cortesef, Susan D. Sergent-Marshallb,Abraham Z. Snyderc, David H. Salatg, Bruce Fischlg,h, Anders M. Daleg,h,
John C. Morrisd, Randy L. Bucknerb,c,e
a Department of Anatomy and Neurobiology, University of Kentucky, MN214 Chandler Medical Center, Lexington, KY 40536-0298, USAb Department of Psychology, Washington University, St. Louis, MO, USA
c Departments of Radiology, and Anatomy and Neurobiology, Washington University, St. Louis, MO, USAd Department of Neurology, Washington University, St. Louis, MO, USA
e Howard Hughes Medical Institute, USAf Department of Psychology, College of Charleston, Charleston, SC, USA
g MGH/MIT/HMS Athinoula A. Martinos Center for Biomedical Imaging, Department Radiology, MGH, Charlestown, MA, USAh MIT Artificial Intelligence Laboratory, MIT, Cambridge, MA, USA
A
er type( vided ap naming,a to informm prolongedl for the SDg gs suggesta in the leftt©
K
1
p(sh
cttz,rgetrtantcantia,
ingbes
0d
Received 5 February 2004; received in revised form 18 August 2004; accepted 1 October 2004
bstract
Individuals with semantic dementia (SD) were differentiated neuropsychologically from individuals with dementia of the AlzheimDAT) at very mild-to-mild stages (clinical dementia rating 0.5 or 1). A picture naming and recognition memory experiment proarticularly useful probe for early identification, with SD individuals showing preserved picture recognition memory and impairednd DAT individuals tending to show the reverse dissociation. The identification of an early SD group provided the opportunityodels of reading by exploring the influence of isolated lexical semantic impairment on reading regular words. Results demonstrated
atency in both SD and DAT group reading compared to a control group but exaggerated influence of frequency and length onlyroup. The SD reading pattern was associated with focal atrophy of the left temporal pole. These cognitive-neuroanatomical findinrole for the left temporal pole in lexical/semantic components of reading and demonstrate that cortical thickness differences
emporal pole correlate with prolonged latency associated with increased reliance on sublexical components of reading.2004 Elsevier Ltd. All rights reserved.
eywords:Semantic dementia; Alzheimer’s; Frontotemporal dementia; Reading; Recognition memory
. Introduction
Semantic dementia (the temporal variant of frontotem-oral dementia; FTD) and dementia of the Alzheimer typeDAT) are clinically overlapping diseases sharing featuresuch as insidious onset and gradual deterioration of compre-ension and word finding ability, among other impairments.
∗ Corresponding author. Tel.: +1 859 323 4813; fax: +1 859 257 6700.E-mail address:[email protected] (B.T. Gold).
Despite clinical similarities, SD is pathologically distinfrom DAT (Hodges, Garrard, & Patterson, 1998; Neary eal., 1998; see alsoKertesz, Hudson, Mackenzie, & Muno1994). Because treatments are increasingly likely to taspecific neurodegenerative mechanisms, it is impoto determine whether neuropsychological markersdifferentiate SD from DAT early in the course of demenwhen intervention may be most effective.
Semantic dementia (SD) is the variant of FTD involvinitially focal degeneration of one or both temporal lo
028-3932/$ – see front matter © 2004 Elsevier Ltd. All rights reserved.oi:10.1016/j.neuropsychologia.2004.10.005
834 B.T. Gold et al. / Neuropsychologia 43 (2005) 833–846
(Hodges, Patterson, Oxbury, & Funnell, 1992; Neary etal., 1998; Snowden, Goulding, & Neary, 1989; see alsoWarrington, 1975). SD is similar to the fluent variety of pri-mary progressive aphasia (Mesulam, 1982) with additionalimpairment of non-verbal semantic knowledge (Hodges etal., 1992; Mesulam, 2001). Distinguishing early forms ofSD from DAT neuropsychologically presents a challenge be-cause DAT can also involve deficits on semantic processingtasks (Huff, Corkin, & Growden, 1986; Kertesz, Appell, &Fisman, 1986; Martin & Fedio, 1983) even relatively earlyin the disease (Chertkow & Bub, 1990; Hodges & Patterson,1995). Similarly, although episodic memory impairment isa hallmark of early DAT, simple tests of verbal episodicmemory such as logical paragraph recall cannot distinguishbetween the two dementias because both types of patientsperform poorly, SD patients due primarily to impairedlanguage and DAT patients due primarily to impaired mem-ory (Hodges et al., 1999). Importantly, though, semanticimpairment is variable in early DAT (Hodges & Patterson,1995) and visuospatial and attentional-executive functioningare preserved in early SD (Hodges et al., 1992; Neary et al.,1998), suggesting that SD and DAT can be distinguishedearly in the dementia process. For example,Hodges et al.(1999) found that a relatively early SD group (mean mini-mental state exam (MMSE) = 20) was distinguished from ane terp
d inS cente es ispH ges,2 ,2 ingd hisa am-i andD oryi s ev-i tionm plen ic-t ctedt
theo thei ad-i ces.I ingi r-s& noi 4,2 ah mayp that
may exist in reading regular words in early SD and DAT. Inparticular, the apparently graded degrees of lexical seman-tic memory retention between healthy older individuals (re-tained), individuals with DAT (less retained), and individualswith SD (least retained), raises interesting questions aboutpotential for differing influences of lexical and sublexicalvariables in reading between groups. Such effects have thepotential to inform models of reading.
Finally, to identify neuroanatomical correlates of poten-tially differing reading patterns between groups, structuralMRI was conducted and automated brain volume analysesand a sensitive cortical thickness technique were used to com-pare group differences in brain volume and local mean cor-tical thickness in vivo (Dale, Fischl, & Sereno, 1999; Fischl& Dale, 2000; Fischl, Liu, & Dale, 2001; Fischl, Sereno, &Dale, 1999a; Fischl, Sereno, Tootell, & Dale, 1999b).
2. Methods
2.1. Subjects
Three groups consisting of a total of 30 individuals par-ticipated in the study: six with early SD (four males and twofemales), 10 with early DAT (seven males and three females)a bjectsw er’sD pres-s ribedp rei ly,p nentw ont s ofd -t antici ,S
ad-m nal(c enti okena tterno t ob-j ands l andn erem en-t r ageo -d atientg DATw l In-s andS rders
arly DAT group (mean MMSE = 23) by significantly beterformance on a test of picture reproduction.
A related cognitive domain, which may be preserveD compared to DAT is picture recognition memory. Revidence suggests that recognition memory for picturreserved in the majority of SD patients (Graham, Becker, &odges, 1997; Graham, Simons, Pratt, Patterson, & Hod000a; Simons, Graham, & Hodges, 2002a; Simons et al.002b). This stands in contrast to the marked picture nameficits in SD relative to DAT. An outstanding issue in trea involves the timing of the emergence of the picture n
ng/recognition memory double dissociation between SDAT. If naming is impaired and picture recognition mem
s preserved in early SD, and the reverse dissociation ident in early DAT, then tests of picture naming/recogni
emory might provide an important and relatively simeuropsychological tool aiding differential diagnosis. A p
ure naming/recognition memory experiment was conduo explore this issue.
The identification of an early SD group providedpportunity to inform models of reading by exploring
nfluence of isolated lexical semantic impairment on reng words with regular spelling-to-sound correspondenndividuals with SD show marked impairment in readrregular words (e.g.,glove) (Graham, Hodges, & Patteon, 1994; Graham, Patterson, & Hodges, 2000b; PattersonHodges, 1992), but the available data indicate little or
mpairment in reading regular words (Graham et al., 199000b; Patterson & Hodges, 1992). Little research in this areas examined latencies of SD reading (naming). Latencyrovide a sensitive index of subtle reading abnormalities
nd 14 non-demented (eight males and six females). Suere recruited from the Washington University’s Alzheimisease Research Center (ADRC) and screened for deion, severe hypertension and other medical factors descreviously (Berg et al., 1998). Potential SD subjects we
dentified either clinically or psychometrically. Clinicalotential SD subjects were identified as having promiord finding difficulty, relative preservation of orientati
o time and place, and relative maintenance of activitieaily living (Hodges et al., 1992). Psychometrically, poten
ial SD subjects were identified as having probable semmpairment via general ADRC test scores (Cortese, Balotaergent-Marshall, & Buckner, 2003).A specially designed neuropsychological battery was
inistered to identify those individuals meeting origiHodges et al., 1992) and consensus (Neary et al., 1998) in-lusion and exclusion criteria for SD; namely, impairmn semantic memory causing anomia and deficits of spnd written single word comprehension, a reading paf surface dyslexia, and impoverished knowledge abou
ects and/or people with relative sparing of phonologicalyntactic components of speech output, and perceptuaon-verbal problem solving skills. Early DAT subjects watched approximately with the SD group for global dem
ia severity and years of education. SD has an earlief onset than DAT (Neary et al., 1998). Therefore, in orer to recruit representative samples of each group, proups were not matched for age. Diagnosis of probableas made according to criteria developed by the Nationatitute of Neurological and Communicative Disorderstroke and the Alzheimer’s Disease and Related Diso
B.T. Gold et al. / Neuropsychologia 43 (2005) 833–846 835
Association (McKhann et al., 1984). Convergent estimatesof global dementia severity were sought through scores onthe clinical dementia rating (CDR;Morris, 1993), the MMSE(Folstein, Folstein, & McHugh, 1975) and whole-brain vol-ume based on MRI. Control subjects were matched approx-imately with the patient groups for years of education andmatched with the DAT group for age. Written informed con-sent was obtained from all subjects in the study, which wasapproved by the Human Studies Committee of WashingtonUniversity.
3. Identifying semantic dementia
3.1. Multimodal semantic assessment
A battery of tests was used to assess semantic knowledgeacross input and output modalities and verbal and pictorialdomains (similar toChertkow & Bub, 1990; Hodges et al.,1992). A core component of the battery was a set of 64 linedrawings from theSnodgrass and Vanderwart (1980)corpus,normed for frequency and prototypicality across six seman-tic categories: animals, birds, fruit, household items, tools,and vehicles (Bozeat, Lambon Ralph, Patterson, Garrard, &Hodges, 2000). The following tests were conducted using thes
1 pos-
23 rre-
ning
4 ri-ortedrep-s ofan-holdthe
e po-
ncy[ E);G st( -s1 ub-l owl-e s test(
3
ctionf ency
and auditory comprehension, respectively. Verbal output wasrated for melodic line, phrase length, articulatory agility andgrammatical form.
3.3. Visuospatial and attentional-executive functionassessment
Measures used to assess visuospatial skills were Raven’sColored Progressive Matrices (Raven, 1995), block designfrom the WAIS (Wechsler, 1955) and various subtestsfrom the Visual Object and Space Perception battery(Warrington & James, 1991). Measures used to assessattentional-executive function were the digit symbol subtestfrom the WAIS, the digit span subtests from the WechslerMemory Scale (Wechsler & Stone, 1973), and the trails tests(Armitage, 1945).
3.4. Analyses
The goal of analyses was to identify individuals meet-ing consensus criteria for SD. Scores on all tests were firstconverted toz-scores for all subjects relative to the mean ofthe controls. Individualz-scores were then averaged acrossa number of cognitive domains to obtain reliable compositescores for lexical semantic, pictorial semantic, visuospatial,a ains.S tiala eech(S rn ofs vi-s tivet im-p sioni ed fort d fora
3r
cts( tionm of the6 nt w-i sksw ed inw sawe orym e-by-s d ran-d ere6p werem y and
et of 64 normed items:
. Category fluency: producing as many exemplars assible in 1 min/category.
. Naming of all 64 line-drawings without cueing.
. Word-to-picture matching: pointing to the drawing cosponding to a spoken word from picture arrays containine within-category foils.
. Picture sorting: sorting of individual cards into vaous superordinate categories. First, all cards were sinto piles of natural and human-made things. Cardsresenting natural things were then sorted into pileanimals/birds/fruit. Finally, cards representing hummade things were sorted into piles of tools/houseitems/vehicles. Sheets with written labels reflectingdesired sort (i.e., natural and human-made, etc.) wersitioned in front of subjects during each sort.
Additional tests of semantics included animal fluefrom the Boston Diagnostic Aphasia Examination (BDAoodglass & Kaplan, 1983], the Boston Naming Te
Kaplan, Goodglass, & Weintraub, 1983), the American Verion of Nelson Adult Reading Test (Grober & Sliwinski,991), and a Synonym Test (Lambon Ralph et al., unp
ished). As an additional test of non-verbal semantic kndge, the picture version of the Pyramids and PalmtreeHoward & Patterson, 1992) was administered.
.2. Fluency and comprehension assessment
The cookie theft picture and the comprehension serom the BDAE were administered to assess verbal flu
ttentional-executive, speech and comprehension domD is known to involve relative preservation of visuospand attentional-executive function as well as fluent spHodges et al., 1992; Snowden et al., 1989). Individuals withD were therefore identified as demonstrating a pattecores reflecting: lexical semantics impaired relative touospatial functioning; lexical semantics impaired relao attentional-executive functioning; pictorial semanticsaired relative to visuospatial functioning; comprehen
mpaired relative to speech fluency. Results are presenthose individuals meeting consensus criteria for SD anll DAT and control subjects.
.5. Experiment 1: picture naming and pictureecognition memory
Five of the six SD individuals and all other subje10 DAT and 14 control) completed the naming/recogniemory experiment. Subjects were asked to name each4 Snodgrass and Vanderwart (1980)line drawings used i
he semantic battery without cueing. Thirty minutes follong the naming task (during which time non-pictorial taere given) a surprise recognition test was administerhich subjects were asked to point to the drawing theyarlier during the naming task from among two categatched foils. The three drawings were presented sid
ide on a single card. Targets were 32 drawings selecteomly from the items used in the naming test. Foils w4 drawings from theSnodgrass and Vanderwart (1980)cor-us that were not part of the semantic test battery andatched with targets for superordinate semantic categor
836 B.T. Gold et al. / Neuropsychologia 43 (2005) 833–846
frequency. Positioning of target items among foils was coun-terbalanced across three spatial positions on pictorial arrays.Orientation of all drawings was identical to target orientationat naming. Drawings were scaled to half the size of thoseused for the naming task.
3.6. Experiment 2: word naming
Nine of the 10 DAT individuals and all other subjects(six SD and 14 control) completed the word naming ex-periment. The word naming experiment was part of an ex-periment examining potential semantic priming differencesbetween groups. The word naming component of the prim-ing experiment required subjects to read the second word inprime–target pairs. This manipulation allowed for computa-tion of naming accuracy and latency to be examined acrosstargets and as a function of specific target properties (e.g.,length and frequency). Latencies were also computed basedupon prime–target relationships. However, the priming ma-nipulation yielded largely null findings, so results will onlybe presented for target word naming, which yielded robustbetween-group results. The experiment was controlled by aPC with a 133 MHz processor running in DOS mode. The17 in. monitor was set to 40-column mode for the presenta-tion of stimuli. A voice key (Gerbrands G1341T) was con-n nciest ds ofm rds,K t-t erei tingt me-t y,L
f theC und.T The3 rials.S andr sible.E int weda y thet tiono d thet noiset ther eent
3
per-f en,G× ired
per participant (TR = 9.7 ms, TE = 4 ms, flip angle = 10◦,TI = 20 ms, TD = 200 ms). Scans were motion corrected andaveraged, yielding a single image volume with high contrast-to-noise ratio, enabling quantitative characterization. AllMRI scans were conducted within 6 months of neuropsy-chological testing and experiments.
3.8. Hemispheric brain volume
Single within-participant averaged volumes were inter-polated to 1-mm isotropic voxels within the atlas space ofTalairach and Tournoux (1988). The atlas target consistedof merged young adult/older adult template that accommo-dates participant atrophy. Registration was verified for eachindividual. An automated procedure then was used to seg-ment each participant’s image volume into cerebrospinal fluid(CSF), grey matter and white matter classes (computed sep-arately for whole-brain and hemispheres) using the signalintensity histogram (Snyder, Sanders, Linenweber, Morris,& Buckner, 2000). Hemispheric brain volume percentageswere then calculated for each participant as grey and whitematter voxels divided by total within-hemisphere voxels (in-cluding CSF). Brain volume percentages were scaled to thevolume of the atlas mask to compensate for individual headsize. This normalization procedure is proportionate to nor-m satef
3
d toi essi d us-i (e 1S ea-s .,2t agev in-f xelsw e pials sen-tt andc cor-t orti-c ss toaF ted’s ,1 ce,i
ted ate d thata olo-
ected to the PC’s real-time clock to collect response lateo the nearest ms. Targets were 162 monosyllable woroderately high-frequency (mean = 140.6 per million woucera & Francis, 1967) with a mean length of 4.13 le
ers. An additional 138 multisyllabic prime–target pairs wncluded but not considered further due to difficulty rahem for regularity. All targets contained regular grapheo-phoneme correspondences (c.f.,Coltheart, Rastle, Perrangdon, & Ziegler, 2001).
Stimuli were presented one at a time at the center oRT in white lowercase letters against a black backgrohe experiment consisted of two blocks of 150 trials.00 experimental trials were preceded by 10 practice tubjects were asked to pay attention to the first word
ead the second word as quickly and accurately as posach trial began with a fixation mark (+) appearing
he center of the screen for 2000 ms. The prime follond appeared for 200 ms. The prime was replaced b
arget, which remained on the screen until the initiaf the reading response. The experimenter then code
rial as correct, incorrect, or noise (some extraneousriggered the voice key or it failed to be triggered byeading response). A 2000 ms interval occurred betwrials.
.7. Structural magnetic resonance imaging
Structural magnetic resonance imaging (MRI) wasormed on a Siemens 1.5 T Vision System (Erlangermany). Between 2 and 4 high-resolution (1 mm× 1 mm1.25 mm) T1-weighted MP-RAGE scans were acqu
alization based on total intracranial volumes to compenor differences in head size (Buckner et al., 2004).
.9. Cortical thickness based on MRI
A sensitive cortical thickness analysis was employedentify potentially small reductions in grey matter thicknn early dementia groups. Cortical thickness was deriveng a series of procedures described in detail elsewhereDalet al., 1999; Fischl & Dale, 2000; Fischl et al., 1999a, b, 200;alat et al., 2004) and validated against both manual murement from MRI patient populations (Kuperberg et al003) and histology (Rosas et al., 2002). Briefly, white mat-
er voxels within each participant’s three-dimensional imolume were first classified using intensity and continuityormation. The surface of the connected white-matter voas then deformed and inflated to locate the approximaturface and this information was refined to obtain a repreation of grey-white matter boundary (Dale et al., 1999). Dis-ance between representations of grey-white boundaryortical surface was calculated at each point across theex to produce representations of cortical thickness (cal thickness maps). Interpolation is used in this procechieve subvoxel (below 1 mm) accuracy (Dale et al., 1999).inally, thickness measures were mapped on the ‘inflaurface of each subject’s reconstructed brain (Fischl et al.999a), allowing visualization of the entire cortical surfa
ncluding sulcal regions.Mean group cortical thickness estimates were compu
ach point on the reconstructed surfaces using a methopplies a series of steps to match morphologically hom
B.T. Gold et al. / Neuropsychologia 43 (2005) 833–846 837
gous cortical locations across subjects (Fischl et al., 1999a).The method involved smoothing reconstructed surface mapsusing a symmetric Gaussian kernel with a standard devia-tion of 22 mm and then averaging across subjects using anon-rigid high-dimensional spherical method, which alignscortical folding patterns (Fischl et al., 1999a). Group corti-cal thickness estimates were compared statistically using animplementation of the general linear model computed on thesurface map data examining the effect of group on thicknessat each vertex across the cortical mantle.
4. Results
Mean demographic information and scores representingestimated global dementia severity for SD, DAT and controlgroups are listed inTable 1. ANOVA revealed no signifi-cant age differences between the three groups (F(2,27)= 2.13,P= 0.14). The SD group was significantly younger than theDAT group (t(14) = 2.49,P< 0.05). DAT and control groups
Table 1Mean demographic and general dementia severity data at the time of imaging
Variable Control,n= 14 DAT,n= 10 SD,n= 6 ANOVA,P-value
Males/females 8/6 7/3 4/2Age 74.1 (9.0) 76.6 (5.7) 68.8 (6.5) 0.14*
Education 14.5 (2.6) 14.5 (3.2) 13.8 (2.0) nsMMSE 29 (1.1) 25 (4.7) 23 (1.7) <0.001a
CDR All 0 8 0.5/2 1 5 0.5/1 1
Notes: Standard deviations are in parentheses.∗ SD group significantly younger than DAT group (P< 0.05).a SD and DAT groups both significantly worse than control group
(P< 0.01) but not different from each other. ns: not significant.
did not differ in age (P= 0.46). The three groups werematched for level of education. Patient groups were matchedfor general global severity of dementia as measured by boththe CDR and the MMSE. Although neither measure providesan absolute index of dementia severity across different de-mentia subtypes, taken together they suggest similar levelsof (mild) global dementia severity across groups.
F(ta
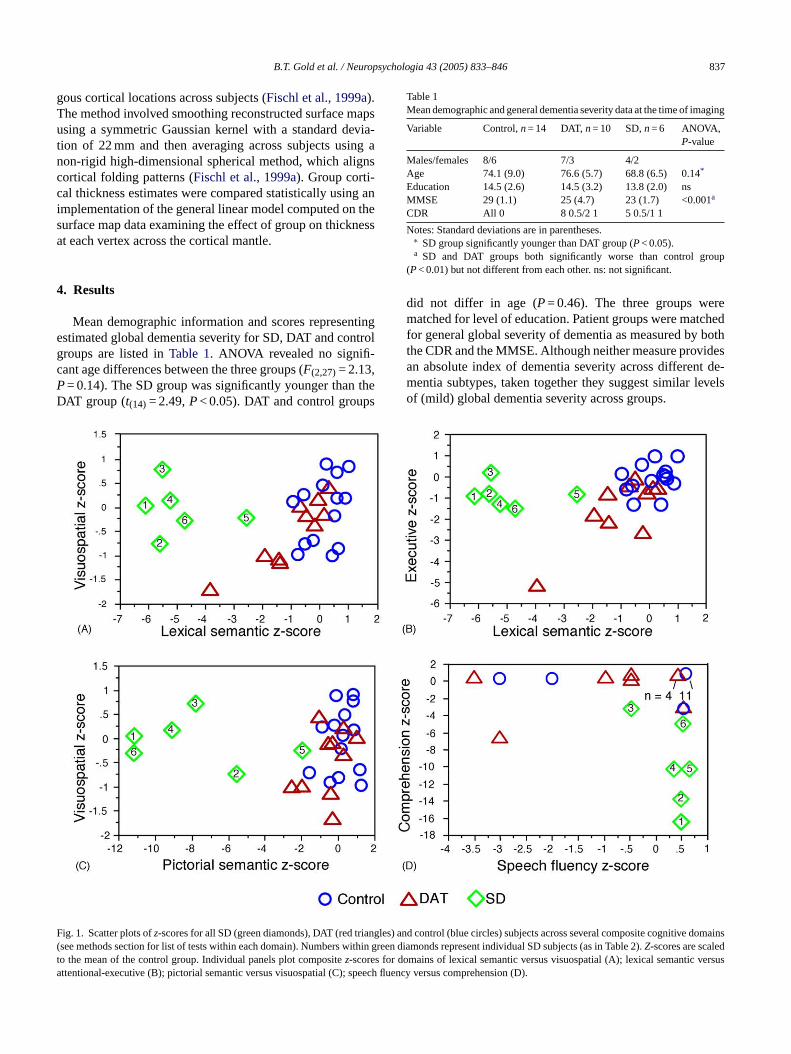
ig. 1. Scatter plots ofz-scores for all SD (green diamonds), DAT (red trianglessee methods section for list of tests within each domain). Numbers within gro the mean of the control group. Individual panels plot compositez-scores for dttentional-executive (B); pictorial semantic versus visuospatial (C); speech
) and control (blue circles) subjects across several composite cognitive domainseen diamonds represent individual SD subjects (as in Table 2).Z-scores are scaledomains of lexical semantic versus visuospatial (A); lexical semantic versusfluency versus comprehension (D).
838 B.T. Gold et al. / Neuropsychologia 43 (2005) 833–846
4.1. Identifying semantic dementia
Raw scores from all tests used to identify SD individualsare presented inTable 2. Fig. 1illustrates degrees of deviation(in standardized scores) of SD individuals from control andDAT subjects across several cognitive domains. The six SDindividuals show patterns of impaired lexical semantics rel-ative to visuospatial functioning (Panel A); impaired lexicalsemantic relative to attentional-executive functioning (PanelB); impaired pictorial semantics relative to visuospatial func-tioning (Panel C); impaired comprehension relative to speechfluency (Panel D). The overall profile in these individuals in-dicating breakdown of semantic knowledge across verbal andnon-verbal domains with relative preservation of visuospatialand attentional-executive functioning and impaired compre-hension relative to speech fluency meets the criteria estab-lished for SD (Hodges et al., 1992; Neary et al., 1998). Asexpected, several early DAT individuals show semantic im-pairment relative to controls. However, early DAT individualstend to show less semantic impairment and more visuospa-tial and attentional-executive impairment than the early SDindividuals.
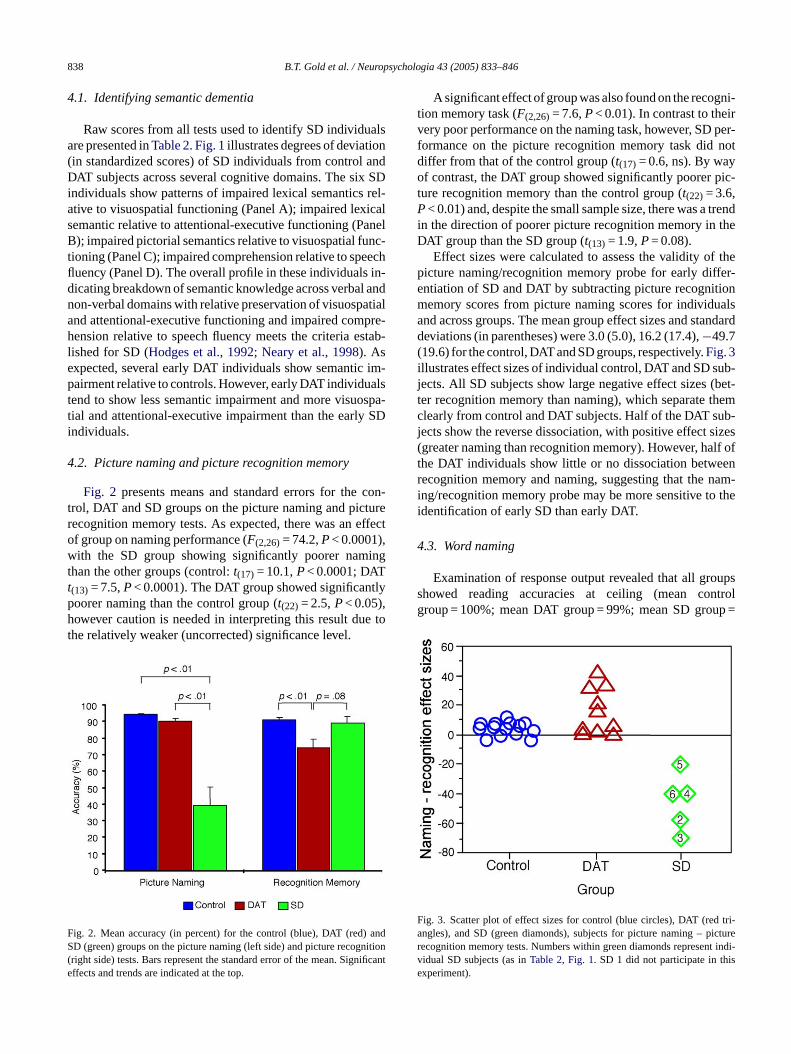
4.2. Picture naming and picture recognition memory
Fig. 2 presents means and standard errors for the con-t turer ffecto ,w ingtt tlyph e tot
F andS nition( ificante
A significant effect of group was also found on the recogni-tion memory task (F(2,26)= 7.6,P< 0.01). In contrast to theirvery poor performance on the naming task, however, SD per-formance on the picture recognition memory task did notdiffer from that of the control group (t(17) = 0.6, ns). By wayof contrast, the DAT group showed significantly poorer pic-ture recognition memory than the control group (t(22) = 3.6,P< 0.01) and, despite the small sample size, there was a trendin the direction of poorer picture recognition memory in theDAT group than the SD group (t(13) = 1.9,P= 0.08).
Effect sizes were calculated to assess the validity of thepicture naming/recognition memory probe for early differ-entiation of SD and DAT by subtracting picture recognitionmemory scores from picture naming scores for individualsand across groups. The mean group effect sizes and standarddeviations (in parentheses) were 3.0 (5.0), 16.2 (17.4),−49.7(19.6) for the control, DAT and SD groups, respectively.Fig. 3illustrates effect sizes of individual control, DAT and SD sub-jects. All SD subjects show large negative effect sizes (bet-ter recognition memory than naming), which separate themclearly from control and DAT subjects. Half of the DAT sub-jects show the reverse dissociation, with positive effect sizes(greater naming than recognition memory). However, half ofthe DAT individuals show little or no dissociation betweenrecognition memory and naming, suggesting that the nam-i thei
4
oupss ntrolg p =
F tri-a icturer t indi-v ise
rol, DAT and SD groups on the picture naming and picecognition memory tests. As expected, there was an ef group on naming performance (F(2,26)= 74.2,P< 0.0001)ith the SD group showing significantly poorer nam
han the other groups (control:t(17) = 10.1,P< 0.0001; DAT(13) = 7.5,P< 0.0001). The DAT group showed significanoorer naming than the control group (t(22) = 2.5,P< 0.05),owever caution is needed in interpreting this result du
he relatively weaker (uncorrected) significance level.
ig. 2. Mean accuracy (in percent) for the control (blue), DAT (red)D (green) groups on the picture naming (left side) and picture recog
right side) tests. Bars represent the standard error of the mean. Signffects and trends are indicated at the top.
ng/recognition memory probe may be more sensitive todentification of early SD than early DAT.
.3. Word naming
Examination of response output revealed that all grhowed reading accuracies at ceiling (mean coroup = 100%; mean DAT group = 99%; mean SD grou
ig. 3. Scatter plot of effect sizes for control (blue circles), DAT (redngles), and SD (green diamonds), subjects for picture naming – pecognition memory tests. Numbers within green diamonds represenidual SD subjects (as inTable 2, Fig. 1. SD 1 did not participate in thxperiment).
B.T. Gold et al. / Neuropsychologia 43 (2005) 833–846 839
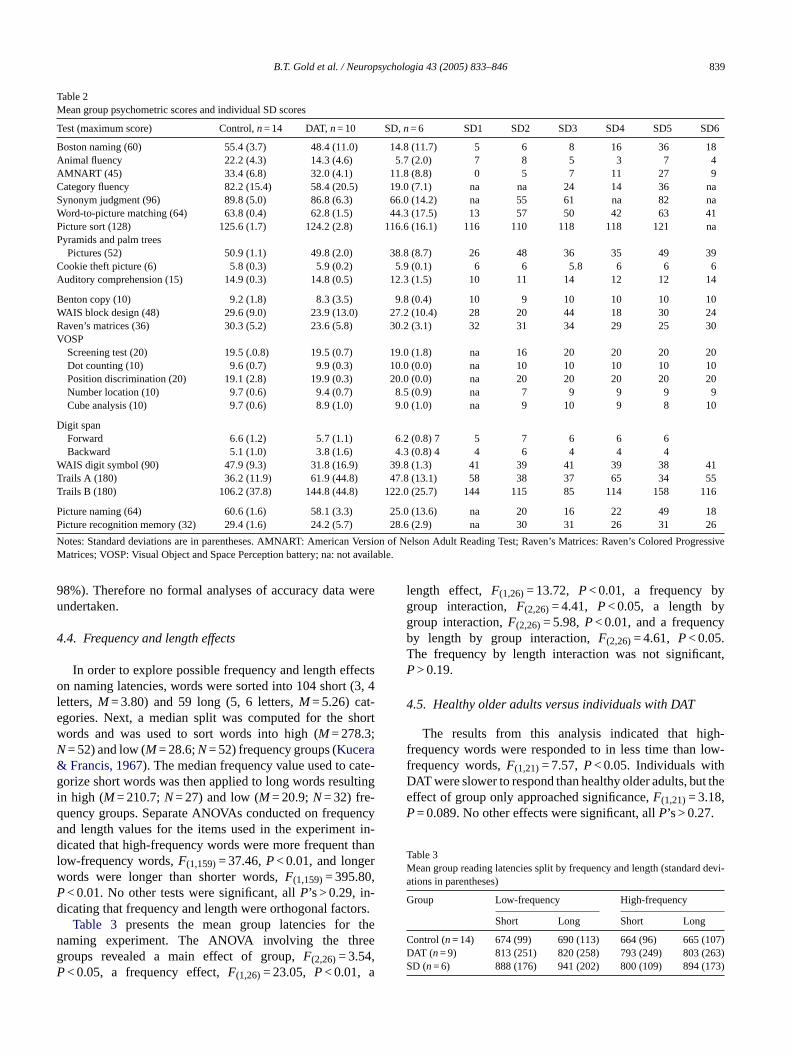
Table 2Mean group psychometric scores and individual SD scores
Test (maximum score) Control,n= 14 DAT,n= 10 SD,n= 6 SD1 SD2 SD3 SD4 SD5 SD6
Boston naming (60) 55.4 (3.7) 48.4 (11.0) 14.8 (11.7) 5 6 8 16 36 18Animal fluency 22.2 (4.3) 14.3 (4.6) 5.7 (2.0) 7 8 5 3 7 4AMNART (45) 33.4 (6.8) 32.0 (4.1) 11.8 (8.8) 0 5 7 11 27 9Category fluency 82.2 (15.4) 58.4 (20.5) 19.0 (7.1) na na 24 14 36 naSynonym judgment (96) 89.8 (5.0) 86.8 (6.3) 66.0 (14.2) na 55 61 na 82 naWord-to-picture matching (64) 63.8 (0.4) 62.8 (1.5) 44.3 (17.5) 13 57 50 42 63 41Picture sort (128) 125.6 (1.7) 124.2 (2.8) 116.6 (16.1) 116 110 118 118 121 naPyramids and palm trees
Pictures (52) 50.9 (1.1) 49.8 (2.0) 38.8 (8.7) 26 48 36 35 49 39Cookie theft picture (6) 5.8 (0.3) 5.9 (0.2) 5.9 (0.1) 6 6 5.8 6 6 6Auditory comprehension (15) 14.9 (0.3) 14.8 (0.5) 12.3 (1.5) 10 11 14 12 12 14
Benton copy (10) 9.2 (1.8) 8.3 (3.5) 9.8 (0.4) 10 9 10 10 10 10WAIS block design (48) 29.6 (9.0) 23.9 (13.0) 27.2 (10.4) 28 20 44 18 30 24Raven’s matrices (36) 30.3 (5.2) 23.6 (5.8) 30.2 (3.1) 32 31 34 29 25 30VOSP
Screening test (20) 19.5 (.0.8) 19.5 (0.7) 19.0 (1.8) na 16 20 20 20 20Dot counting (10) 9.6 (0.7) 9.9 (0.3) 10.0 (0.0) na 10 10 10 10 10Position discrimination (20) 19.1 (2.8) 19.9 (0.3) 20.0 (0.0) na 20 20 20 20 20Number location (10) 9.7 (0.6) 9.4 (0.7) 8.5 (0.9) na 7 9 9 9 9Cube analysis (10) 9.7 (0.6) 8.9 (1.0) 9.0 (1.0) na 9 10 9 8 10
Digit spanForward 6.6 (1.2) 5.7 (1.1) 6.2 (0.8) 7 5 7 6 6 6Backward 5.1 (1.0) 3.8 (1.6) 4.3 (0.8) 4 4 6 4 4 4
WAIS digit symbol (90) 47.9 (9.3) 31.8 (16.9) 39.8 (1.3) 41 39 41 39 38 41Trails A (180) 36.2 (11.9) 61.9 (44.8) 47.8 (13.1) 58 38 37 65 34 55Trails B (180) 106.2 (37.8) 144.8 (44.8) 122.0 (25.7) 144 115 85 114 158 116
Picture naming (64) 60.6 (1.6) 58.1 (3.3) 25.0 (13.6) na 20 16 22 49 18Picture recognition memory (32) 29.4 (1.6) 24.2 (5.7) 28.6 (2.9) na 30 31 26 31 26
Notes: Standard deviations are in parentheses. AMNART: American Version of Nelson Adult Reading Test; Raven’s Matrices: Raven’s Colored ProgressiveMatrices; VOSP: Visual Object and Space Perception battery; na: not available.
98%). Therefore no formal analyses of accuracy data wereundertaken.
4.4. Frequency and length effects
In order to explore possible frequency and length effectson naming latencies, words were sorted into 104 short (3, 4letters,M= 3.80) and 59 long (5, 6 letters,M= 5.26) cat-egories. Next, a median split was computed for the shortwords and was used to sort words into high (M= 278.3;N= 52) and low (M= 28.6;N= 52) frequency groups (Kucera& Francis, 1967). The median frequency value used to cate-gorize short words was then applied to long words resultingin high (M= 210.7;N= 27) and low (M= 20.9;N= 32) fre-quency groups. Separate ANOVAs conducted on frequencyand length values for the items used in the experiment in-dicated that high-frequency words were more frequent thanlow-frequency words,F(1,159)= 37.46,P< 0.01, and longerwords were longer than shorter words,F(1,159)= 395.80,P< 0.01. No other tests were significant, allP’s > 0.29, in-dicating that frequency and length were orthogonal factors.
Table 3 presents the mean group latencies for thenaming experiment. The ANOVA involving the threegroups revealed a main effect of group,F(2,26)= 3.54,P< 0.05, a frequency effect,F(1,26)= 23.05, P< 0.01, a
length effect, F(1,26)= 13.72, P< 0.01, a frequency bygroup interaction,F(2,26)= 4.41, P< 0.05, a length bygroup interaction,F(2,26)= 5.98,P< 0.01, and a frequencyby length by group interaction,F(2,26)= 4.61, P< 0.05.The frequency by length interaction was not significant,P> 0.19.
4.5. Healthy older adults versus individuals with DAT
The results from this analysis indicated that high-frequency words were responded to in less time than low-frequency words,F(1,21)= 7.57,P< 0.05. Individuals withDAT were slower to respond than healthy older adults, but theeffect of group only approached significance,F(1,21)= 3.18,P= 0.089. No other effects were significant, allP’s > 0.27.
Table 3Mean group reading latencies split by frequency and length (standard devi-ations in parentheses)
Group Low-frequency High-frequency
Short Long Short Long
Control (n= 14) 674 (99) 690 (113) 664 (96) 665 (107)DAT (n= 9) 813 (251) 820 (258) 793 (249) 803 (263)SD (n= 6) 888 (176) 941 (202) 800 (109) 894 (173)
840 B.T. Gold et al. / Neuropsychologia 43 (2005) 833–846
4.6. Healthy older adults versus individuals with SD
The results from this analysis indicated that individualswith SD were slower to respond than healthy older adults,F(1,18)= 12.17,P< 0.01. In addition, more frequent wordswere responded to in less time than less frequent words,F(1,18)= 19.79,P< 0.01, and shorter words were respondedto in less time than longer words,F(1,18)= 18.22,P< 0.01.The frequency effect was significantly larger in SD than incontrols,F(1,18)= 6.90,P< 0.05, as was the length effect,F(1,18)= 11.60,P< 0.01. There was a significant interactionamong frequency, length, and group,F(1,18)= 12.46,P< 0.01.A simple effects analysis indicated that the frequency bylength by group interaction occurred because, in healthy olderadults, the length effect was larger for low-frequency words,t(13) = 2.36,P< 0.05 than high-frequency words,t< 1, butfor individuals with SD, the length effect was similar forboth low-frequency words,t(5) = 2.48,P= 0.056, and high-frequency words,t(4) = 2.98,P< 0.05.
4.7. Individuals with DAT versus individuals with SD
The results of this analysis indicated that more frequentwords were responded to in less time than less frequent words,F(1,13)= 15.80,P< 0.01, and shorter words were responded toi -a e nots wedaPt y ef-f d al trol)g entp ssings onr
fre-q gen-e aringt up.T theD rallr weren her low-
TM roupm ons inp
G
T
DS
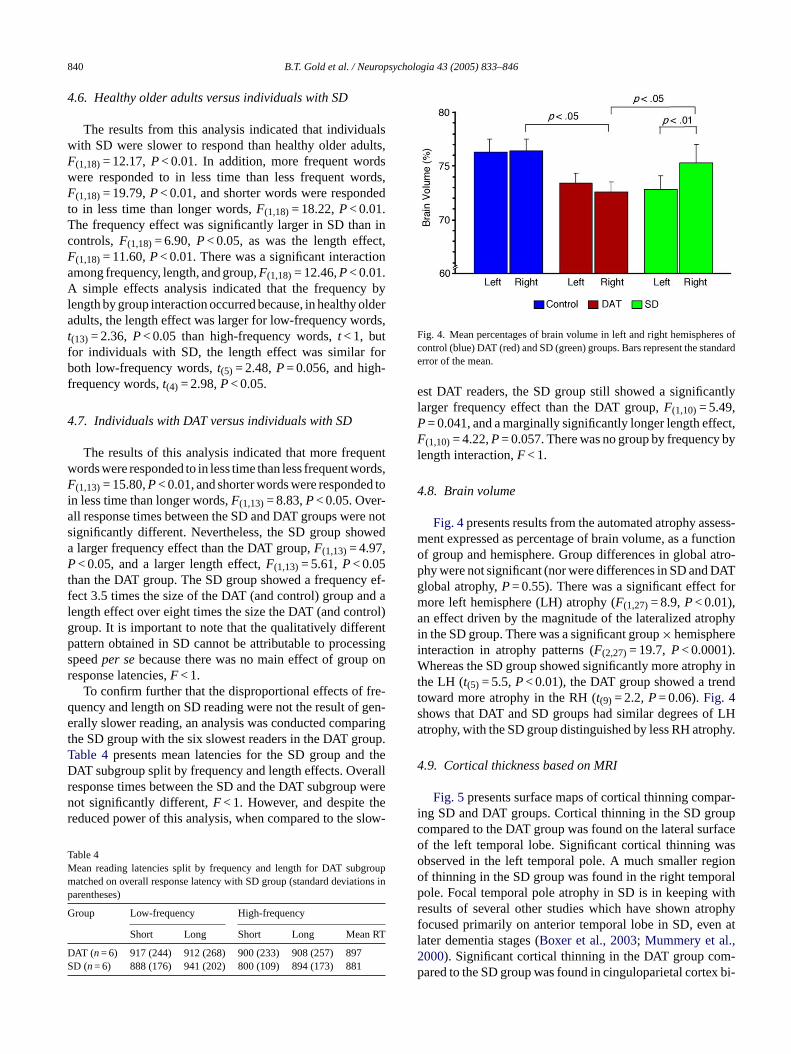
Fig. 4. Mean percentages of brain volume in left and right hemispheres ofcontrol (blue) DAT (red) and SD (green) groups. Bars represent the standarderror of the mean.
est DAT readers, the SD group still showed a significantlylarger frequency effect than the DAT group,F(1,10)= 5.49,P= 0.041, and a marginally significantly longer length effect,F(1,10)= 4.22,P= 0.057. There was no group by frequency bylength interaction,F< 1.
4.8. Brain volume
Fig. 4presents results from the automated atrophy assess-ment expressed as percentage of brain volume, as a functionof group and hemisphere. Group differences in global atro-phy were not significant (nor were differences in SD and DATglobal atrophy,P= 0.55). There was a significant effect formore left hemisphere (LH) atrophy (F(1,27)= 8.9,P< 0.01),an effect driven by the magnitude of the lateralized atrophyin the SD group. There was a significant group× hemisphereinteraction in atrophy patterns (F(2,27)= 19.7,P< 0.0001).Whereas the SD group showed significantly more atrophy inthe LH (t(5) = 5.5,P< 0.01), the DAT group showed a trendtoward more atrophy in the RH (t(9) = 2.2,P= 0.06).Fig. 4shows that DAT and SD groups had similar degrees of LHatrophy, with the SD group distinguished by less RH atrophy.
4.9. Cortical thickness based on MRI
par-i upc faceo aso iono ralp ithr ophyf n atl ,2 -p x bi-
n less time than longer words,F(1,13)= 8.83,P< 0.05. Overll response times between the SD and DAT groups werignificantly different. Nevertheless, the SD group sholarger frequency effect than the DAT group,F(1,13)= 4.97,< 0.05, and a larger length effect,F(1,13)= 5.61,P< 0.05
han the DAT group. The SD group showed a frequencect 3.5 times the size of the DAT (and control) group anength effect over eight times the size the DAT (and conroup. It is important to note that the qualitatively differattern obtained in SD cannot be attributable to procepeedper sebecause there was no main effect of groupesponse latencies,F< 1.
To confirm further that the disproportional effects ofuency and length on SD reading were not the result ofrally slower reading, an analysis was conducted comp
he SD group with the six slowest readers in the DAT groable 4presents mean latencies for the SD group andAT subgroup split by frequency and length effects. Ove
esponse times between the SD and the DAT subgroupot significantly different,F< 1. However, and despite teduced power of this analysis, when compared to the s
able 4ean reading latencies split by frequency and length for DAT subgatched on overall response latency with SD group (standard deviatiarentheses)
roup Low-frequency High-frequency
Short Long Short Long Mean R
AT (n= 6) 917 (244) 912 (268) 900 (233) 908 (257) 897D (n= 6) 888 (176) 941 (202) 800 (109) 894 (173) 881
Fig. 5presents surface maps of cortical thinning comng SD and DAT groups. Cortical thinning in the SD groompared to the DAT group was found on the lateral surf the left temporal lobe. Significant cortical thinning wbserved in the left temporal pole. A much smaller regf thinning in the SD group was found in the right tempoole. Focal temporal pole atrophy in SD is in keeping wesults of several other studies which have shown atrocused primarily on anterior temporal lobe in SD, eveater dementia stages (Boxer et al., 2003; Mummery et al.000). Significant cortical thinning in the DAT group comared to the SD group was found in cinguloparietal corte
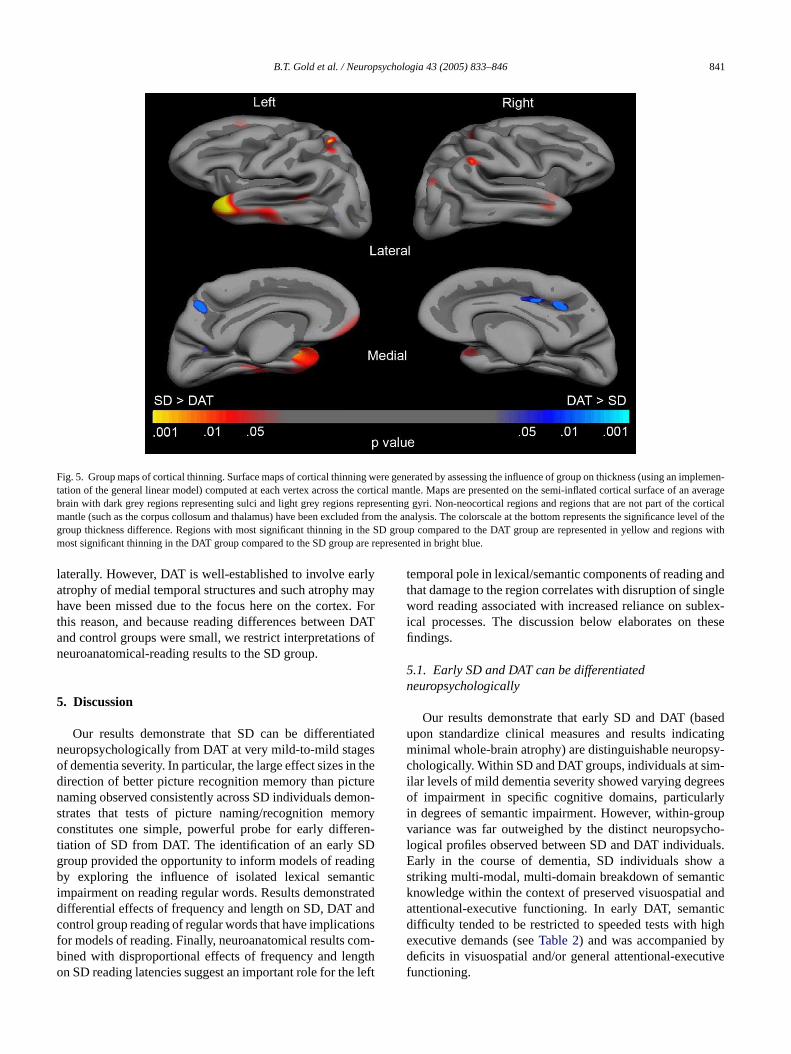
B.T. Gold et al. / Neuropsychologia 43 (2005) 833–846 841
Fig. 5. Group maps of cortical thinning. Surface maps of cortical thinning were generated by assessing the influence of group on thickness (using an implemen-tation of the general linear model) computed at each vertex across the cortical mantle. Maps are presented on the semi-inflated cortical surface of an averagebrain with dark grey regions representing sulci and light grey regions representing gyri. Non-neocortical regions and regions that are not part of the corticalmantle (such as the corpus collosum and thalamus) have been excluded from the analysis. The colorscale at the bottom represents the significance levelof thegroup thickness difference. Regions with most significant thinning in the SD group compared to the DAT group are represented in yellow and regions withmost significant thinning in the DAT group compared to the SD group are represented in bright blue.
laterally. However, DAT is well-established to involve earlyatrophy of medial temporal structures and such atrophy mayhave been missed due to the focus here on the cortex. Forthis reason, and because reading differences between DATand control groups were small, we restrict interpretations ofneuroanatomical-reading results to the SD group.
5. Discussion
Our results demonstrate that SD can be differentiatedneuropsychologically from DAT at very mild-to-mild stagesof dementia severity. In particular, the large effect sizes in thedirection of better picture recognition memory than picturenaming observed consistently across SD individuals demon-strates that tests of picture naming/recognition memoryconstitutes one simple, powerful probe for early differen-tiation of SD from DAT. The identification of an early SDgroup provided the opportunity to inform models of readingby exploring the influence of isolated lexical semanticimpairment on reading regular words. Results demonstrateddifferential effects of frequency and length on SD, DAT andcontrol group reading of regular words that have implicationsfor models of reading. Finally, neuroanatomical results com-bined with disproportional effects of frequency and lengtho e left
temporal pole in lexical/semantic components of reading andthat damage to the region correlates with disruption of singleword reading associated with increased reliance on sublex-ical processes. The discussion below elaborates on thesefindings.
5.1. Early SD and DAT can be differentiatedneuropsychologically
Our results demonstrate that early SD and DAT (basedupon standardize clinical measures and results indicatingminimal whole-brain atrophy) are distinguishable neuropsy-chologically. Within SD and DAT groups, individuals at sim-ilar levels of mild dementia severity showed varying degreesof impairment in specific cognitive domains, particularlyin degrees of semantic impairment. However, within-groupvariance was far outweighed by the distinct neuropsycho-logical profiles observed between SD and DAT individuals.Early in the course of dementia, SD individuals show astriking multi-modal, multi-domain breakdown of semanticknowledge within the context of preserved visuospatial andattentional-executive functioning. In early DAT, semanticdifficulty tended to be restricted to speeded tests with highexecutive demands (seeTable 2) and was accompanied bydeficits in visuospatial and/or general attentional-executivef
n SD reading latencies suggest an important role for th unctioning.
842 B.T. Gold et al. / Neuropsychologia 43 (2005) 833–846
5.2. A picture naming/recognition memory probe candifferentiate early SD from DAT
The most powerful test for differentiation of early SD andDAT individuals was a picture naming/recognition memoryprobe. Recent research has observed a double dissociationbetween SD and DAT groups in picture naming and picturerecognition memory, with SD groups showing poorer nam-ing but better recognition memory than DAT groups (Grahamet al., 1997, 2000a; Simons et al., 2002a). Suggestions ofpreserved episodic memory for pictures in the context ofdegraded semantic knowledge have been controversial (c.f.,Tulving, 2001). Our results of a double dissociation in picturenaming/recognition memory between SD and DAT groupsreplicate the preservation of episodic memory for picturesin SD despite degraded semantic knowledge (Graham et al.,1997, 2000a; Simons et al., 2002a, 2002b).
In addition to group differences observed, the importantclinical implications regarding the potential for differentialdiagnosis raised by the Cambridge group’s observations ledus to explore the ability of a picture naming/recognitionmemory probe to differentiate early SD and DAT individ-uals. Our results demonstrate that a picture naming/picturerecognition memory probe consistently differentiates SDindividuals from both DAT and control (healthy older) indi-v da tiono ing,s . Byc ingc ings res,s pic-t tooli toe s.
5D
op-p in-fl dingr ccu-r sultswF ,t ion ofo costi
calv ivelyg ingly,a DATg pro-p SD
group showed a frequency effect in reading 3.5 times that ofDAT and control groups and a length effect over eight timesthat of DAT and control groups. The finding of increasedresponse times in SD and DAT reading compared to thoseof a control group, combined with exaggerated effects of fre-quency and length only in SD, reveals clues about potentiallydifferent cognitive processes underlying reading in the threegroups. These potentially different processes are first dis-cussed with respect to dual-route and connectionist modelsand then in terms of SD group atrophy patterns.
The highly focal nature of the cognitive impairmentin early SD suggests strongly that their increased naminglatency relates to damaged lexical/semantic componentsof reading. In particular, all SD subjects showed impairedreading of words with irregular spelling-to-sound correspon-dences (see AMNART scores inTable 2). Impairment ofirregular word reading has been interpreted as evidence dam-aged lexical (e.g.,Blazely, Coltheart & Casey, in press) orsemantic (e.g.,Patterson & Hodges, 1992) components ofreading. With respect to models of reading, the finding ofa group by frequency interaction is readily accommodatedwithin both dual-route and connectionist frameworks. Dual-route models (e.g.,Coltheart, 1978; Coltheart et al., 2001)propose that words are read aloud via two processing routes.A lexical route maps orthographic strings directly ontol tionsa t intos emec enta-t hina ob-s ionatel rgeb ordsa lexi-c ,S tm on,1 nt delsp worko weeni gy).I hica ffecti tem.D ,1 ine rds,h nticst thisw
byl ual-r outem route
iduals. As can be seen inFig. 3, all SD individuals showelarge effect size of at least 20% points in the direc
f better performance in recognition memory than nameparating them clearly from DAT and control subjectsontrast, while all DAT individuals showed superior namompared to recognition memory, four showed namcores within 5% points of their recognition memory scoimilar to control individuals. These results suggest that aure naming/recognition memory probe is an importantn early differentiation of SD from DAT but less sensitivearly differentiation of DAT from healthy older individual
.3. Regular word reading is prolonged in early SD andAT
The identification of an early SD group provided theortunity to inform models of reading by exploring theuence of isolated lexical semantic impairment on reaegular words. Reading of regular words was highly aate in both patient groups, consistent with previous reith SD (Patterson & Hodges, 1992) and DAT (Balota &erraro, 1993; Patterson et al., 1994a, 1994b). However
he present findings demonstrate that accurate translatrthography-to-phonology of regular words requires a
n processing speed in both early SD and DAT.Turning to differential effects of lexical and sublexi
ariables on reading, we began by asking whether relatraded effects might emerge between groups. Interestlthough such effects did not emerge between SD androups in overall latency, only the SD group showed disortional effects of frequency and length on reading: The
exical representations, where corresponding pronunciare stored. In addition, a sublexical route translates prinound serially via the application of grapheme-to-phonorrespondence rules. The degradation of lexical represions in SD affects the efficiency of the lexical route. Wit
dual-route account, disproportional frequency effectserved can be explained as a consequence of disproportoss of low-frequency words in the lexical route. A laody of data indicates that reading of low-frequency wre affected prior to high-frequency words in cases ofal/semantic impairment (Gold & Kertesz, 2000; Schwartzaffran, & Marin, 1980; Warrington, 1975). Connectionisodels (e.g.,Plaut, McClelland, Seidenberg, & Patters996; Seidenberg & McClelland, 1989) can also explai
he group by frequency interaction. Connectionist moropose that reading aloud is accomplished via a netf simple processing units that learns associations bet
nputs (i.e., orthography) and outputs (i.e., phonolon addition, a semantic level interacts with orthograpnd phonological levels. Here, a larger frequency e
n SD would result from damage to the semantic sysue to graceful degradation (Bechtel & Abrahamsen991), low-frequency words would be more disruptedarly-stage SD than high-frequency words. In other woigh-frequency words would receive a boost from sema
hat would be less likely for low-frequency words, andould produce an exaggerated frequency effect.Unlike the group by frequency interaction, the group
ength interaction is more easily accommodated within doute than connectionist models. According to the dual-rodel, the large-scale damage incurred by the lexical
B.T. Gold et al. / Neuropsychologia 43 (2005) 833–846 843
in SD should lead to increased reliance on sublexical pro-cesses and resulting disproportional increases in latencies onlonger words. Because the sublexical route is a serial pro-cessor, longer words should require more processing timethan shorter words. For words with regular spelling-to-soundcorrespondences (such as those used here) the two routesarrive at the same pronunciation. Thus, the sublexical routewould be expected to output accurate but slower pronunci-ation. This is exactly what happened. Interestingly, there isevidence of greater effects of length in reading pseudowordsthan words in normal readers (Weekes, 1997). This may bedirectly relevant to SD individuals, for whom the degree oflexical semantic impairment may render word reading some-what analogous to pseudoword reading in normals. Unlike theSD group, the DAT group was not more influenced by lengththan control group. This would fit with the greater retentionof lexical semantics in DAT compared to SD. In addition,mild attentional-executive impairment in early DAT is likelyto contribute to their increased reading latencies relative tothe control group (Balota & Faust, 2001; Balota & Ferraro,1993, 1996; Paap & Noel, 1991). Connectionist models havea more difficult time accounting for the increased length ef-fect observed in SD latencies because they do not contain aserial processing component. Rather, orthographic, phono-logical and semantic components of words are processed inp n thep notc aget rds.I p.8 ffectt elys
t forl the“t man-t servet anticr oldt ientr entso st bea ivelyl wells s ofs nnec-t fromt rre-s lead-i owt h in-t auset ionsa nceo may
be better able to accommodate the disproportional length ef-fect observed in SD reading of regular words.
5.4. Neuroanatomical correlates of abnormal reading inSD and DAT
As expected from previous results comparing SD and DATbrain (Chan et al., 2001; Galton et al., 2001a, 2001b) and greymatter (Boxer et al., 2003; Mummery et al., 2000) volumes,significant cortical thinning in the SD group compared tothe DAT (and control) group was observed in the left tem-poral pole. Unlike previous results, however, the present SDgroup showed atrophy restricted largely to left temporal pole,likely as a result of the mild dementia severity of the presentsample. Direct contrast between the left and right hemispherevolumes in the SD group revealed a significant effect of later-alization. The relatively focal atrophy pattern in SD suggeststhat damage to anterior temporal cortex can be associatedwith disruption of regular word reading and allows us to con-sider the impact of damage to this region on reading. Wenote that it is also possible that other regions contribute tothe behavioral pattern observed but were not identified in thepresent analyses. For discussion, we focus on the prominentdifference in the left temporal pole.
The temporal pole has not typically been thought to playa log-i lefto ralp an-t hea tself( gi-c onalr tom-i re-p i andu pos-t ead-i ,s winga thish por-te s,1
polec s se-m ands read-i nces(H inghS ead-i aven ole,
arallel. Because the short and long words employed iresent study did not differ in terms of frequency, it islear how a connectionist model could predict that damo semantics differentially would affect short and long wot should be noted that simulations byPlaut et al. (1996, see5)indicate that length actually does produce a reliable e
he model’s settling times. However, this effect is relativmall (0.8%).
One specific connectionist theory, which can accounength effects in the context of semantic impairment issemantic glue” hypothesis (Patterson & Hodges, 1992). Theheory holds that, in normal readers, the existence of a seic representation corresponding to a pronunciation cano reinforce the correct response because an intact semepresentation reinforces the binding (“glue”) thought to hogether phonological units for production. When insufficesidual word meaning is available, phonological elemf a response become “unglued” and pronunciation mussembled from constituent elements, resulting in relat
onger reading latencies. The semantic glue theory isuited to explain poor reading of irregular words in caseemantic impairment because the strong weights on coions between orthography and phonology (stemminghe relative prevalence of regular spelling-to-sound copondences) may operate without semantic constraint,ng to regularization errors. However, it is less clear hhe theory could account for the present group by lengteraction in latencies observed with regular words. Beche dual-route model makes relatively stronger predictbout the influence of length, and in particular the influef length when the lexical route is disrupted, we believe it
significant role in normal reading. The modern neurocal model of reading suggested three critical regions:ccipital cortex, involved in visual processing, left latearietotemporal cortex, involved in phonological and sem
ic coding, and a left inferior frontal cortex involved in trranging of speech codes for output, and for output iGeshwind, 1965). Subsequent cognitive neuropsycholoal investigations suggested the involvement of additiegions in single word reading. For example, neuroanacal localization in surface dyslexia has most frequentlyorted damage to posterior superior/middle temporal gyrnderlying white matter, suggesting the importance of
erior temporal lobe in lexical/semantic components of rng (Patterson, Marshall, & Coltheart, 1985). More recentlyurface dyslexia has been reported in SD subjects shotrophy focused primarily on the left temporal pole, andas been interpreted as evidence that the region is im
antly involved in semantic components of reading (Grahamt al., 1994, 2000b; Hodges et al., 1992; Patterson & Hodge992).
By contrast, less evidence exists that the temporalontributes to components of reading which do not stresantics. First, SD patients with temporal pole atrophy
urface dyslexia have tended to show relatively accurateng of words with regular spelling-to-sound correspondeGraham et al., 2000b; Hodges et al., 1992; Patterson &odges, 1992), although impairment of regular word readas been reported in some SD patients (Graham et al., 1994).econd, functional neuroimaging studies of single word r
ng (usually involving both regular and irregular words) hot tended to report prominent activation of temporal p
844 B.T. Gold et al. / Neuropsychologia 43 (2005) 833–846
although activation of a number of anatomically proximalstructures in left lateral temporal cortex have been reportedincluding the superior, middle and inferior temporal gyri, de-pending upon the study (Fiez, Balota, Raichle, & Petersen,1999; Howard et al., 1992; Petersen, Fox, Posner, Mintun, &Raichle, 1989; Price, Moore, Frackowiak, 1996; Pugh et al.,2000; Shaywitz et al., 2002).
The present findings of highly accurate reading in anSD group with focal thinning of temporal pole cortex in isin-line with a view that integrity of the left temporal poledoes not appear strictly necessary for reading single regularwords. However, the focal thinning of temporal cortex anddisproportional influence of frequency and length on SDreading latencies for regular words suggests a role for thetemporal pole in some component of regular word reading.Considered together, the present results suggest that the lefttemporal pole is importantly involved in lexical/semantic,but not orthographic or phonological, components of singleword reading. The disproportional effects of frequencyon SD latencies suggests that the left temporal pole rep-resents a gateway to a lexical/semantic system that isparticularly important for establishing the pronunciation oflow-frequency regular (in addition to irregular) words. Sucha system may typically serve to stabilize pronunciation oflow-frequency words, which have weaker phonologicallyb , duet icalt withl ctedt ten-c xicalc SDg polei ionaln n oft uli( 96G e-m 2V 96
SDg y tob lettera h de-r cei ger-a ourS ingh ,1 pro-c -y ,t ia isa strat-e ondsl
Patterson & Kay, 1982). In terms of phonological readingprocesses, the complete absence of reading errors in ourearly SD group, in the context of the severe lexical seman-tic impairment, suggests that the left temporal pole is notcritically involved in deriving sound from visual words sub-lexically. Taken together, the present data suggest a rolefor the left temporal pole in lexical/semantic componentsof reading and demonstrate that cortical differences in thisregion associate with reliance on sublexical components ofreading.
6. Conclusions
In conclusion, SD can be differentiated from DAT atmild dementia stages. While clinical overlap exists, the char-acteristic profile of relatively isolated multi-modal, multi-domain breakdown of semantic knowledge appears earlyin the course of SD, distinguishing it from DAT. The pat-tern of SD and DAT scores on picture naming and picturerecognition memory tests suggest that these measures rep-resent a simple, powerful probe for early differentiation ofSD from DAT. In terms of reading, the relative influence oflexical and sublexical variables on group latencies is accom-modated by dual-route models of reading and raises a chal-l dis-p dingc ug-g ts ofr mpo-r ts ofr
A
theirc rchp toi JonS forh ingu ms,D ithd NIA( r’sA nellF ute.A forR 609),t D)I orkP yt tionalI ctB
ased lexical representations than high-frequency wordso less experience with their orthographic-to-phonologransformations. Damage to a brain region associatedexical/semantic components of reading would be expeo result in disproportional effects of length on reading laies because it would increase reliance on serial, subleomponents of reading, and this is what resulted in theroup. In general agreement with a role for left temporal
n lexical/semantic components of reading, several functeuroimaging studies have reported prominent activatio
he region during word retrieval cued by a variety of stimDamasio, Grabowski, Tranel, Hichwa, & Damasio, 19;rabowski et al., 2003) as well as during more explicit santic analysis (e.g.,Vandenberghe, Nobre, & Price, 200;andenberghe, Price, Wise, Josephs, & Frackowiak, 19).
The pattern of reading and atrophy results from ourroup suggests further that left temporal pole is unlikele involved in orthographic processes associated withnalysis, or in phonological processes associated witiving sound from visual words sublexically. Disturbann orthographic processing can actually produce exagted effects of length in single word reading as seenD group. In fact, disproportional length effects in readave most commonly been reported in pure alexia (Dejerine892), a reading disorder associated with impairment ofessing letters groups (Patterson & Kay, 1982) or the analsis of individual letters (Arguin & Bub, 1993). Howeverhe nature of the orthographic disturbance in pure alexssociated with a stereotyped letter-by-letter readinggy resulting in response times typically several sec
onger than normal readers (Bub, Black, & Howell, 1989;
enge for most connectionist models. Finally, results ofroportional influence of frequency and length on SD reaombined with cortical thinning in the left temporal pole sest a role for the region in lexical/semantic componeneading and demonstrate that differences in the left teal pole associate with reliance on sublexical componeneading.
cknowledgements
We thank the control subjects and the patients andaregivers for volunteering their time for this researoject. We also thank clinicians at ADRC for helping
dentify patients, Drs. Andrew Kertesz, Martha Storandt,imons, Max Coltheart, and two anonymous reviewerselpful discussion and Dr. Matt Lambon Ralph for allows to use several tests. Finally, we thank Laura Williaaniella Van Hooren, and Jeff Templeton for help wata collection. The research was supported in part byAG05681, AG03991), NIMH (MH57506), the Alzheimessociation (IIRG-00-1944), the James S McDonoundation and the Howard Hughes Medical Institdditional support was provided by the National Centeresearch Resources (P41-RR14075 and R01-RR13
he Mental Illness and Neuroscience Discovery (MINnstitute and the Biomedical Informatics Research Netwroject (BIRN,http://www.nbirn.net), which is funded b
he National Center for Research Resources at the Nanstitutes of Health (NCRR BIRN Morphometric ProjeIRN002).
B.T. Gold et al. / Neuropsychologia 43 (2005) 833–846 845
References
Arguin, M., & Bub, D. N. (1993). Single-character processing in a caseof pure alexia.Neuropsychologia, 31, 435–458.
Armitage, S. G. (1945). An analysis of certain psychological tests usedfor the evaluation of brain injury.Psychological Monographs, 60, 1–48.
Balota, D. A., & Faust, M. E. (2001). Attention in Alzheimers disease. InF. Boller & S. Cappa (Eds.),Handbook of Neuropsychology: 6(2nded., pp. 51–80). Elsevier.
Balota, D. A., & Ferraro, F. R. (1993). A dissociation of frequency andregularity effects in pronunciation performance across young adults,older adults, and individuals with senile dementia of the Alzheimertype. Journal of Memory and Language, 32, 573–592.
Balota, D. A., & Ferraro, F. R. (1996). Lexical, sublexical and implicitmemory processes in healthy young and healthy older adults and inindividuals with dementia of the Alzheimer type.Neuropsychology,10, 82–95.
Bechtel, W., & Abrahamsen, A. (1991).Connectionism and the mind:An introduction to parallel processing in networks. Cambridge, MA:Blackwell.
Berg, L., McKeel, D. W., Jr., Miller, J. P., Storandt, M., Rubin, E. H.,Morris, J. C., et al. (1998). Clinicopathologic studies in cognitivelyhealthy aging and Alzheimer’s disease: Relation of histologic markersto dementia severity, age, sex and apolipoprotein E genotype.Archivesof Neurology, 55, 326–335.
Blazely, A. M., Coltheart, M., & Casey, B. J. (in press). Semantic im-pairment with and without surface dyslexia: Implications for modelsof reading.Cognitive Neuropsychology.
Boxer, A. L., Rankin, K. P., Miller, B. L., Schuff, N., Weiner, M., Gorno-hes
B es, J.
B tho-
B ris, J.onalmatedainst
C L.,y in
C ia of
C . Un-.
C 01).and
C , R.ef-ent.
D sed
D , A..
D clin-t´
Fiez, J. A., Balota, D. A., Raichle, M. E., & Petersen, S. E. (1999).Effects of lexicality, frequency, and spelling-to-sound consistency onthe functional anatomy of reading.Neuron, 24, 205–218.
Fischl, B., & Dale, A. M. (2000). Measuring the thickness of the humancerebral cortex from magnetic resonance images.Proceedings of theNational Academy of Sciences USA, 97, 11050–11055.
Fischl, B., Liu, A., & Dale, A. M. (2001). Automated manifold surgery:constructing geometrically accurate and topologically correct modelsof the human cerebral cortex.Institute of Electrical Electronics En-gineers: Transactions in Medical Imaging, 20, 70–80.
Fischl, B., Sereno, M. I., & Dale, A. M. (1999). Cortical surface-basedanalysis II: inflation, flattening, and a surface-based coordinate system.NeuroImage, 9, 195–207.
Fischl, B., Sereno, M. I., Tootell, R. B. H., & Dale, A. M. (1999).High-resolution inter-subject averaging and a coordinate system forthe cortical surface.Human Brain Mapping, 8, 272–284.
Folstein, M. F., Folstein, S. E., & McHugh, P. R. (1975). Mini-MentalState: a practical method for grading the cognitive state of patientsfor the clinicians.Journal of Psychiatric Research, 12, 189–198.
Galton, C. J., Gomez-Anson, B., Antoun, N., Scheltens, P., Patterson,K., Graves, M., et al. (2001). Temporal lobe rating scale: applica-tion to Alzheimer’s disease and frontotemporal dementia.Journal ofNeurology, Neurosurgery and Psychiatry, 70, 165–173.
Galton, C. J., Patterson, K., Graham, K., Lambon-Ralph, M. A., Williams,G., Antoun, N., et al. (2001). Differing patterns of temporal atrophy inAlzheimer’s disease and semantic dementia.Neurology, 57, 216–225.
Geshwind, N. (1965). Disconnexion syndromes in animals and man.Brain, 88, 17–294.
Gold, B. T., & Kertesz, A. (2000). Preserved visual lexicosemantics inglobal aphasia: A right-hemisphere contribution?Brain and Language,
G nd
G onto,the
.G nship
study
G nshiphasia.
G ct ofantic
G s, J.and
G f aerly..
H nsis-eu-
H tia. Inex
H man-ophy.
H R., etlobentia)
gical
Tempini, M., et al. (2003). Cinguoloparietal atrophy distinguisAlzheimer disease from SD.Archives of Neurology, 60, 949–956.
ozeat, S., Lambon Ralph, A., Patterson, K., Garrard, P., & HodgR. (2000). Non-verbal semantic impairment in SD.Neuropsychologia,38, 1207–1215.
ub, D., Black, S. E., & Howell, J. (1989). Word recognition and orgraphic context.Brain and Language, 37, 357–376.
uckner, R. L., Head, D., Parker, J., Fotenos, A. F., Marcus, D., MorC., et al. (2004). A unified approach for morphometric and functidata analysis in young, old, and demented adults using autoatlas-based head size normalization: reliability and validation agmanual measurement of total intracranial volume.NeuroImage, 23,724–738.
han, D., Fox, N. C., Scahill, R. I., Crum, W. R., Whitwell, J.Leschziner, G., et al. (2001). Patterns of temporal lobe atrophsemantic dementia and Alzheimer’s Disease.Annals of Neurology,49, 433–442.
hertkow, H., & Bub, D. (1990). Semantic memory loss in dementAlzheimer’s type.Brain, 113, 397–417.
oltheart, M. (1978). Lexical access in simple reading tasks. In Gderwood (Ed.),Strategies of Information Processing(pp. 151–216)San Diego, CA: Academic Press.
oltheart, M., Rastle, K., Perry, C., Langdon, R., & Ziegler, J. (20DRC: a dual route cascaded model of visual word recognitionreading aloud.Psychological Review, 108, 204–256.
ortese, M. J., Balota, D. A., Sergent-Marshall, S. D., & BucknerL. (2003). Spelling via semantics and phonology: Exploring thefects of age. Alzheimer’s disease and primary semantic impairmNeuropsychologia, 41, 952–967.
ale, A. M., Fischl, B., & Sereno, M. I. (1999). Cortical surface-baanalysis. I. Segmentation and surface reconstruction.NeuroImage, 9,179–194.
amasio, H., Grabowski, T. J., Tranel, D., Hichwa, R. D., & DamasioR. (1996). A neural basis for lexical retrieval.Nature, 380, 499–505
ejerine, J. (1892). Contributions a l’etude anatomopathologique etique des differentes varietes de cecite verbale.Memories de la SocieeBiologique, 44, 61–90.
75, 359–375.oodglass, H., & Kaplan, E. (1983).The Assessment of Aphasia aRelated Disorders(2nd ed.). Philadelphia: Lea and Febiger.
rabowski, T. J., Damasio, H., Tranel, D., Cooper, G. E., Boles PL. L., & Watkins, G. L. (2003). Residual naming after damage toleft temporal pole: a PET activation study.NeuroImage, 19, 846–860
raham, K. S., Becker, J. T., & Hodges, J. R. (1997). On the relatiobetween knowledge and memory for pictures: Evidence from theof patients with semantic dementia and Alzheimer’s disease.Journalof the International Neuropsychological Society, 3, 534–544.
raham, K. S., Hodges, J. R., & Patterson, K. (1994). The relatiobetween comprehension and oral reading in progressive fluent apNeuropsychologia, 32, 299–316.
raham, N. L., Patterson, K., & Hodges, J. R. (2000). The impasemantic memory impairment on spelling: Evidence from semmemory.Neuropsychologia, 32, 299–316.
raham, K. S., Simons, J. S., Pratt, K. H., Patterson, K., & HodgeR. (2000). Insights from SD on the relationship between episodicsemantic memory.Neuropsycholgia, 38, 313–324.
rober, E., & Sliwinski, M. (1991). Development and validation omodel for estimating premorbid verbal intelligence in the eldJournal of Clinical and Experimental Neuropsychology, 13, 933–949
odges, J. R., & Patterson, K. (1995). Is semantic memory cotently impaired early in the course of Alzheimer’s disease? Nroanatomical and diagnostic implications.Neuropsychologia, 33, 441–459.
odges, J. R., Garrard, P., & Patterson, K. (1998). Semantic demenA. Kertesz & D. G. Munoz (Eds.),Pick’s Disease and Pick Compl(pp. 83–104). New York: Wiley-Liss.
odges, J. R., Patterson, K., Oxbury, S., & Funnell, E. (1992). Setic dementia: Progressive fluent aphasia with temporal lobe atrBrain, 115, 1783–1806.
odges, J. R., Patterson, K., Ward, R., Garrard, P., Bak, T., Perry,al. (1999). The differentiation of semantic dementia and frontaldementia (temporal and frontal variants of frontotemporal demefrom early Alzheimer’s disease: A comparative neuropsycholostudy.Neuropsychology, 13, 31–40.
846 B.T. Gold et al. / Neuropsychologia 43 (2005) 833–846
Howard, D., & Patterson, K. (1992).Pyramids and Palm Trees: A Test ofSemantic Access from Pictures and Words. Thames Valey Publishing.
Howard, D., Patterson, K., Wise, R., Brown, W. D., Friston, K., Weiller,C., et al. (1992). The cortical localization of the lexicons: Positronemission tomography evidence.Brain, 115, 1769–1782.
Huff, F. J., Corkin, S., & Growden, J. H. (1986). Semantic impairment andanomia in Alzheimer’s disease.Brain and Language, 28, 235–249.
Kaplan, E., Goodglass, H., & Weintraub, S. (1983).Boston Naming Test.Philadelphia: Lea and Febiger.
Kertesz, A., Appell, J., & Fisman, M. (1986). The dissolution of languagein Alzheimer’s disease.Canadian Journal of Neurological Sciences,13, 415–418.
Kertesz, A., Hudson, L., Mackenzie, I. R., & Munoz, D. G. (1994). Thepathology and nosology of primary progressive aphasia.Neurology,44, 2065–2072.
Kucera, H., & Francis, W. N. (1967).The computational analysis ofpresent-day American English. Brown University Press.
Kuperberg, G. R., Broome, M., McGuire, P. K., David, A. S., Eddy, M.,Ozawa, F., et al. (2003). Regionally localized thinning of the cerebralcortex in schizophrenia.Archives of General Psychiatry, 60, 878–888.
Martin, A., & Fedio, P. (1983). Word production and comprehension inAlzheimer’s disease: The breakdown of semantic knowledge.Brainand Language, 19, 124–141.
Mesulam, M. M. (1982). Slowly progressive aphasia without generalizeddementia.Annals of Neurology, 11, 592–598.
Mesulam, M. M. (2001). Primary progressive aphasia.Annals of Neurol-ogy, 49, 425–432.
McKhann, G., Drachman, D., Folstein, M., Katzman, R., Price, D., &Stadlan, E. M. (1984). Clinical diagnosis of Alzheimer’s disease: re-port of the NINCDS-ADRDA work group under the auspices of the
mer’s
M sion
M k, R.y of
y and
N Black,us on
P und:
P ning:
P gical-
P men-
P ct of
P :ing
P . E.ng of
P , K.mpu-
P t ofing.
Pugh, K. R., Mencl, W. E., Shaywitz, B. A., Shaywitz, S. E., Fulbright, R.K., Constable, R. T., et al. (2000). The angular gyrus in developmentaldyslexia: Task-specific differences in functional connectivity withinposterior cortex.Psychological Science, 11, 51–56.
Raven, J. C. (1995).Colored Progressive Matrices Sets A, Ab, B. OxfordPsychological Press Ltd.: Oxford.
Rosas, H. D., Liu, A. K., Hersch, S., Glessner, M., Ferrante, R. J.,Salat, D. H., et al. (2002). Regional and progressive thinning ofthe cortical ribbon in Huntingtons disease.Neurology, 58, 695–701.
Salat, D. H., Buckner, R. L., Snyder, A. Z., Greve, D. N., Desikan, R.S., Busa, E., et al. (2004). Thinning of the cerebral cortex in aging.Cerebral Cortex, 14, 721–730.
Schwartz, M. F., Saffran, E. M., & Marin, O. S. M. (1980). Fractionatingthe reading process in dementia: Evidence for word-specific print-to-sound associations. In M. Coltheart, K. Patterson, & J. C. Marshall(Eds.),Deep Dyslexia(pp. 259–269). Routledge: London.
Seidenberg, M. S., & McClelland, J. L. (1989). A distributed, develop-mental model of word recognition and naming.Psychological Review,96, 523–568.
Shaywitz, B. A., Shaywitz, S. E., Pugh, K. R., Mencl, W. E., Fulbright,R. K., Skudlarski, P., et al. (2002). Disruption of posterior brain sys-tems for reading in children with developmental dyslexia.BiologicalPsychiatry, 52, 101–110.
Simons, J. S., Graham, K. S., & Hodges, J. R. (2002). Perceptual andsemantic contributions to episodic memory: evidence from semanticdementia and Alzheimer’s disease.Journal of Memory and Language,47, 197–213.
Simons, J. S., Verfaellie, M., Galton, C. J., Miller, B. L., Hodges, J. R., &Graham, K. S. (2002). Recollection-based memory in frontotemporal
S f 260iarity,an
S entia:
S ner,dle-
T e
T part?Bio-
V of thee
V R. S.ords
W ntic
W cem-
W -
W -
W ordy-
Department of Health and Human Services Task Force on Alzheidisease.Neurology, 34, 934–939.
orris, J. C. (1993). The clinical dementia rating (CDR): current verand scoring rules.Neurology, 43, 2412–2414.
ummery, C. J., Patterson, K., Price, C. J., Ashburner, J., FrackowiaS. J., & Hodges, J. R. (2000). A voxel-based morphometry studsemantic dementia: Relationship between temporal lobe atrophsemantic memory.Annals of Neurology, 47, 36–45.
eary, D., Snowden, J. S., Gustafson, L., Passant, U., Stuss, D.,S., et al. (1998). Frontotemporal lobar degeneration: A consensclinical diagnostic criteria.Neurology, 51, 1546–1554.
aap, K. R., & Noel, R. W. (1991). Dual route models of print to soStill a good horse race.Psychological Research, 53, 13–24.
atterson, K., & Hodges, J. R. (1992). Deterioration of word meaImplications for reading.Neuropsychologia, 30, 1025–1040.
atterson, K., & Kay, J. (1982). Letter-by-letter reading: Psycholodescriptions of a neurological syndrome.Quarterly Journal of Experimental Psychology, 34, 411–441.
atterson, K., Graham, N., & Hodges, J. R. (1994a). Reading in detia of the Alzheimer type: A preserved ability?Neuropsychology, 8,395–407.
atterson, K., Graham, N., & Hodges, J. R. (1994b). The impasemantic memory loss on phonological representations.Journal ofCognitive Neuroscience, 6, 57–69.
atterson, K. E., Marshall, J. C., & Coltheart, M. (1985).Surface dyslexiaNeuropsychological and cognitive studies of phonological read.London: Erlbaum Associates.
etersen, S. E., Fox, P. T., Posner, M. I., Mintun, M., & Raichle, M(1989). Positron emission tomographic studies of the processisingle words.Journal of Cognitive Neuroscience, 1, 153–170.
laut, D. C., McClelland, J. D., Seidenberg, M. S., & Patterson(1996). Understanding normal and impaired word reading: Cotational principles in quasi-regular domains.Psychological Review,103, 56–115.
rice, C. J., Moore, C. J., & Frackowiak, R. S. (1996). The effecvarying stimulus rate and duration on brain activity during readNeuroImage, 3, 40–52.
dementia: implications for theories of long-term memory.Brain, 125,2523–2536.
nodgrass, J. G., & Vanderwart, M. A. (1980). standardized set opictures: norms for name agreement, image agreement, familand visual complexity.Journal of Experimental Psychology: HumLearning and Memory, 6, 174–215.
nowden, J. S., Goulding, P. J., & Neary, D. (1989). Semantic demA form of circumscribed cerebral atrophy.Behavioral Neurology, 2,167–182.
nyder, A. Z., Sanders, A. L., Linenweber, W., Morris, J. C., & BuckR. L. (2000). Automated atrophy assessment AAA in young midage nondemented and demented older adults.Journal of CognitiveNeuroscience Supplement, 2, 115E.
alairach, J., & Tournoux, P. (1988).Co-planar Stereotaxic Atlas of thHuman Brain. New York: Thieme.
ulving, E. (2001). Episodic memory and common sense: how far aPhilosophical Transactions of the Royal Society of London B:logical Sciences, 356, 1505–1515.
andenberghe, R., Nobre, A. C., & Price, C. J. (2002). The responseleft temporal cortex to sentences.Journal of Cognitive Neuroscienc,15, 550–560.
andenberghe, R., Price, C., Wise, R., Josephs, O., & Frackowiak,(1996). Functional anatomy of a common semantic system for wand pictures.Nature, 383, 254–256.
arrington, E. K. (1975). The selective impairment of semamemory. Quarterly Journal of Experimental Psychology, 27, 635–657.
arrington, E. K., & James, M. (1991).The Visual Object and SpaPerception Battery. Bury St. Edmunds, UK: Thames Valley Test Copany.
echsler, D. (1955).Wechsler Adult Intelligence Scale. New York: Psychological Corporation.
echsler, D., & Stone, C. P. (1973).Wechsler Memory Scale. Psychological Corporation: New York.
eekes, B. S. (1997). Differential effects of number of letters on wand nonword naming latency.Quarterly Journal of Experimental Pschology: Human Experimental Psychology, 50, 439–456.