differentiation within the south african clothing industry
TRANSCRIPT

!!This%paper%was%presented%at%“Towards%Carnegie% III”,%a%conference%held%at%the%University%of%Cape%Town%from%3%to%7%September%2012.%%%Please%note%that%copyright%is%held%by%the%author/s%of%the%paper,%and%it%may%not%be% reproduced% or% transmitted% in% any% form% or% by% any% means,% electronic% or%mechanical,%including%photocopying,%recording,%or%by%any%information%retrieval%systems,%without%express%permission%from%the%paper's%author/s.%%

&(175(�)25�62&,$/�6&,(1&(�5(6($5&+
�
6XVWDLQDEOH�6RFLHWLHV�8QLW
'LIIHUHQWLDWLRQ�ZLWKLQ�WKH�6RXWK�$IULFDQ�&ORWKLQJ�,QGXVWU\��,PSOLFDWLRQV�IRU�:DJH�
6HWWLQJ�DQG�(PSOR\PHQW�
1LFROL�1DWWUDVV-HUHP\�6HHNLQJV
&665�:RUNLQJ�3DSHU�1R�����
-XO\������

1LFROL�1DWWUDVV� LV�'LUHFWRU�RI� WKH�$,'6�DQG�6RFLHW\�5HVHDUFK�8QLW� LQ� WKH�&HQWUH� IRU�6RFLDO�6FLHQFH�5HVHDUFK�DQG�3URIHVVRU�RI�(FRQRPLFV�DW�WKH�8QLYHUVLW\�RI�&DSH�7RZQ�
-HUHP\�6HHNLQJV�LV�'LUHFWRU�RI�WKH�&HQWUH�IRU�6RFLDO�6FLHQFH�5HVHDUFK�DQG�D�SURIHVVRU�RI�3ROLWLFDO�6WXGLHV�DQG�6RFLRORJ\�DW�WKH�8QLYHUVLW\�RI�&DSH�7RZQ�

1
Differentiation within the South African Clothing Industry: Implications for Wage Setting and Employment Abstract
The South African clothing industry is the most labour-intensive segment of South Africa’s manufacturing industry, but it is far from monolithic, encompassing a set of different sub-sectors with different market niches and production technologies. These encompass a higher-wage, less labour-intensive, mostly metro-based sector producing relatively high value-added top quality garments for upper income niche markets; and a lower-wage, more labour-intensive sector, mostly in KwaZulu-Natal and parts of the Free State, producing standardised basic clothing items for middle- and low-income consumers in a highly competitive international market. The more labour-intensive bottom end of the industry has been competing successfully against imports from low-wage countries – thus confounding the prevalent policy view that South Africa simply cannot compete with China – but it does so only by paying wages below the legal minima. The different segments of the clothing industry co-exist at different wage rates (i.e. there has been no single ‘race to the bottom’) because they cater to different product markets. Forcing all producers to pay the bargained minimum wage will result in the migration of low-wage jobs from South Africa to China, Lesotho and other lower-wage areas, without any gain to producers or workers in other parts of the South African clothing industry, or to South African consumers.

Introduction In 1962 H.A.F.Barker published a book on The Economics of the Wholesale Clothing Industry of South Africa, 1905-1957. He traced the clothing industry from its origins in Cape Town at the turn of the century through its growth on the Witwatersrand in the 1920s and ‘30s, and rapid growth countrywide during and after the Second World War. With strengthened protection against imports, employment grew to an estimated 50,000 workers in the late 1950s. The workforce comprised primarily white women (on the Witwatersrand, protected by job reservation policies) and coloured women (in Cape Town). From the outset, the clothing industry was characterised by inter-regional wage differentiation, with higher wages in Johannesburg than elsewhere. In the 1920s and 1930s, manufacturers in Cape Town and elsewhere resisted having Johannesburg-level wages imposed on them. In the 1940s and 1950s, many lower-wage producers in Johannesburg relocated to smaller towns such as Parys and Kroonstad (across the provincial border in the northern Orange Free State), Charlestown and Ladysmith (across the provincial border in northern Natal), and Stanger, Port Shepstone and George (along the Natal and Cape coasts). In these newer industrial areas, the majority of workers were African. Barker reports that labour productivity in the newer industrial areas was lower than on the Witwatersrand (or in Cape Town), and distance from both the sources of textiles and clothing markets raised costs, but these were offset by massive differences in wage rates. An investigation by the Wage Board found that, in 1955, the average weekly wage on the Witwatersrand was between two and three times the wages in the new industrial areas. Whilst the industry as a whole was labour-intensive, in the metropolitan areas it was becoming more capital- and skill-intensive, with higher productivity and wages, whilst in other areas productivity and wages were low, and production remained very labour-intensive. Studies of the subsequent transformation of South Africa’s clothing industry similarly emphasized the importance of wages in shaping industrial location and employment creation. Bell (1983, 1986) and Hart and Todes (1997) show how clothing employment grew rapidly in decentralized industrial areas within and adjacent to the bantustans, aided by government incentives (1954-1996) and exemption from the systems of minimum wage-setting through either collective bargaining in industrial councils or wage determinations by the Wage Board (for areas outside of bantustans not covered by industrial councils). Decentralisation was encouraged further by apartheid legislation that imposed constraints on the employment of black workers in Johannesburg (Rogerson and Kubben, 1982). But even after job reservation was scrapped and decentralisation incentives were reduced from 1991 and ended in 1996, firms continued to locate in non-metro areas for wage-related reasons (Robbins et al., 2004: 25-26).
3
The combination of inter-regional wage differentiation and high levels of tariff protection was crucial in the development of South Africa’s clothing industry, which was the vanguard of South African import-substitution industrialisation (Nicol, 1984; Rogerson, 2004; Gibbon, 2004:158; Freund, 2011). Total wage employment in the clothing industry rose to 170,000 in the early 1980s, and remained close to this level into the early 1990s. The proportion of wage employment in the Transvaal declined from about 50 percent in the 1940s to 10 percent by 1985. Cape Town became the centre of higher-wage production. Meanwhile, the proportion of employment in areas outside of industrial councils’ jurisdictions rose to about 30 percent by 1991 (Altman, 1994: 8, 38, 41 and 200). Clothing manufacturing has always had the taint of the sweatshop, prompting moral outrage. The persistence of the lower-wage, more labour-intensive sub-sector into the 1990s and 2000s has come to be regarded with particular alarm, perhaps because it raises fears of a ‘race to the bottom’ as ‘fly-by-night’ clothing firms move in search of lower labour costs, at the precise moment in South African history when policy-makers and trade unionists believe they are on the verge of achieving ‘decent’ work. While it is certainly true that labour costs have been and remain a crucial component of competitiveness in the clothing industry, it is also the case that higher-wage firms can compete with low-wage firms if their productivity is correspondingly higher. This is most easily done by producing for product markets where consumers are prepared to pay a premium for trimmings, quality, fashion and branding, i.e. in market niches where there is relatively high ‘value-added’ in the value chain between inputs and sales price and where quick turn-around times are an advantage. In 1962, Barker observed that some firms stayed in Johannesburg because they could produce ‘high-grade fashion wear’ to relatively high-income people where the higher wage costs could be ‘passed on to the consumer’ (1962: 410). A study of clothing firms and retailers in Johannesburg in the late 1990s found that this continued to be the case (Kesper, 1998). By contrast, firms that set up operations in non-metro areas (and in Durban) focussed on different products and with different consumers in mind. The first factory to move away from an industrial council area to Umtata (in 1949) was a factory ‘producing cheap men’s and boy’s outerwear, and shirts, of cotton, rayon or fiocco’, and the first factory to move to Charlestown from Johannesburg (in 1950) produced ‘lower-grade men’s and boy’s outerwear and shirts’ (Barker, 1962: 109). Such goods were clearly aimed at middle- and lower-income consumers, who comprised a growing product market due to the sharp rise in real wages earned by black workers during the war (Nattrass, 1993). For these

consumers, price was crucial. Firms producing in this market were and are typically low-margin operations posing little if any threat to the high-valued added fashionable end of the industry in the metro areas. Indeed, in the mid-1950s, profit rates were 6.5 times higher in Johannesburg than in non-metro (‘other’) areas, despite wages being three times higher in Johannesburg (Barker, 1962: 408). Almost half a century after Barker’s pioneering study of the South African clothing industry, Coughlin et al. (2004) emphasised the importance of differentiated target markets for clothing producers in Southern Africa, noting that areas with cheap labour have a comparative advantage in ‘garment manufacturing in the low end of the market’ and that those with ‘more expensive labour have sophisticated, high precision clothing factories with the ability to make original and appealing designs for the high end of the market where they are still competitive’ (2004: 61). They note that different product markets are associated with different wage and production strategies. Specifically, they distinguish between niche markets focussed on the rapid production of high price, high quality product-specific goods in small to medium production runs, and mass markets focused on medium quality, low price, generic to moderately product-specific goods in medium to large production runs (ibid: 56). The fact that the clothing industry produces a range of products, for different consumers using production processes with different combinations of average wage, productivity and labour-intensity has been side-lined, if not lost altogether, in post-apartheid debates about industrial policy. Rather, trade unions and industrial policy-makers emphasise the supposedly uniform need to ‘move up the value chain’ where higher wages (and ‘decent work’) are possible (see e.g. Altman, 1994). This has been informed by a theoretical perspective which holds that capitalism is moving away from Fordist, inflexible, mass production systems based on semi-skilled labour, towards post-Fordist, more versatile modular and flexible systems involving skilled labour, greater design and quality. The policy implication is that South Africa should adopt the latter ‘high road’ to growth. But, as Gibbon points out, questions can be raised about the applicability of this ‘high/low road’ model – with ‘normative suggestion of a hierarchy of forms of firm-level industrial organisation’ – to developing countries (Gibbon, 2004: 155-6). He argues that there are opportunities for upgrading in a range of ‘value-chains’, not all of them oriented to branded, high-quality products. South Africa’s industrial policy is strongly oriented towards value-chain alignment in the metro areas, and in product markets dominated by large retailers targeting middle and high-income consumers. Industrial consultants,

5
supported by government grants have set up clothing ‘clusters’ in Durban and Cape Town to bring about ‘value-chain alignment’ where retailers work more closely with local firms to produce quality output with rapid turn-around times for the fast fashion, high-end, niche markets. The bottom end of the market – despite producing basic clothing items for low- and middle-income consumers, and thus contributing significantly to raising their real living standards – is either ignored, or derided as an undesirable ‘sweatshop’ sector, with no potential for productivity growth or sustained competitiveness. Using minimum wages to push them out of business is thus seen as a necessary culling. In this paper, we argue that low-wage clothing firms in the non-metro areas are important for job creation precisely because they are very labour-intensive and because they produce a socially necessary product (affordable clothes for the majority of people) in competition with imports. It opens with an overview of structural adjustment in the South African clothing industry, focussing in particular on the post-apartheid era. We argue that declining tariff protection and the entry of China into the global clothing market are crucial contextual factors, but that rising minimum wages – especially after the formation of the National Bargaining Council for the Clothing Manufacturing Industry (NBC) in 2002 – and the strengthening of the Rand from 2003 served to put additional pressures on the industry. Drawing on existing studies and interviews with firms in Cape Town and Newcastle, and on data from the NBC in KwaZulu-Natal (KZN), we argue that important differences are evident between the ‘top’ end of the market (niche, fast-fashion, full-line relatively capital-intensive production using expensive inputs like wool, mostly in urban areas) and the ‘bottom’ ultra-labour intensive end producing basic clothing items for the mass market using simple machinery and cheaper inputs. These firms produce for large clothing retailers mostly via ‘design houses’, i.e. middle-men who supply patterns and materials to cut-make and trim (CMT) operations in South Africa. Forcing these firms to pay higher minimum wages will shift this business from South Africa to low-wage neighbouring countries – or, if retailers are compelled or persuaded to ‘buy South Africa’, the additional price tag will be passed on to South Africa’s low- and middle-income consumers.

Structural Adjustment in the Post-Apartheid Clothing Industry South Africa’s clothing industry accounted for about 10 percent of manufacturing jobs in 1994. The industry varied significantly across regions. As is the case internationally, clothing firms with a higher proportion of wages to total expenditure – typically the cut-make-and-trim (CMT) operations producing standardised items for the bottom end of the domestic and international clothing market – were located in non-metro areas, as well as in Durban. Wages in Cape Town and Johannesburg were approximately three times higher than in areas like Newcastle and Botshabelo. Wages lay between these poles in the Eastern Cape, the northern Free State and Northern Cape. Firms remaining in the metro areas, notably Cape Town, typically produced for the fashionable top end of the domestic clothing market, often in full-line, specialised production facilities and using higher quality material such as wool (Barnes, 2005). The transition to democracy brought significant changes in labour-market and industrial policy. The 1995 Labour Relations Act strengthened and encouraged collective bargaining, transforming industrial councils into bargaining councils, and facilitating the extension of collective agreements to non-parties. The South African Clothing and Textile Workers Union (SACTWU) was formed to represent most workers across the clothing, textiles and footwear sectors. It was able to drive wages sharply higher in the bargaining council areas through a closed shop agreement (and the extension of agreements) (Altman, 1996: 392; Gibbon, 2004: 162). Wages were raised in areas outside of the bargaining councils’ jurisdictions by the Wage Board and its successor, the Employment Conditions Commission. Between 1997 and 2003, real minimum wages were raised by 50 percent in areas such as Newcastle and Ladysmith (in KZN) and Phutaditjaba (in the Free State), but remained very much lower than in the bargaining council areas, and especially relative to Cape Town and Johannesburg. Opposed to the persistence of lower wages in areas like Newcastle, and of regionally-specific wage negotiations, SACTWU drove moves to establish a national bargaining council that could set minimum wages across the entire country and permit only limited inter-regional wage differentiation. The NBC was established in 2002, and the first national wage agreement was extended across the whole of South Africa in July 2003. Between 2002 and 2010, the NBC (together with the Minister of Labour who extended the agreements to all firms via the government gazette) raised minimum wages in the lowest-wage areas by a further 50 percent, in real terms. Further real increases were agreed and extended at the end of 2010.

7
This sustained attack on inter-regional wage differentiation coincided with changes in industrial policy, as tariffs were reduced sharply, faster even than required by the then international General Agreement on Tariffs and Trade (Edwards et al., 2009). This lowered the cost of imported material, but these benefits for the clothing sector were outweighed by the fall in tariffs on imported clothing from 90 percent in 1996 to 40 percent in 2002 (Anstey, 2004: 1842). The effects of tariff reductions and rising minimum wages on profit margins (and hence employment) were exacerbated, from 2003, by the appreciation of the Rand. It is difficult to obtain a precise picture of trends in clothing employment in the 1990s. The industrial or bargaining councils collated data on employees in registered firms, but these did not cover the entire country until 2003 and always omitted employees in unregistered firms. The DTI provide data from 1993, but it is unclear precisely what the data cover.1 The Labour Force Survey (LFS), conducted by Statistics South Africa, provides data only from 2000. Overall, it seems likely that employment was broadly stable through the 1990s, with perhaps a slight upturn at the end of the decade as exports to the USA benefited from the African Growth and Opportunity Act (AGOA) as well as a weak Rand. A SWOT analysis of South Africa’s clothing industry in 2000 concluded that despite production costs being higher than Asia, South Africa was internationally competitive in CMT at the basic item labour-intensive end of the industry because of faster response times from local firms compared to firms in East Asia (Engelbrecht, discussed in Anstey, 2004: 1843). This seemed to be borne out as clothing exports to the US leaped from $32.2 million in 2001 to $134.3 million in 2003. However, South Africa’s comparative advantage was short lived. After China joined the WTO in 2001, and especially after the multi-fibre arrangement (which had imposed quotas on imports from large Asian countries to developed countries) ended in 2004, China rapidly expanded its export production. When the Rand depreciated sharply (from R6.94 to the US dollar in 2000 to R10.52 in 2002), many South African firms reneged on their contracts to supply domestic retailers in order to get into the lucrative export market (Morris and Einhorn, 2008). Domestic retailers scrambled for 1 http://apps.thedti.gov.za/econdb/Statssa2.asp. The DTI data approximately track data from the NBC from 2003 (see Figure 3 below). The first data (for 1993) are higher than data for employment in areas covered by industrial councils (as reported in Altman, 1994: 41 and 200), but a lot lower than data on total employment including employees outside of the industrial council areas (ibid; see also Godfrey, 1997: 48). The data for 1998-2003 are substantially higher than the aggregate data from bargaining councils. The data for the 2000s are substantially lower than estimates derived from the Labour Force Surveys (see Figure 3 below).

alternatives and ‘discovered’ China. When the Rand strengthened after 2002, South African clothing exports plummeted (to a paltry $5.5 million in 2011) and imports rose sharply (despite a tariff of 45 percent on imported clothing as well as temporary restrictions on Chinese imports in 2007 and 2008). Clothing imports from China comprised 61 percent of total South Africa clothing imports by 2008 and 74 percent by 2010 (AMSA, 2011: 1). South Africa’s international competitiveness was undermined further by relatively high wages and labour costs. Data for the early 2000s show that productivity in South Africa was a little higher than in other African countries but a little lower lower than in India or China. South African’s high wages meant, however, that labour costs per unit of output were more than double the costs in China and more than treble the costs in countries such as Lesotho and Mozambique (Shakya, 2011: 226). Morris and Barnes (2008: 33-4) report data on relative labour costs for a different set of competitors, but unfortunately do not provide data on productivity. They also put South African labour costs at $1.75/hour, which is approximately double the costs in Chinese (which vary between $0.55 and just over $1) and four to five times higher than in Bangladesh, Cambodia, Pakistan, Vietnam and Sri Lanka. Morris and Barnes report that labour costs in South Africa were slightly lower than costs in Turkey or Brazil. The domestic retail sector is highly concentrated, with a handful of national retail chains accounting for between 60 and 70 percent of domestic sales (Robbins et al., 2004: 15), and is able to use its economic power to source large international orders and to hold South African domestic firms to international prices. South African clothing producers thus have to meet international prices or focus on smaller, higher-value added, ‘fast-fashion’ orders where style requirements and response times potentially give local firms an edge. But even here, competitive pressures are strong from nearby countries like Lesotho and Swaziland. Lesotho, largely through the impetus provided by AGOA and the Cotonou agreement (which provided access to the EU market) has developed a vibrant clothing industry specialising in denim, workwear and knit-wear. It became the largest exporter of clothing to the US in Sub-Saharan Africa (Morris et al., 2011: 97). In mid-2007, almost fifty major firms employed a total of 47,000 workers. These included firms which relocated to take advantage of Lesotho’s advantageous tax regime, lower minimum wages and explicit acceptance of piece rate payment (Shakya, 2011).2 Whilst the majority of this workforce was 2 The benefits of relocating to Lesotho were carefully set out in a glossy Practical Guide to Doing Business in Lesotho, produced by the Lesotho Ministry of Trade and Industry, Cooperatives and Marketing (Lesotho, 2008), and on the website (funded by the British
9
employed in factories producing for export to the USA, more than 5,000 workers were working for eight companies producing primarily for the South African market,3 including (for example) Tern Sportswear, which moved from Isithebe (on the KZN North Coast). The industry contracted as a result of the 2008 global financial crisis, but as of 2010, employment had stabilised to around 40,000 workers (ibid: 221). Employment in the clothing industry in Swaziland has stabilised at around 12,000 (Morris et al., 2011: 102). Minimum wages in Lesotho and Swaziland are much lower than in South Africa. Between October 2006 and September 2007, the minimum weekly wage for a general worker or a ‘trainee’ (i.e. beginner) machinist in the Lesotho clothing industry was R170 (or R686 per month, R36 per day). The minimum for non-trainee machinists was R184 per week (or R738 per month, R38 per day) (Labour Code Wages (Amendment) Order, 2007, reproduced in Lesotho, 2008: 20). This compares to minimum wages in the clothing industry in South Africa at the same time of about R300 per week in non-metro areas, R400/week in Durban, and R500/week in Cape Town. Lesotho also expressly allows employers to pay on a piece rate or through bonuses. As Morris et al. report, growing numbers of South African investors have opened production plants in Lesotho and Swaziland to take advantage of these relatively low costs and to escape ‘the rigid and inflexible labour market conditions governing South African labour relations’ and to enjoy a ‘more compliant union environment’ (2011: 98, 102, 106). These South African-owned operations are easily able to continue to supply South African retailers as Lesotho and Swaziland are members of the Southern Africa Customs Union gives them duty-free access to the South African market. Geographical proximity with South Africa allows South African clothing manufacturers to retain their head offices in South Africa and to send managers to Lesotho and Swaziland when necessary (ibid: 106). Between 2006 and 2010, clothing exports from Lesotho to South Africa increased twenty-fold (from R17m to R335m) (Staritz and Morris, 2011: 9). South African-owned and South African market-directed firms in Lesotho specialised in shorter run and quicker response products with higher fashion content and have direct relationships with the large South African retailers (Morris et al., 2011: 105). As Staritz and Morris observe:
Department for International Development, DfID) of the Lesotho Textile Exporters Association. 3 BA Tex (1997), Jonsson (2002), Humin Jeanswear (2002), Ace Apparel (2005), Corporate Clothing (2006), Chelsea West (2006), Peter Blond (2006) and Tern Sportswear (2007).
‘South African apparel manufactures aim to transfer further production as well as some higher value-adding pre-and post-production functions (e.g. pattern making fabric management, logistic co-ordination) from South Africa to Lesotho as they are pushed out of the South African operating environment by high costs and labour market rigidities, and pulled to Lesotho by the lower operating costs and the proximity of these manufacturing locations to their operations in South Africa’ (2011: 11).
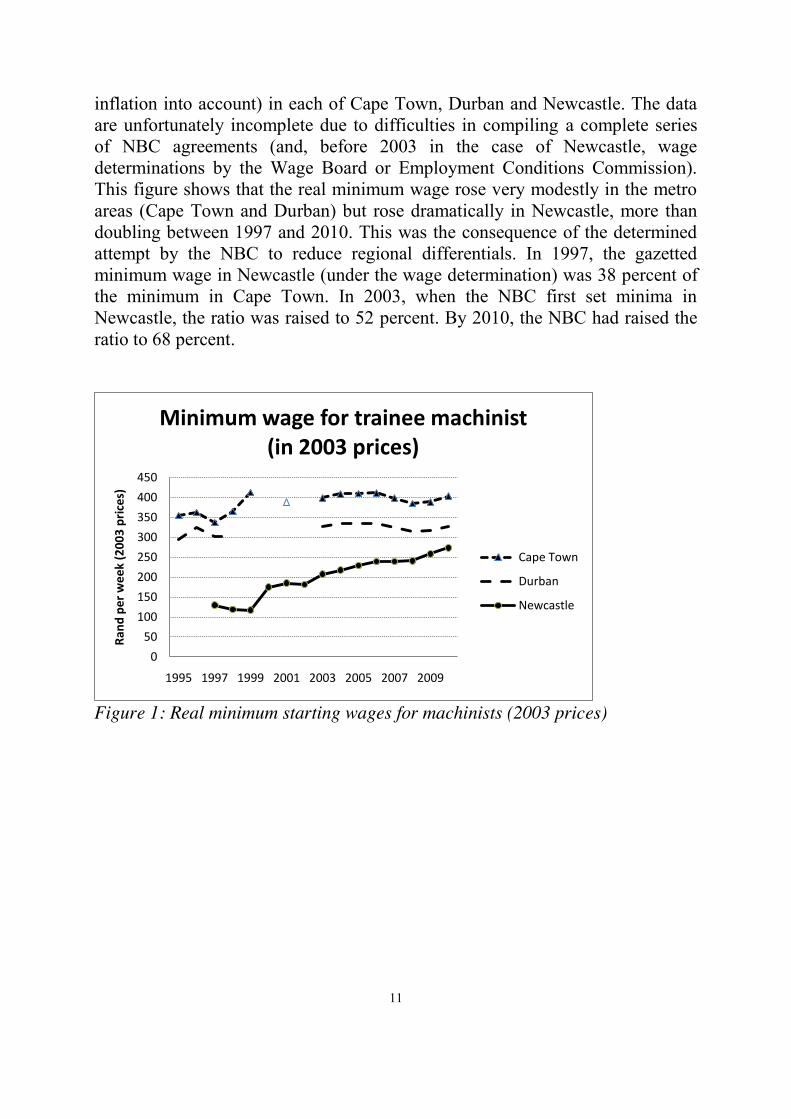
In 2009, the South African textile and clothing giant Seardel opened a new subsidiary in Lesotho, NyeNye Clothing. At almost exactly the same moment, Seardel announced that it intended to close one of its subsidiaries in Cape Town, Intimate Apparel, with the loss of 800 jobs. Because Hosken Consolidated Investments (HCI) owned 71 percent of Seardel, and SACTWU owned 40 percent share in HCI, the union was compromised by this indirect shift in operations from higher-wage Cape Town to lower-wage Lesotho. SACTWU’s Andre Kriel was forced to argue that Seardel was motivated by a concern to save jobs, not to make a profit. NyeNye Clothing, he said, paid ‘above the legal minimum wage’ in Lesotho, ‘and complies with all other Lesotho labour laws. Our role, together with our Lesotho counterparts, is to advance our agenda for decent work in southern Africa, including in Lesotho’. As other observers noted, however, compliance with the minimum wage in Lesotho meant paying wages a lot lower than non-compliant firms in South Africa, which the union was determined to close down.4 The mid 2000s were a time of great adjustment and economic turmoil in the South African clothing industry. But globalisation was not the only source of adjustment pressures. Indeed, South Africa’s low-wage labour-intensive export sector located in the non-metro areas was subject to a ‘perfect storm’ of rising international competition and wage pressure. For example, in Newcastle, an old industrial decentralisation area where the municipality had, in the 1980s and 1990s, actively recruited investment in the clothing industry from Taiwan, Hong Kong and subsequently China, minimum wages for experienced machinists were increased by the ECC in 2000 from R109.60 per week to R236.76 per week, and then rose further to R301.95 in 2003 as a consequence of the first collective agreement in the NBC (Robbins et al., 2004: 33). Minimum starting wages (for the first six months of employment) followed a similar trajectory. Figure 1 shows data on gazetted minimum starting wages for machinists (for the first six months of employment), in real terms (i.e. taking 4 Anna-Maria Lombard, ‘Union owns stake in sweatshop’, City Press 20 Sep 2009 (republished on http://www.ifashion.co.za/index.php?option=com_content&task=view&id=3083).
11
inflation into account) in each of Cape Town, Durban and Newcastle. The data are unfortunately incomplete due to difficulties in compiling a complete series of NBC agreements (and, before 2003 in the case of Newcastle, wage determinations by the Wage Board or Employment Conditions Commission). This figure shows that the real minimum wage rose very modestly in the metro areas (Cape Town and Durban) but rose dramatically in Newcastle, more than doubling between 1997 and 2010. This was the consequence of the determined attempt by the NBC to reduce regional differentials. In 1997, the gazetted minimum wage in Newcastle (under the wage determination) was 38 percent of the minimum in Cape Town. In 2003, when the NBC first set minima in Newcastle, the ratio was raised to 52 percent. By 2010, the NBC had raised the ratio to 68 percent.
Figure 1: Real minimum starting wages for machinists (2003 prices)
0
50
100
150
200
250
300
350
400
450
1995 1997 1999 2001 2003 2005 2007 2009
Ran
d p
er
we
ek
(20
03
pri
ces)
Minimum wage for trainee machinist (in 2003 prices)
Cape Town
Durban
Newcastle

Figure 2: Real minimum starting wages for machinists (in US dollars)
Figure 2 shows that the strong rand between 2007 and 2010 resulted in gazetted minimum wages rising, in dollar terms, even in the metropolitan areas, whilst the minimum wage in Newcastle rose even more dramatically – tripling over the period 1997-2010 – gutting the export sector in the process. Have Jobs really been lost, or have they just become informal? There is a persistent narrative that the decline in the South African clothing industry from the late 1990s onwards has been counter-acted, perhaps even matched, by an increase in informal employment as firms go ‘under the radar’ by shutting down registered operations and starting non-compliant businesses, even in people’s garages. According to an inspector from Durban, “when factories are liquidated often what happens is supervisors and managers buy the machines and employ former factory staff to manufacture in their garages” (quoted in Skinner and Valodia, 2002: 82). Rogerson references several studies in support of his observation that the growth in informal clothing employment in the late 1990s was ‘inextricably linked to the downturn in the formal clothing economy as thousands of retrenched workers have set up their own small clothing enterprise’ (2000: 693; see also ). The same claim was made in 2011 by Johann Baard, the head of the new national manufacturers’ association, AMSA, in an interview (June 2011).5
5 In 1994 Baard was reported to have estimated that 40% of production in the Western Cape was produced by unregistered firms, whilst a spokesman for CMT producers claimed in 1995
0
10
20
30
40
50
60
70
80
90
100
1995 1997 1999 2001 2003 2005 2007 2009
US$
pe
r m
on
thMinimum wage for trainee machinist
(in US dollar terms)
Cape Town
Durban
Newcastle

13
Figure 3: Employment in clothing industry (SIC 314) 2000-2011 But this narrative is supported by casual observation only, and is not reflected in the available survey statistics. Figure 3 reports data on employment from the NBC, DTI and LFS. The NBC and DTI data differ before 2003, presumably because the NBC data exclude until 2003 employment in areas such as Newcastle which until then were outside of the bargaining councils’ jurisdiction. The LFS picks up many more clothing jobs than the NBC or DTI, because it surveys a large national sample of households and therefore records the full range of formal, informal and self-employment in clothing. The LFS data, like the NBC and DTI data, show that employment has been on a trend decline since 2003-04. This suggests that jobs lost in the formal sector have not been compensated for by rising informal clothing employment. Indeed, Godfrey et al. show that the number and proportion of jobs in enterprises that are not compliant with bargaining council wages and conditions of employment has shrunk, perhaps because some enterprises have become formal, but more likely because they have gone out of business (Godfrey et al., 2010: 162). Jobs have been lost to other countries, including not only China but also Lesotho, where employment in the clothing sector doubled between 2000 and 2007 (Shakya, 2011: 221). This is a serious problem for South Africa where, depending on the definition, about a quarter or a third of the labour force is unemployed.6 Job creation is
that there were 16,000 sewing machines in the informal sector in Mitchell’s Plain alone (Godfrey, 1997: 126, fn 67). 6 The October 2011 LFS recorded a 24% unemployment rate if only active job seekers are included in the labour force, and a rate of 33% if the so-called ‘discouraged’ work-seekers (who want work but have given up looking for it) are included in the definition. (Statistical release PO211,
0
50000
100000
150000
200000
250000
300000
2000 2001 2002 2003 2004 2005 2006 2007 2008 2009 2010 2011
Employment, 2000-2010
Total workers in the clothing industry, incl. self-employed (LFS)
Estimated waged employment (LFS)
Registered workers in registered firms (NCBC)
DTI data

urgently required and the clothing industry is one of the most efficient ways to do this, especially in poverty-stricken non-urban areas. As noted by, for example, SACTWU official Etienne Vlok, the clothing industry is in many areas ‘the only source of formal employment and very many families are dependent on it for their survival’ (Vlok, 2006: 227). Although the role of low wages should never be romanticised, it is the case that even relatively low clothing wages form an element of household multiple livelihood strategies and can be especially important for women (Hart and Todes, 1997: 46-7). Many clothing workers are the key breadwinners in poor households, in areas where there are few or no other employment opportunities; the loss of even a low-wage job relegates households into poverty (Van der Westhuizen, 2006: 12-14). Figure 4 presents earnings data from the September 2005 LFS. In 2005-06, the minimum monthly wage for machinists was about R1,600 in Cape Town and about R1,000 in non-metropolitan areas such as Newcastle. Workers employed at below minimum wages, i.e. by non-compliant employers, would have been in the fourth and fifth columns respectively (i.e. R501-1,000 and R1,001-1,500). These jobs are among the lowest-waged, full-time formal jobs in South Africa. (Most lower-paying jobs are part-time). If the clothing industry was a high-profit industry, one could reasonably mount an argument for raising minimum wages and forcing employers to pay higher wages to their workers. But, as argued below, profit margins are tight and because of the relatively high share of wages in total costs, increases in the wage are profoundly threatening to employment, especially for the ultra labour-intensive bottom end of the clothing industry.
Figure 4: Distribution of employment by earnings and kind of employment, 2005 http://www.statssa.gov.za/PublicationsHTML/P02114thQuarter2011/html/P02114thQuarter2011.html
Monthly earnings by type of work (as % of all working people; Sep 2005)
0
2
4
6
8
10
12
14
16
18
0 1-200 201-500
501-1000
1001-1500
1501-2500
2501-3500
3501-6000
6001-11000
11001+ refuse don'tknow
unpaid work infamily business
small business
subsistencefarming
domesticemployees
employeesexcept domestic
15
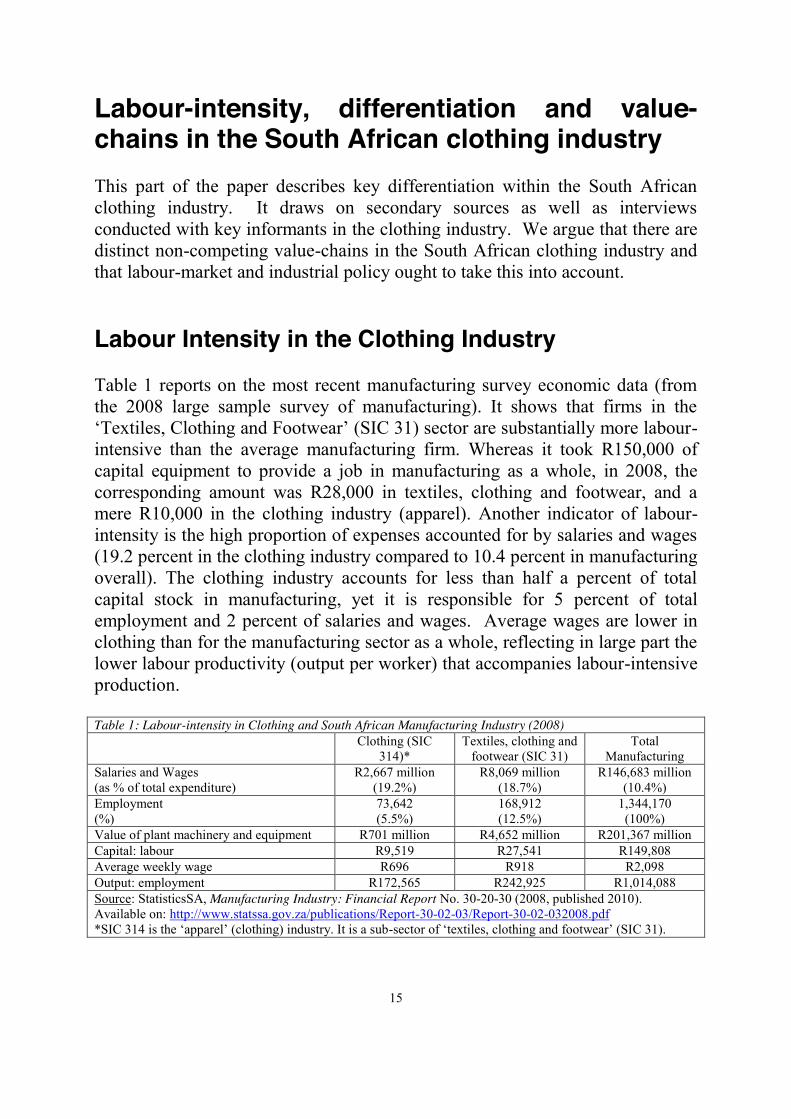
Labour-intensity, differentiation and value-chains in the South African clothing industry This part of the paper describes key differentiation within the South African clothing industry. It draws on secondary sources as well as interviews conducted with key informants in the clothing industry. We argue that there are distinct non-competing value-chains in the South African clothing industry and that labour-market and industrial policy ought to take this into account. Labour Intensity in the Clothing Industry Table 1 reports on the most recent manufacturing survey economic data (from the 2008 large sample survey of manufacturing). It shows that firms in the ‘Textiles, Clothing and Footwear’ (SIC 31) sector are substantially more labour-intensive than the average manufacturing firm. Whereas it took R150,000 of capital equipment to provide a job in manufacturing as a whole, in 2008, the corresponding amount was R28,000 in textiles, clothing and footwear, and a mere R10,000 in the clothing industry (apparel). Another indicator of labour-intensity is the high proportion of expenses accounted for by salaries and wages (19.2 percent in the clothing industry compared to 10.4 percent in manufacturing overall). The clothing industry accounts for less than half a percent of total capital stock in manufacturing, yet it is responsible for 5 percent of total employment and 2 percent of salaries and wages. Average wages are lower in clothing than for the manufacturing sector as a whole, reflecting in large part the lower labour productivity (output per worker) that accompanies labour-intensive production. Table 1: Labour-intensity in Clothing and South African Manufacturing Industry (2008) Clothing (SIC
314)* Textiles, clothing and
footwear (SIC 31) Total
Manufacturing Salaries and Wages (as % of total expenditure)
R2,667 million (19.2%)
R8,069 million (18.7%)
R146,683 million (10.4%)
Employment (%)
73,642 (5.5%)
168,912 (12.5%)
1,344,170 (100%)
Value of plant machinery and equipment R701 million R4,652 million R201,367 million Capital: labour R9,519 R27,541 R149,808 Average weekly wage R696 R918 R2,098 Output: employment R172,565 R242,925 R1,014,088 Source: StatisticsSA, Manufacturing Industry: Financial Report No. 30-20-30 (2008, published 2010). Available on: http://www.statssa.gov.za/publications/Report-30-02-03/Report-30-02-032008.pdf *SIC 314 is the ‘apparel’ (clothing) industry. It is a sub-sector of ‘textiles, clothing and footwear’ (SIC 31).
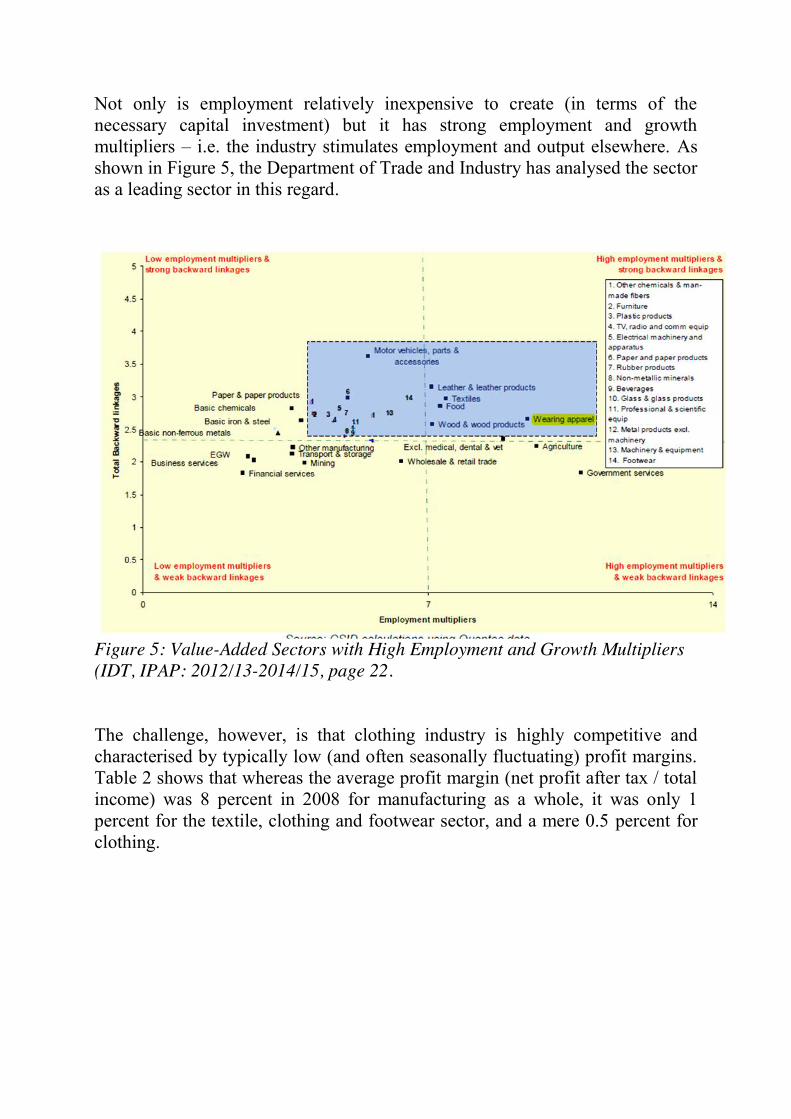
Not only is employment relatively inexpensive to create (in terms of the necessary capital investment) but it has strong employment and growth multipliers – i.e. the industry stimulates employment and output elsewhere. As shown in Figure 5, the Department of Trade and Industry has analysed the sector as a leading sector in this regard.
Figure 5: Value-Added Sectors with High Employment and Growth Multipliers (IDT, IPAP: 2012/13-2014/15, page 22.
The challenge, however, is that clothing industry is highly competitive and characterised by typically low (and often seasonally fluctuating) profit margins. Table 2 shows that whereas the average profit margin (net profit after tax / total income) was 8 percent in 2008 for manufacturing as a whole, it was only 1 percent for the textile, clothing and footwear sector, and a mere 0.5 percent for clothing.

17
Table 2: Profits in Clothing and the South African Manufacturing Industry (2008)
Clothing SIC 31 (textiles
clothing and footwear)
Total Manufacturing
1) Total Income R13,813 million
R43,301 million R1,526,502 million
2) Total Expenditure R13,892 million
R43,040 million R1,414,941 million
3) Closing inventories minus opening inventories
R289 million R686 million R45,546 million
4) Net profit before tax (1-2+3)
R210 million R947 million R157,107 million
5) Tax R143 million R524 million R42,794 million 6) Net profit after tax (4-5) (%)
R67 million (0.06%)
R423 million (0.4%)
R114,313 million
7) Profit margin (6/1) 0.5% 1% 8% Source: Manufacturing Industry: Financial Report No. 30-20-30 (2008). Published 2010. Available on: http://www.statssa.gov.za/publications/Report-30-02-03/Report-30-02-032008.pdf. Differentiation with the clothing industry Whilst labour-intensive in comparison to other manufacturing sectors, the clothing industry encompasses a mix of production processes and products requiring different levels of skill (and sophistication of equipment). This has shaped the location of clothing firms within and across countries and resulted in different global value chains (see e.g. Staritz and Morris, 2011; Gibbon 2005, 2008). In Southern Africa, the more complex clothing products (with greater detail, trimming etc – all of which boosts value-added) tend to be produced in South African metro areas where workers are more skilled – and where communication between suppliers and retails is easier and turn-around times potentially faster. Wages in these metro-based firms are typically higher, but given the more sophisticated machinery required and higher quality garments, the wage bill is a smaller share of total costs than is the case with low-wage, labour intensive operations. Some of the larger South African retailers (like Foschini) have in-house design capacity and relationships with a range of CMT operations in different regions. According to industry sources, metro-based CMT firms are typically given contracts for the manufacture of quality products for the top end of the market, especially fashionable items requiring a quick turn-around from order to delivery. These operations are often small, but employ relatively skilled workers capable of using the more sophisticated machinery necessary for working on chiffons etc. with greater design content.
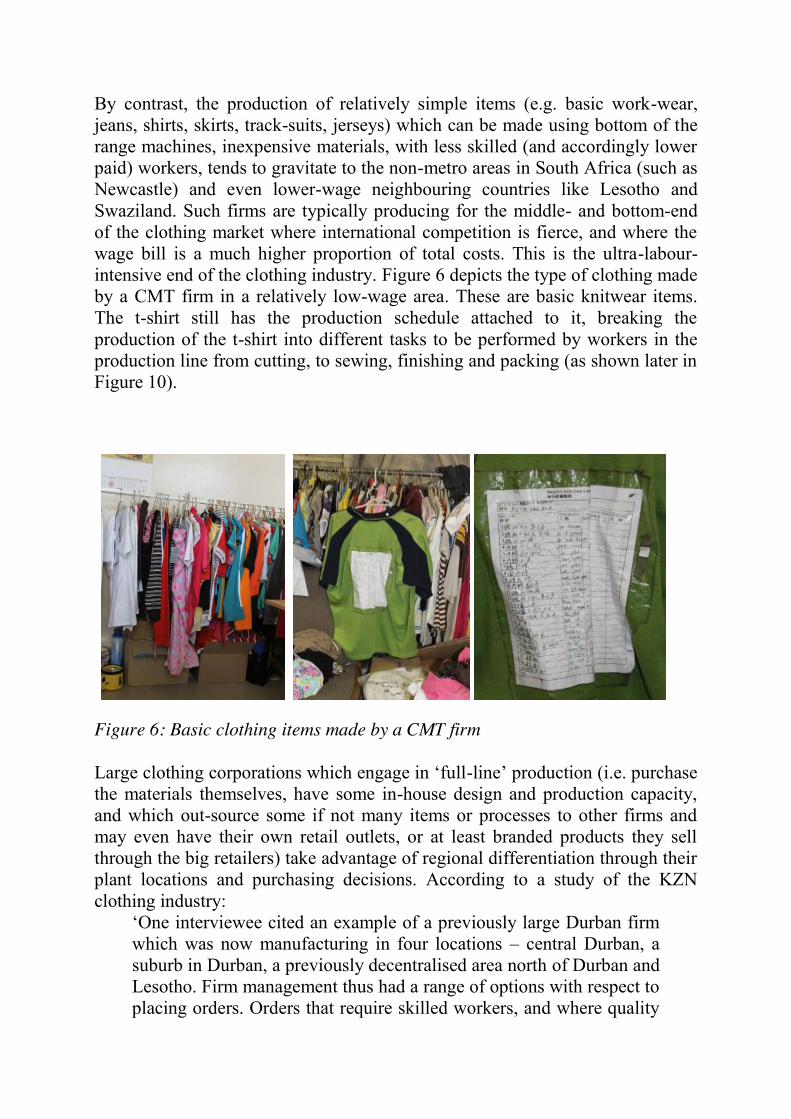
By contrast, the production of relatively simple items (e.g. basic work-wear, jeans, shirts, skirts, track-suits, jerseys) which can be made using bottom of the range machines, inexpensive materials, with less skilled (and accordingly lower paid) workers, tends to gravitate to the non-metro areas in South Africa (such as Newcastle) and even lower-wage neighbouring countries like Lesotho and Swaziland. Such firms are typically producing for the middle- and bottom-end of the clothing market where international competition is fierce, and where the wage bill is a much higher proportion of total costs. This is the ultra-labour-intensive end of the clothing industry. Figure 6 depicts the type of clothing made by a CMT firm in a relatively low-wage area. These are basic knitwear items. The t-shirt still has the production schedule attached to it, breaking the production of the t-shirt into different tasks to be performed by workers in the production line from cutting, to sewing, finishing and packing (as shown later in Figure 10).
Figure 6: Basic clothing items made by a CMT firm Large clothing corporations which engage in ‘full-line’ production (i.e. purchase the materials themselves, have some in-house design and production capacity, and which out-source some if not many items or processes to other firms and may even have their own retail outlets, or at least branded products they sell through the big retailers) take advantage of regional differentiation through their plant locations and purchasing decisions. According to a study of the KZN clothing industry:
‘One interviewee cited an example of a previously large Durban firm which was now manufacturing in four locations – central Durban, a suburb in Durban, a previously decentralised area north of Durban and Lesotho. Firm management thus had a range of options with respect to placing orders. Orders that require skilled workers, and where quality
19
is more of an issue than price, are placed in their Durban central factory. Orders that have to be produced at the lowest possible price are manufactured in Lesotho’ (Skinner and Valodia, 2002: 61).
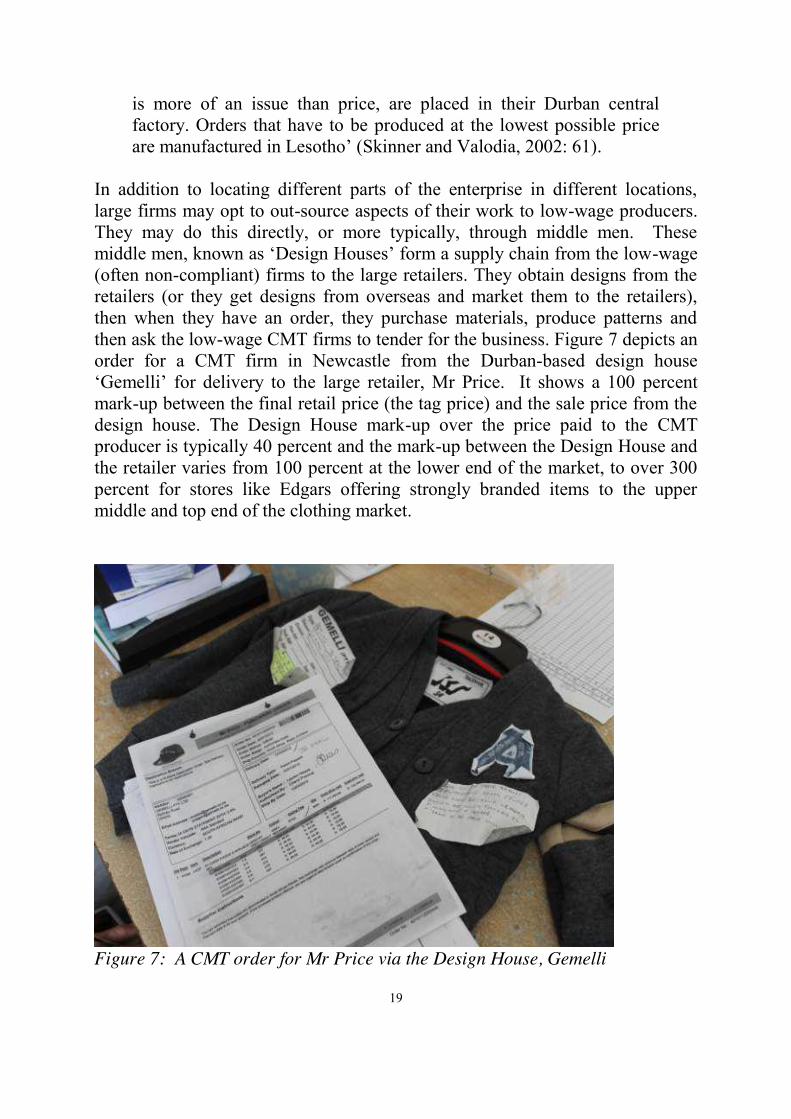
In addition to locating different parts of the enterprise in different locations, large firms may opt to out-source aspects of their work to low-wage producers. They may do this directly, or more typically, through middle men. These middle men, known as ‘Design Houses’ form a supply chain from the low-wage (often non-compliant) firms to the large retailers. They obtain designs from the retailers (or they get designs from overseas and market them to the retailers), then when they have an order, they purchase materials, produce patterns and then ask the low-wage CMT firms to tender for the business. Figure 7 depicts an order for a CMT firm in Newcastle from the Durban-based design house ‘Gemelli’ for delivery to the large retailer, Mr Price. It shows a 100 percent mark-up between the final retail price (the tag price) and the sale price from the design house. The Design House mark-up over the price paid to the CMT producer is typically 40 percent and the mark-up between the Design House and the retailer varies from 100 percent at the lower end of the market, to over 300 percent for stores like Edgars offering strongly branded items to the upper middle and top end of the clothing market.
Figure 7: A CMT order for Mr Price via the Design House, Gemelli
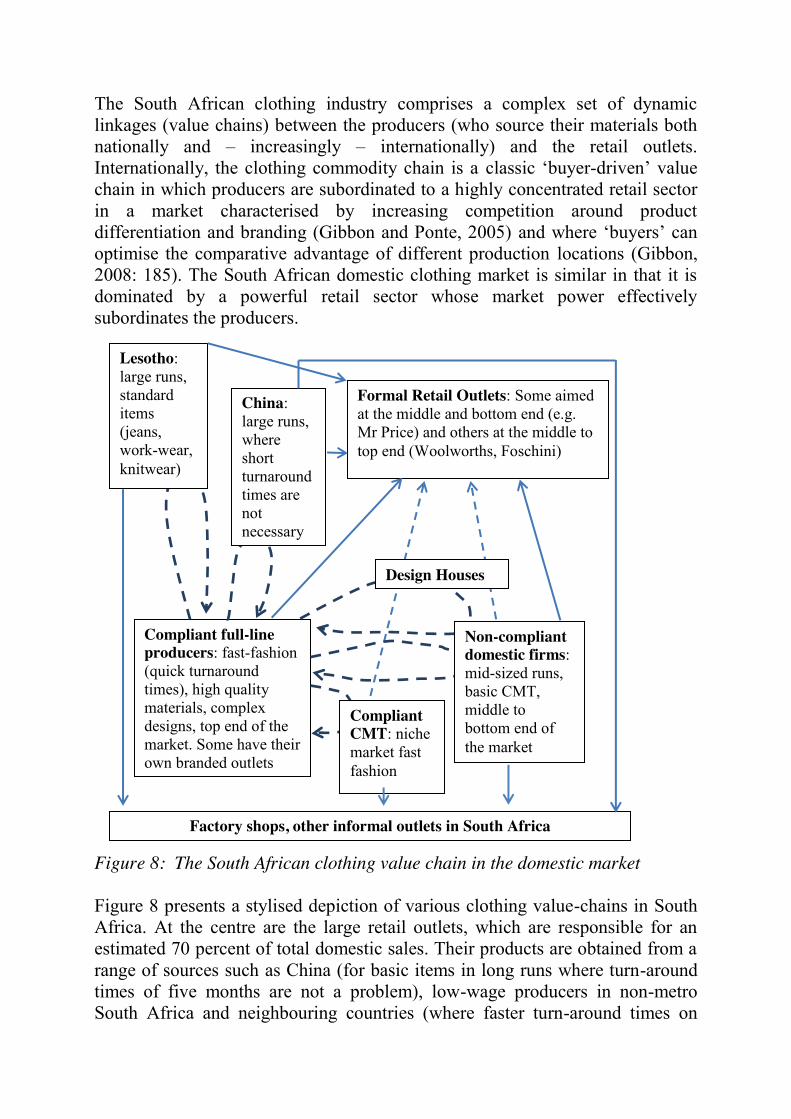
The South African clothing industry comprises a complex set of dynamic linkages (value chains) between the producers (who source their materials both nationally and – increasingly – internationally) and the retail outlets. Internationally, the clothing commodity chain is a classic ‘buyer-driven’ value chain in which producers are subordinated to a highly concentrated retail sector in a market characterised by increasing competition around product differentiation and branding (Gibbon and Ponte, 2005) and where ‘buyers’ can optimise the comparative advantage of different production locations (Gibbon, 2008: 185). The South African domestic clothing market is similar in that it is dominated by a powerful retail sector whose market power effectively subordinates the producers.
Figure 8: The South African clothing value chain in the domestic market Figure 8 presents a stylised depiction of various clothing value-chains in South Africa. At the centre are the large retail outlets, which are responsible for an estimated 70 percent of total domestic sales. Their products are obtained from a range of sources such as China (for basic items in long runs where turn-around times of five months are not a problem), low-wage producers in non-metro South Africa and neighbouring countries (where faster turn-around times on
Compliant full-line producers: fast-fashion (quick turnaround times), high quality materials, complex designs, top end of the market. Some have their own branded outlets
Formal Retail Outlets: Some aimed at the middle and bottom end (e.g. Mr Price) and others at the middle to top end (Woolworths, Foschini)
Factory shops, other informal outlets in South Africa
China: large runs, where short turnaround times are not necessary
Compliant CMT: niche market fast fashion
Non-compliant domestic firms: mid-sized runs, basic CMT, middle to bottom end of the market
Design Houses
Lesotho: large runs, standard items (jeans, work-wear, knitwear)
21
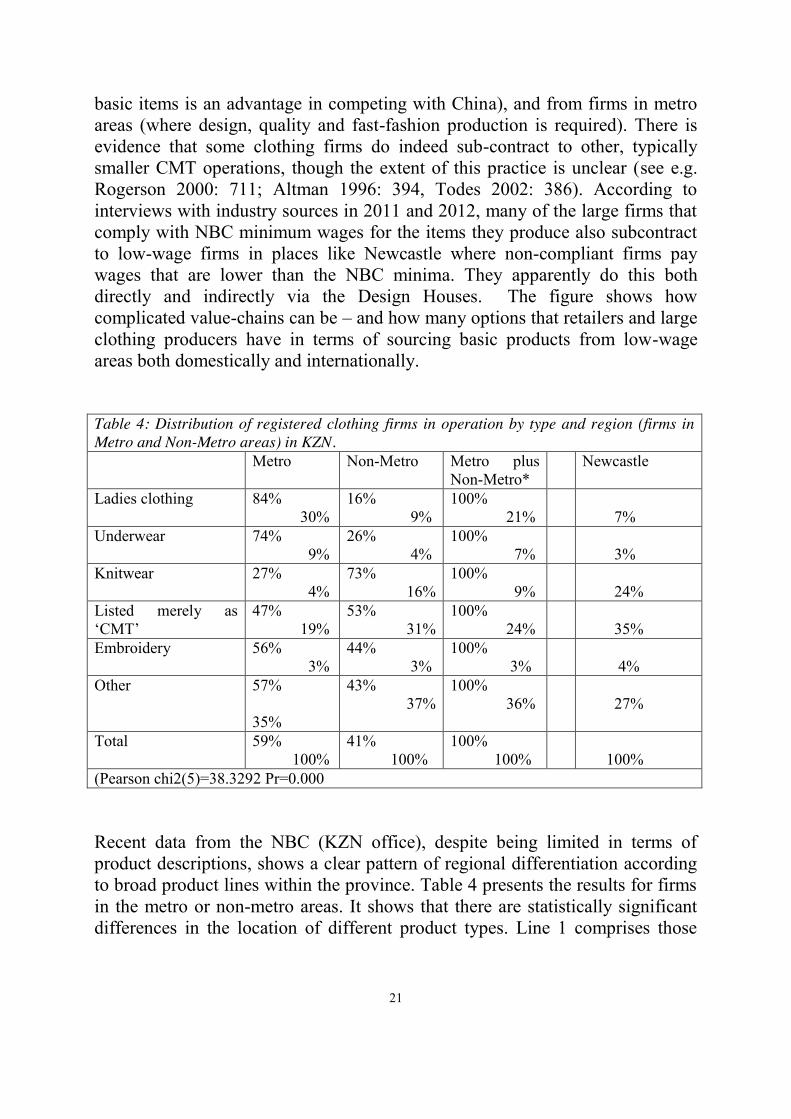
basic items is an advantage in competing with China), and from firms in metro areas (where design, quality and fast-fashion production is required). There is evidence that some clothing firms do indeed sub-contract to other, typically smaller CMT operations, though the extent of this practice is unclear (see e.g. Rogerson 2000: 711; Altman 1996: 394, Todes 2002: 386). According to interviews with industry sources in 2011 and 2012, many of the large firms that comply with NBC minimum wages for the items they produce also subcontract to low-wage firms in places like Newcastle where non-compliant firms pay wages that are lower than the NBC minima. They apparently do this both directly and indirectly via the Design Houses. The figure shows how complicated value-chains can be – and how many options that retailers and large clothing producers have in terms of sourcing basic products from low-wage areas both domestically and internationally. Table 4: Distribution of registered clothing firms in operation by type and region (firms in Metro and Non-Metro areas) in KZN. Metro Non-Metro Metro plus
Non-Metro* Newcastle
Ladies clothing 84% 30%
16% 9%
100% 21%
7%
Underwear 74% 9%
26% 4%
100% 7%
3%
Knitwear 27% 4%
73% 16%
100% 9%
24%
Listed merely as ‘CMT’
47% 19%
53% 31%
100% 24%
35%
Embroidery 56% 3%
44% 3%
100% 3%
4%
Other 57% 35%
43% 37%
100% 36%
27%
Total 59% 100%
41% 100%
100% 100%
100%
(Pearson chi2(5)=38.3292 Pr=0.000 Recent data from the NBC (KZN office), despite being limited in terms of product descriptions, shows a clear pattern of regional differentiation according to broad product lines within the province. Table 4 presents the results for firms in the metro or non-metro areas. It shows that there are statistically significant differences in the location of different product types. Line 1 comprises those

firms who categorise their production lines as ‘ladies’ wear7 (23 percent of the total) and line 2 comprises firms which indicated that they produce underwear, foundation garments and sleep-wear (5 percent of the total). Interviews with stakeholders in the clothing industry suggest that firms producing ‘ladies’ fashion and foundation garments are at the ‘higher’ end of the clothing production continuum in that the processes involved require skilled workers and dedicated machines as well as complicated co-ordination of production of different parts of the garment (especially foundation garments). As can be seen from the table, 84 percent and 74 percent of the ‘ladies wear’ and underwear producers were located in the metro areas. Line 3 shows that the distribution of knitwear (9 percent of the total) was predominantly in non-metro areas. The rest of the listed firms were either classified as simply ‘CMT’ (firms providing no information beyond the fact that they are CMT operations) and ‘other’ (e.g. those reporting that they produced things like adult leisure-wear, work-wear, outer-wear, their own designs, children’s wear etc). These categories no doubt include a range of different quality products in different markets and they are spread fairly evenly across the metro non-metro divide (almost certainly differing according to quality and market segment). The table shows that non-metro areas have much higher proportions of knitwear firms and those listing themselves simply as CMT – and that this is even more marked in the case of Newcastle.
7 Ladies wear includes all firms who mention the word ‘ladies’ in their short description of activities except for those who also mention knitting or underwear – those firms are categorised under knitwear and underwear respectively.
23
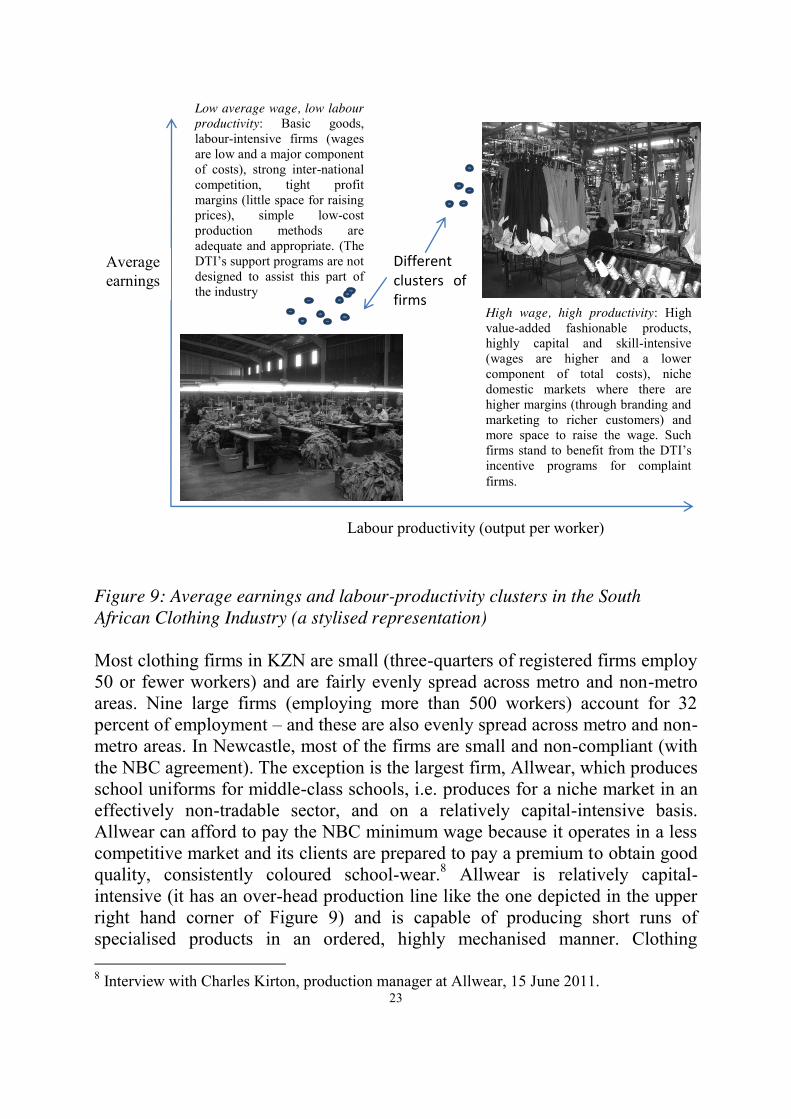
Figure 9: Average earnings and labour-productivity clusters in the South African Clothing Industry (a stylised representation)
Most clothing firms in KZN are small (three-quarters of registered firms employ 50 or fewer workers) and are fairly evenly spread across metro and non-metro areas. Nine large firms (employing more than 500 workers) account for 32 percent of employment – and these are also evenly spread across metro and non-metro areas. In Newcastle, most of the firms are small and non-compliant (with the NBC agreement). The exception is the largest firm, Allwear, which produces school uniforms for middle-class schools, i.e. produces for a niche market in an effectively non-tradable sector, and on a relatively capital-intensive basis. Allwear can afford to pay the NBC minimum wage because it operates in a less competitive market and its clients are prepared to pay a premium to obtain good quality, consistently coloured school-wear.8 Allwear is relatively capital-intensive (it has an over-head production line like the one depicted in the upper right hand corner of Figure 9) and is capable of producing short runs of specialised products in an ordered, highly mechanised manner. Clothing 8 Interview with Charles Kirton, production manager at Allwear, 15 June 2011.
Averageearnings
Labour productivity (output per worker)
High wage, high productivity: High value-added fashionable products, highly capital and skill-intensive (wages are higher and a lower component of total costs), niche domestic markets where there are higher margins (through branding and marketing to richer customers) and more space to raise the wage. Such firms stand to benefit from the DTI’s incentive programs for complaint firms.
Low average wage, low labour productivity: Basic goods, labour-intensive firms (wages are low and a major component of costs), strong inter-national competition, tight profit margins (little space for raising prices), simple low-cost production methods are adequate and appropriate. (The DTI’s support programs are not designed to assist this part of the industry
Different clusters of firms
producers in the fast-fashion, short-run, designer end of the clothing markets have similar set ups. The situation at the other end of the clothing production continuum is very different. The optimal technology for producing many of the standardised, basic clothing items (for budget clothing retailers like Mr Price and Jet) is relatively simple machinery and labour-intensive methods (bottom left corner of Figure 9).
Figure 9 provides a stylised depiction of the different clusters of firms at the top and bottom ends of the South African clothing industry. Firms at the higher end, for example producing the more expensive fashionable items, have higher labour productivity (output per worker) because they are more capital-intensive (have higher capital:labour ratios) and are producing in a market segment where branding matters and where mark-ups are correspondingly higher. They can thus afford to pay the minimum wage, with perhaps production-linked bonuses. Firms at the bottom end, however, are less capital-intensive, have lower average wages (because labour productivity is lower partly because the machinery is simpler and partly because the workers are typically less skilled) than the top end of the industry. The bottom end of the clothing market in South Africa is dominated by firms – many owned by people of Chinese or Indian descent – where the preferred wage model is to pay low basic wages (below the current minimum wage) combined with production-linked pay (piece-work) for particular categories of worker, notably machinists. In this system, average wages are lower than in compliant firms, but some workers (the most productive machinists) are able to earn substantially more than others and hence there is substantial variation in actual wage income. This is typical of piece-work systems in general which have been shown to result in greater productivity, greater variation in earnings and higher average earnings than in systems without piece-work (Seiler, 1984; Lazear, 2000).
25
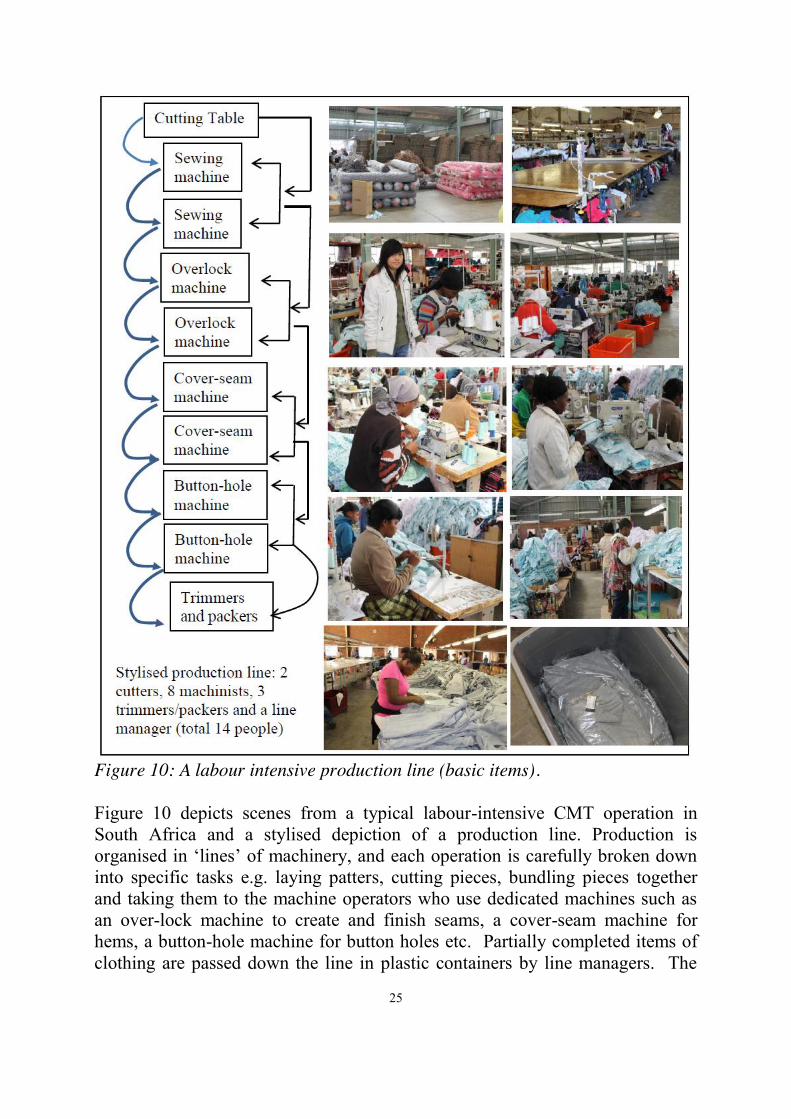
Figure 10: A labour intensive production line (basic items). Figure 10 depicts scenes from a typical labour-intensive CMT operation in South Africa and a stylised depiction of a production line. Production is organised in ‘lines’ of machinery, and each operation is carefully broken down into specific tasks e.g. laying patters, cutting pieces, bundling pieces together and taking them to the machine operators who use dedicated machines such as an over-lock machine to create and finish seams, a cover-seam machine for hems, a button-hole machine for button holes etc. Partially completed items of clothing are passed down the line in plastic containers by line managers. The
finished items are then checked for quality, trimmed, tagged with the final sales price, packed and shipped. Time is of the essence and profit margins are dependent on estimated production times being met. Orders that are not on time are subject to steep penalties and even cancelled orders (in which case the CMT firm owes the Design House for the material, and is forced to sell the cancelled order through informal channels at a loss). Because productivity is so important, many CMT firms make use of piece-work systems where possible. As piece work systems encourage workers to sew as fast as possible, the line in these cases has to be organised in a way which facilitates differential production rates (the system depicted to the right) rather than the steady flow model (depicted on the left). The NBC’s collective agreements criminalise the preferred wage model of many factories in places like Newcastle both because they set a minimum wage that leaves labour-intensive factories unable to compete with imports and because they effectively rule out any significant productivity-linked pay. Collective agreements allow for modest piece work under various conditions but such payments have to be over and above the legal minimum wage. Through extensions, the NBC thus imposes wages suitable for the top end of the clothing market onto the bottom end, and rules out a crucial dimension of their wage and business model: productivity linked pay via the piece-work system for some categories of worker, especially machinists in the busy season. Conclusion South Africa’s low-wage labour-intensive clothing industry has been competing with imports from China and Lesotho. But to continue to do so, it needs to operate on a different wage model to that codified by the NBC agreement which sets relatively high minimum wages and severely constrains the space for piece work pay. This end of the clothing industry has survived by failing to comply with the NBC minimum wage agreement. Firms that are attempting to move towards the NBC agreement (for example by paying 70 percent of the minimum wage) have had to do so in ways which cut employment. Some may attempt to ‘move up the value chain’ by becoming more capital-intensive and competing directly with the metro firms already in this market. Most, however, will simply shut down as their networks and experience are pertinent to the low-wage, low-margin value-chains. Given the strong bifurcation of the product market between the top and bottom ends, there is no simple, easy transition between them. For many firms, moving up the value chain is more of a policy-maker’s fantasy than a practical reality. None of this bodes well for job creation.
27
The government has set itself ambitious job creation goals. The 2010 New Growth Path document tabled a vision of 5 million jobs by 2020 and the 2011 National Development Plan built on it to propose 11 million jobs by 2020. But to do this at its current high levels of capital intensity, the South African economy would need to grow at rates of about 5-6 percent per year, and investment and savings rates would have to double (Nattrass, 2011). The obvious way to generate jobs is to promote labour-intensive forms of production. The National Development Plan recommends the opposite:
‘Currently South African manufacturing strength lies in capital-intensive industries. In a context of high unemployment, growth would ideally be sourced through expanded contribution of labour. However, to compete, the country’s cost structure requires an emphasis on productivity, products and logistics’ (NDP, 2011: 126)
South Africa’s cost structure is taken as given, as something that is as immutable as (for example) South Africa’s lack of navigable rivers. But labour costs are not immutable. They are the outcome of social factors, conflict and institutional management. Ruling out low-wage labour-intensive employment as unacceptable ‘sweatshop’ practices that are incompatible with ‘decent work’ or with some vision of South Africa only operating at the top end of the product market, constitutes a value-judgement as much as an economic claim. The hard facts of the situation are that South Africa has some low-wage clothing jobs, which workers are taking (because, whilst they would prefer higher wages, low wages are better than nothing) but which the NBC is trying to shut down through its current compliance drive. Getting rid of these jobs neither helps these (or other) workers, nor brings South Africa any closer to combatting unemployment. Some argue that if the South Africa state allows non-compliant firms to continue operating, there will be a ‘race to the bottom’ because compliant firms will drop their wages too. But such a scenario fails to consider that there are different segments of the market and that the high-value added firms will continue to pay higher wages as it is in their interests to do so in order to retain their skilled workers. The ‘race to the bottom’ scenario also flies in the face of economic history – notably by ignoring the fact that South African clothing firms have long operated with significant regional wage differentiation and that there was no ‘race to the bottom’ prior to the NBC being formed in the early 2000s. There are no good economic or wage-related reasons why wider regional wage differentiation should not continue. Government can opt to support the upper end of the clothing industry (which the DTI has been doing recently with a R1 billion support program for compliant firms) in order to boost South Africa’s production capacity in

higher value added products. But there is no reason why this needs to be accompanied by actively driving the low-wage labour-intensive end out of business.
29
References Altman, M. 1994. An Industrial Strategy for the Clothing Sector, Industrial Strategy Project, Development Policy Research Unit, University of Cape Town, UCT Press. Altman, M. 1996. Labour Regulation and Enterprise Strategies in the South African Clothing Industry. Regional Studies, vol.30, no.4: 387-399. AMSA. 2011. Trade trends in the SA Clothing Sector for the full year January to December 2010: 4 April 2011. Anstey. M. 2004. National Bargaining in South Africa’s Clothing Manufacturing Industry: Problems and Prospects of Multi-employer Bargaining in an Industry under Siege’, in Industrial Law Journal, vol. 25, October: 1829-1864 Bell, T. 1983. The growth and structure of manufacturing employment in Natal. Occasional paper 7, Institute for Social and Economic Research, University of Durban Westville. Bell, T. 1986. The role of regional policy in South Africa. Journal of Southern African Studies, vol.12, no.2. Coughlin, P., Rubin, M. and L Darga. 2004. ‘The SADC Textile and Garment industries: Towards a Global Vision’, in McCormick, D. and Rogerson, C. (eds). Clothing and Footwear in African Industrialisation, Africa Institute of South Africa, Pretoria: 18-77. Edwards, L., Cassim, R. and D. van Seventer. 2009. ‘Trade Policy in South Africa’, in Aron, J., Kahn, B and G. Kingdon (eds). South African Economic Policy Under Democracy, Oxford University Press. Freund, Bill. "South Africa: the Union Years, 1910–1948 – Political and Economic Foundations." The Cambridge History of South Africa. Eds. Robert Ross, Anne Kelk Mager and Bill Nasson. Cambridge University Press, 2011. Cambridge Histories Online. Cambridge University Press. 31 July 2012 DOI:10.1017/CHOL9780521869836.007 Gibbon, P. 2004. ‘South Africa and the Global Commodity Chain for Clothing: Export performance and constraints’, in McCormick, D. and Rogerson, C. (eds).
Clothing and Footwear in African Industrialisation, Africa Institute of South Africa, Pretoria: 148-192. Gibbon, P., and S. Ponte. 2005. Trading Down: Africa, Value-Chains and the Global Economy, Temple University Press, Philadelphia. Gibbon, P. 2008. Segmentation, Governance and Upgrading in Global Clothing Chains: A Mauritian Case Study. In Fold, N. and M Larson (eds). 2008. Globalisation and Restructuring of African Commodity Flows, Nordiska Afrikainstitutet, Uppsala: 184-209. Godfrey, Shane. 1997. Why Do Employers Bargain at Particular Levels? A Longitudinal Study of Western Cape Clothing Employers’ Perceptions and Behaviour with Regard to Levels of Collective Bargaining, 1991-1995. Unpublished M.A. thesis, University of Cape Town. Hart, G., and A. Todes. 1997. Industrial Decentralisation Revisited. Transformation (32): 31-53 Kesper. A. 1998. Small clothing manufacturers in the Johannesburg inner city: Facing the global challenge, in Urban Forum, 10 (2): 137-64. Lazear, E. 2000. ‘Performance Pay and Productivity’, in The American Economic Review, vol.90, no.5: 1346-1361. Morris, M., and G.Einhorn. 2008. Globalisation, Welfare and Competitiveness: The Impacts of Chinese Imports on the South African Clothing and Textile Industry. Competition and Change, 12, 4: 355-376. Morris, M. Staritz, C. and J. Barnes. 2011. Value chain dynamics, local embeddedness, and upgrading in the clothing sectors of Lesotho and Swaziland. International Journal of Technological Learning, Innovation and Development, vol.4, nos 1/2/3: 96-119 NDP. 2011. National Development Plan: Vision for 2030. National Planning Commission. http://www.npconline.co.za/medialib/downloads/home/NPC%20National%20Development%20Plan%20Vision%202030%20-lo-res.pdf Nattrass, N. 1993. “Economic Aspects of the Construction of Apartheid”, in P.Bonner, P.Delius and D.Posel (eds), Apartheid’s Genesis: 1935-1962, Ravan Press and Witwatersrand University Press.
31
Nattrass, N. 2011. The new growth path: Game changing vision or cop out?, in The South African Journal of Science, vol.107, no.3/4: Art. #638, 8 pages. DOI: 10.4102/sajs.v107i3/4.638. Nicol, Martin. 1984. A History of Garment and Tailoring Workers in Cape Town, 1900-1939. PhD thesis, University of Cape Town. Robbins, G., A.Todes and M.Velia. 2004. Firms at the Crossroads: The Newcastle-Madadeni Clothing Sector and Recommendations on Policy Responses, Report for the KwaZulu-Natal DEDT and Newcastle Municipality. Rogerson, C. 2004. Sunrise or sunset industries? South Africa’s Clothing and Footwear sectors’ in McCormick, D., and C.Rogerson (eds). Clothing and Footwear in African Industrialisation, Africa Institute of South Africa, Pretoria: 110-147. Rogerson, C. 2010. ‘Successful SMEs in South Africa: The Case of Clothing Producers in the Witwatersrand, Development Southern Africa, vol.17, no.5: 687-716. Seiler, E. (1984). Piece rate vs, time rate: the effect of incentives on earnings. In The Review of Economics and Statistics, vol.66, no.3: 363-76 Shakya, M. (2011). Apparel exports in Lesotho: The State’s role in building critical mass for competitiveness. In Chuhan-Pole, P. and M. Angwafo (eds). Yes Africa Can: Success Stories from a Dynamic Continent. The World Bank, Washington. Skinner, C. and I. Valodia. 2002. ‘Labour Market Policy: Flexibility and the Future of Labour Relations: the Case of KwaZulu Natal Clothing Industry’, in Transformation number 50. Staritz, C. and M. Morris. 2011. Local Embeddedness, Upgrading and Skill Development: Global Value Chains and Foreign Direct Investment in Lesotho’s Apparel Sector. Better Work Research Conference: Workers, Business and Government: Understanding Labour Compliance in Global Supply Chains, October 26-28. Todes, A. 1998a. Restructuring, Migration and Regional Policy in South Africa: The Case of Newcastle. PhD Thesis, Department of Town and Regional Planning, University of Natal, Durban.

Todes, A. 2002. Industrial Restructuring in South Africa: The Case of Newcastle. Tijdschrift voor economische en sociale geografie. Vol 90, no.4: 379-390.