dietary guidelines goals and recommendations physicians ... · pdf filegoals and...
TRANSCRIPT

1
Dietary Guidelines Goals and Recommendations
Physicians Committee for Responsible Medicine
Authors: Susan Levin, M.S., R.D.
Neal Barnard, M.D.

2
Preamble
The U.S. Government has promulgated dietary guidance in various forms throughout much of the last century. In recent decades, two major trends have occurred: First, the dietary problem of undernutrition has been eclipsed by an epidemic of overnutrition. More Americans are now overweight or obese than at any time in history. Diabetes, cardiovascular disease, and cancer are now commonplace, exacting costs that are both personal and financial. Abundant scientific information has established the role of nutrition in health, but much of this information has yet to be incorporated into practical dietary guidance for the benefit of the public. Although scientific knowledge has moved swiftly forward, nutritional guidelines have progressed only sluggishly. We therefore sought to establish a set of dietary guidance materials that serve the current needs of the public, based on current scientific knowledge. We first established eight general objectives for the guidance document. We then sought evidence-based materials that quantify nutritional needs and examined the most healthful sources of the essential nutrients.
Principles and Goals When the U.S. Department of Agriculture (USDA) established the Eating Right Pyramid in 1991, followed by the Food Guide Pyramid in 1992, it identified specific principles that guided the development of these graphics. These are detailed in the USDA’s Food Guide: Background and Development, released in 1993 (Welsh 1993). Several of these principles remain relevant for the elaboration of an improved set of dietary guidelines and graphic and are listed below. 1. The new food guide should promote overall health and well-being.
The dietary guidelines should provide information that supports the total health and well-being of the population, rather than being directed to the prevention or treatment of a single disease. However, a recommended diet should not only sustain individuals who are already healthy. Given that the majority of American adults are overweight and have elevated blood cholesterol concentrations, recommendations should provide a basic dietary framework that is useful for individuals with common health conditions, such as overweight, hypercholesterolemia,

3
and hypertension, that may have resulted, in part, from poor dietary choices.
2. The new food guide should be based on up-to-date nutrition
research on recommended intakes of nutrients and other food components. A large body of nutrition research has produced important findings in recent years. Educational materials should be based on current, sound, and objective research. The new food guide should focus on dietary staples that provide all essential nutrients. However, current scientific knowledge is limited regarding the risks and benefits of small amounts of certain additional, nonessential foods.
3. The new food guide must be useful to the target audience. Nutrition education materials should serve as a helpful learning tool, describing foods and quantities in familiar terms.
4. The new food guide should promote optimal nutrition. The USDA
called for the new food guide to be based on commonly consumed foods, saying that a new food guide should be “realistic.” Its point was that consumers should not have to seek out unusual foods in order to meet nutrient needs, a point with considerable merit. However, the USDA also called for a new food guide “to accommodate all types of foods,” a less defensible goal. There is no a priori reason why foods without beneficial nutritional attributes or with distinct nutritional disadvantages should be included in a food guide for the public. It is important not to underestimate the public’s desire for better health and its willingness to alter maladaptive dietary habits. Many people make major dietary alterations, particularly in efforts to lose weight, yet have little guidance as to what constitutes a healthful regimen. It is also important to recognize that many people follow diets that are close to optimal, while others have strayed quite far from an optimal diet. Nutrition education materials should serve both groups.
5. The new food guide should allow maximum flexibility for consumers
to eat in a way that suits their taste and lifestyle while meeting nutritional criteria. Optimal dietary guidelines may be implemented in many varied ways, based on culture and preference. Nutrition education materials should permit the incorporation of healthful foods into a wide range of dietary patterns.
6. A new food guide should provide for the nutritional needs of
individuals from a variety of age groups and activity levels. In

4
describing this goal, the USDA called for a food guide to be “practical,” such that there is no need for different guides for different age groups.
The guidelines and diagram should be applicable for people regardless of age, weight, cultural preference, or health status. However, they do not apply to children less than 2 years of age or individuals with medical illnesses requiring specialized dietary or medical intervention.
7. A new food guide should be based on an understanding of the
strengths and weaknesses of previous guides. The USDA called for a food guide to be “evolutionary,” suggesting that consumers, who have become accustomed to certain dietary concepts should not have to erase what they already know, but rather, can build on that information base. However, the USDA did not differentiate which nutrition concepts merit continuation from those that consumers can safely set aside. It is nonetheless clear that nutrition guidance materials have evolved over several decades, and the process of improving nutrition guides can profit from past experience. In the first half of the last century, nutrition education materials focused on preventing nutrient deficiencies. Subsequently, the focus shifted to the need to curb dietary excesses. Responding to changing needs, some guidance materials, such as the Food Guide Pyramid, were produced after extensive planning, and their subsequent successes and failures have been evaluated, providing a basis for improvement.

5
Recommended Nutrient Intakes The following sections cover all macronutrients and those micronutrients for which recommended intakes are a matter of controversy, with the goal of determining ideal dietary intakes, based on the findings of the World Health Organization (WHO) and the Institute of Medicine (IOM). Carbohydrate Function Dietary carbohydrate occurs as mono- and disaccharides (“sugars”) and as polysaccharides (“starch”). It provides sugars that act as an energy source for the body, particularly the brain, the only carbohydrate-dependent organ, and is stored in the muscles and liver in the form of glycogen. Deficiency When carbohydrate is restricted, the body uses fat as an energy source, creating ketone bodies, which are acidic and, in extreme cases, can cause liver and kidney damage. The minimal amount of carbohydrate required for adults to avoid ketosis is about 50 grams per day. A healthy, varied diet easily provides enough glucose to avoid the production of ketones. Carbohydrate requirements are increased among athletes and other physically active individuals. (ADA 2000) (Jacobs 1999) (Haff 1999) (Leveritt 1999). Overconsumption There is no adverse effect of high intakes of unrefined complex carbohydrate. However, overconsumption of added sugars (simple carbohydrate) has been linked to risk of obesity (Ludwig 2001). Sugar consumption can also contribute to risk of dental caries. Moreover, carbohydrate in any form should not be consumed to the exclusion of necessary quantities of other macronutrients (WHO/FAO, Carbohydrates in Human Nutrition 1997). Institute of Medicine Recommendations The Recommended Dietary Allowance (RDA)—the average daily dietary nutrient intake level sufficient to meet the nutrient requirement of nearly all (97.5 percent) healthy individuals (IOM Energy 2002/2005)—for carbohydrate is based on the average minimal amount of glucose utilized by the brain: 130 g/d for both adults

6
and children. The IOM also recommends that 45 to 65 percent of energy should be in the form of carbohydrate (IOM Energy 2002). World Health Organization Recommendations WHO recommends a minimum of 55 percent of total energy coming from carbohydrate obtained from a variety of food sources for all ages except children under the age of 2. The principal carbohydrate sources should be cereals, vegetables, legumes, and fruits. In the United States, mean percentages of calories from carbohydrates are below this figure, at roughly 50 percent for U.S. adults (USDA 1998). Summary Carbohydrate consumption of at least 55 percent of total energy meets the recommendations of both IOM and WHO.

7
Protein Function Protein is required for the building, maintenance, and repair of body tissues. Of the approximately 20 different amino acids used by the body, nine (essential amino acids) cannot be synthesized by the body and must be obtained from the diet. Deficiency Protein deficiency is rarely seen when diets provide adequate energy, and a deficiency in an individual amino acid is also rare in a varied diet. However, in some parts of the world where the staple weaning foods are unusually high in starch and low in protein (parts of Africa, the Caribbean and Pacific islands), protein deficiency, or kwashiorkor, can occur, resulting in edema, dermatosis, thinning and reddening of the hair, and stunted growth. More common is protein-energy malnutrition, or marasmic kwashiorkor (Beers 1999). Medical conditions that increase protein requirements include burns, surgery, and other metabolic stresses. Protein requirements are imprecise and may depend on many factors. The body can adapt to lower intakes of protein, as illustrated by a 77-day metabolic study in which participants were fed a very low intake of protein (0.356 g/kg/d) and experienced no adverse physiological or biochemical changes. Eventually, two-thirds of the participants reached nitrogen equilibrium and one-third had a small negative balance, but all were within the balance range (Millward 1999) (IOM Energy 2002/2005) (Durkin 1981) Other long-term balance studies reflect a lower need for protein intake than has been found in short-term studies, suggesting efficient use of protein (Abelow 1992). This biological adaptation has made it difficult to specify an absolute quantitative protein requirement. Overconsumption According to the Third National Health and Nutrition Examination Survey, Americans consume, on average, 161 percent of the protein RDA. The majority of this protein is consumed in the form of animal products—fish, poultry, red meat, eggs, and dairy products (Smit 1999). Evidence suggests that a diet that is high in animal protein can contribute to health problems, particularly with respect to mineral balance and renal function. Studies show that lowering dietary protein to U.S. recommended dietary allowance levels (0.8g protein/kg) or below reduces bone resorption and urinary calcium loss (Ince 2004). Diets high in animal protein are also associated with acceleration in the loss of kidney function among individuals whose renal function

8
is already impaired due to hypertension, diabetes, or other causes (Coresh 2003). The Concept of Biological Value While biological value was once considered important, it is now deemed to have little clinical significance, because typical diets encompass a variety of foods (Millward 1999). Intentionally selecting food sources with complementary amino acid profiles is not necessary; as such complementing occurs naturally with a varied diet (ADA 2003) (Young 1994). Diets based on a variety of plant foods meet protein needs when adequate calories are consumed. Institute of Medicine Recommendations The RDA for protein for sedentary adults is 0.8 g/kg (IOM Energy 2002/2005). This number is based on studies of nitrogen balance in a variety of populations. Current IOM protein recommendations are formulated to ensure that 97.5 percent of the population’s needs are met.
Institute of Medicine Recommended Dietary Allowance (RDA)
Age (yrs) Protein (g/kg) 2-3 1.05 4-13 0.95 14-18 0.85 19- >70 0.8
In its 2002/2005 Dietary Reference Intakes, the National Academy of Sciences (NAS) stated that total protein should not exceed 35 percent of total energy intake in order to decrease risk of chronic diseases (IOM, Energy 2002/2005). World Health Organization Recommendations The current WHO recommendation for protein is 0.75 g/kg for adults on a varied diet (WHO/FAO 1985).
World Health Organization Safe Protein Intakes
Age (yrs) Protein (g/kg) 3-4 1.1 5-12 1.0 13-14 0.95 19- >70 0.75

9
Summary A protein intake of 0.75 g per kilogram of body weight is generally adequate for adults. Certain population groups that may need slightly more include those who are in a growth life cycle, such as children and pregnant women. Children’s needs also vary according to individual maintenance and protein deposition requirements.
Age (yrs) Protein (g/kg) 3-4 1.1 5-12 1.0 13-14 0.95 19- >70 0.75
According to the NAS, age (beyond that of young adulthood) does not affect protein needs, therefore no change in requirement is necessary for elderly persons (IOM Energy 2002/2005).

10
Fat Function The body synthesizes the fatty acids it needs from dietary constituents, except for alpha-linolenic acid (ALA) and linoleic acid (LA) which must be part of the diet. These essential fatty acids are used to build omega-3 and omega-6 fatty acids, respectively (Groff, 1995). ALA, an 18-carbon omega-3 fatty acid, is converted to eicosapentaenoic acid (EPA) which, in turn, can be elongated to docosahexaenoic acid (DHA). EPA and DHA are therefore considered nonessential. Aside from essential functions of ALA and LA, small amounts of dietary fat are also required for the absorption of fat-soluble vitamins. Omega-3 and omega-6 fatty acids also play roles in brain development and visual acuity (WHO/FAO 1994). Fat is energy-dense, with more than twice the energy content of carbohydrates or protein (Krause 2004). Deficiency Essential fatty acid deficiencies are rare and were not recognized prior to the 1980s (Messina 2004). Deficiencies of essential fats can lead to a host of symptoms and disorders, including liver and kidney abnormalities, reduced growth rates, decreased immune function, depression, and skin dryness and scaliness (Linscheer 1994). Overconsumption Excess intake of fat, particularly saturated fat, is associated with higher risk of heart disease, obesity, type 2 diabetes, coronary heart disease, and certain cancers (WHO/FAO 1994). Omega-3 needs appear to increase as omega-6 intake increases, suggesting that essential fatty acid requirements may be better expressed as ratios (e.g., omega-3 to omega-6) than by absolute quantities or percentages of total energy consumption (Hibbelin 2006). Some have suggested that that reducing omega-6 fatty acid intake greatly reduces omega-3 requirements (Hibbelin 2006). Institute of Medicine Recommendations The IOM’s essential fatty acid recommendations are based on median intakes in the United States. The Adequate Intake (AI)—an average amount based on approximations or estimates of nutrient intake that are assumed to be adequate, used when an RDA cannot be determined (IOM Energy 2002/2005)—for omega-

11
6 for men is 17 g/d (156 calories) and for women is 12 g/d (108 calories). The AI for omega-3 for men is 1.6 g/d (14 calories) and for women is 1.1 g/d (10 calories). The IOM reports, however, that intakes much lower than the AI occur with no signs of a deficiency. The IOM has set an Acceptable Macronutrient Distribution Range (AMDR)—a range of intakes for an energy source that is associated with reduced risk of chronic disease while providing adequate intakes of essential nutrients (IOM Energy 2002/2005)—for total fat at 20 to 35 percent of calories. Unlike with essential fatty acids, there is no AI or RDA for total fat due to insufficient data for determining the minimum intake for disease prevention. World Health Organization Recommendations For adults, the WHO has set a minimum fat intake at 15 percent of energy. For women in their reproductive years, WHO calls for a minimum of 20 percent. Maximal saturated fat intake is 10 percent of energy. Active individuals may consume up to 35 percent of energy from fat. For essential fatty acids, WHO recommends a goal for omega-6 of 5 to 8 percent of total energy and for omega-3, 1 to 2 percent. This is approximately a 1:5 to 1:8 ratio. Summary and Comment Fatty acid requirements remain controversial, in part because of the rarity of deficiency states and the fact that the recognition of the essential nature of certain fats was relatively recent. Absolute fatty acid requirements remain unclear. The minimum percentages of energy intake from fat—20 percent for IOM and 15 percent for WHO—are both higher than those typical of some populations with a low risk of chronic disease and long life expectancy. It is not yet certain whether requirements are better expressed as ratios of omega-3 to omega-6 intakes. WHO recommendations for omega-6 of 5 to 8 percent of total energy and for omega-3 of 1 to 2 percent approximates a 1:5 to 1:8 ratio. There is no specific nutritional requirement for other fats, except in so far as fat serves as an energy source.

12
Fiber Function Dietary fiber consists of the parts of a plant that cannot be digested nor absorbed early in the digestive process. Fiber is only found in foods derived from plants, such as legumes, vegetables, fruits, and whole grains. Soluble fiber helps control blood glucose and reduces blood cholesterol concentrations. Insoluble fiber reduces intestinal transit time, helps prevent constipation, and may protect against colon cancer. A varied diet of plant-derived foods provides both types of fiber. Deficiency The consequences of a low-fiber diet include higher risk of cardiovascular disease (Ajani 2004) (Humble 1993) (Khaw 1987) (Krumhout 1982) (Pietinen 1996) (Wolk 1999), insufficient satiety and a corresponding excess in energy intake (Howarth 2001), slower intestinal motility, higher risk of type 2 diabetes, and possibly increased risk of certain types of cancer. Currently, American diets have, on average, less than half of the fiber recommended by the IOM (IOM Energy 2002/2005) (DGA 2005). Overconsumption Some have hypothesized that a diet that is extremely high in fiber could lead to deficiencies of vitamins and minerals. However, research findings have been inconclusive (IOM Energy 2002/2005). In cultures with fiber-rich diets, no such inadequacies have been observed (WHO/FAO 1997). Under certain special circumstances (pancreatic disease, irritable bowel syndrome), gastrointestinal distress has been observed at very high intakes of fiber (75 to 80 g/d) (IOM Energy 2002/2005). However, the IOM holds that there is insufficient evidence to set a Tolerable Upper Intake Level (UL) (IOM Energy 2002/2005). Institute of Medicine Recommendations The IOM prescribes fiber intakes based on age categories:
Total Fiber Adequate Intake (AI)
Age (yrs) g/day 2-3 19 4-8 25 Boys 9-13 31 Girls 9-13 26

13
Boys 14-18 38 Girls 14-18 26 Men 19-50 38 Women 19-50 25 Men 51- > 70 30 Women 51- > 70 21
World Health Organization Recommendations The WHO makes no specific recommendation for fiber intake, except to state that dietary carbohydrate should be drawn from fruits, vegetables, legumes, and cereals, with an emphasis on low energy density and a low glycemic index (WHO/FAO - obesity 1997). Summary and Comment Diets rich in legumes, vegetables, fruits, and whole grains provide adequate fiber. Diets emphasizing animal-derived products, refined grains, and simple carbohydrates have correspondingly less fiber. The IOM’s fiber recommendation provides a reasonable minimal intake.
14
Calcium Function Calcium provides skeletal structure and rigidity, and calcium ions play roles in many metabolic processes. The body controls ionized calcium concentrations in the extracellular fluid by a feedback loop through calcium receptors in the parathyroid glands. Parathyroid hormone stimulates the renal production of 1,25-dihydroxycolecaliferol (1,25(OH)2D), which, in turn, promotes intestinal calcium absorption and renal tubular reabsorption of calcium, and, if needed, causes bone resorption to release calcium. Deficiency Calcium intake below approximately 400 mg daily may be associated with poor bone development (Chiu 1992). Chronic calcium deficiency resulting from either inadequate intake or decreased absorption is one cause of reduced bone mass and osteoporosis. However, above this intake level, the relationship between calcium intake and osteoporosis is controversial. Countries with the highest calcium intakes (e.g., the United States, Canada, and many European countries) have higher rates of osteoporosis, compared with developing nations with lower calcium intakes (Gerrior 2001) (Abelow 1992) (Hegsted 1986) (Nordin 2000). Most scientific studies among healthy children and adults do not indicate any long-term benefit of consuming higher amounts of calcium. In a recent review published by the American Academy of Pediatrics, little evidence was found for a relationship between total dietary calcium and bone mineral density or bone mineral content in children (Lanou 2005). Similarly, in adults, high calcium intake does not reduce fracture risk (Feskanich 2003). The Nurses’ Health Study, including 72,337 women followed over 18 years, showed no relationship between calcium intake and hip fracture risk. Overconsumption High doses of supplemented calcium, taken along with high amounts of vitamin D, can have adverse health effects. Toxic effects of excess calcium include increased risk of kidney stone formation, renal insufficiency with or without alkalosis, and decreased absorption of other essential minerals (iron, zinc, magnesium, and phosphorus) (IOM Calcium 1997) (Krause 2004). In epidemiologic studies, chronic high calcium intake is also associated with prostate cancer risk (Giovannucci 1998) (Chan 2001) (Chan 2005). Absorption or Balance Children and adolescents need to be in positive calcium balance (i.e., net calcium retention) to support bone growth. Calcium requirements for adults are

15
based on a calcium intake that maintains calcium balance (zero balance between intake, absorption, and loss) in the body. Calcium losses occur through urinary calcium excretion, fecal calcium excretion, and other insensible losses. Dietary absorption is influenced by the presence of vitamin D, extracellular calcium concentrations, and total calcium intake. At low intakes, calcium is absorbed at maximal efficiency (Messina 2004). Absorption is also increased when circulating ionized calcium is low, leading to the release of parathyroid hormone. Calcium is absorbed from food only when present in the ionic form (Krause 2004). It is unabsorbable when it is precipitated by another dietary component such as oxalate, phytates (a phosphorous containing compound), or if it forms a soap with free fatty acids. Sodium and protein intakes influence calcium balance. Sodium is an important determinant of urinary calcium excretion, because the two minerals compete for resorption in the renal tubules (Nordin 1993)(Nordin 1997) (Matkovic 1995). Dietary protein, particularly animal protein, high in sulfur-containing amino acids, also increases calcium losses (Schuette 1981). The proposed mechanism is that metabolism of amino acids leads to low-grade metabolic acidosis. The skeleton, as a reservoir of calcium salts, reacts by mobilizing salts to neutralize the acidity. Excess dietary protein increases urinary calcium losses and is associated with higher fracture rates (Feskanich 1996) (Sellmeyer 2001). World Health Organization Recommendations WHO’s calcium recommendations for preventing osteoporosis acknowledge the fact that calcium requirements may vary among cultures for dietary, genetic, lifestyle, and geographical reasons. Its recommendations are largely based on data derived from the developed world. WHO recognizes the “calcium paradox”—that hip fracture rates are higher in developed nations where calcium intake is higher than in developing nations where calcium intakes are typically lower. It concludes that hip fracture rates may be related to protein intake, vitamin D status, or both, and that either of these factors could explain the paradox. Because of the major influence of protein on calcium balance, WHO makes two sets of recommendations: one for people consuming a typical Western diet, high in animal protein, and a second for those consuming a diet that is lower in animal protein (20-40g/d). Based on 210 balance experiments in 81 subjects, WHO estimates that calcium equilibrium (the point at which excreted calcium equals net absorbed calcium) is reached at 520 mg/d for adults, but actual basal requirements may be somewhat higher due to insensible losses. WHO recommends a tolerable upper limit of 3000 mg/d to prevent toxicity (WHO 2003). In a report specifically addressing issues of chronic disease, WHO recommends that countries with high rates of osteoporosis have a minimum of 400 to 500 mg
16
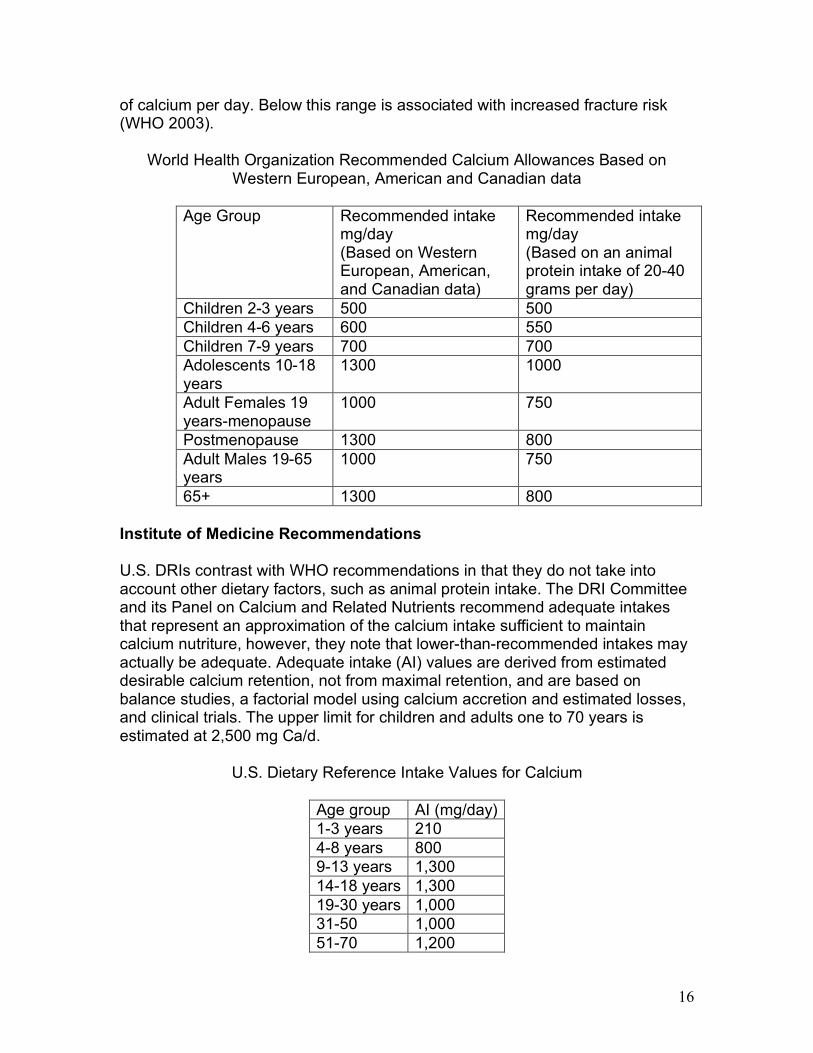
of calcium per day. Below this range is associated with increased fracture risk (WHO 2003).
World Health Organization Recommended Calcium Allowances Based on Western European, American and Canadian data
Age Group Recommended intake
mg/day (Based on Western European, American, and Canadian data)
Recommended intake mg/day (Based on an animal protein intake of 20-40 grams per day)
Children 2-3 years 500 500 Children 4-6 years 600 550 Children 7-9 years 700 700 Adolescents 10-18 years
1300 1000
Adult Females 19 years-menopause
1000 750
Postmenopause 1300 800 Adult Males 19-65 years
1000 750
65+ 1300 800 Institute of Medicine Recommendations
U.S. DRIs contrast with WHO recommendations in that they do not take into account other dietary factors, such as animal protein intake. The DRI Committee and its Panel on Calcium and Related Nutrients recommend adequate intakes that represent an approximation of the calcium intake sufficient to maintain calcium nutriture, however, they note that lower-than-recommended intakes may actually be adequate. Adequate intake (AI) values are derived from estimated desirable calcium retention, not from maximal retention, and are based on balance studies, a factorial model using calcium accretion and estimated losses, and clinical trials. The upper limit for children and adults one to 70 years is estimated at 2,500 mg Ca/d.
U.S. Dietary Reference Intake Values for Calcium
Age group AI (mg/day) 1-3 years 210 4-8 years 800 9-13 years 1,300 14-18 years 1,300 19-30 years 1,000 31-50 1,000 51-70 1,200

17
>70 1,200 Pregnancy ≤18 years
1,300
19-50 years 1,000 Lactation ≤18 years
1,300
19-50 years 1,000 Summary and Comment Both insufficiency and excess of dietary calcium can be harmful. Evidence supports WHO’s recommendation to alter calcium intake recommendations based on diet composition and other lifestyle factors. The desirable calcium intake should be no less than 520 mg per day to meet basal needs and to help prevent osteoporosis. Evidence of substantial benefit from higher intakes is poor.

18
Vitamin D Function Vitamin D is needed to maintain normal levels of calcium and phosphorous in the blood, which, in turn, promote normal bone mineralization, muscle contraction, nerve conduction, and general cellular function in the body. Vitamin D is made in the body as the result of exposure to sunlight. When sun exposure is adequate, there is no dietary requirement for vitamin D. Deficiency Vitamin D deficiency causes rickets in children and not infrequently occurs among elderly persons, although it can become a problem for people of any age (Holick 2006). The adult equivalent of rickets is called osteomalacia. Rickets is marked by faulty calcification, which results in misshapen bones (bowing of legs), retarded bone growth, enlargement of the ends of long bones, deformities of ribs, delayed closing of fontanel, slow eruption of teeth, and malformed and decay-prone teeth. Rickets is also marked by muscle spasms, as well as decreased muscle tone, resulting in the protrusion of the abdomen (Whitney 1996). Osteomalacia has a softening effect on the bones, leading to deformities of limbs, spine, thorax, and pelvis. It also causes pain in the pelvis, lower back, and legs, and bone fractures. Other symptoms include involuntary twitching and muscle spasms (Whitney 1996). The term vitamin D insufficiency describes the finding of biochemical evidence of vitamin D deficiency without the clinical symptoms of rickets or osteomalacia. This condition may predispose individuals to poor muscle and bone health (Hanley 2005). Overconsumption Hypervitaminosis D may cause loss of appetite, headache, weakness, fatigue, excessive thirst, irritability, apathy, hypercalcemia, calcification of soft tissues, irreversible renal damage, kidney stones, and can be fatal (Whitney 1996). Institute of Medicine Tolerable Upper Intake Level (UL) for Vitamin D (IOM 1997)
Age group UL (µg/day) 2-18 years 50 >18 years 50

19
Absorption or Balance The active form of vitamin D in the body is called 1,25-dihydroxyvitamin D3. For many people, 5 to 15 minutes per day of sun between the hours of 10 a.m. and 3 p.m, on the arms and legs or hands, face and arms, during the spring, the summer, and the fall is sufficient to meet vitamin D needs (Holick 2005). However, a number of factors can reduce vitamin D production: latitude, season, the aging process, skin pigmentation, clothing, and sunscreen use (Holick 1994). Vitamin D can be found in foods in the form of vitamin D3 (in animal products, such as egg yolk, liver, and fatty fish) or vitamin D2 (in small amounts in some plant foods). Vitamin D is most reliably found in nutritional supplements, such as common multiple vitamins, and in fortified foods, such as dairy and nondairy milks, and some cereals and margarines. Institute of Medicine Recommendations The IOM sets its adequate intakes, regardless of sun exposure, to meet the needs of each age group (IOM 1997).
Institute of Medicine Adequate Intake (AI) for Vitamin D
Age group AI (µg/day) 2-3 years 5 4-8 years 5 9-13 years 5 14-18 years 5 19-50 years 5 51-70 years 10 >70 years 15
World Health Organization Recommendations For those people who may not be making enough vitamin D, the WHO recommends consuming the Recommended Nutrient Intake amount appropriate for their ages (WHO/FAO 2004).
World Health Organization Recommended Nutrient Intake (RNI) for Vitamin D
Age group RNI (µg/day) 2-3 years 5 4-6 years 5 7-9 years 5 10-18 years 5

20
19-50 years 5 51-65 years 10 65+ years 15
Summary WHO and IOM guidelines are essentially the same and should apply in all cases where there a question whether or not vitamin D needs are met from sunlight exposure.

21
Iron Function Iron is a highly reactive element whose major functions relate to its ability to participate in oxidation and reduction reactions. Iron plays a major role in transport of oxygen and carbon dioxide. It is also an active component of enzymes and contributes to immune function and cognition. (Krause, 2004) The body contains iron in two major pools. Functional iron is found in hemoglobin, myoglobin, and enzymes. Storage iron is found in ferritin, hemosiderin, and transferrin. Iron is highly conserved in the body. In the absence of menstruation or pregnancy, only a small quantity is lost each day. Approximately 90 percent of iron is recovered and reused, and the rest is excreted mainly in bile (Krause 2004). Dietary iron is necessary for maintaining iron balance. Deficiency Iron deficiency is defined as an abnormal value for at least two of the following three indicators: serum ferritin, transferrin saturation, or free erythrocyte protoporphyrin. It is common worldwide, particularly in developing countries (Looker 1997). In industrialized countries, the prevalence of iron-deficiency anemia ranges from 2 to 8 percent (WHO/FAO 2004). Based on results from the National Health and Nutrition Examination Survey (NHANES III 1988-1994), iron deficiency and iron-deficiency anemia are most common among toddlers, adolescent girls, and women of childbearing age. Of the 24,894 study participants, an estimated 9-11 percent of adolescent girls and women of childbearing age were iron-deficient. Of these, 2 percent and 5 percent, respectively, had iron-deficiency anemia. Iron deficiency and iron-deficiency anemia were rare among other demographic groups in the NHANES III study. These data indicate that iron deficiency prevalence is above the goal set by Healthy People 2010 objectives (Looker 1997) (Kramer 2004) (U.S. Dept. Health 2000), but that iron-deficiency anemia is uncommon in the United States. Symptoms of iron-deficiency anemia include decreased work performance, decreased exercise tolerance, and behavioral changes, such as anorexia, pica, and fatigue. Early iron deficiency may increase risk for infection. In later stages, deficiency may result in damage to the structure and function of the epithelial tissues, especially of the tongue, nails, mouth, and stomach (Krause 2004). Toxicity Dietary iron exists in two forms: heme iron found in animal products, and non-heme iron found predominately in plant foods, but also in some animal products.
22
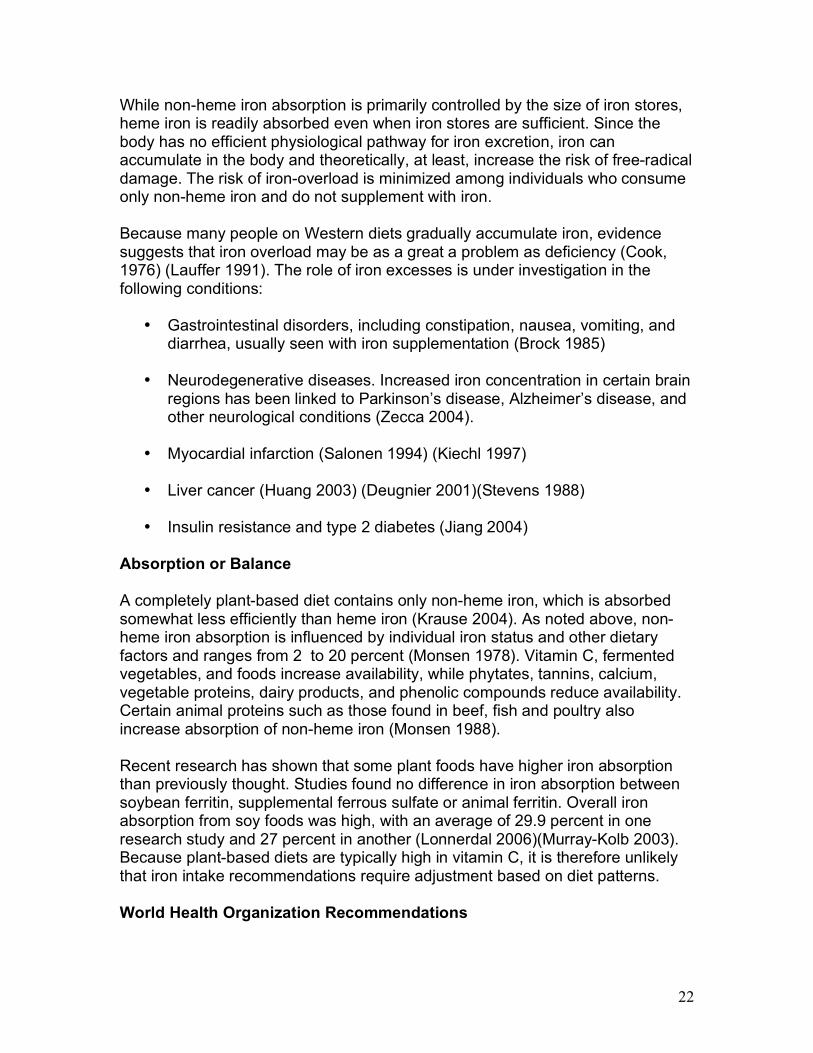
While non-heme iron absorption is primarily controlled by the size of iron stores, heme iron is readily absorbed even when iron stores are sufficient. Since the body has no efficient physiological pathway for iron excretion, iron can accumulate in the body and theoretically, at least, increase the risk of free-radical damage. The risk of iron-overload is minimized among individuals who consume only non-heme iron and do not supplement with iron. Because many people on Western diets gradually accumulate iron, evidence suggests that iron overload may be as a great a problem as deficiency (Cook, 1976) (Lauffer 1991). The role of iron excesses is under investigation in the following conditions:
• Gastrointestinal disorders, including constipation, nausea, vomiting, and diarrhea, usually seen with iron supplementation (Brock 1985)
• Neurodegenerative diseases. Increased iron concentration in certain brain
regions has been linked to Parkinson’s disease, Alzheimer’s disease, and other neurological conditions (Zecca 2004).
• Myocardial infarction (Salonen 1994) (Kiechl 1997)
• Liver cancer (Huang 2003) (Deugnier 2001)(Stevens 1988)
• Insulin resistance and type 2 diabetes (Jiang 2004)
Absorption or Balance A completely plant-based diet contains only non-heme iron, which is absorbed somewhat less efficiently than heme iron (Krause 2004). As noted above, non-heme iron absorption is influenced by individual iron status and other dietary factors and ranges from 2 to 20 percent (Monsen 1978). Vitamin C, fermented vegetables, and foods increase availability, while phytates, tannins, calcium, vegetable proteins, dairy products, and phenolic compounds reduce availability. Certain animal proteins such as those found in beef, fish and poultry also increase absorption of non-heme iron (Monsen 1988). Recent research has shown that some plant foods have higher iron absorption than previously thought. Studies found no difference in iron absorption between soybean ferritin, supplemental ferrous sulfate or animal ferritin. Overall iron absorption from soy foods was high, with an average of 29.9 percent in one research study and 27 percent in another (Lonnerdal 2006)(Murray-Kolb 2003). Because plant-based diets are typically high in vitamin C, it is therefore unlikely that iron intake recommendations require adjustment based on diet patterns. World Health Organization Recommendations

23
The FAO/WHO recommendations are based on average iron requirements—estimated using basal losses for males, basal and menstrual losses for females, and growth requirements in children. The recommendations vary depending on type of diet. In populations consuming typical Western diets including meat, poultry, and fish, recommendations are based on either 15 percent or 12 percent bioavailability. For developing populations consuming primarily plant-based diets, recommendations are based on either 10 percent or 5 percent bioavailability (WHO/FAO 2004).
World Health Organization Recommended Iron Intake (mg/day)
% bioavailability of foods Age (yrs) 15% 12% 10%** 5%*** 1-3 3.9 4.8 5.8 11.6 4-6 4.2 5.3 6.3 12.6 7-10 5.9 7.4 8.9 17.8 Males 11-14
9.7
12.2
14.6
29.2
15-17 12.5 15.7 18.8 37.6 18+ 9.1 11.4 13.7 27.4 Females 11-14
21.8 27.7 32.7 65.4
11-14* 9.3 11.7 14 28 15-17
20.7
25.8
31
62
18+ 19.6 24.5 29.4 58.8 Post-menopause 7.5 9.4 11.3 22.6 Lactating 10 12.5 15 30
*Nonmenstruating **Diet that approximates a medium bioavailability of 10 percent, constrained vegetarian diets, mainly cereals and vegetable foods with small quantities of meat, fish, ascorbic acid ***5 percent bioavailability for very restricted vegetarian diets Institute of Medicine Recommendations The IOM Food and Nutrition Board’s (FNB) recommended dietary intakes for iron were estimated using a maximum rate of absorption of 18 percent bioavailability. These recommendations were calculated based on the needs of a person with normal amounts of functional iron but with minimal stored iron. Recommendations were made with the goal of keeping 97.5 percent of the population in iron balance (IOM Vitamin A 2001).

24
Institute of Medicine Recommended Iron Intake
Age (yrs) Iron (mg/d) 1-3 7 4-8 10 Males 9-13
8
14-18 11 19-30 8 31-50 8 51-70 8 >70 8 Females 9-13
8
14-18 15 19-30 18 31-50 18 51-70 8 >70 8
The FNB established a separate iron RDA for vegetarians, which was 1.8 times greater than the rest of the population. It recommended 14 mg for men and postmenopausal women and 33 mg for premenopausal women not using oral contraceptives, based on one small study of people consuming “iron-inhibiting meals” (Cook 1991). Summary Evidence supports WHO recommendations based on either a 12 percent or 15 percent bioavailability from foods. Higher iron intakes, regardless of diet composition, are unnecessary and may lead to iron toxicity. Rather than aiming for high iron intakes, iron adequacy is best ensured through a diet that reduces absorption inhibitors and includes absorption enhancers.
A bioavailability of 18 percent was used to estimate the average. requirement for children 1+ years, adolescents, and non-pregnant adults consuming a mixed diet typical in the US and Canada
Estimated average requirement (EAR) is about 30% greater for those who engage in regular intense exercise
Upper limit (UL) for adults > 19 is 45mg/day

25
Zinc Function Zinc assists in cell reproduction and tissue growth and repair. It plays a role in immune function and is also a part of many enzymes involved with metabolism. It is also involved in normal taste perception, wound healing, sperm production, and various aspects of fetal development. Deficiency Zinc deficiency affects many systems in the body. Symptoms include growth retardation, skeletal abnormalities, defective collagen synthesis, poor wound healing, dermatitis, delayed sexual maturation in children, blunting of the sense of taste, night blindness, hair loss, impaired immune function, and impaired protein synthesis (Groff 1995). Laboratory indicators of zinc, such as plasma zinc, are not always good predictors of true zinc status (IOM vitamin A 2001). Therefore, the prevalence of zinc deficiency, especially marginal zinc deficiency, is difficult to measure (Lowe 2005) (Wood 2000). However, some researchers have estimated that 9.5 percent of individuals in the United States and Canada are at risk of inadequate zinc intake (Wuehler 2005). Overconsumption Symptoms of zinc toxicity include: nausea, vomiting, epigastric pain, lethargy, fatigue, decreased copper absorption, impaired immune function, and adverse effects on the ratio of low-density-lipoprotein (LDL) to high-density-lipoprotein (HDL) cholesterol (Fosmire 1990).
IOM Tolerable Upper Intake Level (UL) for Zinc (IOM vitamin A 2001)
Age group UL (mg/day) 2-3 years 7 4-8 years 12 9-13 years 23 14-18 years 34 >19 years 40
The WHO has set an upper level of zinc intake for adult men at 45 mg/day and for children at 23-28 mg/day. (WHO/FAO, 2004) Absorption or Balance

26
Zinc absorption is affected by other dietary constituents. High calcium (Wood, 1997) and iron (Solomons 1986) intakes may decrease zinc absorption. Phytates, found in whole grains and legumes, inhibit zinc absorption (Fredlund 2006) (Lonnerdal 2000). Animal protein increases zinc absorption (Sandstrom 1989). Therefore a vegetarian diet, with a high intake of phytates and little or no animal protein, may theoretically lead to lower bioavailability of zinc in the body (IOM vitamin A 2001) (WHO/FAO 2004) (Gibson 1994) (Hunt 1998). Zinc absorption from plant-based sources can be increased to some extent by including sprouted grains, beans, or seeds and yeast-raised breads in the diet, soaking and cooking legumes, and combining zinc sources with acidic ingredients such as lemon juice or tomato sauce (Lonnerdal 2000) (Gibson 1997). Studies of the zinc status of vegetarians have produced inconsistent results (Rauma 2000). Most studies have shown that vegetarians have either similar zinc status, compared with nonvegetarians, or low-normal zinc status (Gibson 1994) (Hunt 2003) (Ball 2000) (Haddad 1999) (Krajcovicova-Kudlackova 1995). However, some studies have shown that vegetarians have lower zinc levels compared to nonvegetarians (Kadrabova 1995) (Freeland 1980). Institute of Medicine Recommendations The IOM sets the RDAs for men based on a standard omnivorous diet. The IOM notes that the requirement for dietary zinc may be as much as 50 percent greater for those following a vegetarian diet, and especially for those whose diets consist largely of grains and legumes (IOM vitamin A 2001).
Institute of Medicine Recommended Dietary Allowance (RDA) for Zinc
Age group RDA (mg/day) Children 2-3 years 3 Children 4-8 years 5 Boys and Girls 9-13 years 8 Boys 14-18 years 11 Girls 14-18 years 9 Men 19-70+ years 11 Women 19-70+ years 8
World Health Organization Recommendations The WHO divides its Recommended Nutrient Intake (RNI) for zinc into three categories based on bioavailability (high, moderate, and low). Entirely plant-based diets are in the low bioavailability category, due to the inclusion of high-phytate foods and the exclusion of animal protein. Omnivorous diets and lacto-

27
ovo-vegetarian diets are in the moderate bioavailablity category. Highly refined diets containing large amounts of meats are in the high availability category (WHO/FAO 2004).
World Health Organization Recommended Nutrient Intake (RNI) for Zinc Age group Low bioavailability
RNI (mg/day) Moderate bioavailability RNI (mg/day)
High bioavailability RNI (mg/day)
2-3 years 8.3 4.1 2.4 4-6 years 9.6 4.8 2.9 7-9 years 11.2 5.6 3.3 Females, 10-18 years
14.4 7.2 4.3
Males, 10-18 years
17.1 8.6 5.1
Females, 19-65 years
9.8 4.9 3.0
Males, 19-65 years
14.0 7.0 4.2
Females, 65+ years
9.8 4.9 3.0
Males, 65+ years
14.0 7.0 4.2
Summary Because zinc absorption is affected by various components of the diet, the WHO's recommendations for zinc, which are based on zinc bioavailability of different diet patterns, are particularly useful.
Issues Regarding Nutrient Sources Nutrients are supplied by a wide variety of sources that vary in their contribution to health. The following sections address nutrients for which the health advantages and disadvantages of various sources may be significant. Carbohydrate Carbohydrate sources may be classified in various ways. Carbohydrates may be simple or complex; grains may be refined or unrefined; and carbohydrate-containing foods vary according to their glycemic index. Simple vs. Complex Carbohydrate. The term simple carbohydrate refers to sugars, that is, monosaccharides and disaccharides, such as glucose, fructose,

28
lactose, and sucrose. Foods high in simple carbohydrate include table sugar, fruit, and milk. Complex carbohydrate refers to starch, that is, polysaccharides. Examples of foods high in complex carbohydrate include grains, legumes, starchy vegetables, pasta, and breads. Generally speaking, complex carbohydrates have a more favorable health profile, compared to simple carbohydrates. Refined vs. Unrefined Carbohydrates. During the refining process, the outer bran coating of grains is removed, greatly reducing its fiber content. Glycemic Index. The glycemic index quantifies the effects of carbohydrate-containing foods on blood glucose concentrations. Foods with a low glycemic index, such as beans or fruit, may improve blood glucose control and reduce triglycerides, compared with high-glycemic-index foods. Evidence suggests substantial benefits of food sources providing complex, unrefined, low-glycemic-index carbohydrate. Protein Protein is available from both plant and animal sources. While most plant foods contain all essential amino acids, some are limited in one amino acid or more. In typical meals, however, the amino acids provided by various plant foods complement each other, providing complete protein. Vegetarian and vegan diets are more than adequate in protein without intentional combining of foods. Soy products provide protein with a biological value similar to that of animal protein. Animal proteins typically contain all essential amino acids. Unlike plant protein, animal protein intake is associated with urinary calcium losses (Ince 2004) Wiederkehr 2001), kidney stones, and osteoporosis (Abelow 1992) (Sellmeyer 2001), possibly as a result of a higher content of sulfur-containing amino acids. In individuals with pre-existing renal impairment (e.g., many people with hypertension or diabetes), intake of non-dairy animal protein is associated with further loss of kidney function (Knight 2003) (Goldfarb 1999). Animal sources of protein present additional health considerations, described below. Fats All fats are mixtures. Fats from animal sources are typically high in saturated fat. Approximately one-half of the fat in beef, one-third of the fat in chicken, and up to one-third of fat in fish is saturated (USDA 2005). Fat derived from fish is higher in long-chain fatty acids, compared with most other fats. Although there is no nutritional requirement for these fats (IOM Energy 2002) (WHO/FAO 1994), they are under investigation for possible benefits in

29
certain disease states. As noted above, fish fats also contain significant amounts of saturated fat (typically 15-30 percent) (USDA 2005). Fats from plant sources are typically lower in saturated fat, with the notable exception of tropical oils. However, all oils contain at least some saturated fat. For example, olive oil is approximately 13 percent saturated fat. Vitamin A Some animal products contain abundant preformed vitamin A, while pro-vitamin A carotenoids (β-carotene, α-carotene, and β-cryptoxanthin) are found in darkly colored fruits and vegetables. The efficiency of absorption for preformed vitamin A ranges from 70 to 90 percent, and the absorption fraction is independent of the ingested quantity. In contrast, β -carotene absorption ranges from 9 to 22 percent with absorption decreasing with increased consumption (IOM vitamin A 2001). Dietary fat consumption increases carotenoid absorption, but does not alter preformed vitamin A absorption (IOM vitamin A 2001). Vitamin D Vitamin D is naturally produced in the skin after exposure to ultraviolet light. A modest exposure to sunlight will provide adequate vitamin D. To be biologically activated, inactive forms of vitamin D, cholecalciferol and ergocalciferol, must be delivered to and hydroxylated in the liver and in the kidney. Because vitamin D is produced in the body and does not have to be consumed, it is actually hormone, rather than a vitamin (Krause 2004). However, precursors to vitamin D are found in some foods of animal and plant origin. Cholecalciferol, or vitamin D3, comes from animals, and ergosterol, or vitamin D2, comes from plants. Either must be further metabolized to its active form, calcitriol. D2 and D3 can be added to some commercial foods, such as cereals, dairy milk, soymilk, and other plant-derived milks. Iron Dietary iron is found in two forms. Iron in its heme form is found in meat products and has an absorption rate up to 25 percent. Non-heme iron is found in plant products and has a variable absorption rate. Non-heme iron is found in whole-grains, beans and some fruits and vegetables, including beans, dark leafy green vegetables, dried fruits, soy products, fortified grains, and nuts and seeds. Many plant foods such as citrus fruits and green peppers are high in vitamin C which increases the absorbability of non-heme iron.

30
Unlike heme iron, non-heme iron is absorbed according to the body’s need. The body has no efficient physiological pathway for iron excretion, and evidence suggests easily absorbable heme-iron may result in elevated body iron stores. Since non-heme iron absorption is influenced by individual iron status and other dietary factors, risk of toxicity is minimized among individuals who do not also supplement with iron (Alexander 1994) (Ball 1999) (Helman 1987)(Harman 1998). Dairy products inhibit the absorbability of iron and may displace iron-rich foods. Calcium Calcium is commonly found in legumes, vegetables, dairy products, and fortified foods. Plant sources of calcium, such as legumes, are also good sources of potassium, a mineral that helps reduce calcium losses. Calcium absorption is highly influenced by many dietary factors. Oxalates (found in some leafy green vegetables such as spinach, chard, and beet greens), phytates (a phosphorous-containing compound found in the outer portion of grains), and phosphorous itself (found in dairy products, eggs, and meat) may reduce calcium absorption (Krause 2004). Therefore, foods high in oxalates, phytates, and phosphorous should not be solely relied upon as calcium sources. Sodium and calcium compete for resorption in the renal tubules (Matkovic 1995). For every 2300 mg of sodium excreted by the kidney, 40-60 mg of calcium is also lost (i.e., every 100 mmol of sodium excreted leads to the excretion of approximately 1 mmol of calcium)(Nordin 1993). Because a 240 ml (8 oz) serving of cow’s milk contains 120 mg sodium, and other dairy products may contain up to 20 percent of the RDA for sodium per serving, their consumption would be expected to promote calcium loss in the urine. Findings from recent epidemiologic and prospective studies in women (Feskanich 2003), children, and adolescents (Lloyd 2000) (Lloyd 2001) (Lloyd 2002) (Kroger 1993) have questioned the efficacy of the use of dairy products for the promotion of bone health and have found little benefit from getting calcium from dairy products. More important than calcium intake is calcium retention. Dietary protein, particularly animal protein, high in sulfur containing amino acids, negatively affects calcium balance by increasing calcium losses (Schuette 1981). Metabolism of amino acids leads to low-grade metabolic acidosis; the skeleton, as a reservoir of calcium salts, reacts by mobilizing salts to counter the production of endogenous acid and neutralize the acidity. Research also shows excess dietary protein not only increases urinary calcium loss but is associated with higher rates of fracture (Feskanich 2003)(Sellmeyer 2001). Because a completely plant-based diet is devoid of animal protein, low in sodium and phosphorus, the most optimal sources of calcium come from plants. Plant-

31
based diets may also decrease requirements by producing anions that can be metabolized (ex. acetate and bicarbonate) thus lowering urinary calcium excretion (Green 1994). Food Group Attributes Macronutrients, micronutrients, and fiber are available in a variety of foods that differ widely in their nutritional attributes. Some foods also contain harmful constituents. In this section, the major food groups are discussed. Legumes Legumes (beans, peas, and lentils) provide complex carbohydrate, protein, traces of essential fats, soluble and insoluble fiber, vitamins, antioxidants, and minerals, such as calcium and iron. Like all plant-derived foods, legumes contain no cholesterol. They are also very low in saturated fat. Vegetables Green leafy vegetables contain protein, traces of essential fats, fiber, and an abundance of vitamins (e.g., vitamin A, vitamin C, folate) and minerals (e.g., calcium, iron). Orange vegetables are particularly high in beta-carotene. Starchy vegetables vary in their glycemic index, which is higher for white potatoes and lower for sweet potatoes and yams. Like all plant-derived foods, vegetables contain no cholesterol. They are also very low in saturated fat. Fruits Fruits provide carbohydrate, fiber, vitamins (e.g., vitamin C, folate, β-carotene), and minerals (eg, potassium). Fruits are higher in simple sugars, compared to legumes, vegetables, and grains. However, with few exceptions, the glycemic index of most fruits is low. Like all plant-derived foods, fruits contain no cholesterol. They are also very low in saturated fat. Grains

32
Whole grains provide complex carbohydrate, fiber, protein, and micronutrients, such as folate, vitamin B6, and magnesium, as well as antioxidants such as selenium, vitamin E, and zinc. Meats Meats contain significant amounts of complete protein. As noted above, animal protein differs from plant protein in its effects on renal function and calcium balance. All meats contain significant amounts of saturated fat, ranging from 15 to 50 percent of energy. Meats also contain significant amounts of cholesterol. The iron in meat is somewhat more bioavailable, compared with the iron in plants. Once thought to be an advantage, the high iron bioavailability may contribute to excessive iron accumulation, which may increase risk of cardiovascular disease and other problems. Like all animal products, meat contains no fiber or complex carbohydrate. Dairy products Dairy products are high in calcium. As a group, they are also high in sugar, cholesterol, and saturated fat. Product, 8 oz serving
Sugar Cholesterol Saturated Fat As Percentage of Total Fat
Whole milk 12.8 g 24 mg 57% 2% milk 12.4 g 20 mg 64% 1% milk 12.7 g 12 mg 65% Nonfat milk 12.5 g 5 mg 62% Yogurt 10.6 g 30 mg 64%
Eggs Eggs, like meat and soy, provide complete protein. However, eggs derive over 60 percent of their energy from fat, a third of which is saturated fat. Each egg also contains 212 mg of cholesterol. There is no fiber in eggs. Oils Oils can provide a high dose of the essential fatty acids necessary for a healthy diet. Some oils will also provide nutrients such as vitamin E. However, most oils

33
also contain substantial amounts of competing fatty acids, including saturated fats. Oils are also concentrated in calories. Sugars Sugar is calorie-dense and nutrient-poor and is not required.

34
References
Welsh SO, Davis C, Shaw A. USDA’s Food Guide: Background and Development. Hyattsville, Md: US Department of Agriculture; 1993. Publication 1514. Position of the American Dietetic Association: nutrition for athletic performance for adults. J Amer Diet Assoc. 2000;100:1543-1556. Jacobs KA, Sherman WM. The efficacy of carbohydrate supplementation and chronic high-carbohydrate diets for improving endurance performance. Int J Sport Nutr. 1999;9(1):92-115. Haff GG, Stone MH, Warren BJ, et al. The effect of carbohydrate supplementation on multiple sessions and bouts of resistance exercise. J Strength Cond Res. 1999;13(2):111-117. Leveritt M, Abernethy PJ. Effects of carbohydrate restriction on strength performance. J Strength Cond Res. 1999;13(1):52-57. World Health Organization. Carbohydrates in Human Nutrition. Joint Food and Agricultural Organization/World Health Organization/United Nations University Expert Consultation. Rome,Italy;1997. Available at: http://www.fao.org/docrep/W8079E/w8079e08.htm. Accessed on December 10, 2005. Ludwig DS, Peterson KE, Gortmaker SL. Relation between consumption of sugar-sweetened drinks and childhood obesity: A prospective, observational analysis. Lancet. 2001;357:505-508. Institute of Medicine/Food and Nutrition Board. (IOM/FNB) Dietary Reference Intakes for Energy, Carbohydrate, Fiber, Fat, Fatty Acids, Cholesterol, Protein, and Amino Acids (Macronutrients). Washington, DC: National Academy Press, 2002/2005. U.S. Department of Agriculture, Agricultural Research Service. Documentation: 1994-96 Continuing Survey of Food Intakes by Individuals (CSFII) and 1994-96 Diet and Health Knowledge Survey (DHKS). Washington, DC: U.S. Department of Agriculture, 1998. Beers MH, Berkow R. The Merck Manual of Diagnosis and Therapy, 17th Ed. Merck & Co., Inc., 1999. Available at: http://www.merck.com/mrkshared/mmanual/section1/chapter2/2c.jsp
35
Millward DJ. Meat or wheat for the next millennium? Plenary Lecture: The nutritional value of plant-based diets in relation to human amino acid and protein requirements. Proceedings of the Nutrition Society. 1999;58:249-260. Durkin N, Ogar DA, Tilve SG, Margen S. Human protein requirements: autocorrelation and adaptation to a low-protein diet containing 0.356 gm protein/kg or 57 N//Kg body weight. Food and Agricultural Organization/World Health Organization/United Nations University Inf. Paper no. 7 Geneva, Switzerland;1981. Abelow BJ, Holford TR, Insogna KL. Cross-cultural association between dietary animal protein and hip fracture: a hypothesis. Calcif Tissue Int. 1992;50:14-18. Smit E, Nieto J, Crespo CJ, Mitchell P. Estimates of animal and plant protein intake in US adults: results from the Third National Health and Nutrition Examination Survey, 1988-1991. J Amer Diet Assoc. 1999;7:813-20. Ince BA, Anderson EJ, Neer RM. Lowering dietary protein to US recommended dietary allowance levels reduces urinary calcium excretion and bone resorption in young women. J Clin Endocrinol Metab. 2004;89:3801-3807. Coresh J, Astor BC, Greene T, Eknoyan G, Levey AS. Prevalence of chronic kidney disease and decreased kidney function in the adult US population: Third National Health and Nutrition Examination Survey. Am J Kid Dis. 2003;41:1–12. World Health Organization. Energy and Protein Requirements. Joint Food and Agricultural Organization/World Health Organization/United Nations University Expert Consultation. (Technical Report Series 724). Geneva,Switzerland;1985. Available at: http://www.fao.org/DOCREP/003/AA040E/AA040E06.htm. Accessed on October 14, 2006. Millward, JD, The nutritional value of plant-based diets in relation to human amino acid and protein requirements, Proceedings of the Nutrition Society, 1999;58:249-260. Position of the American Dietetic Association: vegetarian diets. J Amer Diet Assoc. 2003;103(6):748-765. Young VR, Pellett PL. Plant proteins in relation to human protein and amino acid nutrition. Am J Clin Nutr. 1994;59:1203S-1212S. Groff JL, Gropper SS, Hunt SM. Advanced Nutrition and Human Metabolism. West Publishing Company, New York, 1995. World Health Organization. Fats and oils in Human Nutrition. FAO Food and Nutrition Paper – 57. Joint Food and Agricultural Organization/World Health
36
Organization/United Nations University Expert Consultation. Rome,Italy;1994. Available at: http://www.fao.org/docrep/V4700E/V4700E06.htm. Accessed on February 23, 2006. Mahan KL, Escott-Stump S. Krause’s Food Nutrition and Diet Therapy, 11th ed. W.B. Saunders Company, 2004. Messina V, Mangels R, Messina MJ. The Dietitian’s Guide to Vegetarian Diets, 2nd ed. Sudbury, MA: Jones and Bartlett Publishers; 2004. Linscheer WG, Vergroesen AJ. Lipids. In: Modern Nutrition in Health and Disease. Shils ME, Olson JA, Shike M, eds. Lea and Febiger, Philadelphia, 1994. Hibbeln JR, Nieminen LRG, Blasbalg TL, Riggs JA, Lands WEM. Healthy intakes of n-3 and n-6 fatty acids: estimations considering worldwide diversity. Am J Clin Nutr. 2006;83:1483S-1493S. Ajani UA, Ford ES, Mokdad AH. Dietary fiber and c-reactive protein: findings from National Health and Nutrition Examination Survey data. J Nutr. 2004;134:1181-1185. Humble CG, Malarcher AM, Tyroler HA. Dietary fiber and coronary heart disease in middle-aged hypercholesterolemic men. Am J Prev Med. 1993;9:197-202. Khaw KT, Barrett-Connor E. Dietary fiber and reduced ischemic heart disease mortality rates in men and women: a 12-year prospective study. Am J Epidemiol. 1987;126:1093-1102. Kromhout D, Bosschieter EB, de Lezenne CC. Dietary fibre and 10-year mortality from coronary heart disease, cancer, and all causes. The Zutphen study. Lancet. 1982; 2:518-522. Pietinen P, Rimm EB, Korhonen P, Hartman AM, Willett WC, Albanes D, Virtamo J. Intake of dietary fiber and risk of coronary heart disease in a cohort of Finnish men. The Alpha-Tocopherol, Beta-Carotene Cancer Prevention Study. Circulation. 1996;94:2720-2727. Wolk A, Manson JE, Stampfer MJ, Colditz GA, Hu FB, Speizer FE, Hennekens CH, Willett WC. Long-term intake of dietary fiber and decreased risk of coronary heart disease among women. J Am Med Assoc. 1999;281:1998-2004. Howarth NC, Saltzman E, Roberts SB. Dietary fiber and weight regulation. Nutrition Reviews. 2001;59(5):129-139. Dietary Guidelines for Americans 2005. U.S. Department of Health and Human Services (USDHHS)/U.S. Department of Agriculture (USDA). Available at:

37
http://www.healthierus.gov/dietaryguidelines/index.html. Accessed on: October 23, 2006. World Health Organization. Carbohydrates in Human Nutrition. Joint Food and Agricultural Organization/World Health Organization/United Nations University Expert Consultation. Rome,Italy;1997. Available at: http://www.fao.org/docrep/W8079E/w8079e09.htm#obesity. Accessed on January 10, 2006. Chiu JF, Lan SJ, Yang CY, et al. Long-term vegetarian diet and bone mineral density in postmenopausal Taiwanese women. Calcif Tissue Int. 1997;60(3)245-249. Gerrior S. Nutrient Content of the US Food Supply. Home Economics Research Report no. 53. Washington, DC: United States Department of Agriculture, Center of Nutrition Policy and Promotion; 2001. Abelow BJ, Holford TR, Insogna KL. Cross-cultural association between dietary animal protein and hip fracture: a hypothesis. Calcif Tissue Int. 1992;50:14-18. Hegsted DM. Calcium and osteoporosis. J Nutr. 1986;116:2316-2319. Nordin BC. Calcium requirement is a sliding scale. Am J Clin Nutr. 2000;71(6):1381-1383. Lanou AJ, Berkow SE, Barnard ND. Calcium, Dairy Products, and Bone Health in Children and Young Adults: A Reevaluation of the Evidence. Pediatrics. 2005;115:736-743. Feskanich D, Willett WC, Stamfer MJ, Colditz GA. Calcium, vitamin D, milk consumption, and hip fractures: a prospective study among postmenopausal women. Am J Clin Nutr. 2003;77:504-511. Institute of Medicine/Food and Nutrition Board. (IOM/FNB) Dietary Reference Intakes for Calcium, Phosphorus, Magnesium, Vitamin D, and Fluoride. Washington, DC: National Academy Press, 1997. Giovannucci E, Rimm EB, Wolk A, et al. Calcium and fructose intake in relation to risk of prostate cancer. Cancer Res. 1998;58:442-447 Chan JM, Giovannucci E. Dairy Prodcuts, Calcium, and Vitamin D and Risk of Prostate Cancer. Epidemiologic Reviews. 2001;23(1):87-92. Chan JM, Gann P, Giovannucci E. Role of Diet in Prostate Cancer Development and Progression. J Clin Oncol. 2005;23:8152-8160.

38
Nordin BE, Need AG, Morris HA, Horowitz M. The nature and significance of the relationship between urinary sodium and urinary calcium in women. J Nutr. 1993;123:1615-1622. Nordin BE. Calcium and osteoporosis. Nutrition. 1997;13:664-686. Matkovic V, Ilich JZ, Andon MB et al. Urinary calcium, sodium, and bone mass of young females. Am J Clin Nutr. 1995;62:417-425. Schuette SA, Hegsted M, Zemel MB, Linkswiler HM. Renal acid, urinary cyclic AMP, and hydroxyproline exretion as affected by level of protein, sulfur, amino acid, and phosphorus intake. J Nutr. 1981;111:2106-2116. Feskanich D, Willett WC, Stamfer MJ, Colditz GA. Protein consumption and bone fractures in women. Am J Epidemiol. 1996;143:472-479. Sellmeyer DE, Stone KL, Sebastian A, Cummings SR. A high ratio of dietary animal to vegetable protein increases the rate of bone losss and the risk of fracture in postmenopausal women. Am J Clin Nutr. 2001;73:118-122. World Health Organization. Diet, Nutrition, and the Prevention of Chronic Diseases. Joint Food and Agricultural Organization/World Health Organization/United Nations University Expert Consultation. (Technical Report Series 916). Geneva, Switzerland;2003. Winzenberg T, Shaw K, Fryer J, Jones G. Effects of calcium supplementation on bone density in healthy children: meta-analysis of randomised controlled trials. BMJ [serial online]. Sept. 15, 2006. Available at: http://bmj.bmjjournals.com/. Accessed on Sept. 29, 2006. (may not use) Holick MF. High prevalence of vitamin D inadequacy and implications for health. Mayo Clin Proc. 2006;81(3):353-373. Whitney EN, Rolfes SR. Understanding Nutrition. 7th ed. St. Paul, Mn.: West Publishing Company; 1996. Hanley DA, Davison KS. Vitamin D insufficiency in North America. J Nutr. 2005;135(2):332-337. Holick MF. The vitamin D epidemic and its health consequences. J Nutr. 2005;135(11):2739S-2748S. Holick MF. McCollum Award Lecture, 1994: vitamin D--new horizons for the 21st century. Am J Clin Nutr. 1994;60(4):619-630.

39
World Health Organization. Vitamin and Mineral Requirements in Human Nutrition. 2nd ed. Joint Food and Agricultural Organization/World Health Organization/United Nations University Expert Consultation. Rome,Italy;2004. Looker AC, Dallman PR, Carroll M, Gunter E, Johnson CL. Prevalence of iron deficiency in the United States. JAMA. 1997;277(12):973-976. Kramer LB, Osis D, Coffey J, Spencer H. Mineral and trace element content of vegetarian diets. J Am Coll Nutr. 1984;3:3-11. U.S. Department of Health and Human Services. Healthy people 2010. 2nd ed. With understanding and improving health and objectives for improving health. Washington, DC: U.S. Department of Health and Human Services, 2000. Cook JD, Finch CA, Smith NJ. Evaluation of the iron status of a population. Blood. 1976;48:449-455. Lauffer, RB. Iron Balance. New York, NY. St. Martin’s Press, 1991. Brock C, Curry H, Hanna C, Knipfer M, Taylor L. Adverse effects of iron supplementation: A comparative trial of wax-matrix iron preparation and conventional ferrous sulfate tablets. Clin Ther. 1985;7:568-573. Zecca L, Youdim MBH, Riderer P, Connor JR, Crichton RR. Iron, brain ageing and neurodegenerative disorder. Nature Reviews. 2004;5:863-873. Salonen JT, Nyssonen K, Salonen R. Body iron stores and the risk of coronary heart disease. N Engl J Med. 1994;331:1159. Kiechl S, Willeit J, Egger G, Poewe W, Oberhollenzer F. Body iron stores and the risk of carotid atherosclerosis: Prospective results from the Bruneck Study. Circulation. 1997;96:3300-3307. Huang X. Iron overload and its association with cancer risk in humans: evidence for iron as a carcinogenic metal. Mutat Res. 2003;533:153-171. Deugnier Y, Turlin B. Iron and hepatocellular carcinoma. J Gastroenterol. Hepatol. 2001;16:491-494. Stevens RG, Jones DY, Micozzi MS, Taylor PR. Body iron stores and the risk of cancer. N Engl J Med. 1988;319:1047-1052. Jiang R, Manson JE, MEigs JB, et al. Body iron stores in relation to risk of type 2 diabetes in apparently healthy women. JAMA. 2004;291:711-717.

40
Monsen ER, Hallberg L, Layrisse M, et al. Estimation of available dietary iron. Am J Clin Nutr. 1978;31:134-141. Monsen ER. Iron nutrition and absorption: dietary factors which impact iron bioavailability. J Am Diet Assoc. 1988;88:786-790. Lonnerdal B, Bryant A, Liu X, Theil EC. Iron absorption from soybean ferritin in nonanemic women. Am J Clin Nutr. 2006;83:103-107. Murray-Kolb LE, Welch R, Theil EC, Beard JL. Women with low iron stores absorb iron from soybeans. Am J Clin Nutr. 2003;77:180-184. Institute of Medicine/Food and Nutrition Board. (IOM/FNB) Dietary Reference Intakes for Vitamin A, Vitamin K, Arsenic, Boron, Chromium, Copper, Iodine, Iron, Manganese, Molybdenum, Nickel, Silicon, Vanadium, and Zinc: A Report of the Panel on Micronutrients. Washington, DC: National Academy Press, 2001. Cook JD, Dassenko SA, Lynch SR. Assessment of the role of nonheme-iron availability in iron balance. Am J Clin Nutr. 1991;54:717-722. Groff JL, Gropper SS, Hunt SM. Advanced Nutrition and Human Metabolism. 2nd ed. St. Paul, Mn.: West Publishing Company; 1995. Lowe NM. In search of a reliable marker of zinc status-are we nearly there yet? Nutrition. 2005;21(7-8):883-884. Wood RJ. Assessment of marginal zinc status in humans. J Nutr. 2000;130(5S Suppl):1350S-1354S. Wuehler SE, Peerson JM, Brown KH. Use of national food balance data to estimate the adequacy of zinc in national food supplies: methodology and regional estimates. Public Health Nutr. 2005;8(7):812-819. Fosmire GJ. Zinc toxicity. Am J Clin Nutr. 1990;51(2):225-227. Wood RJ, Zheng JJ. High dietary calcium intakes reduce zinc absorption and balance in humans. Am J Clin Nutr. 1997;65(6):1803-1809. Solomons NW. Competitive interaction of iron and zinc in the diet: consequences for human nutrition. J Nutr. 1986;116(6):927-935. Fredlund K, Isaksson M, Rossander-Hulthen L, Almgren A, Sandberg AS. Absorption of zinc and retention of calcium: Dose-dependent inhibition by phytate. J Trace Elem Med Biol. 2006;20(1):49-57. Epub 2006 Mar 2.

41
Lonnerdal B. Dietary factors influencing zinc absorption. J Nutr. 2000 May;130(5S Suppl):1378S-1383S. Sandstrom B, Almgren A, Kivisto B, Cederblad A. Effect of protein level and protein source on zinc absorption in humans. J Nutr. 1989;119(1):48-53. Gibson RS. Content and bioavailability of trace elements in vegetarian diets. Am J Clin Nutr. 1994;59(5 Suppl):1223S-1232S. Hunt JR, Matthys LA, Johnson LK. Zinc absorption, mineral balance, and blood lipids in women consuming controlled lactoovovegetarian and omnivorous diets for 8 weeks. Am J Clin Nutr. 1998;67(3):421-430. Gibson RS, Donovan UM, Heath AL. Dietary strategies to improve the iron and zinc nutriture of young women following a vegetarian diet. Plant Foods Hum Nutr. 1997;51(1):1-16. Rauma AL, Mykkanen H. Antioxidant status in vegetarians versus omnivores. Nutrition. 2000;16(2):111-119. Hunt JR. Bioavailability of iron, zinc, and other trace minerals from vegetarian diets. Am J Clin Nutr. 2003;78(3 Suppl):633S-639S. Ball MJ, Ackland ML. Zinc intake and status in Australian vegetarians. Br J Nutr. 2000;83(1):27-33. Haddad EH, Berk LS, Kettering JD, Hubbard RW, Peters WR. Dietary intake and biochemical, hematologic, and immune status of vegans compared with nonvegetarians. Am J Clin Nutr. 1999;70(3 Suppl):586S-593S. Krajcovicova-Kudlackova M, Simoncic R, Babinska K, Bederova A, Brtkova A, Magalova T, Grancicova E. Selected vitamins and trace elements in blood of vegetarians. Ann Nutr Metab. 1995;39(6):334-339. Kadrabova J, Madaric A, Kovacikova Z, Ginter E. Selenium status, plasma zinc, copper, and magnesium in vegetarians. Biol Trace Elem Res. 1995;50(1):13-24. Freeland-Graves JH, Bodzy PW, Eppright MA. Zinc status of vegetarians. J Am Diet Assoc. 1980;77(6):655-661. Wiederkehr M, Krapf R. Metabolic and endocrine effects of metabolic acidosis in humans. Swiss Med Wkly. 2001;131:127-132. Knight EL, Stampfer MJ, Hankinson SE, Spiegelman D, Curhan GC. The Impact of Protein Intake on Renal Function Decline in Women with Normal Renal Function or Mild Renal Insufficiency. Ann Int Med. 2003;138:460-467.

42
Goldfarb DS, Coe FL. Prevention of Recurrent Nephrolithiasis. Am Fam Physician. 1999;60:2269-2276. U.S. Department of Agriculture, Agricultural Research Service. 2005. USDA National Nutrient Database for Standard Reference, Release 18. Nutrient Data Laboratory Home Page, http://www.ars.usda.gov/ba/bhnrc/ndl Alexander D, Ball MJ, Mann J. Nutrient intakes and haematological status of vegetarians and age-sex matched omnivores. European Journal of Clinical Nutrition. 1994;45:538-546. Ball MJ, Bartlett MA. Dietary intake and iron status of Australian vegetarian women. Am J Clin Nutr. 1999;70:353-358. Helman AD, Darnton-Hill I. Vitamin and iron status in new vegetarians. Am J Clin Nutr. 1987;45:785-789. Harman SK, Parnell WR. The nutritional health of New Zealand vegetarian and nonvegetarian Seventh-day Adventists: selected vitamin, mineral, and lipid levels. NZ Med J. 1998;111:91-94. Lloyd T, Chinchilli VM, Johnson-Rollings N, Kieselhorst K, Eggli DF, Marcus R. Adult female hip bone density reflects teenage sports-exercise patterns but not teenage calcium intake. Pediatrics. 2000;106:40-44.
Lloyd T, Taylor DS. Calcium intake and peak bone mass. J Am Med Womens Assoc. 2001;56:49-52,72. Lloyd T, Beck TJ, Lin HM et al. Modifiable determinants of bone status in young women. Bone. 2002;30:416-421. Kröger H, Kotaniemi A, Kroger L, Alhava E. Development of bone mass and bone density of the spine and femoral neck--a prospective study of 65 children and adolescents. Bone Miner. 1993;23:171-182. Schuette SA, Hegsted M, Zemel MB, Linkswiler HM. Renal acid, urinary cyclic AMP, and hydroxyproline exretion as affected by level of protein, sulfur, amino acid, and phosphorus intake. J Nutr. 1981;111:2106-2116. Green TJ, Whiting SJ. Potassium bicarbonate reduces high protein-induced hypercalciuria in adult men. Nutr Rev. 1994;14:991-1002.