diesel-related hydrocarbons can dominate gas phase ... · pdf filediesel-related hydrocarbons...
TRANSCRIPT
Atmos. Chem. Phys., 15, 9983–9996, 2015
www.atmos-chem-phys.net/15/9983/2015/
doi:10.5194/acp-15-9983-2015
© Author(s) 2015. CC Attribution 3.0 License.
Diesel-related hydrocarbons can dominate gas phase reactive carbon
in megacities
R. E. Dunmore1, J. R. Hopkins1,2, R. T. Lidster1, J. D. Lee1,2, M. J. Evans1,2, A. R. Rickard1,2, A. C. Lewis1,2, and
J. F. Hamilton1
1Wolfson Atmospheric Chemistry Laboratories, Department of Chemistry, University of York, Heslington,
York, YO10 5DD, UK2National Centre for Atmospheric Science, University of York, Heslington, York, YO10 5DD, UK
Correspondence to: J. Hamilton ([email protected])
Received: 11 March 2015 – Published in Atmos. Chem. Phys. Discuss.: 31 March 2015
Revised: 12 August 2015 – Accepted: 27 August 2015 – Published: 7 September 2015
Abstract. Hydrocarbons are key precursors to two priority
air pollutants, ozone and particulate matter. Those with two
to seven carbons have historically been straightforward to ob-
serve and have been successfully reduced in many developed
cities through air quality policy interventions. Longer chain
hydrocarbons released from diesel vehicles are not consid-
ered explicitly as part of air quality strategies and there are
few direct measurements of their gaseous abundance in the
atmosphere. This study describes the chemically comprehen-
sive and continuous measurements of organic compounds in
a developed megacity (London), which demonstrate that on
a seasonal median basis, diesel-related hydrocarbons repre-
sent only 20–30 % of the total hydrocarbon mixing ratio but
comprise more than 50 % of the atmospheric hydrocarbon
mass and are a dominant local source of secondary organic
aerosols. This study shows for the first time that 60 % of
the winter primary hydrocarbon hydroxyl radical reactivity
is from diesel-related hydrocarbons and using the maximum
incremental reactivity scale, we predict that they contribute
up to 50 % of the ozone production potential in London.
Comparing real-world urban composition with regulatory
emissions inventories in the UK and US highlights a previ-
ously unaccounted for, but very significant, under-reporting
of diesel-related hydrocarbons; an underestimation of a fac-
tor ∼ 4 for C9 species rising to a factor of over 70 for C12
during winter. These observations show that hydrocarbons
from diesel vehicles can dominate gas phase reactive carbon
in cities with high diesel fleet fractions. Future control of ur-
ban particulate matter and ozone in such locations requires
a shift in policy focus onto gas phase hydrocarbons released
from diesels as this vehicle type continues to displace gaso-
line world-wide.
1 Introduction
With an increasing proportion of the world’s population liv-
ing in cities, rising from only 3 % in the 1800’s to over 47 %
by the end of the 20th Century (Gaffney and Marley, 2009),
the impact of urban air pollution has become a significant
factor in global health (Harrison et al., 2012). The costs of air
pollution are high even in those locations that have seen con-
siderable improvements in air quality over the past decades
(Chameides et al., 1992); in the UK exposure to particulate
matter (PM) alone is estimated to reduce life expectancy on
average by around 7–8 months, with a cost to society esti-
mated at up to GBP 20 billion per year (House of Commons
Environmental Audit Committee, 2012).
Primary urban air pollution emissions are dominated by
PM, nitrogen oxides (NOx), carbon monoxide (CO) and
volatile organic compounds (VOCs). Many of these species
can react in the atmosphere to create secondary pollutants,
such as ozone (O3), oxygenated VOCs (OVOCs), peroxy
acyl nitrates (PANs) and condensed materials in the form of
secondary organic aerosol (SOA), which add to the overall
PM load (Robinson et al., 2007; Atkinson and Arey, 2003;
Odum et al., 1997).
Published by Copernicus Publications on behalf of the European Geosciences Union.
9984 R. Dunmore et al.: Diesel-related hydrocarbons can dominate gas phase reactive carbon in megacities
Air quality in London has been controlled and monitored
for over 60 years, making it in theory one of the better under-
stood atmospheres of the world’s megacities. Current mea-
surements in London focus on assessing national compli-
ance with legally prescribed air quality standards, and this
includes the hydrocarbons 1,3-butadiene and benzene. How-
ever, compliance measurements in themselves are insuffi-
cient to fully describe the chemical and physical processes
occurring in the urban atmosphere (McMeeking et al., 2012),
and a particular weakness lies in speciating the many differ-
ent classes of carbon compounds in urban air.
The past 2 decades have seen declining concentrations
of most smaller hydrocarbons in European and US cities,
a result of tighter regulation of sources such as vehicle ex-
haust, evaporation and solvents (von Schneidemesser et al.,
2010; Warneke et al., 2012), better control of natural gas
leakage and an overall switch from gasoline to diesel pow-
ered vehicles. Current national emissions estimates suggest
that the bulk of organic emissions to air are associated with
smaller hydrocarbons, and this has driven policy, regulation
and observation strategies for compliance. Figure 1 shows
Government-estimated emissions for the UK (left) and US
(right), categorised into the dominant emission sources. It
is clear that based on current emission inventories, gaseous
organic emissions from diesel appear to represent a negligi-
ble fraction of reactive carbon released into the atmosphere.
The demand for diesel fuel is expected to increase by 75 %
between 2010 and 2040 and by 2020 it is expected to over-
take gasoline as the number one transport fuel used world-
wide (Exxon Mobil, 2014). The environmental impacts of
this change are evaluated in part based on the national emis-
sion inventories that underpin Fig. 1.
The efficiency with which O3 and SOA can be formed
from diesel or gasoline emissions is dependent on the mass
of available organic carbon, and the reactivity and volatil-
ity of that material (Gros et al., 2007; Jimenez et al., 2009;
Donahue et al., 2012). To quantify this requires individual
speciation of VOCs in order that each property can be prop-
erly estimated. The key urban sources of organic compounds
include combustion products, unburnt fuels and evaporative
emissions of fuels and solvents, all of which are highly com-
plex, often propagating the original complexity of fossil fu-
els into the air. Whilst each VOC has a unique set of re-
action mechanisms, in general terms, as the carbon number
increases, the relative complexity of reactions and yields of
SOA and O3 also increase (Hamilton and Lewis, 2003). The
organic mixture in air is complicated further by the presence
of secondary oxygenated products. This requires a combined
approach to investigate VOC composition, such as using two
different gas chromatography systems.
Several recent field studies have investigated the relative
importance of gasoline, diesel and biogenic emissions in gen-
erating SOA (Gentner et al., 2012; Bahreini et al., 2012; Gor-
don et al., 2013; Platt et al., 2013; Gordon et al., 2014a, b;
Jathar et al., 2014; Ensberg et al., 2014). These have been
carried out predominately in the US, particularly in Califor-
nia, where current diesel usage is rather low by global stan-
dards. The US diesel fleet is dominated by heavy-duty vehi-
cles, leading to a difference in the source strength of diesel
and gasoline engines between weekdays and the weekend. In
contrast, this trend is not observed in London (see Supple-
ment and Fig. S1), which has a different vehicle fleet com-
position, with 60 % diesel fuel use, and a large number of
diesel buses operating at similar times to domestic vehicles.
It is also important to consider that London and Los Ange-
les (arguably the world’s most well-studied city for air pol-
lution) have significant differences in terms of urban geog-
raphy, population density, commuting patterns, amount of
green space/trees and upwind sources (expanded in the Sup-
plement and Table S1). Specifically, the high population den-
sity in central London, and the fact that many vehicle jour-
neys both begin and end in central London (rather than radial
vehicle commuting); resulting in the central London atmo-
sphere experiencing both cold and warm start vehicle emis-
sions. Also worth noting is that there is no large upwind
source of BVOCs in London, rather the natural emissions are
distributed rather homogeneously across the city (Fig. S2).
This work uses high-resolution VOC measurements to in-
vestigate the abundance and trends of diesel-related hydro-
carbons in the atmosphere at a typical urban background site
in London. By comparison to the emission inventories, we
highlight a severe underestimation in the impact of gaseous
VOC emissions from diesel on urban air quality that is likely
replicated across Europe and other cities globally where
diesel vehicle use is high.
2 Experimental
2.1 Clean air for London campaign
Two 5-week campaigns were conducted as part of the Na-
tional Environment Research Council (NERC) funded Clean
Air for London (ClearfLo) project in January/February and
July/August 2012 at an urban background site (see Fig. S3)
based at Sion Manning School in North Kensington, Lon-
don. For more information about this site and the ClearfLo
project refer to Bigi and Harrison (2010) and Bohnenstengel
et al. (2014) respectively.
2.2 Gas chromatography measurements
Two gas chromatography (GC) instruments were used dur-
ing the ClearfLo campaign, a dual channel GC-flame ionisa-
tion detector (DC-GC-FID) and a comprehensive two dimen-
sional GC (GC×GC-FID). Outside air was sampled from
a manifold at 4 m from the ground through a condensation
finger in an ethylene glycol bath held at −30 ◦C, to remove
any moisture from the sample. See Supplement for details
about calibrations.
Atmos. Chem. Phys., 15, 9983–9996, 2015 www.atmos-chem-phys.net/15/9983/2015/

R. Dunmore et al.: Diesel-related hydrocarbons can dominate gas phase reactive carbon in megacities 9985
Figure 1. Total mass by carbon number and functionality from UK 2012 (left) and US 2011 (right) emission inventories. The carbon number
and functionality of emissions have been estimated by applying the speciated inventory of emission sources of Passant (2002) to the most
recent estimates of non-methane hydrocarbon source apportionment for each country (full details can be found in the Supplement).
The DC-GC-FID was operated by the National Centre for
Atmospheric Science (NCAS) Facility for Ground Atmo-
spheric Measurements (FGAM) with the instrument set up
and calibration described in Hopkins et al. (2003). In brief,
the system has three GC columns that operate in parallel,
where after sampling and desorption the flow is split 50 : 50;
one column is an aluminium oxide (Al2O3) Porous Layer
Open Tubular (PLOT, 50 m, 0.53 mm id) for non-methane
hydrocarbons (NMHCs) analysis; and the other column is ac-
tually two LOWOX columns in series (10 m, 0.53 mm id) for
OVOC analysis.
The GC×GC-FID is comprised of a Markes TT24-7
thermal desorption (TD) unit with an air server attach-
ment (Markes International, Llantrisant, UK) and an Agi-
lent 7890 GC (Agilent Technologies, Wilmington, DE, USA)
equipped with an FID operating at 200 Hz. The TD unit sam-
pled at a rate of 100 mLmin−1 for 55 min, giving a total sam-
ple volume of 5.5 L. The trap temperature was set to−10 ◦C,
held for 3 min, then on injection heated at 100 ◦Cmin−1 to
200 ◦C to ensure all analytes of interest were desorbed.
The GC×GC-FID system first dimension column was
a BPX-5 (25m× 0.15mm, 0.4 µm df), at 50 psi, combined
with a second dimension column of a BP-20 (5m×0.25mm,
0.25 µm df), at 23 psi (SGE, Australia), with column pres-
sures controlled using the Agilent 7890 EPC. The total trans-
fer flow valve modulator incorporated a 6-port, 2-way di-
aphragm valve (Valco Instruments, Houston, TX, USA), with
actuation achieved using a solenoid valve, controlled by soft-
ware written “in house”. The modulator was held at 120 ◦C
throughout the run and had a modulation period of 5 s, with
4.7 s sample and 0.3 s injection times. The chromatographic
and modulation configuration of the GC×GC-FID system is
detailed in Lidster et al. (2011). During the injection of sam-
ple, liquid carbon dioxide (CO2) was sprayed onto the first
2 cm portion at the head of the first dimension column for
60 s to re-focus the sample.
An oven temperature programme was developed which
optimised separation and resolution of compounds of in-
terest. The initial oven temperature was 30 ◦C, held for
1 min, ramped at 2.5 ◦Cmin−1 to 130 ◦C, held for 1 min then
ramped at 10 ◦Cmin−1 to 200 ◦C, and held for 1 min; giving
a total run time of 50 min. This, combined with the TD run
time, gave a total analysis time of 55 min.
During the summer campaign, some parameters had to be
changed. Ambient temperatures were higher in comparison
to the winter, meaning the oven temperature programme had
to be altered to allow the oven to reach its minimum tem-
perature. The initial oven temperature was changed to 35 ◦C
held for 2 min and the final temperature of 200 ◦C was held
for 2 min. All other oven parameters were kept the same. Due
to a sensitivity drop, the TD sampling rate was increased to
200 mLmin−1 for 55 min, to give a total sample volume of
11 L.
2.3 Supporting measurements
Measurements of NOx were made using a single chan-
nel, chemiluminescence instrument (Air Quality Design Inc.,
USA), which has a wide linear range (1 ppt to 500 ppb). Lee
et al. (2009) Ozone measurements were made using a UV
Absorption TEI 49C and 49i (Thermo Scientific) with a limit
of detection of 1 ppb.
www.atmos-chem-phys.net/15/9983/2015/ Atmos. Chem. Phys., 15, 9983–9996, 2015

9986 R. Dunmore et al.: Diesel-related hydrocarbons can dominate gas phase reactive carbon in megacities
3 Observations of hydrocarbons in urban air
The two GC instruments individually quantified 78 VOCs
(36 aliphatics, 19 monoaromatics, 21 oxygenated and 2
halogenated), as well as many hundreds more included in
a lumped carbon number assessment from 2667 samples
(1352 winter and 1315 summer). The DC-GC instrument
measured volatile VOCs, C1–C7 hydrocarbons and a se-
lection of OVOCs, with effective saturation concentrations
(Nannoolal et al., 2004, 2008) ranging from 3× 10⁷ to
1.4× 10¹² µgm−3. The GC×GC-FID instrument measured
the less volatile VOC fraction (effective saturation concen-
tration range of 1.8× 10⁶ to 2.4× 10⁹ µgm−3), with hydro-
carbons from C6 to C13, plus a large group of OVOCs (from
C3 onwards). There was some overlap in species measured
by both instruments, with good agreement seen (e.g. benzene
R2 0.92, slope 1.070± 0.013, see Fig. S4).
The number of possible structural isomers increases expo-
nentially with carbon number (Goldstein and Galbally, 2007)
and beyond around C9 it becomes impossible to accurately
identify the structure of every hydrocarbon present in air.
Using the retention behaviour of each compound on chro-
matographic columns it is however possible to assign indi-
vidual species to particular chemical classes and function-
alities. Here we group according to carbon number and ba-
sic functionality, an example of which can be seen in Fig. 2.
The C2−C6 volatility range contains both primary hydrocar-
bon emissions, with isomers quantified individually, along
with several oxygenated compounds. Between C6 to C13,
a wide range of hydrocarbon and OVOC species, including
the n-alkanes, α-pinene, limonene, monoaromatics with up
to 3 substituents and naphthalene were quantified individu-
ally (see Fig. S5 and Table S2).
3.1 Grouping of unresolved complex mixtures
In previous studies using GC-FID, the larger hydrocarbon
fraction, where diesel VOC emissions are predominately
found, is part of an unresolved complex mixture (UCM). One
method used to estimate the relative amounts of VOCs in this
region, is to identify the n-alkane (which is often observed
as a well-defined peak above a raised baseline) and then in-
tegrate the area above the blank baseline between two con-
secutive linear alkanes (using an FID) or to use the m/z 57
fragment ion to represent primary intermediate VOC (IVOC)
(Zhao et al., 2014). In reality, this gives an estimate of the
total or alkyl containing IVOC loading within this volatility
range and will not only include the hydrocarbon fraction with
that specific carbon number but other compounds as well (i.e.
lower carbon number aromatics, OVOCs). This study details
the improved resolution of VOCs using GC×GC to allow for
a more stringent grouping of the UCM by carbon number and
functionality, rather than by volatility.
Higher carbon number aliphatic compounds (C6-C13, pre-
dominantly alkanes with some alkenes and cycloalkanes),
C4 substituted monoaromatics and C10 monoterpenes have
been grouped together and the combined class abundance es-
timated using a response ratio to the corresponding straight-
chained n-alkane, 1,3-diethyl benzene and α-pinene respec-
tively. The group boundaries are shown in Fig. 2, where for
example, box 7 corresponds to the C12 aliphatic group and
encompasses alkanes, cyclic alkanes and alkenes. Only the
material within the box is integrated within this retention
window. This is a clear improvement over the 1-D case, as
there are a considerable number of peaks, with a higher 2nd
dimension retention time, in Fig. 2 that would co-elute with
the aliphatic group if the entire retention window was co-
sampled (i.e. aromatics, oxygenates and other hetero atom
containing species). The number of individual isomer peaks
that could be isolated in the aliphatics grouping increased
from 9 for the C6 group to 40 for C10 (shown in Fig. 6, black
squares). A full table of the observed isomer peaks and group
mass concentrations is provided in Table S3.
Unfortunately, the separation of the linear alkanes,
branched alkanes, cyclic aliphatic and alkenes on the
GC×GC chromatogram is not sufficient at higher carbon
numbers to allow them to be more fully resolved. This is a
direct consequence of the use of the cryogen free and field
deployable valve modulator, which when used in total trans-
fer mode, where the flow in the first column slows during
the modulation pulse, imposes restrictions on the column di-
mensions and internal diameters that can be used (Lidster
et al., 2011). Also, given the temperature constraints on this
instrument, it is likely that the GC×GC not only misses a
fraction of the C13 aliphatic group but may also be under-
reporting the number of isomers in the higher carbon number
groups. This would explain why the number of isomers de-
creases after C11 aliphatics, rather than increases as would be
expected. The aliphatic groups have diurnal behaviour (dis-
cussed in the next section) that indicate a dominant traffic-
related source. Fuel composition measurements suggest there
is unlikely to be significant quantities of alkenes from traf-
fic related sources; gasoline contains around 3–4 wt C% of
alkenes, and diesel contains negligible quantities (Gentner
et al., 2012).
3.2 Diurnal behaviour
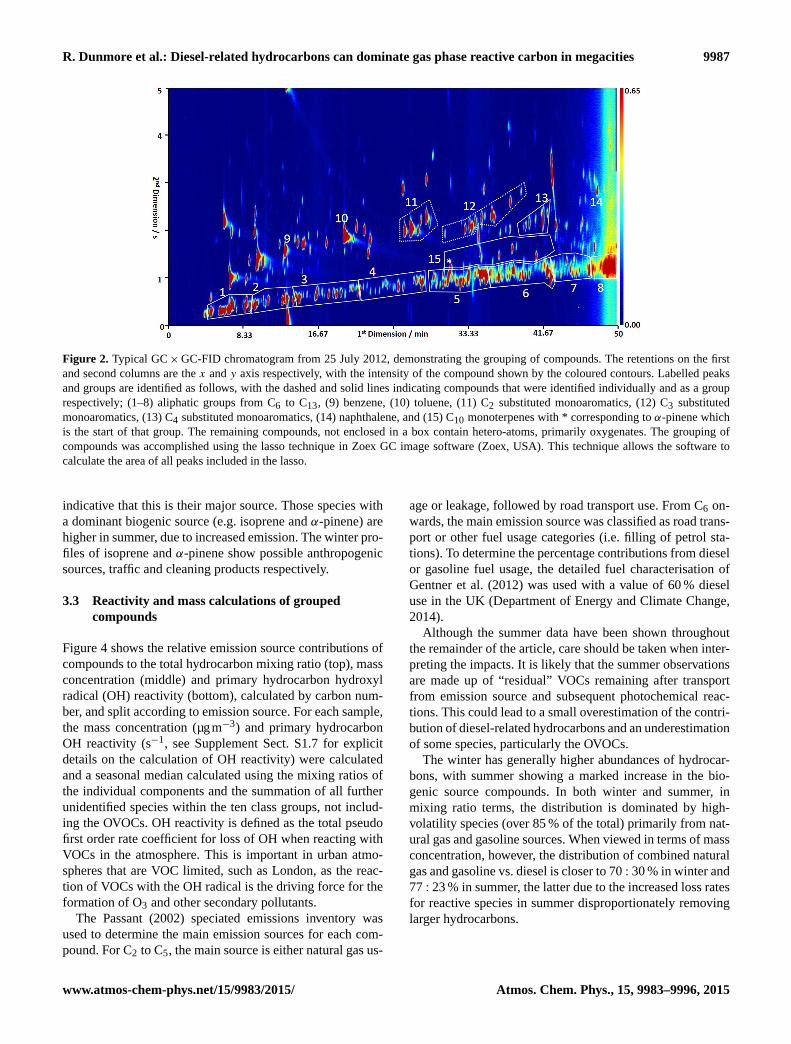
The average diurnal behaviour of a selection of VOCs, O3
and NOx , are shown in Fig. 3. VOCs with an anthropogenic
source (e.g. ethane, toluene, C4 substituted monoaromatics
and C13 aliphatics) have higher mixing ratios in winter, con-
sistent with reduced rates of photochemical removal in the
northern European winter and a lower boundary layer height.
Toluene and NOx are strong indicators of traffic related emis-
sions, and both have diurnal profiles with rush hour peaks,
commonly observed in urban areas (Borbon et al., 2001; Par-
rish et al., 2009; Gaffron, 2012). The profiles of the higher
carbon number species, C4 substituted monoaromatics and
C13 aliphatics, show similar traffic-related profiles, strongly
Atmos. Chem. Phys., 15, 9983–9996, 2015 www.atmos-chem-phys.net/15/9983/2015/
R. Dunmore et al.: Diesel-related hydrocarbons can dominate gas phase reactive carbon in megacities 9987
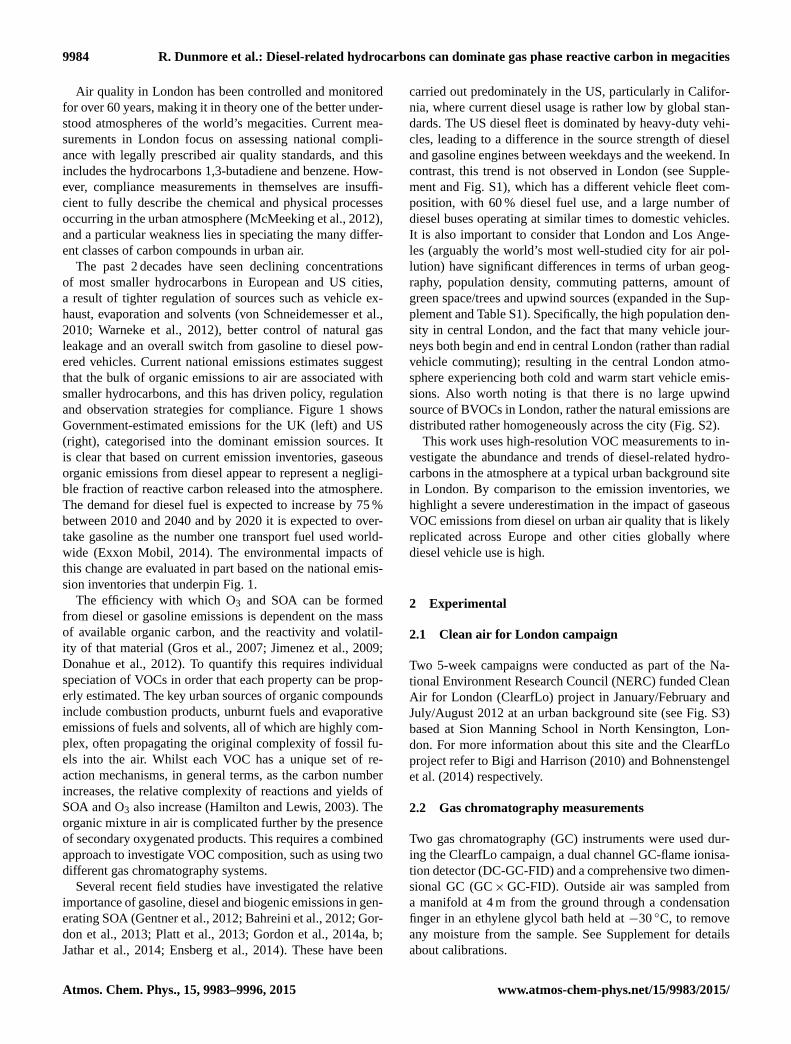
Figure 2. Typical GC×GC-FID chromatogram from 25 July 2012, demonstrating the grouping of compounds. The retentions on the first
and second columns are the x and y axis respectively, with the intensity of the compound shown by the coloured contours. Labelled peaks
and groups are identified as follows, with the dashed and solid lines indicating compounds that were identified individually and as a group
respectively; (1–8) aliphatic groups from C6 to C13, (9) benzene, (10) toluene, (11) C2 substituted monoaromatics, (12) C3 substituted
monoaromatics, (13) C4 substituted monoaromatics, (14) naphthalene, and (15) C10 monoterpenes with * corresponding to α-pinene which
is the start of that group. The remaining compounds, not enclosed in a box contain hetero-atoms, primarily oxygenates. The grouping of
compounds was accomplished using the lasso technique in Zoex GC image software (Zoex, USA). This technique allows the software to
calculate the area of all peaks included in the lasso.
indicative that this is their major source. Those species with
a dominant biogenic source (e.g. isoprene and α-pinene) are
higher in summer, due to increased emission. The winter pro-
files of isoprene and α-pinene show possible anthropogenic
sources, traffic and cleaning products respectively.
3.3 Reactivity and mass calculations of grouped
compounds
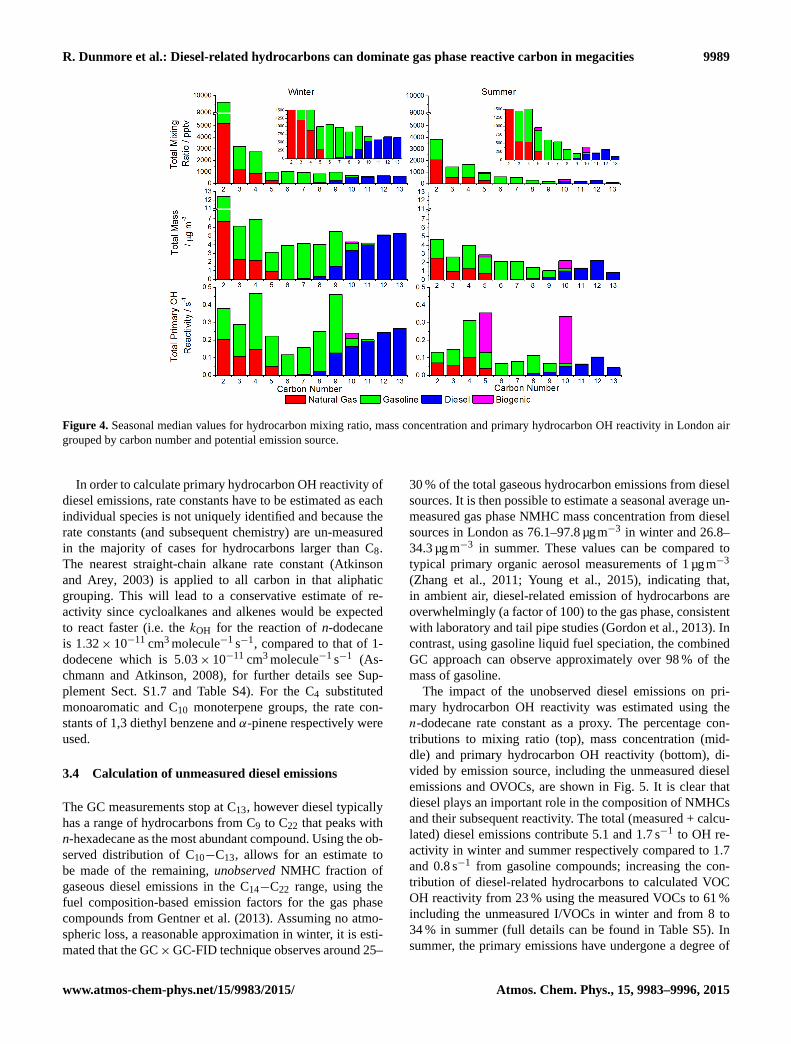
Figure 4 shows the relative emission source contributions of
compounds to the total hydrocarbon mixing ratio (top), mass
concentration (middle) and primary hydrocarbon hydroxyl
radical (OH) reactivity (bottom), calculated by carbon num-
ber, and split according to emission source. For each sample,
the mass concentration (µgm−3) and primary hydrocarbon
OH reactivity (s−1, see Supplement Sect. S1.7 for explicit
details on the calculation of OH reactivity) were calculated
and a seasonal median calculated using the mixing ratios of
the individual components and the summation of all further
unidentified species within the ten class groups, not includ-
ing the OVOCs. OH reactivity is defined as the total pseudo
first order rate coefficient for loss of OH when reacting with
VOCs in the atmosphere. This is important in urban atmo-
spheres that are VOC limited, such as London, as the reac-
tion of VOCs with the OH radical is the driving force for the
formation of O3 and other secondary pollutants.
The Passant (2002) speciated emissions inventory was
used to determine the main emission sources for each com-
pound. For C2 to C5, the main source is either natural gas us-
age or leakage, followed by road transport use. From C6 on-
wards, the main emission source was classified as road trans-
port or other fuel usage categories (i.e. filling of petrol sta-
tions). To determine the percentage contributions from diesel
or gasoline fuel usage, the detailed fuel characterisation of
Gentner et al. (2012) was used with a value of 60 % diesel
use in the UK (Department of Energy and Climate Change,
2014).
Although the summer data have been shown throughout
the remainder of the article, care should be taken when inter-
preting the impacts. It is likely that the summer observations
are made up of “residual” VOCs remaining after transport
from emission source and subsequent photochemical reac-
tions. This could lead to a small overestimation of the contri-
bution of diesel-related hydrocarbons and an underestimation
of some species, particularly the OVOCs.
The winter has generally higher abundances of hydrocar-
bons, with summer showing a marked increase in the bio-
genic source compounds. In both winter and summer, in
mixing ratio terms, the distribution is dominated by high-
volatility species (over 85 % of the total) primarily from nat-
ural gas and gasoline sources. When viewed in terms of mass
concentration, however, the distribution of combined natural
gas and gasoline vs. diesel is closer to 70 : 30 % in winter and
77 : 23 % in summer, the latter due to the increased loss rates
for reactive species in summer disproportionately removing
larger hydrocarbons.
www.atmos-chem-phys.net/15/9983/2015/ Atmos. Chem. Phys., 15, 9983–9996, 2015
9988 R. Dunmore et al.: Diesel-related hydrocarbons can dominate gas phase reactive carbon in megacities
Figure 3. Diurnal profiles of selected urban pollutants in winter (left-hand side of each plot) and summer (right-hand side of each plot).
Winter and summer are plotted on the same y axes to show seasonal differences, with insets allowing the profile to be easily seen. (a and
b) Ozone (n= 2915 and 2880; winter and summer, respectively), (c and d) nitrogen oxides (n= 2915 and 2880), (e and f) ethane (n= 660
and 681), (g and h) toluene (n= 660 and 680), (i and j) isoprene (n= 660 and 681), (k and l) α-pinene (n= 691 and 634), (m and n) C13
aliphatics (n= 692 and 632), (o and p) C4 substituted monoaromatics (n= 692 and 563). Figure 3 was constructed using the OpenAir project
for R where the solid line represents the mean daily concentration and the shaded regions shows the 95 % confidence intervals surrounding
the mean (Carslaw and Ropkins, 2012a, b; R Development Core Team, 2012).
Atmos. Chem. Phys., 15, 9983–9996, 2015 www.atmos-chem-phys.net/15/9983/2015/
R. Dunmore et al.: Diesel-related hydrocarbons can dominate gas phase reactive carbon in megacities 9989
Figure 4. Seasonal median values for hydrocarbon mixing ratio, mass concentration and primary hydrocarbon OH reactivity in London air
grouped by carbon number and potential emission source.
In order to calculate primary hydrocarbon OH reactivity of
diesel emissions, rate constants have to be estimated as each
individual species is not uniquely identified and because the
rate constants (and subsequent chemistry) are un-measured
in the majority of cases for hydrocarbons larger than C8.
The nearest straight-chain alkane rate constant (Atkinson
and Arey, 2003) is applied to all carbon in that aliphatic
grouping. This will lead to a conservative estimate of re-
activity since cycloalkanes and alkenes would be expected
to react faster (i.e. the kOH for the reaction of n-dodecane
is 1.32× 10⁻¹¹ cm3 molecule−1 s−1, compared to that of 1-
dodecene which is 5.03× 10⁻¹¹ cm3 molecule−1 s−1 (As-
chmann and Atkinson, 2008), for further details see Sup-
plement Sect. S1.7 and Table S4). For the C4 substituted
monoaromatic and C10 monoterpene groups, the rate con-
stants of 1,3 diethyl benzene and α-pinene respectively were
used.
3.4 Calculation of unmeasured diesel emissions
The GC measurements stop at C13, however diesel typically
has a range of hydrocarbons from C9 to C22 that peaks with
n-hexadecane as the most abundant compound. Using the ob-
served distribution of C10−C13, allows for an estimate to
be made of the remaining, unobserved NMHC fraction of
gaseous diesel emissions in the C14−C22 range, using the
fuel composition-based emission factors for the gas phase
compounds from Gentner et al. (2013). Assuming no atmo-
spheric loss, a reasonable approximation in winter, it is esti-
mated that the GC×GC-FID technique observes around 25–
30 % of the total gaseous hydrocarbon emissions from diesel
sources. It is then possible to estimate a seasonal average un-
measured gas phase NMHC mass concentration from diesel
sources in London as 76.1–97.8 µgm−3 in winter and 26.8–
34.3 µgm−3 in summer. These values can be compared to
typical primary organic aerosol measurements of 1 µgm−3
(Zhang et al., 2011; Young et al., 2015), indicating that,
in ambient air, diesel-related emission of hydrocarbons are
overwhelmingly (a factor of 100) to the gas phase, consistent
with laboratory and tail pipe studies (Gordon et al., 2013). In
contrast, using gasoline liquid fuel speciation, the combined
GC approach can observe approximately over 98 % of the
mass of gasoline.
The impact of the unobserved diesel emissions on pri-
mary hydrocarbon OH reactivity was estimated using the
n-dodecane rate constant as a proxy. The percentage con-
tributions to mixing ratio (top), mass concentration (mid-
dle) and primary hydrocarbon OH reactivity (bottom), di-
vided by emission source, including the unmeasured diesel
emissions and OVOCs, are shown in Fig. 5. It is clear that
diesel plays an important role in the composition of NMHCs
and their subsequent reactivity. The total (measured + calcu-
lated) diesel emissions contribute 5.1 and 1.7 s−1 to OH re-
activity in winter and summer respectively compared to 1.7
and 0.8 s−1 from gasoline compounds; increasing the con-
tribution of diesel-related hydrocarbons to calculated VOC
OH reactivity from 23 % using the measured VOCs to 61 %
including the unmeasured I/VOCs in winter and from 8 to
34 % in summer (full details can be found in Table S5). In
summer, the primary emissions have undergone a degree of
www.atmos-chem-phys.net/15/9983/2015/ Atmos. Chem. Phys., 15, 9983–9996, 2015

9990 R. Dunmore et al.: Diesel-related hydrocarbons can dominate gas phase reactive carbon in megacities
Figure 5. Contributions of emission source to total mixing ratio,
mass and OH reactivity for winter and summer. Diesel is the sum-
mation of measured and calculated, with error bars indicating the
uncertainty of the unobserved diesel NMHC fraction.
loss due to photochemical ageing and so the values are an
underestimate of the fuel sources. These diesel-related hy-
drocarbons may be partly responsible for the “missing” OH
reactivity observed between measurements of OH lifetime
vs. the value calculated from observed sinks in many studies
(Yoshino et al., 2006, 2012).
3.5 Comparison to emissions inventories
Assuming that the winter observations are made “at source”
(hence atmospheric losses and lifetime differences can be ne-
glected), the measurement location is representative of an
urban setting, and the UK inventory correctly estimates the
emission for toluene (based on direct flux comparisons made
in London by Langford et al., 2010), there appears to be
a significant inventory under-reporting for the higher car-
bon number species. When normalising to toluene, the UK
national emissions inventory, which is believed to use best-
practice international reporting methodologies, under-reports
by a factor of 4.6 for C9 species, rising to a factor of 74 for
C12 compounds (see Fig. 6). Given the clear traffic diurnal
Figure 6. Winter emissions inventory underestimation (left axis and
blue columns) and the number of isomers included in each grouped
set of compounds (right axis and black squares). Grey line shows
a factor of 1, i.e., inventory emission estimation is consistent with
the observations.
profiles of the C10−C13 species (seen in Fig. 3m for C13
aliphatics), which essentially encompasses only diesel fuel,
the most likely source of these species is gaseous emissions
from the diesel vehicle fleet, either evaporative, tailpipe or
a combination of the two. These observations provide the first
direct evidence of significant diesel hydrocarbons in Lon-
don’s ambient air, something that could previously only be
inferred from liquid fuel measurements and exhaust studies.
3.6 Ozone formation potentials
At present, there is insufficient kinetic and mechanistic data
to allow for the accurate modelling of the impact diesel
hydrocarbons will have on photochemical ozone. Unlike
Los Angeles, which is typically impacted by intense single-
day episodic photochemical ozone events, in London (and
NW Europe), higher ozone levels are usually the result of
regional-scale multi-day formation. Therefore, different con-
trol strategies and reactivity scales, which take into account
trans-boundary transport, have been developed and applied
in Europe. Photochemical ozone creation potentials (POCPs,
e.g. Derwent et al., 1998) have been derived using idealised
5-day photochemical trajectory model runs over Europe, in-
corporating detailed chemical degradation schemes of the
emitted VOCs (Saunders et al., 2003). Individual POCP val-
ues depend upon emissions along the trajectory, the reactivity
of the VOC and its propensity to form ozone, i.e. the number
of C-C and C-H bonds in the reactive species. Calvert et al.,
(2008), using the Master Chemical Mechanism (MCMv3.1,
http://mcm.leeds.ac.uk/MCM) and speciated emission inven-
tories (Passant, 2002), with little speciation of alkanes above
C9, found that alkanes dominated POCP-weighted emis-
sions (33 %) on the regional scale in Europe, accounting
Atmos. Chem. Phys., 15, 9983–9996, 2015 www.atmos-chem-phys.net/15/9983/2015/
R. Dunmore et al.: Diesel-related hydrocarbons can dominate gas phase reactive carbon in megacities 9991
for slightly more than the aromatics (29 %) and significantly
more than the alkenes (20 %) and oxygenates (17 %) (Calvert
et al., 2000). They also note that this is in marked contrast
with that found on the urban scale in Los Angeles, where
alkanes contribute little to the intense episodic ozone for-
mation observed. The work presented here shows that emis-
sion inventories severely underestimate the amount of alka-
nes emitted from diesel sources, hence these have not been
included in previous studies on ozone formation. Based on
the POCP results of Calvert et al. (2000) for shorter chain
alkanes, and considering the high OH reactivity of larger hy-
drocarbons, incorporating the diesel-related aliphatics into
future calculations is likely to have a significant impact on
regional ozone formation in Europe, and likely elsewhere.
However, despite the lack of chemical information avail-
able, we can make an assessment of the effects that the new
diesel VOC observations have on local ozone productivity by
calculating the O3 Formation Potential (OFP) of each emis-
sion source using a Maximum Incremental Reactivity (MIR)
scale, as determined by Carter (2010) using the SAPRC-07
mechanism. The MIR scale is based upon 1-day photochem-
ical simulations in a box moving over an urban basin and
subject to ozone precursor emissions. The NOx concentra-
tions are adjusted so that the final ozone concentration in
a simulation showed the maximum sensitivity to changes in
emissions of organic compounds; these conditions give the
MIR. MIRs represent relatively high NOx conditions, often
experienced in US cities, where control of the emissions of
VOCs is the most effective means of reducing ozone forma-
tion (Carter, 2010).
MIR values for a range of important VOC emission classes
(alkanes, alkenes, aromatics, oxygenates) compare well to
POCP values calculated using detailed MCMv3.1 chemistry
in a 1 day US urban photochemical trajectory model, giving
us confidence in the tuned SAPRC-07 chemistry for predict-
ing photochemical ozone formation under typical 1-day high
NOx , high ozone conditions (Derwent et al., 2010). However,
caution must be observed when applying MIR scales to other
conditions (i.e. NW Europe), as previously discussed.
For those species included in one of the carbon number
and functionality VOC groups, a weighted MIR value has
been calculated assuming a composition of 95 % branched
alkane and 5 % alkene. The calculated, unobserved diesel
emissions were given an MIR value based on the weighted
contributions of the different compound classes from the
diesel fuel gaseous emission speciation in Gentner et al.
(2013).
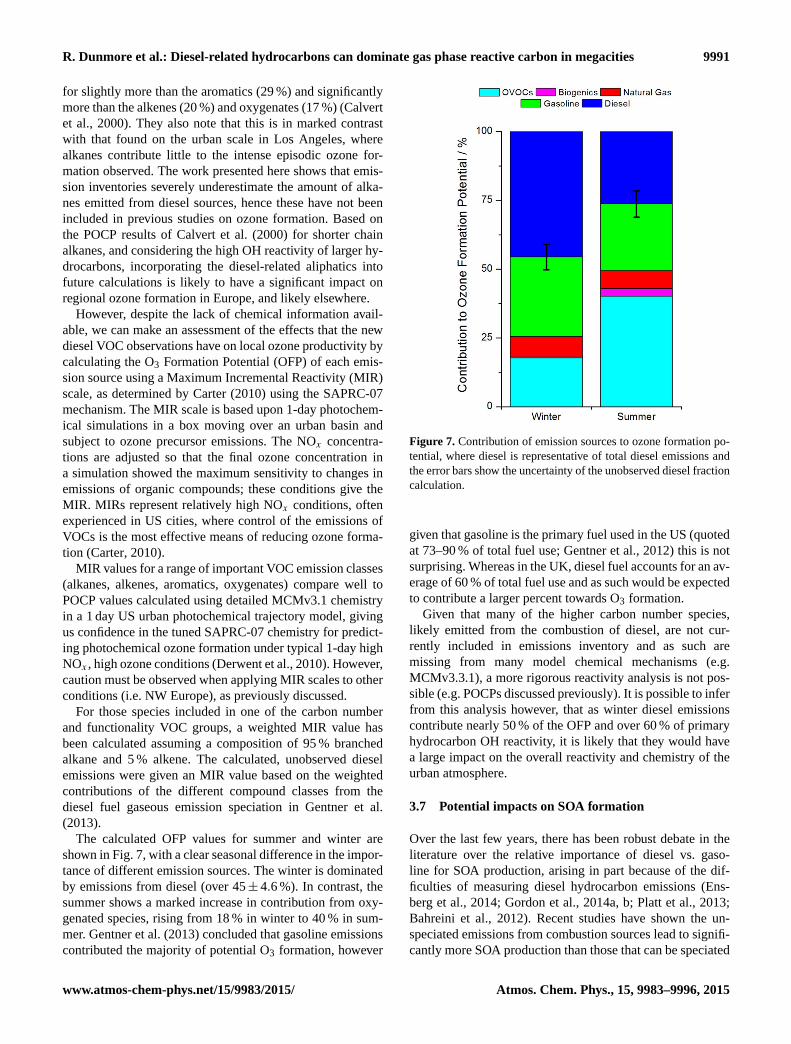
The calculated OFP values for summer and winter are
shown in Fig. 7, with a clear seasonal difference in the impor-
tance of different emission sources. The winter is dominated
by emissions from diesel (over 45± 4.6 %). In contrast, the
summer shows a marked increase in contribution from oxy-
genated species, rising from 18 % in winter to 40 % in sum-
mer. Gentner et al. (2013) concluded that gasoline emissions
contributed the majority of potential O3 formation, however
Figure 7. Contribution of emission sources to ozone formation po-
tential, where diesel is representative of total diesel emissions and
the error bars show the uncertainty of the unobserved diesel fraction
calculation.
given that gasoline is the primary fuel used in the US (quoted
at 73–90 % of total fuel use; Gentner et al., 2012) this is not
surprising. Whereas in the UK, diesel fuel accounts for an av-
erage of 60 % of total fuel use and as such would be expected
to contribute a larger percent towards O3 formation.
Given that many of the higher carbon number species,
likely emitted from the combustion of diesel, are not cur-
rently included in emissions inventory and as such are
missing from many model chemical mechanisms (e.g.
MCMv3.3.1), a more rigorous reactivity analysis is not pos-
sible (e.g. POCPs discussed previously). It is possible to infer
from this analysis however, that as winter diesel emissions
contribute nearly 50 % of the OFP and over 60 % of primary
hydrocarbon OH reactivity, it is likely that they would have
a large impact on the overall reactivity and chemistry of the
urban atmosphere.
3.7 Potential impacts on SOA formation
Over the last few years, there has been robust debate in the
literature over the relative importance of diesel vs. gaso-
line for SOA production, arising in part because of the dif-
ficulties of measuring diesel hydrocarbon emissions (Ens-
berg et al., 2014; Gordon et al., 2014a, b; Platt et al., 2013;
Bahreini et al., 2012). Recent studies have shown the un-
speciated emissions from combustion sources lead to signifi-
cantly more SOA production than those that can be speciated
www.atmos-chem-phys.net/15/9983/2015/ Atmos. Chem. Phys., 15, 9983–9996, 2015

9992 R. Dunmore et al.: Diesel-related hydrocarbons can dominate gas phase reactive carbon in megacities
Figure 8. Potential SOA mass estimates. Upper: mean VOC mass concentration [VOC] shown by black columns, and the corresponding
SOA yields (Y ) for the VOC precursors in blue circles. Lower: potential SOA mass concentration [SOA], calculated as the product of mean
VOC mass and SOA yields. Winter shown on left and summer shown on right hand side panels.
by conventional instrumentation. Jathar et al. (2014), used
simulation chamber data and source-specific SOA yield pa-
rameterisations for these unspeciated emissions to estimate
that, in the US, 90 % of SOA was from biomass burning and
gasoline sources, with 85 % of the SOA coming from unspe-
ciated organic emissions.
There is a clear need to improve measurements of larger
hydrocarbons that represent a large part of what is referred to
in other studies as unspeciated chemicals. In this study, the
uncertainty in the unspeciated fraction has been reduced by
grouping ambient observations of VOCs by carbon number
and functionality. The > C9 aliphatic groups are dominated
by diesel emissions at this location and so the SOA source
strength can be more accurately determined. The potential
contributions of the higher hydrocarbons to SOA forma-
tion has been estimated by multiplying the median measured
VOC mass concentration (Fig. 8, top panel, black columns)
by the corresponding SOA yield (Fig. 8, top panel, blue cir-
cles) (Zhang et al., 2014). The yields applied were measured
in high NOx chamber studies (VOC0/NOx (ppbC ppb−1) of
0.5) with an organic aerosol mass COA of 10 µgm−3, rep-
resentative of urban areas (Zhang et al., 2014; Presto et al.,
2010). Here it is assumed that NMHCs with less than six car-
bons and aqueous chemistry of water soluble oxidation prod-
ucts, such as glyoxal, do not contribute to SOA mass (Knote
et al., 2014). In both winter and summer, the observed lev-
els of aliphatic compounds from diesel sources have the po-
tential to form significant quantities of SOA (Fig. 8, bottom
panel, red columns). If a diesel SOA yield of 0.15 is applied
to the total diesel emissions (as calculated previously), then
gas phase emissions from diesel engines represent the domi-
nant traffic related precursor source of urban SOA in a Euro-
pean megacity such as London, where the use of diesel fuel
is prevalent, in line with previous studies in the US (Gen-
tner et al., 2012). Each cubic metre of air contains sufficient
gas phase hydrocarbons to potentially produce 14.4–17.6 and
4.9–6.1 µg of SOA in winter and summer following atmo-
spheric oxidation.
Recent simulation chamber studies indicate that modern
engines fitted with diesel particle filters, such as EURO5
emissions control, have greatly reduced VOC tailpipe emis-
sion and form little SOA under chamber conditions (Gordon
et al., 2014a, b). However, Carslaw and Rhys-Tyler (2013)
have recently shown that when vehicles are driven under real-
world urban conditions (i.e. different engines loads cause
variable catalyst temperatures which can lead to limited ef-
fectiveness, as opposed to dynamometer tests where the cat-
alyst is held at optimum operating conditions), the emissions
of NOx from diesel engines have not been reduced as ex-
pected given the new technologies implemented. It is possi-
ble to infer that if NOx emissions are higher than expected,
the VOC emissions are also likely to be higher. In this study
we have shown that there is a significant diesel vehicle source
emitting sufficient VOCs to impact ozone and SOA forma-
tion in the urban atmosphere.
Atmos. Chem. Phys., 15, 9983–9996, 2015 www.atmos-chem-phys.net/15/9983/2015/
R. Dunmore et al.: Diesel-related hydrocarbons can dominate gas phase reactive carbon in megacities 9993
4 Conclusions
From the results presented, it is possible to conclude that cur-
rent inventories and emissions estimates do not adequately
represent emissions of gas phase higher carbon number
species from the diesel fleet under real-world conditions and
in a developed urban environment. The calculated impact of
these species is significant, particularly in terms of OH reac-
tivity, ozone formation potential and SOA production.
In the last decade, there has been a steady shift in fuel
use in many locations. For example, in the UK diesel fuel
use as a fraction of total fuel has risen from 52 % in 2005
to 62 % in 2011 (see Fig. S7 and Table S7) (Department of
Energy and Climate Change, 2014). Although the UK may
be considered typical of Europe (where diesel use varies be-
tween 45–80 %) (European Commission, 2012), the average
US value was around 29 % diesel use (US Energy Informa-
tion Administration, 2014) in 2013, with the understanding
of other geographical regions currently being poor.
This shift to an increasingly diesel-powered fleet in many
developed cities, as a response to energy efficiency drivers,
has therefore shifted the balance of hydrocarbons in urban
air from short to long chain compounds, and these observa-
tions provide direct atmospheric evidence of this effect in
London. Previous air quality assessments of diesel-related
hydrocarbons in the atmosphere are few in number, and as
discussed previously, have been made only in the US where
geographic characteristics and vehicle fleet composition are
very different to London, and Europe more widely. In many
cities the impact of diesel hydrocarbons remains to be deter-
mined, but this work demonstrates that it will likely be signif-
icant in locations with substantial diesel fleets. An improve-
ment in measurement infrastructure appears to be essential if
this source is to be quantified more widely or the impacts of
policy evaluated.
Understanding the impact of this change is significantly
hindered however by a lack of appropriate physico-chemical
data for individual longer chain hydrocarbons. There are al-
ready very significant policy challenges for many developed
cities relating to the control of NO2 from modern diesel vehi-
cles, and this study indicates that there may also be a similar,
but currently un-recognised, policy challenge to control re-
active carbon emissions and their contributions to secondary
pollutants.
The Supplement related to this article is available online
at doi:10.5194/acp-15-9983-2015-supplement.
Author contributions. R. E. Dunmore and J. R. Hopkins analysed
the GC data and J. D. Lee made the O3 and NOx measurements.
R. T. Lidster and J. F. Hamilton developed the GC×GC-FID in-
strument. A. R. Rickard provided insight into the kinetics and pho-
tochemical ozone creation potentials. R. E. Dunmore, J. F. Hamil-
ton, A. C. Lewis and M. J. Evans wrote the paper. All authors con-
tributed towards the final version of the paper.
Acknowledgements. R. E. Dunmore would like to thank
NERC (NE/J500197/1) for PhD funding and to acknowl-
edge David Carslaw for his assistance using Openair and
Richard Derwent for assistance with the NAEI. All authors would
like to acknowledge NERC for funding the Clearflo project
(NE/H002112/1), and the efforts of all participants in the field
experiment in supporting these measurements. We would like to
acknowledge Stephen Belcher for project co-ordination.
Edited by: F. Keutsch
References
Aschmann, S. and Atkinson, R.: Rate constants for the gas-phase
reactions of OH radicals with E-7-tetradecene, 2-methyl-1-
tridecene and the C7–C14 1-alkenes at 295± 1 K, Phys. Chem.
Chem. Phys., 10, 4159–4164, doi:10.1039/B803527J, 2008.
Atkinson, R. and Arey, J.: Atmospheric degradation of
volatile organic compounds, Chem. Rev., 103, 4605–4638,
doi:10.1021/cr0206420, 2003.
Bahreini, R., Middlebrook, A., de Gouw, J., Warneke, C.,
Trainer, M., Brock, C., Stark, H., Brown, S., Dube, W.,
Gilman, J., Hall, K., Holloway, J., Kuster, W., Perring, A.,
Prévôt, A., Schwarz, J., Spackman, J., Szidat, S., Wagner, N.,
Weber, R., Zotter, P., and Parrish, D.: Gasoline emissions domi-
nate over diesel in formation of secondary organic aerosol mass,
Geophys. Res. Lett., 39, L06805, doi:10.1029/2011GL050718,
2012.
Bigi, A. and Harrison, R.: Analysis of the air pollution climate at a
central urban background site, Atmos. Environ., 44, 2004–2012,
doi:10.1016/j.atmosenv.2010.02.028, 2010.
Bohnenstengel, S. I., Belcher, S. E., Aiken, A., Allan, J. D.,
Allen, G., Bacak, A., Bannan, T. J., Barlow, J., Bed-
dows, D. C. S., Bloss, W. J., Booth, A. M., Chemel, C., Co-
ceal, O., Di Marco, C. F., Dubey, M. K., Faloon, K. H., Flem-
ing, Z. L., Furger, M., Gietl, J. K., Graves, R. R., Green, D. C.,
Grimmond, C. S. B., Halios, C. H., Hamilton, J. F., Harri-
son, R. M., Heal, M. R., Heard, D. E., Helfter, C., Herndon, S. C.,
Holmes, R. E., Hopkins, J. R., Jones, A. M., Kelly, F. J., Kot-
thaus, S., Langford, B., Lee, J. D., Leigh, R. J., Lewis, A. C.,
Lidster, R. T., Lopez-Hilfiker, F. D., McQuaid, J. B., Mohr, C.,
Monks, P. S., Nemitz, E., Ng, N. L., Percival, C. J.,
Prévôt, A. S. H., Ricketts, H. M. A., Sokhi, R., Stone, D., Thorn-
ton, J. A., Tremper, A. H., Valach, A. C., Visser, S., Whal-
ley, L. K., Williams, L. R., Xu, L., Young, D. E. E., and Zotter, P.:
Meteorology, air quality, and health in London: the ClearfLo
project, B. Am. Meteorol. Soc., online first, doi:10.1175/bams-
d-12-00245.1, 2014.
Borbon, A., Fontaine, H., Veillerot, M., Locoge, N., Galloo, J., and
Guillermo, R.: An investigation into the traffic-related fraction of
isoprene at an urban location, Atmos. Environ., 35, 3749–3760,
doi:10.1016/S1352-2310(01)00170-4, 2001.
www.atmos-chem-phys.net/15/9983/2015/ Atmos. Chem. Phys., 15, 9983–9996, 2015
9994 R. Dunmore et al.: Diesel-related hydrocarbons can dominate gas phase reactive carbon in megacities
Calvert, J. G., Derwent, R. G., Orlando, J. J., Tyndall, G. S., and
Wallington, T. J.: Mechanisms of Atmospheric Oxidation of the
Alkenes, Oxford University Press, New York, 2000.
Carslaw, D. and Rhys-Tyler, G.: New insights from comprehen-
sive on-road measurements of NOx , NO2 and NH3 from vehicle
emission remote sensing in London, UK, Atmos. Environ., 81,
339–347, doi:10.1016/j.atmosenv.2013.09.026, 2013.
Carslaw, D. and Ropkins, K.: openair – an R package for air
quality data analysis, Environ. Modell. Softw., 27–28, 52–61,
doi:10.1016/j.envsoft.2011.09.008, 2012a.
Carslaw, D. and Ropkins, K.: openair – data analysis tools for the
Air Quality Community, The R Journal, 4, 20–29, 2012b.
Carter, W.: SAPRC-07 Atmospheric Chemistry Mechanisms and
VOC Reactivity Scales, available at: http://www.engr.ucr.edu/
~carter/SAPRC/ (last access: 10 February 2015), 2010.
Chameides, W., Fehsenfeld, F., Rodgers, M., Cardelino, C., Mar-
tinez, J., Parrish, D., Lonneman, W., Lawson, D., Rasmussen, R.,
Zimmerman, P., Greenberg, J., Middleton, P., and Wang, T.:
Ozone precursor relationships in the ambient atmosphere, J.
Geophys. Res.-Atmos., 97, 6037–6055, doi:10.1029/91JD03014,
1992.
Department of Energy and Climate Change: Road transport energy
consumption at regional and local authority level, available at:
www.gov.uk/government/statistical-data-sets/road-transport-
energy-consumption-at-regional-and-local-authority-level(last
access: 10 February 2015), 2014.
Derwent, R., Jenkin, M., Saunders, S., and Pilling, M.: Photochemi-
cal ozone creation potentials for organic compounds in northwest
Europe calculated with a master chemical mechanism, Atmos.
Environ., 32, 2429–2441, doi:10.1016/S1352-2310(98)00053-3,
1998.
Derwent, R., Jenkin, M., Pilling, M., Carter, W., and Kaduwela, A.:
Reactivity scales as comparative tools for chemical mecha-
nisms, J. Air Waste Manage., 60, 914–924, doi:10.3155/1047-
3289.60.8.914, 2010.
Donahue, N. M., Kroll, J. H., Pandis, S. N., and Robinson, A. L.:
A two-dimensional volatility basis set – Part 2: Diagnostics of
organic-aerosol evolution, Atmos. Chem. Phys., 12, 615–634,
doi:10.5194/acp-12-615-2012, 2012.
Ensberg, J., Hayes, P., Jimenez, J., Gilman, J., Kuster, W., de
Gouw, J., Holloway, J., Gordon, T., Jathar, S., Robinson, A., and
Seinfeld, J.: Emission factor ratios, SOA mass yields, and the
impact of vehicular emissions on SOA formation, Atmos. Chem.
Phys., 14, 2383–2397, doi:10.5194/acp-14-2383-2014, 2014.
European Commission: EU Transport in Figures, available at:
http://ec.europa.eu/transport/facts-fundings/statistics/doc/2012/
pocketbook2012.pdf (last access: 10 February 2015), 2012.
Exxon Mobil: The Outlook for Energy: A view to 2040, Tech. rep.,
Exxon Mobil Corporation, Texas, 2014.
Gaffney, J. and Marley, N.: The impacts of combustion emissions on
air quality and climate – from coal to biofuels and beyond, At-
mos. Environ., 43, 23–36, doi:10.1016/j.atmosenv.2008.09.016,
2009.
Gaffron, P.: Urban transport, environmental justice and human daily
activity patterns, Transport Policy, 20, 116–129, 12th World Con-
ference on Transport Research (WCTR)/14th World Conference
of the Air-Transport-Research-Society (ATRS), Lisbon, Portu-
gal, 11–15 July 2010, 2012.
Gentner, D., Isaacman, G., Worton, D., Chan, A., Dallmann, T.,
Davis, L., Liu, S., Day, D., Russell, L., Wilson, K., Weber, R.,
Guha, A., Harley, R., and Goldstein, A.: Elucidating secondary
organic aerosol from diesel and gasoline vehicles through de-
tailed characterization of organic carbon emissions, P. Natl.
Acad. Sci. USA, 109, 18318–23, doi:10.1073/pnas.1212272109,
2012.
Gentner, D., Worton, D., Isaacman, G., Davis, L., Dallmann, T.,
Wood, E., Herndon, S., Goldstein, A., and Harley, R.: Chemi-
cal composition of gas-phase organic carbon emissions from mo-
tor vehicles and implications for ozone production, Environ. Sci.
Technol., 47, 11837–11848, doi:10.1021/es401470e, 2013.
Goldstein, A. and Galbally, I.: Known and unexplored organic con-
stituents in the Earth’s atmosphere, Environ. Sci. Technol., 41,
1514–1521, doi:10.1021/es072476p, 2007.
Gordon, T., Tkacik, D., Presto, A., Zhang, M., Jathar, S.,
Nguyen, N., Massetti, J., Truong, T., Cicero-Fernandez, P., Mad-
dox, C., Rieger, P., Chattopadhyay, S., Maldonado, H., Mar-
icq, M. M., and Robinson, A.: Primary gas- and particle-phase
emissions and secondary organic aerosol production from gaso-
line and diesel off-road engines, Environ. Sci. Technol., 47,
14137–14146, doi:10.1021/es403556e, 2013.
Gordon, T. D., Presto, A. A., May, A. A., Nguyen, N. T., Lip-
sky, E. M., Donahue, N. M., Gutierrez, A., Zhang, M., Mad-
dox, C., Rieger, P., Chattopadhyay, S., Maldonado, H., Mar-
icq, M. M., and Robinson, A. L.: Secondary organic aerosol for-
mation exceeds primary particulate matter emissions for light-
duty gasoline vehicles, Atmos. Chem. Phys., 14, 4661–4678,
doi:10.5194/acp-14-4661-2014, 2014a.
Gordon, T. D., Presto, A. A., Nguyen, N. T., Robertson, W. H.,
Na, K., Sahay, K. N., Zhang, M., Maddox, C., Rieger, P.,
Chattopadhyay, S., Maldonado, H., Maricq, M. M., and Robin-
son, A. L.: Secondary organic aerosol production from diesel ve-
hicle exhaust: impact of aftertreatment, fuel chemistry and driv-
ing cycle, Atmos. Chem. Phys., 14, 4643–4659, doi:10.5194/acp-
14-4643-2014, 2014b.
Gros, V., Sciare, J., and Yu, T.: Air-quality measurements in megac-
ities: focus on gaseous organic and particulate pollutants and
comparison between two contrasted cities, Paris and Beijing, CR
Geosci., 339, 764–774, doi:10.1016/j.crte.2007.08.007, 2007.
Hamilton, J. and Lewis, A.: Monoaromatic complexity in urban air
and gasoline assessed using comprehensive GC and fast GC-
TOF/MS, Atmos. Environ., 37, 589–602, doi:10.1016/S1352-
2310(02)00930-5, 2003.
Harrison, R. M., Dall’Osto, M., Beddows, D. C. S., Thorpe, A. J.,
Bloss, W. J., Allan, J. D., Coe, H., Dorsey, J. R., Gallagher, M.,
Martin, C., Whitehead, J., Williams, P. I., Jones, R. L., Lan-
gridge, J. M., Benton, A. K., Ball, S. M., Langford, B., He-
witt, C. N., Davison, B., Martin, D., Petersson, K. F., Hen-
shaw, S. J., White, I. R., Shallcross, D. E., Barlow, J. F., Dun-
bar, T., Davies, F., Nemitz, E., Phillips, G. J., Helfter, C.,
Di Marco, C. F., and Smith, S.: Atmospheric chemistry and
physics in the atmosphere of a developed megacity (London):
an overview of the REPARTEE experiment and its conclusions,
Atmos. Chem. Phys., 12, 3065–3114, doi:10.5194/acp-12-3065-
2012, 2012.
Hopkins, J., Lewis, A., and Read, K.: A two-column method for
long-term monitoring of non-methane hydrocarbons (NMHCs)
Atmos. Chem. Phys., 15, 9983–9996, 2015 www.atmos-chem-phys.net/15/9983/2015/

R. Dunmore et al.: Diesel-related hydrocarbons can dominate gas phase reactive carbon in megacities 9995
and oxygenated volatile organic compounds (OVOCs), J. Envi-
ron. Monitor., 5, 8–13, doi:10.1039/b202798d, 2003.
House of Commons Environmental Audit Committee: Air Quality:
A Follow-up Report, Ninth Report, Tech. rep., House of Com-
mons, London, The Stationery Office Limited, 2012.
Jathar, S., Gordon, T., Hennigan, C., Pye, H. T., Pouliot, G.,
Adams, P., Donahue, N., and Robinson, A.: Unspeciated
organic emissions from combustion sources and their in-
fluence on the secondary organic aerosol budget in the
United States, P. Natl. Acad. Sci. USA, 111, 10473–10478,
doi:10.1073/pnas.1323740111, 2014.
Jimenez, J. L., Canagaratna, M. R., Donahue, N. M., Pre-
vot, A. S. H., Zhang, Q., Kroll, J. H., DeCarlo, P. F., Allan, J. D.,
Coe, H., Ng, N. L., Aiken, A. C., Docherty, K. S., Ulbrich, I. M.,
Grieshop, A. P., Robinson, A. L., Duplissy, J., Smith, J. D., Wil-
son, K. R., Lanz, V. A., Hueglin, C., Sun, Y. L., Tian, J., Laakso-
nen, A., Raatikainen, T., Rautiainen, J., Vaattovaara, P., Ehn, M.,
Kulmala, M., Tomlinson, J. M., Collins, D. R., Cubison, M. J. E.,
Dunlea, J., Huffman, J. A., Onasch, T. B., Alfarra, M. R.,
Williams, P. I., Bower, K., Kondo, Y., Schneider, J., Drewnick, F.,
Borrmann, S., Weimer, S., Demerjian, K., Salcedo, D., Cot-
trell, L., Griffin, R., Takami, A., Miyoshi, T., Hatakeyama, S.,
Shimono, A., Sun, J. Y., Zhang, Y. M., Dzepina, K., Kim-
mel, J. R., Sueper, D., Jayne, J. T., Herndon, S. C., Trim-
born, A. M., Williams, L. R., Wood, E. C., Middlebrook, A. M.,
Kolb, C. E., Baltensperger, U., and Worsnop, D. R.: Evolution of
Organic Aerosols in the Atmosphere, Science, 326, 1525–1529,
doi:10.1126/science.1180353, 2014.
Knote, C., Hodzic, A., Jimenez, J. L., Volkamer, R., Orlando, J. J.,
Baidar, S., Brioude, J., Fast, J., Gentner, D. R., Goldstein, A. H.,
Hayes, P. L., Knighton, W. B., Oetjen, H., Setyan, A., Stark, H.,
Thalman, R., Tyndall, G., Washenfelder, R., Waxman, E., and
Zhang, Q.: Simulation of semi-explicit mechanisms of SOA for-
mation from glyoxal in aerosol in a 3-D model, Atmos. Chem.
Phys., 14, 6213–6239, doi:10.5194/acp-14-6213-2014, 2014.
Langford, B., Nemitz, E., House, E., Phillips, G. J., Famu-
lari, D., Davison, B., Hopkins, J. R., Lewis, A. C., and He-
witt, C. N.: Fluxes and concentrations of volatile organic com-
pounds above central London, UK, Atmos. Chem. Phys., 10,
627–645, doi:10.5194/acp-10-627-2010, 2010.
Lee, J. D., Moller, S. J., Read, K. A., Lewis, A. C., Mendes, L.,
and Carpenter, L. J.: Year-round measurements of nitro-
gen oxides and ozone in the tropical North Atlantic ma-
rine boundary layer, J. Geophys. Res.-Atmos., 114, D21302,
doi:10.1029/2009JD011878, 2009.
Lidster, R., Hamilton, J., and Lewis, A.: The application of two to-
tal transfer valve modulators for comprehensive two-dimensional
gas chromatography of volatile organic compounds, J. Sep. Sci.,
34, 812–821, doi:10.1002/jssc.201000710, 2011.
McMeeking, G. R., Bart, M., Chazette, P., Haywood, J. M.,
Hopkins, J. R., McQuaid, J. B., Morgan, W. T., Raut, J.-C.,
Ryder, C. L., Savage, N., Turnbull, K., and Coe, H.: Air-
borne measurements of trace gases and aerosols over the Lon-
don metropolitan region, Atmos. Chem. Phys., 12, 5163–5187,
doi:10.5194/acp-12-5163-2012, 2012.
Nannoolal, Y., Rarey, J., Ramjugernath, D., and Cordes, W.: Esti-
mation of pure component properties: Part 1. Estimation of the
normal boiling point of non-electrolyte organic compounds via
group contributions and group interactions, Fluid Phase Equi-
libr., 226, 45–63, doi:10.1016/j.fluid.2004.09.001, 2004.
Nannoolal, Y., Rarey, J., and Ramjugernath, D.: Estimation of pure
component properties: Part 3. Estimation of the vapor pressure
of non-electrolyte organic compounds via group contributions
and group interactions, Fluid Phase Equilibr., 269, 117–133,
doi:10.1016/j.fluid.2008.04.020, 2008.
Odum, J. R., Jungkamp, T. P. W., Griffin, R. J., Forstner, H. J. L.,
Flagan, R. C., and Seinfeld, J. H.: Aromatics, reformulated gaso-
line, and atmospheric organic aerosol formation, Environ. Sci.
Technol., 31, 1890–1897, doi:10.1021/es960535l, 1997.
Parrish, D., Kuster, W., Shao, M., Yokouchi, Y., Kondo, Y.,
Goldan, P. D., de Gouw, J., Koike, M., and Shirai, T.: Comparison
of air pollutant emissions among mega-cities, Atmos. Environ.,
43, 6435–6441, doi:10.1016/j.atmosenv.2009.06.024, 2009.
Passant, N.: Speciation of UK emissions of non-methane volatile
organic compounds, Tech. rep., AEA Technology Report ENV-
05452002, Culham, Abingdon, UK, 2002.
Platt, S. M., El Haddad, I., Zardini, A. A., Clairotte, M., Astorga, C.,
Wolf, R., Slowik, J. G., Temime-Roussel, B., Marchand, N.,
Ježek, I., Drinovec, L., Mocnik, G., Möhler, O., Richter, R.,
Barmet, P., Bianchi, F., Baltensperger, U., and Prévôt, A. S. H.:
Secondary organic aerosol formation from gasoline vehicle emis-
sions in a new mobile environmental reaction chamber, Atmos.
Chem. Phys., 13, 9141–9158, doi:10.5194/acp-13-9141-2013,
2013.
Presto, A., Miracolo, M., Donahue, N., and Robinson, A.:
Secondary organic aerosol formation from high-NOx photo-
oxidation of low volatility precursors: n-alkanes, Environ. Sci.
Technol., 44, 2029–2034, doi:10.1021/es903712r, 2010.
R Development Core Team: R: A Language and Environment for
Statistical Computing, R Foundation for Statistical Computing,
Vienna, Austria, available at: http://www.R-project.org/ (last ac-
cess: 19 June 2014), 2012.
Robinson, A., Donahue, N., Shrivastava, M., Weitkamp, E.,
Sage, A., Grieshop, A., Lane, T., Pierce, J., and Pan-
dis, S.: Rethinking Organic Aerosols: Semivolatile Emis-
sions and Photochemical Aging, Science, 315, 1259–1262
doi:10.1126/science.1133061, 2007.
Saunders, S. M., Jenkin, M. E., Derwent, R. G., and Pilling, M. J.:
Protocol for the development of the Master Chemical Mech-
anism, MCM v3 (Part A): tropospheric degradation of non-
aromatic volatile organic compounds, Atmos. Chem. Phys., 3,
161–180, doi:10.5194/acp-3-161-2003, 2003.
US Energy Information Administration: Petroleum and Other Liq-
uids, 2014.
von Schneidemesser, E., Monks, P., and Plass-Duelmer, C.: Global
comparison of VOC and CO observations in urban areas, Atmos.
Environ., 44, 5053–5064, doi:10.1016/j.atmosenv.2010.09.010,
2010.
Warneke, C., de Gouw, J., Holloway, J., Peischl, J., Ryerson, T., At-
las, E., Blake, D., Trainer, M., and Parrish, D.: Multiyear trends
in volatile organic compounds in Los Angeles, California: five
decades of decreasing emissions, J. Geophys. Res.-Atmos., 117,
D00V17, doi:10.1029/2012JD017899, 2012.
Yoshino, A., Sadanaga, Y., Watanabe, K., Kato, S., Miyakawa, Y.,
Matsumoto, J., and Kajii, Y.: Measurement of total OH reactiv-
ity by laser-induced pump and probe technique – comprehensive
www.atmos-chem-phys.net/15/9983/2015/ Atmos. Chem. Phys., 15, 9983–9996, 2015

9996 R. Dunmore et al.: Diesel-related hydrocarbons can dominate gas phase reactive carbon in megacities
observations in the urban atmosphere of Tokyo, Atmos. Environ.,
40, 7869–7881, doi:10.1016/j.atmosenv.2006.07.023, 2006.
Yoshino, A., Nakashima, Y., Miyazaki, K., Kato, S., Suthawa-
ree, J., Shimo, N., Matsunaga, S., Chatani, S., Apel, E., Green-
berg, J., Guenther, A., Ueno, H., Sasaki, H., Hoshi, J., Yokota, H.,
Ishii, K., and Kajii, Y.: Air quality diagnosis from compre-
hensive observations of total OH reactivity and reactive trace
species in urban central Tokyo, Atmos. Environ., 49, 51–59,
doi:10.1016/j.atmosenv.2011.12.029, 2012.
Young, D. E., Allan, J. D., Williams, P. I., Green, D. C., Flynn, M. J.,
Harrison, R. M., Yin, J., Gallagher, M. W., and Coe, H.: Inves-
tigating the annual behaviour of submicron secondary inorganic
and organic aerosols in London, Atmos. Chem. Phys., 15, 6351–
6366, doi:10.5194/acp-15-6351-2015, 2015.
Zhang, Q., Jimenez, J., Canagaratna, M., Ulbrich, I., Ng, N.,
Worsnop, D., and Sun, Y.: Understanding atmospheric or-
ganic aerosols via factor analysis of aerosol mass spec-
trometry: a review, Anal. Bioanal. Chem., 401, 3045–3067,
doi:10.1007/s00216-011-5355-y, 2011.
Zhang, X., Cappa, C., Jathar, S., McVay, R., Ensberg, J.,
Kleeman, M., and Seinfeld, J.: Influence of vapor wall
loss in laboratory chambers on yields of secondary or-
ganic aerosol, P. Natl. Acad. Sci. USA, 111, 5802–5807,
doi:10.1073/pnas.1404727111, 2014.
Zhao, Y., Hennigan, C., May, A., Tkacik, D., de Gouw, J.,
Gilman, J., Kuster, W., Borbon, A., and Robinson, A.:
Intermediate-Volatility Organic Compounds: A large source of
Secondary Organic Aerosol, Environ. Sci. Technol., 48, 13743–
137, doi:10.1021/es5035188, 2014.
Atmos. Chem. Phys., 15, 9983–9996, 2015 www.atmos-chem-phys.net/15/9983/2015/