diagnostic procedures in ophthalmology full colour
TRANSCRIPT


Diagnostic Procedures inOPHTHALMOLOGY

Diagnostic Procedures inOPHTHALMOLOGY
SECOND EDITION
®
JAYPEE BROTHERS MEDICAL PUBLISHERS (P) LTDNew Delhi • Ahmedabad • Bengaluru • Chennai • Hyderabad
Kochi • Kolkata • Lucknow • Mumbai • Nagpur • St Louis (USA)
HV NemaFormer Professor and Head
Department of OphthalmologyInstitute of Medical SciencesBanaras Hindu University
Varanasi, Uttar Pradesh, India
Nitin Nema MS Dip NB
Assistant ProfessorDepartment of Ophthalmology
Sri Aurobindo Institute of Medical SciencesIndore, Madhya Pradesh, India

Published by
Jitendar P VijJaypee Brothers Medical Publishers (P) LtdCorporate Office4838/24 Ansari Road, Daryaganj, New Delhi - 110 002, India, +91-11-43574357 (30 lines)
Registered OfficeB-3 EMCA House, 23/23B Ansari Road, Daryaganj, New Delhi 110 002, IndiaPhones: +91-11-23272143, +91-11-23272703, +91-11-23282021,+91-11-23245672, Rel: +91-11-32558559 Fax: +91-11-23276490, +91-11-23245683e-mail: [email protected], Website: www.jaypeebrothers.comBranches• 2/B, Akruti Society, Jodhpur Gam Road Satellite
Ahmedabad 380 015 Phones: +91-79-26926233, Rel: +91-79-32988717Fax: +91-79-26927094 e-mail: [email protected]
• 202 Batavia Chambers, 8 Kumara Krupa Road, Kumara Park EastBengaluru 560 001 Phones: +91-80-22285971, +91-80-22382956, +91-80-22372664Rel: +91-80-32714073, Fax: +91-80-22281761 e-mail: [email protected]
• 282 IIIrd Floor, Khaleel Shirazi Estate, Fountain Plaza, Pantheon RoadChennai 600 008 Phones: +91-44-28193265, +91-44-28194897,Rel: +91-44-32972089 Fax: +91-44-28193231 e-mail: [email protected]
• 4-2-1067/1-3, 1st Floor, Balaji Building, Ramkote Cross RoadHyderabad 500 095 Phones: +91-40-66610020, +91-40-24758498, Rel:+91-40-32940929Fax:+91-40-24758499 e-mail: [email protected]
• No. 41/3098, B & B1, Kuruvi Building, St. Vincent RoadKochi 682 018, Kerala Phones: +91-484-4036109, +91-484-2395739, +91-484-2395740e-mail: [email protected]
• 1-A Indian Mirror Street, Wellington SquareKolkata 700 013 Phones: +91-33-22651926, +91-33-22276404, +91-33-22276415Rel: +91-33-32901926, Fax: +91-33-22656075, e-mail: [email protected]
• Lekhraj Market III, B-2, Sector-4, Faizabad Road, Indira NagarLucknow 226 016 Phones: +91-522-3040553, +91-522-3040554e-mail: [email protected]
• 106 Amit Industrial Estate, 61 Dr SS Rao Road, Near MGM Hospital, ParelMumbai 400012 Phones: +91-22-24124863, +91-22-24104532, Rel: +91-22-32926896Fax: +91-22-24160828 e-mail: [email protected]
• “KAMALPUSHPA” 38, Reshimbag, Opp. Mohota Science College, Umred RoadNagpur 440 009 (MS) Phone: Rel: +91-712-3245220,Fax: +91-712-2704275 e-mail: [email protected]
USA Office1745, Pheasant Run Drive, Maryland Heights (Missouri), MO 63043, USA, Ph: 001-636-6279734e-mail: [email protected], [email protected]
Diagnostic Procedures in Ophthalmology© 2009, HV Nema, Nitin Nema
All rights reserved. No part of this publication should be reproduced, stored in a retrieval system, or transmitted in any form or by any means:electronic, mechanical, photocopying, recording, or otherwise, without the prior written permission of the editors and the publisher.
This book has been published in good faith that the material provided by contributors is original. Every effort is made to ensureaccuracy of material, but the publisher, printer and editors will not be held responsible for any inadvertent error(s). In case of anydispute, all legal matters to be settled under Delhi jurisdiction only.
First Edition: 2002Second Edition: 2009
ISBN 978-81-8448-595-0
Typeset at JPBMP typesetting unitPrinted at Replika Press


Contributors
Jorge L Alió MD, PhD
Director, VissumInstitute of Ophthalmology of AlicanteAlicante, Spain
Sonal Ambatkar DNB
Glaucoma ServiceAravind Eye HospitalTirunelveli, Tamil Nadu, India
Francisco Arnalich MD
VissumInstitute of Ophthalmology of AlicanteAlicante, Spain
Sreedharan Athmanathan MD, DNB
VirologistLV Prasad Eye InstituteHyderabad, Andhra Pradesh, India
Mandeep S Bajaj MD
ProfessorDr RP Centre for Ophthalmic SciencesAIIMS, New Delhi, India
Tinku Bali MS
ConsultantDepartment of OphthalmologySir Ganga Ram Hospital, New Delhi, India
Rituraj Baruah MS
Senior RegistrarLady Hardinge Medical CollegeNew Delhi, India
Jyotirmay Biswas MS, FAMS
Head, Ocular, Pathology and UveitisSankara Nethralaya, ChennaiTamil Nadu, India
Ambar Chakravarty MS, FRCP
Honorary Professor and HeadDepartment of NeurologyVivekananda Institute of Medical SciencesKolkata, West Bengal, India
Surbhit Chaudhary MS
Ex-FellowSankara NethralayaChennai, Tamil Nadu, India
Taraprasad Das MS
DirectorLV Prasad Eye InstituteBhubaneswar, Orissa, India
Munish Dhawan MD
Dr RP Centre for Ophthalmic SciencesAIIMS, New Delhi, India
Lingam Gopal MS, FRCS
ChairmanMedical Research FoundationSankara Nethralaya, ChennaiTamil Nadu, India
AK Grover MD, FRCS
ChairmanDepartment of OphthalmologySir Ganga Ram HospitalNew Delhi, India
Roshmi Gupta MD
Consultant, Narayana NethralayaBengaluru, Karnataka, India
Sanjiv Gupta MD
Dr RP Centre for Ophthalmic SciencesAIIMS, New Delhi, India
Stephen C Hilton OD
West Virginia UniversityMorgantown, USA
Santosh G Honavar MD, FACS
DirectorDepartment of Ophthalmic Plastic Surgery andOcular Oncology, LV Prasad Eye InstituteHyderabad, Andhra Pradesh, India

Anjali Hussain MS
ConsultantLV Prasad Eye InstituteHyderabad, Andhra Pradesh, India
Subhadra Jalali MS
HeadSmt Kanuri Santhamma Retina-Vitreous CentreLV Prasad Eye InstituteHyderabad, Andhra Pradesh, India
Sadao Kanagami FOPS
ProfessorKitasato University School of MedicineTeikyo, Japan
Sangmitra Kanungo MD, FRCS
ConsultantLV Prasad Eye InstituteHyderabad, Andhra Pradesh, India
Shahnawaz Kazi MS
FellowSankara NethralayaChennai, Tamil Nadu, India
R Kim DO
HeadRetina-Vitreous ServiceAravind Eye Hospital andPostgraduate Institute of OphthalmologyMadurai, Tamil Nadu, India
Parmod Kumar OD
Glaucoma Imaging CentreNew Delhi, India
S Manoj MS
ConsultantRetina-Vitreous ServiceAravind Eye Hospital and Postgraduate Instituteof Ophthalmology, Madurai, Tamil Nadu, India
S Meenakshi MS
ConsultantPediatric Ophthalmology Sankara NethralayaChennai, Tamil Nadu, India
Amit Nagpal MS
ConsultantSankara Nethralaya, ChennaiTamil Nadu, India
A NarayanaswamyConsultantSankara NethralayaChennai, Tamil Nadu, India
Rajiv Nath MS
ProfessorDepartment of OphthalmologyKG Medical UniversityLucknow, Uttar Pradesh, India
Tomohiro Otani MD
ProfessorDepartment of OphthalmologyGunma University School of MedicineMaebashi, Japan
Nikhil Pal MD
Senior ResidentDr RP Centre for Ophthalmic SciencesAIIMS, New Delhi, India
Rajul Parikh MS
Consultant, Sankara NethralayaChennai, Tamil Nadu, India
David Piñero OD
VissumInstitute of Ophthalmology of AlicanteAlicante, Spain
K Kalyani Prasad MS
ConsultantKrishna Institute of Medical SciencesHyderabad, Andhra Pradesh, India
Leela V Raju MD
Monongalia Eye ClinicMorgantown, USA
VK Raju MD, FRCS, FACS
Clinical ProfessorDepartment of OphthalmologyWest Virginia UniversityMorgantown, USA
LS Mohan Ram D Opt, BS
LV Prasad Eye InstituteHyderabad, Andhra Pradesh, India
viii Diagnostic Procedures in Ophthalmology

R Ramakrishnan MS
Professor and CMOAravind Eye HospitalTirunelveli, Tamil Nadu, India
Manotosh Ray MD, FRCS
Associate ConsultantNational University HospitalSingapore
Pukhraj Rishi MD
ConsultantSankara NethralayaChennai, Tamil Nadu, India
Monica Saha MBBS
Department of OphthalmologyKG Medical UniversityLucknow, Uttar Pradesh, India
Chandra Sekhar MD
DirectorLV Prasad Eye InstituteHyderabad, Andhra Pradesh, India
Harinder Singh Sethi MD, DNB, FRCS
Senior Research AssociateDr RP Centre for Ophthalmic SciencesAIIMS, New Delhi, India
Pradeep SharmaProfessorDr RP Centre for Medical SciencesAIIMS, New Delhi, India
Rajani Sharma MD (Ped)
Senior ResidentDepartment of PediatricsAIIMS, New Delhi, India
Savitri Sharma MD
HeadJhaveri Microbiological CentreLV Prasad Eye InstituteHyderabad, Andhra Pradesh, India
Tarun Sharma MD, FRCS
DirectorRetina Service, Sankara NethralayaChennai, Tamil Nadu, India
Yog Raj Sharma MD
ProfessorDr RP Centre for Ophthalmic SciencesAIIMS, New Delhi, India
Deependra Vikram Singh MD
Senior ResidentDr RP Centre for Ophthalmic Sciences, AIIMSNew Delhi, India
Devindra Sood MD
Consultant, Glaucoma Imaging CentreNew Delhi, India
MS Sridhar MD
ConsultantLV Prasad Eye InstituteHyderabad, Andhra Pradesh, India
S Sudharshan MS
FellowSankara NethralayaChennai, Tamil Nadu, India
Kallakuri Sumasri B Optm
Retina-Vitreous CentreLV Prasad Eye InstituteHyderabad, Andhra Pradesh, India
T Surendran MS, M Phil
Vice Chairman and DirectorPediatric OphthalmologySankara NethralayaChennai, Tamil Nadu, India
Garima Tyagi B Opt
Retina-Vitreous CentreLV Prasad Eye InstituteHyderabad, Andhra Pradesh, India
Vasumathy Vedantham MS, DNB, FRCS
Consultant, Retina-Vitreous ServiceAravind Eye Hospital and PostgraduateInstitute of OphthalmologyMadurai, Tamil Nadu, India
L Vijaya MS
HeadGlaucoma, Sankara NethralayaChennai, Tamil Nadu, India
ixContributors


Preface to the Second Edition
The goal of this second edition of Diagnostic Procedures in Ophthalmology remains the same as that ofthe first—to provide the practicing ophthalmologists with a concise and comprehensive text oncommon diagnostic procedures which help in the correct and speedy diagnosis of eye diseases.
Like other disciplines of medicine, the knowledge of ophthalmology continues to expand anda number of newer and sophisticated investigative procedures have been introduced recently. Extensiveand detailed information on recent diagnostic approaches is available in resource textbooks oronline to ophthalmologists. To search these is time consuming, tiring and at times not practicalin a busy clinical practice set-up. Therefore, this ready reckoner has been conceptualized.
The book covers most of the basic and well-established diagnostic procedures in ophthalmology.It starts with visual acuity and describes color vision and color blindness, slit-lamp examination,tonometry, gonioscopy, evaluation of optic nerve head in glaucoma, perimetry, ophthalmoscopyand ophthalmic photography. Most of these procedures are considered basic and carried out routinelybut to obtain an evidence-based diagnosis, a correct procedure for the examination must be followed.
Corneal topography is very useful in detection of corneal pathologies such as early keratoconus,pellucid marginal corneal degeneration, corneal dystrophies, etc. It guides the ophthalmic surgeonto plan appropriate refractive surgery. Recent development in the application of wavefront technologycan reduce different types of optical aberrations and may provide supervision and improve resultsof the LASIK surgery.
A new chapter on Confocal Microscopy is included. Confocal microscopy, a noninvasive procedure,allows in vivo observation of normal and pathogenic corneal microstructure at a cellular level.It can identify subclinical corneal abnormalities.
Procedures like Fundus Fluorescein Angiography and Indocyanine Green Angiography areinvaluable diagnostic tools. They are not only useful in the diagnosis, documentation and follow-up but also in monitoring the management of the posterior segment eye diseases. With the developmentof high quality fundus camera and digital imaging, utility of both techniques has significantlyincreased.
Ultrasonography, as a diagnostic procedure, has immense importance in the modernophthalmology. Both A-scan and B-scan ultrasonography are dynamic procedures wherein diagnosisis made during examination in correlation with clinical features. Three-dimensional ultrasoundtomography allows improved visualization and detection of small ophthalmic lesions. Ultrasoundbiomicroscopy is a method of high frequency ultrasound imaging used for evaluating the structuralabnormality and pathology of the anterior segment of the eye both qualitatively and quantitatively.It is very helpful in understanding the pathomechanism of various types of glaucoma.

Optical Coherence Tomography is a noninvasive, cross-sectional imaging technique which providesobjective and quantitative measurements that are reproducible and show very good correlationwith clinical picture of retinal pathology especially macula. Presently, OCT is often used in assessmentof optic nerve head damage in glaucoma.
One must remember that imaging technique alone may not contribute to a correct diagnosis.It is complementary to clinical examination. Therefore, results of imaging should always be interpretedin conjunction with clinical findings and results of other relevant tests.
Electrophysiological tests are often ordered to assess the functional integrity of the visual pathwayand in evaluating the cause of visual impairment in children. Multifocal ERG and multifocal VEPare newer techniques still under evaluation. It is claimed that multifocal ERG can distinguishbetween the lesions of the outer retina and the ganglion cells or optic nerve. Results ofelectrophysiological tests should never be analyzed in isolation but always be correlated withclinical findings to establish a definitive diagnosis.
Etiological diagnosis of infectious keratitis and uveitis has been more vexing and often fraughtwith pitfalls. Collection of samples from eye, their microbiological work-up and interpretation oflaboratory results have been described in chapters on keratitis and uveitis. Role of optical coherencetomography in the diagnosis and management of complications of uveitis is also discussed.
A number of new chapters such as: Retinopathy of Prematurity, Localization of Intraocular Foreign
Body, Comitant Strabismus, Incomitant Strabismus, Dry Eye, Epiphora, Proptosis and Neurological Disorders
of Pupil have been added in the second edition of the book.
Retinopathy of prematurity is one of the important causes of childhood blindness. Risk factors,documentation, staging, classification, screening procedure and management of the disease arebriefly described.
Precise localization of intraocular foreign body is a tedious procedure but is critically importantfor its removal and management. Computerized tomography and magnetic resonance imaginghave replaced old cumbersome radiological methods for localization of intraocular foreign bodies,metallic and wooden.
Strabismus often has an adverse effect on psychological functioning, personality trait andworking capabilities of an individual. Patients with strabismus suffer from low self-esteem andhave problem in social interaction. Therefore, early correction of strabismus is necessary for improvingthe quality of the life of the patient. The chapter on comitant strabismus presents various methodsfor examination and measurement of deviations. Incomitant strabismus, though less common, ismore troublesome. It usually results from cranial nerves (III,IV,VI) paralysis. Restrictive strabismusmay be associated with interesting clinical ocular syndromes.
Dry eye is one of the most common external ocular diseases seen by ophthalmologists. Prevalenceof dry eye is on rise mainly due to an environmental pollution, change in lifestyle and increasein aging population. Should dry eye be considered a disorder of tear film and excessive tear evaporationor a localized immune-mediated inflammatory response of ocular surface? Besides the controversy,what is more important is an early diagnosis of dry eye and its proper management.
xii Diagnostic Procedures in Ophthalmology

Epiphora is an annoying symptom. It may occur either in infants or adults. An understandingof anatomy and physiology of the lacrimal apparatus is necessary for the evaluation of epiphora.A number of invasive and noninvasive tests are available to investigate patients with epiphoraand localize site of obstruction in the lacrimal passage.
Proptosis has a varied etiology. It may occur due to ocular, orbital and systemic causes. Generally,proptosis requires interdisciplinary cooperation amongst ophthalmologists, neurologists, oncologists,ENT surgeons, internists and radiologists. Investigation of patients with proptosis should beginwith simple standard noninvasive techniques and, if necessary, progress to more elaborate andinvasive procedures. Ultrasonography, CT and MRI are of immense value in the diagnosis.
Examination of pupil (size, shape and pupillary reactions) is essential in neurological disorders.Typical pupillary signs can help in localizing lesions in the nervous system. Characteristics ofAdie tonic pupil and Argyll-Robertson pupil and a detailed evaluation of the third cranial nervepalsy are described in the last chapter.
Most of the contributors who have vast experience in their respective fields have written chaptersfor this book. To make the reader familiar, they have not only described diagnostic proceduresbut also given characteristic findings of eye disorders with the help of illustrations. The bookhas expanded greatly as many new chapters with numerous illustrations are added.
We hope the book should be of great help to the practicing ophthalmologists and clinical residentsproviding a practical resource to investigative procedures in ophthalmology.
HV NemaNitin Nema
xiiiPreface to the Second Edition

Preface to the First Edition
The word diagnosis comes from a Greek word meaning to distinguish or discern. Besides historyand clinical examination of the patient, diagnostic tests are required to aid in making correct diagnosisof eye diseases. The role of diagnostic technology is not inferior to that of a clinician’s acumen.A correct diagnostic report helps in differentiating functional from organic and idiopathic fromnon-idiopathic diseases. The number of diagnostic tests available to an ophthalmologist has increasedsignificantly in the last two decades. Both selective and non-selective tests are presently used forthe clinical and research purposes. Non-selective approach to testing is costly and does not provideuseful information. In order to be useful, diagnostic tests have to be properly performed, accuratelyread, and correctly interpreted. The ordering oculist should always compare the results of testwith the clinical features of the eye disease.
The main aim of the book—Diagnostic Procedures in Ophthalmology is to provide useful informationon diagnostic tests, which an ophthalmologist intends to perform or order during his clinical practice.Some of the procedures described in the book, assessment of visual acuity, slit lamp examination, tonometry,gonioscopy, perimetry and ophthalmoscopy, are routine examinations. However, the technique of properexamination and interpretation of findings to arrive at a correct diagnosis must be known to thepractising ophthalmologist or optometrist.
Procedures like ophthalmic photography, evaluation of optic nerve head, fundus fluorescein angiographyand indocyanine green angiography are invaluable because they not only help in the diagnosis anddocumentation but also help in monitoring the management of eye disease. Corneal topographygives useful data about corneal surface and curvature and contributes to the success of Lasiksurgery to a great extent. The role of A-scan ultrasonography in the measurement of axial lengthof the eye and biometry cannot be over emphasised. B-scan ultrasonography is needed to explorethe posterior segment of the eye when media are opaque or an orbital mass is suspected. Ultrasoundbiomicroscopy (UBM) and Optical coherence tomography (OCT) are relatively new non-invasive toolsto screen the eye at the microscopic level. UBM helps in understanding the pathogenesis of variousforms of glaucoma and their management. OCT obtains a tomograph of the retina showing itsmicrostructure incredibly similar to a histological section. It helps in the diagnosis and managementof the macular and retinal diseases. Electrophysiological tests allow objective evaluation of visualsystem. They are used in determination of visual acuity in infants and in the diagnosis of themacular and optic nerve disorders. What diagnostic tests should be ordered in the evaluationof the patients with infective keratitis or uveitis? Chapters on Diagnostic Procedures in InfectiveKeratitis and Diagnostic Procedures in Uveitis provide an answer.
The experts who have credibility in their fields have contributed chapters to the book. Notonly the procedures of diagnostic tests are described but to make the reader conversant, characteristicfindings in the normal and the diseased eye are also highlighted with the help of illustrations.
The book should be of great help to the practising ophthalmologists, resident ophthalmologists,optometrists and technicians as it provides instant access to the diagnostic procedures in ophthalmology.
We are indebted to all contributors for their excellent contributions in short time in spite oftheir busy schedule. Mr JP Vij deserves our sincere thanks for nice publication of the book.
HV NemaNitin Nema

Acknowledgements
The publication of the second edition of Diagnostic Procedures in Ophthalmology is possible withthe help and cooperation of many colleagues and friends. We wish to express our gratitude toall the contributing authors for their time and painstaking efforts not only for writing the comprehensiveand well illustrative chapters but also updating and revising them to conform the format of thebook.
We are indebted to Prof JL Alió, Dr Vasumathy Vadantham and Dr Tarun Sharma for contributingchapters on a short notice because the initial contributors failed to submit their chapters. Ourgrateful thanks go to Dr Mahipal Sachdev for persuading Dr Manotosh Ray to write a chapteron Confocal Microscopy.
Mrs Pratibha Nema deserves our deep appreciation; without her patience, tolerance andunderstanding, this book would not have become reality.
Finally, Shri Jitendar P Vij (Chairman and Managing Director), Mr Tarun Duneja (Director-Publishing) and supporting staff of M/s Jaypee Brothers Medical Publishers (P) Ltd, New Delhiespecially deserve our sincere thanks for their cooperation and keen interest in the publicationof this book.
HV NemaNitin Nema

Contents
1. Visual Acuity ..................................................................................................................... 1Stephen C Hilton, Leela V Raju, VK Raju
2. Color Vision and Color Blindness ........................................................................... 12Harinder Singh Sethi
3. Slit-lamp Examination ................................................................................................... 33Harinder Singh Sethi, Munish Dhawan
4. Corneal Topography ....................................................................................................... 46Francisco Arnalich, David Piñero, Jorge L Alió
5. Confocal Microscopy...................................................................................................... 84Manotosh Ray
6. Tonometry .......................................................................................................................... 95R Ramakrishnan, Sonal Ambatkar
7. Gonioscopy ...................................................................................................................... 106A Narayanaswamy, L Vijaya
8. Optic Disk Assessment in Glaucoma ................................................................... 115Rajul Parikh, Chandra Sekhar
9. Basic Perimetry ..............................................................................................................128Devindra Sood, Parmod Kumar
10. Ophthalmoscopy.............................................................................................................151Pukhraj Rishi, Tarun Sharma
11. Ophthalmic Photography ............................................................................................ 165Sadao Kanagami
12. Fluorescein Angiography ............................................................................................ 181R Kim, S Manoj
13. Indocyanine Green Angiography ............................................................................200Vasumathy Vedantham
14. A-scan Ultrasonography.............................................................................................. 216Rajiv Nath, Tinku Bali, Monica Saha
15. B-scan Ultrasonography .............................................................................................. 239Taraprasad Das, Vasumathy Vedantham, Anjali Hussain
Sangmitra Kanungo, LS Mohan Ram

16. Ultrasound Biomicroscopy in Ophthalmology ....................................................259Roshmi Gupta, K Kalyani Prasad, LS Mohan Ram, Santosh G Honavar
17. Optical Coherence Tomography .............................................................................. 269Tomohiro Otani
18. Electrophysiological Tests for Visual Function Assessment ........................279Subhadra Jalali, LS Mohan Ram, Garima Tyagi, Kallakuri Sumasri
19. Diagnostic Procedures in Infectious Keratitis ...................................................316Savitri Sharma, Sreedharan Athmanathan
20. Diagnostic Procedures in Uveitis ...........................................................................333Jyotirmay Biswas, Surbhit Chaudhary, S Sudharshan, Shahnawaz Kazi
21. Retinopathy of Prematurity: Diagnostic Procedures and Management ....353Yog Raj Sharma, Deependra Vikram Singh, Nikhil Pal, Rajani Sharma
22. Localization of Intraocular Foreign Body ............................................................362Amit Nagpal, Lingam Gopal
23. Comitant Strabismus: Diagnostic Methods ......................................................... 369Harinder Singh Sethi, Pradeep Sharma
24. Incomitant Strabismus .................................................................................................395S Meenakshi, T Surendran
25. Diagnostic Procedures in Dry Eyes Syndrome ..................................................405MS Sridhar
26. Evaluation of Epiphora ...............................................................................................412AK Grover, Rituraj Baruah
27. Diagnostic Techniques in Proptosis ...................................................................... 426Mandeep S Bajaj, Sanjiv Gupta
28. Neurological Disorders of Pupil .............................................................................441Ambar Chakravarty
Index .................................................................................................................................................. 461
xviii Diagnostic Procedures in Ophthalmology

1Visual Acuity
Vision is the most important of all senses.Approximately 80% of the information from theoutside world is incorporated through the visualpathway. Loss of vision has a profound effecton the quality of life.
The process of vision includes:1. Central resolution (visual acuity)2. Minimal light sensitivity3. Contrast sensitivity4. Detection of motion5. Color perception6. Color contrast7. Peripheral vision (spatial, temporal and
motion detection).In the normal clinical settings, we measure
only one of these functions – central resolutionat high contrast (visual acuity).1
Definition and Terminology ofVisual AcuityThe most basic form of visual perception isdetection of light. Visual acuity is more than justdetecting light. It is the measurement of the abilityto discriminate two stimuli separated in spaceat high contrast compared with the background.The minimal angle of resolution that allows a
human optic system to identify two points asdifferent stimuli is defined as the threshold ofresolution. Visual acuity is the reciprocal of thethreshold of resolution.2 Clinically, discrimina-ting letters in a chart determine this, but thistask also requires recognition of the form andshape of the letters, which are processes thatalso involve higher centers of visual perception.
Discrimination at a retinal level may, there-fore, be determined by less complex stimuli, suchas contrast sensitivity gratings. Theoretically, themaximum resolving power of the human retinacould be derived from an estimate of the angleof approximately 20 seconds of arc because thisrepresents the smallest unit distance betweentwo individually stimulated cones. Thus theresolving power of the eye could be muchgreater than what is measured by visual acuitycharts.3
Cones have the highest discriminatorycapacity, but rods can also achieve someresolution. The greater the distance from the foveathe level of visual acuity falls off rapidly. At a5° distance from the foveal center, visual acuityis only one quarter of foveal acuity.4 Luminanceof test object, optical aberrations of the eye andthe degree of adaptation of the observer alsoinfluence the visual acuity.5
STEPHEN C HILTON, LEELA V RAJU, VK RAJU
Visual Acuity1

2 Diagnostic Procedures in Ophthalmology
Visual thresholds can be broadly classifiedinto three groups:
1. Light discrimination (minimum visible,minimum perceptible)
2. Spatial discrimination (minimum separable,minimum discriminable)
3. Temporal discrimination (perception oftransient visual phenomena such asflickering stimuli).
Many clinical tests can assess many visualfunctions simultaneously. In a healthy observerin best focus, the resolution limit, or as it isusually called, the minimum angle of resolution(MAR), is between 30 seconds of arc and oneminute of arc. Clinically, we use Landolt C andSnellen E to assess visual acuity. The minimumdiscriminable hyper-acuity or vernier-acuity isanother example of spatial discrimination. Theeye is capable of subtle discrimination in spatiallocalization, and can detect misalignment of twoline segments in a frontal plane if these segmentsare separated by as little as three to five secondsof arc, considerably less than the diameter ofa single foveal cone. The mechanism subservinghyper-acuity is still being investigated.
Charts and Scales to RecordVisual AcuityThe function of the eye may be evaluated by anumber of tests. The cone function of the foveacentralis is assessed mainly by measurement ofthe form sense, the ability to distinguish the shapeof objects. This is designated as central visualacuity. It is measured for both near and far,with and without the best possible correctionof any refractive error present. Because onlycones are effective in color vision and becausethey are concentrated in the fovea, themeasurement of the ability to recognize colorsis also a measurement of foveal function.The function of the peripheral retina which
contains mainly rods, may be assessed byperipheral visual field.1
Visual acuity is the first test performed afterobtaining a careful history. Measurement of thecentral visual acuity is essentially an assessmentof the function of the fovea centralis. An objectmust be presented so that each portion of it isseparated by a definite interval. Customarily, thisinterval has become one minute of an arc, andthe test object is one that subtends an angle offive minutes of an arc. A variety of test objectshas been constructed on this principle, so thatan angle of five minutes is at distances varyingfrom a few inches to many feet5 (Figs 1.1 and1.2). The most familiar examination chart isSnellen chart (Fig. 1.3). Conventionally, readingvision is examined at 40 cm (16 inches). Thetesting distance of a preferred near distance chart
Fig. 1.1: Snellen letters subtend one minute of arc ineach section, the entire letter subtends five minutes ofarc
Fig. 1.2: Each component of Snellen letters subtend oneminute of visual angle the entire letter subtends five minutesof visual angle at stated distance

3Visual Acuity
should be observed accurately. The Snellennotation is simply an equivalent reduction fornear, maintaining the same visual angle. Mostof the Snellen-based distance acuity charts arealso commercially available as ‘pocket’ chartsto check the near acuity at a preferred distancefor every patient or at a defined distance forclinical trial purposes including ETDRS (Fig. 1.4)and Snellen letter “E”.
The Jaeger notation is a historic enigma andJaeger never committed himself to the distanceat which the print should be used. The numberson the Jaeger chart simply refer to the numberson the boxes in the print shop from which Jaeger
selected his type sizes in 1854. They have nobiologic or optical foundation. Clinically, Jaeger’scharts (Fig. 1.5) are widely used.
Central visual acuity is designated by twonumbers. The numerator indicates the distancebetween the test object and the patient; thedenominator indicates the distance at which thetest object subtends an angle of five minutes.In the United States these numbers are givenin inches or feet, whereas in the Europe thedesignation is in meters.
The test chart commonly used in the UnitedStates has its largest test object one that subtendsan angle of five minutes at a distance of 200feet (6 m). Then there are test objects of 100, 80,70, 60, 50, 40, 30, 20 and 15 feet. If the individualis unable to recognize the largest test object, thenhe or she should be brought closer to it, andthe distance at which he or she recognizes itshould be recorded. Thus, if the individualrecognizes the test object that subtends a fiveminute angle at 200 feet when he or she is at12 feet, the visual acuity is recorded as 12/200.This is not a fraction but indicates two physical
Fig. 1.3: Snellen chart
Fig. 1.4: ETDRS chart

4 Diagnostic Procedures in Ophthalmology
Fig. 1.5A: Jaeger's type near vision chart

5Visual Acuity
Fig. 1.5BFig. 1.5B: Near vision chart: Music type and numericals

6 Diagnostic Procedures in Ophthalmology
measurements, the test distance and the size ofthe test object.
The most familiar test objects are letters ornumbers. Such tests have the disadvantage ofrequiring some literacy on the part of the patient.Additionally, there is a variation in their abilityto be recognized. “L” is considered the easiestletter in the alphabet to read and “B” is consideredthe most difficult. To obviate this difficulty, brokenrings (Fig. 1.6) have been devised in which thebreak in the ring subtends one minute angle,and the ring subtends a five minute angle.Similarly, the letter “E” may be arranged so thatit faces in different directions (Fig. 1.6). Thesetest objects are easier to see than letters, eliminatesome of the difficulties inherent in reading, and
can be used in the testing of illiterates andpersons not familiar with the English alphabet.A variety of pictures (Fig. 1.6) have also beendesigned for testing the visual acuity of children.
When a person is unable to read even a topletter, he or she is asked to move toward the chartor a chart can be brought closer. The maximumdistance from which he or she recognizes the topletter is noted as the nominator. When visual acuityis less than 1/60, the patient is asked to countfingers from close at hand (CF at 20 cm). When apatient cannot even count fingers, the patient isasked if he or she can see examiner’s handmovements (HM positive). When hand move-ments are not seen we have to record whether theperception of light (LP) is present or absent byasking the patient if he or she sees the light.
Standard illumination should be used for theacuity chart (10 to 20 foot candles for wall charts).When a patient is examined with the Snellenchart in a dark room, the subject sees a highcontrast and glare-free target. But in realcircumstances, contrast and glare reduce visualacuity, and even more so in a pathologicalconditions. The contrast sensitivity function ofa subject may be affected even when Snellenacuity is normal. The contrast sensitivity testsare more accurate in quantifying the loss of visionin cases of cataracts, corneal edema, neuro-ophthalmic diseases, and retinal disorders. Apatient with a low contrast threshold has a highdegree of sensitivity; therefore, a healthy youngsubject may have a threshold of 1%, and a contrastsensitivity of 100% (inversely proportional). Itis important to have adequate lighting whentesting visual acuity so that it does not becomea test of contrast sensitivity.
Factors Affecting Visual AcuityFactors affecting visual acuity may be classifiedas physical, physiological and psychological.
Fig. 1.6: Broken C, letter E and pictures of familiar objectsfor testing visual acuity in illiterates and children

7Visual Acuity
Uncorrected refractive error is a common causeof poor acuity.
Physical factors include illumination andcontrast. Increased illumination increases visualacuity from threshold to a point at which nofurther improvement can be elicited. In theclinical situation this is 5-20 foot candles. Whencontrast is reduced more illumination is requiredto resolve an object. Beyond a certain point,illumination can create glare. Therefore, visualacuity is recorded under photopic condition andone wants to evaluate best visual acuity at thefovea.
Physiological conditions include pupil size,accommodation, light-dark adaptation and age.2
Pupil Size
The pupil size has great influence on visual acuity.Visual acuity decreases if pupils are smaller than2 mm due to diffraction. Pupil diameters largerthan 3.5 mm increase aberration. Variation inpupil size changes acuity by altering illumination,increasing depth of focus, and modifying thediameter of the blur circle on the retina.
Accommodation
An accommodation creates miosis, which couldaccount for small hyperopic prescriptions beingrejected for distance viewing in youngerindividuals.
It is worth while to discuss the role of a pinholein obtaining the best visual acuity in the clinicalsetting. The optimum pinhole is 2.5 mm indiameter. A pinhole in an occluder (Fig. 1.7) maybe introduced in a trial frame with the oppositeeye occluded. Single pinhole device is notadequate. The patient must be able to find a hole,therefore, multiple pinholes are preferred. If thepatient is older or infirm, or has tremors, he isasked to read only a single letter from each lineas we proceed down the chart to record the vision.
Many patients have been referred for neuro--ophthalmologic consultation because ofpainless loss of vision in one eye only. The bestvisual acuity may be 20/60 in the affected eyebut when properly tested with the pinhole, theacuity may improve to 20/20. This indicates thatthe macula and optic nerve are functioningnormally. When the patient’s vision is improvedwith pinhole one knows the problem is a refractiveone and simply need the change in glasses. Ifthe patient’s vision is less when looking throughthe pinhole; it indicates that the patient has eitheran organic lesion at macula, or a central scotoma,or functional amblyopia. A patient with 20/400vision that improves with pinhole to 20/70indicates that the improvement is refractive, butsome pathology may also be present.
Figs 1.7A and B: Occluder with multiple holes
A
B
8 Diagnostic Procedures in Ophthalmology
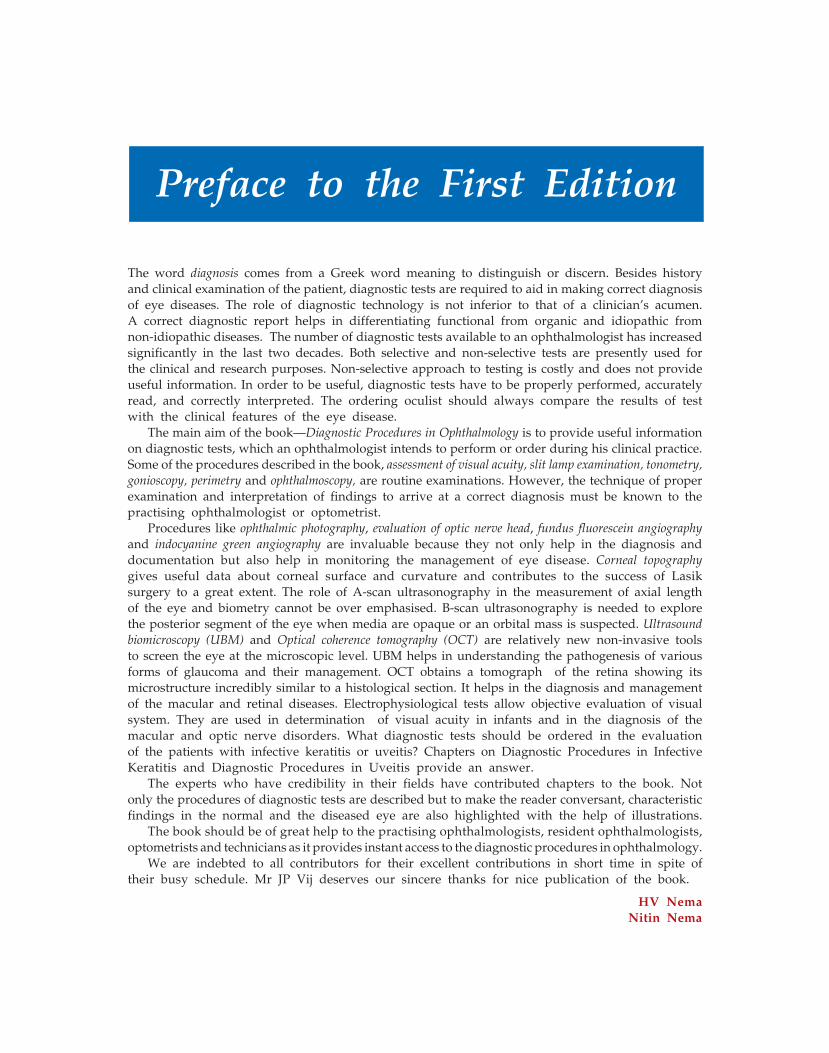
Visual Acuity Testing in YoungChildrenEarly determination of vision loss and refractiveerror is an essential component of assessing theinfant’s ultimate visual development potential.The visual acuity of a newborn as measured bypreferential looking is in the range of 30 minutesof arc (20/600); acuity rapidly improves to sixminutes of arc (20/120) by three months. A steadybut modest improvement to approximately threeminutes of arc (20/60) occurs by 12 months ofage. One minute of arc (20/20) is usually obtainedat the age of three to five years.6
The examination is generally performed onthe parent’s lap. The room should never be totallydarkened because this may provoke anxiety.Objective retinoscopy remains the best methodof determining a child’s refraction.
Other clinical methods involve estimation offixation and following behavior. A test targetshould incorporate high contrast edges. Forinfants younger than six months the best targetrepresents the examiner’s face. For the child ofsix months and older, an interesting toy can beused. After assessment of the binocular fixationpattern, the examiner should direct attention todifferences between the two eyes when testedmonocularly. Objection to occlusion of one eyemay suggest abnormality with the less preferredeye.7
Three common methods are used fordetermining resolution acuity:
1. Behavioral technique (preferential lookingFig. 1.8)
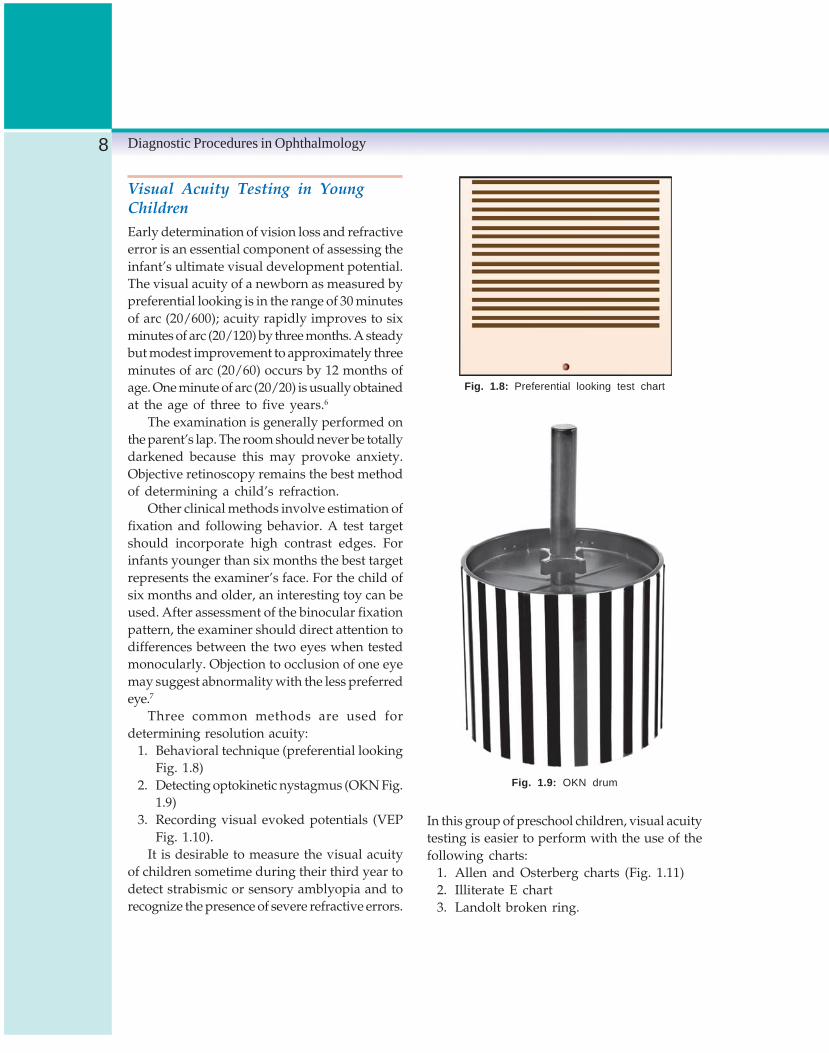
2. Detecting optokinetic nystagmus (OKN Fig.1.9)
3. Recording visual evoked potentials (VEPFig. 1.10).
It is desirable to measure the visual acuityof children sometime during their third year todetect strabismic or sensory amblyopia and torecognize the presence of severe refractive errors.
Fig. 1.8: Preferential looking test chart
Fig. 1.9: OKN drum
In this group of preschool children, visual acuitytesting is easier to perform with the use of thefollowing charts:
1. Allen and Osterberg charts (Fig. 1.11)2. Illiterate E chart3. Landolt broken ring.

9Visual Acuity
Contrast is defined as the ratio of the differencein the luminance of these two adjacent areasto the lower or higher of these luminance values.The amount of contrast a person needs to seea target is called contrast threshold.
The contrast sensitivity is assessed by usingthe contrast sensitivity chart. It has 5-8 differentsizes of letters in six or more shades of gray.Some contrast sensitivity charts contain a seriesof alternating black and white bars; 100 line pairsper mm is equivalent to space of one minutebetween two black lines. The alternating barpattern is described as spatial frequency. Thecontrast sensitivity is measured in units of cyclesper degrees (CPD). A cycle is a black bar andwhite spaces. To convert Snellen units to unitsof cycles per degree, divide 180 by Snellendenominator. Contrast sensitivity measurementsdiffer from acuity measurements; acuity is ameasure of the spatial resolving ability of thevisual system under conditions of very highcontrast, whereas contrast sensitivity is ameasure of the threshold contrast for seeing atarget.8
Visual Acuity in Low VisionPatientsIndividual near acuity needs are different amongdifferent population groups. For low visionpatients these differences are magnified. Twopersons with the same severe visual impairmentmay exhibit marked differences in their abilityto cope with the demands of daily living. Visualacuity loss, therefore, is the aspect that must beaddressed in individual rehabilitation plans.Colenbrander9 subdivides several componentsof visual loss into impairment aspects (how theeye functions), visual ability (how the personfunctions in daily living), and social/economicaspects (how the person functions in society(Table 1.1).
Fig. 1.10: VEP testing
Fig. 1.11: Allen and Osterberg chart
Contrast SensitivityA general definition of spatial contrast is thatit is a physical dimension referring to the light-dark transition at a border or an edge of an imagethat delineates the existence of a pattern or object.

10 Diagnostic Procedures in Ophthalmology
TAB
LE 1
.1:
RA
NG
ES
AN
D A
SP
EC
TS O
F V
ISIO
N L
OS
S
Impa
irmen
t as
pect
sV
isua
l ab
ility
asp
ects
/func
tiona
l vi
sion
Soc
ial
and
econ
omic
asp
ects
(how
the
eye
fun
ctio
n)(h
ow t
he p
erso
n fu
nctio
ns-d
aily
liv
ing
skill
s)(h
ow t
he p
erso
n fu
nctio
ns i
n so
ciet
y)
Ran
ges
Vis
ual
New
sprin
tS
tatis
tical
est
imat
eV
AS
Com
men
ts(I
CD
-9-C
M)
acui
ty(1
M)
of r
eadi
ng a
bilit
yV
isua
l ai
ds
Nor
mal
vis
ion
20/1
2.5
63in
Nor
mal
rea
ding
spe
edN
one
110
Not
e th
at n
orm
al a
dult
20/1
650
inN
orm
al r
eadi
ng d
ista
nce
105
visi
on i
s be
tter
than
20/
2020
/20
40in
Res
erve
cap
acity
for
100
20/2
532
insm
all
prin
t95
Mild
vis
ion
loss
20/3
225
inN
orm
al r
eadi
ng s
peed
90M
any
func
tiona
l cr
iteria
20/4
020
inR
educ
ed r
eadi
ng d
ista
nce
85(w
heth
er f
or a
driv
er’s
20/5
016
inN
o re
serv
e fo
r sm
all
80lic
ense
or
for
cata
ract
20/6
312
.5in
75su
rger
y) f
all
with
in t
he r
ange
Mod
erat
e vi
sion
los
s20
/80
10in
Nea
r-no
rmal
with
Vis
ion
70In
the
Uni
ted
Sta
tes,
20/1
008i
nap
prop
riate
rea
ding
aid
sen
hanc
emen
ts65
child
ren
in t
his
rang
e qu
alify
for
20/1
256i
nLo
w-p
ower
mag
nifie
rsai
ds60
spec
ial
educ
atio
nal
assi
stan
ce20
/160
5in
and
larg
e-pr
int
book
s55
Sev
ere
visi
on L
oss
20/2
004i
nS
low
er t
han
norm
al w
ith50
In t
he U
nite
d S
tate
s,20
/250
3in
read
ing
aids
45pe
rson
s in
thi
s ra
nge
20/3
202.
5in
Hig
h-po
wer
mag
nifie
rs40
are
cons
ider
ed l
egal
ly20
/400
2in
(res
tric
ted
field
)35
blin
d an
d qu
alify
for
tax-
brea
k di
sabi
lity
bene
fits.
Pro
foun
d vi
sion
los
s20
/500
1.6i
nM
argi
nal
with
aid
s30
In t
he E
U,
man
y be
nefit
s20
/630
1.2i
nU
ses
mag
nifie
rs f
or s
pot
25st
art
at t
his
leve
l. T
he20
/800
1in
read
ing,
but
may
pre
fer
20W
HO
inc
lude
s th
is r
ange
20/1
000
talk
ing
book
s fo
r le
isur
e15
in i
ts b
lindn
ess
cate
gory
.
Nea
r-bl
indn
ess
20/1
250
1cm
No
visu
al r
eadi
ngV
isio
n10
In t
his
rang
e, r
esid
ual
visi
on20
/160
01c
mm
ust
rely
on
talk
ing
subs
titut
ion
5te
nds
to b
ecom
e un
relia
ble,
20/2
000
1cm
book
s or
oth
erai
ds0
thou
gh i
t no
nvis
ual
sour
ces
may
still
be
used
as
an a
djun
ct t
ovi
sion
sub
stitu
tion
skill
s.
Tot
al B
lindn
ess
NLP
(Fro
m C
olen
bran
der
A.
Pre
serv
atio
n of
vis
ion
or p
reve
ntio
n of
blin
dnes
s [e
dito
rial]?
Am
J O
phth
alm
ol 2
002;
133:
2. p
.264
.)

11Visual Acuity
SummaryBoth distance and near visual acuities arerecorded for each eye with and without spectacles.Distance visual acuity is recorded at a distanceof 20 feet or in a room of at least 10 feet usingmirrors and projected charts. Near visual acuitycan be recorded using reduced Snellen orequivalent cards at 40 cm. Acuity performance,like any other human performance, is subjectto impairment depending on ocular and generalhealth, emotional stress, boredom, and a varietyof drugs acting both peripherally and centrally.The examiner must provide encouragement andmust have patience.
For clinical studies the ETDRS charts arerecommended because near vision is often moreimportant in the daily life of older or infirmpatients. Reading charts or other near visiontesting charts should be used as part of the routineassessment of the visual acuity. Visual acuitymeasurement is often taken for granted. Manypitfalls make this most important assessmentsubject to variability.10Ambient illumination,aging bulbs, dirty charts or slides, small pupils,and poorly standardized charts are just
some of the factors that can lead to erroneousresults. A little care in ensuring the properenvironment for testing can significantly improveaccuracy.
References1. Newell FW. Ophthalmology Principles and
Concepts. St Louis, Mosby, 1969.2. Moses RA (Ed). Adlers Physiology of the Eye.
St Louis, Mosby, 1970.3. Scheie H. Textbook of Ophthalmology.
Philadelphia, WB Saunders, 1977.4. Duane TD. Clinical Ophthalmology. New York,
Harper and Row, 1981.5. Michaels DD. Visual Optics and Refraction. St
Louis, Mosby, 1985.6. Vander J. Ophthalmology Secrets. Hanley and
Belfus.7. Borish I. Clinical Refraction. Professional
Publisher, 1970.8. Owsley C. Contrast Sensitivity. Ophthalmic
Clinics of North America 2003;16:173.9. Colebrander A. Preservation of Vision or
Prevention of Blindness? Am J Ophthalmol 2003;133:263.
10. Kniestedt, Stamper RL. Visual Acuity and itsMeasurements. Ophthalmic Clinics of NorthAmerica 2003; 16:155.

12 Diagnostic Procedures in Ophthalmology
HARINDER SINGH SETHI
Color Vision andColor Blindness2
Color vision examination is an essential partof screening before a person is taken up for ajob. A person who is color vision defective maygo through life quite unconscious of his colordeficiency and without making any incrimi-nating mistakes, differentiating objects by theirsize, shape and luminosity, using all the timea complete color vocabulary based on hisexperience which teaches him that color termsare applied with great consistency to certainobjects and to certain achromatic shades, untilcircumstances are arranged to eliminate theseaccessory aids and then he realizes that hissensations differ in some way from the normal.Various tests have been developed to enablescreening of anomalous subjects with colordeficiency from a much larger group of normalsubjects.
Color VisionColor is a sensation and not a physical attributeof an object. Color is what we see and is resultof stimulation of retina by radiant energy in asmall band of wavelengths of the electromagneticspectrum usually considered to span about oneoctave, from 380 nm to 760 nm. There are three
main characteristics of color namely hue,saturation, and brightness. Hue is a functionof wavelength. It depends on what the eye andbrain perceive to be the predominant wavelengthof the incoming light. An object’s “hue” is its“color.” Saturation refers to the richness of ahue as compared to a gray of the same brightness.Saturation is also known as “chroma.” Brightnesscorrelates to the ease with which a color is seen,other factors being equal. Brightness is asubjective term referring to the sensationproduced by a given illuminance on the retina.
The spectral wavelengths of different colorsare as follows: violet 430 nm; blue 460 nm; green520 nm; yellow 575 nm; orange 600 nm and red650 nm. The concept of white light is vague,most agreeable definition is, white surface is onewhich has spectral reflection factors independentof wavelength (in the visible spectrum) andgreater than 70%.
Factors Affecting Color Vision
Crystalline Lens
The lens absorbs shorter wavelengths; in young,wavelengths of less than 400 nm and in oldpeople up to 550 or 600 nm are absorbed by

13Color Vision and Color Blindness
the lens resulting in defective color vision onshorter wavelength side.
Retinal Distribution of Color Vision
The center of the fovea (1/8 degree) is blue blind.Trichromatic vision extends 20-30° from the pointof fixation. Peripheral to this red-green becomeindistinguishable up to 70-80° and in farperipheral retina all color sense is lost althoughcones are still found in this region. In the central5°, macula contains carotenoid pigment,xanthophyll. The molecules of the pigment arearranged in such a way that they absorb bluelight polarized in the radial direction. If one looksat a white card through linear polarizer, onewill see two blue sectors separated by two yellowsectors the figure is called Haidinger’s brushes.Macular pigment may also be seen as inhomogeneity in the field of blue or white lightcalled Maxwell’s spot.
Wavelength Discrimination
The normal observer is able to detect a differencebetween two spectral lights that differ by as littleas 1 nm in wavelength in the regions of490 nm and 585 nm. In the region of violet andred a difference of greater than 4 nm is necessary.
Hue, Saturation and Lightness
Hue is the extent to which the object is red, green,blue or yellow. Saturation is the extent to whicha color is strong or weak. Lightness is selfexplanatory attribute, for example, yellow by coloris light.
Illumination
Illumination affects color vision of lowilluminances, the errors increase due to poorerdiscrimination for most of the hue range while
testing color vision. An illuminance of 400 lux(± 100 lux) would be practical value for mostclinical applications.
Bezold-Burcke Effect
von Bezold (1873) and Burcke (1878) discoveredindependently the phenomenon named afterthem, that variation of the luminance levelsmodifies hues.
Color Constancy; Aperture Colors andSurface Colors
Color constancy is a phenomenon in which colorof the objects can be recognized unchanged inspite of possible differences in the illumination.Aperture colors are colors that alter due to changein illumination. Surface colors do not vary withillumination. Extrafoveal vision favors theappearance of aperture colors and foveal visionthat of surface colors.
Complementary Wavelengths
Complementary wavelengths are those which,when mixed in appropriate proportions, givewhite.
Simultaneous Color Contrast
Color contrast is visually demonstrated byobserving the color of a spot in a surround. Thegeneral rule is that the color of the spot tendstoward the complementary of the color of thesurround.
Successive Color Contrast
Successive color contrast is more commonlydescribed as colored after images, when onestares at a red spot for several seconds and thenlooks at a gray card one sees a green spot on

14 Diagnostic Procedures in Ophthalmology
the card. The after image tends toward thecomplementary of the primary image (Stiles-
Crawford effect). The light entering near the edgeof the pupil is less effective than light enteringat the center of the pupil because of the shapeof the receptors and the fact that they areembedded in a medium of different refractiveindex. This effect is wavelength-dependent.
Color Triangle
Color triangle can be drawn to describe thetrichromacy of color mixtures and is useful fordeciding which bands of wavelength areindistinguishable from each other. Three referencewavelengths are chosen, i.e. 450 nm, 520 nmand 650 nm and are placed at vertices of X, Yand Z of a triangle, the position of otherwavelengths is determined. A color triangle doesnot describe the color of a band of wavelengthsunless other circumstances are defined.
Theories of Color Vision
This is a complex topic as no theory explainsthe phenomenon of color vision fully. Fewimportant theories are given below:
Young-Helmholtz Theory (TrichromaticTheory)
Young’s concept is that there are three types ofretinal receptors with different spectralsensitivities. Young’s principal colors are red,green and violet. Young’s hypothesis was notfollowed up until it was revived by Helmholtzin 1852. The Young’s theory may be summarizedas follows:
a. At some stage of visual receptor mechanismthere are three different types of sensoryapparatus G1, G2, G3. These receptors mustbe same for everyone but they may not besame at the fovea as at the periphery.
b. Each of these receptors is characterized fromthe spectral point of view by particularfunction of wavelengths which may bedenoted by G and the response G1 of areceptor for radiation with a spectral energydistribution Eλ may be supposed to havethe form.
G1 = Sgi Eλ dλ.c. Sensation of color is a function of the relative
values of the three responses G1.d. Sensation of light is a function of a linear
combination of the three responses.
Fundamental sensations
By determining approximately the coordinate ofthe confusion points of dichromats Arthur Konigin1893 established a system of fundamentalsensations and identified red, green and violetas fundamental colors. Blue was also identifiedas fundamental color in addition to red and greenby Gothelin.
Granit’s Theory of Color Vision
Granit divides retina into receptor units, eachunit comprising groups of cones and rods whichare connected with a single ganglion cell orseveral ganglion cells which synchronize theirdischarges. These units are classified as“dominators” or “modulators”. The dominatorswhich are numerous have a spectral sensitivitycurve which indicates that they are responsiblefor the sensations of luminosity. Modulatorsshow a selective sensitivity which makes themresponsible for color discrimination. Granit’stheory does not explain the fact of trichromatism.
Hering’s Theory of Color Vision(Opponent Color Theory)
Hering assumed six distinct sensations arrangedin three opposing pairs: white-black; yellow-blueand red-green; he explains three pairs as being

15Color Vision and Color Blindness
due to opposing actions of light on threesubstance of the retina, a catabolism producingwarm sensation (white, yellow, red) and ananabolism the cold ones. This theory is clearlya psychological concept and aims at explainingcomplex percepts than the intermediate effect ofthe stimuli.
Anatomy of Color Vision
The understanding of visual pathway is complexand not evident fully. There are two types ofphotoreceptors in the retina: rods and cones.Approximately 120 million rods are responsiblefor night and peripheral vision. Rods containa photopigment called rhodopsin, a chemicalvariant of vitamin A and a protein called opsin
that serves at very low levels of illumination.Rods have their maximum density about 5degrees from the fovea and cannot distinguishone color from another. The fovea itself isessentially rod-free containing only cones.Approximately 7 million cones are responsiblefor central and color vision. Cones have theirmaximum density within 2 degrees of the centerof the fovea. Both types of receptors diminishin number toward the retinal periphery.
Cones
In the retina three types of cones responsiblefor the red, green and blue sensations have beenisolated. Three types of cone pigments in thehuman retina absorb photons with wavelengthsbetween 400 nm and 700 nm. Color vision ismediated by these three cone photoreceptorsreferred to as long, middle, and short wavelength-sensitive (LWS, MWS, SWS) cones. The longwavelength-sensitive (LWS) cones (sometimescalled “red” or “red-catching”) contain a pigmentcalled erythrolabe, which is best stimulated bya wavelength near 566 nm. Medium wavelength-sensitive (MWS) cones (“green” or “green-
catching”) contain the pigment chlorolabe, whichhas a maximal sensitivity to a wavelength near543 nm. Short wavelength-sensitive (SWS) cones(“blue” or “blue-catching”) contain cyanolabe,which have maximal sensitivity at 445 nm. Theblue cones are absent in the center of the macula.Trichromatic vision perception occurs in central30º field. It is not uncommon to hear the conesreferred to as blue, green, and red cones, butsuch nomenclature is misleading because theL-cones are more sensitive to blue lights thanthey are to red lights. The spectral sensitivitiesof the three cone pigments overlap somewhat.For example, light of 540 nm and 590 nmstimulate both green (MWS) and red (LWS)receptors yet we can easily distinguish betweenthese two wavelengths as “green” and “yellow.”If the human retina contains all three conepigments in normal concentrations, and hasnormal retinal function, the subject is atrichromat. Any color the trichromat sees canbe matched with a suitable mixture of red, green,and blue light.
Color Coded Cells
Two types of color coded cells are found atperipheral levels (ganglion cells and lateralgeniculate body) of the visual system and theyhave been named opponent color cells and doubleopponent color cells. More complex types arefound at more central levels (striate cortex).
Opponent color cells: An opponent color cell isone that gives only polarity of response for somewavelengths and opposite polarity of responsefor other wavelengths. Opponent color cells areconcerned with successive color contrast.
Double opponent color cells: These are cellsopponent for both color and space. The responsemay be onto red light, off to green light in thecenter of the receptive field and off to red light,onto green light in the periphery of the receptive

16 Diagnostic Procedures in Ophthalmology
field. Double opponent cells are concerned withsimultaneous color contrast.
Simple, complex and hypercomplex cells: In rhesusmonkey striate cortex there are a variety of cellsthat are specific for both color and orientation.They have been categorized as color sensitivesimple, complex and hypercomplex cells. Simplecells have a bar-flank double opponent arrange-ment to their receptive fields. Complex color codedcells respond to color boundaries of the appro-priate orientation and the response is indepen-dent of the part of the receptive field being sti-mulated. The edge of hypercomplex cells mustbe short.
Opponent color cells are found amongganglion cells of the retina and lateral geniculatebody. Double opponent cells with center-surround or flank receptive fields are presentin the input layer IV of the striate cortex. Complexand hypercomplex color coded cells are alsofound in the striate cortex in layers II, III, V andVI. Vaetichin in 1953 recorded a negative slowpotential from fish retinae called “S-potential”of two types: L-type (luminosity type) and C-type (chromaticity type). Mitarai in 1961 regardedhorizontal cells as responsible for S-potentialsof L-type and Muller’s fibers for those of C-type.The properties of S-potentials support the Heringsopponent color theory more than the trichromatictheory of Young.
Anomalies of Color Vision
Deficiency of color vision first was described byDalton in1794, the founder of the atomic theory,who himself was color blind; hence the termdaltonism was coined. The color deficiency is oftwo types: (1) congenital and (2) acquired. Inclinical evaluation of color vision it is importantto distinguish between acquired and congenitaldefects.
Congenital vs Acquired ColorDeficiencies
Congenital color vision deficiencies can bedistinguished functionally from acquireddeficiencies in a number of ways. Congenitaldeficiencies typically involve red-green confu-sions, whereas acquired deficiencies, more oftenthan not, are a blue-yellow (Köllner’s rule). Also,because some of the most common congenitaldefects are linked to the X-chromosome, they aremore prevalent in males than females. Acquireddefects, in contrast, are not related to genderexcept by gender differences to trauma or toxicexposure. Acquired color deficiencies are morelikely to be asymmetric between the two eyesthan are hereditary defects; they are also lesslikely to be stable with time. Congenital defectsare usually easier to detect with standard clinicalcolor vision tests, but some acquired ones canbe more subtle and thus are difficult to diagnose.Finally, those with acquired color deficienciesare also more likely to display color-namingerrors because, unlike those with congenitaldeficiencies, they lack the life-long experiencewith defective color perception.
Congenital Color Vision Deficiency
The color vision anomalies commonly beingX-linked are relatively common (8%) in men andrare in women (Fig. 2.1). Nearly all congenitalcolor defects are due to absence or alteration ofone of the pigments in photoreceptors. Congenitalcolor deficits may be divided into classesaccording to whether the patients are red deficient(protans), green deficient (deuterans) or bluedeficient (tritans). The term anopia is used forabsolute deficiency and anomaly for relativedeficiency (Tables 2.1 and 2.2).
Anomalous trichromats are people whogenerally require three wavelengths to match

17Color Vision and Color Blindness
TABLE 2.1: CLASSIFICATION OF COLOR BLINDNESS
Congenital: Males (8%), Females (0.4%) Acquiredclassically X-linked recessive inheritance Unilateral Red-green defectpattern, always bilateral Blue-Yellow defect(a) Achromatopsia Bilateral Red-green defect
Cone monochromats Blue-Yellow defectRod monochromats
(b) DyschromatopsiaDichromats - Deuteranopia Disease Acquired defect
- Protanopia Glaucoma Blue-Yellow- Tritanopia Hypertensive retinopathy Blue-Yellow
Diabetic retinopathy Blue-YellowAnomalous trichromats AMD Blue-Yellow
- Protanomaly Lesions of visual pathway Red-Green- Deuteranomaly Alcohol-nicotine Red-Green- Tritanomaly
TABLE 2.2: VARIOUS TYPES OF COLOR DEFICIENCY
Red deficient Green deficient Blue deficient
Anomalous trichromats Protanomaly Deuteranomaly TritanomalyDichromats Protanopia Deuteranopia TritanopiaMonochromats Rod monochromat Blue monochromat
Fig. 2.1: Inheritance pattern of congenital colorvision defects
another wavelength but do not accept the colormatches made by normal people, Lord Rayleighin 1881 discovered trichromacy. Anomaloustrichromats have three classes of cones but oneis abnormal. Protanomalous people lack the redreceptors and instead they have two pigmentsboth peaking in the range of the normal green.Similarly the deuteranomalous people lack greenreceptors.
Dichromats require only two wavelengths tomatch another wavelength and will accept thecolor matches made by normal people. Thedichromats have two classes of cone receptorswith normal spectral sensitivity, the third classbeing absent. Measurements of their pigmentscan be made by reflection densitomer and coneprocesses isolated by colored backgroundsconfirm the findings. Protanopes have normalgreen and blue cones, red cones being absent.Deuteranopes have normal red and blue conesand tritanopes normal red and green cones.

18 Diagnostic Procedures in Ophthalmology
Protans color deficient subjects are easier totest and classify than deuterans and tritans;because the red cone pigment is quite sensitiveto green wavelengths and both red and greencone pigments are quite sensitive to bluewavelength covering the green and blue range,in deuterans and tritans, as the sensitivity ofvisual pigment does not fall off sharply on theshort wavelength side of the peak.
Monochromatics can be blue cone mono-chromatics and rod monochromatics. Blue conemonochromatics have normal blue cone pigmentbut no red or green cone pigment. In rodmonochromatism only 500 nm pigment is presentin the retina and all three cones pigments areabsent.
Genetics of congenital color deficiencies
The protans and deuterons are commonly sex-linked recessive. About 1% males are protanopes,1% protanomalous, 1% deutaranopes and 5%deuternomalous. The incidence of color visiondeficiency (red-green) in females is 0.4%. Thegene for tritans is autosomal incompletelydominant. Rod monochromatism is very rare;occurs 1 in 30,000, autosomal recessive and thusan increased incidence is seen in consanguineousoffsprings.
Acquired Deficiency ofColor Vision
Koellner formulated that lesions in the outerlayers of the retina give rise to a blue-yellowdefect, while lesions in the inner layers ofthe retina and the optic nerve gives rise to redgreen defect. However, the correlation is notalways true. Some patients with lesions in thecerebral cortex may have color deficits. Thesemay involve naming of the colors or perceptionof colors.
Factors Responsible for Deficiency ofColor Vision
Ocular Diseases
a. Squint amblyopia: Francois by means of clini-cal tests stated that color vision deficienciesin squint amblyopia do not correspond tothe classical type of acquired deficienciesbut rather approximate the normal colorsense of eccentric retinal positions.
b. Glaucoma: Primary glaucoma and ocularhypertension cause tritan-type of defect.
c. Diabetic retinopathy: Diabetic retinopathymay cause color deficiency which may varyfrom a mild loss of hue discrimination tomoderate blue-yellow color vision defi-ciency. In severe cases of diabetic retinopathythe defect may resemble tritanopia.
d. Retinal disorders: Blue-yellow deficits arefound in senile macular degeneration,myopia, retinitis pigmentosa, siderosis bulbiand chorioretinitis.
e. Optic nerve disorders: In one study about 57%of patients with resolved optic neuritiswere found to have color vision defects.Red-green defects have been found in casesof multiple sclerosis and optic atrophy.Tobacco amblyopia causes red-greendefect.
f. Color vision after laser photocoagulation: Afterargon-laser photocoagulation there may beoverall loss of hue discrimination and colordeficiency, mostly of blue-yellow.
Drugs
Many drugs are known to cause deficiency ofcolor vision. They can cause more than one typeof color deficiency (Table 2.3).

19Color Vision and Color Blindness
TABLE.2.3: DRUGS CAUSING COLORDEFICIENCY
Drugs Type of colordeficiency
Chloroquine, Indomethacin, Blue-yelloworal contraceptives, antihistaminics,estrogens, digitalis and butazolidin.
Ethyl alcohol, Ethambutol Red-green
Tri- and bicyclic antidepressants Mixed type
Systemic Disorders
Besides diabetes, a few systemic disorders areknown to be associated with defective colorvision. Following diseases may cause colordeficiency:
a. Cardiovascular disease: Patients with heartdiseases have been found to have blue-yellow deficiency.
b. Turner’s syndrome: Red-green color deficiencyis usually encountered in the syndrome.
Color Vision TestingThe main objective for testing the color blindnessis to determine the exact nature of the defect andwhether the color deficiency is likely to be a sourceof danger to the community and/or to theindividual, if given a particular job.
Types of Color Vision Tests
Color Confusion Tests
Pseudo-isochromatic (PIC) plates are exampleof color confusion tests (Figs 2.2 and 2.3). PICTests are designed on the basis of the colorconfusions made by persons with color defects.In these a symbol or figure in one color is placedon a background of another color so that thefigure and background are isochromatic for thecolor-defective person. PIC tests are usedprimarily as screening tests to identify those withan inherited color defect, although, some of the
Figs 2.2A to C: A Ishihara pseudo-isochromatic plates,B Transformation plate seen as “3” by patients withanomalous red-green color defect, C “Vanishing” or“disappearing” digit type
A
B
C

20 Diagnostic Procedures in Ophthalmology
Fig. 2.3: City University test
tests permit a diagnosis of type and severity.Because the inventory of PIC tests is extensive,only the more commonly used tests are describedhere.
The most widely used test, Ishihara pseudo-isochromatic plates, is a screening test used todetermine the presence of X-linked congenital(red/green) color deficiency. Most screening testsare designed to give a quick, accurate assessmentof red/green deficiencies. The Ishihara test isnot designed to detect tritan disorders or acquiredcolor defects unless the optic neuropathy is severe.
Arrangement Tests
The arrangement tests require the observer toplace colored samples in sequential order on thebasis of hue, saturation, or lightness or to sortsamples on the basis of similarity. One of theearliest tests of this nature that is still availablebut is rarely used today is the Holmgren Wooltest. In this matching test, 46 numerically codedcomparison schemes of yarn are selected to matchthree test colors: yellow-green, pink, and darkred. The comparison schemes differ from the testschemes in being lighter or darker. The test is
not accurate for screening or classification andis not recommended for clinical use. It is ofhistorical significance as an early occupationaltest. The clinical arrangement tests that are inuse today are colored papers mounted in blackplastic caps. The caps are placed in orderaccording to specific instructions, and the orderis recorded as the sequence of numbers printedon the underside of the caps. Results are plottedon score forms for analysis and interpretationand quantitative scores computed. The tests arestandardized for CIE standard illuminant C.
The Farnsworth-Munsell Dichotomous-15(D-15) and the FM-100 test are examples of huediscrimination based on arrangement testsutilizing color chips mounted in a circular capthat subtend exactly 1.5 degrees at a test distanceof 50 cm. This ensures that the observations ofthe subject are made with the central rod freeretina. The D-15 contains 15 colored chips andthe FM-100 contains 85 chips. The chips haveidentical brightness and saturation and differfrom one another. Farnsworth-Munsell testsreveal the type of defect, but not the severity.
Color Matching Tests
The spectral anomaloscope and Pickford-Nicolson anomaloscope are used for colormatching examinations. They can provide theexaminer with information on the severity of aparticular color vision defect. The Nagel anoma-loscope is the most widely used. It consists ofa spectroscope in which two halves of a circularfield are illuminated respectively by monochro-matic yellow (589 nm) and a mixture ofmonochromatic red and green (670 nm and 546nm, respectively). The observer is asked to matchthe two halves of the circle with the three primarycolors available.
The most widely used color vision tests arethe pseudo-isochromatic plates and the D-15

21Color Vision and Color Blindness
panel due to their ease of use and relative lowcost. The Nagel anomaloscope and FM-100 testsare usually only found in academic or researchsettings.
All color vision tests have specific require-ments for lighting, viewing distance, and viewingtime. It is important for the examiner to be familiarwith the test requirements and score sheets beforeconducting a color vision test, otherwise theresults may be inaccurate.
Lantern Tests
Lantern tests are used only for occupationalpurpose. Different types of lantern tests are inuse in different countries. The FALANT is usedin the United States by marine and aviationauthorities; the Holmes Wright Type A is usedin the United Kingdom by aviation authorities;and the Holmes Wright Type B is used inAustralia, the United Kingdom and otherCommonwealth countries by marine authorities.The Edridge-Green Lantern is included in theUnited States Coast Guard requirements, but itis surpassed by the FALANT. Electroretino-graphy (ERG) and microspectrophotometry maybe used in special circumstances.
Test Conditions
Lantern testing is performed after dark adaptationbut all other tests require artificial daylight condi-tions. Light adaptation is critical for anomalo-scopy and especially for FM-100 hue testing, buta color neutral glare-free background and correctillumination are more important. Reliable resultscan be obtained with an artificial daylight source(such as a Macbeth Sol source) or fluorescentlighting with a color temperature between 5850and 6850 degrees Kelvin and good colorrendering index (Ra over 90). If appropriateartificial light is not available then skylight isa good source. The illumination should be
between 250 and 350 lux (approximately 1.5meters below twin fluorescent globe). A failedIshihara test under incandescent globe is a failureof the examiner to observe basic principles, nota failure of the subject. A pass on the other handis still a pass and is statistically the more likelyoutcome.
The viewing geometry should be with thelight 45 degrees to the surface and the subjectviewing the pages at 90 degrees to the surface.Newly printed books sometimes have differentialreflectance between pigments so when tilted backand forth in the light by an anomalous observerthey may provide luminance clues. Appropriateoptical correction for the 65 cm viewing distancemust be available if required. Experienced testersknow that some people read the small identifyingnumbers on the bottom of each page and givea memorized response. Cheating can be preventedby covering these identifying numbers with asecret label.
Clinical Significance of the VariousTests
Lantern testing is entirely vocational since around5% of males fail and these include all those witha severe anomaly but a relatively unpredictablegroup from those with the milder anomalies.Anomaloscopy is the gold standard for clinicaltesting, while the D-15 and FM-100 tests haveboth clinical and vocational applications(diamond sorters and croupiers).
A common vocational test battery shouldconsist of:• Ishihara plates 2 - 17 from the 38 plate series• D-15 color sorting test (3 or more cross over
errors is a failure)• Lantern testing.
Pseudo-isochromatic Color Plates
The most common use of plate tests is to identify

22 Diagnostic Procedures in Ophthalmology
persons with congenital color defects. Pseudo-isochromatic plates (for example, AO-HRR,Ishihara, Dvorine,Tokyo Medical College, SPP-1) provide efficient screening of congenital red-green defects (efficiency 90-95%). Other tests havebeen designed to detect achromatopsia (SloanAchromatopsia test), to differentiate incompleteachromatopsia from complete achromatopsia(Berson blue cone monochromatism plates), todetect acquired defects (SPP-2), or to detect colorconfusion (City University test). Plate tests havethe advantages of being relatively inexpensive,easily available, simple to use, and appropriatewith children and persons who are illiterate. Theyare only suitable for screening purpose, however,they neither provide a quantitative evaluationof color vision nor distinguish the type and severityof the color vision defect. Plate tests are designedto distinguish congenital color-defective fromcolor-normal observers, but they do not evaluatethe wide range of abilities and aptitudes ofobservers with normal color vision to distinguishcolors. Given individual differences inprereceptoral filters and normal photo pigmentpolymorphisms, no plate test can be 100% effectivein screening. When used improperly(nonstandard illuminant, binocular viewing,colored lenses not removed from observer), theirefficiency can diminish dramatically.
The viewing distance required for pseudo-isochromatic plates is 75 cm or approximately30 inches. Proper refractive correction shouldbe provided to the patient in order for them tosee the plates clearly. Viewing time for each plateshould be no more than 4 seconds. Unduehesitation can be a sign of a slight color deficiency.
Ishihara Pseudo-IsochromaticPlates (Confusion Charts)
The Ishihara color vision charts are developedby Shinobu Ishihara in 1917. This test is basedon the principle of confusion of the pigment
color in red-green color defectives (Fig. 2.2B).There are three editions –- a 16 plate series, 24plate series and a 38 plate series. The 10thedition of Ishihara has 38 plates. It is best to usethe larger series because there are relatively fewreliable plates in the smaller series. Both 24 setand 38 plate series set consist of two groups ofplates — a group for those who are literate /numerate which starts from plate 1 at the frontof the book, and a group for illiterates /innumerate in which the colored pattern is ameandering path of connected dots between twoX symbols. The second group is arranged so asto commence with the last page of the book andproceed in reverse order. The group of plates forinnumerate are seldom used because they arenot as easy or reliable to score, but they are basedon the same colorimetric principles as the set fornumerates. It is not necessary to use both typesin the one subject. From a colorimetric perspec-tive there are four different types of test plateemployed in both the 38 and 24 plate seriespreceded by a demonstration plate that is not forscoring. In the large series plates 1 and 38 areboth for demonstration only, while in the smallerseries plates 1 and 24 are for demonstration. Ifthe subject fails viewing the demonstration platedo not proceed with the test. The followingdescription applies to the numerate plates in the38 plate series. The different types of plates inthe test are:
Transformation plates (Fig. 2.2B): Anomalous colorobservers give different responses to color normalobservers. In these plates, one number is seenby a normal trichromat and another (different)number is seen by a color deficient person. Thosewith true total color blindness cannot read anynumeral. These are the plates numbered 2 to 9inclusive.
Disappearing digit (Vanishing) plates (Fig. 2.2C):The normal observer is meant to recognize thecolored pattern. On these plates, a number can

23Color Vision and Color Blindness
be seen by a normal trichromat but nothing canbe seen by the color deficient person. These areplates 10 to 17 inclusive in the 38 plate series.
Hidden digit plates: The anomalous observershould see the pattern. The number on a hiddendigit design cannot be seen by a normal trichromatbut can be seen by most people with red/greendeficiencies. Those people with total colorblindness cannot see any numeral. These areplates 18 to 21 inclusive.
Qualitative plates: These are intended to classifyprotan from deutan and mild from severeanomalous color perception. The plates arenumbered 22 to 25.
Procedure of Testing
The plates are designed to be appreciated correctlyin a room which is lit adequately by daylight.Introduction of direct sunlight or the use of electriclight may produce some discrepancy in the resultsbecause of an alteration in the color values of thecharts. It is suggested that when it is convenientonly to use electric light, it should be adjusted asfar as possible to resemble the effect of naturaldaylight. The plates are held 75 cm from the subjectand tilted at right angles to the line of vision. Amissed/ misread plate must be reread (may be ina random order). The findings should be recordedon the Ishihara color vision test and interpretationmarking chart (Table 2.4).
A correct response to the Ishihara introduc-tory plate is expected and demonstrates suitablevisual acuity to perform the test and rules outmalingering.• Plates 1-25 have numerals and each answer
should be given without more than 3 secondsof delay.
• Plates 26-38 are tracings for use in illiterates,and windings lines between the two Xs aretraced with a dry soft brush. Each tracingshould take less than 10 seconds.
• Each eye should be tested separately (asshould be done for all color vision tests).The recommendations of the test state that
of the first 21 plates if 17 or more plates areread correctly by an individual his color senseshould be regarded as normal. If 13 or less platesare correctly read then the person has a red-green color defect. It is rare to have persons whoread 14-16 plates correctly.
Hardy, Rand, Rittler (H-R-R) Plates
Hardy, Rand, Rittler (H-R-R) plates are anothertype of pseudo-isochromatic (PIC) plate test. Thistest is similar to the Ishihara test except thatthe H-R-R plates classify and quantify the typeof color defect whether protan, deutran, or tritan(blue/yellow). H-R-R plates have coloredsymbols/shapes rather than numbers. Thismakes H-R-R plates a good choice for childrenand illiterates. Since it is capable of detectingtritan disorders, this test is especially useful whenan acquired color vision defect is suspected.Lighting, viewing distance, and viewing timeare the same as that of testing with Ishiharaplates. The first four (non-numbered) plates ofthe H-R-R series are for demonstration only(similar to the Ishihara “12”). The first six(numbered) plates are screening plates. Colorvision is deemed “normal” and no further testingneeds to be done if the subject gives correctresponses to the screening plates. If there is anincorrect response to one or more of the screeningplates, the examiner must follow the directionson the scoring sheet and show additional platesto the subject in order to specifically classify thecolor vision defect.
City University Color Vision Test
The City University test (Fig. 2.3) was developedby Fletcher. It consists of 10 black charts eachof which has 5 color dots. One of the dots is

24 Diagnostic Procedures in Ophthalmology
TABLE 2.4: INTERPRETATION AND MARKING OF THE ISHIHARA COLOR VISION TEST
Number Normal Person withof plate person Person with red-green deficiency total color
blindness andweakness
1 12 12 12
2 8 3 x
3 6 5 x
4 29 70 x
5 57 35 x
6 5 2 x
7 3 5 x
8 15 17 x
9 74 21 x
10 2 x x
11 6 x x
12 97 x x
13 45 x x
14 5 x x
15 7 x x
16 16 x x
17 73 x x
18 x 5 x
19 x 2 x
20 x 45 x
21 x 73 x
Protan DeutanStrong Mild Strong Mild
22 26 6 (2)6 2 2(6)
23 42 2 (4)2 4 4(2)
24 35 5 (3)5 3 3(5)
25 96 6 (9)6 9 9(6)
The mark x shows that the plate cannot be read. Blank space denotes that the reading is indefinite. The numeralsin parenthesis show that they can be read but they are comparatively unclear

25Color Vision and Color Blindness
located in the center being encircled with 4 otherdots so that a subject has to match the centralcolor dot with one of the 4 other dots.
American Optical Company Plates
The American Optical Company (AOC) plates,a screening test for protan and deutan defects,appears to be a composite of other tests. Inaddition to a demonstration plate, there are 14test plates that include 6 transformation and 8vanishing plates. The figures are single- anddouble-digit Arabic numerals. There are at leasttwo different fonts used on different plates. Fiveor more errors on the 14 test plates constitutefailure of the test. Plates with double-digitnumbers are failed if the response to either digitis incorrect.
Dvorine
The Dvorine is another widely used screeningtest for protan and deutan defects. The test bookletcontains both PIC plates and a Nomenclaturetest, which is a unique and valuable feature ofthis test. The plates are presented in two sections:15 plates with Arabic numerals and 8 plateswith wandering trails, with 1 demonstrationplate in each section. Any symbol missed is anerror. Three or more errors in the first sectionconstitute a failure. The Dvorine Nomenclaturetest is used to assess color naming ability. Thereare eight discs (2.54 cm in diameter) of saturatedcolor and eight discs of unsaturated or pastelcolors, which include red, brown, orange, yellow,green, blue, purple, and gray. A rotatable wheelallows the presentation of one disc at a time.Color-naming aptitude adds another dimensionto a color vision assessment, and the results areappreciated by patients and employers curiousto know the impact of a color defect on the abilityto name colors.
Tritan Plate (F-2)
The Tritan plate, or F-2, is a single plate thatFarnsworth designed to screen for tritan colordefects. It is a good test and it can also be usedfor screening for red-green (protan-deutan)defects. The test is performed by a vanishingplate consisting of outlines of two interlockingsquares with different chromaticities on a purplebackground. One square is purple-blue andvanishes for patients with the red-green defects;the other square is green-yellow and vanishes,or is seen less distinctly compared with thepurple-blue square, for the tritan. Persons withnormal color vision see both squares, but thegreen-yellow one is more distinct.
Arrangement Tests
Farnsworth-Munsell 100-Hue Test(Pigment Matching Test)
Farnsworth-Munsell test (Fig. 2.4A) is a psycho-technical test, which quantifies a person’s abilityto discriminate hues of pigment color. This simpleand useful test consists of 85 colored chips thatare designed to approximate the minimumdifference between the hues that a normalobserver can distinguish (1-4 nm). Color deficient
Fig. 2.4A: Farnsworth-Munsell 100-hue test

26 Diagnostic Procedures in Ophthalmology
Fig. 2.4B: Farnsworth-Munsell 100-hue test results from four subjects:A Normal; B Protan defects; C Deutan defects; D Tritan defects
persons make characteristic errors in arrangingthe chips. The results are recorded on a circulargraph. The greater the error arranging the chips,the farther the score is plotted from the centerof the circle (Fig. 2.4B). Automated score for FM100-hue test is also available.
The currently available standard versionconsists of 85 knobs with pigment-colored paper
on top arranged in 4 horizontal panels. Eachpanel has 2 knobs fixed at its 2 ends. The subjectis required to arrange the knobs in each panelin such a manner that the colors of the knobsappear to be changing gradually from one endof the panel to another.
Generally recommended time for arrangingeach panel is 2 minutes. The time spent on

27Color Vision and Color Blindness
arranging the each panel is recorded. Scores ofa knob/cap is the sum of the differences betweenthe number of that cap and the number of thecaps adjacent to it on either side. Sum of thescores of the entire set of knob / caps goes tomake the total error score (TES). Then, the scoresof each knob are plotted on a circular graph.By plotting the scores in a graph, it is seen thatcharacteristic patterns are obtained in specificdefects (Fig. 2. 4 B). The test is capable of detectingall types of color deficiencies. The test resultsshow that:
1. Average discrimination lies between 20 to100 total error score,
2. Superior discrimination is below 20 totalerror score, and
3. Low discrimination is more than 100 totalerror score.
Farnsworth D-15 Test
The Farnsworth D-15 test (Fig. 2.5) consists ofsingle box of 15 colored chips. The test can becarried out more rapidly than the 100-hue test.Viewing distance required is 50 cm or approxi-
mately 20 inches. Unlimited testing time isusually allowed but the subject may be told he/she has two minutes to complete the test in orderto prevent dawdling. The object of the test isto arrange the caps in order using the fixedreference cap as a starting point. The subject isinstructed to take the cap which most closelyresembles the fixed reference cap, and place itnext to it; then find the cap that most closelyresembles the cap he just placed, and place itnext to it. Once the subject has arranged all thecaps, the lid is closed and the box flipped over.The examiner then scores the test based on theorder in which the subject placed them (the capsare numbered on the bottom). The examiner thenconnects the numbers on the score sheet in theorder in which the patient placed the caps. Thescore is either “passing” or “failing.” A circularpattern on the score sheet indicates passing, acriss-crossing or lacing pattern indicates failing.The D-15 panel uses only saturated colors,therefore, subtle defects such as those seen withan anomalous trichromat may be missed. TheD-15 is useful for detecting dichromacy, inparticular, tritan defects which are oftenassociated with eye diseases and drug toxicity.The disadvantage with this test is that minordefects are not detected. Dichromatic subjectswill generally form a series of parallel or criss-crossing lines with at least two lines crossingthe chart in the same direction. The type ofdeficiency is indicated by the index line mostnearly parallel to the crossover lines.
Lanthony Desaturated D-15 Test
The Lanthony desaturated D-15 test (Fig. 2.6)is similar to the Farnsworth D-15 except thatthe color on chips is much less saturated. Thismakes the hue circle smaller and the arrangementtask more difficult. It is especially useful fordetecting subtle acquired color deficiencies.Fig. 2.5: Farnsworth D-15 color test kit

28 Diagnostic Procedures in Ophthalmology
The Sloan Achromatopsia Test
The Sloan Achromatopsia test is a matching testdesigned for rod monochromats described bySloan in 1954. The test consists of seven plates,each with a different color: gray, red, yellow-red, yellow, green, purple-blue, and red-purple.Each plate includes 17 rectangular strips forminga gray scale from dark to light in 0.5 steps ofthe Munsell value. In the center of each rectangleis a colored disc that has the same Munsell valuefrom one end of the gray scale to the other. Thepatient’s task is to identify the rectangle thatmatches the lightness of the colored disc. Thisis a difficult task for persons with normal colorvision because of the color difference, but it isreadily and precisely accomplished by completeachromats, who see the colors as grays of differentlightness. There are normative data for bothpersons with normal color vision and achromats.
Anomaloscopes
Anomaloscopes are instruments that assess theability to make metametric matches. The resultsare used for definitive diagnosis and quantitativeassessment of color vision status. Anomaloscopes
are much more difficult to administer thanpseudo-isochromatic plates and arrangementtests. The first anomaloscope was designed byNagel and is based on the color match knownas the Rayleigh equation, that is, R + G =Y. Becauseof their relatively high price, anomaloscopes arerarely used in private practice.
Nagel Anomaloscope (SpectralMatching Test)
Nagel (1970) constructed anomaloscope forstudying the color vision defects. It is based onthe color match known as the Rayleigh equation,that is Red (R) + Green (G) = Yellow (Y). TheNagel anomaloscope (Fig. 2.7) assesses theobserver’s ability to make a specific color match.In anomaloscope, the observer is asked to matcha mixture of red and green wavelengths to ayellow. This instrument consists of a source ofwhite light, which is split into spectral colorsby a prism. These colors are viewed through atelescope. The field of vision consists of a circledivided into two halves. The lower half projectsa spectral Yellow (Sodium line) and this hasto be matched by a mixture of Red (Lithium line)and Green (Thallium line) in the other half. Theratio of the two component lights can becontrolled by press buttons on the base of thetelescope on a scale of 0 – 73, where 0 is puregreen, and 73 is pure red. The readings areinterpreted as follows: the red/green mix
Fig. 2.6: Lanthony desaturated D-15
Fig. 2.7: Nagel anomaloscope

29Color Vision and Color Blindness
proportions can be expressed in the form of anAnomaly Quotient (AQ). Normal observers haveAQ between 0.7 and 1.4; higher AQs indicatedeuteranomaly (AQ usually >1.7), whereas lowerAQs indicate protanomaly. A major advantageof the Nagel anomaloscope is that it candistinguish between dichromatic and anomaloustrichromatic vision by measuring the balance ofred and green wavelengths in the mixture field.
Pickford-Nicolson Anomaloscope
The Pickford-Nicolson anomaloscope can beused for three different matches or colorimetricequations:
The Rayleigh equation [R + G = Y],The Engelking equation [B + G = CY] andThe Pickford - Lakowski equation [B + Y =W].The matching field is presented on a screen
for free viewing at a variety of distances, andthere are no intervening optics between thepatient and the matching field. The size of thefield is changed by selecting different apertures:the largest is 2.54 cm (1 inch) in diameter andthe smallest, 0.48 cm (3/16 inch). Different colorsare obtained by inserting broadband filters. ThePickford-Lakowski equation is used to assessthe consequence of senescent changes in thespectral transmission of the ocular media(yellowing of the lens), it also has value inexamining acquired color defects. The Engelkingequation is used for diagnosis of the blue - yellowor tritan color defects. Individual variability indensity of the macular pigment and lens pigmen-tation affects both the Engelking and Pickford-Lakowski equations and, accordingly, con-founds the interpretation of an individual result.
Lantern Tests
In marine, rail, and airline transportation, andin the armed forces, colored signals and
navigational aids are extensively used. Lanterntests are performance-based, and they do notdiagnose, classify, or grade the level of colorvision defect. Rather, they attempt to determinewhether the person is capable of performing thecolor signal recognition tasks with adequateproficiency to maintain safety standards. Thereare two types of lantern tests, those that use actualsignal light filters and those that use simulationsof signal lights.
Farnsworth Lantern Test (Falant)
In the United States, the Farnsworth Lantern(Falant) is the standard lantern test (Fig. 2.8).It simulates marine signal lights under a varietyof atmospheric conditions. Two lights arepresented in a vertical display in any of the ninepossible combinations of three colors—red, green,and white—in the two positions. A subject mustaverage eight out of nine correct responses to
Fig. 2.8: Holmes-Wright Lantern

30 Diagnostic Procedures in Ophthalmology
pass the test. White lights are particularlyproblematic, especially for milder color defects.It is reported that the test is not representativeof actual field conditions.
Edridge-Green Lantern Test
The Edridge-Green Lantern (Fig. 2.9) is aninstrument used for testing the ability of a personto recognize color of transmitted light. It wasbuilt to simulate the light of railway traffic signals,as they are visible from a distance. The aperturesrepresent the equivalents of five and half-inchrailway signals at 600, 800 and 1000 yards,respectively when viewed from 20 feet distance.Usually two apertures 1.3 and 13 mm are used,set of filters showing signal red, yellow, greenand blue colors are shown, each color beingshown twice for each aperture size.
Other Tests
Electroretinography
Use of electroretinography (ERG) in the modemera is more useful for detection of color visiondeficiencies for two reasons: (i) new methodsallow to separate and observe accurately thephotopic and scotopic components of ERG withthe possibility of better study of cone activityand (ii) with the use of computer averaging,picking up of oscillatory potentials is more easy.
Microspectrophotometry
In spectrophotometry, an individual cone of adissected retina is aligned under a small spotof light and its absorption is measured at variouswavelengths. The most direct evidence of Young’strichromatic theory (3 classes of cones) comesfrom spectrophotometry. The results of micro-spectrophotometry confirm three groupings withpeak sensitivities at 437-458 nm, 520-542 nmand 562-583 nm.
Color Vision Deficiencies andEveryday LifeMany tasks depend on our ability to discriminatecolor. Selecting products at the grocery store,matching paint colors or items of clothing, orconnecting color-coded wiring all depend onefficient color vision. Color vision deficienciescan seriously affect an individual’s ability tolearn, to work at a chosen occupation and moveeffectively in the world.
Young children are expected to learn colornames early in their educational experience andcolor is frequently used to categorize educationalmaterials. Good color vision is also importantfor students of art, chemistry, biology, geologyand geography. A child with deficient colorvision will have disadvantage on such tasks as
Fig. 2.9: Edridge-Green Lantern
The recommendations of the test state thata candidate should be rejected if he calls
1. Red as Green2. Green as Red3. White light as Green or Red or vice versa4. Red-Green or White light as Black.
Any candidate who makes any other errorsshould be tested with other test.

31Color Vision and Color Blindness
color naming, coding, and matching. Color visiontesting should be done for all children as earlyas possible, and certainly prior to starting school.
If a color deficiency is present, the child’s school,teacher, and parents should be informed so thatmethods of instruction can be modified to meet theirvisual needs. Teachers and parents can help thechild in a number of different ways. First, imagesand utensils such as crayons, pencil and pens canbe labeled with words or symbols. Second,discrimination between items of different color canbe facilitated by the use of high luminance contrast.For example, it would be better to use white chalkon a black or green chalkboard or a dark markeron a white board than combinations that provideless luminance contrast. The level of luminancecontrast in colored materials can be determinedquite easily by making a black and white photocopyof them or by converting them to black and whiteon your computer. Third, children should be taughtcommon objects by their usual color (e.g. ”bananasare normally yellow and the sky is blue”).Occupations vary in their requirement of coloridentification. For some, good color judgment isdesirable but not necessary. For others, knowledgeof one’s color vision is critical. Examples wheregood color judgment can be critical for careersinclude a painter, safety officer, dermatologist,pharmacist, cartographer, coroner, chemist, buyerof textiles, food inspector, electrician, and marinenavigator. Color perception failures in such jobscould be costly, even disastrous.
Enhancing Performance with Filters
The color performance of the patients with colordeficiency can be sometimes enhanced usingcolored filters. By absorbing wavelengthsselectively, these filters help the observer todifferentiate stimuli based on their relativebrightness. For example, a red object viewedthrough a green filter or a green object viewedthrough a red filter will appear much darker.
For example the X-chrom lens is a red contactlens worn on one eye that absorbs shorterwavelengths and passes longer ones. Bycomparing the relative brightness in eye withthe X-chrom lens to that in the eye without it,a dichromat’s ability to distinguish red from greencan be enhanced. While such monocular compa-risons may be useful in specific applications,the user remains a dichromat and is unlikelyto find the approach practical for everyday use.
SummaryOphthalmic personnel are frequently asked toperform color vision testing. Knowing whether acongenital or acquired defect is suspected canhelp determine which color vision test should beadministered. All color vision tests have specificrequirements for lighting, viewing distance,viewing time, and scoring. It is important to befamiliar with the various testing and scoringguidelines in order to provide the requestingdoctor with accurate and useful information.
Bibliography1. Alprey M, Mocller J. Red and green cone visual
pigments of deuternornalous trichromacy.J Physiol 1977;266:647.
2. Brown PK, Wald G. Visual pigments in singlerods and cones of the human retina. Science1964;144:45.
3. Dada VK. Practical problems of colour visiondefectives. Indian Practitioner 1977; 30: 251-55.
4. Dalton J. Extraordinary Facts relating to theVision of Colours. Mem Manchester Lit & PhilSoc 1798, 5(1): 28. Edin J Sci 1798, 9: 97 citedby Duke-Elder ref 6.
5. De valois RL, Abramov I, Jacobs GH. Analysisof response patterns of LGN cells. J OphthalmolSoc Amer 1966;56:966.
6. Duke-Elder S. Diagnostic Methods: The coloursense. In System of Ophthalmology. HenryKimpton, London 1962; Vol VII: 380-84.

32 Diagnostic Procedures in Ophthalmology
7. Duke-Elder S. Congenital colour defects. InSystem of Ophthalmology. Henry Kimpton,London 1964; Vol III (Part 2): 661-68.
8. Duke-Elder S. Colour vision. In System ofOphthalmology. Henry Kimpton, London 1968;4: 617-51.
9. Edridge-Green. Physiology of Vision, London1920.
10. Farnsworth D. Protan, deutan and tritan. J Opt SocAmer 1943;33:568.
11. Farnsworth D, Reed. Small-field Tritanopia. USNSubmar Med Res Lab Rep No 19, 1944.
12. Farnsworth D. Manual of the Farnsworth-Munsell 100-hue test for the Examination of ColorDiscrimination. 1949; revised 1957, pp 1-7.
13. Francois J, Verriest G. Acquired diseasesproducing colour vision defects. Vision Res1961;1:201.
14. Francois J. La discrimination chromatique dansamblyopie strabique. Documents Ophthal1967;23:318.
15. Geddes. Prevalence of colour vision deficients.Br J Psychol 1946;37:30.
16. Georgia Antonakon Chrousos. Ocular findingsin Turner’s syndrome: A perspective study.Ophthalmology 1984;91:926.
17. Gouras P. Identification of cone mechanism inmonkey ganglion cells. J Physiol 1968;199:533.
18. Hardy LH, Rand G, Rittler MC. Comparison ofHRR with other tests. Arch Ophthalmol 1954;51:216.
19. Hart WM Jr. Acquired dyschromatopsias. SurvOphthalmol 1987;32:10.
20. Hart WM Jr. Colour vision. In Adler’s Physiologyof the Eye. Mosby, St Louis 1992;708-27.
21. Hering. Zur Lehre vom Lichtsinne Wien, 1878cited by Duke-Elder ref 6.
22. Holmgren. Holmgren’s wool test. Ann RepSmithsonian Inst 1877; 131.
23. Ishihara S. Test for Colour Blindness Manual ofIshihara Plates, 1917, 5th ed. Tokyo 1925. and 14thed. 1959, Kanehara Shuppan Co Ltd, Tokyo –Kyoto, Japan.
24. John A, Fleishman, Roy W Beck. Defects in visualfunction after resolution of optic neuritis.Ophthalmology 1987;94:1029.
25. Kinnear PK, Sahraie A. New Farnsworth-Munsell100-hue test norms of normal observers for eachyear of age 5-22 and for age decades 30-70. Br JOphthalmol 2002;86:1408-11.
26. Ladd-Franklin. Tetrachromatic Theory. Z PsycholPhysiol Sinnes 1893;4:211.
27. Maxwell C. Fundamental response curve of thecone pigment. Trans Roy Soc Edin 1885; 21(2):275.
28. Michael CR. Colour vision mechanisms inmonkey striate cortex: Simple cells with dualopponent colour receptive fields. J Neurophysiol1978;41:1233.
29. Michael CR. Colour sensitive complex cells inmonkey striate cortex. J Neurophysiol 1978;4:1250.
30. Michael CR. Colour sensitive hypercouplex cellsin monkey striate cortex. J Neurophysiol 1979;42:726.
31. Miller SJH. Colour blindness or achromatopsia.In Parsons’ Diseases of the Eye. 18th ed.Edinburgh, Churchill Livingstone, 1900, 269-70.
32. Mitarai G. Glia-neuron interactions andAdaptional mechanisms of the retina. ln JungR, Kormaluber H (Eds). The Visual System:Neuroplysiology and Psychophysics 1961.
33. Nakamura K. New color vision test to evaluatefaulty color recognition. Jpn J Ophthalmol 2002;46: 601-06.
34. Neitz J, Jacobs GH. Polymorphism in normalcolor vision. Vision Res 1990;30:62.
35. Newton I. Composition of white light. Phil Trans1672;6:3075.
36. Nigel W Daw: Colour vision: Adler’s Physiologyof the Eye, Robert Moses (Ed). St Louis, Mosby,1981.
37. Pearlman AL, Birch J, Meadows JC: Cerebralcolour blindness:An aquired defect in huediscrimination. Amer Neurol 1979;5:253.
38. Rushton WAH. A cone pigment in theprotanope. J Physiol 1963;168:345.
39. Swanson WH, Cohen JM. Color vision.Ophthalmol Clin N Am 2003;16:179-203.
40. Taylor WOG. Effects on employment of colourvision defectives. Br J Ophthalmol 1971;155:753-760.
41. Vola JL, Leprince G. 100-Hue at mesopic level.Mod Probl Ophthal 1978;19:67-70.
42. Wald G. Defective colour vision and its inheri-tence. Proc Nat Acad Sci USA 1966;55:1347.
43. Wiesel TN, Hubel DH: Spatial and chromaticinteractions in the lateral geniculate body ofthe rhesus monkey. J Neurophysiol 1966;29:1115.
44. Young T. A course of lectures on naturalphysiology. Phil Trans 91, 43, 92, 12, 387, 1801-07.
45. Yves le Grand. Light Colour and Vision. London:Chapman and Hall, 1957.

33Slit-lamp Examination
HARINDER SINGH SETHI, MUNISH DHAWAN
Slit-lampExamination3
The slit-lamp is one of the important examiningtools of ophthalmologists. Clinical ophthalmolo-gists all over the world routinely use a slit-lampto examine their patients. A raw slit-lamp wasintroduced in the early 1900s, but presently, it isa sophisticated instrument (Fig. 3.1). One of themost important advantages of slit-lamp
examination is that one can examine the eyestructure in three dimensions (3D). There arethree basic requirements for appreciation ofdepth with a slit-lamp. The first depends upon theclinician possessing a third grade of binocularvision called steriopsis. The second involves thedirection of the incoming light source, and isdependent upon the fact that the light beam canbe moved so it comes in from one side or the other.The third involves the shape of the slit and isdependent upon the fact that the light source canbe moved separately from the oculars.
HistoryOne of the first individuals to apply microscopyto the living eye was Purkinje, who studied theiris with an adjustable microscope by illumina-ting the field of view. The uniocular slit-lampwas born years later when Louis de Weckercombined an eyepiece objective and adjustablecondensing lens within a tube. It was improvedby Siegfried Czapski, who added binocularityto the microscope. However, none of the unitshad sufficient and adjustable illumination.Allvar Gullstrand, an ophthalmologist and 1911Nobel laureate developed a true slit-lamp toFig. 3.1: Slit-lamp

34 Diagnostic Procedures in Ophthalmology
illuminate the eye (Fig. 3.2). Then Henker andVogt improved upon Gullstrand’s device in 1910sby creating an adjustable slit-lamp andcombining Czapski’s microscope withGullstrand’s slit-lamp illumination. The modernslit-lamp is a tool capable of stereoscopicallyexamining optical sections of the anteriorsegment of the eye in great detail. Vogt used theslit-lamp biomicroscope to study a vast array ofeye diseases and documented his findings in apublication, “Lehrbuch und Atlas derSpaltlampenmikroskopie des Leibenden Auges”in 1930s. Besides examination of the anteriorsegment of the eye, the slit-lamp, in conjunctionwith certain contact lenses, is often used toexamine the anterior chamber angle andposterior segment of the eye.
Optics of Slit-lampThe slit-lamp is a compound microscope withan objective lens and an eyepiece. The two maincomponents of the modern slit-lamp are theillumination system and observation system(Fig. 3.3).
Illumination System
The illumination system of most slit-lampsconsists of two different designs. The firstdesign, the Haag-Streit type illumination, allowsde-coupling in the vertical meridian. Suchvertical de-coupling is particularly useful whenperforming gonioscopy to minimize reflectionsand for indirect funduscopy to gain increasedperipheral views. The second design, the Zeiss
type illumination system, does not allow de-coupling in the vertical meridian. The Zeissillumination is light and compact and makesthe slit-lamp easy to use. In either case, theillumination systems are capable of producinga homogenous and aberration-free beam ofwhite light. Most slit-lamps have halogen bulbsto yield shorter wavelengths of light, whichallows better visualization of smaller structurescompared with longer wavelengths of light (i.e.tungsten bulbs). A condensing lens first focusesthe light onto slit aperture. This light is againfocused by another lens onto the eye after beingreflected by tilted mirror. Blue and green (red-free) filters are available in slit-lamp to studyfluorescein staining pattern and microaneurysmand nerve fiber layer.
Observation System
The second main component of slit-lamps is theobservation system. Modern slit-lamp micro-scopes can magnify images between X5 and X25,with some microscopes allowing magnificationto X40 and even X100. Magnification is generallyachieved by three methods:• Flip-type• Galilean rotating barrel, and• Continuous zoom system.
However, magnification of the slit-lamp isless important than its resolution. The resolutionof a slit-lamp is dependent on the wavelengthof light used, the refractive index between the
Fig. 3.2: Allvar Gullstrand

35Slit-lamp Examination
A B C
D E F
eye and objective, the working distance, andthe diameter of the objective lens. In practice,the first three of these factors are not easilymodifiable, but the objective lens diameter canbe modified to increase resolution. However,a very large diameter lens can introduce opticalaberrations. The observation system is alsoinfluenced by the proximity of the patient’s eyeto the examiner’s eyes. This necessitates aconvergence system for binocular viewing, andmost modern slit-lamp biomicroscopes aredesigned with 10 to 15 degrees of convergenceto minimize eye strain to the examiner.
Clinical ProcedureBefore using the slit-lamp, it is important toensure that the instrument is correctly set up.The following points should be checked:• The eyepieces should be focused for the
observer for his/her own refractive error.Often a little more minus correction isrequired than the observer’s actual refractiveerror due to proximal accommodation andconvergence.
• The pupillary distance (pd) is adjusted forthe observer (perhaps the pd should be
Figs 3.3A to F: A The binocular eyepieces provide stereoscopic vision and can be adjusted to accommodate theexaminer’s interpupillary distance. The focusing ring can be twisted to suit the examiner’s refractive error. B Theillumination arm can be swung 180 degrees side to side on its pivoting bases allowing the examiner to direct thelight beam anywhere between the nasal and temporal aspect of the eye. The dimension of the light beam can bevaried in height and width with the levers. C The patient positioning frame consists of two upright metal rods towhich are attached a forehead strap and a chin rest. D The joystick allows for focusing by shifting forward, backward,laterally or diagonally. The joystick can also be rotated to lower or elevate the light beam. The locking screw locatedat the base secures the slit-lamp from movement when it is not in use. E Knurled knob is slit-beam height adjuster,Flip lever controls filters, from left to right: bright, dim, red-free. F ON/OFF power switch provides high or low optionsin light intensity

36 Diagnostic Procedures in Ophthalmology
slightly less than that usually measured toaccount for proximal convergence).
• Check that the slit-lamp is parallel on therunners of the table.
• Check that the observation and illuminationsystems are coupled, and the slit-beam isof even illumination and has sharplydemarcated edge (otherwise irregularity ofthe beam may be falsely interpreted asirregularity of tissues).
• The locations of the controls are known.• The observer and patient are comfortable
in the mid-travel of the slit-lamp. Mid-travelis the location of the slit-lamp when it ishalf-way up or down.
The slit-lamp examination is conducted ina semi dark room. Patient is seated in frontof slit-lamp on an adjustable stool and his headis steadied by placing chin on chin-rest andhis forehead rests on the bar of head-rest. Aswith any technique, a general routine shouldbe followed, in most cases when examiningthe eye and adnexa, a large field of view isused initially and then focus in on detail whenrequired with higher magnification. Theexamination should be commenced using theX10 eyepieces and the lower powered objective.Use the lowest voltage setting on the trans-former. Select the longest slit-length by meansof the appropriate lever. Adjust the chin-restso that the patient’s eyes are approximatelylevel with the black marker on the side of thehead rest. Adjust the height of the slit-lampuntil the slit-beam is centered vertically on thepatient’s eye. Focus the slit-beam on the eyeby moving the joystick either towards or awayfrom the patient. Coarse positioning can beeffected without using the microscope butcritical focusing should be carried out whilstviewing through the microscope. The angulationbetween the observation arm and theillumination arm is adjusted. In addition,
accessories like a fixation light, Hruby lens, anapplanation tonometer, camera or CCTV canbe attached. Laser system can also be attachedto a slit-lamp utilizing its optics for laserdelivery.
Examination TechniquesThe various techniques of slit-lamp examinationare:1. Diffuse illumination2. Direct focal illumination
a. Narrow beam (optic section)b. Broad beam (parallelepiped)c. Conical beam
3. Indirect illumination4. Retroillumination
a. Directb. Indirect
5. Specular reflection6. Sclerotic scatter7. Oscillatory illumination8. Tangential illumination.
Diffuse Illumination
Diffuse illumination (Fig. 3.4) is a good methodfor observing the eye and adnexa in general.
Fig. 3.4: Diffuse illumination

37Slit-lamp Examination
The beam width is kept at maximum andmagnification is kept low and light is thrownat an obtuse angle. It gives an overview of lids,conjunctiva, cornea and lens. Detail examinationis not possible with diffuse illumination. Its mainpurpose is to illuminate as much of the eyeat once for general observation. A broad beamof light is directed at the cornea from an angleof approximately 45 degrees. Position themicroscope directly in front of the patient’s eyeand focus on the anterior surface of the cornea.Low to medium magnification (X7-X16) shouldbe used which allows the observer to view asmany of the structures as possible. Whenviewing the eye with achromatic light oneshould note on gross inspection, any cornealscar, tear debris, irregularities of Descemet’smembrane or pigmentary changes in theepithelium. These findings are investigatedmore thoroughly with other types of illumina-tion.The diffuse illumination mode is also usedwith cobalt blue filter after fluorescein staining.Fluorescein staining is also used to evaluatepositioning of contact lenses, tear breakup time(TBUT), and staining of the cornea for cornealulcer.
Diffuse, wide-beam, illumination togetherwith the red free (green) filter is helpful whenviewing the bulbar conjunctiva, and episcleralblood vessels. With the aid of the red free filtersmall hemorrhages, aneurysms and engorgedvessels stand out well.
Direct Focal Illumination
Direct focal illumination is the most commonlyused method of viewing tissues of the anteriorsegment of the eye. The focused slit is vieweddirectly by the observer through the microscope(Fig. 3.5A). The magnification can be increased(X10 to X40) to view any areas of interest ingreater detail.
Direct/focal illumination can be used withdifferent types of beams:a. Narrow beam (optic section)b. Conical beamc. Broad beam (parallelepiped).
Narrow Beam
Narrow beam optical section is used primarilyto determining the depth or elevation of a defectof the cornea, conjunctiva or locating the depthof an opacity within the lens of the eye (Fig.3.5B). With the optic section, it is possible todetect corneal thickness, site of foreign body,scars and opacities, the depth of anteriorchamber and location of cataracts. Thebiomicroscope should be directly in front ofthe patient’s eye, the illumination source atabout 45 degrees and the illumination mirrorin “click” position. The slit-width is almostclosed (0.5-1.0 mm wide by 7-9 mm high). Setthe magnification on low to medium (X7-X10)and focused on the patient’s closed lid. The
Fig. 3.5A: Direct illumination: the light source is positionedoff to one side, and a bright slit-beam is shone directlyonto the object to be studied. The light is scattered inall directions by the object, and some of this scatteredlight finds its way back to the oculars, where it can beobserved by the examiner
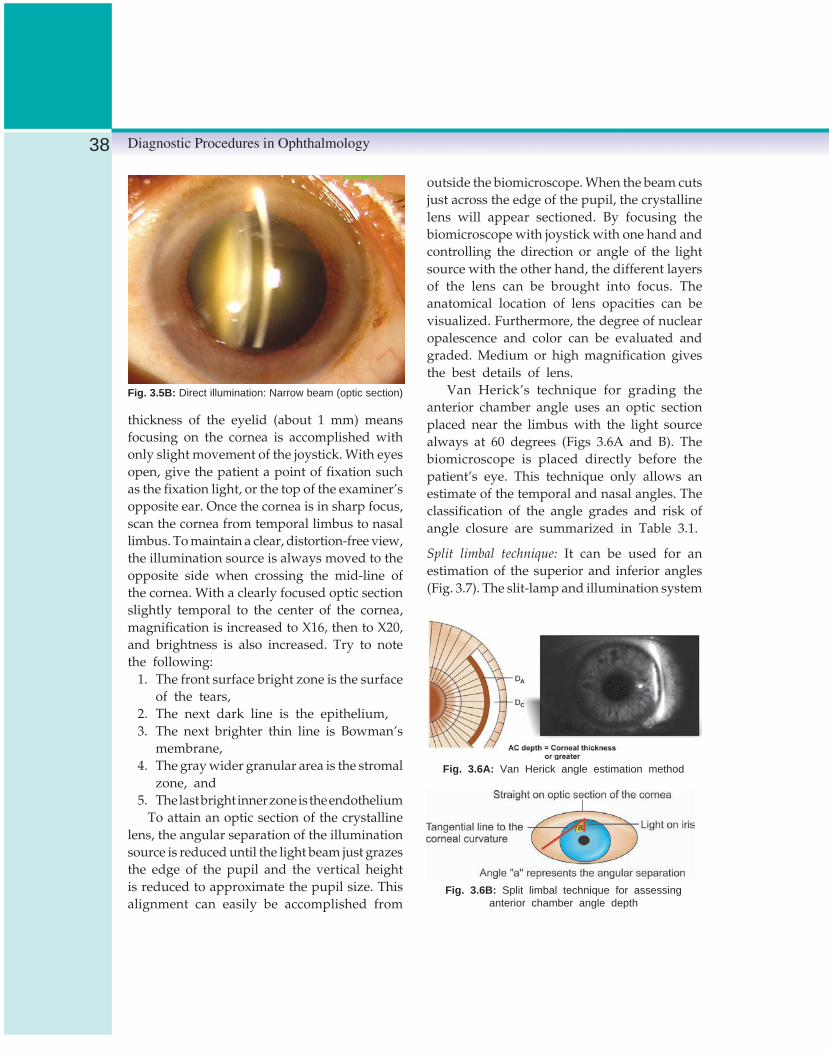
38 Diagnostic Procedures in Ophthalmology
thickness of the eyelid (about 1 mm) meansfocusing on the cornea is accomplished withonly slight movement of the joystick. With eyesopen, give the patient a point of fixation suchas the fixation light, or the top of the examiner’sopposite ear. Once the cornea is in sharp focus,scan the cornea from temporal limbus to nasallimbus. To maintain a clear, distortion-free view,the illumination source is always moved to theopposite side when crossing the mid-line ofthe cornea. With a clearly focused optic sectionslightly temporal to the center of the cornea,magnification is increased to X16, then to X20,and brightness is also increased. Try to notethe following:
1. The front surface bright zone is the surfaceof the tears,
2. The next dark line is the epithelium,3. The next brighter thin line is Bowman’s
membrane,4. The gray wider granular area is the stromal
zone, and5. The last bright inner zone is the endothelium
To attain an optic section of the crystallinelens, the angular separation of the illuminationsource is reduced until the light beam just grazesthe edge of the pupil and the vertical heightis reduced to approximate the pupil size. Thisalignment can easily be accomplished from
outside the biomicroscope. When the beam cutsjust across the edge of the pupil, the crystallinelens will appear sectioned. By focusing thebiomicroscope with joystick with one hand andcontrolling the direction or angle of the lightsource with the other hand, the different layersof the lens can be brought into focus. Theanatomical location of lens opacities can bevisualized. Furthermore, the degree of nuclearopalescence and color can be evaluated andgraded. Medium or high magnification givesthe best details of lens.
Van Herick’s technique for grading theanterior chamber angle uses an optic sectionplaced near the limbus with the light sourcealways at 60 degrees (Figs 3.6A and B). Thebiomicroscope is placed directly before thepatient’s eye. This technique only allows anestimate of the temporal and nasal angles. Theclassification of the angle grades and risk ofangle closure are summarized in Table 3.1.
Split limbal technique: It can be used for anestimation of the superior and inferior angles(Fig. 3.7). The slit-lamp and illumination system
Fig. 3.5B: Direct illumination: Narrow beam (optic section)
Fig. 3.6A: Van Herick angle estimation method
Fig. 3.6B: Split limbal technique for assessinganterior chamber angle depth
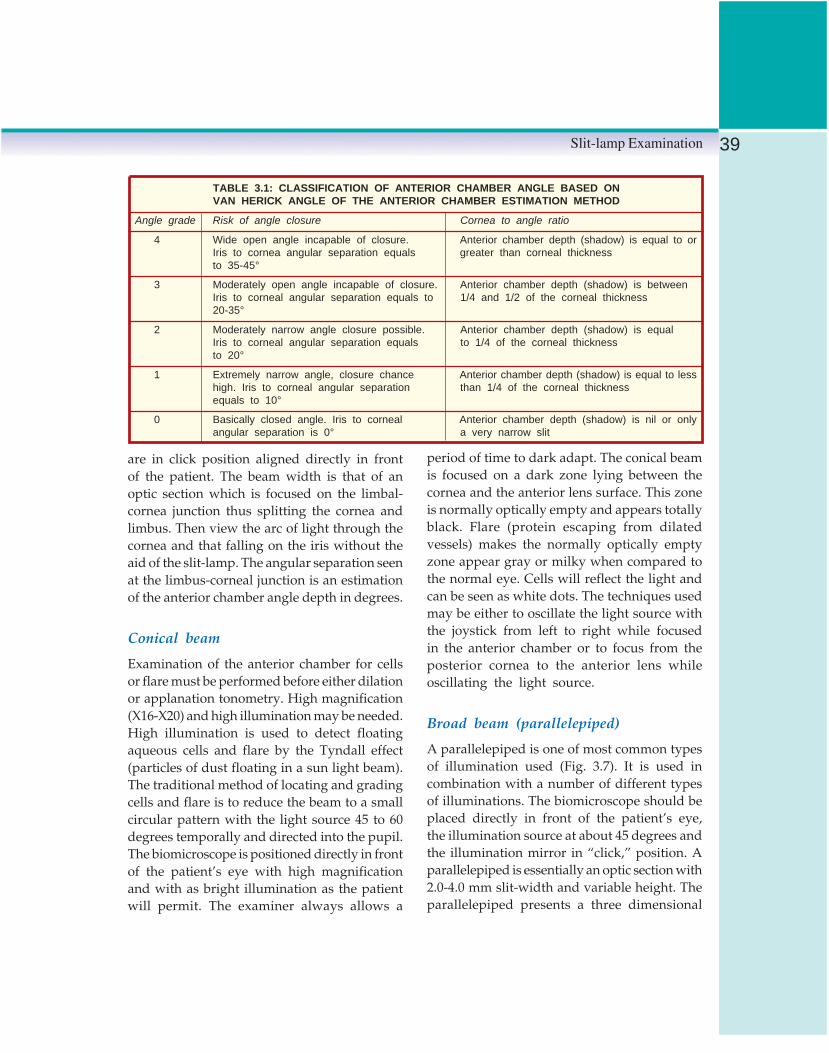
39Slit-lamp Examination
are in click position aligned directly in frontof the patient. The beam width is that of anoptic section which is focused on the limbal-cornea junction thus splitting the cornea andlimbus. Then view the arc of light through thecornea and that falling on the iris without theaid of the slit-lamp. The angular separation seenat the limbus-corneal junction is an estimationof the anterior chamber angle depth in degrees.
Conical beam
Examination of the anterior chamber for cellsor flare must be performed before either dilationor applanation tonometry. High magnification(X16-X20) and high illumination may be needed.High illumination is used to detect floatingaqueous cells and flare by the Tyndall effect(particles of dust floating in a sun light beam).The traditional method of locating and gradingcells and flare is to reduce the beam to a smallcircular pattern with the light source 45 to 60degrees temporally and directed into the pupil.The biomicroscope is positioned directly in frontof the patient’s eye with high magnificationand with as bright illumination as the patientwill permit. The examiner always allows a
period of time to dark adapt. The conical beamis focused on a dark zone lying between thecornea and the anterior lens surface. This zoneis normally optically empty and appears totallyblack. Flare (protein escaping from dilatedvessels) makes the normally optically emptyzone appear gray or milky when compared tothe normal eye. Cells will reflect the light andcan be seen as white dots. The techniques usedmay be either to oscillate the light source withthe joystick from left to right while focusedin the anterior chamber or to focus from theposterior cornea to the anterior lens whileoscillating the light source.
Broad beam (parallelepiped)
A parallelepiped is one of most common typesof illumination used (Fig. 3.7). It is used incombination with a number of different typesof illuminations. The biomicroscope should beplaced directly in front of the patient’s eye,the illumination source at about 45 degrees andthe illumination mirror in “click,” position. Aparallelepiped is essentially an optic section with2.0-4.0 mm slit-width and variable height. Theparallelepiped presents a three dimensional
TABLE 3.1: CLASSIFICATION OF ANTERIOR CHAMBER ANGLE BASED ONVAN HERICK ANGLE OF THE ANTERIOR CHAMBER ESTIMATION METHOD
Angle grade Risk of angle closure Cornea to angle ratio
4 Wide open angle incapable of closure. Anterior chamber depth (shadow) is equal to orIris to cornea angular separation equals greater than corneal thicknessto 35-45°
3 Moderately open angle incapable of closure. Anterior chamber depth (shadow) is betweenIris to corneal angular separation equals to 1/4 and 1/2 of the corneal thickness20-35°
2 Moderately narrow angle closure possible. Anterior chamber depth (shadow) is equalIris to corneal angular separation equals to 1/4 of the corneal thicknessto 20°
1 Extremely narrow angle, closure chance Anterior chamber depth (shadow) is equal to lesshigh. Iris to corneal angular separation than 1/4 of the corneal thicknessequals to 10°
0 Basically closed angle. Iris to corneal Anterior chamber depth (shadow) is nil or onlyangular separation is 0° a very narrow slit

40 Diagnostic Procedures in Ophthalmology
view of the cornea or the crystalline lens. Thethree dimensional view permits observation ofdistinguishable details within the crystalline lens“zones of discontinuity”. As with the opticsection, the angle between the illuminationsource and biomicroscope may be varied toexpose more corneal epithelium, stroma andendothelium. The whole cornea should bescanned using a parallelepiped. When scanningthe cornea, a clear undistorted view must bemaintained by positioning the light source tothe opposite side when crossing the mid-lineof the cornea. Both normal and abnormalfindings can be seen when scanning the corneawith varied levels of magnifications andbrightness. Look for the following findings:
1. Tear debris is usually related to allergiesor occasionally with infections.
2. Corneal nerves are white thread-likestructures that bifurcate and trifurcate andare located anywhere within the cornea.
3. Blood filled vessels extend from the limbusonto or into the cornea, and may bediagnostic of chronic or acute insult orinflammation.
4. Ghost vessels extend from the limbus intothe cornea. They are empty of blood anddiagnostic of past deep corneal inflam-mation.
5. Corneal scars are white in color anddiagnostic of some past corneal damage,ulcer, abrasion or foreign body.
6. Corneal striae are white usually verticalthread-like twisting lines found in theDescemet’s membrane and posteriorstroma. They are diagnostic of poor fittingsoft contact lens and diabetes.
7. Endothelial pigmentation, when heavy andlocated vertically on the endothelium, isknown as Krukenberg’s spindle, it may bediagnostic of iris atrophy and pigmentaryglaucoma. Transillumination of the iris mayreveal transillumination iris defects (TIDs).Scanty and very fine pigment deposits arecommonly seen and are not pathological.
Indirect Illumination
Indirect illumination means looking at tissueoutside the area which is directly illuminatedand can be used in conjunction with most ofthe above techniques. Corneal opacities, cornealnerves and limbal vessels are easily seen underindirect illumination as glare is reduced.Examine always directly as well as indirectlyilluminated areas of the structure. To use thistype of illumination place the biomicroscopedirectly in front of the patient’s eye and theillumination light source at about 45 degrees.Make sure the illumination mirror is in “click”position. Use a parallelepiped beam sharplyfocused on a given structure like the cornea.The light passes through the cornea and fallsout of focus on the iris. The dark area just lateralor proximal to the parallelepiped is the indirector proximal zone of illumination. This is thearea of the cornea which one surveys throughthe biomicroscope. This type of illuminationis helpful in detection of microcystic edema,faint corneal infiltrates and irregularities of thecorneal epithelium and tears. Because it utilizes
Fig. 3.7: Broad beam (parallelepiped)

41Slit-lamp Examination
direct, indirect and retroillumination simulta-neously, one should consider it to be asimportant as any other type of illumination.
Retroillumination
Retroillumination is another form of indirectviewing. The light is reflected off the deeperstructures, such as the iris or retina, while themicroscope is focused to study the more anteriorstructures in the reflected light (Figs 3.8A toD). It is used to study the cornea in light reflectedfrom the iris, and the lens in light reflectedfrom the retina. Structures that are opaque to
light appear dark against a light background(e.g. corneal scars, pigment, and lens opacity).Portions that scatter light appear lighter thanthe background (e.g. edema of the epithelium,corneal precipitates). This method is useful forexamining the size and density of opacities,but not their location.
Retroillumination uses a parallelepiped thatbounces unfocused light off one structure whileobserving the back of another. The alignmentand angular separation of the biomicroscopeto the illumination source will vary. The lightsource beam is reflected off another structurelike the iris, crystalline lens or retina while the
C DFigs 3.8C and D: Retroillumination
Figs 3.8A and B: Retroillumination: This technique allows the observer to view a clear structure with light that hasbeen transmitted through, rather than just bounced off it. A Light from the slit-lamp is shone through the pupil, reflectedoff the fundus, and transmitted through the lens and cornea. B Light is reflected off the iris and transmitted throughthe cornea

42 Diagnostic Procedures in Ophthalmology
biomicroscope is focused on a more anteriorstructure. For retroillumination or transillumi-nation of the iris or crystalline lens a low tomedium magnification (X7-X10) is used. A slit-width 1-2 mm wide and 4-5 mm high is usedwith the biomicroscope and light source placedin direct alignment with each other. They areboth positioned directly in front of the eye tobe examined. Focus the slit just off the edgeof the iris and on the front of the lens. If thereare defects or atrophy of the iris they will beseen as a retinal “orange” glow coming backthrough each defect or hole. Patients who havenumerous endothelial pigment deposits musthave their iris transilluminated. The cornea isprobably the most common structure viewedon retroillumination. Keratic precipitates willappear white in direct illumination but darkby retroillumination. This technique is valuablefor observation of deposits on the cornealendothelium and invading blood vessels.
Sclerotic Scatter
Sclerotic scatter examination uses the principleof total internal reflection (Fig. 3.9). Slit-lampis set to a low X6-X10 magnification and anarrow vertical-slit (1-1.5 mm in width) isdirected in line with the temporal or nasallimbus. A halo of light will be observed aroundthe limbus as light is internally reflected withinthe cornea, but scattered by the sclera. Presenceof corneal opacities, edema or foreign bodieswill be made visible by the scattering light,appearing as bright patches against the darkbackground of the iris and pupil. Even minutenebular opacities can be picked up.
Specular Reflection
Specular reflection is achieved by positioningthe beam of light and microscope in such aposition so that the angle of incidence is equal
to the angle of reflection. The light can bereflected from either the anterior or posteriorcorneal surface. Note that the reflected lightshould pass through only one eyepiece, and,therefore, this method is monocular. Anyroughness or irregularity as induced by thepresence of corneal guttata is visible due toirregular reflection of light. A parallelepipedis used to view the endothelial cells of thecornea. The cells are seen only by one eye andthey appear in the opposite direction of theillumination light source. A parallelepiped isused for specular reflection. The angle betweenthe illumination source and the biomicroscopeshould be approximately 60 degrees and a highmagnification and high illumination must beused.
Place the biomicroscope directly in front ofthe patient’s eye and the illumination lightsource at 45-60 degrees. Just off the limbus,obtain a sharply focused parallelepiped of the
Fig. 3.9: Sclerotic scatter: A bright, wide-slit is shone directlyat the limbus; most of the light is trapped within the corneathrough total internal reflection, and, therefore, the corneaappears dark. When the light hits the opposite limbusor anything abnormal located within the corneal substance,it will scatter; some of the scattered light is directed backto the oculars, the abnormality is visible to the observer

43Slit-lamp Examination
cornea. Slowly advance the parallelepipedacross the cornea until a dazzling reflection ofthe filament is seen within the biomicroscope.This reflection is only seen by one eye. Keepingthe reflected light within the field of view ofbiomicroscope, the focus is moved back towardthe endothelial cells. There will be a point wheretwo images of the filament are seen, one bright,and the other ghost-like or copper-yellow incolor. When the biomicroscope is focused onthe ghost-like filament a mosaic of hexagonalcells are seen. It should be noted that even withX40 magnification the endothelial cells do notlook as large as most texts show. They resemblethe appearance of the dimpled surface of anorange peel or basketball. When the slit-lampillumination system and the biomicroscope areat equal angles of incidence and reflection, theendothelium of cornea is viewable. Both frontand back surfaces of the crystalline lens canalso be viewed by using the specular reflection.
Oscillatory Illumination
In oscillatory illumination, a beam of light isrocked back and forth by moving theilluminating arm or rotating the prism or mirror.This method may be used to determineoccasional aqueous floaters and the extent ofopacities in the crystalline lens.
Tangential Illumination
In tangential illumination iris is examined undervery oblique illumination while the microscopeis aligned directly in front of the eye. It is usefulfor examining tumors of the iris.
Clinical ApplicationSlit-lamp biomicroscopy is very useful in thediagnosis of eye diseases. It should routinelybe performed in almost all diseases of the eye.
1. Eyelids and lashes: A low magnification,with a long and fairly narrow beam shouldbe used to scan the eyelashes and lidmargins. The examination can reveal thepresence of crusted material, lash loss, ery-thema and flaking suggestive of blepharitis.
2. Conjunctiva: For examination of conjunc-tiva, pull the lower lid away from the globewith hand and look at the palpebral andbulbar conjunctiva. One may find foreignbody, purulent material, injection, conjunc-tival follicles, pinguecula or pterygium.Try to see the entire cul-de-sac while thepatient looking up. The upper lid mustbe everted to examine the upper palpebralconjunctiva.
3. Cornea: A narrow beam should be directedapproximately 45 degrees at the cornea. Scanthe entire corneal surface, moving lids andbeam appropriately while trying to evaluatethe epithelium, stromal thickness andendothelium. Note any defects, opacities orpigment dusting on the endothelium. Ifdefects are seen or suspected, instill a topicalanesthetic and fluorescein stain. Make thebeam as large as possible and flip the cobaltblue filter on. Examine the epithelium forareas of bright yellow-green staining. Thestaining represents an epithelial defect.
4. Anterior chamber: The depth of the anteriorchamber can be determined by comparingthe corneal thickness to the space betweenthe posterior surface of the cornea and theiris surface. The beam should be directed atapproximately 45 degrees and just inside thetemporal limbus. An anterior chamberdepth of less than 1/4 of the cornealthickness is considered a narrow-angle. Asearch for flare should also be made.
5. Iris: The iris is generally screened witha narrow-beam with full height. It shouldbe fairly flat and free of masses. Small

44 Diagnostic Procedures in Ophthalmology
pigmented nevi are common, but shouldbe flat. The pupillary margin should beround. A slight extension of the posteriorpigment around the margin is commonbut the presence of vessels on the iris isabnormal (rubeosis iridis).
6. Lens: The anterior capsule, cortex, nucleus,and posterior capsule of the lens arescanned with a narrow and full beam ofthe slit-lamp. When opacity in the lens ispresent, localize its depth within the lens.Pupillary dilatation facilitates thelocalization. If the pupils are dilated, widenthe beam slightly, lower the height anddirect the beam in a straight line towardthe retina between the microscope and theeye near the pupillary border. It resultsin retroillumination and focus on the lensto find iris defects or lens opacities.
7. Anterior vitreous: Anterior vitreous is seenwith a narrow beam. Small proteinaceousstrands are normal, but cells, blood oropacities in the vitreous are abnormal andwarrant investigations.
Slit-lamp Attachments
Besides routine examination of the eye, the slit-lamp with the help of its attachments is usedfor various investigative procedures. Importantslit-lamp attachments with their use arementioned below:
Goldmann tonometer (Fig. 3.10) is used forapplanation tonometry.
Pachymeter (Fig. 3.11) is used for measure-ment of corneal thickness.
Gonioscope (Figs 3.12A to C) is used forvisualization of the angle of the anteriorchamber.
Hruby lens is used for funduscopy.Digital camera for fundus photography (Fig.
3.13).
Fig. 3.10: Goldmann applanation tonometer
Fig. 3.11: Corneal pachymeter mounted on slit-lamp

45Slit-lamp Examination
A
B
C
Figs 3.12A to C: Goldmann gonioscopes: A Single-mirror, B Double-mirror, C Three-mirror
Fig. 3.13: Slit-lamp with digital camera
Bibliography1. Fingeret M, Casser L, Woodcombe HT. Atlas
of Primary Eye Care Procedures. Norwalk,Appleton & Lange, 1990.
2. Waring GO, Laibson PR. A systematic methodof drawing corneal pathologic conditions. ArchOphthalmol 1977:95:1540-42.

46 Diagnostic Procedures in Ophthalmology
FRANCISCO ARNALICH, DAVID PIÑERO, JORGE L ALIÓ
CornealTopography4
The cornea is the most important refractiveelement of the human eye, providing approxi-mately two-thirds of optical power of the eye,accounting for about 43-44 diopters at the cornealapex. Because its surface is irregular andaspherical, it is not radially symmetric, and simplemeasurement techniques are inadequate.
The great upsurge in refractive surgery ledto a need for improved methods to analyze cornealsurface and shape since refraction and kerato-metric data alone were insufficient to predictsurgical outcomes. Understanding and quanti-fying corneal contour or shape has become essen-tial in planning modern surgical interventionfor refractive surgery, as well as in cornealtransplantation. It is also very valuable forassessing optical performance of the eye.
The different methods for evaluating theanterior surface of the cornea, developed overseveral centuries, have, in the present era, ledto the modern corneal topographers.
History of Corneal MeasurementIn 1619 Scheiner analyzed corneal curvature bymatching the image of a window frame reflectedonto a subject’s cornea with the image producedby one of his calibrated spheres.
Fig. 4.1: Helmholtz ophthalmometer
Keratometer
In 1854 Helmholtz described the first truekeratometer, which he called an ophthalmometer
(Fig. 4.1). With some minor improvements, it isstill being used clinically for calculatingrefraction, intraocular lens power and contactlens fitting.
This apparatus is based on the tendency ofthe anterior corneal surface to behave like aconvex mirror and reflect light. The projectionof four points, or mires, onto the cornea, createsa reflected image that can be converted into a

47Corneal Topography
corneal radius, “r”, using a mathematicalequation that considers distance from the mireto cornea (75 mm in the keratometer), image sizeand mire size (64 mm in keratometer). The cornealradius can be transformed into dioptric powerusing the formula:
DP= (index of refraction of the lens - 1)/ rThe standard keratometric index represents
the combined refractive index of the anterior andposterior surfaces of the cornea, considers thecornea as a single refractive surface, and is1.3375. Thus, the equation can be simplified to:
DP= 337.5/ rAlthough keratometers are still common in
ophthalmology clinics, they do have specificlimitations that need to be considered in orderto avoid misleading conclusions.
1. Most traditional keratometers measure thecentral 3 mm of the cornea, which onlyaccounts for 6% of the entire surface.
2. It assumes that the cornea is a perfectlysphero-cylindrical surface, which it is not.The cornea is aspheric in shape, flatteningbetween the center and the periphery.Usually the central corneal curvature is fairlyuniform, and this is the reason why it canbe used to calculate corneal power in normalpatients. However, this is not true in somepathogenic conditions like ectatic disordersor after refractive surgery.
3. The keratometer provides no informationas to the shape of the cornea either insideor outside the contour of the mire. Severalcorneal shapes can all give the samekeratometric value so this apparatus is oflittle use should it become necessary toreconstruct the whole corneal morphology.
Keratoscopy and Photokeratoscopy
Goode presented the first keratoscope in 1847.Placido is credited to photograph the corneal
reflections of a series of illuminated concentricrings (known as Placido’s rings) first time in1880 (Fig. 4.2). In 1896 Gullstrand developeda quantitative assessment of photokeratoscopy.
The keratoscope, like a keratometer, projectsan illuminated series of mires onto the anteriorcorneal surface, usually consisting of concentricrings. The distance between the concentric ringsor mires gives the observer an idea of the cornealshape. A steep cornea will crowd the mires, whilea flat cornea will spread them out. Surfaceirregularity is seen as mire distortion.
When a photographic camera is attached tothe keratoscope, it becomes a photokeratoscope,which gives semi-quantitative and qualitativeinformation about the paracentral, midperipheraland peripheral cornea.
Based on the mathematical equation, it ispossible to calculate corneal power from objectsize. Still, photokeratoscopy gives limitedinformation on the central area, which is notcovered by the mires.
Fig. 4.2: Placido’s rings
Videokeratoscopy
Modern corneal topographers are based onvideokeratoscopy. A video camera is attached

48 Diagnostic Procedures in Ophthalmology
to the keratoscope, and the information isanalyzed by a computer that displays a color-coded map of power distribution or cornealcurvature of the anterior corneal surface (Fig.4.3). It overcomes some of the limitations of othermethods, since it measures larger areas of thecornea, with larger number of points thusincreasing resolution. Computer technologymakes it possible to create permanent recordsand conducts multiple data analyses.
Fig. 4.3: Videokeratography system
Shape of the Normal CorneaThe anterior corneal surface is a refractive surfacecharacterized by an almost spherical shape. Thehuman cornea is not a perfect sphere and isusually assumed to have a conic section. Thismodel could be represented in a simple way bymeans of following equation:
X2 + Y2 + (1 + Q)Z2 – 2RZ = 0
The Z axis is the axis of revolution of theconic, R is the radius at the corneal apex, and
Q is asphericity, a parameter that is used to specifythe type of conicoid.
For a perfect sphere this parameter takes thevalue of zero (Q=0), for an ellipsoid with the majoraxis in the X-Y plane (oblate surface) the asph-ericity is positive (Q>0), for an ellipsoid withthe major axis in the Z axis (prolate surface) asphe-ricity is negative (-1<Q<0), while for a paraboloidwith its axis along the Z axis the value is -1, andit is less than -1 for a hyperboloid (Fig. 4.4).
Other parameters have been defined toclassify the conicoid form of the cornea: “P”,the shape factor (P=Q+1), or the eccentricityvalue, “e”, defined as e = – Q
Fig. 4.4: Different types of conic section
Several studies have shown that the anteriorcorneal configuration tends to be prolate, i.e. thecornea progressively flattens out towardsperiphery by 2-4 diopters (Fig. 4.5).Theasphericity of the normal cornea, depending ondifferent studies, ranges from -0.26 to -0.11.

49Corneal Topography
This tendency to flatten towards peripherycan be detected in the topographic map. Towardthe periphery, dioptric power appears to decline,and the nasal area flattens more than the temporalarea (Fig. 4.6). This could be helpful in distin-guishing right eye topography from the left eyetopography. The topographic patterns of the twocorneas of the same individual often show mirror-image symmetry.
Corneal topographic patterns (Fig. 4.7) havebeen studied in normal eyes and the followingshapes have been found: round (23%), oval(21%), symmetric bow-tie typical for regularastigmatism (18%), asymmetric bow-tie (32%),and irregular astigmatism (7%). In the roundand oval shapes there is an area of uniformdioptric power close to 43 diopters (D) in thecenter of the cornea. The bow-tie configuration
Fig. 4.5: Corneal profile in principal meridians
Fig. 4.6: Corneal topography in a normal right eye. There is a flatteningtowards the periphery, more pronounced at the nasal area

50 Diagnostic Procedures in Ophthalmology
Figs 4.7A and B: A Oval topographic pattern, B Bow-tie patternthat shows an against-the-rule astigmatism
reflects the existence of corneal astigmatism.Depending on the position of the axes, cornealastigmatism is defined as against-the-rule (the
steepest axis is horizontal), with-the-rule (thesteepest axis is vertical), or oblique (the steepestaxis is near the meridian angles of 45º or 135º).
A
B

51Corneal Topography
Figs 4.7C and D: Normal corneal topographic patterns:C With-the-rule astigmatism, D Oblique astigmatism
C
D

52 Diagnostic Procedures in Ophthalmology
Fundamentals and TechnologicalApproaches to Corneal Topography
Specular Reflection Techniques
Placido Disk System
A Placido disk system consists of a series ofconcentric illuminated rings or mires that arereflected off of the cornea and recorded by video-computerized systems. Currently, several compa-nies manufacture instruments called videokerato-scopes that picture corneal shape based on thePlacido disk method, and, in fact, this approachhas been the most clinically and commerciallysuccessful. Two types of Placido targets havebeen used:
1. Large diameter target (disk-shaped), this isless sensitive to misalignment due to a longworking distance, but there can be a lossof data due to interference by the patient’sbrow and nose.
2. Small diameter target (cone-shaped), this isdesigned for a short working distance andcan be influenced by automatic alignmentand focusing or compensation ofmisalignment for accuracy. It does notpresent data loss due to shadows.
Limitations of placido disk system: Placido-basedapparatus creates a three-dimensional systemby making geometric assumptions about thecornea since the apparatus does not measurecorneal surface directly. These assumptions arenot accurate for irregular and aspheric corneas.The reflection technique depends on the integrityand normality of the tear layer.
Interferometric Method-based Systems
In essence, a reference surface (or its hologram)is compared to the tested surface, the cornealsurface, and interference fringes are producedas a result of differences between the two shapes,
which can be interpreted as a contour map ofsurface elevations. Interference techniques areused in the optical industry to detect lens andmirror aberrations of subwavelength dimensions.High accuracy is theoretically possible, butclinical use has not been very wide-spread asyet.
Moire Deflectometry-based Systems
The deflections of the rays reflected off the cornealsurface are analyzed to build up a surfaceelevation map.
Diffuse Reflection Techniques
The following three methods, Moire fringes,Rasterography, and the Fourier transformprofilometry method, modify the natural specularcondition of the anterior surface of the corneatransforming it into a diffusing surface instillingfluorescein in the eye. A structured light pattern(grid or raster) is projected onto the cornea. Dueto the topography of the cornea, if the fringesare observed from a point that is different fromthat of the projecting point, a distorted fringepattern is observed. These stereo-triangulationmethods locate the cornea in space (x, y andz coordinates) and can reconstruct corneal shape.The only difference between the three methodsis the way in which data is processed andanalyzed.
Techniques using Scattered Light-slit-based Systems
When the slit image is on the cornea, it splitsinto a specular reflection and a refracted beamthat penetrates the corneal surface and is scatteredby the tissue of the cornea. An image of thisscattered light within the corneal tissue iscaptured by an imaging system, which usestriangulation to measure the elevation of the

53Corneal Topography
anterior and posterior corneal surfaces withrespect to a reference plane.
ORBSCAN II TM (Fig. 4.8) uses placido diskand slit-based systems to obtain 40 slit-imagesof the cornea. These images are captured overone second and recorded.
Fig. 4.8: Orbscan II system
How to Interpret a CornealTopography Map?Accurate interpretation of corneal shape usingcolor-coded topographic maps is difficult andconfusing for many clinicians, even experiencedcornea specialists. In order to obtain the bestperformance in the analysis of corneal maps,several important points must be taken intoconsideration. It is critical to check the raw imagefirst. Then it is necessary to focus on the scaleand step intervals with which the color-codedtopographic map is built up. It is also importantto review different topographic displays,especially when evaluating irregular or post-surgery corneas.
Raw Photokeratoscope Image
The photokeratoscope image displays theplacido’s rings projected onto the cornea (Fig.
4.9). When considering a color-coded map, theclinician must check that the unprocessed dataupon which it is based, are reliable. If the video-keratoscope image is irregular, data cannot beprocessed by the instrument in a meaningful way.
Thus, for Placido disk-based computerizedvideokeratoscopes, the videokeratoscope imageshould not be ignored. In fact, it is recommendedto check this map before referring to any of theother topographic displays, and to go back toit when there are any doubts regarding theaccuracy of the displayed data. This imageprovides important information for assessing tearfilm quality, mire centering on the cornea, lidopening, or the causes of local irregularities, andother artefacts. If the device used displayscomputer tracking of the placido mires it isimportant to rule out tracking errors.
Devices that rely only on scanning slit-technology to analyze the anterior corneal surfacelack valuable information provided by the rawvideokeratoscope image. Whether the resultingmap is based on reliable primary data or notis impossible to verify without the raw image.
Some instruments identify regions ofuncertainty, showing mire distortions that cannotbe reliable, by leaving blank areas on the color-coded map. Other instruments merely extrapolate
Fig. 4.9: Photokeratoscope raw image

54 Diagnostic Procedures in Ophthalmology
onto the uncertain regions information gatheredfrom adjacent regions with reliable data.
Color-Coded Scales
The shape of a cornea can be measured andrepresented by color-coded maps in which agiven color indicates a different curvature or
elevation. The usual color spectrum for cornealpowers shows near-normal power as green, lowerthan-normal power as cool colors (blues) andhigher than normal powers as warm colors (reds).Most topographers offer absolute as well asnormalized scales to allow the clinician tocustomize the information for maximal clinicalvalue (Fig. 4.10):
Figs 4.10A and B: Corneal topography map represented using anormalized scale A, an absolute scale B
A
B

55Corneal Topography
i. Normalized scale (variable scale) uses a givencolor for different curvatures or elevationson each cornea analyzed, depending on therange for that particular cornea, determinedby its flattest and steepest values. Thesemaps are difficult to interpret and can leadto an incorrect diagnosis since they maymagnify subtle changes in corneal surfaceif the scale is too narrow, or minimize largedistortions if the scale is too wide. Inaddition, color recognition, one of theprimary clues used to interpret on cornealtopography, is lost with a variable scale,since it uses different colors for differenteyes.
ii. Absolute scale (fixed scale) uses the same colorfor the same curvature or elevation no matterwhich eye is examined. However, there aremany different absolute scales since theexaminer can choose different variablessuch as range or step size (intervals in colorchanges). For the specified scale, however,each display will use the same colors, stepsand range. In order to facilitate comparisons
over time and between patients, it isrecommended to stick with a given fixedscale for routine examinations and to changethe scale in the particular cases in whichthis becomes necessary. As an example thepopular Klyce/Wilson scale ranges from 28D to 65 D in equal 1.5 D intervals. Currently,there is no consensus as to the best absolutescale, but in general, dioptric scales withintervals smaller than 0.5 D are not clinicallyuseful and provide details that are notrelevant and may complicate map interpre-tation. For corneas with large dioptric ranges,for instance in advanced keratoconusintervals greater than 0.5 D are recommen-ded. Regarding scales for elevation maps,elevation steps of approximately 5 micronsappear to be clinically useful.
As mentioned previously, color patternrecognition makes it possible to identify commontopographic patterns such as the corneal cylinder,keratoconus (local area of inferonasal steepening)or pellucid marginal degeneration (butterfly-pattern or inferior arcuate steepening), as well
Fig. 4.11: Corneal topography after myopic LASIK

56 Diagnostic Procedures in Ophthalmology
as features associated with refractive surgery (Fig.4.11), such as optical zone size, centration, andcentral islands.
Topographic Displays: Corneal Maps
Different types of maps are used for displayingcurvatures, elevations and irregularities of thecornea.
Axial Map (Sagital Map)
Although this is the original and most commonlyused map, its values only provide a goodapproximation for the paracentral cornea (Fig.4.12A). The axial map measures the radius ofcurvature for a comparable sphere (with the sametangent as the point in question) with a center ofrotation on the axis of the videokeratoscope.Localized changes in curvature and peripheraldata are poorly represented, because of thespherical bias of the reference optical axis.However, newer algorithms in some devices (e.g.arc-step method) have improved the accuracy ofcurvature measurements in the peripheral region.
Local Tangential Curvature Map(Instantaneous Map)
The tangential map displays the tangential/instantaneous/local radius of curvature ortangential power, which is calculated by referringto the neighboring points and not to the axisof the videokeratoscope (Fig. 4.12B). Tangentialmaps reflect local changes and peripheral databetter than axial maps. They are very useful indetecting local irregularities, corneal ectacticdiseases, or surgically induced changes. Forexample, in keratoconus corneas with adisplaced apex, tangential maps are lessinfluenced by peripheral distortion, and candetermine the position and extent of the conemore precisely than axial maps.
Refractive Map
The refractive map displays the refractive powerof the cornea, which is calculated based on Snell’slaw of refraction, assuming optical infinity (Fig.4.12C). This map correlates corneal shape tovision, and is useful in understanding the effectsof surgery.
Elevation Map
The elevation map displays corneal height orelevation relative to a reference plane (Fig. 4.12D),with a presumed assumption of the shape, whichmay be the best-fit sphere, best-fit asphere,average corneal shape, or even based onpreoperative data. Points above the referencesurface are positive (hot colors) and points belowthe reference surface are negative (cool colors).This map shows the three-dimensional (3D)shape of the cornea and is useful in measuringthe amount of tissue to be removed by a refractivesurgical procedure, assessing postoperativevisual problems, or planning and/or monitoringsurgical procedures.
Difference Map
The difference map displays the changes incertain values between two maps (Fig. 4.13). Itis used to monitor any type of change, such asrecovery from contact lens-induced warpage orsurgery-induced changes.
Relative Map
The relative map displays some values bycomparing them to an arbitrary standard (e.g.sphere, asphere, or normal cornea) and a specificmathematical model. This map enhances ormagnifies unique features of the cornea beingexamined.

57Corneal Topography
Fig. 4.12A: Axial map
Fig. 4.12B: Instantaneous map

58 Diagnostic Procedures in Ophthalmology
Fig. 4.12C: Refractive map
Fig. 4.12D: Elevation map
Figs 4.12A to D: Different kind of topography maps for the same cornea

59Corneal Topography
Irregularity Map (Surface Quality Maps)
The irregularity map uses the same techniqueas the elevation map, but takes as a referencesurface the best-fit spherocylindrical toric surface.The difference between the actual surface andthe theoretical surface represents that part of thecornea that cannot be optically corrected. Likerefractive power maps, the irregularity map onlyhas clinical meaning when considering thevalues over the pupillary area.
Numerous other displays, including threedimensional maps (Fig. 4.14) and astigmaticvector analysis are available but less commonlyused.
Fig. 4.13: Difference map
Fig. 4.14: Three-dimensional elevation map

60 Diagnostic Procedures in Ophthalmology
A Good Topography ExaminationCorneal topography is a non-invasive imagingtechnique for mapping the surface curvature ofthe cornea. The specific method varies dependingon the device used, but some aspects are common.The patient is seated facing a bowl containingan illuminated pattern which is focused on theanterior surface of his cornea. The reflectedpattern is analyzed by a computer that calculatesthe shape of the cornea by means of differentgraphic formulae. Although computer programsare created to be very accurate, they can notrecognize, and account for, every problem. Criticalpoints for precise measurement are accuratealignment, centering and focusing (Fig. 4.15). Theydepend on the ability of the examiner to takea good measurement. Another potential sourceof error is tear film irregularities, for examplefocal flattening over a dry patch. These may bemost easily identified on the raw image.
Tear film breakup causes mistracking of themires and artefacts in the topography patternand apparently look like significant irregula-rities (Fig. 4.16). These corneal irregularitiescould suggest a corneal pathology, such askeratoconus, and result in wrong diagnosis (Fig.4.17). To avoid disturbing the tear film, cornealtopography should be performed before adminis-
tering dilating drops and taking intraocularpressures.
In addition, one must avoid artefacts inducedby the nose or the eyelids which can lead toa loss of information in certain areas (Fig. 4.18).These errors are transformed into black areasor areas without data on the topographic map.Correct positioning of the head, eyes and eyelidopening should be ensured to avoid theseproblems.
Quantitative Descriptors of CornealTopography: Corneal IndexesColor-coded maps provide a rapid visual methodfor clinical diagnosis, but do not supplynumerical values that can be used for clinicalmanagement. Several corneal indexes describedifferent features of corneal topography quantita-tively and are of great aid in contact lens fitting,for improved assessment of the optical qualityof the corneal surface, and can be used in artificialintelligence systems to aid in the diagnosis ofcorneal shape anomalies. Some of the most usefulcorneal indexes are described below:
Fig. 4.15: Bad image for topography analysis due tolack of focus
Fig. 4.16: Distortion of the placido rings because oftear film breakup

61Corneal Topography
Basic Topographic Indexes
Simulated Keratometry Reading(SimK values)
This is a simple descriptor of corneal topographythat provides the power and axes of the steepest
and flattest corneal curvatures just as K1 andK2 are provided by the classic keratometer, towhich it correlates well. The cylinder is calculatedfrom the difference between SimK1 and SimK2.Its common uses are:a. Contact lenses fitting
Fig. 4.17: Topographic irregularities and patches on the mapbecause of a tear film instability
Figs 4.18A and B: Loss of information of certain areas of the cornea due toeyelids not opened enough A, and due to nose B
A B

62 Diagnostic Procedures in Ophthalmology
b. Refractive surgery calculations, andc. Assessing an irregular corneal shape, since
it gives the quantity and axis of astigmatism.
Minimum Keratometry Reading (MinK)
This is the minimum meridional power from rings7, 8 and 9. The average power and axis aredisplayed.
Corneal Eccentricity Index (CEI)
This index estimates the eccentricity of the centralcornea, and is calculated by fitting an ellipseto the corneal elevation data. A positive valueis for a prolate surface, negative value for anoblate surface (for example flattened corneas aftermyopic refractive surgery), and zero value fora perfect sphere. Normal central corneas areprolate, meaning they are steeper in the centerthan in the periphery, and tend to be around0.30. This value is used for fitting contact lenses.
Average Corneal Power
This is the area-corrected average of corneal powerin front of the pupil. It usually corresponds tothe spherical equivalent of the classic keratometer,except after decentered refractive surgery. It maybe helpful in determining central corneal curva-ture when calculating the appropriate intraocularlens power.
Surface Regularity Index andPotential Visual Acuity
Surface regularity index (SRI) measures theregularity of the corneal surface that correlateswith the best spectacle-corrected visual acuityassuming the cornea to be the only limiting factor.This index adds up the meridional mire-to-mirepower changes over the apparent pupil entrance.The SRI value increases with increase in the
irregularity of the corneal surface, and its normalvalue is less than 1.0. It measures optical quality.Potential visual acuity (PVA) is a range of theexpected visual acuity that is achievable basedon the corneal topography and can be calculatedbased on SRI.
Surface Asymmetry Index
Surface asymmetry index (SAI) is a descriptorof the corneal surface that measures the differencebetween points located 180º apart in a greatnumber of equally spaced meridians. Therefore,as the cornea becomes less symmetric, the indexdiffers more from 0.
Other indexes, some of which will bementioned below, have been developed, andmight be exclusive to one particular topographer.The clinician should evaluate the meaning, utilityand validity of each index since some indexeshave been tested in peer-reviewed literature whileothers have not.
Screening Tools and ArtificialIntelligence Programs (NeuralNetworks) for Classification andAuto Diagnosis
As mentioned previously, even for an experiencedperson, interpretation of topography can bedifficult, particularly when trying to differentiatethe early stages of a disease from a normal cornea(suspected keratoconus), or when trying todifferentiate between two similar conditions(contact lens warpage vs. early keratoconus).Several mathematical algorithms have beendeveloped to help solve this problem, with highsensitivity and specificity.
Rabinowitz and Mc Donnell developed thefirst numerical method for detecting keratoconususing only topographic data. They use the I-Svalue, which measures the differences betweenthe superior and inferior paracentral corneal

63Corneal Topography
regions, the central corneal power (Max K), andthe power difference between both eyes. Theirstudy presented that patients with keratoconus(suspect) had central corneal power > 47.2 Dor I-S > 1.4 while those with clinical keratoconushad central corneal power > 47.8 D or I-S > 1.9.
However, using only these simplemeasurements for a diagnosis could createspecificity problems. To solve the specificityproblem, the new strategy must be able to detectand consider the unique characteristics ofkeratoconus maps, such as local abnormalelevations. The Keratoconus Prediction Index,
developed by Maeda et al, is calculated fromthe Differential Sector Index (DSI), the OppositeSector Index (OSI), the Center/Surround Index(CSI), the SAI, the Irregular Astigmatism Index(IAI), and the percent Analyzed Area (AA). Thismethod partially overcomes the specificitylimitation.
Maeda et al also developed the neural network
model, based on artificial intelligence. It is a muchmore sophisticated method for classifying cornealtopography and detecting different cornealtopographic abnormalities; it employs indexesthat were empirically found to capture specificcharacteristics of the different corneal patho-logies, including keratoconus. Further modifica-tions in neural network approach developed bySmolek and Klyce supposedly produce 100%accuracy, specificity and sensitivity indiagnosing keratoconus.
Corneal Aberrometry: Fundamentalsand Clinical ApplicationsWhenever a point object does not form a pointimage on the retina, as it should be in an idealoptical system, one encounters an opticalaberration. Although one may feel that he ismeasuring the total refractive error, whenrefracting a patient, one is actually only
considering two components of a whole hostof refractive components in the optics of the eye.However, these two components — sphere andcylinder do constitute the main opticalaberrations of an eye. Even in a normal eye withno subjective need for refraction, opticalaberrations can be detected.
Since the cornea has the highest refractivepower, more than 70% of the eye’s refraction,it is the principal site of aberrations, althoughthe lens and the tear film may also contributeto aberrations.
Fundamentals
Measuring Total Wavefront Aberration
It is possible to express ideal image formationby means of waves. An ideal optical system willprovide a spherical converging wave centeredat the ideal point image. However, in practice,the resulting wavefront, differs from this idealwavefront. The deviation from this idealwavefront is called wavefront aberration, and themore it differs from zero, the more the real imagediffers from the ideal image and the worse theimage quality. Ocular wavefront sensing devicesuse four main technologies to determine theresulting or output wave:
1. The Shack-Hartmann method is the mostwidely used and is inspired by astronomytechnology. It consists of analyzing the waveemerging from the eye after directing a smalllow energy laser beam. This reflected waveis divided by means of a series of smalllenses (lenslet array) which generatesfocused spots. The position of spots isrecorded and compared to the ideal one
2. The Tscherning technique uses typically a gridthat is projected onto the retina. Thedistortion of the pattern is analyzed andused to calculate the wavefront aberrationof the eye.

64 Diagnostic Procedures in Ophthalmology
3. The ray tracing system is similar to theTscherning technique. However, instead ofa grid, a programmable laser serially projectslight beams that forms spots on the retinaat different locations.
4. The spatially resolved refractometer evaluatesthe wavefront profile using the subjectivepatient response. This technology is notpractical for clinical use.
Measuring Corneal Wavefront Aberration
It is known that 80% of all aberrations of thehuman eye occur in the corneal area and only20% of aberrations originate from the rest of theocular structures. The effect of corneal aberrationsis especially important after corneal surgery such
as keratorefractive procedures or penetratingkeratoplasty, since the anterior corneal surfaceis the only one modified. The corneal wavefrontaberration, which is the component of the totalocular wavefront aberration attributed to thecornea, can be derived from the corneal topograp-hic height data. Specifically, the calculation ofwavefront aberrations is performed by expandingthe anterior corneal height data into a set oforthogonal Zernike polynomials (Fig. 4.19).
Zernike Polynomials
For a quantitative description of the wavefrontshape there is a need for a more sophisticatedanalysis than conventional refraction, as the latteronly divides the wavefront in two basic terms:
Fig. 4.19: Corneal wavefront analysis derived from height topography data

65Corneal Topography
sphere and cylinder. One can obtain moreinformation by breaking down the wavefront intoterms which are clinically meaningful, besidesthe sphere and the cylinder. For this purpose,a standard equation has been universallyaccepted by refractive surgeons and visionscientists, known as Zernike polynomials.
Zernike polynomials are equations which areused to fit the wavefront data in a three dimen-sional way. The wavefront function is decompo-sed into terms that describe specific opticalaberrations such as spherical aberration, coma,etc. (Fig. 4.20). Each term in the polynomial hastwo variables, ρ (rho) and θ (theta), where ρ isthe normalized distance of a specific point fromthe center of the pupil, and θ is the angle formedbetween the imaginary line joining the pupillarycenter with the point of interest and the horizontal.According to that, we can imagine thataberrations are strongly influenced by pupil size,and, therefore, aberrometric measurementsshould be related to the diameter of the patient’spupil.
Zernike terms (Znm) are defined using a double
index notation: a radial order (n) and an angular
Fig. 4.20: Zernike polynomial expansion
frequency (m). When talking about first, second,third order aberrations we point to indicate theradial order (n). Each radial order involves n+ 1 term. There are an infinite number of Zerniketerms that can be used to fit an individualwavefront. However, for clinical practice, termsup to the 4th radial order are usually considered:
1. Zernike terms below third order can bemeasured and corrected by conventionaloptical means. The first order term, the prism,is not relevant to the wavefront as itrepresents tilt and is corrected using a prism.The second order terms represent low order
aberrations that include defocus (sphericalcomponent of the wavefront) and astig-matism (cylinder component). Wavefrontmaps that measure only defocus andastigmatism can be perfectly corrected usingspectacles and contact lenses.
2. After the second radial order comes high
order aberrations. These are not measured byconventional refraction or auto refraction.The aberrometer is the only method availablethat can quantify these complex kinds ofdistortions.
3. Third order terms describe coma and trefoildefects.
4. Fourth order terms represent tetrafoil,spherical aberration and secondary astig-matism components.
Because spherical and coma aberrations referto symmetrical systems and the eye is notrotationally symmetrical, the terms spherical-likeand coma-like aberrations are normally used(Fig. 4.21).
Wavefront Maps
Wavefront map describes the optical path diffe-rence between the measured wavefront and thereference wavefront in microns at the pupilentrance. The wavefront error is derivedmathematically from the reconstructed wavefront

66 Diagnostic Procedures in Ophthalmology
Fig. 4.21: Spherical-like and coma-like wavefront aberration maps
by one of the techniques described above. It isplotted as a 2D or 3D map for qualitative analysisin a similar fashion to corneal topography maps.In wavefront error maps, each color representsa specific degree of wavefront error in microns(Fig. 4.22) and like corneal topography maps,it is necessary to consider the range and theinterval of the scale.
Optical and Image Quality
In order to evaluate the impact of aberrationson visual quality following quantitative para-meters have been defined (Fig. 4.23):
Peak to valley error (PV error): This is a simplemeasure of the distance from the lowest pointto the highest point on the wavefront and is not

67Corneal Topography
the best measurement of optical quality sinceit does not represent the extent of the defect.
Root mean square error (RMS error): This measureis by far the most widely used. In a simple way,the RMS wavefront error is a statistical measureof the deviation of the ocular or corneal wavefrontfrom the ideal (Table 4.1). In other words, itdescribes the overall aberration and indicateshow bad individual aberrations are.
Strehl ratio: This represents the ratio of themaximum intensity of the actual image to themaximum intensity of the fully diffracted limitedimage, both being normalized to the sameintegrated flux. This ratio measures opticalexcellence in terms of theoretical performance
results and it is linked to the RMS by the Maréchalformula.
Point spread function (PSF): This is the spreadfunction observed on the retina when the objectis a point in infinity. PSF measures how wellone object point is imaged on the output plane(retina) through the optical system. In the eye,small pupils (approximately 1 mm) producediffraction-limited PSFs, because of the pupilborder. In larger pupils, aberrations tend to bethe dominant source of degradation.
Modulation transfer function, Phase transfer function
and Optical transfer function: Sinusoidal gratingsgreatly simplify the study of optical systems,because irrespective of the amount of eye aberra-
Fig. 4.22: Corneal wavefront aberration maps that includeall kind of aberrations including low and high order

68 Diagnostic Procedures in Ophthalmology
Fig. 4.23: Visual quality summary obtained with the CSO topographer. It is possible to visualize the wavefrontmap (gray scale), Strehl ratio, PSF and MTF function
TABLE 4.1: REFERENCE VALUES FOR CORNEAL ABERRATIONS IN THE NORMAL POPULATION
Pupil Total Astigmatism Spherical Coma RMS Spherical- Coma-(mm) RMS RMS aberration like RMS like RMS
3 0.19 ± 0.07 0.14 ± 0.08 0.04 ± 0.03 0.05 ± 0.03 0.07 ± 0.02 0.09 ± 0.03
5 0.53 ± 0.21 0.43 ± 0.24 0.15 ± 0.05 0.14 ± 0.08 0.18 ± 0.05 0.20 ± 0.08
7 1.26 ± 0.43 0.92 ± 0.53 0.52 ± 0.17 0.42 ± 0.23 0.57 ± 0.16 0.52 ± 0.22
RMS: root mean square, Coma primary coma: terms Z3±1, Spherical aberration primary spherical aberration: term
Z40 Spherical-like: terms fourth and sixth order, Coma-like: terms third and fifth order
Reference: Vinciguerra P, Camesasca FI, Calossi A. Statistical analysis of physiological aberrations of the cornea.J Refract Surg 2003; 19 (Suppl): S265-9.

69Corneal Topography
tions, sinsusoidal grating objects always producesinusoidal grating images. Consequently, thereare only two ways that an optical system canaffect the image of a grating, by reducing contrastor by shifting the image sideways (phase-shift).The ability of an optical system to faithfullytransfer contrast and phase from the object tothe image at a specific resolution are calledrespectively the modulation transfer function (MTF)and the phase transfer function (PTF). The eye’soptical transfer function (OTF) is made up of theMTF and the PTF. A high-quality OTF is,therefore, represented by high MTF and lowPTF.
Clinical Applications
Aberrometers allow practitioners to gain a betterunderstanding of vision by measurement of highorder aberrations. These aberrations reflect arefractive error that is beyond conventionalspheres and cylinders. There may be a large groupof patients whose best corrected visual acuity(BCVA) may improve significantly on removalof the optical aberrations and this new refractiveentity has been called aberropia. Reduced opticalquality of the eye produced by light scatter andoptical aberrations may actually be the root causeof blurred vision associated with dry eyesyndrome and tear film disruption. Measurementof these aberrations can also be helpful inkeratoconus, orthokeratology, post graft fitting,irregular astigmatism or when refractive surgeryhas reduced the patient’s optical quality.
Customized ablations are the future step inlaser technology that should address not onlyspherical and cylindrical refractive errors (low-order aberrations), but also high-order aberra-tions such as trefoil and coma (Fig. 4.24). Thus,vision can be optimized to the limits determinedby pupil size (diffraction) and retinal structureand function.
Clinical Uses of Corneal Topography
Pathological Cornea
Corneal topography is a very important tool inthe detection of corneal pathologies, especiallyectatic disorders. Screening for these anomaliesor their potential development is a critical pointin preoperative evaluation for refractive surgery.Keratorefractive procedures are contraindicatedin these abnormal corneas.
Keratoconus
Keratoconus is characterized by a localizedconical protrusion of the cornea associated withan area of corneal stromal thinning, especiallyat the apex of the cone. The typical associatedtopographic pattern is the presence of an inferiorarea of steepening (Fig. 4.25). In advanced cases,the dioptric power at the apex is at or above55 D. In a small group of patients, the topographicalterations may be centered at the central cornea.In these cases there may be an asymmetric bow-tie configuration, and normally the inferior loopis larger than the superior loop (Fig. 4.26).Keratoconic corneas have three common charac-teristics that are not present in normal corneas:
1. An area of increased corneal power surroun-ded by concentric areas of decreasing power
2. An inferior-superior power asymmetry3. A skewing of the steepest radial axes above
and below the horizontal meridian.Keratoconus suspects are problematic. They
may signal impending development of a clinicalkeratoconus, but they may also represent ahealthy cornea. The lack of ectasia in the fellowcornea does not indicate that the keratoconussuspect will not progress to true keratoconus.In these cases the ideal management is closefollow-up of the signs of keratoconus in orderto check on their stability, and a thoroughanalysis of the videokeratographic indexes.

70 Diagnostic Procedures in Ophthalmology
Figs 4.24A and B: Customized ablation designed according to corneal aberration for the correctionof aberrations induced by a decentered ablation. There is a large amount of coma: axial mapA and customized ablation designed B with the ORK-CAM software (Schwind)
Pellucid Marginal Degeneration
Pellucid marginal degeneration is characterizedby an inferior corneal thinning between 4 and8 O’clock positions above a narrow band of clearthinned corneal stroma. The ectasia is extremelyperipheral and it presents a crescent-shapedmorphology. This pattern has a classical
“butterfly” appearance that results in a flatteningof the vertical meridian and a marked against-the-rule irregular astigmatism (Fig. 4.27).
Keratoglobus
Keratoglobus is a rare bilateral disorder in whichthe entire cornea is thinned out most markedly
A
B

71Corneal Topography
Fig. 4.25: Keratoconus topography pattern
near the corneal limbus, in contrast to thelocalized central or paracentral thinning ofkeratoconus. It is very difficult to obtain reliableand reproducible measurements in these casesdue to the high level of irregularity and the poorquality of the associated tear film. Reliabletopographic examinations show an arc of
peripheral increase in corneal power (steepening)and a very asymmetrical bow- tie configuration.
Terrien’s Marginal Degeneration
In Terrien´s marginal degeneration there is aflattening over the areas of peripheral thinning.

72 Diagnostic Procedures in Ophthalmology
Fig. 4.26: Keratoconus with an asymmetric bow-tie configuration
When thinning is restricted to the superior and/or inferior areas of the peripheral cornea, thereis a relative steepening of the corneal surfaceapproximately 90 degrees away from themidpoint of the thinned area. Therefore, highagainst-the-rule or oblique astigmatism is a
common feature, as this disorder involves morefrequently the superior and/or inferior peripheralcornea. If the area of thinning is small or if thedisorder extends around the entire circumferenceof the cornea, central cornea may remainrelatively spared with a spherical configuration.

73Corneal Topography
Fig. 4.27: Pellucid marginal degeneration topography pattern
Fig. 4.28: Corneal astigmatism induced by a pterygium

74 Diagnostic Procedures in Ophthalmology
Pterygium
Pterygium is a triangular encroachment of theconjunctiva onto the cornea usually near themedial canthus. When the lesion continues togrow out onto the cornea, it could lead to a highdegree of astigmatism. When the growth ofpterygium is about 2 mm or more, a flatteningof the cornea at the axis of the lesion occurs(Fig. 4.28). This produces a marked with-the-ruleastigmatism, even of more than 4 D. The evolutionof the pathology and the surgical outcome couldbe monitored by changes in corneal topography.
Postoperative Cornea inRefractive Surgery
Keratorefractive procedures attempt to alter thecurvature of the central and mid-peripheralcornea, and usually have a minimal effect onthe corneal periphery. The area in which thecurvature is modified is called the optical zone.This tends to be surrounded by a small zoneof altered curvature before normal cornea is
reached at the periphery. The corneal effect ofsurgery could be determined by analyzing thedifference map between the preoperative andpostoperative measurements.
Postradial Keratotomy (RK)Radial keratotomy (RK) corrects myopia byplacing a series of radial incisions (nearly fullcorneal thickness) leaving a central clear zone(optical zone). These incisions cause a flatteningof the central cornea due to retraction of the mostanterior collagen fibers and the outward pressureof the intraocular force. This area of flatteningis surrounded at an approximately 7 mm zoneby a bulging ring of steepening called theparacentral knee. This increases asphericity andcorneal irregularity.
A very typical finding in these corneas isa topographic pattern with a polygonal shape.Depending on the number of incisions made,squares, hexagons or octagons can be seen. Theangles of the polygons correspond closely to thecentral ends of the incisions (Fig. 4.29).
Fig. 4.29: Polygonal pattern in a postradial keratotomy cornea
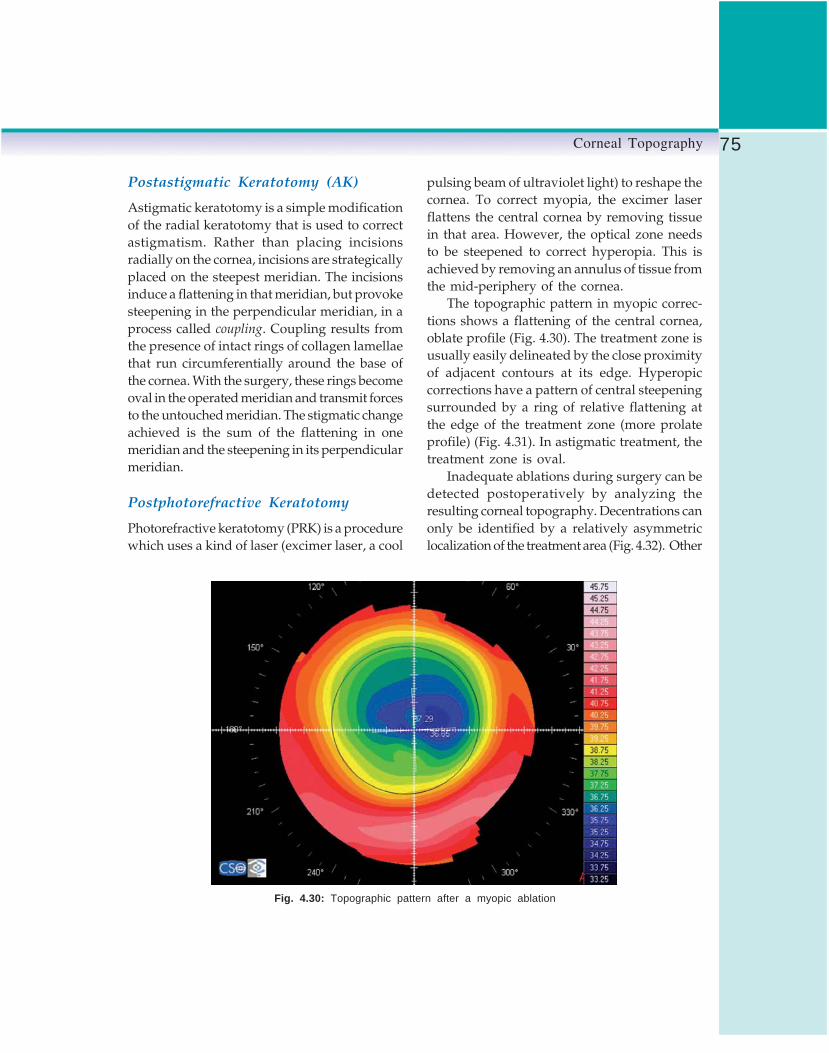
75Corneal Topography
Postastigmatic Keratotomy (AK)
Astigmatic keratotomy is a simple modificationof the radial keratotomy that is used to correctastigmatism. Rather than placing incisionsradially on the cornea, incisions are strategicallyplaced on the steepest meridian. The incisionsinduce a flattening in that meridian, but provokesteepening in the perpendicular meridian, in aprocess called coupling. Coupling results fromthe presence of intact rings of collagen lamellaethat run circumferentially around the base ofthe cornea. With the surgery, these rings becomeoval in the operated meridian and transmit forcesto the untouched meridian. The stigmatic changeachieved is the sum of the flattening in onemeridian and the steepening in its perpendicularmeridian.
Postphotorefractive Keratotomy
Photorefractive keratotomy (PRK) is a procedurewhich uses a kind of laser (excimer laser, a cool
pulsing beam of ultraviolet light) to reshape thecornea. To correct myopia, the excimer laserflattens the central cornea by removing tissuein that area. However, the optical zone needsto be steepened to correct hyperopia. This isachieved by removing an annulus of tissue fromthe mid-periphery of the cornea.
The topographic pattern in myopic correc-tions shows a flattening of the central cornea,oblate profile (Fig. 4.30). The treatment zone isusually easily delineated by the close proximityof adjacent contours at its edge. Hyperopiccorrections have a pattern of central steepeningsurrounded by a ring of relative flattening atthe edge of the treatment zone (more prolateprofile) (Fig. 4.31). In astigmatic treatment, thetreatment zone is oval.
Inadequate ablations during surgery can bedetected postoperatively by analyzing theresulting corneal topography. Decentrations canonly be identified by a relatively asymmetriclocalization of the treatment area (Fig. 4.32). Other
Fig. 4.30: Topographic pattern after a myopic ablation

76 Diagnostic Procedures in Ophthalmology
Fig. 4.31: Topographic pattern after a hyperopic ablation
Fig. 4.32: Pattern of decentered myopic ablation

77Corneal Topography
complicated patterns that may lead to severevision disturbances are the presence of focalirregularities or central islands (Fig. 4.33)produced by an inhomogeneous laser beam oran irregular process of corneal healing.
Postlaser in situ Keratomileusis
Postlaser in situ keratomileusis (LASIK) is anexcimer laser procedure like PRK, but in thiscase tissue is ablated under a superficial cornealflap in order to minimize the influence of theepithelium. The topographic patterns for myopicand hyperopic corrections are the same as inPRK (Figs 4.30 and 4.31). Although the ablationis covered by a flap of corneal tissue, surfaceirregularities and central islands may still occur.Decentration may also occur in a LASIK ablation,depending on the patient’s ability to maintaineye fixation during surgery (Fig. 4.34). Epithelialin-growth at the periphery of the flap-stromalinterface produces an area of steepeningsurrounded by an area of marked flattening
making the corneal surface more irregular (Fig.4.35).
Postlaser Thermal Keratoplasty
In laser thermal keratoplasty (LTK), a Holmiumlaser is used to heat corneal stromal collagenin a ring around the outside of the pupil. Theheat causes the tissue to shrink, producing azone of localized flattening centered on the spot,and a surrounding zone of steepening. Thisbulging effect of the central cornea makes it possi-ble to correct hyperopia. The typical topographicpattern shows the central corneal steepening anda ring of flattening overlying the spots.
Postintrastromal Corneal RingsImplantation
Intrastromal rings are small segments or rings,made of a plastic-like substance, that are insertedinto the periphery of the cornea to correct smalldegrees of myopia or hyperopia. They act asspacers and by changing the orientation of the
Fig. 4.33: Central island after myopic photoablation

78 Diagnostic Procedures in Ophthalmology
A
B
Figs 4.34A and B: Topographic patterns of LASIK decentered ablations aftermyopic treatment A and after hyperopic treatment B

79Corneal Topography
collagen lamellae, depending on their shape andposition, flatten or steepen the central cornea.Intrastromal rings could also be used to reducethe corneal steepening and astigmatismassociated with keratoconus (Fig. 4.36).
Postkeratoplasty
Keratoplasty topographies exhibit a wide varietyof patterns, depending on the type of keratoplasty
performed, the quality of the surgical procedure,whether sutures are still in place in the cornea,and the time elapsed after the procedure. Suturesusually induce a central bulge in the cornealgraft and its removal results in a decrease ofthe astigmatic component. The prolate configu-ration after keratoplasty is the most frequentpattern with a high degree of irregularity (Fig.4.37). There can be multiple regions of abnormallyhigh or low power, or both simultaneously in
A
B
Figs 4.35A and B: Topographic analysis in a post-LASIK cornea with an epithelialin-growth at the inferonasal area: placido rings image A, and axial map B

80 Diagnostic Procedures in Ophthalmology
Fig. 4.36: Management of keratoconus by intrastromal rings
the map. Irregular astigmatism over the entrancepupil may be detrimental to optimum visualacuity in the keratoplasty patient.
Contact Lens-induced CornealWarpage or Molding
Corneal warpage is characterized by topographicchanges in the cornea following contact lens wear(most frequently in wearers of hard or RGP lenses)as a result of the mechanical pressure exertedby the lens. There are at least 4 different formsof noticeable topography change that usually
occur mixed with one another: (i) peripheral
steepening, (ii) central flattening, (iii) furrow
depression, and (iv) central molding or central
irregularity (Fig. 4.38).Inferior corneal steepening (pseudokeratoconus)
is caused by a superiorly riding contact lens thatflattens above the visual axis with an apparentsteepening below. The topographic image couldappear similar to keratoconus, but both conditionsare easily differentiated. In corneal warpage, theshape indexes do not indicate any keratoconiccondition, and the flat K is not as steep as inkeratoconus.

81Corneal Topography
Fig. 4.37: Topographic pattern afterpenetrating keratoplasty
Other Uses of Corneal Topography
Corneal topography is a diagnostic tool, but itis also essential before all refractive procedures,to enable the surgeon to understand the refractivestatus of an individual eye, and plan the optimumrefractive treatment. The corneal topography isalso used for the following purposes:
1. To guide removal of tight sutures aftercorneal surgery (keratoplasty, cataractsurgery, etc.) that are causing steepeningof the cornea (Fig. 4.39).
2. To help in the designing the astigmatickeratotomy.
Fig. 4.38: Corneal warpage

82 Diagnostic Procedures in Ophthalmology
Fig. 4.39: Superior corneal steepening caused by a tight suture
3. To guide contact lens fitting: Selection ofthe probe lens and design of the lens.
4. To calculate the keratometry values for thecalculation of the required power of anintraocular lens for implantation. This isan important issue in corneas that haveundergone refractive surgery, because it ismore difficult to estimate the real keratometricvalues in order to avoid over or undercorrections.
5. To evaluate the effect of a keratorefractiveprocedure.
Bibliography1. Ambrosio R Jr, Klyce SD, Wilson SE. Corneal
topographic and pachymetric screening ofkeratorefractive patients. J Refract Surg 2003;19:24-29.
2. Bogan SJ, Waring GO, Ibrahim O, Drews C, CurtisL. Classification of normal corneal topographybased on computer-assisted videokeratography.Arch Ophthalmol 1990;108:945-9.
3. Boyd BF, Agarwal A, Alio JL, Krueger RR,Wilson SE. (Eds). Wavefront analysis, aberro-meters and corneal topography. Highlights ofOphthalmology, 2003.
4. Cairns G, McGhee CNJ. Orbscan computerizedtopography: Attributes, applications, andlimitations. J Cataract Refract Surg 2005;31:205-20.
5. Corbett M, O’Brart D, Rosen E, Stevenson R.Corneal topography: principles and applications.BMJ Publishing Group, 1999.
6. Corneal Topography. American Academy ofOphthalmology. Ophthalmology 1999;106:1628-38.
7. Courville CB, Smolek MK, Klyce SD. Contri-bution of ocular surface to visual optics. ExpEye Res 2004;78:417-25.
8. Dabezies OH, Holladay JT. Measurement ofcorneal curvature: keratometer (ophthalmo-

83Corneal Topography
meter). In Contact Lenses: the CLAO Guideto Basic Science and Clinical Practice. Kendall/Hunt Publishing Co, 1995;253-89.
9. Hamam H. A new measure for optical perfor-mance. Optom Vis Sci 2003; 80:174-84.
10. Joslin CE, Wu SM, McMahon TT, Shahidi M.Higher-order wavefront aberrations in cornealrefractive therapy. Optom Vis Sci 2003;80:805-11.
11. Karabatsas CH, Cook SD. Topographic analysisin pellucid marginal corneal degeneration andkeratoglobus. Eye 1996;10:451-55.
12. Kaufman H, Barron B, McDonald M, KaufmanS. Companion handbook to the cornea. London,Butterworth Heinemann,1999.
13. Klyce SD. Corneal topography and the newwave. Cornea 2000;19:723-29.
14. Krachmer JH, Mannis MJ, Holland EJ (Ed).Cornea. Surgery of cornea and conjunctiva. StLouis, Elsevier-Mosby, 2005.
15. Maeda N, Klyce SD, Smolek MK. Neuralnetwork classification of corneal topography.Preliminary demonstration. Invest OphthalmolVis Sci 1995;36:1327-35.
16. Mejía-Barbosa Y, Malacara-Hernández D. Areview of methods for measuring cornealtopography. Optom Vis Sci 2001;78:240-53.
17. Miller D, Greiner JV. Corneal measurementsand tests. In Principles and Practice of Oph-thalmology. Philadelphia,WB Saunders,1994.
18. Molebny VV, Panagopoulou SI, Molebny SV,Wakil YS, Pallikaris IG. Principles of ray tracingaberrometry. J Refract Surg 2000;16:S572-75.
19. Rabinowitz YS. Keratoconus. Surv Ophthalmol1998;42:297-319.
20. Rabinowitz YS, Nesburn AB, McDonnell PJ.Videokeratography of the fellow eye inunilateral keratoconus. Ophthalmology 1993;100:181-86.
21. Rao SK, Padmanabhan P. Understandingcorneal topography. Curr Opin Ophthalmol2000;11:248-59.
22. Thibos LN, Applegate RA, Schwiergerling JT,Webb R. Standards for reporting the optical aber-rations of eyes. J Refract Surg 2002;18:S652-60.
23. Vincigerra P, Camesasca FI, Calossi A. StatisticalAnálysis of phisiological aberrations of thecornea. J Refract Surg 2003;19(suppl):265-69.
24. Wang L, Koch DD. Corneal Topography andits integration into refractive surgery. CompOphthalmol Update 2005;6:73-81.
25. Wilson SE, Ambrosio R. Computerized cornealtopography and its importance to wavefronttechnology. Cornea 2001;20:441-54.
26. Wilson SE, Klyce SD. Advances in the analysisof corneal topography. Surv Ophthalmol 1991;35:269-77.
27. Wilson SE, Lin DT, Klyce SD, Insler MS. Terrien’smarginal degeneration: corneal topography.Refract Corneal Surg 1990;6:15-20.

84 Diagnostic Procedures in Ophthalmology
MANOTOSH RAY
ConfocalMicroscopy5
Confocal microscopy, one of the most advancedimaging technologies, offers several advantagesover conventional wide-field optical microscopy.It has the ability to control the depth of field,eliminate or reduce the background informationaway from the focal plane and the capabilityto collect serial optical sections from thickspecimens. The basic key to the confocal approachis the use of spatial filtering techniques toeliminate out-of-focus light or glare. There hasbeen a tremendous interest in confocal micro-scopy in recent years, due in part to the relativeease with which extremely high quality imagescan be obtained. Confocal microscopy hasenhanced the ability to image the cornea in vivo.The application of this technology permits theacquisition of images of high spatial resolutionand contrast as compare to conventionalmicroscopy.
Confocal microscope employs an oscillatingslit aperture in an ophthalmic microscopeconfiguration, especially suitable for the analysisof cell layers of cornea. It can focus through theentire range of a normal cornea from epitheliumto endothelium. A series of scan shows: (a)epithelium, (b) corneal nerves, (c) keratocytes,(d) endothelium and (e) a computer generatedslice of cornea. There are distinct advantages
of confocal microscope over the regularmicroscope. When focused on a transparenttissue like cornea with regular microscope, theunfocused layers affect the visibility of thefocused layer. Confocal microscope, on the otherhand, can focus on different layers distinctlywithout affecting the quality of the image.
OpticsA halogen light source passes through movableslits (Nipkow disk). A condenser lens (front lens)projects the light to the cornea. Only a smallarea inside the cornea is illuminated to minimizethe light scattering. The reflected light passesthrough the front lens again and is directed toanother slit of same size via beam-splitter. Finallythe image is projected onto a highly sensitivecamera and displayed on a computer monitor(Fig. 5.1).
The confocal microscope utilizes a trans-parent viscous sterile gel that is interposedbetween front lens and cornea to eliminate theoptical interface with two different refractiveindices. The front lens works on ‘DistanceImmersion Principle’. The working distance(distance between front lens and the cornea) is

85Confocal Microscopy
1.92 mm. The back and forth movement of thefront lens enables scanning of the entire corneastarting from anterior chamber and cornealendothelium to most superficial cornealepithelium. Use of standard X40 immersion lensgives magnified cellular detail and an image fieldof 440 × 330 μm. Other lenses (e.g. X20) deliverswide field but less distinct cell morphology.Newer model (Confoscan 2.0) captures 350images per examination at a rate of 25 framesper second. Thickness of the captured layersvaries from 3 to 5 microns depending onscanning slit characteristics.
In addition, every recorded image ischaracterized by its position on the ‘Z’ axis ofthe cornea. Every time a confocal scan is
performed, a graphic shows the depth coordinateon the ‘Z’ axis and the level of reflectivity onthe ‘Y’ axis. The graphic also displays thedistance between two images along theanteroposterior line. This simultaneous graphicrecording is called ‘Z’ scan graphic. Thereflectivity on ‘Z’ scan is entirely dependent onthe tissue being scanned. A transparent tissuedisplays low reflectivity whereas a higherreflectivity is obtained from an opaque layer.Therefore, different corneal layers would displaydifferent reflectivity on ‘Z’ scan. The cornealendothelium displays the maximum reflectivitywhile stroma is the lowest. An intermediatereflectivity is obtained from epithelial layers. Atypical ‘Z’ scan of entire normal cornea showshigh endothelial reflection curves followed bylow stromal reflection and then late intermediatereflectivity from superficial corneal epithelium.Thus confocal miscroscopy enables to performcorneal pachymetry or even can measure thedistance between two corneal layers.
Confocal Microscopy of NormalCorneaThis is a noninvasive technique of imaging ofcorneal layers that provides excellent resolutionwith sufficient contrast. A well-executed scancan visualize the corneal endothelium, stroma,subepithelial nerve plexus and epithelial layersdistinctly. The limitations are non-visualizationof normal Bowman’s layer and Descemet’smembrane since these structures are transparentto this microscope. However, it is possible toview these structures when they are patholo-gically involved. Eyes with corneal opacity oredema can also be successfully scanned.¹ Thequality of image depends on: (a) centration ofthe light beam, (b) stability of the eye, and (c)optimum brightness of the illumination.
Fig. 5.1: Optics of confocal microscope
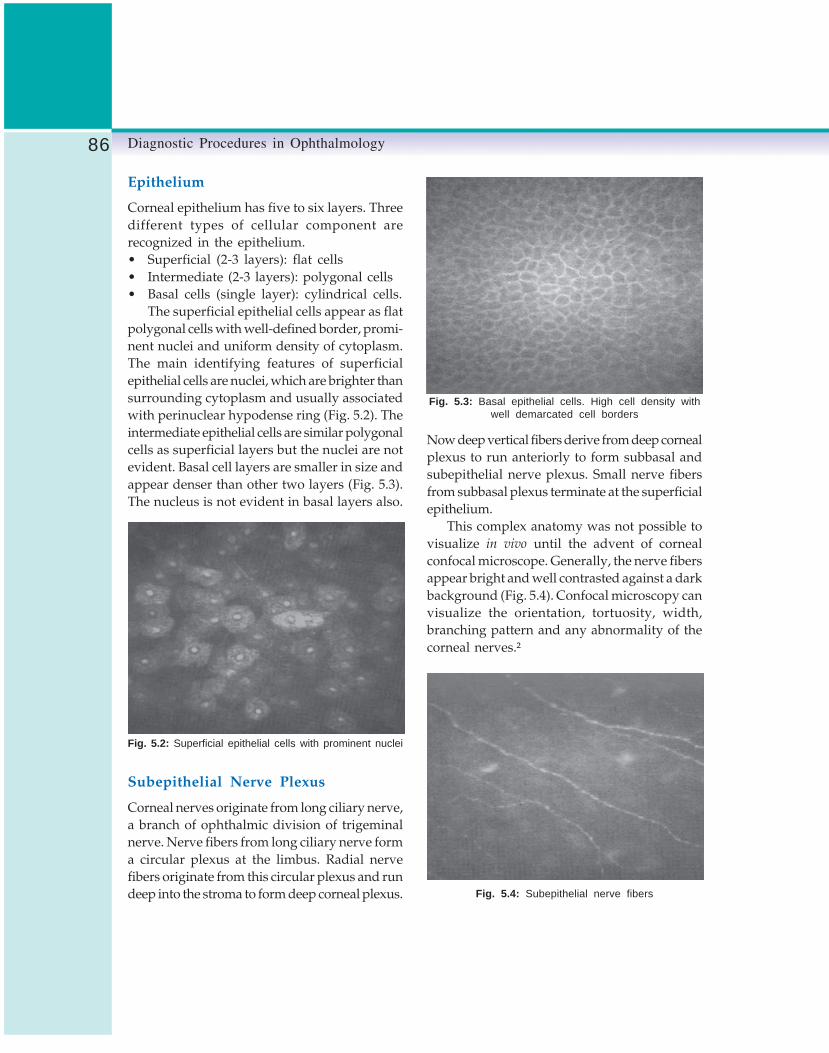
86 Diagnostic Procedures in Ophthalmology
Epithelium
Corneal epithelium has five to six layers. Threedifferent types of cellular component arerecognized in the epithelium.• Superficial (2-3 layers): flat cells• Intermediate (2-3 layers): polygonal cells• Basal cells (single layer): cylindrical cells.
The superficial epithelial cells appear as flatpolygonal cells with well-defined border, promi-nent nuclei and uniform density of cytoplasm.The main identifying features of superficialepithelial cells are nuclei, which are brighter thansurrounding cytoplasm and usually associatedwith perinuclear hypodense ring (Fig. 5.2). Theintermediate epithelial cells are similar polygonalcells as superficial layers but the nuclei are notevident. Basal cell layers are smaller in size andappear denser than other two layers (Fig. 5.3).The nucleus is not evident in basal layers also.
Fig. 5.2: Superficial epithelial cells with prominent nuclei
Subepithelial Nerve Plexus
Corneal nerves originate from long ciliary nerve,a branch of ophthalmic division of trigeminalnerve. Nerve fibers from long ciliary nerve forma circular plexus at the limbus. Radial nervefibers originate from this circular plexus and rundeep into the stroma to form deep corneal plexus.
Now deep vertical fibers derive from deep cornealplexus to run anteriorly to form subbasal andsubepithelial nerve plexus. Small nerve fibersfrom subbasal plexus terminate at the superficialepithelium.
This complex anatomy was not possible tovisualize in vivo until the advent of cornealconfocal microscope. Generally, the nerve fibersappear bright and well contrasted against a darkbackground (Fig. 5.4). Confocal microscopy canvisualize the orientation, tortuosity, width,branching pattern and any abnormality of thecorneal nerves.²
Fig. 5.4: Subepithelial nerve fibers
Fig. 5.3: Basal epithelial cells. High cell density withwell demarcated cell borders

87Confocal Microscopy
Stroma
Corneal stroma represents 90% of total cornealthickness. It has three components:
a. Cellular stroma: Composed of keratocytesand constitutes 5% of entire stroma.
b. Acellular stroma: Represents the majorcomponent (90-95%) of stroma. The maincomponent has regular collagen tissue(Type-I, III, IV) and interstitial substances.
c. Neurosensory stroma: Represented bystromal nerve plexus and nerve fibersoriginating from it.
The keratocyte concentration is much higherin the anterior stroma and progressivelydecreases towards the deep stroma. Generally,the keratocyte count is approximately 1000 cells/mm² in anterior stroma while the average valuedrops to 700 cells/mm² in the posterior stroma.Confocal image of stroma shows multipleirregularly oval, round or bean-shaped brightstructures that represent keratocyte nuclei. Thesenuclei are well contrasted against dark acellularmatrix (Fig. 5.5). Anterior stromal keratocytenuclei assume rounded bean-shaped morpho-logy while the same in rear stroma are more oftenirregularly oval. A bright highly reflectivekeratocyte represents a metabolically activated
keratocyte of a healthy cornea. In a normalhealthy cornea collagen fibers and interstitialsubstances appear transparent to confocalmicroscope and impossible to visualize. It ispossible to identify stromal nerve fibers in anteriorand mid stroma. These nerve fibers belong todeep corneal plexus and appear as linear brightthick lines. The stromal nerve fiber thickness isgreater than epithelial nerves. Occasionally,nerve bifurcations are also clearly visible.
Endothelium
Endothelium is a non-innervated single layerof cells at the most posterior part of cornea.Endothelial cell density is maximal at birth andprogressively declines with age. Normalendothelial cell count varies from 1600 to 3000cells/mm² (average 2700 cells/mm²) in a normalhealthy adult.2-4 However, cornea can stillmaintain the integrity till the cell count declinesbelow 300-500 cells/mm².
Fig. 5.6: Hexagonal endothelial cells in a healthy cornea
Homogeneous hexagonal cells with uniformsize and shape represent healthy endothelial cells.Increasing age and endothelial assault causepleomorphism and polymegathism. Confocalmicroscopy easily identifies endothelial cells.These cells appear as bright hexagonal andpolygonal cells with unrecognizable nucleus. TheFig. 5.5: Stromal keratocytes with bright oval-shaped nuclei

88 Diagnostic Procedures in Ophthalmology
cell borders are represented by a thin, non-reflective dark line (Fig. 5.6). A X20 objective lensprovides wide field with less magnification. Itis possible to perform cell count and study theminute details of cellular morphology.
Confocal Microscopy in CornealPathologies
Keratoconus
Keratoconus is a non-inflammatory ectaticdisorder of the cornea characterized by alocalized conical protrusion associated with anarea of stromal thinning. The thinning is mostapparent at the apex of the cornea. The steepconical protrusion of the corneal apex causeshigh myopia with severe irregular astigmatism.Other features of keratoconus include an ironring, known as Fleischer’s ring that partially orcompletely encircles the cone.5 The cone appearsas ‘oil drop’ reflex on distant direct ophthalmo-scopy due to internal reflection of light. Deepvertical folds oriented parallel to the steeper axisof the cornea at the level of deep stroma andDescemet’s membrane are known as Vogt’s striae.An acute corneal hydrops appears when thereis a break in the Descemet’s membrane. Thecorneal edema usually subsides after few monthsleaving behind scar and flattening the cornea.The corneal nerves become more readily visibledue to thinning of the cornea. High irregularastigmatism precludes adequate spectaclecorrection. In the early stages, use of contact lensesmay improve the visual acuity. However, contactlens fitting can be extremely difficult and inadvanced cases it ceases to improve visual acuityoptimally forcing the patient to rely on onlyoptions left, corneal transplantation.
The most effective way to identify early casesof keratoconus is computerized cornealtopography that has become a gold standard
for diagnosis and follow-up of the disease inrecent years.6,7 Confocal microscopy is a relativelynewer investigative modality to assess thekeratoconic cornea. Morphological changes inkeratoconus are mostly confined to the cornealapex and depend on the severity of the disease.Rest of the cornea may appear normal. The typicalpolygonal shape of superficial epithelial cellsis lost. They appear distorted and elongated inan oblique direction with highly reflective nuclei(Fig. 5.7). Cell borders are not distinguishable.There may be areas of basal epithelial loss asevident by a linear dark non-reflective patch inconfocal microscopy. The subepithelial nerveplexus generally appears normal. However, thesub- basal nerve fibers are curved and take thecourse of stretched overlying epithelium. Cornealstroma is also affected by keratoconus. Theconfocal images of stroma are highly specific.The characteristic stromal changes are multiple‘striae’ represented by thin hyporeflective linesoriented vertically, horizontally or obliquely (Fig.5.8). These are confocal representation of Vogt’sstriae.8 In advanced stages of keratoconus, thekeratocyte concentration is reduced in anteriorstroma. The shape of the keratocytes is alsoaltered. Occasionally, highly reflective bodies
Fig. 5.7: Obliquely elongated superficial epithelium inkeratoconus

89Confocal Microscopy
with tapering ends are visible in anterior stromanear the apex. The nature of these abnormalbodies is not yet known but it may be due toaltered keratocytes. The corneal endothelialchanges vary from none to occasional pleomor-phism and polymegathism.
Corneal Dystrophies
Corneal dystrophies are inherited abnormalitiesthat affect one or more layers of cornea. Usuallyboth eyes are affected but not necessarilysymmetrically. They may present at birth butmore frequently develop during adolescence andprogress gradually throughout life. Some formsare mild, others severe.
Granular Dystrophy
This is an autosomal dominant bilateral non-inflammatory condition that results fromdeposition of eosinophilic hyaline deposits inthe corneal stroma.9 It specifically affects thecentral cornea and eventually can causedecreased vision and eye discomfort. Initially,the lesions are confined to superficial stroma
but with progression of the disease they caninvolve the posterior stroma as well.
Confocal microscopy reveals highly reflective,bright, dense structures in the anterior and mid-stroma. Keratocytes are not involved. Depth ofstromal involvement may be ascertained by using‘Z’ scan function. This is an added advantageover other contemporary investigations thatenables surgeon to plan for surgical modalities.Confocal microscopy is also useful in differentialdiagnosis and follow-up of the disease.
Posterior Polymorphous Dystrophy
Posterior polymorphous dystrophy (PPD) is arare inherited disorder of the posterior layer ofthe cornea. It is a bilateral disorder with earlyonset, although early stage diagnosis is rare sincemost of the affected individuals remainasymptomatic. The characteristic endothelialchanges are small vesicles or areas of geographiclesions. In fact, endothelial cells lining of theposterior surface of the cornea have epithelial-like features.10,11 These cells can also cover thetrabecular meshwork, leading to glaucoma insome patients. Most severe cases may developcorneal edema due to compromised pumpfunction of the endothelial cells.
Confocal microscopy shows multiple roundvesicles at the level of Descemet’s membrane andendothelium.12 PPD usually distorts the normalflat profile of the endothelial cells and presentlarge dark cystic impressions on confocal scan.The endothelial cells surrounding the lesionappear large and distorted.
Fuchs Endothelial Dystrophy
Fuchs endothelial dystrophy is a chronic bilateralhereditary (variable autosomal dominant orsporadic) disorder of corneal endothelium. Ittypically presents after the age of 50 and more
Fig. 5.8: Advanced keratoconus: vertical striae in thestroma

90 Diagnostic Procedures in Ophthalmology
surgery that is currently being successfully usedby refractive surgeons for the correction of varioustypes of refractive errors. LASIK has become thetechnique of choice to correct myopia andhyperopia with or without astigmatism.15 LASEKis a modification of photorefractive keratectomy(PRK) where excimer laser is used to ablatesuperficial corneal stroma after the epitheliumhas been removed. LASIK involves the use ofmicrokeratome to prepare a hinged corneal flapof uniform thickness. The excimer laser issubsequently used to ablate the mid-cornealstromal bed and thereafter the flap is repositedto its original position without applying anysuture. After LASIK, the healing of corneal tissueoccurs quickly since there is minimal damageto the corneal epithelium and the Bowman’smembrane.
Traditionally, the cornea is evaluated withslit-lamp biomicroscopy and computerizedcorneal topography both pre- and postopera-tively. Confocal microscopy adds newer dimen-sions to the commonly employed investigations.Functional outcome of LASIK depends on manyfactors including the biomechanics, healingprocess and the inflammatory response of theflap interface that is created between the epithelialflap and stromal bed. Confocal scan is usefulin evaluation of following parameters.• Corneal flap thickness• Interface study
a) Healing processb) Inflammatory responsec) Abnormal deposits
• Corneal nerve fiber regeneration, and• Residual stromal thickness.
A well-designed flap is the key to successfuloutcome of LASIK. Thinner flaps are more atrisk from flap complications. A few studies withconfocal microscopy had suggested that actualflap thickness after LASIK is consistently lowerthan predicted thickness.16 The reasons are not
common in females. There is a loss of endothelialcells that results in deposition of collagenmaterials in Descemet’s membrane (guttata).Corneal guttata is the hallmark of this disease.The integrity of corneal endothelium is essentialto maintain the metabolic and osmotic functionof the entire cornea. Corneal edema in Fuchsdystrophy initially involves the posterior andmid-stroma. As the disease advances, the edemaprogresses to involve the anterior cornea;resulting in formation of bullous keratopathy.
Confocal microscopy is useful to visualizethe corneal guttata. This technique has a distinctadvantage over conventional specular micro-scopy that fails to visualize the endothelium whenthere is significant corneal edema.13 The cornealguttata appears dark with bright central reflex(Fig. 5.9).14 In advanced stage the endothelialmorphology altered completely but it is stillpossible to identify the distorted cell borders.14
In the early stages of bullous keratopathy, intra-epithelial edema is seen as distorted cellular mor-phology with increased reflectivity. It can alsoidentify the bullae in the basal epithelial layer.
Fig. 5.9: Distorted endothelium in Fuchs endothelialdystrophy
Laser in situ KeratomileusisLaser in situ keratomileusis (LASIK) is one ofthe latest techniques of excimer laser refractive

91Confocal Microscopy
yet known. However, corneal edema that maybe caused by microkeratome cut and suction mayplay an important role. Postoperative scarringand tissue retraction could be other possiblefactors. Using a ‘Z’ scan, it is possible to identifythe interface that corresponds to a very low levelof reflectivity. The flap thickness is obtained bymeasuring the distance between high reflectivespike from the front surface of the cornea andthe low reflective interface (Fig. 5.10).
Fig. 5.10: Measurement of flap thickness in LASIK
The interface usually appears as a hyporef-lective space in between relatively hyperreflectivecellular stroma. Interface can easily be imagedby confocal microscope. Typically, the keratocyteconcentration is lower than normal in theinterface. Bright particles and microstriae areconsistently visible in the interface. These brightparticles most probably originate from microkera-tome blade and represented by highly reflective
white bodies (Fig. 5.11). Microstriae are presentat the Bowman’s layer. Excessive interfacemicrostriae and bright particles may lead toastigmatism and eventually poor outcome afterLASIK. These microstriae can be imaged withconfocal microscope even when the slit-lampexamination is unremarkable.
Fig. 5.11: Bright highly reflective particlesat the flap-stroma interface
Diffuse lamellar keratitis (DLK) also knownas sands of Sahara syndrome, is a noninfectiousinflammation of the interface. The etiology is notknown but it is assumed to be toxic or allergicin nature. In confocal scan DLK appears as diffuseand multiple infiltrates in the interface with noanterior or posterior extension.
Subepithelial nerve fibers are affected byLASIK. No nerve is visible in immediate post-operative period. However, the regeneratingnerve fibers appear as thin irregularly branchingline when confocal scan is performed 5-7 daysafter surgery. The residual stromal thickness canalso be measured using ‘Z’ scan technique asdescribed while evaluating the epithelial flap.
Corneal GraftsConfocal microscope is a useful tool to follow-up the corneal grafts and to diagnose the

92 Diagnostic Procedures in Ophthalmology
abnormal changes that may occur postopera-tively. It provides images at the cellular levelto identify any pathological changes even beforeit becomes clinically evident. It can also be usedto assess the donor cornea.
Corneal graft survival is entirely dependenton optimum number of healthy endothelial cells.Endothelial cell loss occurs rapidly after cornealtransplantation17. Majority of cell loss takes placeduring the first two postoperative years.18 Severalstudies had suggested that endothelial cell lossis much higher after corneal grafting when theprimary indications are bullous keratopathy orhereditary stromal dystrophy in compare tokeratoconus and corneal leukomas.19,20 Anotherinteresting fact is that endothelial cell loss isgreater when corneal transplantation isperformed on phakic eyes than on aphakics.21
Confocal microscopy scores over conven-tional specular microscopy while evaluatingendothelial cell characteristics especially in eyeswith stromal edema. Endothelial morphology inconfocal scan has been described earlier.Immediate postoperative period, endotheliumlooks normal and healthy. However, as timeprogresses, endothelial cell density decreases asevidenced by pleomorphism and polymega-thism. Occasionally, a bright preendothelialdeposits appear, the significance of which is notyet known (Fig. 5.12).
Reinnervation after grafting is another issuewell addressed by confocal microscopy. First signof innervation that starts few months afterkeratoplasty is visible at the periphery of thegraft stroma. However, complete innervation maytake many years to develop. Regenerated nervefibers look similar to that found in a normalcornea. Occasionally, they may take a tortuousand convoluted course depending on age (e.g.older patients) and primary indications ofkeratoplasty (e.g. bullous keratopathy, cornealdystrophies).
It is well known that allograft rejection isone of the most common causes of graft failure.Graft rejection can be classified as epithelial,subepithelial and endothelial rejection, of whichthe endothelial rejection is the worst. Confocal
Fig. 5.12: Pleomorphism, polymegathism andpreendothelial deposits in a corneal graft
Fig. 5.13: Co-existence of degenerated and normalendothelial cells in early endothelial allograft rejection

93Confocal Microscopy
features of epithelial rejection are distorted basalepithelial cells with altered subepithelialreflectivity. Subepithelial rejection is identifiedby discrete opacities underneath the epitheliallayer.22 Endothelial rejection, on the other hand,is characterized by coexistence of normal lookingand degenerated endothelial cells, focal endo-thelial cell lesions and bright highly reflectivemicroprecipitates (Fig. 5.13).23
Intracorneal Deposits
Sources of intracorneal deposits can be exoge-nous or endogenous. They can involve variouslayers of cornea individually or in combination.
Exogenous sources:
• Long-term use of contact lenses• Refractive surgery• Vitreoretinal surgery using silicone oil• Drugs: Amiodarone, Chloroquine
Endogenous sources:
• Wilson’s disease• Hyperlipidemia• Fabry’s disease• Hemosiderosis
The clinical diagnosis is based on slit-lampbiomicroscopy and systemic features in selectedcases. The knowledge of confocal features in thesedisorders is limited except in drug inducedkeratopathies.
Vortex Keratopathy
Vortex keratopathy known as cornea verticillata
is characterized by whorl-like corneal epithelialdeposits. It can be induced by various drugs,e.g. amiodarone (used for cardiac arrhythmias)and anti-malarials (chloroquine, hydroxychloro-quine). Clinically, vortex keratopathy is mani-fested as golden-brown opacities at the inferiorcorneal epithelium. On electron microscopy, theyappear as intracytoplasmic lysosom-like lamellar
inclusion bodies located at the basal epitheliallayer.24 Confocal microscopy adds newer dimen-sions to the existing knowledge. It demonstratesinvolvement of entire cornea, although vortexkeratopathy is primarily a corneal epithelialpathology. The characteristic features arepresence of highly reflective, bright intracellulardeposits at the basal epithelial layer (Fig. 5.14).Overlying epithelium is usually normal. Inadvanced cases these microdeposits may extendto the stroma and eventually to the endothelium.25
Stromal keratocyte density is often reduced.
Fig. 5.14: Intracellular deposits at basalepithelial layer in amiodarone toxicity
ConclusionOphthalmic investigations and instrumentationshave come long way over the past decades.Confocal microscope is one of those wonderfulinnovations in recent time. It is becoming morepopular everyday and its indications areexpanding. Confocal microscopy is truly anexciting tool that can be useful for the clinicaldiagnosis, follow-up and analysis of manycorneal lesions.

94 Diagnostic Procedures in Ophthalmology
Acknowledgement
I would like to thank Aria Mangunkusumo andVanathi Ganesh for their help.
References1. Weigand W, Thaer AA, Kroll P, et al. Optical
sectioning of the cornea with a new confocalin vivo slit-scanning videomicroscope.Ophthalmology 1995;102(4):485-92.
2. Oliveira-Soto L, Efron N. Morphology of cornealnerves using confocal microscopy. Cornea2001;20(4):374-84.
3. Tuft SJ, Coster DJ. The corneal endothelium.Eye 1990;4:389.
4. Nucci P, Brancato R, Mets MB, et al. Normalendothelial cell density range in childhood. ArchOphthalmol 1990;108:247.
5. Gass JD. The iron lines of the superficial cornea:Hudson-Stahle line, Stocker’s line, andFleischer’s ring. Arch Ophthalmol 1964;71:348.
6. Maguire LJ, Bourne WM. Corneal topographyin early keratoconus. Am J Ophthalmol 1989;108:107.
7. Maguire LJ, Lowry J. Identifying progressionof subclinical keratoconus by serial topographyanalysis. Am J Ophthalmol 1991;112:41.
8. Somodi S, Hahnel C, Slowik C, et al. Confocalin vivo microscopy and confocal laser-scanningfluorescence microscopy in keratoconus. GerJ Ophthalmol 1996;5(6):518-25.
9. Werner LP, Werner L, Dighiero P. et al. Confocalmicroscopy in Bowman’s and stromal cornealdystrophies. Ophthalmology 1999;106(9):1697-1704.
10. Hirst LW, Waring GO. Clinical specular micro-scopy of posterior polymorphous endothelialdystrophy. Am J Ophthalmol 1983;95(2):143-55.
11. Mashima Y, Hida T, Akiya S, et al. Specularmicroscopy of posterior polymorphous endo-thelial dystrophy. Ophthalmic Paediatr Genet 1986;7(2):101-07.
12. Chiou AG, Kaufman SC, Beuerman RW, et al.Confocal microscopy of posterior polymor-phous endothelial dystrophy. Ophthalmologica1999;213(4):211-13.
13. Chiou AG, Kaufman SC, Beuerman RW, et al.Confocal microscopy in cornea guttata andFuch’s endothelial dystrophy. Br J Ophthalmol1999;83(2):185-89.
14. Rosenblum P, Stark WJ, Maumenee IH, et al.Hereditary Fuch’s dystrophy. Am J Ophthalmol1980;90:455.
15. Reviglio VE, Bossana EL, Luna JD, et al. Laserin situ keratomileusis for the correction ofhyperopia from +0.50 to +11.50 diopters withKeracor 117C laser. J Refract Surg 2000;16(6):716-23.
16. Durairaj VD, Balentine J, Kouyoumdjian G, etal. The predictability of corneal flap thicknessand tissue laser ablation in laser in situkeratomileusis. Ophthalmology 2000;107(12):2140-43.
17. Harper CL, Boulton ML, Marcyniuk B, et al.Endothelial viability of organ cultured corneasfollowing penetrating Keratoplasty. Eye1998;12(5):834-38.
18. Vasara K, Setala K, Ruusuvaara P. Follow upstudy of corneal endothelial cells, photographedin vivo before eneucleation and 20 years laterin graft. Acta Ophthalmol Scand 1999;77(3):273-76.
19. Obata H, Ishida K, Murao M, et al. Corneal endo-thelial cell damage in penetrating keratoplasty.Jpn J Ophthalmol 1991;35(4):411-16.
20. Abott RL, Fine M, Guillet E. Long-term changesin corneal endothelium following penetratingkeratoplasty. A specular microscopic study.Ophthalmology 1983;90(6):676-85.
21. Ing JJ, Ing HH, Nelson LR, et al. Ten-year post-operative results of penetrating keratoplasty.Ophthalmology 1998;105(10):1855-65.
22. Cohen RA, Chew SJ, Gebhardt BM, et al.Confocal microscopy of corneal graft rejection.Cornea 1995;14(5):467-72.
23. Cho BJ, Gross SJ, Pfister DR, et al. In vivoconfocal microscopic analysis of corneal allograftrejection in rabbits. Cornea 1998;17(4):417-22.
24. Ghose M, McCulloch C. Amiodarone inducedultrastructural changes in human eye. Can JOphthalmol 1984;19:178-86.
25. Ciancaglini M, Carpineto P, Zuppardi E, et al.In vivo confocal microscopy of patients withamiodarone induced keratopathy. Cornea2001;20(4):368-73.

95Tonometry
R RAMAKRISHNAN, SONAL AMBATKAR
Tonometry6Tonometry in reference to the eye is the measure-ment of intraocular pressure (IOP). A tonometeris an instrument that exploits the physicalproperties of the eye to permit measurement ofpressure without the need to cannulate the eye.The first practical tonometer was invented byMaklakov in 1885. Fick is credited with inventinga second applanation tonometer employing afixed area produced by an adjustable force. Thisinstrument was a forerunner of the Goldmannapplanation tonometer (1954) which is todayconsidered the most accurate clinical tonometer.
From a functional standpoint, a normal IOPis one that does not result in optic nerve damage.All eyes do not respond similarly to a particularIOP, therefore, a normal pressure cannot berepresented as a specific measurement. Variousstudies of IOP distribution have shown a meanIOP of 15.5 ± 2.6 mm Hg and the upper limithas been demonstrated to be 2 standard devia-tions above the mean IOP that is 20.5 mm Hg.
Types of TonometersThe physical properties of a normal corneadetermine the limits of accuracy of tonometry.When the cornea is deformed by a tonometer,
the resulting fluid displacement causes theremainder of the globe to distend. The tendencyof the wall of the eye is to resist stretching, anddeformation of the cornea raises the IOP.Tonometers in which the IOP is negligibly raisedduring tonometry (less than 5%) are termed aslow-displacement tonometers. The Goldmanntonometer displaces only 0.5 μl of aqueous humorand raises IOP by only 3%. Tonometers thatdisplace a large volume of fluid and consequentlyraise IOP significantly are termed as high-displacement tonometers. In a normal eye IOPbecomes more during Schiøtz tonometry. High-displacement tonometers are mostly lessaccurate than low-displacement tonometers.
Types of TonometryTonometry can be broadly classified into 2 types,direct and indirect.
Direct Method
A catheter is inserted into the anterior chamberof the eye and the other end is connected to amanometric device from which the pressure iscalculated. Though this is the most accurate

96 Diagnostic Procedures in Ophthalmology
method available, it is not feasible in humanbeing because of its invasive nature.
Indirect Method
It is based on eyes response to an applied force.
Palpation Method
Intraocular pressure (IOP) is estimated byresponse of eye to pressure applied by fingerpulp (indents easily/firm to touch).
The indirect methods can be broadly dividedinto contact and non-contact methods. Basictypes of contact tonometers differ according toshape and magnitude of deformation.
Contact Tonometers
IOP measurement is performed by deforming theglobe and correlating the force responsible fordeformation to the pressure within the eye. Bothindentation and applanation tonometers effecta deformation of globe but the magnitude varies(Fig. 6.1).
Fig. 6.1: A Deformation of globe during indentationtonometry, B Deformation of globe during applanationtonometry
Indentation Tonometer
Indentation tonometer is used to measure theamount of deformation or indentation of the globein response to a standard weight applied to thecornea or the area flattened by a standard force.
The shape of corneal deformation is truncatedcone. It displaces large intraocular volume soconversion tables based on empirical data is usedto estimate IOP. The prototype is Schiøtztonometer.
Applanation Tonometers
Applanation tonometers are used to measureforce necessary to flatten a small, standard areaof cornea. The shape of corneal deformation issimple flattening. The shape is constant so IOPis derived from a mathematical calculation. Theyare of 2 types on the basis of variable that ismeasured.
Variable force: Area of cornea on applanation heldconstant, force varies. Prototype is Goldmanntonometer.
Variable area: Force applied to cornea heldconstant, area varies. Prototype is Maklakovtonometer. The volume displacement is suffi-ciently large to require a conversion table.
Noncontact Tonometer
Noncontact tonometer measures time requiredto deform a standard area of corneal surface inresponse to a jet of air.
Schiøtz Tonometer
Schiøtz tonometer (Fig. 6.2) consists of metalplunger that slides through a hole in a concavemetal plate. The plunger supports a hammerdevice connected to needle that crosses a scale.The extent to which cornea is indented by plungeris measured as the distance from the foot platecurve to the plunger base and a lever systemmoves a needle on calibrated scale. The indicatedscale reading and the plunger weight areconverted to an IOP measurement. More theplunger indents the cornea, higher the scalereading and lower the IOP

97Tonometry
Fig. 6.2: Schiøtz tonometer
The standard instrument has followingcharacteristics:
Foot plate has concavity of 15 mm radiusof curvature. The tonometer weighs 11 gm.
Plunger has 3 mm diameter, a weight of 5.5gm including the force of the lever rests on top ofthe plunger. Additional weights are added toplunger to increase it to 7.5, 10, or 15 gm. The scalereading is zero when plunger extends 0.05 mmbeyond foot plate curve. Each scale unitrepresents 0.05 mm protrusion of the plunger.
Basic concept: The weight of tonometer on theeye increases the actual IOP (Po) to a higherlevel (Pt). The change in pressure from Po toPt is an expression of the resistance of the eye(scleral rigidity) to the displacement of fluid.Determination of Po from a scale reading Ptrequires conversion which is done accordingto Friedenwald conversion tables. Friedenwald
generated an empirical formula for linearrelationship between the log function of IOPand the ocular distension. This formula has ‘C’a numerical constant, the coefficient of ocularrigidity which is an expression of distensibilityof eye. Its average value is 0.025.
Technique: Patient should be in supine position,looking up at a fixation target while examinerseparates the lids and lowers the tonometer plateto rest on the anesthetized cornea so that plungeris free to move vertically (Fig. 6.3). A finemovement of needle on scale is in response toocular pulsations. Scale reading is an averageof the extremes of these excursions. The 5.5 gmweight is initially used. If scale reading is 4 orless, additional weight is added to plunger.Conversion table is used to derive IOP in mmHg from scale reading and plunger weight. Theinstrument is calibrated before each use to checkscale (reading is zero).
Fig. 6.3: Technique of tonometry
Sources of error: Accuracy is limited as ocularrigidity varies from eye to eye. As conversiontables are based on an average coefficient ofocular rigidity; eye that varies significantly fromthis value gives erroneous IOP. High ocularrigidity is seen in high hyperopia, long-standingglaucoma, age-related macular degeneration,and vasoconstrictor therapy. Low ocular rigidity

98 Diagnostic Procedures in Ophthalmology
is found in high myopia, advanced age, miotics,use of vasodilators, after RD surgery (vitrectomy,cryopexy, scleral band) and intravitreal injectionof compressible gas. The variable expulsion ofintraocular blood during Schiøtz tonometry mayinfluence IOP measurement. Repeated measure-ments lower IOP. Either a steeper or a thickercornea causes greater displacement of fluidduring tonometry and gives a falsely high IOPmeasurement.
Variable Force Applanation Tonometers
Goldmann Applanation Tonometer (GAT)
Basic concept: Based on Imbert-Fick law, anexternal force (W) against a sphere equals thepressure in the sphere (P) times the area flattened(applanated) by external force (A)
W = P × A
Cornea being aspherical, wet, and slightlyinflexible fails to follow the law. Moisture createssurface tension (S) or capillary attraction of tearfilm for tonometry head. Lack of flexibility requiresforce to bend the cornea (B) which is independentof internal pressure. The central thickness ofcornea is about 0.55 mm and the outer area ofcorneal flattening differs from the inner area offlattening (A1). It is this inner area which is ofimportance.
Modified Imbert-Fick Law is W + S = PA1 + B
When A1 = 7.35 mm2, S balances B and W=P. This internal area of applanation is achievedwhen the diameter of the external area of cornealapplanation is around 3.06 mm. Grams of forceapplied to flatten 3.06 diameter of the corneamultiplied by 10 is directly converted to mmHg.
Instrument: Instrument is mounted on the endof a lever hinged on the slit-lamp (Fig. 6.4).Examiner views through the center of plastic
biprism (Fig. 6.5) which is used to applanatecornea. Two beam splitting prisms withinapplanating unit optically convert circular areaof corneal contact in 2 semicircles. Edge of cornealcontact is made apparent by instilling fluoresceinwhile viewing in cobalt blue light. By manuallyrotating a dial calibrated in grams, the force isadjusted by changing the length of a springwithin the device. The prisms are calibrated insuch a fashion that inner margin of semicirclestouch when 3.06 mm of the cornea is applanated.Biprism is attached by a rod to a housing whichcontains a coil spring and series of levers thatare used to adjust the force of the biprism againstthe cornea.
Technique: Cornea is anesthetized, tear film isstained with sodium fluorescein. Cornea andbiprism is illuminated by a cobalt blue light.
Fig. 6.4: Goldmann applanation tonometry
Fig. 6.5: Biprism in the Goldmann tonometer

99Tonometry
Fluorescein facilitates visualization of tearmeniscus at margin of contact. Fluorescentsemicircles are viewed through the biprism. Forceagainst the cornea is adjusted until the inneredges overlap. Ocular pulsations createexcursions of semicircular tear meniscus andIOP is read as the median over which arc glides.This is the end point (Fig. 6.6) at which a readingcan be taken from a graduated dial whichindicates grams of force applied to tonometerand so this number is multiplied by 10 to obtainIOP in mm Hg.
Fig. 6.6: End point recording of IOP
Sources of error in applanation tonometry
1. Inadequate concentration of fluorescein inprecorneal tear film gives hypofluorescence.
2. Fluorescein may lose fluorescence in acidicsolution (quenching of fluorescence)causing underestimation of IOP.
3. Wider meniscus or improper verticalalignment gives higher IOP readings (Figs6.7A and B).
4. Thin corneas underestimate and thickcorneas overestimate IOP.
5. For every 3D increase in corneal curvature,IOP raises about 1 mm Hg as more fluidis displaced under steeper corneas causingincrease in ocular rigidity.
6. More than 6 D astigmatism produces anelliptical area on applanation that giveserroneous IOP. 4D with-the-rule andagainst-the-rule astigmatism underestimateand overestimate IOP, respectively.
7. Mires may be distorted on applanating onirregular corneas.
Effect of central corneal thickness (CCT): Variationsin corneal thickness change the resistance of thecornea to indentation so that this is no longerbalanced entirely by the tear film surface tensionthus affecting the accuracy of IOP measurement.A thinner cornea may require less force toapplanate it, leading to underestimation of trueIOP while a thicker cornea would need moreforce to applanate it, giving an artificially higherIOP. The Goldmann applanation tonometer wasdesigned to give accurate readings when the CCTwas 520 μm. As shown by Ehlers et al, therecan be under estimation or overestimation of IOPwhen the corneal thickness is less or more than520 micron, respectively. They interpolatedthat deviation of CCT from 520 μm yields achange in applanation readings of 0.7 mm Hgper 10 μm. IOP measurements are also modifiedafter PRK and LASIK. Thinning of the centralcornea is believed to give lower readings onapplanation.
Figs 6.7A and B: Vertical misalignment. To minimize this,tonometer biprism should be rotated so that axis of leastcorneal curvature is opposite the red line on the prismholder. Other method is to obtain measurements with miresoriented horizontally and vertically and to average thesereadings

100 Diagnostic Procedures in Ophthalmology
Other Variable Force ApplanationTonometersHand-Held Goldmann-TypeTonometers
Perkins Tonometer
Perkins tonometer (Fig. 6.8) uses same prismsas Goldmann but is counterbalanced so thattonometry is performed in any position (Fig. 6.9).The prism is illuminated by battery poweredbulbs. The force on the prisms is adjustedmanually. Being portable it is practical whenmeasuring IOP in infants / children and for usein operating rooms.
Fig. 6.8: Perkins tonometer
Draeger Tonometer
Draeger tonometer is similar to Perkins but usesdifferent set of prisms and operates with a motoradjusting the force on these prisms.
Mackay-Marg Tonometer
Basic concept: Force is required to keep the flatplate of a plunger flush with a surrounding sleeveagainst the pressure of corneal deformation.Tonometer incorporates a 1.5 mm diameterplunger affixed to a rigid spring that extends10 μm beyond the plane of surrounding rubbersleeve. Movement of plunger is electronicallymonitored by a transducer and recorded on amoving paper strip. When the tonometer is placedagainst cornea, the tracing that represents theforce applied to the plunger begins to rise. At1.5 mm of corneal area applanation, tracingreaches a peak and the force applied = IOP +force required to deform the cornea. At 3 mmflattening, force required to deform cornea istransferred from plunger to surrounding sleeve,creating a dip in tracing corresponding to IOP.Flattening of >3 mm of area gives artificialelevation of IOP. It is accurate in eyes withscarred, edematous and irregular corneas.
Fig. 6.9: Tonometry with Perkins tonometer

101Tonometry
Other Mackay-Marg-type Tonometers:CAT 100 Applanation and BiotronicTonometers
They have an internal logic program whichautomatically selects the acceptable measurementand 3 or more good IOP readings are averagedand displayed on screen.
Tonopen
Tonopen (Fig. 6.10) is a portable and batteryoperated tonometer. It has the same principleas that of Mackay-Marg tonometer. The tip hasa strain gauge that is activated when in contactwith cornea. The built-in microprocessor logiccircuit senses a trough force and records untilan acceptable measurement is achieved. Four toten such measurements are averaged to give afinal IOP which is displayed.
The probe tip is applied perpendicularly tocornea until it is just indented. An audible clickindicates that the measurement is acceptable.The process is repeated 4-10 times until a beepindicates a statistically valid average reading.
Pneumatonometer
Pneumatonometer or pneumatic tonometer islike Mackay-Marg tonometer. It has a coresensing mechanism for measuring IOP whileforce required to bend the cornea is transferredto surrounding structure. The sensor is a airpressure like electronically controlled plungerin Mackay-Marg tonometer. It can also be usedfor continuous monitoring of IOP. It givessignificantly higher IOP estimates.
Constant Force Applanation Tonometry
Maklakov Applanation Tonometer
With Maklakov applanation tonometer IOP isestimated by measuring the area of corneaflattened by a known weight. It consists of adumb-bell-shaped metal cylinder with flat endplates of polished glass on either end with adiameter of 10 mm. Tonometers weighing 5, 7.5,10, and 15 gm are used to measure the IOP. Cross-action wire handle to support instrument on thecornea is used. A thin layer of dye is spreadonto the bottom of either end plate and theinstrument is brought in contact with anesthetizedcornea in supine position for 1 second. A circularwhite imprint on end plate corresponds to thearea of corneal flattening. Area is measured andIOP is read from conversion table in the columncorresponding to the weight used.
Noncontact Tonometer
Noncontact tonometer (NCT) was introducedby Grolman. A puff of room air creates aFig. 6.10: Tonometry with tonopen
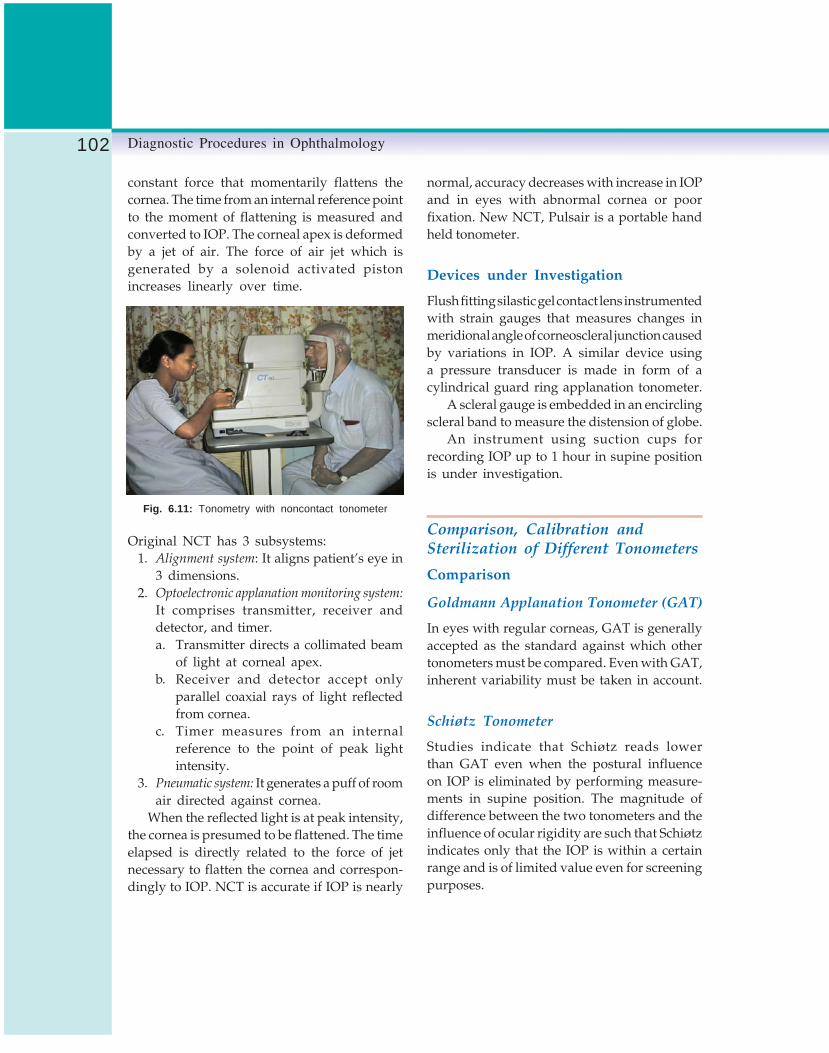
102 Diagnostic Procedures in Ophthalmology
constant force that momentarily flattens thecornea. The time from an internal reference pointto the moment of flattening is measured andconverted to IOP. The corneal apex is deformedby a jet of air. The force of air jet which isgenerated by a solenoid activated pistonincreases linearly over time.
Fig. 6.11: Tonometry with noncontact tonometer
Original NCT has 3 subsystems:1. Alignment system: It aligns patient’s eye in
3 dimensions.2. Optoelectronic applanation monitoring system:
It comprises transmitter, receiver anddetector, and timer.a. Transmitter directs a collimated beam
of light at corneal apex.b. Receiver and detector accept only
parallel coaxial rays of light reflectedfrom cornea.
c. Timer measures from an internalreference to the point of peak lightintensity.
3. Pneumatic system: It generates a puff of roomair directed against cornea.
When the reflected light is at peak intensity,the cornea is presumed to be flattened. The timeelapsed is directly related to the force of jetnecessary to flatten the cornea and correspon-dingly to IOP. NCT is accurate if IOP is nearly
normal, accuracy decreases with increase in IOPand in eyes with abnormal cornea or poorfixation. New NCT, Pulsair is a portable handheld tonometer.
Devices under Investigation
Flush fitting silastic gel contact lens instrumentedwith strain gauges that measures changes inmeridional angle of corneoscleral junction causedby variations in IOP. A similar device usinga pressure transducer is made in form of acylindrical guard ring applanation tonometer.
A scleral gauge is embedded in an encirclingscleral band to measure the distension of globe.
An instrument using suction cups forrecording IOP up to 1 hour in supine positionis under investigation.
Comparison, Calibration andSterilization of Different Tonometers
Comparison
Goldmann Applanation Tonometer (GAT)
In eyes with regular corneas, GAT is generallyaccepted as the standard against which othertonometers must be compared. Even with GAT,inherent variability must be taken in account.
Schiøtz Tonometer
Studies indicate that Schiøtz reads lowerthan GAT even when the postural influenceon IOP is eliminated by performing measure-ments in supine position. The magnitude ofdifference between the two tonometers and theinfluence of ocular rigidity are such that Schiøtzindicates only that the IOP is within a certainrange and is of limited value even for screeningpurposes.
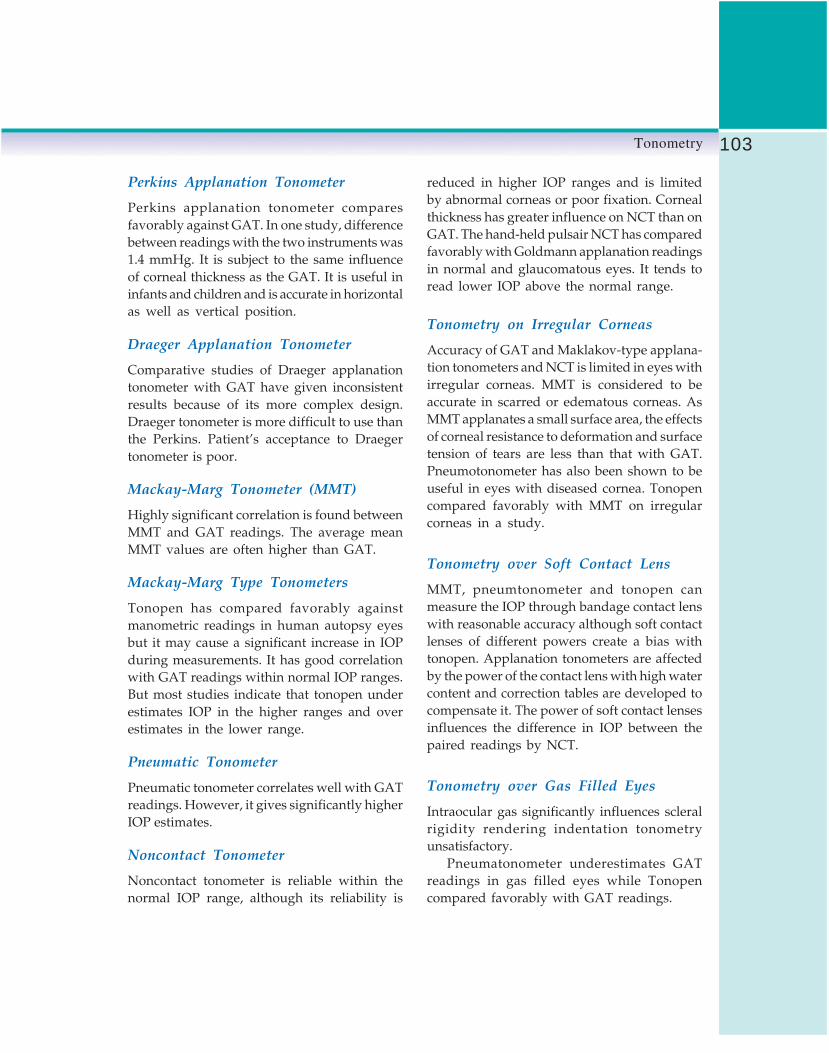
103Tonometry
Perkins Applanation Tonometer
Perkins applanation tonometer comparesfavorably against GAT. In one study, differencebetween readings with the two instruments was1.4 mmHg. It is subject to the same influenceof corneal thickness as the GAT. It is useful ininfants and children and is accurate in horizontalas well as vertical position.
Draeger Applanation Tonometer
Comparative studies of Draeger applanationtonometer with GAT have given inconsistentresults because of its more complex design.Draeger tonometer is more difficult to use thanthe Perkins. Patient’s acceptance to Draegertonometer is poor.
Mackay-Marg Tonometer (MMT)
Highly significant correlation is found betweenMMT and GAT readings. The average meanMMT values are often higher than GAT.
Mackay-Marg Type Tonometers
Tonopen has compared favorably againstmanometric readings in human autopsy eyesbut it may cause a significant increase in IOPduring measurements. It has good correlationwith GAT readings within normal IOP ranges.But most studies indicate that tonopen underestimates IOP in the higher ranges and overestimates in the lower range.
Pneumatic Tonometer
Pneumatic tonometer correlates well with GATreadings. However, it gives significantly higherIOP estimates.
Noncontact Tonometer
Noncontact tonometer is reliable within thenormal IOP range, although its reliability is
reduced in higher IOP ranges and is limitedby abnormal corneas or poor fixation. Cornealthickness has greater influence on NCT than onGAT. The hand-held pulsair NCT has comparedfavorably with Goldmann applanation readingsin normal and glaucomatous eyes. It tends toread lower IOP above the normal range.
Tonometry on Irregular Corneas
Accuracy of GAT and Maklakov-type applana-tion tonometers and NCT is limited in eyes withirregular corneas. MMT is considered to beaccurate in scarred or edematous corneas. AsMMT applanates a small surface area, the effectsof corneal resistance to deformation and surfacetension of tears are less than that with GAT.Pneumotonometer has also been shown to beuseful in eyes with diseased cornea. Tonopencompared favorably with MMT on irregularcorneas in a study.
Tonometry over Soft Contact Lens
MMT, pneumtonometer and tonopen canmeasure the IOP through bandage contact lenswith reasonable accuracy although soft contactlenses of different powers create a bias withtonopen. Applanation tonometers are affectedby the power of the contact lens with high watercontent and correction tables are developed tocompensate it. The power of soft contact lensesinfluences the difference in IOP between thepaired readings by NCT.
Tonometry over Gas Filled Eyes
Intraocular gas significantly influences scleralrigidity rendering indentation tonometryunsatisfactory.
Pneumatonometer underestimates GATreadings in gas filled eyes while Tonopencompared favorably with GAT readings.

104 Diagnostic Procedures in Ophthalmology
Calibration of Goldmann ApplanationTonometer
It is essential that Goldmann applanationtonometer (GAT) should be calibrated perio-dically, at least monthly. Following checks arenecessary:• Check position 0: Turn the zero calibration
on the measuring drum downwards by thewidth of one calibration marking, againstthe index marker. When the feeler arm isin the free movement zone, it should thenmove itself against the stop piece in thedirection of the examiner.
• Check position 0.05: Turn the zero calibrationon the measuring drum upwards by thewidth of one calibration marking, againstthe index marker. When the feeler arm isin the free movement zone, it should thenmove itself against the stop piece in thedirection of the patient.
• Check position at drum setting 2: For checkingthis position, check weight is used. Fivecircles are engraved on the weight bar. Themiddle one corresponds to drum position0, the two immediately to the left and rightto position 2 and the outer ones to position6. One of the marks on the weightcorresponding to drum position 2 is setprecisely on the index mark of the weightholder. Holder and weight are then fittedover the axis of the tonometer so that thelonger part of the weight points towardsthe examiner.
• Check position 1.95: The feeler arm shouldmove towards the examiner. Check position2.05.The feeler arm should move in thedirection of the patient.
• Check at measuring drum setting 6: Turn theweight bar to scale calibration 6, the longerpart shows in the direction of the examiner.
• Check position 5.9/6.1 as performed fordrum setting 2.
Sterilization
Schiøtz Tonometer
The tonometer is disassembled between eachuse and the barrel is cleaned with 2 pipecleaners, the first soaked in alcohol and thesecond dry. The foot plate is cleaned withalcohol swab. All surfaces must be dried beforereassembling.
Goldmann Applanation Tonometer
A variety of techniques are described fordisinfecting the tonometer. Applanation tipshould be soaked for 5-15 min in diluted sodiumhypochlorite, 3% H2O2 or 70% isopropyl alcoholor by wiping with alcohol, H2O2, povidoneiodine or 1: 1000 merthiolate. Other methodsof sterilization include: 10 min of rinsing inrunning tap water, wash with soap and water,cover the tip with a disposable film, andexposure to UV light.
Tonopen
Tip is protected by a disposable latex cover.
Pneumatonometer
Tip should be cleaned with an alcohol sponge,taking care to dry the surface before use.Alternative is the use of disposable latex coverover the tip.
Bibliography1. Armaly MF. On the distribution of applanation
pressure. I. Statistical features and the effectof age, sex, and family history of glaucoma.Arch Ophthalmol 1965;73:11.
2. Bengtsson B. Comparison of Schiøtz andGoldmann tonometry and tonography in apopulation. Acta Ophthalmol (Copenh) 1972;50:455.

105Tonometry
3. Craven ER, et al. Applanation tonometer tipsterilization for adenovirus type 8. Ophthalmology1987;94:1538.
4. Drance SM. The coefficient of scleral rigidity innormal and glaucomatous eyes. Arch Ophthalmol1960;63:668.
5. Dunn JS, Brubaker RF: Perkins applanationtonometer, clinical and laboratory evaluation.Arch Ophthalmol 1973;89:149.
6. Durhan DG, Bigliano RP, Masino JA: Pneumaticapplanation tonometer. Trans Am AcadOphthalmol Otolaryngol 1965;69:1029.
7. Finlay RD. Experience with the Draegerapplanation tonometer. Trans Ophthalmol Soc UK1970;90:887.
8. Forbes M, Pico GJ, Goldmann B: A noncontactapplanation tonometer description and clinicalevaluation. Arch Ophthalmol 1974;91:134.
9. Friedenwald JS. Standardization of tonometersdecennial report. Trans Am Acad OphthalmolOtolaryngol 1954;58.
10. Friedenwald JS. Contribution to the theory andpractice of tonometry. Am J Ophthalmol 1937;20:985.
11. Friedman E, et al. Increased scleral rigidity andage-related macular degeneration. Ophthalmo-logy 1989;96:104.
12. Glouster J, Perkins ES. The validity of the Imbert-Fick law as applied to applanation tonometry.Exp Eye Res 1963;2:274.
13. Grolman B. Non-contact applanation tonometry.Optician 1973;166:4.
14. Hollows FC, Graham PA: Intraocular pressure,glaucoma, and glaucoma suspects in a definedpopulation. Br J Ophthalmol 1966;50:570.
15. Imbert A. Theories ophthalmotonometers: ArchOphthalmol 1885;5:358.
16. Kaufman HE, Wind CA, Waltman SR. Validityof Mackay-Marg electronic applanationtonometer in patients with scarred irregularcorneas. Am J Ophthalmol 1970;69:1003.
17. Khan JA, et al. Comparison of Oculab Tono-Penreadings obtained from various corneal andscleral locations. Arch Ophthalmol 1991; 109: 1444.
18. Krieglstein GK, Waller WK. Goldmannapplanation versus hand-applanation andSchiøtz indentation tonometry. Graefes Arch ClinExp Ophthalmol 1975;194:11.
19. Kronfeld PC. Tonometer calibration empiricalvalidation: the committee on standardization of
tonometers. Trans Am Acad OphthalmolOtolaryngol 1957;61:123.
20. Langham ME, McCarthy E. A rapid pneumaticapplanation tonometer: comparative findingsand evaluation. Arch Ophthalmol 1968;79:389.
21. Macro FJ, Brubakar RF. Methodology of eyepressure measurement. Biorheology 1969;6:37.
22. Markiewitz HH. The so-called Imbert Fick law(Correspondence). Arch Ophthalmol 1960;64:159.
23. McMillan F, Forster RK. Comparison of Mackay-Marg, Goldmann, and Perkins tonometers inabnormal corneas. Arch Ophthalmol 1975;93:420.
24. Moses RA. Fluorescein in applanationtonometry. Am J Ophthalmol 1960;49:1149.
25. Moses RA. The Goldmann applanationtonometer. Am J Ophthalmol 1958;46:865.
26. Pepose JS, et al. Disinfection of Goldmanntonometers against human immunodeficiencyvirus type I. Arch Ophthalmol 1989;107:983.
27. Perkins ES. Hand-held applanation tonometer.Br J Ophthalmol 1965;49:591.
28. Petersen WC, Schlegel WA. Mackay-Margtonometry by technicians. Am J Ophthalmol1973;76:933.
29. Posner A. Practical problems in the use of theMaklakov tonometer. EENT J 1963;42:82.
30. Posner A. An evaluation of the Maklakovapplanation tonometer. EENT J 1962;41:377.
31. Rootman DS, et al. Accuracy and precision ofthe Tono-Pen in measuring intraocular pressureafter keratoplasty and epikeratophakia in scarredcorneas. Arch Ophthalmol 1988;106:1697.
32. Schmidt T. The clinical application of theGoldmann applanation tonometer. Am JOphthalmol 1960;49:967.
33. Schwartz NJ, Mackay RS, Sackman JL. Atheoretical and experimental study of themechanical behavior of the cornea withapplication to the measurement of intraocularpressure. Bull Math Biol 1966;28:285.
34. Schields MB. The noncontact tonometer: Its valueand limitations. Surv Ophthalmol 1980;24:211.
34. Starrels ME. The measurement of intraocularpressure. Int Ophthalmol Clin 1979;19:9.
36. Stepanik J. Tonometry results using a cornealapplanation 3.53 mm in diameter. Klin MonatsblAugenheidkld 1984;184:40.
37. Ventura LM, Dix RD. Viability of herpes simplextype I on the applanation tonometer. Am JOphthalmol 1987;103:48.

106 Diagnostic Procedures in Ophthalmology
A NARAYANASWAMY, L VIJAYA
Gonioscopy7Gonioscopy, the visualization and assessmentof the anterior chamber angle, is an essentialprocedure in the diagnosis and management ofglaucoma. The term gonioscopy was coined byTrantas in 1907. Subsequently, Goldmannintroduced the gonioprism, and Barkan masteredthe art of gonioscopy and highlighted its rolein the management of glaucoma. All cases ofglaucoma should undergo a routine and periodicgonioscopic evaluation. The procedure is fairlyeasy to perform, but experience is needed inaccurate assessment and interpretation.
Optical PrinciplesThe anatomy of the eye is such that the anglerecess is not visualized by routine instru-mentation due to total internal reflection of raysemerging from the angle recess. The gonioscopewas evolved to overcome this optical problemof critical angle (Fig. 7.1).
Types of Gonioscopy
Direct Gonioscopy
Direct gonioscopy is performed with the aid of
concave contact lenses (e.g. Koeppe) placed overan anesthetized cornea with the patient in supineposition and the space between the lens andcornea filled with normal saline or methylcellulose as a coupling agent. Viewing is achieveddirectly using a hand-held biomicroscope andan illuminator. Alternatively, the operatingmicroscope can be used to evaluate the angleof the anterior chamber by making appropriateadjustments. Koeppe’s lenses are available indiameters of 16 mm and 18 mm allowing easy
Fig. 7.1: Optical principles of gonioscopy: a: Incident lightfrom the angle exceeds critical angle resulting in totalinternal reflection and preventing visibility of the recess.b and c: The gonio lens optically eliminates the corneaas shown in the schematic diagrams and allows visibilityof the angle

107Gonioscopy
use in pediatric patients. This technique can bepracticed both in the outpatient clinic as wellas in the operation theatre. A major advantageof this method is that it allows simultaneouscomparison of different quadrants of the angle.Apart from the diagnostic value, lenses like theSwan Jacob, Barkan and Thorpe aid in surgicalintervention (Figs 7.2 and 7.3).
Fig. 7.2: Koeppe’s lenses
Fig. 7.3: Surgical lenses: Barkan and ThorpeIndirect Gonioscopy
Indirect gonioscopy employs reflecting prisms(e.g. Goldmann lens) mounted in a contact lensand angulated at appropriate degrees to evaluatethe angle structures using the slit-lamp. The mostpopular lenses are the Goldmann type, Zeiss,Posner and Sussman four mirrors (Table 7.1).
Goldmann lenses (Fig. 7.4) are of two types:(i) Single mirrored—has a mirror angulated at62°, (ii) Three-mirrored lens—has mirrors at 59°(tongue-shaped, used to evaluate the angle), 67° Fig. 7.4: Goldmann lenses three and single mirror
TABLE 7.1: CONTACT LENSES USED FOR GONIOSCOPY
Type Lenses Features
Direct 1. Koeppe Diagnostic lens—50 diopter concave lens available in two sizes for infants(16 mm) and adults (18 mm)
2. Barkan Surgical lens—available in various sizes and has blunted edges allowingaccess for goniotomy
3. Thorpe Surgical and diagnostic lens4. Swan-Jacob Surgical lens for goniotomy5. Layden Diagnostic lens for evaluating neonatal angle
Indirect 1. Goldmann single Diagnostic and therapeutic lenses, provide excellent images with goodmirror and three magnification and globe stabilitymirrors
2. Zeiss and Posner Ideal diagnostic lenses, patient friendly and very valuable in evaluatingfour mirrors narrow angles and to perform indentation gonioscopy
3. Sussman four mirrors Hand held four mirrors similar advantages as the Zeiss lenses4. Ritch trabeculoplasty Four-mirrored lens with pairs inclined at 59 and 62 degrees. One of
lens each set has a convex lens over it providing magnification—both diagnosticand therapeutic

108 Diagnostic Procedures in Ophthalmology
(midsized, used to view midperipheral fundus)and 73° (long, used to view peripheral fundusand ciliary body). The central wall has a diameterof 12 mm and radius of curvature of 7.38 mm.A newer modified version with 8.4 mm radiusof curvature eliminates the need of using acoupling solution. The three mirrors also aid inretinal evaluation and laser therapy.
Zeiss lens (has under holder), or Posner (hasa screw-in handle) four mirror has mirrorsangulated at 64° and are amongst the mostpopular gonioscopy lenses. The Zeiss four mirror(Fig. 7.5) eliminates the need for rotation toevaluate the angle and it’s radius of curvatureis 7.8 mm, closer to the corneal curvature, therebyeliminating the need for a viscous coupling agent.The diameter of the lens is 9.0 mm which aidsin dynamic or compression gonioscopy, animportant technique in evaluating narrow anglesand angle-closure glaucomas.
4. Adequate anesthesia is ensured using either0.5% topical proparacaine or 4.0%lignocaine.
5. The patient and examiner should be in acomfortable posture with adequate supportto examiner’s forearm and elbow to makesure of good control and minimal pressureover the eye throughout the procedure.
6. The lens is held in the examiner’s left handfor evaluating the right eye and vice versa.
7. The three-mirror gonioscope is filled withviscous solution and inserted as shown inFigure 7.6. The four-mirror is applied directly(Fig. 7.7).
Fig. 7.5: Zeiss four mirror lens
Protocol for a Routine Gonioscopy1. Explain the procedure to the patient.2. Reassure the patient and ensure cooperation.3. Corneal surface is examined to rule out any
contraindication for gonioscopy (abrasion,infection, significant corneal edema oropacity).
Fig. 7.6: The inferior rim of three mirror gonioscope isinserted in the lower fornix with patient in upgaze as shownand swiftly tilted on to the cornea preventing loss of anycoupling fluid
Fig. 7.7: The four mirror gonioscope is applied gentlyand directly on to the cornea. Fingers rested over cheekto ensure adequate support and prevent inadvertentpressure over the globe

109Gonioscopy
8. The patient is asked to maintain a straightgaze once the lens is in situ.
9. Low, but adequate illumination, and smallbeams are focused on the mirror, withviewing and illumination maintained in thesame axis. The illumination arm is movedparaxial when needed to evaluate the nasaland temporal recesses. Magnification andillumination can be increased when neededto evaluate finer details like new vesselsand foreign bodies.One quadrant can be evaluated at a timewith the three mirror by sequential rotationwhile with the four mirror gonioscope allfour quadrants can be evaluated withoutrotation and with minimum adjustments ofthe slit-lamp. Always remember the oppositequadrant (e.g. with mirror at 7 o’clock, the1 o’clock angle) is being evaluated and theimage is reversed but not crossed.
Other dynamic maneuvers like compressionand over the hill evaluation are subsequentlydone. Over the hill maneuver involves askingthe patient to look in the direction of themirror; which in turn gives access to viewingangle recess over the convex iris.Compression techniques will be dealt withsubsequently.
10. Disinfection of lenses is necessary prior andafter every use because of the potential oftransmitting infection. Lenses can be swipeddry with bacillocid (2% gluteraldehyde) oralternatively lenses can be rinsed with soapsolution and water and allowed to dry.
Gonioscopic Anatomy andInterpretationRepeated and routine normal gonioscopic studiesare essential in adding to one’s experience inevaluating a pathological angle. A methodicalevaluation of each structure either from iris plane
to Schwalbe’s line (Fig. 7.8) or from iris planeto Schwalbe’s should curtail errors ininterpretation.
To start with, from the peripheral iris planeone can follow upwards to the insertion of irisroot. The contour of iris has several variations.The normal adult eye has a slightly convexcontour. The same may be exaggerated inhyperopic eyes, where in the anterior segmentit is crowded. A flat iris configuration iscommonly associated with myopia and aphakia.A flat iris configuration with a peripheral convexroll or hump of iris that lies in close relationto the trabecular meshwork and can be seen inphakic normal eyes which often mimics a narrow-angle and is referred to as plateau iris configuration.Contours could also be concave and areassociated with high myopes and pigmentdispersion syndrome. The insertion of iris root,may vary from a posterior, anterior or highinsertions, thereby determining the visibility ofthe ciliary body band and the contour and depthof angle recess. The ciliary body band iscomposed of the anterior end of ciliary muscle
Fig. 7.8: Gonioscopic landmarks of a normal angle:1 Iris root, 2 Ciliary body band, 3 Scleral spur, 4 Trabecularmeshwork, 5 Schwalbe’s line, 6 Schlemm’s canal,7 Parallelopiped effect
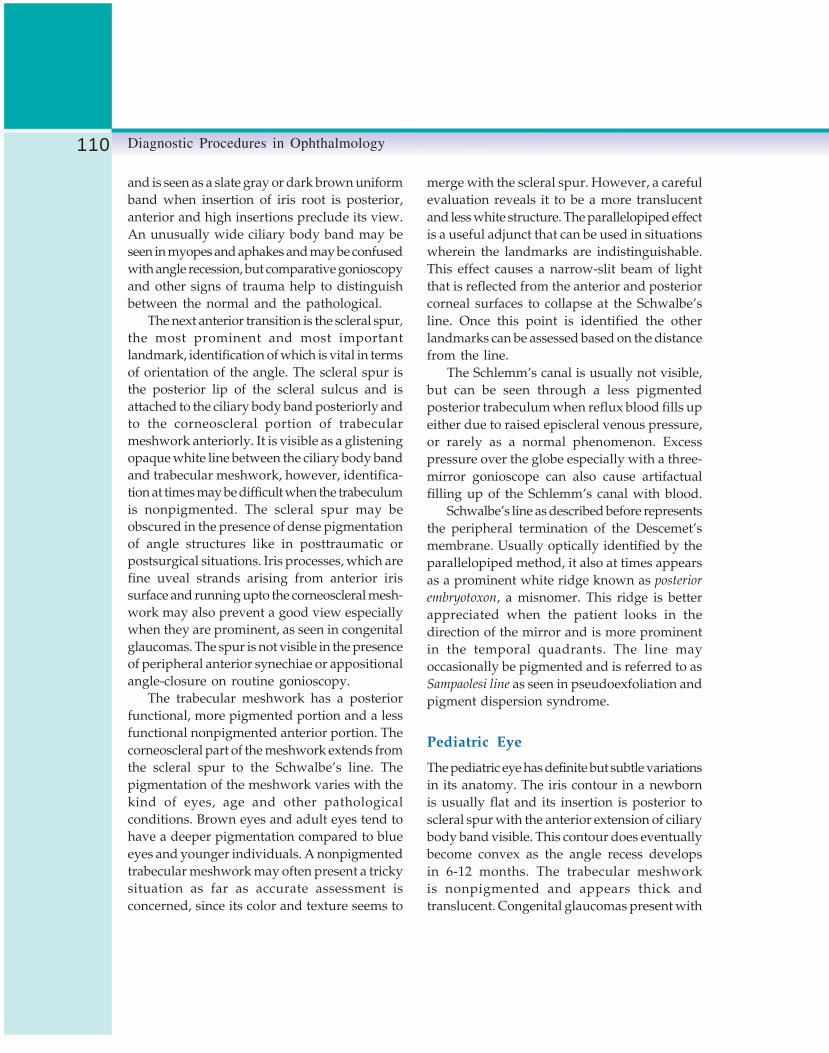
110 Diagnostic Procedures in Ophthalmology
and is seen as a slate gray or dark brown uniformband when insertion of iris root is posterior,anterior and high insertions preclude its view.An unusually wide ciliary body band may beseen in myopes and aphakes and may be confusedwith angle recession, but comparative gonioscopyand other signs of trauma help to distinguishbetween the normal and the pathological.
The next anterior transition is the scleral spur,
the most prominent and most importantlandmark, identification of which is vital in termsof orientation of the angle. The scleral spur isthe posterior lip of the scleral sulcus and isattached to the ciliary body band posteriorly andto the corneoscleral portion of trabecularmeshwork anteriorly. It is visible as a glisteningopaque white line between the ciliary body bandand trabecular meshwork, however, identifica-tion at times may be difficult when the trabeculumis nonpigmented. The scleral spur may beobscured in the presence of dense pigmentationof angle structures like in posttraumatic orpostsurgical situations. Iris processes, which arefine uveal strands arising from anterior irissurface and running upto the corneoscleral mesh-work may also prevent a good view especiallywhen they are prominent, as seen in congenitalglaucomas. The spur is not visible in the presenceof peripheral anterior synechiae or appositionalangle-closure on routine gonioscopy.
The trabecular meshwork has a posteriorfunctional, more pigmented portion and a lessfunctional nonpigmented anterior portion. Thecorneoscleral part of the meshwork extends fromthe scleral spur to the Schwalbe’s line. Thepigmentation of the meshwork varies with thekind of eyes, age and other pathologicalconditions. Brown eyes and adult eyes tend tohave a deeper pigmentation compared to blueeyes and younger individuals. A nonpigmentedtrabecular meshwork may often present a trickysituation as far as accurate assessment isconcerned, since its color and texture seems to
merge with the scleral spur. However, a carefulevaluation reveals it to be a more translucentand less white structure. The parallelopiped effectis a useful adjunct that can be used in situationswherein the landmarks are indistinguishable.This effect causes a narrow-slit beam of lightthat is reflected from the anterior and posteriorcorneal surfaces to collapse at the Schwalbe’sline. Once this point is identified the otherlandmarks can be assessed based on the distancefrom the line.
The Schlemm’s canal is usually not visible,but can be seen through a less pigmentedposterior trabeculum when reflux blood fills upeither due to raised episcleral venous pressure,or rarely as a normal phenomenon. Excesspressure over the globe especially with a three-mirror gonioscope can also cause artifactualfilling up of the Schlemm’s canal with blood.
Schwalbe’s line as described before representsthe peripheral termination of the Descemet’smembrane. Usually optically identified by theparallelopiped method, it also at times appearsas a prominent white ridge known as posterior
embryotoxon, a misnomer. This ridge is betterappreciated when the patient looks in thedirection of the mirror and is more prominentin the temporal quadrants. The line mayoccasionally be pigmented and is referred to asSampaolesi line as seen in pseudoexfoliation andpigment dispersion syndrome.
Pediatric Eye
The pediatric eye has definite but subtle variationsin its anatomy. The iris contour in a newbornis usually flat and its insertion is posterior toscleral spur with the anterior extension of ciliarybody band visible. This contour does eventuallybecome convex as the angle recess developsin 6-12 months. The trabecular meshworkis nonpigmented and appears thick andtranslucent. Congenital glaucomas present with

111Gonioscopy
anterior insertions of the iris directly on to thetrabeculum and at times the anterior iris stromasweeps upward in a concave fashion to insertonto the trabecular meshwork.
Grading and Recording ofGonioscopic Findings
Though multiple individual variations inassessment and grading gonioscopic details arebeing followed, it is important to follow a certainprotocol of documentation, which aids in followup of the disease process. Among the systemsdescribed (Table 7.2), the Spaeth’s system isthought to be complete as it covers details withregard to angle width, iris insertion andconfiguration. Any gonioscopic data shouldcontain: (a) width of angle recess, (b) iris contourand insertion of iris root, (c) degree ofpigmentation and (d) presence of abnormalstructures in each quadrant. Figure 7.9 showsa wide-open angle (Shaffer’s grade IV or Speath’sD40r) with regular iris contour and deep recess.
Fig. 7.9: Gonio-photograph of a grade IV Shaffer’s angle(corresponds to Spaeth—D40r). (a) Iris root, (b) Ciliarybody band, (c) Scleral spur, (d) Trabecular meshwork.Iris contour is regular with a deep recess
All the landmarks—iris root, ciliary body band,scleral spur and trabecular meshwork are visible.When insertion of iris occurs at scleral spur, theperipheral iris appears slightly convex, the angleof the anterior chamber still remains open(Shaffer’s grade III or Speath’s C30r, Fig. 7.10).
TABLE 7.2: CLASSIFICATION SYSTEMS FOR GONIOSCOPY
System System basis Angle structures and classification
All structures visible Wide openAngle recess not seen Grade I narrow
Scheie (1957) Extent of angle Ciliary body band not seen Grade II narrowstructures visualized Posterior trabeculum obscured Grade III narrow
Only Schwalbe’s line visible Grade IV narrow
Wide open (30°-45°) Grade 3-4, closure impossibleModerately narrow (20°) Grade 2, closure possible
Shaffer (1960) Angular width of Extremely narrow (10°) Grade 1, closure probablerecess Partly or totally closed Grade 0, closure present
Anterior to Schwalbe’s line AInsertion of iris root Behind (posterior) to Schwalbe’s line B
At scleral spur CSpaeth (1971) Deep into ciliary body band D
Extremely deep EAngular approach 0-40 degreesto the recessConfiguration of Regular (slightly convex) rperipheral iris Quirk (posterior bowing) q
Steep s

112 Diagnostic Procedures in Ophthalmology
Compression Gonioscopy
Compression or indentation gonioscopy is asimple and invaluable technique that one needsto know to assess narrow angles (Fig. 7.11) andchronic angle-closure situations. It helpsdistinguish appositional angle-closure fromsynechial angle-closure. The technique employsexerting external pressure over the cornea usingthe Zeiss, Posner or Sussman four mirror lenses;thereby forcing the lens iris diaphragmposteriorly and allowing to visualize the hiddenangle recess (Fig. 7.12).
The technique involves a routine assessmentof all quadrants, following which, if onesubsequently decides the angle is narrow, each
quadrant is re-evaluated using a narrow slit-beam (to prevent miosis causing artifactualopening of the angle recess), pressure is applieddirected towards the center of the eye. This resultsin deepening of the anterior chamber in the areaof recess caused by bowing back of peripheraliris along with stretching of the limbal scleralring and straightening of the angle recess;following this one can see structures that werenot visible earlier, or confirm the presence ofperipheral anterior synechiae. Corneal folds oftendistort the view but this can be minimized withappropriate technique in application of pressure.The physiological principles involved incompression gonioscopy have been depicted inFigure 7.13. Compression may not be effectivewhen intraocular pressures are beyond 40 mmHg as this limits the expansion of the limbalscleral ring.
Common Gonioscopic Findings andtheir Variations
Peripheral Anterior Synechia (PAS)
The peripheral anterior synechia is a pathologicalterm referring to the adhesions of peripheral iristo the anterior angle structures, most often thefunctional trabecular meshwork, or rarely,
Fig. 7.10: Gonio-photograph of a grade III Shaffer’s angle(corresponds to Spaeth—C30r). Landmarks are visibleupto scleral spur with a mild iris convexity
Fig. 7.11: The photograph shows a narrow anglevisible upto the Schwalbe’s line
Fig. 7.12: The same angle on compression widensto reveal landmarks upto scleral spur

113Gonioscopy
extending to the Schwalbe’s line. Typically seenassociated with primary angle-closure glaucoma,uveitic and other secondary angle-closureglaucomas, PAS may often be confused with irisprocesses—which are normal fine lacy cords ofuveal tissue extending from the peripheral iristo the trabecular meshwork. PAS on the otherhand are broad adhesions commonly localizedto quadrants with areas in between wideningwith indentation technique of gonioscopy. Anangle that is closed 360° may often present adilemma but one can follow the slit-beam fromthe posterior surface of the cornea which normallydoes not meet the beam on the iris directly inan angle that is open but instead lies alongsidethe other. A direct continuation of the beamwithout a break is suggestive of a closed-angle.Clinical correlation and experience will oftenhelp overcome this hurdle.
Blood Vessels
Normally all vessels in the angle are restrictedto the ciliary body band and iris root and donot extend to the scleral spur or trabecularmeshwork. Anomalous vessels are not rare, they,however, can readily be distinguished fromneovascularization which are vessels usually
arising from the peripheral iris surface andbranching out in an arborizing and lacy patternonto the corneoscleral portion of trabecularmeshwork. Varying amounts of peripheralanterior synechiae may also be associateddepending on the stage of disease process.
Pigmentation
The trabecular meshwork has a varying amountof pigmentation varying from 0 to 4, which isa subjective grading that correlates to none (0),faint (1), average (2), heavy (3), and very heavy(4). Pigmentation increases with age undernormal physiological conditions. Excessivepigmentation is usually pathological and isassociated with pseudoexfoliation syndrome,pigment dispersion syndrome, traumatic anduveitic glaucomas.
Other Abnormal Findings
A variety of surprises may be hidden in the anglerecess. Blood in Schlemm’s canal appears as auniform linear reddish hue just anterior topigmented trabecular meshwork and isassociated with raised episcleral venous pressure.It can also be observed under normal conditionsand as an artifact when excess external pressureis exerted during gonioscopy. Pseudoexfoliativematerial, microscopic hyphema and hypopyoncan be visualized. Foreign bodies and emulsifiedsilicone oil globules are among the other thingsthat can be picked up by a careful gonioscopy.
ConclusionIn conclusion, the diagnostic basis of anyglaucoma should be in correlation to thegonioscopic findings whenever possible. Themanagement and prognosis of the diseasedepends on a complete diagnosis that includes
Fig. 7.13: Compression gonioscopy: a: The narrow angleappears closed on a routine gonioscopy, b: Compressionfails to allow visibility of angle structures due to PAS,c: Compression widens the recess and allows a viewof all structures in the absence of PAS

114 Diagnostic Procedures in Ophthalmology
a routine and periodic gonioscopic evaluation.Gonioscopy widens our scientific understandingof the disease process and guides us to managethe disease more effectively.
Bibliography1. Epstein DL. Chandler and Grant’s Glaucoma
(3rd edn). Philadelphia: Lea and Febiger, 1986.2. Fellman RL, Spaeth GL, Starita RJ. Gonioscopy:
Key to successful management of glaucoma.In Focal points Clinical Modules forOphthalmologists, San Francisco, AAO 1984.
3. Kanski JJ, James AM, John FS. Glaucoma—AColour Manual of Diagnosis and Treatment (2ndedn). London, Butterworth-Heinemann, 1996.
4. Kolker AE, Hetherington J Jr. Becker-Shaffer’sDiagnosis and Therapy of the Glaucomas (5thedn). St Louis, Mosby, 1985.
5. Neil TC, Diane CL. Atlas of Glaucoma. MartinDunitz, 1998;39.
6. Palmberg P. Gonioscopy. In Ritch R, ShieldsMB, Krupin T (Eds). Glaucomas (2nd edn). StLouis, Mosby, 1996.
7. Shields MB. Aqueous humor dynamics. II.Techniques for evaluating. In: Textbook ofGlaucoma (3rd edn). Baltimore, Williams andWilkins, 1992.

115Optic Disk Assessment in Glaucoma
RAJUL PARIKH, CHANDRA SEKHAR
Optic DiskAssessment in
Glaucoma8An estimated 67 million people worldwide haveglaucoma in the year 2000. At least 50% do notknow that they have the disease since it is usuallywithout symptoms.1,2 Rapid advances in imagingtechnologies such as confocal scanning laserophthalmoscopy, scanning laser polarimetry andoptical coherence tomography for detection ofearly glaucomatous damage have only moderatesensitivity and specificity.3-5 New psychophy-sical procedures such as short wavelengthautomated perimetry, frequency doublingperimetry and motion automated perimetrywhich are targeted at specific visual functionshave been shown to be more sensitive and specificthan standard automated perimetry foridentifying early glaucomatous damage.6-8
However, these techniques may not be availableto all clinicians and have the limitations of allsubjective tests. Several studies have shown thatabnormalities in the appearance of the optic diskmay precede visual field defects.9,10 Conventionalstereoscopic clinical evaluation and imaging ofthe optic disk with fundus photographs is stillthe most frequently used and sensitive meansof diagnosing glaucoma. 11 With some training,it is possible to clinically evaluate optic nervehead and retinal nerve fiber layer stereoscopicallyand detect early glaucomatous damage. The aim
of this communication is to describe themorphological changes of the optic nerve inglaucoma, highlight the techniques of clinicalevaluation of the optic disk and discuss thedifferential diagnosis.
Methods of Optic Disk ExaminationTraditionally, the direct ophthalmoscope hasbeen used for the evaluation of the optic nervehead. Though it has the advantage of providinga magnified view of the optic nerve head, it,however, lacks stereopsis and can result inmissing of subtle changes. Therefore, the use ofthe direct ophthalmoscope is to be stronglydiscouraged.
A variety of contact and noncontact lensesare available which allow stereoscopic view ofthe fundus at the slit-lamp. Contact lenses suchas Goldmann lenses are relatively uncomfortablefor the patient, take longer time and the couplingfluid can cause transient blurring and difficultyin obtaining good quality fundus photographs.Noncontact lenses include +60D, +78D, +90Dand Volk superfield lenses (Fig. 8.1). Theseprovide excellent stereoscopic and magnifiedview of the optic disk.

116 Diagnostic Procedures in Ophthalmology
It is important to draw the appearance of theoptic nerve head based on these methods. Thoughdrawing of the optic disk suffers from thedisadvantage of being subjective in nature, thisdoes offer a quick and inexpensive method ofevaluation of the optic nerve head in patientswith glaucoma during follow-up. In addition,photographs may not be possible in all casessuch as patients with rigid miotic pupils andthose with significant media opacities. However,wherever possible, photographs are an indispen-sable adjunct to clinical evaluation.
Features of Glaucomatous Disk Damage
Cup-Disk Ratio
Early studies by Armaly et al have reported thatthe vertical and horizontal cup-disk diameterratios are useful for the quantification ofglaucomatous optic neuropathy and for earlydetection of glaucoma.12 The ratio has limitedvalue in the identification of glaucomatousdamage, because of the wide variability in thesize of the optic cup in the normal population.
Disk margin is defined by inner edge of whitescleral ring (outer arrows), and the optic cupis the level at which neuroretinal rim (NRR) steeps(inner arrow) (Figs 8.2 and 8.3). A large cup-disk ratio can be normal if the optic disk is large13
and a small cup-disk ratio may be glaucomatousif the optic disk is small14 (Fig. 8.4). The problemwith estimating cup-disk ratio as a measure of
Fig. 8.1: Noncontact lenses: +60D, +78Dand Volk superfield lenses
Fig. 8.2: Disk margin (black arrow) and cup margin(white arrow)
Figs 8.3A and B: Vertical disk diameter andhorizontal disk diameter
A
B
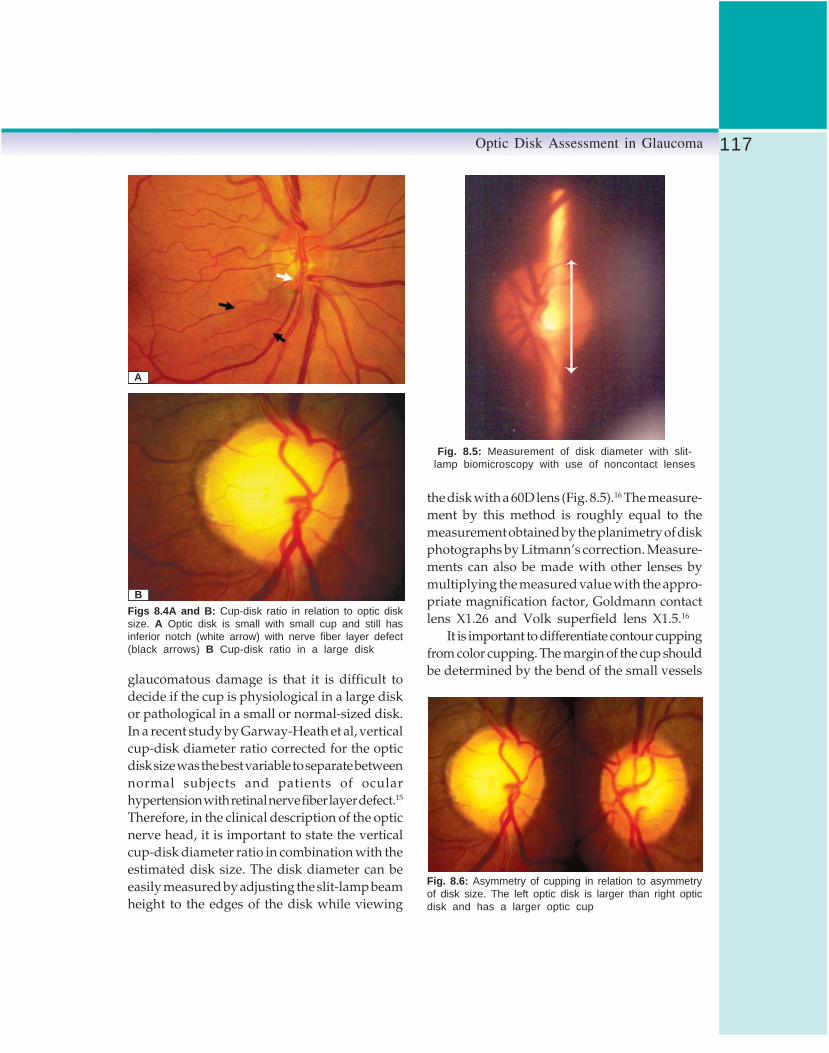
117Optic Disk Assessment in Glaucoma
glaucomatous damage is that it is difficult todecide if the cup is physiological in a large diskor pathological in a small or normal-sized disk.In a recent study by Garway-Heath et al, verticalcup-disk diameter ratio corrected for the opticdisk size was the best variable to separate betweennormal subjects and patients of ocularhypertension with retinal nerve fiber layer defect.15
Therefore, in the clinical description of the opticnerve head, it is important to state the verticalcup-disk diameter ratio in combination with theestimated disk size. The disk diameter can beeasily measured by adjusting the slit-lamp beamheight to the edges of the disk while viewing
the disk with a 60D lens (Fig. 8.5).16 The measure-ment by this method is roughly equal to themeasurement obtained by the planimetry of diskphotographs by Litmann’s correction. Measure-ments can also be made with other lenses bymultiplying the measured value with the appro-priate magnification factor, Goldmann contactlens X1.26 and Volk superfield lens X1.5.16
It is important to differentiate contour cuppingfrom color cupping. The margin of the cup shouldbe determined by the bend of the small vessels
Figs 8.4A and B: Cup-disk ratio in relation to optic disksize. A Optic disk is small with small cup and still hasinferior notch (white arrow) with nerve fiber layer defect(black arrows) B Cup-disk ratio in a large disk
A
B
Fig. 8.5: Measurement of disk diameter with slit-lamp biomicroscopy with use of noncontact lenses
Fig. 8.6: Asymmetry of cupping in relation to asymmetryof disk size. The left optic disk is larger than right opticdisk and has a larger optic cup

118 Diagnostic Procedures in Ophthalmology
Fig. 8.7: HRT print out of the same optic disks shown in Fig. 8.6 showingasymmetry of optic disk cup in relation to disk area
across the disk rim and not by the central areaof disk pallor.
Asymmetry of Optic Disk Cupping
Asymmetry of cupping is seldom seen in normaleyes and until proven otherwise, must be takenas an indication of early glaucomatous damage.However, while assessing asymmetry, it isimportant to rule out asymmetry of the disk size,which may be due to anisometropia. This canresult in difference in the cup-disk ratio betweentwo eyes, in the absence of glaucoma (Figs 8.6and 8.7).
Neuroretinal Rim Evaluation
Glaucomatous damage can be diffuse, focal ora combination of both. Diffuse damage resultsin symmetrical enlargement of the cup. Focaldamage usually involves a particular area of therim. Normally, according to the ISNT rule, theinferior rim is the thickest followed by thesuperior, the nasal and then the temporal (Fig.8.8).17 During optic nerve head evaluation, one
Fig. 8.8: Shows ISNT rule, the inferior rim is the thickestfollowed by the superior, the nasal and then the temporal
must look carefully for any areas of thinningof the neuroretinal rim or for notching or in otherwords extension of the cup into the rim tissue.If the cup is especially deep in the notch, it isknown as a pseudo-pit. Notching and pseudo-pits are usually seen at the superior or inferiorpoles. The width of the notch tends to correspondto the extent of the visual field defect (Figs 8.9Aand B, and 8.10A and B). Optic rim pallor isanother important indicator of glaucomatous disk

119Optic Disk Assessment in Glaucoma
Figs 8.9A and B: Relation between neuroretinal rim notch and visual field defect. The optic disk photographshows inferior notch (black arrow) with corresponding superior arcuate field defect
A
B

120 Diagnostic Procedures in Ophthalmology
Figs 8.10A and B: Relation between inferior notch (here inferior notch is wider than the oneseen in Fig. 8.9) and visual field defect. The optic disk photograph shows neuroretinal notch(black arrow) with corresponding superior arcuate field defect
A
B

121Optic Disk Assessment in Glaucoma
damage. In the glaucomatous optic disk, the paleand translucent atrophic tissue may replace thenormal pink color of the neuroretinal rim whichcan result in a field defect in the correspondingopposite hemisphere.
Vascular Changes
Splinter hemorrhages on the optic disk are acommon finding in glaucoma patients (Fig. 8.11).Various studies have shown that diskhemorrhages in association with localized nervefiber layer defects and notches of the neuroretinalrim are more common among patients of normaltension glaucoma.18, 19 A possible explanationfor the difference in frequency has been suggestedby Jonas et al. They stated that the amount ofblood leaking out of a vessel into the surroundingtissue depends on the intraocular pressure whenthe bleeding occurs.19 High transmural pressuregradient in normal pressure glaucoma leads tolarger disk hemorrhages. Also, since theabsorption rate of disk hemorrhages dependson the size of the disk bleed, the hemorrhagesin patients of normal pressure glaucoma maytake a longer time to disappear and thus havea higher chance to be detected than the disk
hemorrhages in patients of high pressureglaucoma.20
Hemorrhages in glaucoma usually appearas splinter-shaped or flame-shaped hemorrhageson the disk surface21 (Fig. 8.11). They usuallyprecede neuroretinal rim changes and visual fielddefects. The defects corresponding to the locationof the hemorrhage may be expected to appearweeks to year later.22 The presence of diskhemorrhages is considered an indication for theenhancement of treatment of glaucoma.
Configuration of Vessels
The retinal vessels on the optic nerve head canprovide clues about the topography of the disk.Nasalization of the vessels and baring ofcircumlinear vessels can be seen in glaucomaas well as in other diseases of the optic nerve.Bayoneting of the vessels can be seen if the rimis absent or very thin. This causes the vesselsto pass under the overhanging edge of the cupand then make a sharp bend as they cross thedisk surface. This convoluted appearance of thevessels is called ‘bayoneting’.
Peripapillary Atrophy
The zone closer to the optic nerve head withretinal pigment epithelium (RPE) and choroidalatrophy and baring of sclera is called zone β.The more peripheral zone with only RPE atrophyis called zone α (Fig. 8.12). A highly significantcorrelation has been reported between thelocation of peripapillary atrophy and visual fielddefects.23 Sometimes, these changes may representa congenital anomaly, especially in myopic eyes.However, appearance of these changes de novo
or their presence in small, nonmyopic disksshould be viewed with suspicion. Peripapillaryatrophy may be focal or circumferential (Figs8.13 and 8.14).Fig. 8.11: Disk hemorrhage

122 Diagnostic Procedures in Ophthalmology
Fig. 8.12: Peripapillary atrophy. The diagram shows atrophiczone closer to the optic nerve head called zone β andthe more peripheral zone called zone α
Fig. 8.13: Peripapillary atrophy: Localized in thetemporal area of the disk
Fig. 8.14: Peripapillary atrophy: generalized
Retinal Nerve Fiber Layer Abnormalities
Examination of the nerve fiber layer is often usefulin detecting early glaucomatous damage amongpatients of ocular hypertension with normal diskappearance and normal visual fields. Theneuroretinal rim is formed by axons convergingfrom the retina to the scleral canal. Since theaxons are spread out in a thin layer in the retina,even minor losses of the axons can be observedin the retinal nerve fiber layer. In healthy eyes,the nerve fiber layer appears opaque with
radially oriented striations. The small retinalblood vessels have a blurred and crosshatchedappearance, as they lie buried in the nerve fiberlayer. The best way to see the nerve fiber layerdefect is through a dilated pupil with astereoscopic lens, at the slit-lamp, using whiteor green light and a wide-slit beam. In thepresence of nerve fiber layer atrophy, the smallretinal blood vessels become more clearly visibleand appear unusually sharp, clear and wellfocused (Fig. 8.15). The fundus in the affectedarea appears darker and deeper red in contrastto the silvery or opaque hue of the intact nervefiber layer. Defects may be in the form of a wedgeshape arising from the disk margin and wideningtowards the periphery, are pathological (Fig.8.16), while slit-like defects narrower than theadjacent blood vessels may be physiological.Diffuse areas of atrophy are less common in earlyglaucoma and more difficult to identify.
Myopic Changes vs Glaucoma
Myopic disks can present difficulty in evaluationfor glaucoma due to the tilted disks, peripapillaryatrophy and shallow cupping. One needs to

123Optic Disk Assessment in Glaucoma
Fig. 8.15: Retinal nerve fiber layer defect: Wedge-shaped RNFL defect can be seenbetween two black arrows. It is more easily marked in red free photograph
Fig. 8.16: Retinal nerve fiber layer defect. Wedge-shaped RNFL defect reaching up to optic disk margin
carefully examine the disk to look for changesin the contour of the blood vessels, as welldelineate the disk margin from the peripapillarychanges (Fig. 8.17).
Differential DiagnosisIn addition to glaucoma, other abnormalities cancause excavation and or pallor of the optic disk
Fig. 8.17: Myopic disk with primary open-angleglaucoma
and it is, therefore, important to rule out thesepossibilities before making the diagnosis ofglaucoma.
Physiological Cupping
Assessment of the size of the optic disk, carefulexamination of the neuroretinal rim and theretinal nerve fiber layer can help distinguishphysiological cupping from glaucomatousdamage in most cases.
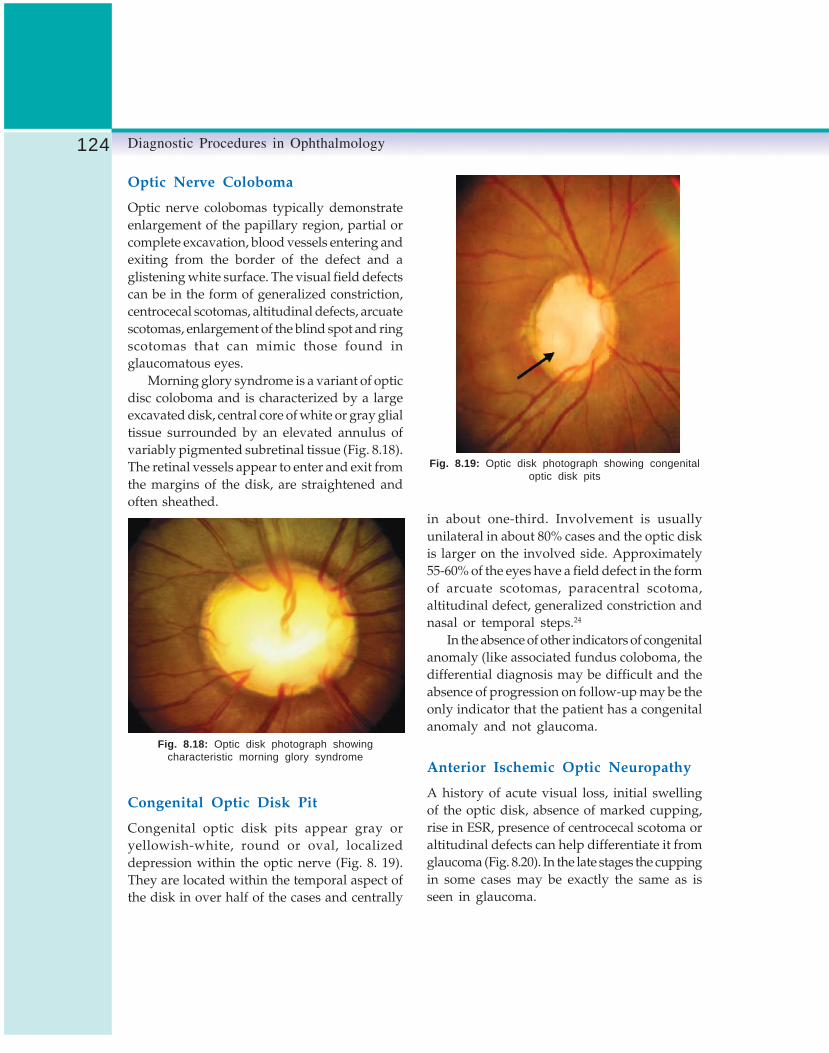
124 Diagnostic Procedures in Ophthalmology
Optic Nerve Coloboma
Optic nerve colobomas typically demonstrateenlargement of the papillary region, partial orcomplete excavation, blood vessels entering andexiting from the border of the defect and aglistening white surface. The visual field defectscan be in the form of generalized constriction,centrocecal scotomas, altitudinal defects, arcuatescotomas, enlargement of the blind spot and ringscotomas that can mimic those found inglaucomatous eyes.
Morning glory syndrome is a variant of opticdisc coloboma and is characterized by a largeexcavated disk, central core of white or gray glialtissue surrounded by an elevated annulus ofvariably pigmented subretinal tissue (Fig. 8.18).The retinal vessels appear to enter and exit fromthe margins of the disk, are straightened andoften sheathed.
in about one-third. Involvement is usuallyunilateral in about 80% cases and the optic diskis larger on the involved side. Approximately55-60% of the eyes have a field defect in the formof arcuate scotomas, paracentral scotoma,altitudinal defect, generalized constriction andnasal or temporal steps.24
In the absence of other indicators of congenitalanomaly (like associated fundus coloboma, thedifferential diagnosis may be difficult and theabsence of progression on follow-up may be theonly indicator that the patient has a congenitalanomaly and not glaucoma.
Anterior Ischemic Optic Neuropathy
A history of acute visual loss, initial swellingof the optic disk, absence of marked cupping,rise in ESR, presence of centrocecal scotoma oraltitudinal defects can help differentiate it fromglaucoma (Fig. 8.20). In the late stages the cuppingin some cases may be exactly the same as isseen in glaucoma.
Fig. 8.18: Optic disk photograph showingcharacteristic morning glory syndrome
Congenital Optic Disk Pit
Congenital optic disk pits appear gray oryellowish-white, round or oval, localizeddepression within the optic nerve (Fig. 8. 19).They are located within the temporal aspect ofthe disk in over half of the cases and centrally
Fig. 8.19: Optic disk photograph showing congenitaloptic disk pits

125Optic Disk Assessment in Glaucoma
Fig. 8.20: Anterior ischemic optic neuropathy. The right-sided optic disk photograph is from patients with long-standing AION showing typical glaucomatous cupping
Figs 8.21A and B: A Optic disk photograph showing significant cupping, but with out of proportion pallor.B Visual field defect showing a temporal hemianopia suggestive of pituitary tumor
A
B

126 Diagnostic Procedures in Ophthalmology
Neurological Causes
Pallor disproportionate to cupping, normalintraocular pressure or unusual history of onset,progression and age should arouse suspicionof a neurological disorder causing optic diskdamage (Fig. 8.21).
Presence of visual field defects that respectvertical midline and the pattern of the field defectsshould be able to suggest the possible site ofthe intracranial lesion.
SummaryIn summary, the optic disk evaluation inglaucoma is best done stereoscopically at theslit- lamp with a dilated pupil using one of the60D, 78D or 90D lenses. Changes in the neuro-retinal rim, optic disk hemorrhages, peripapillaryatrophy and nerve fiber layer defects are moreimportant features than the cup-disk ratio. Thecup-disk ratio is to be documented andinterpreted along with the disk size and not inisolation. The diagnosis of glaucoma will dependon the presence of a visual field defect thatcorrelates with the anatomic changes on the opticnerve head and the peripapillary retina.
References1. Quigley HA. Number of people with glaucoma
worldwide. Br J Ophthalmol 1996;80:389-93.2. Dandona L, Dandona R, Srinivas M, et al. Open-
angle glaucoma in an urban population insouthern India: the Andhra Pradesh EyeDisease Study. Ophthalmology 2000; 107(9): 1702-09.
3. Zangwill LM, Bowd C, Berry CC, Williams J,Blumenthal EZ, SanchezGoleans CA, Vasilie C,Wainreb RN. Discriminating between normaland glaucomatous eyes using the Heidelbergretina tomograph, GDx nerve fibre analyserand optical coherence tomograph. ArchOphthalmol 2001;119:985-93.
4. Bowd C, Zangwill LM, Berry CC, BlumenthalEZ, et al. Detecting early glaucoma byassessment of retinal nerve fibre layer thicknessand visual functions. Invest Ophthalmol Vis Sci2001;42:2001-03.
5. Medeiros FA, Zangwill LM, Bowd C, WeinrebRN. Comparison of the GDx VCC scanninglaser polarimeter, HRT II confocal scanning laserophthalmoscope, and stratus OCT opticalcoherence tomograph for the detection ofglaucoma. Arch Ophthalmol 2004;122;827-37.
6. Johnson CA, Adams AJ, Casson EJ, Brandt JD.Blue-on-yellow perimetry can predict thedevelopment of glaucomatous field loss. ArchOphthalmol 1993;111:645-50.
7. Bayer AU, Maag KP, Erb C. Detection of opticneuropathy in glaucomatous eyes with standardvisual fields using a battery of short wave-lengthautomated perimetry and pattern electroretino-graphy. Ophthalmology 2002;109: 1009-17.
8. Sample PA, Bosworth CF, Blumenthal EZ, GirkinC, Weinreb RN. Visual function-specificperimetry for indirect comparison of differentganglion cell populations in glaucoma. InvestOphthalmol Vis Sci 2000;41:1783-90.
9. Quigley HA, Dunkelberger GR, Baginski TA,et al. Chronic human glaucoma causingselectively greater loss of larger optic nervefibers. Ophthalmology 1988;95:357-63.
10. Sommer A, Pollack I, Maumenne AE. Optic discparameters and onset of glaucomatous fieldloss: I Methods and changes in disc morphology.Arch Ophthalmol 1979;97:1444-48.
11. Greaney MJ, Hoffman DC, Garway-Heath DF,et al. Comparison of optic nerve imagingmethods to distinguish normal eyes from thosewith glaucoma. Invest Ophthalmol Vis Sci 2002;43(1):140-45.
12. Armaly MF, Saydegh RE. The cup/disc ratio.Arch Ophthalmol 1969;82:191-96.
13. Jonas JB, Zach F-M, Gusek GC, Naumann GOH.Pseudoglaucomatous physiologic large cups.Am J Ophthalmol 1989;107:137-44.
14. Jonas JB, Fernandez MC, Naumann GOH.Glaucomatous optic nerve atrophy in small diskswith low cup-to-disc ratios. Ophthalmology1990;97:1211-15.
15. Garway-Heath DF, Ruben ST, Viswanathan A,Hitchings R. Vertical cup/disk ratio in relationto optic disk size: its value in the assessment

127Optic Disk Assessment in Glaucoma
of the glaucoma suspect. Br J Ophthalmol 1999;82:1118-24.
16. Jonas JB, Dichtl A. Advances in the assessmentof the optic disc changes in early glaucoma.Cur Opi Ophthalmol 1995;6:61-66.
17. Jonas JB, Gusek GC, Naumann GOH. Optic disc,cup and neuroretinal rim size, configuration,and correlations in normal eyes. InvestOphthalmol Vis Sci 1991;29,1151-58, InvestOphthalmol Vis Sci 1993;32.
18. Kitazawa Y, Shirato S, Yamamoto T. Optic dischemorrhage in low-tension glaucoma.Ophthalmology 1986;93:853-57.
19. Jonas JB, Budde WM. Optic nerve headappearance in juvenile-onset chronic high-pressure glaucoma and normal-pressureglaucoma. Ophthalmology 2000;107:704-11.
20. Jonas JB, Xu L. Optic disc hemorrhages inglaucoma. Am J Ophthalmol 1994;118:1-8.
21. Drance S.M, Fairclough M, Butler DM, KottlerMS. The importance of disc haemorrhage inthe prognosis of chronic open-angle glaucoma.Arch Ophthalmol 1977;95:226-28.
22. Heijl A. Frequent disc photography andcomputerized perimetry in eyes with opticdisc haemorrhage. Acta Ophthalmol 1986;64:274-81.
23. Jonas JB. Naumann GOH. Parapapillarychorioretinal atrophy in normal and glaucomaeyes. II. Correlations. Invest Ophthalmol Vis Sci1989;30:919-26.
24. Brown GC. Congenital fundus abnormalities.In: Duane TD (Ed). Clinical Ophthalmology 1991,Philadelphia, J.B. Lippincott.

128 Diagnostic Procedures in Ophthalmology
DEVINDRA SOOD, PARMOD KUMAR
Basic Perimetry9Visual field is a part of space, seen at any givenmoment. Changes in the visual field are producedby a number of disease conditions which canaffect the visual system and often manifestthrough changes in the visual field. Hence, itis essential to determine the extent of the visualfield for the diagnosis and management of theseconditions.
The visual field is usually perceived with botheyes. It is, however, measured separately for eacheye. The normal visual field extends up to 50degrees superiorly, 70 degrees inferiorly, 60degrees nasally and 90 degrees temporally. Afterdefining the visual field for each eye, the two canbe compared with each other for asymmetry orcompared to a normal reference test for anyabnormality and be examined together to lookfor patterns suggestive of disease conditions.
Perimetry is the science of measuring theperipheral vision (“Peri”= peripheral and“-metry" = measurement). Perimetry involvesplacing the eye at the center of curvature of ahemispherical or arc-shaped instrument. The testobjects have a constant angular size and are ata constant distance from the eye. The visual fieldhas been compared to an island of vision in a
sea of blindness by Traquair in 1930. This islandof vision is a three dimensional structure. The
x and y co-ordinates represent the location ofpoints on the visual field.
At the fovea, the x and y co-ordinates are0,0. The location of all points on the visual fieldare described along the x and y axis, with respectto fixation (Fig. 9.1). The blind spot is 15 degreestemporal to fixation. The z axis represents theheight of the “hill island of vision” at a givenco-ordinate (x,y) and corresponds to the retinalsensitivity at that point. Greater the sensitivityat a given point, greater is the height of the island
Fig. 9.1: A point on the island of vision is markedalong the x and y axis

129Basic Perimetry
of vision. Since sensitivity is maximum at thefovea, the height of “the hill island of vision”(z) is also maximum at the fovea. The retinalsensitivity drops to sea level 15 degrees temporalto fixation (blind spot).
Types of Perimetry
Kinetic Perimetry
Perimetry aims to draw the map of the islandof vision, such that it is a true representationfor each eye and also aims to present it in away which is clinically useful. Earlier methodsdefined the outer limits of the visual field bymoving objects from the non-seeing area to thecenter. This technique of perimetry, called kinetic
perimetry, it utilizes a moving object of a fixedsize and intensity (e.g. Tangent screen orGoldmann perimeter) to define the boundary ofthe island of vision at a fixed height. This linerepresenting the outer boundary for a given sizeof the test stimulus is called isopter. An isopteris synonymous to a horizontal slice through thehill island of vision.
Manual kinetic perimetry allows large areasto be traversed in a fairly short order. One canmove quickly over areas of little interest and spendrelatively more time in examining critical regions.Equipment is inexpensive and durable. Since theperimetrist is constantly communicating withthe patient, the patient is more comfortable.However, reproducible and reliable examinationsrequire technical skill and early or subtle changesare more likely to be overlooked on manual kineticperimetry. Isopters which are stylized represen-tations of the visual field, making quantificationand statistical analysis difficult.
Static Perimetry
The outer boundary of the island of vision canalso be determined by measuring the retinal
sensitivity (z) at each point (x,y). This techniqueof perimetry is called static perimetry because thetest location is fixed, while the intensity of thetest object of known size is varied, e.g. Tubinger,Octopus and Humphrey perimeters. Staticperimetry provides a vertical slice through thehill island of vision.
Because of the difficulty, inability and apotential for lack of reproducibility with kineticperimetry, static perimetry is preferred fordetecting and following subtle non-geographicdefects in the diagnosis and follow-up ofglaucoma patients. One can perform effectivestatic perimetry with the tangent screen or theGoldmann perimeter. However, manual staticperimetry is tedious, cumbersome and at timesboring. Both the patient and the examiner findit difficult to concentrate for 30 to 90 minutesat a stretch. Automated /computerized perimetrypresents targets at a random sequenceundecipherable by the patient. It can test thesame patient with the same methodology yearafter year and still does not get bored. Kinetictesting is difficult to computerize particularlywith regard to the decisions regarding samespeed and direction of presentation. A static test,on the other hand is relatively straight forward,since the target does not move, the machine hasonly to choose a site, target intensity and thenrecord whether the patient responds, yes or no.
Computers have revolutionized perimetry byallowing precise repetition and meticulousattention to detail, testing the patient’s responseunder optimal conditions repeatedly by allowinga binary yes/no answer from the patient. Allthis makes perimetry tailor made for computeri-zation.
Stimulus Presentation
During static visual field measurement thestimulus can be presented by projection or non-projection. In the projection system a simple

130 Diagnostic Procedures in Ophthalmology
computer video monitor is used to present darkor light combinations of stimuli against a diffusebackground. This system has the advantage ofbeing more flexible and allows kinetic colorperimetry. Drawbacks pertain to the mechanicalaspects of presenting and moving the test targetsuch as mechanical failures, periodic main-tenance and servicing. Also, the combination ofmirrors, shutters and the rotational unit producesan unsuitable clinking noise with each projection.This was used to advantage in earlier models,to assess the reliability of a given field (falsepositives). Newer models elicit the false positiveresponse by omitting the light stimulus andassessing the pace of the patient to the rhythmof the testing.
In the non-projection system stimuli aregenerated by the turning on and off of LightEmitting diodes (LED) which are placed into thesurface of the perimetric bowl. Advantages ofLEDs include silent operation, no moving parts,multiple stimuli presentation and inexpensiveand durable equipment. However, in the LEDsystem stimuli are fixed in the bowl surface atthe time of manufacture, inability to vary stimulussize and color, test site location or resolutionpattern. Further fixed LED positions cannot beexpanded to accommodate new programs. LEDshave a condensed light output. Slight variationsin positioning and mounting of the LED resultin different directional light intensities. All LEDsneed to be calibrated individually. This needsto be done at the factory and on a routine basis.
In the non-projection system a high resolution,flat video monitor can also be used to presentthe stimuli. In this method, the patient fixes ona pseudo-infinite target and stimuli are presentedthroughout the visual field. With this methodof presentation, test site location is infinitelyvariable, kinetic perimetry is possible, andstimulus presentation is without the audible click.Additionally the video monitor projection doesaway need for a perimeter bowl and the projection
device allows greater flexibility and durability.They also occupy less space. However, videomonitor systems are able to assess only the central30 degrees.
Projected stimuli are usually white and ofvariable size and intensity. The size of the stimuliin automated perimeters is similar to that usedfor Goldmann perimeter. There are five differentsizes designated by Roman numerals I to V. Onevery often uses stimulus size III. Failure torecognize target size III necessitates testing withstimulus size V. However, tests using stimulussize V cannot be processed statistically bySTATPAC 2 on the Humphrey perimeter.
In static perimetry, the patient has to respondto a stimulus of predetermined size, color andlocation projected for a fixed duration at a givenintensity level. The patient responds with thebutton in two ways: stimulus seen or stimulusnot seen. Any such response is only suggestivebut not actual proof, that the light was seen ornot seen. For a stimulus of a fixed size andlocation to be seen depends on its intensity. Thisprobability of a stimulus of fixed size and locationwhen plotted against the intensity of the stimulusis called probability of seeing curve. That is to say,the intensity of the stimulus where it is seen50% of the time and missed 50% is called threshold.Similarly, the intensity at which the stimulusis seen 95% of the projected times, is calledsuprathreshold. A low intensity stimulus whichis seen only 5% of the times when projected iscalled infrathreshold.
Bracketing
Determining the threshold for each point in thefield would require thousands of stimulii ofvarying intensity. However, the number of stimulifor threshold determination has been conve-niently reduced by a testing algorithm whichis also accurate. At a given point on the visualfield, the patient responds to a given stimulus

131Basic Perimetry
Fig. 9.2: The probability of seeing curve
Fig. 9.3: Threshold determination at the point P(Staircase technique)
Fig. 9.4: Effect of location and age on threshold
intensity (P1). The intensity of the stimulus isthen decreased in steps of 4 dB till the stimulusis not seen (3). The threshold lies between 2 and3. The intensity of the stimulus is then increasedin steps of 2 dB till the patient is able to perceivethe stimulus. Herein the threshold for the pointis lying between 4 and 5, and is a more accurateassessment of the threshold value at that point.This technique of threshold determination iscalled 4-2 bracketing (Staircase technique). In theOctopus perimeter, the thresholding strategycontinues, until a third reversal, in steps of 1dB, called 4-2-1 algorithm (Fig. 9.3).
Normal threshold values are dependant onthe location of the point on the visual field andalso the age of the patient.
Fovea, the most sensitive point of the visualfield corresponds to 0 degree of eccentricity. Asthe point moves from the fovea, the thresholdvalue (sensitivity) decreases by 0.3 dB for every

132 Diagnostic Procedures in Ophthalmology
degree of eccentricity outside the macula.Sensitivity drops to zero, 15 degrees temporalto fixation (blind spot). Sensitivity also decreaseswith the age; 0.6-1dB per decade of life. Since,threshold is age-related, the patients date of birthshould be correctly entered as the results arecompared to age-matched normals.
The intensity of light which reflects off thesurface is expressed as apostillbs (unit ofluminance). The sensitivity of the human visualsystem varies from 1 to more than 1,000,000apostillbs (asb). The maximum stimulus intensityof the Octopus Field Analyzer is 1000 asb and forthe Humphrey Field Analysis is 10,000 asb. Hence,large numbers representing the listed sensitivityon the printout would be cumbersome. Aconvenient way of expressing threshold values isin terms of a relative logarithmic scale where theintensity of the stimulus is varied by powers of 10
11dB = ———————— log unit (asb)
Increasing dB numbers on the printout implythat dimmer stimuli have been perceived.Thresholds corresponding to a dimmer stimulusmean greater retinal sensitivity. In a report ofthe measured thresholds, large dB valuescorrespond to better sensitivity and small dBnumbers indicate reduction in sensitivity.
Testing Strategy
With the inherent ability to vary the intensityof the light stimulus, static perimeters explorethe visual field in three ways:1. Suprathreshold screening.2. Threshold related screening.3. Full threshold determination.
Suprathreshold screening: Very bright stimuli(suprathreshold) intense enough to be seen easilyby most normal people are presented. The patienthas simply to respond (yes / no) to the presence
of the target. The role of such examinations isrelated to quick screening of large populationsand also to define gross pathology quickly.However, such examinations can miss earlychanges suggestive of glaucoma.
Threshold related screening: Herein, the intensityof the light presented is 5dB brighter than theactual threshold at the test point in question.This allows the entire field to be screened quickly.Threshold related screening is at best a variantof suprathreshold tests which allow for anapproximation of the true sensitivity of the visualfield. It can be used as a screening test fordetection and follow-up of known pathologies.
Threshold determination: A more time consumingway of determining the sensitivity of the visualfield is by determining the threshold value ateach point by the bracketing technique describedearlier. After presenting a light stimulus themachine waits for a yes / no response. If thestimulus is not seen, the intensity of the lightseen is increased in steps of 4dB till it is visible(machine records this as suprathreshold level).Subsequently, light stimuli are decreased in stepsof 2dB till the stimulus is not seen (infra-threshold). The actual threshold is between thesuprathreshold and infrathreshold.
Newer Strategies
Threshold determination at each point of thevisual field is tedious and time consuming.Because by definition threshold is tested by thestaircase algorithm, where every patient can seeonly half of the stimuli presented, newertechniques aim to make the procedure as shortas possible, to ensure that the patient maintainsconcentration and thus provides better reliability.
Swedish Interactive Thresholding Algorithm (SITA)
is similarly based on the fact that a responseat one location has implications at the point tested

133Basic Perimetry
and also its neighboring points. Just as one testedpoint is normal, other points on the visual fieldare likely to be normal too.
Tendency Oriented Perimetry (TOP) is availableon the Octopus perimeter and takes advantageof each response of the patient five-fold. It testsand adjusts the location where the stimulus ispresented and assesses the threshold of the fourneighboring locations by interpolation.
Several threshold tests are available on thetwo commonly available Octopus and Humphreyperimeters. In each test a certain number of pointscan be tested. The number of points tested ina given test is actually a compromise betweenthe time applied and precision, which dependson the type of damage looked for as well as thediagnostic and therapeutic implications resultingtherein. The response at each thresholded pointis compared with a group of normal individuals.The likelihood of such a response in thispopulation of normal patients is expressed asa probability symbol for each tested point. Theseprobability symbols increase in significance froma set of 4 dots to a black box, p<5%, <2%, <1%and 0.5%. A black box indicates that few normalsubjects will have that score; it does not necessa-rily correspond to an absolute defect. Many pointswith p<0.5% are relative defects; their actualthreshold is available from the raw data.
Test Programs
The standard programs on the Humphrey arethe 30-2, 24-2, 10-2 and the macular grid program.In the 30-2 the central 30 degrees of the visualfield are tested. It consists of 76 points 6 degreesapart on either side of the vertical and horizontalaxes, such that the innermost points are threedegrees from fixation. In the 24-2 program 54points are examined. It is near similar to the30-2 except the two peripheral nasal points at30 degrees on either side of the horizontal axisare included while testing the central 24 degrees.
The 10-2 program tests 68 points 2 degrees apartin the central 10 degrees. This program helpsto assess and follow-up fixation characteristicsin patients with an advanced disease along withthe macular test which examines 16 points inthe central 5 degrees, each being 2 degrees apart.The efficiency and results of an examination arereflected by the location of the points tested.
The two commonly used programs on theOctopus are the G1X and the G2 which test 59locations in the central 30 degrees. Here the testpoints are concentrated in the central field,arcuate region and nasal midperiphery to maxi-mize detection of significant changes. Fixationcharacteristics are assessed with the macularprogram M2X which tests 45 locations in thecentral 4 degrees, which are 0.7 degrees apart.
Automated perimetry provides a largeamount of data which is quantifiable, reprodu-cible and amenable to statistical manipulation.However, the magnitude of the data makesinterpretation complex, but a logical, consistentand sequential approach helps to make this lesscomplex.
The earliest injury in open-angle glaucomais localized to the nerve fiber bundle, usuallyin the paracentral nasal region. The initial defectmay be seen as a fluctuation in a cluster of pointsor as a relative defect with normal surroundings.This small area of increased scatter or thresholdinstability is often overlooked at the initialexamination, since it does not meet the criteriafor a valid visual field loss. Based on the otherclinical data, a subtle area of unstable sensitivitymay be suspected as being glaucomatous. Itbecomes more manifest when progression occursand a serial review of fields shows that the areain question has changed with time. Progressionof visual field defects occur in several ways –increase in density of scotomas, expansion ofareas of depression and the development of newones. Uncontrolled glaucoma will eventuallyaffect all areas of the field.

134 Diagnostic Procedures in Ophthalmology
The challenge in automated perimetry is tolocate and document areas of subtle glauco-matous damage and carefully follow anyprogression. Finally a diffuse generalizeddepression affecting the entire visual field is rarelyassociated with early glaucoma, and is usuallydue to other conditions such as cataract oruncorrected refractive errors. Visual fields areusually analyzed by using a printout thatcontains different elements of data. Althoughseveral different visual field analyzers are incurrent use, there are sufficient similarities inthe printout to permit interpretation andcomparison of the results. However, differencebetween instruments does not permit directcorrelation of their absolute scores.
Gaze monitoring is a high precision gaze-tracking system on the newer Humphrey modelswhich uses real time image analysis to measurethe distance between the center of the pupil andthe first corneal reflex. It is unaffected by headmotion. A continuous record is available on theprintout.
An upward deflection is indicative of eyemovement during stimulus presentation.Downward deflections imply that the gaze couldnot be detected. The 750 model of the Humphreyperimeter also offers head-tracking wherein thechin rest is automatically moved in incrementsof 0.3 mm to bring the head back to the initiallygaze tracked position and the Vortex monitorwherein a beep as well as a message is producedon the screen when the patients head movesback by more than 7 mm.
Statistical Analysis
The Statpac program introduced first in 1987and then upgraded to Statpac Plus in 1988, wasderived from a group of normal patients andhelped answer the question: Are the field inquestion normal or not? It introduced the GlobalIndices along with the Single Field Printout,
Change Analysis and the Overview format. In1989 Statpac-2 was introduced. It was formedfrom a database of patients known to have visualfield loss due to glaucoma which was otherwisestable.To detect early changes of glaucoma,groups of points in the superior and inferiorhemispheres were also compared to produce theGlaucoma Hemifield Test.
An interpretation of the single visual fieldperformed with the Humphrey visual fieldanalyzer (Humphrey Instruments, Inc, SanLeandro, C.A) and the Octopus 1 –2 – 3 visualfield analyzer (Interzeag AG , Switzerland) ispresented.
Components of Automated Visual Field
Humphrey Single Field Printout
There are eight parts to the single field printout(Fig. 9.5). Each has to be examined serially beforedrawing a conclusion.
First assess the reproducibility ( Zone-1 ) ofthe concerned fields (Consistency). At the onset,check the printed information at the top of thepage, to ensure listing of the correct patient, thetype of test done (30-2, 24-2, 10-2), eye in questionand date of birth (the software packagestatistically compares the patients response withage corrected normal population). The recordedvisual acuity, refraction and pupil size areimportant parameters as they all can affect thedata. When pupils are miotic, or smaller than2.5 mm, dilatation is required so as to preventgeneralized depression from occurring. Thedecision to dilate patients with large pupils restswith the clinician, but consistency for all visualfields must be maintained.
Next scans the reliability indices (Zone-2).Fixation losses are noted as the ratio of the numberof times the patient responded when he saw atarget placed in the blind spot against the totalnumber of times fixation was tested. In automated
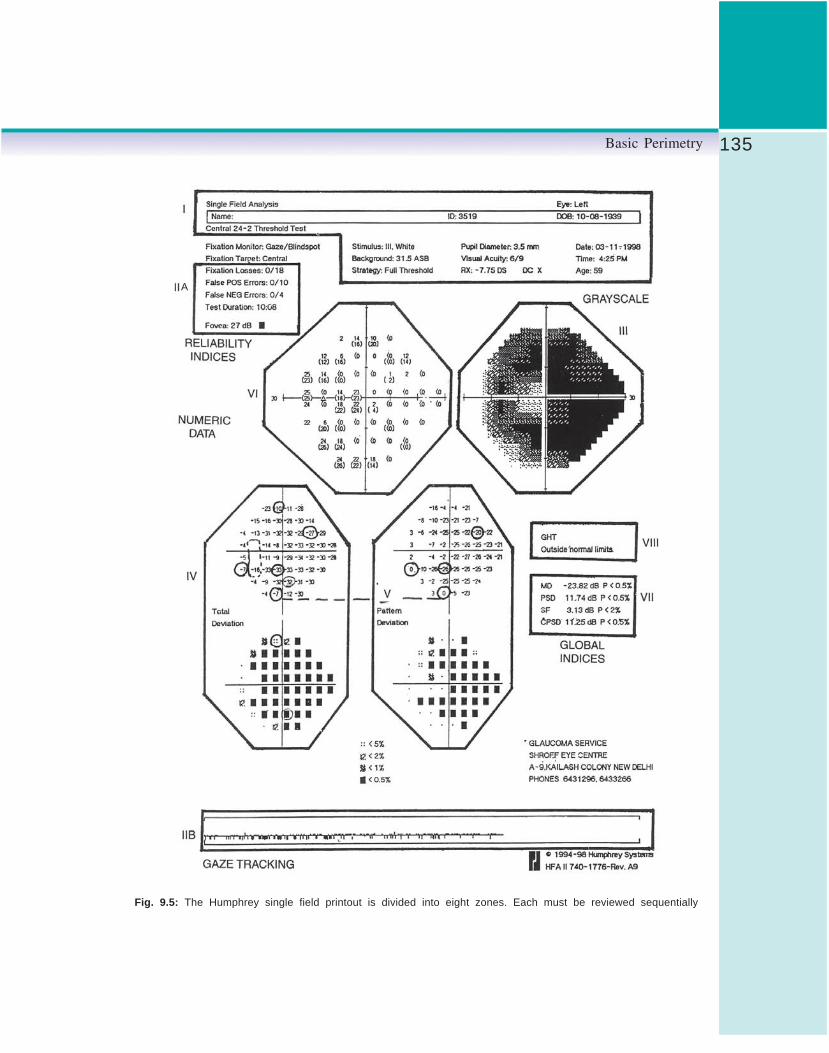
135Basic Perimetry
Fig. 9.5: The Humphrey single field printout is divided into eight zones. Each must be reviewed sequentially
A

136 Diagnostic Procedures in Ophthalmology
perimetry fixation is assessed and monitored byi. Sensors,
ii. Closed circuit TV monitorsiii. Heijl-Krakau method.
Sensors are used to detect minute shift in eyeposition. They are highly sensitive to slightmovement in eye position but are expensive, toosensitive, such that insignificant physiologicalfixation shifts induced by respiration, systoleand involuntary head movements get registeredas fixation losses.
Closed circuit TV monitor displays the imagetaken by an infrared camera. This allows theexaminer to view the patient’s eye and judgeand assist in fixation quality. Advantages of thissystem are continuous monitoring of fixationthroughout the test with no extra time spent inmonitoring fixation per se (Blind Spot ProjectionTechnique). However, continuous videomonitoring is expensive, prone to hardwarefailure and there exists a potential for the machineto disregard fixation losses in patients with fairlygood but not excellent fixation.
Heijl-Krakau method: In this method, themachine assumes or plots the blind spot at thebeginning of the test and then retests after everyeight to twelve stimuli by projecting a supra-threshold stimuli in the blind spot. A positiveresponse indicates fixation loss. This, however,does not work well when significant field lossis adjacent to or involving the blind spot.
When fixation losses are more than 20%, itis bracketed (XX) and is indicative of questionablereliability. However, not all fixation losses aredue to unsteady gaze. A “pseudo-loss” of fixationis seen when there is an improper location ofthe blind spot, or when the initial blind spotis present near the edge of a scotoma, so eventhough it is presented throughout the test, it isoccasionally visible. Also, a head tilt or changein head position occurring during the test willlead to a faulty blind spot location. Finally a
patient who is continually responding even whena light is not flashed will have a number of fixationlosses. For these reasons the fixation loss scoreis not considered in isolation, but rather comparedto the other reliability scores.
False positives (FP) result when the patientresponds to the audible click of the perimeterwith no stimulus projected (trigger happy). Itis also expressed as a ratio of the number oftimes the patient responds to a pause in the testingsequence without presentation of the targetagainst the total numbers of pauses. It is thesingle most significant reliability indicator.Bracketing occurs when FP’s are 33% but often15-20% rate can also destroy the credibility ofa field. A high rate can also occur due to a poorunderstanding of the test requirements by thepatient. A high FP ratio , will be accompaniedby a high positive mean defect, white areas onthe gray scale indication of very high thresholdlevels (white scotomas), a high number of fixationlosses and a message of abnormally highsensitivity on GHT.
False negatives (FN) are expressed as a ratio,and occur when the patient does not respondwhen a point previously thresholded is retestedwith a brighter stimulus. High FN ratio occurswhen the patient tires as in the later part of theexamination, when he changes his internalcriterion on whether or not he sees a point orwhen the edge points of a scotoma are tested.A 33% FN ratio is considered excessive and makesthe test suspect. However, the presence of ascotoma and a high number of FN, with all otherreliability measures being normal, is indicativeof a reliable field.
Foveal threshold measures over 30 dB for avisual acuity of 6/12 or better. A normal fovealvalue and a poorly recorded acuity indicatesneed for a refraction or mild amblyopia. Likewisea good visual acuity and a depressed foveal valuesuggest early damage.
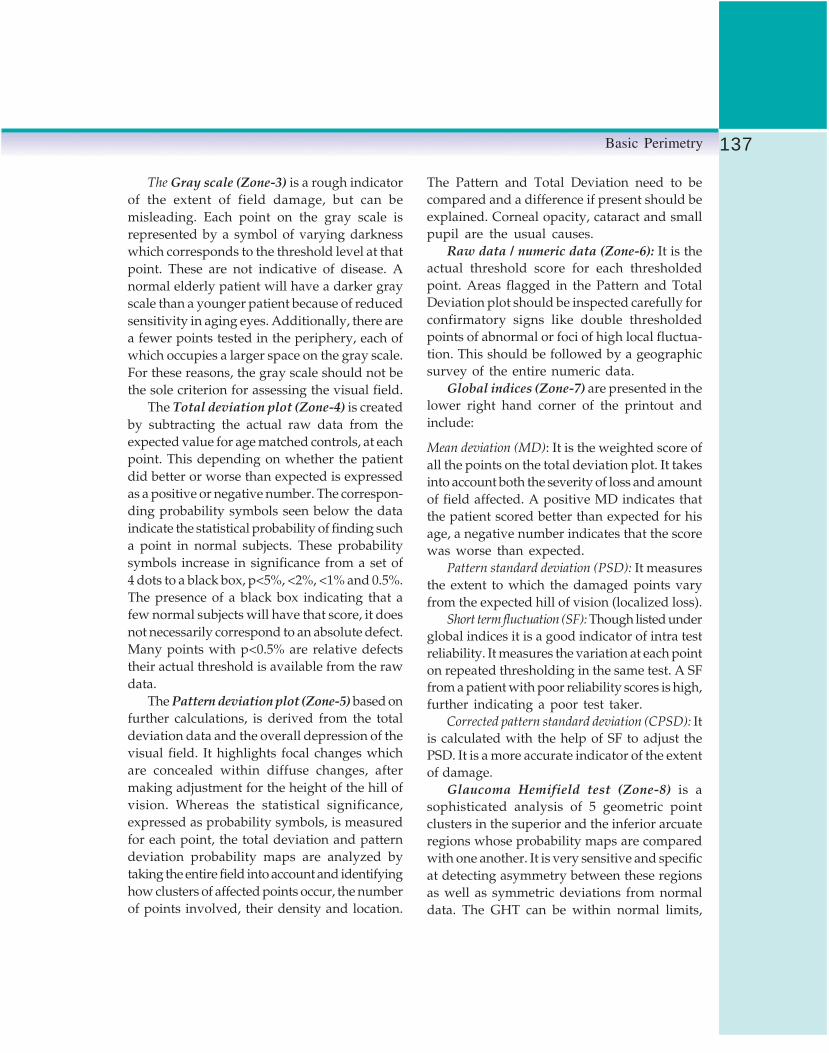
137Basic Perimetry
The Gray scale (Zone-3) is a rough indicatorof the extent of field damage, but can bemisleading. Each point on the gray scale isrepresented by a symbol of varying darknesswhich corresponds to the threshold level at thatpoint. These are not indicative of disease. Anormal elderly patient will have a darker grayscale than a younger patient because of reducedsensitivity in aging eyes. Additionally, there area fewer points tested in the periphery, each ofwhich occupies a larger space on the gray scale.For these reasons, the gray scale should not bethe sole criterion for assessing the visual field.
The Total deviation plot (Zone-4) is createdby subtracting the actual raw data from theexpected value for age matched controls, at eachpoint. This depending on whether the patientdid better or worse than expected is expressedas a positive or negative number. The correspon-ding probability symbols seen below the dataindicate the statistical probability of finding sucha point in normal subjects. These probabilitysymbols increase in significance from a set of4 dots to a black box, p<5%, <2%, <1% and 0.5%.The presence of a black box indicating that afew normal subjects will have that score, it doesnot necessarily correspond to an absolute defect.Many points with p<0.5% are relative defectstheir actual threshold is available from the rawdata.
The Pattern deviation plot (Zone-5) based onfurther calculations, is derived from the totaldeviation data and the overall depression of thevisual field. It highlights focal changes whichare concealed within diffuse changes, aftermaking adjustment for the height of the hill ofvision. Whereas the statistical significance,expressed as probability symbols, is measuredfor each point, the total deviation and patterndeviation probability maps are analyzed bytaking the entire field into account and identifyinghow clusters of affected points occur, the numberof points involved, their density and location.
The Pattern and Total Deviation need to becompared and a difference if present should beexplained. Corneal opacity, cataract and smallpupil are the usual causes.
Raw data / numeric data (Zone-6): It is theactual threshold score for each thresholdedpoint. Areas flagged in the Pattern and TotalDeviation plot should be inspected carefully forconfirmatory signs like double thresholdedpoints of abnormal or foci of high local fluctua-tion. This should be followed by a geographicsurvey of the entire numeric data.
Global indices (Zone-7) are presented in thelower right hand corner of the printout andinclude:
Mean deviation (MD): It is the weighted score ofall the points on the total deviation plot. It takesinto account both the severity of loss and amountof field affected. A positive MD indicates thatthe patient scored better than expected for hisage, a negative number indicates that the scorewas worse than expected.
Pattern standard deviation (PSD): It measuresthe extent to which the damaged points varyfrom the expected hill of vision (localized loss).
Short term fluctuation (SF): Though listed underglobal indices it is a good indicator of intra testreliability. It measures the variation at each pointon repeated thresholding in the same test. A SFfrom a patient with poor reliability scores is high,further indicating a poor test taker.
Corrected pattern standard deviation (CPSD): Itis calculated with the help of SF to adjust thePSD. It is a more accurate indicator of the extentof damage.
Glaucoma Hemifield test (Zone-8) is asophisticated analysis of 5 geometric pointclusters in the superior and the inferior arcuateregions whose probability maps are comparedwith one another. It is very sensitive and specificat detecting asymmetry between these regionsas well as symmetric deviations from normaldata. The GHT can be within normal limits,

138 Diagnostic Procedures in Ophthalmology
outside normal limits, borderline sensitivity,generalized reduction or abnormally highsensitivity (Fig. 9.6).
Octopus Single Field PrintoutThe commonly used seven in one printout is nearidentical to the Humphrey single field printout(Fig. 9.7). Again, a systematic and sequentialapproach helps in interpretation. As before thereare eight parts to the single field printout. Eachhas to be examined serially before drawing aconclusion.
Reproducibility (Zone-1): Before looking at othercomponents of the printout, one needs to identifythe field in question to the concerned patient.One quickly checks the name and date of birthas printed on the upper part of the printout. Testparameters such as the size of the stimulus andpupil, type of test strategy, and test program usedare also looked at along with the eye and dateof examination.
Reliability factors (Zone-2): To assess thereliability of the concerned examination, oneassesses the catch trials just beneath zone I and
also the reliability factor listed below, with thevisual indices. False positives (FP) result whenthe patient responds to the audible click of theperimeter with no stimulus projected. It is alsoexpressed as a ratio of the number of times thepatient responds to a pause in the testingsequence without presentation of the targetagainst the total numbers of pauses. False negatives
(FN) are expressed as a ratio, and occur whenthe patient does not respond when a previouslythresholded point is retested with a brighterstimuli. Each of these should be less than 10%.The reliability factor (value) is determined bythe outcome of the catch trials and ideally itshould be less than 15%.
The Octopus 1-2-3 takes a video photographof the pupil and stores this in its memory. Ifthe eye deviates or the lid closes, the machineregisters the loss of fixation and disregards thepatients response till fixation is restored. Lossof fixation for more than two seconds halts theprogram. Hence the Octopus printout does notdocument fixation losses.
Gray scale (Zone-3): This is the most colorfulpart of the printout but like its counterpart inthe Humphrey single field, it is the least informa-tive since it is obtained by the interpolation ofthe actually tested sensitivities. Lighter colorsare suggestive of higher sensitivities and darkerareas suggest depression. Hence only a cursorylook is required. Black depicts an absolute lossof sensitivity.
Comparison (Zone-4): It is synonymous with thetotal deviation plot on the Humphrey single fieldprintout. The lower left part of the printout, oneon top of the other, is the comparison display,with a numeric display above a probability map.The comparison values are the differencebetween the patients test results and age-matchednormals. The ‘+’ symbol indicates a normalsensitivity. The probability map is displayedgraphically below this. Defects are marked assymbols of different shades. Darker the marking,
Fig. 9.6: Glaucoma hemifield test

139Basic Perimetry
Fig. 9.7: Octopus 1-2-3 seven in one printout like the Humphrey single field has eightzones which need to be viewed systematically

140 Diagnostic Procedures in Ophthalmology
less likely it is to being normal. Values taggedas ‘p’<0.5% mean are less than 0.5% of the normalpopulation may show such a defect without itbeing significant. Comparison values representthe total depression of the visual field.
Corrected comparison (Zone-5): It is synonymouswith the pattern deviation plot on the Humphreysingle field printout. The corrected comparisonrepresents the localized defect after removing thegeneralized depression of the visual field fromthe total depression. Similar to the comparisonthey are represented by values, ‘+’ for normalsensitivity and the probability map is displayedgraphically below this.
Numeric data/raw data (Zone-6): They representthe actual thresholded points from which theentire statistical calculation is done. Close tofixation, values are in their late twenties or earlythirties. In the mid periphery, threshold valuesare in their mid twenties and in the late teensin the periphery.
Visual field indices (Zone-7): They were firstintroduced on the Octopus perimeters in 1985and include:
Mean sensitivity is the average of retinalsensitivities that are measured at all points.
Mean defect (called mean deviation on theHumphrey printout) is the average defect of allthresholded points from the age-matchednormals, as shown in the comparison chart. Itis indicative of the height of the hill island ofvision.
Loss variance (called pattern standarddeviation on the Humphrey printout) is obtainedfrom individual deviations of all measuredlocations with the mean defect value. These areindicators of localized damage.
Short term fluctuation is a reliability factorsuggestive of an intra test variation. A value ofmore than 2.5 is significant. The differencebetween individual deviations on the numeric
display is best assessed by removing the normalshort term fluctuation from the loss variance. Thisgives us the corrected loss variance (called lossvariance on the Humphrey single field printout)which is more sensitive to localized defects.
Bebie’s curve (Zone-8): In the presence of a localdefect, it is often difficult to quantify an additionaldiffuse defect in a particular visual field. Thecumulative curve was introduced by Dr. H. Bebiein the late 1980’s to help assess the overallcondition of the visual field at a glance. In theBebie’s curve test locations are arrangedaccording to the extent of their difference fromthe normal values. The individual test locationsare arranged on the x-axis, and the defects indecibels on the y-axis. The test locations withthe least difference are found on the left sideof the figure, while those with the greatest areon the right side. With this graphical represen-tation, it is simple to differentiate localized fromdiffuse damage.
Analysis of Single Field Printout
After ensuring good reproducibility the visualfield is analyzed using each of the eight areasalone or in combination. The reliability indicesgive an indication of the credibility and accuracyof the fields. The gray scale gives a rough overview of the field, but is not used in the actualfield interpretation. Any suspected change mustbe confirmed by inspecting other parts of theprintout. The total deviation and pattern devia-tion (Comparison and Corrected Comparison onthe Octopus printout) should be compared intandem. A difference between them if seen mustbe explained. The pattern deviation symbols areused in the interpretation of the field with thearrangement and severity of the points or clustersanalyzed. The greater the number of pointsinvolved and greater the depression the moresevere the defect is. After a quick look at the

141Basic Perimetry
numeric data, the global indices (visual fieldindices on the Octopus printout) are analyzednext, with the mean deviation (mean defect onthe Octopus printout) being an indicator of theoverall depression of the field. The patternstandard deviation (loss variance) or correctedpattern standard deviation (corrected lossvariance) is considered significant when a scoreof p < 5% is noted. The short term fluctuationis analyzed as a part of the reliability indicesand with the total and pattern deviation symbols.The glaucoma hemifield test is analyzed at theend, a reading outside normal limits issignificant. The interpretation should alsoinclude allowance for artifacts such as droopinglid, prominent brow, or improper positioning ofthe patient/trial lens. Other mimics of glauco-matous field loss include retinal and neurologicaldisorders along with disorders affecting theclarity of the ocular media. These need to beruled out by a detailed ocular examination.
The minimum criteria for the diagnosis ofglaucoma are listed in Table 9.1.
TABLE 9.1: MINIMUM CRITERIA FORDIAGNOSIS OF GLAUCOMA
1. Three or more non-edge points in the pattern deviationplot with sensitivity reduce to level of p < 5% orworse, with at least one point <1%
2. Glaucoma hemifield test is outside normal limits.3 Corrected pattern standard deviation p <5%
Criteria should be fulfilled on at least two occasions
Non-characteristic visual field defects (Figs9.8 to 9.11) must be substantiated by clinicalexamination of the retina and optic nerve head.The first visual field test in an inexperiencedpatient should be taken with caution. After firsttest the patient becomes more proficient; theresulting improvement in the visual field isknown as learning curve. It is, therefore, desirableto test two or more visual fields before properinterpretation. To be clinically significant, thevisual field should be reproducible.
While assessing single field printout, thepresence of miotic pupil and media opacitiesshould be taken into consideration because theycan cause generalized depression of visual field.The interpretation should also include allowancefor artifacts such as position of the patient,correcting lens (Fig. 9.12), drooping of the lidand prominent brow. It is not rare to find thatvisual field changes in neurological disorders(Fig. 9.13) may mimic the glaucomatous fielddefects.
The visual field examination is a useful toolto study the course of an eye disease as wellas to monitor the therapy. Periodic visual fieldtesting is usually recommended for all glaucomapatients especially with a view to evaluate thedesired target intraocular pressure. In spite ofgood control of the pressure, the patient’s visualfields may show deterioration on follow-up (Fig.9.14) while in some patients the fields remainstationary (Fig. 9.15). Assessment of progressionis difficult because of the long-term fluctuations.One needs to repeat the field test when in doubt.In clinical practice the recent fields are comparedwith the earlier baseline fields to judge theprogression.
ConclusionIn conclusion automated perimetry is anextremely useful tool which has also become thestandard technique for evaluating the visual fieldin patients with glaucoma or glaucoma suspects.Interpretation of the results is difficult andrequires experience in addition to a detailedunderstanding of the underlying principles ofautomatic static perimetry and the appliedstatistical analysis.
A word of caution is necessary. Automatedperimetry should never be used in isolation.Treatment of patients requires combining theresults of automated perimetry with an

142 Diagnostic Procedures in Ophthalmology
Fig. 9.8: Humphrey single field 24-2 SITA standard test of the left eye of a 53 year old patient. Reliability factorshave been expressed as a percentage. The visual field is markedly depressed in the inferior hemisphere on thegray scale and total deviation plot. Anderson’s criteria are fulfilled. The height of the hill island of vision representedby the mean deviation is significantly reduced. Clinical correlation with the amount of optic disk cupping is necessaryto determine the cause of such a defect

143Basic Perimetry
Fig. 9.9: Humphrey single field 30-2 full threshold test of the left eye of a 64 year old patient. High false positivesare bracketed. The gray scale and the total deviation plot show a marked depression of the visual field. However,only a cluster of points on the pattern deviation plot (p<2%) in the central 10 degrees are seen. No probabilitysymbols are seen alongside the CPSD and the Glaucoma Hemifield test is showing a borderline/generalized reductionin sensitivity

144 Diagnostic Procedures in Ophthalmology
Fig. 9.10: Octopus 1-2-3 seven in one single field printout of the left eye of a 61 year old male patient showingan early inferonasal step. There are a number of adjacent points in the inferonasal quadrant on the corrected probabilityplot, depressed to 5%, one of which is depressed to less than 1%. The left part of Bebie’s curve shows a localizeddepression. The corrected loss variance is 8.4. This field needs to be correlated clinically

145Basic Perimetry
Fig. 9.11: Octopus 1-2-3 seven in one single field printout of the left eye of a 61 years old male patient to assessfixation characteristics. Here the catch trials are suggestive of poor reliability. The gray scale and comparisonsare suggestive of depression of the inferior part of the 10 degrees being tested. Within the central 4 degrees ofthis program, each point is 0.7 degrees apart. This helps to assess fixation characteristics better. One of the fourfixation points is depressed p < 2%. The Bebie’s curve is initially suggestive of normal points corresponding tothe superior part of the field. A sudden drop in Bebie’s curve is due to the cluster of depressed points in theinferior part of the field. The CLV is also significant. This field is suggestive of extensive damage in the inferiorhemisphere which is threatening fixation and needs to be correlated clinically

146 Diagnostic Procedures in Ophthalmology
Fig. 9.12: Humphrey single field 24-2 full threshold test of the left eye of a 52 years old patient. A ring scotomaon the gray scale and the pattern deviation plot is evident. Anderson’s criteria are also fulfilled. Such visual fieldloss could be due to glaucoma or retinitis pigmentosa. However, the fundus findings were normal and on repeatingthe field test (with proper positioning of the lens) the changes in the pattern deviation plot disappeared (Lens rimartifact)

147Basic Perimetry
Fig. 9.13: Humphrey single field 30-2 full threshold test of the right eye of a 59 years old patient. The gray scaleand the total deviation plot show a depression of the visual field. Here the gray scale shows a marked temporaldepression as is evidenced on the pattern deviation plot. Such defects which respect the vertical meridian areneurological in origin. In this patient the other eye also showed a temporal hemianopia

148 Diagnostic Procedures in Ophthalmology
Fig. 9.14: Change probability analysis showing deterioration in fields over a period of time

149Basic Perimetry
Fig. 9.15: Overview printout showing stable fields

150 Diagnostic Procedures in Ophthalmology
examination of the complete eye especially theretina, optic nerve and visual pathway.
Bibliography1. Caprioli J. Automated perimetry in glaucoma.
Am J Ophthalmol 1991;111:235.2. Fankhauser F. Problems related to the design
of automatic perimeters. Documenta Ophthalmo-logica 1979;47(1):89.
3. Flammer J. The concept of visual field indices.Graefes Arch Clin Exp Ophthalmol 1986;224:389.
4. Heijl A, Lindgren G, Olsson J. A package forthe statistical analysis of visual fields. DocOphthalmol Proc Ser 1987;49:153.
5. Humphrey Field Analyzer User’s guide.Humphrey Instruments, Inc. San Leandro, 1994.
6. Octopus Visual Field Digest. 4th ed. Switzerland,Interzeag AG.
7. Johnson CA, Keltner J. Automated suprathre-shold static threshold perimetry. Am J Ophthalmol1980;89:731.
8. Kaiser HJ, Flammer J. Visual Field Atlas – Aguide and atlas for the interpretation of visualfields. University Eye Clinic, Basel, 1992.

151Ophthalmoscopy
PUKHRAJ RISHI, TARUN SHARMA
Ophthalmoscopy10A comprehensive eye examination is a must fora complete assessment of the anterior andposterior segments of the eye—be it a diagnosticor preoperative evaluation. Although there areseveral methods of eye examination viz slit-lampbiomicroscopy, gonioscopy, perimetry, tonometry,ultrasonography, ophthalmoscopy remains animportant tool for a complete evaluation of theposterior segment of the eye. In December 1850,Helmholtz announced the invention of an “eye-mirror”, which was the original ophthalmoscope.It was mounted with a holder for one lens, andlenses had to be changed constantly for eyesof different refraction. Rekoss introduced arevolving disk carrying a series of lenses.
Principles of OphthalmoscopyThe basic principle of ophthalmoscopy is shownin Figure 10.1. If the patient’s eye is emmetropic,light rays emanating from a point in the fundusemerge as a parallel beam. If this beam entersthe pupil of an emmetropic observer the raysare focused on the retina and an image is formed.This is called direct ophthalmoscopy.
The fundus can be seen only when theobserved and the illuminated areas of the fundus
overlap. In the emmetropic eye this can happenonly if the light source and the observer’s pupilare optically aligned. Under normal conditionsthis does not happen, hence the pupil normallyappears dark (Fig. 10.2).
Fig. 10.2: The light source and the observer’s pupilare not optically aligned
The illuminating and the observing beamsare aligned using a semi-reflecting mirror or aprism allowing fundal view (Fig. 10. 3).
Indirect OphthalmoscopyRuete introduced indirect ophthalmoscopy in1852. There are several types of indirect
Fig. 10.1: Optics of image formation in anemmetropic eye

152 Diagnostic Procedures in Ophthalmology
ophthalmoscopes are available. One mustunderstand optical principles of indirectophthalmoscopy to carry an ocular examination(including fundus angioscopy). The indirectophthalmoscope can be used in the treatmentof disorders of the posterior segment.
There are five indirect ophthalmoscopytechniques. These are, slit-lamp indirect, headmounted indirect, monocular indirect, modifiedmonocular indirect and penlight ophthalmo-
Fig. 10.3: The light source and the observer’s pupilare optically aligned
Fig. 10.4: Optics of indirect ophthalmoscope
TABLE 10.1: FIELD OF VIEW AND IMAGE MAGNIFICATION OBTAINED BY DIFFERENT CONTACT LENSES
Lens Field of view Image mag. Laser spot Working distance
Super Quad 160® 160°/165° .5x 2.0x contact
Equator Plus® 114°/137° .44x 2.27x contact
Quad Pediatric 100°/120° .55x 1.82x contact
QuadrAspheric® 120°/144° .51x 1.97x contact
PDT Laser 115°/137° .67x 1.5x contact
Trans Equator® 110°/132° .7x 1.44x contact
Area Centralis® 70°/84° 1.06x .94x contact
Super Macula® 2.2 60°/78° 1.49x .67x contact
mag: magnification
scopy. Indirect ophthalmoscopy is carried outin a dark room with fully dilated pupils.
The equipments required for slit-lamp indirectophthalmoscopy includes slit-lamp andcondensing lens. The condensing lens may beeither noncontact or contact lens.
Noncontact lenses: They are plus powered withtwo convex aspheric surfaces. The +60D versionhas the greatest magnification and is best usedfor the disk and macula. The +78D version isa commonly used diagnostic lens and the +90Dis good for small pupils. They are available inclear or blue-free, ‘yellow retina protector glass’.They are comfortable to the patient and minimizethe risk of phototoxic retinal damage due toprolonged exposure to the focused beam.
Contact lenses: Goldman, Mainster, SuperQuad,Equator Plus, Area centralis, Super Macula lensesare often used. Field of view and image magnifi-cation obtained by these lenses are listed in Table10.1.
Method of Examination
For examination, minimal slit-lamp intensity canbe used in a dark room. Always focus the ocularsto accommodate any examiner refractive error,then set the pupillary distance, remove all filters

153Ophthalmoscopy
and keep the magnification to the lowest setting,usually X6-X10. The illumination of the slit-lampshould be adjusted for an intermediate slit heightand a 2 mm width, and then placed in the straightahead position between the oculars (zero degreesor co-axial). Before examination, ensure that thecondensing lens surfaces are clean. Hold thelens vertically between the thumb and indexfinger of the left hand to examine the patient’sright eye and vice versa.
Examination Procedure
Instruct the patient to fixate straight ahead, tostare wide and to blink normally. Center the beamin the patient’s pupil and focus on the cornea.Now the lens is placed in front of the patient’seye, directly in front of the cornea so the backsurface just clears the lashes. Examiner’s fingersmay be placed on either the brow bar or thepatient’s forehead. Using the joystick, focus onthe fundus image by slowly moving away fromthe cornea, keeping the beam centered in thepupil. Once the retinal image is focused, themagnification may be increased. Scan across theentire lens keeping it steady. In order to viewthe peripheral retina, ask the patient to changefixation into the nine cardinal positions of gaze.The lens is realigned and refocused the slit-lampas necessary. To reduce interfering reflections,tilt the lens or move the illumination arm upto10 degrees on either side, once the fundus hasbeen focused. For fine tuning of the fundus view,lateral and longitudinal adjustments of the lensmay be made to optimize the field of view. Whenviewing finer fundus details, intensity andmagnification of slit-lamp should be increased.
Head Mounted Binocular IndirectOphthalmoscopy
Binocular indirect ophthalmoscopy (BIO) is atechnique used to evaluate the entire ocular
Fig. 10.5: Optics of binocular indirectophthalmoscopy
fundus. It provides for stereoscopic, wide-angled,high-resolution views of the entire fundus andoverlying vitreous. Its optical principles andillumination options allow for visualization ofthe fundus regardless of high ametropia or hazyocular media.
Light beams directed into the patient’s eyeproduce reflected observation beams from theretina. These beams are focused to a viewable,aerial image following placement of a high plus-powered condensing lens at its focal distancein front of the patient’s eye. The resultant imageis real, inverted, magnified, laterally reversed,and located between the examiner and thecondensing lens. The observer views this imagethrough the oculars of the head-borne indirectophthalmoscope.
An indirect ophthalmoscope (Fig. 10.6)consists of a head band for comfortable place-ment, light source with variable illumination andan adjustable mirrored surface in the mainhousing and knobs to align the low plus poweredeyepieces (+2.00 to +2.50 D) with the examiner’sinterpupillary distance. A 20 D condensing lens(Fig. 10.7A), a pair of scleral depressors (Fig.

154 Diagnostic Procedures in Ophthalmology
Figs 10.7A to C: A 20 D condensing lens, B A pair of scleral depressors andC Fundus drawing sheet
Fig. 10.6: Indirect ophthalmoscope
10.7B) and fundus drawing sheet (Fig. 10.7C)are needed for a proper indirect ophthalmoscopyand documentation.
Examination Procedure
Proper placement and adjustment of thebinocular indirect ophthalmoscope (BIO) is animportant step in the examination. Place the looseBIO onto the head and position the bottom ofthe front headband one index finger width abovethe eyebrows. Tighten the crown strap until thisheadband position begins to stabilize then
position the back head strap on or below theoccipital notch and tighten until secured. Nowthe knobs that control the instruments mainhousing (oculars and light tower) should beloosened and fixate straight ahead and level invertical position the oculars and alignedtangential to or slightly angled downward fromthe ocular surface; this should maximizeobserver’s visual field and minimize horizontaldiplopia. Horizontally align each ocular byclosing one eye and fixating a centrally positionedthumb of an outstretched hand. Turn on the lightsource and fixate straight ahead on a wall at40 to 50 cm looking at the projected light source.Use the mirror knob to vertically place the lightsource at the upper one-half to one-third of thefield.
The headset is adjusted and the voltage setto mid-range (occasionally the sneeze reflex maystart from the periphery first). The choice ofcondensing lens depends upon the need for apanoramic view or detail; a 30 D providespanoramic view while fundus details can beobtained with 14 D. Stereopsis is important anddepends on the choice of lens. A full stereopsisis obtained with 14 D, three-quarter with 20 Dand one-half stereopsis with 30 D. A 30 D lenscan be used to get a view of fundus in patientswith small pupil. The condensing lens shouldbe held between the tip of the flexed index fingerand the ball of the extended thumb of the non-

155Ophthalmoscopy
dominant hand and the scleral depressor withthe dominant hand. The extended third fingeracts as the pivot. The more convex surface shouldbe toward the observer and the white-ringed edgeclosest to the patient so as to avoid bothersomelight reflexes. These reflexes can be made to movein opposite direction from each other by slightlytilting the lens. Condensing lenses have theirsurfaces coated to reduce such reflexes. The lensmust be smudge free.
The patient should have atleast some ideaof what to expect in the examination. Althoughthe patient may be examined in either sittingor supine position, it is best to recline the patienton a couch with the face directed towards theceiling to avoid stooping. The couch or tableshould be just high enough to reach theexaminer’s hips. The examiner stands oppositeto the clock hour position to be examined. Thepatient is instructed to keep both the eyes openand fixate towards his outstretched hand whichpoints to the meridian of interest.
From a working distance of 18 to 20 inches,direct the light beam into the pupil, producinga complete red pupillary reflex. Pull backwardon the lens, maintaining the central position ofthe pupil reflex, until the entire lens fills withthe fundus image. Fine adjustments are madein the lens tilt and vertex distance to producea distortion-free full lens view. The patient mustbe repeatedly urged to open the fellow eye. Goodcycloplegia is the most important single factorin getting co-operation in this regard. The eyewith inadequate cycloplegia is very photophobic.
All the vital elements involved in thevisualization of the fundus, namely observer’smacula, the eyepiece of the ophthalmoscope,center of the condensing lens, patient’s pupil andthe object observed in the fundus must be kept onan axis to maintain the fundal view. In order todevelop and achieve a continuous sweepingpicture of the fundus, a major retinal blood vessel
must be picked out from the posterior pole andfollowed as anteriorly as possible by theobserver’s movements alone. This vessel shouldbe then followed back to the optic disk. Thismaneuver needs constant practice to master it.
The problem of orientation in the fundus maybe solved by learning to accurately draw theimage exactly as we see in the condensing lens.The drawing chart may be placed inverted overthe patient’s chest. Positioning 180 degrees awayfrom the area of interest, the observer must thinkin terms of anterior in the fundus or posteriorin the fundus (or central and peripheral). Drawthe image seen in the lens on that part of thefundus chart that is closest to the observer.
Since 30% of the retina lies anterior to theequator, failure to study this region will resultin overlooking serious pathology in many cases.Scleral depression not only allows for an easyand complete view of the ora serrata and thepars plana but also allows a better evaluationof the retinal topography making lesions suchas horseshoe tears or vitreo-retinal traction morevisible. It is of particular value in differentiatinga retinal hemorrhage from a retinal break, inrecognizing a raised from a depressed lesionand in detecting whether a foreign body lies onor anterior to the retina. The absence of anoverhanging orbital margin superonasally makesinitial attempts at scleral depression easier. Thedepressor is applied to the superior lid, withoutpressure, at the tarsal margin. The patient looksup and the depressor slides posteriorly parallelto the surface of the globe, as the lid retracts.The depressor is gently pressed against the globeat the equatorial region and a grayish moundis seen to come up in view from the inferior partof the fundus. In viewing the ora, it is sometimesnecessary to tilt the condensing lens somewhatforward, into a plane more nearly parallel tothe iris. It must be remembered that scleraldepression is a dynamic technique.

156 Diagnostic Procedures in Ophthalmology
Fundus Drawing: Color Code(Peter Morse)
Color Code Red
Solid
• Retinal arterioles• Neovascularization• Vascular abnormalities or anomalies• Vortex vein• Attached retina• Hemorrhages (Pre-intra-and sub-retinal)• Open interior portion of retinal break (Tears,
holes)• Normal foveola (Drawn as red dot).
Cross lines
• Open portion of giant tears or large dialysis• Inner portion of chorioretinal atrophy• Open portion of retinal holes in inner layer
of retinoschisis• Inner portion of the areas of retina.
Color Code Blue
Solid
• Detached retina (Fig. 10.8)• Retinal veins• Outlines of retinal breaks (Tears, holes)• Outline of ora serrata (Dentate processes, ora
bays)• Meridional, radial, fixed star-shaped and
circumferential folds• Vitreoretinal traction tufts• Retinal granular tags and tufts (Cystic, non-
cystic)• Outline of flat neovascularization• Outline of lattice degeneration (Inner chevrons
or Xs)• Outline of thin areas of retina• Intra-retinal cysts (with overlying curvilinear
stripes to show configuration).
Cross lines
• Inner layer of retinoschisis
• White with or without pressure• Detached pars plana epithelium anterior to
separation of ora• Outer surface of retina seen in rolled edge
of retinal tears, inverted flap of giant retinaltear.
Stippled or circles
• Cystoid degeneration.
Interruped lines
• Outline of change in area or folds of detachedretina because of shifting fluid.
Color Code Green
Solid
• Opacities in the media (Cornea, anteriorchamber, lens, vitreous)
• Vitreous hemorrhage• Vitreous membranes• Hyaloid ring• Intraocular foreign bodies• Retinal opercula• Cotton wool patches• Ora serrata pearls• Outline of elevated neovascularization.
Stippled or dotted
• Asteroid hyalosis• Frosting or snowflakes on cystoid,
retinoschisis, and lattice degeneration.
Color Code Brown
Solid
• Uveal tissues• Pars plana cysts• Ciliary processes (Pars plicata)• Striae ciliaris• Pigment beneath detached retina• Subretinal fibrosis demarcation lines• Choroidal nevi• Malignant choroidal melanomas• Metastatic and other choroidal tumors• Choroidal detachment.

157Ophthalmoscopy
Outline
• Chorioretinal atrophy beneath detachedretina
• Posterior staphyloma• Edge of buckle beneath detached retina.
Color Code Yellow
Solid
• Intraretinal edema• Intraretinal or subretinal hard yellow
exudates• Deposits in retinal pigment epithelium• Detached macula in some retinal separations• Retinal edema as a result of photocoagulation,
cryothreapy or diathermy• Long and short posterior ciliary nerves• Retinoblastoma.
Stippled or dotted
• Drusen
Color Code Black
Solid
• Pigment within the detached retina (lattice,flap of horse-shoe tear, paravascularpigmentation)
• Pigment in choroid or pigmented epithelialhyperpigmentation in areas of attached retina
• Pigmented demarcation lines at the attachedmargin of detached retina or within detachedretina
• Hyperpigmentation as a result of previoustreatment with cryothreapy, photocoagula-tion or diathermy
• Completely sheathed retinal vessels.
Outline
• Partially sheathed vessels (lattices, retino-schisis)
• Edge of buckle beneath attached retina• Long posterior ciliary nerves and vessels
(Pigmented)• Short posterior ciliary nerves and vessels• Chorioretinal atrophy.
Fig. 10.8: Showing a long-standing, partial, rhegmatogenousretinal detachment with demarcation lines and intraretinalmacrocyst. A horse-shoe tear, lattice degeneration anda retinal dialysis are also seen. An improperly placedscleral buckle effect is made out. Pars plana is detachednasally. Retinoschisis with inner layer hole is seen ininferotemporal periphery. Pars plana cysts are seeninferiorly
Indirect Ophthalmoscopy inOperating Room
Many problems may be encountered whilstoperating and performing an indirect ophthalmo-scopy. The fundus to be examined is usuallya difficult one, with a retinal detachment and/or PVR. The cornea may become edematous orabraded during the course of surgery. Particularcare must be taken in patients having undergoneLASIK surgery to prevent dislocation of cornealflap. The fundus picture may change with eachstep in surgery. The advantages of indirectophthalmoscopy in the operation room stem fromits safe working distance from the sterileoperating field, in accurate localization of allretinal breaks and other fundus landmarks byscleral depression. It helps in obtaining a fine

158 Diagnostic Procedures in Ophthalmology
needle aspiration biopsy and treatment ofchoroidal or retinal tumors.
Indirect ophthalmoscopy is a valuable toolin the examination of children and uncooperativeadults: Since the field of view is much largerwith an indirect ophthalmoscope, fundusexamination is possible even in moving eye. Aquick comparison with the other eye is alsopossible. Children would generally react morefavorably to the more impersonal distance ofindirect examination. It is also useful equipmentin examining the anterior segment for rubeosisand tumor seedings in children with advancedretinoblastoma.
Fundus angioscopy, and transilluminationwith the help of a probe (Fig. 10.9) can be per-formed using indirect ophthalmoscopy; whichhelps in differentiating various types of fundusmass lesions. Nystagmus, aniridia, albinoticfundus, partial vitreous hemorrhage, funduscoloboma, microphthalmos and persistenthyperplastic primary vitreous can be diagnosedwith the help of indirect ophthalmoscope.
Fig. 10.9: Transillumination probe
Monocular Indirect Ophthalmoscopy
Monocular indirect ophthalmoscopy combinesthe advantages of increased field of view (indirectophthalmoscopy) with erect real imaging (direct
ophthalmoscopy). By collecting and redirectingperipheral fundus-reflected illumination rays,which cannot be accomplished with the directophthalmoscope. The indirect ophthalmoscope(Fig. 10.10) extends the observer’s field of viewapproximately four to five times. An internal lenssystem then reinverts the initially inverted imageto a real erect one (Fig. 10.11), which is thenmagnified. This image is focusable using thefocusing lever/eyepiece lever. It gives a field ofview of approximately 30 degrees, yet it isimportant that the patient looks in 6 to 8 differentdirections to see as much of the fundus as possible.The optical system of the monocular indirectophthalmoscope (MIO) has a lens which erectsthe image and allows seeing things as theyactually appear anatomically. It also gives agreater working distance from the patient of 5to 6 inches. The MIO has a yellow filter thatallows one to see deeper details of the retinaat about the level of the choroid. The cost of theMIO is nearly equal to that of a good binocularindirect ophthalmoscope and of course it doesnot allow a stereoscopic view of the retina.
Fig. 10.10: Monocular indirect ophthalmoscope

159Ophthalmoscopy
Examination Procedure
To examine the right eye, remove the patient’sspectacle correction, stand to the patient’s rightside, and ask him to fixate straight ahead andlevel with the left eye. The observer should wearhis refractive correction. The iris diaphragm leveris pushed fully to the left to maximally increasethe aperture size. Center the red dot on the filterdial to open the aperture for normal viewing.The observer's head should be against theforehead rest and align the eye through theinstrument with the patient’s right eye. Thenposition several inches in front of the patientand focus through the pupil onto the fundususing the thumb and focusing lever. Adjust thefocus and iris diaphragm to produce a clearmaximally illuminated fundus view. Continueto approach the patient until the observer’sknuckle lightly touches the patient’s cheek, asthe working distance decreases, fundusmagnification increases. Angle the light slightlynasally to illuminate and visualize the optic disk.
Modified Monocular IndirectOphthalmoscopy
A thorough fundus examination is importantand required in all young patients with strabis-mus or amblyopia in order to rule out organiccauses of amblyopia prior to the initiation oftreatment. The patient co-operation obtained withhead mounted binocular indirect ophthalmo-scope (using a 20 D lens), and slit-lampbiomicroscope (using a 90 D) is usually difficultor impossible on younger children. Also themagnification of the fundus may be inadequateto allow accurate evaluation of posterior poledetails. The direct ophthalmoscope is often thebest available instrument for detailed retinalexamination in young patients.
However, children often become frightenedas the examiner approaches closely, as isnecessary with the direct ophthalmoscope andco-operation is lost. Additionally children oftenfix the ophthalmoscope light and track it as theexaminer moves it, allowing examination of the
Fig. 10.11: Optics of monocular indirect ophthalmoscopy

160 Diagnostic Procedures in Ophthalmology
macula but not of the disk. The field of viewis small and the magnification is more than isusually necessary. This will prevent the examinerfrom seeing the large area of fundus. To avoidthese difficulties the direct ophthalmoscope canbe used in conjunction with a 20 D condensinglens. This combination provides a moderatelymagnified and wider angle view of the posteriorpole. This avoids the close proximity betweenthe patient and examiner required when usinga direct ophthalmoscope alone. This techniqueis called modified monocular indirect ophthalmo-
scopy and has been noted for its ability to providea good view of the retina through a small pupil.
Examination Procedure
To begin the examination a red reflex is visualizedthrough the direct ophthalmoscope held approxi-mately 18 cm from the patient’s eye. A 20 D lensis then placed 3 to 5 cm in front of the patient’seye in the path of the ophthalmoscope light beam,the examiner then needs to move slightly towardor away from the patient until a clear image ofthe retina is observed.
An inverted, aerial image of the retina isproduced, located between the observer and thelens. The apparent magnification will graduallyincrease as the examiner moves closer to thisimage (i.e. closer to the patient), allowing moredetailed examination. Moving closer to the imageobtains a magnification of X4 to X5. As theexaminer moves closer additional lenses in theophthalmoscope are needed, to keep the imageclear depending on the accommodative needsof the examiner. A viewing distance of approxi-mately 18 cm from the patient is optimal,providing suitable magnification and a widefield of view
A disadvantage of the technique, as withconventional direct ophthalmoscopy is the lackof a true stereoscopic view, however, lateralmovement and rotation of the direct ophthalmo-
scope during the examination gives goodparallax clues to depth.
Penlight Ophthalmoscopy
This is a very old, basically a bedside techniquethat originally utilized a penlight and a high pluslens. The patient must be dilated to get as muchbinocularity as possible and large field of view. Theophthalmoscope is held just below the eyes andits light directed into the patient’s eye. Thepatient’s eye is viewed from over the top of theophthalmoscope while a 20 D lens is placedapproximately 3-4 cm from the patient’s eye. Thelight leaving the condensing lens must come tofocus within the pupil allowing the fullest field ofview of the retina, approximately 30 degrees. Theimage is inverted and laterally reversed and locatedbetween the ophthalmoscope and the condensinglens. The degree of stereopsis depends on how fullythe pupil is dilated and one’s ability to convergeand accommodate on the image. It gives a largerfield of view than a MIO though less magnification.This is an alternative method to examine smallinfants. Should the bulb burn out in a BIO one hasan alternative means to get a good view of theperipheral fundus? Do not put hands on thepatient’s shoulder or head. Instead, use the backof the chair to steady yourself.
Direct Ophthalmoscopy
Direct ophthalmoscope (Fig. 10.12) is mostcommonly used instrument in ophthalmicpractice. The ophthalmologist must familiarizeoneself with the use of the direct ophthalmoscopein an appropriate manner.
Before being able to recognize the abnormali-ties in fundus, one must know what normal lookslike. It is advisable to examine as many of yourcolleagues as possible both inside and outsideclinic hours. Good observational and recordingskills can be developed with practice.

161Ophthalmoscopy
Examination Procedure
Direct ophthalmoscopy is best carried out in adark room with fully dilated pupils. One mustbe familiar with the color coding of the lens wheeland the various apertures and filters. Instructthe patient to look at a distant target (the whitespot light on the vision chart) and to ‘pretend’to still see it even if obscured with your head.The patient may blink as required. Your left eyeand left hand should be used to examine thepatient’s left eye. The field of view of the fundusis increased when examiner goes closer to thepatient’s eye. When patients with low myopesor low hyperopes are to be examined, it is betterto remove their glasses. However, for myopesand hyperopes above ± 3.00 DSph and forastigmats above 2.50 DCyl, it is advisable to keepthe glasses on in order to overcome problemsassociated with magnification, minification anddistortion. The extra reflexes produced by thespectacle lenses will at first prove distractingbut can be overcome with practice.
Using a large diameter aperture, examine theexternal features of the eye including pupils. Witha +1 or +2 D lens in the ophthalmoscope, viewthe pupils at a distance of 40 to 66 cms fromthe patient. Look for media opacities. To findthe location of the opacity, note movement ofthe opacity with relation to the movement of theophthalmoscope, using the pupillary plane asa reference point. If the opacity moves in thesame direction as the ophthalmoscope, the opacityis located behind the iris. If the opacity movesin the opposite direction to the ophthalmoscope,the opacity is located in front of the iris.
Using the ophthalmoscope as a light source,which is held tangential to the iris one looksfor any shadow that appears on the nasal side.If the nasal irido-corneal angle has no shadow,it denotes a wide-open angle. However, as thisshadow increases in width relative to the overallcornea size, the angle seems narrow.
Dial up +10 DSph lens in the lens wheeland observe the eye from a distance of 10 cm.Study the red reflex to detect any media opacity.The position of opacity can be inferred from itsparallax with respect to the pupil. When thepatient looks up and the opacity appears to movein the same direction within the red-reflex thenit is located anterior to the pupil plane (i.e. inthe cornea or in the anterior chamber). Opacitythat remains stationary lies in the plane of thepupil but when it moves in the opposite directionto that of the patient’s gaze it lies posterior tothe pupil plane (i.e. the posterior lens or vitreous).It may be easier to move yourself slightly fromside to side rather than ask the patient to movehis eye to achieve the same effect. Duringophthalmoscopy it is advisable to keep both eyesopen and suppress the image from the other eye.It may take some practice to accomplish this.
It is better to move closer to the patient andgradually reduce the power of the lens in thewheel and focus on the crystalline lens, thevitreous and finally the fundus. The power of
Fig. 10.12: Direct ophthalmoscope

162 Diagnostic Procedures in Ophthalmology
lens necessary to focus on the fundus will dependon patient’s and observer’s uncompensatedrefractive error and accommodation. Once a bloodvessel on the fundus is located, move along itand locate the point at which it branches. Thenmove your field of view in the direction in whichthe apex of the branch is pointing till you reachthe optic disk.
If one controls his accommodation it allowsfor an estimation of the patient’s refractive errorby focusing the optic disk. Retinal blood vesselsshould be examined in each quadrant afterlocating the disk. Artery to vein ratio (A/V),arteriolar light reflex (ALR), branching of vesselsto all four quadrants and crossing phenomenonmust be assessed.
Once again focus the disk and move nasallyto view the macula. In this position you mayobscure the fixation target, cause the pupil toconstrict, dazzle the patient and notice sometroublesome corneal reflections. These factorsmake the macula a difficult area to visualize.It may be useful to use a smaller aperture beam.The patient should not be asked to look intothe light when viewing the macula through anundilated pupil. The patient will accommodateand this together with the bright light from theophthalmoscope will make the pupil even smallerreducing the ability to view the whole maculararea.
Finally ask the patient to look in the eightcardinal directions to view the peripheral fundus.You will need to adjust the lens in the wheelslightly as the periphery is closer to you thanthe optic disk requiring more focusing power(plus lens). The red-free filter makes smallmacroaneurysms and small hemorrhagesstandout more clearly. It can also be helpful inestimating the C/D ratio. It is also used todifferentiate between retinal nevus and choroidalnevus. The retinal blood supply and its retinalpigment epithelium (RPE) act like a red filter.
Therefore, a nevus that lies behind the retinaand located in the choroid will not be seen whenviewed with the red-free filter. On the other handa nevus located on or in the retina will still beseen with the red-free filter in place. A cobalt-blue filter is useful in detection of nerve fibersdrop out.
The direct ophthalmoscope gives a magnifi-cation of approximately X15 and a field of view of6.5 to 10 degrees. The formula M= 60 D/4 holdswell for up to + or –10 Ds of refractive error.
Hruby Lens Direct Ophthalmoscopy
The use of the slit-lamp biomicroscope allowsa stereoscopic view of the retina. The auxiliarylenses provide high magnification with excellentresolution. The Hruby lens (-55 D) produces anupright virtual image that is not laterallyreversed.
Examination Procedure
Patient co-operation can be enhanced by attentionto his comfort and with the use of a fixationdevice. Once the illuminated slit is imaged inthe patient’s pupil, the Hruby lens is introducedin front of the patient’s eye as close as possiblewithout contacting the cornea or lashes.
This mode of direct ophthalmoscopy canprovide a very high level of magnification, evengreater than that of the monocular hand helddirect ophthalmoscope. The actual level ofmagnification depends on that available throughthe slit-lamp. Stereopsis is provided to a greaterdegree than all other examination techniques.
The main disadvantage of this technique isthe field of view. It is smaller than all otherexamination methods with the exception of directmonocular ophthalmoscopy (less than two diskdiameters for an emmetropic patient). Moredilation is required than in other binocular

163Ophthalmoscopy
techniques. The quality of the image is easilydegraded by media opacities; however, increasingthe slit-lamp illumination can reduce thisproblem. As the magnification is so high, smallmovements of the observer, lens, or patient havean immediately noticeable effect on image quality.
Wide-Angle Viewing System
Retcam
The Retcam (Fig. 10.13) has a 3 CCD chip videocamera. It is lightweight, easy to position andhas a long cable for easy patient access. It hasfive changeable lenses: 130°, 120°, 80°, 30° andPotrait. It has a large LCD display with 20seconds of real time video per clip and a frame-by-frame or real time video review. It has a lightedcontrol panel, a dual DVD-RAM for easy back-up, multi-image data recall and display, sideby side image comparison, high resolution 24bit color image, instant-digital image capture and
Fig. 10.13: Retcam viewing system
Fig. 10.15: Fundus photograph (Retcam) of a prematureinfant showing retinopathy of prematurity with laserphotocoagulation marks. Preretinal hemorrhage is seenbeyond the superotemporal vascular arcade
Fig. 10.14: Wide-angle fundus photograph (Retcam) ofa premature infant showing retinopathy of prematurity witha demarcation ridge clearly made out
is US FDA approved. It provides a 130° viewfor easy screening for retinopathy of prematurity(Figs 10.14 and 10.15), integrated image andpatient management capabilities, comprehensivephotodocumentation, fluorescein angiographyand built-in software for reporting, storage andarchiving.
Panoret
Panoret (Fig. 10.16) is a high resolution, wide-angle retinal camera based on an innovative

164 Diagnostic Procedures in Ophthalmology
transscleral illumination concept using a fiberoptic bundle, where no pupillary dilatation isnecessary. Coverage angles are 50° and 100° withinterchangeable front lens assembly. It iscomputer assisted in auto-light, auto-brightnessand contrast control along with auto-disk storage.
Fundus illumination may, however, be limitedin heavily pigmented eyes. DVD recording ispossible. DICOM 3.0 connectivity is availablefor telemedicine.
Bibliography1. Yanoff M, Duker JS, Augsburger JJ, et al (Eds).
Ophthalmology (2nd edn). St. Louis, Mosby,2004.
2. Benson WE, Regillo CD: Retinal detachment—Diagnosis and Management (3rd edn).Lippincott-Raven, Philadelphia, 1998;75-99.
3. Regillo CD. Brown GC, Flynn Jr HW. Vitreo-retinal Disease—The Essentials. Thieme, NewYork, 1999;41-49.
4. Schepens CL, Hartnett ME, Hirose T: Schepens’Retinal Detachment and Allied Diseases (2ndedn). Butterworth-Heinemann, Boston, 2000;99-129.
5. Rosenthal ML, Fradin S: The technique ofbinocular indirect ophthalmoscopy. Highlightsof Ophthalmology 1967; 9:179-257.
6. Michels RG, Rice TA, Wilkinson CP. RetinalDetachment (2nd edn). Mosby, St. Louis, 1997;347-70.
7. Havener WH, Gloekner S. Atlas of Diagnostictechniques and Treatment of RetinalDetachment. Mosby, St. Louis, 1997;1-51.
Fig. 10.16: Panoret

165Ophthalmic Photography
SADAO KANAGAMI
OphthalmicPhotography11
Among all types of medical photography, thespeciality of ophthalmic photography is perhapsthe most difficult to master as it requires in-depthknowledge of not only the ocular structures, andthe disease process of the eye, but it also requiresspecial photographic skills in regard to theequipment needed to record ocular pathologyon silver base media or electronic medium.Captured ophthalmic images often have a directinfluence not only on the diagnosis but also onthe treatment choice as in the case of fundusfluorescein angiography (FFA) or indocyaninegreen angiography (ICGA). The responsibilityof accurately capturing this information neededby the treating ophthalmologist becomes criticaland weighs heavily on the shoulder of theophthalmic photographer—especially with theadvent of teleophthalmology where images maybe captured hundreds of miles away from thetreating ophthalmologist. The ophthalmicphotography differs greatly from biologicalphotography in general as the images capturedby the ophthalmic photographer are part of thetreatment decision process or utilized in themanagement of ophthalmic patients. Recenttrends in ophthalmic photographic equipmentinclude computerized equipment that furtheradds to the long list of specialized techniqueand changes in ophthalmic imaging.
Some of the ophthalmic photography andimaging equipments include the following in thelong list of tools used in our field.
35-mm CameraA 35-mm camera with a motorized drive toautomatically advance the film should be fittedwith a long macro lens (135 mm to 150 mm ora medical lens such as the Nikon Medikor lens)in order to keep facial distortion to a minimum.This is very important especially when takingphotographs in the speciality area of oculoplasty.A macro lens should be selected to include fieldsof one eye to full face; a second macro lens couldinclude head/shoulder to full body (Fig. 11.1).The selected 35-mm camera should also be fitted
Fig. 11.1: Macro lens for closeup photography

166 Diagnostic Procedures in Ophthalmology
with either a double-sided macro flash or a built-in ring flash. These macro flashes are typicallymeant for short range (less than one meter)photography for optimum illumination. Whenphotographing oculoplasty patients for full bodyphotography, a studio flash set-up is still therecommended approach.
Fundus Camera
Mydriatic Fundus Camera
Conventional non-corneal contact mydriaticfundus camera (Fig. 11.2) can range between 20and 60 degrees view of the ocular fundus. Theophthalmic photographer can choose the angleof view that will best reflect the needs of thephotodocumentation, for example, in imagingthe optic nerve for glaucoma one would use aview of 20 degrees, while in the case of a largemelanotic choroidal tumor one would select a
wider 60 degree field of view. Mostly, these retinalcameras capture full color images of the retinaas well as having capabilities of capturingmonochromatic and angiographic images(fluorescein and ICG). Determining the exposurelevel of electronic flash is completely differentfrom the regular 35-mm camera used in externalphotography. Usually, these values are predeter-mined (factory setting) by the angle of viewselected on the retinal camera as well as the filmsensitivity used. Other determining factors forflash intensity can be the use of a plus dioptersetting and angiographic or monochromaticselections (such as cobalt-blue and red-free).Typically, retinal cameras have two or morecamera backs; a 35-mm camera for color ormonochromatic black and white film, a polaroidcamera and in some cases certain retinal cameramanufacturers offer optional video camera(analog or digital) to show the images on themonitor and store them in imaging software pro-gram on the computer system.
Non-mydriatic Fundus Camera
As the name suggests, the non-mydriatic funduscamera does not require the use of mydriaticagents to dilate the patient’s pupil. The non-mydriatic fundus camera usually requires anatural dilation of 4 mm; this can be a limitingfactor on patients over the age of 60 years oldthat typically do not naturally dilate well. Thesefundus cameras are usually very easy to operateas they have no viewfinder but instead they usea large 4-inch monochromatic TV monitor (orin some more modern non-mydriatic cameras,an LCD screen) where the patient’s fundus canbe seen by way of an infrared video alignmentcamera. Since the viewing lamp utilizes infraredwavelength, the patient is not aware of theexamination process. The flash illumination,when using a low LUX video charged coupledevice (CCD) camera, is usually very low as theseFig. 11.2: Fundus camera

167Ophthalmic Photography
cameras have a very high sensitivity. The lowerthe LUX level of the color CCD camera, the fasterthe pupillary recovery time and thus, the fasterthe photographic procedure. There are manymanufacturers of non-mydriatic fundus camerassome have the ability to capture angiographicimages. When one uses mydriatic cameras inthe mode of non-mydriatic, these cameras areusually confined for mid-phase only as a waitingperiod of at least one minute must be allowedto permit full pupillary recovery time. Non-mydriatic cameras can download their capturedimages to a computerized filing system. Often,non-mydriatic cameras (Fig. 11.3) are used tophotograph diseases of the posterior segmentof the eye.
The camera is very small and light weighted,it can be easily taken outside of the clinic. Fundusimages have been stored on a personal computerdirectly from the camera using USB cable andan exclusive software.
Indocyanine Green Angiography
Indocyanine green angiography (ICGA) can beperformed with near-infrared illumination using
a retinal camera. ICGA examines the dynamicflow circulation of the choroidal vessels andadjunct structures (Fig. 11.4). Typically, a retinalcamera that has been designed with special filtersuses a black and white near-infrared CCD videocamera (analog or digital) and records static mega-pixel images stored in a computer bank ordynamic images on videotapes as in the caseof the scanning laser ophthalmoscope (SLO).
Digital Hand-held Fundus Camera
Digital hand-held fundus camera is recentlyintroduced. This camera is designed for digitalimages, therefore, it becomes light and easy tooperate compared to the previous model. Thefundus images are displayed on a small LCDmonitor and can be checked. These images canbe stored on a memory card.
There is an adapter for indirect images. Theadapter is very useful while taking the fundusphotographs of the premature babies (Fig. 11.5).
Photo Slit-lamp (Kowa Attachment)
The hand-held Kowa Genesis camera has aspecial attachment (Fig. 11.6) that allows foranterior segment photodocumentation using a
Fig. 11.3: Non-mydriatic fundus camera
Fig. 11.4: ICG angiogram
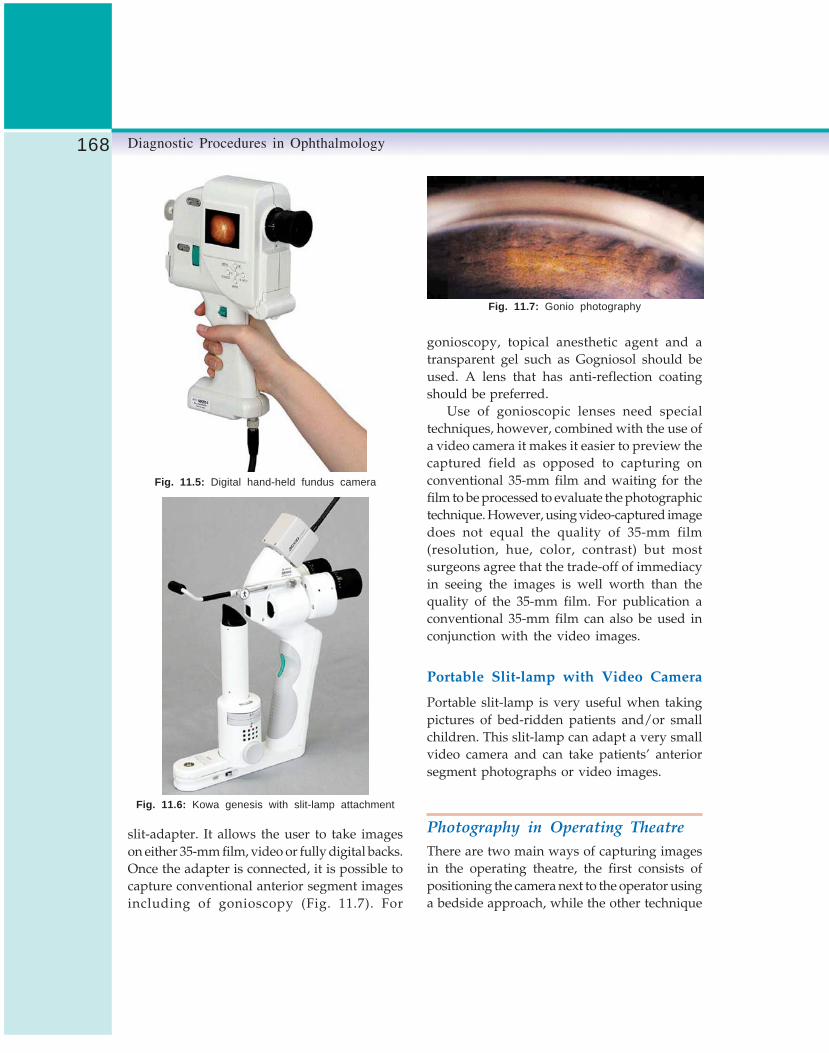
168 Diagnostic Procedures in Ophthalmology
Fig. 11.5: Digital hand-held fundus camera
Fig. 11.6: Kowa genesis with slit-lamp attachment
slit-adapter. It allows the user to take imageson either 35-mm film, video or fully digital backs.Once the adapter is connected, it is possible tocapture conventional anterior segment imagesincluding of gonioscopy (Fig. 11.7). For
gonioscopy, topical anesthetic agent and atransparent gel such as Gogniosol should beused. A lens that has anti-reflection coatingshould be preferred.
Use of gonioscopic lenses need specialtechniques, however, combined with the use ofa video camera it makes it easier to preview thecaptured field as opposed to capturing onconventional 35-mm film and waiting for thefilm to be processed to evaluate the photographictechnique. However, using video-captured imagedoes not equal the quality of 35-mm film(resolution, hue, color, contrast) but mostsurgeons agree that the trade-off of immediacyin seeing the images is well worth than thequality of the 35-mm film. For publication aconventional 35-mm film can also be used inconjunction with the video images.
Portable Slit-lamp with Video Camera
Portable slit-lamp is very useful when takingpictures of bed-ridden patients and/or smallchildren. This slit-lamp can adapt a very smallvideo camera and can take patients’ anteriorsegment photographs or video images.
Photography in Operating TheatreThere are two main ways of capturing imagesin the operating theatre, the first consists ofpositioning the camera next to the operator usinga bedside approach, while the other technique
Fig. 11.7: Gonio photography

169Ophthalmic Photography
is to attach a camera directly to the operatingmicroscope and have the operator take all imagesusing one of the optical pathways of themicroscope (right or left). Using this techniquemeans that the photography port will be takenthrough a 70/30° type of prism and that theoperator will have to look through only the opticalpathway that is occupied by the camera. Usingthis technique will ensure the operator that whathe/she sees is actually captured. Additionally,using this technique will give a good previewof the non-stereo image that is captured by therecording device since only one optical pathwayis equipped with a recording device (usually theright optical pathway is best). It is critical thatthe microscope should be set for focusing therecording device and not the operator’s actualdiopteric correction. If this is not done, capturedimages may not be sharp. The operator will alsonotice that the field viewed and the fieldphotographed is not exactly the same area(usually the photographed field is smaller) butwith practice and years of experience, very goodresults may be achieved. It is critical as in anyother type of photography that the primary lens(lens close to the patient’s cornea) should be freeof artifacts such as: dust, fingerprints, waterstains, fluorescein stains. Attentive care shouldbe given to the lens cleaning techniques to avoidpossible damage to the costly lens. If this is notdone, the quality and color of the captured imageswill be very low with color shift and low contrastimages as well as poor optical resolution.
Specular Microscopy
Photography of the corneal endothelial cells canbe easily performed using a slit-lamp photomicro-scope and resulting images can be analyzedusing a computer program. Typically, theseimages can show the borders of the cells thatreflect the light towards the high magnificationmicroscope lens when used in conjunction with
specular illumination methods. This illuminationcan be achieved by using the illumination towerset at 45 degrees (incident light) from the apexof the cornea while observing the return light(reflected light) through the objective when theobservation tower is set at 45 degrees from theopposite side of the illumination tower. Recenttrends in specular microscopy are the use of non-contact specular microscope that causes littletrauma to the patient and risk of cross contami-nation is less because no corneal applanationis required with the system.
In Figure 11.8 one can easily compare the sizeand/or the arrangement of the endothelial cells.With innovative imaging technology the use ofnon-contact specular microscopy can be easilyobserved on large monitor obviating the use ofprints or photography on silver highlight film base.
Fig. 11.8: Specular photography: endothelial cells
In the past, the role of the ophthalmicphotographer was limited to the capturing ofthe endothelial cells of the cornea. Today,however, the role of the ophthalmic photographerhas evolved to include the analysis of the cornealcells using a computer program (Fig. 11.9).
Imaging System
In 1990, the field of ophthalmic photographywas introduced to electronic imaging technology.At first, only two companies in the United States

170 Diagnostic Procedures in Ophthalmology
were in the forefront of this newly introducedtechnology—KOWA VK-2 system (Fig. 11.10),Topcon ImageNet and Ophthalmic ImagingSystems (OIS). Soon thereafter, a flurry of imagingsystems appeared mostly in PC base and mostlydisappearing in a year or two. In the past tenyears, this new technology has grown to be an
accepted daily routine tool of major universitiesand HMO type practices. The electronic imaginghas mostly replaced all film based angiography(especially true for ICG) avoiding the longdarkroom delays. Although this technology isnot comparable to film based technology, yet asfar as resolution and gray scale, it does offercertain advantages, such as, instant resultsviewable on large CRT screens, image processingor enhancement, transfer of images through theinternet for teaching, screening or second opinion(teleophthalmology).
Advantages
Imaging system has following advantages:1. Captured images are displayed on a monitor
immediately,2. Displayed images are large, so the patients
who are dilated or have low vision canappreciate them,
3. Images may be reviewed by the treatingophthalmologist as they are being captured,
4. Prints can be produced immediately on thinpaper so it is easy to put on a patient’s chart,and
5. Images may be stored in the computer database system for easy review and follow-up.
Disadvantages
Imaging system has following disadvantages:1. The computer systems are quite expensive
and technology changes rapidly makingsystems obsolete in one year,
2. Computer, large CRT screen and printerrequire additional space,
3. Operation of the computer and systemsoftware requires training and maintenance,and
4. Quality of image is not yet comparable with35-mm film.
Fig. 11.9: Noncon robo
Fig. 11.10: Digital imaging system: KOWA VK-2 system

171Ophthalmic Photography
Imaging systems in ophthalmology typicallymeans that the conventional ophthalmic camerarecording device such as the 35-mm or polaroidtype back is replaced with a charged coupledevice (CCD) that may be either analog (videosignal) or digital (higher resolution than videosignal). These CCDs usually can add signifi-cantly to the cost of the fundus or slit-lamp cameraespecially if they are digital in nature. DigitalCCD can be either a single chipped red, greenand blue chipped or could be 3 chipped, onefor each of the RGB wave lengths. The latter isfar more expensive than the single chip but thecolor separation with the three-chip-CCD issuperior. The area of sensitization of the CCDchip (usually varying from inch-to-inch) beingmuch smaller than of the 35-mm surface (24 mm× 36 mm) or of the polaroid sheet, the light (flashintensity) required to expose the light sensitiveCCD is significantly less than that of traditionalfilm base emulsion to expose the same area ofthe eye. Much like the film base emulsion, CCDcomes in a variety of sensitivity calculated inLUX values. The lower the value in front of theLUX, the more sensitive (and usually moreexpensive) the CCD is. However, it can also besaid that the more sensitive the CCD is, the moreelectronic “noise” (comparable to large grainwhen referring to film) can be produced (compar-able to higher sensitivity film such as 1,600 or
3,200 ISO). More recently, ophthalmic manu-facturers: have introduced non-mydriatic retinalcameras with purely digital recording devices.Non-mydriatic cameras are usually equippedwith two CCD, one is a black and white infraredlow resolution used for alignment of the patient’sretina (image is viewable on a small CRT screenlocated on the base of the non-mydriatic retinalcamera), while the second is used to actuallycapture the color image of the retina throughthe naturally dilated pupil in a dimly lit room.One of the main advantages of the low light CCDchip used in the non-mydriatic camera is thatretinal images can be captured sequentiallywithout having to wait 4 to 5 minutes as withinstant type photography (polaroid). Thecaptured retinal images typically do not affectseriously the natural dilation of the pupil.Pupillary recovery is usually very fast as opposedto when using instant type film. Additionally,some non-mydriatic retinal cameras can captureICG angiography since in some cases the infraredcameras used higher resolution.
Photograph of Both Eyes
To take the photographs of ocular movementsespecially in case of strabismus, amblyopia, andocular muscle disorder, eye gaze position in 9directions should be captured (Fig. 11.11). To
Fig. 11.11: Eye gaze position in nine directions
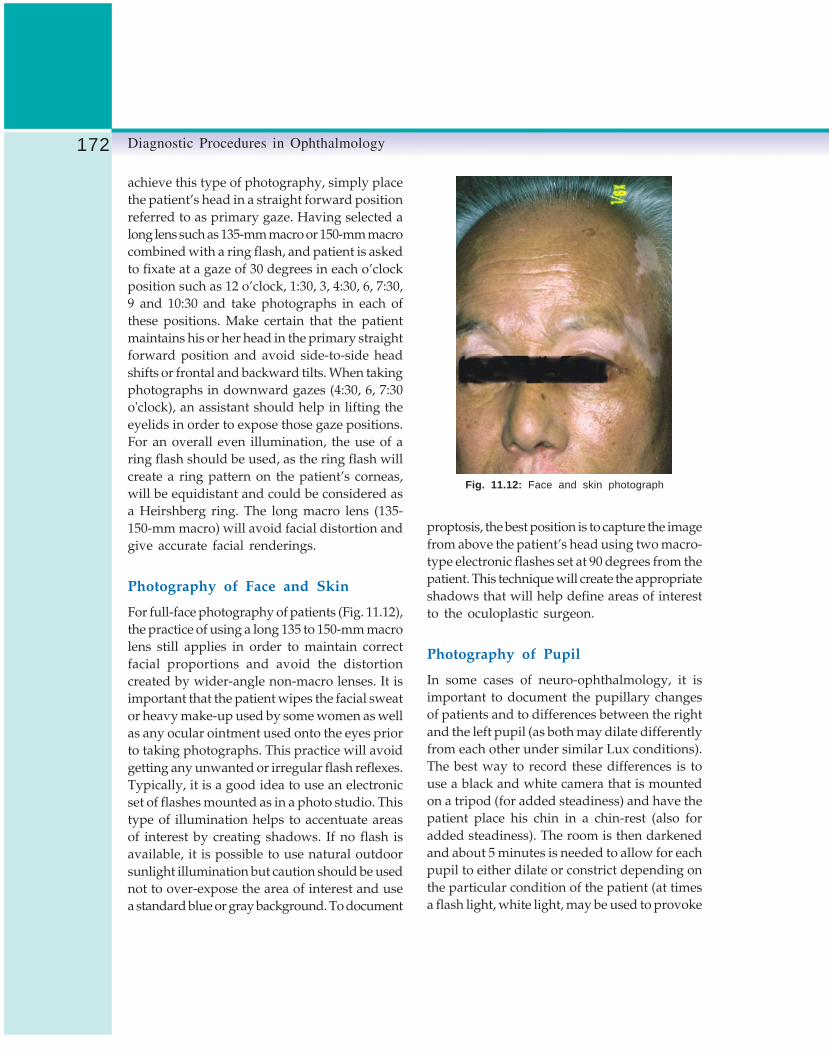
172 Diagnostic Procedures in Ophthalmology
achieve this type of photography, simply placethe patient’s head in a straight forward positionreferred to as primary gaze. Having selected along lens such as 135-mm macro or 150-mm macrocombined with a ring flash, and patient is askedto fixate at a gaze of 30 degrees in each o’clockposition such as 12 o’clock, 1:30, 3, 4:30, 6, 7:30,9 and 10:30 and take photographs in each ofthese positions. Make certain that the patientmaintains his or her head in the primary straightforward position and avoid side-to-side headshifts or frontal and backward tilts. When takingphotographs in downward gazes (4:30, 6, 7:30o'clock), an assistant should help in lifting theeyelids in order to expose those gaze positions.For an overall even illumination, the use of aring flash should be used, as the ring flash willcreate a ring pattern on the patient’s corneas,will be equidistant and could be considered asa Heirshberg ring. The long macro lens (135-150-mm macro) will avoid facial distortion andgive accurate facial renderings.
Photography of Face and Skin
For full-face photography of patients (Fig. 11.12),the practice of using a long 135 to 150-mm macrolens still applies in order to maintain correctfacial proportions and avoid the distortioncreated by wider-angle non-macro lenses. It isimportant that the patient wipes the facial sweator heavy make-up used by some women as wellas any ocular ointment used onto the eyes priorto taking photographs. This practice will avoidgetting any unwanted or irregular flash reflexes.Typically, it is a good idea to use an electronicset of flashes mounted as in a photo studio. Thistype of illumination helps to accentuate areasof interest by creating shadows. If no flash isavailable, it is possible to use natural outdoorsunlight illumination but caution should be usednot to over-expose the area of interest and usea standard blue or gray background. To document
proptosis, the best position is to capture the imagefrom above the patient’s head using two macro-type electronic flashes set at 90 degrees from thepatient. This technique will create the appropriateshadows that will help define areas of interestto the oculoplastic surgeon.
Photography of Pupil
In some cases of neuro-ophthalmology, it isimportant to document the pupillary changesof patients and to differences between the rightand the left pupil (as both may dilate differentlyfrom each other under similar Lux conditions).The best way to record these differences is touse a black and white camera that is mountedon a tripod (for added steadiness) and have thepatient place his chin in a chin-rest (also foradded steadiness). The room is then darkenedand about 5 minutes is needed to allow for eachpupil to either dilate or constrict depending onthe particular condition of the patient (at timesa flash light, white light, may be used to provoke
Fig. 11.12: Face and skin photograph

173Ophthalmic Photography
a specific pupillary reaction that is recorded onvideo). Analog iris recorders are available thatuse infrared CCD cameras in combination withan infrared illumination system that is notperceivable to the patient and where the patient’spupil does not react. Images are then recordedas either a series of still images or as a stringof segments (continuous video images) that arethen transferred to a computer for numericprocessing. Typically when performing thesestudies, no mydriatic agents are used unlessotherwise indicated by the examiner.
External Photography
When taking photographs of the cornea and thelens, the choice instrument is a photo slit-lampsince it has the correct optical magnification andthe appropriate flash to accomplish the task athand. However, when a photo slit-lamp is notavailable, a 35-mm SLR camera with macro lensand electronic flash or even a fundus camera(using a plus diopter) may be used. Externalclose-up photography of one eye for the purposeof documentation of ocular trauma or tumorscan be taken with a macro type lens (usuallya long lens) and a side macro flash (usuallymounted on either side of the front of the macrolens) to avoid disturbing flash reflexes often foundwhen using a ring flash type systems. Carefulevaluation of where the flash reflex will fall iscritical in obtaining useful photo-documentation.Many macro type electronic flashes have whatis called a modeling light that is mounted directlynext to the flash tube. These modeling lights willilluminate the field of interest and give a goodidea of where the flash reflexes will show-upwhen the photograph is captured. Since thecornea and sclera are highly reflective surfaces,special attention needs to be given to theillumination technique. It is possible to limit thesereflections by using polarizing filters on the flash
and lens, however, the reflexes will only partiallydisappear and the iris detail is made very dark.
Conventional 35-mm SLR Camera
When using a 35-mm macro lens for ophthalmicphoto-documentation, it is critical to select a lensthat will keep the true perspective of the areaof interest. Nikon Corporation introduced aspecial macro lens with intergraded ring typemacro flash tube. This special macro lens calledNikor Medikor lens, it comes in two focal lengths.This lens works somewhat differently in thatthe photographer selects the required magni-fication on the lens and then simply focuses byphysically moving towards or away from thepatient. Other possible choices for macro lensesare:One eye 135 to 150 mm macro lensTwo eyes 105 to 135 mm macro lensFull face 105 to 135 mm macro lensTorso 50 to 105 mm macro lensFull body 50 to 105 mm macro lens
Use of Fundus Camera in ExternalPhotography
The hand-held fundus camera (Kowa Genesis)may be especially useful in close-up externalphotography as the system uses a powerfuldistortion-free macro lens along with a co-axialillumination in the fundus camera that producesa small reflex on the cornea or sclera. This camerais particularly well suited in the pediatricpopulation (Fig. 11.13).
Some table-top retinal cameras are also wellsuited for external (single eye) photo-documen-tation of the eye; these retinal cameras are usuallyfitted with a frontal concave lens. To capturethe images, simply position the patient in thechinrest as you would for conventional retinalphotography and select a plus diopter setting

174 Diagnostic Procedures in Ophthalmology
Fig. 11.13: Photograph of external eye with hand-held fundus camera
(as well as in some cases selecting a highermagnification lens) by focusing the retinal camerauntil the images becomes clear. Film type andflash exposure is the same as for regular fundusphotography (Fig. 11.14). For taking fluoresceinstain photography of the cornea or sclera, theretinal camera may be the most useful instrumentsince it already has both the exciter and barrierfilter in place (Fig. 11.15). When performing irisangiography, again the retinal camera is bestsuited for this purpose not only due to the filtersbut also because these cameras are equipped
Fig. 11.14: Photograph of external eye with table-topfundus camera
Fig. 11.15: Fluorescein stain photography
Fig. 11.16: Anterior segment fluorescein angiogram
with an internal timer that is critical for fluores-cein studies requiring dynamic flow analysis(Fig. 11.16). Black and white films ISO 400 orinstant type (polaroid or Fuji) film can be usedand processed in a similar way as for retinalangiography.
Optical System of Fundus CameraFundus camera’s optical system can be comparedto the Galilean type telescope and is characteristicby incorporating an internal co-axial typeillumination and electronic flash. The light

175Ophthalmic Photography
emitted through the objective of the camera lensis a ring-shaped image. The distance from thisring to the surface of objective lens is referredto as the working distance and is of greatimportance in taking good artifact-free fundusphotographs. The actual position of this ring-shaped light can be best observed by lookingfrom the side of the fundus camera. To keep thisrelative position constant is one of the mostimportant and basic points in fundus photo-graphy to insure good color saturation andartifact-free photography (Fig. 11.17).
agent to achieve best possible pupillary dilation(optimally a pupillary dilation of over 8 mm isdesirable). The objective lens should be cleanand free from dust and smear. Any dust particlesmust be carefully removed with a manual blowerwhile smear should be removed with lenscleaning paper. Check that the film is correctlyloaded and flash intensity control is properlyset according to the film sensitivity as well asthe retinal pigmentation. Also adjust the eyepiecediopter scale to match the operator’s dioptericcorrection (Fig. 11.18). Adjust the height of themotorized camera table as well as the operator’sand patient’s stool so both may be as comfortableas possible in front of the fundus camera(Fig. 11.19).
Fig. 11.17: Working distance
Fig. 11.18: Diopteric correction
Fundus Photography
Preparatory Operations
Prior to starting the photographic session, thepatient’s eye must be dilated with a mydriatic
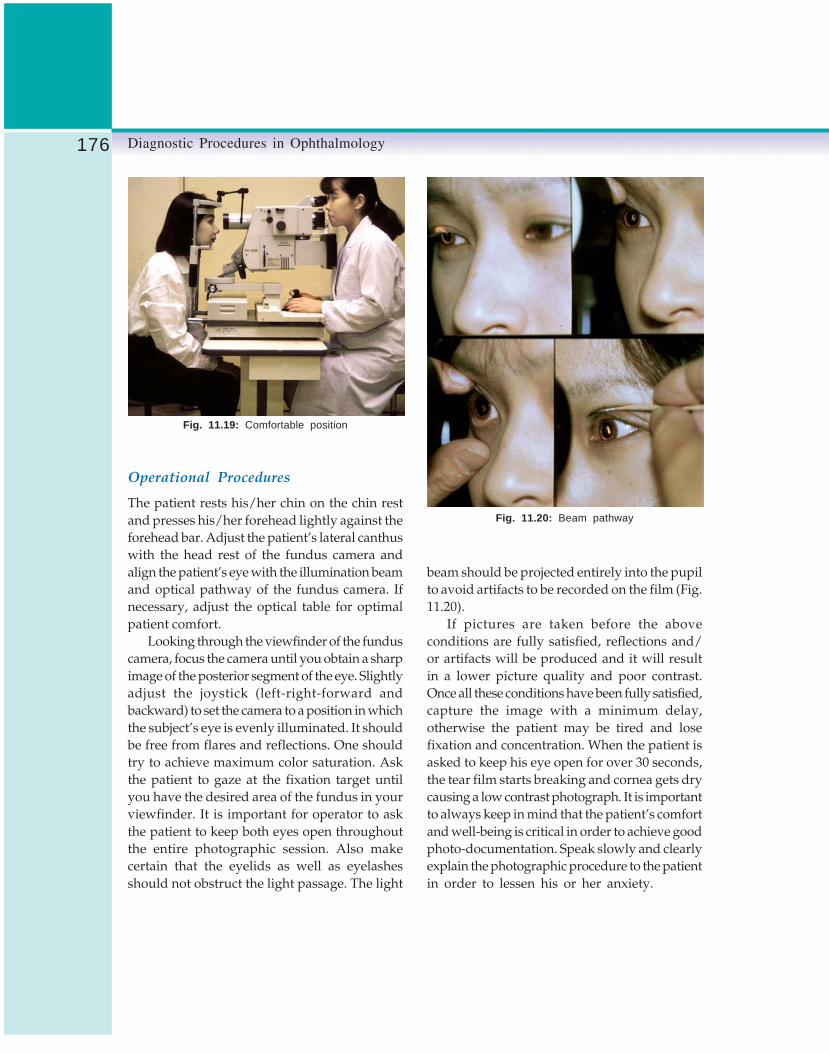
176 Diagnostic Procedures in Ophthalmology
Fig. 11.19: Comfortable position
Operational Procedures
The patient rests his/her chin on the chin restand presses his/her forehead lightly against theforehead bar. Adjust the patient’s lateral canthuswith the head rest of the fundus camera andalign the patient’s eye with the illumination beamand optical pathway of the fundus camera. Ifnecessary, adjust the optical table for optimalpatient comfort.
Looking through the viewfinder of the funduscamera, focus the camera until you obtain a sharpimage of the posterior segment of the eye. Slightlyadjust the joystick (left-right-forward andbackward) to set the camera to a position in whichthe subject’s eye is evenly illuminated. It shouldbe free from flares and reflections. One shouldtry to achieve maximum color saturation. Askthe patient to gaze at the fixation target untilyou have the desired area of the fundus in yourviewfinder. It is important for operator to askthe patient to keep both eyes open throughoutthe entire photographic session. Also makecertain that the eyelids as well as eyelashesshould not obstruct the light passage. The light
Fig. 11.20: Beam pathway
beam should be projected entirely into the pupilto avoid artifacts to be recorded on the film (Fig.11.20).
If pictures are taken before the aboveconditions are fully satisfied, reflections and/or artifacts will be produced and it will resultin a lower picture quality and poor contrast.Once all these conditions have been fully satisfied,capture the image with a minimum delay,otherwise the patient may be tired and losefixation and concentration. When the patient isasked to keep his eye open for over 30 seconds,the tear film starts breaking and cornea gets drycausing a low contrast photograph. It is importantto always keep in mind that the patient’s comfortand well-being is critical in order to achieve goodphoto-documentation. Speak slowly and clearlyexplain the photographic procedure to the patientin order to lessen his or her anxiety.

177Ophthalmic Photography
Fluorescein Angiography
Ophthalmic photography is unique because themedical photographers also perform dynamicflow studies of the iris, retina or choroid usingdyes such as sodium fluorescein or indocyaninegreen. These studies provide a vital piece ofinformation needed by the treating ophthalmo-logist in order to understand the vision problemsof a patient. Fluorescein angiography (FA) is oftenmore complex than conventional color retinalphotography. This, however, is not the case, themain differences between color retinal photo-graphy and angiography are a set of filters(usually a set of exciter and barrier filter) andremembering the correct sequence of the flowstudy (area to be photographed in the early, midor late phase that are usually recorded with atimer).
Principle of Sodium FluoresceinAngiography
Sodium fluorescein is mainly used to performdynamic flow studies of the integrity of retinalvessels (in some cases, sodium fluorescein mayalso be used in the study of the vascular integrityof the anterior segment). Once the pupils aresufficiently dilated, a solution with a concen-tration of 10% (2.5 cc of volume) or 25% (1 ccof volume) of sodium fluorescein is injected inthe patient’s vein. Injection volume should becarefully controlled in children or patientsweighing less than 100 pounds. When usinga concentration of 10% of sodium fluorescein,a recommended dose of 0.066 cc per kg shouldbe used. It not only avoids adverse reactions butgives a good fluorescence standard in thedynamic flow study. The dye travels throughoutthe body’s circulatory system (first throughoutthe veins) including the retinal vessels. Whenobserving the retina with a cobalt blue light(referred to as the exciter light set at about
490 nm), sodium fluorescein reflects a greenfluorescence towards the film plane of the retinalcamera. Before arriving to the film plane, thatgreen fluorescence passes through a yellowbarrier filter (referred as the barrier filter) thatremoves all unwanted blue light that may inter-fere with the true appearance of the fluorescencefound at about 520 nm. These exciter filters (cobaltblue set at 490 nm) and the barrier filter (sharpcut-off filter set at 520 nm) must be matchedperfectly in order to render true fluorescenceimages of the retinal vessels (Fig. 11.21).
Film Type and Development
The amount of fluorescence perceived by the filmwhen properly excited by cobalt blue illuminationis somewhat low; therefore, a highly sensitiveblack and white film such as ISO 400 film shouldbe used. When processing this black and whitefilm (in total darkness), use a medium to highcontrast fresh developer in conjunction with anextended processing time in a solution set at20°C/68°F. Push process is a technique that isused in angiography to see more detail on thefilm produced by the fluorescence; this techniqueconsists of processing the exposed sensitive filmfor an extended period of time (50 to 100% longer)or to process the film in a warmer solution say2 to 4 degrees centigrade higher.
Fig. 11.21: Fluorescein absorption and emission

178 Diagnostic Procedures in Ophthalmology
Photographic Procedures
Fluorescein angiographic study consists ofseveral phases based on time sequence.Depending on the particular ocular disease,dynamic flow studies vary between 3 and 15minutes. Fluorescein angiography has followingphases:1. Preinjection or control photograph: It is a
photograph in which both the exciter andbarrier filters are in place and a photographis taken without the presence of sodiumfluorescein. This is usually done to determinethe presence of pseudo-fluorescence or auto-fluorescence such as in the case of drusens.
Fig. 11.22: Arterial/venous phase of FA
2. Arterial and venous phase: This is the earlyphase of the angiogram study usually within14 to 30 seconds after injection of sodiumfluorescein (Fig. 11.22).
3. Mid-phase: When all retinal vessels have beenfilled (stained) with sodium fluorescein (from30 seconds to 120 seconds).
4. Late phase: This is the last phase and variesin duration depending on the disease of thepatient. In diabetic retinopathy, this phasemay vary from 3 to 5 minutes, whereas insome ocular tumors, it may last as long as15 to 20 minutes (Fig. 11.23).
Fig. 11.23: Late phase of FA
The fluorescein angiography helps inunderstanding various retinal diseases andabnormalities. One needs to study carefully theretinal drawing of the patient’s chart and lookfor notes or direction from the retina specialistto understand the areas of interest and the mainphase of the study (early, mid or late). It is criticalto follow precisely the retina specialist’s notesto understand the diseased eye to be first studied(right or left eye). How soon the retina specialistneeds to evaluate the results of the angiogram?Does the retina specialist need to treat the patientwith laser immediately after the angiographicstudy? This is referred to as a STAT angiogram.A good practice is to carefully study the diseasedretinal areas when performing color photo-graphy, usually done prior to an angiography.Once you understand the ocular disease, youcan start the angiographic procedure with a goodplan. Number of images in each phase, early,mid and late phases as well as area of interest,are dependant on a particular study. It is,however, important to get different results fromwhat were initially anticipated. In fact, at times,angiographic pattern may be completely differentfrom what was anticipated, a retinal vessel thatwas thought to be leaking may be intact and

179Ophthalmic Photography
a normal one may be found leaking. Anticipatingthe unexpected findings comes with years ofangiographic experience and a good set ofstandardized angiographic protocol.
Monochromatic Fundus Photography
Various monochromatic wavelengths penetrateat different layers of the eye revealing specificstructures as well as foreign bodies in thoselayers. With the appropriate monochromaticwavelength filter (cobalt blue filter), it is possibleto isolate the first layer of the retina where youcan find the nerve fiber layers (Fig. 11.24). This
may be very useful while documenting a patientwith glaucoma to demonstrate nerve fiberdropout. A green filter (referred to as red-free)will cut out all red-light making those areas black(red is seen as black) creating a nice high contrastimage of the posterior pole. Red filters will allowthe longer wavelengths of the visible spectrumto penetrate deep into the ocular structures toreveal the choroidal vascular pattern (choroidalvessels appear as white while retinal vesselswill appear as black Fig. 11.25) and a choroidalnevus or melanoma (Fig. 11.26). These photo-graphs, in particular those taken with red-freelight, are very suitable for printing use.
Anterior Segment Photography withPhoto Slit-lamp
The anterior segment is usually photographedwith a photo slit-lamp biomicroscope (Fig. 11.27).It is similar to the clinical slit-lamp biomicroscopethat is used in our daily work; with the exceptionthat it incorporates a camera (static or motionsuch as video) and an electronic flash light.Needless to say, photographers need a goodunderstanding of the clinical instrument beforethey can become skillful in capturing clinicallyuseful images of the anterior segment (Fig. 11.28).
Fig. 11.24: Nerve fiber layer with blue filter
Fig. 11.25: Red-free photography
Fig. 11.26: Choroidal pigment with red filter

180 Diagnostic Procedures in Ophthalmology
Fig. 11.27: Photo slit-lamp Fig. 11.28: Slit-lamp photograph of lens with variousnuclei
Different from fundus photography, photo slit-lamp biomicroscopy is perhaps the mostchallenging type of photography in the field ofophthalmology. It requires a good understandingof the ocular structures; disease process as wellas illumination techniques to illustrate the areaof interest to the clinician. The illumination isof key importance.
Since pathology varies greatly and mayappear differently for each case, simple changesof slit-width, height angle of the illuminationtower or even the use of diffuser, the samepathology may show itself quite differently in thefinal picture. It becomes essential to select mostsuitable lighting technique for each situation.This challenge is perhaps what gives thephotographer greatest pleasure in taking picturesof best area of interest.
In observing through the slit-lamp thereflections from the cornea and lens are not sooffensive. However, same reflections may becomedisturbing and even harmful in hiding areas ofinterest when taking photographs. Adjust theillumination tower angle to avoid unwantedreflections. When using auxiliary light (often
referred to as fill light), it is necessary to payattention to avoid the reflection that light mayproduce on the cornea. Carefully place the areaof interest in the field to be photographed whilemaking certain that you are using the bestpossible form of illumination. Use appropriatemagnification to ensure that not only the areaof interest is captured but you leave enough roomto have a point of reference for follow-up photo-graphic sessions (for example, in photographingan iris melanoma; use of medium magnificationwould allow for a portion of the iris to be seenfor identification that the mass is located at 12,3, 6 or 9 o’clock and provides an idea aboutthe size of the mass.
Bibliography1. Fogla Rajesh, Rao KS. Ophthalmic photography
using a digital camera. Indian J Ophthalmol2003;51:69-72.
2. Kwan A. A simple slit-lamp digital photographicsystem. Eye News 2000;6:18-21.
3. Prasad S. Digital video in a surgical setting.J Cataract Refract Surg 2004;30:2302-03.

181Fluorescein Angiography
R KIM, S MANOJ
FluoresceinAngiography12
The study and diagnosis of retinal, macular andchoroidal pathologic lesions have been greatlyrevolutionized with the advent of fundusfluorescein angiography (FFA). From an initiallaboratory tool, it has now become a usefuldiagnostic tool that has aided the diagnosis andmonitoring of the treatment of retinal vascularand macular diseases. Although the retina canbe readily examined by direct and indirectophthalmoscopy and slit-lamp biomicroscopy,the fluorescein angiography provides a valuableaddition to these techniques. Over the last 40years, it has been successfully utilized in manyresearch studies, controlled clinical trials andnational collaborative studies and its usefulnessand popularity have increased. With thedevelopment of high quality retinal funduscameras, digital imaging and photographicfilters, high resolution angiography of the retinaand choroid is now possible.
HistoryThe technique of using intravenous fluoresceinto evaluate the ocular circulation was probablyintroduced 40 years ago by Mac Lean andMaumenee, who described the direct observation
of the dye and its characteristics by slit-lampbiomicroscopy and ophthalmoscopy. Chao andFlocks provided the earliest description offluorescein angiography in 1958. Finally, it wasintroduced into clinical use in 1961 by Novotnyand Alvis, who demonstrated the photographicdocumentation of the fluorescein dynamics. Overthe last 3 decades advances have occurred inthis sphere, with the development of high qualityphotography equipment, photographic filters,newer printing techniques, stereophotographyand digital imaging which has made possiblethe generation of high resolution angiographyof the retina and choroid.
Basic PrinciplesThe basic principle of FFA is based on the under-standing of luminescence and fluorescence.Luminescence is the emission of light from anysource other than high temperature. When lightenergy is absorbed into a luminescent material,a few electrons are elevated into a higher energystate. Spontaneous decay then occurs ofthese electrons into their lower energy states.When this decay occurs in the visible spectrum,it is called luminescence. Fluorescence is

182 Diagnostic Procedures in Ophthalmology
luminescence that is maintained only bycontinuous excitation. In fluorescence, excitationat one wavelength occurs and is emittedimmediately through a longer wavelength.1, 2
Properties of Sodium FluoresceinSodium fluorescein (C20H12O5Na) is an orangered crystalline hydrocarbon with a low molecularweight (376.27 daltons) and readily diffusesthrough most of the body fluids and throughthe choriocapillaris, but it does not diffusethrough the retinal vascular endothelium or thepigment epithelium. Fluorescein is eliminatedby the liver and kidney within 24-36 hours,though traces may be found even for one week.Retention may be increased if renal function isimpaired.1
The dye absorbs light in the blue range ofthe visible spectrum with absorption peakingat 465 to 490 nm. It emits light from 500 to 600nm with a maximum intensity at 520 to 530 nm(green-yellow). Even though the excitation andemission spectra are quite close, as long assuitably matched excitation and barrier filtersare used, only substances capable of fluorescenceare detected. When fluorescein is injectedintravenously 80% becomes bound to proteinwhile 20% remains free in the blood stream andis available for fluorescence. The blue flash excitesthe unbound fluorescein within the blood vesselsor the leaked out fluorescein. The blue filter shieldsout all other light and allows through only theblue excitation light. Structures containingfluorescein within the eye emit green-yellow light.The blue light is reflected off of the fundusstructures that do not have fluorescein. The bluereflected light and green-yellow fluorescent lightare directed back toward the film of the funduscamera. Just in front of the film a filter is placedthat allows the green-yellow fluorescent lightthrough but keeps out the blue reflected light.2
Technique and EquipmentThe materials needed for fluoresceinangiography are as follows:
1. Fundus camera and auxiliary equipment2. 23 gauge scalp vein needle3. 5 ml syringe4. Fluorescein solution5. 20 gauge 1 ½ inch needle to draw the dye6. Armrest for fluorescein injection7. Tourniquet8. Alcohol9. Bandage
10. Standard emergency equipment (Fig. 12. 1)
Fig. 12.1: Emergency set
Equipment
The traditional fluorescein angiography unit (Fig.12.2) has two 35 mm cameras, one for colorfundus photography while the other (black &white) for fluorescein angiography. Most funduscameras take 30° photographs (magnification ofX2.5 on a 35 mm film), which are adequate fora detailed study of posterior pole lesionsespecially macular diseases. Many camera unitsprovide variable magnification at 20, 30 and 50degrees. The 50° view is most useful for lesionsinvolving a large area of the fundus. The flashunit and powerpack recharges rapidly enough

183Fluorescein Angiography
to allow angiophotographs to be taken at 2 secondintervals. The motor drive in most equipmentsadvance the film automatically and the timerrecords the interval between the various phasesof angiography and is vital especially inconditions when the arterial perfusion pressureis low. The equipment has 2 filters. The exciterfilter transmits blue light at 465 – 490 nm, theabsorption peak of fluorescein excitation. Thebarrier filter transmits light at 525 to 530 nmthe emitted peak of fluorescein.
Fig. 12.2: Fundus camera
The most frequently used film for FFA isKodak 400 ASA (black and white). Variousdeveloping solutions are available but the bestdeveloping time for a particular camera andpower pack combination is variable. After thefilm is developed, the negatives can be counterprinted into either film (transparency) or paper(print). On the negative, areas of flourescence
appear black and on positive film or paper itis white. Usually a roll of 35 mm negative filmused for FFA has 36 frames.1
Digital AngiographyCommercial digital angiography imaging systemshave been available for over 15 years and continueto improve in quality each year. Althoughphotographic film is still capable of capturinggreater detail than current digital systems, digitalimaging offers some distinct advantages over themore traditional film-based angiogram. Instantaccess to the electronic images increases efficiencyand promotes better patient education byreviewing images on a monitor with the patient.Image enhancement and manipulation is easilyachieved with imaging software. Lesions can bemeasured, or digital overlays used to identifychanges in lesion size in serial photographs.Images can be stored on magnetic media likeCD-ROMs and transmitted electronically toremote sites equipped with a computer forviewing. Digital systems also offer the additionaladvantage of shortening the learning curve fornovice angiographers. Having instant feedbackallows the angiographer to adjust exposuresettings and camera alignment to correct anyflaws in technique.
Cutting edge microelectronics and opticaldesigns of unmatched performance enable thepresent day digital cameras to take retinal imagesof exceptional resolution with stunning speedand simplicity. Digital imaging system like theIMAGE-net digital imaging system achievesfaster, more efficient acquisition, storage, retrievaland analysis of images. These imaging systemsalso incorporate a full range of image enhance-ment programs (sharpness, color, contrast) thatcan be of great help in precisely evaluatingdifficult pathologies. For easy and precisephotography, digital cameras are now provided

184 Diagnostic Procedures in Ophthalmology
with alignment dots which provide easyconfirmation of working distance and areextremely helpful for pre-injection positioning.Also synchronized accessory detection capabilityand operating sensors guarantee a perfect imageevery time during fast photography. Precise anddelicate control of flash intensity is vital to obtainmaximum detail in digital imaging. Multi-stepadjustment of flash intensity is provided withmost of the modern cameras, which enablesoptimized results during angiography. Therefractive error of the patient can influence thequality of the images obtained especially the largerefractive errors. To adjust for variations in therefractive errors, diopter compensation knobs areprovided in the modern camera units for accuratephotography. For example 0 setting for –10 to+6 diopter, – setting for –9 to –23 diopter, + settingfor + 5 to + 23 diopter and a setting for +22to +41 diopter (ocular anterior photography).Maximal dilatation is critical for optimal images.Modern angiography units now have a three-step illumination diaphragm changing systemfor patient’s pupil size. Despite these advantages,the high initial cost of digital systems hasprevented them from being employed universally.
Fluorescein Solution
Solutions containing 500 mg of fluorescein areavailable in vials of 10 ml of 5% fluorescein or5 ml of 10% fluorescein, 3 ml of 25% fluoresceinsolution (750 mg) is also available. With a greatervolume the injection time increases, with asmaller volume, more fluorescein remains in thedead space between the arm and the heart.Therefore, 5 ml of 10% solution (500 mg)fluorescein is generally preferred.
The venous dead space between the handor the antecubital vein and the heart may beas much as 5 to 10 ml, leading to sluggish orreduced flow of fluorescein into the centralcirculation. The fluorescein can be flushed with
5 to 10 ml of normal saline. An alternative isto elevate the patient’s arm above the level ofthe heart using an adjustable armrest, whichreduces the fluorescein transit time to the heart.2
Procedure for Fundus FluoresceinAngiography
After informed consent and explaining theprocedure to the patient, the patient’s eyes aredilated. The FFA-set namely fluorescein solutionin the required concentration, scalp vein needle,5 ml syringe and the emergency tray (Fig. 12.1)is prepared. The fundus camera (Fig. 12.2) iskept ready after cleaning the lenses, loading thefilm and test focusing. Patient identificationphotographs are then taken. Modern digitalcameras with imageNet software maintain a datasheet of patients. The patient is positioned andthe camera aligned (Fig. 12. 3). Color photographyof both eyes is first done and then switched overto black and white photography for FFA. Red-free photograph of the posterior pole is taken.Insert the scalp-vein needle and inject thefluorescein dye and the timer is started as soonas the dye is injected. Take pre-injectionphotographs and start fluorescein photographyfrom the first appearance of the dye.
Fig.12.3: Digital fluorescein angiographyin progress

185Fluorescein Angiography
Follow an angiography plan depending onthe case. No standard and comprehensive planis possible to evaluat e all the possible retinalvascular and macular diseases. However, thephotographer should use his own judgment tofollow a particular order in shooting the variousquadrants during flourescein angiography. Forexample, in central serous retinopathy orchoroidal neovascular membrane, it is importantto take early films and posterior pole photographyis sufficient. In macular disorders, concentratingon the posterior pole during angiography is oftenadequate. Diabetic and other vascular diseases,however, require a detailed fundus study wherethe first few photographs are taken of theposterior pole and then each peripheral quadrantis specially taken in a clock-wise fashion fromthe superior quadrant onwards. Photography ofthe peripheral retina demands patience,precision and skill due to problems in patient’scompliance, light reflexes and awkward cameraplacements.
At the end, reassure the patient and explainthe side effects namely discolored skin and urine.If the patient develops nausea or vomiting orsigns of allergic response the procedure is stoppedand necessary steps taken.1
Stereophotography
Stereophotography facilitates interpretation byallowing the images of both eyes to be viewedsimultaneously in depth. It helps us in interpre-ting the condition under study with respect toits relationship to the various layers of the eye.Adequate stereophotographs can be achievedwith a pupillary dilation of 4 mm althoughdilation of 6 mm or more is preferred. The firstphotograph is taken with the camera positionedas far to the photographer’s right of the pupil’scenter. The second photograph of the pair is takenwith the camera held as far to the photographer’sleft of the pupil’s center. This order is extremely
important because the photographs are takenand positioned on the film so that the angiogramis read from right to left. Most of the moderncameras have a stereo lock, which can be activatedto take stereophotographs. Specially madestereo viewers are available to read the stereoimages.
Side Effects and Complications
Adverse reactions to intravenous fluoresceinangiography have ranged from mild to severe.3,4
Mild reactions (1 in 20) are classified as thosewith transient effects that resolve completelywithout requiring any specific treatment. Themost common side effects are nausea andvomiting. Moderate adverse reactions (1 in 63)require medical intervention and majority havea good recovery. They include pruritis, urticaria,syncope, thrombophlebitis, pyrexia and localtissue necrosis. Severe reactions (1 in 1900) arethose requiring intensive intervention and havea variable recovery and at times fatal. Theyinclude laryngeal edema, bronchospasm,anaphylaxis, shock, myocardial infarction,cardiac arrest and convulsion.
Nausea
Nausea occurs in about 3-15% of patients andis the most frequent side effect. It is most likelyto occur in patients under 50 years of age orwhen fluorescein is injected rapidly. It beginsabout 30 seconds after injection and lasts for2 to 3 minutes and then disappears slowly.
Vomiting
Vomiting occurs in about 0-7% of patients nearly40 to 50 seconds after injection. When patientsexperience nausea or vomiting, they should bereassured that the unpleasant and uncomfortablefeeling will subside rapidly.

186 Diagnostic Procedures in Ophthalmology
Hyperventilation is often known to relieve thesesymptoms. Restriction of food and water for 4hours prior to fluorescein angiography mayreduce the incidence of vomiting. Promethacinehydrochloride 25 or 50 mg by month may begiven about one hour before injection especiallyin predisposed individuals.
Pruritus
Pruritus or itching is one of the most frequentallergic reaction (1 in 82), usually occurring 2to 15 minutes after the fluorescein injection. Oralor intravenous antihistamics are often beneficial.
Extravasation of the Dye and LocalTissue Necrosis
Extravasation of dye is extremely painful andserious. Toxic neuritis caused by infiltration ofthe extravasated fluorescein along the nerve inthe antecubital area can result in considerablepain. An ice pack or injection of local anesthesiais very effective. If extravasation occursimmediately it is best to place the needle inanother vein and reinject a full dose of fluorescein.
Vasovagal Attacks
Vasovagal attack is caused more by patientanxiety than by the actual injection of fluorescein.
Shock and Syncope
Some patients may experience bradycardia,hypotension, reduced cardiovascular perfusion,sweating and the sense of feeling cold.
Anaphylaxis
Anaphylaxis to fluorescein may range from hivesto laryngeal edema, bronchospasm or cardio-vascular collapse. Hives may occur 2 to 15
minutes after the fluorescein injection. Althoughhives usually disappear within few hours, anantihistamine such as diphenylhydraminehydrochloride may be administered intra-venously for an immediate response. Severereactions involving the respiratory (1: 3800),cardiac (1: 5300) system and seizures (1: 13,900)can occur and may be fatal (1: 221,781).
There are no known contraindications tofluorescein injections including patients with ahistory of heart disease, cardiac arrhythmias orcardiac pacemakers. However, the dye is to beused with caution or avoided in patients withadvanced renal failure or in patients with historyof drug allergy. Intradermal testing of dilutedsodium fluorescein may be required in suchpatients with history of drug allergy/crossreaction. Although there has been no report offetal complications from fluorescein injectionsduring pregnancy, it is the current practice toavoid angiography in women who are pregnant,especially in the first trimester.
Basic Anatomic Considerations
The inner retina contains the retinal bloodvessels, the larger vessels in the nerve fiber layerand the retinal capillaries in the inner nuclearlayer. The normal retinal vessels both the largeand capillaries with their tight endothelialjunctions (inner blood retinal barrier) areimpermeable to fluorescein leakage. The outerretina is the primary interstitial space of theretina, where edematous fluid, deep hemorrhagesand hard exudate accumulate, is nourished bythe underlying choroidal circulation. Normallythis layer does not have fluorescein because theretinal pigment epithelium (RPE) tight junctions(outer blood retinal barrier) prevent the leakingfluorescein from the choroid to reach the retina.
The larger choroidal vessels do not leakfluorescein but the choriocapillaris show

187Fluorescein Angiography
fluorescein leakage. Fluorescein freely permeatesthrough the Bruch’s membrane up to the RPE.The RPE blocks to a great degree the visualizationof the choroidal fluorescence. The watershed zonerefers to the vertical zone of slightly delayed fillingchoriocapillaris passing through the papillo-macular region and/or the disk, which representsthe border area between the two main posteriorciliary arteries. The choriocapillaris by virtue ofits lobular arrangement has a patchy filling,gradually filling in a transverse fashion withone lobule spilling over into another.
The foveal avascular zone (FAZ) representsthe area of the macula devoid of any retinalcapillaries and measures about 400-500 micronsin diameter. Because most of the optic disk isfed by the ciliary system, fluorescein appearssimultaneously at the optic nerve head andthe choroid before it is apparent in the retinalarteries.
Normal Fundus FluoresceinAngiography
Fluorescein angiography is basically a serialstudy of the vascular pattern of the retina andthe choroid at specific time intervals. Prior todye injection, one or two photographs shouldbe taken of each eye to test the technical quality.Any evidence of fluorescence that appears onthe film at this stage in a normal eye is due tosuboptimal matching of filters (pseudofluo-rescence).
The first appearance of fluorescein in the eyedepends on the arm to retina circulation time,which is approximately 10 to 12 seconds in youngpatients and 12 to 15 seconds in older patients.The circulation time is greater in the presenceof any disease that affects the myocardium andlarge vessels, causing congestion in the pulmo-nary and systemic circulation or obstruction inthe vascular system.
Phases
Fluorescein angiogram consists of five phasesaccording to the appearance of dye in the retinalcirculation.
1. The prearterial phase: The choroidal largervessels and choriocapillaris begin to fill withdye. Fluorescein usually appears approximatelyone second before in the choroidal circulationas compared to the retinal circulation. Earlychoroidal fluorescence is faint, patchy andirregularly scattered throughout the posteriorfundus. It is interspersed with scattered islandsof delayed fluorescein filling. This early phaseis referred to as the choroidal flush. Whenadjacent areas of choroidal filling and non-fillingare quite distinct, the pattern is designated aspatchy choroidal filling (Fig. 12.4).
Within the next 10 seconds due to extremechoroidal fluorescence, the angiogram becomesvery bright. The macula does not show choroidalfluorescence because of the taller, more pigmentedpigment epithelium present in the fovea and,therefore, remains dark throughout the angio-gram.
If a cilioretinal artery is present, it fills atthe same time as choroidal circulation and even
Fig. 12.4: Prearterial phase of angiogram showingpresence of cilioretinal artery (arrow)

188 Diagnostic Procedures in Ophthalmology
before the central retinal artery fills up withfluorescein (Fig. 12. 4). The central retinal arterybegins to fill about 1 to 3 seconds after choroidalfluorescence or approximately 10 to 15 secondsafter injection. The less dense the concentrationof pigment in the pigment epithelium, the greaterthe time will be between the visibility of choroidalfluorescence and the filling of the retinal vessels.
2. The arteriovenous phase: The arterial phaseof the angiogram occurs at 12 to 15 seconds afterinjection of the dye (Fig. 12.5). This is followedby the arteriovenous phase a few seconds laterand is characterized by complete filling of thearteries and capillaries and the first evidenceof laminar flow in the veins (Fig. 12.6). Thevascular flow/ blood stream is faster in the centerof the lumen than on the sides and so the unboundfluorescein appears to stick to the side creatingthe laminar pattern of venous flow. The darkcentral lamina is non-fluorescent blood that comesfrom the periphery, which takes longer tofluoresce because of its more distant origin.
3. The venous phase: This begins as the arteriesare emptying and the veins are filled with dye.In the next 5 to 10 seconds fluorescence of the
two parallel laminae along the wall of the retinalveins becomes thicker. At the junction of twoveins, the inner lamina of each vein may merge.This creates three laminae, one in the center andone on either side of the veins. As fluoresceinfilling increases in the veins, the laminaeeventually enlarge and meet, resulting in completefluorescence of the retinal veins (Fig. 12.7)
Fig. 12.7: Venous phase of the angiogram showingboth veins and arteries filled with dye
Fluorescence of the disk emanates from theposterior ciliary vascular system, both from the
Fig. 12.5: Arterial phase showing the dye filling the arteries, background choroidal fluorescence is also seen
Fig.12.6: Early venous phase of the angiogramshowing laminar flow of the dye

189Fluorescein Angiography
edge of the disk and from the tissue betweenthe center and circumference of the disk. Fillingalso comes from the capillaries of the centralretinal artery on the surface of the disk. Becausehealthy disk contains many capillaries, the diskbecomes fairly hyperfluorescent on the angio-gram.
The perifoveal capillary net cannot alwaysbe seen on the fluorescein angiogram. It can bebest seen in young patients with clear ocularmedia about 20 to 25 seconds after a rapidfluorescein injection (Fig. 12.8). This is calledthe ‘peak’ phase of the fluorescein angiogram.
Loss of portions of the perifoveal capillarynet is believed to be responsible for the decreasein visual acuity in patients with macular disease,diabetic maculopathy and other conditions. Theperifoveal net is an important landmark whenconsidering laser therapy.
Fig. 12.8: Peak phase of the angiogram showing thefoveal avascular zone and the perifoveal vascular netin the patients with diabetic retinopathy and choroidalneovascularization in the macular area
4. Transit phase: The aggregate of the arterial,arteriovenous and venous phases is commonlyreferred to as the transit phase of the angiogram.The transit phase represents the first completepassage of fluorescein in blood through the retinaand choroid. At the end of the transit phasefluorescein remains in the choroid and scleradue to leakage from the choroidal vessels andchoriocapillaris. The transit time is shortest in
the region of the macula and longest in the moreperipheral portions of the retina.
Approximately 30 seconds after injection, thefirst high concentration flush of fluoresceinbegins to empty from the choroidal and retinalcirculations.
5. Recirculation phase: During this phasefluorescein at a lower concentration continuesto pass through the circulation of the fundus(Fig. 12.9). About 3 to 5 minutes after injection,the choroidal and retinal vasculature slowlyempties the fluorescein and the vessels becomegray. Vessels of most normal patients almostcompletely empty fluorescein in approximately10 minutes.
Fig. 12.9: Recirculation phase of the angiogram showingdecreased fluorescence in the retinal vessels
The large choroidal vessels and retinalvessels do not leak fluorescein. The extravasatedfluorescein from the choriocapillaris diffusesthrough the choroidal tissue, Bruch’s membraneand sclera. Leakage of fluorescein with retentionof the dye in tissues is designated as staining.In the later phase of the angiogram, staining ofBruch’s membrane, choroid and especially scleramay be visible if the pigment epithelium is lightlypigmented. Fluorescein also leaks from the vesselsof the ciliary body, so that in the venous and

190 Diagnostic Procedures in Ophthalmology
recirculation phases of the angiogram,fluorescein appears in the aqueous and vitreous.Excitation of fluorescein in the vitreous duringthis phase of the angiogram illuminates theinterior of the eye, producing pseudofluorescenceof any white or highly colored structures withinthe eye, such as myelinated nerve fibers and scars.
In certain conditions such as diabetes orinflammatory conditions of the retina andvitreous, the accumulation of fluorescein in thevitreous is greater than normal due to a break-down of the blood-retinal barrier resulting invitreous haze and poor visibility of retinalstructures. In some diabetic patients, it may benecessary to wait for several days for fluoresceinto clear from the vitreous to obtain a goodsubsequent study.
Abnormal Fluorescence Angiography1,5-7
The abnormal fluorescence is primarily of twotypes: hypofluorescence and hyperfluorescence.Hypofluorescence is a reduction or absence ofnormal fluorescence, whereas hyperfluorescenceis abnormally excessive fluorescence.
Hypofluorescence
Hypofluorescence1,5 is an abnormally dark areaon the positive print of an angiogram. There aretwo causes of hypofluorescence namely blockedfluorescence and vascular filling defect.
Hypofluorescence
• Blocked fluorescence• Vascular filling defect
Blocked Fluorescence
Blocked fluorescence1,5 is also called as masked,obscured or negative fluorescence or transmis-
sion decrease. It indicates a reduction or absenceof normal retinal or choroidal fluorescencebecause of a tissue or fluid barrier located anteriorto the respective retinal or choroidal circulation.
To differentiate blocked fluorescence from avascular filling defect, the hypofluorescence onthe angiogram must be correlated with theophthalmoscopic view. If material is seenophthalmoscopically that corresponds in size,shape and location to the hypofluorescent areaon the angiogram then blocked fluorescence ispresent. If there is no corresponding material,then it is probably due to a vascular filling defectand fluorescein has not perfused the vessels.Moreover, vascular filling defects have a patternthat follows the anatomical distribution of thevessels involved.
Blocked retinal fluorescence
Any opacification in front of the retinal vesselinvolving the cornea, anterior chamber, iris, lens,vitreous or the most anterior portion of the retinaor disk will reduce fluorescence. The vitreousopacification is often caused by vitreoushemorrhage. Other causes like asteroid hyalosis,inflammatory debris, vitreous membranes oropacification secondary to amyloidosis mayprevent visualization of fundus details.
The precapillary arterioles and large retinalvessels are located in the nerve fiber layer andthe capillaries are located deeper in the innernuclear layer. When material lies in front of thenerve fiber layer it will block both planes of retinalvessels. When material lies beneath the nervefiber layer or within or in front of the inner nuclearlayer it will block only the retinal capillariesleaving the large retinal vessels unobstructed.If a blocking material lies deeper than the retinalvascular structures, deep to the inner nuclearlayer, it will not block the vessels but will blockthe choroidal vascular fluorescence.
The most common cause of blocked retinalvascular fluorescence is retinal hemorrhage

191Fluorescein Angiography
(Fig. 12.10). Nerve fiber layer hemorrhage, whichis usually flame-shaped, blocks the smaller retinalvessels lying deeper in the retina but onlypartially blocks the larger retinal vessels in thenerve fiber layer.5
Blocked retinal fluorescence
• Anterior segment material• Vitreous material• Inner retinal material
Blocked choroidal fluorescence
Blocked choroidal fluorescence occurs when fluid,exudate, scar or hemorrhage lie deep to the retinaand in front of the choroidal vasculature.
i. Deep retinal material
Fluid, hard exudate, hemorrhage and pigment canblock the choroidal fluorescence. Deposition ofedema fluid usually occurs in the outer plexiformlayer. When it reaches a certain volume it tends toform spaces between compressed nerve fibers andMüller’s fibers causing cystoid retinal edema.Retinal edema blocks choroidal fluorescence in theearly phase of the angiogram but later it fluoresces.1
ii. Subretinal material
Blood under the retina will cause completeblockage of choroidal fluorescence with theretinal fluorescence showing normally.Subretinal hemorrhage has irregular margins
Figs 12.10A to C: A Fundus photograph shows a subhyaloid hemorrhage (black arrow), B Mid AV phase showsblocked retinal and choroidal fluorescence corresponding to the hemorrhage and an area of capillary non-perfusion(white arrow), C Late venous phase shows the persistence of capillary non-perfusion (white arrow)
Note the disc hyperfluorescence has increased denoting a NVD

192 Diagnostic Procedures in Ophthalmology
Figs 12.11A and B: Geographical helicoid pigment epitheliopathy (GHPC) resolved lesion withpigmentation. A Shows the scar tissue with pigmentation (black arrow), B Shows the late phaseof the angiogram with hypofluorescence corresponding to the pigmentation and hyperfluorescence(staining) of the scar (black arrow)
(between photoreceptors and pigmentepithelium) whereas sub-pigment epithelialhemorrhage is often round and well demarcated.Accumulated pigments (Fig. 12.11), like melaninfrom diseased retinal pigment epithelium canalso cause blocked choroidal fluorescence.1
Blocked choroidal fluorescence
• Deep retinal material• Subretinal material• Sub-RPE material• Choroidal material
Vascular Filling Defect
Vascular filling defect results from vascularobstruction, atrophy or absence of vessels. Theretinal disk or choroidal vessels may be involved.A vascular filling defect of the disk can be easilymade out. The absence of retinal vessels is alsoreadily apparent. If the retinal vessels are visible,the hypofluorescence must be choroidal in origin.Stereoscopic photography can help in differen-tiating the plane of involvement.4
Retinal vascular filling defects
Retinal vascular filling defects are mostcommonly associated with diabetes andatherosclerosis (Fig. 12.12). In the fluorescein
angiogram the retinal arteries fill first, then theretinal capillary bed followed by the retinal veins,and, therefore, it is easy to differentiate arterialand venous occlusion. Also the blocked vesselcan usually be traced in the angiogram.1
Vascular filling defects of the disk
The capillaries on the disk may not fill due tocongenital absence of disk tissue, atrophy of disktissue and its vasculature, or because of vascularocclusion (Fig. 12.13). All these conditions showearly hypofluorescence with late hyperfluore-scence resulting from staining of the involvedtissue.
Choroidal vascular filling defect
This is usually caused by obstruction of tissueand has the following characteristics:1. Normal retinal vascular flow2. Depigmentation of the pigment epithelium3. Reduction of choroidal blood flow, and4. Hypofluorescence in the early phases caused
by loss of the normal ground glass chorio-capillaris fluorescence.The most common form of choroidal vascular
filling defect has been termed patchy choroidalfilling. Areas adjacent to the foci that are fillingshow early hypofluorescence but eventually fillnormally usually 2 to 5 seconds later.
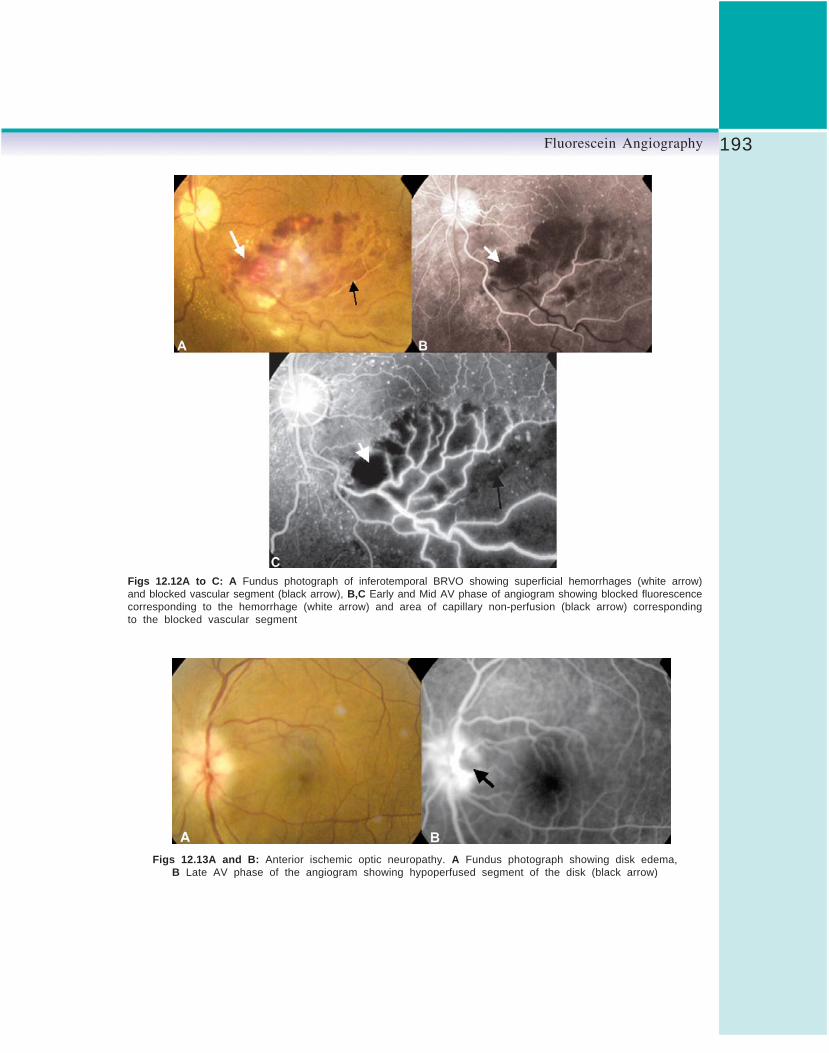
193Fluorescein Angiography
Figs 12.12A to C: A Fundus photograph of inferotemporal BRVO showing superficial hemorrhages (white arrow)and blocked vascular segment (black arrow), B,C Early and Mid AV phase of angiogram showing blocked fluorescencecorresponding to the hemorrhage (white arrow) and area of capillary non-perfusion (black arrow) correspondingto the blocked vascular segment
Figs 12.13A and B: Anterior ischemic optic neuropathy. A Fundus photograph showing disk edema,B Late AV phase of the angiogram showing hypoperfused segment of the disk (black arrow)

194 Diagnostic Procedures in Ophthalmology
Hyperfluorescence
They are abnormally white areas on the positiveprint of an angiogram. The common possiblecauses are:1. Pre-injection fluorescence2. Transmitted fluorescence3. Abnormal vessels4. Leakage
Pre-injection fluorescence1
Each angiogram should have one fundus photowith the filters on and before fluorescein isinjected. This is called the control or pre-injectionfluorescein photograph. Normally it is comp-letely dark.
Autofluorescence: It is the emission offluorescent light from ocular structures in theabsence of sodium fluorescein. It occurs withoptic disk drusen (Fig. 12.14) and astrocytichamartoma.
Pseudofluorescence: It occurs when the blueexciter and green barrier filters overlap. The greenfilter usually allows the passage of green lightand the blue filter allows the passage of blue
Figs 12.14A to C: A Optic nerve head drusen, B Autofluorescence of the drusen is seenin the pre-injection phase of the angiogram, C FFA shows normal optic nerve head
PCA—Posterior ciliary artery

195Fluorescein Angiography
light only. This light reflected off highly reflectivesurfaces passes through these mismatched filtersand stimulates the film. Any light colored orwhite fundus structure like sclera, exudate, scartissue, myelinated nerve fibers, foreign body canthus cause pseudofluorescence.
Transmitted Fluorescence (Pigmentepithelial window defect)
It occurs because of the absence of pigment inthe pigment epithelium leading to accentuationof the visibility of the normal choroidalfluorescence. (Fig. 12.15). It has the followingcharacteristics:1
1. Appears early along with choroidal filling2. Increases in intensity as dye concentration
increases in the choroid3. Does not increase during the later phases
of angiography4. Tends to fade as the choroid empties the dye
at the end of angiography.
Abnormal Vessels
Abnormal retinal and disk vessels
They can be divided into following categories:1. Tortuosity and dilatation
2. Anastomosis3. Neovascularization (Fig. 12.16)4. Aneurysms5. Telangiectatic vessels6. Tumor vessels.
All these changes can be viewed in the earlyphases and usually appear as hyperfluorescence.
Abnormal choroidal vesselsIt can occur with subretinal neovascularizationand vessels within a choroidal tumor. Insubretinal neovascularization early phases showa lacy, irregular and nodular hyperfluorescence.With a choroidal tumor it is also early vasculartype fluorescence although it may increase inthe later phases.4
Leak
The fluorescence of the retinal and choroidalvessels diminishes about 40 to 60 seconds afterinjection and empties almost completely about15 minutes after injection. Any fluorescence thatremains after the retinal and choroidal vesselshave emptied is leakage.
Certain forms of leakage occur in the normaleye. They are:1. Fluorescence of the disk margins from the
surrounding choriocapillaris
Figs 12.15.A and B: Pigment epithelium defect (PED). A Fundus photograph showing PED (white arrow) and afoci of RPE atrophy (black arrow), B Late phase of the angiogram showing the corresponding well-defined hyperfluorescentlesions

196 Diagnostic Procedures in Ophthalmology
Figs 12.16A to C: Proliferative diabetic retinopathy (PDR). A Fundus photograph showing NVD, B Late AV phaseof the angiogram showing hyperfluorescence of the disk (black arrow), C Late venous phase showing increaseddisk hyperfluorescence (Leak–black arrow)
2. Fluorescence of the lamina cribrosa3. Fluorescence of the sclera at the disk margin
if the retinal pigment epithelium terminatesaway from the disk
4. Fluorescence of the sclera when the pigmentepithelium is lightly pigmented.1
Vitreous leak
Vitreous leak is caused by:1. Neovascularization growing from the retinal
vessels onto the surface of the retina or diskor vitreous cavity
2. Intraocular inflammation3. Intraocular tumors.
The vitreous leak due to neovascularizationis usually localized and appears as a cotton balltype of fluorescence, and following inflammation,
the leak is usually generalized. If secondary totumors it is most often localized over the tumor.1
Disk edema
In the early phases, dilation of the capillarieson the optic nerve head may be seen and in thelate phases, the dilated vessel leak resulting infuzzy fluorescence of the disk margin.
Retinal leak
When the leakage is severe, the extracellularfluid may flow into cystic pockets and theangiogram shows fluorescence of the cysticspaces. Cystoid retinal edema is apparent as thefluorescein pools in small loculated pockets (Fig.12.17). In the fovea it takes on a stellateappearance, elsewhere it has a honeycombedappearance. Fluorescent staining of non-cystoid

197Fluorescein Angiography
edema is diffuse, irregular and not confined towell demarcate spaces. Sometimes the largeretinal vessels can also leak. This is called perivas-cular staining and is seen in inflammation,traction and occlusion.1
Choroidal leak
It can appear as pooling or staining. Poolingis leakage of fluorescein into a distinct anatomicspace, staining is leakage of fluorescein diffusedinto tissue. There are specific differences betweenthe fluorescent pooling patterns of sensory andpigment epithelial detachment. In a sensory
retinal detachment the pooling tends to fade awaygradually toward the site where the sensory retinais attached (Fig. 12.18). In contrast in a pigmentepithelial detachment the pooling extends to theedges making the entire detachment and itsmargins hyperfluorescent.3
Staining refers to leakage of fluorescein intoa tissue or material. The most common form ofstaining occurs with drusen. Drusens hyperfluo-resce early in the angiogram since choroidalfluorescence is transmitted through defects inthe pigment epithelium overlying them. However,
Figs 12.17A and B: A A case of ruptured macroaneurysm with a ring of hard exudates and edema (whitearrow), B FFA- late AV phase showing macroaneurysm (black arrow) and edema as a diffuse hyperfluorescence(white arrow)
Figs 12.18A and B: Central serous retinopathy. A Fundus photograph shows the serous collection involvingthe macula, B Late phase of the angiogram shows the site of leak, smoke stack appearance and poolingof the dye (white arrow)

198 Diagnostic Procedures in Ophthalmology
Figs 12.19A and B: Disciform scar of Age-related macular degeneration (AMD). A Fundus photograph showingthe macular scar with pigmentation (white arrow), B Late phase of the angiogram showing staining of the scartissue (white arrow)
some of the drusens remain hyperfluorent evenin the late phases of angiogram due to staining.
Scars also demonstrate staining- hyperfluo-rescence (Fig. 12.19). Sclera usually exhibits latehyperfluorescent staining1.
Iris Fluorescein AngiographyThe vasculature of the iris can be examined byfocusing a retinal fundus camera directly on theiris. This technique is useful in patients withsuspected neovascularization (rubeosis iridis),iris ischemia or iris and ciliary body tumors.Normal iris blood vessels leak fluorescein slightlyand are characteristically straight in configu-ration, with anastomotic connections betweenthe vessels near the iris root and those at the
collarette. In abnormal conditions such asrubeosis, leakage of fluorescein dye from theabnormal vessels is extensive. This leakageoccurs early in the angiogram.2
Iris NeovascularizationIn rubeosis iridis an abnormal growth of newblood vessels occurs on the surface of the iris.Only vessels on the anterior surface are clearlydetected. However, if leakage of fluorescein dyefrom behind the iris is considerable, posteriorsurface vessels should be suspected.
Abnormal new vessels have an irregulardistribution across the iris surface, with atendency to concentrate at the pupillary borderand at the chamber angle. Normal iris vesselsfollow a fairly straight pattern from the iris rootto the pupillary border. Some anastomoticconnections exist between the vessels at the irisroot and the vessels at the collarette. Leakageof fluorescein occurs from the abnormal vesselsin the early phase of the angiogram.2
References1. Ryan SJ, Schachat AP (Eds). Retina. St Louis,
Mosby-Year Book Inc, 2001;875-942.

199Fluorescein Angiography
2. Joseph WB, Robert WF, David HO, James SK.Fluorescein and indocyanine green angiography—Technique and interpretation. American Academyof Ophthalmology, San Francisco, 1997.
3. Stein MR, Parker CW. Reactions followingintravenous fluorescein. Am J Ophthalmol 1971;72: 861-68.
4. Yannuzzi LA, Rohrer MA, Tindel LJ, et al.Fluorescein angiography complication survey.Ophthalmology 1986;93:611-17.
5. Rabb MF, Burton TC, Schatz H, Yannuzzi LA.Fluorescein angiography of the fundus: asystematic approach to interpretation. SurvOphthalmol 1978;22:387-403.
6. Schatz H. Flow chart for the interpretation offluorescein angiograms. Arch Ophthalmol1978;10:625.
7. Schatz H. Essential fluorescein angiography –A compendium of 100 classic cases. San Ansalmo,Pacific Medical Press, 1985.

200 Diagnostic Procedures in Ophthalmology
VASUMATHY VEDANTHAM
Indocyanine GreenAngiography13
Indocyanine green (ICG) angiography (ICGA) isfast emerging as a popular and useful adjunctto the traditional fundus fluorescein angiography(FFA) in the diagnosis of macular, choroidal andouter retinal disorders. This technique wasintroduced in ophthalmology in 1973 by Flowerand Hochheimer.1 FDA approved the ophthalmicuse of ICG dye in 1975. Yet, for the next twentyyears the ICGA remained largely unpopularowing mainly to technical difficulties. With theadvent of videoangiogram recordings and therecognition of its potential in delineating occultchoroidal neovascular membranes, the clinicaluse of ICGA has increased tremendously.
Indocyanine Green Angiography vsFluorescein AngiographyThe visualization of the choroidal circulationis better with ICGA due to two reasons. Firstly,the ICG molecules are not as rapidly extravasatedfrom the choroidal circulation as those of fluores-cein. Secondly, the near-infrared wavelengths oflight that excite and are emitted by ICG dyepenetrate the pigmented ocular structures, hazymedia and small pupils much more readily thanthe light of visible wavelengths associated with
fluorescein dye. The excitation and fluorescenceof the blue-green wavelengths of FFA areabsorbed and scattered by the pigments in thefundus including macular xanthophyll. Thesefactors result in a much better visualization ofthe choroidal circulation and its dynamics withICGA than FFA. However, adequate mydriasisis essential as, its fluorescence efficiency is quitepoor in comparison to fluorescein which requiresa larger quantity of light to be transmitted foradequate resolution.
Indocyanine Green
The indocyanine green (ICG) is a tricarbocyaninedye that comes packaged as a sterile lyophilizedpowder and is supplied with an aqueous solvent.It was first used in 1957 to measure cardiacoutput. It is an anhydrous 3,3,3’,3’-tetramethyl-1,1’-di-(4-sulfobutyl)-4,5,4’ ,5’-dibenzo-indotricarbocyanine hydroxide sodium salt. Itsempirical formula is C43H47N2O6S2Na. It containsless than 5% sodium iodide (in order to increaseits solubility). It has a pH of 5.5 to 6.5 in thedissolved state, and also has limited stability,and hence must be used within 10 hoursafter reconstitution. Ninety eight percent of theinjected dye is bound to plasma proteins, with

201Indocyanine Green Angiography
80% being bound to globulins, especially alpha-1 lipoproteins.2 The dye is secreted unchangedby the liver into the bile.3 There is no renalexcretion of the dye and it does not cross theplacenta. The dye also has a high affinity forvascular endothelium, and hence persists in thelarge choroidal veins, long after injection.
ICG absorbs as well as emits (fluoresces) lightin the near-infrared region of the spectrum. Thepeak absorption after injection is at around 805nm and peak emission is around 835 nm. It alsoexhibits a phenomenon referred to as concentra-tion quenching. After a period of increasingfluorescence with increasing serum concentra-tion, that results in peak fluorescence, furtherincrease in concentration, paradoxically leadsto decreased fluorescence. This is referred to asquenching and is thought to result from dimerformation.
Adverse Reactions
The rate of mild, moderate and severe reactionsto ICG dye is 0.15%, 0.2% and 0.05%,respectively.4 The reported death rate followingICGA is 1 in 333,333 (in contrast to 1 in 222,000following FFA).5 Owing to its iodine content, ithas to be used cautiously in patients with knownallergy to iodine containing substances such asshell fish. ICGA is contraindicated in patientswith history of severe allergies, uremia and liverdisease. In fact, persistence of the ICG dye inthe retino-choroidal circulation of the eye for morethan 30 minutes in the late phase of the angiogramshould prompt the search for hepatic dysfunction.
The ICG should also be avoided in pregnancydue to lack of human toxicity data in this area.No more than 5 mg per Kg of body weight ofICG dye should be used for safety purposes.Extravasation of the dye causes a painlessgreenish-blue stain that migrates from theinjection-site to the elbow, which often disappearsin a week. Removal of the injection needle before
all the dye has been injected will produce atransient dye-stained needle track.
Low- and High-speed Angiography
Two types of fundus camera systems are usedfor ICGA. The first type is based on the imagingoptics of the Zeiss fundus camera, but utilizesa digital charge coupled device (CCD) or a vidiconvideo camera for recording of images. The highresolution CCD camera contains light sensitiveelements (pixels) that are analog to the silverbase of the photographic film of a traditionalcamera. Opening of a built-in electromechanicalshutter exposes these pixels to light. The camerathen converts this analogous signal into a digitalone and sends it to the computer for storage orimmediate viewing. The camera employs filteredlight from either a xenon flash lamp or quartzhalogen lamps. As is true for most of the funduscameras, the optics are optimized for a field of50 degrees, which allows maximum field,maximum light entry with minimum of noisewhich in turn increases the image contrast.Despite a very good spatial resolution, thetemporal resolution is only several images persecond (low-speed angiography). Hence the latephases are captured in good detail. The earlychoroidal arterial filing, especially in youngersubjects with fast blood flow, can be completelymissed using such systems. Another disadvan-tage associated with CCD systems is the image“blooming” or “blow-out” which is a CCD cameraphotographic artifact. It results when the amountof imaging light exceeds a system’s capacityresulting in saturation of the CCD’s pixels, whichin turn overflows to the surrounding pixels. Thisappears as overexposure of the hyperreflectivesurfaces such as optic nerve head, drusen, andexudates. Large overlapping vessels, large scars,melanomas, etc. may be associated withblooming. It can be corrected by reducing theflash intensity.

202 Diagnostic Procedures in Ophthalmology
The second type is based on the optics ofthe scanning laser ophthalmoscope (SLO). Itemploys light from continuous, low-power laserdiodes. Since only a lower amount of peak retinalirradiance can be delivered safely usingcontinuous light sources, SLO systems are lesssensitive to small amounts of ICG dye and,therefore, for the imaging of the late fluorescencewhen compared to CCD systems. Their resolutionis of the order of 512 pixels, in contrast to the1024 pixels of the traditional systems. Theirtemporal resolution, however, is of the order of20 to 30 images per second (high-speedangiography). Hence SLO systems recordchoroidal dye transit better than CCD basedsystems. The images also have a greater contrastowing to the confocal imaging system in whichscattered light is eliminated from the opticalpathway. This is also the reason why the unfilledretinal vessels are easily seen as dark imagessilhouetted against the background fluorescence.These systems are also more comfortable to thepatient since less stimulating light required toacquire images. The newer versions also allowfor simultaneous FFA and ICGA. Disadvantagesof the SLO system are their limited field of view(only 30 degrees), hence imaging of peripheralpathology is difficult and there is also a reductionin the landmarks available for image overlayand laser treatment.
Procedure of IndocyanineAngiography
The patient is seated comfortably in front of thefundus camera, with an extended forearm fordye injection. Red-free and near-infrared reflectedlight images (with ICG excitation light on andbarrier filter removed) are obtained prior toinjection. The former image demonstrates thelandmark retinal vessels well. The latter imagedemonstrates the light-transmission irregulari-ties in the retinal and choroidal tissues and
helps to differentiate between hypo- andhyperfluorescent areas due to irregularities inblood flow. This technique of Red (green-free)photography is referred to as “poor man’s ICG”and is tried when there is a contraindicationto ICG. This is achieved using a band pass filtercentered at 640 nm. Pseudofluorescence is alsochecked for prior to injection, with the excitatorand barrier filters in place. Areas such asdehemoglobinized blood that reflect the incidentlight are associated with pseudofluorescence. Inthe late stages of ICGA study, where the cameragain and flash are at the maximum, such areaswould appear highly hyperfluorescent.
As the dye is diluted 600 times in the systemiccirculation before entering the choroidalcirculation, a dye concentration of 0.03 mg/mlis required for maximal fluorescence. The totalamount of dye injected varies from 25 to 50 mgin 2 to 4 ml of aqueous solvent, with smaller-volume higher concentrations (1 ml bolus of 15to 20 mg/ml injection, followed by a 5-ml salineflush) being used for high-speed angiography.5
For patients with poor dilatation or dark fundi,50 mg in 3 ml of aqueous solvent would beoptimal.
The timing of photography is determined byarm to retina time (approximately 10 in youngand 12-18 seconds in older patients) since thefundus cannot be observed. 6 The flash and gainare set at the maximum, at 300 watt secondsand +24dB respectively. To capture the earliestphases, photographs should be taken even beforefluorescence is evident on the alignment monitor.When the first images of the choroidal or retinalfilling phases are seen clearly, the gain shouldbe progressively lowered with each subsequentphotograph. Images are obtained at intervals ofseveral seconds in low-speed angiographysystems until maximum hyperfluorescence of theretinal and choroidal circulations are reachedafter which images are taken at 30 to 60 secondintervals for the first few minutes, for the early

203Indocyanine Green Angiography
phase. Later images are taken between 8 and12 minutes for the middle phase and between18 and 25 minutes for the late phase. Occasionally,images obtained 30 to 40 minutes into the studyare helpful.
Advantages of ICGA over FFA
1. ICGA can be used even when the ocular mediaare too hazy for FFA. This is due to thephenomenon of Rayleigh scatter that occurswhen the scattering particles are small withrespect to incident-light wavelengths, withthe scatter intensity being greater for shorterwavelengths and hence more troublesomeduring FFA than ICGA.
2. ICG fluorescence can be imaged even in thepresence of considerable blood, due to thephenomenon of Mie or forward scatter. Itoccurs when the dimension of the scatteringparticles is nearly similar to that of thewavelength of the incident light. Due to thiseffect, the 800 nm light used in ICGA allowsthe visualization of large blood vessels hiddenbehind hemorrhages.
3. The peak absorption of ICG coincides withthe emission spectrum of diode laser, whichallows the selective ablation of chorioretinallesions using ICG dye-enhanced laser photo-coagulation wherein a target tissue contain-ing ICG is exposed to the diode laser beam.
4. Infrared light appears as barely visible redlight to the patients, and, therefore,photophobic patients tolerate ICGA betterthan FFA.
5. ICGA accurately measures the size of an occultchoroidal neovascular membrane (CNVM)when compared to FFA that might over orunderestimate it. On FFA, the occult CNVMmay appear larger due to leakage into pigmentepithelial or neurosensory detachments orartificially smaller due to blocked fluorescencefrom adjacent exudates or blood.
Limitations of ICGA
1. The choriocapillaris cannot be imagedseparately with ICGA since their averagecross-sectional diameter (21 μm) is muchsmaller than that of their feeding and drainingvessels, and hence the fluorescence of theformer cannot be differentiated from thatarising from the latter. The edge of onecapillary vessel too, cannot be distinguishedfrom that of an adjacent one since theintercapillary spaces are on an average only5 to 7 μm, which is below the limit ofresolution of ICGA.
2. The phenomenon of Mie scatter also masksthe unfilled retinal vessels that cannot bevisualized well in low speed angiographysystems.
3. Bright areas do not necessarily signify dyeleakage due to the phenomenon of additivefluorescence which the fluorescence increaseslinearly with increase in vascular thicknessuntil an aggregate thickness of 50 μm isreached, when a plateau is reached and nofurther increase in brightness occurs. Miescatter contributes to this additive fluores-cence by making the bright area fuzzy andapparently larger.
4. ICGA is poorer than FFA in the imaging ofclassic CNVM since the early hyperfluores-cence of the CNVM is overwhelmed by theintense background choroidal filling.Moreover, since the affinity of the ICG dyeto the serum proteins is considerably greaterthan fluorescein, the leakage of the formerfrom the classic CNVM is lesser than thatof the latter even in the late phases.
5. Although superior to FFA in the imaging ofoccult CNVM, ICGA may underestimate thesize of the CNVM, when there is little dyeleakage. It is, therefore, imperative to viewthe films as late as 30 to 40 minutes afterinjection.

204 Diagnostic Procedures in Ophthalmology
Normal Phases of ICGA
Depending on time the ICG filling of the posteriorpole choroid follows the following phases:7
During First 2 Seconds (Prearterialand Arterial Phases)
1. Choroidal arteries fill rapidly, usually in theperipapillary area (nasal to the fovea, sincethis region is the area of highest bloodperfusion pressure in the eye) first and thenradiate to the periphery (prearterial phase).The entire posterior pole appears as a uniformnetwork of arterial vessels. Distinct areas ofdelayed filling can be seen at times corres-ponding to the watershed zones describedby Hayreh.8 The period beginning with thedye injection to the first appearance of thedye in the choroidal arteries is referred to asthe prearterial phase. Interarterial anasto-moses, although common cannot be imagedby ICGA.
2. Rapid filling of the choriocapillaris occursand is complete within 2 seconds after entryof the ICG dye into the eye. The choriocapil-laris filling pattern produces faint and diffusefluorescence that prevents the visualizationof the deeper choroidal layers.
3. Concomitant with choriocapillaris filling, thechoroidal veins begin to fill. The arterial phaserefers to the period from early filling of thechoroidal arteries to the first appearance ofthe dye in the choroidal veins. The mean timetaken for this is 1.8 seconds.
4. In SLO angiograms, the major retinal vesselsremain dark, blocking the underlyingchoroidal fluorescence.
Between 2 and 5 Seconds(Arteriovenous phases)
1. The fluorescence from the choroidal arteriesbegins to fade, while that of the choroidal
veins increases, making them moreprominent. Arteriovenous phase refers to theperiod from the late arterial phase to the pointwhen the veins are beginning to fill.
2. The areas of delayed filling get filled up.3. The retinal arteries begin to fill up.
Between 5 Seconds and Several Minutes
There is diminishing fluorescence from thechoroidal veins and overall the choroidalvascular features become less distinct. The periodfrom the early filling of the choroidal veins totheir emptying is also referred to as venous phaseof ICG. The choroidal veins run parallel to theperiphery and eventually form the vortex veins.Venous anastomoses occur between large vessels.Laminar flow (the layered blood-flow pattern inveins caused by the slower, nonturbulentmovement of blood along the vessel wall), issometimes seen in large choroidal veins ofmyopic eyes in ICGA.
Beyond Several Minutes
1. The optik disk becomes dark.2. There is a uniform, faint dimly fluorescent
background against which the majorchoroidal and retinal vessels are seen as darkstructures.The period after the venous phase when there
is leakage or retention of dye in the choroidalor retinal tissue is referred to as the late phaseof ICGA. This phase demonstrates choroidalneovascularization best.
Images using low speed angiography withstandard 1024-line digital systems (non-SLOsystems) do not allow imaging of the earliestphases and hence for these systems, three phaseshave been described:1. Early phase (0-3 minutes): This encompasses
the period from the first appearance of thedye in the choroidal arterial circulation till

205Indocyanine Green Angiography
maximal ICG choroidal fluorescence isachieved (normally within one minute afterdye injection). The medium sized choroidalarteries and veins are well imaged along withhyperfluorescent retinal vessels (Fig. 13.1A).In this phase, choroidal fluorescencepredominates over retinal circulation sincethese vessels are larger, more numerous andlayered in three dimensions.
2. Middle phase (5-15 minutes): This is seen 6to 15 minutes after injection of the dye, where-in the hyperfluorescence of the choroidal veinsand retinal vessels diminishes (gradual dyewashout) to be replaced by a homogenousdiffuse background choroidal fluorescence,due to perfusion of the choriocapillaris (Fig.13.1B).
3. Late phase (30 to 40 minutes): This is seenbeyond 18 to 22 minutes after injection,wherein the choroidal vessels stand out inrelief (silhouettes) as relatively hypofluores-cent structures against the hyperfluorescentbackground, with a dark optic nerve head.The leakage of the dye from the chorio-capillaris into the choroidal stroma accountsfor the background fluorescence that persistsfor hours or days after a single injection ofICG dye (Fig. 13. 1C). Since there is maximalcontrast at this stage with hyperfluorescentlesions, this stage identifies CNVMs best bytheir late staining and fuzzy margins.
Applications of Indocyanine GreenAngiography
Age-related Macular Degeneration (AMD)
The occult choroidal neovascular membrane(CNVM) that occurs in AMD is better imagedby ICGA than FFA. In fact, ICGA can convertoccult CNVM (as per FFA) into well-definedclassic CNVM eligible for ICG-guided lasertreatment in 30% of cases. This is because the
Figs 13.1A to C: Show the various phases of a normalICG angiogram (ICGA). A Early phase of ICGA of theleft eye of a patient (1 minute after injection) showingwell-delineated choroidal and retinal vessels. Note thatthe hyperfluorescence of the choroidal vessels is superiorto that of the retinal vessels in this phase. B Mid phaseof ICGA of the left eye of a patient (7 minutes after injection)showing decreased hyperfluorescence of the choroidaland retinal vessels (dye washout) with homogenousbackground fluorescence. C Late phase of ICGA of theleft eye of a patient (30 minutes after injection) showinga dark optic disk and ill-defined late background choroidalhyperfluorescence. Note that the choroidal vessels standout in relief (silhouettes) as relatively hypofluorescentstructures against the hyperfluorescent background

206 Diagnostic Procedures in Ophthalmology
leakage of the ICG dye from the CNVM to thesubretinal space is slower and of a lessermagnitude than fluorescein that delineates theborders of the CNVM better.9 ICGA might thuspotentially double the number of patients treatedby laser photocoagulation. The CNVMs obscuredby blood are also better imaged due to Mie scatterby ICGA. The CNVMs that have recurred on theedge of areas treated by laser are also betterdelineated and differentiated from the scar tissueby ICGA due to better contrast. This is becausethe chorioretinal scars are hypofluorescent dueto less ICG extravasation and relative lack ofchoroidal vessels, with selective hyperfluores-cence of the CNVM. In contrast, the scars wouldstain in FFA leading to confusion between thesame and the leak from the adjacent CNVM.
Yannuzzi et al have shown that the findingof a hyperfluorescent spot on the late ICGangiogram (hot spot) can separate the neovascu-larized portion from the serous portion of apigment epithelial detachment (PED).10 The sameauthors have recognized three morphologic typesof CNVM, namely, focal spots (comprising 29%of cases), plaques (well and ill defined, comprising27% and 34% of cases respectively), andcombination lesions (with both focal spots andplaques, comprising 8% of cases).11 Focal spotsare less than 1 disk diameter in size (Figs 13.2Ato F) and are located outside the foveal vascularzone (hence they are amenable to ICG-guidedlaser photocoagulation); while plaques are largerlesions (usually more than one disk diameterin size). The plaque-like lesions are the
Figs 13.2A to F: Hot spot. A Color fundus photograph of the left eye of a patient showing a hemorrhagic detachmentof the posterior pole. B Arteriovenous (AV) phase of fundus fluorescein angiogram (FFA) of the left eye showingan area of blocked fluorescence corresponding to the hemorrhagic detachment. Also seen are multiple hyperfluorescentareas suggestive of pigment epithelial detachments (PEDs). There is no hyperfluorescence that could point towardsthe underlying choroidal neovascular membrane (CNVM). C Early phase of ICGA of the left eye showing a smallspot of intense hyperfluorescence suggestive of a hot spot (white arrowhead). D Early phase of ICGA of the lefteye showing the increasing hyperfluorescence of the hot spot (white arrowhead). E Mid phase of ICGA of theleft eye showing the increasing hyperfluorescence of the hot spot suggestive of leakage (white arrowhead). F Midphase of ICGA of the left eye showing the progressively increasing hyperfluorescence of the hot spot (white arrowhead).The area of blocked fluorescence corresponding to the hemorrhagic detachment is also obvious

207Indocyanine Green Angiography
commonest type of occult CNVMs and theycorrespond to the thick subretinal pigmentepithelial membranes (Figs 13. 3A to D). Theyare usually subfoveal in locations and henceICG-guided laser photocoagulation is not advisa-ble and either transpupillary thermotherapy(TTT) or photodynamic therapy (PDT) may betried. Combination lesions can further be dividedinto marginal spots, focal spots at the edge ofa plaque in 3% of cases (Figs 13.4A to D),
overlying spots, hot spots overlying plaques in4% of cases (Figs 13.4A to D) or remote spots(focal spots remote from a plaque of neovasculari-zation seen in 1% of cases). Interestingly, thepatients are often found to develop the samemorphologic type of CNVM in the other eye aswell.12
ICGA also reveals the retinochoroidalanastomosis (RCA) in eyes with occult CNVMalong with a vascularized pigment epithelial
Figs 13.3A to D: Plaque. A Color fundus photograph of the left eye of a patient showing a hemorrhagic PEDwith a notch (black arrowhead). Also seen are hard exudates with retinal pigment epithelial (RPE) degenerationat the fovea. B Venous phase of the FFA of the left eye showing blocked fluorescence corresponding to the hemorrhagicPED (black arrowhead). There is an ill-defined hyperfluorescence in the area of the notch (white arrow). C Midphase of ICGA of the left eye showing blocked fluorescence corresponding to the hemorrhagic PED (black arrowhead).D Late phase of ICGA of the left eye showing a well defined plaque of hyperfluorescence suggestive of CNVM(white arrowhead) along with an adjacent area of blocked fluorescence of the hemorrhagic PED (black arrowhead)

208 Diagnostic Procedures in Ophthalmology
detachment (PED). This is a variant of CNVMthat is fed by both a choroidal and retinal vascularcomponent.13 RCA is the stage III of a retinalangiomatous proliferation (RAP) whichoriginates in the inner retinal layers, progressesinto the subretinal space and becomes eventuallyassociated with new vessel growth from thechoroid. Associated features in this type of CNVMinclude pre- or intraretinal hemorrhages at thelesion site, dilated tortuous retinal vessels,sudden termination of a retinal vessel and cystoid
macular edema. Of these, intraretinal hemorrhageis considered pathognomonic of RAP. This entityhas to be distinguished from small branch retinalvein occlusions. RAP responds poorly totreatment. These lesions are difficult to be detectedon early phase of ICGA and are better imagedon the mid-late phases when there is progressiveintraretinal dye leakage (Figs 13.5A to H). Theyare best identified when they overlie a serousPED that produces a homogenous backgroundof relative hypofluorescence. FFA is poorer to
Figs 13.4A to D: Marginal and overlying hot spots. A Color fundus photograph of the right eye of a patient showingan occult CNVM with subretinal blood seen superiorly and sub-RPE blood inferiorly and overlying the fovea.B Mid phase ICGA of the right eye showing the blocked fluorescence due to subretinal and sub-RPE blood witha vague central hyperfluorescence. C Late phase ICGA of the right eye showing blocked fluorescence (black arrow)and central hyperfluorescence (white arrowhead). D Late phase ICGA of the right eye showing a well-defined plaque(white arrowhead) along with two hyperfluorescent hot spots (white arrows). The vertical arrow denotes the overlyinghot spot while the horizontal arrow denotes the marginal hot spot

209Indocyanine Green Angiography
ICGA in the detection of RAP lesions due toobscuration of the lesion due to progressive dyeleakage both intra and subretinally. In contrast,the RAP lesions in ICGA remain localizable toa small spot of hyperfluorescence due to lesserdye leakage till late into the study.
Polypoidal choroidal vasculopathy (PCV) thatis considered to be a variant of AMD in recentyears has a characteristic appearance on ICGA.
The characteristic lesion is a vascular bulge fromthe surface layer of the choroidal vessels, visibleas a spheroidal orange-red polyp-like structure.These lesions have a predilection to theperipapillary areas but isolated lesions in themacula or the periphery can also occur and areassociated with serosanguineous detachmentsof the neurosensory retina and the retinalpigmentary epithelium. When the leakage is
Figs 13.5A to H: Retinochoroidal anastomosis (RCA). A Color fundus photograph of the right eye of a patientshowing an occult CNVM with an inverted “C”-shaped subretinal hemorrhage (SRH). B Arterial phase of the FFAof the right eye showing blocked fluorescence corresponding to the SRH. The white arrow points to the two hyperfluorescent spots (choroidal in origin) connected to the vasculature arising from the inferior temporal artery. C Arteriovenousphase of the FFA of the right eye showing the spots to progressively increase in hyperfluorescence (white arrow).Also seen are a few hyperfluorescent spots representing RPE window defects in the papillomacular bundle. D Venousphase of the FFA of the right eye showing progressive increase in hyperfluorescence of the spots (white arrow).E Late venous phase of the FFA of the right eye showing increased hyperfluorescence of the spots suggestiveof leakage (white arrow). F Early phase of the ICGA of the right eye showing a small area of hyperfluorescenceat the choroidal level suggestive of a new vessel (white arrow). G Mid phase of the ICGA of the right eye showingthe communication of the choroidal vessel to the retinal vasculature (arising from the inferior temporal artery) (whitearrow). H Mid phase of the ICGA of the right eye showing the communication of the choroidal vessel to the retinalvasculature (arising from the inferior temporal artery) with progressively increasing hyperfluorescence (white arrow)

210 Diagnostic Procedures in Ophthalmology
predominantly serous from the polpys the entitymight be mistaken for central serouschorioretinopathy (CSCR). In the early frames,larger choroidal vessels of the PCV network areeasily identifiable, with the area around andwithin the network remaining relativelyhypofluorescent. Shortly thereafter, smallhyperfluorescent polyps, corresponding to thereddish-orange choroidal excrescences seenclinically, become visible (Figs 13.6A to D).14 Thelate phases of ICGA first show a reversal of the
fluorescence pattern (hypofluorescent core anda hyperfluorescent surrounding casement of thepolpys); and later show usually a uniformdisappearance of the dye (“washout”) from thepolyps (except when they are actively leaking),with no late staining characteristic of classic oroccult CNVM. The ring of ICG staining due toreversal of fluorescence has also been noted inretinal arterial macroaneurysms and serouspigment epithelial detachments (PEDs). Thecentral core of polyps less than 0.5 disk diameters
Figs 13.6A to D: Polypoidal choroidal vasculopathy (PCV). A Color fundus photograph of the right eye of a patientshowing the characteristic orange lesions of PCV (white arrowheads). Also seen is an area of subretinal hemorrhage(SRH) superior to the disk. B Venous phase of FFA of the right eye showing the blocked fluorescence correspondingto SRH superior to disk. Also seen are mottled hyperfluorescent areas over the macula. C Mid phase of ICGAof the right eye (10 minutes) showing multiple polyps in relation to large choroidal vessels (white arrowheads).D Mid phase of ICGA of the right eye (20 minutes) shows that the polyps (white arrowheads) are not leaking
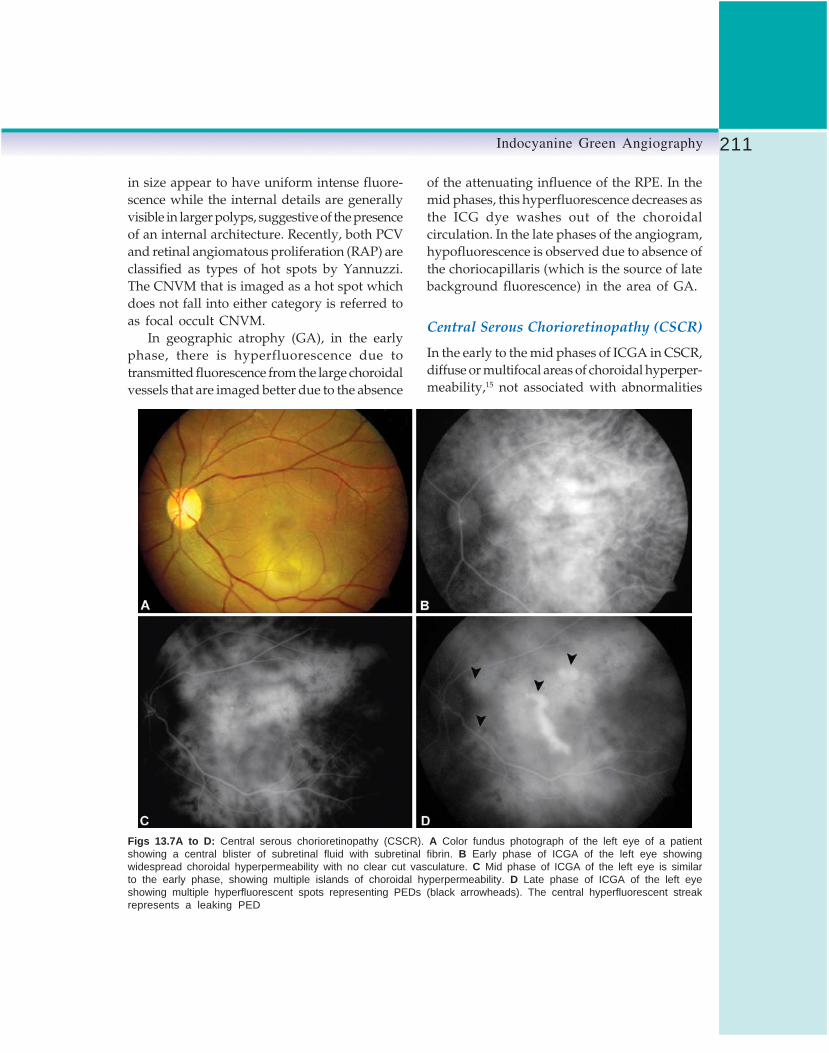
211Indocyanine Green Angiography
in size appear to have uniform intense fluore-scence while the internal details are generallyvisible in larger polyps, suggestive of the presenceof an internal architecture. Recently, both PCVand retinal angiomatous proliferation (RAP) areclassified as types of hot spots by Yannuzzi.The CNVM that is imaged as a hot spot whichdoes not fall into either category is referred toas focal occult CNVM.
In geographic atrophy (GA), in the earlyphase, there is hyperfluorescence due totransmitted fluorescence from the large choroidalvessels that are imaged better due to the absence
of the attenuating influence of the RPE. In themid phases, this hyperfluorescence decreases asthe ICG dye washes out of the choroidalcirculation. In the late phases of the angiogram,hypofluorescence is observed due to absence ofthe choriocapillaris (which is the source of latebackground fluorescence) in the area of GA.
Central Serous Chorioretinopathy (CSCR)
In the early to the mid phases of ICGA in CSCR,diffuse or multifocal areas of choroidal hyperper-meability,15 not associated with abnormalities
Figs 13.7A to D: Central serous chorioretinopathy (CSCR). A Color fundus photograph of the left eye of a patientshowing a central blister of subretinal fluid with subretinal fibrin. B Early phase of ICGA of the left eye showingwidespread choroidal hyperpermeability with no clear cut vasculature. C Mid phase of ICGA of the left eye is similarto the early phase, showing multiple islands of choroidal hyperpermeability. D Late phase of ICGA of the left eyeshowing multiple hyperfluorescent spots representing PEDs (black arrowheads). The central hyperfluorescent streakrepresents a leaking PED

212 Diagnostic Procedures in Ophthalmology
detected both clinically and by FFA, are seenin both the involved and the uninvolved eye(Figs 13.7A to D). In the late phase, there isdispersion of the fluorescence and a distinctsilhouetting of the larger choroidal vessels.Additionally, multiple occult presumed PEDswith a typical staining pattern of earlyhyperfluorescence and late hypofluorescencemay also be imaged. In elderly patients withatypical hyperfluorescence on FFA that does notrule out CNVM, the ICGA demonstration ofbilateral choroidal hyperpermeability helps torule out neovascular AMD. In contrast tofluorescein dye, the pooling of ICG dye into thesub-RPE and sub-neurosensory retinal spacedoes not occur, due to the higher protein bindingof the latter. However, when seen, it is thoughtto represent a blow-out of the PED and the Bruch’smembrane which allows the protein-dyeconjugate to leak through into the spaces.
Diabetic Retinopathy (DR)
FFA remains the gold standard in the manage-ment of DR. ICGA, however, has demonstratedirregular and delayed choroidal filling in mostof the proliferative DR cases and in up to 50%of background DR cases.6
Choroidal Inflammatory Conditions
Digital ICGA is invaluable in the diagnosis andfollow-up of patients with choroidal inflamma-tory disorders. In eyes with choroiditis, areaswith active inflammation block the choroidalfluorescence and are imaged as hypofluorescentareas that might resolve with treatment, as inserpiginous choroiditis.16 Late hyperfluorescenceis seen at sites if a CNVM has evolved. In fact,ICGA is superior to FFA in bird shot choroiditis,in defining the typical patches. Multiple hypo-fluorescent lesions radiating to the periphery,corresponding to the areas of choriocapillaris
drop-out, are observed between the choroidalveins in this condition, by ICGA. Eyes withenlarged blind spots on visual field testing canshow confluent hypofluorescence around theoptic nerve. Acute posterior multifocal placoidpigment epitheliopathy (APMPPE) lesionsremain hypofluorescent both in the initial andlate phases of ICGA, and these recover withresolution, in contrast to the initial hypofluores-cence and late hyperfluorescence in FFA. Thishypofluorescence might be due to a partialchoroidal vascular occlusion secondary toocclusive vasculitis.17 The hypofluorescentlesions are also seen beyond the areas of clinicallyobserved yellow lesions, implying that they arenot due to masking of the choriocapillaris byabnormal RPE (Figs 13. 8A to D). Additionally,the larger choroidal vessels are visualized withinthe hypofluorescent areas pointing towards thenon-perfusion of the overlying choriocapillaris.The ICGA findings have thus lent credence tothe theory of primary choriocapillaris rather thanRPE involvement in APMPPE. In resolvedAPMPPE, the hypofluorescent areas are seen tobe decreased in size or completely resolvedrepresenting areas of RPE hyperpigmentation(the hyperpigmented RPE remains transparentto the infrared wavelengths of ICGA). However,a few persistent hypofluorescent areas mightremain corresponding to RPE hypopigmentation,suggestive of persistent hypoperfusion due tochoriocapillaris damage.
In eyes with multiple evanescent white dotsyndrome (MEWDS), ICGA shows a pattern ofhypofluorescent spots seen in the mid-phase,approximately 10 minutes after injection,throughout the posterior pole and the peripheralretina. These spots persist throughout theremainder of the study. These spots appear largerthan the white spots seen clinically and morein number on ICGA.18A ring of peripapillaryhypofluorescence corresponding to the enlargedblind spot is also seen. The hypofluorescent

213Indocyanine Green Angiography
lesions and the peripapillary hypofluorescencedisappear with clinical resolution.
Choroidal Tumors
Heavily pigmented tumors such as choroidalmelanomas absorb the near-infrared light andblock ICG fluorescence. However, the tumorborders are better delineated by ICGA than FFA,which is essential in the assessment of tumorsize in response to treatment as well as in follow-
up.6 Choroidal hemangiomas, due to theirvascular channels demonstrate progressivelyincreasing hyperfluorescence on ICGA, with veryintense late hyperfluorescence.19 Choroidalmetastasis show variable characteristics on ICGAdepending on their vascularity and pigmen-tation. For instance, while metastasis of thyroidcarcinoma and metastatic bronchial carcinoidtumors are hyperfluorescent, metastasis of breastcarcinoma blocks the choroidal fluorescence ofICGA.19
Figs 13.8A to D: Acute posterior multifocal placoid pigment epitheliopathy (APMPPE). A Color fundus photographof the left eye of a patient showing yellowish white plaque like peripapillary lesions. Also seen are peripapillary concentriclines suggestive of subretinal fluid. B Venous phase of FFA of the left eye showing hyperfluorescent and hypofluorescentspots. The former are seen in the peripapillary area. C Mid phase of ICGA of the left eye (10 minutes) showingperipapillary hypofluorescent spots (white arrowheads). D Mid phase of ICGA of the left eye (20 minutes) is similarshowing persistence of the hypofluorescence of the peripapillary spots (white arrowheads)

214 Diagnostic Procedures in Ophthalmology
Miscellaneous Conditions
Reduced choriocapillaris filling has been notedin myopia with ICGA.6 ICGA is superior to FFAin the detection of lacquer cracks in the maculararea, especially those obscured by the overlyingsubretinal hemorrhage. These appear ashypofluorescent streaks first discernable in themid and more evident in the late phases. Incontrast, lacquer cracks appear hyperfluorescenton FFA. For the same reason, ICGA is alsosuperior to FFA in detecting CNVMs close tolacquer cracks and atrophic areas as only theformer are hyperfluorescent on ICGA.
ICGA can also be useful in patients with mildvitreous hemorrhage, where FFA might not bevery useful due to Rayleigh scatter, identificationof vortex vein ampulla (by the dynamic poolingof the dye with gaze shift).6 Finally, ICGA canbe used to study the velocity of choroidalcirculation and the ocular hemodynamics witha certain success but there is no definite clinicalapplication of this as yet.19
Recent Advances in IndocyanineGreen Angiography1. Wide-angle angiography: This is carried out
by performing ICGA with the aid of wide-angle contact lenses, such as Volk SuperQuadand a traditional Topcon fundus camera. Thediopter compensation knob of the camerashould be set to the (+) setting to compensatefor the image plane of the contact lens. Thisallows real-time imaging of a wide field ofthe choroidal circulation up to 160 degreesof field of view.
2. Overlay technique: This technique allowslesion on one image to be traced on to anothercolor or red-free image. This would allowprecise localization of the lesion for thermallaser treatment and assessment of theadequacy of treatment.
3. Digital stereo imaging: As with FFA images,ICGA images too can be viewed by stereoimaging. Elevated lesions such as PEDs canbe better imaged in this way.
4. ICG as a photo sensitizer: It is consideredto be a cheaper alternative to vertoporfin inphotodynamic therapy of neovascular AMDand other disorders. The advantage of ICGis that it can be imaged and hence propertiming of dye activation (theoretically theideal timing is when the ratio of ICGfluorescence of the CNVM to that of the normaltissue is greatest) and precise localization fortreatment are possible. The need for a separateangiogram prior to treatment is alsoeliminated. However, this technique is stillin its infancy and several investigators areworking on it.
5. Digital subtraction ICGA: It uses digitalsubtraction of sequentially acquired ICGimages along with pseudocolor imaging. Itshows occult CNVM in greater detail andwithin a shorter time than conventionalICGA.
The Future Applications ofIndocyanine Green AngiographyIn the future, ICGA is expected to play a moreimportant and wider role especially in themanagement of macular disorders.1. Identifying subclinical neovascular lesions
in the other eye of patients with AMD. Thereare several reports that mention that 10% ofsuch eyes with no clinical or fluoresceinangiographic evidence of an exudativeprocess harbor plaques of neovascularizationevident on ICGA.
2. ICG-guided feeder vessel photocoagulation:SLO high-speed ICGA can adequately imagethe feeding vessels of the CNVM which are0.5 to 3 mm in length and are believed to

215Indocyanine Green Angiography
lie in the Sattler’s layer of the choroid. Eitherconventional thermal laser or micropulsed(810 nm diode laser) with ICG-dye enhance-ment are treatment modalities gainingpopularity. The drawbacks of this techniqueis the high cost of the SLO imaging systems,frequent occurrence of multiple feeder vesselsand a high rate of reperfusion after a singletreatment, both of which necessitate multipletreatment sessions.
References1. Flower RW, Hochheimer BF.A clinical technique
and apparatus for simultaneous angiographyof the separate retinal and choroidal circulations.Invest Ophthalmol 1973;12: 258-61.
2. Cherrick GR, Stein SW, Leevy CM, DavidsonCS. Indocyanine green: observation of itsphysical properties, plasma decay and hepaticexcretion. J Clin Invest 1960;39:502-600.
3. Sutoh N, Murakoka K, Takahashi K, et al.Remodeling of choroidal circulation in carotidcavernous sinus fistula. Retina 1996;16: 497-504.
4. Hope-Ross M, Yannuzzi LA, Gragoudas ES, etal. Adverse reactions to indocyanine green.Ophthalmology 1994;101:529-33.
5. Lutty G. The acute intravenous toxicity ofbiological stains, dyes and other fluorescentsubstances. Toxicol App Pharmacol 1978;44: 225-49.
6. Bischoff PM, Flower RW. Ten years’ experiencewith choroidal angiography using indocyaninegreen dye: A new routine examination or anepilogue? Doc Ophthalmol 1985;60:235.
7. Yannuzzi LA, Flower RW, Slakter JS (Eds).Indocyanine Green Angiography. St. Louis, Mosby,1997.
8. Hayreh SS. In vivo choroidal circulation andits watershed zones. Eye 1990;4:273-89.
9. Hayashi K, Hasegawa Y, Tazawa Y, et al. Clinical
application of indocyanine angiography tochoroidal neovascularization. Jpn J Ophthalmol1989;33:57.
10. Yannuzzi LA, Slakter JS, Sorenson J, et al. Digitalindocyanine green videoangiography andchoroidal neovascularization. Retina 1992;12:191.
11. Guyer DR, Yannuzzi LA, Slakter JS, et al.Classification of choroidal neovascularizationby digital indocyanine green video-angiography. Ophthalmology 1996;103:2054.
12. Chang B, Yannuzzi LA, Ladas ID, et al. Choroidalneovascularization in second eyes of patientswith unilateral exudative age-related maculardegeneration. Ophthalmology 1995;102:1380.
13. Kuhn D, Meunier I, Soubrane G, Coca G. Imagingof chorioretinal anastomoses in vascularizedretinal pigment epithelial detachments. ArchOphthlamol 1995; 113:1392.
14. Yannuzzi LA, Ciardella AP, Spaide RF, et al.The expanding clinical spectrum of idiopathicpolypoidal choroidal vasculopathy. ArchOphthalmol 1997;115:478.
15. Guyer DR, Yannuzzi LA, Slakter JS, et al. Digitalindocyanine green videoangiography of centralserous chorioretinopathy. Arch Ophthalmol 1994;112:1057.
16. Krupsky S, Friedman E, Foster CS, et al.Indocyanine green angiography in choroidaldiseases. Invest Ophthalmol Vis Sci 1992;33:723.
17. Howe LJ, Woon H, Graham EM, et al. Choroidalhypoperfusion in acute multifocal posteriorplacoid pigment epitheliopathy. An indocyaninegreen angiography study. Ophthalmology1995;102:790.
18. Ie D, Glaser BM, Murphy RP, et al. Indocyaninegreen angiography in multiple evanescent whitedot syndrome. Am J Ophthalmol 1994;117:7.
19. Mones J, Guyer DR, Krupsky S, Freidman E,Gragoudas ES, Ciardella AP. Indocyanine greenVideoangiography (2nd edn). In Principles andPractice of Ophthalmology. Albert DM, JakobiecFA, Azar DT, Gragoudas ES (Eds). Philadelphia,WB Saunders, 2000.

216 Diagnostic Procedures in Ophthalmology
RAJIV NATH, TINKU BALI, MONICA SAHA
A-scanUltrasonography14
Ophthalmic ultrasonography is a non-invasive,efficient and inexpensive diagnostic tool to detectand differentiate various ocular and orbitalpathologies. It is an indispensable tool for thecalculation of intraocular lens (IOL) power, theevaluation of the posterior segment behind densecataract or vitreous hemorrhage, the diagnosisof complex vitreoretinal conditions and thedifferentiation of ocular masses. Ultrasound,unlike other imaging modalities, is examiner-dependent and needs a high level of skill andexpertise. It is a dynamic test where diagnosisis best reached during examination and not fromstill pictures. However, a correlation withclinical findings is essential to make a precisediagnosis.
HistoryUltrasound was first used in ocular diagnosisin 1956 by Mundt and Hughes who employedthe A-scan technique. Oksala and Lehtinen ofFinland further refined this technique in the early1960s. Baum and Greenwood developed the B-scan using the immersion method in late 1950s.The quality of these B-mode images was quitepoor and, therefore, almost all the ultrasono-
graphy of the eye was initially performedusing the A-mode. Later on the biometricprecision of A-scan was increased byincreasing transducer frequencies and usingmore advanced time measurement techniques toreplace the ruler measurement of photographedA-mode displays. In 1967, Giglo and Ludlamdeveloped the system, using 20 mHz focusedtransducer with a multitrace oscilloscope display.In the 1970s the interpretation of A-mode patternsbecame more precise and standardized due tothe efforts of Ossoinig of Vienna. However, itsacceptance was limited because the multiplepeaks of an A-scan were bewildering for theuninitiated. Standardized echography is a widelyused ultrasonic method in ophthalmologyconceptualized by Ossoinig, which combinesdiagnostic A-scan, diagnostic B-scan, biometricA-scan and at times Doppler evaluation.Ultrasonograhy has thus become a reliableand simple procedure with increasingindications.
The advent of high resolution, high frequencyprobes has improved B-mode studies forintraocular and orbital imaging thus pushingA-scan into the backdrop. However, A-scan stillremains the best modality for biometry.
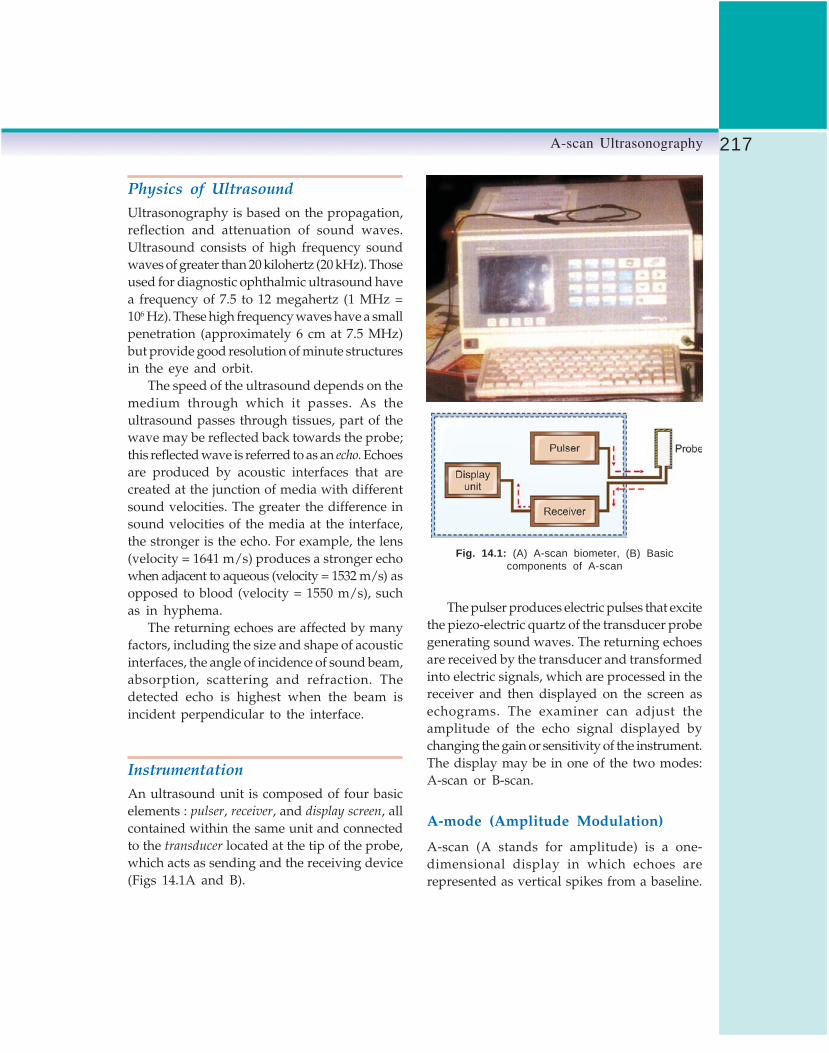
217A-scan Ultrasonography
Physics of UltrasoundUltrasonography is based on the propagation,reflection and attenuation of sound waves.Ultrasound consists of high frequency soundwaves of greater than 20 kilohertz (20 kHz). Thoseused for diagnostic ophthalmic ultrasound havea frequency of 7.5 to 12 megahertz (1 MHz =106 Hz). These high frequency waves have a smallpenetration (approximately 6 cm at 7.5 MHz)but provide good resolution of minute structuresin the eye and orbit.
The speed of the ultrasound depends on themedium through which it passes. As theultrasound passes through tissues, part of thewave may be reflected back towards the probe;this reflected wave is referred to as an echo. Echoesare produced by acoustic interfaces that arecreated at the junction of media with differentsound velocities. The greater the difference insound velocities of the media at the interface,the stronger is the echo. For example, the lens(velocity = 1641 m/s) produces a stronger echowhen adjacent to aqueous (velocity = 1532 m/s) asopposed to blood (velocity = 1550 m/s), suchas in hyphema.
The returning echoes are affected by manyfactors, including the size and shape of acousticinterfaces, the angle of incidence of sound beam,absorption, scattering and refraction. Thedetected echo is highest when the beam isincident perpendicular to the interface.
InstrumentationAn ultrasound unit is composed of four basicelements : pulser, receiver, and display screen, allcontained within the same unit and connectedto the transducer located at the tip of the probe,which acts as sending and the receiving device(Figs 14.1A and B).
Fig. 14.1: (A) A-scan biometer, (B) Basiccomponents of A-scan
The pulser produces electric pulses that excitethe piezo-electric quartz of the transducer probegenerating sound waves. The returning echoesare received by the transducer and transformedinto electric signals, which are processed in thereceiver and then displayed on the screen asechograms. The examiner can adjust theamplitude of the echo signal displayed bychanging the gain or sensitivity of the instrument.The display may be in one of the two modes:A-scan or B-scan.
A-mode (Amplitude Modulation)
A-scan (A stands for amplitude) is a one-dimensional display in which echoes arerepresented as vertical spikes from a baseline.

218 Diagnostic Procedures in Ophthalmology
These spikes represent reflectivity, location andsize of the anatomic structure (Fig. 14.2).
The A-mode display is a time-amplitudedisplay. The X-axis represents time elapsed,which is a function of tissue depth. Knowingthe speed of ultrasound in soft tissues thedistance between two spikes can be derived. Thehorizontal expansion can be modified accordingto type of examination for which three modesorbita, bulbus and varia have been provided. Theorbita mode is used for orbital examination, eachmicrosecond measures approximately 1 mm onscreen. In the bulbus mode examination (inintraocular examination) each microsecondmeasures approximately 2 mm of horizontalexpansion on the screen. The varia mode is usedfor axial length measurement. The reflectivity ismeasured in decibels on the Y-axis and is directlyrelated to the height of the spike above the baseline.When on highest gain, the sound beam is widest,the penetration highest and the spike amplitudemaximum, enabling visualization of the weaksignals. When gain is lowered, the sound beam
is narrower, with less penetration, and the spikeamplitude is decreased. This eliminates theweaker signals but improves resolution (abilityto display two interfaces as separate spikes).
The A-scan probe of a frequency of 7.5 to8 MHz is used for the orbit and 10 MHz forthe globe. A non-focused beam is used, whichhas parallel borders allowing pattern recognitionat different distances from the ultrasound probe(Fig. 14.3A).
B-Mode (Brightness Modulation)
B-scan (B stands for brightness) differs from A-scan in that it produces a two dimensionalacoustic section. An echo is represented as adot on the screen rather than a spike. The strengthof the echo is depicted by the brightness ofthe dot and coalescence of multiple dots on thescreen forms a two dimensional picture of thereflecting tissue. A focused beam is used, as theexamination takes place in a focal zone (Figs14.3B and 14.4).
Fig. 14.2: Schematic representation of A-scan inorbita mode of examination
Figs 14.3A and B: A Nonfocused beam of A-scan,B Focused beam of B-scan

219A-scan Ultrasonography
Vector A-scan Display
A-scan display is provided with some B-scanunits, which allows a simultaneous display ofboth modes (Fig. 14.5). The A-scan patterncorresponds to the vector’s direction.
ProcedureTo perform a successful ultrasound examination,two key components need to be mastered viz.the acquisition of images, and the interpretationof images.
Basic Screening Examination
The screening examination is used to detect alesion. The examination is performed with the
patient reclining or sitting, after anesthetic dropsare instilled in both eyes. No other coupling agentis needed. The echographer sits on an adjustableexamining stool on one side of patient.
The ultrasound probe is first applied at 6o’clock limbus (Fig. 14.6), aiming at the centerof the globe. It examines the oppositechorioretinal layers at the 12 o’clock meridian.The patient is instructed to look away from probeto avoid scanning through the lens. The probeis shifted from limbus to fornix (Fig. 14.7) stillaiming it towards the center of the globe, thusscreening a particular meridian from theposterior pole to the ora serrata. The ultrasoundbeam is always kept perpendicular to theopposite retina (Fig. 14.8). The same procedureis repeated in eight o'clock meridians, movingthe probe temporally around the globe (Fig. 14.9).
Fig. 14.4: Schematic representation of B-scan
Fig. 14.5: Simultaneous display of A and B modes (Note:White arrow is pointing at A-scan spikes correspondingto the B-scan display above it)
Fig. 14.6: Ultrasound probe applied at 6 o’clock limbus
Fig. 14.7: Ultrasound probe is placed at fornix

220 Diagnostic Procedures in Ophthalmology
Further examinations are performed at highersystem sensitivity (gain) allowing the detectionof any vitreous opacity missed during theexamination at tissue sensitivity. However,examination at lower system sensitivity allowsdetection of flat fundus lesions.
Anterior Segment Evaluation —Immersion Technique
Indications for anterior segment evaluation arelimited. However, A-scan may be performed byusing a simple immersion technique.
A scleral shell filled with methylcellulose isinserted between the lids and the probe placedon it. Using this technique the cornea, anteriorchamber, iris, lens and retrolental space can beevaluated and axial length of the eye can bemeasured.
Special Examination Techniques
If a lesion is detected on screening examinationthen special techniques are employed todifferentiate lesions through the analysis ofspecific acoustic characteristics. The specialexamination techniques include:1. Topographic echography2. Quantitative echography, and3. Kinetic echography.
Topographic Echography
It entails the assessment of shape, location andelevation of lesions. The following maneuversare used:a. The probe is placed at the limbus of the
meridian opposite to the center of the lesionand then moved from limbus to fornix toassess the lesion anteroposteriorly(radially).
b. The probe is shifted from side-to-side (parallelto limbus) to evaluate the lesion laterally.
Fig. 14.8: Ultrasound probe is kept perpendicular tothe opposite retina
Fig. 14.9: Screening-probe position for scanning ineight meridians
The printout is labeled according to the meridianthat has been screened, and the segment of themeridian that has been examined, using P forposterior, E for equator and A for anterior. Forexample, when the probe is placed at 6 o’clocklimbus for examining the posterior pole at the12 o’clock meridian, the picture is labeled as12P.

221A-scan Ultrasonography
c. The probe is placed in positions that are 90°apart, to examine the lesion from differentbeam directions.The pathological findings are classified into
one of the three categories point-like, membrane-
like and space occupying (Table 14.1).
Quantitative Echography
Once the topographic findings have been ascer-tained, quantitative echography is performedwith A-scan to determine the reflectivity (i.e. spikeamplitude) of a lesion, after directing the soundbeam perpendicular to it. The resultant spikeheight is expressed as a percentage of the maxi-mum height that can be displayed on the screenand the lesion can be categorized (Table 14.2).
The determination of reflectivity is necessaryfor evaluation of the internal structure and soundattenuation of a mass lesion. Internal structurerefers to the histological configuration (size andarrangement of interfaces) of mass lesions.An internal acoustic structure of a lesion isclassified as regular when the echo spikes areuniform. The spikes are uniformly low inmelanoma and uniformly high in hemangioma.
The acoustic structure is irregular (heterogenous)if the echo spikes show marked variation inamplitude as seen in a metastatic carcinoma.
Sound attenuation occurs when incidentsound energy is scattered, reflected or absorbedby a given medium. It is indicated by decreasingspike height within, or posterior to a lesion(occurring from left to right). This spikedecrease called angle kappa is determined bydrawing an imaginary line through the peaksof the lesion spikes and estimating the anglethen formed with the vitreous base line (Fig.14.10). The steeper the angle, the greater is the
TABLE 14.1: TOPOGRAPHIC DIFFERENTIATION OF LESIONS ON A-SCAN
Category Point-like Membrane-like Space-occupying
Echogram Single spike Single spike or chain of spikes Chain of spikesDifferential diagnosis Foreign body Retinal detachment Melanoma
Vitreous opacities Choroidal detachment RetinoblastomaVitreous membranes HemangiomaTumor surfaces Vitreous hemorrhage
TABLE 14.2: CATEGORIZATION OF LESIONS ON SPIKE HEIGHTPERCENTAGE
Spike height Lesions
1. Low (2-20%) Senile vitreous floaters2. Low medium (10-60%) Choroidal melanoma3. Medium (20-80%) Vitreous membrane4. High (80-100%) Asteroid hyalosis, metastatic carcinoma5. Very high (100%) Retinal detachment, organized vitreous
hemorrhage or foreign body
Fig. 14.10: Sound attenuation showing large anglekappa ‘K’

222 Diagnostic Procedures in Ophthalmology
sound attenuation. Bone, calcium and mostforeign bodies produce strong sound attenuation.This results in a marked decrease of scleral ororbital spikes.
Kinetic Echography
The purpose of this examination is to detectspontaneous movements and after movements.It is done at a low gain.
Spontaneous movements indicate a vascularlesion as evidenced by multiple, very quick, smallamplitude, vertical oscillations in the echo spikepattern. This is assessed with the probe stationaryand the eye fixing steadily on a target.
After movements indicate mobility and areseen as a vertical motion of the echo spikesfollowing cessation of eye movements. Non-solidlesions like PVD or retinal detachment displayafter movements, whereas solid lesions liketumors do not.
Indications of A-scanA-scan ultrasonography is indicated forevaluation of the posterior segment of the eyein the presence of complete or partial opacificationof the anterior or posterior segments. It is alsoused to localize and measure and differentiatetumors and evaluate growth during follow-upof patients as well as to detect intraocular foreignbodies and assess extent of intraocular damagein case of trauma.
Biometry is another important indication ofA-scan for accurate axial length measurementsrequired in IOL power calculation. Measurementof the axial length of globe, is also importantin evaluating congenital glaucoma, microphthal-mos, nanophthalmos, myopia, PHPV andphthisis bulbi.
Morphological characteristics of the eyeballand its contents, like corneal thickness, lens
thickness, anterior chamber depth and relativelens position in the anterior segment, have beenextensively studied in various conditions suchas narrow-angle glaucoma and refractive errors,with the help of A-scan ultrasonography (Table14.3). Ultrasonic pachometry which uses theprinciple of A-scan is now the standard formeasurement of corneal thickness.
TABLE 14.3: INDICATIONS OF A-SCANULTRASONOGRAPHY
Anterior Segment• Corneal opacification• Anterior chamber hyphema or hypopyon• Miosis• Pupillary membrane• CataractPosterior Segment• Vitreous hemorrhage• EndophthalmitisClear Ocular Media• Tumors and masses – detection, differentiation
and follow-up• Vitreous pathologies• Choroidal detachment• Retinal detachment – rhegmatogenous and
exudativeBiometry• Axial length of eyeball• Anterior chamber depth• Lens thickness• Tumor measurementsUltrasonic pachometry• Corneal thickness
Interpretation of Normal A-scanExamination of a normal globe displays thefollowing echo spikes from left to right (Fig.14.11).1. The initial spike (I) represents reverberations
at the probe tip and has no clinicalsignificance.
2. The baseline (B) represents the vitreous cavitywhich is characterized by absence of echospikes in normal conditions. The presenceof any blip on the horizontal line needsevaluation to rule out a pathological condition.

223A-scan Ultrasonography
3. The retinal spike (R) is a straight, high risingecho spike perpendicular to the baseline. Ajagged echo spike means that the probe isnot perpendicularly placed.
4. The choroidal spikes are multiple highreflective spikes, which are seen between theretinal spike (R) and the scleral spikes (S).
5. The scleral spike (S) is difficult to differentiatefrom choroidal spikes.
6. The orbital spikes (O) are multiple spikesbehind the scleral spike. The initial spikesare high reflective and the reflectivitydecreases rapidly because of soundattenuation in the orbit.
7. An electronic scale (E) is displayed on thelower part of the screen. Examination at lowsystem sensitivity (low gain) clearly identifiesthe retinal and scleral spikes.
A-scan in Common OcularPathologies
Vitreous
Vitreous Floaters
They are found due to condensation of vitreoussheets in an aging eye. Very low reflective(2-20%) spikes are displayed as small blips alongthe baseline, which are better displayed at ahigher gain (Fig. 14.12).
Asteroid Hyalosis
Multiple echo spikes with medium to highreflectivity (50–100%) are displayed along thebaseline. The high reflectivity results due topresence of calcium within the asteroid bodies.
Fig. 14.11: Normal A-scanwith sound beam bypassinglens; I: Initial spike, B: baselinerepresenting echo-freevitreous, R: retina, S: sclera,O: orbital soft tissues, E:electronic scale
Fig. 14.12: A-scanpattern of a vitreousfloater (arrows)

224 Diagnostic Procedures in Ophthalmology
Fig. 14.13: A-scan of organizedvitreous hemorrhage
Fig. 14.14: A-scan of endophthalmitis,a week after its occurrence. Spike dueto organized inflammatory membranein vitreous (arrow)
Vitreous Hemorrhage
In fresh, mild vitreous hemorrhage withdispersed red blood cells, a chain of lowamplitude spikes is found on A-scan. These areoften limited posteriorly by a higher reflectivespike representing a posterior vitreousdetachment. Denser the hemorrhage, the higheris the reflectivity of the echo spikes. If the bloodorganizes larger interfaces are found, which maypresent even 60-100% reflectivity (Fig. 14.13).
Endophthalmitis
In endophthalmitis diffuse inflammatory cells arepresent in the vitreous, which are displayed asmultiple echo spikes with low to medium reflec-tivity (10–60%). With organization and membraneformation, the reflectivity increases (Fig. 14.14).Daily follow-up examinations are required.
Posterior Vitreous Detachment
A single lesion spike is present along the baseline.The reflectivity is low (5–10%) if the posteriorvitreous layer is thin. The reflectivity is high (80-90%) if the posterior vitreous layer is thick orlined by red blood cells (Fig. 14.15).
Retina
Retinal Detachment
Retinal detachment is characterized by a single,steeply rising, extremely high (100%) andmoderately thick retinal spike when the soundbeam is perpendicular to the retinal surfaces (Fig.14.16). Other directions cause a change in pattern– an oblique beam gives lower and wider spikeswith two or more peaks and tangential beamsshow a long chain of low to medium high spikes.

225A-scan Ultrasonography
Fig. 14.15: A-scan at highgain: A:medium reflectivespike of PVD, B: low reflectivespike from subvitreal blood
Fig. 14.16: A-scan of retinaldetachment showing 100% tallsingle peak spike (R)
The distance between the retinal spikes and theocular wall spikes in a given beam direction isequal to the degree of elevation. The presenceof signals between the retinal and scleral spikesis indicative of an exudative or hemorrhagicretinal detachment.
Sometimes it is difficult to differentiatebetween a thick vitreous membrane due to
inflammation or trauma, and a retinaldetachment, as both may show a highly reflective(100%) spike. However, they have differentreflectivities in the periphery. A retinaldetachment is highly reflective both posteriorlyand in the periphery. Vitreous membranes tendto be highly reflective posteriorly but less in theperiphery (Fig. 14.17).
Fig. 14.17: A-scan technique fordifferentiating a dense PVD orthick vitreous membrane from RDin the superior portion of eyeball.On scanning the membraneposteriorly 100% high spike isfirst seen (1). The probe is thenshifted so as to follow themembrane to its insertion in theperiphery. A PVD shows lowreflective spikes in the periphery,while the retina remains highlyreflective as seen in (4)

226 Diagnostic Procedures in Ophthalmology
Retinoschisis
A 100% high spike is produced in retinoschisiswhich may demonstrate slight vertical aftermovements. Retinoschisis differs from a retinaldetachment by its more focal, smooth and thincharacter.
Intraocular Tumors
A-scan helps in the detection, differentiation andmeasurement of intraocular tumors.
Choroidal Melanoma
Most malignant melanomas can be diagnosedor suspected from their characteristic ophthalmo-scopic appearance. Ultrasound providesconfirmation of the diagnosis especially in eyeswith opaque ocular media; provided the lesionis elevated by at least 0.75 mm from the innerscleral wall.
The key acoustic criteria of a choroidalmelanoma are regular acoustic structure and alow to medium internal reflectivity due to ahomogeneous cellular architecture. Vascularityis present, with fast spontaneous vertical spikemovements seen during examination; and a solidconsistency, with no after movements of spikesfollowing ocular movements. Larger tumors mayhave a more irregular internal structure due totumor necrosis and large blood vessels. Theyalso show a moderately steep angle kappa dueto strong sound attenuation within the tumor.
Extrascleral extension of the melanoma is seenas jagged scleral echospike with low reflectivespikes immediately behind the sclera. A-scancan also be used for follow-up of tumor growthand to assess effectiveness of therapy. Typically,a treated melanoma becomes highly irregularand more highly reflective due to tumor necrosis,with decreased elevation and loss of vascularity.A-scan can help in differential diagnosis ofchoroidal tumors (Table 14.4 and Fig. 14.18).
Metastatic Carcinoma
The acoustic structure of metastatic carcinomais irregular with a high internal reflectivity (60-80%) and absence of vascularity. Measurementsof tumor height on follow-up show slow growthor no growth.
Choroidal Hemangioma
The acoustic structure of choroidal hemangiomais regular with a very high internal reflectivitydue to multiple blood filled channels. Vascularityis present and follow-up shows no growth.
Choroidal Hemorrhage
Choroidal hemorrhage may show a reflectivitysimilar to that of melanoma but profoundlydiffers from it by displaying after movementsduring kinetic echography if it is sufficientlyelevated.
TABLE 14.4: A-SCAN ULTRASONIC DIFFERENTIATION OF CHOROIDAL TUMORS
Criteria Choroidal melanoma Metastatic carcinoma Choroidal hemorrhage
Internal structure Regular Irregular RegularReflectivity Low to medium (10-60%) High (80-100%) High (100%)
Spontaneous Fast, vertical Minimal or no Fast, verticalmovements (vascularity) movements
Growth during follow-up Significant Slow None

227A-scan Ultrasonography
Figs 14.18A to C: Differential diagnosis of choroidaltumors: A Choroidal melanoma, low internal reflective,B Choroidal hemangioma, uniform high reflectivity, CMetastatic carcinoma, variable reflectivity, Arrow – internaltumor spikes, T: tumor surface, S: sclera
Retinoblastoma
Retinoblastoma is best diagnosed by indirectophthalmoscopy. A-scan offers additional diag-nostic information through the quantitation ofsound attenuation by the lesion. The measure-ment of axial length helps in differentiating itfrom other causes of leukocoria. The status of
Fig. 14.19: A-scan of retinoblastoma. Very high reflectivetumor spikes (T) are seen with decreased reflectivitybehind them due to shadowing of sclera and orbital tissues.Vitreous seeding is seen as a low reflective echo spike(V)
the lesion and the effect of treatment can alsobe assessed by A-scan.
On A-scan, a retinoblastoma shows anirregular acoustic structure with high internalreflectivity (70-100%) (Fig. 14.19). Tumor cellarrangement, large vessels and particularlycalcifications are responsible for the highreflectivity. Vascularity is present as evidencedby spontaneous movements of the lesion spikes.The axial length may be normal or increased.The A-scan pattern may vary depending uponsize of tumor and degree of tumor calcificationand necrosis. A small retinoblastoma withoutcalcification will not produce a high reflectivity.
Other conditions that can cause leukocoriabut can be differentiated from a retinoblastomaby ultrasonography include, persistent hyper-plastic primary vitreous (PHPV), retinopathy ofprematurity, and Coats’ disease (Flow Charts14.1A to D). In PHPV, an A-scan examinationconfirms the absence of a retinal pathology, asnormal retinal echo spikes are seen. The axiallength of the affected eye is shorter than the felloweye. In retinopathy of prematurity, the A-scanshows absence of a mass lesion and the presenceof a large echo spike representing the detachedretina with normal axial length. Coats’ diseaseconsists of retinal detachment with subretinalexudates. A-scan shows a high reflective echo

228 Diagnostic Procedures in Ophthalmology
Flow chart 14.1A: Differential diagnosis of intraocular lesions on A-scan.Point-like lesions on topographic echography
Flow Chart 14.1B: Membrane-like lesions on topographic echography
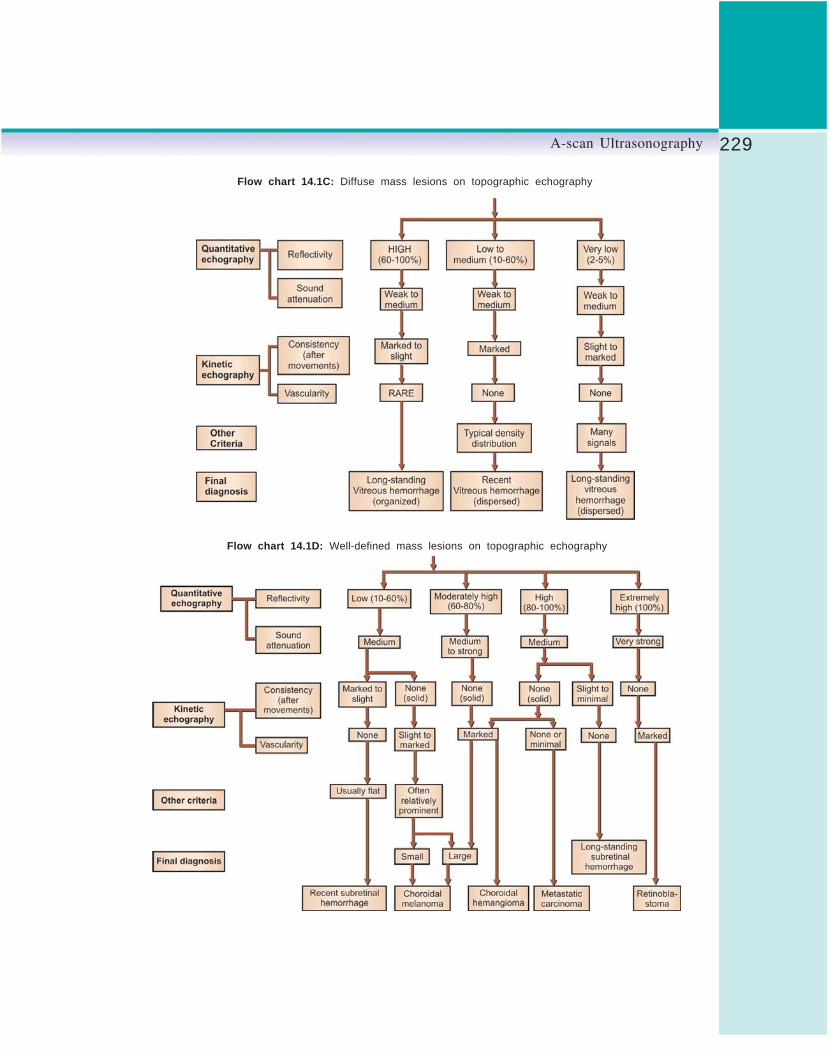
229A-scan Ultrasonography
Flow chart 14.1C: Diffuse mass lesions on topographic echography
Flow chart 14.1D: Well-defined mass lesions on topographic echography

230 Diagnostic Procedures in Ophthalmology
spike of detached retina followed by low reflectiveecho spikes representing red blood cells andcholesterol in the subretinal exudates.
Choroid
Choroidal Thickening
A low gain should be used to detect choroidalpeaks as it improves the resolution of the closelyspaced posterior layers. The choroidal thickeningmay be diffuse or focal, and its reflectivity maybe high or low depending on its etiology. Highreflective thickening is seen in macular edema,endophthalmitis and uveitis while low reflectivethickening in VKH syndrome and sympatheticophthalmitis. Certain tumors may also appearas thickened choroid.
Choroidal Detachment
A thick steeply rising 100% high spike isproduced by choroidal detachment on A-scan.On lowering the gain the spike is observed tobe double peaked. If choroidal hemorrhage ispresent, low to medium spikes are seen in thesubchoroidal space. If choroidal effusion ispresent the space is echo-free.
Ocular Trauma
In a traumatized eye, the fundus visualizationmay be obscured by a hyphema, a cataract ora vitreous hemorrhage. A-scan examination ofthe eye in such cases is used to detect anyintraocular damage and the presence of anintraocular foreign body (IOFB).
It is advisable to repair an open wound beforeultrasonic examination. However, if intraocularassessment is imperative before closure, the A-scan probe should be placed on the conjunctivain an area away from the wound. Marked lidswelling or severe pain may prevent placement
of probe directly on the globe in such case itmay be placed on the closed lids with methyl-cellulose applied for better sound penetration.It is important to use a very high gain whenexamining through the closed lids.
Foreign Body Detection andLocalization
A foreign body in the eye can be easily recognizedby the characteristic steeply rising overloadedecho spike with extremely high reflectivity (100%).It may show a great width at lower gain. Becauseof the small size of the IOFB, the high reflectivesingle echo spike is seen whenever the foreignbody is centered in the path of the sound beam,irrespective of the beam’s direction. A foreignbody produces strong sound attenuation andthe ocular wall spikes behind it are significantlylower due to shadowing.
A-scan complements radiologic evaluationand can detect radiolucent foreign bodies missedon X-ray. A small spherical foreign body, likea pellet, shows a high echo spike followed bya long chain of echo spikes with decreasingheight. These multiple echoes are caused bymultiple reverberations of sound between theanterior and posterior surfaces of the sphericalforeign body. A larger foreign body has anteriorand posterior echo spike and its thickness maybe measured between these surface spikes.
Preretinal Foreign Bodies
When a foreign body is lying within 2 mm ofthe sclera or in the coats of the eye, it becomesdifficult to decide on A-scan whether the foreignbody is intraocular or extraocular. In suchsituation, it is important to know that the sclerayields a high reflective echo spike only whenthe sound beam is perpendicular to it, while ahigh reflective foreign body signal can be

231A-scan Ultrasonography
displayed if it is centered within the sound beamat any angle.
Therefore, the sound beam is aimed towardsthe foreign body at an angle oblique to the sclera,thus decreasing its reflectivity. High reflectiveforeign body spikes are then displayed in frontof the lower reflective ocular wall spikes if theforeign body is intraocular.
Traumatic Retinal Detachment
The high reflective echo spike of retinal detachmentis followed by low reflective echo spikes betweenthe retinal spike and ocular wall spikes. Theserepresent a subretinal hemorrhage (Fig. 14.20).
Dislocated Lens in Vitreous
A dislocated lens in the vitreous shows two smoothand high reflective surface spikes, displayed infront of the ocular spikes. There may be lower
reflective spikes representing the lens nucleus,separating the surface spikes (Fig. 14.21).
Phthisis Bulbi
In phthisis bulbi the globe is atrophic andshrunken, the intraocular contents aredisorganized and intraocular calcification maybe present. The A-scan represents these changesas an irregular pattern of high and low reflectiveecho spikes which fill the globe. High reflectiveecho spikes may be present due to ossificationand the normally high orbital echo spikes areabsent. The axial length of the eyeball is shorterthan normal.
BiometryThe most commonly used function of the A-scanis for measurements in the eye, i.e. biometry. This
Fig. 14.20: A-scan of traumaticretinal detachment: R: 100% tallspike from retinal detachment, H:low reflective echo spike fromsubretinal hemorrhage
Fig. 14.21: A-scan of dislocatedlens in vitreous: A: anterior lensspike, P: posterior lens spikeseen in vitreous cavity
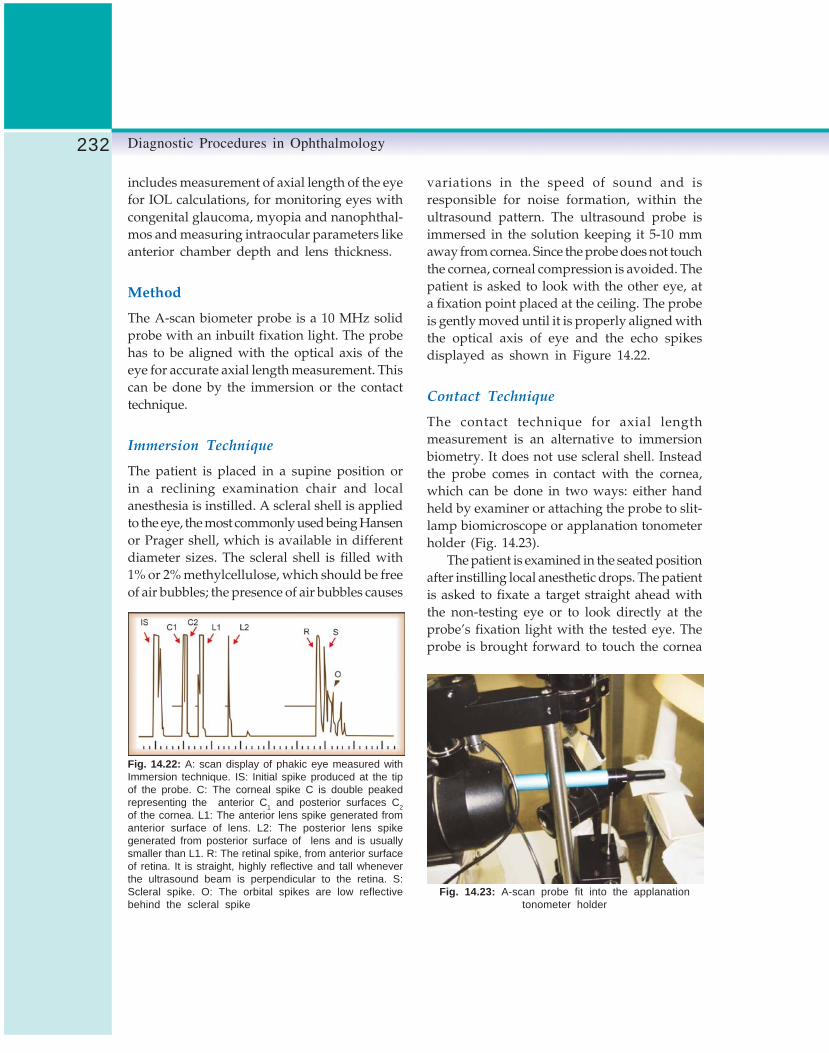
232 Diagnostic Procedures in Ophthalmology
includes measurement of axial length of the eyefor IOL calculations, for monitoring eyes withcongenital glaucoma, myopia and nanophthal-mos and measuring intraocular parameters likeanterior chamber depth and lens thickness.
Method
The A-scan biometer probe is a 10 MHz solidprobe with an inbuilt fixation light. The probehas to be aligned with the optical axis of theeye for accurate axial length measurement. Thiscan be done by the immersion or the contacttechnique.
Immersion Technique
The patient is placed in a supine position orin a reclining examination chair and localanesthesia is instilled. A scleral shell is appliedto the eye, the most commonly used being Hansenor Prager shell, which is available in differentdiameter sizes. The scleral shell is filled with1% or 2% methylcellulose, which should be freeof air bubbles; the presence of air bubbles causes
variations in the speed of sound and isresponsible for noise formation, within theultrasound pattern. The ultrasound probe isimmersed in the solution keeping it 5-10 mmaway from cornea. Since the probe does not touchthe cornea, corneal compression is avoided. Thepatient is asked to look with the other eye, ata fixation point placed at the ceiling. The probeis gently moved until it is properly aligned withthe optical axis of eye and the echo spikesdisplayed as shown in Figure 14.22.
Contact Technique
The contact technique for axial lengthmeasurement is an alternative to immersionbiometry. It does not use scleral shell. Insteadthe probe comes in contact with the cornea,which can be done in two ways: either handheld by examiner or attaching the probe to slit-lamp biomicroscope or applanation tonometerholder (Fig. 14.23).
The patient is examined in the seated positionafter instilling local anesthetic drops. The patientis asked to fixate a target straight ahead withthe non-testing eye or to look directly at theprobe’s fixation light with the tested eye. Theprobe is brought forward to touch the cornea
Fig. 14.22: A: scan display of phakic eye measured withImmersion technique. IS: Initial spike produced at the tipof the probe. C: The corneal spike C is double peakedrepresenting the anterior C1 and posterior surfaces C2of the cornea. L1: The anterior lens spike generated fromanterior surface of lens. L2: The posterior lens spikegenerated from posterior surface of lens and is usuallysmaller than L1. R: The retinal spike, from anterior surfaceof retina. It is straight, highly reflective and tall wheneverthe ultrasound beam is perpendicular to the retina. S:Scleral spike. O: The orbital spikes are low reflectivebehind the scleral spike
Fig. 14.23: A-scan probe fit into the applanationtonometer holder

233A-scan Ultrasonography
Fig. 14.24: A-scan display of a phakiceye measure with contact A-scanbiometry. Since the probe is in contactwith the eye, the initial spike and theanterior corneal spike become one:C: cornea/probe, A: anterior lenssurface, P: posterior lens surface,R: retina, S: sclera
Fig. 14.25: A-scan of an aphakiceye with probe on cornea. Note thestriking absence of the lens spikes:C: cornea/probe: R: retina, S: sclera
without indenting it. It is properly aligned alongthe visual axis to optimize the five high amplitudespikes on the screen. The five spikes in a phakicpatient represent from left to right: (1) anteriorsurface of cornea, (2) anterior surface of lens,(3) posterior surface of lens, (4) anterior surfaceof retina, (5) sclera (Fig. 14.24). An aphakic eyewill not show the lens spikes (Fig. 14.25) thoughsometimes a spike of intact posterior capsule,if present, may be seen.
The leading edge of each echo spike should beperpendicular to the horizontal baseline. Thegain is kept at the minimum level that allows properresolution of these spikes. The density of thecataract determines the need for changing the gainsetting due to absorption of sound. Dense cataractrequires higher gain to achieve good resolution.The anterior chamber depth which appears on thescreen should also be monitored to detect cornealcompression during contact biometry.
The biometer has an automatic as well asmanual mode. Use of the automatic mode
increases the risk of error as the biometer maycapture poor quality scans. Biometers areprogramed to capture any scans with spikes thatare of high amplitude within their givenappropriate area. However, they cannot determineif the spike arose steeply from the baseline or if astep or hump was present in the spike origin.Manual mode is preferable, in which the examinerpresses a foot switch to capture the scan when itis seen to be of high quality. The axial length of theeyeball is measured from corneal surface to retinalsurface and an electronic readout is obtained.
A comparison between contact and immersiontechniques of biometry is given in Table 14.5.
Biometry in Ocular Pathologies
Congenital Glaucoma
Axial length measurement in congenitalglaucoma allows confirmation of the clinicaldiagnosis, and differentiates congenital

234 Diagnostic Procedures in Ophthalmology
TABLE 14.5: COMPARISON BETWEEN CONTACT TECHNIQUE AND IMMERSION TECHNIQUE OF BIOMETRY
Contact technique Immersion technique
Patient is in a more comfortable position, sitting Patient is in a supine or reclining position
Variability from one test to next is present due No variability since probe does not come in contact withto inconsistent corneal compression cornea
Axial length measured is shorter by an average Axial length measured is closer to the true valueof 0.24 mm
glaucoma from megalocornea in which axiallength remains normal. It can also monitorsefficacy of glaucoma therapy. The immersiontechnique is preferable as it can detect minutechanges in axial length in small eyes of children.
Myopia
Biometry helps differentiating the axial myopiafrom the lenticular myopia. A posteriorstaphyloma in highly myopic eyes causes anincrease in axial length. A comparison withprevious axial length measurement or with thatof the other eye may reveal a difference of morethan 1 mm.
Tumor Height
Tumor height can be obtained by measuring thedistance between tumor spike and scleral spike.Follow-up measurements are performed tomonitor the height of the lesion. An increase of0.5 mm suggests tumor growth.
Nanophthalmos
The diagnosis of nanophthalmos is made whenthe globe of an adult is smaller than 17 mm withthickening of retinochoroid and sclera.
Limitations and Pitfalls of A-scan
Artifacts
Acoustic artifacts result from multiple reflections,attenuation and variations in propagation speedin tissues. One must be aware of these artifactsin order to avoid misdiagnosis.
Multiple Reflection Artifacts
Multiple reflections (reverberations) may occurbetween the probe tip and a highly reflectivesurface, or between two highly reflective ocularinterfaces. Calcified lens, intraocular implants(Fig. 14.26), foreign bodies, scleral buckles andair bubbles are common producers of multiple
Fig. 14.26: A-scan of intraocular lensimplant producing multiple signals:L: highly reflective spike from IOL, M:multiple signals (reverberations). PMMAlens has a longer chain of reverberationsthan a silicone lens

235A-scan Ultrasonography
signals and may cause error in axial lengthmeasurements. These artifacts can bedistinguished from true echoes by their positionin the echograms as well as by their morepronounced movements.
Attenuation Artifacts
Silicone oil disperses the ultrasound beam, andthe examination is, therefore, very difficult toperform. The sound attenuation preventsresolution of posterior ocular wall and orbitalcontents (Fig. 14.27). The velocity of sound insilicone oil is much less than in vitreous. Thiscauses the echograms to appear larger than normal.
Low Reflective Spike
Low reflective spikes can occasionally be seenin front of the retinal spike when examinationis performed at high gain. This occurs due tothe lateral portion of the ultrasound beam reachesthe concave retina earlier than the central portion.
Tumors
A tumor mass less than 0.75 mm will be missedon A-scan. To detect the acoustic structure thethickness should at least be 2 mm. A falsenegative result may occur in case of a smallretinoblastoma with no calcification, as it willshow low reflective spikes. A diagnosis ofretinoblastoma may be made if a mass shows
high reflectivity. Reflectivity may be due to someother causes such as intraocular calcification orbone formation in phthisis bulbi. Axial lengthmeasurement and clinical history should behelpful in making the correct diagnosis.
Vitreoretinal Diseases
Dispersed vitreous cells or hemorrhage may bemissed initially due to low reflectivity. The gainshould be increased to improve resolution. It issometimes difficult to differentiate between athick vitreous membrane and retinal detachmentas both show high reflectivity.
Intraocular Foreign Bodies
A foreign body may be missed on A-scan if itssurface is less than 1 mm2 or if it is embeddedin the sclera. A wooden foreign body may initiallybe highly reflective but its reflectivity maydecrease making its localization extremelydifficult. Small air bubbles which enter the eyeas a result of penetrating injury may mimic anintraocular foreign body, but they usuallydisappear within a day or two.
Errors in the Axial LengthMeasurement by BiometryIn the measurement of axial length by biometry,a few errors can creep in. They are mentionedhere along with the corrections required.
Fig. 14.27: A-scan of globe filled withsilicone oil: A: spikes from anteriorsurface of silicone drop, B: spikes fromposterior surface of silicone drop,C: markedly attenuated spikes fromocular wall and orbit

236 Diagnostic Procedures in Ophthalmology
Immersion vs Contact technique: Cornealcompression in contact technique yields shorteraxial length. The axial length measured by contacttechnique is shorter by about 0.24 mm incomparison to immersion technique. Therefore,anterior chamber depth must be monitored andthe displays with more shallow depths deletedeven if the spikes appear to be of a high quality.
Misalignment: Erroneous axial lengthmeasurements occur when the ultrasound beamis not aligned with the visual axis of the eyeor is not perpendicular to the macula. The retinaland scleral spikes should be of high amplitude,with the retinal spike arising steeply from thebaseline. No sloping of the retinal spike shouldbe present and there should be no jags, humpsor steps on its ascending edge. If the posterioror the anterior lens spikes are not of highamplitude, the sound beam is misaligned andis not in the visual axis. The posterior lens spikemay be slightly shorter than anterior lens spikebecause of its greater curvature. However, if theposterior lens spike is more than 10% shorterthan the anterior one, the sound beam ismisaligned (Fig. 14.28).
Methylcellulose or thick tear film: Longer axiallength may appear due to presence of a fluidmeniscus between the probe and the cornea,caused by use of ointment, methylcellulose fromprevious eye examination or abnormally thicktear film. If these are suspected, the eye shouldbe washed with saline prior to biometry.
Posterior staphyloma: Problem should besuspected if a difference of more than 0.3 mmis present between the two eyes or a differenceof more than 0.2 mm is found on consecutivemeasurements in the same eye. In these instances,the patient’s history should be taken to findreasons for the difference, or probe for a macularlesion like posterior staphyloma.
Cataract: Extremely dense cataracts can be achallenge due to absorption of the sound beamas it passes through the lens. A higher gain settingmay be needed to achieve high amplitude retinaland scleral spikes. In an extremely dense,calcified lens, the entire sound beam may beabsorbed with no echoes at all from the posteriorsegment. In such case, measurements from thefellow eye must be used in calculation.
Difference between the average sound velocityand the specific sound velocities: The humaneye is mostly composed of aqueous and vitreoushumors, both of which have an ultrasoundvelocity of 1532 m/s. Only the cornea andcrystalline lens have different ultrasoundvelocities. If the eye is measured at an ultrasoundvelocity of 1532 m/s then the true axial length(TAL) = MAL + 0.32, where MAL is the measuredaxial length and 0.32 mm is the addition, whichstands for the correction for underestimation dueto corneal thickness and lens thickness.
Refractive errors: The formula, distance = velocity
X time is programed into the biometer to calculate
Fig. 14.28: Misalignment demonstratedby the decreased amplitude of theposterior lens spike (arrow): A: anteriorlens surface, P: posterior lens surface,R: retina

237A-scan Ultrasonography
the distance between the corneal and retinalspikes, with the average velocity in a phakic eyetaken as 1550 m/s. However, the velocity ofsound in various ocular media in the same eyeand in same ocular media of different eyes isnot the same, but the machine does notdifferentiate it. For example, in a myopic personwho is likely to have a fluid vitreous, soundwaves should be able to travel faster in the vitreouscavity than in a hyperopic person. Since thebiometer is not capable of recognizing thedifference in velocities it may underestimate thelength of vitreous cavity in myopia. It will bethe reverse in hyperopia, where axial length mayget overestimated. An axial myopia of 29 mmis best measured at an average velocity of 1550m/s while an axial hyperope of 20 mm is bestmeasured at average velocity of 1560 m/s. Thetype of eye (phakic, aphakic or pseudophakic)should also be carefully fed in before biometryas the average velocities programed for them aredifferent.
The errors which creep into the estimationof axial length prevent accurate IOL powercalculation. An error of 1 mm in measuring axiallength affects the postoperative refraction by atleast 2.5 diopters. This causes a large residualpostoperative error of refraction (spherical) ineyes with high ametropia. Modification in IOLcalculation formulae have been suggested(Holladay modification), but these are complex,time consuming and require additional software.
Importance of Clinical Correlation inMaking a DiagnosisBefore beginning the examination, the echo-grapher should be informed of the pertinenthistory and clinical findings. Some clinicallydisparate conditions may have similar acousticproperties; for example, it is difficult to differen-tiate vitreous hemorrhage from endophthalmitis
on A-scan as both show low to medium reflectiveecho spikes. A clinical history assists in theirdifferentiation.
In case of a dense cataract, an ultrasoundexamination is warranted when other clinicalfeatures raise the suspicion of a posterior segmentabnormality. Such indications include a rapidlydeveloping cataract, history of trauma or apossible IOFB, heterochromia, afferent pupillarydefect, posterior synechiae, acute red eye, acuterise of IOP and diabetes mellitus.
A-scan versus B-scan
The B-scan covers a considerably larger area thana single A-mode pattern. By providing a two-dimensional topographic documentation, the B-scan is used to define a lesion’s shape andposition. However, the information obtainedfrom amplitude, shape and motion of A-scanspikes is missing. The quantitative reflectivityof ocular lesions, the most important ultrasonicdifferential criterion can be evaluated only onA-scan. Thus, A- and B-scan displays providespecific acoustic information which in either ofone display mode is absent or poorly differen-tiated.
The A-scan has certain unique advantages.The probe used is smaller and can be angledto detect peripheral lesions and small vitreousopacities (which may be missed on B-scan).Because of the small probe size it is the methodof choice in posttraumatic cases with open globewounds. However, orbital lesions are betterdelineated by B-scan. The two modes are,therefore, complimentary to each other and anoptimal echographic examination results froma combination of both modalities.
Bibliography1. Atta HR. Ophthalmic Ultrasound: A Practical
Guide. London,Churchill Livingstone, 1996.

238 Diagnostic Procedures in Ophthalmology
2. Baum G, Greenwood I. The application of ultra-sonics locating techniques to ophthalmology.Theoretic considerations and acoustic propertiesof ocular media. I: Refractive properties. Am
J Ophthalmol 1958, 46:319.3. Binkhorst RD. Biometric A-scan ultrasono-
graphy and intraocular lens power calculation.In: Emery JM (Ed). Current Concepts In CataractSurgery: Selected Proceedings of the FifthBiennial Cataract Surgical Congress. St. Louis,Mosby: 1987.
4. Byrne SF. Standardized echography, Part I: A-scan examination procedures. Int Ophthalmol Clin1979;19:267-81.
5. Baum G. Ultrasonic characteristics of malignantmelanoma. Arch Ophthalmol 1967;78:72-75.
6. Blumenkranz MS, Byrne SF. Standardized echo-graphy for the detection and characterizationof retinal detachment. Ophthalmology 1982;89:821-31.
7. Coleman DJ, Carlin B. A new system for visualaxis measurements in the human eye usingultrasound. Arch Ophthalmol 1967;77:124-27.
8. Coleman DJ. Ophthalmic biometry usingultrasound. Int Ophthalmol Clin 1969;9:667-83.
9. Coleman DJ, Lizzi FL, Jack RL. Ultrasonographyof the Eye and Orbit. Philadelphia: Lea andFebger, 1977.
10. Coleman DJ, Lizzi FL, Silverman RH. A modelfor acoustic characterization of intraoculartumors. Invest Ophthal Vis Sci 1985;26:545-50.
11. Dallow RL. Ultrasonography in ocular and orbi-tal trauma. Int Ophthalmol Clin 1994;14:23-56.
12. Holladay JT. Standardizing constants for ultra-sonic biometry, keratometry, and intraocularlens power calculations. J Cataract Refract Surg1997;23(9):1356-70.
13. Nhindatz GH Jr, Hughes WB. Ultrasonics inocular diseases. Am J Ophthalmol 1956;41: 488-89.
14. Ossoinig KC. Standardized echography: Basicprinciples clinical application and results. IntOphthalmology Clin 1979;19:127-210.
15. Price PR, Jones TB, Goddard J. Basic conceptsof ultrasonic tissue characteristics. RadiologicClinics of North America 1980;18:21-30.
16. Shammas HJ. Atlas of Ophthalmic Ultrasono-graphy and Biometry, St Louis, Mosby, 1984.

239B-scan Ultrasonography
TARAPRASAD DAS, VASUMATHY VEDANTHAM, ANJALI HUSSAIN,SANGMITRA KANUNGO, LS MOHAN RAM
B-scanUltrasonography15
Since the first application in ophthalmology byMundt and Huges,1 ultrasonography, in littleover four decades, has emerged as an indispen-sable tool in the diagnosis and management ofvarious ocular and orbital abnormalities. Thevalue of ultrasonography in the diagnosis ofvitreoretinal diseases, and particularly inpreoperative evaluation of the posterior segmentof the eye need not be over emphasized.2
Ultrasonography is mostly indicated in hazymedia when the traditional optical evaluationis not possible. It is also of immense diagnosticand therapeutic value in selected situationsdespite media clarity such as intraocular spaceoccupying lesions. This chapter briefly describesthe technique, and evaluation of the posteriorsegment eye diseases using B-scan contactultrasonography. Care is taken to describe theultrasonic features of commonly seen vitreoretinaldiseases with representative illustrations. Anacquaintance with the technique andinterpretation is imperative to appreciate thetechnical potential of ocular ultrasound.
Physics and Basic TechnologyUltrasound consists of high frequency soundwaves over 20,000 cycles per second or 20
kilohertz (kHz). The tissue ultrasound interactionconsists of reflection (and refraction), scattering,and absorption of the sound energy.
Reflection and Refraction
When the pulse of ultrasound energy meets alarge smooth boundary between two tissues thatdiffer in physical properties, some of the incidentpulse energy may be reflected between the twomedia. This part of the pulse energy is redirectedin a specific direction back into the original tissuewith the same speed with which it approachedthe boundary; some energy, however, continuesto be transmitted forward into the tissue beyondthe boundary, with the speed of propagationdetermined by the medium. If the incident pulsestrikes the boundary perpendicularly, thereflected energy will be maximal and thetransmitted pulse will propagate forward withnone or minimal change in direction. If theboundary is approached obliquely by the incidentpulse, then the reflected pulse will be reducedand the transmitted pulse will be refracted.
Scattering
Scattering of ultrasonic energy occurs both atrough interfaces between different tissues and

240 Diagnostic Procedures in Ophthalmology
different homogeneity of density or elasticitywithin a tissue. It can be considered to be theredirection of the incident ultrasound energy intomany directions. There is no particular directionascribed to the reflected energy, but a continuumof directions. In true scattering no energy is lostfrom the pulse, but the energy is redirected.
Absorption
In the ocular tissues, an ultrasound pulse losesenergy due to conversion of the vibrational energyof the pulse to other energy forms such as heat.The mechanisms of absorption in media are notproperly understood; different tissues exhibitdifferent frequency dependent absorptions.Ophthalmic ultrasonography utilizes 8-10 MHzsound waves. As it travels through the eye, itis reflected by the intraocular structures, and theechoes or the signals are returned to the screen.
Ultrasound UnitAn ultrasound unit is composed of four basicelements: the pulser, the receiver, and the displayunit are all contained within the same chassisand connected to the transducer, located at thetip of the probe by an electrically shielded cable.The pulser produces electric pulse at a rate of1000 pulses per second. Each pulse excites theelectrodes of the piezo-electric crystal of thetransducer, generating sound waves. Thereturning echoes are received by the transducerand transformed into electric signals. Thesesignals are processed in the receiver anddemodulator, and then displayed on the screenof the display unit.
Ophthalmic ultrasonography commonly usestwo modes of display—the A-scan, and B-scan.
A-scan or amplitude modulation scan providesone dimensional image of vertical deflectionsfrom a base line. The A-scan provides information
regarding structure (size, distribution),reflectivity (height of spikes), sound attenuation(absorption), and vascularity.
B-scan or brightness modulation scan providestwo dimensional images of a series of dots andlines. B-scan provides the topographicinformation of shape, location, extension,mobility, and gross estimation of thickness ofthe tissue. While independently each mode ofultrasonography do provide a wealth ofinformation, the combination of both A- and B-scan (Vector A-scan) is invaluable in a varietyof occasions where diagnostic dilemma exists.In vector display the A-scan pattern correspondsto the vector’s direction. The vector B-scan usesa focused 10 MHz transducer in contrast to8 MHz unfocused transducer used instandardized A-scan.
Three-dimensional ultrasound tomographyof the eye is a new advanced ultrasoundtechnique and digital computer technology whereocular pathology can now be viewed in “3D”.The sonographer scans the eye using a regularB-scan ultrasound probe which is inserted intothe motorized scanner assembly. This in turnrotates the probe allowing the computer to acquireover 200 B-scan images in 5 to 10 seconds. Usingdigital technology, the 2D images and their globalpositions are recorded, reconstructed anddisplayed in real time as part of a 3D volume.
Three-dimensional ultrasound tomographyprovides the following benefits over the currentone- and two-dimensional evaluations:1. Improved visualization: Information is
presented in a format that reflects the 3Dnature of the pathology under examination.The multiple acquired scans in 3D imagingalso reduce the risk of missing a smallpathology that can be overlooked if the probeis not properly aimed toward it.
2. Volume measurements: The 3D examinationprovides volume measurement capabilities

241B-scan Ultrasonography
that surpass any of the volume estimationmethods available with conventional 2Dultrasound techniques. Accurate volumemeasurements of intraocular tumors allowthe physician to monitor changes over acertain period of time, i.e. growth of a smallchoroidal tumor, decrease in size of adisciform macular degeneration, or theresponse of a melanoma to radiation, laseror drug therapy.
3. Profile A-scan analysis: Using an S-shapedamplifier that allows an evaluation of theinternal echo-spikes an accurate linearmeasurement in any chosen direction can bemade.
4. Analysis of the volume-of-interest: Withmultidirectional slicing can show a tomo-graphic display of intraocular pathology.
5. Surface rendering with a three-dimensionalview: The surfaces and boundaries of theocular pathology can be made underexamination.
Screening TechniquesIt is best to begin with a maximum gain (80decibels) setting on the B-scan, with the patientlying on his back. The eye is anesthetized withtopical paracaine when the transducer can beplaced on the sclera; alternately, the probe canbe placed on the closed eyelid and in such asituation the eye need not be anesthetized. Theprobe is placed on the globe opposite the areato be examined. The marker on the probe actsas the orientation point and corresponds to theupper portion of the echogram. To evaluate thesuperior and inferior fundus the marker isdirected towards the nose (horizontal transverse),and to evaluate the nasal and temporal fundus,the marker is directed at 12 o’clock meridian(vertical transverse). The best detail of pathologyis obtained in the central portion of the echogram;
if the pathology is not located in one of the majormeridians (3, 6, 9, 12 o’clock) an obliquetransverse scan can be used to evaluate thepathology. In order to completely scan the eyeit is prudent to first direct the probe face at thelimbus, and then slowly shift to the fornix. Thusone could evaluate from the posterior pole tothe periphery in each quadrant. Once the cross-sectional evaluation is completed, the area ofinterest is scanned by longitudinal scan.Longitudinal scans allow for evaluation of asingle meridian from its most posterior aspectto the far periphery. This is accomplished bydirecting the marker at the corneal limbusopposite the area to be examined. Axial scanprovides a pleasing, generally understandablepicture; however, it requires placement of theprobe directly on the cornea and thus the riskof corneal abrasion increases.
A-scan produces a series of deflections fromthe base line. The amplitude of the spike is directlyrelated to the density of the interface, and thespace between the spikes indicates the time ittakes for the sound to encounter an interfaceand return as a signal.
Screening Technique with a 3D Unit
To begin scanning with 3D-unit, the operatoreither presses a foot switch or may press theon-screen scan button. The scanner assemblyrotates for several seconds (5, 7.5, or 15 accordingto the chosen scan type), and then return to itsstarting position. The system emits a beep toneat the start and end of actual scanning period,during which fixation must be maintained. Afterscanning, the images become static, the recordedinitial scan plane images replace the line B-scandisplay. Several buttons appear on the right sideof screen, which allow the operator to reviewthe recorded images and send to the 3D reviewingmode.

242 Diagnostic Procedures in Ophthalmology
3D Scan Review
Activating the 3D viewing function produces ascreen, where central part of the screen showsthe polyhedron (cube), with its sides positionedat the extreme borders of the scanned volume.The view is initially oriented as seen by theultrasound probe, i.e. the near field is in frontand the far field is behind. The 3D viewingsoftware includes many functions.
The Normal Eye
Examination of a normal globe at high systemsensitivity reveals two echographic areas,separated by an echo free area. The echographicarea at the beginning of the scan representsreverberations at the tip of the probe and has noclinical significance. When the scan resolution isgood, one could see the posterior convex structureof the crystalline lens. The large echo free arearepresents the vitreous cavity. The echogenic areaafter the vitreous represents the retina, choroid,sclera, and the orbital tissue behind it. The retinais seen as a concave surface proximally. The opticnerve shadow is seen as a triangular shadowwithin the orbital fat (Fig. 15.1).
Evaluation of the Vitreous
A maximum high gain should be used forevaluation of the vitreous humor. The normalvitreous cavity is devoid of any acoustic signalsand appears black or sonolucent on the B-scan.On the A-scan the baseline remains flatthroughout the scan. During normal aging thevitreous begins to degenerate, and varyingamounts of opacities are seen. Also there maybe significant contracture of the vitreous gelleading to complete separation of the posteriorhyaloid.
Asteroid Hyalosis
Asteroid hyalosis, a unilateral conditioncharacterized by formation of calcium soapswithin the vitreous cavity, appears as brightround signals on B-scan, and medium amplitudespikes in A-scan, with an echo free space justin front of the retina that represents the echo-free vitreous gel (Fig. 15.2). This is in contrastto an eye with emulsified silicone oil, where thereis no echo-free space. Generally, these opacitiesexhibit distinct movement on movement of theeye.
Fig. 15.1: Normal globe: Ultrasonogram shows an echolucent vitreous cavity, concave retinochoroidal layer and the triangular shadow of the optic nerve

243B-scan Ultrasonography
Fig. 15.2: Asteroid hyalosis: Bright round signals seen on B-scan with echo freespace separating them from the retina
Posterior Vitreous Detachment
Posterior vitreous detachment (PVD) appears asan undulating membrane in front of theretinochoroidal layer that moves with movementof the eye. It may separate completely from theposterior pole or may remain attached to theoptic disk. On A-scan it appears as a tall spike,but not as tall as the spike of a retinal detachment(RD) or a retained intraocular foreign body. Theheight of the A-scan spike and the brightness
of B-scan of PVD reduce as the gain is reduced;in contrast the RD maintains its 100% reflectivityall the time. Kinetic scanning is also usefulwhere a PVD shows wafting after-movements(Fig. 15.3). PVD may be complete or incomplete.It is incomplete in most of the vascular retino-pathies associated with vitreous hemorrhage,particularly proliferative diabetic retinopathy(PDR). One could also image vitreoschisis thatusually occurs in PDR.
Fig. 15.3: Posterior vitreous detachment (PVD): B-scan shows an undulating membrane in front of the retinochoroidallayer attached to the optic disk. The configuration of the detached vitreous is changed with the movementof the eye (right)

244 Diagnostic Procedures in Ophthalmology
Vitreous Hemorrhage
The ultrasonic pattern of vitreous hemorrhagedepends on the density, location, extent, andassociated fibrous changes. The density ofhemorrhage is best estimated from the A-scanamplitude and the area of vitreous hemorrhagefrom B-scan. Hemorrhage in the vitreous appearsas small white echoes on B-scan and lowamplitude spikes on A-scan. With greater densityof vitreous hemorrhage, usually greater opacitiesare seen on the B-scan. A fresh diffuse andunclotted hemorrhage produces very little or noecho response so that many time the vitreousmight appear sonolucent. Membranes are easilydifferentiated from blood clots by their patterns,and the height of the echoes.
One can also image the location of vitreoushemorrhage such as confined within the PVD, pre-and post-hyaloid location, or diffusely dispersed(Fig. 15.4). One can also differentiate old clottedblood from fresh hemorrhage. We have earlierreported that the overall accuracy of ultrasonicdiagnosis of vitreous hemorrhage and retinaldetachment in opaque media vis-a-vis the intra-and postoperative findings were nearly 92%.3
Subhyaloid hemorrhage typically does notclot. On echography, high gain settings are often
required to detect mild subhyaloid hemorrhage.However, dense subhyaloid hemorrhage showshigh echo reflectivity (Fig. 15.5).
Endophthalmitis
Ultrasonography of the eye with endophthalmitisdepends on the degree and severity of infectionand the extent of vitreous involvement. Generallyopacities are noted, and membrane formationbecomes apparent in severe cases. Choroidalthickening, choroidal detachment, retinaldetachment and retained IOFB are possibleassociated findings (Fig. 15.6).
Evaluation of the Retina
The retina appears as a dense membrane onB-scan, and in normal circumstances one cannot differentiate retina from the choroid. OnA-scan it typically gives a 100% tall spike.
Retinal Detachment
Retinal detachment appears as tall (100%amplitude) spike separated from the choroido-scleral layer; it is attached, however, to the opticnerve and the ora serrata. By serial scanning
Fig. 15.4: Vitreous hemorrhage: Intragel and subhyaloid in location and theposterior vitreous is partially detached

245B-scan Ultrasonography
Fig. 15.6: Endophthalmitis: Ultrasonogram shows low to mediumechoreflective vitreous opacities with choroidal thickening
the extent of retinal detachment can bedetermined. Recent retinal detachments arecharacterized by a mobile retina and translucentsubretinal space (Fig. 15.7).
With time when the proliferative vitreoretino-pathy (PVR)4 sets in, the vitreous space becomes
limited, there is decreased mobility of the retinain kinetic scanning, and membranes form andadhere to the retina from all sides. This causesa variety of configurations in the B-scan andthe most prominent one is the funnel confi-guration of the detached retina (Fig. 15.8 ). Two
Figs 15.5A to D: B-scan of posterior hyaloid detachment. A shows a high echoreflectivity dueto thickening of posterior hyaloid with medium echo reflectivity due to less dense subhyaloidhemorrhage. Corresponding A-scan, B shows initial high reflective spike with low to medium echospikes.In contrast, dense subhyaloid hemorrhage, C shows high echo reflectivity and correspondingA scan, D shows medium to high echoreflectivity

246 Diagnostic Procedures in Ophthalmology
Fig. 15.7: Retinal detachment (fresh): B-scan shows detached retina as a thin, attached to theoptic disc and fanning peripherally. Vector A-scan showing a tall, highly echoreflective spike signifyinga retinal detachment. The subretinal space in fresh retinal detachment is usually sonolucent
Fig. 15.8: Closed funnel retinal detachment: Ultrasound shows a detached thick retina in a triangularconfiguration, with apposition of the sides of the triangle in front of the optic disc
configurations—open, and closed funnel aredescribed in PVR. In triangular retinal detach-ment the sides of the triangle represent the highlydetached stiff retina, and the base of the triangleis the proliferating vitreous membrane.
An attempt was made to ultrasonicallydifferentiate advanced grades of PVR.5 In PVRC1 the detached retinal leaves are thickened, andthe subretinal space is sonolucent in contrastto PVR C2 and C3 where the subretinal spaceis not sonolucent. In PVR D1 and D2 the retinalleaves are thickened and shortened andsubretinal space is no longer sonolucent. In PVRD3 three configurations are observed—triangular,morning glory, and T-shape.
Long-standing retinal detachments may alsodevelop retinal cysts (Fig. 15.9) and becomepartially calcified, and cholesterol debris mayaccumulate in the subretinal space. It is importantto remember that an axial B-scan view may notalways demonstrate the insertion of a retinaldetachment into the optic nerve. Therefore, alongitudinal approach should be used toproperly assess the relationship of a membraneto the optic nerve.
Retinal Tear
Large retinal tears can be visualized easily, butthe smaller ones require a meticulous examina-

247B-scan Ultrasonography
Traction Retinal Detachment
Traction detachment is a common finding invascular retinopathies, chiefly diabeticretinopathy. It is caused by the strong adhesionof vitreous membranes, bands, or the posteriorhyaloid face to the retina and subsequent traction.The vitreoretinal adhesion could be focal causinga tent-like, or broad, causing a table-top tractionof the retina (Fig. 15.11); the detached retinaappears to have a concave configuration, incontrast to the convex configuration of therhegmatogenous retinal detachment.
Exudative Retinal Detachment
The configuration of the detachment is convexand bullous. It is usually secondary to tumors,inflammatory conditions, e.g. Vogt-Koyanagi-Harada disease (VKH), or vascular disorderssuch as hypertensive choroidopathy, and toxemiaof pregnancy. In VKH syndrome there is a diffusechoroidal thickening with low to medium echoreflectivity (Fig. 15.12).
Retinoschisis
This condition most often involves theinferotemporal peripheral fundus. It may be
Fig. 15.9: Longitudinal B-scan shows formation of intraretinalcysts (white arrow) and retinal detachment with highreflective surface spikes on corresponding A-scan. Oftenintraretinal cysts may mimic a tractional retinal detachment
Fig. 15.10: Retinal tear: B-scan showing a breach ofretinal tissue. Vitreous is attached to this breach of tissuesuggesting the element of traction in causing retinal tear
tion. It appears as a breach of tissue on B-scan,and on A-scan it appears as a highly reflectivetissue separate from the other fundus spikes (Fig.15.10). Giant retinal break with detachmentappears as a rolled out tissue on B-scan withclear breach of tissue. In general, however,detecting retinal tears on ultrasonography is noteasy and it is never as specific or sensitive ason optical evaluation. It is useful in situationswhen fresh vitreous hemorrhage due to retinaltear obscures the fundus view; in these situationsthe retinal tears are mostly located in the upperhalf of the retina.

248 Diagnostic Procedures in Ophthalmology
Fig. 15.11: Tractional retinal detachment: B-scan shows a concave configuration of the retina witha broad area of vitreoretinal adhesion signifying a table-top traction of the retina. The correspondingvector A-scan showing a highly reflective spike, signifying RD
Fig. 15.12: Exudative retinal detachment and choroidal thickening in VKH syndrome: B-scan showsdiffuse choroidal thickening (better appreciated at the low gain of 77.0 dB), with overlying exudativeRD. Corresponding vector A-scan shows a highly reflective spike signifying retinal detachment andlow to medium reflective spikes behind it signifying choroidal thickening

249B-scan Ultrasonography
Fig. 15.14: Subretinal cysticercosis: B-scan shows a sharply outlined cyst in the subretinal space,with a bright spot adjacent to the inner wall corresponding to the scolex. The vector A-scan throughthe scolex shows a tall and highly reflective spike
unilateral or bilateral. On B-scan it appears assmooth, thin, dome-shaped membrane that doesnot insert in the optic disc (Fig. 15.13). On A-scan, 100% high spike is produced, which may
demonstrate slight vertical after movement. Itdiffers from retinal detachment by its more focal,smooth and thin character. A choroidaldetachment is thicker than retinoschisis and mayhave a double peaked spike.
Cysticercosis
There is a characteristic echographic appearancewith a sharply outlined, oval cyst within thevitreous cavity and/or in the subretinal space(Fig. 15.14). The scolex of the parasite is seenas a very highly reflective, echo-dense nodulethat is located adjacent to the inner wall of thecyst.
Evaluation of the Choroid
The retinochoroidal layer has a smooth concaveconfiguration on B-scan and gives a tall spikeon A-scan.
Choroidal Thickening
Thickening of choroid can be localized or diffuse,and is seen in a number of conditions. Theyinclude posterior uveitis, sympathetic ophthal-mia, Vogt-Koyanagi-Harada disease, late stageof endophthalmitis and uveal effusion syndrome.
Fig. 15.13: Retinoschisis: Transverse B-scan shows amoderately elevated thin smooth dome-shaped membraneecho (arrow) located in the inferotemporal periphery. Verythin 100% spike is also seen on A scan

250 Diagnostic Procedures in Ophthalmology
Fig. 15.15: Choroidal detachment: B-scan shows smooth, dome-shaped, thick membranous structure.The corresponding vector A-scan, shows a series of medium to high reflective spikes behind the retinalspike with a sonolucent suprachoroidal space
Choroidal Detachment
On B-scan a choroidal detachment appears asa smooth, dome-shaped, thick membranousstructure that does not insert to the optic nerve(Fig. 15.15). The choroidal detachment can belocalized, or involve the entire fundus (kissing
choroidal detachment). The B-scan also candemonstrate the nature of suprachoroidal fluid;in serous detachment, the suprachoroidal spaceis echo-lucent, and in hemorrhagic detachment,the suprachoroidal space is echo-dense.
On A-scan the thickened choroid appears asa series of high reflective spikes just behind theretinal spike. The detached choroid produces a100% reflective, double peaked spike (retina andchoroid together). This spike exhibits little or noafter movement on kinetic scanning. Thesuprachoroidal space appears sonolucent or withlow to medium height spikes depending on thenature of suprachoroidal fluid.
Evaluation of Traumatized Eye
Ultrasonography adequately supplements thecareful and meticulous evaluation a traumatizedeye needs.6 Very often indirect ophthalmoscopyis not useful because of media opacity, or poor
patient cooperation. Ultrasonography permitsevaluation of the intraocular structures, locatinga retained intraocular foreign body, andidentifying any posterior wall disruption.
Vitreous Hemorrhage
The ultrasonic character of vitreous hemorrhageis not different than vitreous hemorrhage in non-traumatic conditions. However, a large retinaldialysis can be easily detected. Occasionally thetrail of hemorrhage in the solid vitreous can betraced to the site of bleeding such as avulsionof major vessel or scleral rupture (Fig. 15.16).
Fig. 15.16: Traumatic vitreous hemorrhage: Intravitreousgel trail of traumatic vitreous hemorrhage. B-scan showslinearly placed bright spots in the vitreous cavity, leadingto site of retinal vessel avulsion causing vitreous hemorrhage

251B-scan Ultrasonography
Fig. 15.17: Dislocated lens: B-scan shows a globularstructure in the posterior vitreous signifying a dislocatedlens. Acoustic shadowing is seen, implying that the lenscould be cataractous or calcified
Dislocated Lens
Dislocated lens appears as a round or ovalglobular structure in the posterior vitreous, and
Fig. 15.18: Intraocular foreign body: B-scan shows a bright signal in front of the opticdisk in the posterior vitreous, with a high 100% reflectivity on vector A-scan, that persistson lowering of the gain. Orbital shadowing is also seen at low gain
strands of vitreous might be attached to thedislocated lens (Fig. 15.17).
Intraocular Foreign Body
Ultrasonography can detect both metallic andnon-metallic foreign bodies. Metallic foreignbodies produce very bright signals on B-scanthat persist on lowering the gain (Fig. 15.18).When the sound beam is focused on the metallicforeign body, much of the sound waves areabsorbed by the foreign body, thus creating ashadowing artifact on the adjacent orbit. Roundmetallic foreign bodies classically producereverberation artifact just behind the foreign body,and the sound signals gradually reduce as itprogresses to the orbit. On A-scan metallic foreignbodies produce high (100%) reflective echoes,and reduplication echoes are seen as progres-sively decreasing amplitude spikes behind the

252 Diagnostic Procedures in Ophthalmology
round metallic foreign body. Glass and vegetativematter (radiolucent) are more challenging, butthey also produce bright signals on B-scan, andtall reflective echo on A-scan.
Posterior Globe Rupture
Traumatic posterior globe rupture (Fig. 15.19)is seen as a breach of scleral and choroidal tissuewith associated choroidal thickening. Associatedfindings may be vitreous hemorrhage, retainedintraocular or orbital foreign body, and retinaldetachment.
Optic Nerve Avulsion
This is seen secondary to trauma. In acute injury,vitreous hemorrhage may be present, and anactual peripapillary scleral break may be seenin B-scan (Fig. 15.20). In long-standing cases,there may be proliferative tissue at the optic disk.
Evaluation of Intraocular Tumors
The intraocular tumors display different acousticcharacteristics on ultrasonography because oftheir vast difference in histologic composition.B-scan provides information on topographic
features such as shape, location, and extension.A-scan provides information on structure,reflectivity, vascularity, and height. Serialultrasonography is useful in measuring theheight and growth of the tumor over a periodof time.
Melanoma
Ultrasonically melanomas appear as solid,regularly structured, vascular lesions of low tomedium reflectivity. Vascularity of the tumor iswell appreciated as distinct spontaneous
Fig. 15.19: Posterior globe rupture: B-scan shows breach of scleral tissue withecholucent space in the subTenon’s space signifying fluid
Fig. 15.20: Optic nerve avulsion: B-scan shows a scleralbreak near the optic disk signifying optic nerve avulsion

253B-scan Ultrasonography
movements of the lesion spikes duringexamination in A-scan. While the most commonshapes are a dome or collar-button, they can alsobe diffuse. A collar-button shape signifies ruptureof Bruch’s membrane, and it is usually associatedwith retinal detachment (Fig. 15.21). There canbe other signs such as acoustic hollowing(decreased reflectivity at the tumor base due touniform echotexture of the tumor), choroidalexcavation at the tumor base and posterior scleralbowing (noted in younger individuals).
Metastatic Choroidal Carcinoma
On B-scan metastatic choroidal carcinomasappear diffuse; they have a typical bumpy,
irregular contour, with a central elevation. Theyhave medium to high reflectivity, with minimalto none internal vascularity. The large interfacebetween the choroidal tissue and the carcinomamass is responsible for the high reflectivity. OnA-scan, irregular spikes of medium to highamplitudes are seen.
Choroidal Hemangioma
These tumors appear as a flat, echogenic, solid,subretinal mass, often located at the posteriorpole, with minimal sound attenuation, with orwithout concomitant exudative retinaldetachment (Fig. 15.22).
On A-scan, it has a regular acoustic structurewith very high (95-100%) internal reflectivity,that results from the large interfaces formed bythe vessel surfaces. By reducing the gain, thevascularity of the tumor can be better appreciated.
Retinoblastoma
On B-scan retinoblastoma, if large, is seen asan irregular echogenic mass involving thevitreous, retina, and/or the subretinal space. Areaof calcification is seen as area of high echoge-nicity. This causes strong sound attenuation, andis seen as an area of echolucency behind thecalcification (Fig. 15.23). This is because the
Fig. 15.21: Choroidal melanoma: B-scan shows a collar-button-shaped mass from the choroid into the vitreouscavity
Fig. 15.22: Choroidal hemangioma: Left—On B-scan, a flat echogenic solid subretinal massis seen with concomitant exudative retinal detachment of 4.16 mm thickness. Right—Adecrease in thickness is seen after photocoagulation

254 Diagnostic Procedures in Ophthalmology
Fig. 15.23: Retinoblastoma: B-scan shows an irregular, large echogenic mass involving the vitreousfrom the retina. Corresponding vector A-scan shows high internal reflectivity (70 to 90%), dueto spots of calcification
sound is almost totally reflected by calcification,thus preventing its further propagation beyond.On A-scan, the characteristic features are solidconsistency (absence of after movementsfollowing a sudden ocular movement), highinternal reflectivity (70-90%), and presence ofvascularity. High internal reflectivity is due tocalcification and the large interface between areaof necrosis and viable tumor cells.7 The axiallength of the eye may be normal or increasedin case the tumor invades the ocular wall. Theincreased axial length is thus an important pointin differentiating retinoblastoma from otherconditions causing leukocoria.
Disciform Macular Scar (Secondary toAge-related Macular Degeneration)Disciform macular scar is often confused withchoroidal melanoma due to its subretinal
location, and solid consistency, it can bedifferentiated by its irregular acoustic structure,medium to high reflectivity, absence ofvascularity, and rarity of associated retinaldetachment (Fig. 15.24).
Structural Anomalies
Structural anomalies of globe include phthisisbulbi, atrophic bulbi, posterior staphyloma,choroidal coloboma, optic nerve head drusenand anophthalmos.
Phthisis Bulbi
In phthisis bulbi the globe is smaller than normalwith multiple echogenic vitreous opacities,choroidal thickening, and calcification of ocularcoats, with resultant absence of high reflectiveorbital echospikes due to shadowing (Fig. 15.25).

255B-scan Ultrasonography
Atrophic Bulbi
Atrophic bulbi is characterized by a normal globecontour with calcification of ocular coats (Fig.15.26). It has normal axial length.
Posterior Staphyloma
Posterior staphyloma is seen as a shallowexcavation of the posterior pole with smoothedges on sonographic evaluation of highlymyopic eyes.
Choroidal Coloboma
Choroidal coloboma is seen as an excavation,usually involving the posterior pole; but incontrast to posterior staphyloma, its edges aresharp. Associated findings include micro-phthalmos, and retinal detachment.
Optic Nerve Drusen
Optic nerve drusen are calcified nodules seenechographically to produce an echo of extremely
Fig. 15.24: Disciform macular scar: B-scan shows a solid subretinal lesion. In contrast to amelanoma, it has an irregular acoustic structure, and medium to high reflectivity in the correspondingvector A-scan
Fig. 15.25: Phthisis bulbi: B-scan shows a smaller than normal globe, with multiple echogenic vitreousopacities and calcification of ocular coats. The corresponding vector A-scan shows the resultantorbital shadowing

256 Diagnostic Procedures in Ophthalmology
Fig. 15.26: Atrophic bulbi: Ultrasonogram shows a normal globe contourwith calcification of the ocular coats
Fig. 15.27: Optic nerve head drusen: B-scan showing bright echogenic spot over the optic disk.Corresponding vector A-scan showing a highly reflective spike that persists on lowering the gain

257B-scan Ultrasonography
high reflectivity at or within the optic nerve head.They are best seen with transverse andlongitudinal B-scan approaches, which bypassthe lens, and demonstrate the calcified nodulesbetter than the axial approach (Fig. 15.27).
Optic Nerve Head Coloboma
Coloboma involving the optic disk is easilyimaged by B-scan. These can be small andshallow. The sharp edge of the defect margindifferentiates a coloboma from a staphyloma onultrasonography (Fig. 15.28).
Immersion B-scanImmersion B-scan is used to study the anteriorsegment structures (Fig. 15.29). A water bath isused to incorporate the delay zone.
Ophthalmic ultrasonography is an invalu-able tool in diagnosis and evaluation of theposterior segment of the eye. Knowledge ofvarious features and appropriate clinical corre-lation is essential to gain maximum informationfrom this technology.
Fig. 15.28: Optic nerve head coloboma: Horizontal B-scan showing sharp defect over the optic disk areasuggestive of coloboma of the optic disk
Fig.15.29: Left: Immersion B-scan shows a total cataract withintact posterior capsule. Right:Immersion B-scan showingpartially absorbed cataractouslens. Note the thickness of thelens and increased reflectivity ofthe posterior capsule

258 Diagnostic Procedures in Ophthalmology
References1. Mundt GH, Huges WF. Ultrasonic in ocular
diagnosis. Am J Ophthalmol 1956;41:488-98.2. Das T, Namperumalsamy P: Ocular ultrasound
in preoperative evaluation of posterior segmentof the eye. Indian J Ophthalmol 1983;31:1022-24.
3. Das T, Namperumalsamy P. Ultrasonographiccharacterisation of vitreous hemorrhage andretinal detachment. Afro-Asian J Ophthalmol1985;4:10-16.
4. The Retina Society Terminology Committee.The classification of retinal detachment withproliferative vitreoretinopathy. Ophthalmology1983;90:121-25.
5. Das T, Namperumalsamy P. Ultrasonic charac-terisation of proliferative vitreoretinopathy.Afro-Asian J Ophthalmol 1987;5:180-85.
6. Das T, Namperumalsamy P. Ultrasonographyin ocular trauma. Indian J Ophthalmol 1987;35:121-25.
7. Das T, Namperumalsamy P. Ultrasonic evalua-tion of retinoblastoma. Afro-Asian J Ophthalmol1986;5:4-10.
Bibliography1. Coleman DJ, Lizzi FL, Jack RL (Eds). Ultrasono-
graphy of the eye and orbit. Philadelphia, Leaand Febiger, 1977.
2. Shammas HJ. Atlas of Ophthalmic Ultrasono-graphy and Biometry. St Louis: CV Mosby Co,1984.

259Ultrasound Biomicroscopy in Ophthalmology
ROSHMI GUPTA, K KALYANI PRASAD, MOHAN RAM, SANTOSH G HONAVAR
UltrasoundBiomicroscopy inOphthalmology16
Ultrasound biomicroscopy (UBM) uses highfrequency sound waves to provide noninvasivein vivo imaging of the anterior segment withmicroscopic resolution. It acts on a principlesimilar to that of the B-scan; sound waves inthe ultrasonic range are reflected off the structureof interest, and the reflected waves form images.However, frequency of the waves used in theUBM range between 35 and 50 MHz, while theophthalmic B-scan probes generate sound wavesof 10 MHz frequency. The B-scan, with a lowerfrequency, has better penetration, and can imagestructures of the posterior segment well. Anteriorsegment structures can be visualized only bythe immersion technique, the resolution beingpoor compared to the UBM. The UBM, withhigher frequency sound waves, can penetrateonly about 5 mm into the eye; however, it canform images of the anterior segment with a muchbetter resolution than the B-scan. UBM can beused to image and assess the morphology ofstructures easily seen on conventional exami-nation (with slit-lamp) such as cornea, iris andsclera, as well as structures hidden from clinicalobservation, including the ciliary body andzonule. The normal anatomical relations andpathophysiologic changes in the anteriorsegment structures can be examined both
qualitatively and quantitatively with the helpof UBM.
Basic Physics and InstrumentationSignal processing for ultrasound biomicroscopeis similar to that in conventional B-modeultrasound. A monocycle high voltage (200Vpeak to peak) 40 to 100 MHz pulse is used toexcite the transducer. The resulting 40-100 MHzultrasound pulse is transmitted into the tissuewhile the transducer is moved linearly over theimaging field (typically 4-8 mm). The commer-cially available machines use 50 or 35 MHztransducers. The back-scattered ultrasound isdetected by the same transducer, the data beingcollected at each of 512 equally spaced lines.
The radio-frequency signal is received andamplified in proportion to the depth from whichit originated using time-gain compensation(TGC). That is the signals from deeper structuresare amplified more than those from moresuperficial structures, thus compensating for theattenuation of the ultrasound beam in the tissue.After the radio-frequency signals are processednon-linearly to enhance the low level signals,its envelope is detected to produce an A-scan
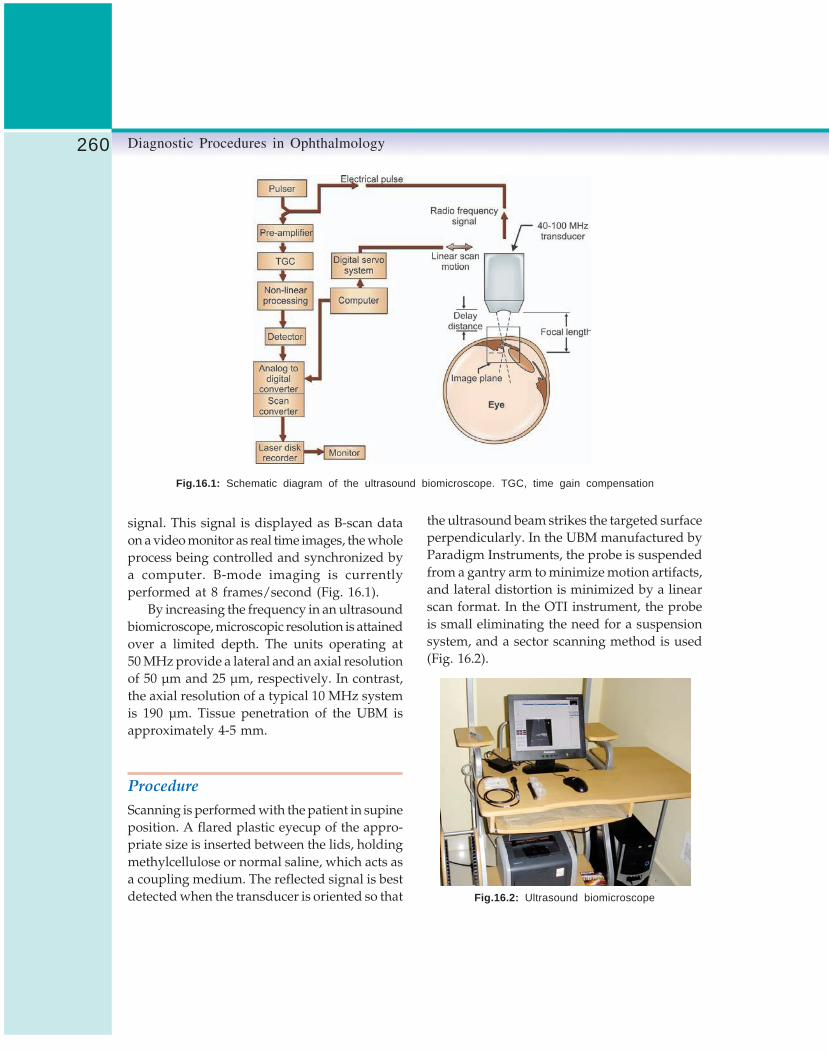
260 Diagnostic Procedures in Ophthalmology
Fig.16.1: Schematic diagram of the ultrasound biomicroscope. TGC, time gain compensation
signal. This signal is displayed as B-scan dataon a video monitor as real time images, the wholeprocess being controlled and synchronized bya computer. B-mode imaging is currentlyperformed at 8 frames/second (Fig. 16.1).
By increasing the frequency in an ultrasoundbiomicroscope, microscopic resolution is attainedover a limited depth. The units operating at50 MHz provide a lateral and an axial resolutionof 50 μm and 25 μm, respectively. In contrast,the axial resolution of a typical 10 MHz systemis 190 μm. Tissue penetration of the UBM isapproximately 4-5 mm.
ProcedureScanning is performed with the patient in supineposition. A flared plastic eyecup of the appro-priate size is inserted between the lids, holdingmethylcellulose or normal saline, which acts asa coupling medium. The reflected signal is bestdetected when the transducer is oriented so that
the ultrasound beam strikes the targeted surfaceperpendicularly. In the UBM manufactured byParadigm Instruments, the probe is suspendedfrom a gantry arm to minimize motion artifacts,and lateral distortion is minimized by a linearscan format. In the OTI instrument, the probeis small eliminating the need for a suspensionsystem, and a sector scanning method is used(Fig. 16.2).
Fig.16.2: Ultrasound biomicroscope

261Ultrasound Biomicroscopy in Ophthalmology
Fig.16.3: UBM photograph showing normal ocularstructures, cornea, corneoscleral junction, sclera, anteriorchamber angle, iris, ciliary body and anterior surface oflens
Ultrasound Biomicroscopic Anatomyof the Normal Eye and AdnexaThe appearance of ocular anatomy on ultrasoundbiomicroscopy is similar to a low powermicroscopic section (Fig. 16.3). The superficialcornea appears as two parallel highly reflectivelines; the first indicating the epithelial surface andthe second the Bowman’s membrane. The cornealstroma shows a lower internal reflectivity than thesclera. The posterior corneal surface is depicted bya high reflective line corresponding to theendothelium and the Descemet’s membrane.
The anterior chamber can be outlined andits depth to the lens or iris at any point canbe determined. The angle structures are welloutlined by ultrasound biomicroscopy.
The corneoscleral junction can be definedwell. The sclera has a high internal reflectivitydue to the irregular arrangement of the collagenbundles. The high reflectivity of the scleradifferentiates it from the less reflective episcleraltissue, ciliary body and peripheral choroid.
The scleral spur (thickest region) is locatedwhere the trabecular meshwork meets theinterface line between the sclera and ciliary body.It is utilized as a landmark for interpreting UBMimages of the anterior chamber angle andanalyzing angle pathology.
The entire ciliary body can be defined fromthe ciliary processes to the pars plana. The zonuleis imaged as a medium reflective line extendingfrom the ciliary process to the lens surface.
Quantitative UltrasoundBiomicroscopyThe ultrasound biomicroscopy provides preciseand reliable measurements and relationships ofthe anterior segment structures. The UBMmeasurement software measures distance bycounting the number of pixels along themeasured line, and multiply it by the theoreticalsize of the pixel. The theoretical precision ofmeasurement of the lateral and axial distancesin the commercially available machines is 6 and12 μm, respectively, while the resolutions of thetwo are 50 and 25 μm. The UBM cannotdistinguish between two points along an axialline which are less than 25 μm apart, but if thepoints are more than 25 μm apart, the distancebetween them can be measured with 6 μmprecision. The axial and lateral measurementsof the UBM are accurate and reliable, as comparedto histologic sections and ultrasound pachymetry.
The reproducibility is good in intra-observerUBM measurements, but not in the inter-observervalues. Both image acquisition differences andmeasurement process contribute to the variability.A semiautomated software that calculates theparameters after a single user input of a referencelocation has improved the reproducibility.
Multiple parameters have been proposed tofacilitate the quantitative study of UBMmeasurements (Table 16.1).
Clinical Applications of UBM
Keratoplasty
The UBM may be useful in imaging underlyingstructures and defining the state of the angle

262 Diagnostic Procedures in Ophthalmology
TABLE 16.1: PARAMETERS OF QUANTITATIVE ULTRASOUND BIOMICROSCOPY (PAVLIN ET AL)
Name Abbreviation Description
Angle opening distance AOD Distance between the trabecular meshwork and the irisat 500 μm anterior to the scleral spur
Trabecular-iris angle TIA θ 1 Angle of AC angle recess
Trabecular-ciliary TCPD Distance between the trabecular meshwork and the ciliaryprocess distance process at 500 μm anterior to the scleral spur
Iris thickness ID1 Iris thickness at 500 μm anterior to the scleral spur
Iris thickness ID2 Iris thickness at 2 mm from the iris root
Iris thickness ID3 Maximum iris thickness near the pupillary edge
Iris-ciliary process distance ICPD Distance between the iris and the ciliary process alongthe line of TCPD
Iris-zonule distance IZD Distance between the iris and the zonule along the lineof TCPD
Iris-lens contact distance ILCD Contact distance between the iris and the lens
Iris-lens angle ILA θ 2 Angle between the iris and the lens near the pupillaryedge
of the anterior chamber prior to keratoplasty (Fig.16. 4). In corneal transplant cases, the graft-hostjunction can be defined. Posterior wound gapeand the Descemet’s stripping can also be imaged.
Fig.16.4: UBM of an eye with adherent leukoma:visualization of anterior chamber and other structure helpsplanning of management
Limbal Dermoid
Limbal dermoid can be well-delineated with thehelp of UBM. The extent of the dermoid into thecornea or intraocularly may be demonstrated,and the surgical approach for removal can beplanned (Fig. 16.5). The UBM is capable of
Fig.16.5: UBM of a limbal dermoid showing extensioninto the layers of the cornea, but no intraocular extension

263Ultrasound Biomicroscopy in Ophthalmology
detecting cystic as well as solid lesions of theconjunctiva. The margins of the lesion and theirintraocular extension can be defined. However,it is not yet possible to differentiate the differenttypes of solid and cystic tumors of the conjunctivabased on the UBM image alone.
Refractive Surgery
Excimer laser keratoablation results in a loss ofBowman’s membrane and double lines of thenormal corneal surface are converted into a singleline.
Intraocular Lenses
The location of optic and haptic of an intraocularlens can be assessed accurately by looking fora strong echo at their interface plane (Fig. 16.6).The technique is used to study different typesof intraocular lenses including accommodatingintraocular lenses. Studies have been conductedon angle-fixated, iris-fixated (Artisan) andposterior chamber phakic intraocular lensesusing the UBM. It is possible to assess distanceof phakic intraocular lenses from the cornealendothelium, iris, and the surface of the
crystalline lens, and the changes in the anatomicrelationships pre- and post-implantation ofdifferent types of lenses.
Glaucoma
The ability of ultrasound biomicroscopy, to imagevarious angle structures and the ciliary body,has helped to define mechanisms in various typesof glaucoma (Fig. 16.7).
Fig.16.6: UBM showing pupillary capture ofintraocular lens optic
Fig.16.7: Iris bombé in uveitic glaucoma: Accumulationof aqueous behind the iris balloons the iris forward
Relative Pupil Block Glaucoma
In primary angle-closure glaucoma (PACG), theangle closure results from relative pupillary block.The iris is always convex, with variable degreesof angle-closure (Figs 16.8A to C). It is possibleto quantify the area of iris-lens touch presentin this condition. The iris-lens touch is generallysmaller than that seen in normal patients.
Plateau Iris Syndrome
Peripheral angle-closure persists in plateau irissyndrome even in the presence of patentiridectomy. It has been shown by the ultrasoundbiomicroscopy that the peripheral iris issupported by an anterior positioning of the ciliary

264 Diagnostic Procedures in Ophthalmology
Fig.16.8A: UBM of an eye with a narrow-angle glaucoma
Fig.16.8B: UBM of the same eye after laseriridotomy, demonstrating opening of the angle
Fig.16.8C: Eye with angle-closure, UBM showing peripheralanterior synechiae, iridotomy is unlikely to be effectivein opening the angle
processes. The ciliary processes providestructural support behind the peripheral iris thatprevents it from falling away from the trabecularmeshwork following iridectomy. Peripheraliridoplasty can produce thinning of the iris inthis region improving angle opening (Figs 16.9Ato C).
Fig.16.9A: UBM of an eye with plateau iris configurationshowing narrow-angle due to anterior location of ciliaryprocesses
Fig. 16.9B: UBM showing plateau configuration ofiris with a closed-angle
Fig. 16.9C: UBM of the eye (shown in Fig. 16.9B)showing open-angle after laser iridoplasty
Supraciliary effusion can produce angle-closure by anterior rotation of the ciliary processesproducing direct angle-closure and pupil blocksecondary to the anterior position of the lens.Supraciliary fluid that is undetectable by othermeans can be detected by the UBM.
Ciliary Block Glaucoma
Ciliary block glaucoma has been studied by theultrasound biomicroscopy. Swelling or anterior

265Ultrasound Biomicroscopy in Ophthalmology
rotation of the ciliary body with forwardmovement of the lens-iris diaphragm andrelaxation of the zonular apparatus cause directangle-closure by morphologically pushing theiris against the trabecular meshwork. UBM oftenreveals a shallow supraciliary detachment notevident on routine B-scan examination.
Pigment Dispersion and PigmentaryGlaucoma
Pigment dispersion occurs most likely due tomechanical contact between the posterior irisand zonular pockets. The UBM demonstrates awide open-angle in pigmentary glaucoma. Theiris configuration is typically concave, with avariable amount of irido-zonular contact (Fig.16.10). The iris which is in apposition to theanterior lens capsule acts as a flap valve thatdoes not permit the flow of aqueous from theanterior chamber to the posterior chamber,thereby increasing the pressure in the anteriorchamber compared with the posterior chamber,a condition termed reverse pupillary block. It hasbeen shown both by clinical observation andultrasound biomicroscopic studies that miotics
and iridectomy can produce a straightening ofa bowed iris in this condition. It has also beendemonstrated by the ultrasound biomicroscopythat accommodation can produce iris bowingin pigmentary dispersion. With accommodation,the anterior surface of the lens moves forward(which increases anterior chamber aqueouspressure) resulting in the pressure reversal thatproduces posterior iris movement.
Failure of Filtering Surgery
Since it is possible to image the internal ostiumwith ultrasound biomicroscopy it can be helpfulin determining the causes of filtering surgeryfailure. The filtering bleb shows a spongyappearance on the ultrasound biomicroscopywith an occasional clear fluid space. The UBMcan accurately localize the site of obstructionto aqueous flow (Figs 16.11A and B). Sites ofpotential blockage include internal ostium(within the eye), beneath the scleral flap (withinthe surgical drainage tunnel), at the episclera
Fig.16.10: UBM showing irido-zonular contact due toposterior bowing of the iris in an eye with pigmentaryglaucoma
Fig. 16.11B: UBM showing scarred bleb (blackarrow) in failed trabeculectomy
Fig. 16.11A: UBM of eye after trabeculectomyshowing a filtering bleb (white arrow)

266 Diagnostic Procedures in Ophthalmology
(caused by scarring immediately above the scleralflap), and bleb encapsulation.
Ocular Trauma
Ocular trauma may result in hyphema, cyclodia-lysis, angle-recession and iridodialysis. UBM canbe used in the detection of these conditions,especially in the presence of hazy media. It can beused to locate a foreign body in the angle or the iris(Fig. 16.12). Persistent hypotony after oculartrauma may be due to cyclodialyisis (Fig. 16.13),or cyclitic membrane (Fig. 16.14). The diagnosismay be elucidated by the UBM.
Tumors of Uvea
Tumors of the iris, ciliary body and peripheralchoroid lie within the penetration limit of the
ultrasound biomicroscope. This imaging methodis valuable in measuring tumor thickness,defining tumor extent and differential diagnosis.
Iris Nevi
Iris nevi are benign tumors which do not requireany intervention. UBM is useful in measuringthe thickness and extent of nevus.
Leukemic Infiltration of Iris
UBM is valuable in measuring the stromalthickness in leukemic infiltration (Fig. 16.15A).It can also be used to assess the effect ofradiotherapy (Fig. 16.15B), and follow-up.
Iris Melanomas
Iris melanomas have varied clinical presenta-tions, and differentiation between melanomasand nevi can be difficult, requiring serialobservations. UBM is useful in defining the tumorboundaries and also detecting a change in itscharacteristics.
Fig.16.12: UBM showing a high-reflective foreignbody in ciliary body
Fig.16.13: UBM showing cyclodialysis cleft in aneye after blunt trauma (white arrow)
Fig.16.14: UBM demonstrating a cyclitic membranein an eye with persistent hypotony

267Ultrasound Biomicroscopy in Ophthalmology
Fig.16.15A: UBM showing leukemic infiltration of irisin a patient of leukemia in remission
Fig.16.15B: UBM of the same eye after externalbeam radiotherapy
Iris Cyst
The iridociliary junction is a common locationfor iris cysts. UBM is useful in differentiatingcysts from solid masses. The ultrasoundappearance consists of a thin-walled cyst withno internal reflectivity (Fig. 16.16).
Ciliary Body Tumor
The UBM is very helpful in differentiating purelyiris tumors from ciliary body tumors. Ciliary bodytumors can be defined and identified at a stagewhen they cannot be detected by conventionalultrasound (Fig. 16.17).
Peripheral Choroidal Tumors
The UBM cannot define the full extent of the
Fig.16.16: UBM showing ciliary body cyst
Fig.16.17: UBM of ciliary body tumor extendingthrough the angle into the anterior chamber and iris
peripheral choroidal tumors. The anterior borderscan be frequently detected and this informationcan be helpful if radioactive plaque therapy iscontemplated.
Scleral Diseases
UBM can differentiate between the diseases ofsclera proper and diseases of episclera.
Nodular Scleritis
The involvement of the sclera can be detectedby a change in the reflectivity of the scleral tissue.The edematous scleral tissue becomes weaklyreflective.

268 Diagnostic Procedures in Ophthalmology
Necrotizing Scleritis
Necrotizing scleritis implies thinning of the sclerasecondary to a destructive process. The UBMcan detect this thinning and provide a quanti-tative assessment of residual scleral tissue.
Scleral Staphyloma
The UBM can detect the thinning that occursin a scleral staphyloma and also the changesin the underlying ciliary body.
Episcleritis
Episcleritis appears as a thickening of theepiscleral layer without involvement of the scleraitself.
ConclusionThe strength of UBM lies in its ability to producecross-sections of the living eye at microscopicresolution without affecting the relationships ofthe structures imaged. It is a tool for qualitativeand quantitative assessment of the anteriorsegment. It has already contributed considerablyto our understanding of ocular pathophysiology.The scope of applications of UBM is increasingin the diagnosis and management of various eyediseases.
Bibliography1. Buchwald HJ, Muller A, Spraul CW, Lang GK.
Ultrasound biomicroscopy of conjunctivallesions. Klin Monatsbl Augenheilkd 2003;220(1-2):29-34.
2. Hoops JP, Ludwig K, Boergen KP, Kampik A.Preoperative evaluation of limbal dermoidsusing high-resolution biomicroscopy. GraefesArch Clin Exp Ophthalmol 2001;239(6):459-61.
3. Iishikawa H, Schuman JS. Anterior segmentimaging: ultrasound biomicroscopy. Ophthal-
mology Clinics of North America 2004;17:7-20.4. Jimenez-Alfaro I, Benitez del Castillo JM, Garcia-
Feijoo J, Gil de Bernabe JG, Serrano de La IglesiaJM: Safety of posterior chamber phakicintraocular lenses for the correction of highmyopia: anterior segment changes afterposterior chamber phakic intraocular lensimplantation. Ophthalmology 2001;108(1):90-9.
5. Jimenez-Alfaro I, Garcia-Feijoo J, Perez-SantonjaJJ, Cuina R. Ultrasound biomicroscopy of ZSAL-4 anterior chamber phakic intraocular lens forhigh myopia. J Cataract Refract Surg 2001;27(10):1567-73.
6. Kawana K, Okamoto F, Nose H, Oshika T.Ultrasound biomicroscopic findings of ciliarybody malignant melanoma. Jpn J Ophthalmol2004;48(4):412-4.
7. Kunimatsu S, Araie M, Ohara K, Hamada C.Ultrasound biomicroscopy of ciliary body cysts.Am J Ophthalmol 1999;127(1):48-55.
9. Liebmenn JM, Ritch R, Esaki K. Ultrasoundbiomicroscopy. Ophthalmology Clinics of NorthAmerica 1998;11:421-33.
8. Lanzl IM, Augsburger JJ, Hertle RW, RapuanoC, Correa-Melling Z, Santa Cruz C. The roleof ultrasound biomicroscopy in surgical planningfor limbal dermoids. Cornea 1998;17(6):604-6.
10. Lin HC, Shen SC, Huang SF, Tsai RJ. Ultrasoundbiomicroscopy in pigmented conjunctival cysticnevi. Cornea 2004;23(1):97-9.
11. Marchini G, Pedrotti E, Sartori P, Tosi R.Ultrasound biomicroscopic changes duringaccommodation in eyes with accommodatingintraocular lenses: pilot study and hypothesisfor the mechanism of accommodation. J CataractRefract Surg 2004;30(12):2476-82.
12. Pavlin CJ, Foster FS. High frequency ultrasoundbiomicroscopy, imaging the eye at microscopicresolution. Ophthalmology Clinics of North America1994;7:509-22.
13. Pavlin CJ, Foster FS. Ultrasound Biomicroscopyof the Eye. New York: Springer-Verlag, 1995.
14. Pavlin CJ, Foster FS. Ultrasound biomicroscopyin glaucoma. In Ritch R, Shields MB, KrupinT (Eds). The Glaucomas, Basic Sciences 2nd ed.St Louis: Mosby, 1996;1:471-90.
15. Pop M, Payette Y, Mansour M. Ultrasoundbiomicroscopy of the Artisan phakic intraocularlens in hyperopic eyes. J Cataract Refract Surg2002;28(10):1799-803.

269Optical Coherence Tomography
TOMOHIRO OTANI
Optical CoherenceTomography17
Optical coherence tomography (OCT) is adiagnostic technology, which provides a cross-sectional image of the anterior eye and the retinain vivo with a high resolution similar to ahistological section by light microscopy.1-3 OCThas demonstrated the intraretinal structure offundus diseases including macular hole,4
macular edema,5, 6 highly myopic eye.7 It alsoenables us to evaluate the surgical outcome ofmacular diseases on the histopathologic level.A third-generation OCT (OCT3), with less than10-μm axial resolution, provides more detailedimaging of the retinal structures than the formerone.
In this chapter, the principle of OCT, proce-dures, limitations and the cross-sectional imagesof various macular diseases using OCT conductedin our institution are being described.
Instruments and Principle of OCT3SystemThe OCT3 system hardware consists of thepatient module; the computer unit; the flat screenvideo monitor; the keyboard, mouse and colorinkjet printer (Fig. 17.1).
OCT uses low-coherence interferometry toproduce cross-sectional images of optical
scattering from intraretinal microstructures (Fig.17.2). These images are similar to those providedby B-mode ultrasound. Low coherence light froma super luminescent diode source connects witha Michelson interferometer. Infrared light fromthe source is divided at an optical beam-splitterinto reference beam and measurement beam. Themeasurement beam is directed onto the patient’seye and is reflected from intraocular structuresat different distances. The reflected light (reflectedmeasurement beam) is composed of multipleechoes which include information about therange or distance and thickness of differentintraocular structures. The reference beam is
Fig. 17.1: OCT3 system

270 Diagnostic Procedures in Ophthalmology
Fig. 17.2: The optical interferometer (Courtesy from:Schuman JS, Puliafito CA, Fujimoto JG. Principle of OpticalCoherence Tomography. In Optical CoherenceTomography of Ocular Diseases (2nd edn). New Jersey,SLACK Incorporated, 2004)
reflected from a reference mirror. The reflectedreference beam returns to the beam-splitter whereit combines with the reflected measurement beam.Time delay information between the two lightpathways is then determined by a photo diode,which detects back-scattered light along areference optical delay path. Once the light isdetected, a signal is sent which is processedelectronically and used within the OCT internalcomputer data acquisition bank for analysis andstorage. Measuring the interferometric signalcreates A-mode type scans. Cross sectionalimages are constructed from a sequence of singlelongitudinal A-mode type scan. There is nocontact between the OCT scanner and the eye.Slit-lamp biomicroscopy of the retina may beperformed simultaneously with the imageacquisition. The obtained OCT images aredisplayed in a false color representation. Theintensity of the reflected optical signal isrepresented on a logarithmic scale with varyingdegrees of brightness. The maximum opticalreflection and back-scattering are represented byred-white colors, while the minimum signals arerepresented by blue-black colors.
Difficulties and LimitationsThe use of OCT is limited by intraocular mediaopacities such as vitreous hemorrhage, densecataract and corneal edema, which attenuatemeasurement beam and reflected light.
Pattern of OCT in Macular Diseases
Normal Macula
Cross-sectional images of the normal maculashowed a physiological foveal depression withan intraretinal layered structure (Fig. 17.3). Ahigh reflectivity was obtained from the retinalnerve fiber layer, plexiform layers and the retinalpigment epithelium (RPE). The boundarybetween the photoreceptor inner segments andouter segments (Fig. 17.3, bottom, arrows) was alsoseen as a highly reflective band on OCT3.8, 9 Theganglion cell and nuclear layers produced lowreflectivity. The thickness of the fovea(center of the macula) averaged 144 μm andwas independent of either age or state ofrefraction.10
Macular Hole
Kishi and Takahashi evaluated the three-dimensional structure of idiopathic macular hole(Fig. 17.4) in 89 affected eyes using OCT andscanning laser ophthalmoscopy (SLO).4 In stage1 hole, OCT revealed retinal split or cystic changesat the fovea in 11 of 15 eyes (73%) and fovealretinal detachment in 4 eyes (27%). Intraretinalsplitting involving the perifoveal area waspresent in 16 eyes with stage 2 hole. A breakwas present in the anterior cyst wall. The outerretina could not be identified at the fovea byOCT. A full thickness hole surrounded byintraretinal split or cystoid edema was presentin all of 50 eyes with stage 3 hole. Operculawere seen in 32 of the 50 eyes. A detached vitreous

271Optical Coherence Tomography
Fig. 17.3: Normal macula. Fundus photograph (top) and OCT3 (bottom). OCT3 shows a physiologic foveal depressionwith an intraretinal layered structure. The boundary between the photoreceptor inner segments and outer segmentsis also seen as a highly reflective band (arrows).
cortex could be observed in 24 of the 32 eyes.Intraretinal split seen by OCT appeared asradiating striae of elevated Henle’s fiber layerby SLO. The findings show that idiopathic
macular hole initiates as intraretinal split or cystsat the fovea and that a full-thickness macularhole forms when the anterior cyst wall isoperculated.

272 Diagnostic Procedures in Ophthalmology
Figs 17.4A to C: Macular hole. A Stage 1 macular hole. OCT3 demonstrates a foveal cyst.B Stage 2 macular hole. OCT3 shows a flap consists of retinal tissue extending from theperifoveal retina. The perifoveal retina has cystic changes. C Stage 3 macular hole. The perifovealretina is elevated and has cystic changes. An operculum is seen above the hole
Preretinal Macular Fibrosis
Maruyama and coworkers examined 19 eyes withpreretinal macular fibrosis (Figs 17.5 and 17.6)using OCT.11 The foveal thickness ranged from300-650 μm. The macula was swollen in 15 eyeslacking the physiological foveal depression. In4 eyes with pseudomacular hole, the fovealstructure showed sharp columnar depressionsurrounded by thickened perifoveal retina.Swelling of the retina was more pronounced inthe outer retinal layers showing a low reflectivezone. The findings show that preretinal macularfibrosis is not a mere retinal surface disorderbut may also be associated with fluid accumu-lation in the outer retina.
High Myopic Eyes
Takano and Kishi evaluated the OCT featuresof the retina in patients with severe myopia andposterior staphyloma7 (Fig. 17.7). The studyincluded 26 phakic and 6 pseudophakic eyes.The refractive errors of the 26 phakic eyes rangedfrom –8 to –31 diopters (average – 16.7 diopters).Although refractive errors were within – 8diopters in the 6 pseudophakic eyes, the eyeshad apparent posterior staphyloma. The axiallengths measured by A-mode ultrasonographyranged from 25.7 to 32.7 mm (average, 29.2 mm).Slit-lamp examination with a contact lensshowed that none of the eyes had a macularhole. In 9 eyes with shallow retinal elevation
B
C
A

273Optical Coherence Tomography
Fig. 17.6: Preretinal macular fibrosis with pseudohole.Fundus photograph (top) and OCT3 (bottom). The fovealstructure showed sharp columnar depression (arrows)surrounded by thickened perifoveal retina
Fig. 17.7: Highly myopic eye. Fundus photograph (top)and OCT3 (bottom). The fundus has retinochoroidalatrophy within the staphyloma. OCT3 shows a localizedretinal detachment (*) and perifoveal retinoschisis (Δ)
on slit-lamp examination, optical coherencetomography disclosed a foveal retinal detachmentwith retinoschisis in 8 eyes and a foveal retinaldetachment in 1 eye. Two of the remaining 23eyes had retinoschisis. Foveal retinal detachmentand retinoschisis are common features in severelymyopic eyes with posterior staphyloma. Retinaldetachment may precede the formation of amacular hole in severely myopic eyes.
Diabetic Macular Edema
Otani and Kishi reported cross-sectional imagesof diabetic macular edema by OCT.6 OCT showedthree patterns of structural changes in diabeticmacular edema (Figs 17.8 to 17.12): sponge-like
Fig. 17.5: Preretinal macular fibrosis. Fundus photograph(top) and OCT3 (bottom). Contraction of preretinalmembrane (arrows) caused retinal thickening with fluidaccumulation in the outer layer of the retina
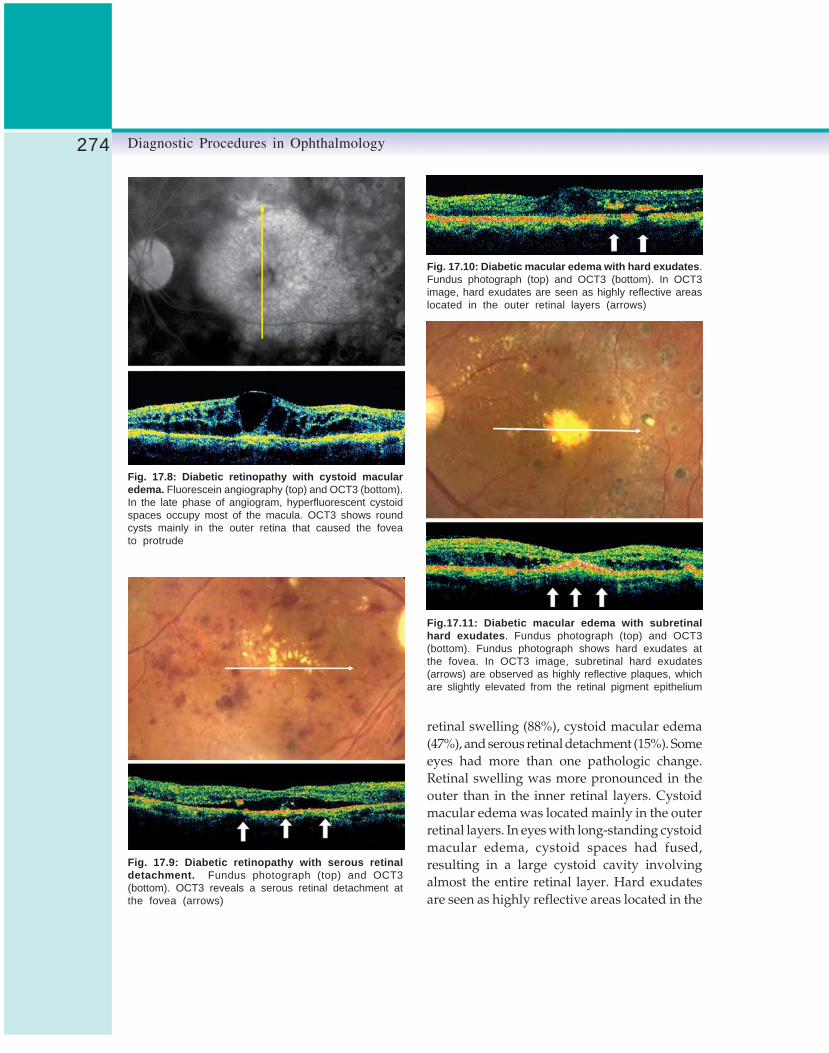
274 Diagnostic Procedures in Ophthalmology
Fig. 17.8: Diabetic retinopathy with cystoid macularedema. Fluorescein angiography (top) and OCT3 (bottom).In the late phase of angiogram, hyperfluorescent cystoidspaces occupy most of the macula. OCT3 shows roundcysts mainly in the outer retina that caused the foveato protrude
Fig. 17.9: Diabetic retinopathy with serous retinaldetachment. Fundus photograph (top) and OCT3(bottom). OCT3 reveals a serous retinal detachment atthe fovea (arrows)
Fig. 17.10: Diabetic macular edema with hard exudates.Fundus photograph (top) and OCT3 (bottom). In OCT3image, hard exudates are seen as highly reflective areaslocated in the outer retinal layers (arrows)
Fig.17.11: Diabetic macular edema with subretinalhard exudates. Fundus photograph (top) and OCT3(bottom). Fundus photograph shows hard exudates atthe fovea. In OCT3 image, subretinal hard exudates(arrows) are observed as highly reflective plaques, whichare slightly elevated from the retinal pigment epithelium
retinal swelling (88%), cystoid macular edema(47%), and serous retinal detachment (15%). Someeyes had more than one pathologic change.Retinal swelling was more pronounced in theouter than in the inner retinal layers. Cystoidmacular edema was located mainly in the outerretinal layers. In eyes with long-standing cystoidmacular edema, cystoid spaces had fused,resulting in a large cystoid cavity involvingalmost the entire retinal layer. Hard exudatesare seen as highly reflective areas located in the

275Optical Coherence Tomography
Figs 17.12A to D: Diabetic macular edema. A Before vitrectomy, the retina is thickened withan area of low intraretinal reflectivity (yellow arrows) and cystoid cavities are seen in the retina.The fovea protrudes. A serous retinal detachment is seen at the fovea (white arrows); the fovealthickness is 780 μm. The visual acuity is 20/500. B Two months after vitrectomy, a serousretinal detachment (white arrows) is enlarged in diameter. The visual acuity is 20/300. C Fourmonths after vitrectomy, an intraretinal area of low reflectivity is diminished and the serous retinaldetachment has resolved; the foveal thickness decreased to 400 μm. The visual acuity is20/200. D Ten months after vitrectomy, the foveal pit is restored. The visual acuity is 20/70
outer retinal layers. In eyes with a serous retinaldetachment, hard exudates tend to deposit notonly in the retina but also in the subretinal space.12
Otani and Kishi also evaluated the retinalstructure before and after vitrectomy for diabeticmacular edema13 (Figs 17. 8 and 17. 9). The fovealthickness (the distance between the inner retinalsurface and the retinal pigment epithelium) andthe retinal thickness (thickness of the neuro-sensory retina) were measured by OCT preopera-tively and postoperatively. All 13 eyes had retinalswelling with a low intraretinal reflectivity. Inaddition to retinal swelling, there were cystoidspaces in 5 (38%) of 13 eyes, a serous retinaldetachment in 3 (23%), and both cystoid spacesand serous detachment in 3 (23%). Six monthspostoperatively, the mean foveal thicknesssignificantly decreased from 630 to 350 μm(P <.01, paired t-test) and the mean thicknessof neurosensory retina decreased from 540 to
320 μm (P <.01, paired t-test). A serous retinaldetachment occurred transiently in 3 eyes.Compared with the preoperative level, thepostoperative visual acuity level improved bymore than 2 lines in 5 of the 13 eyes (38%),remained the same in 7 eyes (54%), and decreasedin 1 eye (8%). Vitrectomy was generally effectivein treatment of diabetic macular edema. OCTdemonstrated the intraretinal changes of macularedema and the process of edema absorption.
Central Serous Chorioretinopathy
Iida et al evaluated central serous chorio-retinopathy with OCT during the acute phaseand after resolution of the phase14 (Fig. 17.13).In a prospective study, 23 consecutive eyes of23 patients with central serous chorioretinopathywere examined. In the acute phase, neurosensoryretina was thickened within the area of serous
B
C
A
D

276 Diagnostic Procedures in Ophthalmology
Fig. 17.13: Central serous chorioretinopathy. Fundusphotograph (top) and OCT (bottom). A fundus photographshows a serous retinal detachment. In OCT image throughthe fovea, the detached retina is swollen, with intraretinalareas of low reflectivity
retinal detachment in all 23 eyes. The detachedretina was thicker than the reattached retina afterresolution of the retinal detachment in all eyes.The retinal thickness at the center of the foveaduring the acute phase (range 157 to 236 μm;mean ± SD 196.9 ± 22.6 μm) was significantlythicker compared with that after resolution(range, 105 to 152 μm; mean ± SD, 124.8 ± 10.7μm; P<.0001, Wilcoxon test). In the acute phase,areas of low reflectivity localized within thedetached retina were observed in 18 of the 23eyes. In the area of a grayish-white lesion, OCTshowed a moderately reflective mass bridgingthe detached neurosensory retina and retinalpigment epithelium in all 4 eyes; the outer layerof the detached retina was more highly reflectivein these eyes. The retinal pigment epitheliumwas focally detached beneath the subretinalreflective mass in 3 of the 4 studied eyes. In alleyes studied, neurosensory retina was thickenedwithin the area of serous retinal detachment in
the acute phase of central serous chorio-retinopathy. The grayish-white lesion seems tobe a fibrinous exudate that accumulates in thesubretinal space and infiltrates into the outerretina.
Rhegmatogenous Retinal Detachment
Hagimura et al reported the pathologic changesof the detached neurosensory retina in rhegmato-genous retinal detachment15 (Fig. 17.14). Retinalimages were prospectively examined by OCT in25 eyes with rhegmatogenous retinal detachment.OCT of the detached neurosensory retina,adjacent to the center of the fovea, demonstratednormal retinal structure in 10 eyes (40%),intraretinal separation in 7 eyes (28%), and an
Fig. 17.14: Rhegmatogenous retinal detachment.Fundus photograph (top) and OCT (bottom) show thedetached retina with intraretinal separation (arrows)

277Optical Coherence Tomography
undulated separated outer retina in 8 eyes (32%).Three statistically significant factors affected best-corrected visual acuity: intraretinal separation(P = <.001), intraretinal separation withundulated outer retina (P = <.001), and heightof retinal detachment at the central fovea (P<.001).Visual acuity was significantly worse in the 15eyes with intraretinal separation with or withoutan undulated outer retina than in the 10 eyeswith retinal thickening but no intraretinalseparation (P = <.036). The 8 eyes with undulatedseparated outer retina showed significantlyhigher retinal detachment at the central foveathan the 7 eyes with intraretinal separation butno undulated outer retina (P = <.009) and the10 eyes without intraretinal separation (P =>.016). The duration from onset of subjectivesymptoms to OCT was not related to theoccurrence of intraretinal separation of thedetached retina. Intraretinal separation of thedetached retina occurred frequently and shortlyafter retinal detachment in this condition andwas one of the factors associated with poor visionin rhegmatogenous retinal detachment. Visualacuity significantly decreased in the highlydetached retina.
Juvenile Retinoschisis
Ikeda et al reported a cross-sectional image ofjuvenile retinoschisis16(Fig. 17.15). The retina wassplit into two layers in the central fovea whichextended into the perifoveal area. The inner retinacontained two highly reflective zones corres-ponding to the nerve fiber and inner plexiform
Fig. 17.15: Juvenile retinoschisis. OCT3 showscolumnar-shaped structures bridging the separated twolayers
Fig. 17.16: Vitelliform macular dystrophy (Vitelliformstage). Fundus photograph (top) and OCT (bottom): OCTshows a highly reflective fusiform thickening of the layer(white arrows) at the level of retinal pigment epithelium andchoriocapillaris
layers. Columnar-shaped structures, presumablyMüeller cells, bridged the separated two layers.Scanning laser ophthalmoscope showedelevation of the Henle’s fiber layer. These findingsseemed to show that the retinal splitting occursat the outer plexiform layer.
Vitelliform Macular Dystrophy
Honma et al reported a cross-sectional imageof vitelliform macular dystrophy17(Fig. 17.16).Eyes at the vitelliform stage showed a highlyreflective fusiform thickening of the layer at thelevel of the retinal pigment epithelium (RPE) andchoriocapillaris. The vitelliform lesion lackedbackground fluorescence due to blocking whenseen by fluorescein angiography. In eyes withscrambled egg lesion, OCT showed two highlyreflective zones posterior to the sensory retina.A flat dome-shaped space was present between

278 Diagnostic Procedures in Ophthalmology
the level of the RPE and the choriocapillaris.The area of accumulated yellow material showeda window defect on a fluorescein angiogram.Findings showed this yellow material to haveaccumulated within the RPE in the vitelliformstage. The material was also located in thesubretinal space in the scrambled egg stage.
ConclusionExamination of ocular fundus is a routineexamination in the clinical practice ofophthalmology. Ophthalmologists can observeocular fundus at 10 μm of resolution using adirect ophthalmoscope or a biomicroscope.Because biopsy of the retina is impossible,histopathologic information of retinal disordershas not been well known. OCT allows us toinvestigate the clinicopathologic correlation offundus diseases in vivo. As described in thisreview, OCT has made a great contribution toour understanding of chorioretinal diseases.
References1. Haung D, Swanson EA, Lin CP, et al. Optical cohe-
rence tomography. Science 1991;254:1178-81.2. Puliafito CA, Hee MR, Schuman JS, Fujimoto
JG. Macular diseases. In Optical CoherenceTomography of Ocular Diseases. New Jersey,SLACK Incorporated, 1996.
3. Hee MR, Izatt JA, Swanson EA, et al. Opticalcoherence tomography of the human retina.Arch Ophthalmol 1995;113:325-32.
4. Kishi S, Takahashi H. Three-dimensionalobservation of developing macular holes. AmJ Ophthalmol 2000;130:65-75.
5. Hee MR, Puliafito CA, Wong C, et al.Quantitative assessment of macular edema withoptical coherence tomography. Arch Ophthalmol1995;113:1019-29.
6. Otani T, Kishi S. Patterns of diabetic macularedema with optical coherence tomography. AmJ Ophthalmol 1999;127:688-93.
7. Takano M, Kishi S. Foveal retinoschisis andretinal detachment in severely myopic eyes withposterior staphyloma. Am J Ophthalmol 1999;128:472-76.
8. Drexler W, Sattmann H, Hermann B, et al.Enhanced visualization of macular pathologywith the use of ultrahigh resolution opticalcoherence tomography. Arch Ophthalmol2003;121:695-706.
9. Schuman JS, Puliafito CA, Fujimoto JG.Interpretation of the Optical CoherenceTomography Image. In. Optical CoherenceTomography of Ocular Diseases, 2nd ed. NewJersey, SLACK, 2004.
10. Hagimura N. Optical coherence tomographicfeatures of normal ocular fundus. Jpn J ClinOphthalmol 1998;52:1459-62.
11. Maruyama Y, Otani T, Kishi S. Optical coherencetomographic features of preretinal macularfibrosis. Jpn J Clin Ophthalmol 1999;52:1468-70.
12. Otani T, Kishi S. Tomographic findings of fovealhard exudates in diabetic macular edema. AmJ Ophthalmol 2001;131:50–54.
13. Otani T, Kishi S. Tomographic assessment ofvitreous surgery for diabetic macular edema.Am J Ophthalmol 2000;129:186-90.
14. Iida T, Hagimura N, Sato T, Kishi S. Evaluationof central serous chorioretinopathy with opticalcoherence tomography. Am J Ophthalmol2000;129:519-20.
15. Hagimura N, Suto K, Iida T, Kishi S. Opticalcoherence tomography of the neurosensoryretina in rhegmatogenous retinal detachment.Am J Ophthalmol 2000;129:16-20.
16. Ikeda F, Takahashi K, Kishi S. Optical coherencetomographic features of juvenile retinoschisis.Jpn J Clin Ophthalmol 1998;52:1479-82.
17. Honma R, Utsugi N, Maruyama Y, Kishi S.Optical coherence tomographic features ofvitelliform macular dystrophy. Jpn J ClinOphthalmol 1998;52:1515-18.

279Electrophysiological Tests for Visual Function Assessment
SUBHADRA JALALI, LS MOHAN RAM, GARIMA TYAGI, KALLAKURI SUMASRI
ElectrophysiologicalTests for Visual
Function Assessment18Visual Electrophysiology TestsVisual electrophysiology is an extremely powerfultool to assess functional integrity of the visualpathway. Visual pathway starts from the photo-receptor and retinal pigment epithelial layer,proceeds through inner retinal layers, ganglioncell layer and then via optic nerve through thechiasma to the optic radiations in the brain, finallyending at the occipital cortex. This chapter aimsto introduce some basic concepts of visualelectrophysiological tests (VET) with the helpof some representative clinical cases.
Visual electrophysiological tests include thevarious types of electroretinogram (ERG),electrooculogram (EOG) and visual evokedpotential (VEP). A patient may need some teststo ascertain the abnormality. Before ordering thetests a clear understanding of the nature of eachof these is absolutely essential to derive a validinterpretation. A thorough clinical evaluation isa prerequisite before ordering any visualelectrophysiological test.
History
To understand how visual electrophysiologicaltests reached its present status, some of themilestones are described here. DuBois-Reymond
of Berlin discovered standing potential of 6millivolts in excised fish eyes and found thatcornea was positive with respect to posterior poleof the eye in 1849. He thought that these signalsoriginate in optic nerve. Holmgren showedelectrical responses to light in excised frog anddemonstrated that these to originate in the retina.
Dewar and McKendrick showed thatelectrical potentials could be recorded from intactanimal eyes on illumination of the retina. In 1877,Dewar succeeded in recording ERG from thehuman eye but the resulting curves were notpublished. The first human ERG was publishedby Kahn and Lowenstein.
Between 1933 and 1947 Ragnar Granit inOxford did extensive studies with variouschemical agents to analyze the origins of variousphases of the ERG. American psychologist LorrinRiggs, and Gosta Karpe at the Karolinska Institutedesigned a contact lens electrode independently.The credit for taking the science of ERG fromthe laboratory to the clinic goes to Gosta Karpewho invited ophthalmologists to visit his clinicwhere routine diagnostic ERG was introduced.
Before ordering and interpreting these tests,a thorough understanding of the nature andlimitations of each of test is a essential to arriveat a valid interpretation and diagnosis.
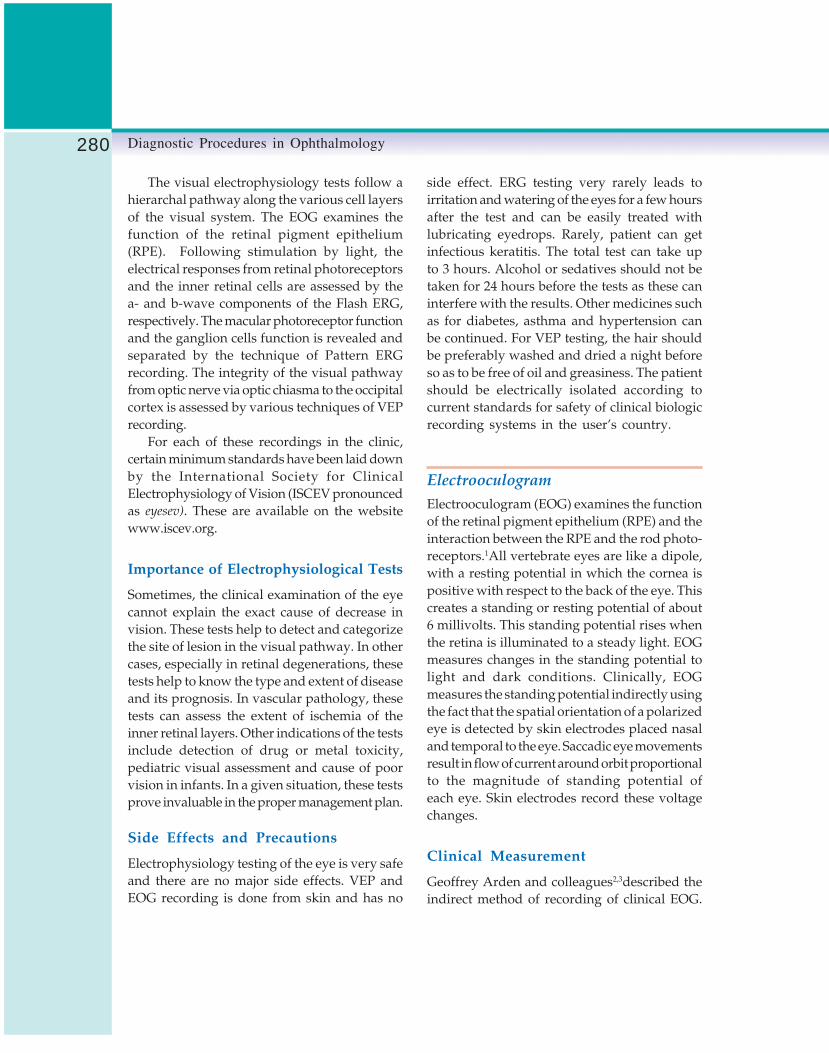
280 Diagnostic Procedures in Ophthalmology
The visual electrophysiology tests follow ahierarchal pathway along the various cell layersof the visual system. The EOG examines thefunction of the retinal pigment epithelium(RPE). Following stimulation by light, theelectrical responses from retinal photoreceptorsand the inner retinal cells are assessed by thea- and b-wave components of the Flash ERG,respectively. The macular photoreceptor functionand the ganglion cells function is revealed andseparated by the technique of Pattern ERGrecording. The integrity of the visual pathwayfrom optic nerve via optic chiasma to the occipitalcortex is assessed by various techniques of VEPrecording.
For each of these recordings in the clinic,certain minimum standards have been laid downby the International Society for ClinicalElectrophysiology of Vision (ISCEV pronouncedas eyesev). These are available on the websitewww.iscev.org.
Importance of Electrophysiological Tests
Sometimes, the clinical examination of the eyecannot explain the exact cause of decrease invision. These tests help to detect and categorizethe site of lesion in the visual pathway. In othercases, especially in retinal degenerations, thesetests help to know the type and extent of diseaseand its prognosis. In vascular pathology, thesetests can assess the extent of ischemia of theinner retinal layers. Other indications of the testsinclude detection of drug or metal toxicity,pediatric visual assessment and cause of poorvision in infants. In a given situation, these testsprove invaluable in the proper management plan.
Side Effects and Precautions
Electrophysiology testing of the eye is very safeand there are no major side effects. VEP andEOG recording is done from skin and has no
side effect. ERG testing very rarely leads toirritation and watering of the eyes for a few hoursafter the test and can be easily treated withlubricating eyedrops. Rarely, patient can getinfectious keratitis. The total test can take upto 3 hours. Alcohol or sedatives should not betaken for 24 hours before the tests as these caninterfere with the results. Other medicines suchas for diabetes, asthma and hypertension canbe continued. For VEP testing, the hair shouldbe preferably washed and dried a night beforeso as to be free of oil and greasiness. The patientshould be electrically isolated according tocurrent standards for safety of clinical biologicrecording systems in the user’s country.
ElectrooculogramElectrooculogram (EOG) examines the functionof the retinal pigment epithelium (RPE) and theinteraction between the RPE and the rod photo-receptors.1All vertebrate eyes are like a dipole,with a resting potential in which the cornea ispositive with respect to the back of the eye. Thiscreates a standing or resting potential of about6 millivolts. This standing potential rises whenthe retina is illuminated to a steady light. EOGmeasures changes in the standing potential tolight and dark conditions. Clinically, EOGmeasures the standing potential indirectly usingthe fact that the spatial orientation of a polarizedeye is detected by skin electrodes placed nasaland temporal to the eye. Saccadic eye movementsresult in flow of current around orbit proportionalto the magnitude of standing potential ofeach eye. Skin electrodes record these voltagechanges.
Clinical Measurement
Geoffrey Arden and colleagues2,3described theindirect method of recording of clinical EOG.

281Electrophysiological Tests for Visual Function Assessment
Skin electrodes are placed at the medial andlateral canthi to detect the amplitude of the signalbetween these two points. A ground electrodeis fixed to the forehead. Pupils are dilated. AGanzfeld is used to illuminate whole retinauniformly. Eye should not be exposed to too brightor too dim lights before EOG. After an initial6 minutes of light adaptation, test is started. Thepatient makes fixed 30-degree lateral eyemovements (using diode fixation lights) duringa period of 20 minutes of dark adaptation, andthen during a 12-15 minute period of lightadaptation. The eye movements are made every1-2 seconds for approximately 15 seconds anda pause of 45 seconds, every minute. The dipolegenerated by the resting potential induces currentflow in the skin electrodes upon shift of the eyeposition (Fig. 18.1).The changes in voltage are
amplified and displayed on a computer dataacquisition system (Fig. 18.2). The changes inthis indirectly measured potential, from darknessto light is the light-induced rise of the restingpotential.3 In the dark, the resting potentialdecreases while it slowly rises to a peak (Slowoscillation of EOG) after the lights are switchedon (Fig. 18.2). The amplitude of the signal isrecorded at its minimum during dark adaptation(the dark trough) and at its maximum duringlight adaptation (the light peak). The ISCEV haslaid down standards for EOG testing.4Thenormal light peak occurs in conditions ofnormally functioning photoreceptors in contactwith a normally functioning RPE, and is causedby progressive depolarization of the RPE basalmembrane. The EOG is quantified by calculatingthe amplitude of the light peak in relation to
Figs 18.1A to C: EOG recording procedure. A Sites of skin electrode placement. B Ganzfeld fixating lights (LED)15 degrees apart, with 30° excursion from right to left. C 16 to 20 sweeps per minute following a baseline recordingof 6 minutes in white light. Recording is for 15 minutes in dark and 15 minutes in light

282 Diagnostic Procedures in Ophthalmology
Fig. 18.2: Showing raw waveforms of the saccades (left) and the final EOG graph (right). Note the light riseand normal Arden ratio of >200% in each eye
the dark trough as a percentage, the Arden
index.3A normal index would be > 185% (Fig.18.2).
Clinical Uses
A normal ERG and abnormal EOG are classicallyseen in Bests’ vitelliform macular dystrophy5 (Fig.18.3) even in very early stages of the diseasewith minimal fundus changes and in asympto-matic carriers. EOG abnormality is also seen ina variety of RPE and rod-photoreceptor disorderssuch as retinitis pigmentosa, choroideremia andage-related macular degeneration. EOG is alsoabnormal in choroidal melanomas and couldbe an adjunct tool to differentiate melanoma fromnevi.6 EOG is normal in isolated inner retinalcell dysfunction such as in congenital stationarynight blindness (CSNB) where RPE and photo-receptors are normal. EOG can be used to studydrug toxicity against RPE. One must rememberthat because light is used to provoke the voltagechange in EOG, this test cannot separate thephotoreceptor and RPE dysfunction. In recent
years, Arden et al.7 have shown that after intakeof low doses of ethanol an EOG peak similarto the light-induced EOG peak can be recorded.This could test RPE layer function independentof its interaction with the photoreceptors.7
Limitations of EOG Recording
Patient cooperation and central fixation limit theclinical recording of EOG. Patients with poorcentral fixation or variable eccentric fixation,children, infants and uncooperative adults can-not be tested satisfactorily. Many testing variablessuch as media opacities and illumination levelscan influence the voltages. Therefore, borderlineEOG abnormalities need to be interpreted withcaution and test may have to be repeated forconfirmation.1
Fast Oscillations of EOG
It was reported by Kolder and colleagues8 thatthe EOG responses could be slow or fast, if thefrequency of the light and dark periods for

283Electrophysiological Tests for Visual Function Assessment
stimulation were altered. They found the ‘slow’oscillations were greatest with repeated light anddark periods of 12.5 minutes each, whereas, thegreatest amplitude of ‘fast’ oscillations of EOGwere seen when the light and dark cycles wereof 1.1 minute each. The amplitude of ‘fast’oscillations increased in dark phase and reducedin light phase. The clinical value of these fastoscillations needs further study.
Electroretinogram (ERG)Due to selective transport of ions, the inside ofthe photoreceptor cells is more negative than theoutside resulting in a standing membranepotential in the dark. Once light falls on the retina,it induces a change in the transmembrane
movement of especially sodium and potassiumions, making the cells hyperpolarized, that is,they become more negative to the extra cellularspace than in the dark. These voltage changesare reflected in various ERG components.
Various techniques are in clinical use toassess the electrical response of retinal cells tolight. The most common of these is the Full-fieldFlash ERG. Others are Pattern ERG, Focal ERGand Multifocal ERG (Table 18.1).
The Flash ERG is the mass response of theneural and nonneural retinal cells to a full fieldluminance stimulation. The test reflects thefunction of the photoreceptors and inner nuclearlayers of the retina in response to light stimu-lation. It is recorded by using stimuli deliveredby an integrating sphere, called Ganzfeld, whichprovides a uniform whole field illumination to
Fig. 18.3: Shows poor light rise on EOG in a patient with subnormal vision and bilateral macular lesions.ERG recordings including macular photoreceptors (PERG) are normal as shown in ERG results

284 Diagnostic Procedures in Ophthalmology
TABLE 18.1: SPECIALIZED TYPES OF ERG(NOT COVERED BY ISCEV STANDARD)10
1. Macular or focal ERG2. Multifocal ERG3. Early receptor potential (ERP)4. Scotopic threshold response (STR)5. Direct-current ERG6. Long-duration flash ERG (on-off responses)7. Bright-flash ERG8. Double-flash ERG9. Chromatic stimulus ERG (including S-cone
response)10. Dark and light adaptation of the ERG11. Stimulus intensity-response amplitude analysis
(Naka-Rushton)12. Saturated a-wave slope analysis
the retinal spherical surface.9 The Ganzfeldprovides both flash stimulation and a diffusebackground for photopic adaptation besidesfixation lights (Fig. 18.4)
By varying the background illumination, thelight or dark-adapted state of the eye and theintensity of the stimulus flash, one can elicit andisolate response from different retinal cells. TheISCEV standard describes simple technical
procedures that allow reproducible ERGs to berecorded under a few defined conditions, frompatients of all ages including infants.9,10 Detailsof the equipment standardization is beyond thescope of this chapter but is available in literature.11
Recording Electrode
The ERG is recorded using corneal or non-cornealelectrodes (Fig. 18.5). The closer the electrode isto the cornea, the higher the amplitude one gets,though latency will not change. Prototypes ofcorneal electrode are Burian-Allen and Jetelectrodes. The corneal electrodes can be unipolarlike the Jet-electrode or bipolar like the Burian-Allen electrode. The Burian-Allen electrode iscentrally transparent with a large optical openingand incorporates a device to hold the lids apart.Topical anesthesia and a nonviscous solutionlike 0.5% methylcellulose are needed. Moreviscous solutions can attenuate signal amplitude.Corneal electrodes may be difficult to maintaindue to a silver coating that needs resurfacingperiodically, and are expensive and cause some
Fig. 18.4: An integrated sphere called Ganzfeld provides a uniform, whole field illumination to the retinal sphericalsurface. It provides both flash stimulation and a diffuse background light for photopic adaptation. The inside surfacehas three light emitting diodes as fixation targets for the eye and also for excursion of the eyes during EOG recordings.A chin rest allows proper positioning of the subject. Two prototypes are shown
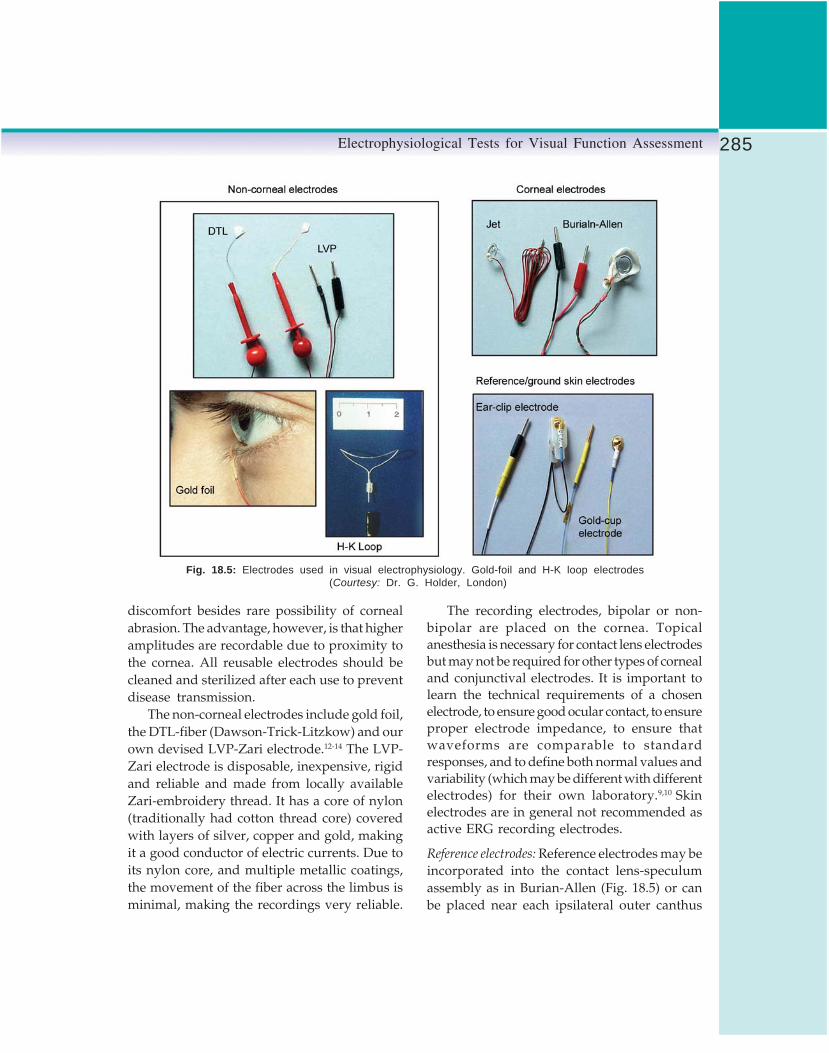
285Electrophysiological Tests for Visual Function Assessment
Fig. 18.5: Electrodes used in visual electrophysiology. Gold-foil and H-K loop electrodes (Courtesy: Dr. G. Holder, London)
discomfort besides rare possibility of cornealabrasion. The advantage, however, is that higheramplitudes are recordable due to proximity tothe cornea. All reusable electrodes should becleaned and sterilized after each use to preventdisease transmission.
The non-corneal electrodes include gold foil,the DTL-fiber (Dawson-Trick-Litzkow) and ourown devised LVP-Zari electrode.12-14 The LVP-Zari electrode is disposable, inexpensive, rigidand reliable and made from locally availableZari-embroidery thread. It has a core of nylon(traditionally had cotton thread core) coveredwith layers of silver, copper and gold, makingit a good conductor of electric currents. Due toits nylon core, and multiple metallic coatings,the movement of the fiber across the limbus isminimal, making the recordings very reliable.
The recording electrodes, bipolar or non-bipolar are placed on the cornea. Topicalanesthesia is necessary for contact lens electrodesbut may not be required for other types of cornealand conjunctival electrodes. It is important tolearn the technical requirements of a chosenelectrode, to ensure good ocular contact, to ensureproper electrode impedance, to ensure thatwaveforms are comparable to standardresponses, and to define both normal values andvariability (which may be different with differentelectrodes) for their own laboratory.9,10 Skinelectrodes are in general not recommended asactive ERG recording electrodes.
Reference electrodes: Reference electrodes may beincorporated into the contact lens-speculumassembly as in Burian-Allen (Fig. 18.5) or canbe placed near each ipsilateral outer canthus

286 Diagnostic Procedures in Ophthalmology
as a reference for the corresponding eye. Theforehead as a reference has a theoretical risk ofsignal contamination by ocular crossover or fromcortical evoked potentials.
Ground electrode: A separate skin electrode, suchas an ear-clip (Fig. 18.5) should be attached toan indifferent point and connected to ground.
Electrode Placement
After topical anesthesia, corneal electrodes arefilled with a mild viscous coupling solution suchas 0.5% methylcellulose and inserted gently likea contact lens in the center of the cornea, withthe lid speculum holding the lids apart simulta-neously. The non-corneal electrode is placed inthe lower fornix as close to the inferior limbusas possible. It should be stable, non-mobile andnot injure the cornea. The reference electrode isplaced at the outer canthus. An ear-clip electrodeserves as a ground electrode. For all skin-electrodes, good contact is essential with lowimpedance. To achieve this grease and dead cellson the skin are removed by rubbing with anabrasive and an alcohol pad. Figure 18.6 (left)shows a subject with the LVP Zari electrode inplace, held across the fornix with a crocodileclip (red color) and the reference electrode (bluecolor) at the outer canthus. The ear-clip groundelectrode is also seen. All the electrodes are thenconnected to a junction box (middle) which sendsthe signals through an interface box into the
computerized amplifiers and recorders. Careshould be taken to connect the electrodes to thecorrect site on the junction box. The outer canthalelectrodes go to the positive and recording electro-des to the negative poles of the junction box.
Flash Stimulus Characteristics
The light stimulus should consist of flasheshaving a maximum of about 5 ms duration sothat duration of each flash is considerably shorterthan the integration time of any photoreceptor.These short white flashes obtained bystroboscopes and gas discharge tubes have acolor temperature of 7000 degrees K. A standardflash (SF) strength is defined as one that producesa stimulus strength (in luminous energy persquare meter) at the surface of the Ganzfeld bowlof 1.5-4.5 photopic cd.s.m-2 (candela-seconds permeter squared).10 In addition to producing flashes,the stimulator must be capable of producing asteady and uniformly even, white (colored inrare special situations) background luminanceof 17- 34 cd.m-2 across the full field. Prolonged-flash ERGs and chromatic lights are currentlyused for studying slow potentials and forseparating on-and off-responses.
Technical Requirements
The system should be capable of attenuating theflash strength from standard flash over a rangeof at least 3 log units, either continuously or
Fig. 18.6: LVP electrode placement (left) and connections (middle) to junction box (arrow).ERG in progress (right)

287Electrophysiological Tests for Visual Function Assessment
in steps of no more than 0.3 log unit. Thisattenuation should not change the wavelength.It is essential to periodically calibrate the stimulusand background illumination by integrated andnonintegrated photometers to achieve standardtest conditions.11
The bandpass of the amplifier andpreamplifier should include at least the rangeof 0.3 to 300 Hertz and should be adjustablefor oscillatory potential recordings and otherspecialized requirements. Amplifiers aregenerally AC (alternating current) coupled.
The recording equipment should be able torepresent the full amplifier bandpass withoutattenuation. The computer digitizers shouldsample responses at the rate of 1000 Hertz orhigher. The observer should be able to watchthe displays so as to monitor and makeadjustments to get clean and less noisy recording.The computerized digitizers are usually capableof averaging multiple responses so as to removesome of the artifacts.
Clinical Protocol9,10
ERG is recorded after full pupillary dilatationso that all parts of retina get illuminated. Avoidany extra illumination (as in fluoresceinangiography or fundus photography) but if theseexaminations have been performed, a period ofdark adaptation of at least one hour is neededbefore scotopic recording.
The subject is placed in a completely darkroom for 30 minutes. Next, the subject withelectrodes in place is seated comfortably withthe chin on the chin rest and eyes open withthe face inside the Ganzfeld bowl (Fig. 18.6). Theheight of patient should be adjusted so that theneck and back muscles are not in a tensed-upposition as this can induce muscle-generatedartifacts. The cable from junction box is fixedto the shoulder at the subject’s end and plugged
into the interface box at the other end, sendingthe retinal signals into the amplifiers andcomputer analyzers. Patients are encouraged tofixate at the central target to reduce eye movementand artifacts.
The ISCEV standard describes9,10 a minimumof 5 basic ERG response recordings, three in darkadapted or scotopic conditions and two in light-adapted or photopic state. These basic ERG wave-forms are a mass response of the photoreceptorsand inner retinal cells. The retinal ganglion cellsdo not contribute to the flash ERG. Various ERGresponses (Fig. 18.7) are described below.
Isolated Rod Response
To isolate the signals from the rod system ofphotoreceptors, a dim white flash of strength2.5 log units below the white SF is used. Serialresponses are recorded with a minimum of 2second interval between the flashes to allow therods to return to dark-adapted state in betweenthe flashes. A blue stimulus is equallyappropriate if equated to the white standard.At this low intensity level, the cones areinsensitive to the stimulus. The isolated rodresponse has almost no a-wave and a slowlyrising, broad-peaked, b-wave. The b-wave in theisolated rod-response waveform is a post-receptorphenomenon, i.e. inner retinal cell response thatis driven by only the rod photoreceptors. At thislow luminance a-wave is not recordable due topoor photoactivation. There is progressiveappearance and increasing amplitude of the a-wave as stimulus intensity is increased from lowlevel to the higher level of the standard flash(intensity response curve). As the a-wave startsappearing with increasing intensity of stimulus,it represents activity of the rod photoreceptorsbut with maximum flash intensity, the cones alsostart contributing to the a-wave as is seen inthe maximal combined response.

288 Diagnostic Procedures in Ophthalmology
Fig. 18.7: Normal Flash ERG waveforms from a normal fundus. Under scotopic conditions, we can record theisolated rod response (IRR), the maximal retinal response (MCR), and the scotopic oscillatory potentials (OP’s).The photopic responses include the single flash for cones (PSF) and the 30-Hertz flicker responses (30 Hz)
Maximal Combined Response
The maximal response is dominated by rodresponses but also has a small component ofcone activity. The initial negative a-wave isgenerated by the photoreceptors, i.e. both rodsand cones. The positive b-wave is generated post-receptoraly in relation to depolarization of theON-bipolar cells.15 Under scotopic conditions,flash ERG is obtained using the Standard whiteflash which is 0 decibel attenuated. A sharp a-wave and a much larger, rapidly rising peakedb-wave which comes to baseline very slowly,are characteristic of this response. Durationbetween two flashes should be at least 10 secondsto remove effect of bleach of photoreceptors bythe bright flash of light.
Oscillatory Potentials
The oscillatory potentials (Ops pronounced asopees) are small but high frequency oscillations
on the ascending limb of the b-wave of themaximal combined response.
These are extracted and amplified to presentthe oscillatory potentials as seen in Figure 18.7.They are generated in relation to amacrine cellactivity in the middle and inner retinal cell layers.Under scotopic condition and using standardflash intensity as a stimulus, other wavelets areremoved by resetting of the filters. The high-passfilter must be reset from the usual 0.3 Hz to 75 Hz,so that an overall bandpass of 75 at high end and300 Hz at low end is achieved. The response varieswith stimulus repetition rate and changes after thefirst stimulus. Flashes should be given 15 secondsapart to the dark-adapted eyes (1.5 seconds apartto light-adapted eyes), and only the second orsubsequent responses should be retained oraveraged.9,10 Normal response is characterized by3 major peaks followed by 1-2 smaller peaks.Comparison with normal individual laboratoryvalues is often adequate to assess any abnormality.

289Electrophysiological Tests for Visual Function Assessment
Single-Flash Cone Response
To record the photopic responses, the retina isexposed to 10 minutes of light adaptation byusing the background light in the dome of17-34 candelas per meter square of luminance(that saturates rods and makes them unrespon-sive). After this the retina is exposed to a standardflash (SF) to obtain the photopic single flash (PSF)cone response. Inter-stimulus intervals shouldnot be less than 0.5 seconds. This cone responseis characterized by a small a-wave and a verysharply rising b-wave that rapidly returns tothe baseline. Better localization of cone functionsis seen with the single flash cone response thanwith the flicker response. The photopic cone a-wave has contribution from the hyperpolarizing(OFF) bipolar cells and also cone photorecep-tors.16 The cone b-wave probably reflects post-phototransduction activity. Separation of the coneON (depolarizing bipolar cells) and OFF(hyperpolarizing bipolar cells) pathways is doneby using a long duration stimulus with a photopicbackground.17
30 Hz Flicker Cone ResponseUnder the photopic condition repetitive standardflashes are presented at a frequency of 30 stimuliper second. Rods are suppressed by the photopiccondition and are incapable of responding tothe highly repetitive stimuli. The amplitude ismeasured from trough to peak of each response.The latency is measured as the distance betweenstimulus onset and time-to-peak. A vertical linein the trace should indicate the time of onsetof the stimulus. The 30 Hz response is a sensitivemeasure of cone dysfunction, but is generatedat an inner retinal level.18 The response is affectedin inner retinal ischemic states.
ERG Measurements and Recording
A typical flash ERG record is a double peakwaveform. According to current convention the
amplitude of the initial cornea negative a-waveis measured from baseline to the trough, whileb-wave amplitude is from the trough of a-waveto peak of cornea positive b-wave. Latency ofeach wave is measured from stimulus onset,marked by a vertical line across the baseline,to peak of the response (Fig. 18.8). Both amplitudeand implicit time should be measured for eachcomponent of the waveform. For practicalpurposes, the variables most often measured arethe b-wave amplitudes of the isolated rodresponse, maximal combined response and ofsingle flash cone response. The time-to peak ofthe single flash 30 Hz flicker response and b-wave latency of maximal combined response ismeasured. Amplitudes and appearance of theoscillatory potentials9,10 are highly dependentupon stimulus conditions, adaptation andamplifier filter characteristics, but most authorsdescribe three major peaks often followed by afourth smaller one. Comparison of the responseto the laboratory normative wavelets may beadequate for many clinical purposes at ourpresent state of knowledge. An overall index ofoscillatory potential amplitude can be obtainedby adding up measurements of the three majorpeaks, preferably from lines spanning the bases
Fig. 18.8: Methodology of ERG amplitudes andlatency measurements (see text for details)
290 Diagnostic Procedures in Ophthalmology
of the adjacent troughs, but alternatively fromthe adjacent troughs directly (to allow use ofmeasuring cursors with digitized systems). Someauthors advise measurement of individual peaks.
Normal Values
Due to multiple variables that can affect the ERGwaveforms, it is recommend that each laboratoryshould confirm normal values for its own equip-ment and patient population taking an appro-priate sample size. All ERG reporting shouldinclude normal values and the limits of normal.
Reporting of the ERG
The reports or communications of ERG datashould include two representative waveformsof each of the standard responses displayed withamplitude and time calibrations and labeled withrespect to stimulus variables and the state oflight or dark adaptation. Details of the standar-dized reporting conditions are available in theliterature.9,10
Pediatric ERG Recording
The ERG can be recorded from infants and youngchildren9,10but one needs to account for immatureeyes and limited cooperation. Special care isrequired to monitor electrode position and comp-liance in order to avoid artifactual recordings.Pediatric subjects can be studied without sed-ation or general anesthesia. Non-cooperativechildren are given oral sedation and rarelygeneral anesthesia. The latter can modify theERG responses. Repeat measurements may beneeded to confirm the findings, especially in casesof poor recordable waveforms. Pediatric ERGresponses should ideally be compared to thosefrom normal subjects of the same age, even thoughthere may be little normative data available.Several examples of each response should berecorded in order to recognize reproducible
waveforms and choose the best and largest ofthese reproducible responses.
Limitations of ERG
ERG has following limitations:1. Flash ERG is affected only if the retinal
dysfunction is widespread. In localizedconditions, even if they involve high-celldensity area say of the macula, the flash ERGcan be normal. This is seen in conditionslike Stargardts’ heredomacular degenerationand early stages of cone dystrophy orlocalized RP. Ganglion cell function is notreflected in flash ERG. Flash ERG does notcorrelate with visual acuity.
2. Diurnal variation exists in rod-ERG b-waveamplitudes, therefore, it should be accountedin serial measurements or research protocols.
3. A number of artifacts such as a blink reflex,muscular tension artifacts (photomyoclonicresponse) or improper electrode placementand contact can lead to erroneous results.The electrophysiologist should be aware ofthese and know how to get valid recordings.
4. ERG recordings require a certain level ofcooperation from the patient. Fixation is notcritical in ERG recording but photophobia,claustrophobia and excessive blinking andanxiety are known to alter the response.
5. Hazy media and miotic pupils can causeerroneous results, as sufficient light does notreach the photoreceptors. Appropriateadjustments would be required to getmeaningful data.
6. Adjustments are also needed for age and highrefractive error as these affect the ERGresponses.
Pattern Electroretinogram
Some of the limitations of flash ERG can beovercome by more recent techniques of pattern

291Electrophysiological Tests for Visual Function Assessment
electroretinogram (PERG) and multifocal ERG.Pattern ERG is a contrast response driven bymacular photoreceptors but originates in theganglion cell layer of retina. It allows both ameasure of central retinal function, and retinalganglion cell function. It is the only electrophysio-logical test that can provide direct assessmentof the ganglion cells. PERG helps in improvedinterpretation of VEP abnormalities and helpsto differentiate optic nerve pathology from themacular pathology.19
Recording Parameters and Measurement
The PERG is recorded (Fig. 18.9) with refractivecorrection in place, without mydriasis, using non-contact lens electrodes.12,13,19 Reference electrodesare placed on ipsilateral outer canthus, and noton forehead or ear, to avoid the contamination
from the cortically generated VEP. Binocularstimulation and recording is usually preferred,except in cases of squint, so the better eye canmaintain fixation and accommodation. It is asmall response and may be difficult to recordwithout stringent controls. Diurnal variation andtest-retest variability may be important inlongitudinal studies.
PERG is measured as the electrical responseto a pattern reversal checkerboard stimulus wherethe overall luminance is unchanged duringpattern reversal. A high contrast (near 100%)black and white checkerboard pattern of 15 and30 minute check size with pattern reversalmethod is recommended. Field size of stimulusshould be between 10 and 16 degrees, and theframe rate of the Cathode rate tube should bea minimum of 75 Hz or above. Stimulus strengthof the white checks should be 80 cd m-2. Steady
Fig. 18.9: PERG measurements (Top). Bottom left shows PERG stimulusand bottom right shows actual recording of PERG from two eyes

292 Diagnostic Procedures in Ophthalmology
fixation is very important because eye movementand blinking will cause severe artifacts. As theamplitudes of PERG signals are small, moreaveraging is needed. Often more than 150responses are averaged to get each response.Sweep time of recording is about 150 milli-seconds. Computerized artifact rejection isessential and this should be set at no higherthan 100 microvolts peak to peak. Backgroundillumination should not be very bright or dim.Ordinary background room light suffices andshould be kept constant for all recordings.
At a stimulus reversal rate of 16 reversalsper second a sinusoidal waveform called Steady-
state PERG is obtained. This needs Fourieranalysis to measure the amplitude and phaseshift and is not often used clinically. At a slowrate of 1-3 Hz (2 to 6 reversals per second) patternreversal, a transient PERG is obtained. Threecomponents are seen in PERG. There is aninitial negative wave (N35) at 35 milliseconds,a positive peak (P50) at 50 milliseconds and afinal negative N95 wave at 95 milliseconds fromstimulus onset. Clinically, the transient PERGhas two main components (Fig. 18.9). P50 is aninner retinal component driven by the macularphotoreceptors. N95 is the second componentwhich is contrast related and is generated bythe ganglion cells.19 PERG P50 amplitudes canvary from 0.5 to 8 microvolts depending onstimulus characteristics such as the temporalfrequency of the stimulus.20 Bandpass filters ofthe AC coupled amplifiers are set from 1-100Hz and notch filters should be switched off.
P50 amplitude is measured from trough ofN35 to the peak of P50, the N95 is measuredfrom peak of P50 to the trough of N95 (Fig. 18.9).P50 latency is a more consistent measurementand used clinically while peak of N 95 is oftenbroad and this precludes accurate latencymeasurement for N95. If N35 is poorly definedthen N35 is replaced by the average time
between time zero and onset of P 50. Age-matchedcontrol data should be generated in eachlaboratory.
Clinical Uses
Pattern ERG is most useful in assessing the visualloss of unknown etiology. It helps in differentia-ting visual loss due to macular photoreceptors/macular inner retinal cells from diseases ofganglion cell and optic nerves. PERG also helpsto monitor early drug toxicity.21
Primary evaluation of macular function: In maculardisorders, the P50 component of the PERG isabnormal, often with preservation of the N95:P50ratio. P50 amplitude is usually affected, withlatency changes only, occasionally being seen,particularly in association with macular edemaor serous detachment at the macula.19 Primarymacular dysfunction such as Stargardt-fundusflavimaculatus, will usually have a normal (rarelysubnormal) flash ERG and an abnormal PERG.In generalized retinal dysfunction with macularinvolvement (cone-rod dystrophy) both ERG andPERG are abnormal. In patients with rod-conedystrophy, but normal central retinal function,the PERG may be normal even when the FlashERG is almost extinguished.
Ganglion cell dysfunction: Primary ganglion celldysfunction is associated with marked N95component loss, particularly in Lebers hereditaryoptic atrophy and advanced dominant opticatrophy.19 Very severe optic nerve disease willalso reduce P50 amplitude, and P50 latency.Complete extinction of the PERG in relation tooptic nerve disease rarely if ever occurs, providingat least one eye has enough vision to maintainfixation for binocular PERG recording. The PERGmay still readily be detectable in an eye withno light perception.19 It must be remembered thatthough pattern VEP is primarily used to detect

293Electrophysiological Tests for Visual Function Assessment
optic nerve dysfunction, macular diseases cancause delayed VEP latency. PERG P50 defectsassociated with or without VEP abnormalities,point to macular dysfunction. Normal or a defectof only N95 component of PERG with anabnormal VEP suggests optic nerve/ ganglioncell dysfunction.19
Limitations of PERG
1. The PERG amplitudes are very small anddue to technical demands, not all laborato-ries record PERG as a routine. Stringentcontrols are required to avoid artifacts. TheISCEV standards are available for PERGrecordings.20
2. Patient cooperation is essential in recordingthe PERG.
3. All equipments for ocular electrophysiologydo not have the capability to perform PERG.
4. In eyes with hazy media where the patternstimulus cannot be projected on the macula,results can be erroneous.
Visual Evoked Potential
Visual evoked potential (VEP) is a sensitiveindicator of optic nerve function. It is an evokedelectrophysiological signal that is recorded atthe scalp in response to visual stimuli. Theresponses are much smaller than the full-fieldflash ERG responses, typically measuring only5-10 microvolts in amplitude, which lie buriedin the electroencephalographic (EEG) noise of50 microvolts or greater. Averaging of therecorded signals over a given time period afterrepeated stimulation can help in extraction ofVEP from the background EEG activity.
Recording and Measurement
The visual stimuli used to elicit VEP are of threetypes: flash, pattern-reversal and pattern-onset.22
The standard flash used in ERG recording canbe used for Flash VEP also. The pattern stimulusconsists of an isoluminant checkerboard orgrating of various spatial frequencies. Skinelectrodes used are silver-silver chloride or gold-disk electrode (Fig. 18.5). Good contact of theelectrodes using conducting paste and thoroughcleaning of skin, help in obtaining clean andreliable recordings. The electrodes are placed onthe scalp relative to bony landmarks in relationto the head size as per the international10/20 system23 (Fig. 18.10). The anteroposteriormidline measurements are based on the distancebetween the nasion, inion and vertex. The activeelectrode is placed on the midline over the visualoccipital cortex (OZ) while reference electrodeat the frontal pole (FZ). The ground electrodeis at the forehead or earlobe.
Recordings are done with refractive correctionwithout mydriasis using monocular stimulation.Prechiasmal lesions are reliably detected bypattern-reversal stimulation while flash stimulusis used in difficult and uncooperative patientsor those with dense media opacities and verypoor vision. Pattern-onset/offset stimulus isespecially useful in malingerers and patients withnystagmus, due to short stimulus duration andinability of the subject to consciously defocusthis stimulus. For chiasmal and postchiasmallesions, multichannel recordings are required asa single midline channel with active electrodeonly over the occipital cortex can miss lesions.The VEP traces (two reproducible records of each)can be presented as positive upwards (Fig. 18.11)or negative upwards. The polarity conventionand stimulus parameters used should beindicated in the report besides the amplitudeand latency. Latency is measured from thestimulus onset to peak of the componentmeasured. It must be remembered that interoculardifference in the pattern-reversal VEP indicatesdysfunction of the entire prechiasmal pathway

294 Diagnostic Procedures in Ophthalmology
Fig. 18.11: Normal pattern-reversal to three different check sizes (top-15, 30 and 60 minutes), Pattern-onset(bottom left) and Flash (bottom right) VEP
Fig. 18.10: The international 10/20 system of electrode placement for midlinesingle channel VEP. Inset shows Pattern VEP recording in progress

295Electrophysiological Tests for Visual Function Assessment
and includes ocular, retinal and optic nervecauses.
Normal Waveforms22
1. Flash VEP: It consists of a series of positiveand negative peaks that are designated innumerical sequence. Commonest componentsrecorded are N2 and P2 at 90 and 120 msec,respectively (Fig. 18.11).
2. Pattern-reversal VEP: The peaks are namedas negative or positive followed by the latency.Commonest wave used for clinical cases isthe P100 component, (positive peak at 100msec) since it is a very robust measure withminimal interocular and inter-subjectmeasurement variation (Fig. 18.11).
3. Pattern-onset/offset VEP: Three componentsdescribed are C1 (positive at 75 msec), C2(negative at 125 msec) and C3 (positive at150 msec). With a stimulated hemifield, theresponse will appear contralateral to thehemifield stimulated.
Limitations of VEP
VEP has following limitations:1. Age, refractive error, inattention and
conscious defocusing of the pattern affect theVEP latency.
2. Stimulus parameters such as contrast,luminance, check size and field size areimportant determinants of the waveform(Fig. 18.11) and it is essential for eachlaboratory to establish their own normalcontrols.
3. Since the amplitudes of VEP are very small,surrounding noise can easily contaminatethem and, therefore, strict vigil has to be kepton the recording equipment, recordingtechnique and the stimulus parameters used.
4. Numerous specialized types of VEP22 arebeing assessed and these are still used as
investigational tools (Table 18.2). Knowledgein these areas is still evolving.
Clinical Uses of VisualElectrophysiological TestsA number of ocular disorders may require visualelectrophysiology testing for proper diagnosis(Tables 18.3 and 18.4). It must be rememberedthat ERG needs to be interpreted in the contextof other clinical features and investigative reportsto arrive at the correct diagnosis. One can beway off the true diagnosis if it is based on ERGrecording alone.
Photoreceptor Dysfunction
In widespread genetic retinal photoreceptordisorders like retinitis pigmentosa (RP) orchoroideremia, a profound reduction of ERG isseen even when retina looks apparently normal.The diagnosis of RP is often obvious in patientswith history of night blindness, progressiveperipheral field constriction and typical retinalchanges including equatorial pigment migration,arterial attenuation, RPE atrophy and disk palloras seen in a 40 years male with visual acuityof 20/50 and residual visual fields of 10 degreescentrally (Fig. 18.12A, top). ERG has a limitedrole in diagnosis but helps to assess residual
TABLE 18.2: SPECIALIZED TYPES OF VEPNOT COVERED BY THE ISCEV STANDARD22
1. Steady state VEP2. Sweep VEP3. Motion VEP4. Chromatic (color) VEP5. Binocular VEP6. Stereo-electro VEP7. Multichannel VEP8. Hemifield VEP9. Multifocal VEP
10. Multifrequency VEP11. LED goggles VEP

296 Diagnostic Procedures in Ophthalmology
macular photoreceptor function. In the test ERGmay not be recordable with routine testing usingstandard flash. With extensive filtering andaveraging (Fig. 18.12B, bottom), response (arrow)can be elicited identifying residual cone function.PERG is a more reliable method of elicitingresidual central macular function (Fig. 18.13).Fields are also important in such cases to definelegal blindness and functional disability in thepatient. ERG, however, is essential in researchstudies to demonstrate diffuse, severe photorecep-tor dysfunction that characterizes even earlystages of RP. A normal ERG recorded beyond6 years of age practically rules out possibilityof developing RP in future. ERG helps to diagnosepatients with atypical findings and also in carrierdetection. Flash ERG in RP (Figs 18.12 to 18.14)can be either extinguished, or show a rod-coneor rarely a cone-rod or even a negative type ofERG dysfunction. All such types usually pointto a progressive disease especially if implicit timeabnormalities are present. True sector or localizedcentral (restricted) disease (Fig. 18.15) may giveamplitude reduction with no implicit time
change, whereas diffuse or generalized diseaseis usually associated with abnormal implicittime.24,25
Localized Photoreceptor Loss withPigmentary Retinal Dystrophy
In atypical retinal pigmentary dystrophies, ERGmay help to confirm the diagnosis anddifferentiate various conditions. For example ina 65 years old female patient with BCVA of20/80 in each eye, there was no history of nightblindness or reduced dark adaptation butgradual progressive loss for reading since 5 years.Posterior pole showed RPE atrophy and mildpigment migration while the rest of the retinawas normal (Fig. 18.15). Retinal arteries showedattenuation and disk had temporal pallor. ERGwas not extinguished or severely affected,excluding the diagnosis of typical RP. However,both scotopic and photopic responses showed20-40% reduction in amplitudes with only mildincrease in latency. The condition can be interpre-ted as an Inverse RP / Central RP26 or central
TABLE 18.3: COMMON INDICATIONS FOR ELECTRORETINOGRAPHY
1. Evaluation of nyctalopia (vitamin A deficiency in children and adults,congenital stationary night blindness, primary diffuse retinaldegenerations, high myopia, malingering
2. Retinitis pigmentosa and allied diseases3. Other pigmentary retinopathies (pseudo-RP)4. Juvenile macular degeneration5. Assessment of ischemia in ocular vascular disease6. Infantile vision impairment and nystagmus7. Evaluation of hemerelopia with or without visual impairment8. Detection of carrier state for X-linked diseases (X-linked RP, CSNB,
achromatopsia, cone- or cone-rod dystrophies)9. Evaluation of eyes with metallic foreign bodies to detect siderosis
10. Evaluation of any retinal toxicity to established retinotoxic drugs likechloroquine, quinine, viagra, anti-epileptic drugs
11. Evaluation of any potential retinal toxicity of newer pharmacologicproducts
12. Evaluation of course of various inflammatory diseases (birdshotretinopathy, MEWDS, AZOOR)
13. Diagnosis

297Electrophysiological Tests for Visual Function Assessment
(c) Kearns-Sayre syndrome [mitochondrial myo-pathy, chronic progressive external ophthalmo-plegia (CPEO), RP, heart block]
(d) Chronic progressive external ophthalmoplegiaplus (CPEO+)
D. Bruch’s membrane disorders(a) Angioid streaks (PXE)(b) Dominant drusen
E. Hereditary vitreoretinal disorders(a) X-linked juvenile retinoschisis(b) Goldmann-Favre syndrome(c) Enhanced S-cone syndrome (ESCS)
F. Inflammatory conditions(a) Multiple evanescent white dot syndrome
(MEWDS)(b) Birdshot retinochoroidopathy(c) Pars planitis(d) Syphilis(e) Pigmented paravenous retinochoroidal atrophy
(PPRCA)(f) Diffuse unilateral subacute neuroretinitis
(DUSN)(g) Rubella
G. Vascular disorders(a) Sickle-cell retinopathy(b) Ophthalmic artery occlusion(c) Central retinal artery occlusion(d) Central retinal vein occlusion(e) Carotid insufficiency (ocular ischemic
syndrome)(f) Diabetic retinopathy
H. Toxic disorders(a) Chloroquine and hydroxychloroquine(b) Quinine(c) Digoxin(d) Thioridazine(e) Chloropromazine(f) Indomethacin(g) Methanol
I. Miscellaneous(a) Albinism(b) High myopia(c) Acquired retinal dysfunction/degeneration
(i) Vitamin A deficiency (malabsorptionsyndromes)
(ii) Autoimmune retinopathy, including cancer-associated retinopathy (CAR) andmelanoma-associated retinopathy (MAR)
(d) Retinal (cone-rod) dystrophy with supernormaland delayed rod ERG b-waves
TABLE 18.4: INDICATIONS OF ELECTROPHYSIOLOGY TESTS IN SPECIFIC DISEASES
A. Retinal and Choroidal Disorders1. Congenital and infantile forms of blindness
(a) Leber congenital amourosis (LCA)(b) Stationary congenital retinal dysfunction
(1) Congenital achromatopsia (completeblue cone monochromatacy)
(2) Congenital stationary night blindness(incomplete and complete CSNB)
(3) Fundus albipunctatus(4) Oguchi disease
(c) Blindness as part of a pediatric neurologicsyndrome(1) Infantile Refsum syndrome, Zelweger
syndrome (retinal degenerationassociated with generalizedperoxisomal disease)
(2) Neuronal ceroid lipofuscinoses(infantile, late infantile, juvenile)
(3) Mucolipidosis type IV(4) Hallervorden-Spatz syndrome (iron
storage in basal ganglia, mentalretardation, spasticity, RP)
(5) Senior-Loken syndrome (LCA orsevere early-onset RP with renalfailure)
(6) Joubert syndrome (retinal aplasia,cerebellar hypoplasia, neonataltachypnea)
2. Rod-cone photoreceptor dystrophy/degenera-tion (hereditary dystrophies)(i) Rod and rod-cone dystrophy/degeneration
(retinitis pigmentosa)(1) Autosomal dominant, autosomal
recessive, X-linked(2) RP with slightly greater cone loss(3) RP with electronegative ERG
(ii) Cone and cone-rod dystrophies3. Macular Dystrophies
(a) Peripherin/Retinal degeneration slow type(RDS)
(b) X-linked (juvenile) retinoschisis(c) Stargardts macular dystrophy(d) Bests macular dystrophy(e) Pattern dystrophy
B. Choroidal dystrophies(a) Choroidal atrophy(b) Gyrate atrophy of the choroid and retina(c) Choroideremia – patients and carriers(d) Central areolar choroidal atrophy
C. Retinal dystrophies associated with other diseases(a) Usher syndrome (RP and congenital deafness)(b) Bardet-Biedl syndrome (RP, hexadactyly,
obesity, hypogenitalism, and mental retardation)

298 Diagnostic Procedures in Ophthalmology
Fig. 18.12: Unrecordable PERG and flash ERG in advanced retinitis pigmentosa depicting macular involvementVA 20/80 OU, Fields central 10 degrees, night blindness present (Top row). Extensive filtering and averaging ofthe maximal combined response to elicit a microvolt ERG (arrow, outside ISCEV standard) showing residual retinalfunction in patient of RP with visual acuity of 20/800 and macular atrophy (Bottom row)
Fig. 18.13: Preserved PERG in a patient of RP with extinguished flash ERG responses showing macularsparing. Visual acuity of a 25-year male was 20/25 and visual fields showed central island of 10 degrees

299Electrophysiological Tests for Visual Function Assessment
Fig. 18.14: Cone-rod dystrophy: Retinal dystrophy with Bulls’ eye macular lesion, arterial narrowing, peripheralRPE degeneration and disk pallor. ERG showed absent cone functions with subnormal but recordable isolated rodresponse suggestive of cone-rod dystrophy in a 29 years patient with VA 20/80. Note large blink artifacts towardsend of recordings (arrows) that are not uncommon due to photophobia in these subjects
Fig. 18.15: Central RP: Fundus photograph showing central location of pigmentary retinopathy with normal periphery.ERG shows subnormal rod and cone functions and ERG is not extinguished. The disease is likely to remain localizedand minimally progressive. Visual acuity of patient 20/80, central scotoma on fields but with no night blindness

300 Diagnostic Procedures in Ophthalmology
pigmentary retinopathy that is likely to be onlyslowly progressive and may not lead to less than20/400 vision.
Cone Dystrophies
Cone dystrophies (Fig. 18.16) have normal rodresponses, but subnormal, though not extingui-shed, cone responses.27 The 30 Hz flicker responseusually shows both amplitude reduction anddelayed implicit time. In early stages, the patientmay present with normal macula and mildtemporal disc pallor and be misdiagnosed asoptic nerve dysfunction if abnormal VEP isdemonstrated, without recording the ERG. Inlater years such patients develop typical Bull’seye lesion. Some patients can have supernormalrod responses. One common presentation of cone
dystrophy is a patient with visual loss ofunknown etiology (Fig. 18.17) where ERG givesthe correct diagnosis.
Inner Retinal Dysfunction:Negative ERG
In a negative ERG the a-wave is unaffected butthe b-wave in the scotopic maximal retinalresponse has a selective reduction of amplitude.It usually signifies diseases sparing the photo-receptors and involving the dysfunction ofpost-photo transduction and probably post-receptor cells in the middle retinal layers. In amajority of cases an etiology can be detected aftercorrelating clinical and ERG findings, but in somecases the clinical entity cannot be labeled asspecific.
Fig. 18.16: Cone dystrophy: Male 36 year with VA 20/200, color vision loss and central scotoma. Localized conedystrophy involving only macular photoreceptors, it shows severely reduced and delayed P50 in PERG. Other flashERG responses are normal including photopic responses as the peripheral cones (that are more in numbers thanmacular cones) are uninvolved
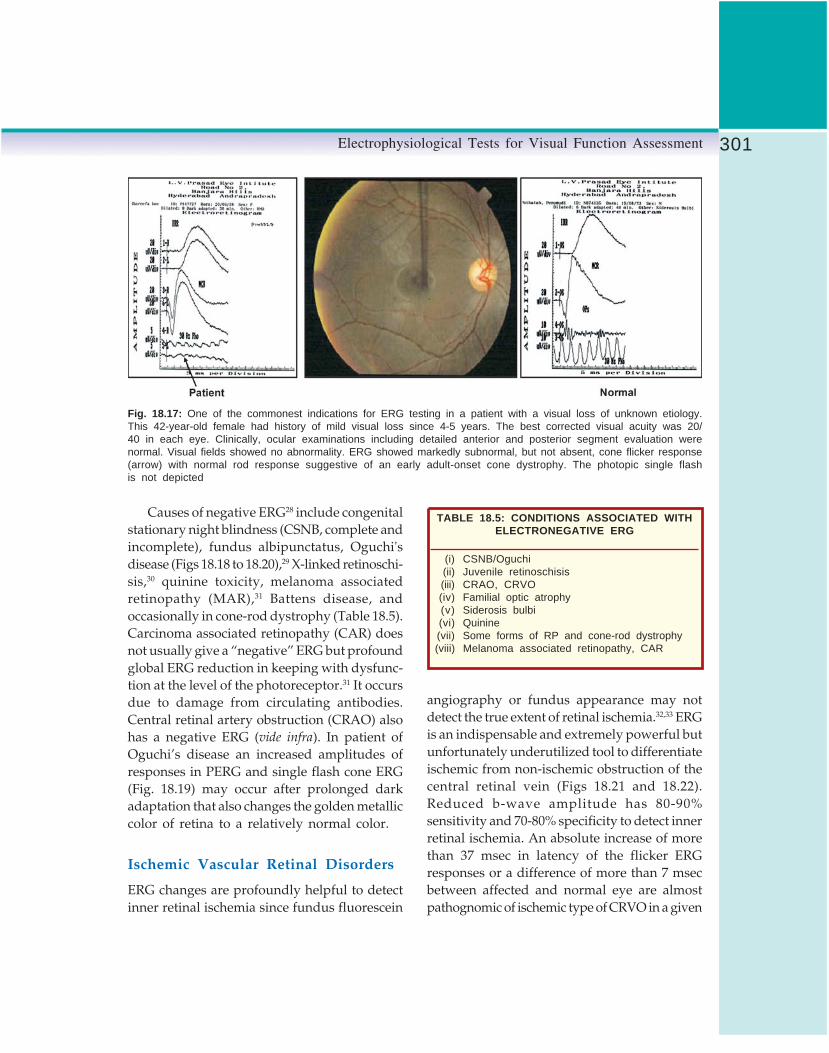
301Electrophysiological Tests for Visual Function Assessment
Causes of negative ERG28 include congenitalstationary night blindness (CSNB, complete andincomplete), fundus albipunctatus, Oguchi'sdisease (Figs 18.18 to 18.20),29 X-linked retinoschi-sis,30 quinine toxicity, melanoma associatedretinopathy (MAR),31 Battens disease, andoccasionally in cone-rod dystrophy (Table 18.5).Carcinoma associated retinopathy (CAR) doesnot usually give a “negative” ERG but profoundglobal ERG reduction in keeping with dysfunc-tion at the level of the photoreceptor.31 It occursdue to damage from circulating antibodies.Central retinal artery obstruction (CRAO) alsohas a negative ERG (vide infra). In patient ofOguchi’s disease an increased amplitudes ofresponses in PERG and single flash cone ERG(Fig. 18.19) may occur after prolonged darkadaptation that also changes the golden metalliccolor of retina to a relatively normal color.
Ischemic Vascular Retinal Disorders
ERG changes are profoundly helpful to detectinner retinal ischemia since fundus fluorescein
angiography or fundus appearance may notdetect the true extent of retinal ischemia.32,33 ERGis an indispensable and extremely powerful butunfortunately underutilized tool to differentiateischemic from non-ischemic obstruction of thecentral retinal vein (Figs 18.21 and 18.22).Reduced b-wave amplitude has 80-90%sensitivity and 70-80% specificity to detect innerretinal ischemia. An absolute increase of morethan 37 msec in latency of the flicker ERGresponses or a difference of more than 7 msecbetween affected and normal eye are almostpathognomic of ischemic type of CRVO in a given
TABLE 18.5: CONDITIONS ASSOCIATED WITHELECTRONEGATIVE ERG
(i) CSNB/Oguchi(ii) Juvenile retinoschisis(iii) CRAO, CRVO(iv) Familial optic atrophy(v) Siderosis bulbi(vi) Quinine(vii) Some forms of RP and cone-rod dystrophy(viii) Melanoma associated retinopathy, CAR
Fig. 18.17: One of the commonest indications for ERG testing in a patient with a visual loss of unknown etiology.This 42-year-old female had history of mild visual loss since 4-5 years. The best corrected visual acuity was 20/40 in each eye. Clinically, ocular examinations including detailed anterior and posterior segment evaluation werenormal. Visual fields showed no abnormality. ERG showed markedly subnormal, but not absent, cone flicker response(arrow) with normal rod response suggestive of an early adult-onset cone dystrophy. The photopic single flashis not depicted

302 Diagnostic Procedures in Ophthalmology
clinical setting. Reliable information from FFAmay be available only in 50-60% cases of CRVOdue to media haze, extensive hemorrhages, poorquality photographs and inability to visualizeperipheral retina. ERG circumvents all theselimitations as it is a global response from thewhole retina and is not too much affected bymedia haze.
Other conditions like ocular ischemicsyndrome34 (Fig. 18.23), central retinal arteryocclusion (Fig. 18.24) and ophthalmic arteryocclusion (extinguished ERG) 35 are also very welldetected on ERG. The “negative” ERG in centralretinal artery occlusion (CRAO) 35 occurs due to
the double blood supply of the retina. The RPE/photoreceptors (a wave) are spared as they aresupplied via choroidal circulation, but bipolarcells and amacrine cells (b-wave and oscillatorypotentials) are affected as they are supplied viacentral retinal artery. In ophthalmic arteryobstruction where both retinal and choroidalcirculation are affected, the ERG is unrecordableas all retinal cell layers are involved.35
In ocular ischemic syndrome ERG isextremely useful since clinical presentation ofthis under diagnosed clinical entity is variable.36
In diabetic retinopathy37progressive abnorma-lities in ERG are seen with progression of the
A
A1
B
B1
Figs 18.18A and B: Oguchi's disease. A & A1 Fundus appearance before and B & B1 2 hoursafter dark adaptation. Corresponding ERG are shown in Figure 18.19

303Electrophysiological Tests for Visual Function Assessment
Fig. 18.19: Oguchi's disease: ERG findings after 20 minutes and after 2 hours of dark adaptation in Oguchi'sdisease. In each case the left graph is before and right graph is after the prolonged dark adaptation. The OP’sand on-off responses were recorded only once before prolonged dark adaptation and show absence of off-response.Baseline findings are similar to those seen in complete form of CSNB with normal fundus with the exception ofa much smaller or nearly absent MCR b-wave in classical complete CSNB
Fig. 18.20: Oguchi's disease: Negative ERG with preserved isolated rod responses and photopic flash andflicker ERG suggestive of incomplete CSNB

304 Diagnostic Procedures in Ophthalmology
retinopathy. The oscillatory potentials showprofound reduction in case of disk new vessels(NVD). The ERG can be subnormal even beforeclinical retinopathy, possibly due to metaboliceffects on the retinal cells. ERG, however, cannotpredict accurately the presence of PDR and is,therefore, not used clinically for monitoringdiabetic retinopathy.
Drug Toxicity and Monitoring Healthof Retina25
ERG helps to differentiate nyctalopia due tovitamin A deficiency from CSNB and RP. ERGis indicated particularly in adults such as thosewith alcoholic liver disease, chronic pancreatitis,or malabsorption syndromes. The rod responses
are markedly affected and white flecks may beseen in the retina. Visual acuity is unaffected.Similarly, ERG abnormalities can be seen in drugtoxicity especially with hydroxychloroquine,38
chloroquine, quinine and thioridazine. VEP isuseful to detect ethambutol toxicity (Fig. 18.25).
ERG can detect and prognosticate sideroticchanges in eyes with retained iron IOFB.31 InitiallyERG has a subnormal b-wave on maximalcombined scotopic response that can progressto a negative ERG with time and ultimatelybecome extinguished. Removal of IOFB in eyeswith recordable ERG, may lead to improvementin ERG changes and a stable outcome. Inadvanced siderosis, removal of IOFB will notstop progressive visual loss and sometimesphthisis bulbi develops.
Fig. 18.21: Non-ischemic CRVO: A 28-year male had mild blurring of vision since 5 days due to CRVO withmild macular edema. The full field ERG of right eye is very much comparable to the left eye; both of which arewithin normal limits suggestive of non-ischemic CRVO. Note the PERG is showing reduced P50 amplitude in theright eye compared to left eye. Although the vision is same (20/20) in both eyes but the macular function of theright eye is not same as the left eye possibly due to macular edema leading to symptomatic reduced contrastsensitivity in the patient
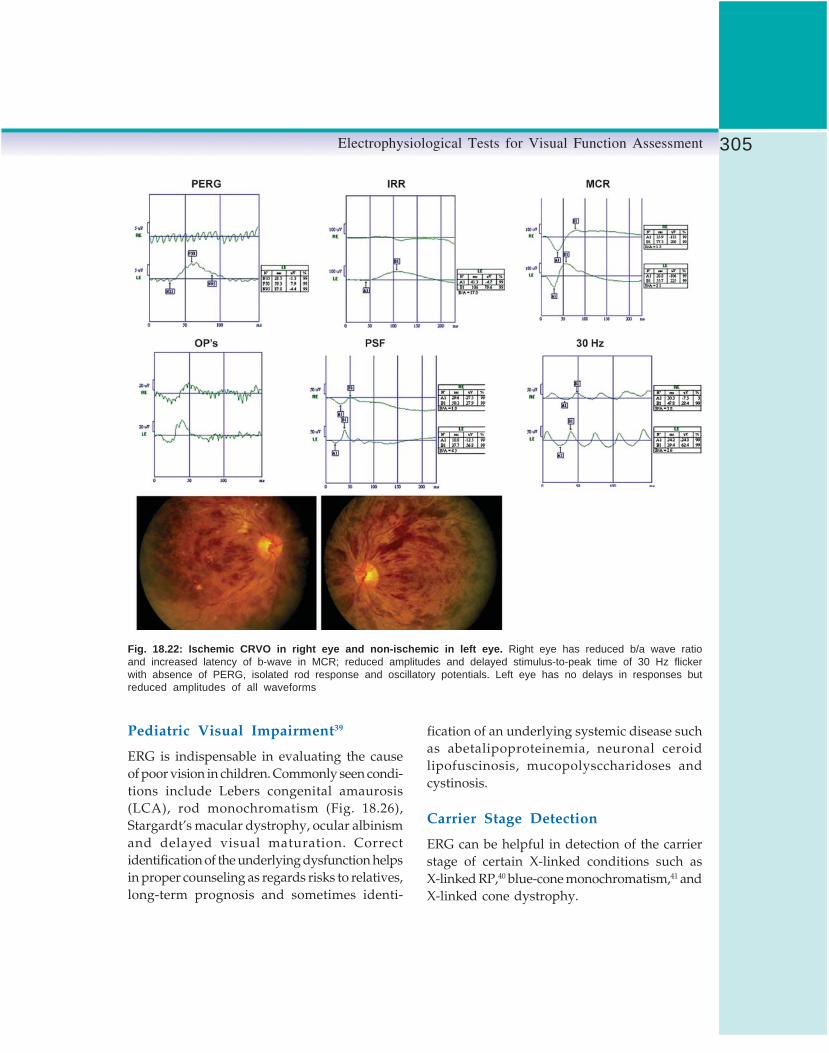
305Electrophysiological Tests for Visual Function Assessment
Pediatric Visual Impairment39
ERG is indispensable in evaluating the causeof poor vision in children. Commonly seen condi-tions include Lebers congenital amaurosis(LCA), rod monochromatism (Fig. 18.26),Stargardt’s macular dystrophy, ocular albinismand delayed visual maturation. Correctidentification of the underlying dysfunction helpsin proper counseling as regards risks to relatives,long-term prognosis and sometimes identi-
fication of an underlying systemic disease suchas abetalipoproteinemia, neuronal ceroidlipofuscinosis, mucopolysccharidoses andcystinosis.
Carrier Stage Detection
ERG can be helpful in detection of the carrierstage of certain X-linked conditions such asX-linked RP,40 blue-cone monochromatism,41 andX-linked cone dystrophy.
Fig. 18.22: Ischemic CRVO in right eye and non-ischemic in left eye. Right eye has reduced b/a wave ratioand increased latency of b-wave in MCR; reduced amplitudes and delayed stimulus-to-peak time of 30 Hz flickerwith absence of PERG, isolated rod response and oscillatory potentials. Left eye has no delays in responses butreduced amplitudes of all waveforms

306 Diagnostic Procedures in Ophthalmology
Optic Nerve and Visual Pathway
Optic nerve and visual dysfunction42 includefollowing conditions:1. Optic nerve demyelination: The pattern VEP
(PVEP) latency (P100) is usually delayed inoptic nerve demyelination and the delay maybe subclinical, i.e. it may occur with no signsor symptoms of optic nerve involvement.43,44
This may significantly affect clinical manage-ment in a patient with spinal cord diseaseand possible multiple sclerosis (MS). The VEPis almost invariably delayed followingsymptomatic optic nerve involvement in MS,even when vision has returned to normal.
2. Papilledema: In papilledema the VEP is normalunless secondary optic atrophy occurs.
3. Anterior ischemic optic neuropathy: In anteriorischemic optic neuropathy (AION) the PERGshows normal P50 amplitude and latency,elevation of N95, normal flash ERG andreduced amplitude with normal P100 latencyin VEP (Fig. 18.27). Using multichannel VEPrecordings, the chiasmal lesions, such aspituitary tumors, show a “crossed asym-metry” where there is an abnormal distribu-tion over the two hemispheres which is inan opposite direction for the two eyes.45
Stimulus parameters are crucial for accuratelocalization. In general, use of a large field,large check stimulus gives paradoxicallateralization45 whereas a small field,small check stimulus gives anatomicallateralization. Retrochiasmal lesions give an
Fig. 18.23: Ocular ischemic syndrome: A 68-year female with VA 20/50 and early cataract in each eye. Fundushad features of NPDR, dilated veins and minimal disk pallor. ERG showed reduced amplitude of rod mediated innerretinal responses (IRR), and reduced b/a wave ratio in maximal combined response (MCR).The inner retinal ischemiawas depicted by reduced amplitudes and poorly recordable oscillatory potentials, with delayed stimulus-to-peak timeof 30-Hz flicker ERG. Carotid artery doppler (not shown) showed moderate atheromatous changes. Patient developedneovascular glaucoma six months later without worsening of retinopathy in the right eye

307Electrophysiological Tests for Visual Function Assessment
“uncrossed” asymmetry where there is anabnormal distribution that is the same forthe two eyes. Serial VEP recordings can helpdetect recurrences or non-responsiveness tomedical therapy as VEP abnormalities canoccur before visual fields or visual acuitybecome abnormal.
4. Ocular albinism: In some cases of ocularalbinism, the condition may not be apparentin the absence of typical phenotypic expres-sion of skin or iris, but child can have nystag-mus and poor vision due to an albinogenotype. All albinos, irrespective of genotypeor phenotype exhibit misrouting. Heterozy-gote carriers do not demonstrate misrouting.The diagnosis of the intracranial misrouting
of albinism, where the majority of optic nervefibers from each eye do not decussate to thecontralateral hemisphere, is readily demon-strated by multichannel VEP. Abnormalitiesmay occur in response to either patternappearance or diffuse flash stimulation, butthe flash VEP appears to be more effectivein infants and the pattern appearance VEPin adults.
5. Visual acuity assessment: Objective assessmentof visual acuity is performed with patternappearance stimulation using a very briefappearance time in order to minimize thepossibility of voluntary closure or defocusing.
6. Other optic nerve diseases: Lebers hereditaryoptic neuropathy (LHON), toxic and nutri-
Fig. 18.24: CRAO: Left eye with CRAO shows preserved a-wave and absent b-wave (negative ERG) in maximalcombined response depicting preservation of outer retinal cell layers supplied by choroidal vasculature and ischemiain inner retinal layers supplied by central retinal artery. Right eye responses are normal

308 Diagnostic Procedures in Ophthalmology
tional optic neuropathies and traumatic opticneuropathy show variable changes inamplitude and latency of VEP depending onextent of involvement.
7. Visual loss assessment in infants and children:
VEP is a useful tool along with ERG andother clinical assessments to differentiatevarious conditions such as cortical visualimpairment, delayed visual maturation, andamblyopia.
8. Malingering: Along with other tests, VEP helpsto differentiate malingering from visualpathway lesions. Pattern onset is a useful
technique as subjects cannot voluntarily blurthis stimulus.
Recent Advances in MultifocalERG and Multifocal VEPMultifocal ERG (mfERG) technique developedinitially by Bearse and Sutter46 allows local ERGresponses to be recorded simultaneously frommany regions of the retina. The response isthought to originate from outer retina with rela-tively little contribution from the ganglion cells.47
Fig. 18.25: Ethambutol toxicity: This 18-years male has rapidly progressive, bilateral sequential loss of visionfrom 4 months (20/400). There was bilateral optic disk pallor with ill-sustained pupillary reactions but no RAPD.The pattern VEP was unrecordable. Flash ERG was normal. In PERG, the N95 was absent (arrow) and P50 waspreserved confirming the patient to have bilateral optic neuropathy. Visual fields showed central 7 degrees of scotomain both eyes. History of antitubercular treatment in the past pointed to a diagnosis of possible ethambutol toxicity

309Electrophysiological Tests for Visual Function Assessment
Responses are recorded to a scaled hexagonalpattern-reversal stimulus in photopic conditions(Fig. 18.28) although some laboratories areattempting to record scotopic mfERG also. MfERGhelps to distinguish between diseases of the outerretina and ganglion cells or optic nerves. Alongwith multifocal VEP (mfVEP),48 the mfERG helpsto differentiate organic and non-organic causesof visual loss.
There are some limitations of these techniques.Since it is an evolving technology the recordingparameters and interpretation are still not standa-rdized, though guidelines have been formulated.49
The techniques are still not widely available. Fullfield ERG helps to evaluate the function of theretina as a whole. However, it cannot detect focalareas of abnormal function. Multifocal ERG is anew technique. It allows analysis of local ERGresponses to assess focal retinal function. Basictechnology is similar to full-field ERG in some
aspects. In mfERG the recording, ground andreference electrodes and their placement close toor on the cornea, lateral canthus and ear lobe aresimilar to the routine ERG. Recording isdone with dilated pupils with subject placed inordinary room light for 15 minutes before testing.
Effect of Stimulus on mfERG 46,47
Stimulus can be delivered by a cathode ray tube(CRT), i.e. monitor LCD projectors, LED arraysor scanning laser ophthalmoscope. The com-monest frame frequency of the CRT is 75 Hzand should never be 50 or 60 Hz as this is similarto the line current frequency which interferesas noise with the recordings. Stable fixation isessential to get reliable mfERG recordings andvarious fixation targets and monitoring devicesmay be used that do not interfere with therecordings.
Fig. 18.26: Rod monochromatism: Showing poorly recordable PERG (due to nystagmus), and absent cone-mediatedresponses (PSF, 30 Hz) with normal scotopic rod-mediated responses (IRR, MCR). This child of 8 years hadVA of 20/400, congenital nystagmus that had reduced with time and photophobia with complete achromatopsia

310 Diagnostic Procedures in Ophthalmology
The retina is stimulated with a black andwhite pattern of hexagonal elements each ofwhich has a 50% chance of being illuminatedevery time the frame changes. The hexagonalpattern was designed to compensate for the localdifferences in signal density (cone density) across
the posterior retina. Thus the central hexagonsare smaller than the peripheral ones (Fig. 18.28).Each hexagon element follows a fixedpredetermined sequence called m-sequence thatcontrols the order of flicker of the stimuluselements between light and dark. This sequence
Fig. 18.27: Anterior ischemic optic neuropathy: A 48-year-old male had one month reduction of vision in theleft eye. VA was 6/6 and 6/60 in the right and left eyes respectively. Left eye showed diffuse field loss (not shown).Right eye color fundus (Top left) and red free photograph (Middle left) showed normal color of the disk with fewRPE changes at macula. Color fundus photograph of the left eye (Top right) showed small disk with no cup anddiffuse pallor. Red free photograph of left eye (Middle right) showed 3 quadrants disk pallor with sparing of inferotemporalsegment. Pattern ERG showed normal P50 and N95 responses in right eye. Left eye showed reduced amplitudeand delayed latency of P50, with secondary elevation of N95 component (arrow) (Extreme top right). The patternVEP had normal amplitude and latency in right eye (Bottom right) but was poorly recordable in the left eye (Bottomleft)

311Electrophysiological Tests for Visual Function Assessment
is designed in such a way that the overallluminance of the screen over the time of recordingis relatively stable, i.e. equiluminant. The overallstimulus pattern should subtend a visual angleof 20-30 degrees on either side of fixation. Thestimulus region can be divided into differentnumbers of hexagons such as 61, 103 or 241.Duration of recording varies from 4-8 minutesdepending on whether 61 or 103 elements areused. Various artifacts in mfERG recordingsinclude electrical noise, movement errors due tofixation losses, eccentric fixation, shadowingerrors due to edge of refraction lenses, and errorsdue to too much averaging.
Multifocal ERG Responses
By correlating the continuous ERG signal withthe on or off phases of each stimulus element,
the focal ERG signal associated with eachelement is calculated. The data obtained can bedisplayed in various ways; commonly as atopographic array, a three-dimensional plot oras group averages (Fig. 18.28). The trace arraysare essential to display as they not only showthe topographical variations due to focalpathology but also demonstrate the quality ofthe records. It is important to remember that thetracings of mfERG are not responses in the senseof direct electrical signals from a local regionof the retina. The mfERG waveforms are amathematical extraction of signals that correlatewith the time that one portion of the screen isilluminated. The signals are hence influencedby adaptation effects from previous stimuli andby scattered light from other fundus areas.
The typical waveform of the primary mfERG(first order or first order kernel K1) is a biphasic
Fig. 18.28: Normal multifocal ERG stimulus and variety of output display

312 Diagnostic Procedures in Ophthalmology
wave. The initial negative deflection is calledN1, which is followed by a positive deflectionPI and a second negative deflection called N2.Thecellular origins of these responses is still understudy but the N1 may be from photoreceptorswhile P1 may have contributions from the innerretinal cells. The amplitude and latencymeasurements of N1 and P1 follow the sameconvention as for the a- and b-waves of routineflash ERG. Each laboratory needs to establishits normative data for meaningful comparisons.
Clinical Uses of Multifocal ERG
Multifocal ERG is still under evaluation forclinical usage. However, it is used in the studyof following conditions:1. Maculopathies such as cone dystrophy,
central areolar atrophy (Fig. 18.29), andStargardt's macular dystrophy (Fig. 18.30).
2. Retinal vascular disorders3. Inflammatory conditions of optic nerve
4. Field loss due to ocular and non-ocularpathology
5. Toxic retinal pathology and6. Visual loss of unknown etiology.
Focal Macular ERG
Focal macular ERG50 is another technique torecord ERG responses from the macular areaalone. There is, however, no consensus on thebest technique or standardized technique for focalmacular ERG. With advent of PERG andmultifocal ERG there is still a need to assessas to which of these techniques is useful in clinicalsituations. Presently, focal macular ERG is notin widespread use.
ConclusionThe objective information provided byelectrophysiological examination of the visual
Fig. 18.29: Central areolar atrophy: It shows subnormal PERG, normal full-field ERG andreduced multifocal ERG. Right bottom shows clinical fundus picture

313Electrophysiological Tests for Visual Function Assessment
system is important in the diagnosis andmanagement of diseases of visual pathway. Theclinician recording the waveforms and theone interpreting the test results should bethoroughly conversant with the pitfalls andinterrelation of various tests ordered. Theelectrophysiology results must always be
interpreted and correlated to the clinical andother test parameters to avoid misdiagnosis.Newer techniques in this field such as multifocalERG, multifocal VEP, focal macular ERG andmotion VEP are constantly evolving to improveour diagnostic ability and understanding of thevisual pathway.
Fig. 18.30: Multifocal ERG in Stargardt's heredomacular degeneration showing reduced central cone function
TABLE 18.6: NORMAL VALUES IN THE LVPEI LABORATORY USING THE METROVISIONSYSTEM (FIG. 18.7)
Response a-wave b-waveAmplitude Latency Amplitude Latency
(microvolts) (milliseconds) (microvolts) (milliseconds)
Isolated rod response - - 130-160 90-110Maximal retinal response 105-130 20.0-22.0 350-450 45.00±4Photopic cone 120-180 27-3130 Hz Flicker 100-150 33-35
314 Diagnostic Procedures in Ophthalmology
Note:1. The website of the International Society for
Clinical Electrophysiology of Vision (ISCEV)www.iscev.org provides full text of all standardsand guidelines for ocular electrophysiologyrecording. Each laboratory involved in such tests,whether for clinical or research purposes, mustattempt to meet these standards so as to havemeaningful international communications.
2. The recordings shown in this chapter are on twotypes of electrophysiology recording systems:LKC UTAS-2000 and Metrovision. Due to spaceconstraints only one waveform of each eye isshown instead of two reproducible waveforms.The normal values in our laboratory are givenin Table 18.6.
References1. Welber RG, Eisner A. Retinal function and
physiological studies. In: Retinal Dystrophiesand Degenerations. Newsome DA (Ed). NewYork, Raven Press 1988;44-69.
2. Arden GB, Barrada A, Kelsey JH. New clinicaltest of retinal function based on the standingpotential of the eye. Br J Ophthalmol 1962;46:449-67.
3. Arden GB, Fojas MR. Electrophysiologicalabnormalities in pigmentary degenerations ofthe retina. Arch Ophthalmol 1962;68:369-89.
4. Marmor MF, Zrenner E (for the InternationalSociety for Clinical Electrophysiology of Vision):Standard for Clinical Electrooculography. DocOphthalmol 1993;85:115-24.
5. Krill AE, Morse PA, Potts AM, Klein BA.Hereditary vitelliruptive macular degeneration.Am J Ophthalmol 1966;61:1405-15.
6. Brink HM, Pinckers AJ, Verbeek AM. The electro-oculogram in uveal melanoma: A prospectivestudy. Doc Ophthalmologica 1990;75:329-34.
7. Arden GB, Wolf JE. The human electrooculo-gram: interaction of light and alcohol. InvestOphth Vis Sci 2000;41:2722-29.
8. Kolder H, Brecher GA. Fast oscillations of thecorneoretinal potential in man. Arch Ophthalmol1966;75:232-37.
9. Marmor MF, Zrenner E (for the InternationalSociety for Clinical Electrophysiology of Vision):Standard for Clinical Electroretinography (1994Update). Doc Ophthalmol 1995;89:199-210.
10. Marmor MF, Zrenner E (for the InternationalSociety for Clinical Electrophysiology of Vision):Standard for Clinical Electroretinography (1999Update). Doc Ophthalmol 1999;97:143-56.
11. Brigell M, Bach M, Barber C, Kawasaki K,Kooijman A. Guidelines for calibration ofstimulus and recording parameters used invisual clinical electrophysiology. Doc Ophthalmol1998;95:1-14.
12. Dawson WW, Trick GL, Litzkow CA. Improvedelectrode for electroretinography. InvestOphthalmol Vis Sci 1979;18:988-91.
13. Ram LSM, Jalali S, Reddy PSR, Rao VS, DasT, Nutheti R. Safety and efficacy evaluation ofa new Electrode (The LVP Electrode) Part I.Pattern ERG pilot study. Doc Ophthalmol 2003;107:171-77.
14. Ram LSM, Jalali S, Faheemuddin S, Das T, NuthetiR. Safety and efficacy evaluation of a new ERGelectrode (The LVP Electrode) Part II. Flash ERGpilot study. Doc Ophthalmol 2003;107:179-83.
15. Shiells RA, Falk G. Contribution of rod, on-bipolar and horizontal cell light responses tothe ERG of dogfish retina. Vis Neurosci 1999;16:503-11.
16. Bush RA, Sieving PA. A proximal retinalcomponent in the primate photopic ERG a-wave.Invest Ophthalmol Vis Sci 1994;35:635-45.
17. Bush RA, Sieving P A. Inner retinal contributionsto the primate photopic fast flicker electroretino-gram. J Opt Soc Am A 1996;13:557-65.
18. Sieving PA. Photopic ON- and OFF-pathwayabnormalities in retinal dystrophies. Trans AmOphthalmol Soc 1993;91:701-73.
19. Holder GE. The pattern electroretinogram andan integrated approach to visual pathwaydiagnosis. Prog Retin Eye Res 2001;20:531-61.
20. Bach M, Hawlina M, Holder GE, Marmor MF,Meigen T, Vaegan, Miyake Y. Standard forPattern Electroretinography. Doc Ophthalmol2000;101:11-18.
21. Neubauer AS, Steifelmyer S, Berninger T, ArdenGB, Rudolph G. The multifocal patternelectroretinography in chloroquine retinopathy.Ophthal Res 2004;36:106-13.
22. Odom JV, Bach M, Barber C, Brigell M, MarmorMF, Tormene AP, Holder G, Vaegan. For theInternational Society for Clinical Electrophysio-logy of Vision. Visual evoked Potential standard(2004). Doc Ophthalmol 2004;108.

315Electrophysiological Tests for Visual Function Assessment
23. American Encephalographic Society. Guidelinethirteen: Guidelines for standard electrodeplacement nomenclature. J Clin Neurophysiol1994;11:111-13.
24. Marmor MF. The electroretinogram in Retinitispigmentosa. Arch Ophthalmol 1979; 97:1300-04.
25. Berson EL. Retinitis pigmentosa and allieddiseases: applications of electroretinographictesting. Int Ophthalmol 1981;4:7-22.
26. Marmor MF, Aguirre G, Arden G, et al. Retinitispigmentosa: Symposium on terminology andmethods of exmination. Ophthalmology 1983; 90:126-31.
27. Krill AE, Deutman AF, Fishman M. The conedegenerations. Doc Ophthalmol 1973;35:1-80.
28. Koh AH, Hogg CR, Holder GE. The incidenceof negative ERG in clinical practice. DocOphthalmol 2001;102:19-30.
29. Miyake Y, Yagasaki K, Horiguchi M, KandaT. Congenital stationary night blindness withnegative ERG. A new classification. ArchOphthalmol 1986;104:1013-20.
30. Tantri A, Vrabee TR, Cuunjieng A, Frost A,Annesley WH Jr., Donoso LA. X-linkedRetinoschisis. A clinical and molecular geneticsreview. Surv Ophthalmol 2004;49:214-30.
31. Scholl HP, Zrenner E. Electrophysiology inacquired retinal disorders. Surv Ophthalmol 2000;45:29-47.
32. Hayreh SS, Klugna MR, Beri M, Kimera AL,Podhajsky P. Differentiation of ischemic fromnon-ischemic CRVO during the early acutephase. Graefes Arch Clinical and Exp Ophthalmol1990;228:201-17.
33. Johnson MA, McPhee TJ. Electrophysiologicfindings in iris neovascularization due to acutecentral retinal vein occlusion. Arch Ophthalmol1993;111:808-14.
34. Brown GC, Magragal LE. The ocular ischemicsyndrome: clinical, fluorescein angiographic andcarotid angiographic features. Int Ophthalmol1988;11:243-51.
35. Brown GC, Magragal LE, Sergott R. Acuteobstruction of the retinal and choroidalcirculation. Ophthalmology 1986;93:1373-82.
36. Hussain N, Jalali S, Kaul S. Carotid artery diseasesand ocular disorders. Ind J Ophthalmol 2001;49:5-14.
37. Tzekov R, Arden GB. The electroretinogram indiabetic retinopathy. Surv Ophthalmol 1999;44:53-60.
38. Tzekov RT, Serrato A, Marmor MF. Electroreti-nogram findings in patients using hydroxy-chloroquine. Doc Ophthalmol 2004;108:87-97.
39. Kriss A, Jeffrey B, Taylor D. The Electroretino-gram in infants and young children. J ClinNeurophysiol 1992;9:373-93.
40. Berson EL, Rosen JB, Simonoff EA. Electroretino-graphic testing as an aid in detection of carriersof X-chromosome linked Retinitis pigmentosa.Am J Ophthalmol 1979;87:460-68.
41. Berson EL, Sandberg MA, Maguire A, BromleyWC, Roderick TH. Electroretinograms in carriersof blue cone monochromatism. Am J Ophthalmol1986;105:254-61.
42. Heckenlively JR, Weleber RG, Arden GB. Testinglevels of the visual system. In: Heckenlively JR andArden GB (Eds). Principles and Practice of ClinicalElectrophysiology of Vision. St Louis, Mosby YearBook, 1991;485-93.
43. Holliday AM, McDonald WI, Mushin J. Visualevoked response in the diagnosis of multiplesclerosis. Br Med J 1973;4:661-64.
44. Holder GE. Multiple sclerosis. In: Heckenlively JRand Arden GB (Eds). Principles and Practice ofClinical Electrophysiology of Vision. St Louis,Mosby Year Book 1991;797-805.
45. Holder GE. Chiasmal and Retrochiasmal lesions.In: Heckenlively JR and Arden GB (Eds).Principles and Practice of Clinical Electrophysio-logy of Vision. St Louis, Mosby Year Book,1991;557-64.
46. Bearse MA Jr., Sutter EE. Imaging localized retinaldysfunction with the multifocal ERG. J Opt Soc AmA 1996;13:634-40.
47. Hood DC, Odel JG, Chen CS, Winn BJ. The multi-focal ERG. J Neuroophthalmol 2003; 23: 225-35.
48. Hood DC, Odel JG, Winn BJ. The multifocal VEP.J Neuroophthalmol 2003;23:279-89.
49. Marmor MF, Hood DC, Keating D, Kondo M,Seelinger MW, Miyake Y. For The InternationalSociety for Clinical Electrophysiology of Vision.Guidelines for basic multifocal ERG. DocOphthalmol 2003;106:105-15.
50. Miyake Y. Focal macular electroretinography.Nagoya L Med Sci 1998;61:79-89.

316 Diagnostic Procedures in Ophthalmology
SAVITRI SHARMA, SREEDHARAN ATHMANATHAN
DiagnosticProcedures in
Infectious Keratitis19Microbial keratitis may be caused by bacteria,fungi, parasites or viruses and each of these mayproduce a spectrum of disease which may ormay not have distinctive clinical appearance.Many a time it may not be possible to discriminatebetween infected or non-infected corneas. Tominimize morbidity that may occur secondaryto delay in diagnosis and to achieve favorableoutcome within a reasonable cost and time,laboratory investigations are indicated in patientswith suspected microbial keratitis.
Two entirely different protocols are requiredto be followed while investigating viral and non-viral corneal ulcers, so determined on the basisof clinical features. A combination of the twoprotocols may be called for when a distinctionof viral versus non-viral is not obvious clinically.In the interest of clarity, this chapter is dividedin two parts to describe microbiologic proceduresrequired for work-up of clinically non-viral andviral corneal ulcers.
Familiarity of ophthalmologists to the func-tions, limitations, and scopes of microbiologylaboratory is important for proper and meaning-ful interpretation of results. A well equippedocular microbiology laboratory with well trainedtechnical personnel has great advantages overa general microbiology laboratory, in handling
and processing minute quantity of ocularsamples, especially corneal samples. Specialorientation towards processing and interpreta-tion of results is of paramount importance.1
Protocol for Non-viralKeratitis: Bacterial, Fungaland AcanthamoebaIdeally, samples for the microbiologicinvestigations of a suspected microbial keratitismust be collected before the start of any antibiotictreatment. Treatment can be initiated based onthe result of the smears and, if required, modifiedin accordance with the culture and sensitivityresults. The protocol essentially consists of foursteps, viz: collecting, transport, and processingof the clinical samples and interpretation of theresults.
Collection of Samples
Prior to the collection of sample from the cornealulcer itself, it is generally recommended to obtaina culture from the lids and conjunctiva of boththe infected and the uninfected eye.2 Thisprocedure is supposed to help in two ways:firstly, the organism(s) grown from the uninvolved

317Diagnostic Procedures in Infectious Keratitis
eye (indicating normal flora) may be used forcomparative purposes, secondly, in the absenceof growth from the ulcer the organism(s) fromthe cul-de-sac of the involved eye may well bethe causative organism(s).2 Despite recommen-dation for this procedure in several textbooks,in our experience, samples from lids and conjunc-tiva have not yielded useful results in themanagement of corneal ulcers.3 Similar observa-tion has been made in the newer edition ofLaboratory diagnosis of ocular infections publishedby the American Society of Microbiology,4 whichis a deviation from the earlier edition recommen-ding collection and processing of samples fromthe eyelid margins and conjunctiva. Samplescollected from the site of lesion, i.e. the infectedcorneal tissue are the most valuable formicrobiological diagnosis of microbial keratitis.If available, any foreign body on the cornea,contact lens, contact lens case, or lens solutionsmay be collected.
Corneal samples can be collected using theslit-lamp or operating microscope afterinstillation of topical anesthetic (4% Lignocainehydrochloride or 0.5% Proparacaine hydro-chloride). These anesthetic agents may havevariable effect on the growth of organisms,5
however, allowing some time interval betweeninstillation of anesthetic agent and collection ofsample would help reduce their effect, if any.
Cotton swabs are not recommended forcollection of corneal samples, however, calciumalginate swabs, if available, may be used in casesof bacterial keratitis.6 Platinum spatula,disposable blade (#15), bent needle, surgical knifeand disposable cautery have all been used forcollection of corneal scrapings for microbiologicalprocessing. We routinely use blade no. 15 onBard Parker handle. No difference was foundby us in the quantitative yield of organisms frombacterial and mixed (fungal with bacterial)keratitis while comparing the use of calcium
alginate swab with blade no. 15.7 Although theyield of fungi was more with calcium alginateswab than with blade in this study we did notrecommend replacing blade with swab. Swabsare likely to get contaminated by normal florain the tear film and are less efficient in transferringclinical material onto slides and culture media.While collecting samples from the corneal ulcerthe eyelids must be held widely apart to reduceinadvertent contamination by the lid marginsor eyelashes. Adherent exudate on the surfaceof the ulcer may be removed using a sterile cottonswab prior to collection of scrapings.
The blade or spatula is scraped over thesurface of the area of suppuration by a seriesof short, moderately firm strokes in one directionto sample both the central and peripheral marginsof the infiltrated area of the cornea. Each scrapingis used to inoculate one medium or to prepareone smear. Viable organisms may be presentthroughout the inflamed area or localized to theadvancing margin or the ulcer crater.
In the absence of accessible cornealsuppuration, a corneal biopsy can be done witha disposable skin punch, diamond knife or smallcorneal trephine.8 The tissue specimen is placedin a sterile petri dish for sectioning. Additionalcorneal scrapings can be obtained from the baseof a partial thickness corneal biopsy.
Collection of anterior chamber exudates isadvised only under exceptional circumstancesowing to risk of inoculating organisms into theeye. The possible circumstances are deep stromalsuppuration that cannot be sampled by ananterior approach and infections that haveextended into the anterior chamber.4
Transport of Corneal Samples to theMicrobiology Laboratory
Transportation of corneal scrapings in anytransport medium is not recommended. The

318 Diagnostic Procedures in Ophthalmology
scrapings are plated directly onto culture mediaor smeared onto clean glass slides by the sideof the patient in the clinic or operating room.It would help to maintain a corneal collectionkit in the clinic or operating room containinga set of media, sterile slides (wrapped in foil),spatula/blades, glass marking pencil and swabs(Fig. 19.1) in case the microbiology laboratorycannot be reached and requested to provide thematerials whenever required.
Corneal biopsy tissue can be transportedto the microbiology laboratory in a sterile dryPetri dish or in a sterile bottle with sterile saline.Aqueous fluid is usually collected and trans-ported in a tuberculin syringe. Exudates fromthe anterior chamber may also be directly platedon culture media and smeared on slides.
Processing of Corneal Scrapings
A complete microbiological work-up of a non-viral corneal ulcer may require up to 10 cornealscrapings for a number of smears and culturemedia (Table 19.1). In case of small ulcer, withlimited material availability, high priority needsto be given to inoculation of blood agar orchocolate agar and to prepare only one or two
smears. Preferred media may be selectivelyincluded based on clinical impression, forexample, non-nutrient agar for a suspectedAcanthamoeba keratitis patient. A schematicdiagram to guide non-viral corneal ulcer work-up is shown in Figure 19.2.
Direct Smear Examination Methods
Material is transferred from the blade/spatulato a glass slide over an area of approximately1 cm in diameter within a wax-pencil marked(on the reverse) area to avoid needless searchingunder the microscope. While the specimen isthinly spread for dry smears (Gram, Giemsa,GMS) it can be just placed within the circle forwet smears (KOH, CFW, LPCB) under a cover-slip. Table 17.2 outlines the various stainingprocedures in brief.8 At least two smears shouldbe prepared. For several years, a combinationof KOH + CFW, Gram, and Giemsa-stainedsmears has provided a high sensitivity andspecificity in our laboratory for the detection ofbacteria, fungi, and Acanthamoeba in cornealscrapings. Common laboratory light microscope
Fig. 19.1: Corneal scraping collection tray containing culturemedia, blades, glass slides marker pen, reagents andcoverslips
TABLE 19.1: SEQUENCE OF SMEAR PREPARATIONAND CULTURE MEDIA INOCULATION FOR THEDIAGNOSIS OF NON-VIRAL KERATITIS
Smears 1. Potassium hydroxide and/orCalcofluor white
2. Gram stain3. Giemsa stain
Media 4. Blood agar—aerobic5. Blood agar—anaerobic6. Chocolate agar7. Brain heart infusion broth8. Thioglycollate broth9. Non-nutrient agar
10. Sabouraud dextrose agar Optional 1. Potato dextrose agar Smears/ 2. Lowenstein-Jensen medium media 3. Brain heart infusion broth with
antibiotic4. Additional non-nutrient agar5. Extra smear on slide

319Diagnostic Procedures in Infectious Keratitis
Fig. 19.2: Schematic diagram for microbiology processing of non-viral keratitis
suffices in most instances for the examinationof the smears except when fluorescent stains(calcofluor white or acridine orange) are usedwhich require a fluorescence microscope.
Culture Methods
Inoculation: Agar plates such as blood agar (BA),chocolate agar (CA), are inoculated by lightlystreaking both sides of the blade/spatula overa surface in a row of separate C-shaped markswithout penetrating the agar. This procedurehelps distinguish valid growth from platecontaminants (Fig. 19.3). Slopes of Sabourauddextrose agar (SDA) or potato dextrose agar(PDA) in bottles are similarly inoculated bymaking a row of streaks from below upwards.Liquid media such as brain heart infusion broth
Fig. 19.3: Blood agar inoculated with corneal scrapingand incubated at 35°C for 48 hours showing confluentgray, moist colonies (Pseudomonas aeruginosa) on theinoculum (‘C’ streaks) and a contaminant colony awayfrom the inoculum
(BHI) is inoculated by agitating the blade/spatuladirectly in the broth. To facilitate this procedure

320 Diagnostic Procedures in Ophthalmology
without inviting contamination, the BHI shouldbe available in screw-capped tubes with the toplevel of the medium not below 1 cm from thebrim of the tube. The inoculation of thioglycollatebroth (thio) requires transfer of the scrapedmaterial onto a cotton or calcium alginate swaband insertion to the bottom of the tube to facilitategrowth of anaerobic bacteria. It is a good practiceto limit the inoculation of non-nutrient agar(NNA) with 1-2 strokes in the center of the platewith minimal disturbance of the surface of themedium. While inoculating the plates/bottles,care must be taken to minimize exposure of themedium to the atmosphere.
Corneal biopsy tissue can be cut into smallfragments and inoculated into media or it canbe emulsified in sterile saline using tissuehomogenizer and then distributed in culturemedia, preferably under a bio-safety laminar flowhood.
Aqueous fluid drops can be placed over agarplate surfaces as such without streaking anddropped directly into liquid media, preferablyunder a bio-safety laminar flow hood.Incubation The inoculated culture media areplaced in appropriate incubators. NNA (aftersample inoculation) requires to be overlaid witha few drops of heat killed or live E coli suspensionprior to incubation. While BA (aerobic), BHI broth,thio broth, NNA, SDA and PDA are incubatedunder normal atmospheric conditions, CA isincubated in a candle jar which provides 5%CO2, and another BA (anaerobic) is incubatedin anaerobic jar or cabinet, if available. All mediaare incubated at 35°C (± 1) except SDA and PDAwhich are kept at 27°C (± 1) in BOD incubator.Petri dishes are incubated with lids facingdownwards to prevent condensed moisture fromdripping onto the medium. Broth tubes are heldupright in racks. Early growth may be detectedon culture plates in most instances within 24-48 hours of incubation, however, media such
as BA (aerobic), CA, thio and BHI that showno growth, should be incubated until at least7 days before discarding. In case of no growthBA (anaerobic), SDA, PDA and NNA may beincubated until 2 weeks. Incubation beyond 2weeks, in our experience, has not resulted inincreased positivity. Instead, incubation longerthan 2 weeks may lead to drying of media, andgrowth of contaminants due to repeated openingof plates for observation.
Observation: On solid agar plate growth oninoculation marks (C streaks) are regardedimportant while growth outside the inoculationmarks is disregarded as contaminants (Fig. 19.3).All culture media [except BA (anaerobic) in ajar/cabinet] must be examined daily for detectionof any growth. BA (anaerobic) may be examinedat intervals of 2-3 days for 2 weeks.
Size, color, texture, consistency, and numberof colonies on the inoculation marks are countedand recorded. An arbitrary semiquantitativegrowth estimation graded in our laboratory is+ (10 colonies), ++ (10-50 colonies), and +++(50 colonies). While bacterial and fungal coloniesare examined with unaided eyes, the observationof Acanthamoeba growth requires use ofmicroscope. NNA plates (with lid on) are placedunder X4 or X10 objective lens of the microscopeand presence of trophozoites is looked for inthe vicinity of the inoculation mark on the surfaceof the medium. No colonies are formed byAcanthamoeba.
Growth in liquid media appears as turbiditywhich requires to be subcultured and Gram-stained for identification.Identification: Microbiological identificationdetails of various organisms that may be isolatedfrom cases of non-viral keratitis are neither theintent nor the scope of this chapter. Bacterialcolonies are usually Gram-stained and identifiedafter consideration of colony characteristics,Gram-reaction, morphology, and results of

321Diagnostic Procedures in Infectious Keratitis
biochemical tests. Conventional procedures maybe adopted for biochemical tests or commercialkits from a number of companies (bioMerieux,France, Lachema, Czech Republic; OrganonTechnika, USA)9 may be obtained. Some of thesecompanies have recently launched their productsin India.
Identification of fungal species requiresobservation of rate of growth, color, consistencyand texture of the colony and characteristicmicroscopic features. Though most species areidentified easily more than 20% of filamentousfungal isolates may remain unidentified becauseof the lack of characteristic spores. Biochemicaltests for identification are needed only in caseof yeast or yeast-like fungal growth. Helpful hintsfor identification are available.10
Presence of characteristic cysts and tropho-zoites on the surface of NNA (Fig. 19.4) helpsto identify Acanthamoeba genus. Specification ofthis genus is presently controversial11 and hasno place in the realm of a clinical ocularmicrobiology laboratory.
bacteria are used to determine sensitivity by disk-diffusion method. In this method (Kirby-Bauer)the bacteria is cultured on Mueller-Hinton agar,and antibiotic impregnated disks are applied.After incubation, the diameter of the zone of inhibi-tion around each disk gives an approximationof susceptibility or resistance of the organism(Fig. 19.5). Commercially available kits providea zone size interpretative chart to facilitateinterpretation. Slow-growing bacteria andanaerobes cannot be reliably tested with disk-diffusion method. Estimating the minimalinhibitory concentrations (MIC) of antibiotics mayprovide a more useful information than labelingorganisms as sensitive or resistant,4 especiallybecause the results of disk-diffusion tests relateto levels of drug achievable in serum and donot relate directly to concentration of drugproduced in the preocular tear film and oculartissues by standard routes of administration.
The MIC of a drug can be tested by brothdilution or agar dilution method. The antibioticis serially diluted and added to tubes with brothor wells of a microtiter plate or incorporated intoagar plates. A standard suspension of theorganism is then inoculated. The MIC is recordedas the lowest concentration with no visible
Fig. 19.4: Acanthamoeba trophozoites (irregular,vacuolated) on the surface of NNA with E. coli (originalmagnification × 500)
Fig. 19.5: Antibiotic susceptibility test for Pseudomonasaeruginosa isolated from corneal ulcer. The diameter ofzone of inhibition around antibiotic discs is measured andreported as sensitive, intermediate, or resistant (Diskdiffusion test)
Antimicrobial Susceptibility Testing
Antimicrobial susceptibility testing is done in
vitro to identify the response of an organism toa panel of selected drugs. Commercially availablepanels for Gram-positive and Gram-negative
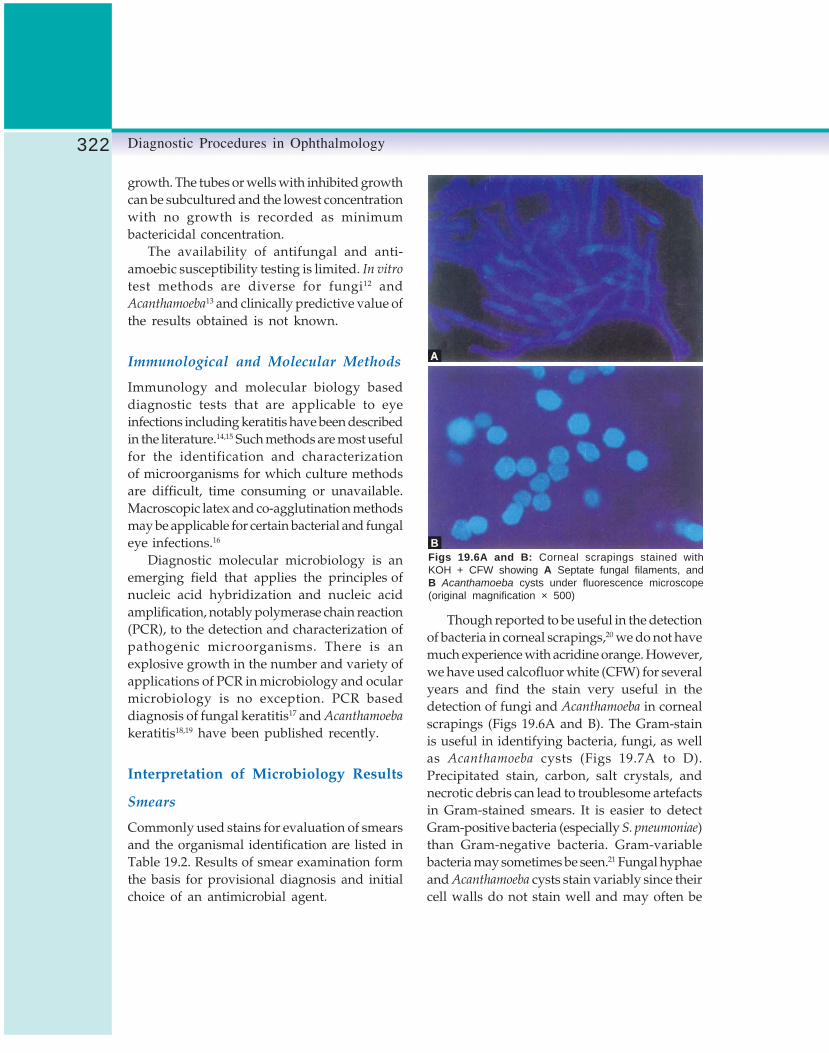
322 Diagnostic Procedures in Ophthalmology
growth. The tubes or wells with inhibited growthcan be subcultured and the lowest concentrationwith no growth is recorded as minimumbactericidal concentration.
The availability of antifungal and anti-amoebic susceptibility testing is limited. In vitro
test methods are diverse for fungi12 andAcanthamoeba13 and clinically predictive value ofthe results obtained is not known.
Immunological and Molecular Methods
Immunology and molecular biology baseddiagnostic tests that are applicable to eyeinfections including keratitis have been describedin the literature.14,15 Such methods are most usefulfor the identification and characterizationof microorganisms for which culture methodsare difficult, time consuming or unavailable.Macroscopic latex and co-agglutination methodsmay be applicable for certain bacterial and fungaleye infections.16
Diagnostic molecular microbiology is anemerging field that applies the principles ofnucleic acid hybridization and nucleic acidamplification, notably polymerase chain reaction(PCR), to the detection and characterization ofpathogenic microorganisms. There is anexplosive growth in the number and variety ofapplications of PCR in microbiology and ocularmicrobiology is no exception. PCR baseddiagnosis of fungal keratitis17 and Acanthamoeba
keratitis18,19 have been published recently.
Interpretation of Microbiology Results
Smears
Commonly used stains for evaluation of smearsand the organismal identification are listed inTable 19.2. Results of smear examination formthe basis for provisional diagnosis and initialchoice of an antimicrobial agent.
Though reported to be useful in the detectionof bacteria in corneal scrapings,20 we do not havemuch experience with acridine orange. However,we have used calcofluor white (CFW) for severalyears and find the stain very useful in thedetection of fungi and Acanthamoeba in cornealscrapings (Figs 19.6A and B). The Gram-stainis useful in identifying bacteria, fungi, as wellas Acanthamoeba cysts (Figs 19.7A to D).Precipitated stain, carbon, salt crystals, andnecrotic debris can lead to troublesome artefactsin Gram-stained smears. It is easier to detectGram-positive bacteria (especially S. pneumoniae)than Gram-negative bacteria. Gram-variablebacteria may sometimes be seen.21 Fungal hyphaeand Acanthamoeba cysts stain variably since theircell walls do not stain well and may often be
Figs 19.6A and B: Corneal scrapings stained withKOH + CFW showing A Septate fungal filaments, andB Acanthamoeba cysts under fluorescence microscope(original magnification × 500)

323Diagnostic Procedures in Infectious Keratitis
TABLE 19.2: COMMON STAINING PROCEDURES FOR CORNEAL SCRAPINGS INTHE DIAGNOSIS OF NON-VIRAL KERATITIS
Stain Steps
Gram stain 1. Fix smear in 95% methanol2. Flood smear with crystal violet for 1 minute3. Rinse with tap water4. Flood smear with Gram’s iodine solution for 1 minute5. Rinse with tap water6. Decolorise with acetone-alcohol solution7. Rinse with tap water8. Flood with safranin or dilute Carbol Fuchsin for 30 seconds9. Rinse with tap water and allow to dry
Giemsa stain 1. Fix smear in fixative for 5 (Diff Quik)TM seconds(quick) 2. Dip in reagent A for 5 seconds
3. Dip in reagent B for 5 seconds4. Rinse with water and allow to dry
Giemsa stain 1. Flood with Giemsa solution for 45-60 minutes2. Rinse in 95% ethanol
Potassium 1. Add one drop of 10% KOH with 10% glycerolhydroxide 2. Place a coverslip(KOH) preparation 3. Apply nail polish around the coverslip edges to prevent drying
KOH+ 1. Add one drop of 10% KOHCalcofluor white 2. Add one drop of 0.1% calcofluor white with 0.1% Evans blue solution
3. Place a coverslip4. Examine under UV light
Ziehl-Neelsen 1. Flood fixed smear with hot (steaming) strong carbol fuchsin and leave for 5 minutesacid fast 2. Rinse with water
3. Decolorize with 20% H2SO4 for 1-2 minutes4. Rinse with water5. Flood with methylene blue counter stain for 2 minutes6. Rinse with water and allow to dry
Kinyoun’s 1. Flood fixed smear with strong carbol fuchsin for 2 minutesmodification 2. Rinse with waterof Acid fast 3. Decolorize with 1% H2SO4stain 4. Rinse with water
5. Flood with methylene blue counter stain for 2 minutes6. Rinse with water and allow to dry
Lactophenol- 1. Mix specimen colony in a drop of LPCBCotton blue 2. Apply coverslip
3. Apply nail polish around edges of coverslip to prevent drying
Acridine orange 1. Mix specimen in 0.01% of acridine orange2. Apply coverslip3. Examine under UV light
seen as negative outlines (Fig. 19.7). Trophozoitesof Acanthamoeba are difficult to recognize owingto their irregular morphology and similarity tomacrophages.22 Giemsa-stained smear serves asa supportive smear. Cytological details are seenwell and bacteria, fungi as well as Acanthamoeba
cysts can be seen.
Arbitrary quantification of bacteria per highpower field may help determine the significanceas bacteria comprising the indigenous microfloraof the conjunctiva and tear film may be detectedin small numbers. Smears with more than tenorganisms are more determine. However,detection of bacteria in smears often needs to

324 Diagnostic Procedures in Ophthalmology
be correlated with corresponding bacterialgrowth in culture for determining significance.Failure of an organism, seen in smears, to growin culture would indicate either non-viableorganism or sample variation. Sampling errormust always be ruled out in case of discrepantresults.
Presence of partially stained or unstainedbacilli in Gram or Giemsa-stained smears hasoften indicated possibility of atypical mycobac-teria (Fig. 19.8) and successful diagnosis of thesame.23 Thin, branching and beaded filamentsin these smears are indicative of Nocardia sp.To confirm the diagnosis, acid fast stains using20% H2SO4 (Ziehl-Neelsen technique) in theformer and 1% H2SO4 (Kinyoun method) in thelatter (Fig. 19.9) are very rewarding.
Cultures
While smear examination provides preliminaryevidence, culture isolation gives diagnostic
Figs 19.7A to C: Corneal scrapings stained with Gramstain showing A Gram-positive cocci in pairs, B Gram-negative bacilli (arrow), C Septate fungal filaments
Fig. 19.8: Corneal scraping from a case of Mycobacteriumchelonae keratitis (post-LASIK surgery) showing acid fastbacilli by Ziehl-Neelsen staining (20%H2SO4) (originalmagnification × 500)
Fig. 19.7D: Corneal scrapings stained with Gram stainshowing Acanthamoeba cysts (original magnification × 500)

325Diagnostic Procedures in Infectious Keratitis
medium of the same organism identified insmears, confluent growth at the inoculation siteon at least one solid medium, or repeat isolationfrom the same patient. These criteria are moreapplicable to bacteria and fungus thanAcanthamoeba as it is neither a normal commensalnor a laboratory contaminant.
Antibiotic Susceptibility
Interpretation of agar disk diffusion test (forbacterial susceptibility) that relates to levels ofdrug in serum is often controversial. However,since higher antibiotic concentrations can beachieved in the cornea by topical administrationof antibiotics, an organism labeled as resistantor intermediate in sensitivity by this test mayrespond to the drug in vivo. The reverse is unlikelyto be the case.
The quantitative MIC can be compared to theantibiotic concentration expected at the site ofinfection. However, resistance breakpoints forocular isolates have not been determined andthere are no generally accepted cut off points.
Polymerase Chain Reaction (PCR)
The results of PCR on corneal scrapings areusually as good as the choice of primers(oligonucleotide sequence for a particular geneof a particular organism) and the stringentperformance of the test. It is a highly sensitivetest but instances of false positives can be highif PCR test is not handled carefully. Anylaboratory that undertakes molecular diagnosticsmust comply with all requirements to containcontamination, use appropriate controls andprovide reliable results. The PCR results arebest viewed in conjunction with the clinicalimpression and, if possible, with anothersupporting laboratory evidence towards thediagnosis.
confirmation. Culture report should indicate theday the growth appeared and its quantificationor significance. Less than 10 colonies on onlyone solid medium or growth in only one liquidmedium is usually equivocal. Growth oforganisms such as S. epidermidis, Corynebacterium
sp. and Propionibacterium sp. in small numbersor in a single liquid medium is generally ofuncertain significance. The same organisms,however, may be significant in the presence ofa strong predisposing factor in the patient. Allisolates must be considered in the light of clinicalrelevance and laboratory significance. Laboratorycriteria for definitive infection include growthon two or more media, growth on at least one
Figs 17.9A and B: Corneal scraping from a case ofNocardia keratitis showing A Gram-positive, thin, beaded,branching filaments in Gram stained smear, and B Acidfast, thin, beaded, branching filaments in the same smearstained by Kinyoun method (1% H2SO4) after decolori-zation (original magnification × 500)

326 Diagnostic Procedures in Ophthalmology
Protocol for Viral KeratitisThe advancement made in the field of laboratorytechniques for the diagnosis of viral infectionsin the past decade has been enormous with theintroduction of newer techniques and impro-visation of earlier techniques. These techniqueshave been extensively employed for the diagnosisof viral keratitis, especially in developed countries.However, owing to the cost constraints, thetechniques are yet to become a routine in mostlaboratories in India, including large universitylaboratories. Several factors may need to beconsidered before a laboratory chooses to adopttechniques for the diagnosis of viral keratitis orin fact any viral disease. These factors includeinformation regarding the prevalence of aparticular viral infection, need of screening forthe same in a given population, cost of thetechnique, availability of the infrastructure, andwhether a rapid diagnosis can be provided. Anideal technique should be cost-effective, providea rapid diagnosis in a reasonable frame of time,easy to perform and interpret, and adaptable inroutine microbiology laboratories.
As pertinent in non-viral keratitis, thecollection, transport, and processing of cornealsamples for the diagnosis of viral keratitis havea distinct protocol which may be combined withthe former in case of clinical uncertainty.
Collection of Samples
A variety of samples including corneal scrapings,corneal swabs, corneal impression smear, andcorneal button may be submitted for viraldiagnosis. In addition or instead of cornealsamples, conjunctival scrapings/swabs oraqueous fluid may also be helpful in somesituations. As is true for most diseases, collectionof clinical sample early in the disease prior toadministration of antimicrobial agents, is mostuseful for laboratory diagnosis.
Transport of Samples
Unlike the banishment for transport of cornealscrapings (in a transport medium to thelaboratory) in the protocol for non-viral cornealulcer diagnosis, the sample for viral diagnosisalways needs to be collected in an appropriatetransport medium (except the smears) and sentto the laboratory. Methods of transport wouldvary according to the type of sample collected.Table 19.3 outlines the methods of transportationof samples to the virology laboratory.
Processing of Samples
Samples received in a virology laboratory maybe processed using a variety of techniques. Thechoice of technique would depend on the typeof sample and the specific virus that is beinglooked for. Most of the procedures can beperformed in a moderately equipped laboratory.The procedures standardized and adopted byus for the diagnosis of Herpes simplex virus(HSV) keratitis are outlined in Table 19.4. Of allavailable laboratory techniques for diagnosis ofviral infections only a few can be adopted ina particular laboratory. The choice is made basedon the advantages, disadvantages and costeffectiveness of the techniques and their overallutility.
Direct Smear Examination (Cytology)
A rapid diagnosis of viral keratitis can beestablished by observing stained smears ofcorneal scrapings, conjunctival scrapings/swabs, or centrifuged deposits of aqueous fluid(cytospin).24 These may be accomplished usingnon-specific staining techniques such as Giemsa,Papanicolaou, and Hematoxylin-Eosin stain.These techniques help visualize multinucleatedgiant cells, koilocytic changes (Fig. 19.10A), andintranuclear/intracytoplasmic inclusions (Fig.19.10B), and various inflammatory cells which

327Diagnostic Procedures in Infectious Keratitis
TABLE 19.3: METHODS OF TRANSPORTATION OF SPECIMEN TO THE VIROLOGY LABORATORYFOR INVESTIGATION OF VIRAL KERATITIS
Corneal scrapings1. Smear on glass slide, air dry and send for staining/immunofluorescence (IF)/immunoperoxidase (IP)2. Transfer in a vial (0.5 to 1 ml) of viral transport medium (VTM) and send for culture. Can be stored at
4°C. Do not freeze3. Transfer on a cellulose acetate membrane, air dry, fix in acetone/methanol and send for staining/IF/IP4. Transfer in 1 ml of phosphate buffered saline/minimum essential medium/Hank’s balanced salt solution and
send for PCRCorneal impression smear on glass slide or cellulose acetate membrane
Air dry, fix in acetone/methanol/15 minutes and send for staining/IF/IPCorneal/conjunctival swab1. Use cotton swab to collect material and transfer in VTM and send for culture. Can be stored at 4°C. Do
not freeze2. Dry swab and calcium alginate swabs are unacceptableCorneal button1. Place in VTM and send for culture2. Place in 10% buffered formalin and send for histopathology3. Place in phosphate buffered saline/minimum essential medium/Hank’s balanced salt solution and send for PCRAqueous humor1. Place few drops in VTM and send for culture2. Place in sterile tube/eppendorf and send for PCR or staining/IF/IP
are predominantly lymphocytes. Koilocyticchanges are characteristic perinuclear clearing(halo) with increase in density of surroundingrim of cytoplasm, classically described in humanpapilloma virus infected squamous epithelialcells of the cervix. Intranuclear inclusions aremore efficiently seen in Papanicolaou stain thanGiemsa-stained smears, however, Giemsa stainis good for enumerating cell types. Though thesestaining techniques have the advantage of beingrapid and inexpensive, they are often non-specificand offer low sensitivity in the diagnosis of viralinfection. For example, these stains cannot
TABLE 19.4: METHODS FOR LABORATORYDIAGNOSIS OF VIRAL KERATITIS FOLLOWED ATLV PRASAD EYE INSTITUTE
1. Non-specific smear examination (cytology) methods:• Papanicolaou stain• Giemsa stain
2. Cell-associated antigen detection methods• Direct/indirect immunofluorescence assay (IF)• Indirect immunoperoxidase assay (IP)
3. Virus isolation (tissue culture) methods• Conventional tissue culture• Shell-vial technique
4. Molecular virology method• Polymerase chain reaction
Figs 17.10A and B: Corneal scrapings from a case ofHSV keratitis showing. A Multinucleated giant cell (arrow)and koilocytic changes (arrowhead), and B Intranuclearinclusion, in an epithelial cell (Papanicolaou stain, originalmagnification × 500)

328 Diagnostic Procedures in Ophthalmology
differentiate the intranuclear inclusions of HSVfrom that of Varicella zoster virus (VZV).
Specific cytology techniques used for viraldiagnosis are techniques that indirectly suggestthe presence of viral antigen in the clinicalsample. Detection of cell associated viral antigenin a corneal scraping or conjunctival scrapingis very useful in the diagnosis of viral keratitis.We have been routinely using direct and indirectimmunofluorescence (Fig. 19.11), and indirectimmunoperoxidase (Fig. 19.12) assays in thediagnosis of HSV, VZV keratitis and adenoviralkeratoconjunctivitis. Both these tests are rapid,
specific and sensitive when suitable monoclonalor purified polyclonal antibodies are used in thetest system. Relatively higher sensitivity andlower specificity is achieved with purifiedpolyclonal antibodies tests while monoclonalantibodies show high specificity but lowsensitivity. Indirect immunoperoxidase (IP) assayhas distinct advantages over indirect immuno-fluorescence (IF) assay. The former provides apermanent preparation for records and utilizesan ordinary light microscope while the latter hasthe inherent problem of quenching (fading) offluorescence and requires a sophisticated andexpensive fluorescence microscope. In addition,the IP technique can be used on paraffinembedded tissue while the IF technique providesbetter results with frozen tissue sections.
Detection of soluble viral antigens in cornealscrapings collected in buffer and body fluidsincluding tears, aqueous, and vitreous, have beendescribed using enzyme-linked immunosorbentassay (ELISA),25latex agglutination,26 and radioimmunoassay (RIA). Results obtained by ELISAand RIA are more objective compared to IF andIP assays (which tend to be subjective), however,we do not have experience using these techniquesfor the diagnosis of viral keratitis. Some of therapid methods of antigen detection in viralkeratitis are described in Table 19.5.
Tissue Culture Methods
Classically described techniques of virusisolation have been embryonated eggs andanimal inoculation, which are not favored bymost virology laboratories for routine diagnosticpurposes. A much favored technique is that oftissue culture, especially cell cultures. Establishedcell lines such as HeLa, Vero, HEp 2 and MRC-5 have been used for isolation of HSV from cornealscrapings.27We have recently succeeded in usingimmortalized human corneal epithelial cell line28
for isolation of HSV.
Fig. 19.11: Corneal scraping from a case of HSV keratitisshowing presence of HSV-1 antigen in the epithelial cells(indirect immunofluorescence assay, original magnification× 250)
Fig. 19.12: Corneal scraping from the same patient ofHSV keratitis (Fig. 19.11) showing presence of HSV-1antigen (stained brown) in epithelial cells (indirectimmunoperoxidase assay, original magnification × 500)

329Diagnostic Procedures in Infectious Keratitis
TABLE 19.5: RAPID DIAGNOSTIC TESTS FOR VIRAL KERATITIS
Type of test Time Viruses detected
Less than 1 hour1. Giemsa stain (Diff Quik)TM 5 minutes HSV 1 & 2, VZV, Adenovirus2. Papanicolaou stain 45 minutes HSV 1 & 2, VZV, Adenovirus3. HSV test kit 20 minutes HSV 1 & 2
(Sure cell herpes)(R)
4. Latex agglutination 35 minutes HSV 1 & 2(Virogen)(R)
Between 1-6 hours1. Immunofluorescence 2-3 hours HSV 1 & 2, VZV, Adenovirus2. Immunoperoxidase 4-5 hours HSV 1 & 2, VZV, Adenovirus3. HSV antigen detection (Herp check)(R) 5 hours HSV-14. ELISA 3-4 hours HSV 1 & 2
Growth of virus in the cell lines can bedetermined either by characteristic cellularchanges or cytopathic effect (CPE) as shown inFigure 19.13 or by IF or IP technique, which detectviral antigens in the infected cell lines.Appearance of CPE may take several days butantigens can be detected even before CPE occurs,therefore, IF or IP is a more rapid method. Virusesmay be cultured in cell lines maintained in tubes(tube culture) or on cover-slips in vials (shellvial) as shown in Figure 19.14. Shell vial techniqueis a modification of conventional tissue culturetechnique wherein entry of virus into themonolayer of susceptible cells (on a cover-slipin a vial) is facilitated by centrifugation of the
Fig. 19.13: Monolayer of vero cell line showing cytopathiceffect caused by HSV-1 indicating growth of the virusin the cells (tube culture, phase contrast, originalmagnification × 200)
vial containing cells and the clinical sample (spinamplification).29 The virus growth occurs in ashorter period (18-72 hours) by this method andadditionally, both IF and IP techniques can beperformed easily on the cover-slips retrieved fromthe vials for antigen detection. Both these factorsare responsible for increased sensitivity of shellvial technique in isolation of viruses.
Molecular Virology Methods
In recent times, the PCR technique has beenemployed extensively for the detection of viralDNA in clinical samples which is one of thebest indications for diagnostic use of thistechnique.30 By virtue of being extremely sensitiveand specific, and at the same time simple andrapid, PCR is presently the most sought aftertechnique for viral diagnosis. In our experience,combination of cytology coupled with antigendetection by IF or IP technique and viral DNAdetection by PCR may obviate the role ofcumbersome procedures of viral isolation bytissue culture, in the diagnosis of viral keratitis.By cost considerations, setting up and runninga molecular virology laboratory may be lessexpensive than tissue culture laboratory.Diagnosis of atypical herpetic epithelial keratitisusing primers for 142 base pair segment of theDNA polymerase gene of the HSV genome by

330 Diagnostic Procedures in Ophthalmology
herpetic keratitis diagnosis has also beendescribed.35
Proper safe guard against false positives inPCR based test is a great challenge to a molecularvirology laboratory. Top of the line quality control,appropriate controls and good laboratorypractices are mandatory to obtain reliablelaboratory reports.
Interpretation of Virology Results
Our laboratory routinely performs a variety oftechniques for the laboratory diagnosis of viralkeratitis which includes cytology by Papani-colaou and Giemsa stain, antigen detection byIF/IP technique, culture by shell vial techniqueand PCR (Fig. 19.15). In an analysis of 70clinically suspected cases of HSV keratitis whosecorneal scrapings were tested by PCR, shell vialculture, antigen detection by IF/IP, and cytologyby Papanicolaou stain, the sensitivity of the testswas 55.8%, 28.3%, 22.7% and 15.6%, respectively(unpublished data). A laboratory diagnosis ofHSV keratitis was offered when HSV-1 antigenwas detected and/or HSV-1 was isolated and/or HSV DNA was detected by PCR with or
PCR has been reported.31,32 A variety of primersfor PCR diagnosis of HSV type 1 and 2 and VZVinfections of the eye (other than keratitis) hasbeen described and can be adapted for thediagnosis of keratitis.33,34 A nested PCR for stromal
Figs 19.14 A to C: Virus cultures using cell lines. A Tubeculture, B Shell vial culture, C Containing cover-slip
Fig. 19.15: Detection of HSV 1 and 2 by PCR in a cornealscraping from a case of HSV keratitis. Agarose gelelectrophoresis (Ethidium bromide stained) showing positivecontrol (lane 1), negative control (lane 2), test sample(lane 3), and molecular weight marker (lane 4). Note theband of 179 bp size (DNA polymerase gene specific)in lane 3 corresponding to positive control

331Diagnostic Procedures in Infectious Keratitis
without cellular changes in Papanicolaoustained smear. PCR results were interpreted withcaution when this test alone was positive. It wasalways correlated with clinical findings and withthe results of other tests. False positives wereavoided by using a different primer set andadopting a reduced sensitivity PCR.36
It is evident from our observations thatadopting a single technique alone may resultin under diagnosis. Papanicolaou stain, thoughless sensitive than others, is a valuable test.Presence of multinucleated giant cells,intranuclear inclusions, and koilocytic changesare indicative of HSV/VZV infection. Initiationof antiviral therapy is indicated based on thesesmear findings coupled with positive antigendetection by IF or IP assays. Both IF and IP assaysdetect viral proteins in the absence of viablevirions when cultures would be negative. Wehave often been more successful in detecting theviral antigen than isolating the virus. It is,therefore, recommended that antigen detectionassays and Papanicolaou staining should bedone in the laboratory diagnosis of viral keratitiswhere facilities for culture and PCR are notavailable.
References1. Agarwal V, Biswas J, Madhavan HN, et al.
Current perspectives in infectious keratitis. IndJ Ophthalmol 1994;42:171-92.
2. Burd EM. Bacterial keratitis and conjunctivitis.In: Smolin G, Thoft RA (Eds). The Cornea:Scientific Foundations and Clinical Practice.Boston: Little Brown and Co, 1994.
3. Sharma S, Sankaridurg PR, Ramachandran L, etal. Is the conjunctival flora a reflection of thepathogenic bacteria causing corneal ulceration?Invest Ophthalmol Vis Sci 1994;35(Suppl): S1947.
4. Wilhelmus KR, Liesegang TJ, Osato MS, et al.Cumitech 13A, Laboratory Diagnosis ofOcular Infections. Coordinating (Ed). SpecterSC, American Society for Microbiology,Washington, DC 15, 1994.
5. Badenoch PR, Coster DJ. Antimicrobial activityof topical anaesthetic preparations. Br JOphthalmol 1982;66:364-67.
6. Benson WH, Lanier JD. Comparison oftechniques for culturing corneal ulcers.Ophthalmology 1992;99:800-04.
7. Jacob P, Gopinathan U, Sharma S et al. Calciumalginate swab versus Bard Parker blade in thediagnosis of microbial keratitis. Cornea 1995;14:360-64.
8. Sharma S. Diagnostic methods in ocularmicrobiology. In: Modern Ophthalmology.Datta, LC, (Ed). 2nd ed. New Delhi: JaypeeBrothers Medical Publishers 1999;216-24.
9. Murray PR, Baron EJ, Pfaller MA et al. Manualof Clinical Microbiology. 6th ed. AmericanSociety of Microbiology, Washington DC, 1995.
10. Larone DH. Medically Important Fungi: A Guideto Identification (3rd edn). Washington DC: ASMPress, 1995.
11. Gast RJ, Ledee DR, Fuerst PA et al. Subgenussystematics of Acanthamoeba: Four nuclear 18SrDNA sequence types. J Euk Microbiol 1996;43: 498-504.
12. Thomas PA. Mycotic keratitis: An underestimatedmycosis. J Medical Veter Mycology 1994;32:235-56.
13. Saunders PPR, Proctor EM, Rollins DF et al.Enhanced killing of Acanthamoeba cysts in vitrousing Dimethylsulfoxide. Ophthalmology1992;99:1197-2000.
14. Rao NA. A laboratory approach to rapiddiagnosis of ocular infections and prospects forthe future. Am J Ophthalmol 107: 283-91,1989.
15. Gordon YJ. Rapid diagnostic tests for infectiousocular disease. Int Ophthalmol Clin 1993;33:153-61.
16. Sobol WM, Gomez JT, Osato MS et al. Rapidstreptococcal antigen detection in experimentalkeratitis. Am J Ophthalmol 1989;107:60-64.
17. Alexandrakis G, Gloor P. Diagnosis of Fusariumkeratitis in an animal model using thepolymerase chain reaction (abstract). InvestOphthalmol Vis Sci 1994;35:S1676.
18. Mathers WD, Nelson SE, Lane JL et al. Confirma-tion of confocal microscopy diagnosis ofAcanthamoeba keratitis using polymerase chainreaction analysis. Arch Ophthalmol 2000;118: 178-83.
19. Lehmann OJ, Green SM, Morlet N, et al.Polymerase chain reaction analysis of

332 Diagnostic Procedures in Ophthalmology
Acanthamoeba. Invest Ophthalmol Vis Sci 1998;39:1261-65.
20. Groden LR, Rodnite J, Brinser JH et al. Acridineorange and Gram stains in infectious keratitis.Cornea 1990;9:122-24.
21. Choudhury K, Sharma S, Garg P et al. Clinicaland Microbiological profile of Bacillus keratitis.Cornea 2000;19:301-06.
22. Sharma S, Srinivasan M, George G: Acanthamoebakeratitis in non-contact lens wearers. ArchOphthalmol 1990;108:676-78.
23. Garg P, Bansal AK, Sharma S et al. Bilateralinfectious keratitis following laser in situkeratomileusis: A case report and review ofthe literature. Ophthalmology, 2000.
24. Jack I, Marmion BP: Direct virus diagnosis. In:Collee JG, Duguid JP, Fraser AG, Marmion BP(Eds). Mackie, McCartney Practical MedicalMicrobiology (13th ed). Edinburgh, ChurchillLivingstone,1989.
25. Kowalski RP, Gordon YJ, Romanowski EG etal. A comparison of enzyme immune assay andpolymerase chain reaction with the clinicalexamination for diagnosing ocular herpeticdisease. Ophthalmology 1993;100:530-33.
26. Kowalski RP, Gordon YJ. Evaluation of immu-nologic tests for the detection of ocular herpessimplex virus. Ophthalmology 1989;96:1583-86.
27. Simon MW, Miller D, Pflugfelder SC et al.Comparison of immunocytology to tissueculture for diagnosis of presumed herpes virusdendritic epithelial keratitis. Ophthalmology1992;99:1408-13.
28. Sasaki KA, Ohashi Y, Sasabe T et al. An SV40-immortalized human corneal epithelial cell lineand its characterization. Invest Ophthalmol VisSci 1995;36:614-21.
29. Johnson FB, Luker G, Chow C. Comparisonof shell vial culture and the suspension-infectionmethod for the rapid detection of herpes simplexviruses. Diagn Microbiol Infect Dis 1993;16:61-66.
30. Podzorski RP, Persing DH. Molecular detectionand identification of microorganisms. In Murrayet al (Eds). Manual of Clinical Microbiology (6thed). American Society of Microbiology,Washington DC, 1995.
31. Tei M, Nishida K, Kinoshita S. Polymerase chainreaction detection of herpes simplex virus intear fluid from atypical herpetic epithelial keratitisafter penetrating keratoplasty. Am J Ophthalmol1996;122:732-35.
32. Koizumi N, Nishida K, Adachi W et al. Detectionof herpes simplex virus DNA in atypical epithelialkeratitis using polymerase chain reaction. BrJ Ophthalmol 1999;83:957-60.
33. Yamamoto S, Langston DP, Kinoshita S et al.Detecting herpes virus DNA in uveitis usingpolymerase chain reaction. Br J Ophthalmol1996;80:465-68.
34. Cunningham ET, Short GA, Irvine AR et al.Acquired immunodeficiency syndrome—associated herpes simplex virus retinitis. ArchOphthalmol 1996;114:834-40.
35. Kudo E, Shiota H, Kinouchi Y et al. Detectionof herpes simplex virus DNA in tear fluid ofstromal herpetic keratitis patients by nestedpolymerase chain reaction. Jpn J Ophthalmology1996;40:390-96.
36. Yamamoto S, Shimomura Y, Kinoshita S et al.Detection of herpes simplex virus DNA inhuman tear film by the polymerase chainreaction. Am J Ophthalmol 1994;118:160-63.
333Diagnostic Procedures in Uveitis
JYOTIRMAY BISWAS, SURBHIT CHAUDHARY, S SUDHARSHAN, SHAHNAWAZ KAZI
DiagnosticProcedures in
Uveitis20In recent years, there have been remarkableadvances in the diagnosis and management ofuveitis/intraocular inflammation. The advancesare in part, from the progress noted in the arenaof ocular immunology, immunopharmacology,vitreoretinal surgical techniques and laboratoryinvestigations. This chapter on diagnosticprocedures in uveitis provides an overview ofthe advances in the field of clinical and laboratorydiagnosis of uveitis, indications and surgicaltechniques of chorioretinal biopsy.
Clinical and LaboratoryDiagnosis of UveitisFifty percent of cases of uveitis are consideredidiopathic. Many others are associated with, orform a part of, other systemic immune-mediateddisease. Diagnostic laboratory based immunolo-gical tests often provide not only the differentialdiagnosis of uveitis but also aid in the manage-ment of these patients. Moreover, in combinationwith other serologic, laboratory-based investiga-tions, these assays assist in defining a non-infectious entity.
Basic Investigations
Total and differential white blood cell counts
and erythrocyte sedimentation rate (ESR) cangive initial clues to the systemic association ofthe uveitic disease and also provide a base-lineto therapeutic response and drug side effects.
ESR may be raised in non-infectious uveiticdiseases such as connective tissue disorders andsarcoidosis and also in infectious conditionssuch as tuberculosis and syphilis and is, therefore,included in routine investigations of uveitis.
Serological Tests
Rheumatoid Factor
Rheumatoid factor per se is not associated withuveitis and can be ordered in cases ofsclerouveitis. Rheumatoid factor is negative incases of juvenile rheumatoid arthritis (JRA) andankylosing spondylitis (AS).
Antinuclear Antibody
Antinuclear antibody (ANA) is elevated in anumber of diseases such as: AS, JRA, dermato-myositis, systemic lupus erythematosus (SLE),scleroderma, Sjogren’s syndrome, chronichepatitis, apical pneumonia and lymphoma.
ANA testing, therefore, gathers morerelevance when limited to patients with a

334 Diagnostic Procedures in Ophthalmology
reasonable likelihood of disease, where a positiveresult is more likely to be true positive. Obtainingdiagnostic titres adds to the significance of thetest.
Antineutrophil Cytoplasmic Antibody TestAntineutrophil cytoplasmic antibody (ANCA)test is positive in Wegener’s granulomatosis,Churg-Strauss syndrome, microscopic polyan-gitis and polyarteritis nodosa. Two distinct sub-types are noticed—perinuclear ANCA (pANCA)and cytoplasmic ANCA (cANCA). The sensiti-vity of cANCA is as high as 85-96% in patientswith widespread Wegener’s granulomatosis, butsensitivity falls to 80% in patients with limiteddisease. There are a number of conditions wherea false-positive cANCA is demonstrated. Theseinclude: atrial myxomas, human immuno-deficiency virus (HIV) infection, bronchial carci-noma, non-Hodgkin’s lymphoma, endocarditis,eosinophilic myalgia syndrome and mycobac-teriosis.
Scleritis is more common with Wegener’sgranulomatosis than anterior uveitis. Therefore,ANCA is not routinely done in uveitis and shouldbe done in selected cases like uveitis with scleritisor peripheral ulcerative keratitis.
Angiotensin Converting EnzymeMany cells in the body including normal capillaryendothelial cells and monocytes, particularlymacrophages, produce angiotensin convertingenzyme (ACE). Normal levels in males are 12-55 mole/min/ml and in women 11-29 mole/min/ml. The levels are elevated in active systemicsarcoidosis and reduced with oral steroid intake.However, serum ACE is not specific forsarcoidosis and is also elevated in leprosy,tuberculosis and histoplasmosis. As patientswith ocular sarcoidosis are usually in systemicremission, a normal serum ACE level does notrule out sarcoidosis.1
In combination with gallium scan and aroentgenogram of the chest, serum ACE hasacquired more significance in the diagnosis ofsarcoid uveitis.2 In one of the studies the aqueousACE levels were found to be more specific thanthe serum ACE values.3
Serological Tests for Syphilis
Fluorescent Treponemal AntibodyAbsorption Test
Fluorescent treponemal antibody absorption(FTA-AbS) test is positive in all cases of syphilis,a negative test rules out syphilis. Once the patienthas had syphilis, he remains positive throughoutlife.
Venereal Disease ResearchLaboratory Test
Venereal disease research laboratory (VDRL)test measures non-specific reaginic antibody.The test is negative in many cases of tertiarysyphilis. As uveitis is often a feature of latestage of syphilis, the test may be negative. Itis a titrable parameter and turns negativefollowing adequate treatment. If syphilis issuspected as a cause of uveitis, both FTA-AbS(for high degree of sensitivity and specificity)and VDRL (to determine state of activity) mustbe ordered.
Human Leucocyte Antigens
Human leucocyte antigens (HLA) are located onthe sixth chromosome. The position on thechromosome is indicated by A, B, C (class I) orD (class II). HLAs are found to be associatedwith several specific diseases. Some of theanterior uveitic entities have been found to havea strong HLA association and are listed in Table20.1.

335Diagnostic Procedures in Uveitis
Diagnostic BiopsiesDiagnosis of isolated intraocular inflammatoryprocess (without accompanying systemicmanifestations) is characteristically based onobservation of clinical signs, the evolution ofaffection and the final outcome. Laboratory testsbased on findings in the serum are of some value,especially when the intraocular inflammationis associated with disease involving other organs.When, however, the affection involves the eyeonly, these tests are of little value. Sampling ofthe ocular tissue may be more revealing.Following improvement in instrumentation andaseptic microsurgical techniques, intraocularmaterial for diagnostic purpose and testing ismore commonly being utilized by ophthalmo-logists.
Histopathology is a part of the ophthal-mologist’s armamentarium that is useful in thediagnosis and management of intraocular
inflammation/uveitis. Initially, uveitis is broadlyclassified based on a thorough history andphysical examination. Once classified, theophthalmologist can efficiently use special testsand procedures to aid in the diagnosis andmanagement of uveitis.
Indications for Diagnostic Biopsies
A large number of new diagnostic laboratorytechniques allows for the identification andcharacterization of cells, proteins, and histo-pathologic specimen and even for flow cytometricstudies of very small samples obtained byparacentesis. The diagnostic paracentesis of theeye, keratocentesis of the anterior chamber fluidand vitreous biopsy, have definite value in thefollowing situations.1. Diagnosing the presence of specific microbial
pathogens that are the likely cause ofinfectious disease in the eye.4,5
TABLE 20.1: HLA ASSOCIATION WITH UVEITIS
Disease HLA association Comments
Acute retinal necrosis DR 9 50% of patients with fulminant disease;HLA DQw7 55% of of patients vs 19% of control subjects
Behçet disease B5101* 80% of patients vs 26% of control subjects
Birdshot retinochoroidopathy A29.2 80% of patients vs 7% in control subjects
Inflammatory bowel disease B27 6 of 13 patients
Juvenile onset arthritis with iridocyclitis DRw5 62% of patients vs 19% in control subjects
Pars planitis DR2 68% of patients vs 28% in control subjects
Presumed ocular histoplasmosis DRw2 81% of patients with disciform scarring vs 28%HLA B7 in control subjects
Psoaritic arthritis B27 6 of 9 B27 positive patients
Spondyloarthritis B27 56 of 63 patients with either AS or Reiters syndrome
Recurrent anterior uveitis B27 52% of patients vs 4% in control subjects
Vogt-Koyanagi-Harada(VKH) syndrome DRB1*0405, Several class II alleles associated, depending on theDRB4*0101, racial groupDRQA1*0301 DR1 (36% vs 9% of control subjects) andHLA DR1, DR4 in Hispanics DR1 56%
Systemic lupus erythematosus (SLE) DR2 and DR3 36% vs 24% of control subjects

336 Diagnostic Procedures in Ophthalmology
2. Detecting a predominance of a certain celltypes (e.g. macrophages, epithelial ingrowth,ghost erythrocytes, phacolytic cells) that mayprovide a clue as to the etiology of an inflam-matory disease, which may be autoimmuneor allergic in nature6 (Table 20.2).
3. For the identification of:a. Specific antibody in the aqueous humor
or the vitreous aspirate that would be sug-gestive of infection (toxocara,7 toxo-plasma8).
b. Serum ACE in the aqueous humor wouldbe indicative of granulomatous inflam-mation (sarcoidosis).3
c. Miscellaneous conditions includeimmune complex and antibody associatedwith Behçet’s disease9 and identificationof tumor cell infiltration of the eye suchas large cell lymphoma,10leukemia,retinoblastoma, malignant melanoma,and metastatic cells11,12 (Fig. 20.1).
It is recommended that diagnostic paracen-tesis be performed in all cases of postoperativeendophthalmitis.4,5Anterior chamber tap shouldalso be done to rule out infectious etiology(particularly Propionibacterium acne) in delayedonset postoperative uveitis following intraocular
TABLE 20.2: INDICATIONS AND FINDINGS ON DIAGNOSTICPARACENTESIS
Indications Findings
Endophthalmitis Bacteria, fungiRetinoblastoma, malignant melanoma,reticulum cell sarcoma, leukemia Tumor cellsmetastatic tumorToxocara canis EosinophilsToxoplasma gondii, T. canis,Reticulum cell sarcoma, syphilis, Antibodies (ELISA)Behçet’s diseaseSarcoidosis ACERetinoblastoma LD isoenzymesPhacolytic glaucoma Macrophages/lens matterHemorrhagic glaucoma Ghost erythrocytesEpithelial ingrowth Epithelial cellsPersistent hyperplastic primary vitreous Mesenchymal fibrous cellsAmyloidosis Amyloid
Fig. 20.1: Anterior chamber tap of a patient showingmetastatic cells
lens implantation. Furthermore, any elderlypatient who presents with deteriorating vision(usually with vitritis as predominant feature) ofundetermined etiology, should undergo vitreousbiopsy to rule out reticulum cell sarcoma (Table20.3).. The biopsy is also indicated in a malignantneoplasm that involves the eye, the centralnervous system or the visceral organs. In oneseries, the diagnosis of ocular reticulum cellsarcoma was made by vitreous biopsy in 56%of the eyes.13 In cases diagnosed by vitreousbiopsy, the average interval from onset ofsymptoms to the diagnosis was 13 months, as

337Diagnostic Procedures in Uveitis
opposed to 21 months in patients where thediagnosis was made by histology of any othersites.13 Ocular reticulum cell sarcoma oftenresponds to radiation and chemotherapy.Therefore, an early diagnosis with prompttherapeutic intervention may contribute to thepreservation of visual function and prolongationof life. Similarly, any patient suspected of beingan intravenous drug abuser presenting withendogenous endophthalmitis-like picture shouldundergo diagnostic anterior chamberparacentesis and vitreous biopsy.14
Anterior Chamber ParacentesisParacentesis of anterior chamber is a relativelysimple outpatient procedure, which can beperformed when the patient is seated at the slit-lamp or lying in a supine position.
Many techniques have been described for theanterior chamber paracentesis. A simple and safetechnique, which can be performed in an OPDsetting taking adequate aseptic precautions isdescribed below:1. Broad-spectrum antibiotic drops should be
instilled. After 30 seconds, a drop of local
anesthetic is instilled. One may also use sterilecotton tipped applicator soaked in antibioticand applied at the planned site of needleinsertion.
2. A tuberculin or 2 ml syringe with a 27 to30 gauge needle is used (Fig. 20. 2). However,in case of granulomatous uveitis, it ispreferable to use a large bore 25-26 gaugeneedle. Conjunctival toothed forceps may beused to stabilize the globe.
3. The needle entry into the anterior chamberis oblique through the stroma via the lowerlimbus. This acts as a valvular self-sealingparacentesis wound on withdrawal of theneedle. One should avoid touching the cornealendothelium and particularly the lens inphakic patients and should stay over theperipheral iris at all times. The needle shouldnot be aimed towards the center of the pupiland the beveled end should face upwardsthroughout the procedure.
4. Obtain a 0.1 to 0.3 ml yield of aqueous, andon withdrawal external pressure is appliedto the entrance with sterile cotton tippedapplicator. A drop of antibiotic is instilledin the conjunctival sac and the eye is patched
TABLE 20.3: INDICATIONS FOR ANDFINDINGS ON VITREOUS TAP
Indications Findings
Endophthalmitis Bacteria, fungiRetinoblastoma, malignantmelanoma, reticulum cellsarcoma, leukemia, Tumor cellsMetastatic cancersT. canis, T. gondii EosinophilsReticulum cell sarcoma, Antibodiessyphilis, Behçet’s diseaseSympathetic ophthalmia MacrophagesCMV retinitis PCR of virus DNABehçet’s disease Monoclonal antibodiesAsteroid hyalosis Calcium soapsAmyloidosis Amyloid
Fig. 20.2: Shows the technique of anterior chamberparacentesis using limbal approach with a 30 gauge needle,in a patient suspected to have postoperative endophthalmitis

338 Diagnostic Procedures in Ophthalmology
for half an hour after which the patient isre-examined on the slit-lamp to ensureanterior chamber reformation.
Vitreous Tap or Diagnostic Vitrectomy
A vitreous tap has to be considered in cases withintraocular inflammation of suspected infectiousetiology, masquerade syndrome, or intraocularinflammation not responding to treatment.Tapped vitreous is often small, but can providevaluable diagnostic information if processedproperly. Diagnostic vitrectomy provides a largeamount of material, though diluted. In thepresence of a hazy vitreous precludingvisualization of the fundus, the combination ofvitreous sampling for diagnostic purpose witha therapeutic vitrectomy is certainly a sound andlogical approach.
Technique of Vitreous Tap
1. The procedure can be carried out in theoperation theatre using a surgical microscopeafter a sub-conjunctival or retrobulbarinjection. However, it can also be performedin the OPD. When performed in the OPD,the technique is similar to that of anteriorchamber paracentesis. As the perforation ofthe sclera is more painful than performinga keratocentesis, a sub-conjunctival injectionof 0.1 ml of 2% lidocaine can be given atthe site of scleral perforation and entry intothe vitreous space 3-mm posterior to thesurgical limbus.
2. The vitreous sampling is done using 25 to23 gauge needles. Most eyes with long-standing intraocular inflammation haveliquefied vitreous or fluid pockets within thevitreous. In such a situation fine bored 25-G needle can be used. When organizationof vitreous is seen 23-G needle is preferred.The vitreous sample may be easier to obtain
with the use of a three-way stopcock. Oneend is attached to the needle and the othertwo openings are attached to two tuberculinsyringes. The globe is immobilized with aconjunctival forceps, and the needle isinserted in the vitreous cavity under directvisualization with slit-lamp. The emptysyringe withdraws the vitreous, andmanipulating the stopcock, a similar quantityof antibiotic is injected into the vitreous cavity.After the injection the needle is slowlywithdrawn from the eye.For analysis of the vitreous, it is essential
to obtain an undiluted vitreous specimen understerile conditions intraoperatively. Newertechniques using vitrectome with attachments15
and pneumovitrector16 have been described. Doftet al17 obtained vitreous samples in eyes withendophthalmitis by directly connecting a syringeto the aspiration tube of the vitreous cutter. Othershave used a collecting bottle with openings atboth sides integrated into the aspiration system.18
Smiddy et al19 obtained vitreous samples througha three-way stopcock through a manual aspira-tion. Scholda and co-workers15 have developeda new technique, in which a metal devise isintegrated into the aspiration system of thevitrectomy unit which fits on standard laboratoryplastic containers with integrated caps. Recently,Peyman has described a full functional vitrectomyinstrument (pneumovitrector) composed of anaspiration and a cutting system combined withan infusion line for injecting air or gas into thevitreous cavity.16 By simultaneous injection ofair and removal of vitreous, the pneumovitrec-tomy allows to obtain a large undiluted vitreousbiopsy specimen.
A more thorough standard three-portvitrectomy can be performed especially whentherapeutically indicated in cases of endophthal-mitis. The undiluted vitreous can be sampledand aspirated via a side-port.20

339Diagnostic Procedures in Uveitis
Tests and Handling of Aqueous andVitreous SpecimenThe specimen should be handled in such a wayas to allow maximum number of tests to beperformed for the diagnosis. The volume ofsampled vitreous is relatively large, comparedto the aqueous specimen, increasing the yieldon various agar plates and the chances ofobtaining a positive culture. To maximize thechance of detecting the offending factor, theaqueous humor and vitreous specimen obtainedshould be divided in two equal volumes. Onevolume is used for the following tests:
Microbiology
Direct smears are prepared for Gram stain,Giemsa stain, Gomori’s methanamine silver andcalcofluor white stain.The samples should alsobe immediately inoculated onto blood agar,chocolate agar, brain-heart-infusion-broth(BHIB), thioglycolate fluid (maintained at bodytemperature), Sabouraud’s agar, Brucella agarand BHIB with gentamicin (maintained at roomtemperature for fungal isolation).
Polymerase Chain Reaction
A minimum volume of 0.05 ml should be reservedfor this test especially when P. acne, fungalendophthalmitis and uveitis of viral etiology issuspected. The details of PCR are mentioned later.The other half of the original sample can beprocessed for the following tests:1. Cytology: The entire sample can be spinned
down, the supernatant transpipetted and thepellet resuspended in formalin or glutaral–dehyde. These pellets are passed through twoor more millipore filters and number ofspecific staining including immunohisto-chemistry is carried out to identify theinfiltrating cell types.20 The other technique
includes cytocentrifuge by cytospin method(about 1000 revolutions for 5 minutes).
2. Antibodies: The supernatant obtained afterspinning down the cellular components with-in the aqueous humor should be subjectedto ELISA. The local production of specificantibodies within the ocular fluids is animportant indication for the possible etiologyespecially when Toxocara or Toxoplasma issuspected.20
3. Flow cytometric analysis: 21 Flow cytometry(FCM) measures the physical and chemicalproperties of individual particles or cellsmoving in a single file in a fluid stream.Constituent cells must be dispersed in a fluidmedium before a specimen can be analyzedby FCM. Intact tissue specimens (for example,solid tumors) must first undergo disintegra-tion by mechanical, chemical, or enzymaticmethods. Some of these methods allow thecytoplasm to remain intact, thereby permittinganalysis of cytoplasm or cell surfacemembrane properties.The most clearly defined application of FCM
is in diagnostic surgical pathology. It is anadjunct to histologic examination in the diagnosisof lymphoproliferative and leukemic processes.FCM is applied to the study of uveal melanomas,retinoblastomas and ocular lymphoid prolifera-tions, especially masquerade syndrome. It is nowalso being used to provide valuable informationregarding the ratio between the cytotoxic andhelper T-cells, an indication for the immunologicevents taking place during the course of the oculardisease.
Biopsy
Iris and Ciliary body Biopsy
Biopsy of iris and ciliary body are usuallyperformed in suspected tumors in these regions.

340 Diagnostic Procedures in Ophthalmology
These lesions include glioneuromas, medullo-epitheliomas, iridociliary cysts, leiomyomas,malignant melanomas and nematodegranulomas.22 Indications of iris and ciliary bodybiopsy in uveitic conditions are few and include:1. Metastatic lesions to the iris and ciliary body
masquerading as uveitis.2. Ruptured iris cysts mimicking as anterior
uveitis.3. Iris and ciliary body nodules secondary to
granulomatous conditions like tuberculosisand sarcoidosis. In a recent publication,Moorthy and co-workers were able to diagnose3 patients with coccidioidomycosis irido-cyclitis following biopsy of iris nodules.23
Choroidal and RetinochoroidalBiopsy
Lesions within the choroid can be difficult todifferentiate clinically, although technologicaladvances in non-invasive imaging have helpedto monitor the size and the growth. When theinflammatory process is relentless and theanterior chamber tap and/or vitreous tap (orvitrectomy) are unrevealing, the ophthalmologisthas to consider the option of performing achoroidal or retinochoroidal biopsy. Withadvances in instrumentation and microsurgicaltechniques, endoretinal biopsy and chorioretinalbiopsy can be performed more easily. There areseveral reports of retinochoroidal biopsyestablishing etiological diagnosis of uveitis,especially to differentiate subretinal lesions ofinfective origin from non-infective ones.24
The diagnosis of ocular reticulum cell sarcomacan usually be made on the basis of vitrectomyalone, sometimes it requires a more aggressiveapproach with choroidal biopsy, when parsplana vitrectomy and extensive medicalexamination fail to confirm the diagnosis ofreticulum cell sarcoma.25
Chorioretinal Biopsy (External Approach)
Trap-door approach of Stallard: After a conjunctivalperitomy, a Flieringa ring is sutured to the baresclera. A lamellar scleral flap is dissected in a trap-door fashion over the lesion. Penetrating diathermyis applied around the lesion with adequatemargins. The lesion is dissected leaving the retinaintact. This procedure is not in use any more.
Full-thickness eye wall resection of Peyman:
Preoperatively, the mass lesion is surroundedby rows of heavy laser photocoagulation burns,which is performed in two sessions 3 to 4 weeksapart.26-31 The resection is performed 4 weeksafter the initial session.30 A conjunctival 360°peritomy is carried out and transilluminationand diathermy localize the tumor. A Peymanbasket is sutured to the globe. A partial thicknessflap is dissected around the lesion. Penetratingdiathermy is applied around the tumor in thescleral bed. Pars plana sclerotomies are madefor later vitrectomy and sealed with scleral plugs.The lesion is excised using curved Vannasscissors. The scleral flap is sutured back in placeand pars plana vitrectomy is performed to removeany vitreous blood and incarcerated vitreous fromvitrectomy site. Surgery can also be performedunder systemic hypotensive anesthesia to reducethe risk of hemorrhage.29
Endoretinal biopsy (Internal approach): Endoretinalbiopsy is done in patients with uncertain retinalinflammation. A pars plana vitrectomy isperformed before the retina is biopsied. After thevitrectomy, the retinal site is demarcated andsurrounded by endodiathermy or a barrage ofendolaser. A shallow retinal detachment isinduced by injection of a minute amount ofbalanced salt solution under the retina to slightlyelevate it. The internal part of demarcation zoneis cut out using fine intraocular scissors. Theunderlying tissue is sampled which can beremoved by gently aspirating it into a draining

341Diagnostic Procedures in Uveitis
Fig. 20.3: Shows the technique of FNAB of an irismass lesion using a limbal approach
flute. At times, additional material for examina-tion can be collected from the subretinal spaceusing a soft tipped flute needle connected to atuberculin syringe. Additional endodiathermyand endolaser burns may be added, if necessary,in order to prevent fluid seepage under the cutedges of the non-biopsied retina which can causea retinal detachment. This is followed by internaltamponade using expansile gases.
In some instances, a biopsy of the retina maybe necessary to establish the diagnosis, parti-cularly when both eyes are involved or there is agreat potential for loss of vision, as in cases ofacute retinal necrosis (Herpes and CMV).32
Retinal biopsy is needed in patients if retinallesions have atypical presentations. A casewas reported, where an HIV-positive patientpresented with a clinical picture similar toCMV retinitis. As the retinitis was found to beganciclovir resistant, retinal biopsy was carriedout which showed it to be toxoplasmicchorioretinitis33 highlighting the importance ofretinal biopsy in establishing the diagnosis.
Fine-Needle Aspiration BiopsyFine-needle aspiration biopsy (FNAB) offers ahistologic correlation to the clinical diagnosisin cases of atypical presentation of intraocularlesions. It aids in effective planning andmanagement and enables histopathologicaldiagnosis without having to sacrifice the eye orhaving to resort to open biopsy methods.
FNAB has been recommended in followingconditions:1. Cases of suspected infectious subretinal
lesions (abscess or tuberculoma) mimicking aschoroidal tumors. Gregor and coworkers 34
diagnosed a Nocardia asteroides subretinalabscess following a trans-vitreal FNAB.
2. Cases where diagnosis is difficult, distinctionbetween benign and malignant is not clear,all ancillary tests are inconclusive, and where
therapeutic decisions have to be made on thebasis of cytological findings.35
3. Patients with metastatic disease of the choroidbut with no primary.
4. Cases where patient refuses recommendedtherapy until histopathological confirmationis obtained.
Techniques of Fine-NeedleAspiration BiopsyThe method of choice of FNAB is contingent onthe existing anatomic state of the eye, the locationof the lesion, size of the lesion, and the presenceor the absence of a retinal detachment.
Approach22,36,37
Limbal, pars plana, corneolimbal-zonule andsubretinal approaches are used for taking FNAB.
Limbal approach: This approach is used for irislesions (Fig. 20.3) or posterior ciliary body lesionsin aphakia.
Pars plana approach: In this approach, the needleis passed from the pars plana region (3.5 mmfrom the limbus) in the quadrant opposite thelesion, through the vitreous gel (Fig. 20.4).
For some of the eyes with tumors locatedposteriorly, a vitrectomy has to be performed

342 Diagnostic Procedures in Ophthalmology
before aspiration. The purpose of vitrectomy isto maintain the clear visualization of the lesionsand the needle path, to remove the vitreous thatcould potentially adhere to the needle (reducingunnecessary retinal traction), to eliminateadherence of the vitreous to the tumor cells inthe needle as the needle is withdrawn (mitigatepotential of tumor cells tracking in the wound),and to control bleeding after aspiration.
Corneolimbal-zonular approach: It preventsdissemination of the tumor mass through theneedle track. This approach is used in patientswith retinoblastoma, a highly friable tumor, asthe chance of needle track dissemination isextremely high. Through a corneolimbalapproach the needle passes through multipleplanes, thus wiping out the tumor cells as theneedle is removed from the eye. In addition theabsence of blood vessels theoretically decreasesthe chances of dissemination.
Subretinal approach: It is adopted in cases ofsubretinal abscess and tuberculoma, consideringthe site is approachable.
Most surgeons prefer to use a 25-gauge needlewith a flexible connector to a 2 ml syringe tominimize the movement and surgical traumaduring biopsy. Others prefer a spinal needle with
a trochar and cannula, although the excessmovement caused by removing the trochar andattaching the syringe and flexible connector maylead to increased complications.
Complications of FNAB22,36,37
The most common complication of FNAB isbleeding from the site of the needle track. Virtuallyall intraocular FNABs are associated with asmall degree of hemorrhage, which can besubretinal, retinal or intravitreal.
Orbital dissemination of tumor cells and dis-tant metastatic spread caused by tumorimplantation along the needle track has beenreported. It is reduced with the use of smaller25-gauge needle. Theoretically, the procedure canalso disseminate a subretinal focus of infection.38
Iatrogenic retinal perforations are unavoi-dable by the indirect needle approach to thechoroidal lesions and may cause a retinaldetachment after FNAB. The number of casesdeveloping the retinal detachment followingFNAB is few, possibly because the blood clotcloses the site of perforation.
Test and Handling of Biopsy MaterialFor obtaining maximal information fromretinal and chorioretinal biopsy, a closecooperation amongst the clinician, the surgeon,the microbiologist and the pathologist is of utmostvalue. The differential diagnosis should becommunicated to the laboratory personnel anda plan of handling the tiny biopsy specimenshould be worked out. As soon as the biopsyspecimen is removed, it should be divided intofour parts based on the clinical suspicion. Onepart should be snap frozen for immunostaining,one for light and electron microscopy, one forin situ hybridization and the remaining formicrobiological cultures and PCR detection ofinfective agents.
Fig. 20.4: Technique of FNAB of a subretinal masslesion using a pars plana approach

343Diagnostic Procedures in Uveitis
Microbiological Cultures
A small piece of tissue is seeded onto the agarplate or preferably onto the agar medium. Afterincubation for 24-48 hours, initial indicationsfor the type of infective microbial agent can beobtained.
Light and Electron Microscopy
These two techniques are complimentary andshould be used in parallel. The specimen to beused for these tests should be fixed in 10%formaldehyde or preferably glutaraldehydesolution.
Immunohistochemistry
The material should be snap frozen. Frozensections can be studied with appropriateantibody to identify infectious agents like virusesand autoimmune diseases. Immunohistoche-mistry can also be done from sections of formalinfixed tissues.
In situ Hybridization39
In situ hybridization test can be done in cryopreserved tissue as well as sections from formalinor glutaraldehyde fixed tissues. Radiolabelledprobes are used specially for infectious organismslike viruses. Localization of such infectiousagents within a cell is possible.40
Polymerase Chain Reaction
Polymerase chain reaction (PCR) is a newmolecular biological technique, which involvesenzymic application of specific sequence of DNAor RNA (Fig. 20.5). This technique was firstdescribed by Mullis and coworkers in 1985. PCRis based on the principle of three steps namely:(i) denaturation, (ii) annealing, and (iii) ampli-fication (Fig. 20.6). Since its introduction in 1995,PCR has been widely used in both research and
Fig. 20.5: Photograph of the PCR machine
clinical medicine. Its application in ophthalmo-logy and medical sciences as a whole has increa-sed exponentially over the last few years.41,42
The ocular tissues which can be submittedfor PCR include: intraocular fluid (aqueous andvitreous), fresh retinal and choroidal tissues,formalin fixed or paraffin embedded tissues, andDNA material extracted from a stained orunstained cytology slide.
PCR is a reliable test for detection ofadenoviruses from the conjunctiva andPropionibacterium acne and other bacterialendophthalmitis.43 It is also employed in thediagnosis of tuberculous uveitis,44 presumedocular tuberculosis45 and also to emphasize therole of tuberculosis in the etiology of Eales’disease46,47 and toxoplasmosis.
Some general precautions are needed tominimize the risk of contamination, whichinclude performing the initial processing in abiologic safety hood not used for any other PCRrelated procedure. All reagents should beprepared in another biologic safety cabinet usingmaterials dedicated solely to the PCR and shouldbe aliquoted in sterile tubes.

344 Diagnostic Procedures in Ophthalmology
Fig. 20.6: Diagrammatic representation of the three steps of PCR: Denaturation, Annealing and Amplification
Lastly, PCR can detect agents for which theprimers exist. There are limited numbers ofprimers available. It also does not provide cellularmorphology. In contrast, the in situ DNAhybridization can show the hybridized DNAwithin the infected cell. PCR detects only theamplified DNA and not necessarily reflect theetiological agents.
Conjunctival and Lacrimal GlandBiopsy
Conjunctival and lacrimal gland biopsy shouldbe reserved for those patients with visibleconjunctival masses or lacrimal gland enlarge-ment, as can occur with sarcoidosis, tuberculosis,
syphilis and coccidiomycosis.22 Stains usedinclude hematoxylin and eosin supplementedby Gomori’s methamine silver, Warthin-Starrystain and acid-fast stains, as well as immuno-histochemical stains using antibodies.Occasionally, a gallium scan will demonstratelacrimal gland uptake and support the need forlacrimal gland biopsy.
Mucosal Biopsy
The commonest indication of oral mucosalbiopsy in a uveitic scenario is for the diagnosisof Behçet’s syndrome, which shows evidence ofan occlusive vasculitis. Similarly, characteristicinflammation of one of the minor salivary glands
Polymerase Chart Reaction

345Diagnostic Procedures in Uveitis
pigment epitheliopathy, multiple evanescentwhite dot syndromes, multifocal choroiditis,sympathetic ophthalmia and VKH syndrome(early stage).
FFA can also distinguish a macular retinitisor choroiditis from central serous choroidopathyor choroidal neovascular membrane.
Indocyanine Green Angiography48
The choroid is composed of vascular elementsand is involved in majority of chorioretinalvascular disorders. FFA provides informationregarding the alterations in the blood-aqueousbarrier at the level of the retinal vessels and theretinal pigment epithelium in intraocularinflammatory conditions. However, it is unableto describe the choroid, as the absorption andemission of photonic fluorescein energy in theblue-green wavelength range is impaired by theretinal pigment epithelium. Indocyanine greenangiography (ICGA) uses the ICG molecule,which absorbs and emits photonic fluoresceinenergy in the near infrared wavelength range,which penetrates melanin pigment, hemorrhage,macular xanthophyll pigment and other obstaclessuch as turbid fluids.20 These characteristicsallow imaging of the normal and disturbedchoroidal and retinal circulations as well as thenormal and disturbed fluid distribution in thechoroid.
ICGA can aid in the diagnosis of Behçet’sdisease, sarcoidosis, tuberculosis, birdshotretinochoroidopathy toxoplasmic retinochoroi-ditis, acute posterior multifocal placoid pigmentepitheliopathy, multiple evanescent white dotsyndromes, multifocal choroiditis, VKH syn-drome and sympathetic ophthalmia.. Differentpatterns of ICG fluorescence have been identifiedduring examinations of patients with similardisorders. Fardeau and coworkers 49 establisheda precise ICGA semiology in 52 patients withBirdshot retinochoroidopathy. In another
on scanning can confirm a clinical suspicionof Sjogren’s syndrome, whereas inflammationof the intestinal mucosa can support the diagnosisof ulcerative colitis, Crohn’s disease or Whipple’sdisease.22
Lymph Node Biopsy
In patients with uveitis and enlarged lymphnodes, FNAB or excision biopsy of the affectednodes can be performed to rule out tuberculosisor sarcoidosis2.
Ancillary TestsFundus Fluorescein Angiography
Fundus fluorescein angiography (FFA) is ahelpful adjunct test in inflammatory diseasesinvolving the fundus of the eye. The mainadvantage of this technique is its ability to bettervisualize the retinal vessels and delineate theirwalls. FFA is most often used to diagnose cystoidmacular edema, retinal or choroidal neovascular-ization, areas of retinal non-perfusion and activeretinal vasculitis. FFA is also useful in patientswith neurosensory retinal detachment and otherouter retinal inflammations, particularly thoseinvolving the RPE. The major drawback of FFAis its inability to image the choroid and to detectinflammatory events affecting the choroid andchoriocapillaris especially in areas where thelesion is deep.20 Furthermore, one has to rememberthat although FFA findings are helpful in illus-trating the inflammatory processes and anatomicchanges within the retina and the vessels,generally the FFA patterns are not diagnosticor pathognomonic for any particular intraocularinflammatory disease.
Posterior uveitic entities where FFA is parti-cularly indicated are birdshot retinochoroido-pathy, geographic helicoid peripapillarychoroiditis, acute posterior multifocal placoid

346 Diagnostic Procedures in Ophthalmology
Fig. 20.7: Ultrasound B-scan with vector A-scanshowing gross choroidal thickening in a patient with VKHsyndrome
Fig. 20.8: UBM photograph showing a membrane (m)over the pars plana region (arrows denoting the extentof membrane) with vitreous exudates suggestive of parsplanitis in a patient with complicated cataract obscuringretinal view
landmark article by Oshima et al, 50 ICGA wasperformed in 20 eyes with VKH syndrome andthe findings suggested a transient choroidalcirculatory disturbance during the acute stage.A standardized procedure for combining FFAand ICGA has been found to be more useful.
Ultrasound
B-scan ultrasonography is used most commonlyin patients with uveitis to investigate inflam-matory choroidal and scleral thickening that canoccur with VKH syndrome (Fig. 20.7), posteriorscleritis and sympathetic ophthalmia20and toevaluate the posterior segment in patients withdense cataracts or other media opacities. It isalso useful in detecting exudative retinaldetachment, detachment of choroid, evaluationof the ONH and thickening of macula (edema).It is useful in detection of panophthalmitis andscleritis where classically “T-sign” is present.Ultrasound has a very important role in themanagement of endophthalmitis to determine itsseverity and extent of infection.
USG is also useful in diagnosis of granulomaand abscess in tuberculosis, cysts with scolexin cysticercosis and nematode infection.
Ultrasound Biomicroscopy51,52
Conventional ultrasound use frequencies in10 MHz range. The use of ultrasound frequenciesin the 50-100 MHz range is a relatively newdevelopment in the ultrasound imaging of theeye. Ultrasound biomicroscopy (UBM) is a newtool available for evaluation inflammation inareas, which are not visualized clinically. It canbe used to study up to the anterior 4-mm of theglobe. In conditions like small undilating pupildue to posterior synechiae with or withoutcomplicated cataract this modality is extremelyuseful in identifying the presence of inflammationin the area of the pars plana (Fig. 20.8). It hasalso been used in ciliary body metastatic tumors,which can masquerade as uveitic entities,12 (Figs.
20.9 and 20.10) and for the diagnosis andmanagement of pars planitis caused by caterpillarhair.53
Optical Coherence Tomography
Optical Coherence Tomography (OCT) is anoncontact, non-invasive imaging techniqueused to obtain high-resolution cross-sectional

347Diagnostic Procedures in Uveitis
any sonic modality. Newer fourth generationOCT uses a femtosecond laser light source andhas achieved an axial resolution of 3 microns.Spectral OCT and the en-face OCT are newerdevelopments. Among the newer modalities ofinvestigations OCT has come to stay and is avery useful supplement to conventionaltechniques.
Macular changes can occur in various formsof uveitis and can be studied clinically by slit-lamp biomicroscopy, indirect ophthalmoscopyor by fundus flourescein angiography. Macularedema and its sequelae are among the leadingcauses of decreased vision in patients withuveitis. Other changes that can occur in themacula due to uveitis include: serous retinaldetachment at the macula, epiretinal membrane,macular hole, vitreomacular traction (tractionalretinal detachment), and choroidal neovascularmembrane.
Uveitic conditions are by nature recurrentand hence the patients have to be followed-upat frequent intervals. OCT being a non-invasivetechnique has the advantage of repeatability. OCTthus is helpful in not only diagnosing but infollow-up of patients at regular intervals withtreatment. It is helpful in the management ofintraocular inflammation as it is able to definethe extent, depth and thickness of the inflam-matory lesion. It is also helpful in localizing thelayer of retina and choroid harboring lesion.
This localization is helpful in not onlydiagnosing the disease but also in monitoringthe response to treatment – for example cystoidmacular edema is a classical complication ofocular inflammation. It results from either arupture of the inner or outer blood ocular barrier.OCT can detect precisely even very minimalamount of fluid in particular layers of retina.
OCT can be more helpful in detecting subtlemacular edema which may not be detected onFFA.55-57 Macular edema is an important cause
Fig. 20.9: Metastatic Lesion: Slit-lamp photograph showinganterior chamber reaction and fluffy exudates on thesuperior iris
Fig. 20.10: UBM image showing cystic metastatic lesionsin the ciliary body region
images of the retina. It is analogous to ultrasoundB-scan imaging except that light rather thansound waves are used in order to obtain a muchhigher longitudinal resolution of approximately10 μm (axial) and 20 microns (transverse) in theretina.54 Its resolution is 8-25 times greater than

348 Diagnostic Procedures in Ophthalmology
of defective vision due to various uveiticconditions especially intermediate uveitis. Earlydetection and treatment is important (Figs 20.11Aand B) because it can lead to complicationsand vision loss. We have found intermediateuveitis to be the commonest cause of macularedema.
OCT is extremely sensitive in identifyingneurosensory retinal elevation because of thedistinct difference in optical reflectivity betweenphotoreceptors and underlying RPE/chorio-capillaris. It can detect the presence of shallowsubretinal fluid or macula involvement in retinaldetachment. OCT is helpful in the early diagnosisas well as resolution of shallow retinaldetachment (Figs 20.12A and B). It can also beused to distinguish true retinal detachment fromretinoschisis.
OCT appearance of CNVM is described asa bump with moderate slope extending upwardor as a fusiform thickening with disruption ofthe reflective band. OCT is useful before planning
macular surgery for removal of subfoveal CNVespecially in patients with presumed ocularhistoplasmosis syndrome and multi-focalchoroiditis. Following patterns of subfovealCNVM can be made out with the help of OCT:• Reflective band anterior to and clearly
separated from the RPE.• Highly reflective red band anterior to and
adherent to the RPE, similar to the bump• Highly reflective band indistinguishable from
the RPE.Submacular surgery results have shown that
eyes for which OCT reveals the triad of hyper-reflective tissue with anterior location, aseparation zone and an underlying opticallyclear zone, surgical removal may represent areasonable alternative.
Color Vision Testing
Color vision testing serves as an objective measureof optic nerve dysfunction. In addition, patientswith birdshot choroidoretinopathy can developcolor vision loss disproportionate to the visual
A
B
A
B
Figs 20.11A and B: A Pretreatment OCT picture showinglarge cystoid spaces at the macula. B Posttreatment OCTpicture of the same patient showing resolution of macularedema with restoration of foveal contour
Figs 20.12A and B: A OCT picture showing neurosensorydetachment at the macula, B OCT picture showingposttreatment resolution

349Diagnostic Procedures in Uveitis
acuity or fundus finding, presumably reflectingthe widespread outer retinal dysfunction.
Visual Field Testing
Visual field testing (VFT) is an important ancil-lary investigation in uveitic entities, especiallyin posterior uveitis like serpiginous choroiditis,multifocal choroiditis, birdshot retinochoroido-pathy, Behçet’s disease, sarcoidosis, toxoplasmicretinochoroiditis, acute posterior multifocalplacoid pigment epitheliopathy and multipleevanescent white dot syndromes. It can documentthe progression of a disease process involvingthe retina which manifests as well-demarcatedscotomas. De Courten and co-workers58 discussedthe potential role of computerized visual fieldtesting for appraisal and follow-up of patientswith birdshot retinochoroidopathy. VFT can alsocategorize the patients developing field losssecondary to steroid induced glaucoma.
Audiometry
Audiometry can record the extent of hearing lossseen in VKH syndrome and syphilis.
Radiological Studies
The sacroiliac joint is inflamed in 60% to 90%of patients with HLA-B27 related uveitis. Plainradiographs are quite useful in demonstratingthe inflammatory narrowing of the sacroiliacjoint. CT-scan and MRI offer increased sensitivityfor documenting sacroiliitis, but are moreexpensive and indicated in selected cases. ChestX-ray is indicated in sarcoidosis and tuberculosiswhile cases with ankylosing spondylitis needradiograph of sacroiliac joint.
Radionucleotide Studies
Intravenously injected gallium-67 localizes tonormal liver, spleen and bone, as well as areas
of active inflammation, such as inflamed lymphnodes, parotid and lacrimal glands, and joints.Although any cause of inflammation can producea positive test, the gallium scan is used frequencyto identify pulmonary hilar gland or lacrimal,parotid and submandibular gland inflammation,as in the case of sarcoidosis.
Lumbar Puncture
Lumbar puncture (LP) is most often used inpatients with suspected intraocular lymphoma.LP should be done after a complete neurologicalevaluation and imaging procedure like CT and/or MRI-scan to avoid unexpected shifting ofintracranial contents. LP is also used in selectedcases to test suspected meningitis due to syphilis,tuberculosis, toxoplasmosis, cryptococcalinfection and coccidiomycosis.
Skin Testing
Purified protein derivative of tuberculin (Mantoux
test): Mantoux test is a non-specific test. Skintesting involves intradermal injection of0.1 ml of antigen to elicit a delayed typehypersensitivity response indicative of priorexposure. Normally all patients with panuveitisare tested for tuberculosis (TB) with 0.1 ml of5 units of purified protein derivative (PPD). Thisincludes patient with a prior Bacillus Calmette-Guerin (BCG) vaccination or a distant historyof tuberculosis. Although a positive test doesnot reflect tubercular activity, a negative test oftenrules out a tubercular focus in the body. Dueto the prior exposure to TB, a large number(60 to 90%) of healthy adults have a positivePPD skin test in India. Therefore, there are highpossibilities of false positive results. Hence, allpatients of suspected ocular tuberculosis shouldbe evaluated by associated findings like X-raychest showing pulmonary tuberculosis. Apositive Mantoux test in a case of granulomatous

350 Diagnostic Procedures in Ophthalmology
anterior uveitis with poor general health or ina nonresponder to systemic steroids is of greatersignificance. Aqueous samples should besubjected to PCR study for Mycobacterialtubercular genome in such cases.
Patients with active Behçet’s syndromeoccasionally show increased dermal sensitivity,termed pathergy, which is manifestated by forma-tion of local pustule in response to intradermalinjection. This test is of limited sensitivity evenin the active phase of the disease.
References1. Baarsma GS, La Hey E, Glasius E, et al. The
predictive value of serum-angiotensinconverting enzyme and lysozyme levels in thediagnosis of ocular sarcoidosis. Am J Ophthalmol1987;104:211-17.
2. Power WJ, Rodriquez A, Perroze-Seres M, etal. The value of combined serum-angiotensinconverting enzyme and gallium scan indiagnosing ocular sarcoidosis. Ophthalmology1995;101:2007-11.
3. Weinreb RN, Sandman R, Ryder MI, et al.Serum-angiotensin converting enzyme activityin human aqueous humor. Arch Ophthalmol1985;103:34-36.
4. Allansmith MR, Skaggs C, Kimmuras SJ. Anteriorchamber paracentesis: Diagnostic value inpostoperative endophthalmitis. Arch Ophthalmol1970;84:745-48.
5. Foster RK. Etiology and diagnosis of bacterialpostoperative endophthalmitis. Ophthalmology1978;85:320-24.
6. Witmer R. Clinical implications of aqueoushumor studies in uveitis. Am J Ophthalmol1978;86:39-42.
7. Benitez del Castillo JM, Herreros G, Guillen JL etal. Bilateral ocular toxocariasis demonstrated byaqueous humor enzyme linked immunosorbentassay. Am J Ophthalmol 1996;119:51-54.
8. O’Connor GR. Precipitating antibody totoxoplasmosis in blood and aqueous humor.Am J Ophthalmol 1957;75:44-48.
9. Michelson JB, Chisari FV, Kansu J. Antibodiesto oral mucosa in patients with ocular Behcet’sdisease. Ophthalmology 1985;92:1277-34.
10. Michels RG, Green WR, Engel HM, et al.Intraocular reticular cell sarcoma:diagnosis bypars plana vitrectomy. Arch Ophthalmol1975;93:1331-35.
11. Takahashi T, Oda Y, Chiba T, et al. Metastatictumour of iris and ciliary body simulating asiridocyclitis. Br J Ophthalmol 1984;188:266-69.
12. Woog JJ, Chess J, Albert DM, et al. Metastatictumour of iris simulating as iridocyclitis. Br JOphthalmol 1984;188:167-69.
13. Freeman LN, Schachat AP, Knox DL, et al.Clinical features, laboratory investigations andsurvival in ocular reticulum cell sarcoma.Ophthalmology 1997;94:1631-39.
14. Michelson JB, Whitaker JP, Wilson S, et al.Invisible foreign body granuloma of the retinaassociated with intravenous cocaine addition.Am J Ophthalmol 1979;87:278-79.
15. Scholda CD, Egger SF, Lakits A, et al. A systemfor obtaining undiluted intraoperative vitreousbiopsy specimen. Arch Ophthalmol 1996;114:1271-72.
16. Peyman GA. A Pneumovitrector for thediagnostic biopsy of the vitreous. OphthalmolSurg Laser 1996;27:246-47.
17. Doft BK, Donelly K. A single sclerotomy vitreousbiopsy in endophthalmitis. Arch Ophthalmol1991;109:465.
18. Tamai M, Nakazawa M. A collection systemof obtaining vitreous humor in clinical cases.Arch Ophthalmol 1991;109:465-66.
19. Smiddy WE, Michels RG, de Bustros, de la CruzZ, Green WR. Histopathology of tissue removedduring vitrectomy for impending macular holes.Am J Ophthalmol 1989;108:360-64.
20. Ben Erza D. Diagnostic intraocular interventions.In: Ben Erza D (Ed). Ocular inflammation: Basicand clinical concepts. Martin Dunitz,1999;83-89.
21. Crofty TB, Campbell RJ. Flow cytometry.Ophthalmol Clinic North Am 1995;8:37-46.
22. Ma PE, Peyman GA. Uveal biopsy. In: WilliamT, Jaeger EA (Eds). Duannes ClinicalOphthalmology. Lippincott Williams andWilkins, 1998.Vol 4,Ch 36,1-13.
23. Moorthy RA, Rao NA, Sidikaro Y, et al.Coccidioidomycosis iridocyclitis. Ophthalmology1994;101:1923-28.
24. Kirmani MH, Thomas EL, Rao NA, et al.Intraocular reticular cell sarcoma: diagnosis bychoroidal biopsy. Br J Ophthalmol 1987;71:748-52.

351Diagnostic Procedures in Uveitis
25. Peyman GA, Charles H. Internal eye wallresection in the management of uvealmelanoma. Can J Ophthalmol 1988;23:219-24.
26. Peyman GA, Juarez CP, Raichand M. Full-thickness eye wall biopsy: Long-term resultsin 9 patients. Br J Ophthalmol 1981;65:722-25.
27. Peyman GA, Axelrod AJ, Graham RO. Full-thickness eye wall resection: An experimentalapproach for treatment of choroidal melanoma:Evaluation of cryotherapy, diathermy andphotocoagulation. Arch Ophthalmol 1974;91: 219-30.
28. Constable IJ, Chester GH, Horne R, et al. Humanchorioretinal biopsy under controlled systemichypotensive anaesthesia. Br J Ophthalmol1980;64:559-63.
29. Peyman GA, Diamond JG, Axelrod AJ. Sclero-chorio-retinal (SCR) resection in humans. AnnOphthalmol 1974;6:1347-49.
30. Peyman GA, Nelson PT, Axelrod AJ. Full-thickness eye wall resection: Evaluation ofpreoperative photocoagulation. InvestOphthalmol 1973;12:262-66.
31. Peyman GA, Mary DR, Ericson ES, et al. Full-thickness eye wall resection: An experimentalapproach for the management of choroidalmelanoma II. Homo- and heterograft. InvestOphthalmol 1973;11:668-72.
32. Culbertson WW, Blumenkranz, Pepose JS, etal. Varicella zoster virus is a cause of acuteretinal necrosis. Ophthalmology 1986;93:559-69.
33. Cote MA, Rao NA. The role of histopathologyin the diagnosis and management of uveitis.Int Ophthalmol 1990;14:309-16.
34. Gregor RJ, Chong CA, Augsburger JJ, et al.Endogenous Nocardia asteroides subretinalabscess diagnosed by transvitreal fine needleaspiration biopsy. Retina 1989;9:118-21.
35. Shanmugam MP, Biswas J. Fine needleaspiration biopsy in the diagnosis of intraocularlesions. Indian J Ophthalmol 1997;45:105-08.
36. Glasgow BJ, Straatsma BR, Kreiger AE. Fine-needle aspiration of the posterior segmentintraocular tumors. Ophthalmol Clinic North Am1995;8:59-72.
37. Glasgow BJ, Brown HH, Zargoza AZ, et al.Quantification of tumor seeding from the needleaspiration of ocular melanomas. Am J Ophthalmol1988;105:538-56.
38. Freeman WR, Wiley CA. In situ nucleic acidhybridization. Surv Ophthalmol 1989;34:187-92.
39. Henderly DE, Atalla LR, Freeman WR, Rao NA.Demonstration of cytomegalovirus retinitis byin situ DNA hybridization. Retina 1988;8:177-81.
40. Della G. Molecular biology in ophthalmology:review of principles and recent advances. ArchOphthalmol 1996;114:457-63.
41. Adleberg JM, Wittwer C. Use of the polymerasechain reaction in the diagnosis of ocular disease.Current Opinion in Ophthalmology 1995;6:III:80-85.
42. Chan CC, Palestine AG, Li Q, Nussenblatt RB.Diagnosis of Ocular toxoplasmosis by the use ofimmunocytology and the polymerase chainreaction. Am J Ophthalmol 1994;117:803-05.
43. Therese KL, Anand AR, Madhavan HN:Polymerase chain reaction in the diagnosis ofbacterial endophthalmitis. Br J Ophthalmol1998;82:1078-82.
44. Biswas J, Therese L, Madhavan HN. Use ofpolymerase chain reaction (PCR) in the detectionof Mycobacterium tuberculosis complex DNAfrom aqueous sample of suspected tubercularuveitis. Uveitis Today. Proceedings of theFourth International Symposium on Uveitis,Yokohama, Japan, 10-14th October 1997, pp.227-230, 1998.
45. Gupta V, Arora S, Gupta A, Ram J, BamberyP, Shegal S: Management of presumedintraocular tuberculosis: possible role of the poly-merase chain reaction. Acta OphthalmologicaScandinavica 1998;47:679-82.
46. Madhavan HN, Therese KL, Gunisha P, BiswasJ. Polymerase chain reaction for the detectionof Mycobacterium tuberculosis in epiretinalmembrane in Eales' disease. Invest OphthalmolVis Sci 2000;41:822-25.
47. Biswas J, Therese L, Madhavan HN: Use ofpolymerase chain reaction in detection ofMycobacterium tuberculosis complex DNA fromvitreous sample of Eales’ disease. Br J Ophthalmol1999;83:994.
48. Ruiz-Moreno JM, Ben Erza D. Indocyanine greenangiography in uveitis. In: Ben Erza D (Ed).Ocular inflammation: Basic and clinical Concepts.Martin Dunitz, 1999;91-102.
49. Fardeau C, Herbert CP, Kullmann N, et al.Indocyanine green angiography in Birdshotchoroidoretinopathy. Ophthalmology 1999;106:1928-34.

352 Diagnostic Procedures in Ophthalmology
50. Oshima Y, Harino S, Hara Y, et al. Indocyaninegreen angiography in Vogt-Koyanagi-Haradadisease. Am J Ophthalmol 1996;122:58-66.
51. Pavin CJ, Sherar MD, Foster FS. Subsurfaceultrasound microscopic imaging of the intacteye. Ophthalmology 1990;97:224-50.
52. Pavin CJ, Harasiewicz K, Sherar MD. Clinicaluse of ultrasound biomicroscopy. Ophthalmology1991;98:287-95.
53. Bhende M, Biswas J, Sharma T, et al. UltrasoundBiomicroscopy in the diagnosis and manage-ment of pars planitis caused by caterpillar hairs.Am J Ophthalmol 2000;130:125-26.
54. Zolf R, Glacet Bernard A, Benhamou N, MimounG, Coscas G, Soubrane G. Imaging analysis withoptical coherence tomography; Retina 2002;22(2):192-201.
55. Reinthal EK, Volker M, Freudenthaler N, GrubM, Zierhut M, Schlote T. Optical coherencetomography in the diagnosis and follow up
of patients with uveitic macular edema.Ophthalmology 2004;101(12):1181-88.
56. Antcliff RJ, Stanford MR, Chauhan DS, GrahamEM, Spalton DJ, Shilling JS, Ffytche TJ, MarshalJ. Comparison between optical coherencetomography and fundus fluorescein angio-graphy for the detection of cystoid macularedema in patients with uveitis. Ophthalmology2000; 107(3):593-99.
57. Markomichelakis NN, Halkiadakis I, PanteliaE, Peponis V, Patelis A, Theodossiadis P,Theodossiadis G. Patterns of macular edemain patients with uveitis: qualitative andquantitative assessment using optical coherencetomography: Ophthalmology 2004;111(5): 946-53.
58. De Courten C, Herbort CP. Potential role ofcomputerized visual field testing for the appraisaland followup of Birdshot choroidoretinopathy.Am J Ophthalmol 1998;106:430-36.

353Retinopathy of Prematurity: Diagnostic Procedures and Management
YOG RAJ SHARMA, DEEPENDRA VIKRAM SINGH, NIKHIL PAL, RAJANI SHARMA
Retinopathy ofPrematurity:
Diagnostic Proceduresand Management
21The improved survival rate of extremelypremature infants has indirectly led to increasein the incidence of retinopathy of prematurity.Ophthalmologists are now being required toexamine these premature babies with greaterfrequency. The understanding of pathogenesis,screening and management of retinopathy ofprematurity (ROP) has markedly changed sinceTerry first described it.1 The Multicenter Trial ofCryotherapy for Retinopathy of Prematurity(Cryo-ROP)2-5 and lately, Early TreatmentRetinopathy of Prematurity (ETROP) study6
have influenced the management of ROP.
EtiologyRetinopathy of Prematurity is the result of abnor-mal development of immature retinal vesselscapable of progressing to a vasoproliferativeretinal disorder. ROP can result in severe visualimpairment and has been reported to attributeto as much as 40% of the perinatal blindness.
Arrested Vasculogenesis
During normal retinal development, the vesselsstart at optic disk at approximately 16 weeks ofgestation and migrate towards ora serrata. They
reach nasal ora serrata by 36 weeks of gestationand the temporal ora serrata by 39 to 41 weeks ofgestation. The interruption of this normal vasculo-genesis leads to development of retinal ischemiaand ROP. The location of this interruptionwhich is related to time of premature birth deter-mines the development of various stages of ROP.
Risk Factors
The multiple factors that are associated with theseverity of ROP are: low birth weight, younggestational age, non-black race, multiple birth,prolonged elevation of arterial oxygen levels,hypoxemia, hypercarbia, hypocarbia, respiratorydistress syndrome, apnea, erythrocyte transfu-sions, sepsis, intraventricular hemorrhage (IVH),prolonged parentral nutrition, methylxanthineadministration, and treatment with indome-thacin.7-12
Classification and StagingZones
The coordinated developmental sequencepermits the retina to be subdivided in to 3concentric zones.
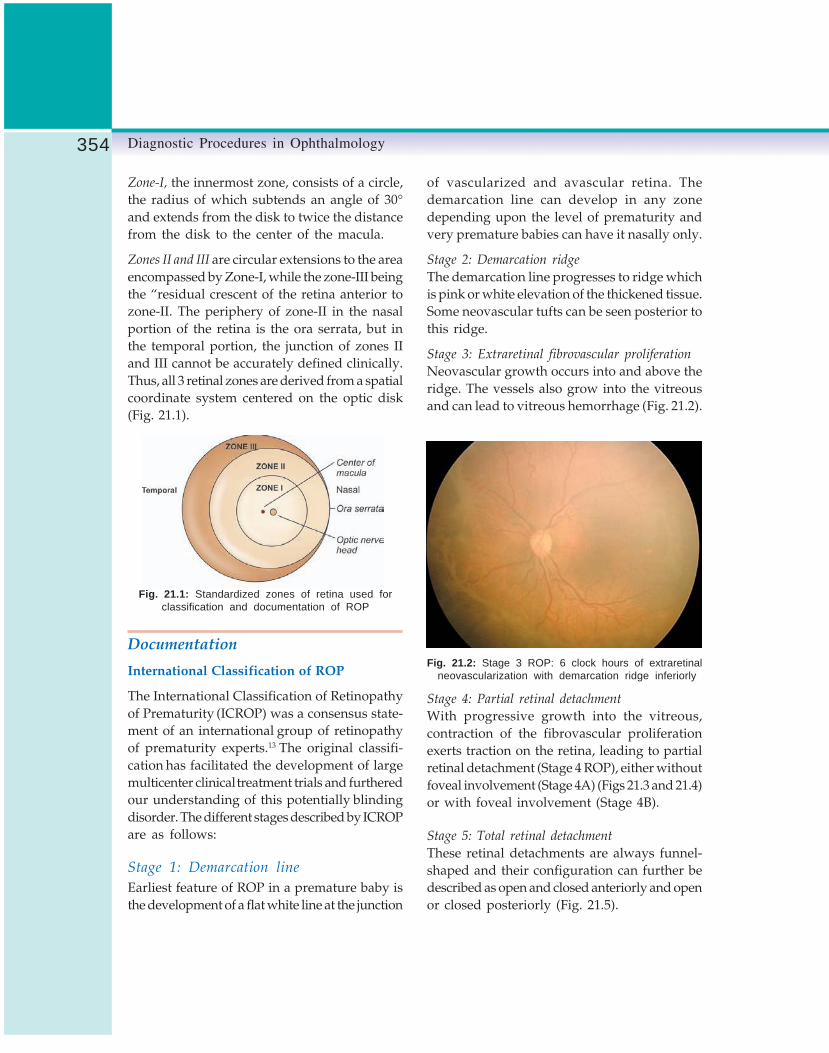
354 Diagnostic Procedures in Ophthalmology
Zone-I, the innermost zone, consists of a circle,the radius of which subtends an angle of 30°and extends from the disk to twice the distancefrom the disk to the center of the macula.
Zones II and III are circular extensions to the areaencompassed by Zone-I, while the zone-III beingthe “residual crescent of the retina anterior tozone-II. The periphery of zone-II in the nasalportion of the retina is the ora serrata, but inthe temporal portion, the junction of zones IIand III cannot be accurately defined clinically.Thus, all 3 retinal zones are derived from a spatialcoordinate system centered on the optic disk(Fig. 21.1).
Fig. 21.1: Standardized zones of retina used forclassification and documentation of ROP
Documentation
International Classification of ROP
The International Classification of Retinopathyof Prematurity (ICROP) was a consensus state-ment of an international group of retinopathyof prematurity experts.13 The original classifi-cation has facilitated the development of largemulticenter clinical treatment trials and furtheredour understanding of this potentially blindingdisorder. The different stages described by ICROPare as follows:
Stage 1: Demarcation line
Earliest feature of ROP in a premature baby isthe development of a flat white line at the junction
of vascularized and avascular retina. Thedemarcation line can develop in any zonedepending upon the level of prematurity andvery premature babies can have it nasally only.
Stage 2: Demarcation ridge
The demarcation line progresses to ridge whichis pink or white elevation of the thickened tissue.Some neovascular tufts can be seen posterior tothis ridge.
Stage 3: Extraretinal fibrovascular proliferation
Neovascular growth occurs into and above theridge. The vessels also grow into the vitreousand can lead to vitreous hemorrhage (Fig. 21.2).
Fig. 21.2: Stage 3 ROP: 6 clock hours of extraretinalneovascularization with demarcation ridge inferiorly
Stage 4: Partial retinal detachment
With progressive growth into the vitreous,contraction of the fibrovascular proliferationexerts traction on the retina, leading to partialretinal detachment (Stage 4 ROP), either withoutfoveal involvement (Stage 4A) (Figs 21.3 and 21.4)or with foveal involvement (Stage 4B).
Stage 5: Total retinal detachment
These retinal detachments are always funnel-shaped and their configuration can further bedescribed as open and closed anteriorly and openor closed posteriorly (Fig. 21.5).

355Retinopathy of Prematurity: Diagnostic Procedures and Management
Fig. 21.3: Early Stage 4A ROP: Traction along theridge with peripheral retinal detachment
Fig. 21.4: Stage 4A ROP: Tractional retinaldetachment not involving macula
Fig. 21.5: Stage 5 ROP: Total retinal detachmentwith white reflex
Plus Disease and Rush Disease
Plus disease is defined as dilated and tortuousblood vessels at posterior pole along withpupillary rigidity and media haziness (Fig. 21.6).
Rush disease is defined as rapid progressionthrough the three stages of ROP, with plus diseaseand retinal detachment occurring within a fewweeks.14 It often occurs in the zone-I and thesmallest babies are frequently affected. Failures oftreatment are highest in this group and hence sucheyes need prompt and aggressive management.
Recently, an international group of pediatricophthalmologists and retinal specialists hasdeveloped a consensus document that revisessome aspects of ICROP.15 The aspects that differfrom the original classification includeintroduction of (1) the concept of a more virulentform of retinopathy observed in the tiniest babies(aggressive, posterior ROP), (2) a description ofan intermediate level of plus disease (pre-plus)between normal posterior pole vessels and frankplus disease, and (3) a practical clinical tool forestimating the extent of zone-I.
Threshold ROP (Figs 21.7A and B)
Threshold ROP is defined as Stage 3 + ROP inzone-I or -II occupying at least 5 contiguous clock
Fig. 21.6: Zone-I ROP with plus disease

356 Diagnostic Procedures in Ophthalmology
hours or 8 noncontiguous clock hours of retina.The Cryo-ROP trial found that 62% of theuntreated eyes as compared to 44% of the treatedeyes with threshold ROP progressed tounfavorable outcome5 (Table 21.1).
Prethreshold ROP
Prethreshold ROP is defined as any stage of ROPin zone-I with plus disease and ROP stage 3plus with 3 contiguous or 5 noncontiguous clock
TABLE 21.1: CATEGORIES OF STRUCTURAL OUTCOME5
Favorable
(1) Essentially normal posterior pole (near peripheryand zone-I), including angle of vessels(2) Abnormal angle of major temporal vascular arcadein the posterior pole(3) Macular ectopia(4A) Stage 4A partial retinal detachment, also includingretinoschisis, or fold in the posterior pole (fovea spared)
Unfavorable
(4B) Stage 4B partial retinal detachment, also includingretinoschisis, or fold, all with foveal involvement(4C) View of macula (and presumably patient’s centralvision) blocked owing to partial cataract, partial retrolentalmembrane, or partial corneal opacity due to retinopathyof prematurity (ROP)(5) Stage 5 total retinal detachment, or total retinoschisis,or retrolental membrane (blocking all view of fundus)(5A) Entire view of posterior pole and near peripheryblocked by total cataract or total corneal opacity fromROP.(6) Enucleation for any reason
Unable to grade (UG)Unable to determine (e.g. view impossible because of corneal opacity unrelated to ROP or because of mioticpupil)None of the above (e.g. extreme vascular attenuation and optic atrophy)
hours of involvement of retina in zone-II, butless than threshold stage.
ROP may not progress through all thesestages sequentially. ROP in zone-I frequentlyprogresses to stage 3 without an interveningdemarcation line or ridge. With advancementsin neonatal support and intensive care units andincreasing availability of screening modules moreand more prematures are being diagnosed ROPin zone-I, which progresses at a faster rate andalmost always to threshold stage. Therefore,
Figs 21.7A and B: Threshold ROP. A prelaser and B postlaser ablation
A B

357Retinopathy of Prematurity: Diagnostic Procedures and Management
zone-I eyes and high risk zone- II eyes shouldbe treated earlier. This issue was addressed inthe multicenter study of Early Treatment forRetinopathy of Prematurity (ETROP).6
Comparison between untreated eyes, high riskpre-threshold eyes treated early, and high-riskeyes treated at threshold demonstrated thatretinal ablative therapy is beneficial forpreventing unfavorable outcome.
The ETROP concluded that the earlytreatment can be considered for Type 1 ROPdefined as; (a) Any eye that has any stage ofROP in zone-I with plus disease, (b) Stage 3 ROPin zone-I with or without plus disease and (c)Stage 2 or 3 ROP in zone-II with plus disease.
Screening for ROPThe natural history data from the CRYO-ROPand other studies were combined to answer thequestion of when to begin and concludescreening for acute ROP (Table 21.2).
Screening Procedure
• Screening is best done at Neonatal ICU alongwith trained neonatology staff to monitor vitalparameters during examination.
• Mydriasis can be achieved by 2.5% phenyl-ephrine and 0.5% tropicamide instilled thriceat an interval of 15 mins.
• Instruments required include: 28 D/20 D lens,pediatric scleral depressor, pediatric lid specu-lum (Fig. 21.8) and indirect ophthalmoscope.
• Since examination with lid speculum andscleral depressor is often distressing to theinfant, presence of a pediatrician is extremelyuseful.
• Examination should be carried out withutmost gentleness and minimal possibleillumination. A quick examination of theposterior pole gives impression whether theplus disease is present or not. Screening allalong the 4 major blood vessels in fourquadrants up to the retinal periphery shouldbe carried out.
TABLE 21.2: GUIDELINES FOR SCREENING AND FOLLOW-UP EXAMINATION
Screening criterion • All infants with a birth weight < 1500 gm• All infants born at postmenstrual age of 32 weeks or earlier• All infants weighing between 1500 and 2000 gm requiring supplemental
oxygen, or with an unstable clinical course
First examination By 32 weeks postmenstrual age or 4 weeks chronological age whicheveris earlier
Follow-up 48-72 hours (a) After treating threshold ROP(b) High risk prethreshold ROP (consider treatment if in zone-I)
Weekly (a) Retinal vessels immaturity with vessels ending in zone-I but no ROPin that zone
(b) Low risk prethreshold ROP
Fortnightly (a) Retinal vessels immaturity with vessels ending in zone-II orzone-III but no ROP in that zone
(b) Less than prethreshold ROP in zone-I
Final examination (a) Attainment of 45 weeks post-menstrual age without developmentof ROP
(b) Progression of retinal vascularization into zone-II without previouszone-II ROP
(c) Full vascularization within 1 disk diameter of the ora serrata on twooccasions

358 Diagnostic Procedures in Ophthalmology
RetcamThe Retcam (Fig. 21.9) is a real time wide-angle(120-130 degrees) digital imaging system for
Figs 21.8A to C: The instruments required for screening: A scleral depressor, B speculum,C condensing lens for indirect ophthalmoscope
Fig. 21.9: Retcam
viewing pediatric eyes manufactured by MassieResearch Laboratories, Dublin CA. Retcam fillsthe need for wide-field imaging and is fully digitalenabling efficient assessment and monitoring.Nearly the entire retina is documented with onlyfive images. Real-time imaging display providesimmediate feedback. Inexpensive digital imagestorage eliminates film. One is able to retrieveand manage patient information with built-inimage database and also transmit images tocolleagues. Retcam II is the latest addition tothe series with newer benefits like flat LCD colordisplay, frame by frame video review and 20second video capture especially useful forfluorescein angiography.
Intervention for ROP
Cryotherapy
The most detailed and comprehensive dataregarding the safety and efficacy of ROP wasmade available by the multicenter trial ofCryotherapy for Retinopathy of Prematurity(CRYO-ROP) study.2-5 The study was carried outin 23 centers across USA. CRYO ROP resultsindicated an unfavorable outcome in 25.7% ofthe eyes that received cryotherapy compared with47.4 % of the control eyes. Though the data signifya definite advantage of treatment over notreatment but the rate of 25% blindness is stillvery high.
A B C

359Retinopathy of Prematurity: Diagnostic Procedures and Management
Laser Ablation
Laser treatment applied through laser indirectophthalmoscope (LIO) has become the methodof choice for treatment of threshold and highrisk prethreshold ROP.16-19The cryotherapy is alsoeffective in decreasing the incidence ofunfavorable outcome, but laser has followingadvantages:1. The laser is more precise than cryo in treating
the retina, especially for the areas near theridge and thus reduces the risk of vitreoushemorrhage.20
2. Laser is less painful and allows treatmentunder a topical anesthesia with sedation andmonitoring.
3. Laser leads to lesser dispersion of the retinalpigment epithelial cells and less or nobreakdown of blood-retinal barrier.21
4. Laser photoablation seems to be particularlyeffective for zone-I disease.20 The diode laser(810 nm) has the advantage of being portableso that it can be easily transported to theneonatal intensive care unit.22
The treatment is carried out in presence ofa trained neonatologist, who monitors the infant.An intravenous infusion maintains the hydrationof the infant. Adequate sedation is achieved byadministration of oral sedative one hour priorto the surgery.
The treatment is applied in a near confluentpattern with moderate intensity burns placedhalf burn apart covering the whole avasculararea.16 However, new vessels are not to be treated.The combination of 20 D and 28 D lenses withscleral indentation is utilized to approachdifferent areas. Continuous monitoring by atrained neonatologist is essential during laserablation. Any suspicion of severe apneic episodeshould lead to curtailment of the treatment, whichcan be planned at a later date. It is not infrequentto find large skip areas in the eyes treated bybeginners, so all attempts should be made to
do maximum laser photocoagulation in the entireavascular area. Reevaluation after 48 hours toassess the disease progression and the adequacyof the photocoagulation is most vital. Presenceof plus disease and of skip areas usually guidesthe advisability of the supplementary treatment.The infants showing definite signs of regressionlike disappearance of plus disease can safelybe followed-up after a week. Other infants shouldbe reexamined after 3 days. It is to be stressedthat while more than 90% of cases with ROPwill regress, a significant percentage of caseswill keep progressing despite laser therapy.23
Complications of laser treatment are few. Besidessystemic problems like apneic episodes, ocularside effects include iris atrophy, posteriorsynechiae and cataract.24
Surgical Intervention
Scleral Buckling
The buckling is done for stage 4A ROP. Afterperforming 360-degree limbal peritomy, a bandis passed under the four recti and tied. Indirectophthalmoscopic examination is done to ensureadequate retinal and choroidal perfusion andposition of the buckle. Care should be taken toavoid pulling the band too tight. Within a yearof surgery, the scleral band is divided or removedto permit growth of the globe and orbit. Bucklingdoes reduce the progression of stage 4 to stage5 ROP.25, 26
Vitrectomy
Pars plana vitrectomy is being increasinglyutilized to manage advanced ROP cases.27-31
Although recent reports describe encouraginganatomical results, the functional results havebeen disappointing so far.28, 30 The vitrectomyis usually performed for stage 5 ROP.27 The lenssparing vitrectomy for stage 4a and 4b has also

360 Diagnostic Procedures in Ophthalmology
been reported to result in better outcomes ascompared to scleral buckling.28-31
The entry sites are usually made at the limbus.Most cases require removal of the crystalline lens.A 20-gauge knife is used to make a slit incisionin the dense retrolental membrane and the tissueis dissected away from the retina with scissorsand forceps. Removal of the transvitreal extra-retinal fibrovascular proliferative membrane,which is in the plane of the anterior hyaloidsurface, is effected from the center to peripheral.Retinal troughs and folds are opened.Viscodissection is extremely helpful for thispurpose. At the conclusion, air-fluid exchangeis performed to push the retina further back.
The timing of the intervention is importantfor both anatomical and functional results. Earlyintervention is desirable in terms of visualfunction, but anatomical results were not morefavorable in very young infants. The membranein older infants is thinner, adhesion to the retinais weaker, and active neovascularization isabsent. Membrane removal from the retina iseasier, but visual recovery is poor.
Visual Rehabilitation and ParentalCounseling
Management of ROP involves not only a properfollow-up of neonates with prompt laser ablationat the required stage and/or vitreoretinal surgery,but also a proper refraction including low visionaid assessment. As well, parents need to beeducated about the severity of the disease andto cope with psychosocial issues in childrendisabled due to ROP.
ConclusionROP is becoming a major cause of blindnessamong children worldwide because of theintroduction of the neonatal intensive care
services for preterm and low-birth-weight babies.The future challenge is to make accessible tothese infants laser, cryo or surgical treatment.To conclude, recent surgical advances have madeROP from untreatable to manageable in mostcases. The investigators need to focus onimproving the surgical techniques for stage 4and stage 5 ROP, preventing the prematurityand preventing the development of ROP.
References1. Terry TL. Extreme prematurity and fibroblastic
overgrowth of persistent vascular sheath behindeach crystalline lens. Am J Ophthalmol 1942;25:203-04.
2. Cryotherapy for Retinopathy of PrematurityCooperative Group. Multicenter Trial ofCryotherapy for Retinopathy of Prematurity:preliminary results. Arch Ophthalmol 1988;106:471-79.
3. Cryotherapy for Retinopathy of PrematurityCooperative Group. Multicenter Trial ofCryotherapy for Retinopathy of Prematurity:one-year outcome—structure and function. ArchOphthalmol 1990;108:1408-16.
4. Cryotherapy for Retinopathy of PrematurityCooperative Group. Multicenter Trial ofCryotherapy for Retinopathy of Prematurity:Snellen visual acuity and structural outcomeat 5½ years after randomization. Arch Ophthalmol1996;114:417-24.
5. Cryotherapy for Retinopathy of PrematurityCooperative Group. Ophthalmologicaloutcomes at 10 years. Arch Ophthalmol 2001;119:1110-18.
6. Early Treatment for Retinopathy of PrematurityCooperative Group. Revised indications for thetreatment of retinopathy of prematurity: resultsof the Early Treatment for Retinopathy ofPrematurity Randomized Trial. Arch Ophthalmol121:1684-96.
7. Darlow BA, Horwood LJ. Retinopathy ofprematurity: risk factors in a prospectivepopulation-based study. Paediatr PerinatEpidemiol 1992,6:62-80.

361Retinopathy of Prematurity: Diagnostic Procedures and Management
8. Flynn JT, Bancalari E, Snyder ES, et al. A cohortstudy of transcutaneous oxygen tension andthe incidence and severity of retinopathy ofprematurity. N Engl J Med 1992;326:1050-54.
9. Hammer ME, Mullen PW. Logistic analysis ofrisk factors in acute retinopathy of prematurity.Am J Ophthalmol 1986;102:1-6.
10. Palmer EA, Flynn JT, Hardy RJ, et al. Incidenceand early course of retinopathy of prematurity.Ophthalmology 1991;98:1628-40.
11. Schaffer DB, Palmer EA, Plotsky DF, et al.Prognostic factors in the natural course ofretinopathy of prematurity. Ophthalmology1993;100:230-37.
12. Shohat M, Reisner SH, Krikler R, et al.Retinopathy of prematurity: incidence and riskfactors. Pediatrics 1983;72:159-63.
13. The Committee for the Classification ofRetinopathy of Prematurity. An InternationalClassification of Retinopathy of Prematurity.Arch Ophthalmol 1984;102:1130-34.
14. Pierce E, Peterson R, Smith L. Retinopathy ofprematurity. In: Principles and Practice ofOphthalmology. Jakobiec A. (Ed). WB Saunders,Philadelphia, PA 2000;4443-59.
15. An International Committee for theClassification of Retinopathy of Prematurity.The International Classification of Retinopathyof Prematurity Revisited. Arch Ophthalmol2005;123:991-99.
16. Fallaha N, Lynn MJ, Aaberg TM Jr, LambertSR, Clinical Outcome of Confluent LaserPhotoablation for Retinopathy of Prematurity.J AAPOS 2002;6:81-85.
17. Paysse EA, Lindsey JL, Coats DK, Contant CF,Steinkuller PG. Therapeutic outcomes ofcryotherapy versus transpupillary diode laserphotocoagulation for threshold retinopathy ofprematurity. J AAPOS 1999;3:234-40.
18. Connolly BP, McNamara A, Regillo CD, TasmanW, Sharma S. Visual outcomes after laserphotocoagulation for threshold retinopathy ofprematurity. Ophthalmology 1999;106:1734-8.
19. Connolly BP, McNamara A, Sharma S, RegilloCD, Tasman W. A comparison of laserphotocoagulation with trans-scleral cryotherapyin the treatment of threshold retinopathy ofprematurity. Ophthalmology 1998;105:1628-31.
20. Hammer ME, Pusateri TJ, Hess JB, Sosa R,Stromquist C. Threshold retinopathy ofprematurity.Transition from cryotherapy to lasertreatment. Retina 1995;15:486-89.
21. Hunter DG, Repka MX. Diode laserphotocoagulation for threshold retinopathy ofprematurity. Ophthalmology 1993;100:238-44.
22. McNamara JA. Laser treatment for retinopathyof prematurity. Curr Opin Ophthalmol 1993,4:76-80.
23. Hartnett ME, McColm JR. Retinal featurespredictive of progressive stage 4 retinopathyof prematurity. Retina 2004;24(2):237-41.
24. Ibarra MS, Capone A Jr. Retinopathy of pre-maturity and anterior segment complications.Ophthalmol Clin North Am 2004;17(4):577-82.
25. Chuang YC, Yang CM. Scleral buckling for stage4 retinopathy of prematurity. Ophthalmic SurgLasers 2000;31(5):374-79.
26. Noorily SW, Small K, de Juan E Jr, MachemerR. Scleral buckling surgery for stage 4Bretinopathy of prematurity. Ophthalmology 1992;99(2):263-68.
27. Gopal L, Sharma T, Shanmugam M, BadrinathSS, Sharma A, Agraharam SG, Choudhary A.Surgery for stage 5 retinopathy of prematurity:the learning curve and evolving technique. IndianJ Ophthalmol 2000;48(2):101-06.
28. Seaber JH, Machemer R, Eliott D, Buckley EG,deJuan E, Martin DF. Long-term visual resultsof children after initially successful vitrectomyfor stage V retinopathy of prematurity.Ophthalmology 1995;102(2):199-204.
29. Hartnett ME, Maguluri S, Thompson HW,McColm JR. Comparison of retinal outcomesafter scleral buckle or lens-sparing vitrectomyfor stage 4 retinopathy of prematurity. Retina2004;24(5):753-57.
30. Prenner JL, Capone A Jr, Trese MT. Visualoutcomes after lens-sparing vitrectomy for stage4A retinopathy of prematurity. Ophthalmology2004;111(12):2271-73.
31. Hubbard GB, Cherwick DH, Burian G. Lens-sparing vitrectomy for stage 4 retinopathy ofprematurity. Ophthalmology 2004; 111(12): 2274-77.
362 Diagnostic Procedures in Ophthalmology
AMIT NAGPAL, LINGAM GOPAL
Localization ofIntraocular
Foreign Body22Intraocular foreign body (IOFB) is defined as anintraocular retained unintentional projectile. Ofall open globe injuries, 18-41% harbor IOFB.1
Most of such injuries occur in the 20-40 yearsage group. 2 This being the most productive age,the effect on the economy is significant. The mostcommon type of injury associated with IOFB ismetal on metal injury exemplified by hammeringactivity (60-80%).3-5 Power machine toolscontribute to 18-25% of IOFBs and weaponrelated injuries contribute to about 19%.3-5
Seventy to 90% of IOFBs are metallic and 80%of these are magnetic which has a significantbearing on the management and the ease withwhich the FB can be extracted from the eye.
Types of Intraocular ForeignBodiesAs alluded to, IOFBs can be broadly groupedunder metallic and non-metallic. Metallic foreignbodies can be magnetic such as iron and someof its alloys and non- magnetic. Among the non-magnetic foreign bodies the most important arelead foreign bodies seen in bullet injuries. Brassand other metal pieces can be seen in explosiveinjuries such as bomb blasts. Glass forms the
most frequently encountered non-metallic foreignbody. Other non-metallic foreign bodies includewooden pieces classically seen with broomstick,and caterpillar hair.
History of InjuryHistory can guide the clinician as to the possibilityof the IOFB being present in a given eye andas well as the type of IOFB. From the managementperspective, it is important to note the type ofinstrument or tool being used at time of the injury.In cases of metal on metal, the identity of theIOFB is fairly certain. Injuries in a rural set upare likely to be due to thorn and plant twigsand could be associated with high incidence offungal infection. The findings of the surgeon whoexamines the patient immediately after the injurywould be very important because subsequentlyvisualization of the fundus becomes difficult dueto hazy media.
Slit-lamp ExaminationThorough slit-lamp examination can provide veryuseful information.

363Localization of Intraocular Foreign Body
Cornea
Corneal entry wound can often be made outeasily. However, fine linear corneal scars canbe missed unless one looks for them carefully.The size of the corneal wound is usually smallerthan the foreign body since the foreign bodytraveling at a high velocity is able to stretch theelastic tissues. Presence of localized cornealedema especially inferiorly can be indicative offoreign body lying at 6 o’clock angle.
Iris
Presence of iris hole is a very important clueto the presence of the IOFB. The relationshipbetween the location of the iris hole and thecorneal scar also indicates the direction in whichthe foreign body was traveling. Iris hole can behidden under a dense arcus senilis. Presenceof siderosis bulbi may be evident on slit-lampexamination of the iris and lens. The rustybrownish hue is striking.
Lens
Presence of a track of foreign body in the lenscan be seen occasionally. However, in most caseslens opacity rapidly becomes total. Intactnessof posterior capsule can be assessed sometimeclinically and if not possible by slit-lampexamination, then the ultrasound evaluation isrecommended. If the vitreous is perceived to beclear and posterior capsule is intact despite lensinjury, one can presume that the FB is locatedin the anterior segment. On occasions, foreignbody can traverse across the zonule of the lenswithout disrupting the lens. Hence cornealwound with presence of intact posterior capsuledoes not necessarily exclude the possibility ofposterior segment foreign body. Intralenticularforeign body can be obvious on slit-lampexamination.
Caveats
1. Glass IOFB in anterior chamber can beparticularly difficult to see even on slit-lampexamination.
2. Gonioscopy may be the only way to identifya small foreign body in the angle.
3. Foreign body located in the ciliary body areais difficult to identify by both slit-lampevaluation and fundus examination.
Fundus ExaminationEvaluation of fundus using indirect ophthalmo-scopy cannot be over emphasized. Since theinjury is likely to produce vitreous hemorrhageand vitritis, the visualization of fundus detailsmay deteriorate very rapidly. Therefore, the initialfundus examination should be as thorough aspossible. The documentation of fundus findingsmade by the first examiner is often valuable forthe subsequent ophthalmologist who may becalled upon to manage the case.
Binocular indirect ophthalmoscopy withscleral indentation may detect IOFB (Fig. 22.1),
Fig. 22.1: Showing a large metal foreign body onthe retina

364 Diagnostic Procedures in Ophthalmology
if the media are clear enough. In delayed cases,the IOFB may be surrounded by fibrous capsuleand could be missed. In case of iron foreignbodies present on the retina for significant periodof time, one may find tell tale signs of localizedsiderosis bulbi. Large glass pieces may evadeclinical detection with ophthalmoscopy if theyare embedded in the peripheral opaque vitreousfollowing vitreous hemorrhage.
Signs in the fundus that may facilitatelocalization of foreign body:1. Vitreous track formed by blood may point
to the location of foreign body2. Intra-retinal hemorrhage may indicate the site
of impaction of foreign body. On occasion,the foreign body may hit the retina andricochet to another location or fall down tothe inferior periphery. Therefore, inferiorperiphery should be inspected carefully ifforeign body is not located elsewhere.
3. Signs of double perforation of globe indicatethe presence of foreign body in the ocularcoats posteriorly or even behind the eye inthe orbit.
Electrical Induction Methods forLocalization of IOFBThe Berman and Roper-Hall localizers are purelyof historic importance. Induction is a physicalphenomenon wherein an alternating currentpassed through a primary coil will induce currentin a secondary circuit. If the voltage in thesecondary circuit is equalized, no current flowsbetween them. If such an instrument approachesa metallic foreign body, a difference in potentialis created in the secondary circuit resulting ina flow of current. Roper-Hall localizer gives audiosignal if foreign body is metallic. A continuoussound is heard for an iron foreign body anda discontinuous sound for a nonferrous metalforeign body. The instrument is provided with
two probes that can be used intraoperatively bycovering them with sterile sleeves. One probehas higher penetrance and is used to grosslylocate the foreign body to a quadrant. The secondprobe is more sensitive for precise localization.6
UltrasonographyA combined B- and vector A-scan is the easiestway of evaluating the eye for presence of IOFB7
(Figs 22.2 and 22.3). A 10 Mega hertz (MHz)probe is routinely employed. A 20 MHz probe
Fig. 22.2: Ultrasound B-scan showing metallic IOFBnear the retinal surface
Fig. 22.3: Ultrasound B-Scan showing large piece ofmetallic IOFB with orbital shadowing
365Localization of Intraocular Foreign Body
can give higher resolution. For anteriorly locatedIOFB, one may have to use immersion scan orstand off or use ultrasound biomicroscopy.
Since the injured eye could potentially havea wound that can open on pressure, theultrasonography should be done very gently. Forthe same reason, ultrasonography is done overclosed lids.
Features
Foreign bodies are characterized by a highechogenecity. They are seen as dense white spotson gray scale display and persist even at lowgain. Depending on the size, reverberating echoesmay also be seen. Metal and stone have a highechogenecity, more than any other normalstructure except bone. Wood and vegetablematters reflect only intermediate amplitudeechoes. Glass gives a high amplitude echoes onlywhen the ultrasound beam strikes the surfaceof the glass with perpendicular incidence.
Caveats
Very large foreign bodies can cause shadowing.Linear glass foreign bodies can sometimesproduce misleadingly low amplitude echoes dueto the ultrasound beam not being perpendicularto the surface of the foreign body. With regardsto foreign bodies in the eye wall, it may be difficultto be certain whether the foreign body is closerto the vitreous cavity or scleral surface. Theshadowing caused by the foreign body will makeit difficult to assess the integrity of the coats ofeyeball. Very anteriorly located foreign bodiesand small foreign bodies entrapped in densevitreous hemorrhage can be missed by routineultrasonography. Air bubble in the vitreous cavitycan mimic IOFB due to the high reflectivity.However, air tends to float in the vitreous cavityand hence is located in the nondependentposition irrespective of the position of the head.
Multiple foreign bodies can present bizarre echopatterns. Foreign body with irregular surface cangive the impression of multiple foreign bodies.Organic matter degrades with time and the IOFBcould be difficult to detect.
The injury related damage to the retina,choroid and the vitreous can be detected onultrasonography. One should look for thepresence or absence of choroidal detachment(hemorrhagic or serous), retinal detachment andvitreous detachment. Vitreous incarceration inthe posterior coat of the eye indicates possiblesite of double perforation. In general, echographytends to overestimate the size of an IOFB.
Ultrasound BiomicroscopyUltrasound biomicroscopy (UBM) is a relativelynew investigational modality. Using a 50 MHzprobe, the resolution is increased multifold atthe expense of penetrance. Foreign bodies locatedin the anterior segment can be well imaged withthis modality. Foreign bodies located beyond theposterior capsule of the lens cannot be reachedbecause of the low penetrance. Since theinvestigation can only be done in contact withthe globe, it is obviously contraindicated in eyeswith open globes or precariously approximatedwounds. IOFB such as caterpillar hair can onlybe picked up with UBM.8
Radiological MethodsComputerized tomography has replaced mostof the other radiological methods in theinvestigation of injured eye with suspected IOFB.However, from the historical perspective, thesemethods are reviewed.9
Direct Methodsa. Plain X-ray, true lateral view: The affected
side is towards the film with infraorbital lineat right angles to the film.

366 Diagnostic Procedures in Ophthalmology
b. Plain X-ray, posteroanterior view (PA-Water’sview): The nose-chin position allows goodview of maxillary region since the bonyshadow of petrous temporal bone is excluded.The face is placed against the film with theorbito-mental line tilted at an angle of 15degrees to the horizontal.
Methods Based on RotationalMovements of the Eye
a. Movement of the eye in lateral position:Three exposures are made on the same filmarranged for a true lateral view. With thehead steadily placed, exposures are madewith the eye looking straight, up and down.If the foreign body moves with the eye, threeimages of the foreign body will be seen. Thisis indicative of the presence of foreign bodyin the eye.
b. Use of limbal ring: A metallic ring made ofeither silver or steel of suitable diameter issutured to the limbus. The same procedureas described above is followed for the lateralview. In addition, a posteroanterior view X-ray is also taken. In a perfect true lateral view,the limbal ring is imaged as a straight linecorresponding to the limbus. Three such lineswill be seen corresponding to the threepositions of the eyeball. An outline of the eyecan be drawn using the limbal ring as guide.The location of the foreign body can beidentified with respect to the outline drawn.Movement of the foreign body with respectto the ring movement also gives a clue as tothe location of the foreign body. Theposteroanterior view gives the clock meridianlocation of the foreign body while the lateralview gives the anteroposterior location.Movement of the foreign body with the ringindicates that the FB is within the eyeballwhile if it does not move it is likely to be extra-ocular. There are obviously a lot of fallacies
in the interpretation. A foreign body stuck tothe eye wall is likely to move to the same extentas the ring while one in the vitreous cavityis likely to move more or less than the limbalring. Foreign body in the center of rotationof the eye will not move while a foreign bodyin the extra ocular muscle, although outsidethe eyeball will move with the contraction ofthe extra ocular muscle. Suturing a ring to arecently traumatized eye is not a pleasantprocedure and could be associated with riskof further damage if the globe has precariouslyapproximated wound.
c. Radio opaque markers: Other radio opaquemarkers that have been used are contact lenswith 4 radio opaque dots incorporated in it.
Method Based on Different Angle ofExposure to X-rays
a. Sweet’s method: Using two referencemarkers, one located just in front of the cornea,and the other temporal to it, two exposuresof X-ray are taken from two different direc-tions on the same plate. The superimpositionof the markers on the plate along with theforeign body permits the localization of theforeign body. However, the calculations arecumbersome.
b. Other methods: Similar to Sweet’s methodthere are others methods such as MacKenzie’s method, Dixons’ method, Bromley’smethod, and Mc Rigor’s method. None ofthem are in vogue now.
Use of Contrast Material toDelineate the Globe
This method envisages injection of radio opaquedye into the subTenon’s space with a view todelineate the globe surface and use it as areference to locate the FB. This technique forobvious reasons is obsolete.

367Localization of Intraocular Foreign Body
Computerized Tomographic Scan
Computerized tomographic scan (CT-scan) hasreplaced all other radiological methods forlocalization of IOFB. It is noninvasive and doesnot need placement of any radio opaque markeron or near the injured eye. It images the orbitequally well and hence superior to ultrasono-graphy from that perspective. It enables thelocalization of the foreign body easily in vitreous(Figs 22.4 and 22.5) and very precisely in thecoats of eyeball (Fig. 22.6). Associated damage
Fig. 22.4: CT scan showing a piece of metallic wirewithin the vitreous cavity.
Fig. 22.5: CT-scan showing metallic IOFB within midvitreous cavity
Fig. 22.6: CT-scan showing a metallic IOFB withinthe ocular coats with retinal detachment
to the orbital bones and brain can also beevaluated. Multiple foreign bodies can be easilyidentified. For foreign bodies of more than 0.06cu mm in size, the sensitivity is 100%.10 However,soft tissue details inside the eye cannot be seenwell. For detecting small IOFBs, high-resolutionscans with overlapping slices are needed.Wooden foreign bodies are not easily imagedby CT scan.
Magnetic Resonance Imaging (MRI)In general, magnetic resonance imaging (MRI)is not indicated in detection of IOFBs. In thepresence of magnetic IOFB it can be positivelyharmful. The application of powerful magneticfield can move the magnetic IOFB and damagethe intraocular structures.11 However, woodenIOFBs are best picked up on MRI.
References1. Shock JP, Adams D. Long-term visual acuity
results after penetrating and perforating injuries.Am J Ophthalmol 1985;100:714-18.
2. Punnonen E, Laatikainen L. Prognosis ofperforating eye injuries with foreign bodies.Acta Ophthalmol 1989;66:483-91.
3. Roper-Hall MJ. Review of 555 cases of intraocularforeign bodies with special reference to theprognosis. Br J Ophthalmol 1954;38:65-99.

368 Diagnostic Procedures in Ophthalmology
4. Williams DF, Mieler WF, Abrams GW, LewisH. Results and prognostic factors in penetratingocular injuries with retained intraocular foreignbodies. Ophthalmology 1988;95:911-16.
5. Percival SPB. A decade of intraocular foreignbodies. Br J Ophthalmol 1972;56:454-61.
6. Duke-Elder S. System of ophthalmology vol14 Part I- Mechanical injuries. Intraocular foreignbodies. Henry Kimpton. London 1972;570-72.
7. Bhende M , Gopal S, Gogi A, Sharma T, GopalL, Lekha G, Sen P, Menon S. In The SankaraNethralaya Atlas of Ophthalmic Ultrasound.New Delhi: Jaypee Brothers Medical Publishers,2006;61-68.
8. Bhende M, Biswas J, Sharma T, Chopra SK,
Gopal L. Ultrasound biomicroscopy in thediagnosis and management of pars planitiscaused by cater pillar hairs. Am J Ophthalmol2000;130:125-26.
9. Duke-Elder S. System of ophthalmology vol14 Part I- Mechanical injuries. Intraocular foreignbodies. Henry Kimpton. London 1972;579-611.
10. Chacko JG, Figueroa RE, Johnson MH, MarcusDM, Brooks SE. Detection and localization ofsteel intraocular foreign bodies using computedtomography. Ophthalmology 1997;104:319-23.
11. Ta CN, Bowman RW. Hyphema caused by ametallic intraocular foreign body duringmagnetic resonance imaging. Am J Ophthalmol2000;129:533-34.

369Comitant Strabismus: Diagnostic Methods
HARINDER SINGH SETHI, PRADEEP SHARMA
ComitantStrabismus:
Diagnostic Methods23IntroductionA strabismus or squint is a misalignment of thetwo eyes when they do not point together towardsthe same object. This may take the form of oneor other eye turning in (convergent strabismus)or out (divergent strabismus). Occasionally, oneeye may be higher than the other (verticalstrabismus). The strabismus may be constant(present at all times) or occur only intermittently.In a comitant strabismus there is a full rangeof movement of each eye.
Incidence
It is estimated that a strabismus occurs in about 5%of the population. Most strabismus develops in thefirst few years of life with the majority appearingeither in the first or the third year of life.
EtiologyBoth eyes are moved by six muscles and themovements of the two eyes are linked by reflexeswhich are normally fully developed within sixmonths of birth. A strabismus occurs becauseof the failure of these reflexes to develop fullyin early life. In most cases the reason for thisfailure of the reflexes to develop is unclear. Insome cases the development of the strabismus
is related to uncorrected refractive error, traumaand general ill health.
Comitant Strabismus
Comitant strabismus is usually congenital. It isnot associated with diplopia. Extra-ocularmuscles and nerves are often normal. The anglebetween the longitudinal axes of the eyes remainsconstant on testing eye movements. Both eyeshave full movement if tested separately. Thereis excess tone in one muscle compared with itsantagonist resulting in deviation of the eye.
Types of Comitant Strabismus
• Convergent strabismus termed esotropia
• Divergent strabismus termed exotropia
• A and V syndromesThe examination of strabismus requires a few
equipments, a list of essential and desirableequipments is given in the Table 23.1.
Examination of a Case of StrabismusThe examination of a case of strabismus requiresassessment of:1. The motor status2. The sensory status

370 Diagnostic Procedures in Ophthalmology
TABLE 23.1: ESSENTIAL AND DESIRABLE EQUIPMENTS FOR EXAMINATION OF STRABISMUS
Essential equipments
Prism bars: horizontal and vertical prism bars and looseprisms set, at least 30 and 45 prism diopter prismsOccluderFixation targets for distance and near to control theaccommodation as desired, trial set with prisms of1 to 8 pdBagolini’s striated glassesRed and green goggles.Double Maddox rod setSnellen chart with letters and E in rows and a singleletter E chartProtractor with a foot rulerDirect ophthalmoscopeRandot stereotest
Desirable equipments
SynoptophoreHess chart or Lees screenPerimeterIndirect ophthalmoscopeTeller acuity cards with screenHaidinger brushes and after imagesattachment for synoptophoreSpielmann occluder, translucent or one way reflectingOptico Kinetic Nystagmus (OKN) drumVERDigital cameraElectronystagmography and videonystagmographysystem
Examination of Motor Status
The examination of the motor status includes:1. Head posture2. Ocular deviation3. Limitation of movements or the extent of the
versions4. Fusional vergences.
Head Posture
Observation of head posture starts at the firstglance of the patient, as he enters the clinic. Hemust not be made conscious of keen observation.Much of information is lost after the patientbecomes conscious of being examined. Headposture has three components:(a) Chin elevation or depression (vertical),(b) Face turn to right or left side (horizontal) and(c) Head tilt to right or left shoulder (torsional).
These three components at three differentjoints between head and neck may correct themotility disturbances in the three directions. Thepatient prefers a head posture at which the oculardeviation is the least, and image can be fused.Rarely, a head posture which causes the maximaldeviation is chosen so that the peripheral imagecan be easily suppressed or ignored.
Common causes of abnormal head postureare tabulated in Table 23.2.
TABLE 23.2: CAUSES OF ABNORMAL HEADPOSTURE
1. Incomitant strabismus either paralytic, restrictive, ormusculofascial anomalies
2. Comitant strabismus with A and V phenomenon; chinup in a V-exotropia or A-esotropia and chin downin V-esotropia and A-exotropia
3. Nystagmus cases with a null position4. Under corrected glasses with the peripheral stronger
power or a wrong cylinder axis5. One eyed persons6. Homonymous hemianopia
Ocular torticollis is a classic example of anabnormal head posture seen in a patient withcongenital superior oblique palsy who maintainsa binocular vision in spite of the congenital defect.Such cases may present later with their headposture forcibly corrected. An old photographof the patient helps in diagnosing the conditionand rule out a supposedly acute onset. The headposture in a case of left superior oblique (LSO)palsy will present chin depression, face turn tothe right, and head tilt to the right shoulder.For comprehension it is told that LSO being adepressor, chin depression occurs, it being anintorter, a head tilt towards the opposite shoulder

371Comitant Strabismus: Diagnostic Methods
occurs, and a face turn to the right brings theeyes in abduction so that the vertical movementscan be executed by the vertical recti. Head postureensures that the eye is out of the field of actionof the paralytic muscle.
Measurement of Interpupillary Distance
Interpupillary distance (IPD) is the distancebetween pupils of the two eyes. The interpupillarydistance is a very important parameter that cangive information about the craniofacial disorders,a true hypertelorism versus telecanthus andvergence requirement. It is helpful in propercentering of the spectacles. Decentered lenseshave prismatic effect and can increase or decreasean existing deviation, or induce a strabismuscausing eye strain. A narrow interpupillarydistance may predispose, simulates andaccentuates esotropia. A wide IPD gives animpression of exotropia.
Interpupillary distance can be measured byfollowing methods:
By an ordinary millimeter scale: A 15 mm rule isrequired to measure the IPD. The patient is seatedwith the examiner positioned about 33 cm infront, both in the same vertical plane. Themillimeter rule is placed on the nasal bridge ofthe patient in the spectacle plane. The examinercloses his right eye and asks the patient to lookat his left eye with his right eye (left eye maybe closed). The scale reading bisecting the pupilis aligned to one. Next the right eye of the patientis covered and the patient asked to look at theexaminer’s right eye with his left eye. Again thescale reading bisecting the pupil of left eye ofthe patient is taken. The difference between thetwo readings gives the IPD.
It is better to note the scale reading alignedwith the midline of the patient. This gives thepupillary distance of each eye from the midlineand helps in detecting asymmetry of the face.
An asymmetric face requires an asymmetricadjustment of the optical centers of the spectacle.The IPD should also be similarly measured withthe patient looking at the distant target (6 m).There may be slight (2-3 mm) difference betweenthe near and distance measurements.
Using the Pulzone-Hardy rule
Pulzone-Hardy rule is a special device formeasuring the pupillary distance of each eye.It has a slot for the nose and the central lineis aligned with the midline of the patient. Withthe patient and examiner seated as in the abovemethod, with the left eye occluded the patientfixates with his right eye at the examiner’s lefteye. The vertical wire is moved till it bisects thepupil. The reading is taken (half IPD). Similarlythe left half IPD is taken. Add the two whichgives the interpupillary distance. Differencebetween the two readings indicates asymmetry.
Using the synoptophore
The IPD can be simply determined on thesynoptophore. It is considered a first step beforethe synoptophore can be used for any measure-ment. This is done by adjusting the distancebetween the two eye pieces each of which canbe separately adjusted and the distance betweenthe two read on a millimeter scale.
The arms of the synoptophore are kept atzero and the patient is asked to look at the centerof the slide in the right picture tube with hisright eye. The examiner with his right eye closed,aligns the central white line on the top of mirrorunit of the tube with the reflection of the lightin the center of patient’s pupil. The procedureis repeated with the left eye of the patient similarlyand the IPD read from the millimeter scale. Onceset, it is locked for the different procedures forthe patient.
Ocular Deviation
The examination of ocular deviation is the mostimportant aspect of strabismus examination as

372 Diagnostic Procedures in Ophthalmology
it not only establishes strabismus but alsoquantifies it. Further it is very important todifferentiate the true strabismus from the apparentstrabismus, i.e. pseudostrabismus whichneeds only reassurance to the patient. A covertest is required to establish the existence of astrabismus.
PseudostrabismusA true strabismus is a misalignment of the twovisual axes, so that both do not meet at the pointof regard. An apparent strabismus is just anappearance of strabismus in spite of the alignmentof the two visual axes. Apparent strabismus orpseudostrabismus can be due to an abnormalityof adnexal structures like the lids, canthi or orbits,or due to abnormal relationship between the visualaxis and optical axis of the eyes. A telecanthusor a broad nasal bridge covers the nasal bulbarconjunctiva and gives the appearance of aconvergent strabismus (pseudoesotropia). Thisbecomes more prominent whenever a lateral gazeis attempted, the adducting eye getting coveredby the telecanthal fold. Similarly the epicanthuscovers the nasal bulbar conjunctiva to cause apseudoesotropia. Neonates and young infantsare commonly suspected to have such astrabismus. A proper examination can excludethis and reassure the mothers. A greater inter-orbital separation (hypertelorism) gives theappearance of a divergent strabismus (pseudo-exotropia). On the other hand, euryblepharon,a condition with horizontally large palpebralapertures gives a look of pseudoesotropia.Similarly, a ptosis or lid retraction can masqueradeas a pseudohypotropia and hypertropia,respectively. A ptosis may mask an existinghypotropia or aggravate hypertropia. And atelecanthus may mask an exotropia and highlightan esotropia. These appearances, therefore,assume importance even in a case of strabismusposted for surgery. The patient should be explained
of the consequence of a surgery in advance toavoid any discontentment later.
Angle kappa: Angle kappa is the difference betweenvisual and the optical axis. The visual axis (theline joining the fovea and the target) is not thesame as the optical or geometric axis (the linepassing through the center of the pupil or cornea).They differ normally by about + 5°, that is theeye would appear to be looking 5° out (exotropic)when it looks at any object. This is the nature’smechanism to offset some optical aberrations.The angle kappa gives a look of exotropia inspite of perfect alignment, but it is within ourlimits of acceptance. When it is more than 5°,as in some hyperopes, it causes pseudoexotropia.On the other hand, an angle less than 5° or anegative angle kappa, as in some myopes, causespseudoesotropia. Occasionally, displacement ofthe macula (heterotopia) can occur in someconditions like retinopathy of prematurity, leadingto displacement of the corneal reflection. If onlyone eye is affected, the squinting appearance isaccentuated. Angle kappa can be measured onthe synoptophore with a special slide.
Detection of a strabismus: A cover-uncover test isrequired to confirm the diagnosis of strabismusand to differentiate it from pseudostrabismus.It is necessary to perform this test when thecorneal reflections are unequal, or if the historysuggests a strabismus. It is an objective test whichis a cornerstone of the diagnosis and managementof strabismus. It has two components:1. Observations to be made during covering
(Cover test, Fig. 23.1A) and2. Observations to be made during uncovering
(Cover-uncover test, Fig. 23.1B).
Cover Test
It is important to have a proper fixation target.It should be a figure or letter of size 6/9 of Snellenchart. This is to control the accommodation. A

373Comitant Strabismus: Diagnostic Methods
fixation achieved by a torch light is not desirable.Lang fixation stick which has very small figuresis very useful for young children and reducedSnellen letters or numbers are ideal for the adultsand older children. The fixation distance shouldbe 33 cm for near and 6 meters for distance. Itis important that target for near should be heldslightly below eye level and for distance it shouldbe at eye level to avoid a false impression ofstrabismus. Thirdly an occluder is required andin case of children it is the hand or a thumbwhich can be used to avoid scarring him.
The subject is asked to fixate on the targetat the requisite distance and an observation ismade whether both eyes appear to fixate (noapparent strabismus) and one appears to fixateas the other deviates (apparent strabismus).
Cover test (Observation made during cover test)
The next step is to cover the apparently fixatingeye and observe what happens to the other(apparently deviating) eye. If that moves to takeup fixation, it confirms the presence of a manifestor true squint (heterotropia). If one had used aSpielmann translucent occluder (Fig. 23.2) onewould have observed the eye behind the cover,deviating. However, if both the eyes appear tofixate in the first instance, the examiner attemptsto cover either of the eyes to observe the behavior
of the eyes. If it moves to confirm a heterotropiait would imply a true squint masked byappearance.
Uncover test (Observations made during
uncovering)
The second part, uncover test is helpful inunmasking the latent strabismus (heterophoria)which presents with both eyes appearing to fixatethe target. One of the eyes is covered, which breaksthe fusion, and if there is any heterophoria(tendency for strabismus) the eye behind coverdeviates (in/out/up/down). The examiner thenobserves the behavior of this eye as he removesthe cover. If it remains deviated it confirms alatent strabismus with poor fusion (poor recovery)and if it recovers, the examiner observes the speedof recovery. The speed of recovery indicates the
Figs 23.1A and B: Cover/uncover test: A cover test, B uncover test
Fig. 23.2: Spielmann occluder

374 Diagnostic Procedures in Ophthalmology
strength of fusion and is an important prognosticsign.
Another observation can be that on uncover-ing the eye, the uncovered eye reassumed fixationas the other eye deviates. This indicates thepresence of a strabismus with the “uncovered”eye being dominant. This also indicates that thevisual acuity is unequal in the two eyes. A freealternation of fixation between the two eyesindicates equal vision in the two eyes.
Alternate Cover Test
In the alternate cover test, the eyes are rapidlyand alternately occluded—from one eye to theother and then back again (Fig. 23.3). Thisprocedure causes breakdown of the binocularfusion mechanism and reveals re-fixationmovements of each eye at the moment ofuncovering. The cover/uncover test is lessdissociating than alternate cover test. In theabsence of a manifest strabismus, such astrabismus in fixation implies a latent strabismus.
Prerequisites of Cover-Uncover Test
The cover-uncover test requires the following pre-requisites:1. Ability of both eyes to fixate the target2. Ability of both eyes to have central fixation and
3. Ability of both eyes to have no gross / severemotility defect.The cover-uncover test may be fallacious if
the eye is blind, have markedly subnormal visionor eccentric fixation and limitation of moments.For infants who would not allow an occluderor a hand close to their face, the examiner canuse indirect occlusion test or distant cover test.Here the fixation light or target is obstructed forone eye by an occluder at some distance awayfrom the child
The cover-uncover test helps to confirm a truemanifest or latent strabismus along with its type:exodeviation, esodeviation or vertical deviations.It also indicates the visual dominance or thepresence of amblyopia. It also tells aboutcomitance of the strabismus by comparing theprimary and secondary deviations. Thecharacteristics of strabismus like unilateral orbilateral, constant or alternating can be noted.The variability in strabismus for near anddistance, the effect of accommodation andpatient’s refractive error can also be studied. Thetest can uncover the associated latent nystagmusif any. A cover-uncover test needs to be donein all the nine cardinal positions of gaze, as alsofor near and distance fixation. With experiencethe examiner can detect even small anglestrabismus except microtropia of less than 5 prismdiopter deviation.
Fig. 23.3: Alternate cover test

375Comitant Strabismus: Diagnostic Methods
Measurement of Ocular Deviation
Deviations can be measured by two methods:objective and subjective. Both require thecooperation of the patient. The objective testsdepend on the observations by the examiner ofthe patient’s fixation pattern. This is based onneutralizing the movement of the deviating eyeas it takes up the fixation. Methods based onthis principle requires patient to have foveal orsteady parafoveal fixation. Inherently thesubjective tests are more precise and reveal statusof the sensory system. Tests cannot be done ifthe patient lacks binocular vision, or the abilityto comprehend the directions or express theresponse. The subjective measurement is basedon dissociation of two eyes to induce the maximalangle of deviation or observe the position of theimages on a calibrated scale. Both the tests wouldhave to be used judiciously by the examiner inorder to understand the sensorimotor aspectsof strabismus.
Prism Bar Cover Test
The deviations can be measured whethersubjectively or objectively by various methods.The simple and best way to measure deviationis by using prisms or prism bar (Fig. 23.4) alongwith the cover test known as prism bar cover test
(PBCT). In fact it is the cover-uncover with theaddition of neutralization of deviation by theprisms (Fig. 23.5).
For neutralizing esodeviations, prisms areplaced base out and for exodeviations they areplaced base in. A simple rule to remember is
that apex of the prism should point towardsdeviation. Therefore, in a vertical deviation, baseup prism is used in front of right eye if thereis right hypotropia and base down if there ishypertropia. If there is combination of horizontaland vertical deviations, the prisms are placedhorizontally in front of one eye and verticallyin front of the other eye. For large deviations,a combination of loose prism of 30 or 45 prismdiopter in front of one eye and prism bar in frontof the other eye is used. The plastic prisms areplaced in the frontal position, that is, parallelto the infraorbital margin. But the glass prismsare placed in the Prentice position, that is, theposterior face of the prism is perpendicular tothe line of sight.
It may be reiterated that the fixation distance(both for near and distance), fixation targets (Fig.23.6) and proper dissociation of the two eyesshould be ensured. A hurriedly done test canbe fallacious. An accommodative or fusionalconvergence should be relaxed. The latter bymaking the subject wear occlusion for at least4 hours (even extended up to 24 hours in casesof intermittent exotropia of simulated divergenceexcess type). The accommodative convergenceshould be controlled by making the subject wearhis proper refractive correction for the testFig. 23.4: Prism bar and loose prisms
Fig. 23.5: Prism bar cover test

376 Diagnostic Procedures in Ophthalmology
distance. For near fixation additional readingcorrection may have to be added in cases ofaccommodative esotropia of convergence excesstype.
Following precautions should be taken forprism bar cover test:a. It is essential to prevent fusion by continuous
use of alternate cover test.b. It is essential to control accommodation by
use of an accommodating target.c. Since a high powered prism reduces the
clarity of vision, often impairs fixation if placedin front of an ambylopic eye, therefore, itshould preferably be placed in front of bettereye.
d. Children can cooperate for short time onlyso it is preferable to start with approximatelythe correct prism rather than to work up fromlower strength.
e. In cases with combined vertical andhorizontal strabismus, it is preferable to usesquare prisms as they can be easily heldtogether between thumb and the finger.It is important to understand that the
deviation to be measured is to be static deviationand should be free of the aforementioned dynamicfactors of accommodation and fusion. It is thestatic angle which requires surgical correctionwhereas the dynamic deviation of accommoda-tion should be corrected by glasses.
Prism Bar Under Cover test: Measurement of
Dissociated Vertical Deviations
In patients with dissociated vertical deviations(DVD) the alternate cover test reveals that eacheye turns upward under cover in contrast to thesituation in vertical heterophoria. After removalof the cover, the eye makes a slow downwardmovement to reach the midline, at times evengoing below it, accompanied by incycloduction.The translucent occluder of Spielmann isespecially useful in the diagnosis of this conditionas well as demonstrating it to the patient’s parents.A precise measurement of the vertical excursionsof each eye during DVD is nearly impossiblebecause of its variable nature. An accuratequantitative assessment of DVD may be obtainedprovided visual acuity in each eye is sufficientto visualize the fixation target, using amodification of the prism and cover test. As thepatient focuses on the fixation target at 6 mdistance, the occluder is quickly shifted to thefixating eye, allowing the previously dissociatedand elevated eye to take up fixation. The coveris then returned to the nonfixating eye. As thealternate cover test is continued, increasingamounts of base-down prisms are held underthe occluder infront of the nonfixating eye untilthe downward fixation movement of that eyeis neutralized. The procedure is then repeatedwith the fellow eye fixating.
Effect of high plus or minus glasses on measuring
strabismus deviations
Plus lenses always measure less deviation thanactual, both in esodeviation and exodeviation(base-out effect in eso and base in effect in exo).Minus lenses always measure more deviationthan actual, both in esodeviation and exodevia-tion (base in effect in eso and base out effectin exo).
Measurements
To determine the different aspects of strabismus,deviations can be measured in various ways:
Fig. 23.6: Fixation targets

377Comitant Strabismus: Diagnostic Methods
1. Deviation with distance and near fixationto determine its nature as to whether esotropiais: basic/convergence excess divergenceinsufficiency, and exotropia is: basic/ conver-gence insufficiency /divergence excess.
2. Deviation in nine different cardinal positionsof gaze to determine any incomitance(paralytic, restrictive or spastic).
3. Deviation in up gaze of 25 degree and downgaze of 35 degree for determining A-V patterns.
4. Deviations with right and left eye fixatingalternatively to determine primary andsecondary deviation in case of incomitantstrabismus.
5. Deviations with subjective method and objec-tive method to determine the type of retinalcorrespondence (normal or anomalous).
6. Deviations after prolonged cover to differen-tiate a true divergence excess type from thesimulated divergence excess exotropia as alsoto determine the fully undissociateddeviation.
Examination of Eyes in Nine GazePositions
It is important to measure the ocular deviationsin different gaze positions for diagnosing motilitydefects. Although, except for the down gaze, onedoes not use 35 degree gaze positions physiolo-gically, these are helpful for diagnosis. Theseare, therefore, called diagnostic positions. Justlike the measurements in the primary position,measurements in these peripheral eight positionsare also best done by prism bar cover test, withan accommodative target. Some clinicians preferto use deviometers, which are devices that cangive different fixed/repeatable fixation targetpositions. For near measurements any Lister’sperimeter (Fig. 23.7) or a simple vertical standwith a vertically rotatable arm around a pivot,with the free end carrying the fixation target,
can be used. For distance measurements one mayuse multiple fixed points on the opposite wall.
Alternatively a single fixed target may be usedwith the head being turned to bring the eyesin the desired positions. The deviation of headcan be read on a protactor along with scale. Acephalodeviometer, a calibrated mirror can alsobe used.
Synoptophore
Synoptophore (Fig. 23.8) is a basic orthopticinstrument based on the haploscopic principle.It is also known as amblyoscope (Major,Curpax—Major types), and troposcope. Itconsists of a chin rest and forehead rest withtwo tubes carrying the targets seen through anangled eye piece. The tubes are placed horizon-tally and are movable in the horizontal andvertical planes. The distance between the twotubes can also be adjusted with the subject’sinterpupillary distance (IPD). The targets in thetubes are illuminated slides which can be raisedup or down and also be tilted to test for verticaland torsional deviations. All these adjustmentscan be read on the scales in degrees and prismdiopters. The tube can be locked individually
Fig. 23.7: Lister perimeter

378 Diagnostic Procedures in Ophthalmology
Fig. 23.8: Synoptophore
or both with respect to each other. Theillumination of each target can be increased ordecreased and flashes can be given if desired.Additional devices like Haidinger brushes canbe attached. The targets are placed at a fixeddistance from the eye piece which are of + 6.0D or +6.5 D, so that the targets are at opticalinfinity. This should theoretically not stimulateaccommodation. However, in reality proximalconvergence does come into play distorting thedeviations. This factor has significantly reducedthe applicability of the synoptophore as a reliableinstrument to measure deviations, especiallyhorizontal ones.
Uses of Synoptophore
In cyclovertical strabismus the synoptophore isa useful instrument to measure torsion. It is alsouseful for studying accommodative convergenceand for imparting orthoptic exercises.
The synoptiscope of Curpax-Major is a modi-fication which uses semi-transparent mirrors inplace of opaque mirrors in front of eyes. This
allows the subject to view a distant objectsuperimposed on the targets in slide holders.Another synoptometer Oculus is a modificationwhich allows measurement of deviations in peri-pheral positions with the help of mirrors.
Corneal Reflection Tests
Hirschberg’s test: The test estimates the deviationof corneal light reflex from the center of the pupiland provides a rough measurement of degree ofstrabismus. The corneal reflections, evennormally are not exactly centered, because ofangle kappa, but are symmetrical in the absenceof a strabismus. In case of esodeviation, thecorneal reflection falls more temporally and inexodeviation, reflection falls nasally. Roughly a1 mm shift signifies a 5° deviation (earlier thoughtto be 7°). Thus if the reflex falls on the nasallimbus, the exodeviation is 30° (approximately60 prism diopters). This test can be used ininfants, who are not very co- operative or in casesof eccentric fixation or non-fixation (blind eyes).
Krimsky test: In Krimsky test (or prism reflex test),a prism bar is utilized to quantify the deviationusing the corneal reflection. It is preferable toplace the prism bar on the fixating eye and toneutralize the amount by observing the cornealreflex in the deviating eye (nonfixating).
Synoptophore: A foveal sized slide is placed infront of the fixing eye and the position of thecorneal reflections is noted while the amblyo-scope tubes are both at zero. The tube in frontof the fixing eye is moved along the eye in sucha way that reflection in the squinting eye movesinto the normal position (comparable with thatin other eye). The angle can be recorded in degreeor prism diopter.
Methods using corneal reflections giveapproximate values but are useful when PBCTcannot be done, for e.g. young children,uncooperative patients, patients with poor

379Comitant Strabismus: Diagnostic Methods
fixation, etc. Deviations measuring less than 10prism diopters cannot be measured.
Subjective Tests of Deviation
These tests utilize the subject’s perception of thedeviation. When there is misalignment, the subjectperceives diplopia and the separation betweenthe two images indicates the subjective deviation.This is the diplopia principle. Here the singlephysical location is perceived by the subject astwo perceptual localizations. Diplopia testingwith the red green goggles is based on thisprinciple. Measurement of deviation on Maddoxtangent scale with the help of Maddox rod isalso based on it, Subjective tests can also bedone on the haploscopic principle, where two“physical locations” are used to have one“perceptual localization”. The examples are asdone on synoptophore when tested subjectivelyor the Hess or Lees screen.
Diplopia testing: When red and green glasses areplaced before the right and left eye respectively;they dissociate the two images and are seendouble in cases of strabismus. Esodeviationscause uncrossed diplopia (homonymous diplo-pia) and exodeviations cause crossed diplopia(heteronymous diplopia). In the former the imagefalls on the nasal half of the retina and is projectedon the temporal half of the field, and so is seenuncrossed (same side as the eye). In exodevia-tions the image falls on the temporal retina toproduce crossed diplopia. It is preferable to usean illuminated slit target and to use the slitvertically for charting horizontal deviations andto use it horizontally to chart vertical deviations.A tilt of the image is also better appreciated witha slit target. The test can be done both for nearand distance. For distance one may utilize theMaddox tangent scale or cross, to quantify thedeviation otherwise prisms for deviation are used.The separation between the two images is
recorded for each eye in the nine diagnostic gazepositions. A red filter alone can also be usedbut the dissociation is then not complete as withred and green glasses. The test is very usefulfor diagnosis and follows-up of incomitantstrabismus.
Hess and Lees screen: Here two test objects (twolocations) are shown to the patient but seen byhim as one. The dissociation may be done byred-green glasses as in the Hess screen test (Fig.23.9A) or a mirror septum as in the Lees screen(Fig. 23.9B). The Lancaster red-green test withthe two Foster torches use red-green filters inthe torches and green glasses. Polaroid disso-ciation can also used in order to have a morephysiological dissociation. These haploscopictests are very good for documentation of ocularmuscle paralysis and restrictive conditions.
The Hess chart has a grid pattern where eachsquare represents 5 degree excursion for thefixating eye. Thus the inner square tests for 15
Fig. 23.9A: Hess screen

380 Diagnostic Procedures in Ophthalmology
degree eye movements from the primary position.The outer square (each side is curved inwards)represents 30 degree excursion for the fixing eye.The outer square is usually charted to mildunderaction. The Hess chart is a very good testwhich can document the under or over actionof the extraocular muscles.
Measurement of cyclodeviations: While the objectivetests are difficult, the subjective tests are verygood for measuring cyclodeviations. Diplopiacharting with a slit target is used to make thepatient appreciate the tilt. A horizontal slitappears to be tilted in the opposite direction tothe cyclodeviation in the eye. In case ofexcyclodeviation of the right eye, the tilt isanticlock-wise and in case of incyclodeviationit will be clock-wise.
By using two Maddox rods (Fig. 23.10),preferably one white and the other red, the tiltis neutralized by rotating the Maddox rods inthe requisite direction. The change of axis onthe trial frame can be read to give the actualcyclodeviation. It is known as the double Maddox
rod test. A vertical prism of 5 prism diopter canbe added to create a separation between the twohorizontal lines seen through the Maddox rods.
The synoptophore is a good instrument tomeasure cyclodeviations, the slides can be tiltedto make the patient appreciate straightening of
the torsion in the slides. The slides used shouldhave vertical features or one can use the afterimage slides.
For objective evaluation of the cyclodevia-tions, the indirect ophthalmoscopy and fundusphotography are useful methods. These are goodto semi-quantify the cyclodeviations. Normallythe fovea is located between the two horizontallines, one passing through the center of the diskand the other cutting the lower pole of the disktangentially. The usual location is in the middleof these two horizontal lines, that is, 0.3 diskdiameters below the horizontal line through thecenter of the disk. A difference of 0.25 diskdiameter or more between the two eyes isconsidered abnormal.
Limitations of movements: In addition to measuringthe ocular deviations, it is valuable to note thelimitations of movements. In restrictivestrabismus, the limitation of movements ismarked compared to the ocular deviation whichis small. In contrast, in the incomitant strabismusthe limitation of movement and ocular deviationcollaborate each other. Both the ductions andthe versions should be noted and documented.Usually a subjective assessment is made on ascale of 7 points (+3 to -3) or 9 points (+4 to-4). This is usually helpful in follow-up of cases
Fig. 23.9B: Lees chart Fig. 23.10: Maddox rod

381Comitant Strabismus: Diagnostic Methods
of incomitant strabismus. It should be noted thatdue to variations in the adnexal structures, thesecannot be fool proof method of assessing suchdeviations. Normally adduction is considerednormal when the nasal one-third cornea crossesthe lower punctum. Less than this is consideredto be limited. For abduction to be considerednormal, temporal limbus should touch the lateralcanthus. Vertical movements are difficult to assessdue to palpebral aperture. The overaction of theobliques can be assessed. Mild over action isappreciated only in sursum adduction andmoderate overaction in adduction. If there is ahyper or hypotropia in primary position itsignifies severe overaction.
Grading oblique overactions: Another useful clinicaltest to grade the inferior oblique overaction isby observing the angle the adducting eye makeswith the horizontal line as it elevates and abducts( if overacting ) on lateral version to the oppositeside. It may be noted that in the absence of inferioroblique overaction eye would remain in thehorizontal line. Analogous to this grading thesupererior oblique also can be graded. The angleadducting eye makes with the horizontal as itdepresses and abducts on a lateral version, isnoted (Table 23.3).
Measurement of Vergences
In actual practice the manifestation of astrabismus (heterotropia) only occurs if the latenttendency for the strabismus (heterophoria) is notovercome by the fusional vergences. Themeasurement of vergences is very important, asit determines the capability of the motor systemto cope with an induced misalignment of visualaxes. If these vergence amplitudes are large, evena large angle strabismus remains asymptomatic,and if they are small, or intermittent, even asmall angle strabismus manifests remainssymptomatic.
Vergences are usually tested in the threeplanes:(a) Horizontal vergences: convergence and
divergence(b) Vertical vergences: sursumvergence and
deorsumvergence and(c) Torsional vergences: incyclovergence and
excyclovergence.In principle, to measure the vergences, the
axes are misaligned artificially; and this maybe done with prisms or on the synoptophore.The horizontal and vertical vergences can bemeasured only by prisms in this manner, as theprisms cannot induce a torsional misalignment.
TABLE 23.3: GRADING OF OBLIQUE OVERACTIONS
Inferior oblique overaction Superior oblique overaction
Grade 1+* Up to 20 degree angle with Grade 1+ Up to 15 degree angle with thethe horizontal line horizontal line
Grade 2+ Up to 30 degree angle with Grade 2+ Up to 30 degree angle with thethe horizontal line horizontal line
Grade 3+ Up to 60 degree angle with Grade 3+ Up to 60 degree angle with thethe horizontal line horizontal line
Grade 4+ Up to 90 degree angle with Grade 4+ Up to 90 degree angle with thethe horizontal line horizontal line
* Grade 1 + inferior oblique overaction may not be easily detectable on lateral version and is better appreciatedby only in tertiary position, e.g. levoelevation for right inferior oblique
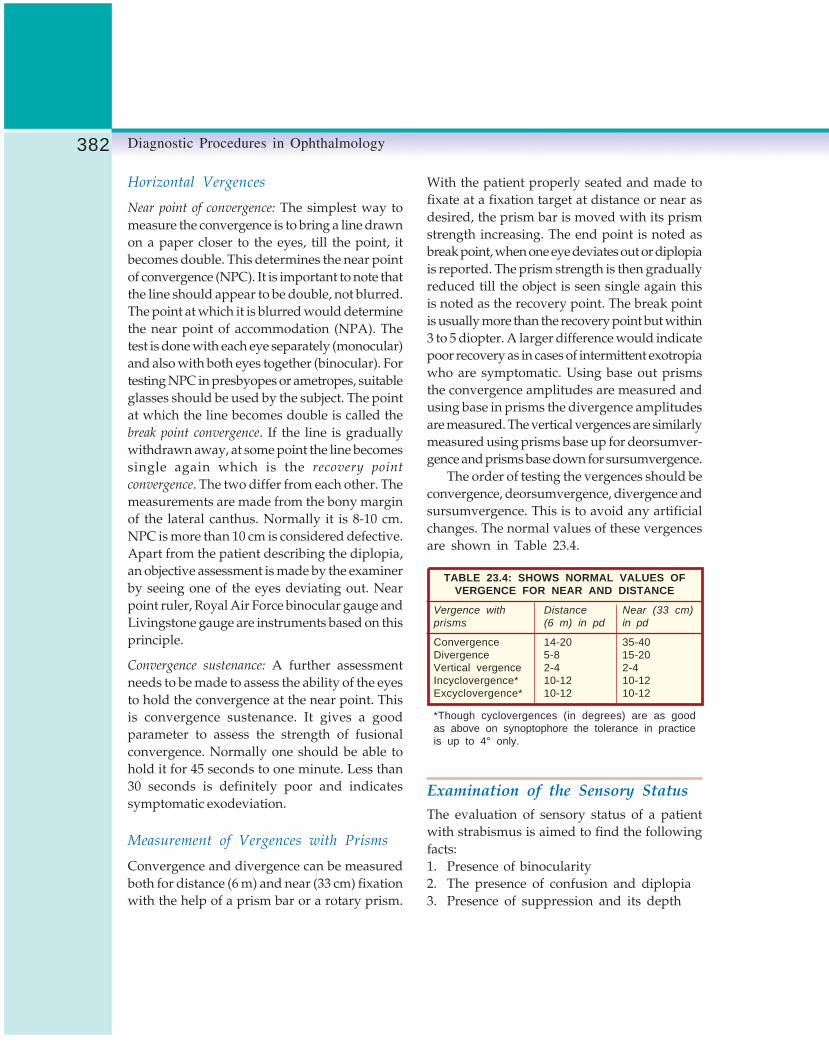
382 Diagnostic Procedures in Ophthalmology
Horizontal Vergences
Near point of convergence: The simplest way tomeasure the convergence is to bring a line drawnon a paper closer to the eyes, till the point, itbecomes double. This determines the near pointof convergence (NPC). It is important to note thatthe line should appear to be double, not blurred.The point at which it is blurred would determinethe near point of accommodation (NPA). Thetest is done with each eye separately (monocular)and also with both eyes together (binocular). Fortesting NPC in presbyopes or ametropes, suitableglasses should be used by the subject. The pointat which the line becomes double is called thebreak point convergence. If the line is graduallywithdrawn away, at some point the line becomessingle again which is the recovery point
convergence. The two differ from each other. Themeasurements are made from the bony marginof the lateral canthus. Normally it is 8-10 cm.NPC is more than 10 cm is considered defective.Apart from the patient describing the diplopia,an objective assessment is made by the examinerby seeing one of the eyes deviating out. Nearpoint ruler, Royal Air Force binocular gauge andLivingstone gauge are instruments based on thisprinciple.
Convergence sustenance: A further assessmentneeds to be made to assess the ability of the eyesto hold the convergence at the near point. Thisis convergence sustenance. It gives a goodparameter to assess the strength of fusionalconvergence. Normally one should be able tohold it for 45 seconds to one minute. Less than30 seconds is definitely poor and indicatessymptomatic exodeviation.
Measurement of Vergences with Prisms
Convergence and divergence can be measuredboth for distance (6 m) and near (33 cm) fixationwith the help of a prism bar or a rotary prism.
With the patient properly seated and made tofixate at a fixation target at distance or near asdesired, the prism bar is moved with its prismstrength increasing. The end point is noted asbreak point, when one eye deviates out or diplopiais reported. The prism strength is then graduallyreduced till the object is seen single again thisis noted as the recovery point. The break pointis usually more than the recovery point but within3 to 5 diopter. A larger difference would indicatepoor recovery as in cases of intermittent exotropiawho are symptomatic. Using base out prismsthe convergence amplitudes are measured andusing base in prisms the divergence amplitudesare measured. The vertical vergences are similarlymeasured using prisms base up for deorsumver-gence and prisms base down for sursumvergence.
The order of testing the vergences should beconvergence, deorsumvergence, divergence andsursumvergence. This is to avoid any artificialchanges. The normal values of these vergencesare shown in Table 23.4.
TABLE 23.4: SHOWS NORMAL VALUES OFVERGENCE FOR NEAR AND DISTANCE
Vergence with Distance Near (33 cm)prisms (6 m) in pd in pd
Convergence 14-20 35-40Divergence 5-8 15-20Vertical vergence 2-4 2-4Incyclovergence* 10-12 10-12Excyclovergence* 10-12 10-12
*Though cyclovergences (in degrees) are as goodas above on synoptophore the tolerance in practiceis up to 4° only.
Examination of the Sensory StatusThe evaluation of sensory status of a patientwith strabismus is aimed to find the followingfacts:1. Presence of binocularity2. The presence of confusion and diplopia3. Presence of suppression and its depth

383Comitant Strabismus: Diagnostic Methods
4. Presence of ambylopia and its degree5. Type of correspondence and6. Presence of stereopsis and its grade.
Binocularity and Diplopia
If binocular diplopia is present, it indicatesbinocularity. The presence of true diplopiashould be established by differentiating it fromfalse impression of diplopia due to blurring orelongation of an image due to astigmatism. Itis necessary to establish binocular nature ofdiplopia by closing one eye. If, it disappears,it is suggestive of binocular diplopia. In long-standing cases of strabismus even of adult onset,patient may learn to ignore the other image. Insuch cases use of dissociating mechanisms likered-green goggles, Bagolini’s glasses, single ordouble Maddox rod are helpful in visualizationof diplopia. In cases of strabismus without diplo-pia or in cases without strabismus, dissociationtest are helpful in detecting the presence ofbinocular perception.
Suppression
Suppression is a sensory adaptation tostrabismus in children, which only occurs whenthe eyes are open. It is a temporary phenomenon.As soon as the fixating eye is covered, deviatedeye takes up the fixation. It occurs from the activecortical inhibition of disparate and confusingretinal images originating from the retina of thedeviating eye. The stimulus for suppression isdiplopia, confusion or a blurred image resultingfrom astigmatism or anisometropia.
Clinically, suppression can be classified intothree types:1. Central or peripheral: In central suppression
the image from the fovea of the deviating eyeis inhibited to avoid confusion, while inperipheral suppression image forming on theperipheral retina is inhibited. Fig. 23.11: Bagolini striated glasses
2. Facultative or obligatory: Facultative suppres-sion occurs only during binocular conditionsand obligatory during monocular conditions.
3. Unilateral or alternating: Unilateral suppres-sion is present in one eye only (unilateral)while in alternating suppression both theeyes are involved or it may alternate betweentwo eyes (alternating).The extent (area) and depth (intensity) of
suppression should be noted. The sensitiveperiod during which suppression may developends after the age of 8-9 years. Once developed,suppression may persist throughout life. If dueto any reason, patient loses the ability to suppressduring adult age, it can never be regained anddiplopia prevails. Such a thing can happen dueto head trauma, spontaneous change of angleof strabismus or due to iatrogenic causes likestrabismus surgery or improper orthoptictreatment.
Tests for Suppression
Bagolini striated glasses: Bagolini striated glassestests is the most physiological test for dissociationof eyes. A pair of striated glasses is used (Figs23.11 and 23.12). The axis of striations of thetwo eyes is kept at right angle to each other,i.e. 45o and 135o. When viewed through theglasses, a point source of light is seen as a linewhich is at right angle to striation. In suppressiontwo types of response can be seen:a. Single line response: If only one line is seen,
it is suggestive of other eye scotoma, i.e.suppression response.

384 Diagnostic Procedures in Ophthalmology
b. Cross response with central gap in one: Itis suggestive of central suppression scotomain that line, i.e. eye.
Interpretation of responses:
1. Symmetrical cross response: If the patient hasno strabismus, it is suggestive of normal bi-foveal correspondence. But if a manifeststrabismus is present, it is indicative of har-monious anomalous retinal correspondence.
2. Asymmetrical cross response: Two linesintersecting each others at some other pointthan midline, indicates an incomitantstrabismus with normal retinal corres-pondence, i.e. diplopia response.
Worth four dot test: In the Worth four dot test(WFDT) eyes are dissociated with red-greengoggles. It is more dissociating and hence lessphysiological as compared to Bagolini glass. Thistest is performed with patient wearing red lensin front of right eye which filters all color exceptred, and green lens in front of left eye whichfilters all colors except green. The patient thenviews a box with four lights which has one red,two green and one white light (Fig. 23.13). Theresult is interpreted as follows:1. Four dots are suggestive of normal retinal
correspondence (NRC) if manifest strabismusis not present. In presence of manifestdeviation it suggests harmonious anomalousretinal correspondence.
Fig. 23.12: Bagolini glasses test: A Crossed response(NRC with no strabismus or harmonious ARC withstrabismus), B Left suppression, C Right suppression,D Crossed response with central scotoma in Right eyeE Esotropic diplopia, F Exotropic diplopia (With right andleft eye lenses at 135 and 45 degrees, respectively)
Fig. 23.13: Worth four dot test: A Four dots: NRC withno strabismus or ARC with strabismus, B Left suppression,C Right suppression, D Binocular diplopia (With red andgreen glasses in front of right and left eye)
2. Five dots (2 vertical red, 3 green in invertedtriangle form) are suggestive of normal retinalcorrespondence with manifest deviation.These five dots are separated differentlydepending on the type of deviation. Theuncrossed pattern with red on right issuggestive of esodeviation, crossed pattern,i.e. red on left side is suggestive of exodevia-tion and if they are vertically displaced, itis suggestive of vertical anomalous retinalcorrespondence.
3. Three dots (green) indicate right suppression.4. Two dots (red) indicate left suppression.
It is performed at 6 meter distance and itsubtends an angle of 1.2 degree. In case of centralscotoma larger than this size, WFDT will not bevisualized. The patient can be brought nearer toWFDT test to increase angle subtended by it.
Synoptophore: The suppression scotoma can bemapped with synoptophore, at least in thehorizontal meridian. One arm is rotated, and thepoints are noted at which the target carried by themoving arm disappears and reappear. Slideswhich present paramacular targets are used.
After image test: After image test demonstratesthe visual direction of the fovea or eccentricfixation point. It is highly dissociating orthoptictest. The right eye is flashed with a vertical brightflash of light and left by a horizontal flash. Aseach eye is stimulated separately, fovea of eacheye or fixation point in eccentric fixation are at

385Comitant Strabismus: Diagnostic Methods
the center of the after images. The patient is thenasked to draw the relative positions of the afterimages (Fig. 23.14). Interpretation of the test isas follows:a. Cross response: If the two after images are
seen as a cross, the patient has normal retinalcorrespondence. This is irrespective of thedeviation of two eyes.
b. Asymmetrical crossing: In this vertical andhorizontal lines have their centers separated.The amount of separation is proportional toangle of anomaly. In case of esotropia withARC, vertical after image (belonging to righteye) will be seen to the left of the horizontalafter image. These findings are reversed inexotropia. A single vertical after image issuggestive of left suppression and a hori-zontal after image is suggestive of rightsuppression.
Measurement of Suppression Scotoma
Suppression scotoma can be charted underbinocular conditions (fixating with one eye, whilethe field of other eye is charted). This can bedone by following methods:
Use of prisms: This is a simple method basedon the patient recognizing diplopia when theimage falls outside the limits of scotoma. Prismsare used to displace the central object peripherallytill it can be visualized in different directions.
Binocular perimetry: The testing apparatus isarranged in such a manner that fixation targetis common to both eyes but the test object is seenonly by the eye under examination. This canbe achieved in following way:a. Lees screen or Hess screen: When one eye
is charted the other eye fixates through mirrorin Lees and red green dissociation in Hesscharting.
b. Two Bjerrum screens at 90o to each other.c. Polaroid scotometer: Using polaroid disso-
ciation while one eye fixates, the field of othereye is charted.Depending upon the test different responses
are observed.i. With more dissociating tests like prisms and
Lees screen single large coarse scotoma isseen, extending from fovea to the diplopiajoint. Some authors have demonstratedhemiretinal scotoma in exodeviations,whereas esodeviations showed morediscreate scotoma.
ii. With less dissociating test like phase diffe-rence haploscope and Polaroid scotometertwo discrete scotomas are seen. These arefoveal scotoma about 2o–3o in size anddiplopia point scotoma. This is seen in bothesodeviation and exodeviation; in exodevia-tion the foveal scotoma showed a verticalstep-like hemiretinal scotoma of Jampolsky.
Depth of Scotoma
Depth of scotoma is measured by using differen-tial stimulation of the two eyes. This can be donewith red filters of increasing density arrangedin ladder pattern (Bagolini’s graded density filterbar). The patient fixates a small target and filtersof increasing density are placed in front of thefixating eye until patient perceives diplopia.Greater the density of filter required to inducediplopia, greater the depth of suppression.
Fig. 23.14: After image test: A Crossed response (NRCwith no strabismus), B Asymmetric cross (ARC withstrabismus, left suppression), C Esotropia, D Exotropia,E Right suppression, F Left suppression diplopia (Withvertical and horizontal flash before right and left eyes,respectively)

386 Diagnostic Procedures in Ophthalmology
Retinal CorrespondenceInvestigation of state of retinal correspondenceis indicated in all cases of constant strabismus.A bifoveal correspondence is called normal retinal
correspondence (NRC). A correspondence betweenfovea of one eye and extrafoveal point of theother eye (deviating eye) is called anomalous retinal
correspondence (ARC). It is an acquired binocularfunctional sensory adaptation to strabismus atthe cortical level. Suppression precedes thedevelopment of ARC. At the cortical level thereis a change in synoptic connections from thefoveo-foveal to the foveo-extrafoveal. Theextrafoveal point should have good visualpotential in order to have an association withthe fovea of the fixing eye.
Following conditions facilitate the develop-ment of ARC:1. Early onset strabismus: a good neural
plasticity is required for the new connections,2. Constant angle of deviation: Constancy of
the stimuli favors development of newconnections and
3. Small angle of deviation especially esodevia-tions and rarely exodeviations: It is rarelyfound in exotropias as they are generallyintermittent or variable due to good fusionalvergence. ARC allows some binocular visionwith limited fusion to be maintained in thepresence of heterotropia.
Diagnosis of ARCIt is necessary to measure the angle of deviationby subjective and objective methods to diagnoseARC. ARC is present when there is differencein the subjective and objective deviations. In NRCobjective and subjective angles are equal. If thesubjective angle is zero, there is no subjectivestrabismus. In the presence of objective angleshowing a strabismus, ARC is termed asharmonious ARC. If the subjective angle is not
zero but less than the objective angle of deviation,it is unharmonious ARC. The difference betweenobjective and subjective angle is the angle ofanomaly. Hence in harmonious ARC, subjectiveangle is zero and objective angle is equal to angleof anomaly. In unharmonious ARC, objectiveangle is greater than subjective angle and henceangle of anomaly. In NRC, objective and subjectiveangles are same and angle of anomaly is zero.
The objective angle of deviation can bemeasured by prism bar cover test (PBCT) or bycover-uncover test, and on the synoptophorewith alternate on-off method. The subjective angleof deviation can be measured by followingmethods:1. After image test2. Synoptophore3. Worth four dot test4. Maddox rod or red filter test5. Polaroid dissociation6. Phase difference haploscope and7. Bagolini’s striated glasses.
Bagolini’s Striated Glasses
The patient with strabismus is first evaluatedwith cover-uncover test and objective angle ismeasured with PBCT. Next with the strabismusmanifested, the patient looks through theBagolini’s striated glasses. If he sees a crossresponse (as seen by person with NRC with nostrabismus) in the presence of manifest stra-bismus it implies a harmonious ARC. If the patientdoes not see a cross response, i.e. X, the prismsare added to get a X cross response. The prismpower required is the subjective angle of deviationand it is termed non-harmonious ARC. Inpresence of strabismus with NRC, patient seestwo oblique lines crossing asymmetrically to forma V or A instead of X response. In the presenceof suppression, patient sees only one line, lineof the other eye which is suppressed is not seen.In case of central scotoma, the eye with the

387Comitant Strabismus: Diagnostic Methods
scotoma sees a line with a break in the center(Fig. 23.12).
Worth’s Four Dot Test
The objective angle is first measured by PBCT.After wearing red green glasses, patient is askedto look at the dots. The prisms are added tillthe patient shows a normal response that is fourdots in a normal rhombic pattern. The strengthof prism indicates subjective angle.
Synoptophore
The objective angle is measured by patientalternately fixing till there is no movement ofeyes on alternate on-off. The subjective angle ismeasured by the patient aligning the two imagesby his perception of simultaneous perceptionslides.
After Image Test
After image test is used to measure subjectiveangle. Each eye is monocularity flashed witha self flash to create a horizontal after imagein right eye and vertical after image in left eye(Fig. 23.14). Each after image is centered at fovea(even in cases of ARC due to central fixation).In case of ARC, patient sees an asymmetric cross.The displacement between the centers of the twoafter images is proportional to the angle ofanomaly (tan θ =displacement/distance oftesting). The angle of anomaly can thus becalculated.
The strabismus can be corrected surgicallyif the appearance warrants it. More extensivesurgery can be performed if there is establishedARC with sensory and motor fusion, thecorrespondence should adapt to the new eyeposition, reducing the risk of consecutivestrabismus. Treatment may not be needed onmany cases of ARC because it may cause
intractable diplopia, bifoveal binocular singlevision cannot be restored and many patients withARC may have useful and symptom-freebinocular single fusion.
AmblyopiaAmblyopia is a condition with unilateral orbilateral decrease of visual functions caused byform vision deprivation and/or abnormalbinocular interaction. It cannot be explained bya disorder of ocular media or visual pathway.It is a condition caused by abnormal visualexperience during early childhood, the criticalperiod of visual development. In appropriatecases it is reversible by therapeutic measures.
Classification of Amblyopia
1. Strabismic amblyopia2. Anisometropic amblyopia (unilateral or
asymmetric)a. Anisohyperopicb. Anisomyopic
3. Form vision deprivation amblyopia (unila-teral or bilateral)a. Stimulus deprivation amblyopia or
amblyopia ex-anopsia, ptosis (coveringpupil), opacities in cornea, lens or vitreous,unilateral occlusion or penalization
b. Ametropic amblyopia (uncorrectedbilateral high refractive error) i. Hyperopiaii. Myopia
iii. Astigmatism (meridional amblyopia)4. Nystagmus related amblyopia5. Organic amblyopia
a. Subclinical macular damageb. Malorientation of conesc. Cone deficiency syndromeAmblyopia is a disorder of visual perception,
only one of which is the visual acuity on the

388 Diagnostic Procedures in Ophthalmology
standard vision charts (Snellen acuity); but thereare other visual functions too that are affected.The amblyopia syndrome shows the followingabnormalities:
1. Decreased visual acuity (Snellen)2. Decreased grating acuity (Teller)3. Decreased vernier acuity4. Decreased or lost stereoacuity5. Decreased contrast sensitivity6. Decreased brightness perception7. Abnormal contour interaction8. Increased perception and reaction times9. Nasotemporal asymmetries in resolution of
vertical gratings and10. Motility defects in pursuit, saccades and
fixation.While the hallmark of amblyopia is decreased
visual acuity, it is important to understand thatrecognition acuity (Snellen or similar charts) ismore affected than either resolution acuity(Teller acuity, Fig. 23.15) or detection acuity(Catford drum or Bailey-Hall cereal test).Secondly the anisometropic and strabismicamblyopes behave differently. The Snellen letteror recognition acuity is affected more in strabismicor mixed (strabismic + anisometropic) amblyopes
compared to anisometropic amblyopes. BothSnellen acuity and grating acuity are affectedequally in anisometropic amblyopes, whereasin strabismic amblyopes the grating acuity isaffected to half the extent of Snellen acuity. Thusstrabismic amblyopia is underestimated ongrating tests.
Diagnosis of Amblyopia
For diagnosis of unilateral amblyopia differenceof vision between two eyes or in case bilateralamblyopia , difference from the age-related normis taken into consideration. Clinically, a differenceof two-line on Snellen chart (one octave difference)is considered significant.
Yet another well recognized feature of stra-bismic amblyopic vision is that it is not degradedby neutral density filters, it may even show someimprovement. However, in anisometropicamblyopes, an equal deterioration is seen inamblyopic and normal eyes. Other organic retinalpathologies causing diminution of vision aresusceptible to deterioration by neutral densityfilters. This test can thus distinguish functionalamblyopia from organic ones.
Abnormal contour interaction is seen in theform of degradation of visual acuity for objectsplaced in a row or line (linear acuity), comparedto the acuity of the same object viewed separately(single letter acuity). This phenomenon has beendescribed as the crowding phenomenon. Crowdingphenomenon is present to some extent even innormal subjects (critical area of separation=1.9to 3.8 min of arc). In amblyopes this is morepronounced, similar to the critical area ofseparation of peripheral retina of normal humansubjects (8.4 to 23.3 min of arc).The crowdingphenomenon has also been attributed to the poorvisual acuity present in amblyopes. But itsimportance in prognosticating progress inamblyopia therapy should be remembered. Thesingle letter acuity improves more rapidly duringFig. 23.15: Teller acuity cards

389Comitant Strabismus: Diagnostic Methods
the course of treatment. Finally both the singleletter and linear acuity should approach eachother, if it is not so there is always a risk ofrecurrence of amblyopia. Children who cannotbe tested with linear charts, single letter,optotypes with “surrounds” can be used to causecontour interaction.
In the normal charting of Snellen vision, highcontrast (80%) letters are used. Abnormal contrastfunctions have been recorded both in strabismicand anisometropic amblyopes, particularly athigh spatial frequencies. At low spatialfrequencies the contrast sensitivity is normal inamblyopes, but at high spatial frequencies thecontrast sensitivity is deteriorated, more so withsevere amblyopia. This is due to a neural lossof foveal function and not due to optical factors,or unsteady fixation movements or eccentricfixation. Contrast sensitivity has been observedto differ in strabismic and anisometropic amblyo-pes. It becomes normal in strabismic amblyopeswhen the luminance levels are reduced, whilethe deficit persists in anisometropic amblyopes.Other psychophysical functions are also affected.Besides the affection of form vision, brightnessperception is also affected in ambylopes. Darkadaptation curves are essentially normal andeven if there is an effect on the light sense, thereis clearly dissociation between the effect on thelight sense and the acuity. While recovery timeafter a glare stimulus to fovea is normal, theperception time and reaction time is 6 timeslonger. The critical flicker fusion frequency (rateat which a flicker just disappears) is usuallynormal compared to maculopathies. Pupils aregenerally normal and briskly reacting thoughafferent pupillary defect and raised edge lightpupil cycle time have been reported.
Stereoacuity
Stereopsis refers to our ability to appreciate depththat is the ability to distinguish the relative
distance of objects with an apparent physicaldisplacement between the objects. It is possibleto appreciate the relative location of objects usingone eye (monocular clues). However, it is thelateral displacement of the eyes that providestwo slightly different views of the same object(disparate images) and allows acute stereoscopicdepth discrimination. Stereoacuity develops andcan be tested on the preferential looking tests(PLT) at 6 months after birth. It has been usedas a screening test for binocular vision anomaliesin preschool children, but with difficulty.Stereopsis is an important binocular clue to depthperception. Stereopsis cannot occur monocularlyand is due to binocular retinal disparity withinPanum’s fusional space. Two objects stimulatedisparate (noncorresponding) retinal pointswithin Panum’s fusional area.
Stereoacuity tests: The real-depth tests are not usedas clinical tests. Most clinical tests are basedon the haploscopic principle, using two dimen-sional or vectographic pictures. Some elementsof the two pictures have a disparity which isfused to create a 3-D image. There are two groupsof clinical tests used to measure stereopsis. Theseare the contour stereotests and the random-dotstereotest. Random-dot stereograms were firstused by Julesz to eliminate monocular clues.As there are no contours, depth perception(stereopsis) can only be appreciated whenbinocular fusion occurs. Two process ofstereopsis are used and these are local and globalstereopsis. Local stereopsis exists to evaluate thetwo horizontally disparate stimuli. This processis sufficient for contour stereotests. Globalstereopsis is required in random-dot stereogramwhen the evaluation and correlation ofcorresponding points and disparate points areneeded over a large retinal area. An exampleof a contour stereotest used in the clinic is TitmusFly stereotest. In the Titmus Fly stereotest,horizontal disparity is presented via the
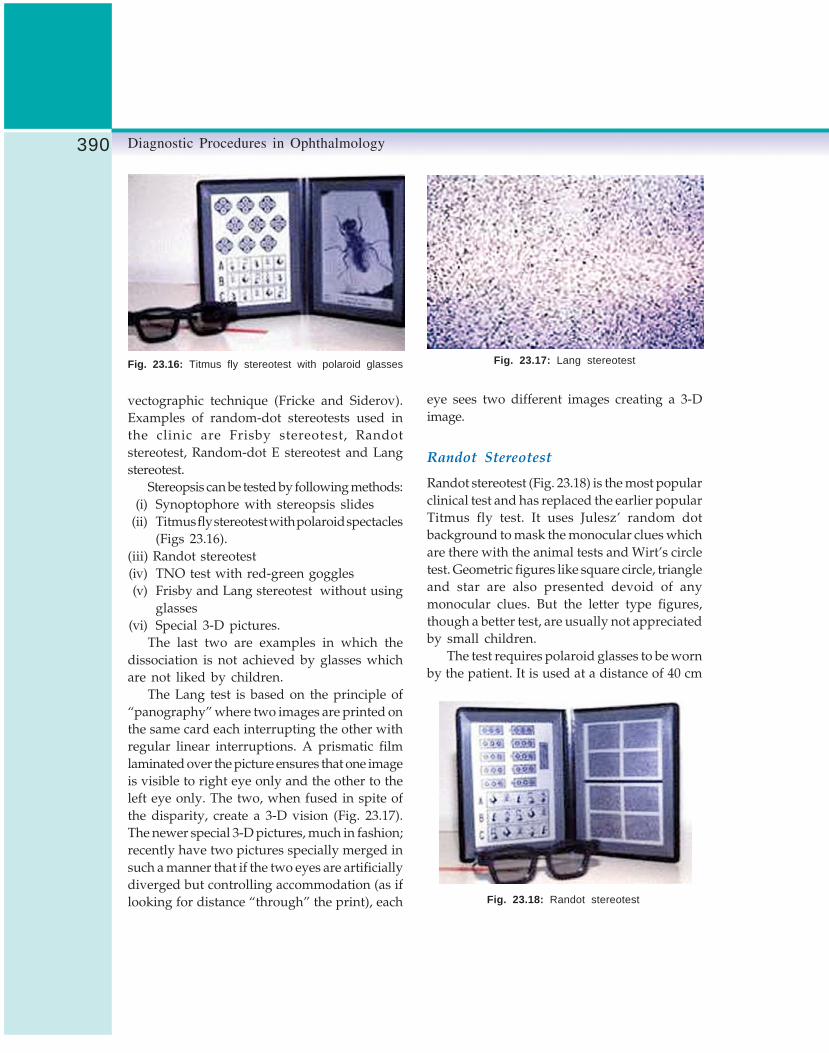
390 Diagnostic Procedures in Ophthalmology
eye sees two different images creating a 3-Dimage.
Randot Stereotest
Randot stereotest (Fig. 23.18) is the most popularclinical test and has replaced the earlier popularTitmus fly test. It uses Julesz’ random dotbackground to mask the monocular clues whichare there with the animal tests and Wirt’s circletest. Geometric figures like square circle, triangleand star are also presented devoid of anymonocular clues. But the letter type figures,though a better test, are usually not appreciatedby small children.
The test requires polaroid glasses to be wornby the patient. It is used at a distance of 40 cm
vectographic technique (Fricke and Siderov).Examples of random-dot stereotests used inthe clinic are Frisby stereotest, Randotstereotest, Random-dot E stereotest and Langstereotest.
Stereopsis can be tested by following methods:(i) Synoptophore with stereopsis slides
(ii) Titmus fly stereotest with polaroid spectacles(Figs 23.16).
(iii) Randot stereotest(iv) TNO test with red-green goggles(v) Frisby and Lang stereotest without using
glasses(vi) Special 3-D pictures.
The last two are examples in which thedissociation is not achieved by glasses whichare not liked by children.
The Lang test is based on the principle of“panography” where two images are printed onthe same card each interrupting the other withregular linear interruptions. A prismatic filmlaminated over the picture ensures that one imageis visible to right eye only and the other to theleft eye only. The two, when fused in spite ofthe disparity, create a 3-D vision (Fig. 23.17).The newer special 3-D pictures, much in fashion;recently have two pictures specially merged insuch a manner that if the two eyes are artificiallydiverged but controlling accommodation (as iflooking for distance “through” the print), each
Fig. 23.16: Titmus fly stereotest with polaroid glasses Fig. 23.17: Lang stereotest
Fig. 23.18: Randot stereotest

391Comitant Strabismus: Diagnostic Methods
and thus tests near binocular vision, therefore,the myopes up to 3 diopters can be missed inthe screening test. The Wirt circles (1-10) testhas the stereoacuity from 400 arc seconds to 20arc seconds.
TNO Test
TNO test (Fig. 23.19) is also based on the random-dot background but uses red-green glasses fordissociation of the two images. It tests stereo-acuity from 480 arc seconds to 15 arc seconds.
Frisby Test
The Frisby stereotest (Fig. 23.20) consists of threeperspex plates of different thickness: 6 mm,3 mm and 1.5 mm.
On one face of each plate are found squares,three of which are filled with a random patternof blue triangles of various sizes and the fourthof which has a central circular area that is notpatterned. On the opposite side of the platecoincident with this area is a circular patternof similar blue triangles. The plate is held infront of a white board and when viewed directly,the squares are all filled with random patternsalthough in one square a binocular viewer willsee a circle standing up from the plate (crosseddisparity) or lying below the rest of the design(uncrossed disparity) depending on which side
of the plate is closest to the observer. By alteringthe thickness of the plate and the distance fromthe subject different stereoacuities can beassessed. For 30 cm viewing distance, the 6 mm,3 mm and 1.5 mm plates represent 600, 300 and150 arc seconds of stereoacuity, respectively. Thisassumes the interpupillary distance of 60 mm,but no significant change is caused by differentIPD.
Distance Stereopsis Tests
Stereoacuity should be tested for distance also.A projection vectographic test or Oculus distancestereotest can be used to test stereopsis fordistance. A diminished stereopsis for distancemay be an early sign of decompensatingexophoria.
Normal Stereoacuity
The adult individuals are capable of apprecia-ting stereopsis with disparities as fine as 15-20 arc seconds. The adult norm is 40 arc seconds.For children, 3-5 years old the norm is 70 arcseconds, and for 5-7 years it is 50 arc seconds.Children above 8 years have the adult norm.
Fig. 23.19: TNO test with red-green glasses
Fig. 23.20: Frisby stereotest

392 Diagnostic Procedures in Ophthalmology
Lang Two Pencil Test
In the absence of fine stereotests a gross estimationof stereopsis can be made by a bedside test, twopencil test popularized by Lang. A pencil is heldin the examiner’s hand horizontally and the childis asked to touch the tip with the tip of anotherpencil rapidly, coming from one side. Care shouldbe taken to avoid giving the end on view of thepencil, as that can be accomplished evenmonocularly, therefore, horizontal pencils arebetter, as they do not allow an end-on view.Always compare the binocular task withmonocular task. The test is a gross stereopsistest of about 400 arc seconds disparity.
All the tests provide a measure of stereoacuityby asking the patient to identify the correct targetthat has stereoscoptic depth (target withdisparity). The working distance and interpupil-lary distance will need to be taken intoconsideration when calculating stereoacuity.Patients with disturbed binocular vision ordifferent refractive error in one eye will performpoorly on depth discrimination tests. A roughestimation of visual acuity has been made onthe basis of stereoacuity.
Fixation Disparity
The concept of fixation disparity is importantto understand the relationship of binocularityand heterophoria. Ogle et al described the fusiondisparity as a physiological sensory pheno-menon occurring in heterophoria, in which adeviation of the visual axes of 6-10 minutes ofarc is compatible with bifoveal binocular singlevision The phoria that is measured afterdisrupting fusion by cover- uncover test or similarmethods is dissociated phoria. Fixation disparityis dependent upon the Panum’s fusional area.Under binocular conditions there may be amisalignment of the fixation points in the twoeyes within the limits of the Panum’s area offusion, which is fused and is seen as one. This
fusible misalignment is fixation disparity (Fig.23.21A). This is quantified in minutes of arc.
Under binocular conditions of viewing avertical line is shown such that the upper halfis seen by right eye and the lower half by theleft eye, each viewed through polaroiddissociation. If there is a misalignment, prismsare used to align the two halves. This is calledassociated phoria. The rest of the picture shownapart from the vertical lines is seen by the twoeyes and function as a fusion lock. The associatedphoria is different from the phoria seen underdissociation and is, therefore, named differently.
Fixation disparity curves: Under forced vergencesituations, using 3, 6, 9, 12 pd prisms base-in,and base-out alternatively, the fixation disparityand the associated phoria can be charted andplotted. These plots are called fixation disparity
curves. There are four common types of fixationdisparity curves (Fig. 23.21B). Individuals withType I curves are frequently asymptomatic. Thoseindividuals having a steep slope, greater than0.77 minute/prism diopter in esophoria and 1.06minutes/prism diopter in exophoria are usuallysymptomatic. Type II curves do not intersect the
Fig. 23.21A: Fixation disparity

393Comitant Strabismus: Diagnostic Methods
fixation targets provides more naturalcircumstances and a fusion lock and are visibleequally by both eyes. The central fixation targetfor vertical associated phoria has half splithorizontal lines, each half visible to the rightor left eye. For horizontal associated phoria, thesplit half lines are vertical. For measuringassociated phoria the adjustment knob (to moveone half line) is kept at zero and prisms are usedto correct the misalignment that is reported bythe patient. Both vertical and horizontalassociated phorias can be measured. Formeasuring fixation disparity, the knob is shiftedto set 10 minutes of exofixation disparity. If thepatient reports misalignment the knob is takento the other end till the patient reportsmisalignment in the reverse direction. Finallythe misalignment is decreased till the patientreports alignment. The viewing time should belimited to a few seconds.
Wesson Card
Wesson card has to be viewed through polaroidglasses (Fig. 23.23). It has vertical lines in theupper half (seen by one eye) and an arrow inthe lower half (seen by the other eye). The restof the card is viewed binocularly.
Fig. 23.21B: The four fixation disparity curve typesdeveloped by Ogle et al. The type of curve dependsupon the curve shape and not on the vertical or horizontalposition of the curve on the graph
X-axis. Type IV curve is associated with unstablebinocularity. The individuals with types II, IIIand IV are usually symptomatic. The flatterportion of the curve represents the condition ofrapid adaptation to the vergence stimuli. Visiontherapy may be considered to successfully flattenthese curves and make the patient asymptomatic.
Forced fixation disparity curves can also beplotted using different spherical lenses (in pre-presbyopes) using lens power + 2.0 D to - 3.0 D in0.5 D or 1.0 D steps. These forced fixation disparitycurves are also used to measure AC/A ratio.Fixation disparity can be measured by Sheedydisparometer, Mallet unit and Wesson card.
Disparometer
A close-up view of the fixation disparity targetson the disparometer is shown in the Figure 23.22.The fine reading print shown adjacent to the
Fig. 23.22: Disparometer for measuring angular amountof fixation disparity, A Front or patient side, B Back orclinician side
A B

394 Diagnostic Procedures in Ophthalmology
Fig. 23.23: Wesson fixation disparity card
Bibliography1. Adelstein FE, Cuppers C. Analysis of the motor
situation in strabismus. In: Arruga A (Ed).International strabismus symposium (universityof Giessen, 1966) New York, S. Karger A.G. 1968;139-48.
2. Bagolini B. Tecnica par L’esame della visionebinoculare sensa introduzone di elimenti dissicianti“test del vetro striato”. Boll Ocul 1958;37:195.
3. Bielschowsky A. Lectures on motor anomalies,Hanover NH. 1943. (reprinted 1956) DartmouthCollege Publications.
4. Bixenmann WW, Noorden GK von. Apparentfoveal displacement in normal subjects and incyclotropia. Ophthalmologica 1982;89:58.
5. Brodie SE. Photographic calibration of theHirschberg test. Invest Ophthalmol Vis Sci 1987;28:736.
6. Broniarczyk-Loba A, Nowakowska O,Laudanska-Olszewska I, Omulecki W. Advance-ments in diagnosis and surgical treatment ofstrabismus in adolescent and adults. Klin Oczna2003;105(6):410-3.
7. Bruckner R. Exakte strabismus diagnostik bei Yz-3 jahrigen, Kindem mit einem einfachen “Durchleuch tungs test” Ophthalmologica 1962;144:184.
8. Burian HM. Normal and anomalous correspon-dence in Allen JH (Ed). Strabismus Ophthalmicsymposium II. St. Louis, Mosby,1958.
9. Capobianco NM. The subjective measurement ofthe near point of convergence and its significance
in the diagnosis of convergence insufficiency. AmOrthopt J 1952;2:40.
10. Fern KD, Manny RE. Visual acuity of the preschoolchild: a review. Am J Optom Physiol Optics1986;63:314-34.
11. Filipovic T, Grzetic R, Sviderek-Stalekar D. Earlierdetection of amblyopia and strabismus byophthalmologic screening card attached to thevaccination card. Can J Ophthalmol 2003; 38(7):587-92.
12. Holmes JM, Fawcett SL. Testing distancestereoacuity with the Frisby-Davis 2 (FD2) test. AmJ Ophthalmol 2005;139(1):193-95.
13. Hussein MA, Coats DK, Muthialu A, Cohen E,Paysse EA. Risk factors for treatment failure ofanisometropic amblyopia. J AAPOS 2004; 8(5):429-34.
14. Kim DS, Coats DK, McCreery KM, Paysse EA,Wilhelmus KR. Accuracy of clinical estimation ofabnormal head postures. Binocul Vis Strabismus Q2004;19(1):21-24.
15. Leske DA, Holmes JM. Maximum angle ofhorizontal strabismus consistent with truestereopsis. J AAPOS 2004;8(1):28-34.
16. Parvataneni M, Christiansen SP, Jensen AA,Summers CG. Referral patterns for commonamblyogenic conditions. J AAPOS 2005; 9(1):22-25.
17. Sharma P. Strabismus Simplified. ModernPublishers, New Delhi 1999.
18. Sokol S. Visually Evoked Potentials: theorytechniques and clinical applications. SurvOphthalmol 1976:21:18.
19 Spielmann A. A translucent occluder to study eyeposition under unilateral or bilateral cover test. AmOrthopt J 1986;36:65.
20. Teller DY, McDonald M, Preston K, Sebris SL.Dobson V. Visual acuity in infants and children:the acuity card procedure. Dev Med Child Neurol1986:28:779.
21. Urist MJ Pseudostrabismus caused by abnormalconfiguration of the upper eyelid margins. Am JOphthalmol 1993;75:455.
22. Veronneau-Troutman S. Prisms in the Medical andSurgical Treatment of Strabismus. St. Louis: Mosby,1994.
23. Von Noorden GK, Campos EC. Binocular Visionand Ocular Motility: Theory and management ofstrabismus. 6th edn, St Louis, Mosby, 2002.
24. Wright KW, Walonker F, Edelman P. 10 dioptrefixation test for amblyopia. Arch Ophthalmol1981;9:1242.

395Incomitant Strabismus
S MEENAKSHI, T SURENDRAN
IncomitantStrabismus24
Incomitant strabismus comprises a large groupof disorders in which the amount of deviationis different in different gaze positions. Broadlythese can be categorized in paralytic andrestrictive or mechanical.
Paralytic strabismus includes:1. Third cranial nerve (Oculomotor nerve) palsy2. Fourth cranial nerve (Trochlear nerve) palsy3. Sixth cranial nerve (Abducens nerve) palsy4. Paralysis of nerve supplying single muscle5. Monocular elevation deficiency6. Monocular depression deficiency and7. Möbius syndrome.
Restrictive strabismus includes:1. Duane’s retraction syndrome2. Orbital blow-out fractures with muscle
entrapment3. Thyroid related strabismus4. Congenital fibrosis and5. Brown’s syndrome.
Following important points must beconsidered while examining a case of incomitantstrabismus:
1. As most of the incomitant strabismus areacquired a detailed history should beobtained about:(a) Trauma to the head and orbit
(b) Previous surgery such as cataract,glaucoma implant and scleral buckle
(c) Treatment for thyroid eye disease.2. Due to the incomitant nature of the strabis-
mus patient may adopt an anomalous headposture for fusion.
3. During duction and version testing, onemust be aware of restrictive and pareticmuscles giving the impression of anoveracting yoke muscle.
4. Primary and secondary deviations shouldbe measured meticulously. Primarydeviation is measured with the prism infront of the affected eye and secondarydeviation, with the prism in front of thenormal eye.
5. Alternate prism cover testing should bedone in all cardinal positions of gaze.
6. Ability of the patient to proper fusion shouldbe ascertained with neutralizing prisms orFresnel prisms for both Snellen and freespace. It is important to ascertain fusionfor both primary and down gaze as theseare the important functional gazes foractivities of daily living.
7. Head tilt measurements are important toassess cyclovertical muscle involvement.

396 Diagnostic Procedures in Ophthalmology
8. The presence of subjective torsion assuspected by subjective complaints of tiltingor seen on diplopia charting may bequantified by the Double Maddox Rod test.The same can also be confirmed by onfundus examination.
9. In office, forced duction and force generationtesting should be carried out when possible,to assess the presence of restrictions anddegree of nerve function preserved.
10. Neuroimaging of the orbits and brain isoften required to make a complete diagnosisand planning appropriate intervention.
11. It is also important to consider myastheniagravis and chronic progressive externalophthalmoplegia in the differentialdiagnosis.
Fig. 24.1: Third cranial nerve palsy
Paralytic Strabismus
Third Cranial Nerve Palsy
The third cranial nerve supplies the levatorpalpebrae superioris, superior rectus, medialrectus, inferior rectus, and inferior oblique.Therefore, the patient with third nerve palsy maypresent with a combination of the followingsymptoms and signs:1. Diplopia: horizontal and vertical2. Ptosis3. Exotropia and hypotropia4. Limited ocular motility in the direction of
action of affected muscles (Fig. 24.1), a partialparesis involving only the superior or inferiordivisions or isolated muscle palsy may alsobe a presentation.

397Incomitant Strabismus
5. Paralysis of the pupillary sphincter withresultant mydriasis or pupil sparing type
6. Long-standing palsy may have aberrantregeneration in the form of ipsilateralretraction of the upper lid on attemptedadduction and/or attempted infraduction, aswell as pupillary constriction.If the pupil is spared the cause is most likely
vascular. When the pupil is involved, the causeis likely to be an aneurysm. Patients withvasculopathy and pupil sparing third nervepalsy should be observed daily for one week,then weekly for one month, and finally monthlyfor six months.
To rule out concurrent superior oblique palsy,patient is asked to attempt adduction and onelooks for incyclotorsion by observing theconjunctival blood vessels.
Etiology
The etiology of third cranial nerve palsy differsin pediatric and adult groups.
Causes of pediatric onset third nerve palsy are:1. Congenital due to birth trauma2. Trauma3. Inflammation4. Neoplasm and5. Aneurysm.
Causes of adult onset third nerve palsy are:1. Aneurysms2. Vascular disease3. Trauma4. Neoplasm5. Ideopathic.
Fourth Cranial Nerve Palsy
The fourth cranial nerve supplies the superioroblique muscle. Fourth nerve palsy is the mostcommon cyclovertical muscle palsy. Patients maypresent with a combination of the followingsymptoms and signs:
1. Head tilt in both congenital and acquiredpalsy
2. Facial asymmetry: The side of the face onthe side of the tilt is often less developed inthe congenital variety. This may be easilyevaluated by looking at old photographs.
3. Torsional diplopia can be assessedsubjectively and objectively.
4. The three-step test is the key to making thediagnosis of isolated cyclovertical musclepalsy. The test requires motility measurementsfirst in the primary position. This step incrimi-nates the depressors of the hypertropic eyeand the elevators of the hypotropic eye. Nextmeasurements are performed in the side gazesand an increase in hypertropia is noted (Fig.24.2). This step eliminates the two musclesthat do not act in the field of gaze showingthe increased hypertropia. The third step,which is the head tilt to either side, exposesthe weakened muscle that is unable to elevatethe eye.
5. Version testing may reveal an ipsilateralinferior oblique overaction, ipsilateral supe-rior oblique underaction and contralateralsuperior oblique overaction due to failure ofthe paretic eye to infraduct well in abductiongiving the impression of overaction.
6. Bilateral superior oblique palsy has someunique features. These include history ofclosed head trauma, subjective torsion,objective torsion more than 10 degrees,alternating hypertropia on head tilts, V-pattern esotropia and a chin-down posture.
EtiologyThe etiology of fourth cranial nerve palsy maybe congenital and acquired.1. Congenital is the commonest cause of fourth
cranial nerve palsy in many series.2. Acquired fourth cranial nerve palsy may be
due to trauma, tumor, aneurysm andiatrogenic.

398 Diagnostic Procedures in Ophthalmology
Fig. 24.2: Fourth cranial nerve palsy
Sixth Cranial Nerve orAbducens Palsy
The sixth cranial nerve supplies the lateral rectusmuscle. The constellation of signs and symptoms,which depend on the severity of the palsy areas follows:
1. Horizontal diplopia2. Face turn is present towards the side of the
paretic muscle. The face turn is present toavoid diplopia and may be subtle.
3. Esophoria is present in primary gaze inmild cases and esotropia with prominenthorizontal incomitance in more severe palsy(Fig. 24.3). The esotropia is typically morefor distance and in bilateral cases there maybe a V-pattern.
4. Absence of vertical deviation.
Etiology
The sixth cranial nerve palsy occurs due toinfection, trauma, neoplasm, systemic vasculardisorders, systemic hematological disorders,intracranial hypertension, raised intracranialpressure, inflammatory disorders and idiopathic.
Principles of Management1. If the cause is vascular or postinfectious, many
patients improve with time. It is prudent towait 3 to 6 months for recovery beforecontemplating surgical intervention.
2. Conservative management options areavailable to tide over during the waitingperiod. Options include monocular occlusion,prisms either ground in or Fresnel to helppatient fuse and carry on with activities ofdaily living.

399Incomitant Strabismus
Fig. 24.3: Sixth cranial nerve palsy
3. Some patients are able to manage with a smallhead posture especially patients with mildsixth nerve palsy.
4. Botulinum toxin A injection into the anta-gonist muscle may prevent contracture andhelp with the recovery of the paretic muscle.
5. Pre-surgical in-office testing includes:a. To assess the amount of residual muscle
function in the paretic muscle. This isdone by assessment of saccades clinicallyor through saccadic velocity testing. Thiscan also be done by the force generationtest.
b. To assess the presence of contracture ofthe antagonist muscle. This is done bythe force duction test.
6. Surgical goals include fusion in primary gazeor with a minimal head posture and cosmesis.
This can be achieved by:a. Weakening the overacting antagonistb. Strengthening the paretic muscle after
ascertaining the residual muscle function.This may be obtained by shortening oflateral rectus muscle in the sixth nervepalsy, or tuck of the superior oblique.
c. If muscle function is very poor one mustconsider transposition procedures suchas Jensen’s or Hummelsheim’s procedure.Full tendon transposition for the lateralrectus palsy and superior obliquetransposition procedures for the thirdnerve palsy are recommended.
Monocular Elevation Deficiency
Formerly named double elevator palsy, theterminology has been changed after studiesshowed that many patients have only superiorrectus palsy without involvement of the inferioroblique.
Etiology
Etiology may be congenital or acquired.Congenital causes include supranuclear defects,primary superior rectus paresis, primary inferiorrectus restriction and inferior rectus restrictionsecondary to superior rectus paresis.
Acquired deficiency may occur due tocerebrovascular disease, tumors, sarcoidosis andinfectious diseases.
Monocular elevation deficiency has followingclinical presentations:1. Unilateral limitation of up gaze above midline
with accompanying ptosis2. Hypotropia3. Limitation of elevation in both abduction and
adduction4. Abnormal head posture in the form of chin
elevation for fusion

400 Diagnostic Procedures in Ophthalmology
5. Pseudoptosis in addition to true ptosis6. Acquired deficiency presents with acute onset
of diplopia in primary position and up gaze.Diagnosis of the etiology is based on certain
clinical features. These include presence of Bell’sphenomenon, saccadic testing below and abovemidline and forced duction testing.
Bell’s phenomenon is present if the causeis supranuclear and absent in the others. Upwardsaccades are normal in inferior rectus restrictionand slowed in supranuclear monocular elevationdeficiency below midline and absent abovemidline. In primary superior rectus paresis, thesaccades are slowed both above and belowmidline. Forced duction testing is positive onlyif inferior rectus is restricted.
A simple approach to management includes:1. Forced duction testing on the table2. If inferior rectus restriction is present then
the muscle is recessed.3. If forced duction test is negative considertransposition procedure such as Knapp’stransposition where the medial and lateral rectusare either split or in their entirety are transposedadjacent to the superior rectus insertion
Möbius Syndrome
A child with Möbius syndrome usually presentsin infancy. The child is brought by the caregiverfor the lack of facial movements while cryingand inability to smile. The child may be unableto close his mouth, may have a prominent upperlip and indistinct speech. No racial, sex predi-lection has been described, and the inheritancepattern is variable.
Clinical Features
The clinical features include congenital facialdiplegia, bilateral abducens nerve palsies andcongenital bilateral incomplete facial palsyresulting in a mask-like face. Nerve, brainstem,
or muscle aplasia is the primary event has notbeen established. Cranial nerves VI to XII maybe involved. This may present as dysphagia,paralysis and hypoplasia of the tongue. Thecranial nerve VIII may be spared and III andIV nerves are rarely involved. However, facialnerves are always involved. The VI nerve isinvolved in 75% of cases while the XII nervein only in minority of cases.
Systemic Findings
Möbius syndrome is associated with congenitaldeformities. The most common deformity isclubfoot. Brachial deformities and pectoralmuscle hypoplasia (Poland anomaly) arecommon. Brachydactyly and syndactyly are alsodescribed. CT or MRI shows calcification in theregion of VI nerve.
Management involves a multidisciplinaryapproach and is primarily cosmetic.
Restrictive Strabismus
Duane’s Retraction Syndrome
Duane’s retraction syndrome (DRS) is acongenital ocular motility disorder characterizedby limitation of abduction or/and adduction,palpebral fissure narrowing on attemptedadduction (Fig. 24.4) due to retraction of globeand upshoot or downshoot on adduction dueto leash effect of tight lateral rectus.
It is postulated that a disturbance in normalembryogenic development causes Duanesyndrome. It is further substantiated by thefrequent associations of the syndrome with ocularanomalies and congenital abnormalities of thefacial, skeletal, and CNS. Agenesis of the sixthnerve or nucleus and innervation of the lateralrectus muscle by the inferior division of thirdnerve nucleus cause simultaneous cocontracture
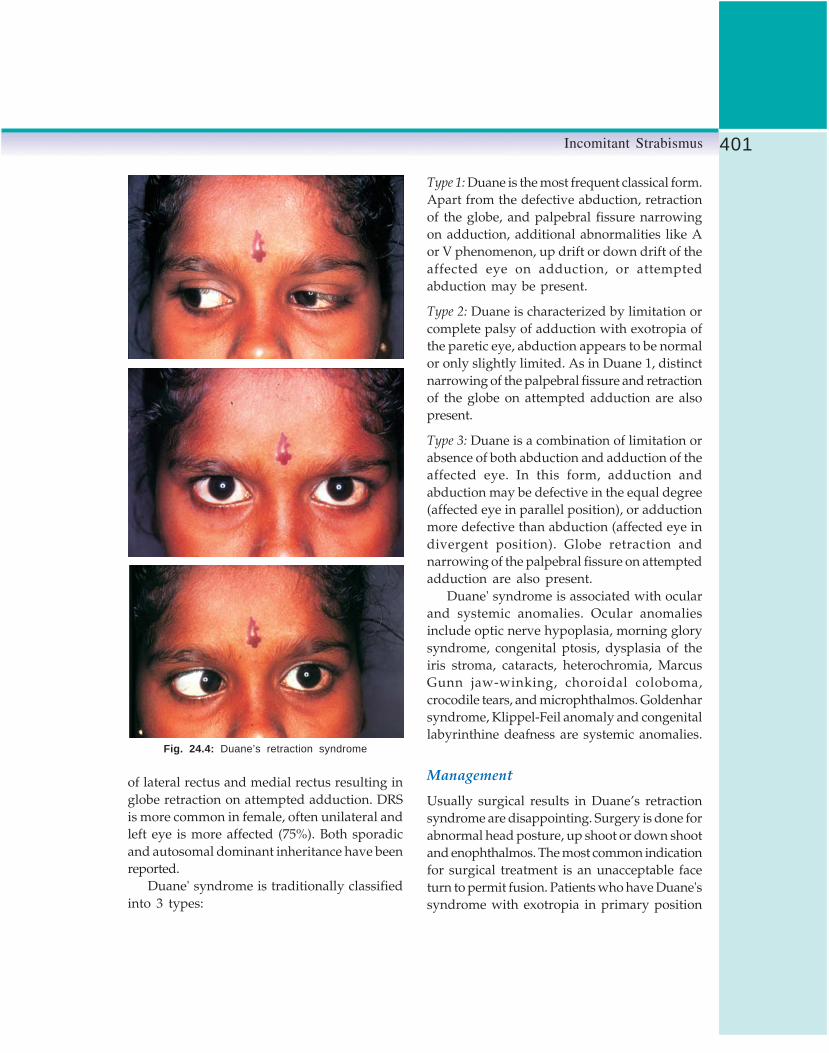
401Incomitant Strabismus
Type 1: Duane is the most frequent classical form.Apart from the defective abduction, retractionof the globe, and palpebral fissure narrowingon adduction, additional abnormalities like Aor V phenomenon, up drift or down drift of theaffected eye on adduction, or attemptedabduction may be present.
Type 2: Duane is characterized by limitation orcomplete palsy of adduction with exotropia ofthe paretic eye, abduction appears to be normalor only slightly limited. As in Duane 1, distinctnarrowing of the palpebral fissure and retractionof the globe on attempted adduction are alsopresent.
Type 3: Duane is a combination of limitation orabsence of both abduction and adduction of theaffected eye. In this form, adduction andabduction may be defective in the equal degree(affected eye in parallel position), or adductionmore defective than abduction (affected eye indivergent position). Globe retraction andnarrowing of the palpebral fissure on attemptedadduction are also present.
Duane' syndrome is associated with ocularand systemic anomalies. Ocular anomaliesinclude optic nerve hypoplasia, morning glorysyndrome, congenital ptosis, dysplasia of theiris stroma, cataracts, heterochromia, MarcusGunn jaw-winking, choroidal coloboma,crocodile tears, and microphthalmos. Goldenharsyndrome, Klippel-Feil anomaly and congenitallabyrinthine deafness are systemic anomalies.
Management
Usually surgical results in Duane’s retractionsyndrome are disappointing. Surgery is done forabnormal head posture, up shoot or down shootand enophthalmos. The most common indicationfor surgical treatment is an unacceptable faceturn to permit fusion. Patients who have Duane'ssyndrome with exotropia in primary position
Fig. 24.4: Duane’s retraction syndrome
of lateral rectus and medial rectus resulting inglobe retraction on attempted adduction. DRSis more common in female, often unilateral andleft eye is more affected (75%). Both sporadicand autosomal dominant inheritance have beenreported.
Duane' syndrome is traditionally classifiedinto 3 types:

402 Diagnostic Procedures in Ophthalmology
usually have a face turn away from the affectedeye. More commonly, an esodeviation in primaryposition leads to a face turn toward the sideof the affected eye. A reduction of 50% or moreof the width of the palpebral fissure duringadduction compared with primary position hasbeen suggested as an indication for surgicaltreatment of the syndrome.
The surgical procedures include medialrectus muscle recession, vertical rectus muscletransposition, lateral rectus muscle recession andposterior fixation suture.
Medial rectus muscle recession: Recession of themedial rectus muscle in the involved eye willalign the eye but will not improve abductionbeyond the primary position. Resection of thelateral rectus muscle is avoided because it willincrease retraction and will not improveabduction. Medial rectus recession alone alsomay improve the enophthalmos and verticalovershoots in adduction, in part by limitingadduction of the eye. For adult patients adjustablesuture recession techniques are helpful.Recession of the contralateral medial rectusmuscle in addition to the ipsilateral medial rectusmuscle may be performed in those cases in whichthe patient has primary position esotropia greaterthan 20 prism diopters.
Vertical rectus muscle transposition: Transpositionof the vertical rectus muscles to a position adjacentto the lateral rectus, with or without recessionof the ipsilateral medial rectus, has beensuggested as a means of correcting the primaryposition esotropia, improving abduction, andenlarging the field of single binocular vision.This procedure probably should be consideredonly as primary treatment for patients withmarked limitation of abduction with minimalretraction, and no up shoot or down shoot.
Lateral rectus muscle recession: Patients may presentwith exodeviation in primary position with a
face turn away from the side of the affected eye.The face turn is treated with recession of theipsilateral lateral rectus muscle. If primaryposition exotropia is present with a marked upshoot or down shoot, a lateral rectus recessionusually is combined with a Y-splitting procedureor a posterior fixation suture. In up shoot ordown shoot, recession of the lateral rectus muscleis effective.
Posterior fixation suture: A posterior fixation sutureon the lateral rectus muscle can effectively preventslippage of the muscle belly over the globe. Itmay be used as an alternative procedure to treatup shoots and down shoots. Simultaneousrecession of both lateral and medial rectus mayhelp with up shoot and down shoot.
Brown’s Syndrome
Brown’s syndrome is a restrictive strabismusmarked by limitation of elevation that is worsewhen the eye is in adduction (Fig. 24.5). It ischaracterized by following features:
1. Limitation of elevation in adduction. Thereis some limitation of elevation in abductionbut the limitation is more marked inadduction.
2. Minimal or no hypotropia in primary gaze3. Minimal or no over action of ipsilateral
superior oblique4. Divergence in upgaze causing Y-pattern5. Limited elevation in abduction can produce
pseudo inferior oblique over action of thefellow eye
6. Intorsion on attempted up gaze7. Compensatory head posture chin elevation
and face turn to keep the affected eye inabduction
8. Good fusion and stereopsis9. In adduction, palpebral fissure widens and
there is a down shoot of the involved eye.10. Forced duction test is positive

403Incomitant Strabismus
Eustin and colleagues graded Brown’ssyndrome into 3 types:1. Mild: Restriction of elevation in adduction,
no hypotropia in primary gaze and no downshoot in adduction
2. Moderate: No hypotropia in primary gazeand down shoot on adduction
3. Severe: Hyportropia in primary gaze, markeddown shoot on adduction and amblyopia,usually patients develop compensatory headposture and have fusion. If the patientpresents with a manifest hypotropia and nocompensatory head posture or haveassociated horizontal strabismus, there isincreased risk of amblyopia.Brown's syndrome is classified into
congenital and acquired forms. The congenitalform is subdivided into true and pseudo.Cysticercosis is an important cause of acquiredBrown’s syndrome.
Differential diagnosis of the syndromeinclude double elevator palsy, blow-out fracture,inferior oblique palsy, superior oblique palsy andDuane’s retraction syndrome.
Treatment
The mild and moderate form of the syndromewithout strabismus in primary position shouldbe left untreated. Visual acuity and binocular
status should be closely monitored in youngchildren. Spontaneous resolution may occur insome cases. Corticosteroids may be beneficial.
In the severe form of the syndrome withhypotropia in primary gaze, surgery is indicated.Other indications for surgery include anomaloushead posture, loss of binocularity in a child andcosmetically unacceptable down shoot inadduction. The surgery is based on the principleof lengthening the superior oblique tendon.Procedures such as tenotomy and tenectomy arenot controlled to achieve a controlled elongationof superior oblique tendon a Wright superioroblique tendon expander can be used.
Congenital Fibrosis of ExtraocularMuscles
It is an autosomal dominant disease affectingthe extraocular muscles. It is characterized byblepharoptosis (Fig. 24.6) and chin elevation,absence of elevation or depression of the globewith eyes fixed 20 to 30 degrees below thehorizontal meridian, little or no horizontalmovement and absence of Bell’s phenomenon.Fibrosis of extraocular muscles is seen onhistopathology. Ductions are very limited.Amblyopia, refractive errors particularlyhyperopia and astigmatism are common. Patientsmay also show esotropia in attempted elevationprobably due to the adductive action of superiorrectus muscle.
Fig. 24.5: Brown’s syndrome
Fig. 24.6: Congenital fibrosis of the extraocular muscles

404 Diagnostic Procedures in Ophthalmology
Ocular associations and systemic associa-tions are not common. Ocular associations suchas optic nerve hypoplasia, chorioretinalcoloboma, microphthalmos and albinism havebeen described. Systemic associations such asbilateral inguinal hernias and cryptorchidismare reported.
Management
Goals of management are: (a) clear the visualaxis, (b) alleviate chin-up posture, and (c) aligneyes in primary position. Large recessions aftercareful dissection of intermuscular septalattachments, with the use of preplaced sutures,give good results. Frontalis sling is the mainstayof ptosis repair. Absence of Bell’s phenomenonoften necessitates long-term generous use oflubricants in these patients.
Orbital Blow-out Fracture
Strabismus after blow-out fracture has beenestimated to occur in about 58% of patients.
Clinical Features
Immediately following injury with cricket ortennis ball or road traffic accidents, the patientpresents with black eye and restriction of ocularmovement in all directions of gaze which usuallysubsides by end of first week. It presents as specificrestrictive strabismus with diplopia in up anddown gaze due to entrapment of soft tissue infractured fragment, hypoesthesia alonginfraorbital nerve and enophthalmos due toherniation of orbital contents into the maxillarysinus. The presence of muscle entrapment canbe confirmed on force duction test (FDT). Saccadic
movement testing can differentiate betweenparetic and entrapped muscle. The associatedsevere globe damage is often rare since blow-out is a protective phenomenon. Plain X-ray(Waters view) and CT-scan confirm diagnosis.
Management
In initial phase of injury, surgery should bewithheld until two weeks till edema subsides.Patient should be followed-up closely with serialdiplopia and Hess charting. Surgery should bedeferred if sufficient diplopia-free area is presentin primary and down gaze. Surgery can beperformed for significant enophthalmos.Teflon plate can be placed subperiostially. Fortroublesome diplopia, Fresnel prisms trial canbe considered. Initially inferior rectus recessioncan be planned for surgical correction.
Bibliography1. Ahluwalia BK, Gupta NC, Goel SR, et al. Study
of Duane’s retraction syndrome. Acta Ophthal-mologica (Copen) 1988;66:77.
2. Brown HW. True and simulated superior obliquesheath syndrome. Doc Ophthalmol 1973;34:123.
3. Kraft SP, Jacobson ME. Technique of adjustablesuture strabismus surgery. Ophthalmic Surg1990;21:633.
4. Park MM, Eustis HS. Simultaneous superiortenotomy and inferior oblique recession inBrown syndrome. Ophthalmology 1987;94:1043.
5. Sharma P. Strabismus simplified. New Delhi,Modern Publishers, 1999.
6. Smith RS, Damasat M. Acquired orbitalretraction syndrome after 6th nerve paralysis.Neurology 1973;14:147.
7. von Noorden GK. Binocular Vision and OcularMotility. 4th ed. St Louis, Mosby, 1990.
8. Wilson WE, Eustis HS, Park MM. Brownsyndrome. Survey Ophthalmol 1989;34:153.

405Diagnostic Procedures in Dry Eyes Syndrome
MS SRIDHAR
DiagnosticProcedures in Dry
Eyes Syndrome25Dry eye (DE) is a disorder of tear film due totear deficiency or excessive tear evaporationcausing damage to the interpalpebral ocularsurface and associated with symptoms of oculardiscomfort.1
Presently, DE is classified into 2 major groups:Tear deficient DE and evaporative DE. Teardeficient DE (ATD—Aqueous tear deficiency) isa disorder of lacrimal function causing decreasedsecretion of aqueous or can result from failureof transfer of lacrimal fluid into the conjunctivalsac. In evaporative or tear sufficient DE, lacrimalfunction is normal and in most cases, the tearabnormality is due to increased tear evaporation.Meibomian gland (MG) dysfunction andblinking disorders are common causes forevaporative DE.
Clinical FeaturesThe usual symptoms of a patient with dry eyescaused by ATD include tearing, redness, burning,blurring of vision, fluctuating vision, itching,irritation, dryness, foreign body sensation, tiredeyes and heaviness of lids. Symptoms tend toget aggravated in hot, arid climates and by certainoccupations like exposure to chemicals, dust,
smoke and prolonged use of computer videoterminals.
Signs include presence of greasy scales onthe lid margins suggestive of seborrheicblepharitis or crusts on the lid margin, the removalof which results in oozing of blood from thesurface which is common is staphylococcalblepharitis. The tear film height is usuallyreduced and mucus debris or stringy dischargemay be seen. The conjunctiva may appearlusterless. It may be thickened, edematous,hyperemic, or may show slight folding inferiorly.In advanced cases, the conjunctiva may bekeratinized particularly in the exposed areas.2
Corneal examination may reveal fine punctatestaining with fluorescein which in severe casesmay appear as confluent patches. Epithelialdefects may develop which may be slow to healor may persist and predispose to rapid sterilecorneal ulceration or secondary bacterialinfection. Plaques or filaments on the surfaceof the cornea may be formed.
Occasionally, clinical signs may be absentin a patient with dry eyes and hence clinicaldiagnostic tests are mandatory in the evaluation.The clinical signs of meibomian glanddysfunction include stenosed or pouting orifices,squamous metaplasia of the orifices (white shafts

406 Diagnostic Procedures in Ophthalmology
of keratin in the orifices), reduced expressibilityof meibomian gland secretions and turbid orthick toothpaste like secretions of the meibomianglands. The presence of thickening of the lidmargins, telangiectatic blood vessels and cystson the lid margin may be noted. Transilluminationmay also reveal drop out of the meibomian glandducts, which is a sign of obstructive meibomiangland disease. In patients with acne rosacea withinflammatory meibomitis, the gland architectureis distorted. Video meibography, using one-chipinfrared video camera and a hand heldtransilluminating light source along with a videomonitor, is useful for imaging the abnormalstructure of the meibomian glands in chronicblepharitis.
Clinical Diagnostic Tests for Dry EyesTear Film Break-Up Time (TBUT)
According to the diagnostic algorithm put forthby Plugfelder3 for diagnosing dry eye, fluoresceintear break-up time (TBUT) is the first diagnostictest to be done which gives information regardingtear film stability. A diagnosis of tear film instabi-lity is made when a fluorescein TBUT value of<10 seconds is obtained. Even though Deckerin 1876 started research on tear film stability,it was Norn4 in 1965 who evolved a simple andconvenient method to assess the tear film stabilityby observing the tear film using a cobalt bluefilter on a slit-lamp, after instilling fluoresceinstain. The interval between the last blink andthe first appearance of a dry spot on thefluorescein-stained tear film was then called thecorneal wetting time. Later term break-up time ortear break up time (BUT or TBUT) was used.5-7
Although different methods now exist like theinvasive5 and non-invasive methods2, differencein the method of instilling fluorescein, numberof readings taken4-6,8 and the type of slit-lamp
observation, with a narrow vertical slit, horizontalslit or a full beam9, 10, this test is of importanceever since it has been identified as the screeningtest in determination of dry eyes in the potentialcontact lens wearers.7
The clinical method of doing fluorescein tearbreak-up time (TBUT) is as follows:
The subject is made to sit comfortably on aslit-lamp with forehead firmly against theforehead rest and chin resting comfortably onthe chin rest. The microscope is positioneddirectly in front of the eye to be receiving thestain. The fluorescein strip is wetted with a dropof preservative-free saline. The strip is thenapplied over the inferotemporal conjunctiva. Thesubject is asked to blink for 3-5 times only andthen is asked to stop blinking. The fluoresceinstaining is then viewed under a slit-lamp (fullbeam) using a blue filter along with a wrattenfilter with magnification. The time interval fromthe last blink to the appearance of a randomlyseen dark spot is recorded with a stopwatch.This is followed by taking another 2 readingsof TBUT with a gap of 3-5 blinks in between.
Non-invasive break-up time (NIBUT): In thismethod, mire is projected using a keratometer,topography, perimeter or tearoscope. The timetaken for the tear film to distort or break-up aftera blink is measured. The reading of break-uptime is less than that of invasive tear break-uptime using fluorescein, but it is more difficultpractically to do it in the clinic.
Schirmer’s Test 1 without Anesthesia
This test assesses the reflex secretion and tearproduction potential. No anesthetic is used.Whatman filter paper #41 measuring 35 mm inlength with a bend at 5 mm is used, and placedat the junction of medial 2/3 and lateral 1/3of the lower lid in the fornix (Fig. 25.1). Thepatient is asked to look forward and blink

407Diagnostic Procedures in Dry Eyes Syndrome
normally. The test is carried out in dimillumination and under standard conditions oftemperature and humidity. The length of wettingis recorded after 5 minutes. Wetting of less than5 mm is considered abnormal.
Schirmer’s Test with Anesthesia
Topical proparacaine is instilled into theconjunctiva. After 5 minutes, the excess fluid iswiped off with a Johnson’s bud. The fluoresceinstrip is then placed as mentioned above and thelength of wetting is read after 5 min. While takingthe reading when the front of the wetted areawas uneven, the millimeter it crosses is recordedas the value.
Schirmer’s test though categorized by manyresearchers as non-reliable11-14 is still widely usedto assess adequacy of tear production15-19 to helpin diagnosis of keratoconjunctivitis sicca,screening for dry eye in contact lens wearers12,20
and for analysis of chemical components of tearfilm.21-23 Lemp in the workshop on clinical trialsof dry eyes puts forth the use of Schirmer’s testas the standard measure for diagnosing tear-deficient dry eye. Validated by van Bijsterveld,24
this test is also recommended by the workinggroup on diagnostic tests, and available forroutine clinical practice.
Schirmer’s Test with NasalStimulation
After performing routine Schirmer’s test, a cottonswab is inserted into the nasal cavity towardsthe direction of ethmoid sinus. A 75 mm stripof Whatman filter paper #41 is placed in theconjunctival fornix and the length of wettingmeasured after 5 minutes. Wetting of less than10 mm is considered abnormal. It is advisableto perform this test on a different occasion.Patients, who do not respond to nasal stimulationby an increase in the lacrimal secretion, arethought to have an invasion of lymphocytes intotheir lacrimal glands,5 resulting in anatomicdestruction of the gland. Such patients do notshow any response even on maximal stimulation.Patients who respond, the lacrimal gland isviable. When patient responds to nasalstimulation but is less responsive to conjunctivalstimulation, it is postulated that the reflex circuitbetween the lacrimal gland and the conjunctivais disturbed.
Diagnostic Dye Staining: Fluoresceinand Rose Bengal Stain
The instillation of dyes is a common methodto detect ocular surface epithelial pathologyassociated with dry eyes. Rose bengal is afluorescein derivative that has been used for thediagnosis of dry eye since Sjögren25 describedthe presence of dye staining in patients withkeratoconjunctivitis sicca (KCS) in 1933. It wasthought to stain only devitalized epithelial cellsbut it also stains healthy epithelial cells whenthey are not protected by a healthy layer ofmucin.26 Therefore, it has the unique propertyof evaluating the protective status of the preoculartear film. Rose bengal also stains dead ordegenerating cells, lipid-contaminated mucousstrands, and corneal epithelial filaments (Fig.25.2). Solution is preferred over impregnated
Fig. 25.1: Schirmer’s test showing the Whatman filterat the junction of medial 2/3rd and lateral 1/3rd of lowerlid in the fornix

408 Diagnostic Procedures in Ophthalmology
strips.27 A double vital staining technique wasdescribed at the NEI Workshop.1 A 2 μl mixtureof 1% rose bengal and 1% fluorescein (preser-vative-free) and non-preserved saline withoutanesthetic, is instilled into the conjunctiva. Theareas of staining are graded on slit-lampexamination.
The interpretation of rose bengal staining indry eyes is based on two factors, intensity andlocation. Van Bijsterveld 28 reported a gradingscale that evaluates the intensity based on a scaleof 0 to 3 in three areas: nasal conjunctiva, temporalconjunctiva and cornea, with a maximumpossible score of 9. The classic location for rosebengal staining in aqueous tear deficiency isinterpalpebral conjunctiva, which appears in theshape of two triangles whose bases are at thelimbus. The NEI workshop has recommendeddivision of nasal and temporal conjunctiva into3 zones, each graded from 0-3, with a maximumpossible score of 18.
Rose bengal staining is considered moresensitive and more specific in detecting patientswith dry eyes than either reduced tear break-up time or a low Schirmer’s test. Rose bengalstaining may help to differentiate between ATDand lipid tear deficiency (LTD) by studying thedistribution of stain in the non-exposure zone.
Preferential staining has been observed in non-exposure zones in the LTD, whereas in ATD,the staining is seen in the exposed interpalpebralareas.29
Fluorescein is another diagnostic dyecommonly used for diagnosis of dry eye. Thedye penetrates intercellular spaces and indicatesincreased epithelial permeability.26 Fluoresceingenerally stains the cornea more than theconjunctiva (Fig. 25.3).
Lissamine green B has been investigated asa marker for ocular surface disease. It is foundto detect dead or degenerated cells and it pro-duces less irritation after topical administrationthan rose bengal.
Fluorescein Clearance Test
Schirmer’s Strip
Ten microlitre of 0.5% fluorescein and 0.4%oxybuprocaine hydrochloride are instilled intothe conjunctival fornix. The eyes are kept openfor 5 minutes. 35 mm long strips of Whatmanfilter paper #41 is placed in both the eyes. Theeyes are then closed for 5 minutes. The intensityof color is compared to a standard scale. Eachgrade shows a 12.5% increase in the basal tearturnover and tear flow. This method may not
Fig. 25.2: Diffuse slit-lamp view showing rose bengalstaining (arrow) in a patient with aqueous tear deficiency(ATD)
Fig. 25.3: Diffuse slit-lamp view showing fluoresceinstaining with filaments in a dry eye patient
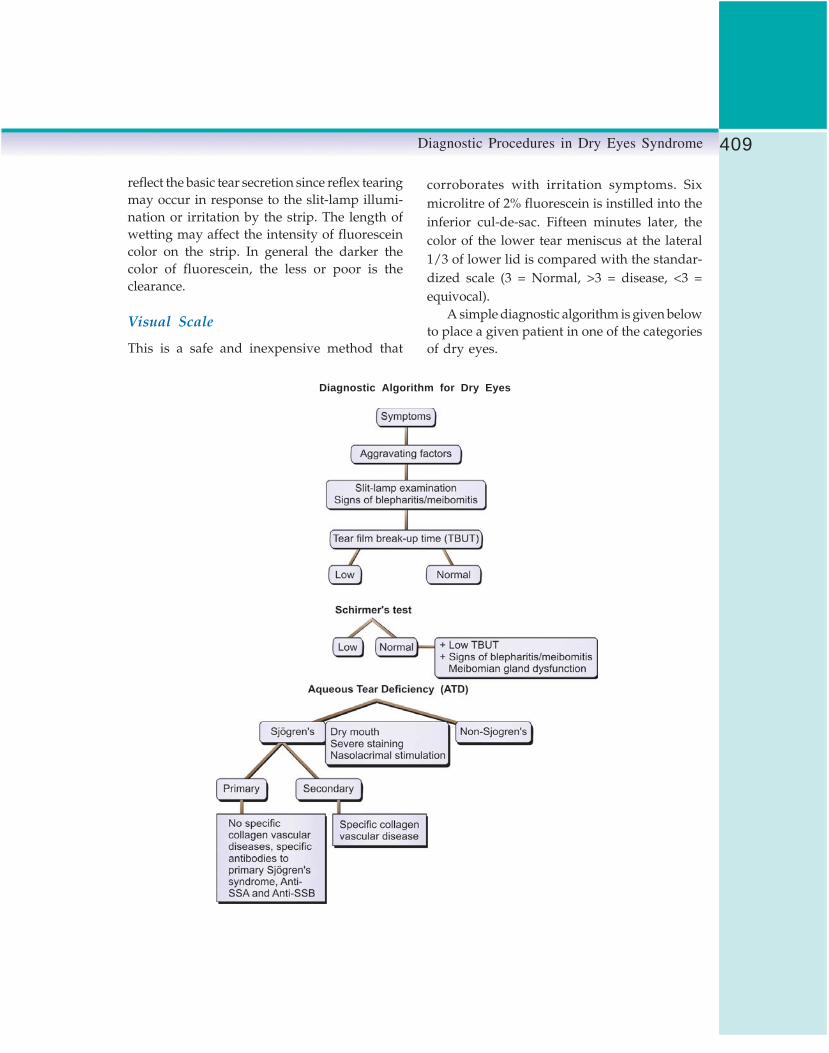
409Diagnostic Procedures in Dry Eyes Syndrome
Diagnostic Algorithm for Dry Eyes
reflect the basic tear secretion since reflex tearingmay occur in response to the slit-lamp illumi-nation or irritation by the strip. The length ofwetting may affect the intensity of fluoresceincolor on the strip. In general the darker thecolor of fluorescein, the less or poor is theclearance.
Visual Scale
This is a safe and inexpensive method that
corroborates with irritation symptoms. Sixmicrolitre of 2% fluorescein is instilled into theinferior cul-de-sac. Fifteen minutes later, thecolor of the lower tear meniscus at the lateral1/3 of lower lid is compared with the standar-dized scale (3 = Normal, >3 = disease, <3 =equivocal).
A simple diagnostic algorithm is given belowto place a given patient in one of the categoriesof dry eyes.

410 Diagnostic Procedures in Ophthalmology
Laboratory Tests
Tear Film Osmolarity
Tear film (TF) osmolarity is said to represent thegold standard in the diagnosis of DE becauseof its greater sensitivity and specificity as a singletest or in combination with other tests. Though,it is unable to distinguish between ATD DE andEvaporative DE. The osmolarity of basal tearsis measured and thus reflex tearing has to beavoided. There exists a need for an instrumentthat is more reliable and freely available for testingTF osmolarity. Technical errors resulting in falselyabnormal values are reported.
Tear Ferning
Conjunctival mucus from a normal eye crystal-lizes in the form of ferns when placed on a dryglass slide and observed under the microscope.The scrapings are obtained from lower nasalpalpebral conjunctiva, 30 immediately followingdrying; the slide is evaluated under a microscopeto find typical mucus arborization or ferning.Ocular ferning test from conjunctival scrapingsis considered as a quantitative test for mucindeficiency. The conjunctival mucus may bereduced or absent in those patients with condi-tions like chemical burns, ocular cicatricialpemphigoid and Stevens-Johnson syndrome.
Conjunctival Impression Cytology
The surface of the normal conjunctiva containsgoblet cells that produce mucin. In cases ofadvanced dry eye, the epithelium undergoespathologic changes, termed squamous meta-plasia, and the density of goblet cells decreases.As a result, the tear film becomes unstablesecondary to a reduction in the mucin layer ofthe tear film. Conjunctival impression cytologyallows the evaluation of epithelium and gobletcells on the conjunctival surface.
Lysozyme and Lactoferrin Assays
Though lysozyme and lactoferrin are found tobe low in dry eye, the tests for their evaluationare cumbersome and expensive and hence notrecommended for use in clinical practice.
Measurements of Immnoglobulinsand Antibodies
Measurements of IgA, IgG, IgM and viralantibodies 31 in tears by ELISA have been triedas laboratory tests in the diagnosis of dry eyes.Since constitutive protein concentration in thetears varies with flow rate, tear collection mustbe standardized and it has to be assured thatonly non-stimulated tears are obtained.32
Serum Autoantibodies
Detection of serum autoantibodies is used todiagnose Sjögren’s syndrome ATD. One or moreof the following autoantibodies may be found:Antinuclear antibodies (ANA titer ≥1:160),rheumatoid factors (RF titer ≥1:160) or Sjögren’ssyndrome–specific antibodies such as anti-Ro(Sjögren-A) or anti-La (Sjögren-B). In one study33
antinuclear antibodies (ANA) were the mostfrequently detected antibodies in ATD beingpresent in 80%. In contrast, positive RF was foundin 65% and positive SS-A in 30% of the samegroup of patients.34
References1. Lemp MA. Report of the National Eye Institute/
Industry Workshop on Clinical Trials in DryEyes. CLAO 1995;21:221-32.
2. Tabbara KF, Wagoner MD. Diagnosis andmanagement of dry eye syndrome. IntOphthalmol Clin 1996;36:61-76.
3. Pflugfelder SC, Tseng SCG, Sanabin O, et al.Evaluation of subjective assessment andobjective diagnostic tests for diagnosing tearfilm disorders known to cause ocular irritation.Cornea 1998;17:38-56.

411Diagnostic Procedures in Dry Eyes Syndrome
4. Norn MS. Desiccation of precorneal film. ICorneal wetting-time. Acta Ophthalmol (Kbh)1969;47:865-80.
5. Lemp MA, Hamill JR. Factors affecting tear filmbreak up time in normal eyes. Arch Ophthalmol1973;89:103-05.
6. Rengstorf RH. The precorneal tear film breakup time and the location in normal subjects.Am J Optom Physiol Opt 1974;51:765-69.
7. Holly FJ. Tear film physiology and contact lenswear. II. Contact lens tear film interaction. AmJ Optom Physiol Opt 1981;58:331-41
8. Vanley GT, Leopold IH, Gregg TH.Interpretations of tear film break up. ArchOphthalmol 1977;95:445-48.
9. Cho P, Brown B. Review of TBUT techniqueand a closer look at the TBUT of HK-Chinese.Optom Vis Sci 1993;70:30-38.
10. Cho P, Brown B, Chan I, Conway R, Yap M.Reliability of the tear film break up techniqueof assessing tear stability and the locations oftear break up in Hong Kong Chinese. OptomVis Sci 1992; 69:879-85.
11. Wright JC, Meger GE. A review of Schirmer’stest for tear production. Arch Ophthalmol1962;67:773-82.
12. Tabak S. A Short Schirmer’s test. Contacto1972;16(2):38-42.
13. Hanson J, Fikentscher R, Rosenberg B.Schirmer’s test of lacrimation. Arch Ophthalmol1975;101:293-95.
14. Henderson JW, Prough WA. Influence of ageand sex on flow of tears. Arch Ophthalmol1950;43:224-31.
15. Mishima S, Gasset A, Klyce SD, Baum JL.Determination of tear volume and tear flow.Invest Ophthalmol 1966;5(3):264-76.
16. Jones LT. Lacrimal secretory system and itstreatment. Am J Ophthalmol 1966;62:47-60.
17. Shapiro A, Merin S. Schirmer test and breakup time of tear film in normal subjects. AmJ Ophthalmol 1979;88:752-57.
18. Hamano H, Hori M, Hamano T, Mitsunaga S,Maeshima J, Kojima S, Kawabe H, HamanoT. A new method for measuring tears. CLAOJ 1983;9:281-89.
19. Rajiv, Mithal S, Sood AK. Pterygium and dryeye – a clinical correlation. Indian J Ophthalmol1991;39:15-16.
20. Clinch TE, Benedetto DA, Feldberg NT, LaibsonPR. Schirmer’s test: a closer look. Arch Ophthalmol1983;101:1383-86.
21. Prause JU. Immunoelectrophoretic determina-tion of tear fluid proteins collected by theSchirmer I test. Acta Ophthalmol (Kbh) 1979;57:959-67.
22. Kiljstra A, Jeurissen SHM, Koning KM. Lacto-ferrin levels in human tears. Br J Ophthalmol1983;67:199-202.
23. Stuchell RN, Feldman JJ, Farris RL, Mandel ID.The effect of collection technique on tearcomposition. Invest Ophthalmol Vis Sci 1984;25:374-77.
24. Van Bijsterveld OP. Diagnostic tests in the siccasyndrome. Ann Ophthalmol 1969;82:10-14.
25. Sjögren HS. Zur kenntnis der keratoconjunctivitissicca (keratitis folliformis ber hypofunktion derranendrasen). Acta Ophthalmol (Copen) 1933;11:1-151.
26. Feenstra RPG. Tseng SCG. Comparison offluorescein and rose bengal staining.Ophthalmology 1992;101:984-93.
27. Roberts DK. Keratoconjunctivitis sicca. J AmOptom Assoc 1991;62:187-99.
28. Van Bijsterwald OP. Diagnostic tests in the siccasyndrome. Ophthalmology 1969;82:10-14.
29. Lee SH, Tseng SCG. Rose Bengal staining andcytologic changes associated with meibomiangland dysfunction. Am J Ophthalmol 1997;124:736-50.
30. Tabbara KF, Okumoto M. Ocular ferning test.A qualitative test for mucus deficiency.Ophthalmology 1982;89:712-14.
31. Coyle PK, Sibony PA. Viral antibodies in normaltears. Invest Ophthalmol Vis Sci 1988;29:10.
32. Fullard RJ, Snyder C. Protein levels in non-stimu-lated and stimulated tears of normal humansubjects. Invest Ophthalmol Vis Sci 1990;32:8.
33. Pflugfelder SC, Whitcher JP, Daniels TE.Sjögren’s syndrome In: Pepose J, Holland G,Whilhelmus K (Eds). Ocular infection andimmunity. St. Louis, Mosby, 1997.
34. Pflugfelder SC, et al. Chronic Epstein-Barr viralinfection and immunologic dysfunction inpatients with aqueous tear deficiency.Ophthalmology 1990;97:313-23.

412 Diagnostic Procedures in Ophthalmology
AK GROVER, RITURAJ BARUAH
Evaluation ofEpiphora26
Applied Anatomy and Physiologyof the Lacrimal Apparatus
Lacrimal Gland
The lacrimal gland is an exocrine gland (20×15×5mm) that lies in the lacrimal fossa formed bythe frontal bone in the anterosuperior lateralorbit. It is divided into a larger orbital lobe anda smaller palpebral lobe by the fibrous extensionsfrom the Whitnall ligament, levator aponeurosisand its lateral horn.1 It secretes tears througha series of ducts (10-12) into the conjunctivalsac just in front of the superior fornix, 5 mmabove the lateral tarsal border. Two to six ductsfrom the orbital portion run through and jointhe ducts of the palpebral lobe. Removal ordamage to the palpebral lobe can thus lead tosignificant decrease in tear secretion.
There are accessory exocrine glands of Krauseand Wolfring that are located in the superiorfornix and above the superior border of the tarsus,respectively. These glands have got no apparentnerve supply.
The blood supply of the lacrimal gland isfrom the lacrimal branch of the ophthalmic artery.Venous blood drainage is via the ophthalmicvein.2
Nerve Supply
The lacrimal gland has got sensory, secretomotorand, sympathetic supply. Sensory supply comesthrough the lacrimal branch of the ophthalmicdivision of the Vth cranial nerve. Secretomotorsupply is via the parasympathetic fibers.Parasympathetic preganglionic fibers arise fromthe lacrimal nucleus in the pons near the glosso-pharyngeal nucleus. Sympathetic postganglionicfibers come from superior cervical ganglion andreach the lacrimal gland via deep petrosal andalso along with the sympathetic fibers aroundlacrimal artery and nerve.2
Lacrimal Excretory Apparatus
The lacrimal excretory apparatus consists of theupper and the lower puncta, canaliculi, tear sacand the nasolacrimal duct (Fig. 26.1).
Puncta: These are small, round to oval orificesof about 0.2 mm in diameter on the summit ofan elevation, the papilla lacrimalis that lies nearthe medial end of the eyelid margins at thejunction of its ciliated and the non-ciliated partsin line with the openings of the meibomianglands. The puncta, being relatively avascular

413Evaluation of Epiphora
is paler than its surrounding, serving as a guidein case of finding a stenosed punctum.
The upper punctum is slightly medial relativeto the lower but when the eyelids are closed theyappose each other. The medial ends of the lowerlid retractors also help stabilize the puncta andprevent punctal eversion on blinking. The patencyof the puncta is maintained by the surroundingdense fibrous tissue continuous with the adjacenttarsal plate.
Canaliculi: The canaliculi are hollow tubes of0.5 mm diameter connecting the puncta to thelacrimal sac. Each canaliculus has a vertical part,which is 2 mm in length and a horizontal partof 8-10 mm, which follows the eyelid marginconverging towards the medial canthus. Thecanaliculi are enveloped by the orbicularis musclefibers and elastic tissue, except on the posteriorwalls, which are covered by conjunctiva throughwhich the probe can be easily seen. The upperis slightly shorter than the lower. There is adilatation at the junction of these two parts, whichis the ampulla. The canaliculi pierce the periorbitaof the lacrimal sac separately, uniting at an angleof 25o to form a short common canaliculus
(0-5 mm long). It then enters a small diverticulumof the sac, the lacrimal sinus of Maier at a pointon the posterolateral surface of the sac about2.5 mm from the apex of the sac. The commoncanaliculus is directed anteriorly forming anacute angle of about 45o with the sac beforeentering it. This acute entry into the lacrimalsac creates a potential mucosal flap or valveacross the opening, the valve of Rosenmuller.2,3
The canaliculi are lined by stratifiedsquamous epithelium supported with elastictissue that can be dilated to three times the normaldiameter.2
Lacrimal sac: The lacrimal sac lies in the lacrimalfossa formed by the lacrimal bone and the frontalprocess of the maxilla in the anterior part of themedial wall of the orbit which is continuousbelow with the nasolacrimal duct. Vertical sutureline between the frontal process of the maxillaand the lacrimal bone is slightly medial to themiddle of the floor of the fossa. This is of surgicalimportance because in dacryocystorhinostomyoperation, the first bony opening is made throughthis line.
The lacrimal sac is 12-15 mm tall, 4-6 mmanteroposteriorly and 2-3 mm wide. The sac abovethe junction of the common canalicular duct isknown as fundus. An imaginary line drawn fromthe medial canthus to the first upper molar tooththat slopes downward and backward at 15-25°indicates the long axis of the sac.
A portion of the periorbita, which splits atthe posterior lacrimal crest, encloses the lacrimalsac and then joins at the anterior lacrimal crestforming the anterior and the posterior lacrimalfascia, respectively. Anterior ethmoidal air cellsand vessels are medial to the upper part of thesac, the cribriform plate and the frontal sinusfloor lie superior to the sac. Between the posteriorsurface of the sac and the posterior lacrimal fasciathere is a vascular plexus; injury to the plexuscause troublesome bleeding. Anteriorly, the upper
Fig. 26.1. Lacrimal system

414 Diagnostic Procedures in Ophthalmology
part of the sac is in close contact with the medialpalpebral ligament so much that the ligamentmay have to be divided near its attachment tothe anterior lacrimal crest for completemobilization of the sac. The angular vein crossesthe ligament subcutaneously 8 mm from themedial canthus; however, the position of the veinis not always constant. Incision for removal ofthe sac should not be more that 2-3 mm medialto the medial canthus.
Nerve supply of the lacrimal sac is by theinfratrochlear branch of the nasociliary nerve.
Blood supply of the lacrimal sac is via thedorsalis nasi and medial superior palpebral, bothbeing branches of the ophthalmic artery, angularbranch of the facial artery, branch of the externalmaxillary artery and the infraorbital branch ofthe internal maxillary artery. Venous drainageis through the rich venous plexus surroundingthe sac into the angular vein.
Nasolacrimal duct: The nasolacrimal duct is acontinuation of the lacrimal sac. There is onlya slight constriction at the junction of thenasolacrimal duct and the sac. The long axisis along the line joining the medial canthus tothe first molar. It can be identified from outsideby the more numerous and prominent veinsurrounding the duct than the sac and frominside by the focal narrowing (valve of Krause)at the junction. The duct also has a thicker wallwhich becomes apparent on incision.
The nasolacrimal duct can be divided intotwo parts, an interosseous part (12 mmapproximately) and an intermeatal part (5 mmapproximately). It lies embedded in a bony canalformed medially by the maxillary bone andlaterally by the lacrimal bone above and theinferior conchea below. The nasolacrimal ductopens on the lateral wall of the nasal cavity about10 mm posterior to the anterior end of the inferiorconchea and 30 mm from the external nares. Theduct opening has a mucosal fold, the valve of
Hasner, which prevents air from entering thelacrimal sac on sudden blowing the nose. Theduct opening varies in size, shape and also thesite of opening.
The duct is surrounded by a network ofvenous plexus. The plexus of vessels whenengorged is sufficient to obstruct the duct.
Nerve supply to the duct is by the infratro-chlear and the anterior superior alveolar nerves.
Blood supply of the nasolacrimal duct is fromthe palpebral branches of the ophthalmic,angular and infraorbital arteries and nasalbranch of the sphenopalatine. Venous drainageis via the angular and the infraorbital vesselsabove and below into the nasal veins. Lymphaticsof the nasolacrimal duct pass onto thesubmandibular and deep cervical nodes.
Orbicularis Oculi
Orbicularis oculi is the muscle that acts as theprotector of the eyes through its blinking action.It has got two main parts—the orbital and thepalpebral part. Our main concern here is thelatter. The palpebral part is again divided intopretarsal—that part of orbicularis lying over thetarsus and the preseptal part over the orbitalseptum. The insertions of the orbicularis at themedial canthus around the lacrimal sac are calledheads.
The preseptal part has its superficial headinserted into the medial canthal tendon and thedeep head into the fascia on the dome of thelacrimal sac and into the upper part of theposterior lacrimal crest.
The pretarsal part has its circumferential fibersoriented over the superior and inferior tarsal plate.Laterally, it originates from the horizontal rapheand also from the lateral orbital tubercle.Medially, it is inserted into the anterior andposterior lacrimal crest by its two heads—thesuperficial and the deep head.

415Evaluation of Epiphora
Two other muscle strips, the marginalpreciliary and the retrociliary (muscle of Riolan)exist that are part of the pretarsal part of theorbicularis oculi.
Nerve supply to the orbicularis oculi muscleis by the facial nerve.
Tear Secretion and Elimination4-6
Tear secretions are mainly by the two sets ofglands—lacrimal and the accessory glands ofWolfring and Krause. The accessory glands arethe basal secretory that give a constant supplyof tears as they lack any known innervations.The lacrimal gland is the reflex secretor.Autonomic stimulation; emotional stimulation;conjunctival, corneal or uveal irritation orirritative foci in the sinus, mouth, ear, or teethlead to reflex tearing. It can accompany yawning,laughing, sneezing and coughing.
Tears are distributed along the conjunctivalfornices, precorneal tear film and the marginaltear strips. Approximately 25% of the secretedtears are lost by evaporation. Rest are drainedthrough the lacrimal drainage system via thepunctum, the canaliculi, the sac, the nasolacrimalduct and ultimately into the inferior meatus ofthe nose. About 60% of the tears are drainedvia the lower punctum but in case of abnor-malities the upper punctum can functionefficiently without overflow.6
The blinking action of the eyelids helps indriving the tears forward into the drainagesystem. Blinking displaces the upper as well asthe lower lid medially due to the firm attachmentof the orbicularis to the medial canthal tendon.Moreover, with each blink the upper and lowerlid approximates at the lateral canthal area andthen proceeds towards the medial canthusdisplacing the tear film towards the puncta.
Even in the absence of blinking, low flowof tears occurs through the puncta due to theKrehbiel phenomenon, capillary action and the
normal downhill slope of the eyelids but alongwith a passive reflux into the lacrimal lake.
With the start of the blink the tears arepropelled towards the puncta. As the processcontinues the open puncta move towards eachother and occlude. Due to the orientation of thesuperficial and the deep heads of the orbicularisaround the canaliculi and their firm attachmentto the bone, the eyelid is pulled medially oncontraction, the canaliculi are shortenedsqueezing the tear already in the ampulla andthe canaliculi into the sac. The attachment ofthe deep head of the preseptal part of theorbicularis into the fascia on the dome of thelacrimal sac pulls the sac laterally on contractionenabling the sac filling (negative pressure). Thevalve of Rosenmuller reduces backflow, once thetears are in the sac.
On opening the eyes, the muscle around thecanaliculi relaxes leading to the flow of tearsinto canaliculi again due to the reduced intra-canalicular pressure. Tears can also gravitatedown the nasolacrimal duct passively. But activedrainage into the nose is by the complex actionof the Horner muscle.
Evaluation of EpiphoraTearing can broadly be grouped under two mainheadings:1. Lacrimation (Hypersecretion of tears)2. Epiphora (Impairment of drainage)
It is essential to differentiate between two inplanning the management.• Epiphora is a condition where there is
excessive tearing due to reduced tear outflow,i.e. defective tear drainage.
Obstruction at any point along the lacrimaldrainage pathway, from the punctum to thenose can cause epiphora. This can lead toepiphora varying in severity from intermittentepiphora with a partial block to tears

416 Diagnostic Procedures in Ophthalmology
overflowing to the cheek. It can be unilateralor bilateral. It is worse in winter months andwindy weather. Vision can be affected moreon down gaze due to elevated tear meniscusor tear splattered glasses. Chronic epiphoracan cause red, sore lower-lid skin, withsecondary anterior lamella (vertical)shortening (mild cicatrical ectropion).Excessive wiping away of tears can causeor exacerbate a medial ectropion.
• Functional epiphora is the term that is usedwhen there is epiphora with patent syringing,in the absence of any causes of hypersecretion.This may be due to a narrowing or stenosisof the nasolacrimal duct, which increases theresistance to the tear outflow but does notcause a complete anatomical obstruction. Theterm lacrimal pump dysfunction is used forepiphora due to reduced tear drainage oforbicularis causes. Common causes offunctional epiphora are punctal stenosis,facial palsy with paralytic ectropion, singlefunctional canaliculus and commoncanalicular stenosis.
• Pseudoepiphora refers to the reflexhypersecretion of aqueous tears from the mainlacrimal gland due to altered production bythe glands of Krause and Wolfring.7
Evaluating a case of epiphora needs asystematic approach, so that the causes ofhypersecretion can also be ruled out.
HistoryA meticulous history taking is vital to theevaluation. Patient‘s symptoms, past ophthalmic,nasal and medical history should be elicited.A history of allergic diathesis and use of drugsshould be obtained.
In case of congenital tearing, parents maycomplain of constant tearing with minimal orno mucopurulent discharge suggesting upper
system block (punctal or canalicular dysgenesis).Constant tearing with frequent mucopurulentdischarge and matting of the lashes suggestnasolacrimal duct block. Intermittent tearing withmucopurulence may suggest intermittentobstruction of the nasolacrimal duct (impactionof a swollen inferior nasal turbinate associatedwith an upper respiratory tract infection).
Examination
The lacrimal examination can be divided underthree heading:1. Periorbital, lid and lacrimal system
assessmentGeneral examination of the face,
periorbital and medial canthal areas andeyelids is essential. It includes:• Slit-lamp examination of the puncta,
external eye and tear meniscus,• Syringing,• Diagnostic probing and• Fluorescein dye test.
2. Examination of the nasal cavity3. Radiological examination4. Newer modalities
Periorbital, Lid and Lacrimal SystemAssessment8
General examination of the face and periorbital region:Examination of these parts with relevance to thesymptoms help in establishing a diagnosis.Eyelid malposition, facial and periorbitalasymmetry should be looked for.
Lacrimal sac swelling: A lump over the medialcanthal area below the medial palpebral ligamentstrongly indicates to a lacrimal sac swelling (Fig.26.2).
Evidence of inflammation: Fistula (Fig. 26.3) andinflammation over the sac area need to be furtherevaluated.

417Evaluation of Epiphora
Fig. 26.3: Acute dacryocystitis with fistula
Shortening of anterior lamella: Vertical eyelidtightness should be checked by asking the patientto look up at the ceiling. If there is short anteriorlamella, the ectropion will be exacerbated.
Assessment of puncta: All the four puncta shouldbe looked for the presence of any stenosis ormembrane blocking them. They should facetowards the lacrimal lake. The relative positionof the upper and the lower puncta to each otherand to the caruncle should also be assessed.
Eyelid laxity: The eyelid can in itself be a causeof epiphora. Involutional ectropion oftenprogresses from punctal eversion to involve themedial third, then the medial half of the lowereyelid and eventually the entire lid. Examination
of the lid with utmost care is needed to diagnosethe condition.
Horizontal laxity of the eyelid can be estimatedby Pinch test and snap back test:• Pinch test: Using the thumb and the index
finger, the lid is pulled firmly away from theglobe, the distance between the lid and theeye is measured and the laxity is documentedas:None 5 mmMinimal 5-7 mmMild 8-9 mmModerate 10-12 mmSevere >12 mm
• Snap back test: The speed with which the lowerlid settles back against the globe after beingpulled down and released is to be observed,as well as whether there is a short gap betweenthe lid and globe once settled and before thefirst blink.
• Medial canthal tendon laxity: It is always tobe assessed while evaluating a case ofepiphora. It is graded with the lateraldistraction test and by noting the positionof the lower punctum in relation to the upper.These tests depend on the fact that the lowerpuncta normally lies at the plica at rest andalso when pulled laterally.
The patient is made to sit in front of theexaminer at arm length distance with theireyes at the same level. The patient is askedto look at the bridge of the examiner’s noseand without inducing accommodativeconvergence by moving too close, the lowerpunctum position is noted relative to theupper.
-1 Punctal medialization 0 Normal+1 Midway between the plica and the
medial limbus+2 In line with the medial limbus
+3 - +6 Beyond the medial limbus
Fig. 26.2: Swelling above the area of the lacrimalsac in a child

418 Diagnostic Procedures in Ophthalmology
• Lateral distraction test: After noting the restingposition of the lower punctum, the lower lidis pulled laterally and the position of thepunctum is noted again. The test is gradedas: 0 No distraction at all+1 Punctum reaches midpoint of plica
and medial limbus+2 Punctum reaches medial limbus+3 Punctum reaches midpoint of medial
limbus and pupil line+4 Punctum reaches pupil line+5 Punctum reaches midpoint of pupil
line and limbus line+6 Punctum reaches lateral limbus
Slit-lamp Examination
The slit-lamp examination is an essential partof evaluation.• Punctum should be evaluated for patency,
size, position and discharge.• Mild degrees of ectropion (Fig. 26.4) and
entropion (Fig. 26.5) that are not apparentto gross external examination may be revealedon the slit-lamp biomicroscopy. Small lesionsof eyelid margins like papillomas, molluscumcontagiosum, chalazia, nevi and carcinomaare best detected with the slit-lamp.
• Pressure over the lacrimal sac may causedischarge from the punctum, suggestingnasolacrimal duct obstruction.
• Presence of inflammation on the areaoverlying the canaliculus and discharge fromthe punctum on pressure over the area maysuggest canaliculitis (Fig. 26.6).
• Examination for the signs of blepharitis (Fig.26.7) as well as dry eye syndrome which leadto hypersecretion of tears should be lookedfor. Conjunctival lesions particularlypinguecula and pterygium may inducetearing. The forniceal and palpebralconjunctiva should be inspected for follicles
Fig. 26.4: Involutional ectropion
Fig. 26.5: Congenital entropion
and papillae of reactive inflammatorydisorders and allergic conjunctivitis.
• Cornea should be examined for anyirregularities, features of dry eye syndromeor epithelial dystrophies. These examinationshelp to rule out causes of hyperlacrimation.
• The vertical height of the tear meniscus isto be measured prior to instillation of anyeyedrops. Staining the tear film with a smallamount of fluorescein aids in assessing thevolume of the tear lake.

419Evaluation of Epiphora
Fig. 26.7: Blepharitis
Fig. 26.8: Schirmer test
Schirmer test is basically of three types:Schirmer I test, Basic secretion test and SchirmerII test.
Schirmer I test is performed without topicalanesthetic. Ten mm or more wetting is taken asnormal. Excessive wetting can be due topseudoepiphora or hypersecretion.
Basic secretion test is done as the Schirmer Itest but after instillation of topical anesthetic intothe lower fornix. This anesthesia eliminates thelocal source of irritation as by the Schirmer teststrips and gives an estimate of the basic tear
Fig. 26.6: Canaliculitis
Schirmer Test
Schirmer test (Fig. 26.8) helps us to excludepseudoepiphora. For this test white filter paperstrips (41 Whatman) of 35 mm in length and5 mm width are used. They are folded 5 mmat one end and inserted into the inferior fornixat the junction of the middle and lateral thirdof the lid and allowed to remain in this positionfor 5 minutes with the eyes open. The patientshould be comfortably sitting in a dimly lit roomaway from direct air source as the fan. Moreoverthere should not be any kind of verbalstimulation. After the end of the 5 minutes, thewetting of the filter paper is measured.

420 Diagnostic Procedures in Ophthalmology
secretion by the glands of Krause andWolfring.9,10 Wetting of less than 10 mm after5 minutes indicates deficiency of basic tearproduction. A tearing patient with patentlacrimal drainage system with deficient basictear production indicates towards reflexhypersecretion.
Schirmer II test measures the reflex tearing fromthe main lacrimal gland after eliminating thelocal causes of irritation. After anesthetizing theconjunctival sac, the trigeminal nerve isstimulated either with a cotton-tipped applicatorapplied to the nasal mucosa or with ammoniumchloride on a cotton pledget held at the externalnares. The amount of excess wetting in additionto that of the basic secretion test is the reflexsecretion.
Fig. 26.9: Instruments used for syringing and probing
Syringing
Syringing the canalicular system providesinformation regarding the patency status. Oneto two drops of topical anesthesia (proparacaineor tetracaine) is instilled into the conjunctivalsac. The punctum is dilated gently by advancingthe Nettleship dilator (Figs 26.9 and 26.10), first
Fig. 26.10: Dilatation of punctum and syringing

421Evaluation of Epiphora
vertically for about 2 mm and then horizontallywith a twisting movement. Simultaneously,lateral traction is applied to the eyelid. With theeyelid stretched, the dilator is withdrawn andthe lacrimal cannula attached with syringe filledwith normal saline is advanced horizontallythrough the punctum and the canaliculus (Fig.26.10). No resistance should be felt in its entirepath. Irrigation is then done and the patient isasked to respond if fluid passes into theoropharynx or nose.
If there is resistance to irrigation, obstructionis present. Regurgitation of fluid from the samepunctum indicates that there is a canalicularblock. Regurgitation of fluid from the upperpunctum indicates blockage at the level ofcommon canalicular duct, lacrimal sac ornasolacrimal duct. Immediate regurgitation ofclear fluid usually suggests a common canalicularobstruction. Relatively delayed regurgitation offluid mixed with mucus or pus usually indicatesNLD blockage.
Diagnostic Probing
Probing the canaliculi provides informationregarding the site of obstruction, which isnecessary for decision-making. It is performedonly after obstruction is demonstrated by othertests. After topical anesthesia of the conjunctivalsac, the canaliculi are also irrigated withanesthetics. A probe of appropriate size isinserted into the punctum after dilatation andadvanced till it meets obstruction. First it is passedvertically through the punctum, turned mediallyand advanced until it encounters the lacrimalbone (Fig. 26.11A).
Through out the procedure the lid shouldbe firmly pulled laterally so that there is nokinking of the canaliculi. It is then withdrawna few millimeters and rotated inferiorly andslightly posterolaterally until the proximal partof the nasolacrimal duct is felt. The probe is then
passed until it strikes the floor of the nose inthe inferior meatus (Fig. 26.11B). If in betweenany obstruction is felt, the site of obstruction isnoted by grasping the probe with a forceps atits entrance before withdrawing.
Figs 26.11A and B: Dilatation of punctum and probing
Obstruction can be felt as a “soft stop” in caseof a stenosis of the canaliculus or as a “hard stop”as the probe hits the bone at the medial wall of thelacrimal sac. Obstruction at less than 8 mmindicates a canalicular block, 8-10 mm indicatesa common canalicular obstruction and distal tothat if the probe passes more than 10 mm.
While probing a child, a few considerationsshould be noted. Probing is usually recommen-ded through the upper canaliculi as the lowercanaliculus carries more tear flow than the upperand it is wise to avoid the possibility of injuryto it. Up to 1 year of age, the distance from thepunctum to the nasolacrimal duct isapproximately 12 mm, whereas, to the floor ofthe nose, it is approximately 20 mm.11
A
B

422 Diagnostic Procedures in Ophthalmology
Fluorescein Dye Test
Dye disappearance test or fluorescein dye retention
test: This is a semiquantitative test of delayedor obstructed tear outflow. It is of particularimportance for the evaluation of congenitaldacryostenosis in infants and toddlers wherelacrimal irrigation is impossible withoutanesthesia and deep sedation. One drop of 2%fluorescein is instilled into the unanesthetizedconjunctival sac of both the eyes. The volumeof the tear lake is then noted preferably underthe cobalt blue light. The patient is instructednot to wipe the eyes. The tear lakes are examined5 minutes later, and the relative volume isdetermined. Persistence of significant dye andespecially asymmetric clearance of the dye fromthe tear meniscus over a 5 minutes periodindicates a relative obstruction of the sideretaining the dye.12,13
Jones tests: 14,15 The Jones tests are dye tests forfunctional epiphora where the lacrimal drainagesystem observed to be patent on syringing. Thereare two types of Jones tests (Figs 26.12Aand B).• Jones tests I: It investigates the lacrimal outflow
under normal physiological conditions.Fluorescein (2%) is instilled into theconjunctival sac and presence of the dye atthe inferior meatus is noted at 2 minutes and5 minutes with the help of a cotton tipapplicator. Rate of false negative is very highwith this test.
• Jones tests II: It is a nonphysiological test thatdetermines the presence or absence of fluores-cein in the irrigating saline fluid retrievedfrom the nose. Flushing of the residual dye(of the unsuccessful Jones test I) from theconjunctival sac is done and after that topicalanesthesia is instilled into the conjunctivalsac. Patient is seated with head tilted forwardand a transcanalicular irrigation with salineis done. Patient is then asked to blow or spit
the fluid onto a paper tissue and fluoresceindye is looked for.A positive test is with the presence of the dye
on the tissue paper suggesting that the dye hadreached the lacrimal sac but in the presence ofa narrowed nasolacrimal duct or a nonfunc-tioning lacrimal pump requiring the syringingpressure to force it down.
The test is said to be negative when the tissueis clear of any dye indicating that it did not getinto the lacrimal sac with the Jones I test as ineyelid malposition, lacrimal pump failure,punctal or canalicular stenosis.
A positive Jones test II confirms anatomicalpatency with a high-pressure wash out offluorescein.
Modifications of Tests
Taste test: One drop of saccharin is instilled intothe conjunctival sac and one gets the taste of
Figs 26.12A and B: Jones test I and II

423Evaluation of Epiphora
it after several minutes in case of a patent lacrimaldrainage system.
Endonasal dye test: This is done as the Jones testI and presence of the dye is seen through anendoscope inserted into the nares.
Oropharynx dye appearance test: Fluorescein 2%is instilled into the conjunctival sac of one sideat a time and the oropharynx is checkedperiodically for the appearance of the dye. Thistest is of particular importance in infants wheresedation or anesthesia is otherwise needed.
Examination of Nasal Cavity
The key to success of a dacryocystorhinostomysurgery lies in the intact anatomy of the nasalcavity. Moreover, pathology of the structuresaround the opening of the nasolacrimal ductitself may be the cause of epiphora. Examinationof the nasal cavity can be done either with anasal speculum or more completely with a rigidnasal endoscope. Treatment of the existingpathology is necessary before contemplatingsurgical intervention.
Ancillary Radiological Investigations
Radiological tests help in confirming the site ofobstruction or stenosis in case of blockedsyringing, confirm a functional cause of epiphoraand delineate the anatomical as well as thepathological process pertaining to the problem.
DacryocystographyDacryocystography (Figs 26.13 and 26.14) is ofimportance in case of blocked syringing to locatethe site of obstruction. Moreover, it givesadditional information regarding any fistula orintrasac pathology.
After instillation of local anesthesia, a finecatheter is introduced into the canaliculus(preferably the superior one) and 0.5-2 ml of watersoluble iodinated contrast medium is injected
Fig. 26.13: Dacryocystography showing passage ofcontrast into the nasal cavity
Fig. 26.14: Dacryocystography showing pooling ofcontrast in the lacrimal sac (NLD obstruction)
continuously during either conventional tomo-graphy or CT acquisition. CT dacryocystographyis considered superior to conventional one asit provides useful anatomical information aboutthe orbital wall, sinus as well as allowingevaluation of the nasolacrimal duct.
MRI dacryocystography provides the sameinformation as the conventional studies, withoutthe use of catheterization and contrast medium.Both the sides are preferably done simultaneously

424 Diagnostic Procedures in Ophthalmology
in case of a functional epiphora. Enhancementof the film is done with digital subtraction (Fig.26.15).16,17
Fig. 26.15: Dacryocystography after digital subtraction
Dacryoscintigraphy18-20
Functional epiphora becomes difficult todifferentiate from partial block of the lacrimaldrainage system. Dacryoscintigraphy assessesthe lacrimal drainage system under physiologicalcondition.Technetium-99, a gamma ray-emittingradionuclide in saline or technetium sulfurcolloid are instilled into the conjunctival sac andimaged with a gamma camera at fixed interval.Delay in the passage of the dye may occur atany site as in the region of the conjunctival sacor the canaliculi, which may be due to lid orcanalicular diseases. Apart from being anoninvasive technique, radiation exposure to thelens is minimal compared to that of dacryocysto-graphy. The disadvantage of dacryoscintigraphyis that it lacks in showing finer anatomical detail.
Computer Tomography (CT)21
The role of CT scan comes when anatomical orpathological abnormalities are suspected as the
underlying cause of epiphora which may be dueto craniofacial injury, congenital deformities orlacrimal sac neoplasia. The paranasal sinuses,especially the maxillary sinuses are imaged forany abnormalities that might be affecting thenasolacrimal duct. Preoperative assessment ofthe cribriform plate is noted for any abnormalposition to avoid a possible cerebrospinal leakat the time of surgery.
Newer Modalities
Chemiluminescence test22: Cyalume, achemiluminescent material is injected with asialography catheter to demonstrate the patencyof outflow passages.
Dacryoscopy: Dacryoscope, a mini rigidendoscope allows the direct visualization of theinterior and the lining of the lacrimalpassages.23,24
Standarized echography: Gross anatomicalstructural defects can be evaluated with thestandardized echography.25
Thermography: Thermographic evaluation of thelacrimal passage used in conjunction withroutine lacrimal irrigation to visualize the tearducts in normal subjects and in a patient withobstructive epiphora has been described.26
References1. Jane Olver J. Colour Atlas of Lacrimal Surgery.
London, Butterworth- Heinemann 2002;11-26.2. Bron AJ, Tripathi RC, Tripathi B. Wolff’s
Anatomy of the eye and orbit. 8th edn.Edinburgh, Chapman & Hall Medical Publication1997;72-84.
3. Tucker NA, Tucker SM, Linberg JV. The anatomyof the common canaliculus. Arch Ophthalmol1996;114:1231-34.
4. William MH Jr. (Ed). Adler’s Physiology of theEye: Clinical Application 9th edn. Harcourt BraceAsia 1992.

425Evaluation of Epiphora
5. Doane MG. Blinking and the mechanics of thelacrimal drainage system. Ophthalmology 1981;88:844-50.
6. Becker BB. Tricompartmental model of thelacrimal pump mechanism. Ophthalmology 1992;99:1139-45.
7. Basic and clinical science course, AmericanAcademy Ophthalmology, 2005; Orbit, eyelidsand the lacrimal system. Chapter 14-Evaluationand management of the tearing patient, 272.
8. Conway ST. Evaluation and management of“functional” nasolacrimal blockage: results ofa survey of the American Society of OphthalmicPlastic and Reconstructive surgery. Ophth PlasticReconstr Surg 1994;10:185-87.
9. Krupin T, Cross D A, Becker B. Decreased basaltear production associated with generalanesthesia. Arch Ophthalmol 1977;95:107.
10. Lamberts DW, Foster CS, Perry HD. Schirmertest after topical anesthesia and the tear meniscusheight in normal eye. Arch Ophthalmol1979;97:1082.
11. Nesi FA, Lisman RD, Levine MR. Smith’sOphthalmic plastic and reconstructive surgery.2nd edn. St Louis, Mosby 649-60.
12. Flack A. The fluorescein appearance test for lacri-mal obstruction. Ann Ophthalmol 1979; 11:237.
13. MacEwen CJ, Young JDH. The effect of fluores-cein disappearance test (FDT): an evaluation ofits uses in infants. J Paed Ophthal Strab 1991; 28:305.
14. Zappia RJ, Milder B. Lacrimal drainage function.I.The Jones fluorescein test. Am J Ophthalmol 1972;74:154-59.
15. Zappia RJ, Milder B. Lacrimal drainage function.I.The fluorescein dye disappearance test. Am JOphthalmol 1972;74:160-62.
16. Galloway JE, Kavic TA, Raflo GT. Digitalsubstraction macrodacryocystography.Ophthalmology 1984;91:956-62.
17. Lloyd GAG, Welham RAN. Substractionmacrodacryocystography. Br J Radiol 1972;47:379-82.
18. Rossomondo RM, Carlton WH, Trueblood JH.A new method of evaluating lacrimal drainage.Arch Ophthalmol 1972;88:523.
19. Hurwitz JJ, Maisey MN, Welham RAN.Quantitative lacrimal scintillography. Br JOphthalmol 1975;59:308-12.
20. Jedrzynski MS, Bullock JD. Radionuclidedacryocystography. Orbit 1998;17:1-25.
21. Kallman JE, Foster JA, Wulc AE, et al. Computertomography in lacrimal outflow obstruction.Ophthalmology 1997;104:676-82.
22. Raflo GT. Assessment of efficacy of chemilumi-nance evaluation of lacrimal drainage system.Ophthalmic Surgery 1982;13:36.
23. Coehn SW, Prescott R, Sherman M.Dacryoscopy. Ophthalmic Surgery 1979;10:57.
24. Tsugihisa Sasaki, Yuuko Nagata, KazuhisaSugiyama. Nasolacrimal duct obstructionclassified by dacryoendoscopy and treated withinferior meatal dacryorhinostomy. Part I:Positional diagnosis of primary nasolacrimalduct obstruction with dacryoendoscope. Am JOphthalmol 2005;140:1065-69.
25. Dutton JJ. Standardised echography in thediagnosis of lacrimal drainage dysfunction. ArchOphthalmol 1989;197:1010.
26. Raflo GT, Chant P, Hurwitz JJ. Thermographicevaluation of lacrimal drainage system.Ophthalmic Surgery 1982;13:119.

426 Diagnostic Procedures in Ophthalmology
MANDEEP S BAJAJ, SANJIV GUPTA
DiagnosticTechniques in
Proptosis27IntroductionProptosis is defined as an anterior displacementof the globe from its normal position in the orbit.The orbit is a unique area packed with numerousvital structures which are delicately poised ina dynamic equilibrium. Even a minute alterationin this balance can lead to clinically significantramifications. Orbit is a closed cavity whichusually does not allow for direct evaluation ofany pathological process developing inside, andis often referred to as a Pandora box. It is awatershed area, being the meeting ground ofmany specialities and, therefore, a collaborativeapproach is required in the diagnosis andmanagement of orbital disorders. A wide varietyof disease processes can involve the orbit suchas inflammations, parasitic infestations,metabolic and endocrine disturbances (Fig. 27.1),vascular anomalies, primary and metastatictumors (Figs 27.2 and 27.3), depending on theage group and other predisposing factors.Common orbital tumors encountered arecavernous hemagioma, lacrimal pleomorphicadenoma, meningioma, dermoid cysts, opticnerve glioma and lymphoma, to name a few.Parasitic involvement of the orbit, especiallycysticercosis and occasionally hydatid cyst are
Fig. 27.1: A patient with thyroid ophthalmopathy withbilateral exophthalmos
Fig. 27.2: Clinical photograph of a patient showing proptosisof the right eye with marked downward and outwarddisplacement of the globe

427Diagnostic Techniques in Proptosis
not uncommon in developing countries.Endocrine disturbances, such as thyroiddysfunction, could have some of their earliestmanifestations in the orbit and adnexa.
In a case of proptosis, as in any other clinicalsituation, the diagnostic work-up begins witha careful history and clinical examination. Thedegree of proptosis is quantified by performingan exophthalmometry. The most commonly usedinstrument is the Hertel’s exophthalmometer (Fig.27.4), in which the position of the anterior cornealsurface is recorded, taking the lateral orbital rimas a reference point. An absolute reading greaterthan 21 mm or a relative difference of more than2 mm between the two eyes is used as a cut-off value for diagnosing proptosis. Some of the
important clinical parameters to be taken intoconsideration are the laterality, direction of globedisplacement, characteristics of the mass ifpalpable, visual status and posterior segmentevaluation. A vast array of diagnostic techniqueshave evolved over the years to confirm thepresumptive clinical diagnosis. This chapterdescribes techniques which complement theprocess of diagnosis in a case of proptosis andare crucial for appropriate management.
Diagnostic TechniquesA large number of diagnostic techniques areavailable for evaluation of a case of proptosis.However, as a general principle, one shouldfollow a graded approach in employing thesetechniques, starting with the less invasive onesand going on to the more invasive ones, onlyif indicated. One should also be able to distinguishas to which group of investigations would berelevant in a particular case. The noninvasivetechniques include imaging studies, which arethe cornerstone in reaching a diagnosis in a caseof proptosis. Invasive techniques are aimedmainly on efforts to reach a tissue diagnosis,which entails harvesting of tissue and subjectingit to routine and specialized histopathologicaltests.
Imaging Techniques
Standard Roentgenography (Plain X-ray)
Standard X-rays of the orbit were a useful imagingtechnique for initial screening before the adventof CT. They are of value in demonstrating bonychanges and particularly fractures and foreignbodies in the orbit. Special optic foramen viewscan be obtained to visualize enlargement whichcan denote apical tumors. There are a varietyof views of the orbit that can be requested, each
Fig. 27.3: A child with acute onset proptosis of theright eye suggestive of an orbital malignancy
Fig. 27.4: Hertel’s exophthalmometer

428 Diagnostic Procedures in Ophthalmology
with its own specific benefits. These include theCaldwell view (general view), Water’s view(orbital view), Rhese view (optic foramen) andLateral view/axial basal view (paranasalsinuses).
Important findings to look out for includeorbital enlargement (trauma, benign tumor),orbital wall erosion (benign pathology), orbitalwall destruction (malignant pathology),calcification (phlebolith, meningioma, lacrimalgland carcinoma, retinoblastoma), hyperostosis(meningioma, Paget’s disease, malignantosteoblastic secondary, fibrous dysplasia),enlargement of the optic foramen (optic nerveglioma, meningioma) and enlargement of thesuperior orbital fissure (aneurysm or tumor withposterior extension).
Ultrasonography (USG)
Ultrasonography is a rapid noninvasive tool forthe evaluation of orbital lesions causingproptosis. As most USG machines are compactand portable, it can be performed in an officesetting as well as peroperatively. It gives usefulinformation about the characteristics of the lesionand can even clinch the diagnosis when doneby an experienced observer. Despite being inferiorto CT-scan and MRI in depicting the bony wall,orbital apex, adjacent sinuses and intracranialcompartments, ultrasound is arguably a betterimaging modality in the detection of subtlechanges of the soft tissues within the orbit, andthe differentiation of extraocular muscles andoptic nerve lesions. The machine basicallyconsists of a transducer at the tip of a probewhich emits ultrasonic waves by the vibrationof a piezo-electric crystal inside the probe. Thesewaves are reflected, scattered and absorbed bythe medium. The reflected waves are thenprocessed in a computer to generate a single ormultidimensional picture on a screen.Ophthalmic USG uses frequencies ranging
between 6 and 20 MHz (typically 10 MHz). Thespeed of sound varies with the medium, andin the orbit it is usually 1550 m/s. The lowerfrequencies provide better penetration but lowerresolution and vice-versa. Ultrasound is, however,of limited value in assessing lesions of theposterior orbit; (sound waves at 8-10 MHz donot penetrate beyond the mid-orbit) or the sinusesor intracranial space.
Standardized A-scan is a time-amplitudedisplay mode where we get one dimensionaldisplay of vertical (amplitude) spike and thehorizontal axis which is modified to display thedistance in millimeters. The A-scan gives usimportant information regarding the internalstructure of a lesion. For example clear cysts andhomogenous solid lesions (e.g. lymphoma)typically produce low amplitude internal spikes(reflectivity) whereas heterogeneous lesions (e.g.hemangioma and dermoids) produce higheramplitude echoes within the normal orbitalpattern.
B-scan is a two dimensional intensitymodulated display. It is seen as a funnel-shapeddisplay on the screen, the mouth of the funnelbeing on the right, the probe position (transducerband) is on the right and the horizontal extenton the right gives the depth of penetration ofsound beam. The vertical axis represents thesegment of the eye being scanned. B-scan allowsa real time evaluation of any lesion andsuccessive cross sections are displayed on themonitor. The signal amplitude is displayed asdots whose brightness gives an idea of the strengthof the returning echoes, which is referred to asthe Gray scale. Orbital B-scan can be transocular
where the beam crosses the globe, which is thenseen in front behind which the orbital shadowis displayed, or par-ocular, which bypasses theglobe and is used mainly for anterior orbitallesions. B-scan shows rather characteristicalterations of the normal orbital pattern in variouslesions such as tumors, cysts and inflammation.

429Diagnostic Techniques in Proptosis
For example, one can differentiate thyroidorbitopathy from pseudotumor by demonstrating“tendon sparing” thickening of extraocularmuscles in thyroid ophthalmopathy (Fig. 27.5)as contrast to tendonitis and posterior scleritiswhich typically occur in idiopathic orbitalinflammatory disease (IOID) or pseudotumor. Inaddition certain lesions can be definitelydiagnosed on USG like cavernous hemangioma(Fig. 27.6), cysticercosis and hydatid cyst (Figs27.7 and 27.8).
Another important application of USG is forserial measurements of size of lesions andevaluation of response to therapy like in the caseof orbital cysticercosis, dysthyroid ophthalmo-pathy, and optic nerve thickness in optic neuritis.
Color Doppler (CD) imaging is one of the mostimportant developments of the last decade (Figs27.9A and B). It allows evaluation of blood flowalong with simultaneous B scan imaging of thelesion and can definitely diagnose lesions such asorbital varices, A-V malformations and carotid-cavernous sinus fistulas. The patterns obtained
Fig. 27.6: Ultrasound A- and B-scan of the orbit showinga well demarcated, intraconal lesion with high internalreflectivity and moderate sound attenuation, suggestiveof cavernous hemangioma
Fig. 27.5: Ultrasound picture in a case of thyroid ophthalmopathy showingenlargement of the belly of an extraocular muscle with tendon sparing

430 Diagnostic Procedures in Ophthalmology
Fig. 27.7: Ultrasound picture showing an orbital cystwith scolex suggestive of cysticercosis
Fig. 27.8: Ultrasound picture showing an orbital cystwith “double wall sign” typical of hydatid cyst
Figs 27. 9A and B: Color Doppler examination in a caseof orbital varices. A Before and B After Valsalva maneuvershowing low blood flow velocity on dynamic evaluationreveal information on the extent of arterial or
venous flow in the substance of the lesion.Apart from these, there are other methods
of USG like C-scan which depicts orbital lesionsin a coronal plane and D-scan which providesa three dimensional display.
Three-dimensional ultrasound (3D USG)imaging is a novel way of imaging ophthalmicpathologies in vivo, revealing valuabletopographic information in ways more familiarand recognizable to the untrained eye, wheresurfaces can be perceived and their approximaterelationships in three-dimensions can bepresented (e.g. to determine the contour and size
of tumors, to ascertain the shape and relativeconfigurations of tissues and structures in theeye). Three-dimensional USG imaging allowsvolumetric and topographic reconstruction of thevitreous, retina, choroid, sclera, and orbitalstructures. Volumetric reconstruction is valuablein tumor growth assessment, while topographicmapping provides a more comprehensivequantitative description of the surface andmarginal parameters responsible for volumetricchanges.
A
B

431Diagnostic Techniques in Proptosis
Computed Tomography
Computed tomography (CT) is one of the mostimportant investigations in a case of proptosisas it gives anatomic details par excellence. It hasrevolutionized the management of orbitaldisorders and is valuable for delineating theshape, locations, extent, and characteristics oflesions of the orbit. Furthermore, current CT- scanadministers a dose of radiation which comparesfavorably with an X-ray of the skull. Its spatialresolution is 0.5 mm. Eight slices are requiredto perform an orbital scan which extend fromthe maxillary sinus below to inferior part of thefrontal lobe above, and include the optic chiasmand pituitary area. Axial-scan is done in supineposition and coronal in prone position. Forsagittal views, re-formating of images is requiredas they cannot be done directly. ‘Bone windows’
are available to enhance bony changes and three
dimensions reconstruction is possible to aid insurgical planning. Suspected orbital diseaseassociated with paranasal sinus disease, thyroidophthalmopathy, foreign bodies, hemorrhage, ororbital trauma is evaluated using noncontrastCT, while the visualization of tumors that arewell supplied with blood vessels (e.g.meningioma) or whose blood vessels leak isimproved by the use of IV contrast enhancing
agents. CT-scan has resolution and tissue contrastcapabilities allowing for the imaging of softtissues, intracranial structures, masses orprocesses suspected of calcification such aslymphangioma (Fig. 27.10), bones (e.g. sinusanatomy) or bony destruction (e.g. leukemia,lymphoma, histiocytosis, and rhabdomyo-sarcoma), contrast containing blood vessels andforeign bodies. Coronal sections with 2-3 mmslices should be specifically asked for in casesof blow-out fractures and for assessingextraocular muscle size in Graves ophthalmo-pathy. High resolution CT with 1 mm cuts isuseful for studying optic nerve lesions. Axialsections show both globes, the horizontal rectusmuscles, optic nerve, other orbital soft tissue andbony structures. Coronal section, anteriorly,shows globe with relation to recti muscles andposteriorly, all four rectus muscles, obliquemuscles, optic nerve and soft tissue of the orbit.At the apex it also shows the optic foramen.
CT adequately documents findings such asthe extent of proptosis, muscle enlargement,location (intraconal or extraconal) and size ofa lesion, compression of the globe or optic nerveand presence or absence of bone erosion, as wellas the condition of adjacent sinuses and thepresence of intracranial involvement. It alsoshows the internal characteristics of the lesion—
Fig. 27.10: Clinical and CT picture in a case of orbital lymphangioma. CT shows adiffuse, poorly defined, heterogenous lesion with minimal enhancement

432 Diagnostic Procedures in Ophthalmology
Fig. 27.11: CT-scan (axial view) showing a well delineated,fusiform, intraconal mass isodense to the optic nerve,suggestive of glioma
whether it is homogeneous or heterogeneous,solid or cystic, presence of calcification and theeffect of contrast enhancement. Benign tumorssuch as cavernous hemangioma, neurilemoma,dermoids and gliomas (Fig. 27.11) usually haverounded well circumscribed borders. Malignantlesions on the other hand have diffuse, irregularboundaries. Important features of thyroidophthalmopathy include swelling of musclesmaximally in the mid-portion (Fig. 27.12) (relativesparing of the tendons), slight uveo-scleralthickening, apical crowding, increase in thediameter of the retrobulbar optic nerve sheath,increased density of orbital fat, and anterior
Fig. 27.12: CT-scan (axial view) showing significantenlargement of extraocular muscles with sparing of tendonsin a case of thyroid exophthalmos
Fig. 27.13: CT-scan (coronal view) showing an infiltrativelesion in the lacrimal gland fossa with irregular internalstructure suggestive of a malignant lacrimal gland tumor
displacement of the lacrimal gland. CT is a usefulmodality for the evaluation of lacrimal fossamasses, especially epithelial tumors (Fig. 27.13).CT can adequately depict osseous alterationsand calcifications, and can differentiate a groupof epithelial tumors from inflammatory andlymphoproliferative conditions. Features specificof orbital pseudotumor include a poorly definedintra- or extraconal mass close to the surfacemargin of the globe. In the myositic type onemay get enlargement of one or more musclesclose to their insertion, with ill-defined margins.Other features of orbital pseudotumor are thatit typically involves muscles and tendoninsertions, there is increased density of retroorbitalfat, thickening and enhancement of sclera nearTenon’s capsule and enlargement of the lacrimalgland. Lymphangioma may be diagnosed if thereis a multi-lobulated pattern on CT-scan (Fig.27.10) and a cystic internal structure instandardized ultrasound evaluation. Cavernoushemangiomas show as well circumscribed, solid,masses involving the intra or extraconalcompartment. On CT-scan lymphoproliferativetumors typically show up as a localized or diffusemass with moulding to the orbital structures.

433Diagnostic Techniques in Proptosis
Magnetic Resonance Imaging
Magnetic resonance imaging (MRI) is anoninvasive imaging technique which does notemploy ionizing radiation and has no knownadverse biological effects. The process involvesa strong magnetic field which is applied to thebody (Fig. 27.14). It excites protons in the bodytissues and causes them to align in a particularorientation in relation to the magnetic field. Whenthe magnetic field is switched off, the protonsrelax to their original alignment and re-emit theenergy gained. The signal is recorded in termsof intensity and location. T1 weighting and T2weighting refer to two methods of measuringthe relaxation times of the excited protons afterthe magnetic field is switched off. The variousbody tissues have different relaxation times anda given tissue may be T1 or T2 weighted, implyingthat is best visualized on that particular typeof image. Coronal, sagittal and axial images canbe directly obtained. A surface coil is used forophthalmic purposes to enhance spatialresolution. Four basic parameters can be adjustedto identify different tissues: proton density oftissue, bulk motion of protons (flow), spin lattice
relaxation time (T1) and spin-spin relaxation time(T2).
Tissues with high proton (hydrogen nuclei)density (e.g. fat) emit a high signal as does lowproton flow (coagulated blood). Low signal isproduced by bone, sclera and sinus air and fasterproton flow like in flowing blood. In T1 image(short TR and TE, i.e. relaxation time and echotime, respectively), the fat is bright and vitreousdark, and is reverse in T2 image (long TR andTE). In proton density image (long TR and shortTE), the vitreous is intermediate density as seenin muscle, and the fat is seen brightly.
Paramagnetic substances like melanin andmethemoglobin alter the signal character of theimage causing relative brightness on T1 weightedimage. Similarly, gadolinium, a paramagneticsubstance is used as a contrast agent (coupledwith diethylenetriaminepenta acetic acid orDTPA). Using this, false negative tests have beenvastly removed and imaging of meningiomas,demyelination, metastasis, meningeal lesions,ventricular abnormalities and pituitary masseshave been greatly enhanced. A few contraindi-cations are there to the administration of contrast,the relative ones being severe hepatic or renaldysfunction and absolute ones include sickle-cell anemia and hemolytic anemia. Mild allergicreactions may still occur.
Technical advances in MRI include the useof various surface coils, motion artifact and fatsuppression techniques which greatly enhancevisualization of orbital images. Contrast-enhanced MRI (using IV gadolinium) is helpfulin the evaluation of orbital lesions such ascavernous hemangiomas, high-flow vascularmalformations (IV gadolinium enhancementbrightens vascularized lesions so that theyexhibit the same density as fat), nonthyroidrelated extraocular muscle enlargement, whichincludes myositis or metastases, or processes thatpotentially extend into the cavernous sinus.
Fig. 27.14: A patient undergoing an MRI-scan

434 Diagnostic Procedures in Ophthalmology
Fig. 27.15: MRI-scan of the orbit (axial view, T1 weighted)showing a hyperintense lesion at the posterior polesuggestive of choroidal melanoma
Fig. 27.16: MRI-scan of the orbit (sagittal view, T2 weighted)showing a hypointense lesion at the posterior polesuggestive of choroidal melanoma
of the cystic nature of the lesion and thehemorrhages in lymphangiomas), it is interestingto note that these lesions typically do not enhancewith gadolinium. In thyroid ophthalmopathy onenotices a high signal intensity in enlarged eyemuscles on T2W1. In orbital pseudotumor thelesion is isodense to fat on T2W1.
MRI of the orbit is especially useful in opticnerve lesions or trauma, unusual orbitalinflammation, orbital metastasis (Fig. 27.17) andtumors extending to the orbital apex or havingsuspected intracranial extension.
Salient contraindications to performing anMRI scan include the presence of ferrous metallicforeign bodies (even mascara which containsferrous compounds cause artifacts), aneurysmclips, cardiac pacemaker and cochlear implants.In addition, claustrophobic and obese patientsmay pose problems. Other limitations of MRIare lack of bone visualization, higher cost andlonger time of scan.
An interesting advancement in MRI isMagnetic Resonance Angiography (MRA) in whichspecial software is used to suppress normal softtissue to enhance vascular structures (Fig. 27.18).This is analogous to bone window setting onCT-scan. Gadolinium enhancement is needed
Fig. 27.17: MRI-scan of the orbit (sagittal view, T1weighted) showing orbital metastasis
On MRI, melanin within melanomas typicallygives such tumors a hyperintense signal on T1-weighted scans (Fig. 27.15) and hypointensesignal on T2-weighted scans (Fig. 27.16) relativeto the vitreous. Non-contrast, fat-suppressionstudies help to determine the extension of ocularmelanoma into the orbit and optic nerve.Subretinal hemorrhage may be differentiated fromchoroidal melanoma by MRI when visualizationis poor and ultrasound inconclusive. While MRIis a more useful diagnostic modality inlymphoangiomas (better anatomical illustration
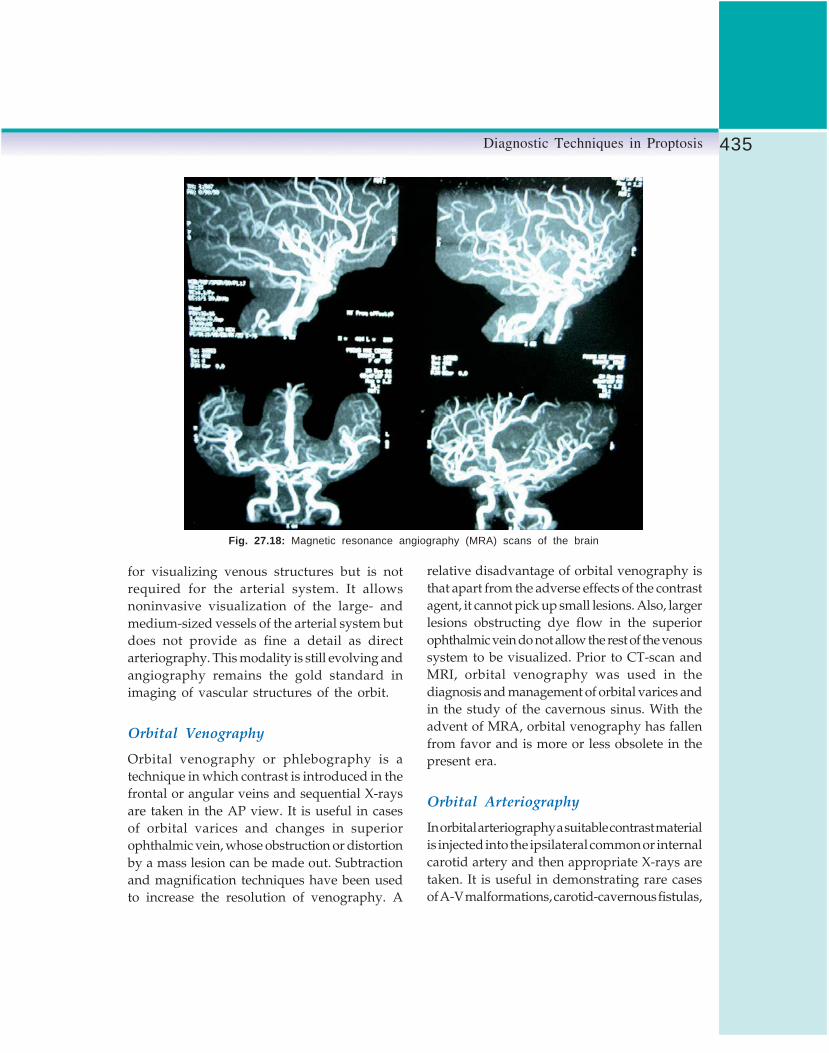
435Diagnostic Techniques in Proptosis
Fig. 27.18: Magnetic resonance angiography (MRA) scans of the brain
for visualizing venous structures but is notrequired for the arterial system. It allowsnoninvasive visualization of the large- andmedium-sized vessels of the arterial system butdoes not provide as fine a detail as directarteriography. This modality is still evolving andangiography remains the gold standard inimaging of vascular structures of the orbit.
Orbital Venography
Orbital venography or phlebography is atechnique in which contrast is introduced in thefrontal or angular veins and sequential X-raysare taken in the AP view. It is useful in casesof orbital varices and changes in superiorophthalmic vein, whose obstruction or distortionby a mass lesion can be made out. Subtractionand magnification techniques have been usedto increase the resolution of venography. A
relative disadvantage of orbital venography isthat apart from the adverse effects of the contrastagent, it cannot pick up small lesions. Also, largerlesions obstructing dye flow in the superiorophthalmic vein do not allow the rest of the venoussystem to be visualized. Prior to CT-scan andMRI, orbital venography was used in thediagnosis and management of orbital varices andin the study of the cavernous sinus. With theadvent of MRA, orbital venography has fallenfrom favor and is more or less obsolete in thepresent era.
Orbital Arteriography
In orbital arteriography a suitable contrast materialis injected into the ipsilateral common or internalcarotid artery and then appropriate X-rays aretaken. It is useful in demonstrating rare casesof A-V malformations, carotid-cavernous fistulas,

436 Diagnostic Procedures in Ophthalmology
aneurysms and hemangiopericytoma. Maximumvisualization can be obtained by the use ofmagnification to allow viewing of the smallercaliber vessels, and subtraction techniques toradiologically eliminate bone. With the adventof MRI and CT, particularly MRA, its role andutility are gradually fading out.
Blood Tests
The nature of the blood investigations performedwill depend to a large degree upon the clinicalfindings of the patient. Given herein are someof the more commonly utilized blood investiga-tions to assist in the evaluation of a patient withproptosis.
Total and Differential Blood Counts
This test is particularly useful in evaluatingpatients with leukemia and lymphomas.
Thyroid Function Tests
Thyroid function tests include tests of T3, T4and TSH. These tests will be abnormal in amajority of patients with thyroid ophthalmo-pathy. However, if thyroid disease is stronglysuspected and these tests are normal, additionalendocrine studies can be considered. Further testswhich can be done include the antithyroglobulinand antimicrosomal antibodies, which areabnormal in nearly 70% of patients with Gravesdisease.
Antineutrophil Cytoplasmic Antibody(cANCA) Serum Assay
Diagnosis of Wegener’s granulomatosis shouldbe considered in patients with scelrokeratitis orcoexisting sinus disease and orbital mass lesions.The antineutrophil cytoplasmic antibody(cANCA) serum assay is a very sensitive testfor the presence of this rare disease.
Serum Angiotensin Converting Enzyme
The diagnosis of sarcoidosis may be assistedby testing for serum angiotensin convertingenzyme (ACE). This multi-system granulomatousinflammatory condition may present withlacrimal gland enlargement.
ELISA for Cysticercosis
Elisa test is used for evaluating the presence ofan orbital cyst, if cysticercosis is suspected.However, it needs to be corroborated with clinicaland imaging findings due to a high percentageof both false positive and false negative results.
Biopsy Techniques
Although imaging techniques can help us inmaking a provisional diagnosis and areindicative in nature, a definitive diagnosis canonly be made by obtaining a tissue specimenand subjecting it to routine and specializedhistopathological techniques. Biopsy techniqueswhich are commonly employed are describedbelow.
Fine Needle Aspiration Cytology
Fine needle aspiration cytology (FNAC) isemployed for rapid diagnosis of suspectedmalignant orbital lesions. It is minimally invasivein nature and can be performed in an officesetting. Although strict asepsis is mandatory,a full fledged operative set up is not required.It is done with the help of a hand held gun with22 to 25 gauge needle (Fig. 27.19). After localizingthe mass by palpation (for anterior orbital lesions)or under ultrasound or CT guidance (for relativelyposterior lesions), the needle is introduced intothe mass and the material is aspirated by usingnegative pressure. The aspirate is then spreadover a slide, air dried, fixed in 95% alcohol and
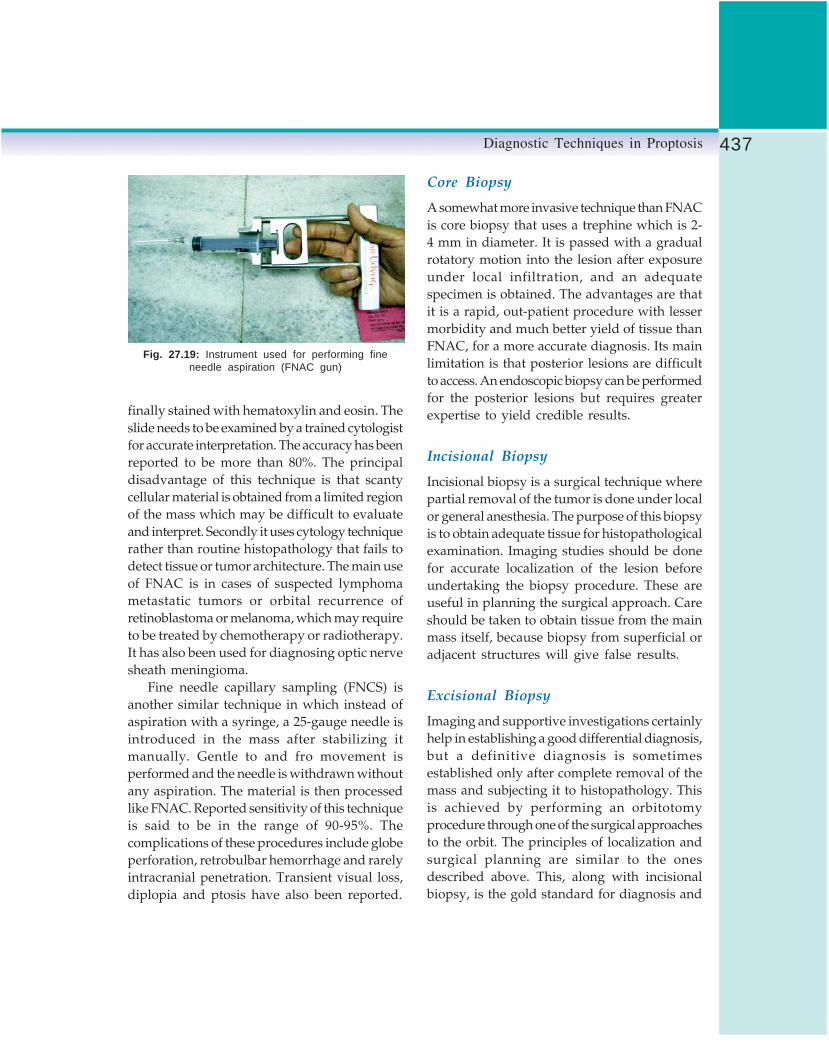
437Diagnostic Techniques in Proptosis
finally stained with hematoxylin and eosin. Theslide needs to be examined by a trained cytologistfor accurate interpretation. The accuracy has beenreported to be more than 80%. The principaldisadvantage of this technique is that scantycellular material is obtained from a limited regionof the mass which may be difficult to evaluateand interpret. Secondly it uses cytology techniquerather than routine histopathology that fails todetect tissue or tumor architecture. The main useof FNAC is in cases of suspected lymphomametastatic tumors or orbital recurrence ofretinoblastoma or melanoma, which may requireto be treated by chemotherapy or radiotherapy.It has also been used for diagnosing optic nervesheath meningioma.
Fine needle capillary sampling (FNCS) isanother similar technique in which instead ofaspiration with a syringe, a 25-gauge needle isintroduced in the mass after stabilizing itmanually. Gentle to and fro movement isperformed and the needle is withdrawn withoutany aspiration. The material is then processedlike FNAC. Reported sensitivity of this techniqueis said to be in the range of 90-95%. Thecomplications of these procedures include globeperforation, retrobulbar hemorrhage and rarelyintracranial penetration. Transient visual loss,diplopia and ptosis have also been reported.
Core Biopsy
A somewhat more invasive technique than FNACis core biopsy that uses a trephine which is 2-4 mm in diameter. It is passed with a gradualrotatory motion into the lesion after exposureunder local infiltration, and an adequatespecimen is obtained. The advantages are thatit is a rapid, out-patient procedure with lessermorbidity and much better yield of tissue thanFNAC, for a more accurate diagnosis. Its mainlimitation is that posterior lesions are difficultto access. An endoscopic biopsy can be performedfor the posterior lesions but requires greaterexpertise to yield credible results.
Incisional Biopsy
Incisional biopsy is a surgical technique wherepartial removal of the tumor is done under localor general anesthesia. The purpose of this biopsyis to obtain adequate tissue for histopathologicalexamination. Imaging studies should be donefor accurate localization of the lesion beforeundertaking the biopsy procedure. These areuseful in planning the surgical approach. Careshould be taken to obtain tissue from the mainmass itself, because biopsy from superficial oradjacent structures will give false results.
Excisional Biopsy
Imaging and supportive investigations certainlyhelp in establishing a good differential diagnosis,but a definitive diagnosis is sometimesestablished only after complete removal of themass and subjecting it to histopathology. Thisis achieved by performing an orbitotomyprocedure through one of the surgical approachesto the orbit. The principles of localization andsurgical planning are similar to the onesdescribed above. This, along with incisionalbiopsy, is the gold standard for diagnosis and
Fig. 27.19: Instrument used for performing fineneedle aspiration (FNAC gun)

438 Diagnostic Procedures in Ophthalmology
has the added advantage of being therapeuticin benign encysted lesions like dermoids,cavernous hemangioma, pleomorphic adenomaof lacrimal gland, neurilemoma and fibroushistiocytoma.
Pathology Techniques
This area is the most important part of anydiagnostic process as it provides actual tissuediagnosis, which may have therapeutic andmedico-legal importance. It is imperative to haveproper communication with the pathologistpreoperatively, to facilitate and plan theappropriate histopathologic technique for a givencase.
Cytology
As already stated under the section on FNAC,cytology is a low cost technique for rapiddiagnosis. The aspirate is spread over a slideand air dried followed by alcohol fixation andstained by Papanicolaou technique and H&Eor May-Grunwald-Giemsa stain; mainly usedfor suspected malignant lesions. Cytology hasits limitations as discussed earlier.
Gross Examination
The gross excised specimen is inspected for shape,size, consistency (firm/hard/cystic/nodular),and whether the capsule is intact or broken.Measurements are made in three dimensions.Then it is cut to see the internal architecture –color, areas of necrosis, calcification and innerstructure (solid or cystic). For example, on grossexamination, pleomorphic adenoma of thelacrimal gland displays an intact capsule, withfirm, bosselated appearance, and on cut sectionit has whitish, firm solid areas with some inter-spersed friable areas. Cavernous hemangiomaon the other hand has a reddish-bluish color
and has a firm to soft spongy consistency (Fig.27.20). On cut section, it has a typical honeycombpattern of innumerable cystic spaces (Fig. 27.21),which can be very well appreciated on H&E stain(Fig. 27.22). Parasitic cysts, such as hydatid cystare seen as a thin walled translucent fluid-filledstructure (Fig. 27.23). The gross specimen is sentto the pathologist in a labeled bag filled with10% formalin solution in adequate quantity.
Routine Histopathology
The biopsy or excised specimen is furtherprocessed in the pathological laboratory by
Fig. 27.20: Gross specimen of an orbital cavernoushemangioma
Fig. 27.23: Gross section of an orbital cavernoushemangioma (gross specimen)

439Diagnostic Techniques in Proptosis
Fig. 27.22: Histopathological picture (H & E) of cavernoushemangioma showing large blood-filled spaces
dehydrating in alcohol. Then it is embedded inparaffin and sectioned with a microtome knife.This is followed by removal of paraffin andstaining with hematoxylin and eosin stain (Fig.27.24). Hematoxylin is a basic dye that bindsacidic structures like DNA and nuclei in cellswhile eosin is an acidic dye that stains basicstructures like proteins. This gives clues aboutthe nature of the lesion. For example, cells withprominent nuclei and scanty cytoplasm will stainblue as in lymphoma, retinoblastoma, inflam-matory lesions and basal cell carcinoma. On theother hand, cells with abundant cytoplasm likeepithelial cells and connective tissue as insquamous cell carcinoma and amyloidosis, willstain pink.
Fig. 27.24: Histpathological picture (H & E) ofpleomorphic adenoma of the lacrimal gland
Histochemistry
In situations where the routine histologicalprocess is difficult to interpret, varioushistochemical and immunohistochemicaltechniques provide assistance. For example, Oilred O or Sudan black are used to stain fat incases of sebaceous gland carcinoma or xantho-matous tumors. Similarly, Alcian blue is usedfor mucinous substances and PAS (Periodic acidSchiff) for glycogen and some fungal hyphae.Fontana is used for staining melanin, esterasefor cytoplasmic granules in leucocytes andBodian for nerve fibers.
Immunohistochemistry
Immuno-histo-chemistry is a highly sensitivetechnique, which utilizes the principle of antigen-antibody reaction to capture certain specificproteins in specific tissues, which can then pointout to the correct diagnosis. This reaction iscoupled by an enzyme, which then generatesa color reaction when combined with certainchemicals called chromogens. Monoclonalantibodies are directed against an importantgroup of cytoskeletal components calledintermediate filaments. These are specific for
Fig. 27.23: Gross specimen of a hydatid cyst of the orbit

440 Diagnostic Procedures in Ophthalmology
different tissues and can be diagnostic. Forinstance, cytokeratins are found in epithelial cellsand carcinomas, vimentin in mesenchymal cellsand sarcomas, desmin in striated and smoothmuscle cells, GFAP in glial cells andneurofilaments in neurons. Other examples areLCA (Leucocyte common antigen) used to stainlymphoid lesions; HMB 45 is used in melanomas,especially in cases of amelanotic melanomawhere pigmentation may not be seen. S100 isused for schwannomas and neurofibromas.Similarly, specific antibody-antigen reactions areused to differentiate B cell from T cell lymphomas.
Electron Microscopy
Scanning Electron Microscopy (SEM) andTransmission Electron Microscopy (TEM) aresometimes used in evaluating unusual lesions.TEM can be vital in the diagnosis of certain tumorssuch as leiomyoma, neurilemoma, neurofibromaand amelanotic melanoma and also in certainpoorly differentiated tumors like alveolarrhabdomyosarcoma and alveolar soft partsarcoma. It is an expensive and time consumingprocess. With the advent of the above mentionedimmunohistochemical stains, it is rarely used.SEM can be used to see the three dimensionalultrastructure of lesions and can provide elementaldetails of retained foreign bodies.
Additional InvestigationsOnce the initial cause of the proptosis has beendetermined, it is often necessary to undertakeadditional investigations to further determinethe full extent of the pathology. This isparticularly true in the cases where the causeof the proptosis is found to be a tumor. Forexample patients with hematological andlymphoproliferative tumors require the followingadditional investigations: X-ray chest, blood
counts, serum immunoglobulin electrophoresis,bone marrow aspiration and biopsy, bone scan,liver and spleen scan and abdominal and pelvicCT.
ConclusionDiagnosis of a case of proptosis requires asystematic approach through a proper clinicalevaluation coupled with appropriateinvestigative techniques. If used effectively, thesetechniques can guide the clinician in achievingan accurate diagnosis and optimal managementin this rather challenging field.
Bibliography1. Aburn NS, Sergott RC. Orbital Color Doppler
Imaging. Eye 1993;7:639-47.2. Aviv RI, Miszkiel K. Orbital imaging: Part 2.
Intraorbital pathology. Clin Radiol 2005;60:288-307.
3. Bartley GB, Gorman CA. Diagnostic criteria forGraves ophthalmopathy. Am J Ophthalmol1995;119:792-95.
4. Bilaniuik CT. Vascular lesions of the orbit inchildren. Neuroimaging Clin N Am 2005;15:107-20.
5. Devis PC, Newman NJ. Advances in neuro-imaging of visual pathways. Am J Ophthalmol1996;121:690-705.
6. Dutton JJ, Byrne SF, Proia AD. Diagnostic Atlasof Orbital Diseases. Philadelphia, Saunders, 2000.
7. Newton TH, Bilaniuk LT (Eds). Radiology ofEyes and Orbit. New York, Raven, 1990.
8. Rootman J (Ed). Diseases of Orbit: A Multi-disciplinary approach. Philadelphia, LippincottWilliam & Wilkins, 2003.
9. Shields JA, Shields CL. Atlas of Orbital Tumors.New York, William & Wilkins, 1999.
10. Shields JL, Shields JA, Honavar, SG, et al. Clinicalspectrum of primary ophthalmic rhabdomyo-sarcoma.Ophthalmology 2001;108:2284-92.
11. Wiersinga WM, Prummel MF. Pathogenesis ofGraves ophthalmopathy—current understan-ding (Editorial). J Clin Endocrinol Metab2001;86:501-03.

441Neurological Disorders of Pupil
AMBAR CHAKRAVARTY
NeurologicalDisordersof Pupil28
IntroductionPupillary examination is a powerful tool in theneurological evaluation. The key in understan-ding the significance of pupillary findings is toknow the anatomy of the system and to recognizethe various reactions of the pupil. It is furtherimportant to correlate historical information withclinical findings in the context of known anatomyto arrive at a cogent diagnosis. Studies on pupilhave also figured significantly in advances ofautonomic physiology.1-4
Anatomy and PhysiologyThe normal pupil is slightly situated inferomedialto the center of cornea. When viewed in thenatural state, the iris and pupil appear slightlylarger (12.5%) because of the corneal magnifi-cation. The sphincter muscle is located at thepupillary border and is more powerful than thedilator muscle. Blood supply of iris is throughthe radially arranged vessels arising from themajor arterial circle at the iris base. Pupillarycontrol is essentially a balance betweenparasympathetic and sympathetic system.Although pupillary size and reactivity, as wellas ciliary muscle tone, are basically controlled
by the autonomic nervous systems, the majorrole is played by the parasympathetic systemdue to the mechanical superiority of the sphinctermuscle.
Parasympathetic impulses arise in theEdinger-Westphal Complex (EWC), a centralpaired subnucleus of the oculomotor nerve inthe midbrain. Light directed into either eyeusually produces bilateral pupillary constriction.The pupillary light reflex (Fig. 28.1) begins withhyperpolarization of the retinal photoreceptors.Ultimately the retinal ganglion cells are activated.The retinal ganglion cells send their axonsthrough the optic nerve, chiasm and optic tractto synapse in the pretectal nuclei. Interneuronsthen connect the pretectal nuclei to the EWC.Efferent pupillary fibers arise from the EWC andtraverse the mesencephalon in the rostralfascicles of the third cranial nerve. It enters theorbit as part of the inferior division of the nerve,and arrives at the ciliary ganglion by means ofthe motor nerve to the inferior oblique muscle.Most of the pupillomotor fibers synapse in themain or accessory ciliary ganglion and reachthe iris sphincter muscle via the short ciliarynerves. Interruption in this pathway, EWC tothe sphincter muscle will cause pupillarydilatation and decreased reactivity. Afferent

442 Diagnostic Procedures in Ophthalmology
visual system pathology does produce differencein pupillary size. Pupillary constriction is alsoa component of a number of synkinetic reactionsinvolving parasympathetic activity–near reflex(miosis, accommodation, and convergence),Bell’s phenomenon (levator inhibition, superiorrectus muscle stimulation, and miosis) andWestphal-Piltz reaction (orbicularis spasm andmiosis). The cortical region responsible forsupranuclear generation of the near responseremains uncertain. It probably rises from diffusecortical projections. Ultimately, supranuclearinputs for the near reflex converge upon the rostralsuperior colliculus. From here connections aremade to the mesencephalic reticular formation,pretectum and EWC to generate the near triad—pupillary constriction, lens accommodation andconvergence.
First order neuron of sympathetic pathway(Fig. 28.2) arises in the hypothalamus anddescends through the reticular substance tosynapse in the intermediolateral gray substanceof the lower cervical and upper thoracic spinalcord (ciliospinal center of Budge Waller, C8-T1).Second order neuron arises in the intermedio-lateral gray column and then ascends withoutsynapse through the sympathetic paraspinalchain to the superior cervical ganglion. From
the superior cervical ganglion the postganglionicor third order neuron travels on the surface ofthe common carotid artery. At the bifurcationof the internal and external carotid arteries, fiberscontrolling facial sweating follow the externalcarotid artery, while those destined for the eyeand lid follow the internal carotid artery. In thecavernous sinus these eye and lid fibers join thefifth and sixth cranial nerves and enter the orbitvia the superior orbital fissure. Fibers destinedfor the dilator muscle enter the eye via the longposterior ciliary nerves or short posterior ciliarynerves.
Examination of PupilThe most important evaluation technique forpupil is the history. A careful history of knownpupillary disorders is vital to establish whethera pupillary sign has any meaning in the contextof the disorder under consideration. Rarely, a
Fig. 28.1: Pupillary light reflex pathway from retina throughoptic pathway to lateral geniculate body and then on toEdinger-Westphal nucleus complex and then along thethird nerve trunk to the iris sphincter
Fig. 28.2: Sympathetic pathway to the iris dilatormuscle

443Neurological Disorders of Pupil
patient will present with complaint of abnor-mality of pupil as a presenting symptom hencethe presenting complaints should be stressedupon to get a proper clue into the diagnosis ofpupillary abnormality such as associated historyof trauma, features of raised ICT, irritative lesions,poor visual acuity, lid lag, double vision anduse of drugs. Old photographs provide signifi-cant information and should be evaluated in allcases of long-standing or asymmetry documentedon examination. Bedside evaluation of pupil andits reactions require a good visibility with comfortof patient and examiner. Examination of pupilrequires a good illuminator which providesbright, even beam without hot spots or dim areas.Evaluation should begin in darkness or in verydim light as this allows the pupils to start theirconstriction from a bigger size and increases theamplitude of the pupillary movement makingit easier to see. There are three stages in theexamination of the pupils.
Evaluation of Anisocoria
Pupillary inequality is usually due to an irisinnervation problem. The best way to decidewhether it is the sphincter muscle or the dilatormuscle that is weak is to compare the amountof anisocoria in darkness and in light. Noanisocoria in darkness or in light indicates anintact efferent arm of the light reflex arc. Virtuallyeveryone has a measurable pupillary sizedifference if sensitive enough techniques are used;however, only 20% of normal individuals haveenough asymmetry to be recognized clinically(i.e., 0.4 mm or more). Age plays a major rolein pupillary size. Newborns have smallhyporeactive pupils, young children have larger,briskly reactive pupils and as the age progressthe normal pupillary size and reactivitydiminishes such that older individuals havemiotic, relatively slowly reactive pupils.
Evaluation of the Afferent Arm ofthe Light Reflex Arc
Swinging-Light Pupil Test
The swinging-light pupil test is a rapid, low cost,accurate and objective method of identifyingasymmetric optic nerve disease but it is uselessunless proper technique is used. The idea is tolook for a Relative Afferent Pupillary Defect(RAPD) in one eye compared to the other byalternate projection of light over each eye (Fig.28.3).
Technique
1. The room illumination should be dim. Unlessthe test is performed in darkness, the ampli-tude of pupil constriction will be too low.
2. The patient should fixate on a distant target.This provides maximal relaxation of the irissphincter muscle. A near target would evokemiosis associated with the synkinetic nearreflex.
3. Use a bright light stimulus. Dim lights donot produce enough pupil constriction. Ifneither pupil constricts very much to
Fig. 28.3: Left afferent pupillary defect (RAPD)

444 Diagnostic Procedures in Ophthalmology
flashlight illumination, use a more potent lightsource, such as the indirect ophthalmoscope.Avoid a light so bright that it causesphotophobia or extreme miosis.
4. Direct the light from below the level of thepatient’s eyes. This is done so as not to provokemiosis from the patient’s fixing on the light.
5. Move the light briskly and rhythmically fromeye to eye several times. If you move the lightacross the nose too slowly, you will evoketoo much constriction and miss a subtlerelative afferent pupil defect. Make about fiveswings. This repetition is necessary to be surethat any pupillary dilation on one side doesnot reflect merely the adventitious sphinctermovement of physiologic pupillary unrest.
Interpretation
A relative afferent pupillary defect (RAPD) isa sensitive indicator of unilateral or asymmetricinjury to the afferent pupillary pathway. If aRAPD is found, it needs to be investigated. Ingeneral, the size of the RAPD correlates withthe asymmetry of visual field loss and theresultant asymmetry of pupillomotor input. Italso tends to vary with the location of the lesionwithin the afferent pathway.
Retina
1. Large unilateral retinal lesions, i.e. retinaldetachment or central retinal artery occlusionproduce a clear RAPD. Visual acuity mightbe good if the macula is spared. A carefuldilated funduscopic examination is usuallydiagnostic, and a consultation with anophthalmologist/neurologist is important.
2. Cataracts and corneal opacities do not causeafferent pupillary defects.
Optic Nerve
Damage to the optic nerve almost alwaysproduces a RAPD. Visual acuity loss may be
mild or severe, but a visual field abnormalitycan almost invariably be detected by a perimetry.The optic disk may appear normal or acutelyswollen but will later develop pallor. Examplesof optic nerve disorders include optic neuritis,ischemic optic neuropathy, hereditary opticneuropathy, compressive lesions, toxins, trauma,and cellular infiltration.1. The largest afferent defects occur in associa-
tion with unilateral optic nerve disorders.2. “Resolved” optic neuritis may result in optic
disk pallor and RAPD despite recovery tonormal visual acuity and normal visual field.
3. The extent of damage in bilateral optic nervedisorders is rarely symmetrical. Therefore, aRAPD will be found on the side with greaterdamage on carefully examination.
Optic Chiasm1. Compressive lesions of the optic chiasm can
produce asymmetric visual loss and, therefore,a RAPD. Commonly, a junctional scotomais found.
2. Symmetric bitemporal hemianopsia is notassociated with a RAPD, because injury to thevisual and pupillary pathways is symmetric.
Optic Tract
A pure optic tract lesion will produce a smallRAPD in the contralateral eye. Thus, a completehomonymous hemianopsia with an afferentdefect in the eye with the temporal field lossshould raise the possibility of a tract lesion asthe cause of visual loss.
Pretectal Nucleus
1. The pretectal nucleus in the dorsal midbrainis the final synapse site of pupillary fiberscoming from tract via brachium of the superiorcolliculus. Visual fibers, however, haveseparated off to go on to the lateral geniculatenucleus. Therefore, a dorsal midbrain lesioncan produce a small contralateral RAPD andno visual loss.

445Neurological Disorders of Pupil
2. Afferent pupillary defects form optic tract ormidbrain injury are usually small and arefairly rare.
Further Observations
The intensity of the RAPD, which is related moreclosely to differences in visual field loss thanvisual acuity loss in the two eyes, can bequantitatively measured by placing progressivelyhigher neutral-density filters over the normal eyeuntil the RAPD is eliminated.5,6 The filters areparticularly useful when the diagnosis of RAPDis equivocal. The examiner places the 0.3-log unitfilter over each eye consecutively and performsthe swinging-light test. If no RAPD is present,the pupil of the eye covered by the filter dilatesslightly as the light is swung towards it. Whena RAPD is minimal, the filter placed over theaffected eye makes the pupil dilation in that eyemore obvious.
The swinging-light pupil test is useful evenwhen only one iris sphincter muscle isoperational. Constriction of the pupil in theunaffected eye as the light is swung toward itis equivalent to pupillary dilation in the eye withthe suspected RAPD. This phenomenon is called(misleadingly) a “reverse RAPD”, it is merelya different way to elicit a standard RAPD.
Evaluation of Near Response
The pupillary response to near effort must bechecked. If the light reaction seems a little weak,the examiner should look to see if the pupilsconstrict better to a near stimulus than to light.If they better constrict to light this is called ‘light-near dissociation’ and may indicate underlyingpathology like neurosyphilis, lesions of the dorsalmidbrain (obstructive hydrocephalus, pinealregion tumors) and aberrant regeneration(oculomotor nerve palsy, Adie’s tonic pupil).
Features of common causes of pupillaryasymmetry in neuro-ophthalmology have beengiven in Table 28.1 and the sites of lesions causingpupillary abnormalities are shown in Figure28.4.
Pupillary Abnormalities
Anisocoria
Local Ophthalmologic Conditions
Typically, patients with anisocoria due to localcauses have a painful red eye with a small pupiland visual disturbance.a. Any condition resulting in an inflammatory
response within the anterior chamber maycause spasm of the sphincter muscle,resulting in anisocoria.
b. Acute closed-angle glaucoma results in a redpainful eye and visual disturbance. In thiscondition, the pupil tends to be dilated, withan impaired light reflex that may simulateinterruption of the parasympathetic nervoussystem.
c. Prosthetic eyes have yet to show a brisk lightreflex.
d. Other important causes of irregular pupilswith poor light reflex are congenital malfor-mation of the iris, postoperative changes, andposttraumatic mydriasis due to tears in theiris and its sphincter muscle.
Episodic Anisocoria
Either parasympathetic or sympathetic paresisor over activity may produce intermittentanisocoria. The common causes of episodicanisocoria due to parasympathetic paresisinclude uncal herniation, seizure disorder andmigraine. Parasympathetic hyperactivityconditions like cyclic oculomotor paresis andparasympathetic spasm7 are known to add to

446 Diagnostic Procedures in Ophthalmology
TAB
LE 2
8.1:
CH
AR
AC
TER
ISTI
CS
OF
PU
PIL
S E
NC
OU
NTE
RE
D I
N N
EU
RO
-OP
HTH
ALM
OLO
GY
Con
ditio
nG
ener
alch
arac
teris
tics
Res
pons
e to
light
and
near
stim
uli
Roo
m c
ondi
tion
inw
hich
ani
soco
riais
gre
ater
Res
pons
e to
myd
riatic
sR
espo
nse
tom
iotic
sR
espo
nse
toph
arm
acol
ogic
agen
ts
Ess
entia
l an
isoc
oria
Rou
nd,
regu
lar
Bot
h br
isk
No
chan
geD
ilate
sC
onst
ricts
Nor
mal
and
rar
ely
need
ed
Hor
ner’s
syn
drom
eS
mal
l, ro
und,
unila
tera
lB
oth
bris
kD
arke
ned
Dila
tes
Con
stric
tsC
ocai
ne 4
% p
oor
dila
tatio
n
Adi
e to
nic
pupi
lU
sual
ly l
arge
r in
brig
ht l
ight
,se
ctor
pup
ilpa
lsy,
ver
mifo
rmm
ovem
ent
unila
tera
l or
les
sof
ten
bila
tera
l
Abs
ent
tolig
ht,
toni
c to
near
; to
nic
redi
latio
n
Ligh
ted
Dila
tes
Con
stric
tsP
iloca
rpin
e 0.
1%co
nstr
icts
Arg
yll-R
ober
tson
pupi
lsS
mal
l, irr
egul
ar,
bila
tera
lP
oor
to l
ight
,be
tter
to n
ear
No
chan
geP
oor
Con
stric
ts—
——
——
—-
Mid
brai
n pu
pils
Mid
dila
ted,
may
be o
val,
bila
tera
lP
oor
to l
ight
,be
tter
to n
ear
No
chan
geD
ilate
sC
onst
ricts
——
——
——
-
Ocu
lom
otor
pal
syM
id d
ilate
d,un
ilate
ral,
rare
lybi
late
ral
Fix
edLi
ghte
dD
ilate
sC
onst
ricts
——
——
——
—
Pha
rmac
olog
cally
dila
ted
pupi
lsV
ery
larg
ero
und,
uni
late
ral
Fix
edLi
ghte
d—
——
——
-N
oP
iloca
rpin
e 1%
does
not
con
stric
t

447Neurological Disorders of Pupil
Fig. 28.4: Sites of lesions in pupillary abnormalities
the episodic anisocoria. Other conditionsproducing the episodic anisocoria includesympathetic hyperactivity conditions, sympa-thetic dysfunction producing alternatinganisocoria and pupillary dilatation.
Dilated Pupil (anisocoria thatincreases in bright illumination)
The patient has anisocoria that increases in brightlight. Differential diagnoses of a dilated pupilinclude Adie tonic pupil, III cranial nerve palsy,and pharmacologic blockade.
Adie Tonic Pupil
Adie tonic pupil predominately occurs in femalesaged 20-50 years. Patient may complain of
photophobia, episodes of blurred near vision orblurred vision when switching from near to farviewing and may even complain of unequalpupils. Typically, the involved pupil displaysa poor response to light, with a relativelypreserved response to sustained near fixationbut an abnormally slow or tonic contraction. Slit-lamp examination often reveals sector palsiesof the iris. The parasympathetic defect in Adiepupil8 is believed to occur after the fibers leavethe ciliary ganglion. As a result of denervationsupersensitivity, the affected eye displays anabnormally brisk response to dilute (1/8%)pilocarpine and this test (Fig. 28.5) has beensuggested as a way of differentiating pregang-lionic and postganglionic parasympaheticlesions. Recent literature reports many patientswho have mydriasis due to oculomotor nerve

448 Diagnostic Procedures in Ophthalmology
compression and have displayed reactivity todilute pilocarpine, should show other signs ofthird nerve dysfunction. The combination of anidiopathic tonic pupil with decreased deeptendon reflexes and/or orthostatic hypotensionis termed Holmes-Adie syndrome. The conditionis common in young women. Adie pupil iscommonly unilateral, but may become bilateralin 10% cases. The symptoms of a tonic pupiltend to be self-limited. Adie pupil is believedto be of uncertain etiology. However, neuro-syphilis, diabetes, herpes zoster, giant cellarteritis, and alcoholism have been incriminated.A closely related rare condition is the Rosssyndrome characterized by the triad of segmentalanhidrosis, hyporeflexia and tonic pupils. Only
a handful of cases have been described in theworld literature so far.9 Harlequin syndromerefers to segmental anhidrosis only without anyocular manifestation. In fact, it is reasonable toassume that all these dysautonomic syndromes(Horner, Adie, Ross and Harlequin) representclinical manifestations of a generalizedautonomic injury with or without somaticnervous system involvement (e.g. areflexia).
Third Cranial Nerve Dysfunction
The most worrisome cause of an enlarge pupilis oculomotor nerve dysfunction. Anisocoria inthe setting of a head injury with decreased levelof consciousness may be due to uncal herniation.
Fig. 28.5: Mid pilocarpine test for right Adie’s pupil

449Neurological Disorders of Pupil
An expanding supertentorial lesion forcesthe inner basal edge of the uncus towards themidline and over the edge of the tentorium,thereby compressing the adjacent midbrain andoculomotor nerve. This results in ipsilateral thirdnerve palsy and decreased level of consciousness.In addition, the contralateral cerebral peduncleis compressed against the free edge of the tento-rium, resulting in the ipsilateral hemiparesis.Such patients require urgent intervention to lowerintracranial pressure and have a poor prognosiswithout surgical intervention. When a para-sympathetic pupillary defect coexists with ptosisand extraocular muscle palsies in a patient witha normal level of consciousness, the diagnosisis third nerve palsy with pupillary involvement.In these situations, one needs to exclude theposterior communicating artery aneurysm.Emergency neuroimaging is indicated unlessanother etiology is apparent.
Nonisolated Third CranialNerve Palsy
If other neurologic symptoms or signs are present,they will, in most cases, direct the clinician tothe site along the oculomotor nerve pathwaywhere the responsible lesion is likely to beresiding. For example, a patient with contralateralhemiparesis has a lesion in the midbrainipsilateral to the III nerve palsy, while a patientwith additional involvement of the VI cranialnerve probably has a lesion in the ipsilateralcavernous sinus. In some cases, the presence ofother neurologic or systemic features will suggestthe specific disorder responsible for theophthalmoplegia, as in an elderly patient withheadaches, weight loss, transient visual lossand tenderness of the superficial temporalarteries who is most likely harboring giant cellarteritis.
Isolated Third Cranial Nerve Palsy
Many times, however, a patient develops IIIcranial nerve palsy without other neurologic orsystemic symptoms or signs. In such patient,consideration of specific characteristics of theophthalmoplegia (e.g. status of the pupil) andhistorical details (e.g. static versus progressive)will help guide one to the likely disorderresponsible for the presentation.
There are five important causes of acute thirdnerve palsy seen in routine clinical practice.1. Infarction of the peripheral cranial nerve2. Compression by tumor3. Compression by aneurysm4. Trauma5. Brainstem stroke.
The list should probably also include Tolosa-Hunt syndrome or painful ophthalmoplegiasyndrome when considering clinical practice inthe Indian context. However, the overallimpression on the frequency of occurrence of thiscondition in India is probably somewhatoverestimated and certainly the condition wouldnot appear to be as prevalent if strict diagnosticcriteria (neuroradiological) are employed (vide
infra).
Most of the less frequent disorders causingoculomotor nerve palsy as well as trauma andbrainstem stroke listed above, occur in patientswith historical information or physical signs thatimplicate the underlying cause of ophthalmo-plegia (i.e. nonisolated). Therefore a neurologistevaluating a patient with acute and neurolo-gically-isolated III cranial nerve palsy facesfollowing dilemmas:• Is it due to infarction or compression (by
aneurysm)?• Can one wait and watch, or do one need
to image emergently?• Should one go directly to catheter angio-
graphy, or screen using a noninvasive testfollowing imaging to exclude aneurysm?

450 Diagnostic Procedures in Ophthalmology
Ischemic III cranial nerve palsy is the mostcommon pupil-sparing oculomotor palsy inmiddle-aged or older adults. It is usually theresult of infarction of the extra-axial segment ofthe oculomotor nerve,10 although patients withsimilar clinical characteristics have beendescribed who have documented midbrainstrokes.11 This condition has traditionally beenreferred to as “diabetic III nerve palsy” or “diabeticophthalmoplegia” since it frequently occurs inpatients with established diabetes. However, thesame condition may occur in patients who arenot diabetic but who have other overt orunrecognized vascular risk factors, most notablyleft ventricular hypertrophy (LVH) associatedwith hypertension and polycythemia.
Patients with the ischemic III nerve palsy havethe following clinical profile:• Age usually greater than 45 years,
occasionally, younger and those with long-standing diabetes.
• Abrupt onset.• Often times associated with a dull,
continuous pain around the ipsilateral brow,eye, or temple lasting a week or two, at most.
• Pupil usually normal, about 1/3 of patientsdemonstrate small anisocoria (one millimeteror less), but the pupil characteristicallyremains reactive to light. Anisocoria greaterthan one millimeter, or a “blown” pupil, isnot consistent with ischemic injury, andusually indicates that a mass lesion iscompressing the oculomotor nerve.
• Neurologically isolated, bilateral III nerve, oripsilateral IV or VI nerve, involvement is notconsistent with ischemic III nerve palsy.
• Progression of external ophthalmoplegiaduring the subsequent one to two weeksoccurs in about 2/3 of acutely-evaluatedpatients who have incomplete deficits at theirfirst visit. Progression of deficits beyond thisperiod indicates that the initial diagnosis was
in error and that a mass lesion is compressingthe third nerve.
• Excellent prognosis or spontaneous recovery(without signs of aberrant regeneration) isexpected within 3 months in 90% of patients.Recurrent events involving the same or otherocular motor nerves occur in at least 15%of patients.
Work-up for a Patient with Pupil-sparing Complete Third Nerve Palsy
Following investigation should be performed:• Fasting and 2 hour postprandial glucose esti-
mation and, if known diabetes, hemoglobinAlc assay (It is not uncommon to identifyunsuspected diabetes in a patient presentingwith ischemic ocular motor nerve palsy. Inthose with established diabetes, poor glycemiccontrol may be a predisposing factor).
• Serial blood pressure measurement and ECGlooking for LVH (As with diabetes, it is notuncommon to identify previously unsus-pected hypertension in this population).
• Hemoglobin and hematocrit (for poly-cythemia).
• Other evaluations for vascular risk factors,(as appropriate.)
• Erythrocyte sedimentation rate and/or c-reactive protein if patient is older than 55years to screen for giant cell arteritis.
• Neuroimaging is generally not necessaryunless:
• Age less than 45 years• Vascular risk factors not present• No recovery within 3 months• Signs of aberrant regeneration develop• Pupil becomes involved with anisocoria
> one millimeter• Other neurologic signs develop.Tumors that compress the III cranial nerve
in ambulatory outpatients are usually located
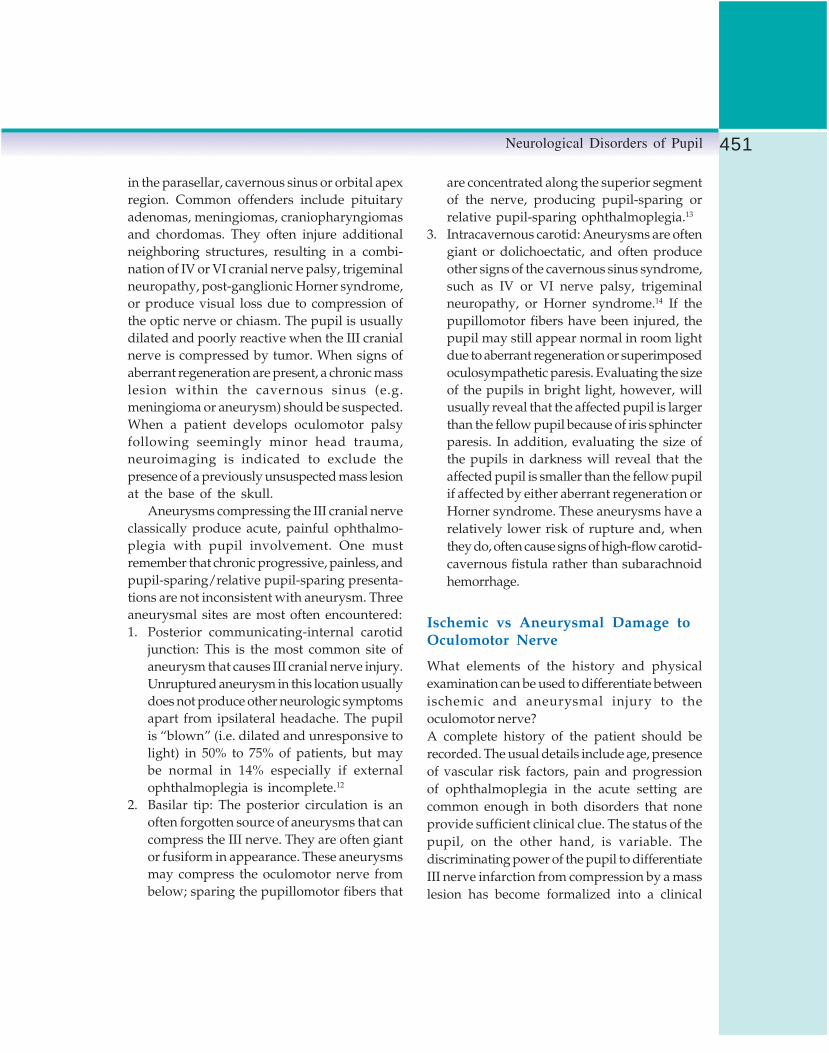
451Neurological Disorders of Pupil
in the parasellar, cavernous sinus or orbital apexregion. Common offenders include pituitaryadenomas, meningiomas, craniopharyngiomasand chordomas. They often injure additionalneighboring structures, resulting in a combi-nation of IV or VI cranial nerve palsy, trigeminalneuropathy, post-ganglionic Horner syndrome,or produce visual loss due to compression ofthe optic nerve or chiasm. The pupil is usuallydilated and poorly reactive when the III cranialnerve is compressed by tumor. When signs ofaberrant regeneration are present, a chronic masslesion within the cavernous sinus (e.g.meningioma or aneurysm) should be suspected.When a patient develops oculomotor palsyfollowing seemingly minor head trauma,neuroimaging is indicated to exclude thepresence of a previously unsuspected mass lesionat the base of the skull.
Aneurysms compressing the III cranial nerveclassically produce acute, painful ophthalmo-plegia with pupil involvement. One mustremember that chronic progressive, painless, andpupil-sparing/relative pupil-sparing presenta-tions are not inconsistent with aneurysm. Threeaneurysmal sites are most often encountered:1. Posterior communicating-internal carotid
junction: This is the most common site ofaneurysm that causes III cranial nerve injury.Unruptured aneurysm in this location usuallydoes not produce other neurologic symptomsapart from ipsilateral headache. The pupilis “blown” (i.e. dilated and unresponsive tolight) in 50% to 75% of patients, but maybe normal in 14% especially if externalophthalmoplegia is incomplete.12
2. Basilar tip: The posterior circulation is anoften forgotten source of aneurysms that cancompress the III nerve. They are often giantor fusiform in appearance. These aneurysmsmay compress the oculomotor nerve frombelow; sparing the pupillomotor fibers that
are concentrated along the superior segmentof the nerve, producing pupil-sparing orrelative pupil-sparing ophthalmoplegia.13
3. Intracavernous carotid: Aneurysms are oftengiant or dolichoectatic, and often produceother signs of the cavernous sinus syndrome,such as IV or VI nerve palsy, trigeminalneuropathy, or Horner syndrome.14 If thepupillomotor fibers have been injured, thepupil may still appear normal in room lightdue to aberrant regeneration or superimposedoculosympathetic paresis. Evaluating the sizeof the pupils in bright light, however, willusually reveal that the affected pupil is largerthan the fellow pupil because of iris sphincterparesis. In addition, evaluating the size ofthe pupils in darkness will reveal that theaffected pupil is smaller than the fellow pupilif affected by either aberrant regeneration orHorner syndrome. These aneurysms have arelatively lower risk of rupture and, whenthey do, often cause signs of high-flow carotid-cavernous fistula rather than subarachnoidhemorrhage.
Ischemic vs Aneurysmal Damage toOculomotor Nerve
What elements of the history and physicalexamination can be used to differentiate betweenischemic and aneurysmal injury to theoculomotor nerve?A complete history of the patient should berecorded. The usual details include age, presenceof vascular risk factors, pain and progressionof ophthalmoplegia in the acute setting arecommon enough in both disorders that noneprovide sufficient clinical clue. The status of thepupil, on the other hand, is variable. Thediscriminating power of the pupil to differentiateIII nerve infarction from compression by a masslesion has become formalized into a clinical

452 Diagnostic Procedures in Ophthalmology
dictum, the “rule of the pupil”. While this “rule”will work most of the time, there are importantpitfalls that must be recognized in order to avoidmissing aneurysms.
The “rule” states that a normal pupil impliesinfarction while a dilated pupil impliescompression (by aneurysm) of the oculomotornerve. What is the anatomic basis of this “rule”?The pupillomotor fibers are concentratedperipherally along the superior to mediallongitudinal segment of the 3rd nerve as it coursefrom the interpeduncular fossa to the cavernoussinus. Aneurysms arising from the junction ofthe posterior communicating and internal carotidarteries typically expand downward andlaterally, preferentially compressing thepupillomotor fibers as the III nerve becomesinjured (producing pupil-involving third nervepalsy). In contrast, the core of the III nerve receivesits blood supply via the vaso vasorum.Accordingly, the peripherally locatedpupillomotor fibers tend to be spared when thecore of the III nerve is injured by ischemia(producing pupil-sparing third nerve palsy).
How reliable is the “rule” in clinical practice?In regards to aneurysms, Kissel and colleagues12
reviewed the course of III nerve angiographicallyin 51 patients with proven aneurysm at thejunction of the posterior communicating and theinternal carotid arteries. A similar study wasreported in a series of patients evaluated by asingle investigator.15 The main clinicallyrelevant caveats to be derived from these studiesinclude:• None of the patients in either series has pupil-
sparing complete III nerve palsy; pupil-sparing complete III nerve palsy is generallynot a sign of aneurysm. However, theexceptional reports exit.
• Kissel and coworkers12 observed that 14% ofthe patients had pupil-sparing, but theophthalmoplegia was incomplete in all.
Therefore, pupil-sparing can be an importantsign of aneurysmal compression in patientswith incomplete ophthalmoplegia.
• Complete third nerve palsy was observed in5 of 7 patients with pupil-sparing, within5 days. Therefore, always reevaluate thosepatients with pupil-sparing incomplete IIInerve palsy within a week to identify pupilinvolvement, a sign signifying aneurysm.
• In Kissel and coworkers series 24% of patientshad partial involvement (i.e., relative pupil-sparing III nerve palsy), the majority of whomhad incomplete ophthalmoplegia.
• In the above series, 63% of patients hadcomplete pupillary involvement (i.e. pupil-blown third nerve palsy) and the majority(47%) of whom had complete III nerve palsy.Indeed one does not have to see a pupil-blowncomplete III nerve palsy to implicateaneurysmal compression.There are four important settings where a
patient with aneurysm and III cranial nerve palsymay have a normal appearing pupil. If one doesnot consider these traps, one may be at risk ofmissing an aneurysm:1. When external ophthalmoplegia is incomp-
lete, it usually refers to a patient with all IIInerve innervated extra ocular musclesaffected, but not fully. Incomplete ophthalmo-plegia may also refer to the situation wherenot all of the extraocular muscles are affected.
2. When the inferior division of the thirdnerve is spared. The oculomotor nerve travelswithin the dural lateral wall of the cavernoussinus where it bifurcates into a superior andinferior division near the superior orbitalfissure. The superior division carries fibersthat innervate the superior rectus and levatorpalpebrae, while the inferior division carriesfibers that innervate the inferior rectus, medialrectus, inferior oblique, and iris sphinctermuscles. Intracavernous carotid or basilar tipaneurysms not uncommonly preferentially

453Neurological Disorders of Pupil
injure the superior division of the III cranialnerve, producing ptosis and paresis of ocularelevation, but no anisocoria.
3. When 3rd nerve palsy is combined withHorner syndrome. Giant intracavernouscarotid artery aneurysms commonly injurethe oculomotor nerve and, less often, the oculo-sympathetic pathway. If III nerve palsy andHorner syndrome occur in the same patient,the size of the resulting pupil looks fairlysimilar to the other pupil in room light. But,observing the pupils with added light willusually expose the paretic iris sphincter, theaffected pupil looks slightly larger than thefellow pupil. In addition, the affected pupilusually dilates so poorly that it appearssmaller than its fellow pupil if observed indarkness.
4. When the injured third nerve has undergoneaberrant regeneration.16 In some cases ofchronic compression of the oculomotor nerveby a giant aneurysm of the cavernous sinus,regenerating fibers may become miss-wired,a process called aberrant regeneration.Fibers originally destined to innervate certain
extraocular muscles become re-routed intopupillomotor fibers that innervate the irissphincter. The enhanced tone of the iris sphincterthat results from this process produces a pupilthat is smaller than normal, reacts poorly to lightbut better to near, and dilates poorly in darkness.
The evaluation of a patient with III cranialnerve palsy must proceed urgently because ofthe threat of cerebral aneurysm, which may beas frequent as 30% in some series of isolatedcases. As discussed, the relationship betweenthe degree of internal and external ophthalmo-plegia is the best clinical predictor of whetherneurologically isolated and acute III cranial nerveinjury is due to compression or infarction. Exceptin those patients with pupil sparing completeIII nerve palsy, neuroimaging, preferably using
MRI, is indicated to identify a mass lesioncompressing the oculomotor nerve (e.g. pituitaryapoplexy) or some other explanation for thepresentation (e.g. midbrain stroke). If the studyis unrevealing, one must then proceed emergentlyto exclude aneurysm.
While catheter angiography remains the“gold standard” for identifying aneurysm, it isnot without risk. The complication rate is higherin certain patients in particular, those greaterthan 70 years of age, as well as those withsymptomatic atherosclerotic cerebrovasculardisease, significant cardiovascular or renaldisease, or Ehlers-Danlos syndrome. Three-dimensional magnetic resonance angiography(MRA) is a tempting alternative to catheterangiography. How sensitive is this screeningtest for detecting aneurysms causing III cranialnerve palsy? The answer depends, in part, onconsidering the ability of MRA to detectaneurysms of various sizes and the proportionof aneurysms in each size class associated withIII nerve palsy. A recent metaanalysis disclosedestimates regarding aneurysms at the junctionof the posterior communicating and internalcarotid arteries.17 With aneurysm size more thanor equal to 5 mm, the miss rate was 3% whereaswith sizes less than 5 mm, the miss rate exceeded45%.
Because the sensitivity of aneurysmaldetection using MRA has become sufficientlyhigh, one may now substitute it for catheterangiography in the diagnostic evaluation ofsome, but not all, patients with III cranial nervepalsy. However, it should be considered ascreening test to exclude aneurysm under certainclinical circumstances, namely when thelikelihood of aneurysm is relatively high. Theuse of MRA to detect aneurysm is subject to thefollowing two crucial caveats:1. Most importantly, the skill of the interpreting
neuroradiologist must be first rate.
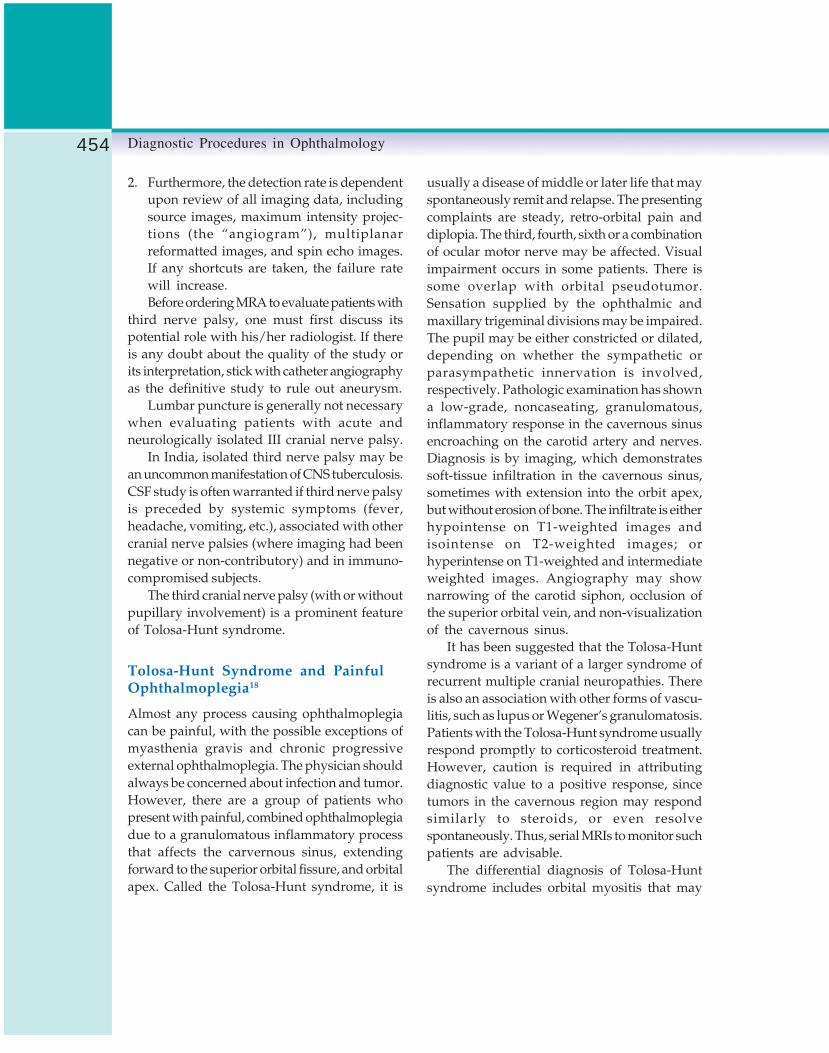
454 Diagnostic Procedures in Ophthalmology
2. Furthermore, the detection rate is dependentupon review of all imaging data, includingsource images, maximum intensity projec-tions (the “angiogram”), multiplanarreformatted images, and spin echo images.If any shortcuts are taken, the failure ratewill increase.Before ordering MRA to evaluate patients with
third nerve palsy, one must first discuss itspotential role with his/her radiologist. If thereis any doubt about the quality of the study orits interpretation, stick with catheter angiographyas the definitive study to rule out aneurysm.
Lumbar puncture is generally not necessarywhen evaluating patients with acute andneurologically isolated III cranial nerve palsy.
In India, isolated third nerve palsy may bean uncommon manifestation of CNS tuberculosis.CSF study is often warranted if third nerve palsyis preceded by systemic symptoms (fever,headache, vomiting, etc.), associated with othercranial nerve palsies (where imaging had beennegative or non-contributory) and in immuno-compromised subjects.
The third cranial nerve palsy (with or withoutpupillary involvement) is a prominent featureof Tolosa-Hunt syndrome.
Tolosa-Hunt Syndrome and PainfulOphthalmoplegia18
Almost any process causing ophthalmoplegiacan be painful, with the possible exceptions ofmyasthenia gravis and chronic progressiveexternal ophthalmoplegia. The physician shouldalways be concerned about infection and tumor.However, there are a group of patients whopresent with painful, combined ophthalmoplegiadue to a granulomatous inflammatory processthat affects the carvernous sinus, extendingforward to the superior orbital fissure, and orbitalapex. Called the Tolosa-Hunt syndrome, it is
usually a disease of middle or later life that mayspontaneously remit and relapse. The presentingcomplaints are steady, retro-orbital pain anddiplopia. The third, fourth, sixth or a combinationof ocular motor nerve may be affected. Visualimpairment occurs in some patients. There issome overlap with orbital pseudotumor.Sensation supplied by the ophthalmic andmaxillary trigeminal divisions may be impaired.The pupil may be either constricted or dilated,depending on whether the sympathetic orparasympathetic innervation is involved,respectively. Pathologic examination has showna low-grade, noncaseating, granulomatous,inflammatory response in the cavernous sinusencroaching on the carotid artery and nerves.Diagnosis is by imaging, which demonstratessoft-tissue infiltration in the cavernous sinus,sometimes with extension into the orbit apex,but without erosion of bone. The infiltrate is eitherhypointense on T1-weighted images andisointense on T2-weighted images; orhyperintense on T1-weighted and intermediateweighted images. Angiography may shownarrowing of the carotid siphon, occlusion ofthe superior orbital vein, and non-visualizationof the cavernous sinus.
It has been suggested that the Tolosa-Huntsyndrome is a variant of a larger syndrome ofrecurrent multiple cranial neuropathies. Thereis also an association with other forms of vascu-litis, such as lupus or Wegener’s granulomatosis.Patients with the Tolosa-Hunt syndrome usuallyrespond promptly to corticosteroid treatment.However, caution is required in attributingdiagnostic value to a positive response, sincetumors in the cavernous region may respondsimilarly to steroids, or even resolvespontaneously. Thus, serial MRIs to monitor suchpatients are advisable.
The differential diagnosis of Tolosa-Huntsyndrome includes orbital myositis that may

455Neurological Disorders of Pupil
usually be distinguished by swelling anderythema of the eyes. The combination of painfulpalsies of the ocular motor nerves associatedwith Horner syndrome is so-called Readerparatrigeminal syndrome and usually reflectscoexistent involvement of the oculosympatheticfibers in the cavernous sinus, usually due tomass lesions. Ophthalmoplegic migraine isreported to affect each of the ocular motor nerves.Distinction may sometimes be difficult fromTolosa-Hunt syndrome.
Years ago, Mathew and Chandy19 and thenMathew20 described a similar syndrome whichthey considered akin to the Tolosa-Huntsyndrome and this accounted for nearly half ofall cases of acute ophthalmoplegia encounteredat Vellore, South India. CT or MRI was notavailable at that time but catheter angiographydid demonstrate intercavernous carotid arterynarrowing in one case. Over the years, mostneurologists in India, must have encounteredmany such angio-negative, steroid responsiveacute painful ophthalmoplegias (though not welldocumented in literature) and given the diagnosisof Tolosa-Hunt syndrome. With ready availa-bility of MR-scan now, personal experience ofthe author is that radiological evidence ofcavernous sinus-orbital fissure inflammatorylesion can be detected in about half of such cases.The nosology of the Indian variant, therefore,remains a little uncertain and needs studyinga large series.
Optic Nerve Pathology
The commonest condition is optic neuritis andin fact any lesion of optic nerve might causepupillary dilatation.
Pharmacologic Mydriasis
The final common entity accounting for anisolated dilated pupil is pharmocologic
mydriasis. If high suspicion exists for the useof mild dilating drops, 1% pilocarpine in theaffected eye confirms the diagnosis (Fig. 28.6).Eyes exposed to parasympatholytic medicationsdo not respond to 1% pilocarpine. Sympathomi-metics that commonly are used to facilitatenasotracheal intubation or ophthalmologicexamination also cause mydriasis. In one study,dilute pilocarpine (1/8%) was used to differen-tiate between pathologic and sympathomimeticmydriasis; 1% pilocarpine overcomes sympatho-mimetic mydriasis. Inadvertent ocular exposureto anticholinergic agents also has been reported.Patients using scopolamine patches have beennoted to have self-limited mydriasis, which hasbeen dubbed as cruise ship anisocoria.
Miosis Increases in Dim Illumination
Horner Syndrome21-23
Hallmark features of Horner syndrome include:(1) unilateral miosis, (ii) ptosis and (iii) anhidrosis.It is the result of disruption of the sympatheticinnervation to the eye at any place along thepathway. The affected eye has a delayed response– ‘dilation lag’ to reduced illumination, as a result,the anisocoria of Horner syndrome is greaterseconds after entering a dark environment thanit is after 15-30 seconds. In patients with anunestablished diagnosis, instillation of 4-10%cocaine solution is indicated. Cocaine inhibitsthe reuptake of norepinephrine, causing morenorepinephrine to be available at the neuro-muscular junction of the iris dilator muscle. Oneshould assess the pupils at baseline and at40-60 minutes. In a positive test, the sympathe-tically impaired pupil fails to dilate, and thedegree of anisocoria increases. In some studies,this test has been both sensitive and specific forHorner syndrome (Fig. 28.7). The delineation ofthe level of a lesion causing Horner syndromehas proved more problematic. This becomes

456 Diagnostic Procedures in Ophthalmology
Fig. 28.6: Pilocarpine (1%) test for right pharmacologic pupil
Fig. 28.7: Cocaine test for right Horner syndrome

457Neurological Disorders of Pupil
important, as patients with postganglionic Hornersyndrome tend to have a very good prognosis,while preganglionic lesions are often the hall-mark of myelopathy or malignancy. The exceptionis in patients with carotid dissection, which mayresult in postganglionic Horner syndrome.Fortunately, such lesions are associated withacute neck pain or other neurologic deficits.Therefore, in cases of painful Horner syndrome,emergent evaluation of the anterior cerebralcirculation is indicated. In patients with Hornersyndrome without pain, a chest X-ray to excludea Pancoast tumor probably is indicated, butfurther work-up may be pursued on an outpatientbasis. Horner syndrome also can occur in incipienttranstentorial herniation. Such patients typicallyexperience a rapid deterioration in brainstemfunction and have a decreased level ofconsciousness. Due to the proximity of the carotidsheath, Horner syndrome may occur as acomplication of an inferior alveolar nerve block.Causes of Horner syndrome are detailed inTable 28.2.
Hydroxyamphetamine Test
Hydroxyamphetamine test is employed todifferentiate between a preganglionic and a post-ganglionic Horner syndrome. The importanceof such distinction has already been mentioned.Hydroxyamphetamine enhances the release ofnorepinephrine from the third order terminal.If the postganglionic neuron is injured, the pupilwill not dilate or will dilate poorly. Cremeret al23 found that a 1 mm increase in the amountof anisocoria is associated with 85% probabilitythat the lesion is postganglionic. 2 mm increaseis associated with a probability of 99% thatpostganglionic defect exists. However, thehydoxyamphetamine test is not perfect. Cremetet al23 found that anisocoria increased in 93%of postganglionic cases. The anisocoria did notchange in 90% preganglionic cases. Therefore,one has to assume an approximately 10% errorrate with this test. In case with non-availabilityof hydroxyamphetamine, one may substitute withadrenaline. Instillation of adrenaline (1:1000) ina case of postganglionic Horner syndrome will
TABLE 28.2: COMMON CAUSES OF HORNER SYNDROME
Central Dorsolateral medullary infarct (Wallenberg’s syndrome)Hypothalamic, thalamic, or mesencephalic infarct, hemorrhage, tumor or demyelinationMultiple system atrophyCervicothoracic spinal cord lesions
Preganglionic Cervicothoracic paraspinal mass (including neuroblastoma)Cervical disk herniationApical lung cancerCervical sympathectomyNeck injury during forceps deliveryInternal carotid artery dissectionCervical adenopathyCervical tumorsNeck trauma
Postganglionic Neck injury during forceps deliveryInternal carotid artery dissectionCervical adenopathyCervical tumorsNeck traumaOtitis mediaCavernous sinus lesionCluster headache

458 Diagnostic Procedures in Ophthalmology
cause pupillary dilatation due to the phenomenonof denervation supersensitivity. This test has itslimitations.
Simple Anisocoria
Simple anisocoria may be found in approximately20% of the general population and may varyfrom day to day in the same individual. In mostpatients, the degree of anisocoria is less than1 mm, and not associated with ptosis, dilationlag, or vasomotor dysfunction. In some patients,simple anisocoria may be provoked by oralmedications (e.g. pseudoephedrine, selectiveserotonin reuptake inhibitors). Installation of4-10% cocaine solution causes dilation of botheyes. Old photographs can provide evidence thatthe anisocoria had been present for some time.
Simple anisocoria may be the result of a varietyof cholinergic antiglaucoma medications. A smallpupil may be the result of a chance exposureto cholinergic agents. Suspect pharmacologicmiosis in an otherwise asymptomatic patientwho wears contact lenses and has experiencedacute onset of miosis. Implicated agents includeanticholinesterases (e.g. flea-collar anisocoria)and inhaled anticholinergics (ipratropiumbromide). In such case, withdrawal of exposureto the agent confirms the diagnosis.
Bilateral Constricted Pupils
The constricted pupil indicates lesion in thevarious circuitous pathway taken by thesympathetic supply to the dilator muscle. Thelesion may be in the hypothalamus, brainstem,lateral aspect of the spinal cord, the sympatheticchain, the cervical sympathetic ganglia, thepericarotid plexus, or in the sympathetic fibers,which run to the orbit by accompanying theophthalmic division of the trigeminal nerve. Thecommon causes for bilateral constricted pupils
include pontine hemorrhage, primary orsecondary tumors involving the cervicalsympathetic chain, vascular lesions of the carotidartery or its sheath and toxins. Bilateral sponta-neous miosis means almost invariably an upperbrainsteam lesion.
Argyll-Robertson Pupils
Argyll-Robertson pupils are classically associa-ted with neurosyphilis. The exact location of thepathologic lesion is hotly debated. Consensusplaces the lesion in the dorsal midbrain inter-rupting fibers serving the light reflex with sparingof the ventral accommodative pathways. Clinicalfeatures include: (a) small pupils nonreactive tolight stimulation with an intact near response(Fig. 28.8), (b) irregular pupils, (c) pupils thatdilate poorly in the dark and to mydriatic agents.Similar pupillary findings may be seen in diabeticpatients. Other causes of light-near dissociationare:1. Dorsal midbrain syndrome: Besides light-near
dissociation these patients have other clinicalfeatures like eyelid retraction, convergence,retraction-nystagmus and decreased up gaze.
2. Severe bilateral visual loss of optic nerve orretinal origin: These patients would havedilated pupils nonreactive to light but near-convergence reaction with pupillary cons-triction may be preserved by proprioceptiveinput to the brain.
Bilateral Dilated Pupils
Differential diagnosis of the dilated pupil isrelatively small. Once angle-closure glaucomaand a mechanically damaged sphincter pupillaemuscle are eliminated from the possible etiologies,dysfunction of the parasympathetic nervoussystem clearly remains the possibility. Suchpupils are dilated and show poor reactivity.

459Neurological Disorders of Pupil
Fig. 28.8: Light and near response of Argyll-Robertson pupil
Dilated pupils are caused by the paralysis ofthe parasympathetic fibers either at their originform the pretectal nuclei and the Edinger-Westphal nucleus in the midbrain, during theircourse with the oculomotor nerve or at the ciliaryganglion in the orbit. The common causes of thedilation include vascular accidents in themidbrain, tentorial herniation or aneurysms ofthe carotid artery.
ConclusionAlmost all pupillary conditions would bediagnosed with the above approaches delineated.Further work-up will depend on the specific
diagnosis and requires investigations like chestX-ray, CT/MRI-scan of the head and cervicalspine. Episodic conditions may be difficult todiagnose at first evaluation and requires repeatedevaluations to make a diagnosis.
The management of pupillary abnormalitieswill depend upon the cause of asymmetry, whichmay include the management of raised intra-cranial pressure and removal of irritative causelocal or distant.
References1. Lowenfeld IE. The pupil: anatomy, physiology
and clinical application. Ames: Iowa StateUniversity Press, 1993.

460 Diagnostic Procedures in Ophthalmology
2. Burde RW, Savino PJ, Trobe JD. Clinical decisionin Neuro-Ophthalmology (2nd ed). St. Louis:Mosby, 1998;221-45.
3. Kordon RH, Thompson HS. The pupil. In. RosenES, Thompson HS, Cumming WJ, Eustace P.Eds. Neuro-ophthalmolog. London, Mosby1998;13.1-13.19.
4. Muller NR, Newtron NJ (Eds). In: Walsh andHoyts Clinical Neuro-ophthalmology. 5th ed.Vol 1. Baltimore. William and Wilkins 1998; 827-1042.
5. Thompson HS, Montague P, Cox TA, et al. Therelationship between visual acuity, pupillarydefects and visual field loss. Am J Ophthalmol1982;93:681-86.
6. Johnson IN, Hill RA, Bartholomew MJ. Correla-tion of afferent pupillary defect with visual losson automated perimetry. Ophthalmology 1988;95:1649-55.
7. Thompson HS, Corbett JJ. Spasms of the irissphincter. Ann Neurol 1980;8:547-49.
8. Adler FW, Scheie HG. The site of disturbancein tonic pupils. Trans Am Ophthalmol Soc 1940;38:183-88.
9. Chakravarty A, Mukherjee A, Roy D. Rosssyndrome – a case documentation. Acta NeurolScand 2003;107:72.
10. Asbury AR, Alderedge H, Hersberg R, Fisher CM.Oculomotor palsy in diabetes mellitus: a clinico-pathological study. Brain 1970;93:555-56.
11. Breen LA, Hopf HC, Farns BK, Gutman L. Pupil-sparing oculomotor palsy due to midbraininfarction. Arch Neurol 1995;48:10-16.
12. Kissel JT, Burde RM, Kingele TG, et al. Pupilsparing oculomotor palsies with internal carotid-
posterior communicating artery aneurysms.Ann Neurol 1983;13:149-54.
13. Guy JR, Day AL. Intracranial aneurysms withsuperior division paresis of the oculomotornerve. Ophthalmology 1989;96:1071-76.
14. Linskey ME, Sekhar LM, Hirsch W, et al.Aneurysms of the intracavernous carotid artery:clinical presentation, radiographic features andpathogenesis. Neurosurg 1990;20:71-79.
15. Keane JR. Aneurysms and third nerve palsies.Ann Neurol 1983;14:696-97.
16. Ford FR, Walsh FB, King A. Clinical observationson the pupillary phenomenon resulting fromregeneration of the third nerve. Bull JohnsHopkins Hosp 1941;68:309-18.
17. Jacobson DM, Trobe JD. The emerging role ofmagnetic resonance angiography in themanagement of patients with third cranial nervepalsy. Am J Ophthalmol 1999,128:94-96.
18. Kline LB, Huyt WF. The Tolosa-Hunt syndrome.J Neurol Neurosurg Psychiatry 2002,71:577-82.
19. Mathew NT, Chandy J. Painful ophthalmoplegia.J Neurol Sci 1970;11:243-56.
20. Mathew NT. Painful ophthalmoloplegia. InTropical Neurology. Ed. Spiliane JD. London,Oxford University Press, 1972;120-23.
21. Tompson HS. Diagnosing Horner’s syndrome.Trans Am Acad Ophthalmol Otolaryngel 1977; 82:840-48.
22. Malmey WF, Younge BR, Mayer NJ. Evaluationof the causes and accuracy of pharmacologicallocalization in Horner’s syndrome. Am JOphthalmol 1980;90:394-420.
23. Cremer SA, Thompson HS, Digre KB, et al.Hydroxyamphetamine mydriasis in normalsubjects. Am J Ophthalmol 1990;100:66-70.

461Index
Index
AA- and B-scan 240A and V syndromes 369Aberropia 69Abnormal fluorescence angiography
190blocked choroidal fluorescence 191blocked retinal fluorescence 190hyperfluorescence 194hypofluorescence 190
Acanthamoeba 320, 321Acanthamoeba cysts 322Acanthamoeba keratitis 318Accommodation 7, 442Accommodative convergence 375,
378Acquired deficiency of color vision 18Acridine orange 323Acute dacryocystitis 417Acute posterior multifocal placoid
pigment epitheliopathy212, 213
Adenoviral keratoconjunctivitis 328Adie tonic pupil 446, 447Adverse reactions to intravenous
fluorescein angiography 185anaphylaxis 186local tissue necrosis 186nausea 185pruritus 186shock and syncope 186vasovagal attacks 186vomiting 185
Age-related macular degeneration205, 254
CNVM 206hemorrhagic PED 207hot spot 206, 208laser photocoagulation 207photodynamic therapy 207pigment epithelial detachment 206polypoidal choroidal
vasculopathy 209retinochoroidal anastomosis 207transpupillary thermotherapy 207
Alternate cover test 374
Amblyopia 171, 374, 387, 403classification 387contrast sensitivity 389crowding phenomenon 388diagnosis 388disparometer 393distance stereopsis tests 391fixation disparity 392fixation disparity curves 392Frisby stereotest 390, 391Lang stereotest 390Lang two pencil test 392normal stereoacuity 391preferential looking tests 389random-dot E stereotest 390random-dot stereograms 389special 3-D pictures 390stereoacuity tests 389stereopsis 389Teller acuity 388Titmus Fly stereotest 389TNO test 391Wesson card 393Wesson fixation disparity card 394
American optical company plates25
A-mode (Amplitude modulation) 217A-mode ultrasonography 272Amplitude modulation scan 240Anderson’s criteria 142, 146Aneurysmal damage to oculomotor
nerve 451Aneurysms 397, 451-453Angle kappa 372Angle-closure glaucoma 113, 458Anisocoria 443, 445, 446Anomalies of color vision 16
acquired 16congenital 16
Anomaloscope Nagel 28 Pickford-Nicolson 29Anterior chamber estimation
method 39Anterior chamber paracentesis 337Anterior chamber tap 336Anterior ischemic optic neuropathy
124, 125, 306, 310
Anterior segment evaluation—immersion technique 220
Anterior segment photography 179Anteroior chamber paracentesis 337Antibiotic susceptibility 325Antimicrobial susceptibility 321Antineutrophil cytoplasmic antibody
436Applications of indocyanine green
angiography 205Aqueous tear deficiency 405Arden index 282Argyll-Robertson pupils 446, 458,459Arrangement tests 25
Edridge-Green Lantern test 30Farnsworth D-15 test 27Farnsworth Lantern test
(Falant) 29Farnsworth-Munsell 100-hue
test 25Holmes-Wright Lantern 29Lantern tests 29Lanthony desaturated D-15 test 27
A-scan ultrasonography 216, 240,428
A-scan versus B-scan 237Asteroid hyalosis 242, 243Asymmetry of optic disk cupping
118Atrophic bulbi 256Atypical retinal pigmentary
dystrophies 296Audiometry 349Automated perimetry 115Automated perimetry fixation 136Autonomic nervous systems 441A-V patterns 377
BBacterial colonies 320Bacterial keratitis 317Bagolini’s striated glasses 370Basic perimetry 128Bebie’s curve 140, 145Behçet’s syndrome 350

462 Diagnostic Procedures in Ophthalmology
Bell’s phenomenon 400, 404, 442Bests’ vitelliform macular dystrophy
282Bilateral superior oblique palsy
397Biometry in ocular pathologies 233
congenital glaucoma 233myopia 234nanophthalmos 234tumor height 234
Biopsy 339, 436Black and white films 174Blepharitis 405, 418, 419Blood vessels 113Blow-out fracture 403, 404B-mode (Brightness modulation) 218Botulinum toxin 399Bracketing (staircase technique)
130, 131Brightness 12Brightness modulation scan 240Brown’s syndrome 395, 402, 403B-scan ultrasonography 239, 240,
259, 428B-wave amplitude 289
CCalcium alginate swab 317Calcofluor white 319, 322, 323Calibration Goldmann applanation
tonometer 104Camera 35 mm 165 35 mm SLR 173 CCD 201Canaliculi 413, 419Carrier stage detection 305Catheter angiography 453, 454Causes of Horner syndrome 457Cavernous hemangioma 432, 438C/D ratio 162Central areolar atrophy 312Central scotoma 7Central serous chorioretinopathy
210, 211Central serous retinopathy 185, 197Chloroquine 93, 304Choroidal and retinochoroidal
biopsy 340Choroidal coloboma 255Choroidal detachment 250, 365Choroidal hemangioma 253Choroidal inflammatory conditions 212Choroidal melanomas 282
Choroidal neovascular membrane185, 203, 206, 214
Choroidal pigment 179Choroidal thickening 249Choroidal tumors 213
choroidal hemangiomas 213choroidal metastasis 213
Choroideremia 282Ciliary block glaucoma 264Ciliary body tumor 267Clinical uses of EOG 282Clinical uses of visual electro-
physiological tests 295Closed circuit TV 136Closed-angle glaucoma 445CNVM 203, 214Cocaine 455Cocaine test 456Collection of samples 316, 326Color blindness 12Color coded cells 15Color constancy 13Color contrast simultaneous 13Color contrast successive 13Color Doppler imaging 429, 430Color performance 31.Color photography 184Color triangle 14Color vision 12Color vision testing 19, 348
City University test 20color confusion tests 19color matching tests 20Edridge-Green Lantern 21FALANT 21Farnsworth-Munsell
dichotomous-15 test 20FM-100 test 20, 21
Hardy-Rand-Rittler plates 23Ishihara pseudoisochromatic
plates 20Lantern tests 21Nagel anomaloscope test 21pseudo-isochromatic plates 19
Comitant strabismus 369Complete third nerve palsy 450Compression gonioscopy 112Computed tomography 431Condensing lens 154Cone dystrophies 300Cones 15Condensing lens 20D 153Confocal microscopy 84, 85Congenital color vision deficiency 16
anomalous trichromats 17blue deficient 17dichromats 17
green deficient 17monochromats 17red deficient 17X-linked 16
Congenital fibrosis 395Congenital fibrosis of extraocular
muscles 403Congenital glaucomas 110Congenital optic disk pit 124Congenital ptosis 401Congenital stationary night
blindness 282Conjunctival and lacrimal gland
biopsy 344Conjunctival impression cytology 410Constricted pupil 458Contact lenses 115, 152, 93Contact lenses for gonioscopy 107
Barkan 107Goldmann 107Koeppe 107Layden 107Sussman 107Swan-Jacob 107Thorpe 107Zeiss and Posner 107
Contact tonometers 96applanation 96indentation 96
Contrast sensitivity 9Contrast-enhanced MRI 433Convergence 442Convergent strabismus 369Core biopsy 437Corneal aberrometry 63
astigmatism 65coma 65high order aberrations 65low order aberrations 65measuring corneal wavefront
aberration 64measuring total wavefront
aberration 63optical and image quality 66ray tracing system 64Shack-Hartmann method 63spatially resolved refractometer 64trefoil 65Tscherning technique 63wavefront maps 65Zernike polynomials 64Zernike terms 65
Corneal astigmatism 50Corneal biopsy 317, 318Corneal dystrophies 89
Fuchs endothelial dystrophy 89granular dystrophy 89

463Index
posterior polymorphousdystrophy 89
Corneal grafts 91Corneal reflection tests 378
double Maddox rod test 380grading oblique overactions 381Hess chart 380Hess screen 379Hirschberg’s test 378Krimsky test 378Lees chart 380Lees screen 379Maddox tangent scale 379measurement of cyclodeviations
380synoptophore 378
Corneal samples 317Corneal scraping collection 318Corneal scrapings 317, 322Corneal topography 46, 52
absolute scale 55artificial intelligence programs 62average corneal power 62axial map 56color-coded scales 54corneal eccentricity index 62corneal indexes 60corneal maps 56difference map 56diffuse reflection techniques 52elevation map 56interferometric method-based
systems 52irregularity map 59Moire deflectometry-based
systems 52normalized scale 55placido disk system 52Placido’s rings 47raw photokeratoscope image 53refractive map 56relative map 56simulated keratometry reading 61specular reflection techniques 52surface asymmetry index 62surface regularity index 62tangential curvature map 56techniques using scattered light-
slit-based systems 52videokeratoscopy 47
Corneal ulceration 405Corneal wetting time 406Corrected comparison 140Corrected pattern standard
deviation 137Cover test 372Cover-uncover test 372, 374
Cryotherapy for retinopathy ofprematurity 358
Crystalline lens 12CT-scan 349, 404, 428, 432,
435, 436Culture media 320Culture methods 319Cultures 324Cup-disk ratio 116, 126Cyclovertical muscle palsy 397Cysticercosis 249, 403, 426, 430Cytology 438Cytopathic effect 329
DDacryocystography 423
chemiluminescence test 424CT dacryocystography 423CT scan 424, 428dacryoscintigraphy 424dacryoscopy 424MRI dacryocystography 423standardized echography 424thermography 424
Dark adaptation 281Dark trough 281Diabetic III nerve palsy 450Diabetic maculopathy 189Diabetic retinopathy 18,212Diagnosis of uveitis 333
angiotensin converting enzyme334
antineutrophil cytoplasmicantibody test 334
antinuclear antibody 333basic investigations 333fluorescent treponemal antibody
absorption test 334human leucocyte antigens 334rheumatoid factor 333serological tests 333serological tests for syphilis 334venereal disease research
laboratory test 334Wegener’s granulomatosis 334
Diagnostic biopsies 335Diagnostic vitrectomy 338Differential blood counts 436Diffuse lamellar keratitis 91Digital subtraction ICGA 214Digital angiography 183Digital camera 370Digital imaging 181Digital stereo imaging 214
Dilated pupil 447, 458Diplopia 396, 400Diplopia testing 379Direct ophthalmoscope 115, 161, 370Direct ophthalmoscopy 151, 160Direct smear examination 318, 326Disciform macular scar 254, 255Disk-diffusion tests 321Dislocated lens 251Dissociated vertical deviations 376Divergent strabismus 369Double elevator palsy 403Double Maddox rod set 370, 396Double opponent color cells 15Draeger applanation tonometer 103Drug or metal toxicity 280Drugs causing color deficiency 19Dry eye 405Dry eyes syndrome 405Duane’s retraction syndrome 395,
400, 401, 403
EEctropion 418Edinger-Westphal complex 441Edinger-Westphal nucleus 459Electrode placement 286Electrooculogram 279, 280
clinical uses 282limitations 282
Electrophysiological tests 279Electroretinogram 279, 283ELISA test 328, 410, 436Emmetropic eye 151Endonasal dye test 423Endophthalmitis 244, 245, 249Endothelium corneal 87Enophthalmos 404Entropion 418EOG recording procedure 281Epicanthus 372Epiphora 412, 415Episcleritis 268Episodic anisocoria 445Epithelium corneal 86ERG 305ERG amplitudes and latency 289ERG response 287Esotropia 369ETDRS chart 3, 11Evaluation of the retina 244Evaluation of the vitreous 242Evaluation of traumatized eye 250Evaporative DE 405

464 Diagnostic Procedures in Ophthalmology
Examination of eye in nine gazepositions 377
Examination of nasal cavity 423Examination of pupil 442Examination of the sensory status 382
ambylopia 383binocularity 382, 383diplopia 382, 383stereopsis 383suppression 382, 383
Excisional biopsy 437Exophthalmometry 427Exotropia 369, 371External ophthalmoplegia 450External photography 173Exudative retinal detachment 247, 248Eyelid laxity 417
FFabry’s disease 93Failure of filtering surgery 265False negatives 136, 138False positives 136, 138, 143Fast oscillations of EOG 282Fine needle aspiration cytology
(FNAC) 436Fine-needle aspiration biopsy 341
corneolimbal-zonular approach342
limbal approach 341pars plana approach 341subretinal approach 342
Fixation target positions 377Flash stimulus characteristics 286Flicker cone response 30Hz 289Fluorescein angiogram phases 187
arteriovenous phase 188prearterial phase 187recirculation phase 189transit phase 189venous phase 188
Fluorescein angiography 177, 181, 200arterial and venous phase 178film type and development 177late phase 178mid-phase 178preinjection or control
photograph 178principle 177procedure 184
Fluorescein dye test 416, 422Fluorescein stain 407FNAC 437Focal ERG 283Focal macular ERG 312
Force duction test 400, 404Foreign body 43Fourth cranial nerve palsy 397Foveal threshold 136Full-field flash ERG 283Functional epiphora 416Fundus camera 166, 182
digital hand-held fundus camera167, 168
hand-held Kowa genesiscamera 167
mydriatic fundus camera 165non-mydriatic fundus camera
166photo slit-lamp 167portable slit-lamp with video
camera 168Fundus drawing sheet 154Fundus drawing: color code 156
color code black 157color code blue 156color code brown 156color code green 156color code red 156color code yellow 157cross lines 156interrupted lines 156solid 156
Fundus fluorescein angiography165, 181,345
Fungal hyphae 322Future applications of indocyanine
green angiography 214
GGanglion cells 280Ganzfeld bowl 283, 287Gaze monitoring 134Genetics of congenital color
deficiencies 18Giant retinal break 247Giemsa stain 323, 326Giemsa-stained smears 324Glaucoma 263Glaucoma hemifield test 134,
137, 138, 141, 143Glioma 432Global indices 134, 137Goblet cells 410Goldenhar syndrome 401Goldmann contact lens 117Gonioscopic landmarks 109Gonioscopic lenses 168
Gonioscopy 106, 108, 151Grading of anterior chamber angle
38, 111 Shaffer’s grade 111 Spaeth’s system 111
Gram stain 323Gram-stained smears 322Graves disease 436Graves ophthalmopathy 431Gray scale 137, 138
HHaidinger brushes 13, 378Haidinger brushes and after
images 370Hand-held Goldmann-type
tonometers 100Draeger tonometer 100Mackay-Marg tonometer 100Maklakov applanation tonometer
101Perkins tonometer 100tonopen 101
Handling of biopsy material 342Harlequin syndrome 448Head posture 370Head tilt 370Head tracking 134Heijl-Krakau method 136Hemosiderosis 93Herings opponent color theory 16Herpes simplex virus 326Herpetic epithelial keratitis 329Hertel’s exophthalmometer 427Hess chart 370, 404Histochemistry 439Histopathology 438HLA association with uveitis 335Holmes-Adie syndrome 448Homonymous hemianopia 370Horner syndrome 453, 455, 446, 457HRT print out 118Hruby lens direct ophthalmoscopy 162HSV keratitis 328HSV type 1 and 2 330Hue saturation 13Humphrey field analysis 132, 133Humphrey single field printout
134, 135Hydatid cyst 426, 430, 438, 439Hydoxyamphetamine test 457Hydroxychloroquine 304Hypercomplex cells 16Hyperfluorescence 194
autofluorescence 194

465Index
pigment epithelial window defect195
pre-injection fluorescence 194pseudofluorescence 194
Hyperlipidemia 93Hypertelorism 372Hypotropia 399
IIdentification of fungal species 321Idiopathic orbital inflammatory
disease 429III cranial nerve palsy 453IMAGE-net digital imaging system 183Imaging system 169Imaging techniques 427Immersion B-scan 257Immunofluorescence assay 327Immunoglobulins 410Immunohistochemistry 343, 439Incisional biopsy 437Incomitant strabismus 395Indications of diagnostic
paracentesis 336amyloidosis 336Behçet’s disease 336, 337endophthalmitis 336hemorrhagic glaucoma 336leukemia 336malignant melanoma 336persistent hyperplastic primary
vitreous 336phacolytic glaucoma 336retinoblastoma 336sarcoidosis 336toxocara canis 336toxoplasma gondii 336
Indications for diagnostic biopsies 335Indications for electroretinography 296Indications for vitreous tap 337
amyloidosis 337asteroid hyalosis 337Behçet’s disease 337CMV retinitis 337endophthalmitis 337reticulum cell sarcoma 337retinoblastoma 337sympathetic ophthalmia 337
Indications of A-scan 222anterior chamber depth 222asteroid hyalosis 223biometry 222, 231choroidal detachment 230choroidal hemangioma 226choroidal hemorrhage 226
choroidal melanoma 226choroidal thickening 230congenital glaucoma 222corneal thickness 222dislocated lens in vitreous 231endophthalmitis 224foreign body localization 230intraocular tumors 226measurement of the axial
length 222metastatic carcinoma 226ocular trauma 230phthisis bulbi 231posterior vitreous detachment 224preretinal foreign bodies 230retinal detachment 224, 231retinoblastoma 227retinoschisis 226vitreous floaters 223vitreous hemorrhage 224
Indirect immunofluorescence 328Indirect immunoperoxidase 328Indirect ophthalmoscope 153, 154, 370Indirect ophthalmoscopy 151, 158, 181
head mounted indirect 152modified monocular indirect 152monocular indirect 152penlight ophthalmoscopy 152slit-lamp indirect 152
Indirect ophthalmoscopy inoperating room 157
Indocyanine green 214Indocyanine green angiography
165, 200, 345advantages 203adverse reactions 201limitations 203procedure 202
Infectious keratitis 280Infectious keratitis: diagnostic
procedures 316Infrathreshold 130Inner retinal dysfunction 300Instant type film 174Intermediate uveitis 348Intermittent exotropia 375International Society for Clinical
Electrophysiology ofVision 280, 314
Interpretation of A-scan 222Interpupillary distance 371, 377Intervention for ROP 358
cryotherapy 358laser ablation 359parental counseling 360scleral buckling 359surgical intervention 359vitrectomy 359
Intracorneal deposits 93Intranuclear intracytoplasmic
inclusions 326Intraocular foreign body 243, 251, 362
binocular indirectophthalmoscopy withscleral indentation 363
corneal wound 363foreign body in the angle 363gonioscopy 363initial fundus examination 363intralenticular foreign body 363intraretinal hemorrhage 364iris hole 363lens opacity 363metallic 362non-metallic 362siderosis bulbi 363, 364signs of double perforation 364slit-lamp examination 362vitreous hemorrhage 364vitreous track 364
Intraocular lenses 263Intraocular tumors 252Iris and ciliary body biopsy 339Iris cyst 267Iris fluorescein angiography 198Iris melanomas 266Iris neovascularization 198Iris nevi 266Iris thickness 262Iris-ciliary process distance 262Iris-lens angle 262Iris-zonule distance 262Ischemic III cranial nerve palsy 450Ischemic vascular retinal disorders 301Ishihara pseudo-isochromatic
plates 22ISNT rule 118Isolated rod response 287Isolated third cranial nerve palsy 449
JJaeger notation 3Jaeger’s charts 3Jones tests 422
Jones tests I 422Jones tests II 422
KKeratitis 326Keratoconjunctivitis sicca 407

466 Diagnostic Procedures in Ophthalmology
Keratoconus 88Keratometer 46, 47Keratometry 62Keratoplasty 261Kinetic echography 222Kinyoun method 324Knapp’s transposition 400Köllner’s rule 16Kowa genesis with slit-lamp
attachment 168KOWA VK-2 system 170Krukenberg’s spindle 40
LLacrimal excretory apparatus
412Lacrimal gland 412Lacrimal sac 413Lacrimal sac swelling 416Lacrimation 415Lactoferrin assays 410Lactophenol cotton blue 323Laser in situ keratomileusis 90LASIK surgery 91, 157Latex agglutination 328Leak 195
choroidal leak 197disk edema 196retinal leak 196vitreous leak 196
Leakage of fluorescein 189Lebers congenital amaurosis 305Lebers hereditary optic neuropathy
307Lees screen 370Lens rim artifact 146Letter “E” 6Leukemic infiltration of iris 266Light adaptation 281Light and electron microscopy 343Light peak 281Light source 153Light-induced rise of the resting
potential 281Light-near dissociation 445Limbal dermoid 262Limitations of ERG 290Lister’s perimeter 377Loss variance 140Low speed angiography 201, 204Low-coherence interforometry 269Lumbar puncture 349, 454Luminescence 181Lymph node biopsy 345
Lymphangioma 431Lysozyme assays 410
MMackay-Marg tonometer 103Macula 7Macular edema 347, 348Macular photoreceptor function 280Magnetic resonance angiography
(MRA) 434, 435, 453Magnetic resonance imaging 433Magnification 34
continuous zoom 34flip type 34
Malignant lacrimal gland tumor 432Malingering 308Mantoux test 349Marcus Gunn jaw-winkingMaximal combined response 288Maxwell spot 13Mean defect 140Mean sensitivity 140Measurement of ocular deviation 375Measurement of vergences 381
convergence sustenance 382horizontal vergences 381near point of convergence 382torsional vergences 381vertical vergences 381
Medial canthal tendon laxity 417Meibomian gland dysfunction 405Melanoma 252Metastatic choroidal carcinoma 253Methods for localization of IOFB 364
Berman and Roper-Halllocalizers 364
Bromley’s method 366combined B- and vector A-scan
364computerized tomographic scan
367Dixons’ method 366Mac Kenzie’s method 366magnetic resonance imaging 367Mc Rigor’s method 366plain X-ray 365, 366radio opaque markers 366Sweet’s method 366ultrasonography 364ultrasound biomicroscopy 365use of contrast material 366use of limbal ring 366
Microbial keratitis 316Microbiological cultures 343
Microbiology 339Mild pilocarpine test 448Minimal inhibitory concentrations 321Minimum angle of resolution 2Minimum criteria for the diagnosis
of glaucoma 141Miosis 442, 455Möbius syndrome 395, 400Modified monocular indirect
ophthalmoscopy 159Molecular microbiology 322Monochromatic fundus photography
179Monocular elevation deficiency 399Monocular indirect ophthalmoscopy
158, 159Morning glory syndrome 124, 401MRA 454MRI 349, 428, 434, 435, 436, 453Mucosal biopsy 344Multifocal ERG 283, 308, 311Multifocal VEP 308Multinucleated giant cells 326, 327Multiple evanescent white dot
syndrome 212Multiple pinholes 7Myasthenia gravis 396Mydriasis 397Myopia 214Myopic disk 123
NNasalization of the vessels 121Nasolacrimal duct 414Near blindness 10Near vision chart 5Necrotizing scleritis 268Negative a-wave 288Negative ERG 300Nerve fiber layer 179Nerve supply 412Neurological disorders of pupil
441Neuroretinal notch 120Neuroretinal rim 118, 121, 123Neuroretinal rim notch 119Nikor Medikor lens 173Nodular scleritis 267Noncom robo 170Noncontact lenses 115, 116, 152Noncontact tonometer 96Non-invasive break-up time 406Nonisolated third cranial nerve
palsy 449

467Index
Non-viral keratitis : bacterial,fungal and acanthamoeba316, 319, 322
Normal cornea 85Normal cornea, shape 48Normal fundus fluorescein
angiography 187Normal globe 242Normal macula 270Nystagmus 370
OOccluder 7, 370Occult choroidal neovascular
membranes 200OCT in macular diseases 270
central serous chorioretinopathy275, 276
diabetic macular edema 273diabetic retinopathy with cystoid
macular edema 274diabetic retinopathy with serous
retinal detachment 274foveal retinal detachment 273high myopic eyes 272juvenile retinoschisis 277macular hole 270normal macula 271posterior staphyloma 272preretinal macular fibrosis 272, 273retinoschisis 273rhegmatogenous retinal
detachment 276vitelliform macular dystrophy 277
Octopus 139Octopus field analyzer 132Octopus single field printout 138Ocular albinism 305, 307Ocular anatomy on ultrasound
biomicroscopy 261Ocular deviation 371Ocular ischemic syndrome 302Ocular microbiology 316Ocular movements 171Ocular trauma 266Oculomotor palsy 446Open-angle glaucoma 123, 133Ophthalmic imaging systems 170Ophthalmic photography 165Ophthalmoplegia 396, 452Ophthalmoplegic migraine 455Ophthalmoscopy 151Opponent color cells 15Optic chiasm 444
Optic coherence tomography 269Optic disk cupping 142Optic disk evaluation in glaucoma 115Optic nerve 7, 444Optic nerve avulsion 252Optic nerve demyelination 306Optic nerve drusen 255Optic nerve head coloboma 124, 257Optic nerve head drusen 256Optic nerve hypoplasia 404Optic tract 444Optical coherence tomography
115, 269, 346Optical principles 106Optical system of fundus camera 174Optico kinetic nystagmus drum 370Optics 84Optics of slit-lamp 34
clinical procedure 35Haag-Streit type illumination 34illumination system 34observation system 34Zeiss type illumination system 34
Orbicularis oculi 414Orbital arteriography 435Orbital blow-out fractures 395Orbital venography 435Oropharynx dye appearance test 423Oscillatory potentials 288Overlay technique 214
PPainful ophthalmoplegias 455Pair of scleral depressors 153Papanicolaou stain 326, 327, 330, 331Papilledema 306Parallelopiped 39, 40, 41, 43, 110Paralytic strabismus 395Pattern deviation plot 137Pattern electroretinogram 280, 283,
290clinical uses 292evaluation of macular function 292ganglion cell dysfunction 292
Pattern standard deviation 137PCR technique 329Pediatric ERG recording 290Pediatric visual assessment 280Pediatric visual impairment 305Penlight ophthalmoscopy 160Perimeter 370Perimetry 128, 151Peripapillary atrophy 121, 122Peripheral anterior synechia 112
Peripheral choroidal tumors 267Peripheral iridoplasty 264Perkins applanation tonometer 103Pharmacologic miosis 458Pharmacologic mydriasis 455Pharmacologically dilated pupils 446Phases of ICGA 204
arteriovenous phases 204between 2 and 5 seconds 204between 5 seconds and
several minutes 204beyond several minutes 204early phase 204first 2 seconds 204late phase 205middle phase 205prearterial and arterial phases 204
Photography in operation theatre 168Photography of face 172Photography of pupil 172Photoreceptor dysfunction 295Phthisis bulbi 254, 255Physics of ultrasound 217Physiological cupping 123Pigmentary glaucoma 265Pigmentation 113Pilocarpine (1%) test 456Pilocarpine 455Pinch test 417Pinhole 7Pitfalls of A-scan 234
artifacts 235cataract 236errors in the axial length
measurement bybiometry 235
intraocular foreign bodies 235low reflective spike 235methylcellulose 236misalignment 236multiple reflection artifacts 234posterior staphyloma 236refractive errors 236tumors 235vitreoretinal diseases 235
Pituitary tumor 125Plateau iris syndrome 263Pneumatic tonometer 103Poland anomaly 400Polaroid or Fuji film 174Polymerase chain reaction 322, 325,
339, 343Poor vision in infants 280Positive b-wave 288Posterior globe rupture 252Posterior staphyloma 255, 272

468 Diagnostic Procedures in Ophthalmology
Posterior vitreous detachment 243,365
Potassium hydroxide 323Pretectal nucleus 444Prethreshold ROP 359Primary angle-closure glaucoma 263Principles of ophthalmoscopy 151Prism bar 370Prism bar cover test 375Probing 416, 421Procedures in uveitis 333Proliferating vitreous membrane 246Proliferative diabetic retinopathy 243Proliferative vitreoretinopathy 245Properties of sodium fluorescein 182Proptosis 426Pseudoepiphora 416Pseudofluorescence 202Pseudoptosis 400Pseudostrabismus 372Pseudotumor 434Pterygium 43, 418Ptosis 396, 401Pulzone-Hardy rule 371Puncta 412, 416, 417, 418Pupil: Neurological disorders 7, 281,
441Pupillary abnormalities 445Pupillary light reflex 441
QQuantitative echography 221Quinine 304
RRadio immunoassay 328Radiological studies 349Radionucleotide studies 349RAPD 443Reader paratrigeminal syndrome 455Reading charts 11Record visual acuity 2Recording electrode 284
Burian-Allen 284contact lens 5gold foil 285ground 286LVP-Zari 285reference 285
Red and green goggles 370Red-free photography 179Reference values for corneal
aberrations 68
Reflection 239Refraction 239Refractive surgery 74, 93, 263
postastigmatic keratotomy 75postintrastromal corneal rings
implantation 77postkeratoplasty 79postlaser in situ keratomileusis 77postlaser thermal keratoplasty 77postphotorefractive keratotomy 75radial keratotomy 74
Relative afferent pupillary defect 443Relative pupil block glaucoma 263Reliability factors 138Reliability indices 134Reproducibility 134, 138Retcam 358Retinal correspondence 377, 386
after image test 387anomalous retinal
correspondence 386Bagolini’s striated glasses 386diagnosis of ARC 386harmonious ARC 386normal retinal correspondence 386unharmonious ARC 386Worth four dot test 387
Retinal detachment 224, 231,243, 244, 246, 348
Retinal fundus cameras 181Retinal nerve fiber layer
abnormalities 122diffuse areas 122slit-like defects 122wedge-shaped 123
Retinal photoreceptors 280Retinal pigment epithelium 280Retinal tear 246Retinitis pigmentosa 282, 295Retinoblastoma 253Retinochoroidal anastomosis 207Retinopathy of prematurity 353
arrested vasculogenesis 353classification 353early treatment 353etiology 353international classification 354
stage 1: dermarcation line 354stage 2: dermarcation ridge 354stage 3: extraretinal fibrovas-
cular proliferation 354stage 4: partial retinal
detachment 354stage 5: total retinal
detachment 354management 353multicenter trial of cryotherapy 353
pathogenesis 353plus disease 355prethreshold 355, 356risk factors 353
birth weight 353multiple birth 353respiratory distress
syndrome 353young gestational age 353
Rush disease 355screening 353, 357screening procedure 357threshold 355, 356zones 353
zone-I 354zones II and III 354
Retinoschisis 247, 273Retroillumination 44Rhegmatogenous retinal
detachment 157Ring scotoma 146Rod monochromatism 305, 309Rod-photoreceptor disorders 282Rose Bengal stain 407, 408Ross syndrome 448Royal air force binocular gauge 382
SSampaolesi line 110Scanning electron microscopy 440Scanning laser ophthalmoscope 202Scattering 239Schiøtz tonometer 95, 102Schirmer I test 406, 419Schirmer II test 407, 420Schirmer’s strip 408Schirmer’s test 408, 419Schirmer’s test with nasal
stimulation 407Scleral depression 154, 157Scleral staphyloma 268Scotoma suppression 385Sensors 136Serum angiotensin converting
enzyme 436Serum autoantibodies 410Seven in one printout 138, 139Seven in one single field printout 145Shell vial technique 329Short term fluctuation 137, 140Simple anisocoria 458Single-flash cone response 289Sixth cranial nerve palsy 398, 399Sjögren’s syndrome 410

469Index
Slit-lamp 33, 259, 317,Slit-lamp attachments 44
digital camera 44Goldmann tonometer 44gonioscope 44Hruby lens 44pachymeter 44
Slit-lamp biomicroscopy 151, 181, 270Slit-lamp examination 33, 36, 418Smears 322Snap back test 417Snellen chart 2, 3, 370, 388Specialized types of ERG 284Specular microscopy 169Specular photography 169Spielmann occluder 370Spielmann translucent occluder 373Splinter hemorrhages 121Split limbal technique 38Stargardt’s macular dystrophy
305, 313Statistical analysis 134Statpac program 134Stereophotography 185Sterilization of different tonometers
102, 104Steriopsis 33Stevens-Johnson syndrome 410Strabismus 365,369, 395Stroma 87Subepithelial nerve plexus 86Superior oblique palsy 397Suprathreshold 130Suprathreshold screening 132Swedish interactive thresholding
algorithm (SITA) 132Swinging-light pupil test 443, 445Sympathetic pathway 442Sympathomimetic mydriasis 455Synoptophore 370, 371, 377,
384, 387Syringing 416, 420
TTable-top retinal cameras 174Taste test 422Tear deficient DE 405Tear ferning 410Tear film break-up time 406Tear film osmolarity 410Tear secretion 415Techniques of slit-lamp
examination 36broad beam 39
conical beam 39diffuse illumination 36direct 36direct focal illumination 37indirect illumination 40narrow beam 37oscillatory illumination 43retroillumination 41sclerotic scatter 42specular reflection 42tangential illumination 43
Telecanthus 372Teleophthalmology 170Teller acuity cards 370Temporal hemianopia 125, 147Tendency oriented perimetry 133Test programs 133
Humphrey 10-2, 30-2, 24-2 133
macular grid program 133macular program M2X 133octopus G1X, G2 133
Testing strategy 132Tests for suppression 383
after image test 384, 385Bagolini glasses test 384Bjerrum screens 385binocular perimetry 385depth of scotoma 385Hess screen 385Lees screen 385suppression scotoma 385synoptophore 384Worth four dot test 384
Theories of color vision 14Granit’s theory 14Hering’s theory 14Young-Helmholtz theory 14
Thioridazine 304Third cranial nerve dysfunction 448Third cranial nerve palsy 396Three-dimensional ultrasound
tomography 240Three-step test 397Threshold 130Threshold determination 132Thyroid function tests 436Thyroid ophthalmopathy 426, 432Time-gain compensation 259Tissue culture methods 328Tolosa-Hunt syndrome 449, 454Tonomerty 95, 151
Goldmann applanationtonometer 95
Schiøtz tonometry 95Tonometry on irregular corneas 103Tonometry over gas filled eyes 103
Tonometry over soft contact lens 103Topographic echography 220Total deviation plot 137Trabecular-iris angle 262Traction retinal detachment 247, 248Transillumination 158Transmission electron microscopy
440Transport of corneal samples 317Trichromatic theory of Young 16Trophozoites 323Tumors of uvea 266Types of gonioscopy 106
direct 106indirect 108
Types of perimetry 129automated 129computerized 129Goldmann perimeter 129, 130kinetic 129manual kinetic 129static 129, 130tangent screen 129
UUltrasonography 151, 428, 430Ultrasound 346, 430Ultrasound biomicroscopy 259, 262,
346Ultrasound unit 240Uses of corneal topography 69
keratoconus 69keratoglobus70pellucid marginal degeneration 70pterygium 74Terrien’s marginal degeneration 71
Uveitis diagnostic procedures 333
VVan Herick’s technique 38, 39Varicella zoster virus 328Vascular filling defect 192
choroidal vascular filling defect 192retinal vascular filling defects 192vascular filling defects of the
disk 192Vector A-scan 240Vector A-scan display 219VEP 308Viral antigens in corneal scrapings 328Viral corneal ulcers 316Viral keratitis 326

470 Diagnostic Procedures in Ophthalmology
Virus isolation 327Vision 1
color contrast 1Vision loss 10Visual acuity 1Visual acuity assessment 307Visual acuity in low vision 9Visual acuity testing in young
children 8Allen and Osterberg charts 8binocular fixation pattern 8illiterate E chart 8Landolt broken ring 8objective retinoscopy 8occlusion 8optokinetic nystagmus 8preferential looking test chart 8sensory amblyopia 8visual evoked potentials 8
Visual electrophysiology tests 279Visual evoked potential 279, 293
flash 293, 295limitations 295normal waveforms 295pattern-onset 293
pattern-onset/offset 295pattern-reversal 293, 295
Visual field defect 118Visual field indices 140Visual field testing 349Visual function assessment 279Visual loss assessment in infants
and children 308Visual pathway 279Visual scale 409Visual thresholds 2
light discrimination 2spatial discrimination 2temporal discrimination 2
Vitrectomy 275Vitreoretinal surgery 93Vitreous hemorrhage 214, 243,
244, 250Vitreous tap 338Vogt-Koyanagi-Harada disease
247, 249Volk superfield lens 117Vortex keratopathy 93VZV infections 330
WWegener’s granulomatosis 436, 454Westphal-Piltz reaction 442Wide-angle angiography 214Wide-angle viewing system 163
panoret 163retcam 163
Wilson’s disease 93Worth four dot test 387
XX-ray 404, 427, 431
ZZeiss fundus camera 201Zernike polynomials 64Ziehl-Neelsen 323Ziehl-Neelsen technique 324