diagnosc non invasif de la fibrose hépaque par élastométrie ... · as expected, there was...
TRANSCRIPT
Diagnos(c non invasif de la fibrose hépa(que par
élastométrie impulsionnelle au cours du sevrage alcoolique
LudivineLegros,EdouardBardou-Jacquet,BrunoTurlin,SophieMichalak,NatachaLacaveOber@,AntoniaLeGruyer,KarimAziz,FrançoisVabret,GérardLeDreau,
DominiqueGuyader,RomainMoirand
JournéesSFA–16mars2018
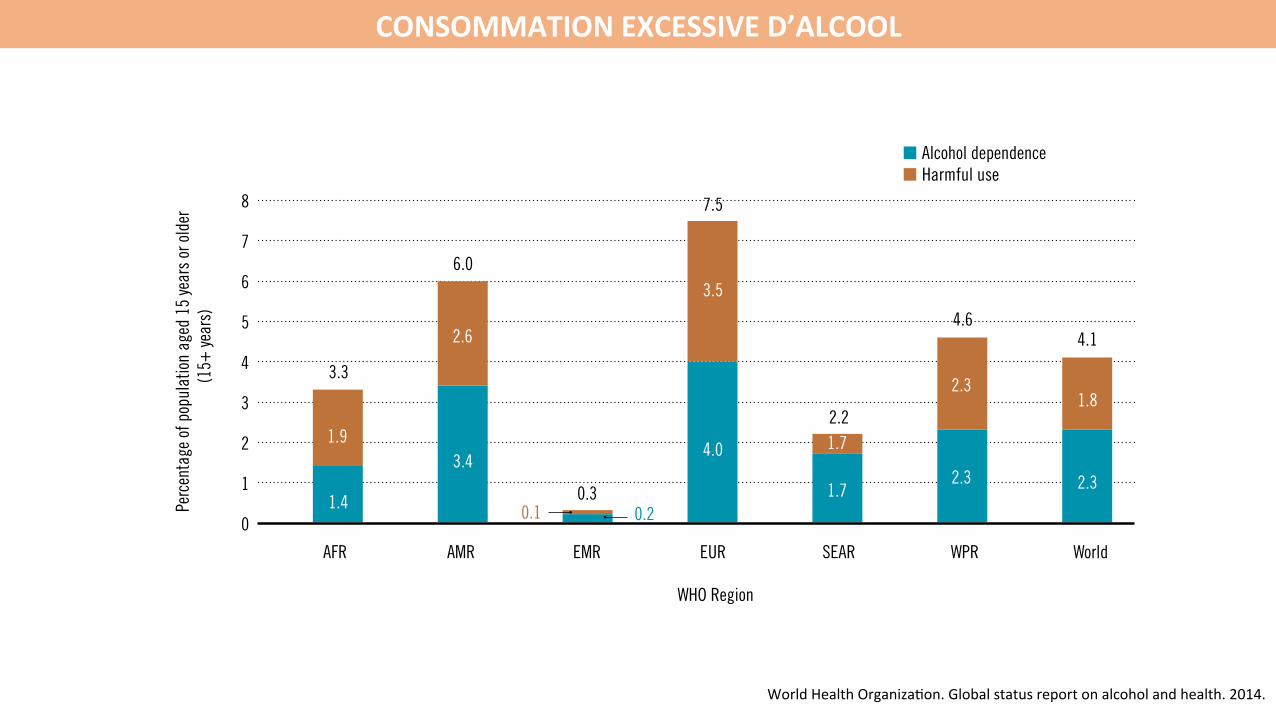
CONSOMMATIONEXCESSIVED’ALCOOL
51
Health consequences
WHO Region
12
10
Perc
enta
ge of
all
ages
DAL
Ys
8
4
SEARAFR AMR EMR EUR WPR
14
World
2.4
6
2
6.7
0.6
12.8
4.0
6.6
5.1
Figure 20. Alcohol-attributable fractions (AAFs) for all-cause DALYs by WHO region and the world, 2012
0
As expected, there was substantial regional variability in the global alcohol-attributable burden of disease and injury similar to that observed for alcohol-attributable deaths (see Figure 20 and Figure 21). In the European Region and particularly in high-income countries within Europe, there is a much higher alcohol-attributable disease burden compared to alcohol-attributable deaths because of the disabling impact of AUDs.
WHO Region
7
6
Perc
enta
ge of
pop
ulat
ion a
ged
15 ye
ars o
r old
er
(15+
year
s) 5
3
SEARAFR AMR EMR EUR WPR
8
World
4
2
Figure 19. Prevalence of alcohol use disorders (AUDsa) by WHO region and the world, 2010
a The prevalence of AUDs is the sum of the prevalence of harmful use and alcohol dependence, in line with ICD-10 criteria (WHO, 1992).
1
1.9
1.4
3.4
2.6
3.5
4.0
1.7
1.7
2.3
2.3
2.3
1.8
3.3
6.0
0.3
7.5
2.2
4.64.1
0.20.1
Q�Alcohol dependence Q�Harmful use
0
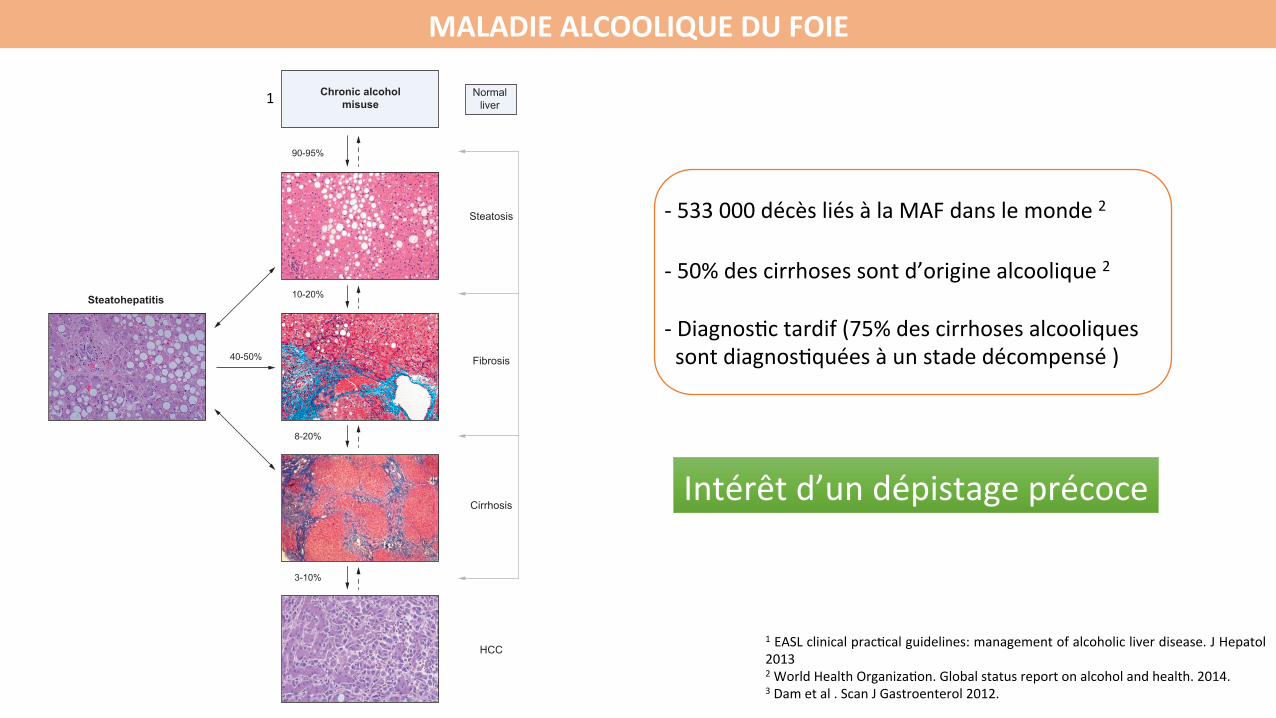
MALADIEALCOOLIQUEDUFOIE
1EASLclinicalprac@calguidelines:managementofalcoholicliverdisease.JHepatol20132WorldHealthOrganiza@on.Globalstatusreportonalcoholandhealth.2014.3Dametal.ScanJGastroenterol2012.
of alcohol per day increases the risk of progression to liver cirrho-sis to 30% in patients with uncomplicated alcoholic fatty liver,and to 37% in those with established alcoholic fibrosis [65].Whether the type of alcoholic drink consumed, e.g. wine asopposed to beer or hard liquor, impacts the risk of ALD is stilldebated [88,89] and it is unclear whether the effect of differentbeverages on disease risk is direct or related to confounding fac-tors, such as diet. Patterns of drinking vary substantially amongpatients with ALD and may influence the risk of ALD. While ear-lier studies indicated that binge drinking increases the risk of ALD[90,91], data from a recent prospective, single-center studysuggested that recent increases in liver-related mortality in the
UK are the result of daily or regular heavy drinking rather thandue to episodic or binge drinking [92]. Drinking outside mealsincreases the risk of ALD compared to drinking only together withmeals [87,93]. However, data on whether drinking patterns affectthe likelihood of ALD evolution are sparse and information onalcohol consumption is largely restricted to total amounts [16].A number of studies have also shown that caffeine intake appearsto protect against cirrhosis in heavy drinkers, with a clear inversedose–response effect [94–96]. However, the mechanism behindthis correlation is unknown.
Studies in humans have demonstrated that women are moresusceptible towards the hepatotoxic effects of alcohol, and
HCC
Steatohepatitis
Chronic alcoholmisuse
Normal liver
Steatosis
Fibrosis
Cirrhosis
90-95%
10-20%
8-20%
40-50%
3-10%
Genetic factors
Environmental factors
Female gender
Binge drinking
SNPs
Viral hepatitis
Hemochromatosis
HIVObesity and insulin resistanceCigarette smoking
Fig. 1. Natural history of alcoholic liver disease (ALD). The spectrum of ALD is comprised of steatosis, steatohepatitis, fibrosis, cirrhosis, and superimposed hepatocellularcarcinoma. Both environmental and genetic factors are known to modify the progression of ALD (adapted from [2] with permission from the American GastroenterologicalAssociation).
JOURNAL OF HEPATOLOGY
Journal of Hepatology 2012 vol. 57 j 399–420 405
1
Intérêtd’undépistageprécoce
-533000décèsliésàlaMAFdanslemonde2
-50%descirrhosessontd’originealcoolique2
-Diagnos@ctardif(75%descirrhosesalcooliquessontdiagnos@quéesàunstadedécompensé)
F ! 2, .95 (95% CI, .91–.97) for F ! 3, and .95 (95%CI, .91–.97) for F ! 4.
FS and FT agreed on the diagnosis of F " 2 vs. F !2 in 140 patients (77%). In the 43 patients in whom
they disagreed, FS agreed with LB examination results in15 cases and FT agreed with LB examination results in28 cases. As shown in Figure 3A, for the diagnosis ofF ! 2, LB examination confirmed FT in 80% of cases, FS
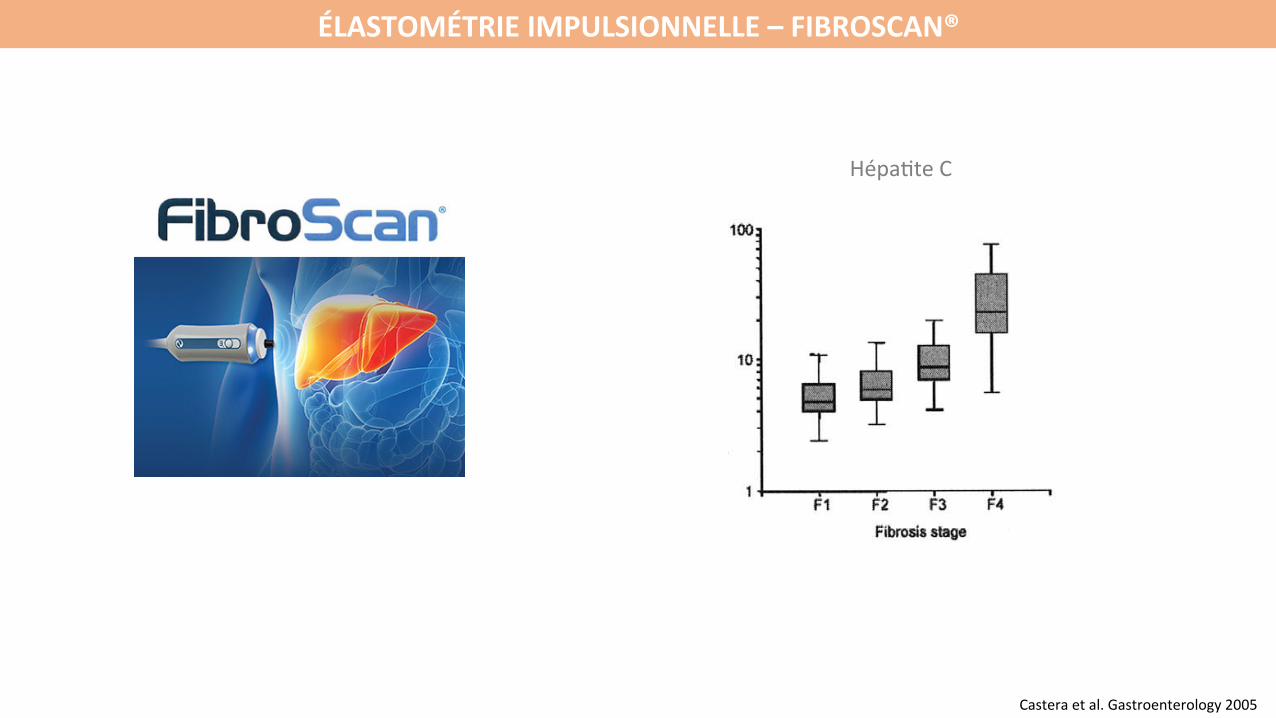
Figure 1. Box plots of (A) FS, (B) FT, and (C) APRI values for eachfibrosis stage. Because of the wide range of FS values for F4, thevertical axis is in logarithmic scale. The top and bottom of the boxesare the first and third quartiles, respectively. The length of the boxthus represents the interquartile range within which 50% of the valueswere located. The line through the middle of each box represents themedian. The error bars show the minimum and maximum values(range).
Figure 2. ROC curves for FS, FT, and APRI, and the combination of FSand FT, for different fibrosis thresholds: (A) F0–F1 vs. F2–F4 (F ! 2),(B) F0–F2 vs. F3–F4 (F ! 3), and (C) F0–F3 vs. F4 (F ! 4).
346 CASTÉRA ET AL GASTROENTEROLOGY Vol. 128, No. 2ÉLASTOMÉTRIEIMPULSIONNELLE–FIBROSCAN®
Casteraetal.Gastroenterology2005
Hépa@teC
OBJECTIF
Évaluerlaperformancediagnos@quedel’élastométrieimpulsionnelle(Fibroscan®)pouréliminerunefibrosehépa@quesévèredanslamaladiealcooliquedufoie
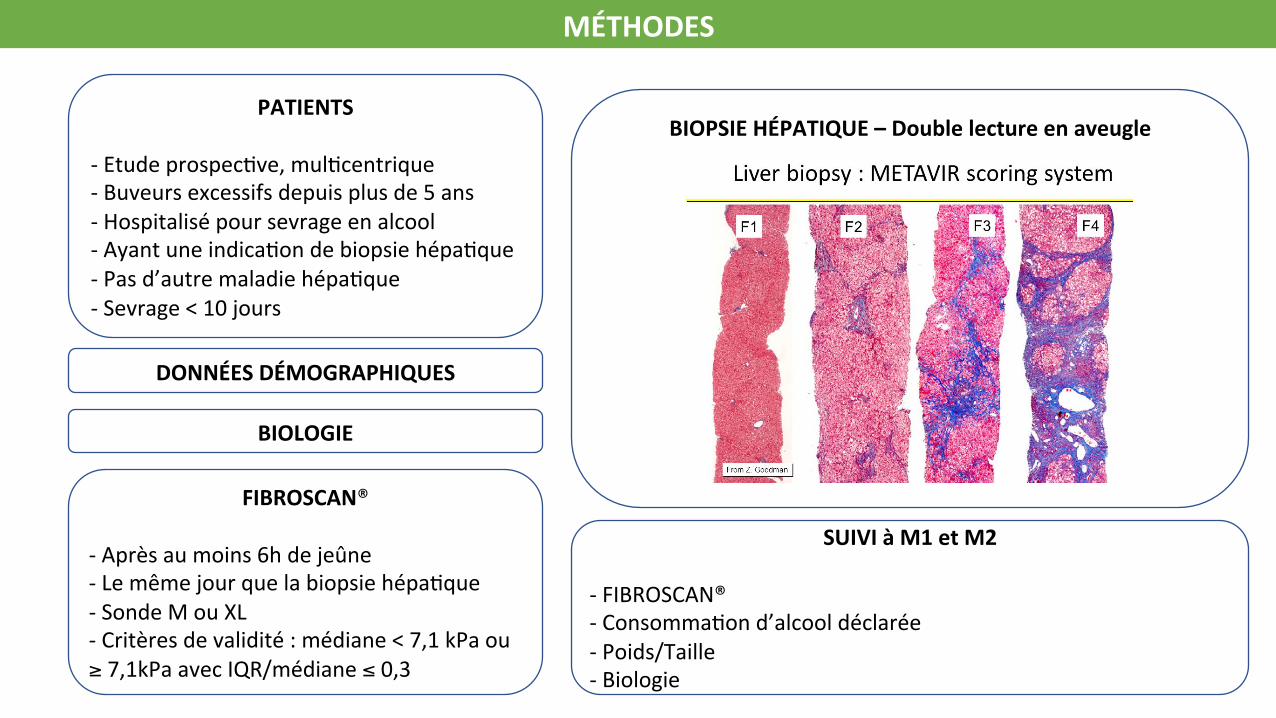
MÉTHODES
PATIENTS-Etudeprospec@ve,mul@centrique-Buveursexcessifsdepuisplusde5ans-Hospitalisépoursevrageenalcool-Ayantuneindica@ondebiopsiehépa@que-Pasd’autremaladiehépa@que-Sevrage<10jours
FIBROSCAN®-Aprèsaumoins6hdejeûne-Lemêmejourquelabiopsiehépa@que-SondeMouXL-Critèresdevalidité:médiane<7,1kPaou≥7,1kPaavecIQR/médiane≤0,3
BIOPSIEHÉPATIQUE–Doublelectureenaveugle
SUIVIàM1etM2
-FIBROSCAN®-Consomma@ond’alcooldéclarée-Poids/Taille-Biologie
DONNÉESDÉMOGRAPHIQUES
BIOLOGIE

RÉSULTATS–FlowChart
1733pa@entsscreenés
307pa@entsinclus
Donnésanalyséesn=254
Donnéesencoursd’analysen=53
Donnéessurlafibrose,n=246
Analysehistologiquedivergente,n=8
Fibroscan®techniquementimpossible,n=3
Fibroscan®invalide,n=13
Pa@entsinclusdansl’analysedeperformance,n=231
3complica@onshémorragiques
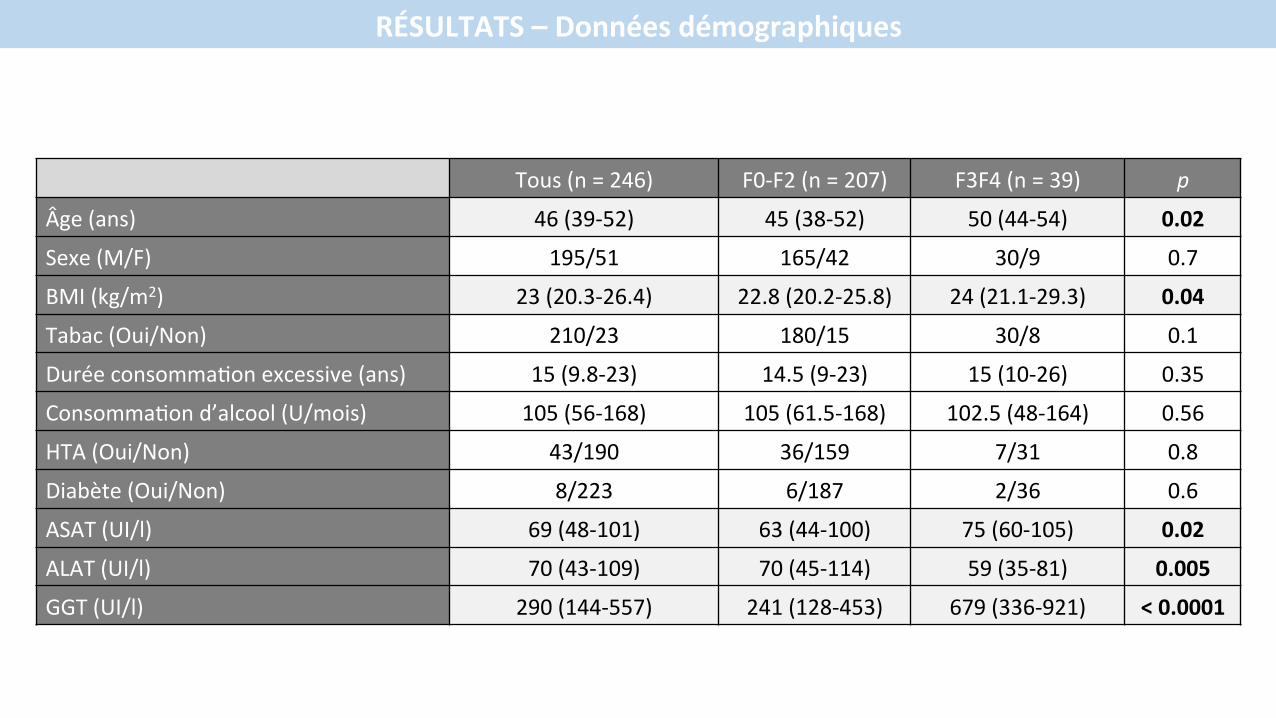
RÉSULTATS–Donnéesdémographiques
Tous(n=246) F0-F2(n=207) F3F4(n=39) p
Âge(ans) 46(39-52) 45(38-52) 50(44-54) 0.02
Sexe(M/F) 195/51 165/42 30/9 0.7
BMI(kg/m2) 23(20.3-26.4) 22.8(20.2-25.8) 24(21.1-29.3) 0.04
Tabac(Oui/Non) 210/23 180/15 30/8 0.1
Duréeconsomma@onexcessive(ans) 15(9.8-23) 14.5(9-23) 15(10-26) 0.35
Consomma@ond’alcool(U/mois) 105(56-168) 105(61.5-168) 102.5(48-164) 0.56
HTA(Oui/Non) 43/190 36/159 7/31 0.8
Diabète(Oui/Non) 8/223 6/187 2/36 0.6
ASAT(UI/l) 69(48-101) 63(44-100) 75(60-105) 0.02
ALAT(UI/l) 70(43-109) 70(45-114) 59(35-81) 0.005
GGT(UI/l) 290(144-557) 241(128-453) 679(336-921) <0.0001
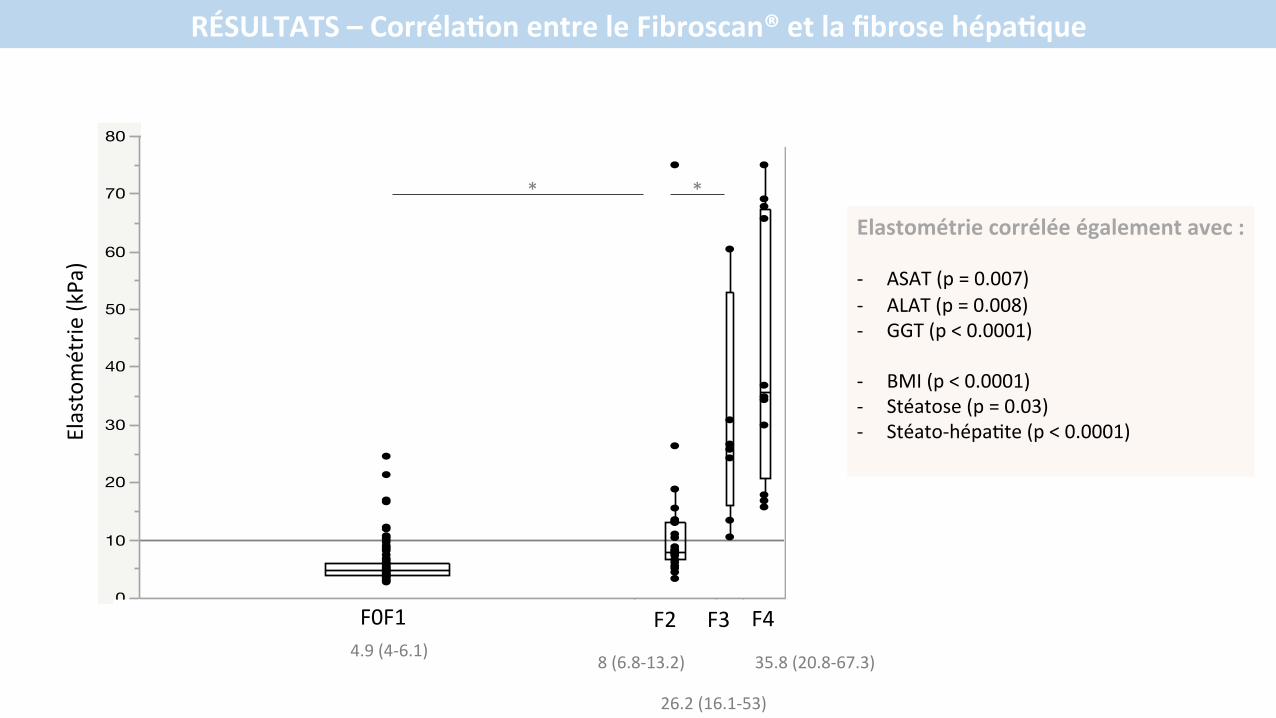
RÉSULTATS–CorrélaYonentreleFibroscan®etlafibrosehépaYque
0
10
20
30
40
50
60
70
80
FS M
0 vale
ur
F0F1 F2 F3 F4
4.9(4-6.1)
26.2(16.1-53)
35.8(20.8-67.3)
Elastométrie
(kPa)
F0F1 F2 F3 F4
8(6.8-13.2)
* *
Elastométriecorréléeégalementavec:- ASAT(p=0.007)- ALAT(p=0.008)- GGT(p<0.0001)
- BMI(p<0.0001)- Stéatose(p=0.03)- Stéato-hépa@te(p<0.0001)
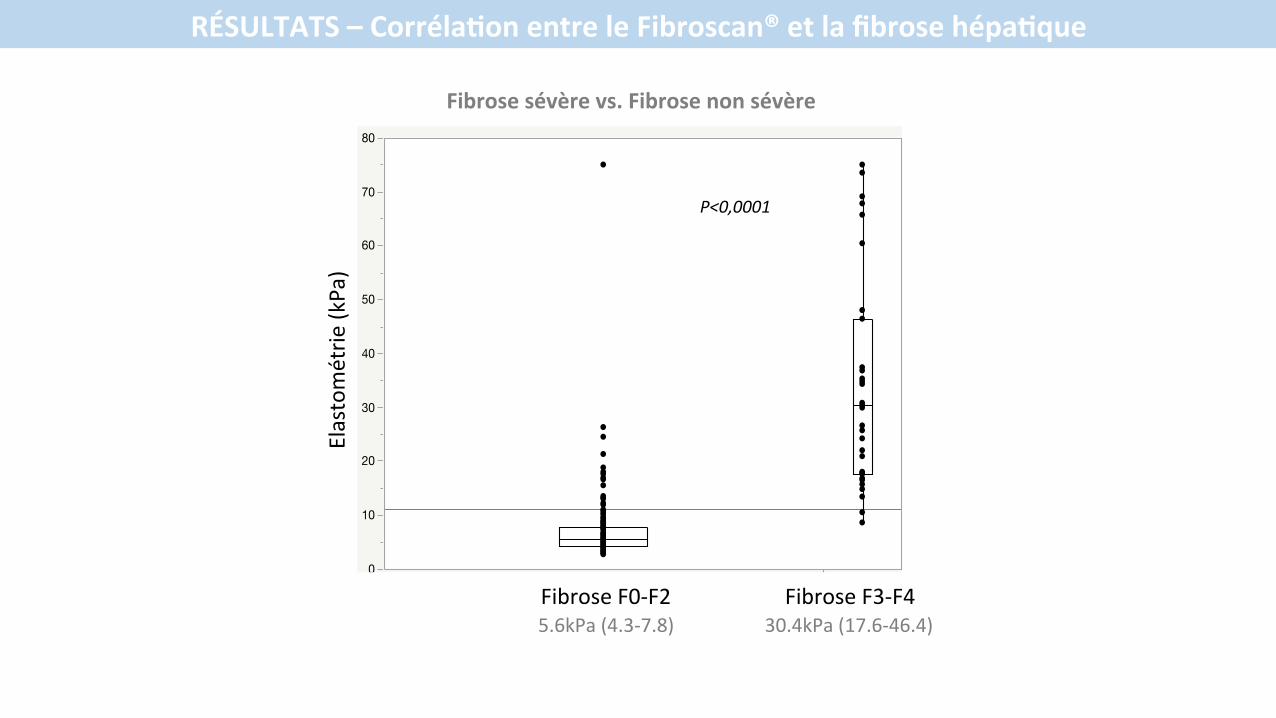
RÉSULTATS–CorrélaYonentreleFibroscan®etlafibrosehépaYque
0
10
20
30
40
50
60
70
80
FS M
0 va
leur
F0F1F2 F3F4
5.6kPa(4.3-7.8) 30.4kPa(17.6-46.4)
P<0,0001
Elastométrie
(kPa)
FibroseF0-F2 FibroseF3-F4
Fibrosesévèrevs.Fibrosenonsévère
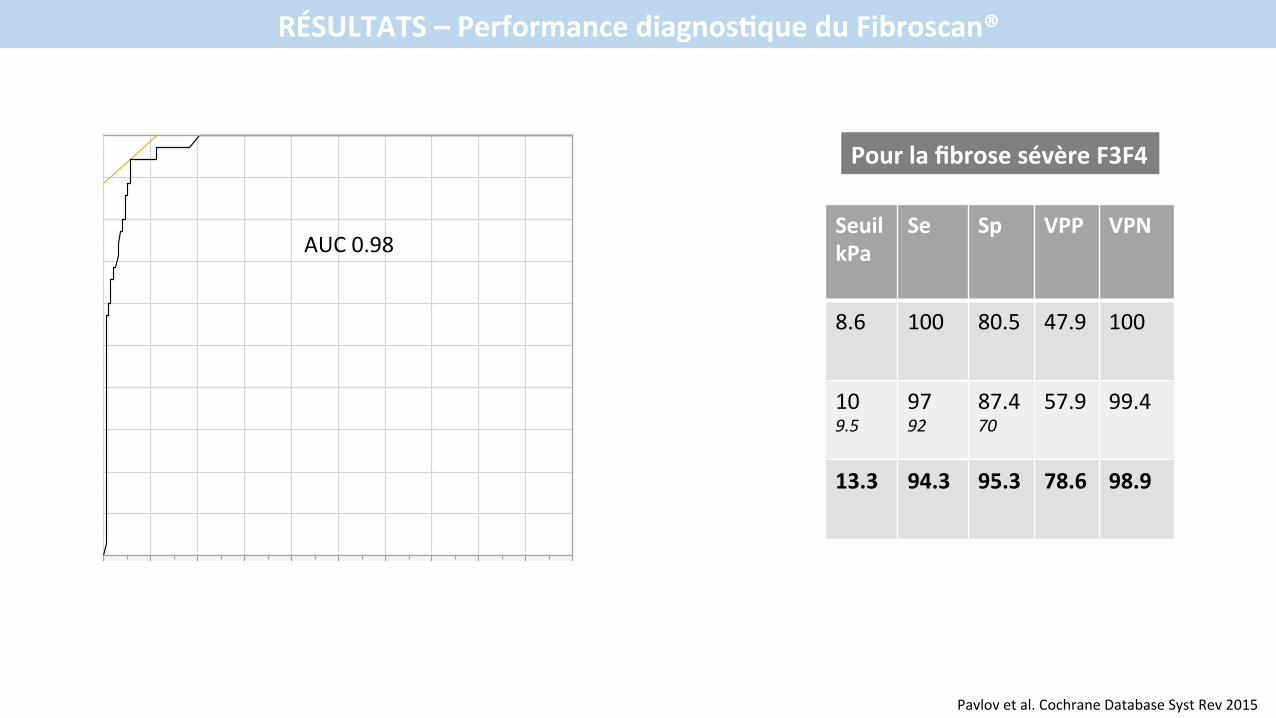
RÉSULTATS–PerformancediagnosYqueduFibroscan®
SeuilkPa
Se Sp VPP VPN
8.6 100 80.5 47.9 100
109.5
9792
87.470
57.9 99.4
13.3 94.3 95.3 78.6 98.9
PourlafibrosesévèreF3F4
Pavlovetal.CochraneDatabaseSystRev2015
Vrai
pos
itif
Sens
ibilit
é
0,00
0,10
0,20
0,30
0,40
0,50
0,60
0,70
0,80
0,90
1,00
0,00 0,10 0,20 0,30 0,40 0,50 0,60 0,70 0,80 0,90 1,001-SpécificitéFaux positif
AUC0.98
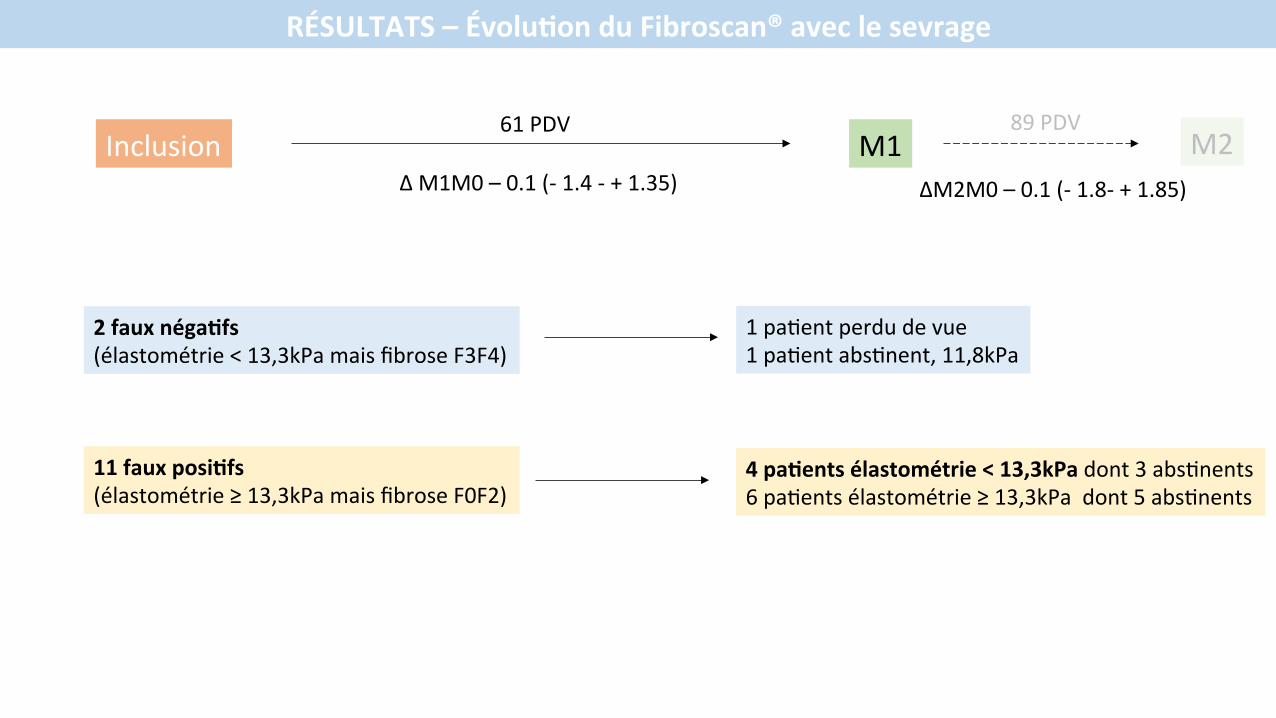
RÉSULTATS–ÉvoluYonduFibroscan®aveclesevrage
Inclusion
2fauxnégaYfs(élastométrie<13,3kPamaisfibroseF3F4)
11fauxposiYfs(élastométrie≥13,3kPamaisfibroseF0F2)
M1
1pa@entperdudevue1pa@entabs@nent,11,8kPa
4paYentsélastométrie<13,3kPadont3abs@nents6pa@entsélastométrie≥13,3kPadont5abs@nents
61PDVM2
89PDV
ΔM1M0–0.1(-1.4-+1.35) ΔM2M0–0.1(-1.8-+1.85)

CONCLUSION
Cesrésultatspréliminairesmontrentque:• Lavaleurdel’élastométrieimpulsionnelleestcorréléeàlafibrosehépa@quedanslaMAF
• Uneélastométrie<à13.3kPapermetd’exclurelafibrosehépa@quesévère
• Sonu@lisa@onenpra@quecourantepermexrait• dediagnos@quer16%defibrosehépa@quesévèreàunstadecompensé• etd’éviterlerecoursàlabiopsiechez87%depa@entssuspectsdeMAF