diagenesis and reservoir quality of the finnmark carbonate platform, barents sea ... · diagenesis...
TRANSCRIPT

Diagenesis and reservoir quality of the Finnmark carbonate platform, Barents Sea: results from wells 7128/6-1 and 7128/4-1
STEPHEN N. EHRENBERG, ERIK B. NIELSEN, TORE A. SV ÅNÅ & LARS STEMMERIK
Ehrenberg, S. N., Nielsen, E. B., Svånå, T. A. & Stemmerik, L.: Diagenesis and reservoir quality of the Finnmark carbonate
platforrn, Barents Sea: results from Wells 7128/6-1 and 7128/4-1. Norsk Geologisk Tidsskrift, Vol. 78, pp. 225-252. Oslo 1998.
ISSN 0029-196X.
The four depositional stages of this Late Carboniferous-Pennian carbonate platforrn show different patterns of diagenesis and
porosity control because of differences in sediment composition and depositional setting. Initial mixed siliciclastic-carbonate strata
(Moscovian-Gzhelian) have mostly low porosity. The following shallow-water, photozoan limestonefdolomite strata
(Gzhelian-early Sakmarian) contain multiple zones of high porosity, reflecting low abundance of both early-rnarine and Jate-burial
calcite cement, together with early leaching of aragonite and moderate degrees of dolomitization. This combination of
porosity-favourable factors resulted from deposition in a platforrn-interior location during a time of major sea-leve! fluctuation and
low accommodation creation. The overlying interval of open-shelf, heterozoan limestone (Late Sakmarian-Artinskian) has
uniformly low porosity due to extensive late-burial calcite cementation. The final stage of deepfcold-water deposition (mid-Late
Pennian) culminated in high-porosity, carbonate-poor spiculite at the top of the platforrn succession.
S. N. Ehrenberg, Statoil, N-4035 Stavanger, Norway; T. A. Svånå, Statoil, postboks 40, N-9401 Harstad, Norway; E. B. Nielsen & L. Stemmerik, Geological Survey of Denmark and Green/and, Thoravej 8, DK-2400, Copenhagen NV, Denmark.
Introduction This paper complements the accompanying paper by Ehrenberg et al. (1998), which describes the depositional evolution and sequence stratigraphy of the Finnmark carbonate platform, as represented in wells 7128/6-1 and 7128/4-1. As shown in Fig. l , the Upper Paleozoic carbonate-dominated succession is divided into nine lithostratigraphic units (L-l through L-9) based on lithofacies associations, and interpretations of sediment accommodation/supply patterns are used to define seven depositional sequences (S-1 through S-7). In the present paper, the focus is on the diagenesis and reservoir quality of these strata, with the ultimate goal of developing models useful for regional prospect evaluation. Descriptions here make frequent reference to the core description log in Appendix l of Ehrenberg et al. (1998), where measurements of plug porosity are plotted together with the gamma ray (GR) log, core description, and various petrologic analyses.
The Finnmark carbonate platform underwent four distinct stages of depositional evolution. Each of the four corresponding stratigraphic intervals (left margin of Fig. l) is characterized by a different style of diagenesis and porosity development, and is associated with a unique set of problems relevant to regional play potential and risk evaluation. These 'reservoir' problems may be summarized as follows:
Stage 1: Mixed si/iciclastic-carbonate deposition (Mosco
vian-Gzhelian). - This interval (lithostratigraphic units L-1 and L-2) has low to moderate porosity. The main questions here are why hetter porosities are associated
mostly with dolomitized zones, and whether this interval is likely to contain hetter porosity elsewhere on the Finnmark Platform.
Stage 2: Shallow-water photozoan limestone and dolomite
(Gzhelian-Early Sakmarian). -The main problem in this interval (units L-3-L-7) concerns the causes of wide porosity variations observed both vertically in each well, and laterally between wells. Why does well 7128/6-1 have higher porosity than well 7128/4-1 almost throughout this interval (Fig. l)? It is also important to understand the relationship between porosity and dolomitization, as well as the factors controlling the wide variations in dolomitization.
Stage 3: Open-marine heterozoan limestone (Late Sakmarian-Artinskian). - This interval (unit L-8) has uniformly low porosity due to extensive calcite cementation. Problems include explanation of the porosity contrast between this and the underlying porous carbonates, and determination of the timing of porosity loss with respect to burial history.
Stage 4: Deepjcold-water shale, limestone, and spiculite
(mid-Late Permian). - High porosity occurs near the top of this interval (unit L-9) in carbonate-poor spiculite, where a small oil and gas accumulation was discovered by well 7128/4-1 (5.4 Mbbl. recoverable assuming fill to structural closure; 40 Mbbl. assuming stratigraphic trapping and fill coincident with seismic anomaly area). The main problems are the origin of this porosity and the factors controlling lateral variations in porosity develop-

226 S. N. Ehrenberg et al.
4
3
2
1
Uthost�raphic
Sequences
CJ Dolomite l' ..... ,�, l
NORSK GEOLOGISK TIDSSKRIFT 78 (1998)
Spiculite
Griesbach.
U. Penn.Kung.
lt.Artinsk.
e.Artinsk.
It. Sakmar.
j�-lt.Assel.
J m.Assel.
J e.Assel.
]�� J e. Gzhe l.
J Kasimov.
It. Moscov.
� unitbou ry
c:::J Limestone c:::J Sandstone/siltstone Base-levet rise Sequence boundary tzl Calcareous spiculite c=:J Shale ' Base-levet fall
MFS � - Calcareous shale c:==J:l Buildups
Fig. l. Gamma ray and porosity profiles through the Late Carboniferous-Permian succession in wells 7128/4-1 and 7128/6-1, and litho1ogic summary of 7128/6-1
section. Tops of lithostratigraphic units (L-l through L-9) and major depositional sequences (S-1 through S-7) are indicated. Porosity profiles are based on calibration
of density log to core measurements. Stratigraphic intervals labelled l through 4 at left margin correspond to the four stages of platform depositional evolution.
ment. In both the spiculite and the Gzhelian-Sakmarian carbonates, prospectivity is critically dependent upon definition of an up-dip lateral seal for stratigraphic trapping. Thus another problem in both these intervals is the identification of either potential sealing facies, or mechanisms for lateral diagenetic porosity occlusion.
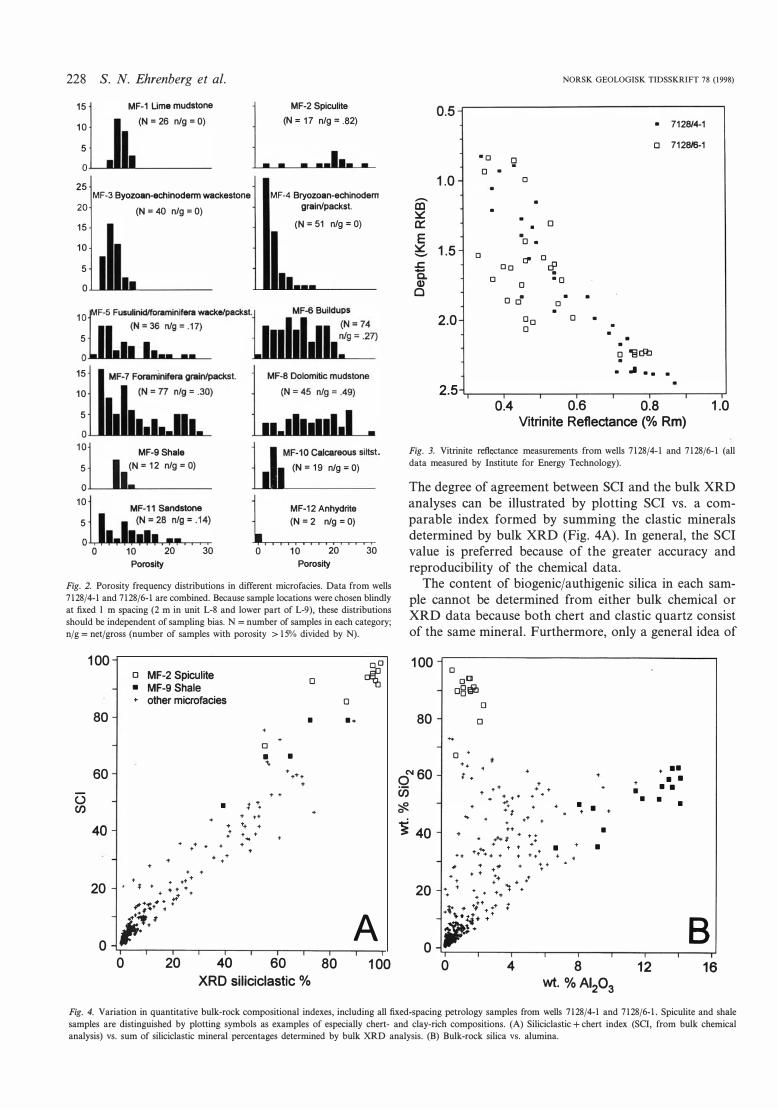
Because diagenetic style and porosity are strongly correlated with lithology and depositional setting (Table l), descriptions of each stratigraphic interval are organized according to rock type (microfacies category). Porosity distributions in each microfacies are shown in
Fig. 2, where data from both wells 7128/4-1 and 7128/6-1 are combined. Because sample locations were chosen blindly at fixed l m spacing (2 m in unit L-8 and the lower part of L-9), these distributions should be independent of sampling bias. A 'net/gross' value is calculated for each microfacies as the ratio of the number of samples with porosity > 15% divided by the total number of samples in that microfacies. Thus netfgross decreases in the order MF -2, -8, -7, -6, -5, -11, while microfacies MF-l, -3, -4, -9, -10, and -12 have no occurrences of porosity > 15%. The distribution of these mi-

NORSK GEOLOGISK TIDSSKRIFT 78 (1998)
Table l. Dolomitization and porosity in different rock types.
Diagenesis, Finnmark carbonate platform, N. Norway 227
Microfacies Dolomitization Porosity
Main porosity
occluding processes
Foraminifera Undolomitized to weakly dolomitized.
grainstone/packstone (MF-7)
Primary interparticle, intraparticle, and
moldic.
Cementation by fine to coarse calcite
spar.
Buildups (MF-6) Wide variations. Moldic (little dolomitized buildups). Moldic
and intercrystalline (dolomitized buildups).
Late calcite cement, saddle dolomite and
coarse anhydrite (little dolomitized
buildups). Anhydrite plugging and
fine-rhombic dolomite cement
(dolomitized buildups).
Mud-rich lithologies (MF-8 Wide variations, but mainly extensively
and MF-5) dolomitized.
Intercrystalline and moldic. Correlation of
porosity with dolomitization (Fig. 13C)
suggests that creation of intercrystalline
porosity is the main process responsible for
the observed wide porosity variation.
Presence of tight mud matrix rich in
calcite microspar, or formation of tight
microdolomite matrix.
Bryozoan-echinoderm Undolomitized except for minor Mainly intraparticle. Cementation by syntaxial and fine
calcite spar. However, a subordinate
group of these samples experienced
extensive early mechanical compaction.
grainstone to wackestone dolomite rhombs in matrix-rich areas.
(MF-4 and MF-3)
Sandstone (MF -Il ) Wide variations. Correlation of higher
porosity with increasing dolomitization
(Fig. 130) implies inhibition of
compaction by early dolomite
cementation.
Mainly intraparticle and intercrystalline. Compaction and cementation by
syntaxial and fine calcite spar.
crofacies within each lithostratigraphic unit (Fig. l) is illustrated in Fig. 6 and Appendix l of Ehrenberg et al. (1998).
Reservoir conditions and burial history The CarboniferousfPermian section has a near-hydrostatic fluid pressure gradient throughout and is estimated to follow a geotherma1 gradient of 38.8°Cfkm, with 48.9°C at a depth of 1.18 km below the sea floor (1570 m RKB in well 7128/6-1). No uncontaminated formation water has been sampled, but salinity at 1570 m RKB is estimated to be high (around 160,000 ppm equivalent NaCl, or roughly 5 times seawater salinity) based on drill-stem test samples and fluid pressure gradient. Maximum burial depth of 1.0-1.5 km greater than present is believed to have been attained in Oligocene/Miocene time, followed by Plio/Pleistocene uplift and erosion caused by a combination of deep-seated tectonism and glaciation (Nyland et al. 1992; Dore & Jensen 1995).
Vitrinite reflectance (VR) data from the two wells are compared in Fig. 3. These profiles match typical VR profiles from Viking Graben and Haltenbanken wells if the latter are offset 1.0-1.5 km shallower, thus supporting the uplift/erosion estimate noted above. VR values in well 7128/6-1 tend to be lower than in well 7128/4-1 in the interval 1.5-2.1 km, but are similar below 2.1 km. The deeper values are mostly measured on coal, and have a high degree of confidence, whereas measurements from the overlying carbonate section have low reliability. The apparent differences within the carbonate section are therefore regarded as too uncertain to indicate any sig-
nificant difference in thermal history between the well locations.
Despite the similarity of the VR trends, evidence from the Visean sandstone unit underlying the carbonate succession (roughly 2400-2500 mRKB in both wells) suggests a higher degree of thermal exposure in well 7128/4-1. The Visean sandstone unit is less porous in well 7128/4-1 (average 8%) than in well 7128/6-1 (average 16%; compare porosity profiles in Fig. 4 of Ehrenberg et al. 1998). Petrographic study of cuttings shows that the lower porosity in well 7128/4-1 results from greater quartz cementation, a process believed to proceed as a function of time-temperature integral (Bjørkum et al., 1998).
Analytical techniques The reader is referred to Ehrenberg et al. (1998) for description of the fixed-interval sampling approach used and basic information on the analytical techniques. The bulk XRD analysis of each sample was used to calculate the relative proportions of weight percent calcite and dolomite, expressed as:
CCD = 100 x Calcite/(Calcite + Dolomite).
A 'Siliciclastic + Chert Index' (SCI) value is calculated for each sample from the bulk chemical analysis:
SCI = wt% Si02 + Al203 + Ti02 + Fe203 + Na20
+ K20 + P205 + H20.
228 S. N. Ehrenberg et al.
15
10
5
o
25
20
15
10
5
o
5
MF-1 Ume mudstone
(N = 26 n/g = O)
MF-3 Byozoan-echinodenn wackestone
(N = 40 n/g = O)
o.u�--��--��---
15
10
5
MF-9Shale
5 (N = 12 n/g = O)
0L-�UUL_ ________ _
10
5
10 20 30 Porosity
o
MF-2 Spiculite
(N = 17 n/g = .82)
MF-4 Bryozoan-echinodem grain/packst.
(N = 51 n/g = O)
(N=19 n/g=O)
MF-12 Anhydrite
(N = 2 n/g =O)
10 20 Porosity
30
Fig. 2. Porosity frequency distributions in different microfacies. Data from wells 7128/4-1 and 7128/6·1 are combined. Because sample locations were chosen blindly at fixed l m spacing (2 m in unit L-8 and lower part of L-9), these distributions should be independent of sampling bias. N = number of samples in each category; n/g = netfgross (number of samples with porosity > 15% divided by N).
100 �o o MF-2 Spiculite o • MF-9 Shale + other microfacies o
80 • ••
D • • ...
60 . •••
u • � •. en + .. 40 + •• +
. . . . ... . . + . + + + + +
+ + .
+ + •• + 20 ; • •• + + .; 1'
�;"tl � +
o ,�
.
� A
o 20 40 60 80 100 XRD siliciclastic o/o
-al ::.::: 0:: E
::.::: -..c: -a. Cl)
Cl
NORSK GEOLOGISK TIDSSKR!Ff 78 (1998)
0.5 �--------------------------------, 7128/4-1
o 7128/6-1
o • 1.0 a
o . o •
1.5 IJ r1' o
o o dl . a o •o
o o• a
2.0 Da o o
o'§Ob . . .. . . .
2.5 'o--.....---.----r----.----,-----,,------r' o.4 o.6 o.a
Vitrinite Reflectance (o/o Rm) 1.0
Fig. 3. Vitrinite reflectance measurements from wells 7128/4-1 and 7128/6-1 (all data measured by Institute for Energy Technology).
The degree of agreement between SCI and the bulk XRD analyses can be illustrated by plotting SCI vs. a comparable index formed by summing the clastic minerals determined by bulk XRD (Fig. 4A). In general, the SCI value is preferred because of the greater accuracy and reproducibility of the chemical data.
The content of biogenicjauthigenic silica in each sample cannot be determined from either bulk chemical or XRD data because both chert and clastic quartz consist of the same mineral. Furthermore, only a general idea of
100 o
oD o8�
o
80 o
o .. • ••
N 60 ; . • • o Ci5 '#.
j 40
20
o
..
..
.. • + ... .
. •t . ••
:++t + •
... ........... + •
• .. . . .
.. . . . . +
• .. .. + ... • +
... .. :• + ..... . + + i' "t. + . . +
+ •
t. .... .. ; .. . + . . . ��H
o
. +
4
.
• + • +
• • •
8 wt. o/o Al203
+ • • • • • •
B 12 16
Fig. 4. Variation in quantitative bulk-rock compositional indexes, including all fixed-spacing petrology samples from wells 7128/4-1 and 7128/6-1. Spiculite and shale samples are distinguished by plotting symbols as examples of especially chert- and clay-rich compositions. (A) Siliciclastic + chert index (SCI, from bulk chentical analysis) vs. sum of siliciclastic ntineral percentages deterntined by bulk XRD analysis. (B) Bulk-rock silica vs. aluntina.

NORSK GEOLOGISK TIDSSKRIFT 78 (1998)
Table 2. Cement terminology.
Cement type
Calcite: Micritic*
Microspar•
Fine spar••
Coarse spar
Fibrous
Prisma tie
Syntaxial
Dolomite: Microdolomite•
Fine rhombic**
Coarse rhombic
Saddle
Silica: Chalcedony
Chert
Macroquartz
Quartz overgrowths
Other: Anhydrite
Gypsum
Bari te
Fluorite
Crystal size Characteristics (mm)
<0.004 Replaces mud rnatrix and bioclast walls.
0.004-0.02 Infills inter- and intraparticle volumes.
0.02-0.1
O. l-l
<0.5
<0.15
0.3-2
<0.02
0.02-0.1
O.l-l
<0.5
<0.05
0.05-5
0.3-2
Replaces mud matrix and surrounds micritic peloids in micropeloidal matrix.
lnfills inter- and intraparticle volumes.
Infills inter- and intraparticle volumes not filled by fine spar.
Crusts of radial fibrous cement.
Crusts of radially-oriented microspar lining bioclast walls.
Overgrowths, rnainly 0.05-0.3 mm wide, in optical continwty with host echinoderm fragments.
Replaces matrix and bioclasts. Typically subhedral to anhedral and inclusion-rich.
Pore-filling euhedral rhombs, commonly with inclusion-rich cores.
Pore-filting euhedral rhombs.
Pore-filting crystals with sweeping extinction and curved surfaces.
Fills pores and replaces bioclasts. Both length-fast and length-slow varieties are present.
Fills pores and replaces bioclasts. Post-dates chalcedony.
Fills pores and fractures. Post-dales chert.
Syntaxial cement on detrital quartz grains.
Includes both fine 'felty' and coarse-crystalline fabrics.
Relicts of radiating crystals associated with anhydrite.
Replacive to pore-filling laths.
Minor cement; difficult to recognize, except using CL.
• These relatively early, finer-grained cements typically have bright blue-light fiuorescence.
•• Fine calcite spar and fine rhombic dolomite tend to have weak, commonly sector-zoned blue-light fiuorescence. Coarser cements are non-fiuorescent.
the chert content can be obtained from the thin sections
or the polished core slabs, because these two-dimensional
views may not be representative of three-dimensional rock
volume, especially in the case of the common nodular form
of occurrences of biogenic and authigenic silica. A p lot of
silica vs. alumina (Fig. 4B) can be used to highlight samples
with possible high biogenic or authigenic silica content,
because such samples would be expected to have high ra ti os
of silica/alumina. However, varying silicafalumina ratio
can also refiect variation in the nature of the siliciclastic
component, which consists mainly of quartz silt or sand
in some samples, and mainly of clay in other samples. In
Fig. 4B, there is a sharp cut-off of maximum alumina
Diagenesis, Finnmark carbonate platform, N. Norway 229
content for given silica content, which can be interpreted
as refiecting the composition of clastic material consisting
of pure clay.
Stable isotope analyses were performed by Harald
Johansen at the Institute for Energy Technology (IFE),
Kjeller, Norway. All results are reported relative to the
PDB standard. Two types of samples were analysed:
bulk-rock samples and laser-probe samples. The laser
probe technique (precision and accuracy described in
Smalley et al. 1989) uses a laser beam to decompose or
'ablate' a region about 10 microns in diameter which has
been precisely located on the polished surface of a thin slice
of rock. The rock slice is contained in a vacuum chamber
on the stage of a petrographic microscope, and the
liberated co2 is drawn off and frozen in to a sample tube
imrnediately after each ablation. Typically, 3 to 6 separate
ablations (adjacent points in the same or similar textural
component) are needed to accumulate sufficient gas for
analysis. This technique thus allows microsampling of
individual petrographic features with a resolution ap
proaching I O microns.
Cement types and diagenetic sequence
The descriptive cement terminology used in this study (Table 2) is based on petrographic appearance (mainly crystal size and morphology), using a conventional light microscope. As described below, however, observations using cathodoluminescence (CL) and blue-light fiuorescence (Dravis & Yurewicz 1985) reveal discontinuities in cement growth within some of these cement categories, as well as possible continuity of cement growth between some categories. The following general diagenetic sequence is interpreted as being the simplest plausible scenario consistent with observations throughout the Upper Paleozoic carbonates. Diagenetic sequence in the spiculite of unit L-9 is described separately below.
l. Marine cementation is represented by fibrous calcite, which is, however, present in only a few samples. The fibrous calcite coarsens outward from bioclast walls, terminating in prismatic to equant calcite microspar, probably an early phreatic cement.
2. Aragonite dissolution is conventionally ascribed to exposure and leaching by meteoric water. Aragonite may also have been partly replaced by calcite microspar and fine spar, in exceptional cases resulting in preservation of algal cell structure.
3. Early calcite cementation formed microspar and fine spar lining bioclasts and molds. These are viewed as shallow phreatic cements, probably representing both marine and meteoric porewaters to widely varying degrees in different samples. The most distinctive morphology is radially-oriented, prismatic spar that forms co a tings 0.02-

230 S. N. Ehrenberg et al. NORSK GEOLOGISK TIDSSKRIFT 78 (1998)
Fig. 5. Sample depth 1901.00 m from wel17128/6- l (near the center of the maximum-porosity zone in the lower part of unit L-6; see Appendix l , panelS in Ehrenberg et al. 1998). Photomicrographs of the same area in plane light (left), CL (center), and blue-light ftuorescence (right). Interior of a leached Palaeoaplysina plate, showing walls of canals (canal interior ='C') which are replaced by calcite microspar ha ving mottled reddish CL and dull ftuorescence ('l'). This finest-crystalline calcite is overgrown by fine spar ('2') that is non-luminescent and brightly fiuorescent, which is, in turn, overgrown by later coarser spar ('3') ha ving oscillatory CL zoning and no ftuorescence.
O. l mm thick on bioclasts (Figs. 5-7). In other cases, bioclast walls and molds are lined by equant calcite microspar to fine spar (Fig. 8). Micritic calcite composing bioclast walls and mud matrix has a finely mottled, dull red-orange CL, suggesting varying degrees of alteration and replacement during early, probably meteorically-influenced cementation. The earliest preserved cement generation appears to be non-luminescent, brightly fluorescent calcite that forms the innermost zone of the prisma tie spar coatings (Figs. 5, 6). This cement is conformably overgrown by brightly luminescent, dull to non-fluorescent calcite. Syntaxial cement growth on echinoderm fragments shows a similar pattern (Fig. 9), as discussed below under unit L-8.
4. Early dolomite replacement and cementation resulted in microdolomite and fine rhombic dolomite (Table 2). Microdolomite consists of subhedralfanhedral, inclusionrich crystals that replace mud matrix, bioclasts, and early calcite cements. Fine rhombic dolomite forms clear (inclusion-free) crystals that typically overgrow the replacive dolomite microspar (Figs. 10, 11). Like the calcite cements, therefore, dolomite typically shows increasing crystal size outward into pores. This stage is discussed further in the later section on dolomitization.
5. Late calcite cementation formed coarse spar that is characterized by oscillatory dull to bright CL zoning (Figs. 7, 8, 12). Much of the fine calcite spar in the same samples has similar CL characteristics (Figs. 6, 8), and therefore represents the earlier stages of late calcite cementation. The fine calcite spar category of Table 2 thus
includes both early and late calcite cements. Most syntaxial calcite cement is also interpreted to have formed
during this late cementation period. Staining of thin sections shows that the outer zone of both coarse spar crystals and syntaxial calcite overgrowths is iron-rich.
6. Late dolomite cementation produced both coarse rhombic dolomite and part of the fine rhombic dolomite. Dolomite shows a pattern of CL variation correlated with texture that is similar to the pattern observed for the calcite cements; early dolomite has uniform dull red-orange CL, while some fine rhombic dolomite and all coarse rhombic dolomite display oscillatory dull to bright to dark CL zoning (Fig. 10). Late dolomite commonly cross-cuts zoning patterns in late calcite.
7. Saddle dolomite postdates coarse rhombic dolomite. The saddle dolomite has mostly very dull, even CL, but some crystals have cores with bright oscillatory CL zoning
(probably coarse rhombic dolomite on which the saddle dolomite nucleated), and other crystals have outer oscillatory zones of dull to moderate CL intensity (Fig. 12).
8. Coarse anhydrite cement commonly infills remaining former pore spaces around saddle dolomite, but some coarse anhydrite may also have formed at various earlier stages in the diagenetic sequence. All variations from fibrous to lath-shaped to coarse, blocky anhydrite are
commonly present in the same thin section. Coarse anhydrite typically cross-cuts and encloses remnants of all other cements present (Fig. 12).

NORSK GEOLOGISK TIDSSKRIFT 78 (1998) Diagenesis, Finnmark carbonate platform, N. Norway 231
Fig. 6. Sample depth 1877.00 m from well 7128/6-1 (from just above the top of the stratigraphically youngest occurrence of porosity > 15% in unit L-6; see Appendix l , panel 6 in Ehrenberg et al. 1998). Photomicrographs of the same area in plane light (left), CL (center), and blue-light fluorescence (right). Brachiopod shell ('O') is overgrown by four generations of cement. (Compare with num bered cement stages in Fig. 5.) The earliest cement ('l') consists of inclusion-rich, micritic to microsparry calcite having mottled reddish CL and dull fluorescence, possibly reflecting replacementfalteration of high-Mg calcite marine cement during later meteorically-influenced diagenesis. The next stage ('2') is non-luminescent and brightly fluorescent, reflecting earliest phreatic cementation. This is overgrown by moderately luminescent, non-fluorescent cement ('3'), which is in turn overgrown by brightly luminescent, non-fluorescent cement ('4'). All cement-stage boundaries except 1/2 appear 'conformable' (lacking evidence for dissolution followed by discordant zonal geometry).
Mixed siliciclastic-carbonate interval (L-1 and L-2)
This interval includes lithostratigraphic units L-l, consisting of alternating sandstone and limestone, and L-2, composed mainly of silty shale and silty wackestone to calcareous siltstonejvery fine-grained sandstone. Both units are siliciclastic-rich, but L-1 represents relatively high-energy, shallow-shelf conditions, while L-2 represents deeper-water settings well below fair-weather wave base.
Lithostratigraphic unit L-1
The cored portion of this unit consists of three intervals of porous (mainly 10-15%) dolomitic sandstone and subordinate silty dolomitic mudstone, alternating with three intervals of tight (porosity mainly < 5%) limestone and calcareous sandstone (Appendix l, panel l of Bh renberg et al. 1998).
Dolomitic sandstone intervals, 3-6 m thick, are characterized by poorly sorted quartz and K-feldspar grains, bimodal sorting, and well-rounded coarser grains. Three main rock types make up the dolomitic intervals:
• The lowermost dolomitic sandstone interval contains abundant calcite bioclasts and is cemented by coarse dolomite spar. The coarse spar cement is accompanied by microdolomite grain coatings in the lower part of the interval.
• In the upper two dolomitic sandstone intervals, calcite bioclasts are entirely absent, but are possibly represented by abundant grain molds. These sandstones are cemented by microdolomite, which typically forms coatings of uniform thickness around all grains andgrain molds. Pores are commonly partly infilled by coarse anhydrite cement, accompanied in a few samples by gypsum and chalcedony.
• Dolomitic mudstone with widely varying silt content (MF-8) occurs as three thin beds associated with the upper two dolomitic sandstone intervals. Abundance of intercrystalline microporosity increases with increasing degree of replacement by microdolomite.
Limestone and calcareous sandstone intervals, 3-5 m thick, include a range of rock types with differing styles of porosity occlusion:
• Phylloid algal buildups (MF-6) are present as five beds, each a meter or two in thickness. These rocks consist mainly of micro-peloidal matrix, cemented by calcite microspar. Molds of phylloid plates are typically lined by microspar and then infilled by fine-equant and coarse calcite spar, accompanied by later saddle dolomite in the uppermost sample (2100.75 m) and by still later coarse anhydrite in this and several other samples.
• Skeletal grainstone and packstone (MF-7) are heavily cemented by syntaxial overgrowths on crinoid fragments and fine-equant to coarse calcite spar.

232 S. N. Ehrenberg et al. NORSK GEOLOGISK TIDSSKRIFT 78 (1998)
Fig. 7.' Sample depth 1875.00 m from well 7128/6-1 (from the upper part of unit L-6, in the low-porosity zone overlying the maximum-porosity zone; see Appendix l , panel 6 in Ehrenberg et al. 1998). Photomicrographs of the same area in plane light (left), CL (center), and blue-light fluorescence (right). VP direction is toward top of page. A brachiopod shell (consisting of primary, non-luminescent calcite; parti y replaced by areas of brownish chert, 'C') is partly fil led by geopetal micropeloidal sediment (turbid brownish areas in plane light). The shell is overgrown by cement stages 1-3 (described in Fig. 6), following which all macroporosity is infilled by late coarse calcite spar with oscillatory CL zoning and no fluorescence. The brightly luminescent stage 4 cement is absent except for possible minor occurrences ('4') associated with the micropeloidal matrix.
• Skeletal wackestones (MF-5) are characterized by a tight matrix consisting of micritic to microsparry calcite plus abundant dolomite rhombs. Cavities within bioclasts are infilled by coarse calcite spar or by saddle dolomite.
• Calcareous sandstone (MF -11) consists of poorly sorted siliciclastic grains pl us abundant calcite bioclasts and lithoclasts. Porosity loss appears to have occurred mostly by compaction, with remaining intergranular volume infilled by fine-equant and syntaxial calcite cement.
There are numerous mutually reinforcing reasons for the contrast in porosity between the calcareous and dolomitic sandstones of unit L- l. In the calcareous sandstones, low porosity results from ( l) poor sorting; (2) extensive stylolitic dissolution; and (3) calcite cementation. Higher porosity in the dolomitic sandstones reflects (l ) dominance of a relatively well-sorted silt to very fine sand fraction; (2) early framework stabilization by growth of grain-coating microdolomite with high intercrystal porosity; (3) lack of major stylolitization and calcite cementation; and (4) extensive grain dissolution (of both inferred calcite bioclasts and feldspars). These factors all stem from either primary depositional characteristics, or environmentally-dictated early diagenetic processes.
The most interesting question concerning unit L-1 is why significant macroporosity has been preserved in the dolomitic intervals, but not in the limestones. Considerable macroporosity in the limestones was eliminated by
infilling with late, burial-related cements, including coarse calcite spar, saddle dolomite, and anhydrite. The fact that these late cements did not also occlude the dolomitic sandstone intervals implies that they were derived from local sources within the limestone intervals, with limited potential for meter-scale vertical transport into the interlayered dolomitic intervals. This conclusion has positive implications for the possible occurrence of porous reservoirs in unit L-1 elsewhere on the Finnmark Platform.
Lithostratigraphic unit L-2
Diagenesis can be summarized in terms of the following four lithologies:
• Silty shale (MF-9) has low porosity (mostly 5-8%) due both to compaction of the clay-rich matrix, and cementation by micritic to microsparry calcite and very fine-grained rhombic dolomite.
• Silty/shaly wackestone (MF-3) has low porosity (mostly 2-5%) because of extensive calcite cementation of both matrix and internat cavities in bioclasts.
• Calcareous siltstones (MF -l O) are lithologically gradational into the MF-3 wackestones, and show a similar style of tight calcite cementation throughout unit L-2. There are also three beds, 0.4-1.5 m thick, of fine- to medium-grained sandstone with abundant calcite bioclasts. These are tightly cemented by calcite spar, much of which forms syntaxial overgrowths on echinoderm fragments.

NORSK GEOLOGISK TIDSSKRIFT 78 (1998) Diagenesis, Finnmark carbonate platform, N. Norway 233
Fig. 8. Sample depth 1960.00 m from well 7128/6-1 (from the low-porosity Jower part of an undolornitized buildup in the upper part of unit L-4). Photornicrographs of the same area in plane light (Jeft), CL (center), and blue-light fiuorescence (right). A Jeached Palaeoaplysina plate has canals ('C') filled by dark rnicritic sediment and internal mold filled by calcite cement. Three generations of cement are apparent. The earliest stage consists of rnicrospar with dull luminescence and bright fiuorescence ('l'). The second stage consists of coarse spar with oscillatory CL zoning and no fiuorescence ('2'). All macroporosity was subsequently infilled by coarse spar with uniform dull lurninescence and no fiuorescence ('3'). Exact correlation between these cement stages and those shown in previous figures is uncertain.
• Phylloid algalfPalaeoaplysina buildups (MF-6) in the top part of the lowermost depositional cycle have cementation similar to the buildups in unit L-l. Platey molds are lined by calcite microspar and infilled by coarse calcite spar, followed by saddle dolomite and coarse anhydrite. Low to modest amounts (1-5%) of visible porosity occur in the micro-peloidal, bioclastrich matrix, which encloses the larger, entirely cementfilled molds.
Shallow-water photozoan dolomite (L-3 through L-7)
limestone and
This interval is characterized by wide variations in porosity, dolomitization, and anhydrite content. Three main facies associations are present, making up five lithostratigraphic units:
l. Dolomitic mudstones (MF-8), deposited in a restricted lagoonal to sabkha setting (L-3 and L-5);
2. Alga1 buildups (MF-6) and inter-buildup wackestones (MF-5), representing an intermittently restricted, shallow-shelf setting, probably below fair-weather wave base (L-4); and
3. Foraminifera-algal grainstonejpackstones (MF-7), probably deposited as shallow-water sand shoals (L-6
and L-7).
Each of these facies assocmt10ns has its particular diagenetic style. Thus there is no single factor nor any
unique combination of factors that accounts for the wide porosity variations in the Gzhelian-lower Sakmarian interval, but various controlling relationships become apparent when individual microfacies categories are considered separately.
Important features relevant to reservoir prediction are:
• The occurrence of high porosities in a wide range of microfacies types (Fig. 2). This indicates that reservoirgrade porosity development is not dependent upon the presence of any one depositional setting, but can be expected more or less throughout this interval. This statement should not be misconstrued as implying that porosity is not dependent upon depositional setting; rather, different combinations of porosity-favourable factors exist in different facies.
• The trend of upward-increasing porosity through the Gzhelian-Asselian interval in we/1 7128/6-1, culminating in a maximum-porosity zone in the /ower part of unit L-6 (Fig. 1). This trend imp1ies an overall depositional control on porosity related to the 2nd-order accommodation minimum interpreted to occur near the top of unit L-5, just below the porosity maximum.
• The lower porosity profi/e of the equivalent interval in we/1 7128/4-1. A possible explanation for this difference is the inferred deeper-water depositional setting of the 7128/4-1 location throughout Gzhelian-Iower Sakmarian time, possibly resulting in lesser subaerial exposure and leaching. In addition, the occurrence of distinctly lower overall porosities in both the Visean sandstone unit and the Gzhelian/Asselian carbonate interval in
234 S. N. Ehrenberg et al. NORSK GEOLOGISK TIDSSKRIFT 78 (1998)
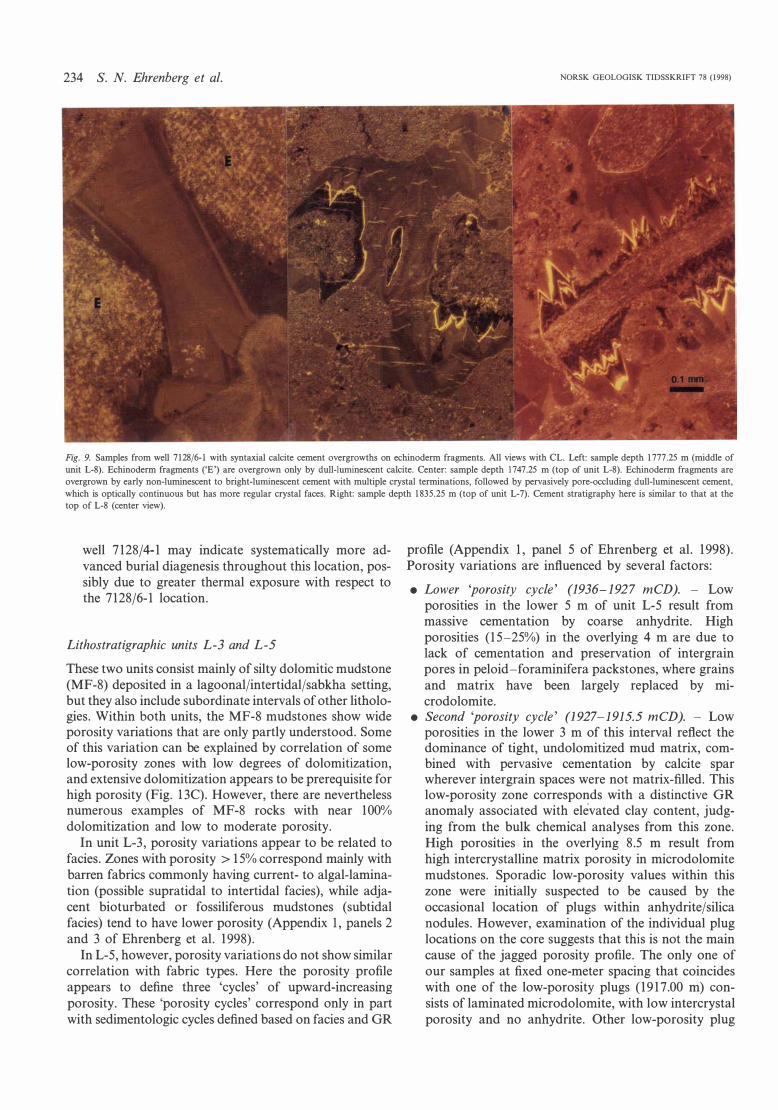
Fig. 9. Samples from well 7128/6-1 with syntaxial calcite cement overgrowths on echinoderm fragments. All views with CL. Left: sample depth 1777.25 m (middle of unit L-8). Echinoderm fragments ('E') are overgrown only by dull-luminescent calcite. Center: sample depth 1747.25 m (top of unit L-8). Echinoderm fragments are overgrown by early non-luminescent to bright-luminescent cement with multiple crystal terminations, followed by pervasively pore-occluding dull-luminescent cement, which is optically continuous but has more regular crystal faces. Right: sample depth 1835.25 m (top of unit L-7). Cement stratigraphy here is similar to that at the top of L-8 (center view).
well 7128/4-1 may indicate systematically more advanced burial diagenesis throughout this location, possibly due to greater thermal exposure with respect to the 7128/6-1 location.
Lithostratigraphic units L-3 and L-5
These two units consist mainly of sil ty dolomitic mudstone (MF-8) deposited in a lagoonaljintertidaljsabkha setting, but they also include subordinate intervals of other lithologies. Within both units, the MF-8 mudstones show wide porosity variations that are only partly understood. Some of this variation can be explained by correlation of some low-porosity zones with low degrees of dolomitization, and extensive dolomitization appears to be prerequisite for high porosity (Fig. 13C). However, there are nevertheless numerous examples of MF-8 rocks with near 100% dolomitization and low to moderate porosity.
In unit L-3, porosity variations appear to be re1ated to facies. Zones with porosity > 15% correspond mainly with barren fabrics commonly having current- to algal-lamination (possible supratidal to intertidal facies), while adjacent bioturbated or fossiliferous mudstones (subtidal facies) tend to have lower porosity (Appendix l, panels 2 and 3 of Ehrenberg et al. 1998).
In L-5, however, porosity variations do not show similar correlation with fabric types. Here the porosity profile appears to define three 'cycles' of upward-increasing porosity. These 'porosity cycles' correspond only in part with sedimentologic cycles defined based on facies and GR
pro file (Appendix l, panel 5 of Ehrenberg et al. 1998). Porosity variations are infl.uenced by several factors:
• Lower 'porosity cycle' (1936-1927 mCD). - Low porosities in the lower 5 m of unit L-5 result from massive cementation by coarse anhydrite. High porosities (15-25%) in the overlying 4 m are due to Jack of cementation and preservation of intergrain pores in peloid-foraminifera packstones, where grains and matrix have been largely replaced by microdolomite.
• Second 'porosity cycle' (1927-1915.5 mCD). - Low porosities in the lower 3 m of this interval refl.ect the dominance of tight, undolomitized mud matrix, combined with pervasive cementation by calcite spar wherever intergrain spaces were not matrix-filled. This low-porosity zone corresponds with a distinctive GR anomaly associated with elevated clay content, judging from the bulk chemical analyses from this zone. High porosities in the overlying 8.5 m result from high intercrystalline matrix porosity in microdolomite mudstones. Sporadic low-porosity values within this zone were initially suspected to be caused by the occasional location of plugs within anhydritejsilica nodules. However, examination of the individual plug locations on the core suggests that this is not the main cause of the jagged porosity profile. The only one of our samples at fixed one-meter spacing that coincides with one of the low-porosity plugs (1917.00 m) consists of laminated microdolomite, with low intercrystal porosity and no anhydrite. Other low-porosity plug

NORSK GEOLOGISK TIDSSKRIFT 78 (1998) Diagenesis, Finnmark carbonate platform, N. Norway 235
Fig. JO. Sample depth 2009.85 m from well 7128/6-1 (from an extensively dolomitized buildup in the lower part of unit L-4). Photomicrographs of the same area (part of the mold of a phylloid algal plate) in plane light (left), CL (center), and blue-light fluorescence (right). The mud matrix ('M') surrounding the mold is replaced by anhedral, inclusion-rich microdolomite, with bright CL and moderate to bright fluorescence. Pores were then infilled by brightly luminescent, non-fluorescent, fine rhombic dolomite (' F') . The final stage is coarse rhombic dolomite ('C') having oscillatory zoned dull to bright CL and no fluorescence, whlch formed conformable overgrowths on the fine rhombic cement.
locations also appear to be mainly within thinly laminated mudstone and outside of anhydrite nodules, suggesting that the pattern of frequent, wide porosity variation refl.ects the thinly bedded character of these shallow-water deposits, with micro-cyclic alteration of zones with high and low porosity.
• Upper 'porosity cycle' (1915.5-1906mCD). - Here, the porosity pattern appears similar to the underlying 'cycle' just described. Again, the jagged profile of frequent porosity variation is mainly related to varying abundance of intercrystal matrix porosity, and there is a distinct trend of overall increasing porosity upwards. In this case, porosity continues to increase upwards in to the remarkably porous packstones comprising the base of unit L-6.
Lithostratigraphic unit L-4
This 82-m interval consists mainly of Palaeoaplysina buildups alternating with fusulinid wackestones. Unit L-4 is divisible into 5 intervals (4-19 m thick) of blocky, low GR activity separated by 4 thinner intervals (1-5 m) of high GR activity (Appendix l of Ehrenberg et al. 1998).
High-GR intervals are interpreted as transgressive deposits, but also contain shallow-water facies (thin sandstone and laminated mudstone beds) marking intermittent falls in relative sea leve! and possible subaerial exposure. The high-GR intervals have low porosity (mostly < 10%), refl.ecting tight micritic matrix that has not been significantly dolomitized. These intervals are of interest as potential seals for lateral (stratigraphic) trapping of hydro-
carbons, because of their low porosity and pro bable lateral continuity. Transgressive-systems-tract deposits in shallow-shelf carbonates are generally viewed as barriers to fluid fl.ow and potential sealing facies (see, for example, Kerans et al. 1994; Tinker 1996).
Low-GR intervals are interpreted as highstand deposits of pro bable 4th-order transgressive-regressive sequences, within which cyclic alternation of buildup and interbuildup facies refl.ects yet higher-order sea-leve! fl.uctuations and/or autocyclic sedimentation. Porosity in both buildups and interbuildup wackestones varies widely (Fig. 14), and boundaries between zones of higher and lower porosity commonly have no apparent relationship to boundaries between facies types. For example, high-porosity zones in the intervals 1940-1945; 1962-1974; 2000-2005 mCD include both buildups and surrounding inter-buildup beds (Appendix l, panels 3 and 4 of Ehrenberg et al. 1998). Porosity also shows no correlation with dolomitization in the buildups (Fig. 13A), although partial to complete dolomitization appears favourable'for porosity in the MF-5 wackestones (Fig. 13C).
In order to investigate the causes of porosity variation within the buildups, petrographic comparisons have been made between samples with contrasting high vs. low porosity:
• In the calcite-rich buildups, Palaeoaplysina plates are commonly preferentially dolomitized, while the matrix is mainly calcite (Fig. 11). In high-porosity samples, coarse calcite spar tends to be scarce or only modestly developed. Where present, fusulinids tend to have internal pores that are uncemented except for a thin

236 S. N. Ehrenberg et al. NORSK GEOLOGISK TIDSSKRIFT 78 (1998)
Fig. 11. Sample depth 1 972.00 m from well 7128/6-1 (from an incipiently dolomitized buildup near the middle of unit L-4). Photomicrographs of the same area in plane light (left), CL (center), and blue-light fluorescence (right). Interior of a Palaeoaplysina mold, showing macroporosity (blue epoxy), canals ('C') filled with micropeloidal mud matrix, and three distinct cement generations. Following plate dissolution, mold walls were coated by early prismatic calcite microspar (fine crystals lining surfaces of canals). Plate mold (area around canals) was then partly infilled by fine rhombic dolomite crystals ('F'), which were subsequently enclosed by syntaxial calcite overgrowth on echinoderm fragment ('E').
lining of prismatic to fine calcite spar. In con trast, the low-porosity samples tend to show extensive infilling of Palaeoaplysina plates and other fossil cavities by coarse calcite spar (Fig. 8).
• For the dolomite-rich buildups, high-porosity samples tend to have abundant visible porosity in the form of both molds and intercrystalline matrix porosity (Fig. l 0). Most of the low-porosity samples seem to have lost porosity mainly by plugging of molds and intercrystalline pores by anhydrite, but in some cases porosity was lost mainly by development of a tightly intergrown fabric of rhombic dolomite.
Thus high porosity is associated with abundant open moldic pares, whether the buildups are dolomitized or not. Low porosity most commonly reflects infilling of these molds by calcite spar in the calcite-rich buildups, or by anhydrite in the dolomite-rich buildups.
Lithostratigraphic units L-6 and L-7
These units are considered together because of similarities in lithology and diagenesis. They include a broad range of lithologies, but foraminifera grainstonefpackstone (MF-7) is the dominant component in both units. These units were cored in both of the wells studied. In well 7128/4-1, the core begins approximately 6 m below the to p of unit L-7, and ends approximately 5 m a bo ve the base of L-6, while in well 7128/6-1 there is 100% core coverage of both units. The units are of similar thickness in both locations, but are distinctly less porous in well 7128/4-1 (Fig. 1). Thus comparison of these cores is
relevant to understanding lateral porosity variations in the Asselian carbonate interval.
Units L-6 and L-7 are largely undolomitized, except for:
• Moderate to minor dolomitization throughout the lower portions of both units in well 7128/6-1;
• Extensive early dolomitization in and around two mudstone beds in the lower part of L-6 in well 7128/4-1;
• Late saddle dolomite in parts of L-6 and L-7 in well 7128/4-1. (In contrast, no saddle dolomite is observed in units L-6 and L-7 in well 7128/6-1.)
Petrographic comparisons were made between MF-7 samples with contrasting high vs. low porosity in unit L-6. This microfacies was selected because it has the widest porosity variation and the most samples. In the two wells combined, there are 13 MF-7 samples with porosity >20% and 20 MF-7 samples with porosity < 5% (Fig. 15). Most of the high-porosity samples (n =
11) are from well 7128/6-1, while most of the low-porosity samples (n = 13) are from well 7128/4-1. The high-porosity samples are characterized by abundant intergrain and intrafossil porosity (Figs. 5, 6). Many of the MF-7 samples from the 'porosity maximum' zone in well 7128/6-1 (1882-1906 mCD) are packstones having a highly porous matrix of calcite microspar with subordinate microdolomite. The low-porosity samples show extensive occlusion of the same pore types that characterize the high-porosity samples by fine to coarse calcite spar cement, and any matrix present is also tightly cemented

NORSK GEOLOGISK TIDSSKRIFT 78 (1998) Diagenesis, Finnmark carbonate platform, N. Norway 237
Fig. 12. Sample depth 1849.25 m from well 7128/4-1 (from a coral-rich buildup near the middle of unit L-6). Photomicrographs of cement-filled mold in plane light {left) and CL (center/right). Oscillatory CL zoning in late coarse calcite spar ('C') is truncated by later saddle dolomite, whose outer crystal faces appear cut by coarse, non-luminescent anhydrite cement ('A'). The saddle dolomite in this sample is unique in showing a late stage of oscillatory CL zoning. Saddle dolomite in most samples displays only the inner zone of uniform dull CL ('D').
(Fig. 7). Thus the wide porosity variation in units L-6 and L-7 appears to be mainly a function of the degree to which primary porosity has been infilled by calcite cement. One can also point to additional factors involved in development of the higher-porosity zones, such as the removal of aragonitic skeletal material by early leaching, the near absence of early marine fibrous cements, and the lack of anhydrite plugging, but these are factors that are common to the low-porosity zones as well.
An additional difference of possible significance is the presence of minor to modest amounts of dolomite in many of the high-porosity MF-7 samples, but not in the lowporosity group (Fig. 16). However, it is uncertain whether this dolomite should be regarded as having an 'active' or 'passive' role with regard to porosity occurrence. According to the active interpretation, the dolomite may be regarded as having formed in association with matrix dissolution, and may have tended to stabilize the framework against compactional porosity loss. According to the passive interpretation, the dolomite is viewed as an intermediate- to late-burial cement whose preferential introduction into porous strata simply refl.ects access of dolomitizing fl.uids in proportion to permeability. Present data are insufficient to test these alternative hypotheses.
Vertical porosity variation. - The porosity profile of the L-6/L-7 interval is similar in the two wells (Fig. l), in that the lower part of the interval contains numerous highporosity zones (Figs. 5, 6), white the upper part has only low to moderate porosity (Fig. 7). The point above which high porosities (> 15%) become rare is very distinct (1877 mCD in well 7128/6-1 and 1845 mCD in well 7128/4-1).
This may represent a correlative stratigraphic horizon (a buildup bed that is 3.2 m thick in well 7128/6-1 and 1.4 m thick in well 7128/4-1), above which there was a change in depositional or early diagenetic conditions significant for porosity development. Again, comparison of high- vs. low-porosity samples shows that the main reason for the difference in porosity is calcite spar abundance.
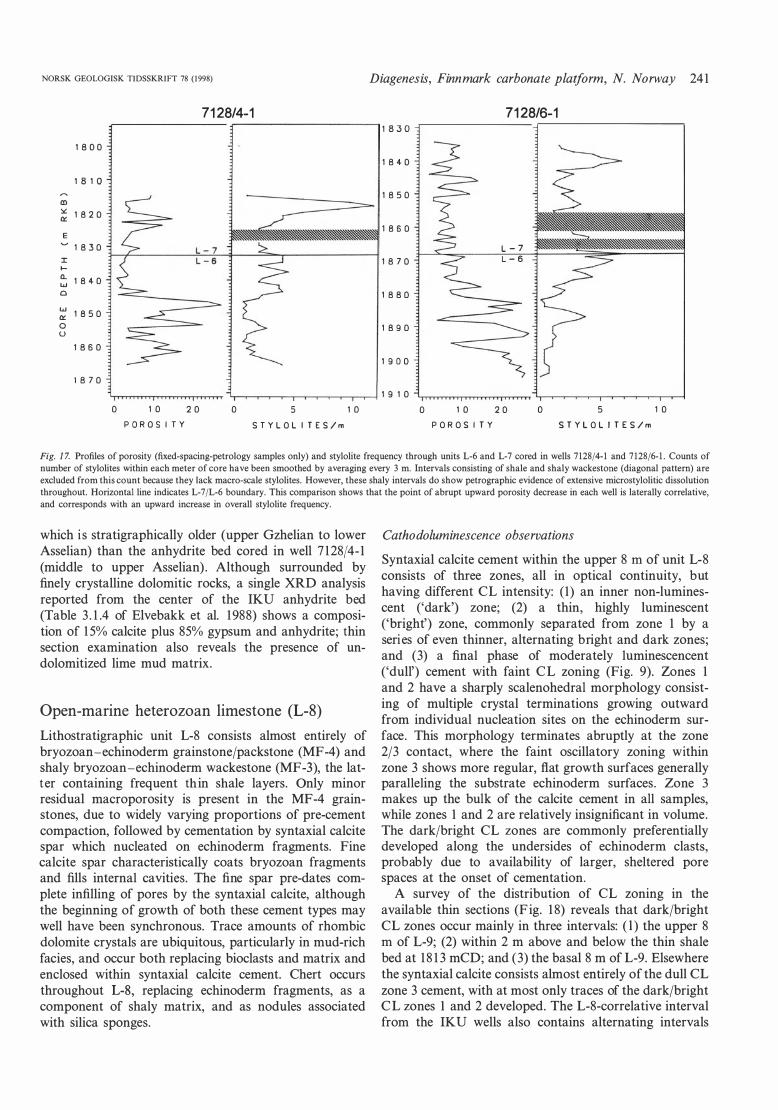
The reason for the distinct overall difference in calcite spar abundance above and below this horizon is suspected to be related to stylolite development, envisioned to be the main source for the coarse calcite spar in these rocks. Correlation between stylolite occurrence and cementational porosity loss in limestones is well documented (Dunnington 1967; Harms & Choquette 1965; Purser 1984). A meter-by-meter count of the number of easily visible stylolites on the core surface in units L-6 and L-7 indicates overall greater frequency within the upper (lower porosity) interval in each well (Fig. 17). This interval also includes a num ber of carbonate-rich shale to shaly wackestone beds that were susceptible to extensive clay-assisted chemical dissolution of calcite during burial. Another factor possibly contributing to lower porosity in the upper part of unit L-6 is lesser subaerial exposure at cycle tops, due to overall greater accommodation than in the lower part of L-6. Evidence for such a difference in accommodation is seen in the greater frequency of min or GR peaks (Fig. l) and stylolites (Fig. 17) in the upper part of L-6.
Lateral porosity variation. - The trend of upward-increasing porosity through the Gzhelian/ Asselian interval in well 7128/6-1, culminating in a maximum-porosity zone in the lower part of unit L-6 (Fig. 1), implies an overall deposi-

238 S. N. Ehrenberg et al.
100
-Q) -·E 8o o o '"C + .æ 60 "u ro u -
-.æ 40 "u ro u
o
� 20
o 100
-Q) -E 80 o o
'"C + .æ 60 "u ro u -
-Q) -
·u ro u
o o �
40
20
o
..• .._
•
• •
•
•
•
• • l •
., .•.
•
• •
•
•
.... .
•
•
•
• •
•
... . . ..
•
•
•
• •
•
•
•
•• • •
•
•
•
•
•• • • l
•• • • •
•
•
o D
o •
•
D
o
o
• •
• •
D D
10 20 Porosity (%)
NORSK GEOLOGISK TIDSSKRIFT 78 (I998)
A �,. . ...,. ..... ,
• • • •
�� 'B � • • •
MF-6
l l
c MF-5 = •
MF-8=0
o
l
30 o
•
•
.. ,
• •
•
•
•
• •
•
•
•
•
•
•
• •
l
• •
•
•
• •
• •
•
•
• l •
•
•
• l • •
•
10 20 Porosity (%)
• • • MF-7
•
•
•
D MF-11
30
Fig. 13. Dolomitization vs. porosity. Dolomitization index (100 x calcitef(calcite + dolomite), from bulk XRD analysis) vs. helium porosity in five microfacies categories. A) MF-6 (buildups): Porosity is uncorrelated with degree of dolomitization, except that very low porosities ( < 5%) occur only in nearly non-dolomitized rocks, which are massively cemented by late calcite spar. Note that most buildup samples are either very little dolomitized or extensively dolomitized. B) MF-7 (foraminifera grainfpackstones): These grain-rich rocks are mostly little dolomitized, and show no overall correlation between porosity and degree of dolomitization. (However, see also Fig. 16, which includes only MF-7 samples from units L-6 and L-7.) C) MF-5 (fusulinid wackestones) and MF-8 (dolomitic mudstones): These mud-rich rocks tend to have low porosity where the mud matrix has not been extensively dolomitized. D) MF-Il (sandstones): Porosity increases with dolomitization.

NORSK GEOLOGISK TIDSSKRIFT 78 (1998) Diagenesis, Finnmark carbonate platform, N. Norway 239
tional control on porosity related to the inferred 2nd-order accommodation minimum near the top of unit L-5. The lesser development of this porosity trend in 7128/4-1 could therefore result from a systematic difference in porosity-favourable depositional conditions, in particular the inferred deeper-water depositional setting of the 7128/ 4-1 location. For example, the laterally equivalent strata here may have been less affected by meteoric leaching and compaction-inhibiting, exposure-related cementation (as described, for example, by Dravis 1996) due to more continuous subaqueous sedimentation.
As noted above in connection with Fig. 3, a possible additional factor is greater 'thermal exposure' in well 7128/4-1, as suggested by the occurrence of distinctly lower porosity in well 7128/4-1 in both Gzhelian/Asselian carbonates and the Visean sandstone unit. This explanation is supported by recently-acquired fluid inclusion and apatite fission track data, and is not necessarily inconsistent with the similarity of the VR trends in the two wells (Fig. 3), insofar as VR level may reflect mainly maximum temperature rather than time-temperature integral (Quigley & Mackenzie 1996).
Dolomitization
The present study does not include geochemical, isotopic, or fluid-inclusion characterization of the various petrographically-defined dolomite types, so interpretations regarding dolomite origin are necessarily preliminary and based partly on ana1ogy with correlative strata, where such data are available (Elvebakk et al . 1990; Stemmerik & Larssen 1993). Dolomite is present throughout the
SO l--�u.--uu�n-it•L•4L,_C
�C
�D-<�
50� l l (N = 21
11 .111 n/g = . 33)
50 1
unit L4, CCD>50 l 11 (N = 23
. 111 1 n/g = .43)
50 l __ .. L_ ___ "�o•t-L4 __
. _c_c_o_<_so_ (N = 3 n/g = .33) •• •
5 o o 1 0 20 30 Porosity
Fig. 14. Porosity frequency distributions for MF-6 (buildups}, grouped by: ( l ) stratigraphic unit, and (2) dolomitization index (CCD) = l 00 x calcite/( calcite + dolomite ). The upper two histograms include buildups from unit L-4, where there are roughly equal numbers of dolornite-rich and dolomite-poor buildups. In L-4, there is no correlation between dolornitization and porosity. The lower two histograms include buildups from units other than L-4, where most buildups are undolornitized. Many of these undolornitized buildups are heavily cemented by late calcite spar, giving porosities much lower that most buildups from unit L-4. N = number of samples in each category; n/g = net/gross (number of samples with porosity > 15% divided by N).
Upper Paleozoic section, but occurs as a volumetricallydominant reservoir component only in units L-l , L-3, L-4, and L-5. Different styles and fabrics of dolomitization are present in different parts of the section.
In unit L-1, dolomitization is associated mainly with sandstones (thin, progradational shoreline deposits). Intermittent restriction during or immediately following sand deposition led to sulfate precipitation and evaporative and/or reflux dolomitization (Moore 1989, Chapter 5). This apparently stabilized the sand against mechanical compaction, preserving porosity relative to the interlayered limestone zones, where calcareous sandstones underwent extreme compaction aided by microstylolitic dissolution.
In dolomitic mudstones (MF-8) in units L-3 and L-5, and fusulinid wackestones (MF-5) in unit L-4, dolomite is finely crystalline, is associated with syndepositional anhydrite nodules, and replaces the carbonate mud matrix of rocks with barren to low-diversity biota. This microdolomite is interpreted to have formed early (probably less than a few meters' depth) by evaporative and/or reflux dolomitization. It is thus analogous with the 'replacement dolomite' described by Stemmerik & Larssen (1993) from the Asselian Kapp Duner Formation of Bjørnøya.
In Palaeoaplysina jphylloid algae buildups (MF-6) in unit L-4, dolomite occurs both as fine rhombic, moldfilling cement, and as matrix-replacive microdolomite in rocks with open-marine, variably diverse biota. Both buildups and interbuildup wackestones in unit L-4 show wide variation in degree of replacement by dolomite. The 22 individual buildup intervals within L-4 may be divided in to calcite-rich buildups (CCD mainly > 80) and dolomite-rich buildups (CCD mainly < 30). In other words, most buildups are either little dolomitized or extensively dolomitized (Fig. 13A). Dolomite-rich buildups (for example, Fig. lO) occur mainly near the base (2000-2017 mCD) and near the top (1936-1951 mCD) of L-4 (Appendix l , panels 3 and 4 of Ehrenberg et al. 1998). Within the intervening interval (1958-1995 mCD), the buildups are mostly calcite-rich (Figs. 8, 11, 12), but many of the inter-buildup sediments and the tops of some buildups are highly dolomitized. This latter pattern suggests a setting of shallow evaporative lagoons restricted between buildups that stood partly emergent during repeated episodes of minor lowstands and dolomite formation. This style of dolomite distribution resembles the situation described in Palaeoaplysina buildups of the Tyrrellfjellet Member of Spitzbergen (Skaug et al. 1982). The thoroughly dolomitized buildups near the base and top of L-4 are more comparable with the situation found in the Kapp Duner Formation of Bjørnøya (Lønøy 1988; Stemmerik & Larssen 1993). Both of these on-land occurrences are Gzhelian-Asselian in age, and thus approximately time-equivalent with unit L-4.
Although dolomite in the buildups typically shows increasing crystal size outward into pores, it is uncertain whether the fine rhombic dolomite represents a distinctly later cementation event than the finer-grained micro-

240 S. N. Ehrenberg et al.
10
5
o 10
5
o
well 7128/6-1 (N = 41 n/g = .37)
well 7128/4-1 (N = 24 n/g = .17)
10 20 30 Porosity
Fig. 15. Porosity frequency distributions comparing wells 7128/6-1 vs. 7128/4-1 in terms of MF-7 (foraminifera grainfpackstones) in units L-6 and L-7. N = number of samples in each category; n/g = netfgross (number of samples with porosity > 15% divided by N).
dolomite, as concluded by Stemmerik & Larssen (1 993) for the Kapp Duner Formation, or, altematively, was formed during the same early dolomitization process, with the morphological difference simply reflecting a pore-fil ting as opposed to replacive origin . According to the latter scenario, microdolomite may be envisioned as having formed by replacement at the same time as fine rhombic dolomite was growing on the partially dolomi-
Q) � E 90 o
o "C +
.æ ·u (ij 80 (.) ........
-Q) -
·o (ij (.) 70
o o T""
60 o
o o
o •
• o • o
• •
o o o
• = 7128/4-1 o= 7128/6-1
5
•
•
10 15 20 Porosity (%)
o.
o o
o
o
25 30
Fig. 16. Dolomitization index (100 x calcitef(calcite + dolomite), from bulk XRD analysis) vs. helium porosity in MF-7 (foraminifera grainfpackstones) from units L-6 and L-7. Plotting symbol indicates well. Samples with porosity < 10% tend to have little dolomite content, reflecting either: ( l ) an active role of dolomitization in porosity creationjpreservation, or (2) a passive relationship of preferential dolomitization along originally more porous and permeable beds.
NORSK GEOLOGISK TIDSSKR!Ff 78 (1998)
tized substrate . Microdolomite and much of the fine rhombic dolomite all have similar dull red-orange CL (Figs . 1 0, 1 1 ) .
Microdolomite typically has strong blue -light fluores cence, while fine rhombic dolomite is weakly fluorescent to non-fluorescent . This difference can also be interpreted either as the result of different timing or replacive vs . pore-filling growth.
An uncertainty needing further study is whether much of the replacive micro dolomite in buildup facies actually formed after associated fine rhombic dolomite cement. Partly dolomitized buildups typically contain rhombic dolomite cement infilling molds of algal plates, but have relatively undolomitized matrix (Fig. 1 1 ) . Extensively dolomitized buildups contain similar mold-filling rhombic dolomite, and also show extensive replacement of matrix and bioclasts by microdolomite (Fig. 1 0 ) . Assuming these two sample groups to represent a sequence of progressive dolomitization, the pore-filling fine rhombic dolomite would be earlier than the finer-grained replacive dolomite . This is the reverse of the sequence of progressively later timing with increasing crystal size that would be inferred based on the simplistic assumption that re placive dolomite must always predate associated, more coarsely crystalline dolomite cement .
Obviously, we have few constraints on the origin of dolomite in the buildups. It could all be formed during the same early, evaporative-driven process inferred for the microdolomite in MF-5 and MF-8 rocks, or it could well be a more complex product of multi-stage processes . It is reasonable to attribute the extensive dolomitization throughout the top 1 8 m of L-4 to downward flow of brines produced by the hypersaline environment repre sented by unit L-5 . Porosities in parts of this interval, and in the overlying lower 5 m of L-5 , are heavily occluded by coarse anhydrite cement possibly precipitated from these same brines . However, there are no apparent petrographic differences between the rocks at the top of L-4 and other extensively dolomitized buildups deeper in L- 4. Elongate dolomite, as has been interpreted to represent pseudomorphs after anhydrite in the Kapp Duner Formation, and in core from well 71 20/2- 1 (Lønøy 1 988; Stemmerik & Larssen 1 993), has not been observed in the present study .
As noted above in the section on 1ithostratigraphic units L-6 and L-7, dolomite in porous foraminifera/algae packstones and wackestones (MF -7) in the lower part of unit L-6 occurs as fine rhombs within highly micropo rous micritic matrix . It is uncertain whether these rhombs should be regarded as replacive of the matrix or as very fine pore-filling cement .
Surprisingly, there are no traces of dolomite associated with the 1 .3-m anhydrite bed at 1 839 mCD in unit L-6 of well 71 28/4-1 . The 1 0 cm of laminated mudstone capping the anhydrite and patches of mudstone within the anhydrite all consist entirely of calcite microspar. A simi1ar situation may exist within a 7 m-thick anhydrite bed cored in the shallow IKU wells (Bugge et al . 1 995 ),
NORSK GEOLOGISK TIDSSKRIFT 78 (1998)
7128/4-1
1800
181 o
m � 1 8 2 O �
Diagenesis, Finnmark carbonate platform, N. Norway 241
7128/6-1 1830
1840
1 8 5o
E � 1 8 6 O --� 18 3 O L-7
J: 1 8 7 O L-6 1-Q_ 1840 w o 1 8 8 O w 1 8 5O � o 1 8 9 O u
1860 1900
1 8 7 O 1 9 1 o
o 1 o 20 o 5 1 o o 1 o 20 o 5 1 o
POROSITY STYLOL l TES/m POROSITY STYLOLITES/m
Fig. 1 7. Profiles of porosity (fixed-spacing-petrology samples only) and stylolite frequency through units L-6 and L-7 cored in wells 7128/4-1 and 7128/6-1. Counts of number of stylolites within each meter of core have been smoothed by averaging every 3 m. Intervals consisting of shale and shaly wackestone (diagonal pattem) are excluded from this count because they Jack macro-scale stylolites. However, these shaly intervals do show petrographic evidence of extensive microstylolitic dissolution throughout. Horizontal line indicates L-7/L-6 boundary. This comparison shows that the point of abrupt upward porosity decrease in each well is laterally correlative, and corresponds with an upward increase in overall stylolite frequency.
which is stratigraphically older (upper Gzhelian to lower Asselian) than the anhydrite bed cored in well 71 28/4- 1 (middle to upper Asselian) . Although surrounded by finely crystalline dolomitic rocks, a single XRD analysis reported from the center of the IKU anhydrite bed (Table 3. 1 . 4 of Elvebakk et al. 1 988) shows a composi tion of 1 5 % calcite p lus 85 % gypsum and anhydrite ; thin section examination also reveals the presence of undolomitized lime mud matrix .
Open-marine heterozoan limestone (L-8)
Lithostratigraphic unit L-8 consists almost entirely of bryozoan-echinoderm grainstonejpackstone (MF-4) and shaly bryozoan-echinoderm wackestone (MF-3), the latter containing frequent thin shale layers. Only minor residual macroporosity is present in the MF- 4 grain stones, due to widely varying proportions of pre-cement compaction, followed by cementation by syntaxial calcite spar which nucleated on echinoderm fragments . Fine calcite spar characteristically coats bryozoan fragments and fills internal cavities . The fine spar pre-dates complete infilling of pores by the syntaxial calcite, although the beginning of growth of both these cement types may well have been synchronous. Trace amounts of rhombic dolomite crystals are ubiquitous, particularly in mud-rich facies, and occur both replacing bioclasts and matrix and enclosed within syntaxial calcite cement. Chert occurs throughout L-8, replacing echinoderm fragments, as a component of shaly matrix, and as nodules associated with silica sponges .
Cathodoluminescence observations
Syntaxial calcite cement within the upper 8 m of unit L- 8 consists of three zones, all in optical continuity, but having different CL intensity: (l) an inner non-lumines cent ('dark') zone ; (2 ) a thin, highly luminescent ('bright') zone, commonly separated from zone l by a series of even thinner, alternating bright and dark zones ; and (3) a final phase of moderately luminescencent ('dull') cement with faint CL zoning (Fig. 9). Zones l and 2 have a sharply scalenohedral morphology consist ing of multiple crystal terminations growing outward from individual nucleation sites on the echinoderm sur face . This morphology terminates abruptly at the zone 2/3 contact, where the faint oscillatory zoning within zone 3 shows more regular, flat growth surfaces generally paral le ling the substrate echinoderm surfaces . Zone 3 makes up the bulk of the calcite cement in all samples, whi le zones l and 2 are relatively insignificant in volume . The dark/bright CL zones are commonly preferentially developed along the undersides of echinoderm clasts, probably due to availability of larger, sheltered pore spaces at the onset of cementation .
A survey of the distribution of CL zoning in the available thin sections (Fig. 1 8) reveals that dark/bright CL zones occur mainly in three intervals: (l ) the upper 8 m of L-9; (2 ) within 2 m above and below the thin shale bed at 1 81 3 mCD; and (3) the basal 8 m of L-9. Elsewhere the syntaxial calcite consists alm ost entirely of the dull CL zone 3 cement, with at most only traces of the dark/bright CL zones l and 2 developed. The L-8-correlative interval from the IKU wells also contains alternating intervals

242 S. N. Ehrenberg et al.
with and without dark/bright CL zones init iating the syntaxial cement overgrowths (Fig . 1 8) .
Similar patterns o f dark/bright/dull CL zoning are characteristic of echinoderm-rich grainstones of many ages from both marine phreatic (Maliva 1 989) and mete oric phreatic environments (Meyers 1 978; Walkden & Berry 1 984; Dorobek 1 987; James & Bone 1 989) . Variations in CL intensity of calcite cements mainly reflect abundances of Fe and Mn (Hemming et al. 1 989) , which are controlled in large part by oxygen availability during cement growth . CL cement zone chemistry has not been investigated in the present study, but based on previous results on samples with similar zoning (Dorobek 1 987; Meyers 1 989) , it can be speculated that the early dark CL zone l resulted from growth in an oxygenated envi ronment , where Fe and Mn were relatively insoluble and thus unavailable for incorporation into the calcite ce ment . The following bright CL zone 2 probably formed
7128/6-1 1740
+ + !1750 +
:1760
1770
1780
; 1790
:1800
L830 i + � . . •1840
-''l -:-
-=
-
�lol.:-:.-
l 00 l ...J ;t: c: ::J o :c a. (U .... C>
:p
� e! -(/) o
.c: �
��l
W-� l
. CIS.wtlme WPGø
CL-zones 1&2: + Well developed + Poorly developed - Not present
+ t
+ +
+ + + • + • + •
IKU wells
150
160
30
40
50
60
70
80
90
m
��-·
c !O
·c !O E
� !O
Cl) l
c !O
:i: Ul c t 4:
CIS.vflmt WPGB
Uncertain due to low abundance of syntaxial cement
N o l ::l l o ..-a; N ..-.......
Fig. 18. Surveys of cathodoluminescence (CL) zoning in thin sections from unit L-8 in well 7128/6-1, and from two !KU wells with stratigraphicaUy equivalent cores. Presence ( +) or absence ( -) of CL zones I and 2 is indicated by symbols to the left of the depth scales. In both locations; CL zones l and 2 are present on! y within distinct stratigraphic intervals, implying probable control by variations in depositional conditions and potential lateral correlation of CL-defined horizons.
NORSK GEOLOGISK TIDSSKRIFT 78 (1998)
Table 3. Stable isotopic analyses of L-8 grainstones.
Depth (m)
Bulk -rock analyses:
Samples with dark/bright CL zones:
.513C (%o PDB)
1745.75 4.6 1747.25 4.8 1812.25 4.4 Samples without dark/bright CL zones: 1755.25 4.8 1777.25 1822.25
5.0 4.1
Laser probe analyses of syntaxial calcite cement zones:
1747.25: Dark/bright CL zones l & 2 5.4 Dark/bright CL zones l & 2 5.3 Dull CL zone 3 6.7 Dull CL zone 3 5.8 1812.25: Dark/bright CL zones l & 2 5.9 Dark/bright CL zones l & 2 4.9 Dull CL zone 3 5.4
.5'"0 (%o PDB)
-5.4 -5.8 -3.7
-5.8 -6.7 -4.6
-3.7 -4.5 -2.5 -4.6
-2.0 -2.5 -4.4
under slightly reducing conditions , where Mn and lesser amounts of Fe could be reduced to the soluble divalent state and thereby subst ituted into the calcite lattice . The dull CL zone 3 would then reflect the onset of more strongly reducing conditions associated with deeper burial, where both Fe and Mn were more soluble .
Carbon and oxygen isotopic analyses
Petrographic evidence is ambiguous regarding the question of whether the abrupt termination of limestone deposition at the top of L-8 was caused by subaerial exposure or is entirely the result of drowning. Thus the presence of the dist inctive dark/bright CL zoning at this horizon could have various interpretations . Furthermore , the mineralogy of L-8 skeletal constituents was mainly stable low-Mg calcite , which is little affected during even prolonged exposure (James & Bone 1 989) . Thus the absence of porosity enhancement at the top of L-8 is not necessarily inconsistent with the possibility of extended subaerial exposure prior to deposition of L-9.
In order to test for evidence of preferential meteoric water involvement near the top of unit L-8, and possible association of meteoric water with the occurrence of the dark/bright CL zones, a series of stable isotopic analyses was carried out . Two approaches were used . First , a set of six bulk-rock samples was analysed to compare two horizons with distinctly developed dark/bright CL cement zoning vs . underlying samples containing only the dull CL zone 3 spar. The latter samples were selected to be several meters distant from the nearest samples containing any dark/bright CL cement . The results (Table 3) show no systematic differences in either carbon or oxygen isotopic composition between the two sample sets .
Sec ondly , the laser probe technique was used to compare the compositions of the dark/bright CL zones with the later dull CL spar in one sample from each of two

NORSK GEOLOGISK TIDSSKRIFT 78 (1998)
horizons with distinctly developed dark/bright CL cement zoning . The areas to be analysed were photographed with both CL and reflected light illumination to ensure accurate location of the laser probe sampling points within spar cement having the desired CL intensity . The points analysed from the dark/bright CL zones included mainly zone l calcite , because zone 2 is too thin to be sampled without danger of also including material from the adjacent zone 3. The results (Table 3) show no significant difference in isotopic composition between the dark/bright CL zones and the later dull CL spar .
These results do not support the hypothesis that meteoric water was preferentially involved , either in cementation associated with the top contact of L-8, or in the localized formation of dark/bright CL zone cements. Three of the probe analyses (including two from the dark/bright CL zones) in fact have o xygen isotopic compositions dose to the inferred value for Permian seawater ( -2 . 5 %o; Given & Lohmann 1 986) . The other analyses all show moderate displacements to values more negative than -2 .5%o, which could be interpreted as evidence for freshwater influence . However, in view of the open-shelf deposit ional setting of the samples , and the Jack of independent evidence of subaerial exposure , it seems most reasonable to interpret this displacement as reflecting variable amounts of cementation by connate marine water at moderately elevated temperatures under burial . Carbon isotopic compositions show considerable variation, but are also not far removed from the inferred value for Permian seawater (near 5 %o; Scholle 1 995 ) . Both carbon and oxygen data are consistent with burial dissolution of biogenic calcite along stylolites , and precipitation as syntaxial cement in a rock-dominated system .
Based on the stable isotopic analyses , it is concluded that the pattern of local ized occurrence of dark/bright CL zones only within certain horizons is not re lated to meteoric water influx, but probably reflects variations in early marine phreatic condit ions. Possibly the main controlling factor is the duration of sediment residence in the oxygenated environment within the upper several meters below the sea floor. Rapid sedimentation and burial of the sediment would tend to favour development of low-Eh conditions befare significant cementation , and consequent development only of dull CL cement . Extended res idence near the sea floor, such as occurred at the top surface of unit L-8, and probably also associated with the shale zone (inferred MFS) at 1 81 3 mCD, would tend to favour initial cement growth under the high-Eh conditions interpreted for the dark/bright CL zones .
Timing of porosity loss in L-8 grainstones
The most important question regarding the diagenes is of unit L- 8 is the timing of cementational porosity loss with respect to the burial history . In many samples , most porosity was lost by early (pre-cement) compaction , but
Diagenesis, Finnmark carbonate platform, N. Norway 243
interspersed with these compacted samples are more numerous samples where porosity loss was mainly due to syntaxial calcite cementation. Byrozoan-echinoderm grainstones are known to form highly porous reservoirs elsewhere (Jobe & Saller 1 995 ; James & Bone 1 989; Loucks & Bebout 1 984) , so it is unlikely that th is lithology is necessarily prone to cementational porosity loss early in its burial history . This is also supported by the presence of a 5 m interval of MF- 4 lithology with moderately porosity (mostly 1 0-1 5 %) in un it L- 7 of well 71 28/4- 1 (1 81 9. 5 -1 825 . 0 mCD) . Apart from cement abundance , the main difference between this interval and the overlying low-porosity L-8 grainstones (cored in well 71 28/6- 1 ) is the frequency of stylolites visible on the co red surface ; average 2 . 6/m in the MF-4 interval of L- 7 vs . 1 1 /m in the MF- 4 portion of L-8 (5 9 m; excluding 31 m of the L-8 core dominated by MF-3 wackestone) . In the MF-3 wackestones, thin-section observations show that stylolit ic dissolution is also extensive , but is dispersed throughout the rock, rather than concentrated along discrete surfaces as in the MF- 4 intervals .
Based on the above observations , the hypothesis is proposed that cementation and porosity loss in unit L-8 occurred synchronously with development of stylolites . Porosity in byrozoan-echinoderm grainstone/packstone intervals should therefore be inversely proportional to frequency and magnitude of stylolite occurrence . Stylol itic dissolution is believed to be localized by contact with clay and mica surfaces and proceeds as a function of increasing temperature . Carbonate porosity in general decreases with increasing thermal maturity (Schmocker 1 984) , and it is reasonable to expect stylolitic dissolution and resulting calcite cementation and porosity loss to follow a similar correlation in Barents Sea strata. The timing of porosity loss in unit L-8 can potentially be constrained by looking for a regional Barents Sea correlat ion between porosity and vitrinite-reflectance (VR) level in L- 8-equivalent lithologies. In the IKU cores , VR level is somewhat lower (0.37-0. 45 in wells 7129/1 0-U-02 and 71 28/1 2-U-01 ; Elvebakk et al . 1 988; Bugge et al . 1 989) than in the exploration wells (0. 5 ; Fig . 3) , but po rosity in t he L-8-equivalent Artinskian -Sakmarian IKU unit is just as low as in the exploration wells (2 -7%; average of 1 6 plugs = 5. 0%) . This indicates that porosity loss in unit L-8 occurred befare maximum burial depth was attained.
Deepjcold-water shale, limestone, and spiculite (L-9)
Lithostratigraphic unit L-9 comprises two depositional cycles of upward-decreasing GR activity , reflecting decreasing siliciclastic content following events of sea-leve ! rise and condensed sedimentation which in itiated each cycle . The lower cycle is composed of calcareous shale (MF- lB) and calcareous , very fine-grained spiculite (MF-
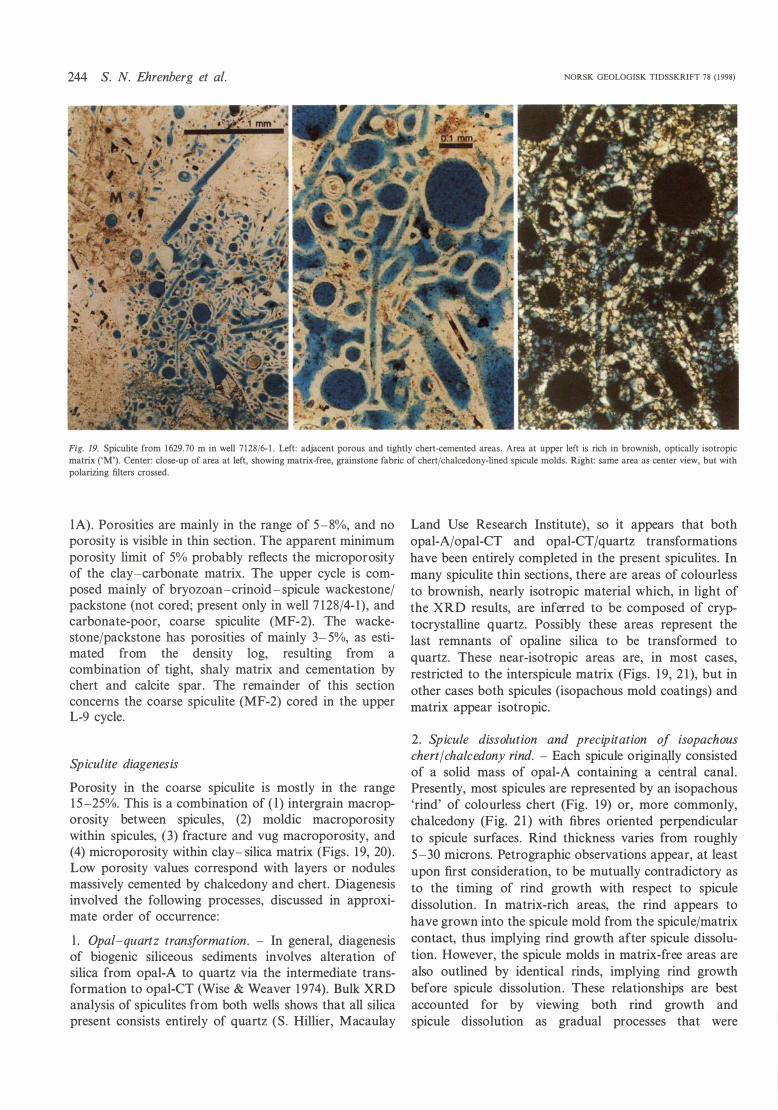
244 S. N. Ehrenberg et al. NORSK GEOLOGISK TIDSSKRIFT 78 (1998)
Fig. 19. Spiculite from 1629.70 m in well 7128/6-1. Left: adjacent porous and tightly chert-cemented areas. Area at upper left is rich in brownish, optically isotropic matrix ('M'). Center: close-up of area at left, showing matrix-free, grainstone fabric of chert/chalcedony-lined spicule molds. Right: same area as center view, but with polarizing filters crossed.
lA) . Po rosities are mainly in the range of 5 -8%, and no po rosity is visible in thin section . The apparent minimum po rosity limit of 5 % probably reflects the microporosity of the clay-carbonate matrix . The upper cycle is composed mainly of bryozoan-crinoid-spicule wackestone/ packstone (not cored ; present only in well 712 8/4- 1 ) , and carbonate-poor, coarse spiculite (MF-2). The wackestone/packstone has porosities of mainl y 3-5 %, as estimated from the density log, resulting from a combination of tight, shaly matrix and cementation by chert and calcite spar. The remainder of this section concems the coarse spiculite (MF-2 ) cored in the upper L-9 cycle .
Spiculite diagenesis
Po rosity in the coarse spiculite is mostly in the range 1 5 -25 %. This is a combination of (l ) intergrain macroporosity between spicules , (2 ) moldic macroporosity within spicules, (3) fracture and vug macroporosity, and (4) micropo rosity within clay-silica matrix (Figs . 1 9, 20) . Low po rosity values correspond with layers or nodules massively cemented by chalcedony and chert . Diagenesis involved the following processes, discussed in approximate order of occurrence :
l. Opal-quartz transformation. - In general, diagenesis of biogenic siliceous sediments involves alteration of silica from opal-A to quartz via the intermediate transformation to opal-CT (Wise & Weaver 1 974) . Bulk XRD analysis of spiculites from both wells shows that all silica present consists entirel y of quartz (S. Hillier, Macaulay
Land Use Research Institute) , so it appears that both opal- A/opal-CT and opal -CT/quartz transfo rmations have been entirely completed in the present spiculites . In many spiculite thin sections, there are areas of colourless to brownish, nearly isotropic material which, in light of the XRD results, are inferred to be composed of cryptocrystalline quartz . Possibly these areas represent the last remnants of opaline silica to be transformed to quartz . These near-isotropic areas are, in most cases, restricted to the interspicule matrix (Figs . 1 9, 2 1 ), but in other cases both spicules (isopachous mold coatings ) and matrix appear isotropic .
2 . Spicule dissolution and precipitation of isopachous chert/chalcedony rind. - Each spicule o rigin�lly consisted of a solid mass of opal- A containing a central canal . Presently, most sp icules are represented by an isopachous 'rind' of colourless chert (Fig . 1 9) or, mo re commonly, chalcedony (Fig. 21) with fibres o riented perpendicular to spicule surfaces . Rind thickness varies from roughly 5 -30 microns. Petrographic observations appear, at least upon first consideration, to be mutually contradictory as to the timing of rind growth with respect to spicule dissolution . In matrix-rich areas, the rind appears to have grown into the spicule mold from the spicule/matrix contact, thus impl ying rind growth after spicule dissolution . However, the spicule molds in matrix-free areas are also outlined by identical rinds, impl ying rind growth before spicule dissolution . These relationships are best accounted fo r by viewing both rind growth and spicule dissolution as gradual processes that were

NORSK GEOLOGISK TIDSSKRIFT 78 (1998) Diagenesis, Finnmark carbonate platform, N. Norway 245
Fig. 20. Spiculite from 1574.25 m in well 7128/4-1. Left: low-magnification view showing three fabric types: (l) coarse spiculite containing moldic macroporosity in rnicroporous clay matrix (top and central area); (2) silty shale lens (brown area, lower right); and (3) very fine-grained, little cemented spiculite ('X') surrounding shale lens. Center: doser view of coarse spiculite with packstone fabric. Right: close-up of center view, showing spicule mold infilled with chalcedony, and finally macroquartz ('Q').
mutually dependent and therefore synchronous . In matrix-free areas , rind growth on outer surfaces of still undissolved spicules would have begun synchronously with the first increment of s ilica dissolution. However, in areas where outward growth was blocked by the presence of matrix, rind growth would have been delayed until space was provided by removal of the spicule . It is unknown whether the rind init ially formed as chalcedony, or was opai-CT that later transformed to chalcedony and chert .
3. Post-rind chalcedony and chert cementation. - Following spicule dissolution , some spicule molds were infilled by a generation of non-isopachous cha)cedony consisting of arrays of fibres radiat ing from one or several points on the inner surface of the isopachous rind . As seen in transmitted light in thin section , colour varies from colourless to varying shades of brown . A pore-filling origin is indicated by the observation that a small proportion of the chalcedony-filled molds in well 7128/6- 1 have geopetal fabric , indicat ing gravity-controlled filling from the bottom upwards (Fig. 2 1 ) . The lower part of the mold is filled by non-fluorescent , colourless chalcedony similar to the outer rind, with fibres oriented parallel to the fibres in the enclosing isopachous rind . The top of the sp icule mold is filled by fluorescent , brown chalcedony, having a flat , geopetal contact with the underlying colourless chalcedony. Fibres in the brown chalcedony have radiating orientation, commonly at a high angle to the fibre orientations in the underly ing chalcedony and the enclos ing rind. Geopetal chalcedony
fillings are present in the top six and lower two meters of the 71 28/6- 1 core , but have not been seen in the 712 8/4- 1 samples . These features are reminiscent of the geopetal fabrics common in concentrically- infilled agates (see, for example , Fall ick et al . 1 985 ) . It is uncertain whether or not this fabric indicates a vadose environment and thus is evidence for subaerial exposure of the spiculite . Spicule d issolution is assumed to have coincided with diffus ional transport and precipitation of s il ica at nearby s ites within the sediment volume . This resulted in d ifferent iat ion of the sp icul ite into porous regions and adjacent , commonly nodular-appearing masses t ightly cemented by chalcedony, chert , and macroquartz . Proximity of clay may have tended locally to inh ibit s il ica precip itation , as suggested by the common pres ence of a th in (1 -2 mm) zone of poorly-cemented, porous spiculite , having very thin chalcedony rind development along contacts between shale lenses and surrounding , relatively well-cemented spicul ite (Fig. 20, left view) .
4. Mechanical compaction and fracturing. Compaction is indicated by common breakage and collapse of individual spicules , and by so ft-sediment deformation of shaly lenses between res istant spiculite masses . Early compaction is also expressed by fractures in calcite shell fragments that were subsequently coated by isopachous chalcedony similar to the rinds outlining spicules . Presumably early compaction coincided with, and was eventually arrested by , s ilica cementation . Fractures are common throughout the coarse

246 S. N. Ehrenberg et al. NORSK GEOLOGISK TIDSSKRIFT 78 (1998)
Fig. 21. Geopetal chalcedony filling spicule molds in spiculite from 1633.25 m in well 7128/6-1. Same area viewed in plane light (left); with polarizing filters crossed (center); and with incident blue-light ftuorescence (right; slightly lower magnification). UP direction is toward top of page. Turbid, optically isotropic, brightly ftuorescent matrix fills volumes between spicules. Spicule walls are lined by isopachous rind of colourless, non-fluorescent chalcedony, which also fills lower parts of some spicule molds ('A'). Later brownish, fluorescent chalcedony ('B') fills remaining mold volumes.
spiculite cores in both wells . Some fractures terminate against sedimentologic discontinuities , and therefore appear to be an early compactional effect . Other fractures may be late , but evidence as to timing is commonly inconclusive . In the 71 2 8/4-1 spiculite , fracturing is asso ciated with development of extensive micro-breccia zones , especially affecting porous , poorly cemented spiculite adjacent to heavily cemented spiculite vo lumes . Some fractures are open and uncemented, while others are partly or completely infilled by cements . Observations of various fractures are consistent with the overall cement infil l sequence : chalcedony , macroquartz , saddle do lomite, coarse calcite (Fig. 22 ) .
5 . Dolomite cementation. Iron-rich do lomite (?ankerite ) is present as euhedral rhombs within shale lenses, and saddle dolomite occurs as euhedral rhombs within spiculite and along fractures . It is unknown whether the (non-saddle) dolomite in shale lenses was contemporaneous with saddle dolomite in the enclosing spiculite . Saddle dolomite is locally enclosed by, and thus predates, calcite spar. In the upper part of the 71 28/4- 1 spiculite core , saddle dolomite commonly fills spicule molds and appears to pre-date macroquartz, which is abundant in surrounding dolomite free mo lds, but not in the dolomite- filled molds .
6. Stylo litic dissolution and macroquartz cementation. Stylo li tic contacts are present along clay-rich surfaces , including both shale laminations and shaly matrix within microbreccia lenses . Stylo litization may be a main source
for si lica precipitated as macroquartz (crystals Iarger than roughly 30 ,um) Iining mo lds, intergrain pores , and fractures . 7. Calcite cementation. Coarse calcite cement is common throughout the cored intervals , but with widely varying abundance in different samples . It infills molds, intergrain pores , and fractures . This appears to be the Iatest diage netic process, because the calcite is undeformed and locally infills molds and fractures previously lined by macroquartz . Thin-section staining shows that much of the calcite spar is low in iron content, but it typically has a Fe-rich outer zone (Fig . 22 ) .
Factors controlling spiculite porosity
Qualitative thin-section and core e xamination indicates that the ratio of chertjchalcedony (and also macro quartzjchert) increases from top to base in both cored intervals and also appears to be corre lated with decreas ing porosi ty. In both wells , concretion-like bodies or layers , mostly 5 -2 0 cm thick , massively cem ented by chalcedony and chert , are more abundant near the base of the cored intervals. These l ayers have sharp contacts wi th surro unding porous spiculi te having apparently similar primary depositional fabric . Massive si lica cementation is inferred to b ecome abundant j ust below the cored intervals in both wells , accounting for the decrease in the density-log porosity profile (Fig. 1 ) , and for the dri lling difficulties that resulted in suspension of coring in both instances . At present , it is unclear what factors control led this localized massive silica cementation . This is

NORSK GEOLOGISK TIDSSKRIIT 78 (1998) Diagenesis, Finnmark carbonate p/atform, N. Norway 241
Fig. 22. Late vein minerals in three different samples of spiculite. Left: 1641.75 m, well 7128/6-1. Macroquartz veins with rninor macroporosity (blue epoxy) remaining open. Center: 1640.25 m, well 7128/6-1. Veins lined with macroquartz and infilled by coarse, unifonnly Fe-rich calcite (stained blue). Right: 1576.21 m, well 7128/4-1. Vugs and fractures are infi.lled by coarse Fe-poor calcite ('C') that terminates in Fe-rich rims (stained purple).
directly relevant to understanding reservoir and lateral sea! development and is thus an important topic for further study . Lack of spicule compaction within the cemented volumes , combined with fracture development and microbrecciation in surrounding porous spiculite , indicates that porosity differentiation was an early process , pro bably occurring within the upper kilometer of burial . Ultraviolet light core photographs show saturation of brightly fl.uorescent oil within the porous spiculite , and absence of oil in adjacent massively cemented zones , indicating that oil migration post-dates the massive silica cementation .
Lithologically similar , but much finer-grained (5-50 micron-diameter spicules , as opposed to 10-500 microns in the present cores) Devonian spiculites from Texas were also interpreted to have undergone lithification by chalcedony-ehert cementat ion within the firs t kilometer of burial (Ruppel & H ovorka 1995). Here , the occurrence of high-porosity zones was suggested to follow deposi tional facies variations . Massively sil ica-cemented, low-porosity zones occur in pro ximity with limestone beds due to inferreci en hancement of silica p recipitat ion rates by Mg+ ions released from carbonate . However, no such relationship of silica cementation to carbonate pro ximity is o bserved in the present study . The only major concentration of detrital carbonate observed in the present cores from the coarse sp iculite facies is a 5 cm-thick coquina bed at 1575. 80 mCD in well 7128/4-1, which is surrounded by porous spiculite .
Fracture and vug porosity make up a minor proportion of the total porosity, but may be of great importance for increasing longer-range reservo ir connectivity .
In the 7128/4-1 core , clusters of vuggy pores typically occur in the most porous (least silica-cemented) rock volumes, often only centimeters away from heavily si lica cemented volumes. In some cases, fractures appear to be enlarged into irregular vugs by dissolution , suggested by thinning and truncation of spiculite fabric adjacent to vug walls . Vuggy porosity is more abundant in the 7128/4-1 core , but is also present in certain intervals of the 7128/6-1 spiculite , especially 1638. 5-1639.2 mCD. In this zone , abundant vuggy fractures commonly terminate against sedimentologic discontinuities , indicating formatien during ear ly compactional deformation.
It is unknown whether the higher porosity within the upper part of the spiculite is related mainly to (l) a change in depositional lithology upward through the spiculite interval , or (2 ) subaerial exposure of the top of L-9 and leaching by meteor ic water . In favour of the first cause , the overall GR and lithology trends observed support the interpretation of upward shoaling of depositional conditions, invo lving decreasing shale content and possible increasing rate of spicule production, or increasing degree of current winnowing . Thus the upward porosity increase could refl.ect decreasing abundance of primary inter-spicule matrix. Upward increase in sedi ment accumulation rate would also favour porosity preservation by allowing less time for porosity-destroying processes occurring on the sea fl.oor, including bio turbat ion and early cementation. According to this model , the high moldic porosity of the spiculite can be interpreted entirely as the result of local silica redistribution during shal low phreat ic diagenesis . Altematively , it can be argued that a depositionally-determined tendency
248 S. N. Ehrenberg et al.
toward upward porosity increase was enhanced by mete oric leaching at the top of L-9. This possibility is presently being investigated by a combination of stable isotopic and fluid inclusion analyses .
Factors controlling permeability
This section is concerned with variations in the correlation between permeability and porosity observed within and between different lithologies . Fo r the sake of simplicity , this discussion is restricted to cover only the four microfacies having the most significant occurrences of porosity > 1 5 % (MF-7, -8, -6, and -2; Fig . 2 ) . These variations are discussed in terms of the carbonate rockfabricjpetrophysical classification scheme of Lucia (1 995 ) , which is based on division of porosity into interparticle , separate-vug, and touching-vug categories . However, the present discussion i s only qualitative , be cause none of the samples has been point counted to determine relative pore-type abundances . There is also uncertainty regarding the degree to which the thin sections are truly representative of the plug volumes on which permeability and porosity were measured. Many samples are obviously heterogeneous in fabric on a centimeter scale , and the thin sections were , in most cases , cut from the core immediately adjacent to the plug rather than from the plug itself. This could account for some of the non-correlation between fabric and poro-perm trends noted below.
MF-7 grainstone fpackstones
The tight poro-perm correlation defined by the MF -7
�amples (Fig. 23A) would seem to imply uniformly varymg p
_ore-system characteristics ; i . e . that separate-vug
poros ity makes up a roughly constant proportion of total porosity , and that effective particle size is roughly constant . This trend, if uncorrected for vuggy porosity , falls within Lucia's 20-1 00 micron field (Fig. 23A) , corre sponding with the size range for fine calcite spar cement (Table 2 ) . Correction assuming that uniformly 30% of total porosity i s vuggy porosity would move the trend into Lucia's 1 00-500 micron field, corresponding with the approximate s ize of the dominantly bioclastic grains in these rocks .
However, thin section examination indicates that the MF-7 samples show wide variations in fabric , such that it seems unlikely that they have uniformly varying poresystem characteristics . In terms of the Lucia classification, these rocks include both 'grain-dominated grainstonefpackstones ' , where the effective particle size is on the scale of grains (1 00-500 microns) , and 'muddominated packstones ' , where the effective particle size is much smaller. Furthermore , a large proportion (commonly 25 -75%) of the total visible porosity is separatevug (moldic and intrafossil ) porosity , but this proportion
NORSK GEOLOGISK TIDSSKRIFT 78 (I998)
appears widely variable from sample to sample . There fore, it is difficult to explain the apparently coherent poro-perm behaviour of this sample group .
MF-8 dolomitic mudstones
These samples p lot in the vicinity of the MF-7 trend , but show considerably mo re scatter . All samples have muddominated fabric, so according to Lucia (1 995 ) , higher permeability for given total porosity would be expected to correspond with coarser matrix crystal size . A second facto� to be considered is the proportion of total porosity that Is vuggy porosity . Disappointingly , however, it is difficult to see that either of these parameters is related to the relative positions of the data points in Fig . 23B. This problem may be illustrated by considering the 8 samples with porosity in the range 22 -25% (Fig . 23B) . Permeabilities vary from 0.3 to 1 1 3 mD, but show little consistent correspondence with either matrix crystal size or proportion of vuggy porosity . The only factor that seems to have a consistent relationship to the poro-perm ratio is siliciclastic content (measured in terms of SCI index) , in that samples with SCI < 1 0% plot along the high-permeability side of the poro-perm envelope (Fig. 23B) .
MF-6 buildups
The MF-6 samples plotted in Fig. 23C have been edited to include only Palaeoaplysina and phylloid algae-domi nated varieties . These rocks display distinctly higher permeability for given porosity compared with the MF-7 trend . Most porosity visible in thin section is moldic formed either by dissolution of aragonite plates , o; present as smaller moldic and intrafossil pores in the muddy matrix . In general , only a subordinate proportion of total visible porosity is interparticle porosity within dolo�itized matrix . Much of the moldic intra-plate poros ity appears to be interconnected, at !east on the scale of a thin section . The platey molds are therefore �nterpreted as consisting in part of touching-vug poros It�, s�ch that Luc�a's particle-size fields do not apply for this hthology . It IS also likely that some of the platey vugs are larger than plug scale , such that high 'touchingvug permeability' measured on the plugs may not be valid for larger rock volumes . Nevertheless , the observation
. of a coh�rent poro-perm correlation implies a regu
lar mcrease m vug connectivity with increasing total poros�ty . Dolomitization does not appear to have sys temat tcally affected poro-perm relationship (Fig. 23C) .
MF-2 spiculite
Due to the limited core coverage , all plug samples from the coarse spiculite (upper cycle of unit L-9) are included in Fig . 23D, whether or not they correspond with the

NORSK GEOLOGISK TIDSSKRIFT 78 (1998) Diagenesis, Finnmark carbonate platform, N. Norway 249
1000
o E -
� :0 m Q)
E Q)
0..
o E -
� :0 m Q) E .... Q)
a_
100
10
1
0.1
0.01 1000
100
10
1
0.1
0.01
A
o
c
D o
o
o
MF-7 Foram. grain/packstones o Grain-dominated • Mud-dominated o
o •• DO O
• o O O•
D•
o
o D o
D
MF-6 Buildups • CCD <50 o CCD >50
B MF-8 Dolomitic mudstones Vuqqy porosity:
• <1 0% of total Ø o 20-30% o 50-80%
o f o
o
o
Do • •
o
•
• .lii
Matrix crystal size: • 2-8 microns O 1 0-20 microns
tf SCI <10%: f
D
6
6
/
6
6
MF-2 Spiculite s well 7128/6-1 • well 7128/4-1
6
/ /
/
6
• • • • •
•
•
/
6
o 5 10 15 20 25 30 35 o 5 10 15 20 25 30 35 Porosity (%) Porosity (%)
Fig. 23. Permeability vs. porosity in the four microfacies categories having highest overall porosity in wells 7128/6·1 and 7128/4-1. Diagonal lines in (A) show approximate positions of Lucia's (1995) particle-size groups for non-vuggy carbonate rocks. (Positions are approximate because Lucia uses a log scale for porosity, whereas a linear scale is used here.) Diagonal line in (B), {C), and (D) shows boundary between 500-100 and 100-120 pm fields to facilitate comparison between plots. Plotting symbols vary from plot to plot, and show sample groupings discussed in text. Dashed diagonal in (D) shows trend of matrix porosity in Devonian spiculites from Texas (from Fig. 18 of Ruppel & Hovorka 1995).
lesser number of petrologically-analysed fixed-interva1 samples . These rocks show extreme variation in poroperm ratio, reflecting wide variations in rock fabric and proportion of separate-vug porosity . Most samples from well 7128/6-1 p1ot near the trend for matrix porosity in the Devonian spiculite reservoirs of Texas (diagonal line i n Fig . 23D; from Fig . 18 in Ruppe1 & Hovorka 1995). Flow in these p1ugs probably takes place mainly through the rock matrix, rather than
through fractures and larger vugs . Samples from the 2 .3 m of core in well 7128/4-1 have higher permeabi1ity and most1y higher porosity than the 7128/6-1 samp1es . This improvement is interpreted as reflecting (l) lower matrix content and larger spicule size due to shallower depositional conditions, and (2) presence of vugs 1arger than p1ug sca1e in some samp1es. Samp1es plotting to the left of the solid diagonal line in Fig . 23D are suspected to be plugs with fractures .

250 S. N. Ehrenberg et al.
Conclusions
Diagenetic style and porosity are correlated with lithology and depositional setting. Each of the four main stages of platform evolution has its particular set of facies associations, and consequent potential for reservoir development:
Moscovian to Early Gzhelian. - Intervals of limestone and calcareous sandstone have lost nearly all porosity by compaction and late cementation by calcite spar. Interbedded dolomitic sandstones are moderately porous due to early dolomite cementation, which may have inhibited mechanical compaction and reduced susceptibility to later calcite cementation. This pattem indicates that late porosity occlusion in these strata was a local-scale, closed-system process.
Middle Gzhelian to Early Sakmarian. - High porosity occurs in several rock types, refiecting various sets of controlling factors. Dolomitization is favourable for porosity in mudstones and wackestones, but is neither positively nor negatively correlated with porosity in buildups and grainstones, where high porosity mainly refiects paucity of late calcite cement. This stratigraphic interval contains numerous porous zones throughout, because of the favourable combination of a platform-interior setting with an overall trend of decreasing rate of 2nd-order sea-level rise and subsequent 2nd-order lowstand.
Late Sakmarian to Artinskian. - Virtually complete loss of effective porosity by calcite cementation in unit L- 8 refiects the stable depositional mineralogy and the presence of abundant thin clay-rich horizons subject to stylolitic dissolution. Porosity loss is viewed as a late burial process that can potentially be calibrated as a function of thermal maturity. However, data from the shallow IKU cores indicate little porosity at VR of 0.4% Rm, offering little hope for porosity preservation regionally.
Mid- to Late Permian. - High porosity occurs in extremely micro-heterogeneous, carbonate-poor spiculite at the top of this interval. Decreasing porosity downward through the spiculite is caused by massive cementation by chert and macroquartz. However, it is unknown whether preservation of high moldic and interspicule porosity in the upper spiculite zone is entirely facies- and lithology-dependent, or results from exposure and leaching by meteoric water.
Acknowledgments. - The manuscript was improved thanks to suggestions from Nei! A. H. Pickard and NGT referees Deborah Bliefnick and Michael Talbot.
Manuscript received May 1997
NORSK GEOLOGISK TIDSSKRIFT 78 (1998)
References
Bjørkum, P. A., Oelkers, E. H., Nadeau, P. H., Walderhaug, O. & Murphy, W. M. 1998: Porosity prediction in quartzose sandstones as a function of time, temperature, depth, stylolite frequency, and saturation hydrocarbon. AAPG
Bulletin 82, 637-648. Bugge, T., Elvebakk, G., Bakke, S., Fanavoll, S., Lippard, S., Leith, T. L.,
Mangerud, G., Mi\ller, N., Nilsson, I., Rømuld, A., Schou, L., Vigran, J. 0., Weiss, H. M. & Århus, N. 1989: Shallow drilling Barents Sea 1988 main report. IKU Report 89.022, 348 pp.
Dore, A. G. & Jensen, L. N. 1995: The impact of Late Cenozoic uplift and erosion on hydrocarbon exploration: offshore Norway and some other uplifted basins. Global and Planetary Change 12, 415-436.
Dorobek, S. L. 1987: Petrography, geochernistry, and origin of burial diagenetic facies, Siluro-Devonian Helderberg Group (carbonate rocks), central Appalachians. AAPG Bulletin 71, 492-514.
Dra vis, J. J. 1996: Rapidity of freshwater calcite cementation - implications for carbonate diagenesis and sequence stratigraphy. Sedimentary Geo/ogy 107,
1-10. Dravis, J. J. & Yurewicz, D. A. 1985: Enhanced carbonate petrography using
tluorescence rnicroscopy. Journal of Sedimentary Petrology 55, 795-804. Dunnington, H. V. 1967: Aspects of diagenesis and shape change in stylolitic
limestone reservoirs. 7th World Petroleum Congress Proceedings 2, 339-352. Ehrenberg, S. N., Nielsen, E. B., Svånå, T. A. & Stemmerik, L. 1998: Deposi
tional evolution of the Finnmark carbonate platform, Barents Sea: results from wells 7128/6-1 and 7128/4-1. Norsk Geologisk Tidsskrift 78, 185-224.
Elvebakk, G., Bugge, T., Eem, J. V. D., Fanavoll, S., Fjerdingstad, V., Haugane, E., Leith, T. L., Mørk, A., Rendall, H., ..Skarbø, 0., Smelror, M., Sættem, J., Vigran, J. 0., Weiss, H. M. & Århus, N. 1988: Shallow drilling Barents Sea 1987 main report. IKU Report 88.039, 311 pp.
Elvebakk, G., Fanavoll, S., Johansen, H. & Stemmerik, L. 1990: Sedimentology, stratigraphy, diagenesis, geochernistry and reservoir potential of Gzhelian-As· selian carbonates, Finnmark Platform. IKU Report 90.078, 76 pp.
Fallick, A. E., Jocelyn, J., Donnelly, T., Guy, M. & Beham, C. 1985: Origin of agates in volcanic rocks from Scotland. Nature 313, 672-674.
Given, R. K. & Lohmann, K. C. 1986: Isotopic evidence for the early meteoric diagenesis of the reef facies, Permian reef complex of west Texas and New Mexico. Journal of Sedimentary Petrology 56, 183-193.
Harms, J. C. & Choquette, P. W. 1965: Geologic evaluation of a gamma-ray porosity device. Transactions of the Society of Professional Well Log Ana/ysts,
6th Annua/ Logging Symposium C, 1-37. Hemming, N. G., Meyers, W. J., & Grams, J. C. 1989: Cathodoluminescence in
diagenetic calcites: the roles of Fe and Mn as deduced from electron probe and spectrophotometric measurements. Journal of Sedimentary Petrology 59, 404-411.
James, N. P. & Bone, Y. 1989: Petrogenesis of Cenozoic, temperate-water calcarenites, south Australia: a model for meteoric/shallow burial diagenesis of shallow-water calcite sediments. Journal of Sedimentary Petrology 59, 191-203.
Jobe, H. & Saller, A. 1995: Oil reservoirs in grainstone aprons around bryozoan mounds, Upper Harrodsburg Limestone, Mississippian, Illinois Basin. AAPG
Bulletin 79, 783-800. Kerans, C., Lucia, F. J. & Senger, R. K. 1 994: Integrated characterization of
carbonate ramp reservoirs using Perrnian San Andres Formation outcrop analogs. AAPG Bulletin 78, 181-216.
Loucks, R. G. & Bebout, D. G. 1984: Shelf-interior carbonate grainstone shoals: Lower Cretaceous Pearsall Formation, south Texas. In Harris, P. M. (ed.): Carbonate Sands: a Core Workshop, 334-364. Society of Econornic Paleontologists and Mineralogists Core Workshop 5.
Lucia, F. J. 1995: Rock-fabric/petrophysical classification of carbonate pore space for reservoir characterization. AAPG Bulletin 79, 1275-1300.
Lønøy, A. 1988: Environmental setting and diagenesis of Lower Perrnian Palaeoaplysina bnildups and associated sediments from Bjørnøya: implications for exploration of the Barents Sea. Journal of Petroleum Geology 11, 141-156.
Maliva, R. G. 1989: Displacive calcite syntaxial overgrowths in apen marine limestones. Journal of Sedimentary Petrology 59, 397-403.
Meyers, W. J. 1978: Carbonate cements: their regional distribution and interpretation in Mississippian limestones of southwestem New Mexico. Sedimentology
25, 371-400. Meyers, W. J. 1989: Trace element and isotope geochemistry of zoned calcite
cements, Lake Valley Formation (Mississippian, New Mexico): insights from water-rock interaction modelling. Sedimentary Geo/ogy 65, 355-370.
Moore, C. H. 1989: Carbonate Diagenesis and Porosity. Elsevier, Amsterdam, 338 pp.
Nyland, B., Jensen, L. N., Skagen, J., Skarpnes, O. & Vorren, T. 1992: Tertiary uplift and erosion in the Barents Sea: magnitude, timing and consequences. In
Larsen, R. M. et al. (eds.): Structural and Tectonic Modelling and its Application
to Petroleum Geo/ogy. Norwegian Petroleum Society (NPF) Special Publication No. l , 153-162. Elsevier, Amsterdam.

NORSK GEOLOGISK TIDSSKRIFT 78 (1998)
Purser, B. H. 1984: Stratiform stylolites and the distribution of porosity: examples from the Middle Jurassic limestones of the Paris Basin. In Stylolites and
Associated Phenomena Relevance to Hydrocarbon Reservoirs. Special Publication by Abu �bi National Reservoir Research Foundation, 203-217, Abu Dhabi, U. A. !!:1
Ruppel, S. C. & Hovorka, S. D. 1995: Contro1s on reservoir development in Devonian chert: Permian Basin, Texas. AAPG Bulletin 79, 1757-1785.
Schmocker, J. W. 1984: Empirical relation between carbonate porosity and thermal rnaturity: an approach to regional porosity prediction. AAPG Bulletin
68, 1697-1703. Scholle, P. A. 1995: Carbon and sulfur isotope stratigraphy of the Permian and
adjacent intervals. In Scholle, P. A. & Peryt, T. M. (eds.): Permian of the
Northern Continents, 133-149. Springer Verlag, Berlin. Skaug, M., Dons, C. E., Lauritzen, Ø. & Worsley, D. 1982: Lower Permian
Palaeoaplysina bioherms and associated sediments from central Spitsbergen. Polar Research 2, 57-75.
Diagenesis, Finnmark carbonate platform, N. Norway 251
Smalley, P. C., Stijfhoorn, D. E., Råheim, A., Johansen, H. & Dickson, J . A. D. 1989: The laser microprobe and its application to the study of C and O isotopes in calcite and aragonite. Sedimentary Geology 65, 211-221.
Stemmerik, L. & Larssen, G. B. 1993: Diagenesis and porosity evolution of Lower Permian Palaeoaplysina buildups, Bjørnøya: an example of diagenetic response to high-frequency sea-leve! fluctuations in an arid climate. In Horbury, A. D. & Robinson, A. D. (eds.): Diagenesis and Basin Development,
199-211. American Association of Petroleum Geologists, Studies in Geology 36.
Tinker, S. W. 1996: Building the 3-D jigsaw puzzle: applications of sequence stratigraphy to 3-D reservoir characterization, Permian Basin. AAPG Bulletin
80, 460-485. Walkden, G. M. & Berry, J. R. 1984: Syntaxial overgrowths in muddy crinoidal
limestones: cathodoluminescence sheds new light on an old problem. Sedimen
tology 31, 251-267. Wise, S. W. & Weaver, F. M. 1974: Chertification of oceanic sediments. Interna
tional Association of Sedimentologists Special Publication l, 301-326.