diagenesis and its impact on the reservoir quality of
TRANSCRIPT
Page 1
Diagenesis and its impact on the reservoir quality of Miocene 1
sandstones (Surma Group) from the Bengal Basin, Bangladesh 2
3
M. Julleh J. Rahman1 and Richard H. Worden2* 4
1Dept. of Geological Sciences, Jahangirnagar University, Dhaka, Bangladesh 5
2 Dept. of Earth, Ocean and Ecological Sciences, University of Liverpool, L69 3GP, United 6
Kingdom 7
8
Abstract 9
Rapid supply and deposition of 1000’s of meters of Miocene and Pliocene sediment tend to lead 10
to a different set of controls on reservoir quality than older, more slowly buried sandstones. Here 11
we have studied Miocene fluvial-deltaic Bhuban Formation sandstones, from the Surma Group, 12
Bengal Basin, buried to >3,000m and >110ºC, using a combination of petrographic, geochemical 13
and petrophysical methods in order to understand the controls on Miocene sandstone reservoir 14
quality to facilitate improved prediction of porosity and permeability. The main conclusions of 15
the study are that mechanical compaction processes are the dominant control on porosity-loss 16
although early calcite growth has led to locally-negligible porosity in some sandstones. 17
Mechanical compaction occurred by grain rearrangement, ductile grain compaction and brittle 18
grain fracturing. Calcite cement, occupying up to 41% intergranular volume, was derived from a 19
combination of dissolved and recrystallized bioclasts, an influx of organic-derived carbon dioxide 20
and plagioclase alteration. Clay minerals present include smectite-illite, kaolinite and chlorite. 21
The smectitic clay was probably restricted to low energy depositional environments and it locally 22
diminishes permeability disproportionate to the degree of porosity-loss. Kaolinite is probably the 23
result of feldspar alteration resulting from the influx of organic-derived carbon dioxide. Quartz 24
Page 2
cement is present in small amounts, despite the relatively high temperature, due to a combination 25
of limited time available in these young sandstones, grain-coating chlorite and low water 26
saturations in these gas-bearing reservoir sandstones. Reservoir quality can now be predicted by 27
considering primary sediment supply and primary depositional environment, the magnitude of the 28
detrital bioclast fraction and the influx of organic-derived carbon dioxide. 29
30
Key words: Diagenesis; sandstone; reservoir quality; Miocene; Surma Group; Bengal Basin; 31
mechanical compaction, calcite cement 32
33
*Corresponding author. E-Mail. [email protected], UK-44 1517945184 34
35
Page 3
1. Introduction 36
The Bengal Basin in Southeast Asia covers most of Bangladesh and is known as a prolific 37
petroleum-bearing basin. It contains up to 22,000 m of Cretaceous to Holocene sedimentary fill 38
(Alam et al., 2003). This huge succession includes about 4,000 to 5,000 m of Neogene sediment 39
of the petroliferous Surma Group (Table 1) buried to 2,300 to 3,100 m. So far, twenty-five 40
economically-viable fields have been discovered in Bangladesh. Predominantly, these are gas 41
fields in the Miocene Surma Group sandstones. These recently-discovered gas fields have 42
become a significant source of hydrocarbon in the Bengal Basin and promise to serve as an 43
engine of economic growth for Bangladesh. There are several publications that have dealt with 44
the regional geology, sedimentology, tectonic evolution and petroleum prospectivity of the Surma 45
Basin, especially for the north-eastern petroleum province (Hiller and Elahi, 1984; Johnson and 46
Alam, 1991; Khan et al., 1988; Lietz and Kabir, 1982; Rahman et al., 2009; Shamsuddin et al., 47
2001). However, relatively few publications focus on the reservoir quality and diagenesis of the 48
sandstone units (Imam and Shaw, 1987; Islam, 2009; Rahman and McCann, 2012; Rahman et al., 49
2011). 50
Reservoir quality (porosity and permeability) is a key control on success during petroleum 51
exploration, along with source presence, maturation, migration, trap and seal. Reservoir quality is 52
a function of primary sand texture and composition and the secondary diagenetic processes of 53
compaction, mineral cementation, mineral replacement and mineral dissolution (Worden and 54
Burley, 2003). The necessarily limited time available to bury Miocene sediment to >2,000 m 55
requires either a very large river system spewing sediment into a basin with a restricted 56
dimensions, or a major tectonic event (e.g. the Himalayan orogeny) in the sediment's hinterland 57
(or a combination of both reasons). The Bengal Basin has accumulated sediment at about 150 58
m/myr, a value that is approximately ten times greater than, for example, the rate of sediment 59
Page 4
accumulation for the Brent Group reservoirs in the North Sea. There are some notable 60
differences in the controls on reservoir quality in Neogene sandstones at 2,000 to 3,500 m 61
compared to Palaeogene or older sandstones, at equivalent depths, due to the accelerated rate of 62
sediment supply and burial. The rapid burial and consequent heating of Miocene sediments to > 63
2,300 m suggests that kinetically-controlled diagenetic processes, for example carbonate 64
neoformation, clay mineral transformations or the growth of quartz cement, will be less advanced 65
than in older basins at the same depth and temperature (Dutton et al., 2012; Gier et al., 2008). 66
Furthermore if a major Miocene tectonic event led to the supply of a vast amount of sediment 67
from the surrounding mountain belts, it is likely that the supplied sediment will be 68
mineralogically immature compared to sediment supplied and accumulated more slowly (Worden 69
et al., 2000; Worden et al., 1997). Therefore, it is important to have a detailed understanding of 70
sandstone diagenesis during petroleum exploration in young, e.g. Miocene, basins. Previous 71
studies on diagenetic cements in the Bengal Basin revealed a dominant presence of calcite cement 72
in the Surma Group (Rahman and McCann, 2012). The present investigation is a petrographic 73
and geochemical study of Surma Group sandstones dominantly from the central Bengal Basin. It 74
builds on earlier work (Imam and Shaw, 1987; Islam, 2009; Rahman and McCann, 2012; Rahman 75
et al., 2011) by undertaking a full assessment of all the possible controls on reservoir quality, 76
extending the study to a great range of depths (2303 m to 3178 m; Fig. 2), using stable isotope 77
data from calcite cement from the central Bengal Basin and, for the first time, incorporating core 78
analysis data. Samples have been collected from six exploration wells from four gas fields 79
(Jalalabad, Meghna, Narsingdi, SaldaNadi and Titas; Fig. 1). 80
This paper specifically seeks to address the following research questions: 81
1) Is compaction or cementation the dominant control on reservoir quality in young 82
(Miocene) sandstones buried to more than 3,000 m? 83

Page 5
2) What are the main sources of carbonate cement in these young and deeply buried 84
sandstones and can we predict this control on reservoir quality? 85
3) Is quartz cement common in these young sandstones heated to more than 100C? 86
4) What are the key aspects of diagenesis to consider in an assessment and prediction of 87
reservoir quality of young sandstones buried to more than 3,000 m and heated to more 88
than 100C? 89
90
2. Geological setting 91
The Cretaceous to Holocene Bengal Basin lies on the eastern side of the Indian subcontinent 92
between the Shillong Plateau to the north, and the Indo-Burman Ranges to the east. The Bengal 93
Basin occupies most of Bangladesh and West Bengal (India) as well as part of the Bay of Bengal 94
(Fig. 1). Basin development is concluded to have started in the Early Cretaceous epoch (ca. 127 95
Ma) when the Indian plate rifted away from Antarctica, although there is ongoing debate about 96
the precise timing of rifting (Gibbons et al., 2013; Jokat et al., 2010). After plate reorganization 97
at about 90 Ma, the Indian plate migrated rapidly northward and collided with Asia between 98
approximately 55 and 40 Ma (Johnson and Alam, 1991). This basin originated during the 99
collision of India with Eurasia and Burma, building the extensive Himalayan and Indo-Burman 100
mountain ranges and, thereby, loading the lithosphere to form flanking sedimentary basins (Uddin 101
and Lundberg, 1998). 102
Since the Cretaceous, sedimentation in the Bengal Basin has been controlled by the movement 103
and collision pattern of the Indian plate with the Burmese and Tibetan plates and by the uplift and 104
erosion of the Himalayas and Indo Burman Ranges (Alam, 1989). The basin-fill of the onshore 105
part of the basin has previously been divided into platform (shelf), slope (hinge) and basinal 106
facies (Alam et al., 2003) (Fig. 1). Crystalline basement of the Indian plate underlies the shelf 107

Page 6
and bounds the Bengal Basin to the west and north; the deeper basin to the east and southeast may 108
be floored by oceanic or transitional crust (Johnson and Alam, 1991). 109
Upper Cretaceous to Middle Eocene stratigraphic units comprise non marine to shallow-marine 110
deposits (Uddin and Lundberg, 1998). Basin-wide subsidence took place in the middle Eocene 111
resulting an extensive marine transgression with the deposition of the nummulitic Sylhet 112
Limestone Formation (Table 1). This event was followed by the brackish to marine shales of 113
Kopili Formation. In the Oligocene, basin-wide emergence and marine regression occurred, 114
followed by deposition of the Barail Group. 115
During the Miocene, major uplift began in Himalayas, and large volumes of orogenic sediments 116
were funneled into the basin from the north east, building a major Mio-Pliocene delta complex 117
(Uddin and Lundberg, 1998). The Miocene Surma Group was then deposited in deltaic to 118
shallow marine environments followed by predominantly fluvial deposition of the Mio-Pliocene 119
Tipam Formation and then finally fluviatile Plio-Pleistocene Dupi Tila Formation sandstones 120
(Alam, 1989). 121
The sediments of the Miocene Surma Group have been sub-divided into, in age order, the Bhuban 122
and Boka Bil Formations. The wells utilized in this study had reservoirs in the Bhuban 123
Formation (Fig. 2). The Bhuban and Boka Bil Formations were principally deposited in a large, 124
mud-dominated delta system that drained a significant portion of the eastern Himalaya (Johnson 125
and Alam, 1991). The delta responsible for the Surma Group has been interpreted to be tide-126
dominated (Alam, 1995; Rahman et al., 2009). The marine-deltaic to fluvial-deltaic shale and 127
sandstone rhythmites of the Surma Group sediments are reported to represent repetitive 128
transgression and regression phases that resulted from subsidence as well as relative sea-level 129
changes (Rahman et al., 2009) (Table 1). The older Bhuban Formation consists of fine grained, 130
well-indurated, thickly bedded sandstones, siltstones, shales and claystones (Imam and Shaw, 131
Page 7
1987). The reservoir sandstones of the Bhuban Formation of the Surma Group are characterized 132
by a combination of massive units, parallel-lamination, cross-bedding, cross-bedded sandstones 133
with lags of mud clasts, and ripple-lamination with flaser bedding (Rahman et al., 2009). 134
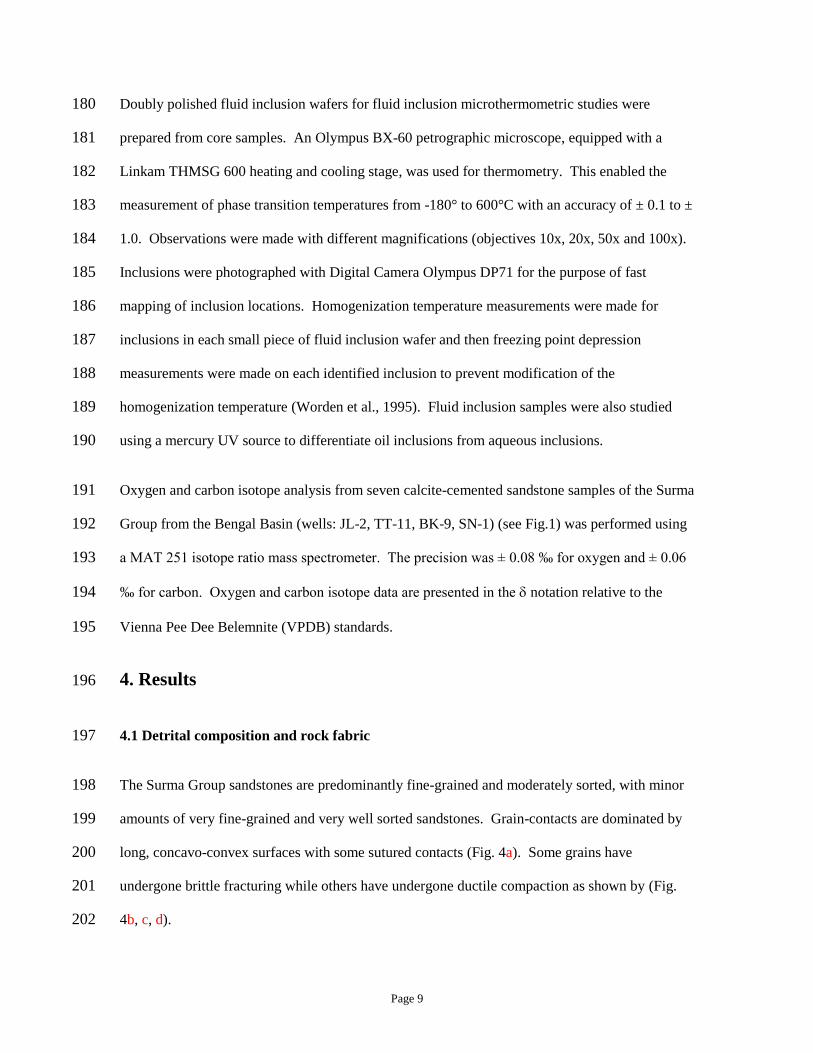
The borehole-temperature in the Bhuban Formation sandstones in this study range from 85C at 135
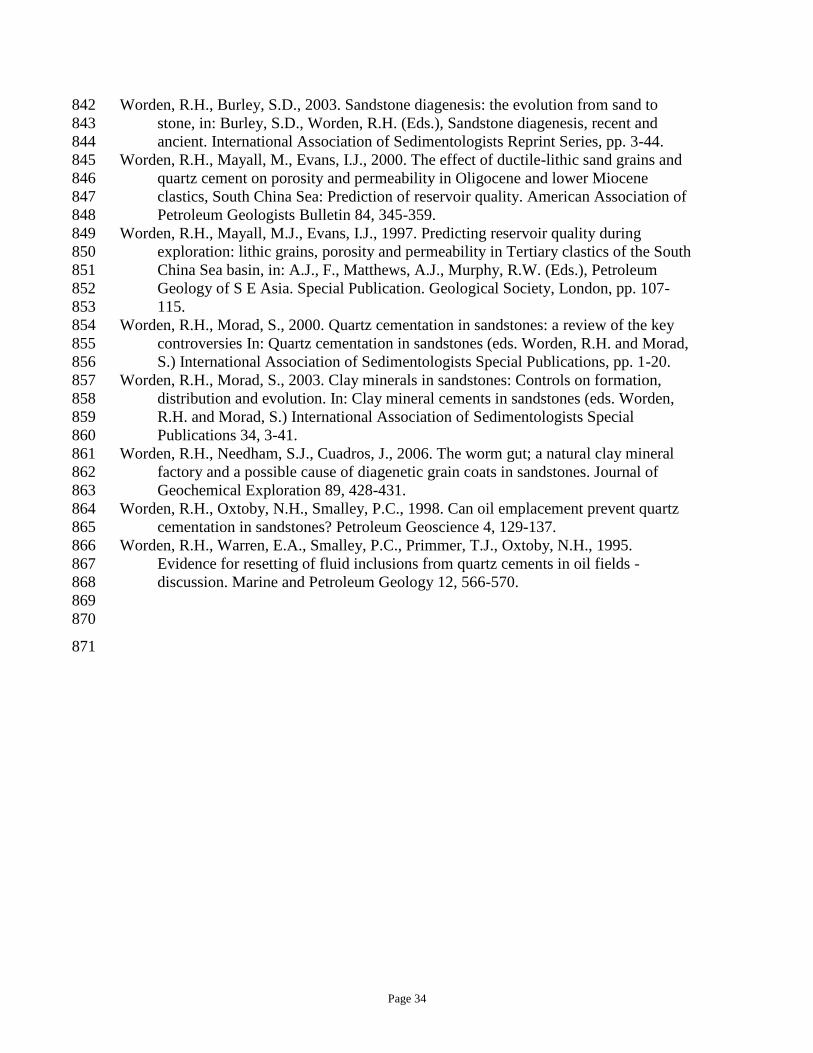
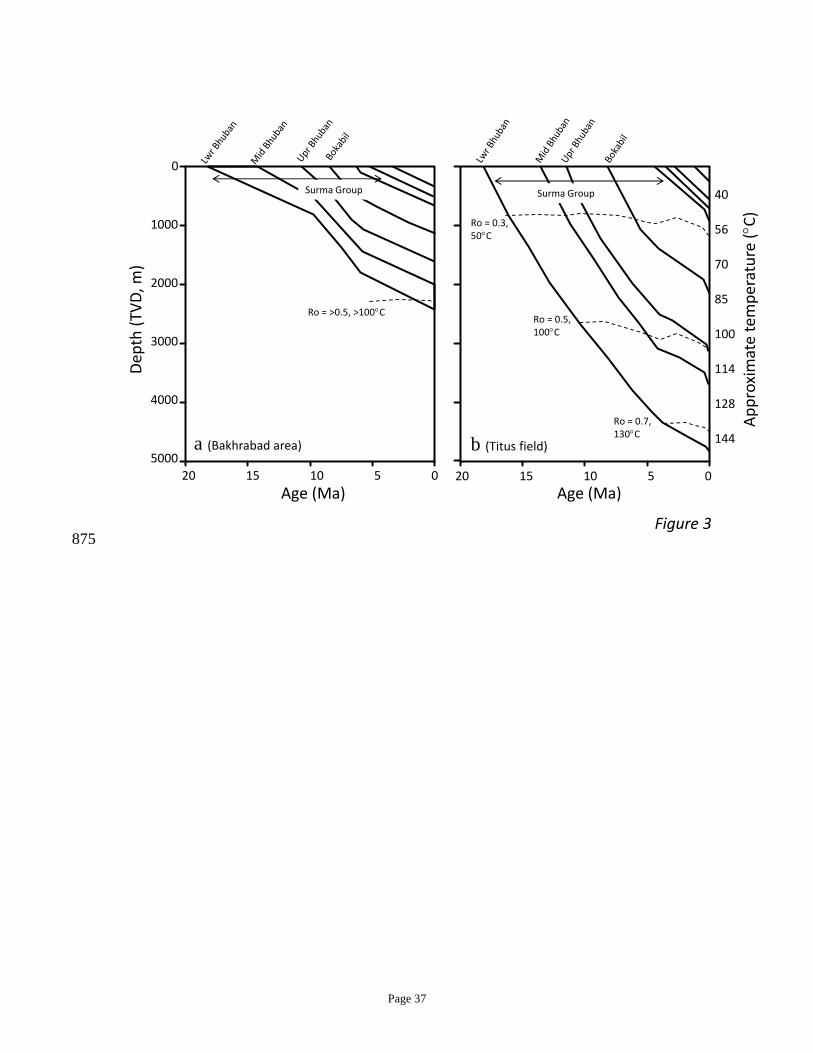
2300 m to 115C at 3200 m. Burial history and thermal modelling indicate that the main phase of 136
oil and gas generation occurred around 12 million years ago (BAPEX, 1996) (Fig. 3). The 137
sandstones have not been reported to be significantly overpressured. 138
3. Samples and methods 139
Thin section petrographic analysis was performed on 85 sandstone core samples collected at a 140
range of depths between 2303 m and 3178m from six exploratory wells from four gas fields: 141
Jalalabad (JL-2, JL-3, both drilled in 1989), Meghna (BK-9, 1990), Narshingdi (BK-10, 1990), 142
and Titas (TT-11, 1990; TT-15, 2006). Samples for thin-section study were impregnated with 143
blue epoxy to facilitate petrographic recognition of porosity. Thin sections were stained with 144
Alizarin-Red S and potassium-hexacyanoferrate (lll) to help identify calcite and dolomite and 145
their ferroan versions (Tucker, 1988). 146
The modal composition of the sandstones was achieved by counting 600 points per thin section. 147
In the case of coarse polyminerallic rock fragments, such as quartz-feldspar granitic rock 148
fragments, the individual mineral was counted as a single grain following the Gazzi-Dickinson 149
point counting method (Dickinson, 1985; Dickinson and Suczek, 1979). Intergranular volume 150
(IGV %) was determined from point-count data and is equal to the sum total of remaining 151
intergranular porosity and the pore-filling cements and matrix. 152
Two scanning electron microscopes (SEM) were employed in the study: a CamScan MV 2300 153
SEM (University of Bonn, Germany) and a Philips XL30 tungsten filament SEM fitted with an 154
Page 8
Oxford Instruments INCA EDS system with an SiLi detector (University of Liverpool, UK). 155
These were used in secondary electron imaging (SEI) and backscattered electron microscope 156
(BSEM) modes to observe authigenic minerals, cements and pore geometry in sandstones. They 157
were also used to determine the relative timing of mineral growth and deformation. A cold 158
Cathodoluminescence (CCL) detector was used on the Philips XL30 (University of Liverpool, 159
UK), at 10 kV to help differentiate quartz grains and quartz cement. The SEM-CL image was 160
built up over 16 frames. 161
Broken rock chips and polished sections were used for SEM examination. Broken rock chips 162
were gold coated and examined at an acceleration voltage of 20 kV. Polished sections for BSEM 163
and EDS analysis were coated using an Emitech K950X carbon coater. The contact between the 164
thin section slide and sample holder was improved by painting around the sample with colloidal 165
graphite to form a good conduction path. 166
Samples for X-ray diffraction (XRD) were cut from the core samples. A PANalytical X’pert pro 167
MPD X-ray diffractometer was used for the analysis. The samples were crushed using a 168
micromill and distilled water for 10 minutes. They were then dried overnight in a low 169
temperature oven and powdered using agate pestle and mortar. A copper X-ray source operating 170
at 40kV and 40mA was used. Powder samples were loaded into cavity holders and rotated 171
continuously during the scan, completing one rotation every 2 seconds. Programmable anti-172
scatter slits and a fixed mask maintained in an irradiated sample area of 10 x 15 mm, with an 173
additional 2o incident beam antiscatter slit producing a flat background for raw data down to a 174
2theta angle of 3o. The X’Celerator detector was set to scan in continuous mode with full length 175
active pulse-height discrimination levels set to 45 to 80 %. Operation of the XRD was controlled 176
using “HighScore Plus ®” analysis software and automated Rietveld refinement methods with 177
reference patterns from the International Centre for Diffraction Data; Powder Diffraction File-2 178
Release 2008. 179
Page 9
Doubly polished fluid inclusion wafers for fluid inclusion microthermometric studies were 180
prepared from core samples. An Olympus BX-60 petrographic microscope, equipped with a 181
Linkam THMSG 600 heating and cooling stage, was used for thermometry. This enabled the 182
measurement of phase transition temperatures from -180° to 600°C with an accuracy of ± 0.1 to ± 183
1.0. Observations were made with different magnifications (objectives 10x, 20x, 50x and 100x). 184
Inclusions were photographed with Digital Camera Olympus DP71 for the purpose of fast 185
mapping of inclusion locations. Homogenization temperature measurements were made for 186
inclusions in each small piece of fluid inclusion wafer and then freezing point depression 187
measurements were made on each identified inclusion to prevent modification of the 188
homogenization temperature (Worden et al., 1995). Fluid inclusion samples were also studied 189
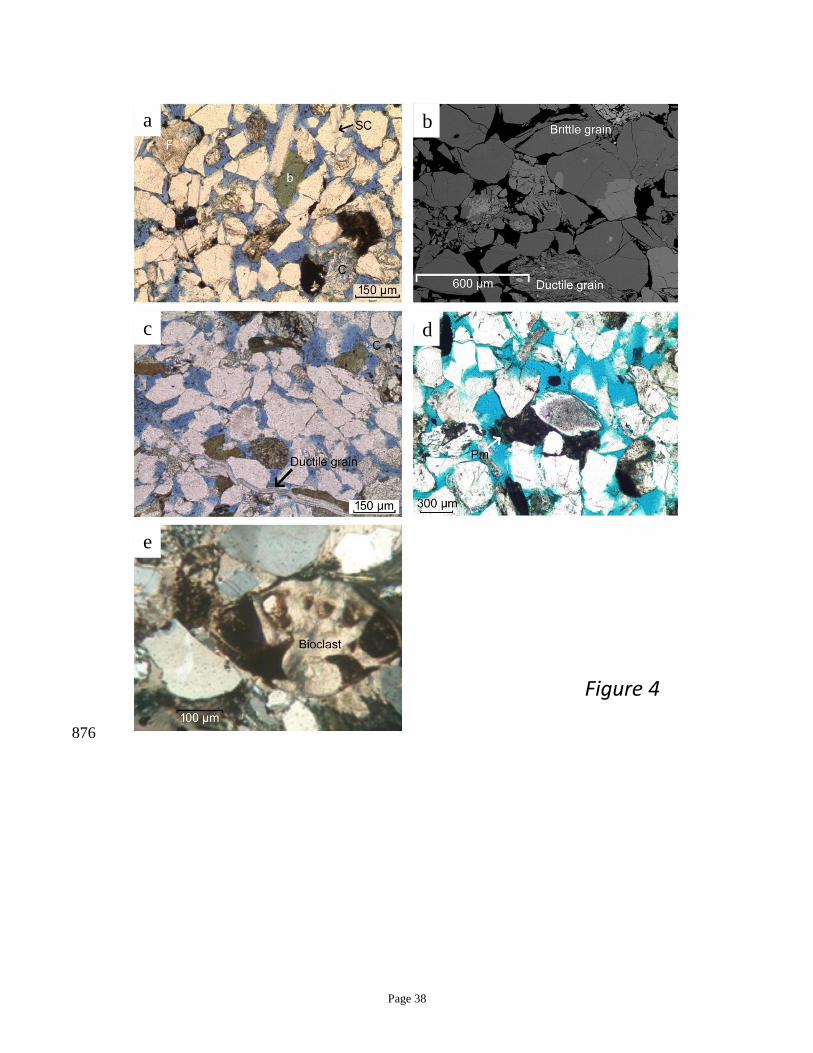
using a mercury UV source to differentiate oil inclusions from aqueous inclusions. 190
Oxygen and carbon isotope analysis from seven calcite-cemented sandstone samples of the Surma 191
Group from the Bengal Basin (wells: JL-2, TT-11, BK-9, SN-1) (see Fig.1) was performed using 192
a MAT 251 isotope ratio mass spectrometer. The precision was ± 0.08 ‰ for oxygen and ± 0.06 193
‰ for carbon. Oxygen and carbon isotope data are presented in the notation relative to the 194
Vienna Pee Dee Belemnite (VPDB) standards. 195
4. Results 196
4.1 Detrital composition and rock fabric 197
The Surma Group sandstones are predominantly fine-grained and moderately sorted, with minor 198
amounts of very fine-grained and very well sorted sandstones. Grain-contacts are dominated by 199
long, concavo-convex surfaces with some sutured contacts (Fig. 4a). Some grains have 200
undergone brittle fracturing while others have undergone ductile compaction as shown by (Fig. 201
4b, c, d). 202
Page 10
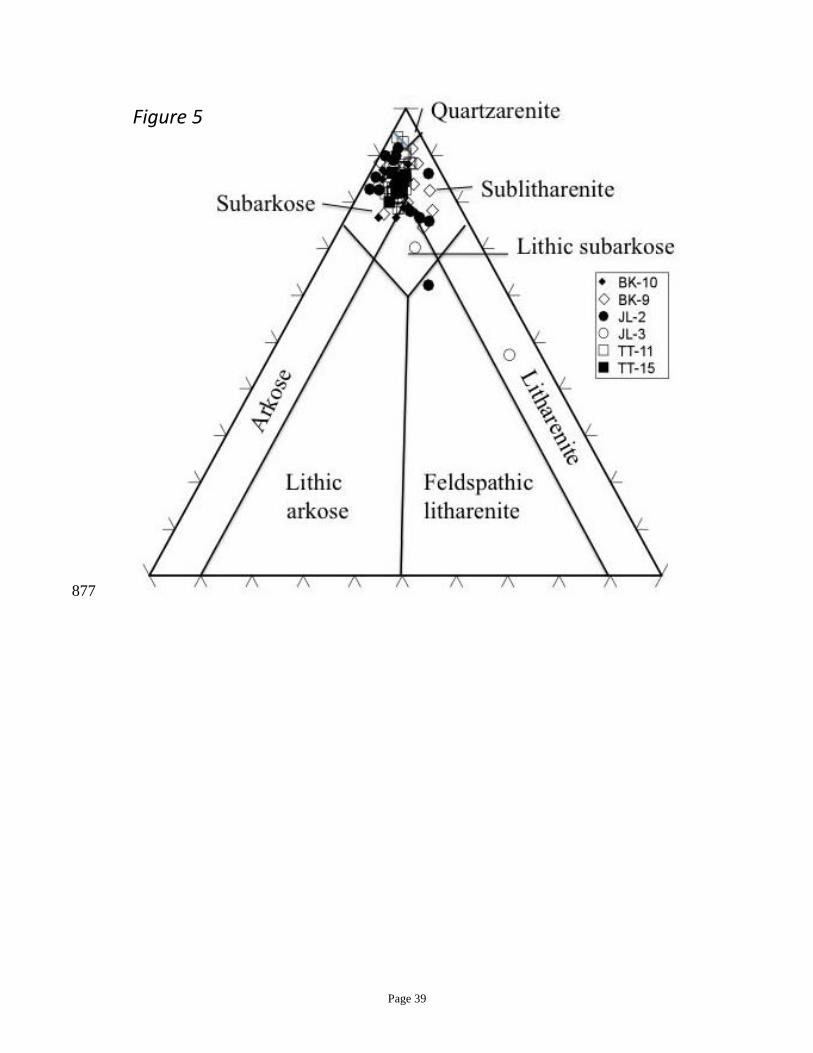
Petrographic compositions of the Surma Group sandstones is reported in Table 2. They are 203
predominantly subarkosic to sublitharenitic in composition (Fig. 5). Intergranular volume (IGV) 204
of the studied sandstones varies from 16 to 46.5 %. Higher values of IGV (32 – 46.5 %) have 205
been observed in sandstones with high porosity and high cement contents (Table 2). Quartz is the 206
most abundant detrital constituent representing 74 % of the detrital grains, on average. 207
Monocrystalline quartz grains dominate the detrital quartz population with an average of 61 %; 208
polycrystalline quartz are a subordinate component at 13 %. Feldspars grains represent an 209
average of 9.9 % of the detrital grains; this is split between K-feldspar (5.0 %) and plagioclase 210
feldspar (4.9 %). Lithic grains represent an average of 8.3 % of the detrital grains and occur as 211
sedimentary, metamorphic and minor volcanic fragments. Metamorphic lithic grains are mainly 212
micaceous phyllite and schist fragments. They are more abundant (5.0 %) than sedimentary lithic 213
grains (2.6 %) which are dominated by shale fragments. Detrital phyllosilicates grains are present 214
with almost equal amount of muscovite and biotite (averages of 3.6 % and 3.8 %, respectively). 215
The lithic fragments are thus dominated by ductile grains. The detrital ductile grains have been 216
deformed by plastic deformation whereas more brittle grains (e.g. quartz, feldspar grains) have 217
undergone fracturing (Fig. 4b). Few carbonate grains and bioclasts (Fig. 4e) have been found. 218
4.2 Diagenetic minerals and cements 219
The main diagenetic minerals in the sandstones are calcite cement and clay mineral cements 220
(chlorite, illite/illite-smectite and kaolin) with subordinate amounts of quartz and K-feldspar 221
overgrowths (Table 2). The diagenetic constituents, in order of abundance, are: calcite, clay 222
minerals, quartz, with only trace amounts of K-feldspar and pyrite. 223
4.2.1 Calcite cement 224
Calcite is the most abundant cement (average 6 %, maximum 37 % of the total sandstone 225
composition). Carbonate bioclasts are present in some samples, providing possible evidence of 226
Page 11
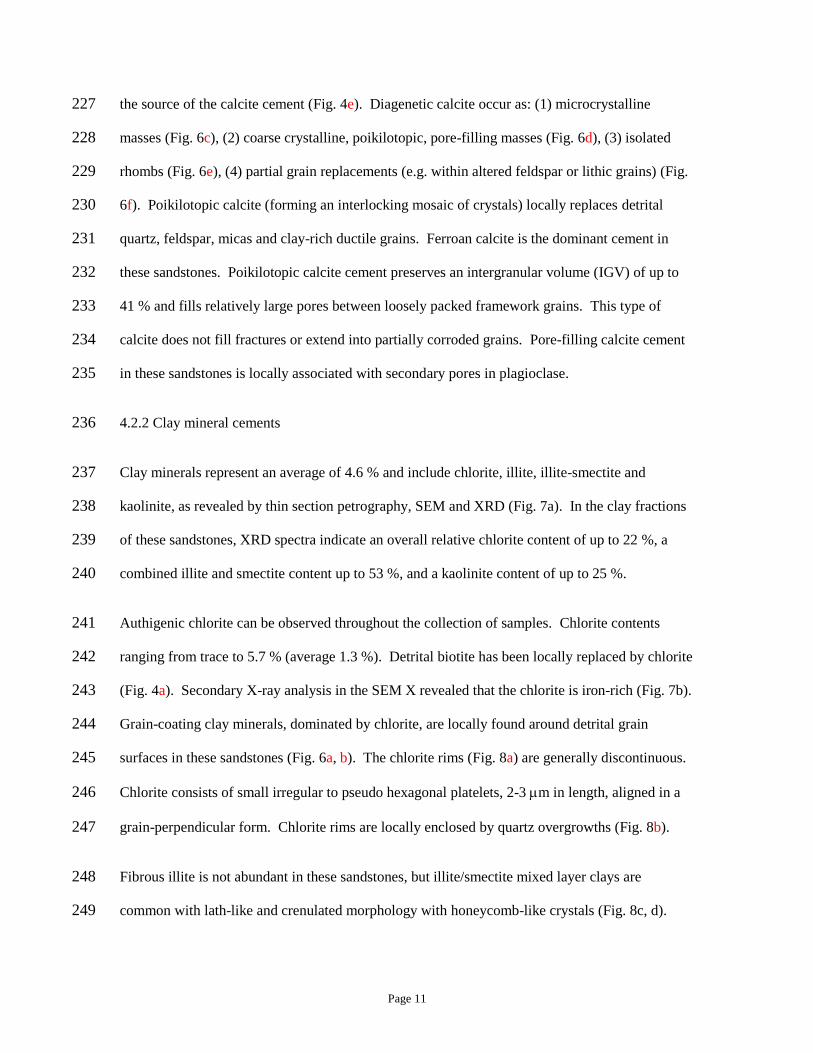
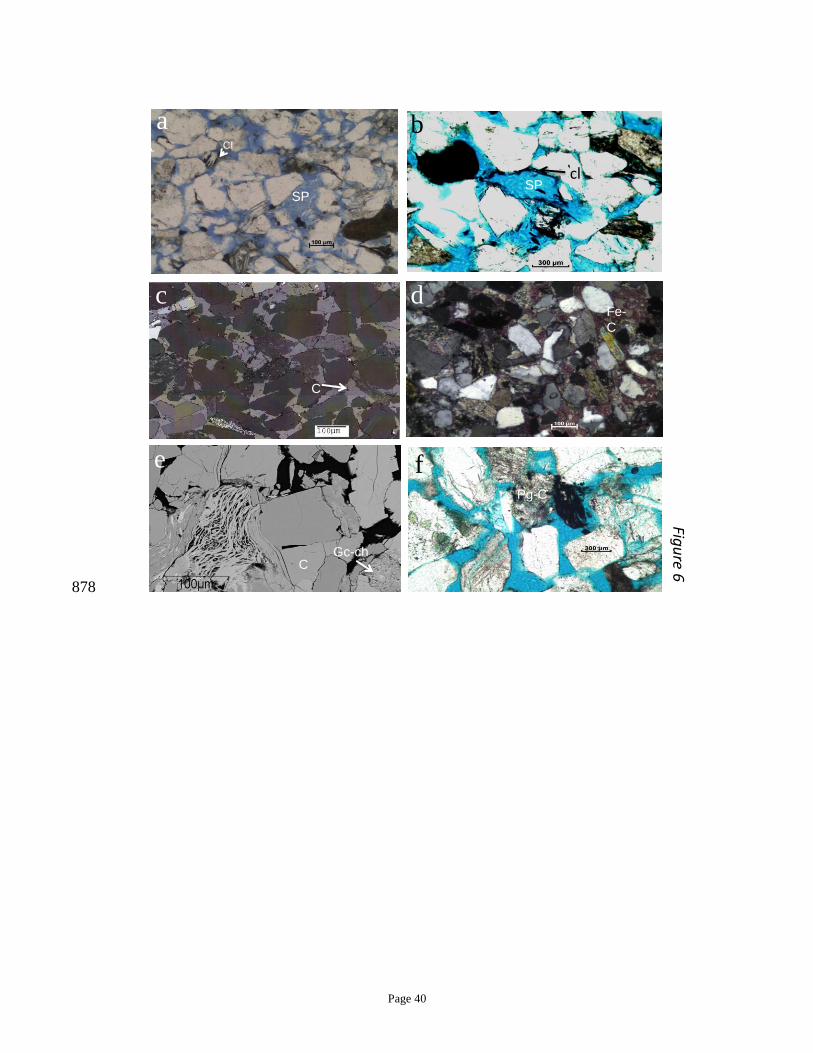
the source of the calcite cement (Fig. 4e). Diagenetic calcite occur as: (1) microcrystalline 227
masses (Fig. 6c), (2) coarse crystalline, poikilotopic, pore-filling masses (Fig. 6d), (3) isolated 228
rhombs (Fig. 6e), (4) partial grain replacements (e.g. within altered feldspar or lithic grains) (Fig. 229
6f). Poikilotopic calcite (forming an interlocking mosaic of crystals) locally replaces detrital 230
quartz, feldspar, micas and clay-rich ductile grains. Ferroan calcite is the dominant cement in 231
these sandstones. Poikilotopic calcite cement preserves an intergranular volume (IGV) of up to 232
41 % and fills relatively large pores between loosely packed framework grains. This type of 233
calcite does not fill fractures or extend into partially corroded grains. Pore-filling calcite cement 234
in these sandstones is locally associated with secondary pores in plagioclase. 235
4.2.2 Clay mineral cements 236
Clay minerals represent an average of 4.6 % and include chlorite, illite, illite-smectite and 237
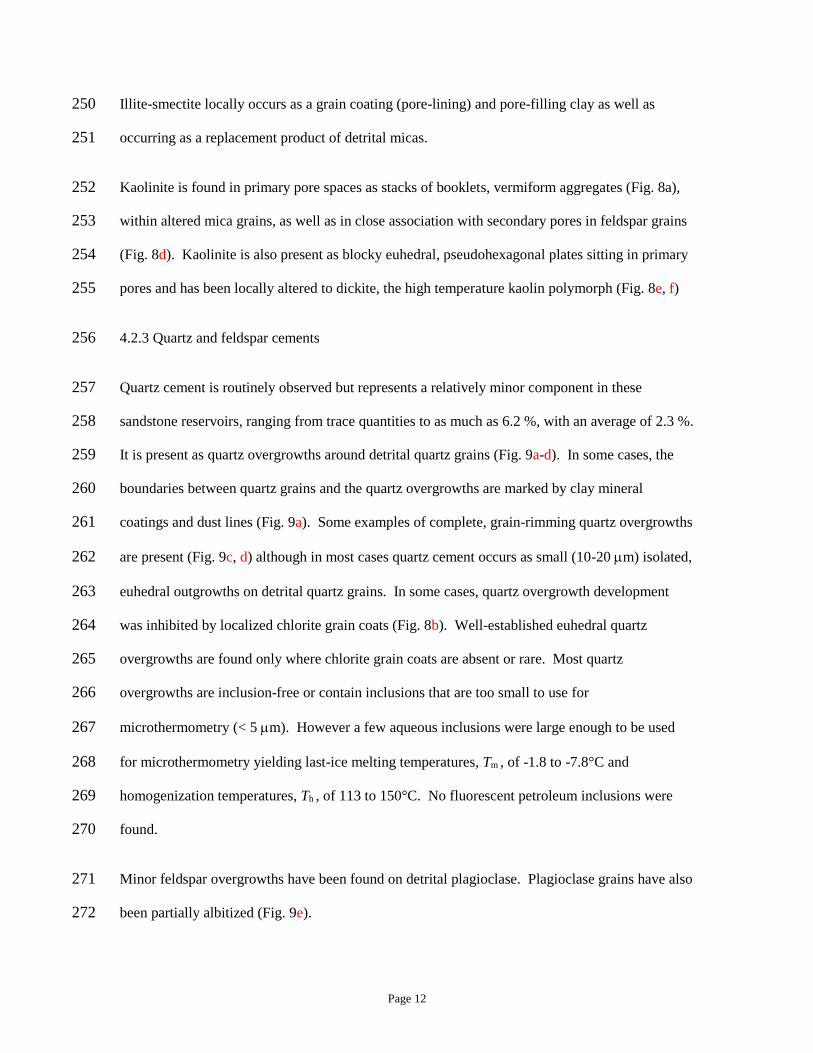
kaolinite, as revealed by thin section petrography, SEM and XRD (Fig. 7a). In the clay fractions 238
of these sandstones, XRD spectra indicate an overall relative chlorite content of up to 22 %, a 239
combined illite and smectite content up to 53 %, and a kaolinite content of up to 25 %. 240
Authigenic chlorite can be observed throughout the collection of samples. Chlorite contents 241
ranging from trace to 5.7 % (average 1.3 %). Detrital biotite has been locally replaced by chlorite 242
(Fig. 4a). Secondary X-ray analysis in the SEM X revealed that the chlorite is iron-rich (Fig. 7b). 243
Grain-coating clay minerals, dominated by chlorite, are locally found around detrital grain 244
surfaces in these sandstones (Fig. 6a, b). The chlorite rims (Fig. 8a) are generally discontinuous. 245
Chlorite consists of small irregular to pseudo hexagonal platelets, 2-3 m in length, aligned in a 246
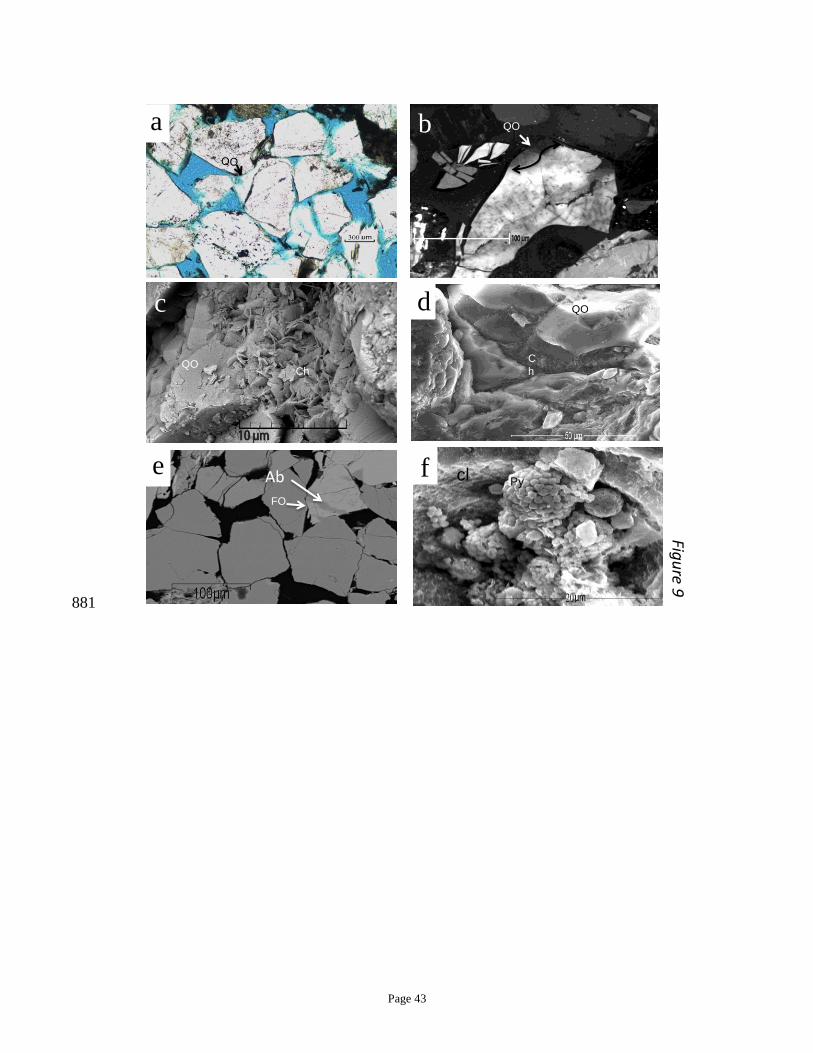
grain-perpendicular form. Chlorite rims are locally enclosed by quartz overgrowths (Fig. 8b). 247
Fibrous illite is not abundant in these sandstones, but illite/smectite mixed layer clays are 248
common with lath-like and crenulated morphology with honeycomb-like crystals (Fig. 8c, d). 249
Page 12
Illite-smectite locally occurs as a grain coating (pore-lining) and pore-filling clay as well as 250
occurring as a replacement product of detrital micas. 251
Kaolinite is found in primary pore spaces as stacks of booklets, vermiform aggregates (Fig. 8a), 252
within altered mica grains, as well as in close association with secondary pores in feldspar grains 253
(Fig. 8d). Kaolinite is also present as blocky euhedral, pseudohexagonal plates sitting in primary 254
pores and has been locally altered to dickite, the high temperature kaolin polymorph (Fig. 8e, f) 255
4.2.3 Quartz and feldspar cements 256
Quartz cement is routinely observed but represents a relatively minor component in these 257
sandstone reservoirs, ranging from trace quantities to as much as 6.2 %, with an average of 2.3 %. 258
It is present as quartz overgrowths around detrital quartz grains (Fig. 9a-d). In some cases, the 259
boundaries between quartz grains and the quartz overgrowths are marked by clay mineral 260
coatings and dust lines (Fig. 9a). Some examples of complete, grain-rimming quartz overgrowths 261
are present (Fig. 9c, d) although in most cases quartz cement occurs as small (10-20 m) isolated, 262
euhedral outgrowths on detrital quartz grains. In some cases, quartz overgrowth development 263
was inhibited by localized chlorite grain coats (Fig. 8b). Well-established euhedral quartz 264
overgrowths are found only where chlorite grain coats are absent or rare. Most quartz 265
overgrowths are inclusion-free or contain inclusions that are too small to use for 266
microthermometry (< 5 m). However a few aqueous inclusions were large enough to be used 267
for microthermometry yielding last-ice melting temperatures, Tm , of -1.8 to -7.8°C and 268
homogenization temperatures, Th , of 113 to 150°C. No fluorescent petroleum inclusions were 269
found. 270
Minor feldspar overgrowths have been found on detrital plagioclase. Plagioclase grains have also 271
been partially albitized (Fig. 9e). 272

Page 13
4.2.4 Pyrite cement 273
Pyrite cement is present as framboidal aggregates as revealed by SEM (Fig. 9f). Pyrite sits within 274
the intergranular pores surrounded by illite/smectite mixed layer clay coated detrital grains. 275
4.3 Stable isotope results 276
Isotopic data from poikilotopic calcite cement are presented in Table 2. 18O values range 277
between 11.7‰ and 6.9 VPDB. Calcite 13C values sit within a range from 18.2‰ to 4.1 to 278
VPDB. Slightly more negative 13C values have been previously reported (Rahman and McCann, 279
2012) from the northeastern part of Bengal Basin (Surma Basin, Fig. 10). 280
4.4 Porosity and Permeability 281
Core analysis porosity ranges from 3 to 28 %; core analysis permeability ranges from 0.15 to 282
1,230 mD (BAPEX, 1996; Islam, 2010). 283
Petrographic microscopy and SEM analysis showed that the sandstones exhibit three different 284
types of porosity: (i) intergranular macroporosity (primary porosity), (ii) secondary porosity and 285
(iii) microporosity associated with clay minerals, that is probably secondary in origin (Fig. 8a-f). 286
The total porosity (primary and secondary) comprises an average 18 % of the rock volume 287
(ranging from 0 to 31 %). Sandstones with high ductile grain contents tend to have lower 288
porosity than those with low ductile grain contents (Fig. 11). Petrographically-defined total 289
porosity tends to decrease with increasing depth of burial with the lowest porosities found at 290
depths > 3000 m (Fig. 11). 291
Petrographically-defined primary porosity has an average value of 14 %, ranging from 0 to 27 %. 292
Secondary porosity has an average of about 4 %, ranging from 0 to 11 %. The development of 293
the majority of the secondary porosity occurred due to the dissolution of detrital feldspar grains 294
Page 14
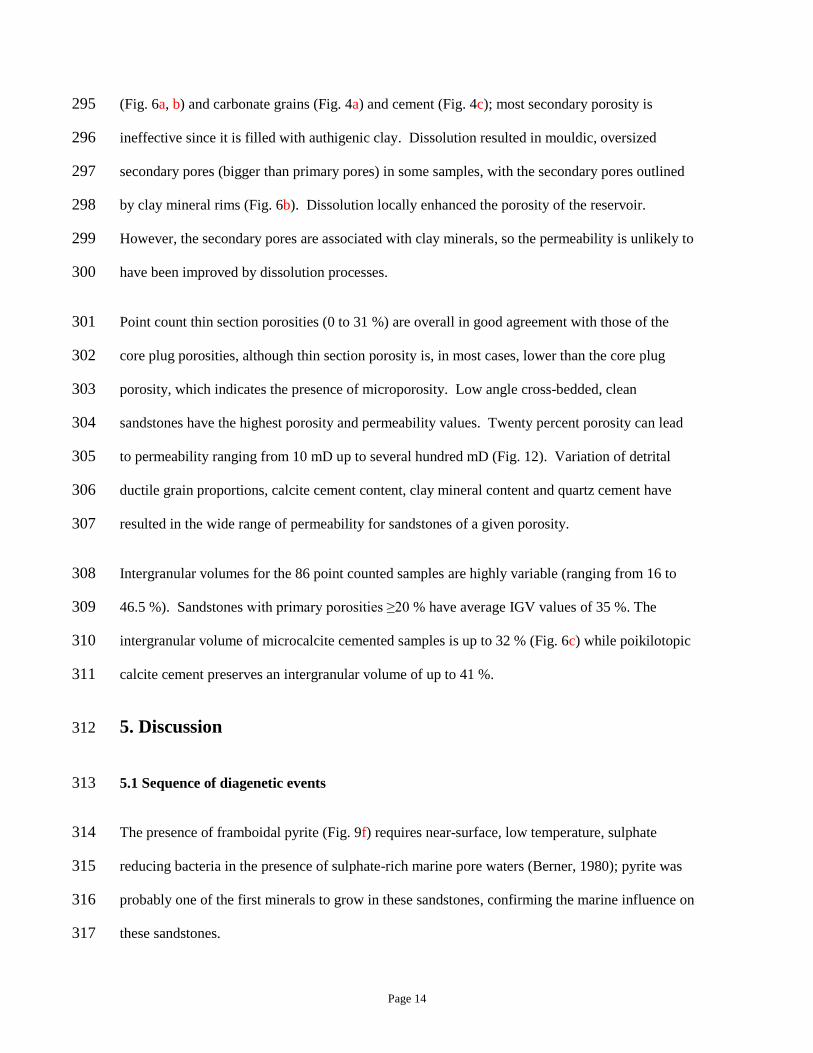
(Fig. 6a, b) and carbonate grains (Fig. 4a) and cement (Fig. 4c); most secondary porosity is 295
ineffective since it is filled with authigenic clay. Dissolution resulted in mouldic, oversized 296
secondary pores (bigger than primary pores) in some samples, with the secondary pores outlined 297
by clay mineral rims (Fig. 6b). Dissolution locally enhanced the porosity of the reservoir. 298
However, the secondary pores are associated with clay minerals, so the permeability is unlikely to 299
have been improved by dissolution processes. 300
Point count thin section porosities (0 to 31 %) are overall in good agreement with those of the 301
core plug porosities, although thin section porosity is, in most cases, lower than the core plug 302
porosity, which indicates the presence of microporosity. Low angle cross-bedded, clean 303
sandstones have the highest porosity and permeability values. Twenty percent porosity can lead 304
to permeability ranging from 10 mD up to several hundred mD (Fig. 12). Variation of detrital 305
ductile grain proportions, calcite cement content, clay mineral content and quartz cement have 306
resulted in the wide range of permeability for sandstones of a given porosity. 307
Intergranular volumes for the 86 point counted samples are highly variable (ranging from 16 to 308
46.5 %). Sandstones with primary porosities ≥20 % have average IGV values of 35 %. The 309
intergranular volume of microcalcite cemented samples is up to 32 % (Fig. 6c) while poikilotopic 310
calcite cement preserves an intergranular volume of up to 41 %. 311
5. Discussion 312
5.1 Sequence of diagenetic events 313
The presence of framboidal pyrite (Fig. 9f) requires near-surface, low temperature, sulphate 314
reducing bacteria in the presence of sulphate-rich marine pore waters (Berner, 1980); pyrite was 315
probably one of the first minerals to grow in these sandstones, confirming the marine influence on 316
these sandstones. 317
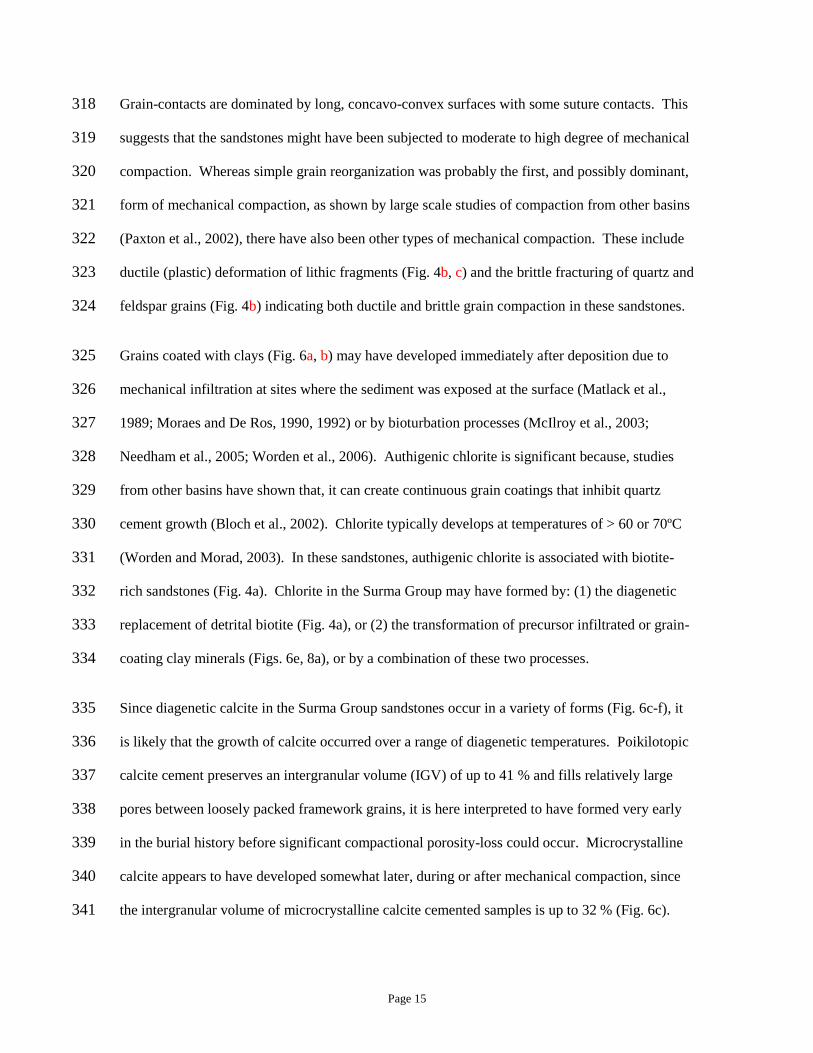
Page 15
Grain-contacts are dominated by long, concavo-convex surfaces with some suture contacts. This 318
suggests that the sandstones might have been subjected to moderate to high degree of mechanical 319
compaction. Whereas simple grain reorganization was probably the first, and possibly dominant, 320
form of mechanical compaction, as shown by large scale studies of compaction from other basins 321
(Paxton et al., 2002), there have also been other types of mechanical compaction. These include 322
ductile (plastic) deformation of lithic fragments (Fig. 4b, c) and the brittle fracturing of quartz and 323
feldspar grains (Fig. 4b) indicating both ductile and brittle grain compaction in these sandstones. 324
Grains coated with clays (Fig. 6a, b) may have developed immediately after deposition due to 325
mechanical infiltration at sites where the sediment was exposed at the surface (Matlack et al., 326
1989; Moraes and De Ros, 1990, 1992) or by bioturbation processes (McIlroy et al., 2003; 327
Needham et al., 2005; Worden et al., 2006). Authigenic chlorite is significant because, studies 328
from other basins have shown that, it can create continuous grain coatings that inhibit quartz 329
cement growth (Bloch et al., 2002). Chlorite typically develops at temperatures of > 60 or 70ºC 330
(Worden and Morad, 2003). In these sandstones, authigenic chlorite is associated with biotite-331
rich sandstones (Fig. 4a). Chlorite in the Surma Group may have formed by: (1) the diagenetic 332
replacement of detrital biotite (Fig. 4a), or (2) the transformation of precursor infiltrated or grain-333
coating clay minerals (Figs. 6e, 8a), or by a combination of these two processes. 334
Since diagenetic calcite in the Surma Group sandstones occur in a variety of forms (Fig. 6c-f), it 335
is likely that the growth of calcite occurred over a range of diagenetic temperatures. Poikilotopic 336
calcite cement preserves an intergranular volume (IGV) of up to 41 % and fills relatively large 337
pores between loosely packed framework grains, it is here interpreted to have formed very early 338
in the burial history before significant compactional porosity-loss could occur. Microcrystalline 339
calcite appears to have developed somewhat later, during or after mechanical compaction, since 340
the intergranular volume of microcrystalline calcite cemented samples is up to 32 % (Fig. 6c). 341
Page 16
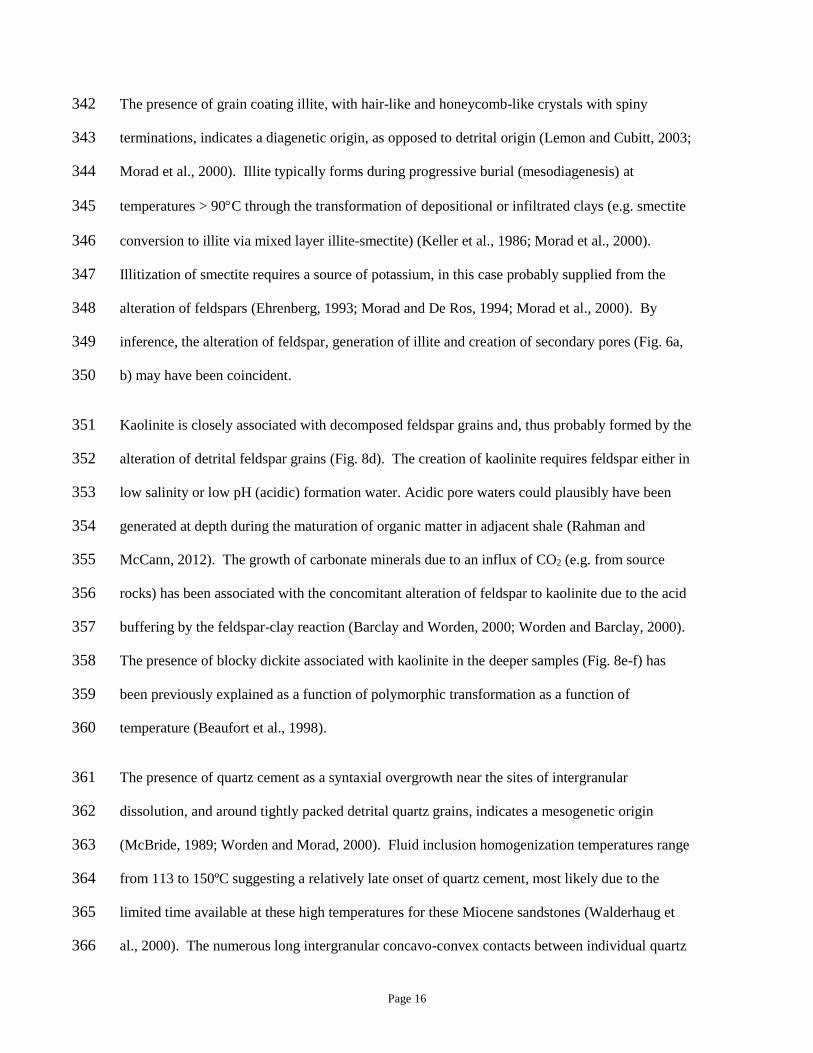
The presence of grain coating illite, with hair-like and honeycomb-like crystals with spiny 342
terminations, indicates a diagenetic origin, as opposed to detrital origin (Lemon and Cubitt, 2003; 343
Morad et al., 2000). Illite typically forms during progressive burial (mesodiagenesis) at 344
temperatures > 90C through the transformation of depositional or infiltrated clays (e.g. smectite 345
conversion to illite via mixed layer illite-smectite) (Keller et al., 1986; Morad et al., 2000). 346
Illitization of smectite requires a source of potassium, in this case probably supplied from the 347
alteration of feldspars (Ehrenberg, 1993; Morad and De Ros, 1994; Morad et al., 2000). By 348
inference, the alteration of feldspar, generation of illite and creation of secondary pores (Fig. 6a, 349
b) may have been coincident. 350
Kaolinite is closely associated with decomposed feldspar grains and, thus probably formed by the 351
alteration of detrital feldspar grains (Fig. 8d). The creation of kaolinite requires feldspar either in 352
low salinity or low pH (acidic) formation water. Acidic pore waters could plausibly have been 353
generated at depth during the maturation of organic matter in adjacent shale (Rahman and 354
McCann, 2012). The growth of carbonate minerals due to an influx of CO2 (e.g. from source 355
rocks) has been associated with the concomitant alteration of feldspar to kaolinite due to the acid 356
buffering by the feldspar-clay reaction (Barclay and Worden, 2000; Worden and Barclay, 2000). 357
The presence of blocky dickite associated with kaolinite in the deeper samples (Fig. 8e-f) has 358
been previously explained as a function of polymorphic transformation as a function of 359
temperature (Beaufort et al., 1998). 360
The presence of quartz cement as a syntaxial overgrowth near the sites of intergranular 361
dissolution, and around tightly packed detrital quartz grains, indicates a mesogenetic origin 362
(McBride, 1989; Worden and Morad, 2000). Fluid inclusion homogenization temperatures range 363
from 113 to 150ºC suggesting a relatively late onset of quartz cement, most likely due to the 364
limited time available at these high temperatures for these Miocene sandstones (Walderhaug et 365
al., 2000). The numerous long intergranular concavo-convex contacts between individual quartz 366
Page 17
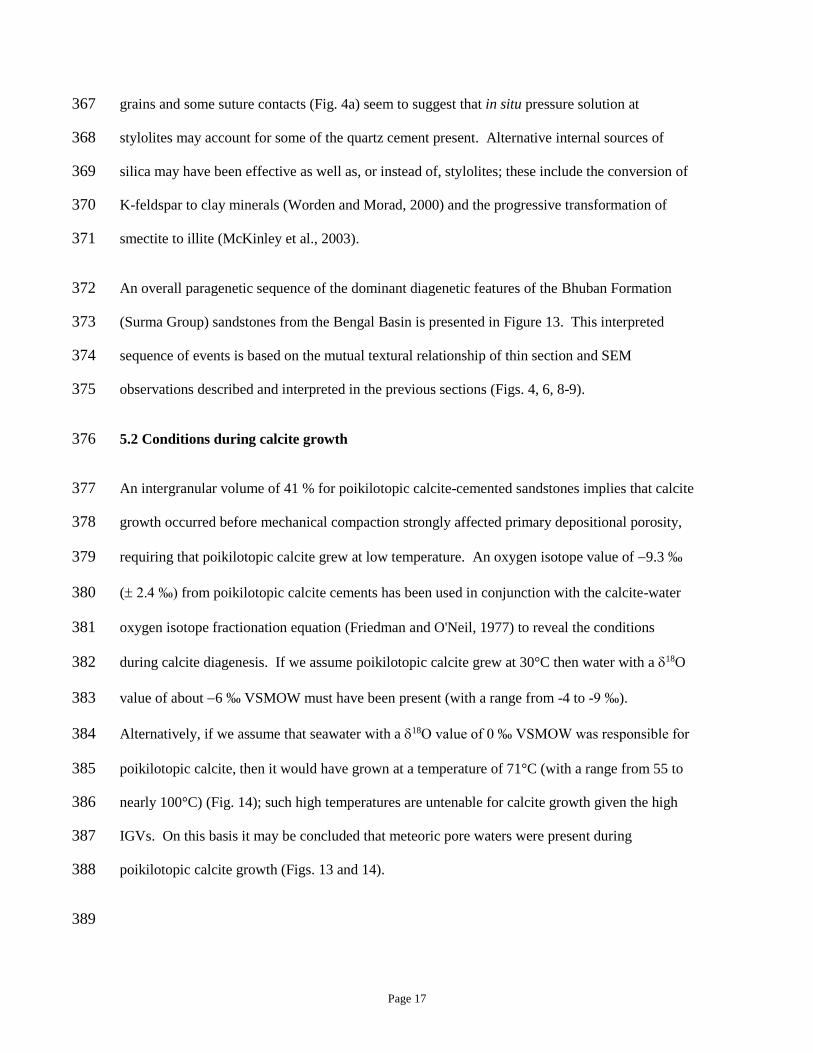
grains and some suture contacts (Fig. 4a) seem to suggest that in situ pressure solution at 367
stylolites may account for some of the quartz cement present. Alternative internal sources of 368
silica may have been effective as well as, or instead of, stylolites; these include the conversion of 369
K-feldspar to clay minerals (Worden and Morad, 2000) and the progressive transformation of 370
smectite to illite (McKinley et al., 2003). 371
An overall paragenetic sequence of the dominant diagenetic features of the Bhuban Formation 372
(Surma Group) sandstones from the Bengal Basin is presented in Figure 13. This interpreted 373
sequence of events is based on the mutual textural relationship of thin section and SEM 374
observations described and interpreted in the previous sections (Figs. 4, 6, 8-9). 375
5.2 Conditions during calcite growth 376
An intergranular volume of 41 % for poikilotopic calcite-cemented sandstones implies that calcite 377
growth occurred before mechanical compaction strongly affected primary depositional porosity, 378
requiring that poikilotopic calcite grew at low temperature. An oxygen isotope value of 9.3 ‰ 379
( 2.4 ‰) from poikilotopic calcite cements has been used in conjunction with the calcite-water 380
oxygen isotope fractionation equation (Friedman and O'Neil, 1977) to reveal the conditions 381
during calcite diagenesis. If we assume poikilotopic calcite grew at 30°C then water with a 18O 382
value of about 6 ‰ VSMOW must have been present (with a range from -4 to -9 ‰). 383
Alternatively, if we assume that seawater with a 18O value of 0 ‰ VSMOW was responsible for 384
poikilotopic calcite, then it would have grown at a temperature of 71°C (with a range from 55 to 385
nearly 100°C) (Fig. 14); such high temperatures are untenable for calcite growth given the high 386
IGVs. On this basis it may be concluded that meteoric pore waters were present during 387
poikilotopic calcite growth (Figs. 13 and 14). 388
389
Page 18
390
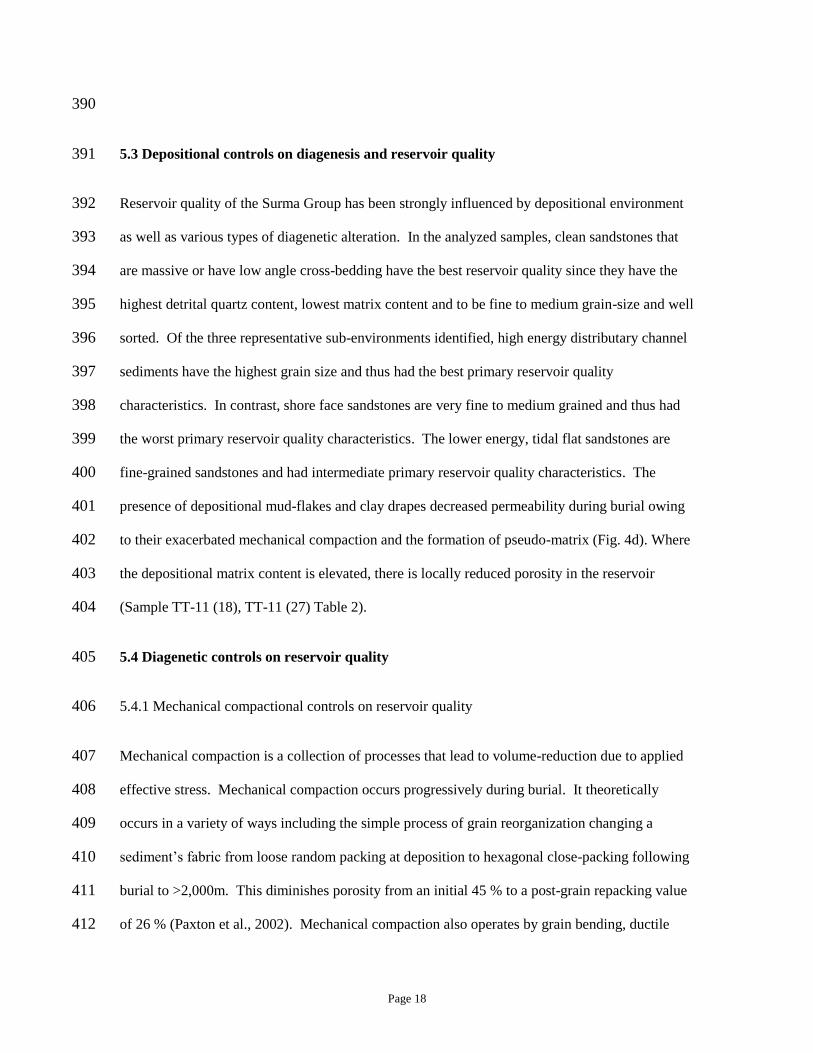
5.3 Depositional controls on diagenesis and reservoir quality 391
Reservoir quality of the Surma Group has been strongly influenced by depositional environment 392
as well as various types of diagenetic alteration. In the analyzed samples, clean sandstones that 393
are massive or have low angle cross-bedding have the best reservoir quality since they have the 394
highest detrital quartz content, lowest matrix content and to be fine to medium grain-size and well 395
sorted. Of the three representative sub-environments identified, high energy distributary channel 396
sediments have the highest grain size and thus had the best primary reservoir quality 397
characteristics. In contrast, shore face sandstones are very fine to medium grained and thus had 398
the worst primary reservoir quality characteristics. The lower energy, tidal flat sandstones are 399
fine-grained sandstones and had intermediate primary reservoir quality characteristics. The 400
presence of depositional mud-flakes and clay drapes decreased permeability during burial owing 401
to their exacerbated mechanical compaction and the formation of pseudo-matrix (Fig. 4d). Where 402
the depositional matrix content is elevated, there is locally reduced porosity in the reservoir 403
(Sample TT-11 (18), TT-11 (27) Table 2). 404
5.4 Diagenetic controls on reservoir quality 405
5.4.1 Mechanical compactional controls on reservoir quality 406
Mechanical compaction is a collection of processes that lead to volume-reduction due to applied 407
effective stress. Mechanical compaction occurs progressively during burial. It theoretically 408
occurs in a variety of ways including the simple process of grain reorganization changing a 409
sediment’s fabric from loose random packing at deposition to hexagonal close-packing following 410
burial to >2,000m. This diminishes porosity from an initial 45 % to a post-grain repacking value 411
of 26 % (Paxton et al., 2002). Mechanical compaction also operates by grain bending, ductile 412
Page 19
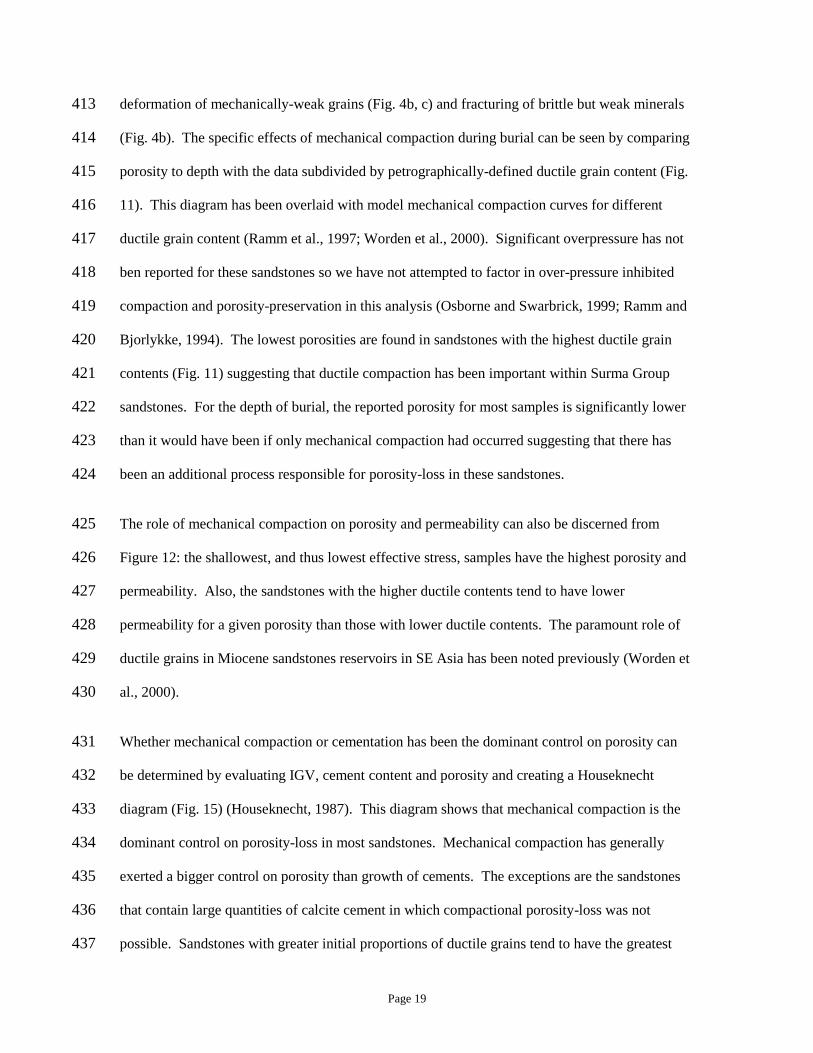
deformation of mechanically-weak grains (Fig. 4b, c) and fracturing of brittle but weak minerals 413
(Fig. 4b). The specific effects of mechanical compaction during burial can be seen by comparing 414
porosity to depth with the data subdivided by petrographically-defined ductile grain content (Fig. 415
11). This diagram has been overlaid with model mechanical compaction curves for different 416
ductile grain content (Ramm et al., 1997; Worden et al., 2000). Significant overpressure has not 417
ben reported for these sandstones so we have not attempted to factor in over-pressure inhibited 418
compaction and porosity-preservation in this analysis (Osborne and Swarbrick, 1999; Ramm and 419
Bjorlykke, 1994). The lowest porosities are found in sandstones with the highest ductile grain 420
contents (Fig. 11) suggesting that ductile compaction has been important within Surma Group 421
sandstones. For the depth of burial, the reported porosity for most samples is significantly lower 422
than it would have been if only mechanical compaction had occurred suggesting that there has 423
been an additional process responsible for porosity-loss in these sandstones. 424
The role of mechanical compaction on porosity and permeability can also be discerned from 425
Figure 12: the shallowest, and thus lowest effective stress, samples have the highest porosity and 426
permeability. Also, the sandstones with the higher ductile contents tend to have lower 427
permeability for a given porosity than those with lower ductile contents. The paramount role of 428
ductile grains in Miocene sandstones reservoirs in SE Asia has been noted previously (Worden et 429
al., 2000). 430
Whether mechanical compaction or cementation has been the dominant control on porosity can 431
be determined by evaluating IGV, cement content and porosity and creating a Houseknecht 432
diagram (Fig. 15) (Houseknecht, 1987). This diagram shows that mechanical compaction is the 433
dominant control on porosity-loss in most sandstones. Mechanical compaction has generally 434
exerted a bigger control on porosity than growth of cements. The exceptions are the sandstones 435
that contain large quantities of calcite cement in which compactional porosity-loss was not 436
possible. Sandstones with greater initial proportions of ductile grains tend to have the greatest 437

Page 20
degree of compactional porosity-loss (Fig. 15), thus confirming the significance of ductile grains 438
deduced from the porosity-permeability plot (Fig. 12). 439
5.4.2 Diagenetic cement controls on reservoir quality 440
The growth of pore-filling cements explains why porosity values are lower than they would be 441
had only mechanical compaction occurred. Poikilotopic calcite cement has locally reduced 442
porosity down to 3 to 7 % and permeability down to < 0.15 mD in some samples (Figs. 13, 16a, 443
b). The 13C VPDB values from calcite cement from the Bengal Basin range between from 18.2 444
to 4.1 ‰ VPDB (Fig. 10; Table 2). This range is extended to 23.1 ‰ to 1.4 ‰ by reference to 445
previous work (Rahman and McCann, 2012). Strongly negative 13C values require an organic 446
source of carbonate while values close to 0 ‰ suggest that there may have been a marine 447
bioclastic source of carbonate (Morad, 1998). Petrographic evidence of bioclasts (Fig. 4e) 448
confirms that values close to 0‰ are the result of bioclastic debris supplying some of the calcite. 449
However, the prevalence of strongly negative calcite 13C values suggests that much carbonate 450
was derived from the breakdown of organic matter supplied as CO2, possibly from early source 451
rock maturation or resulting from biogenic sources during intermediate burial (Irwin et al., 1977). 452
Organic sources of CO2 still require a source of calcium to allow calcite to grow. Since pore-453
filling calcite cement is locally associated with secondary pores in plagioclase (Fig. 6f), this leads 454
to the conclusion that calcic-feldspar breakdown may be at least partly responsible for calcite 455
growth. Petroleum systems are typically flooded with source rock-derived CO2 before the main 456
phase of oil generation and the CO2 may also have induced alteration of the feldspars by 457
dissociation in water leading to carbonic acid formation (Barclay and Worden, 2000; Worden and 458
Barclay, 2000). We have not detected a role for oil emplacement on calcite cement abundance: 459
i.e we have not found any evidence of inhibition of calcite cement due to the emplacement of oil 460
(De Souza and Silva, 1998). This may be due to the fact that calcite grew early either due to 461
Page 21
bioclast dissolution (Fig. 4f) or due to a pre-oil emplacement flux of source-rock derived CO2 462
(Fig. 10). 463
Clay minerals represent the second most volumetrically significant group of pore-filling cements 464
that affect porosity and permeability (Figs. 8, 16c and d). Pore-filling illite-smectite (Figs. 7 and 465
8c) slightly reduces porosity, but based on precedents from other basins, has a dramatic effect on 466
permeability (McKinley et al., 2003; Worden and Morad, 2003). Authigenic kaolinite locally 467
occludes pore spaces although much of it seems to have replaced feldspars and has resulted in 468
redistributional secondary micro-porosity (Giles and Deboer, 1990) (Figs. 7 and 8a, f, e). The 469
poikilotopic calcite oxygen and carbon isotope data have been interpreted to suggest that meteoric 470
water influx combined with organic-derived CO2 were important during diagenesis (Figs. 10 and 471
14). An influx of low salinity water and CO2 are conducive to the conversion of feldspars to clay 472
minerals cation-rich smectite into higher temperature clays such as kaolinite and illite. Thus the 473
conditions that resulted in poikilotopic calcite growth may also have led to silicate diagenetic 474
reactions. The silicate reactions act as a pH buffer for the hydrogen ions that result from CO2 475
dissolution and dissociation followed by calcite precipitation: 476
CO2 dissolution and dissociation: CO2 + H2O HCO3- + H+ (R1) 477
Calcite precipitation: HCO3- + Ca2+ CaCO3 + H+ (R2) 478
K-feldspar alteration to illite: 3KAlSi3O8 + 2H+ KAl3Si3O10(OH)2 + 2K+ + 6SiO2 (R3) 479
Plagioclase alteration to kaolinite: CaAl2Si2O8 + 2H+ Al2Si2O5(OH)2 + Ca+2+ (R4) 480
Both of the feldspar replacement reactions (R3 and R4) buffer the pH (use up hydrogen ions) and 481
allow reactions R1 and R2 to continue. Thus feldspar alteration, clay growth and carbonate growth 482
may all be genetically connected. 483
Small amounts of quartz cement (average of 2.3%) have been found in the Surma Group (Figs. 9a 484
- d) showing that quartz cement has played only a minor role in reducing porosity and 485
Page 22
permeability. The relatively small volume of quartz cement in these sandstones can be attributed 486
to a number of factors: (i) the limited amount of time spent above the critical onset temperature of 487
80C (Walderhaug et al., 2000), (2) the presence of grain coating clay (Dowey et al., 2012; 488
Worden and Morad, 2003) and possibly (3) the limited amount of residual water in these gas-489
charged sandstones that is available to facilitate water-rock interaction (Worden et al., 1998). 490
There is an inverse relationship between the amount of chlorite and the amount of authigenic 491
quartz (Figs. 8b, 17). Chlorite grain coats may therefore have inhibited quartz cement and helped 492
to preserve porosity, a phenomenon that has been reported in many basins around the world 493
(Dowey et al., 2012). 494
5.5 Comparison of the Surma Group to other Miocene sandstones at 2,300 to 3,200m 495
Miocene sandstones at buried to greater 2,000 m have been assessed for reservoir quality and 496
diagenesis in several petroliferous basins around the world including those in SE Asia, Gulf of 497
Mexico, Central Europe and California. They have several features in common that result from 498
the rapid accumulation of sediment. 499
Mechanical compactional processes, especially ductile compaction, play a paramount role in 500
controlling reservoir quality in many Miocene reservoirs, as well as the Surma Group sandstones 501
discussed here. The rapid supply of mineralogically immature sediment, with an innate tendency 502
to undergo ductile compaction, is important for Miocene sediments in parts of the Gulf of Mexico 503
(Dutton et al., 2012), SE Asia (Worden et al., 2000) and Central Europe (Gier et al., 2008). The 504
high rate of Miocene sediment accumulation, e.g. ten times that responsible for the accumulation 505
and burial of the Brent Group in the North Sea, (Giles et al., 1992), suggests that there will have 506
been limited time for the supplied sediment to become cleaned-up during transport from the 507
hinterland to the site of final accumulation. 508

Page 23
Similar to the Surma Group sandstones in the Bengal Basin, the important role of calcite cement, 509
with a lesser role or dolomite cement, is a common to most Miocene sandstones in SE Asia, Gulf 510
of Mexico, Central Europe and California (Ali, 1995; Boles and Ramseyer, 1987; Dutton et al., 511
2012; Fayek et al., 2001; Gier et al., 2008). Where isotope studies have been undertaken (Ali, 512
1995; Fayek et al., 2001), the carbonate cements were, like the Surma Group calcite cements, 513
interpreted to be a result of a combination of marine (presumably bioclastic) sources and various 514
organic sources. 515
Alteration of plagioclase grains is endemic to Miocene sandstones, and not just those in the 516
Surma Group (Boles and Ramseyer, 1987; Dutton et al., 2012; Gier et al., 2008; Hirt et al., 1993). 517
Also similar to the Surma Group, clay minerals in these sandstones typically represent a 518
collection of depositional (smectite-illite) and early diagenetic (kaolinite) clays that have yet to 519
achieve the illite-dominated characteristics typical of older sandstones at about 3,000m (and 520
>100C) burial 521
Quartz cement is routinely present in Miocene sediments buried to the 2,300 to 3,200 m (85 to 522
115C) found in the Surma Group sandstones in this study, but it is usually present in smaller 523
amounts than would be expected in Mesozoic sandstones at this depth (temperature) range. 524
Compared to the Surma Group sandstones, quartz cement was found in similar quantities in 525
Miocene sandstones at similar depths in Central Europe (Gier et al., 2008) and SE Asia (Worden 526
et al., 2000). At significantly greater depths of burial (and higher temperatures), rather more 527
quartz cement is typically found in Miocene sandstones (Dutton et al., 2012; Worden et al., 2000) 528
although porosity is typically higher than might be expected than for Mesozoic sandstones. The 529
lack of quartz cement at >100C in Miocene sandstones has been attributed to the lack of time 530
available to grow quartz cement (Gier et al., 2008). 531
532

Page 24
533
6. Conclusions 534
1) The Miocene Surma Group in the Bengal Basin, buried to 2300 m and 3200 m, contains sub-535
arkosic to sub-litharenitic, tide-dominated, deltaic sandstones. 536
2) The main reservoir quality control in these young, but relatively deeply buried, sandstones is 537
mechanical compaction. Depth of burial and the detrital ductile grain content had important 538
controls on the extent of mechanical compaction. Lithic ductile-rich sandstones have 539
undergone more compaction than ductile-poor sandstones. 540
3) Cement growth was less important than mechanical compaction in these sandstones, but 541
poikilotopic calcite is the main diagenetic cement. This calcite grew (or dissolved and then 542
reprecipitated) in meteoric water at relatively low temperature . Calcite cement was derived 543
from a combination of marine bioclastic grains and organic CO2 sources, such as biogenic 544
breakdown or early thermal maturation. 545
4) Partly illitized smectite occurs in these sandstones and, where present, it locally blocks pore 546
throats. Small amounts of kaolinite occurs as a partial replacement of feldspar grains. Fe-547
rich chlorite locally coats sand grains. 548
5) Quartz cement is not particularly important in these Miocene sandstones even though burial 549
temperatures have reached >100C; this is probably due to a combination of the limited time 550
at elevated temperatures and the presence of grain-coating chlorite. 551
6) Reservoir quality in the Miocene Surma Group sandstones is predominantly limited by 552
sediment supply (controlling ductile grain and clay mineral contents), depositional 553
environment (influencing bioclast and clay mineral contents) and burial history (largely 554
controlling the thermal stress). 555

Page 25
7) Good reservoir quality sandstones, with high porosities (20 % to 30 %) and permeabilities (34 556
to 1230 mD), have been observed at a range of depths (2300 m and 3200 m in Surma Group 557
sandstones in the Bengal Basin. The best reservoir quality sandstones are fine to medium 558
grained and show good sorting, have a low primary ductile grain content and a small amount 559
of calcite cement (i.e. low primary bioclasts content). 560
8) Good reservoir quality sandstones are not uniformly distributed and instead are locally 561
compartmentalized by poorly sorted and tightly compacted, ductile-rich sandstones, and 562
sandstones with extensive cementation (poikilotopic calcite in particular) having porosity (3 - 563
7 %) and permeability (0.15 – 1.4mD). 564
565
Acknowledgements 566
First author would like to thank Commonwealth Scholarship Commission (CSC) United 567
Kingdom for granting a Commonwealth Academic Fellowship (2012) to carry out this research 568
project. This work was partly sponsored by Alexander von Humboldt Foundation (AvH), 569
Germany. We are grateful to BAPEX (Bangladesh Petroleum Exploration and Production 570
Company) for giving permission to analyze core samples. We are thankful to Prof. Dr. Andreas 571
Mackensen, Alfred Wegener Institute, Germany and Dr Steve Crowley, stable isotope laboratory 572
of Earth and Ocean Sciences of University of Liverpool, UK for isotope analysis. 573
Page 26
Figure captions 574
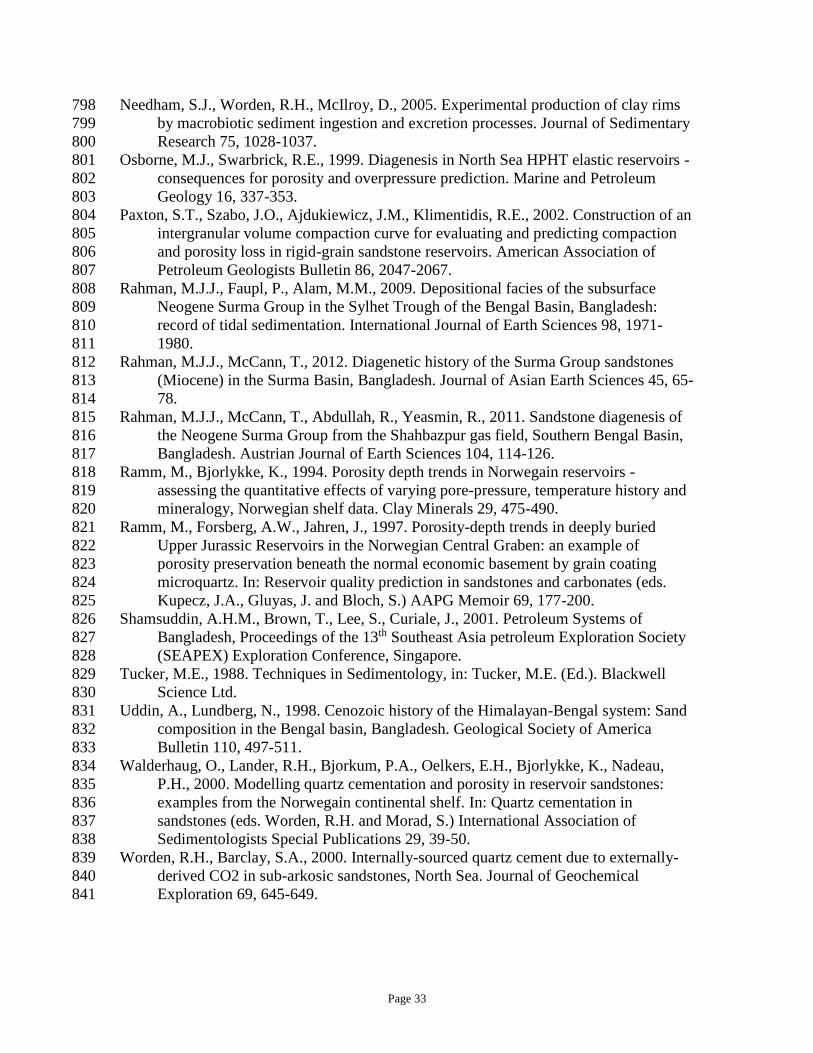
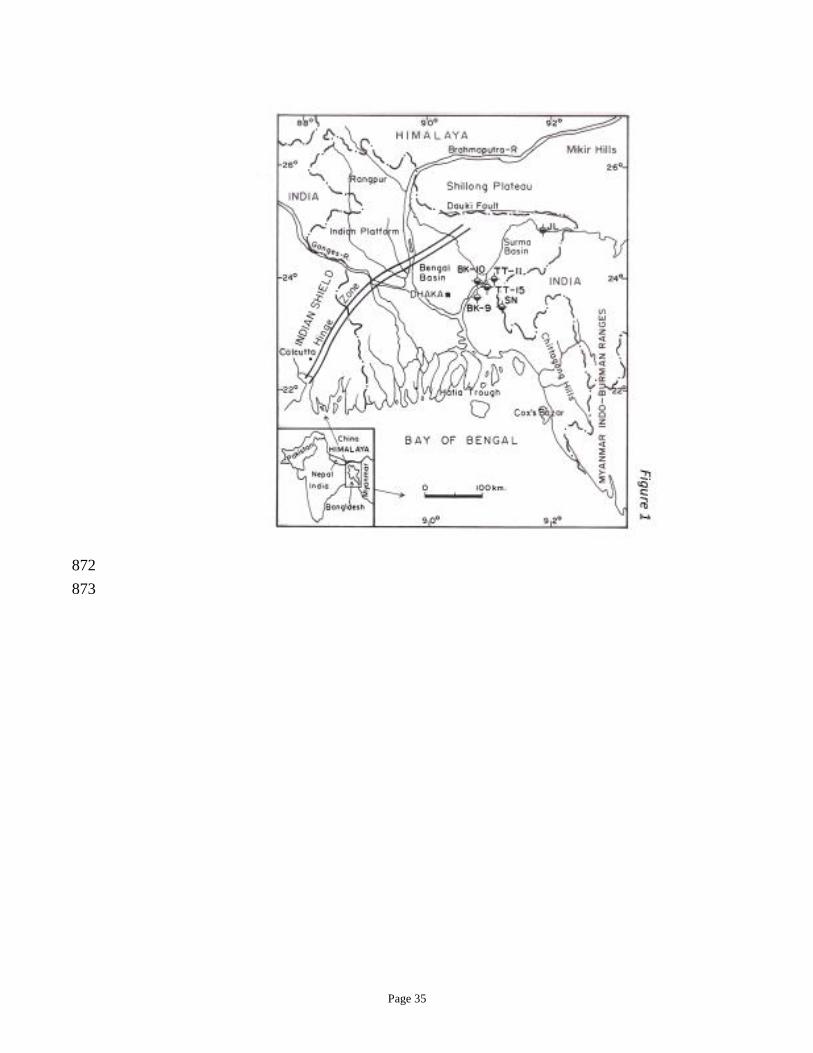
Figure 1. Major tectonic elements of the Bengal Basin (Alam et al., 2003; Alam and Curray, 575
2003) and locations of the petroleum exploration wells: BK-9 (Bakhrabad-9-Meghna Gas 576
Field) BK-10 (Bakhrabad-10-Narshingdi Gas Field), JL-Jalalabad, SN-SaldaNadi, TT-11 577
(Titas-11 of the Titas Gas Field), TT-15 (Titas-15 of the Titas Gas Field) 578
Figure 2. Lithofacies of the Surma Group (SG) encountered in BK-9 (Meghna), BK-10 579
(Narshingdi), TT-11 (Titas-11) and TT-15 (Titas-15) wells. sample location 580
Figure 3. Burial history diagrams of: (a) Bakhrabad area (BAPEX, 1996) where BK-9 581
(Bakhrabad-9 of the Meghna Gas Field) and BK-10 (Bakhrabad-10 of the Narshingdi Gas 582
Field) wells are situated; (b) Titas Gas Field (Islam, 2009), in the Bengal Basin. 583
Figure 4. a. Photomicrograph showing long intergranular concavo-convex contacts between 584
individual quartz grains and some suture contacts (sc), biotite (b) being altered to chlorite, 585
partly dissolved carbonate grain (c) and feldspar (F), depth 2698.4 m, well TT-11 (Titas); 586
b. BSE image showing brittle- and ductile-grain compaction, depth 2473 m, well JL-3 587
(Jalalabad-3); c. deformed ductile grain (mica) occluding pore space and isolating 588
remaining pore space as it extruded between rigid grains, depth 2307.9 m, well BK-9 589
(Meghna); d. Pseudomatrix (Pm) formed due to mechanical compaction of clay clasts; e. 590
Bioclast contributing carbonate cement generation, depth 2709.4 m, well TT-11 (Titas) 591
Figure 5. Modal composition and classification of the Surma Group sandstones in the Bengal 592
Basin. The fields are from McBride (1963). For symbol explanation, see Figure 1. 593
Figure 6. Photomicrographs of sandstones showing: (a) Infiltrated clay minerals (Cl), partial to 594
almost completely dissolved plagioclase resulting secondary porosity (SP), BK-9 well 595
(Meghna) at depths 2308.5 and 2317.7 m; (b) mouldic secondary porosity (SP) with clay-596
Page 27
mineral rim -depth 2597 m, JL-2 (Jalalabad); (c) BSE image showing poikilotopic pore-597
filling intermediate calcite-depth 2789.9 m, well TT-11 (Titas); (d) Photomicrographs 598
showing Poikilotopic pore-filling early calcite cement (Fe-C, Fe-calcite) - depth 2307 m, 599
well BK-9 -2 (Meghna); (e) BSE image of isolated pore-filling late carbonate cement, 600
depth 2659 m, well JL-2 (Jalalabad); (f) Isolate late carbonate cement associated with 601
plagioclase dissolution (Pg-C)- depth 2588 m, well JL-2 (Jalalabad). 602
Figure 7. (a) XRD spectra (glycolated) of clay separate of sandstone at depth 2597 m, Jalalabad. 603
(b) Characteristic energy dispersive secondary X-ray spectra of chlorite. 604
Figure 8. Scanning electron micrographs of sandstones showing: (a) BSE image of microporous 605
vermiform kaolinite aggregates (K), thin chlorite rim (Ch), grain coating chlorite (gc-ch) 606
depth 2608 m, well Jalalabad-2; (b) Platelets of authigenic chlorite (Ch) that retards quartz 607
overgrowth (QO), depth 2307.9 m, well BK-9 (Meghna); (c) Pore filling Illite-smectite (Ill-608
sm), depth 2923.3 m, well BK-10 (Narshingdi); (d) BSE image of pore filling illite-609
smectite (Ill-sm), kaolinite (K) and dissolved feldspar (F), depth 2603 m, well JL-2 610
(Jalalabad); (e) Pore-filling kaolinite (kaolinite, K, dickite, D; depth 3175.1 m, well BK-10 611
(Narshingdi); (f) enlarged view of pore-filling kaolinite in Fig. 8e. 612
Figure 9. (a) Photomicrograph of sandstone showing quartz overgrowth occluding pore throats, 613
depth 2588 m, well JL-2 (Jalalabad); (b to d) Scanning electron micrographs of sandstones 614
showing: b. SEM-CL image of quartz cement partially narrowing pore throat, depth 2608 615
m, well JL-2 (Jalalabad); c. Interlocking quartz cement (QO) reducing pore throat), depth 616
2989.9 m, well TT-11 (Titas); d. Well developed quartz overgrowth (QO) hindering 617
chlorite (Ch) development, depth 3131.3 m, well TT-15 (Titas); e. BSE image showing 618
feldspar overgrowth on plagioclase, depth 2659 m, well JL-2 (Jalalabad); f. Framboidal 619
aggregates of pyrite, depth 3135 m, well TT-15 (Titas-15). 620
Page 28
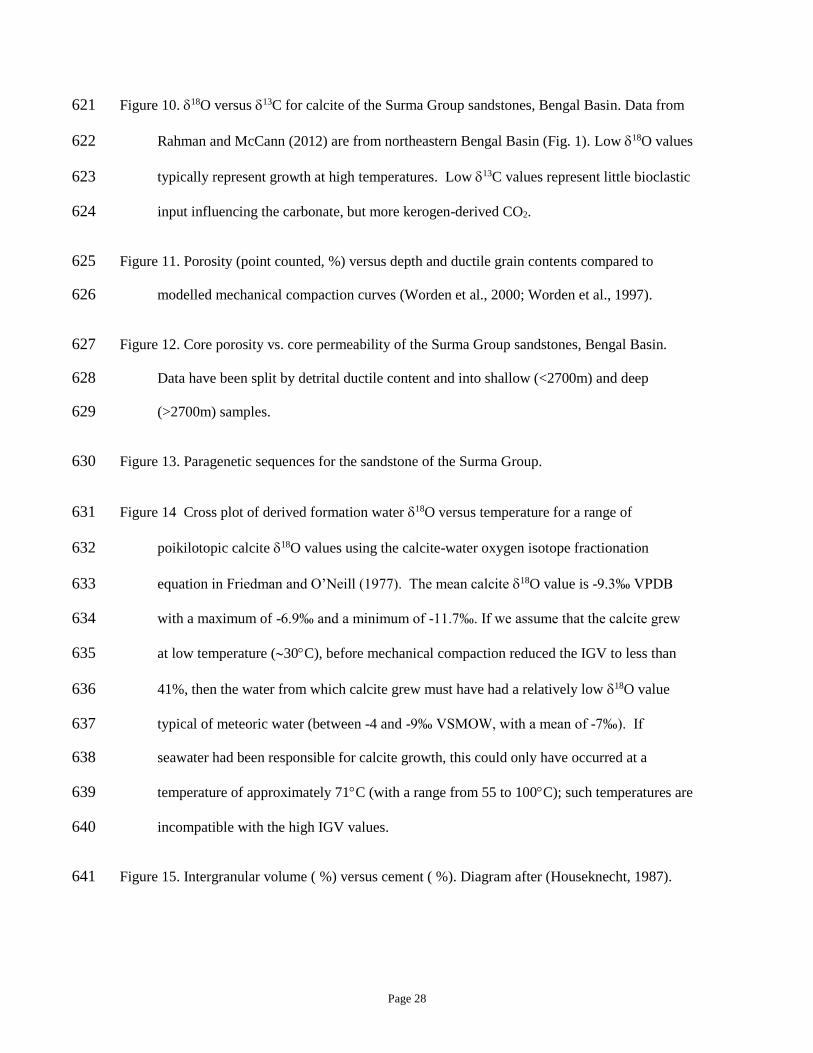
Figure 10. 18O versus 13C for calcite of the Surma Group sandstones, Bengal Basin. Data from 621
Rahman and McCann (2012) are from northeastern Bengal Basin (Fig. 1). Low 18O values 622
typically represent growth at high temperatures. Low 13C values represent little bioclastic 623
input influencing the carbonate, but more kerogen-derived CO2. 624
Figure 11. Porosity (point counted, %) versus depth and ductile grain contents compared to 625
modelled mechanical compaction curves (Worden et al., 2000; Worden et al., 1997). 626
Figure 12. Core porosity vs. core permeability of the Surma Group sandstones, Bengal Basin. 627
Data have been split by detrital ductile content and into shallow (<2700m) and deep 628
(>2700m) samples. 629
Figure 13. Paragenetic sequences for the sandstone of the Surma Group. 630
Figure 14 Cross plot of derived formation water 18O versus temperature for a range of 631
poikilotopic calcite 18O values using the calcite-water oxygen isotope fractionation 632
equation in Friedman and O’Neill (1977). The mean calcite 18O value is -9.3‰ VPDB 633
with a maximum of -6.9‰ and a minimum of -11.7‰. If we assume that the calcite grew 634
at low temperature (30C), before mechanical compaction reduced the IGV to less than 635
41%, then the water from which calcite grew must have had a relatively low 18O value 636
typical of meteoric water (between -4 and -9‰ VSMOW, with a mean of -7‰). If 637
seawater had been responsible for calcite growth, this could only have occurred at a 638
temperature of approximately 71C (with a range from 55 to 100C); such temperatures are 639
incompatible with the high IGV values. 640
Figure 15. Intergranular volume ( %) versus cement ( %). Diagram after (Houseknecht, 1987). 641

Page 29
Figure 16. Core porosity-permeability controls: (a) Porosity versus calcite cement, (b) 642
Permeability versus calcite cement, (c) Porosity versus clay mineral cement, (d) 643
Permeability versus clay mineral cement, (e) Porosity versus quartz cement, (f) 644
Permeability versus quartz cement. 645
Figure 17. Relationship between petrographically-determined authigenic chlorite and quartz 646
cement split be present day (maximum) depth of burial. Quartz cement is only present at > 647
4 % when chlorite is present at < 2 %. The maximum amount of quartz cement increases 648
in more deeply buried (i.e. hotter) samples. 649
650
Table caption 651
652
Table 1 Stratigraphic succession of the Bengal Basin (after Rahman and McCann, 2012). 653
654
Table 2 Petrographic and stable-isotope composition, as well as porosity-permeability values for 655
the 85 analysed sandstone samples encountered in seven petroleum exploration wells (JL-2-656
Jalalabad 2, JL-3-Jalalabad 3, BK-9-Bakhrabad 9, BK-10-Bakhrabad 10, SN-1). The Gazzi-657
Dickinson method was used for point counting (Dickinson, 1985; Dickinson and Suczek, 1979). 658
Only calcite-cement content and isotope values are given for sandstone of the Salda Nadi well. 659
IGV: intergranular volume 660
661
Page 30
References 662
663
Alam, M., 1989. Geology and depositional history of Cenozoic sediments of the Bengal 664
Basin, Bangladesh. Palaeogeography Palaeoclimatology Palaeoecology 69, 125-665
139. 666
Alam, M., Alam, M.M., Curray, J.R., Chowdhury, A.L.R., Gani, M.R., 2003. An 667
overview of the sedimentary geology of the Bengal Basin in relation to the regional 668
tectonic framework and basin-fill history. Sedimentary Geology 155, 179-208. 669
Alam, M.M., 1995. Tide-dominated sedimentation in the Upper Tertiary succession of 670
the Sitapahar Anticline, Bangladesh, in: Flemming, C.G., Bortholma, A. (Eds.), 671
Tidal signatures in modern and ancient sediments. International Association of 672
Sedimentologists, Special Publication. Blackwells, Oxford, pp. 329-341. 673
Alam, M.M., Curray, J.R., 2003. The curtain goes up on a sedimentary basin in south-674
central Asia: unveiling the sedimentary geology of the Bengal Basin of Bangladesh 675
- Special Issue. Sedimentary Geology 155, 175-178. 676
Ali, M.Y., 1995. Carbonate cement stratigraphy and timing of diagenesis in a Miocene 677
mixed carbonate-clastic sequence, offshore Sabah, Malaysia - constraints from 678
catholuminescence, geochemistry, and isotope studies. Sedimentary Geology 99, 679
191-214. 680
BAPEX, 1996. Petroleum geology of Bangladesh, Core Laboratory Report. Bangladesh 681
Petroleum Exploration & Production Co. Ltd, Dhaka, p. 139. 682
Barclay, S.A., Worden, R.H., 2000. Geochemical modelling of diagenetic reactions in a 683
sub-arkosic sandstone. Clay Minerals 35, 57-67. 684
Beaufort, D., Cassagnabere, A., Petit, S., Lanson, B., Berger, G., Lacharpagne, J.C., 685
Johansen, H., 1998. Kaolinite-to-dickite reaction in sandstone reservoirs. Clay 686
Minerals 33, 297-316. 687
Berner, R.A., 1980. Early diagenesis, a theoretical approach. Princeton University Press, 688
Princeton. 689
Bloch, S., Lander, R.H., Bonnell, L., 2002. Anomalously high porosity and permeability 690
in deeply buried sandstone reservoirs: Origin and predictability. American 691
Association of Petroleum Geologists Bulletin 86, 301-328. 692
Boles, J.R., Ramseyer, K., 1987. Diagenetic carbonate in Miocene sandstone reservoir, 693
San Joaquin basin, California. American Association of Petroleum Geologists 694
Bulletin 71, 1475-1487. 695
De Souza, R.S., Silva, D.A., 1998. Origin and timing of carbonate cementation of the 696
Namorado Sandstones (Cretaceous), Albacora Field Brazil: implication for oil 697
recovery. In: Carbonate cementation in sandstones (ed. Morad, S.) International 698
Association of Sedimentologists Special Publications 26, 309-325. 699
Dickinson, W.R., 1985. Interpreting provenance relation from detrital modes of 700
sandstones, in: Zuffa, G.G. (Ed.), Provenance of Arenites: NATO ASI Series, C 701
148. D. Reidel Publishing Company, Dordrecht, pp. 333-363. 702
Dickinson, W.R., Suczek, C.A., 1979. Plate tectonics and sandstone compositions. 703
American Association of Petroleum Geologists Bulletin 63, 2164-2182. 704
Dowey, P.J., Hodgson, D.M., Worden, R.H., 2012. Pre-requisites, processes, and 705
prediction of chlorite grain coatings in petroleum reservoirs: A review of 706
subsurface examples. Marine and Petroleum Geology 32, 63-75. 707
Page 31
Dutton, S.P., Loucks, R.G., Day-Stirrat, R.J., 2012. Impact of regional variation in 708
detrital mineral composition on reservoir quality in deep to ultradeep lower 709
Miocene sandstones, western Gulf of Mexico. Marine and Petroleum Geology 35, 710
139-153. 711
Ehrenberg, S.N., 1993. Preservation of anomalously high-porosity in deeply buried 712
sandstones by grain coating chlorite - examples from the Norwegian continental 713
shelf. American Association of Petroleum Geologists Bulletin 77, 1260-1286. 714
Fayek, M., Harrison, T.M., Grove, M., McKeegan, K.D., Coath, C.D., Boles, J.R., 2001. 715
In situ stable isotopic evidence for protracted and complex carbonate cementation 716
in a petroleum reservoir, North Coles Levee, San Joaquin Basin, California, USA. 717
Journal of Sedimentary Research 71, 444-458. 718
Friedman, I., O'Neil, J.R., 1977. Compilation of stable isotope fractionation factors of 719
geochemical interest. US Geological Survey Professional papers. 720
Gibbons, A.D., Whittaker, J.M., Muller, R.D., 2013. The breakup of East Gondwana: 721
Assimilating constraints from Cretaceous ocean basins around India into a best-fit 722
tectonic model. Journal of Geophysical Research-Solid Earth 118, 808-822. 723
Gier, S., Worden, R.H., Johns, W.D., Kurzweil, H., 2008. Diagenesis and reservoir 724
quality of Miocene sandstones in the Vienna Basin, Austria. Marine and Petroleum 725
Geology 25, 681-695. 726
Giles, M.R., Deboer, R.B., 1990. Origin and significance of redistributional secondary 727
porosity. Marine and Petroleum Geology 7, 378-397. 728
Giles, M.R., Stevenson, S., Martin, S.V., Cannon, S.J.C., Hamilton, P.J., Marshall, J.D., 729
Samways, G.M., 1992. The reservoir properties and diagenesis of the Brent Group: 730
a regional perspective, in: Morton, A.C., Haszeldine, R.S., Giles, M.R., Brown, S. 731
(Eds.), Geology of the Brent Group. The Geological Society, London, pp. 289-327. 732
Hiller, K., Elahi, M., 1984. Structural development and hydrocarbon entrapment in the 733
Surma Basin, Bangladesh (north-east Indo-Burman fold belt), Proceedings of the 734
5th Offshore South Asia Conference, Singapore. 735
Hirt, W.G., Wenk, H.R., Boles, J.R., 1993. Albitization of plagioclase crystals in the 736
Stevens Sandstone (Miocene), San Joaquin Basin, California and the Frio 737
Formation (Oligocene), Gulf Coast, Texas, a TEM AEM study. Geological Society 738
of America Bulletin 105, 708-714. 739
Houseknecht, D.W., 1987. Assessing the relative importance of compaction processes 740
and cementation to reduction of porosity in sandstones. American Association of 741
Petroleum Geologists Bulletin 71, 633-642. 742
Imam, M.B., Shaw, H.F., 1987. Diagenetic controls on the reservoir propoerties of gas 743
bearing Neogene Surma Group sandstones in the Bengal Basin, Bangladesh. 744
Marine and Petroleum Geology 4, 103-111. 745
Irwin, H., Curtis, C., Coleman, M.L., 1977. Isotopic evidence for source of diagenetic 746
carbonates formed during burial of organic rich sediments. Nature 269, 209-213. 747
Islam, M.A., 2009. Diagenesis and reservoir quality of Bhuban sandstones (Neogene), 748
Titas Gas Field, Bengal Basin, Bangladesh. Journal of Asian Earth Sciences 35, 89-749
100. 750
Islam, M.A., 2010. Petrophysical Evaluation of Subsurface Reservoir Sandstones of 751
Bengal Basin, Bangladesh. Journal of the Geological Society of India 76, 621-631. 752
Page 32
Johnson, S.Y., Alam, A.M.N., 1991. Sedimentation and tectonics of the Sylhet Trough, 753
Bangladesh. Geological Society of America Bulletin 103, 1513-1527. 754
Jokat, W., Nogi, Y., Leinweber, V., 2010. New aeromagnetic data from the western 755
Enderby Basin and consequences for Antarctic-India break-up. Geophysical 756
Research Letters 37. 757
Keller, W.D., Reynolds, R.C., Inoue, A., 1986. Morphology of clay minerals in the 758
smectite-to-illite conversion series by scanning electron microscope. Clays and 759
Clay Minerals 34, 187-197. 760
Khan, M.A.M., Ismail, M., Ahmed, M., 1988. Geology and hydrocarbon prospects of the 761
Surma Basin, Bangladesh, 7th Offshore South Asia Conference, Singapore, pp. 364-762
387. 763
Lemon, N.M., Cubitt, C.J., 2003. Illite fluorescence microscopy: a new technique in the 764
study of illite in the Merrimelia Formation. Cooper Basin, Australia, in: Worden, 765
R.H., Morad, S. (Eds.), Clay mineral cements in sandstones. International 766
Association of Sedimentolgists Special Publication. Blackwells, Oxford, pp. 411-767
424. 768
Lietz, J.K., Kabir, J., 1982. Prospects and constraints of oil exploration in Bangladesh, 4th 769
Offshore South East Asia Conference, Singapore, pp. 1-4. 770
Matlack, K.S., Houseknecht, D.W., Applin, K.R., 1989. Emplacement of clay into sand 771
by infiltration. Journal of Sedimentary Petrology 59, 77-87. 772
McBride, E.F., 1989. Quartz cement in sandstones: a review. Earth Science Reviews 26, 773
69-112. 774
McIlroy, D., Worden, R.H., Needham, S.J., 2003. Faeces, clay minerals and reservoir 775
potential. Journal of the Geological Society 160, 489-493. 776
McKinley, J.M., Worden, R.H., Ruffell, A.H., 2003. Smectite in sandstones: A review of 777
the controls on occurrence and behaviour during diagenesis. In: Clay mineral 778
cements in sandstones (eds. Worden, R.H. and Morad, S.) International Association 779
of Sedimentologists Special Publications 34, 109-128. 780
Morad, S., 1998. Carbonate cementation in sandstones: distribution patterns and 781
geochemical evolution. In: Carbonate cementation in sandstones (ed. Morad, S.) 782
International Association of Sedimentologists Special Publications 26, 1-26. 783
Morad, S., De Ros, L.F., 1994. Geochemistry and diagenesis of stratabound calcite 784
cement layers within the Rannoch Formation of the Brent Group, Murchison Field, 785
North Viking Graben (Northern North Sea) - Comment. Sedimentary Geology 93, 786
135-141. 787
Morad, S., Ketzer, J.M., De Ros, L.F., 2000. Spatial and temporal distribution of 788
diagenetic alterations in siliciclastic rocks: implications for mass transfer in 789
sedimentary basins. Sedimentology 47, 95-120. 790
Moraes, M.A.S., De Ros, L.F., 1990. Infiltrated clays in fluvial Jurassic sandstones of 791
Recôncavo Basin, northeastern Brazil. Journal of Sedimentary Petrology 60, 809-792
819. 793
Moraes, M.A.S., De Ros, L.F., 1992. Depositional, infiltrated and authigenic clays in 794
fluvial sandstones of the Jurassic Sergie Formation, Reconcavo Basin, northeastrn 795
Brazil, In: Origin, diagenesis and petrophysics of clay minerals in sandstones (eds. 796
Houseknecht, D.W. and Pittman, E.D.) SEPM Special Publication, pp. 197-208. 797
Page 33
Needham, S.J., Worden, R.H., McIlroy, D., 2005. Experimental production of clay rims 798
by macrobiotic sediment ingestion and excretion processes. Journal of Sedimentary 799
Research 75, 1028-1037. 800
Osborne, M.J., Swarbrick, R.E., 1999. Diagenesis in North Sea HPHT elastic reservoirs - 801
consequences for porosity and overpressure prediction. Marine and Petroleum 802
Geology 16, 337-353. 803
Paxton, S.T., Szabo, J.O., Ajdukiewicz, J.M., Klimentidis, R.E., 2002. Construction of an 804
intergranular volume compaction curve for evaluating and predicting compaction 805
and porosity loss in rigid-grain sandstone reservoirs. American Association of 806
Petroleum Geologists Bulletin 86, 2047-2067. 807
Rahman, M.J.J., Faupl, P., Alam, M.M., 2009. Depositional facies of the subsurface 808
Neogene Surma Group in the Sylhet Trough of the Bengal Basin, Bangladesh: 809
record of tidal sedimentation. International Journal of Earth Sciences 98, 1971-810
1980. 811
Rahman, M.J.J., McCann, T., 2012. Diagenetic history of the Surma Group sandstones 812
(Miocene) in the Surma Basin, Bangladesh. Journal of Asian Earth Sciences 45, 65-813
78. 814
Rahman, M.J.J., McCann, T., Abdullah, R., Yeasmin, R., 2011. Sandstone diagenesis of 815
the Neogene Surma Group from the Shahbazpur gas field, Southern Bengal Basin, 816
Bangladesh. Austrian Journal of Earth Sciences 104, 114-126. 817
Ramm, M., Bjorlykke, K., 1994. Porosity depth trends in Norwegain reservoirs - 818
assessing the quantitative effects of varying pore-pressure, temperature history and 819
mineralogy, Norwegian shelf data. Clay Minerals 29, 475-490. 820
Ramm, M., Forsberg, A.W., Jahren, J., 1997. Porosity-depth trends in deeply buried 821
Upper Jurassic Reservoirs in the Norwegian Central Graben: an example of 822
porosity preservation beneath the normal economic basement by grain coating 823
microquartz. In: Reservoir quality prediction in sandstones and carbonates (eds. 824
Kupecz, J.A., Gluyas, J. and Bloch, S.) AAPG Memoir 69, 177-200. 825
Shamsuddin, A.H.M., Brown, T., Lee, S., Curiale, J., 2001. Petroleum Systems of 826
Bangladesh, Proceedings of the 13th Southeast Asia petroleum Exploration Society 827
(SEAPEX) Exploration Conference, Singapore. 828
Tucker, M.E., 1988. Techniques in Sedimentology, in: Tucker, M.E. (Ed.). Blackwell 829
Science Ltd. 830
Uddin, A., Lundberg, N., 1998. Cenozoic history of the Himalayan-Bengal system: Sand 831
composition in the Bengal basin, Bangladesh. Geological Society of America 832
Bulletin 110, 497-511. 833
Walderhaug, O., Lander, R.H., Bjorkum, P.A., Oelkers, E.H., Bjorlykke, K., Nadeau, 834
P.H., 2000. Modelling quartz cementation and porosity in reservoir sandstones: 835
examples from the Norwegain continental shelf. In: Quartz cementation in 836
sandstones (eds. Worden, R.H. and Morad, S.) International Association of 837
Sedimentologists Special Publications 29, 39-50. 838
Worden, R.H., Barclay, S.A., 2000. Internally-sourced quartz cement due to externally-839
derived CO2 in sub-arkosic sandstones, North Sea. Journal of Geochemical 840
Exploration 69, 645-649. 841
Page 34
Worden, R.H., Burley, S.D., 2003. Sandstone diagenesis: the evolution from sand to 842
stone, in: Burley, S.D., Worden, R.H. (Eds.), Sandstone diagenesis, recent and 843
ancient. International Association of Sedimentologists Reprint Series, pp. 3-44. 844
Worden, R.H., Mayall, M., Evans, I.J., 2000. The effect of ductile-lithic sand grains and 845
quartz cement on porosity and permeability in Oligocene and lower Miocene 846
clastics, South China Sea: Prediction of reservoir quality. American Association of 847
Petroleum Geologists Bulletin 84, 345-359. 848
Worden, R.H., Mayall, M.J., Evans, I.J., 1997. Predicting reservoir quality during 849
exploration: lithic grains, porosity and permeability in Tertiary clastics of the South 850
China Sea basin, in: A.J., F., Matthews, A.J., Murphy, R.W. (Eds.), Petroleum 851
Geology of S E Asia. Special Publication. Geological Society, London, pp. 107-852
115. 853
Worden, R.H., Morad, S., 2000. Quartz cementation in sandstones: a review of the key 854
controversies In: Quartz cementation in sandstones (eds. Worden, R.H. and Morad, 855
S.) International Association of Sedimentologists Special Publications, pp. 1-20. 856
Worden, R.H., Morad, S., 2003. Clay minerals in sandstones: Controls on formation, 857
distribution and evolution. In: Clay mineral cements in sandstones (eds. Worden, 858
R.H. and Morad, S.) International Association of Sedimentologists Special 859
Publications 34, 3-41. 860
Worden, R.H., Needham, S.J., Cuadros, J., 2006. The worm gut; a natural clay mineral 861
factory and a possible cause of diagenetic grain coats in sandstones. Journal of 862
Geochemical Exploration 89, 428-431. 863
Worden, R.H., Oxtoby, N.H., Smalley, P.C., 1998. Can oil emplacement prevent quartz 864
cementation in sandstones? Petroleum Geoscience 4, 129-137. 865
Worden, R.H., Warren, E.A., Smalley, P.C., Primmer, T.J., Oxtoby, N.H., 1995. 866
Evidence for resetting of fluid inclusions from quartz cements in oil fields - 867
discussion. Marine and Petroleum Geology 12, 566-570. 868
869
870
871
Page 35
872
873

Page 36
874
Figure 2
Page 37
875 Figure 3
b (Titus field)
Surma Group
20 15 10 05
Ro = 0.7, 130C
Ro = 0.5, 100C
Ro = 0.3, 50C
Age (Ma)
a (Bakhrabad area)
0
1000
2000
3000
4000
5000
20 15 10 05
Ro = >0.5, >100C
Age (Ma)
Dep
th (
TVD
, m)
40
56
70
85
100
114
128
144
Ap
pro
xim
ate
tem
pe
ratu
re (C
)
Surma Group
Page 38
876
a b
c d
e
Figure 4
Page 39
877
Figure 5
Page 40
878
SP
SP
CI
F
F
F
CI
CI
C
C
A
A
CI
F
F
AB
C
a
c
fe
dFe-
C
C
Pg-C
C
Gc-ch
SPSPSP
cl
bFig
ure 6

Page 41
879
2theta angle (θ)
a
b
Figure 7KeV electron energy
Re
lative
in
ten
sity
To
tal co
un
ts

Page 42
880
K
K F
Ill-
sm
C
h
Q
O
Ill-sm
Ill-sm
Ch
A B
EF
Ch
ChQO
Ill-Sm
Ill-Sm
FK
K+D KD
D
K
a b
c d
e f
Gc-chFig
ure 8
Page 43
881
Q
O
QO
QO+
Q
Q
O
Q
O
C
h
C
h
D
QO
QO
C
h
FO
Ch
Py
c
Ab cl
b QO
f
d
a
e
Figu
re 9

Page 44
882
883
-15
-10
-5
0
-25 -20 -15 -10 -5 0 5
New data
Rahman and McCann (2012)
13C ‰ VPDB
1
8O
‰ V
PD
B
Rec
ryst
allis
atio
no
f b
iocl
asti
c-d
eriv
ed c
alci
te d
uri
ng
bu
rial
Figure 10
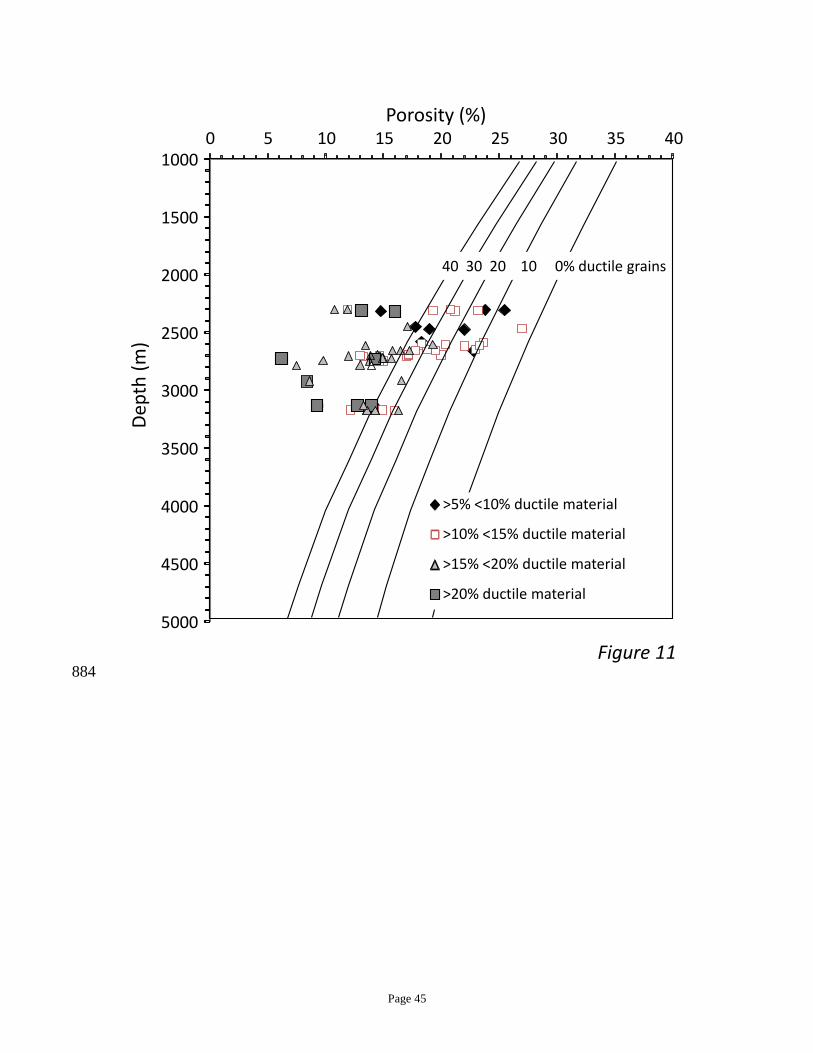
Page 45
884
1000
1500
2000
2500
3000
3500
4000
4500
5000
0 5 10 15 20 25 30 35 40
>5% <10% ductile material
>10% <15% ductile material
>15% <20% ductile material
>20% ductile material
Porosity (%)D
epth
(m
)
40 30 20 10 0% ductile grains
Figure 11
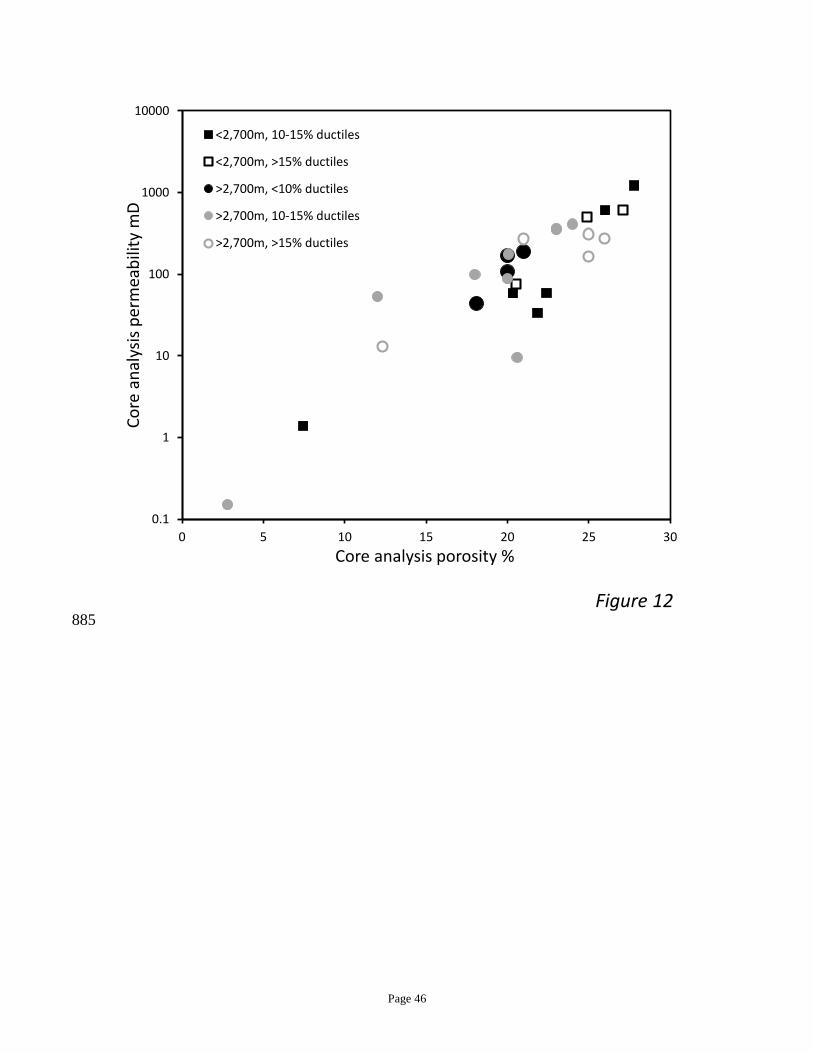
Page 46
885 Figure 12
0.1
1
10
100
1000
10000
0 5 10 15 20 25 30
Co
re a
nal
ysis
per
mea
bili
ty m
D
Core analysis porosity %
<2,700m, 10-15% ductiles
<2,700m, >15% ductiles
>2,700m, <10% ductiles
>2,700m, 10-15% ductiles
>2,700m, >15% ductiles

Page 47
886
Infiltrated clay when sediment surface exposed
Mechanical compaction – grain rearrangement
Ductile compaction / brittle grain fracture
Framboidal pyrite under marine conditions
Poikilotopic calcite growth
Microcrystalline calcite growth
Feldspar, lithic and mica alteration
Local creation of chlorite grain coats
Quartz overgrowths
Vermiform kaolinite
Smectite conversion to illite
Kaolinite conversion to dickite
time
eodiagenesis mesodiagenesis
Figure 13
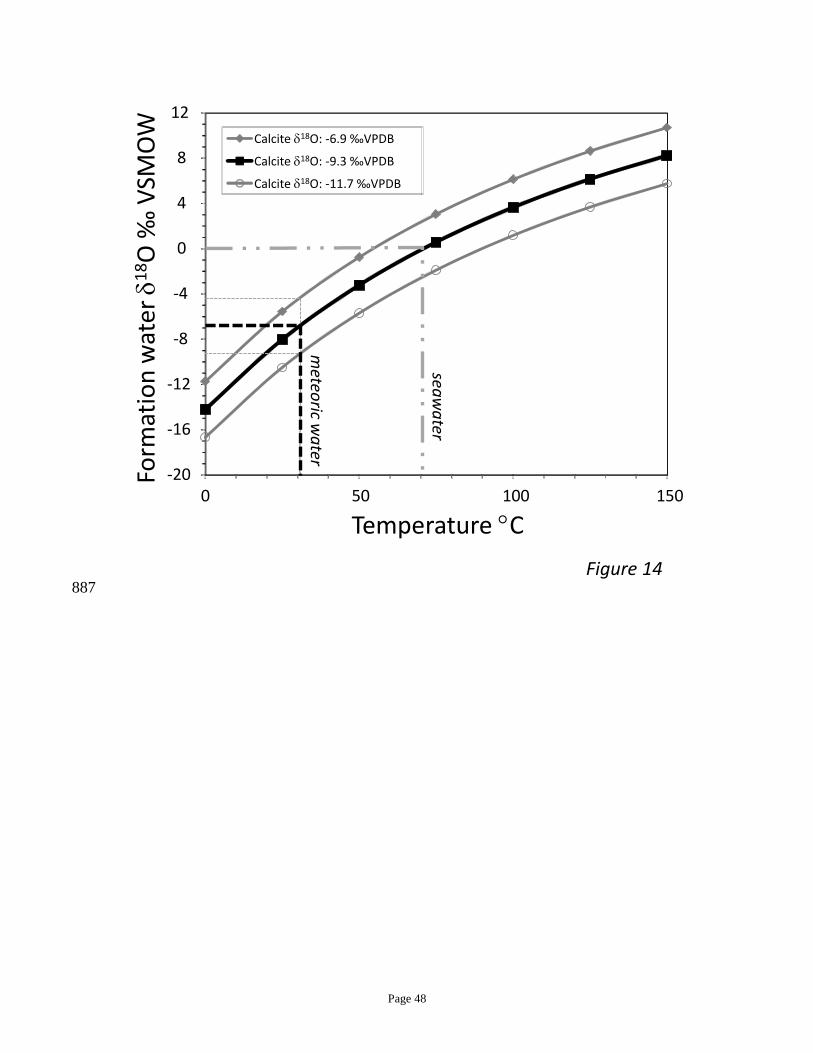
Page 48
887
-20
-16
-12
-8
-4
0
4
8
12
0 50 100 150
Temperature C
Form
atio
n w
ater
1
8O
‰ V
SMO
W Calcite 18O: -6.9 ‰VPDB
Calcite 18O: -9.3 ‰VPDB
Calcite 18O: -11.7 ‰VPDB
seaw
ater
meteo
ric wa
ter
Figure 14
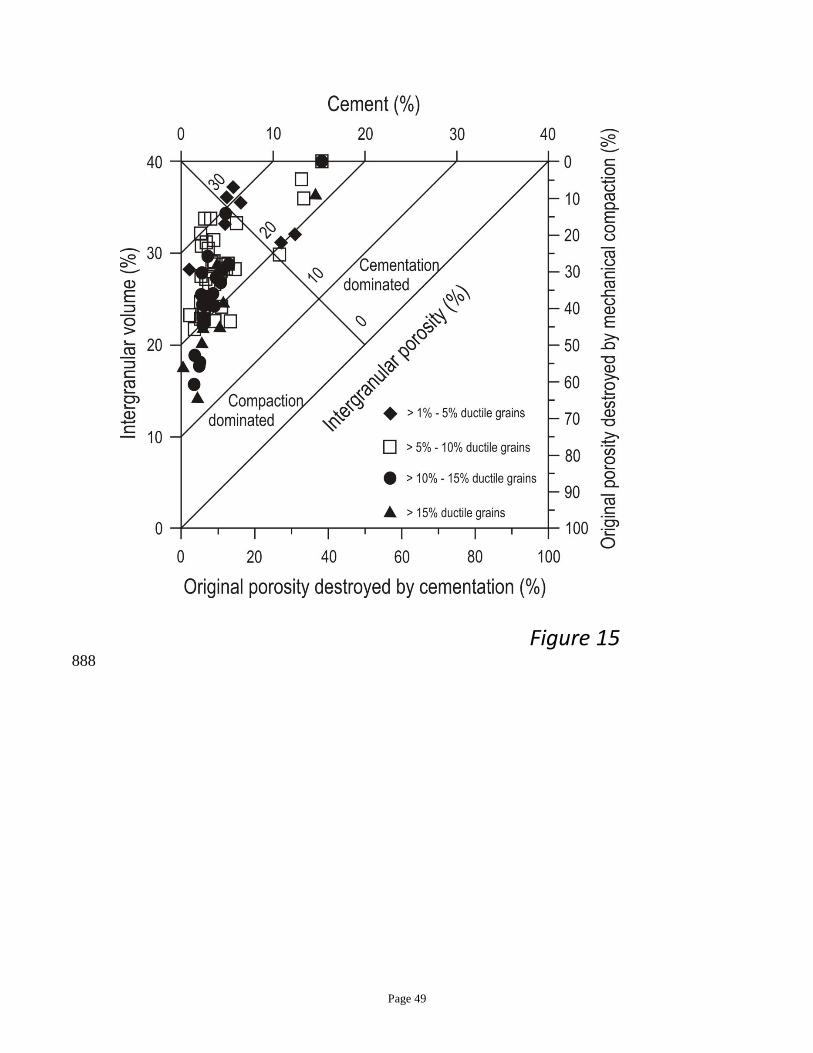
Page 49
888
Figure 15
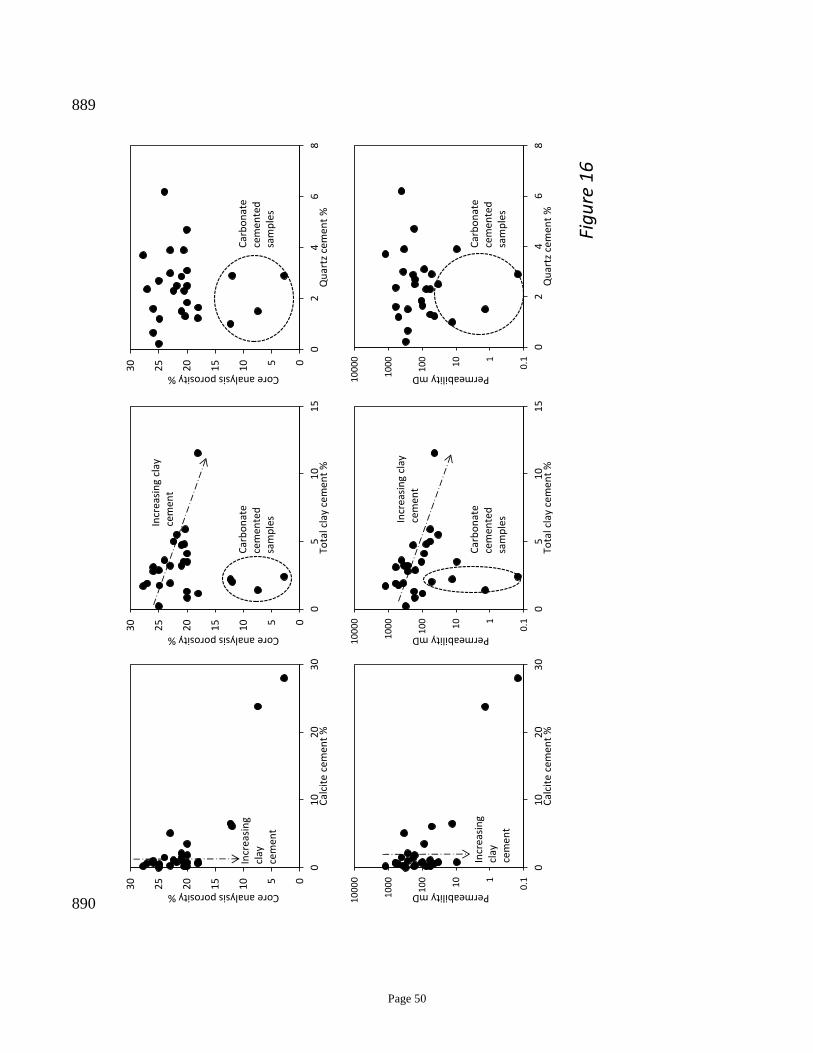
Page 50
889
890
Fig
ure
16
05
10
15
20
25
30
01
02
03
0
Core analysis porosity %
Cal
cite
cem
ent
%
0.11
10
10
0
10
00
10
00
0
01
02
03
0
Permeability mD
Cal
cite
cem
ent
%
05
10
15
20
25
30
02
46
8
Core analysis porosity %
Qu
artz
cem
ent
%
0.11
10
10
0
10
00
10
00
0
02
46
8
Permeability mD
Qu
artz
cem
ent
%
05
10
15
20
25
30
05
10
15
Core analysis porosity %
Tota
l cla
y ce
men
t %
0.11
10
10
0
10
00
10
00
0
05
10
15
Permeability mD
Tota
l cla
y ce
men
t %
Car
bo
nat
e ce
men
ted
sa
mp
les
Car
bo
nat
e ce
men
ted
sa
mp
les
Car
bo
nat
e ce
men
ted
sa
mp
les
Car
bo
nat
e ce
men
ted
sa
mp
les
Incr
easi
ng
clay
ce
men
t
Incr
easi
ng
clay
ce
men
t
Incr
easi
ng
clay
ce
men
t
Incr
easi
ng
clay
ce
men
t

Page 51
891
892
Chlorite (%)
Qu
artz
cem
en
t (%
)
0
1
2
3
4
5
6
7
0 1 2 3 4 5 6
<2600m
2600-2700m
2700-2800m
2900-3000m
>3100m
Figure 17
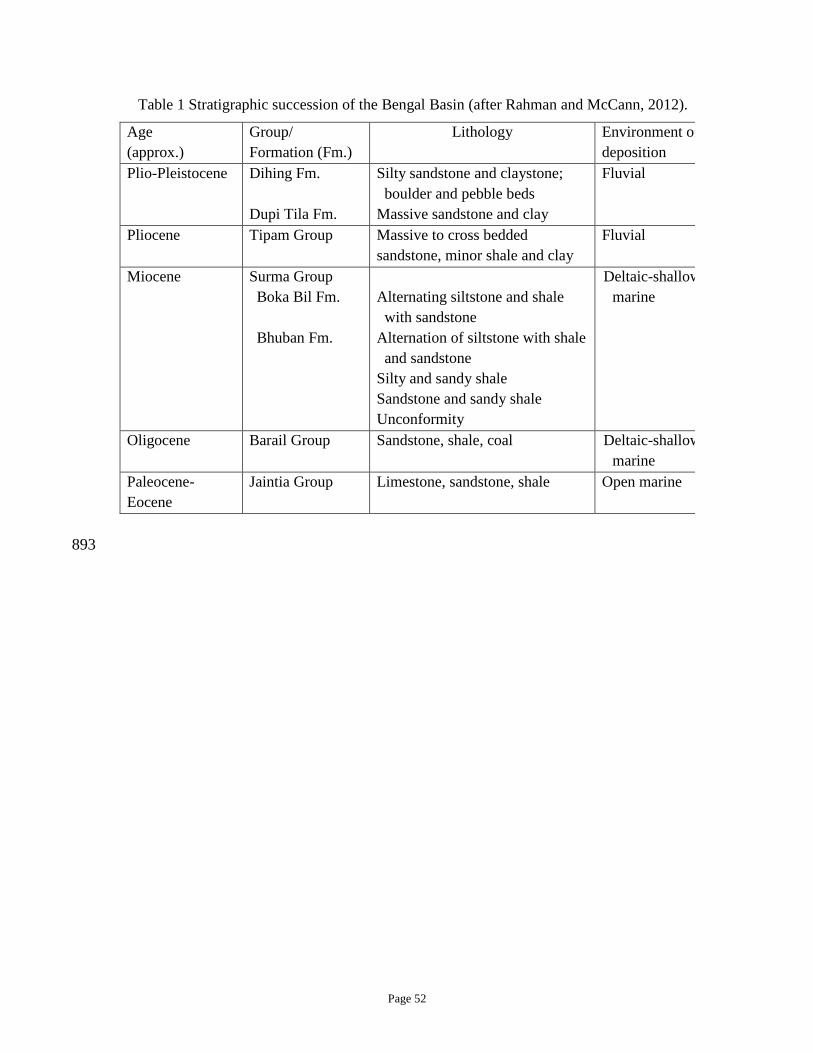
Page 52
893
Table 1 Stratigraphic succession of the Bengal Basin (after Rahman and McCann, 2012).
Age
(approx.)
Group/
Formation (Fm.)
Lithology Environment of
deposition
Plio-Pleistocene Dihing Fm.
Dupi Tila Fm.
Silty sandstone and claystone;
boulder and pebble beds
Massive sandstone and clay
Fluvial
Pliocene Tipam Group Massive to cross bedded
sandstone, minor shale and clay
Fluvial
Miocene Surma Group
Boka Bil Fm.
Bhuban Fm.
Alternating siltstone and shale
with sandstone
Alternation of siltstone with shale
and sandstone
Silty and sandy shale
Sandstone and sandy shale
Unconformity
Deltaic-shallow
marine
Oligocene Barail Group Sandstone, shale, coal
Deltaic-shallow
marine
Paleocene-
Eocene
Jaintia Group Limestone, sandstone, shale Open marine

Page 53
894 Table
2 (
part
1)
Wel
l
Dep
th
(m)
Qu
artz
mo
no
cryst
alli
ne
Qu
artz
po
lycr
yst
al
lin
eC
her
tK
-fel
dsp
arP
lagi
ocl
ase
Det
rita
l
Bio
tite
Det
rita
l
mu
sco
vite
Lit
hic
s-
sed
imen
tary
Lit
hic
s
met
amo
rph
ic
Lit
hic
s
volc
anic
Det
rita
l
carb
on
ate
clas
ts
Mat
rix
clay
Qu
artz
cem
ent
Ch
lori
te
cem
ent
Cal
cite
cem
ent
Cla
y
cem
ents
Pri
mar
y
po
rosi
ty
Sec
on
dar
y
po
rosi
ty
IGV
13C
‰
VP
DB
18O
‰
VP
DB
core
anal
ysi
s
po
rosi
ty %
core
an
alysi
s
per
mea
bil
ity
mD
JL-2
(1)
25
82
.03
8.7
14
.31
.51
.86
.80
.00
.50
.70
.00
.20
.53
.00
.82
.34
.54
.31
8.3
2.3
33
.2
JL-2
(2)
25
88
.03
6.5
6.9
1.1
2.2
3.6
0.3
0.0
5.0
1.7
0.0
3.6
2.0
2.8
0.8
2.2
2.2
23
.74
.53
3.7
JL-2
(4)
25
95
.32
8.9
6.0
2.8
4.9
3.9
1.8
0.4
3.5
10
.60
.00
.00
.00
.05
.72
6.5
4.3
0.0
0.0
36
.5-1
8.2
-11
.7
JL-2
(6)
25
97
.03
6.5
6.3
0.0
3.0
2.3
2.0
0.0
2.5
0.5
0.0
0.5
1.5
1.0
5.5
∗11
.8
6.3
18
.32
.03
2.5
JL-2
(7)
26
03
.03
4.3
6.5
0.0
1.8
1.8
1.5
1.0
2.0
1.5
0.0
0.3
1.3
1.8
4.5
∗10
.5
8.8
19
.33
.03
5.5
JL-2
(8)
26
06
.04
0.3
0.7
1.0
1.3
0.0
1.3
2.3
4.2
1.3
0.0
0.0
1.3
0.7
3.2
∗19
2
.61
7.0
3.6
24
.8
JL-2
(9)
26
08
.03
6.0
7.1
1.1
2.2
3.0
1.9
0.6
5.8
2.5
0.0
1.9
1.9
3.8
2.2
4.9
1.1
20
.42
.23
4.4
JL-2
(11
)2
61
2.0
45
.53
.80
.93
.31
.71
.40
.95
.45
.50
.02
.51
.80
.65
.31
.21
.91
3.5
3.2
24
.3
JL-2
(12
)2
61
3.0
35
.83
.30
.53
.83
.81
.01
.00
.50
.30
.01
.04
.80
.83
.58
.36
.02
3.3
2.3
46
.5
JL-2
(13
)2
61
5.0
41
.54
.80
.51
.53
.80
.50
.52
.30
.00
.01
.03
.31
.34
.87
.36
.01
8.5
2.5
41
.0
JL-2
(14
)2
61
9.1
40
.84
.00
.02
.31
.30
.30
.30
.80
.80
.01
.81
.32
.81
.89
.57
.32
2.0
3.3
44
.5
JL-2
(15
)2
65
0.0
37
.36
.00
.02
.00
.81
.30
.50
.31
.00
.00
.30
.81
.33
.0∗1
2.3
7
.52
3.0
2.5
35
.5
JL-2
(16
)2
65
1.0
39
.36
.01
.52
.52
.31
.00
.30
.30
.30
.00
.02
.51
.32
.3∗1
2.3
8
.31
8.8
0.8
33
.1
JL-2
(17
)2
65
9.0
35
.57
.00
.33
.04
.31
.31
.30
.51
.30
.00
.82
.01
.53
.3∗1
0.8
5
.81
9.5
0.8
32
.0
JL-2
(18
)2
66
2.2
42
.89
.80
.33
.31
.50
.30
.51
.00
.80
.01
.30
.52
.31
.58
.02
.32
2.8
1.3
37
.3
JL-3
(3)
24
48
.43
8.7
5.7
2.5
6.3
2.5
0.5
1.4
6.2
4.7
0.2
1.1
0.8
1.9
3.2
0.8
3.6
17
.11
.62
7.4
JL-3
(4)
24
54
.23
7.6
10
.51
.33
.02
.31
.00
.00
.81
.00
.00
.31
.31
.82
.0∗1
3.8
3
.21
7.8
2.5
26
.0
JL-3
(5)
24
61
.22
6.1
7.5
1.0
2.6
2.0
0.3
0.3
33
.00
.70
.30
.01
.62
.60
.70
.08
.11
1.7
1.6
24
.7
JL-3
(7)
24
66
.13
3.3
3.0
0.3
1.8
1.5
0.8
0.5
0.3
0.8
0.0
1.0
2.8
1.5
3.0
∗12
.37
.32
7.0
2.3
41
.5
JL-3
(8)
24
73
.23
7.5
10
.82
.05
.03
.30
.00
.01
.00
.80
.00
.50
.51
.80
.88
.84
.81
9.0
3.8
35
.6
JL-3
(9)
24
78
.24
1.2
10
.00
.52
.92
.20
.50
.20
.02
.20
.01
.02
.01
.31
.07
.62
.42
2.0
2.0
36
.2
BK
-9 (
1)
23
03
.54
8.3
5.2
5.2
0.8
3.5
0.5
2.2
1.7
10
.50
.00
.01
.51
.20
.30
.51
.51
0.8
3.6
15
.72
4.9
50
4
BK
-9 (
2)
23
04
.64
5.8
4.3
5.9
3.5
3.5
0.6
1.9
3.5
8.7
0.0
0.0
0.9
2.4
0.5
0.6
1.4
11
.94
.71
7.7
27
.16
14
BK
-9 (
3)
23
05
.22
8.0
15
.88
.32
.73
.04
.33
.00
.72
.70
.00
.01
.53
.71
.70
.20
.02
0.8
3.3
27
.92
7.8
12
30
BK
-9 (
4)
23
05
.83
7.3
10
.01
0.8
5.3
1.8
1.0
0.8
0.0
0.5
0.0
0.0
2.3
0.3
0.3
1.0
0.8
23
.84
.32
8.3
BK
-9 (
5)
23
06
.43
8.5
5.7
8.3
1.8
4.6
1.4
2.1
2.9
4.0
0.0
0.0
1.3
1.6
0.2
0.8
2.4
11
.96
.41
8.1
BK
-9 (
6)
23
07
.03
4.0
10
.07
.51
.00
.70
.81
.30
.32
.80
.00
.01
.20
.50
.33
7.0
1.8
0.2
0.3
41
.0-9
.5-6
.9
BK
-9 (
7)
23
07
.92
6.0
15
.28
.72
.51
.50
.81
.80
.23
.20
.00
.02
.02
.22
.31
.30
.52
5.5
5.3
33
.8
BK
-9 (
8)
23
08
.83
3.2
6.2
5.5
3.5
2.7
2.0
1.5
1.3
3.3
0.0
0.0
3.7
4.3
0.5
0.5
0.0
23
.25
.73
2.1
BK
-9 (
9)
23
09
.24
5.3
1.9
3.6
0.8
1.6
4.3
4.4
2.3
6.1
0.0
0.0
1.7
0.8
0.8
1.8
2.1
13
.15
.12
0.3
BK
-9 (
10
)2
31
0.7
43
.71
.91
.61
.40
.52
.03
.71
.43
.00
.00
.01
.40
.30
.03
1.2
6.7
0.5
0.8
40
.1
BK
-9 (
11
)2
31
2.8
35
.09
.51
0.3
6.8
4.3
2.0
2.5
0.5
4.0
0.5
0.0
1.8
0.8
0.3
0.5
0.8
19
.31
.32
3.3
BK
-9 (
12
)2
31
3.5
33
.01
1.3
9.3
3.2
1.5
1.3
1.0
3.8
1.2
0.0
0.0
3.2
1.5
0.7
23
.80
.70
.04
.52
9.9
7.5
1.4
BK
-9 (
13
)2
31
4.2
30
.31
3.3
9.7
2.3
2.8
3.5
1.7
0.0
2.5
0.0
0.0
4.2
3.2
1.2
0.8
0.2
21
.21
.83
0.8
BK
-9 (
14
)2
31
7.2
38
.44
.23
.62
.61
.02
.66
.50
.74
.70
.00
.02
.62
.40
.30
.22
.91
6.0
10
.72
4.5
BK
-10
(1
)2
31
7.7
36
.51
4.8
6.5
4.0
4.3
1.8
1.5
0.0
2.0
0.0
0.0
3.5
1.5
1.0
0.0
1.0
14
.86
.52
1.8
BK
-10
(2
)2
91
8.5
53
.53
.72
.02
.02
.43
.79
.70
.11
.50
.00
.00
.70
.20
.20
.00
.01
6.6
5.5
17
.72
5.0
31
0
BK
-10
(3
)2
92
1.7
56
.02
.00
.90
.96
.61
.13
.10
.11
.60
.00
.00
.61
.20
.60
.61
0.9
8.6
4.8
22
.61
8.1
44
BK
-10
(4
)2
92
2.3
43
.71
.91
.61
.61
.42
.03
.70
.53
.00
.00
.01
.40
.30
.03
1.2
6.7
0.5
0.8
40
.1
BK
-10
(5
)2
92
5.8
42
.97
.64
.94
.94
.95
.45
.81
.65
.40
.00
.01
.50
.70
.21
.02
.68
.42
.81
4.3
26
.02
72
BK
-10
(6
)3
17
0.8
44
.93
.95
.55
.56
.60
.92
.00
.24
.20
.00
.01
.81
.80
.40
.73
.11
4.9
6.4
22
.82
0.0
10
7
BK
-10
(7
)3
17
3.0
54
.50
.91
.91
.95
.51
.45
.70
.40
.90
.00
.01
.42
.90
.11
.44
.61
2.2
5.5
22
.72
1.0
18
9
BK
-10
(8
)3
17
4.2
49
.13
.82
.22
.23
.30
.51
.70
.25
.20
.00
.01
.72
.50
.01
.80
.81
6.0
8.7
22
.92
0.0
16
8
BK
-10
(9
)3
17
6.0
46
.34
.10
.90
.95
.23
.43
.20
.97
.70
.00
.01
.82
.70
.40
.42
.51
4.3
4.8
22
.02
5.0
16
3
BK
-10
(1
0)
31
76
.34
7.1
2.8
0.8
0.8
6.3
2.4
2.4
0.8
5.7
0.0
0.0
0.8
2.4
0.3
0.2
3.1
16
.37
.02
3.1
BK
-10
(1
1)
31
77
.84
8.6
6.8
4.0
4.0
3.6
2.5
2.1
1.5
6.6
0.0
0.0
1.7
1.7
0.3
0.8
0.8
13
.61
.81
8.9
18
.09
9
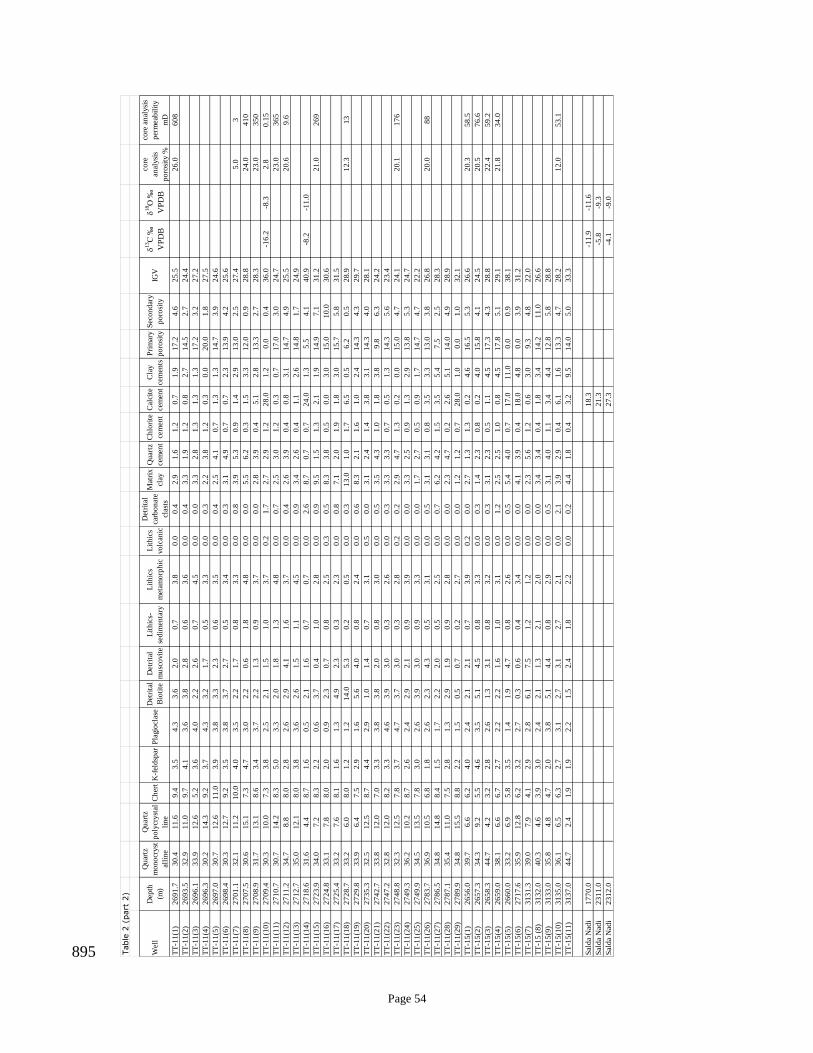
Page 54
895 Table
2 (
part
2)
Wel
lD
epth
(m)
Qu
artz
mo
no
cryst
alli
ne
Qu
artz
po
lycr
yst
al
lin
e
Ch
ert
K-f
eld
spar
Pla
gio
clas
eD
etri
tal
Bio
tite
Det
rita
l
mu
sco
vite
Lit
hic
s-
sed
imen
tary
Lit
hic
s
met
amo
rph
ic
Lit
hic
s
volc
anic
Det
rita
l
carb
on
ate
clas
ts
Mat
rix
clay
Qu
artz
cem
ent
Ch
lori
te
cem
ent
Cal
cite
cem
ent
Cla
y
cem
ents
Pri
mar
y
po
rosi
ty
Sec
on
dar
y
po
rosi
ty
IGV
13C
‰
VP
DB
18O
‰
VP
DB
core
anal
ysi
s
po
rosi
ty %
core
an
alysi
s
per
mea
bil
ity
mD
TT
-11
(1)
26
91
.73
0.4
11
.69
.43
.54
.33
.62
.00
.73
.80
.00
.42
.91
.61
.20
.71
.91
7.2
4.6
25
.52
6.0
60
8
TT
-11
(2)
26
93
.53
2.9
11
.09
.74
.13
.63
.82
.80
.63
.60
.00
.43
.31
.91
.20
.82
.71
4.5
2.7
24
.4
TT
-11
(3)
26
96
.13
3.9
12
.65
.23
.64
.02
.22
.60
.74
.50
.00
.03
.32
.81
.31
.31
.31
7.2
3.2
27
.2
TT
-11
(4)
26
96
.33
0.2
14
.39
.23
.74
.33
.21
.70
.53
.30
.00
.32
.23
.81
.20
.30
.02
0.0
1.8
27
.5
TT
-11
(5)
26
97
.03
0.7
12
.61
1.0
3.9
3.8
3.3
2.3
0.6
3.5
0.0
0.4
2.5
4.1
0.7
1.3
1.3
14
.73
.92
4.6
TT
-11
(6)
26
98
.43
0.3
12
.79
.23
.53
.83
.72
.70
.53
.40
.00
.33
.14
.90
.70
.72
.31
3.9
4.2
25
.6
TT
-11
(7)
27
01
.13
2.1
11
.21
0.0
4.0
3.5
2.2
1.7
0.8
3.3
0.0
0.8
3.9
5.3
0.9
1.4
2.9
13
.02
.52
7.4
5.0
3
TT
-11
(8)
27
07
.53
0.6
15
.17
.34
.73
.02
.20
.61
.84
.80
.00
.05
.56
.20
.31
.53
.31
2.0
0.9
28
.82
4.0
41
0
TT
-11
(9)
27
08
.93
1.7
13
.18
.63
.43
.72
.21
.30
.93
.70
.00
.02
.83
.90
.45
.12
.81
3.3
2.7
28
.32
3.0
35
0
TT
-11
(10
)2
70
9.4
30
.31
0.0
7.3
3.8
2.5
2.1
1.5
1.0
3.7
0.2
1.7
2.7
2.9
1.2
28
.01
.20
.00
.43
6.0
-16
.2-8
.32
.80
.15
TT
-11
(11
)2
71
0.7
30
.71
4.2
8.3
5.0
3.3
2.0
1.8
1.3
4.8
0.0
0.7
2.5
3.0
1.2
0.3
0.7
17
.03
.02
4.7
23
.03
65
TT
-11
(12
)2
71
1.2
34
.78
.88
.02
.82
.62
.94
.11
.63
.70
.00
.42
.63
.90
.40
.83
.11
4.7
4.9
25
.52
0.6
9.6
TT
-11
(13
)2
71
2.7
35
.01
2.1
8.0
3.8
3.6
2.6
1.5
1.1
4.5
0.0
0.9
3.4
2.6
0.4
1.1
2.6
14
.81
.72
4.9
TT
-11
(14
)2
71
8.6
31
.64
.48
.71
.60
.52
.11
.60
.70
.70
.02
.68
.70
.70
.72
4.0
1.3
5.5
4.1
40
.9-8
.2-1
1.0
TT
-11
(15
)2
72
3.9
34
.07
.28
.32
.20
.63
.70
.41
.02
.80
.00
.99
.51
.51
.32
.11
.91
4.9
7.1
31
.22
1.0
26
9
TT
-11
(16
)2
72
4.8
33
.17
.88
.02
.00
.92
.30
.70
.82
.50
.30
.58
.33
.80
.50
.03
.01
5.0
10
.03
0.6
TT
-11
(17
)2
72
5.4
33
.27
.68
.11
.61
.34
.92
.30
.32
.30
.00
.87
.12
.01
.91
.83
.01
5.7
5.8
31
.5
TT
-11
(18
)2
72
8.7
33
.26
.08
.01
.21
.21
4.0
5.3
0.2
0.5
0.0
0.3
13
.01
.01
.76
.50
.56
.20
.52
8.9
12
.31
3
TT
-11
(19
)2
72
9.8
33
.96
.47
.52
.91
.65
.64
.00
.82
.40
.00
.68
.32
.11
.61
.02
.41
4.3
4.3
29
.7
TT
-11
(20
)2
73
5.3
32
.51
2.5
8.7
4.4
2.9
1.0
1.4
0.7
3.1
0.5
0.0
3.1
2.4
1.4
3.8
3.1
14
.34
.02
8.1
TT
-11
(21
)2
74
2.7
33
.81
2.0
7.0
3.3
3.8
3.8
2.0
0.8
3.0
0.0
0.5
3.5
4.3
1.0
1.8
3.8
9.8
6.3
24
.2
TT
-11
(22
)2
74
7.2
32
.81
2.0
8.2
3.3
4.6
3.9
3.0
0.3
2.6
0.0
0.3
3.3
3.3
0.7
0.5
1.3
14
.35
.62
3.4
TT
-11
(23
)2
74
8.8
32
.31
2.5
7.8
3.7
4.7
3.7
3.0
0.3
2.8
0.2
0.2
2.9
4.7
1.3
0.2
0.0
15
.04
.72
4.1
20
.11
76
TT
-11
(24
)2
74
9.3
36
.21
0.2
8.7
2.6
2.4
2.9
2.1
0.9
3.9
0.0
0.0
3.3
2.5
0.9
1.3
2.9
13
.85
.32
4.7
TT
-11
(25
)2
74
9.9
34
.51
3.5
7.8
3.0
2.6
3.9
3.0
0.9
3.3
0.0
0.0
1.7
2.7
0.5
0.9
1.7
14
.74
.72
2.2
TT
-11
(26
)2
78
3.7
36
.91
0.5
6.8
1.8
2.6
2.3
4.3
0.5
3.1
0.0
0.5
3.1
3.1
0.8
3.5
3.3
13
.03
.82
6.8
20
.08
8
TT
-11
(27
)2
78
6.5
34
.81
4.8
8.4
1.5
1.7
2.2
2.0
0.5
2.5
0.0
0.7
6.2
4.2
1.5
3.5
5.4
7.5
2.5
28
.3
TT
-11
(28
)2
78
7.1
35
.41
1.0
7.5
2.8
1.3
2.9
1.9
0.9
2.8
0.0
0.0
2.3
4.7
0.2
2.6
5.1
14
.04
.92
8.9
TT
-11
(29
)2
78
9.9
34
.81
5.5
8.8
2.2
1.5
0.5
0.7
0.2
2.7
0.0
0.0
1.2
1.2
0.7
28
.01
.00
.01
.03
2.1
TT
-15
(1)
26
56
.03
9.7
6.6
6.2
4.0
2.4
2.1
2.1
0.7
3.9
0.2
0.0
2.7
1.3
1.3
0.2
4.6
16
.55
.32
6.6
20
.35
8.5
TT
-15
(2)
26
57
.33
4.3
9.2
5.5
4.6
3.5
5.1
4.5
0.8
3.3
0.0
0.3
1.4
2.3
0.8
0.2
4.0
15
.84
.12
4.5
20
.57
6.6
TT
-15
(3)
26
58
.34
4.7
4.2
3.2
2.8
2.6
1.3
3.1
0.8
3.2
0.0
0.3
3.1
2.3
0.5
1.1
4.5
17
.34
.32
8.8
22
.45
9.2
TT
-15
(4)
26
59
.03
8.1
6.6
6.7
2.7
2.2
2.2
1.6
1.0
3.1
0.0
1.2
2.5
2.5
1.0
0.8
4.5
17
.85
.12
9.1
21
.83
4.0
TT
-15
(5)
26
60
.03
3.2
6.9
5.8
3.5
1.4
1.9
4.7
0.8
2.6
0.0
0.5
5.4
4.0
0.7
17
.01
1.0
0.0
0.9
38
.1
TT
-15
(6)
27
17
.63
5.9
12
.86
.23
.22
.70
.30
.60
.43
.40
.00
.04
.13
.90
.41
8.0
4.8
0.0
3.9
31
.2
TT
-15
(7)
31
31
.33
9.0
7.9
4.1
2.9
2.8
6.1
7.5
1.2
1.2
0.0
0.0
2.3
5.6
1.2
0.6
3.0
9.3
4.8
22
.0
TT
-15
(8
)3
13
2.0
40
.34
.63
.93
.02
.42
.11
.32
.12
.00
.00
.03
.43
.40
.41
.83
.41
4.2
11
.02
6.6
TT
-15
(9)
31
33
.03
5.8
4.8
4.7
2.0
3.8
5.1
4.4
0.8
2.9
0.0
0.5
3.1
4.0
1.1
3.4
4.4
12
.85
.82
8.8
TT
-15
(10
)3
13
5.0
36
.16
.56
.32
.73
.12
.73
.12
.72
.10
.02
.13
.92
.90
.46
.11
.61
3.3
4.7
28
.21
2.0
53
.1
TT
-15
(11
)3
13
7.0
44
.72
.41
.91
.92
.21
.52
.41
.82
.20
.00
.24
.41
.80
.43
.29
.51
4.0
5.0
33
.3
Sal
da
Nad
i1
77
0.0
18
.3-1
1.9
-11
.6
Sal
da
Nad
i2
31
1.0
21
.3-5
.8-9
.3
Sal
da
Nad
i2
31
2.0
27
.3-4
.1-9
.0