dfa investment dimensions group - pacific life
TRANSCRIPT

Annual ReportYear Ended: October 31, 2020
DFA INVESTMENT DIMENSIONS GROUP INC.
VA U.S. Targeted Value Portfolio
VA U.S. Large Value Portfolio
VA International Value Portfolio
VA International Small Portfolio
VA Short-Term Fixed Portfolio
VA Global Bond Portfolio
VIT Inflation-Protected Securities Portfolio
VA Global Moderate Allocation Portfolio
VA Equity Allocation Portfolio
See the inside front cover for important information about access to your fund’s annual and semi-annual shareholder reports.


Important information about access to shareholder reports
Beginning on January 1, 2021, as permitted by regulations adopted by the Securities and ExchangeCommission, you may not be receiving paper copies of a Portfolio’s annual and semi-annual shareholder reportsby mail, unless you specifically request paper copies of the reports from the insurance company that offers yourvariable annuity or variable life insurance contract or from your financial intermediary. Instead of delivering papercopies of the reports, the insurance company may choose to make the reports available on a website, and will notifyyou by mail each time a shareholder report is posted and provide you with a website link to access the report.Instructions for requesting paper copies will be provided by your insurance company.
If you already elected to receive shareholder reports electronically, you will not be affected by this change andyou need not take any action. You may elect to receive shareholder reports and other communicationselectronically from the insurance company or your financial intermediary anytime by following the instructionsprovided by the insurance company or by contacting your financial intermediary.
You may elect to receive all future shareholder reports in paper free of charge from the insurance company.You can inform the insurance company or your financial intermediary that you wish to continue receiving papercopies of your shareholder reports by following the instructions provided by the insurance company or bycontacting your financial intermediary. Your election to receive reports in paper will apply to all portfolio companiesavailable under your contract with the insurance company.

[THIS PAGE INTENTIONALLY LEFT BLANK]

December 2020 Dear Fellow Shareholder, As we come to the end of a year that saw an array of challenges, we want to thank you for the honor of serving you. We recognize that your financial assets play a vital role in your future, and we have tremendous gratitude for the faith you place in us by entrusting those assets with Dimensional. Since the day our firm was founded nearly 40 years ago, we have focused on bringing the great ideas in finance to life for investors. We believe that a sensible, financial science-based approach offers people the best chance at a successful investment experience. With that as a guiding principle, we continue to innovate in the strategies we offer and how they are executed. We look forward to further work on these efforts—if there’s a better way to do something, we want to pursue it. We also place great value on helping our clients understand what they can expect from us. We strive to be transparent about what we can deliver, and to then excel in our execution. That’s how we help clients achieve their financial goals. And at Dimensional, we believe that when investors win, we all win. On behalf of over 1,400 employees, we send our deepest appreciation for letting us serve as the investment manager of your assets. Sincerely,
David P. Butler Gerard O’Reilly CO-CHIEF EXECUTIVE OFFICER CO-CHIEF EXECUTIVE OFFICER and CHIEF INVESTMENT OFFICER

[THIS PAGE INTENTIONALLY LEFT BLANK]

DFA INVESTMENT DIMENSIONS GROUP INC.
ANNUAL REPORT
Table of Contents
PageLetter to ShareholdersDefinitions of Abbreviations and Footnotes. . . . . . . . . . . . . . . . . . . . . . . . . . . . . . . . . . . . . . . . . . . . . . . . . . . . . . . . . . . . . . . . . . . . 1
Performance Charts. . . . . . . . . . . . . . . . . . . . . . . . . . . . . . . . . . . . . . . . . . . . . . . . . . . . . . . . . . . . . . . . . . . . . . . . . . . . . . . . . . . . . . . . . . . . 3Management’s Discussion and Analysis. . . . . . . . . . . . . . . . . . . . . . . . . . . . . . . . . . . . . . . . . . . . . . . . . . . . . . . . . . . . . . . . . . . . . . . 8Disclosure of Fund Expenses. . . . . . . . . . . . . . . . . . . . . . . . . . . . . . . . . . . . . . . . . . . . . . . . . . . . . . . . . . . . . . . . . . . . . . . . . . . . . . . . . . 16Disclosure of Portfolio Holdings. . . . . . . . . . . . . . . . . . . . . . . . . . . . . . . . . . . . . . . . . . . . . . . . . . . . . . . . . . . . . . . . . . . . . . . . . . . . . . . . 18Schedules of Investments/Summary Schedules of Portfolio Holdings
VA U.S. Targeted Value Portfolio. . . . . . . . . . . . . . . . . . . . . . . . . . . . . . . . . . . . . . . . . . . . . . . . . . . . . . . . . . . . . . . . . . . . . . . . . . 20VA U.S. Large Value Portfolio. . . . . . . . . . . . . . . . . . . . . . . . . . . . . . . . . . . . . . . . . . . . . . . . . . . . . . . . . . . . . . . . . . . . . . . . . . . . . 23VA International Value Portfolio. . . . . . . . . . . . . . . . . . . . . . . . . . . . . . . . . . . . . . . . . . . . . . . . . . . . . . . . . . . . . . . . . . . . . . . . . . . . 26VA International Small Portfolio. . . . . . . . . . . . . . . . . . . . . . . . . . . . . . . . . . . . . . . . . . . . . . . . . . . . . . . . . . . . . . . . . . . . . . . . . . . . 30VA Short-Term Fixed Portfolio. . . . . . . . . . . . . . . . . . . . . . . . . . . . . . . . . . . . . . . . . . . . . . . . . . . . . . . . . . . . . . . . . . . . . . . . . . . . . 34VA Global Bond Portfolio. . . . . . . . . . . . . . . . . . . . . . . . . . . . . . . . . . . . . . . . . . . . . . . . . . . . . . . . . . . . . . . . . . . . . . . . . . . . . . . . . . . 38VIT Inflation-Protected Securities Portfolio. . . . . . . . . . . . . . . . . . . . . . . . . . . . . . . . . . . . . . . . . . . . . . . . . . . . . . . . . . . . . . . . 45VA Global Moderate Allocation Portfolio. . . . . . . . . . . . . . . . . . . . . . . . . . . . . . . . . . . . . . . . . . . . . . . . . . . . . . . . . . . . . . . . . . 46VA Equity Allocation Portfolio. . . . . . . . . . . . . . . . . . . . . . . . . . . . . . . . . . . . . . . . . . . . . . . . . . . . . . . . . . . . . . . . . . . . . . . . . . . . . . 47
Statements of Assets and Liabilities. . . . . . . . . . . . . . . . . . . . . . . . . . . . . . . . . . . . . . . . . . . . . . . . . . . . . . . . . . . . . . . . . . . . . . . . . . . 48Statements of Operations. . . . . . . . . . . . . . . . . . . . . . . . . . . . . . . . . . . . . . . . . . . . . . . . . . . . . . . . . . . . . . . . . . . . . . . . . . . . . . . . . . . . . . 51Statements of Changes in Net Assets. . . . . . . . . . . . . . . . . . . . . . . . . . . . . . . . . . . . . . . . . . . . . . . . . . . . . . . . . . . . . . . . . . . . . . . . . 54Financial Highlights. . . . . . . . . . . . . . . . . . . . . . . . . . . . . . . . . . . . . . . . . . . . . . . . . . . . . . . . . . . . . . . . . . . . . . . . . . . . . . . . . . . . . . . . . . . . . 58Notes to Financial Statements. . . . . . . . . . . . . . . . . . . . . . . . . . . . . . . . . . . . . . . . . . . . . . . . . . . . . . . . . . . . . . . . . . . . . . . . . . . . . . . . . 63Report of Independent Registered Public Accounting Firm. . . . . . . . . . . . . . . . . . . . . . . . . . . . . . . . . . . . . . . . . . . . . . . . . . 82
Fund Management. . . . . . . . . . . . . . . . . . . . . . . . . . . . . . . . . . . . . . . . . . . . . . . . . . . . . . . . . . . . . . . . . . . . . . . . . . . . . . . . . . . . . . . . . . . . . . . . . 83Board of Directors Table. . . . . . . . . . . . . . . . . . . . . . . . . . . . . . . . . . . . . . . . . . . . . . . . . . . . . . . . . . . . . . . . . . . . . . . . . . . . . . . . . . . . . . . . 84
Voting Proxies on Fund Portfolio Securities. . . . . . . . . . . . . . . . . . . . . . . . . . . . . . . . . . . . . . . . . . . . . . . . . . . . . . . . . . . . . . . . . . . 91Notice to Shareholders. . . . . . . . . . . . . . . . . . . . . . . . . . . . . . . . . . . . . . . . . . . . . . . . . . . . . . . . . . . . . . . . . . . . . . . . . . . . . . . . . . . . . . . . . . . . 92
This report is submitted for the information of each Portfolio’s shareholders. It is not authorized for distribution toprospective investors unless preceded or accompanied by an effective prospectus.
i

[THIS PAGE INTENTIONALLY LEFT BLANK]

DFA INVESTMENT DIMENSIONS GROUP INC.
DEFINITIONS OF ABBREVIATIONS AND FOOTNOTES
Summary Schedules of Portfolio Holdings/Schedules of Investments
Investment AbbreviationsP.L.C. Public Limited CompanyADR American Depositary ReceiptSA Special AssessmentLIBOR London Interbank Offered RateSOFR Secured Overnight Financing RateUSTMMR U.S. Treasury Money Market RateUSD United States DollarAUD Australian DollarsCAD Canadian DollarsEUR EuroGBP British PoundsNOK Norwegian KroneSEK Swedish KronaSGD Singapore Dollars
Investment Footnotes† See Note B to Financial Statements.‡ Calculated as a percentage of total net assets. Percentages shown parenthetically next
to the category headings have been calculated as a percentage of total investments.“Other Securities” are those securities that are not among the top 50 holdings inunaffiliated issuers of the Fund or do not represent more than 1.0% of the net assets ofthe Fund. Some of the individual securities within this category may include Total orPartial Securities on Loan and/or Non-Income Producing Securities.
* Non-Income Producing Securities.# Total or Partial Securities on Loan.@ Security purchased with cash collateral received from Securities on Loan.§ Affiliated Fund.» Securities that have generally been fair value factored. See Note B to Financial
Statements.Ω Rule 144A, Section 4(2), or other security that is restricted as to resale to institutional
investors. This security has been deemed liquid based upon the Fund’s LiquidityGuidelines. The liquidity determination is unaudited.
(r) The adjustable rate shown is effective as of October 31, 2020. Interest rate disclosed isas of the most recent information available. Certain variable rate securities are notbased on a published reference rate and spread but are determined by the issuer oragent and are based on current market conditions. These securities do not indicate areference rate and spread in their description.
^ Denominated in USD, unless otherwise noted.± Face Amount of security is not adjusted for inflation.
1

Financial Highlights
(A) Computed using average shares outstanding.(B) Represents the combined ratios for the respective Portfolio and its respective pro-rata
share of its Underlying Funds.(C) Non-Annualized(D) Annualized(E) Because of commencement of operations and related preliminary transaction costs,
these ratios are not necessarily indicative of future ratios.
All Statements, Schedules and Notes to Financial Statements
— Amounts designated as — are either zero or rounded to zero.SEC Securities and Exchange CommissionƱ Commencement of Operations.
CONTINUED
2

DFA INVESTMENT DIMENSIONS GROUP INC.
PERFORMANCE CHARTS(Unaudited)
VA U.S. Targeted Value Portfolio vs.Russell 2000® Value IndexOctober 31, 2010-October 31, 2020
Growth of $10,000
$19,789$21,453
$0
$10,000
$30,000
$20,000
10/10 10/202018 20192011 2012 2013 2014 2015 20172016
VA U.S. Targeted Value Portfolio
Russell 2000® Value Index
Past performance is not predictive offuture performance.
The returns shown do not reflect thededuction of taxes that a shareholderwould pay on fund distributions or theredemption of fund shares.
Frank Russell Company is the sourceand owner of the trademarks, servicemarks, and copyrights related to theRussell Indexes.
Average AnnualTotal Return
OneYear
FiveYears
TenYears
-13.18% 2.38% 7.93%
VA U.S. Large Value Portfolio vs.Russell 1000® Value IndexOctober 31, 2010-October 31, 2020
Growth of $10,000
$24,502$24,732
$0
$10,000
$30,000
$20,000
10/10 10/202018 20192011 2012 2013 2014 2015 2016 2017
VA U.S. Large Value Portfolio
Russell 1000® Value Index
Past performance is not predictive offuture performance.
The returns shown do not reflect thededuction of taxes that a shareholderwould pay on fund distributions or theredemption of fund shares.
Frank Russell Company is the sourceand owner of the trademarks, servicemarks, and copyrights related to theRussell Indexes.
Average AnnualTotal Return
OneYear
FiveYears
TenYears
-12.12% 4.57% 9.38%
3

DFA INVESTMENT DIMENSIONS GROUP INC.
PERFORMANCE CHARTS(Unaudited)
VA International Value Portfolio vs.MSCI World ex USA Index (net dividends)October 31, 2010-October 31, 2020
Growth of $10,000
$0
$10,000
$20,000
2019201810/10 20172011 2012 2013 2014 2015 2016 10/20
VA International Value Portfolio
MSCI World ex USA Index (net dividends)
$10,922
$14,226
Past performance is not predictive offuture performance.
The returns shown do not reflect thededuction of taxes that a shareholderwould pay on fund distributions or theredemption of fund shares.
MSCI data © MSCI 2020, all rightsreserved.
Average AnnualTotal Return
OneYear
FiveYears
TenYears
-18.49% -0.36% 0.89%
VA International Small Portfolio vs.MSCI World ex USA Small Cap Index (net dividends)October 31, 2010-October 31, 2020
Growth of $10,000
$17,169$17,520
$0
$10,000
$30,000
VA International Small Portfolio
MSCI World ex USA Small Cap Index (net dividends)
$20,000
2019201810/10 20172011 2012 2013 2014 2015 2016 10/20
Past performance is not predictive offuture performance.
The returns shown do not reflect thededuction of taxes that a shareholderwould pay on fund distributions or theredemption of fund shares.
MSCI data © MSCI 2020, all rightsreserved.
Average AnnualTotal Return
OneYear
FiveYears
TenYears
-3.66% 4.28% 5.55%
4

DFA INVESTMENT DIMENSIONS GROUP INC.
PERFORMANCE CHARTS(Unaudited)
VA Short-Term Fixed Portfolio vs.ICE BofAML US 6-Month Treasury Bill Index,ICE BofAML 1-Year US Treasury Note IndexOctober 31, 2010-October 31, 2020
Growth of $10,000
$0
$10,000
$20,000
ICE BofAML 1-Year US Treasury Note Index
VA Short-Term Fixed Portfolio
ICE BofAML US 6-Month Treasury Bill Index
2017 2019201810/10 2011 2012 2013 2014 2015 2016 10/20
$10,964
$10,839$10,871
Past performance is not predictive offuture performance.
The returns shown do not reflect thededuction of taxes that a shareholderwould pay on fund distributions or theredemption of fund shares.
ICE BofA index data copyright 2020 ICEData Indices, LLC
Average AnnualTotal Return
OneYear
FiveYears
TenYears
0.84% 1.26% 0.84%
VA Global Bond Portfolio vs.FTSE World Government Bond Index, 1-5 Years,Currency-Hedged in USD TermsOctober 31, 2010-October 31, 2020
Growth of $10,000
$12,066$12,458
$0
$10,000
$20,000
VA Global Bond Portfolio
FTSE World Government Bond Index, 1-5 Years,Currency-Hedged in USD Terms
2017 2019201810/10 2011 2012 2013 2014 2015 2016 10/20
Past performance is not predictive offuture performance.
The returns shown do not reflect thededuction of taxes that a shareholderwould pay on fund distributions or theredemption of fund shares.
FTSE fixed income indices © 2020 FTSEFixed Income LLC. All rights reserved.
Average AnnualTotal Return
OneYear
FiveYears
TenYears
1.54% 2.11% 2.22%
5

DFA INVESTMENT DIMENSIONS GROUP INC.
PERFORMANCE CHARTS(Unaudited)
VIT Inflation Protected Securities Portfolio vs.Bloomberg Barclays U.S. TIPS IndexMay 29, 2015-October 31, 2020
Growth of $10,000
$0
$10,000
$20,000
10/17 10/2010/1910/1805/29/15 10/1610/15
VIT Inflation Protected Securities Portfolio
Bloomberg Barclays U.S. TIPS Index
$12,152$12,185
Past performance is not predictive offuture performance.
The returns shown do not reflect thededuction of taxes that a shareholderwould pay on fund distributions or theredemption of fund shares.
Bloomberg Barclays data provided byBloomberg Finance L.P.
Total ReturnOneYear
FiveYears
SinceInception
9.72% 4.46% 3.66%
VA Global Moderate Allocation Portfolio vs.MSCI All Country World Index (net dividends),FTSE World Government Bond Index, 1-3 Years, Currency-Hedged in USD Terms,65% MSCI ACWI (net div)/35%FTSE World Govt Bond Index 1-3 yr (hedged) IndexApril 8, 2013-October 31, 2020
Growth of $10,000
$0
$10,000
$20,000
10/16 10/2010/1910/17 10/1810/1504/08/13 10/13 10/14
$15,467
$17,923
$15,400
$11,241
VA Global Moderate Allocation PortfolioMSCI All Country World Index (net dividends)FTSE World Government Bond Index, 1-3 Years, Currency-Hedged in USD Terms65% MSCI ACWI (net div)/35% FTSE World Govt Bond Index 1-3 yr (hedged) Index
Past performance is not predictive offuture performance.
The returns shown do not reflect thededuction of taxes that a shareholderwould pay on fund distributions or theredemption of fund shares.
MSCI data © MSCI 2020, all rightsreserved.
FTSE fixed income indices © 2020 FTSEFixed Income LLC. All rights reserved.
Data includes composite data frommultiple sources; see data descriptionsfor additional details. MSCI data © MSCI2020, all rights reserved. FTSE fixedincome indices © 2020 FTSE FixedIncome LLC. All rights reserved.
Total ReturnOneYear
FiveYears
SinceInception
3.35% 5.97% 5.88%
6

DFA INVESTMENT DIMENSIONS GROUP INC.
PERFORMANCE CHARTS(Unaudited)
VA Equity Allocation Portfolio vs.MSCI World Index (net dividends)July 10, 2017-October 31, 2020
Growth of $10,000
$0
$10,000
$20,000
10/2010/19 04/2010/18 04/1910/17 04/1807/10/17
VA Equity Allocation Portfolio
MSCI World Index (net dividends)
$11,697$12,701
Past performance is not predictive offuture performance.
The returns shown do not reflect thededuction of taxes that a shareholderwould pay on fund distributions or theredemption of fund shares.
MSCI data © MSCI 2020, all rightsreserved.
Total ReturnOneYear
SinceInception
-0.25% 4.85%
7

MANAGEMENT’S DISCUSSION AND ANALYSIS
U.S. Equity Market Review 12 Months Ended October 31, 2020
U.S. equities had mostly positive returns for the period. The broad U.S. equity market, as measured by the Russell 3000® Index, gained approximately 10.15%. As measured by Russell indices, small-cap stocks underperformed large-cap stocks, and mid-cap stocks, a subset of the large-cap universe, underperformed large-cap stocks but outperformed small-cap stocks. Value stocks underperformed growth stocks as measured by the Russell indices.
Total Return for 12 Months Ended October 31, 2020
Russell 3000® Index........................................................................................................................... 10.15% Russell 1000® Index (large-cap stocks)................................................................................................ 10.87% Russell Midcap® Index (mid-cap stocks).............................................................................................. 4.12% Russell 2000® Index (small-cap stocks)............................................................................................... -0.14%Russell Microcap® Index (micro-cap stocks)......................................................................................... 3.15% Dow Jones U.S. Select REIT Index SM ..................................................................................................
Total Return for 12 Months Ended October 31, 2020
Russell 1000® Value Index (large-cap value stocks).............................................................................. Russell 1000® Growth Index (large-cap growth stocks).......................................................................... Russell 2000® Value Index (small-cap value stocks)............................................................................. Russell 2000® Growth Index (small-cap growth stocks).........................................................................
-25.14%
-7.57% 29.22% -13.92%13.37%
Source: Frank Russell Company is the source and owner of the trademarks, service marks, and copyrights related to the Russell Indexes.
VA U.S. Targeted Value Portfolio The VA U.S. Targeted Value Portfolio invests in a broadly diversified group of U.S. small- and
mid-cap value stocks. The investment strategy is process driven, emphasizing broad diversification. As of October 31, 2020, the Portfolio held approximately 1,220 securities. Average cash exposure throughout the year was less than 1% of the Portfolio’s assets.
For the 12 months ended October 31, 2020, total returns were -13.18% for the Portfolio and -13.92% for the Russell 2000® Value Index, the Portfolio’s benchmark. The Portfolio’s exclusions of realestate investment trusts (REITs) and highly regulated utilities contributed positively to performancerelative to the benchmark, as REITs and utilities generally underperformed in the U.S. Conversely, withlow relative price (value) stocks underperforming high relative price (growth) stocks, the Portfolio’sgreater emphasis on value stocks detracted from relative performance.
VA U.S. Large Value Portfolio The VA U.S. Large Value Portfolio is designed to capture the returns of U.S. large company low
relative price (value) stocks. The investment strategy is process driven, emphasizing broad diversification with increased exposure to stocks with smaller market capitalizations, lower relative price (value), and higher profitability within the large-cap value segment of the U.S. market. As of October 31, 2020, the
8

Portfolio held approximately 360 securities. Average cash exposure throughout the year was less than 1% of the Portfolio’s assets.
For the 12 months ended October 31, 2020, total returns were -12.12% for the Portfolio and -7.57% for the Russell 1000® Value Index, the Portfolio’s benchmark. With low relative price (value) stocks underperforming high relative price (growth) stocks, the Portfolio’s greater emphasis on value stocks had a negative impact on performance relative to the benchmark. Conversely, the Portfolio’s exclusion of real estate investment trusts (REITs) contributed positively relative performance, as REITs generally underperformed in the U.S.
International Equity Market Review 12 Months Ended October 31, 2020
Performance of non-U.S. developed markets was mostly negative for the period. As measured by the MSCI World ex USA indices, small-cap stocks outperformed large-cap stocks, and mid-cap stocks, a subset of the large-cap universe, outperformed large-cap stocks but underperformed small-cap stocks. Value stocks underperformed growth stocks as measured by the MSCI World ex USA indices.
12 Months Ended October 31, 2020
Return in U.S. Dollars MSCI World ex USA Index.................................................................................................................. -6.79% MSCI World ex USA Mid Cap Index..................................................................................................... -3.83% MSCI World ex USA Small Cap Index.................................................................................................. -0.65% MSCI World ex USA Value Index......................................................................................................... -18.72% MSCI World ex USA Growth Index....................................................................................................... 5.65%
For the 12 Months Ended October 31, 2020, the U.S. dollar depreciated against most non-U.S. developed markets currencies. Overall, currency movements had a positive impact on the U.S. dollar-denominated returns of developed markets.
12 Months Ended October 31, 2020
Ten Largest Foreign Developed Markets by Market Cap Local Return Return in U.S. Dollars Japan................................................................................................ -2.97% 0.33% United Kingdom............................................................................... -22.19% -22.25% France.............................................................................................. -17.43% -13.79% Switzerland...................................................................................... -4.37% 2.95% Canada............................................................................................. -4.70% -6.05% Germany.......................................................................................... -10.77% -6.84% Australia.......................................................................................... -11.01% -9.29% Netherlands..................................................................................... 4.14% 8.62% Hong Kong....................................................................................... -8.06% -7.15% Sweden........................................................................................... 0.79% 9.10%
Source: Returns are of MSCI standard indices net of foreign withholding taxes on dividends. Copyright MSCI 2020, all rights reserved.
9

Emerging markets had mostly positive performance for the period, outperforming non-U.S. developed markets but underperforming the U.S. As measured by the MSCI Emerging Markets indices, small-cap stocks underperformed large-cap stocks, and mid-cap stocks, a subset of the large-cap universe, underperformed large-cap stocks and small-cap stocks. Value stocks underperformed growth stocks as measured by the MSCI Emerging Markets indices.
12 Months Ended October 31, 2020
Return in U.S. Dollars MSCI Emerging Markets Index............................................................................................................. 8.25%MSCI Emerging Markets Mid Cap Index................................................................................................ -3.22%MSCI Emerging Markets Small Cap Index............................................................................................. 2.39%MSCI Emerging Markets Value Index.................................................................................................... -8.47%MSCI Emerging Markets Growth Index.................................................................................................. 25.97%
For the 12 Months Ended October 31, 2020, the U.S. dollar depreciated against some emerging markets currencies and appreciated against others. Overall, currency movements had a negative impact on the U.S. dollar denominated returns of emerging markets.
12 Months Ended October 31, 2020
Ten Largest Emerging Markets by Market Cap Local Return Return in U.S. Dollars China............................................................................................................... 33.57% 35.19% Taiwan............................................................................................................. 18.86% 26.49% Korea............................................................................................................... 11.33% 14.15% India................................................................................................................ 1.83% -2.54% Brazil............................................................................................................... -11.13% -38.13% South Africa..................................................................................................... -6.49% -13.31% Saudi Arabia..................................................................................................... -0.90% -0.90% Russia............................................................................................................. -14.17% -29.27% Thailand........................................................................................................... -28.54% -30.77% Malaysia............................................................................................................. -6.02% -5.49%
Source: Returns are of MSCI standard indices net of foreign withholding taxes on dividends. Copyright MSCI 2020, all rights reserved.
For Portfolios investing in non-U.S. equities traded outside of the U.S. market time zone, differences in the valuation timing and methodology between a Portfolio and its benchmark index may impact relative performance over the referenced period. The Portfolios price foreign exchange rates at the closing of the U.S. market, while their benchmark indices use rates at 4 p.m. London time. The Portfolios also may use fair value pricing to price certain portfolio securities at the closing of the U.S.
10

market, while benchmark indices may use local market closing prices. For the one-year period ended October 31, 2020, these differences generally contributed positively to the Portfolios’ relative performance.
VA International Value Portfolio The VA International Value Portfolio invests in developed ex U.S. large company value stocks.
The investment strategy is process driven, emphasizing broad diversification, with increased exposure to stocks with smaller total market capitalizations, lower relative price (value), and higher-profitability within the large-cap value segment of developed ex U.S. markets. As of October 31, 2020, the Portfolio held approximately 520 securities in 22 eligible developed markets. Average cash exposure throughout the year was less than 1% of the Portfolio’s assets.
For the 12 months ended October 31, 2020, total returns were -18.49% for the Portfolio and -6.79% for the MSCI World ex USA Index (net dividends), the Portfolio’s benchmark. With low relative price (value) stocks underperforming high relative price (growth) stocks for the period, the Portfolio’s focus on value stocks detracted from performance relative to the style-neutral benchmark.
VA International Small Portfolio The VA International Small Portfolio invests in developed ex U.S. small company stocks. The
Portfolio generally excluded stocks with the lowest profitability and highest relative price. The investment strategy is process driven, emphasizing broad diversification. As of October 31, 2020, the Portfolio held approximately 3,410 securities in 22 eligible developed markets. Average cash exposure throughout the year was less than 1% of the Portfolio’s assets.
For the 12 months ended October 31, 2020, total returns were -3.66% for the Portfolio and -0.65% for the MSCI World ex USA Small Cap Index (net dividends), the Portfolio’s benchmark. The Portfolio’s exclusion of stocks with the lowest profitability and highest relative price detracted from performance relative to the benchmark, as those stocks outperformed. Conversely, the Portfolio’s exclusion of real estate investment trusts (REITs) contributed positively to relative performance, as REITs generally underperformed in developed ex U.S. markets.
Fixed Income Market Review 12 Months Ended October 31, 2020
Bond yields decreased in the U.S. during the 12 months ended October 31, 2020. Short-term yields decreased more than long-term yields. However, given their longer duration, long-term bonds generally outperformed short-term bonds for the period. Bond yields also generally decreased in Germany, Italy, Spain, and the U.K., resulting in outperformance of longer-term bonds in these markets as well. Bond yields, however, generally increased in Japan during the period.
Long-term bond indices generally outperformed short-term bond indices in global developed fixed income markets for the 12 months ended October 31, 2020. For example, the FTSE World Government Bond Index 1-3 Years (hedged to USD) returned 2.44%, while the FTSE World Government Bond Index 20+ Years (hedged to USD) returned 8.76%. Within the U.S., the Bloomberg Barclays U.S. Treasury Bond Index 1-3 Years returned 3.25%, while the Bloomberg Barclays U.S. Treasury Bond Index 20+ Years returned 14.04%.
October 31, 2019 October 31, 2020 Change
11

One-Month Treasury Bill (yield)........................................ 1.59% 0.08% -1.51% Ten-Year U.S. Treasury Notes (yield)................................ Source: Bloomberg
1.69% 0.88% -0.81%
Many of Dimensional’s fixed income strategies use a variable maturity approach that identifies a maturity range with higher expected returns. When the yield curve is flat or inverted, short-term securities are believed to offer higher expected returns. When the yield curve is upwardly sloped, portfolio maturities may be lengthened to seek the higher expected returns associated with longer maturities. These higher returns may be achieved by capital appreciation (from holding bonds through an upwardly sloped term structure) as well as by earning higher current yields. During the period under review, the short-term Portfolios employing a variable maturity approach generally focused on the shorter-end of their eligible duration range, reflecting the relatively flat to inverted short-term segments of eligible yield curves. The intermediate-term Portfolios employing a variable maturity approach generally continued to maintain a duration near the longer end of their eligible range, reflecting the upward slope of the term structure from the intermediate to longer end of eligible yield curves.
Some of Dimensional’s fixed income strategies use a variable credit approach that varies exposure to lower quality securities. When credit spreads are narrow, higher-quality securities are emphasized. When credit spreads are wide, additional credit exposure may be taken in order to position a Portfolio to seek higher expected returns by capturing high expected credit premiums. Credit spreads began the period relatively narrow and then widened in early 2020 before narrowing at the end of the period. As a result, the variable credit Portfolios began the period positioned below their maximum allowable weights in single-A, BBB, and BB rated bonds. As credit spreads widened during the period, the variable credit Portfolios generally increased their allocations to single-A, BBB, and, where appropriate, BB rated bonds. Realized credit premiums were generally positive for short-term bonds but negative for intermediate- and long-term bonds. Credit bonds did, however, generally outperform securitized bonds, such as mortgage backed securities, over the period.
VA Short-Term Fixed Portfolio The VA Short-Term Fixed Portfolio is designed to achieve a stable real return in excess of the
rate of inflation by generally investing in high-quality fixed income securities and maintaining a weighted average portfolio maturity of one year or less. The investment strategy uses a variable maturity approach and shifts maturities based on changes in the yield curve. The strategy uses current yields and identifies favorable maturity ranges of expected returns based on potential buy and sell strategies. Maturity targets are shifted based on Dimensional’s expectations for term premiums. The weighted average duration of the Portfolio was relatively unchanged at 0.19 year as of October 31, 2020, from 0.14 year as of October 31, 2019.
For the 12 months ended October 31, 2020, total returns were 0.84% for the Portfolio versus 1.30% for the ICE BofA U.S. 6-Month Treasury Bill Index and 2.02% for the ICE BofA 1-Year U.S. Treasury Note Index, the Portfolio’s benchmarks. The U.S. Treasury yield curve was flat along the Portfolio’s eligible maturity range, indicating smaller expected term premiums during the period. As a result, the Portfolio was focused at the shorter end of the eligible duration range. Interest rates decreased across
12

the eligible maturity range and realized term premiums were positive for the period. As such, the Portfolio’s shorter weighted average duration detracted from performance relative to both the ICE BofA U.S. 6-Month Treasury Bill Index, and the ICE BofA 1-Year U.S. Treasury Note Index.
VA Global Bond Portfolio The VA Global Bond Portfolio is designed to provide a market rate of return by investing in U.S.
and foreign government securities, high-quality corporate fixed income securities, and currency-hedged global fixed income instruments maturing in five years or less. The currency exposure associated with non-U.S. dollar-denominated securities within the Portfolio is generally hedged back to the U.S. dollar. The investment strategy uses a variable maturity approach and shifts maturities and country allocations based on changes in the eligible yield curves. The strategy uses current yields and identifies favorable maturity ranges of expected returns based on potential buy and sell strategies for each eligible country. Maturity targets and country allocations are shifted based on Dimensional’s expectations for term premiums. The weighted average duration of the Portfolio decreased to 0.95 year as of October 31, 2020, from 2.07 years as of October 31, 2019.
For the 12 months ended October 31, 2020, total returns were 1.54% for the Portfolio and 3.12% for the FTSE World Government Bond Index, 1-5 Years, Currency-Hedged in USD terms, the Portfolio’s benchmark. During the period, yield curves in global developed markets were generally flat along the Portfolio’s eligible maturity range, indicating smaller expected term premiums. As a result, the Portfolio’s weighted average duration was decreased. Realized term premiums, however, were generally positive in global developed markets for the period. As such, the Portfolio’s shorter weighted average duration relative to the benchmark—primarily due to an underweight to U.S. dollar-denominated securities in the three- to five-year maturity range and allocation to securities with maturities shorter than one year—detracted from relative performance. The Portfolio’s relative overweight to British pound- and euro-denominated securities also detracted from performance relative to the benchmark.
VIT Inflation-Protected Securities Portfolio The VIT Inflation-Protected Securities Portfolio is designed to provide inflation protection and
current income by investing generally in inflation-protected securities issued by the U.S. government and its agencies and instrumentalities with maturities of between five and 20 years. The weighted average duration of the Portfolio was relatively unchanged at 7.80 years as of October 31, 2020, compared to 7.74 years as of October 31, 2019.
For the 12 months ended October 31, 2020, total returns were 9.72% for the Portfolio and 9.09% for the Bloomberg Barclays U.S. Treasury TIPS Index, the Portfolio’s benchmark. Real interest rates generally decreased during the period and realized real term premiums were positive. The Portfolio’s emphasis on the intermediate segment of the real yield curve contributed positively to performance relative to the benchmark, as the intermediate segment outperformed the combination of the long and short ends of the real yield curve.
VA Global Moderate Allocation Portfolio The VA Global Moderate Allocation Portfolio seeks long-term capital appreciation and current
income by investing in a combination of other mutual funds managed by Dimensional that invest in domestic and international equity securities, including emerging markets securities, and fixed income securities. The Portfolio seeks to achieve its investment objective through a moderate allocation to both global equity and global fixed income securities. As of the date of this report, the Portfolio’s investments
13

in domestic equity funds included the U.S. Core Equity 1 Portfolio, the U.S. Core Equity 2 Portfolio, VA U.S. Large Value Portfolio, and the DFA Real Estate Securities Portfolio; the Portfolio’s investments in international equity funds included the International Core Equity Portfolio, Emerging Markets Core Equity Portfolio, and VA International Value Portfolio (collectively, the “Equity Underlying Funds”); and the Portfolio’s investments in fixed income funds included the DFA Two-Year Global Fixed Income Portfolio, DFA Selectively Hedged Global Fixed Income Portfolio, VA Global Bond Portfolio, and VA Short-Term Fixed Portfolio (“Fixed Income Underlying Funds,” and, collectively with the Equity Underlying Funds, the “Equity and Fixed Income Underlying Funds”). The investment strategy is process driven, emphasizing broad diversification. As of October 31, 2020, the Equity Underlying Funds collectively held approximately 13,460 securities in 47 eligible developed and emerging markets and the Fixed Income Underlying Funds collectively held approximately 690 fixed income securities in 21 countries, excluding supranationals.
For the 12 months ended October 31, 2020, total returns were 3.35% for the Portfolio and 4.66% for the Portfolio’s composite benchmark, a hypothetical composite index composed of 65% MSCI All Country World Index (net dividends), the Portfolio’s equity benchmark, and 35% FTSE World Government Bond Index 1-3 Years (hedged to USD), the Portfolio’s fixed income benchmark. The Portfolio’s equity component underperformed the equity component of the composite benchmark and detracted from the Portfolio’s performance relative to the composite benchmark. The Portfolio’s fixed income component underperformed the fixed income component of the composite benchmark and detracted from the Portfolio’s performance relative to the composite benchmark.
The Equity Underlying Funds’ greater emphasis on low relative price (value) stocks had a negative impact on performance relative to the benchmark, as value stocks underperformed high relative price (growth) stocks globally. With small-caps underperforming large-caps globally for the period, the Equity Underlying Funds’ inclusion of and emphasis on small-cap stocks also detracted from performance relative to the benchmark, which is composed primarily of large- and mid-cap stocks.
During the period ended October 31, 2020, yield curves in global developed markets were generally flat along the Fixed Income Underlying Funds’ eligible maturity range, indicating smaller expected term premiums. As a result, the Fixed Income Underlying Funds’ weighted average duration was decreased. Realized term premiums, however, were generally positive in global developed markets for the period as longer-term bonds generally outperformed shorter-term bonds. As such, the Fixed Income Funds’ shorter weighted average duration relative to the fixed income benchmark detracted from performance relative to the fixed income benchmark.
VA Equity Allocation Portfolio The VA Equity Allocation Portfolio seeks long-term capital appreciation by investing in a
combination of mutual funds managed by Dimensional that invest in domestic and international equity securities, including emerging markets securities. As of the date of this report, the Portfolio’s investments in the domestic equity funds included the U.S. Core Equity 1 Portfolio, the U.S. Large Company Portfolio, the VA U.S. Large Value Portfolio, the VA U.S. Targeted Value Portfolio, and the DFA Real Estate Securities Portfolio; and the Portfolio’s investments in the international equity funds included the International Core Equity Portfolio, the VA International Small Portfolio, the VA International Value Portfolio, and the Emerging Markets Core Equity Portfolio (collectively, the “Underlying Funds”). The investment strategy is process driven, emphasizing broad diversification. As of
14

October 31, 2020, the Underlying Funds collectively held approximately 13,600 securities in 47 eligible developed and emerging markets.
For the 12 months ended October 31, 2020, total returns were -0.25% for the Portfolio and 4.36% for the MSCI World Index (net dividends), the Portfolio’s benchmark. The Underlying Funds’ greater emphasis on low relative price (value) stocks had a negative impact on performance relative to the benchmark, as value stocks underperformed high relative price (growth) stocks globally. With small-caps underperforming large-caps globally for the period, the Underlying Funds’ inclusion of and emphasis on small-cap stocks also detracted from performance relative to the benchmark, which is composed primarily of large- and mid-cap stocks.
15

DFA INVESTMENT DIMENSIONS GROUP INC.
DISCLOSURE OF FUND EXPENSES
(Unaudited)
The following Expense Tables are shown so that you can understand the impact of fees on your investment. Allmutual funds have operating expenses. As a shareholder of the fund, you incur ongoing costs, which include costsfor portfolio management, administrative services, and shareholder reports, among others. Operating expenses andlegal and audit services, which are deducted from a fund’s gross income, directly reduce the investment return of thefund. A fund’s expenses are expressed as a percentage of its average net assets. This figure is known as the expenseratio. The following examples are intended to help you understand the ongoing costs, in dollars, of investing in thefund and to compare these costs with those of other mutual funds. The examples are based on an investment of$1,000 made at the beginning of the period shown and held for the entire period.
The Expense Tables below illustrate your fund’s costs in two ways.
Actual Fund Return
This section helps you to estimate the actual expenses after fee waivers that you paid over the period. The“Ending Account Value” shown is derived from the fund’s actual return and “Expenses Paid During Period”reflects the dollar amount that would have been paid by an investor who started with $1,000 in the fund. Youmay use the information here, together with the amount you invested, to estimate the expenses that you paidover the period.
To do so, simply divide your account value by $1,000 (for example, a $7,500 account value divided by $1,000= 7.5), then multiply the result by the number given for your fund under the heading “Expenses Paid DuringPeriod.”
Hypothetical Example for Comparison Purposes
This section is intended to help you compare your fund’s costs with those of other mutual funds. Thehypothetical “Ending Account Value” and “Expenses Paid During Period” are derived from the fund’s actualexpense ratio and an assumed 5% annual return before expenses. In this case, because the return used isnot the fund’s actual return, the results do not apply to your investment. The example is useful in makingcomparisons because the SEC requires all mutual funds to calculate expenses based on a 5% annual return.You can assess your fund’s costs by comparing this hypothetical example with the hypothetical examples thatappear in shareholder reports of other funds.
Please note that the expenses shown in the tables are meant to highlight and help you compare ongoing costsonly and do not reflect any transactional costs, if applicable. The “Annualized Expense Ratio” represents the actualexpenses for the six-month period indicated.
Six Months Ended October 31, 2020
EXPENSE TABLES
BeginningAccount
Value05/01/20
EndingAccount
Value10/31/20
AnnualizedExpenseRatio (1)
ExpensesPaid
DuringPeriod (1)
VA U.S. Targeted Value Portfolio
Actual Fund Return. . . . . . . . . . . . . . . . . . . . . . . . . . . . . . . . . . . . . . . . $1,000.00 $1,151.20 0.38% $2.05Hypothetical 5% Annual Return. . . . . . . . . . . . . . . . . . . . . . . . . . $1,000.00 $1,023.23 0.38% $1.93
VA U.S. Large Value Portfolio
Actual Fund Return. . . . . . . . . . . . . . . . . . . . . . . . . . . . . . . . . . . . . . . . $1,000.00 $1,065.10 0.27% $1.40Hypothetical 5% Annual Return. . . . . . . . . . . . . . . . . . . . . . . . . . $1,000.00 $1,023.78 0.27% $1.37
16

BeginningAccount
Value05/01/20
EndingAccount
Value10/31/20
AnnualizedExpenseRatio (1)
ExpensesPaid
DuringPeriod (1)
VA International Value Portfolio
Actual Fund Return. . . . . . . . . . . . . . . . . . . . . . . . . . . . . . . . . . . . . . . . $1,000.00 $1,074.10 0.43% $2.24Hypothetical 5% Annual Return. . . . . . . . . . . . . . . . . . . . . . . . . . $1,000.00 $1,022.98 0.43% $2.19
VA International Small Portfolio
Actual Fund Return. . . . . . . . . . . . . . . . . . . . . . . . . . . . . . . . . . . . . . . . $1,000.00 $1,152.00 0.56% $3.03Hypothetical 5% Annual Return. . . . . . . . . . . . . . . . . . . . . . . . . . $1,000.00 $1,022.32 0.56% $2.85
VA Short-Term Fixed Portfolio
Actual Fund Return. . . . . . . . . . . . . . . . . . . . . . . . . . . . . . . . . . . . . . . . $1,000.00 $1,001.00 0.21% $1.06Hypothetical 5% Annual Return. . . . . . . . . . . . . . . . . . . . . . . . . . $1,000.00 $1,024.08 0.21% $1.07
VA Global Bond Portfolio
Actual Fund Return. . . . . . . . . . . . . . . . . . . . . . . . . . . . . . . . . . . . . . . . $1,000.00 $1,007.60 0.23% $1.16Hypothetical 5% Annual Return. . . . . . . . . . . . . . . . . . . . . . . . . . $1,000.00 $1,023.98 0.23% $1.17
VIT Inflation-Protected Securities Portfolio
Actual Fund Return. . . . . . . . . . . . . . . . . . . . . . . . . . . . . . . . . . . . . . . . $1,000.00 $1,045.60 0.14% $0.72Hypothetical 5% Annual Return. . . . . . . . . . . . . . . . . . . . . . . . . . $1,000.00 $1,024.43 0.14% $0.71
VA Global Moderate Allocation Portfolio (2)
Actual Fund Return. . . . . . . . . . . . . . . . . . . . . . . . . . . . . . . . . . . . . . . . $1,000.00 $1,097.30 0.30% $1.58Hypothetical 5% Annual Return. . . . . . . . . . . . . . . . . . . . . . . . . . $1,000.00 $1,023.63 0.30% $1.53
VA Equity Allocation Portfolio (2)
Actual Fund Return. . . . . . . . . . . . . . . . . . . . . . . . . . . . . . . . . . . . . . . . $1,000.00 $1,135.50 0.39% $2.09Hypothetical 5% Annual Return. . . . . . . . . . . . . . . . . . . . . . . . . . $1,000.00 $1,023.18 0.39% $1.98
(1) Expenses are equal to the fund’s annualized expense ratio for the six-month period, multiplied by the averageaccount value over the period, multiplied by the number of days in the most recent six-month period (184), thendivided by the number of days in the year (366) to reflect the six-month period.
(2) The Portfolio is a Fund of Funds. The expenses shown reflect the direct expenses of the Fund of Funds andthe Fund of Funds’ portion of the expenses of its Underlying Funds (Affiliated Investment Companies).
DISCLOSURE OF FUND EXPENSESCONTINUED
17

DFA INVESTMENT DIMENSIONS GROUP INC.
DISCLOSURE OF PORTFOLIO HOLDINGS
(Unaudited)
The SEC requires that all funds file a complete Schedule of Investments with the SEC for their first and thirdfiscal quarters as an exhibit to their reports on Form N-PORT. For DFA Investment Dimensions Group Inc., this wouldbe for the fiscal quarters ending January 31 and July 31. Such Form N-PORT filing must be made within 60 days ofthe end of the quarter. DFA Investment Dimensions Group Inc. filed its most recent Form N-PORT with the SEC onSeptember 29, 2020. They are available upon request, without charge, by calling collect: (512) 306-7400; by mailinga request to Dimensional Fund Advisors LP, 6300 Bee Cave Road, Building One, Austin, TX 78746; or by visiting theSEC’s website at http://www.sec.gov.
SEC regulations permit a fund to include in its reports to shareholders a “Summary Schedule of PortfolioHoldings” in lieu of a full Schedule of Investments. The Summary Schedule of Portfolio Holdings reports the fund’s50 largest holdings in unaffiliated issuers and any investments that exceed one percent of the fund’s net assets atthe end of the reporting period. The regulations also require that the Summary Schedule of Portfolio Holdings identifyeach category of investments that are held.
A fund is required to file a complete Schedule of Investments with the SEC on Form N-CSR within ten days aftermailing the annual and semi-annual reports to shareholders. It will be available upon request, without charge, bycalling collect: (512) 306-7400; by mailing a request to Dimensional Fund Advisors LP, 6300 Bee Cave Road, BuildingOne, Austin, TX 78746; or by visiting the SEC’s website at http://www.sec.gov.
PORTFOLIO HOLDINGS
The SEC requires that all funds present their categories of portfolio holdings in a table, chart, or graph formatin their annual and semi-annual shareholder reports, whether or not a Schedule of Investments is used. The followingtable, which presents portfolio holdings as a percentage of total investments before short-term investments andcollateral for loaned securities, is provided in compliance with this requirement. The categories shown belowrepresent broad industry sectors. Each industry sector consists of one or more specific industry classifications.
FUNDS OF FUNDSAffiliated Investment Companies
VA Global Moderate Allocation Portfolio. . . . . . . . . . . . . . . . . . . . . . . . . . . . . . . . . . . . . . . . . . 100.0%VA Equity Allocation Portfolio. . . . . . . . . . . . . . . . . . . . . . . . . . . . . . . . . . . . . . . . . . . . . . . . . . . . . . 100.0%
DOMESTIC AND INTERNATIONAL EQUITY PORTFOLIOSVA U.S. Targeted Value Portfolio
Communication Services. . . . . . . . . . . 2.8%Consumer Discretionary. . . . . . . . . . . . 14.1%Consumer Staples. . . . . . . . . . . . . . . . . 4.5%Energy. . . . . . . . . . . . . . . . . . . . . . . . . . . 6.1%Financials. . . . . . . . . . . . . . . . . . . . . . . . 25.5%Health Care. . . . . . . . . . . . . . . . . . . . . . 4.7%Industrials. . . . . . . . . . . . . . . . . . . . . . . . 21.9%Information Technology. . . . . . . . . . . . 9.5%Materials. . . . . . . . . . . . . . . . . . . . . . . . . 9.5%Real Estate. . . . . . . . . . . . . . . . . . . . . . . 1.1%Utilities. . . . . . . . . . . . . . . . . . . . . . . . . . . 0.3%
100.0%
VA U.S. Large Value PortfolioCommunication Services. . . . . . . . . . . 12.5%Consumer Discretionary. . . . . . . . . . . . 6.5%Consumer Staples. . . . . . . . . . . . . . . . . 5.5%Energy. . . . . . . . . . . . . . . . . . . . . . . . . . . 6.6%Financials. . . . . . . . . . . . . . . . . . . . . . . . 18.9%Health Care. . . . . . . . . . . . . . . . . . . . . . 18.0%Industrials. . . . . . . . . . . . . . . . . . . . . . . . 13.2%Information Technology. . . . . . . . . . . . 10.6%Materials. . . . . . . . . . . . . . . . . . . . . . . . . 7.5%Real Estate. . . . . . . . . . . . . . . . . . . . . . . 0.3%Utilities. . . . . . . . . . . . . . . . . . . . . . . . . . . 0.4%
100.0%
VA International Value PortfolioCommunication Services. . . . . . . . . . . 4.2%Consumer Discretionary. . . . . . . . . . . . 17.2%Consumer Staples. . . . . . . . . . . . . . . . . 4.8%Energy. . . . . . . . . . . . . . . . . . . . . . . . . . . 8.6%Financials. . . . . . . . . . . . . . . . . . . . . . . . 27.5%Health Care. . . . . . . . . . . . . . . . . . . . . . 7.0%Industrials. . . . . . . . . . . . . . . . . . . . . . . . 11.8%Information Technology. . . . . . . . . . . . 2.5%Materials. . . . . . . . . . . . . . . . . . . . . . . . . 12.2%Real Estate. . . . . . . . . . . . . . . . . . . . . . . 2.7%Utilities. . . . . . . . . . . . . . . . . . . . . . . . . . . 1.5%
100.0%
18

VA International Small PortfolioCommunication Services. . . . . . . . . . . 4.3%Consumer Discretionary. . . . . . . . . . . . 13.3%Consumer Staples. . . . . . . . . . . . . . . . . 6.0%Energy. . . . . . . . . . . . . . . . . . . . . . . . . . . 3.4%Financials. . . . . . . . . . . . . . . . . . . . . . . . 12.4%Health Care. . . . . . . . . . . . . . . . . . . . . . 5.3%Industrials. . . . . . . . . . . . . . . . . . . . . . . . 23.9%Information Technology. . . . . . . . . . . . 10.4%Materials. . . . . . . . . . . . . . . . . . . . . . . . . 12.5%Real Estate. . . . . . . . . . . . . . . . . . . . . . . 5.1%Utilities. . . . . . . . . . . . . . . . . . . . . . . . . . . 3.4%
100.0%
FIXED INCOME PORTFOLIOSVA Short-Term Fixed Portfolio
Corporate. . . . . . . . . . . . . . . . . . . . . . . . 2.7%Government. . . . . . . . . . . . . . . . . . . . . . 39.8%Foreign Corporate. . . . . . . . . . . . . . . . . 16.3%Foreign Government. . . . . . . . . . . . . . . 16.7%Supranational. . . . . . . . . . . . . . . . . . . . . 24.5%
100.0%
VA Global Bond PortfolioCorporate. . . . . . . . . . . . . . . . . . . . . . . . 5.2%Foreign Corporate. . . . . . . . . . . . . . . . . 39.9%Foreign Government. . . . . . . . . . . . . . . 36.3%Supranational. . . . . . . . . . . . . . . . . . . . . 18.6%
100.0%
VIT Inflation-Protected SecuritiesPortfolio
Government. . . . . . . . . . . . . . . . . . . . . . 100.0%
100.0%
DISCLOSURE OF PORTFOLIO HOLDINGSCONTINUED
19

VA U.S. TARGETED VALUE PORTFOLIO
SUMMARY SCHEDULE OF PORTFOLIO HOLDINGS
October 31, 2020
Shares Value†Percentage
of Net Assets‡
COMMON STOCKS — (98.2%)COMMUNICATION SERVICES — (2.8%)
Interpublic Group of Cos., Inc. (The). . . . . . . . . . . . . . . . . . . . 55,158 $ 997,808 0.3%Other Securities. . . . . . . . . . . . . . . . . . . . . . . . . . . . . . . . . . . . . . . 7,852,776 2.5%
TOTAL COMMUNICATION SERVICES. . . . . . . . . . . . . . . . . . . . . . . . 8,850,584 2.8%
CONSUMER DISCRETIONARY — (13.8%)* AutoNation, Inc.. . . . . . . . . . . . . . . . . . . . . . . . . . . . . . . . . . . . . . . 24,151 1,370,086 0.4%
BorgWarner, Inc.. . . . . . . . . . . . . . . . . . . . . . . . . . . . . . . . . . . . . . 38,886 1,360,232 0.4%# Lithia Motors, Inc., Class A. . . . . . . . . . . . . . . . . . . . . . . . . . . . . 5,099 1,170,577 0.4%* Mohawk Industries, Inc.. . . . . . . . . . . . . . . . . . . . . . . . . . . . . . . . 18,326 1,891,060 0.6%
Toll Brothers, Inc.. . . . . . . . . . . . . . . . . . . . . . . . . . . . . . . . . . . . . . 43,252 1,828,695 0.6%Other Securities. . . . . . . . . . . . . . . . . . . . . . . . . . . . . . . . . . . . . . . 36,972,272 11.6%
TOTAL CONSUMER DISCRETIONARY. . . . . . . . . . . . . . . . . . . . . . . 44,592,922 14.0%
CONSUMER STAPLES — (4.4%)Bunge, Ltd.. . . . . . . . . . . . . . . . . . . . . . . . . . . . . . . . . . . . . . . . . . . 19,044 1,080,366 0.3%
* Darling Ingredients, Inc.. . . . . . . . . . . . . . . . . . . . . . . . . . . . . . . 42,261 1,817,223 0.6%Ingredion, Inc.. . . . . . . . . . . . . . . . . . . . . . . . . . . . . . . . . . . . . . . . . 17,481 1,239,228 0.4%
* Post Holdings, Inc.. . . . . . . . . . . . . . . . . . . . . . . . . . . . . . . . . . . . 17,668 1,517,681 0.5%Other Securities. . . . . . . . . . . . . . . . . . . . . . . . . . . . . . . . . . . . . . . 8,628,909 2.7%
TOTAL CONSUMER STAPLES. . . . . . . . . . . . . . . . . . . . . . . . . . . . . . . 14,283,407 4.5%
ENERGY — (6.0%)EQT Corp.. . . . . . . . . . . . . . . . . . . . . . . . . . . . . . . . . . . . . . . . . . . . 70,744 1,071,064 0.3%Other Securities. . . . . . . . . . . . . . . . . . . . . . . . . . . . . . . . . . . . . . . 18,279,188 5.8%
TOTAL ENERGY. . . . . . . . . . . . . . . . . . . . . . . . . . . . . . . . . . . . . . . . . . . . . 19,350,252 6.1%
FINANCIALS — (25.1%)Ally Financial, Inc.. . . . . . . . . . . . . . . . . . . . . . . . . . . . . . . . . . . . . 80,930 2,159,212 0.7%
* Athene Holding, Ltd., Class A. . . . . . . . . . . . . . . . . . . . . . . . . . 51,792 1,661,487 0.5%Comerica, Inc.. . . . . . . . . . . . . . . . . . . . . . . . . . . . . . . . . . . . . . . . 29,106 1,324,614 0.4%First Horizon National Corp.. . . . . . . . . . . . . . . . . . . . . . . . . . . . 122,999 1,280,420 0.4%Invesco, Ltd.. . . . . . . . . . . . . . . . . . . . . . . . . . . . . . . . . . . . . . . . . . 98,478 1,291,047 0.4%Janus Henderson Group P.L.C.. . . . . . . . . . . . . . . . . . . . . . . . 43,358 1,053,599 0.3%Lincoln National Corp.. . . . . . . . . . . . . . . . . . . . . . . . . . . . . . . . . 28,000 982,800 0.3%OneMain Holdings, Inc.. . . . . . . . . . . . . . . . . . . . . . . . . . . . . . . . 35,046 1,222,755 0.4%People’s United Financial, Inc.. . . . . . . . . . . . . . . . . . . . . . . . . 106,113 1,132,226 0.4%Popular, Inc.. . . . . . . . . . . . . . . . . . . . . . . . . . . . . . . . . . . . . . . . . . 24,047 1,014,783 0.3%Reinsurance Group of America, Inc.. . . . . . . . . . . . . . . . . . . . 12,706 1,283,560 0.4%Santander Consumer USA Holdings, Inc.. . . . . . . . . . . . . . . 61,307 1,246,984 0.4%Voya Financial, Inc.. . . . . . . . . . . . . . . . . . . . . . . . . . . . . . . . . . . . 28,966 1,388,340 0.4%Zions Bancorp NA. . . . . . . . . . . . . . . . . . . . . . . . . . . . . . . . . . . . . 43,995 1,419,719 0.5%Other Securities. . . . . . . . . . . . . . . . . . . . . . . . . . . . . . . . . . . . . . . 62,534,842 19.7%
TOTAL FINANCIALS. . . . . . . . . . . . . . . . . . . . . . . . . . . . . . . . . . . . . . . . . 80,996,388 25.5%
HEALTH CARE — (4.6%)Perrigo Co. P.L.C.. . . . . . . . . . . . . . . . . . . . . . . . . . . . . . . . . . . . . 22,113 970,097 0.3%Other Securities. . . . . . . . . . . . . . . . . . . . . . . . . . . . . . . . . . . . . . . 13,794,690 4.3%
TOTAL HEALTH CARE. . . . . . . . . . . . . . . . . . . . . . . . . . . . . . . . . . . . . . . 14,764,787 4.6%
20

Shares Value†Percentage
of Net Assets‡
INDUSTRIALS — (21.5%)AGCO Corp.. . . . . . . . . . . . . . . . . . . . . . . . . . . . . . . . . . . . . . . . . . 14,360 $ 1,106,151 0.4%Air Lease Corp.. . . . . . . . . . . . . . . . . . . . . . . . . . . . . . . . . . . . . . . 37,394 1,018,613 0.3%AMERCO. . . . . . . . . . . . . . . . . . . . . . . . . . . . . . . . . . . . . . . . . . . . . 3,204 1,112,301 0.4%Carlisle Cos., Inc.. . . . . . . . . . . . . . . . . . . . . . . . . . . . . . . . . . . . . 9,842 1,219,129 0.4%Knight-Swift Transportation Holdings, Inc.. . . . . . . . . . . . . . . 43,670 1,659,023 0.5%Quanta Services, Inc.. . . . . . . . . . . . . . . . . . . . . . . . . . . . . . . . . . 20,554 1,283,186 0.4%
* Sensata Technologies Holding P.L.C.. . . . . . . . . . . . . . . . . . . 29,063 1,270,344 0.4%Snap-on, Inc.. . . . . . . . . . . . . . . . . . . . . . . . . . . . . . . . . . . . . . . . . 9,344 1,471,960 0.5%Textron, Inc.. . . . . . . . . . . . . . . . . . . . . . . . . . . . . . . . . . . . . . . . . . 58,003 2,076,507 0.7%
#* XPO Logistics, Inc.. . . . . . . . . . . . . . . . . . . . . . . . . . . . . . . . . . . . 13,929 1,253,610 0.4%Other Securities. . . . . . . . . . . . . . . . . . . . . . . . . . . . . . . . . . . . . . . 55,848,797 17.4%
TOTAL INDUSTRIALS. . . . . . . . . . . . . . . . . . . . . . . . . . . . . . . . . . . . . . . . 69,319,621 21.8%
INFORMATION TECHNOLOGY — (9.3%)* Arrow Electronics, Inc.. . . . . . . . . . . . . . . . . . . . . . . . . . . . . . . . . 27,872 2,170,950 0.7%
DXC Technology Co.. . . . . . . . . . . . . . . . . . . . . . . . . . . . . . . . . . 53,442 984,402 0.3%* First Solar, Inc.. . . . . . . . . . . . . . . . . . . . . . . . . . . . . . . . . . . . . . . . 12,991 1,130,802 0.4%* Flex, Ltd.. . . . . . . . . . . . . . . . . . . . . . . . . . . . . . . . . . . . . . . . . . . . . 130,502 1,846,603 0.6%
Jabil, Inc.. . . . . . . . . . . . . . . . . . . . . . . . . . . . . . . . . . . . . . . . . . . . . 39,666 1,314,531 0.4%* ON Semiconductor Corp.. . . . . . . . . . . . . . . . . . . . . . . . . . . . . . 41,788 1,048,461 0.3%
SYNNEX Corp.. . . . . . . . . . . . . . . . . . . . . . . . . . . . . . . . . . . . . . . . 13,283 1,748,574 0.6%Other Securities. . . . . . . . . . . . . . . . . . . . . . . . . . . . . . . . . . . . . . . 19,808,124 6.1%
TOTAL INFORMATION TECHNOLOGY. . . . . . . . . . . . . . . . . . . . . . . 30,052,447 9.4%
MATERIALS — (9.3%)CF Industries Holdings, Inc.. . . . . . . . . . . . . . . . . . . . . . . . . . . . 38,042 1,050,340 0.3%Huntsman Corp.. . . . . . . . . . . . . . . . . . . . . . . . . . . . . . . . . . . . . . . 54,727 1,329,319 0.4%Reliance Steel & Aluminum Co.. . . . . . . . . . . . . . . . . . . . . . . . 22,042 2,402,358 0.8%Steel Dynamics, Inc.. . . . . . . . . . . . . . . . . . . . . . . . . . . . . . . . . . . 57,283 1,803,269 0.6%Westlake Chemical Corp.. . . . . . . . . . . . . . . . . . . . . . . . . . . . . . 27,911 1,887,342 0.6%WestRock Co.. . . . . . . . . . . . . . . . . . . . . . . . . . . . . . . . . . . . . . . . . 70,463 2,645,886 0.8%Other Securities. . . . . . . . . . . . . . . . . . . . . . . . . . . . . . . . . . . . . . . 18,973,776 6.0%
TOTAL MATERIALS. . . . . . . . . . . . . . . . . . . . . . . . . . . . . . . . . . . . . . . . . . 30,092,290 9.5%
REAL ESTATE — (1.1%)Jones Lang LaSalle, Inc.. . . . . . . . . . . . . . . . . . . . . . . . . . . . . . . 14,289 1,612,657 0.5%Other Securities. . . . . . . . . . . . . . . . . . . . . . . . . . . . . . . . . . . . . . . 1,783,146 0.6%
TOTAL REAL ESTATE. . . . . . . . . . . . . . . . . . . . . . . . . . . . . . . . . . . . . . . 3,395,803 1.1%
UTILITIES — (0.3%)Other Securities. . . . . . . . . . . . . . . . . . . . . . . . . . . . . . . . . . . . . . . 902,677 0.3%
TOTAL COMMON STOCKS. . . . . . . . . . . . . . . . . . . . . . . . . . . . . . . . . . 316,601,178 99.6%
PREFERRED STOCKS — (0.1%)
CONSUMER DISCRETIONARY — (0.1%)Other Security. . . . . . . . . . . . . . . . . . . . . . . . . . . . . . . . . . . . . . . . 250,322 0.1%
VA U.S. TARGETED VALUE PORTFOLIO
CONTINUED
21

Shares Value†Percentage
of Net Assets‡
INDUSTRIALS — (0.0%)Other Security. . . . . . . . . . . . . . . . . . . . . . . . . . . . . . . . . . . . . . . . $ 164,809 0.1%
TOTAL PREFERRED STOCKS. . . . . . . . . . . . . . . . . . . . . . . . . . . . . . . 415,131 0.2%
TOTAL INVESTMENT SECURITIES(Cost $352,940,242). . . . . . . . . . . . . . . . . . . . . . . . . . . . . . . . . . . . . . . 317,016,309
SECURITIES LENDING COLLATERAL — (1.7%)@§ The DFA Short Term Investment Fund. . . . . . . . . . . . . . . . . . 479,969 5,553,720 1.7%
TOTAL INVESTMENTS—(100.0%)(Cost $358,492,387). . . . . . . . . . . . . . . . . . . . . . . . . . . . . . . . . . . . . . . $322,570,029 101.5%
Summary of the Portfolio’s investments as of October 31, 2020, based on their valuation inputs, is as follows (see SecurityValuation Note):
Investments in Securities (Market Value)
Level 1 Level 2 Level 3 Total
Common StocksCommunication Services. . . . . . . . . . . . . . . . . . . $ 8,850,584 — — $ 8,850,584Consumer Discretionary. . . . . . . . . . . . . . . . . . . 44,591,814 $ 1,108 — 44,592,922Consumer Staples. . . . . . . . . . . . . . . . . . . . . . . . . 14,283,407 — — 14,283,407Energy. . . . . . . . . . . . . . . . . . . . . . . . . . . . . . . . . . . 19,350,252 — — 19,350,252Financials. . . . . . . . . . . . . . . . . . . . . . . . . . . . . . . . . 80,995,013 1,375 — 80,996,388Health Care. . . . . . . . . . . . . . . . . . . . . . . . . . . . . . . 14,752,576 12,211 — 14,764,787Industrials. . . . . . . . . . . . . . . . . . . . . . . . . . . . . . . . 69,319,621 — — 69,319,621Information Technology. . . . . . . . . . . . . . . . . . . . 30,052,447 — — 30,052,447Materials. . . . . . . . . . . . . . . . . . . . . . . . . . . . . . . . . . 30,092,290 — — 30,092,290Real Estate. . . . . . . . . . . . . . . . . . . . . . . . . . . . . . . 3,395,803 — — 3,395,803Utilities. . . . . . . . . . . . . . . . . . . . . . . . . . . . . . . . . . . 902,677 — — 902,677
Preferred StocksConsumer Discretionary. . . . . . . . . . . . . . . . . . . 250,322 — — 250,322Industrials. . . . . . . . . . . . . . . . . . . . . . . . . . . . . . . . 164,809 — — 164,809
Securities Lending Collateral. . . . . . . . . . . . . . . . . — 5,553,720 — 5,553,720
TOTAL. . . . . . . . . . . . . . . . . . . . . . . . . . . . . . . . . . . . . . $317,001,615 $5,568,414 — $322,570,029
VA U.S. TARGETED VALUE PORTFOLIO
CONTINUED
See accompanying Notes to Financial Statements.
22

VA U.S. LARGE VALUE PORTFOLIO
SUMMARY SCHEDULE OF PORTFOLIO HOLDINGS
October 31, 2020
Shares Value†Percentage
of Net Assets‡
COMMON STOCKS — (99.9%)COMMUNICATION SERVICES — (12.5%)
AT&T, Inc.. . . . . . . . . . . . . . . . . . . . . . . . . . . . . . . . . . . . . . . . . . . . 510,971 $13,806,436 3.0%* Charter Communications, Inc., Class A. . . . . . . . . . . . . . . . . 13,352 8,062,205 1.8%
Comcast Corp., Class A. . . . . . . . . . . . . . . . . . . . . . . . . . . . . . . 340,296 14,374,103 3.2%* T-Mobile US, Inc.. . . . . . . . . . . . . . . . . . . . . . . . . . . . . . . . . . . . . . 31,777 3,481,806 0.8%
Verizon Communications, Inc.. . . . . . . . . . . . . . . . . . . . . . . . . . 58,963 3,360,301 0.7%Walt Disney Co. (The). . . . . . . . . . . . . . . . . . . . . . . . . . . . . . . . . 50,429 6,114,516 1.3%Other Securities. . . . . . . . . . . . . . . . . . . . . . . . . . . . . . . . . . . . . . . 7,828,763 1.7%
TOTAL COMMUNICATION SERVICES. . . . . . . . . . . . . . . . . . . . . . . . 57,028,130 12.5%
CONSUMER DISCRETIONARY — (6.5%)DR Horton, Inc.. . . . . . . . . . . . . . . . . . . . . . . . . . . . . . . . . . . . . . . 56,804 3,795,075 0.8%Ford Motor Co.. . . . . . . . . . . . . . . . . . . . . . . . . . . . . . . . . . . . . . . . 312,226 2,413,507 0.5%General Motors Co.. . . . . . . . . . . . . . . . . . . . . . . . . . . . . . . . . . . 100,456 3,468,746 0.8%Other Securities. . . . . . . . . . . . . . . . . . . . . . . . . . . . . . . . . . . . . . . 19,956,180 4.4%
TOTAL CONSUMER DISCRETIONARY. . . . . . . . . . . . . . . . . . . . . . . 29,633,508 6.5%
CONSUMER STAPLES — (5.5%)Kroger Co. (The). . . . . . . . . . . . . . . . . . . . . . . . . . . . . . . . . . . . . . 88,430 2,848,330 0.6%Mondelez International, Inc., Class A. . . . . . . . . . . . . . . . . . . 64,509 3,426,718 0.8%Walmart, Inc.. . . . . . . . . . . . . . . . . . . . . . . . . . . . . . . . . . . . . . . . . . 51,411 7,133,276 1.6%Other Securities. . . . . . . . . . . . . . . . . . . . . . . . . . . . . . . . . . . . . . . 11,497,499 2.5%
TOTAL CONSUMER STAPLES. . . . . . . . . . . . . . . . . . . . . . . . . . . . . . . 24,905,823 5.5%
ENERGY — (6.6%)Chevron Corp.. . . . . . . . . . . . . . . . . . . . . . . . . . . . . . . . . . . . . . . . 115,793 8,047,613 1.8%ConocoPhillips. . . . . . . . . . . . . . . . . . . . . . . . . . . . . . . . . . . . . . . . 91,117 2,607,769 0.6%Exxon Mobil Corp.. . . . . . . . . . . . . . . . . . . . . . . . . . . . . . . . . . . . . 235,125 7,669,777 1.7%Other Securities. . . . . . . . . . . . . . . . . . . . . . . . . . . . . . . . . . . . . . . 11,581,539 2.5%
TOTAL ENERGY. . . . . . . . . . . . . . . . . . . . . . . . . . . . . . . . . . . . . . . . . . . . . 29,906,698 6.6%
FINANCIALS — (18.9%)Bank of America Corp.. . . . . . . . . . . . . . . . . . . . . . . . . . . . . . . . . 229,382 5,436,353 1.2%
* Berkshire Hathaway, Inc., Class B. . . . . . . . . . . . . . . . . . . . . . 49,526 9,999,299 2.2%Citigroup, Inc.. . . . . . . . . . . . . . . . . . . . . . . . . . . . . . . . . . . . . . . . . 128,445 5,320,192 1.2%Goldman Sachs Group, Inc. (The). . . . . . . . . . . . . . . . . . . . . . 23,560 4,453,782 1.0%JPMorgan Chase & Co.. . . . . . . . . . . . . . . . . . . . . . . . . . . . . . . 155,799 15,274,534 3.4%Morgan Stanley. . . . . . . . . . . . . . . . . . . . . . . . . . . . . . . . . . . . . . . 89,250 4,297,388 1.0%Travelers Cos., Inc. (The). . . . . . . . . . . . . . . . . . . . . . . . . . . . . . 19,149 2,311,476 0.5%Truist Financial Corp.. . . . . . . . . . . . . . . . . . . . . . . . . . . . . . . . . . 56,633 2,385,382 0.5%Wells Fargo & Co.. . . . . . . . . . . . . . . . . . . . . . . . . . . . . . . . . . . . . 144,357 3,096,458 0.7%Other Securities. . . . . . . . . . . . . . . . . . . . . . . . . . . . . . . . . . . . . . . 33,393,015 7.2%
TOTAL FINANCIALS. . . . . . . . . . . . . . . . . . . . . . . . . . . . . . . . . . . . . . . . . 85,967,879 18.9%
HEALTH CARE — (17.9%)Anthem, Inc.. . . . . . . . . . . . . . . . . . . . . . . . . . . . . . . . . . . . . . . . . . 21,126 5,763,173 1.3%Bristol-Myers Squibb Co.. . . . . . . . . . . . . . . . . . . . . . . . . . . . . . 60,856 3,557,033 0.8%Cigna Corp.. . . . . . . . . . . . . . . . . . . . . . . . . . . . . . . . . . . . . . . . . . . 30,231 5,047,670 1.1%CVS Health Corp.. . . . . . . . . . . . . . . . . . . . . . . . . . . . . . . . . . . . . 106,209 5,957,263 1.3%Danaher Corp.. . . . . . . . . . . . . . . . . . . . . . . . . . . . . . . . . . . . . . . . 24,909 5,717,612 1.2%Humana, Inc.. . . . . . . . . . . . . . . . . . . . . . . . . . . . . . . . . . . . . . . . . 9,731 3,885,394 0.8%
23

Shares Value†Percentage
of Net Assets‡
HEALTH CARE — (Continued)* Laboratory Corp. of America Holdings. . . . . . . . . . . . . . . . . . 14,026 $ 2,801,974 0.6%
Medtronic P.L.C.. . . . . . . . . . . . . . . . . . . . . . . . . . . . . . . . . . . . . . 57,928 5,825,819 1.3%Pfizer, Inc.. . . . . . . . . . . . . . . . . . . . . . . . . . . . . . . . . . . . . . . . . . . . 398,194 14,127,923 3.1%Thermo Fisher Scientific, Inc.. . . . . . . . . . . . . . . . . . . . . . . . . . 16,736 7,918,136 1.7%Other Securities. . . . . . . . . . . . . . . . . . . . . . . . . . . . . . . . . . . . . . . 21,226,589 4.7%
TOTAL HEALTH CARE. . . . . . . . . . . . . . . . . . . . . . . . . . . . . . . . . . . . . . . 81,828,586 17.9%
INDUSTRIALS — (13.2%)Eaton Corp. P.L.C.. . . . . . . . . . . . . . . . . . . . . . . . . . . . . . . . . . . . 33,145 3,440,120 0.8%FedEx Corp.. . . . . . . . . . . . . . . . . . . . . . . . . . . . . . . . . . . . . . . . . . 18,335 4,757,382 1.0%Kansas City Southern. . . . . . . . . . . . . . . . . . . . . . . . . . . . . . . . . 12,742 2,244,376 0.5%Norfolk Southern Corp.. . . . . . . . . . . . . . . . . . . . . . . . . . . . . . . . 19,624 4,103,771 0.9%Raytheon Technologies Corp.. . . . . . . . . . . . . . . . . . . . . . . . . . 58,154 3,158,925 0.7%Republic Services, Inc.. . . . . . . . . . . . . . . . . . . . . . . . . . . . . . . . 28,633 2,524,572 0.5%Stanley Black & Decker, Inc.. . . . . . . . . . . . . . . . . . . . . . . . . . . 16,180 2,689,116 0.6%Trane Technologies P.L.C.. . . . . . . . . . . . . . . . . . . . . . . . . . . . . 17,638 2,341,444 0.5%Other Securities. . . . . . . . . . . . . . . . . . . . . . . . . . . . . . . . . . . . . . . 35,103,668 7.7%
TOTAL INDUSTRIALS. . . . . . . . . . . . . . . . . . . . . . . . . . . . . . . . . . . . . . . . 60,363,374 13.2%
INFORMATION TECHNOLOGY — (10.6%)Cognizant Technology Solutions Corp., Class A. . . . . . . . . 39,424 2,815,662 0.6%Corning, Inc.. . . . . . . . . . . . . . . . . . . . . . . . . . . . . . . . . . . . . . . . . . 84,822 2,711,759 0.6%Fidelity National Information Services, Inc.. . . . . . . . . . . . . . 21,684 2,701,610 0.6%Intel Corp.. . . . . . . . . . . . . . . . . . . . . . . . . . . . . . . . . . . . . . . . . . . . 300,601 13,310,612 2.9%
* Micron Technology, Inc.. . . . . . . . . . . . . . . . . . . . . . . . . . . . . . . . 97,428 4,904,526 1.1%Other Securities. . . . . . . . . . . . . . . . . . . . . . . . . . . . . . . . . . . . . . . 22,089,262 4.8%
TOTAL INFORMATION TECHNOLOGY. . . . . . . . . . . . . . . . . . . . . . . 48,533,431 10.6%
MATERIALS — (7.5%)Dow, Inc.. . . . . . . . . . . . . . . . . . . . . . . . . . . . . . . . . . . . . . . . . . . . . 51,379 2,337,231 0.5%Linde P.L.C.. . . . . . . . . . . . . . . . . . . . . . . . . . . . . . . . . . . . . . . . . . . 15,454 3,405,134 0.7%Newmont Corp.. . . . . . . . . . . . . . . . . . . . . . . . . . . . . . . . . . . . . . . 45,969 2,888,692 0.6%Other Securities. . . . . . . . . . . . . . . . . . . . . . . . . . . . . . . . . . . . . . . 25,432,877 5.7%
TOTAL MATERIALS. . . . . . . . . . . . . . . . . . . . . . . . . . . . . . . . . . . . . . . . . . 34,063,934 7.5%
REAL ESTATE — (0.3%)Other Securities. . . . . . . . . . . . . . . . . . . . . . . . . . . . . . . . . . . . . . . 1,519,139 0.3%
UTILITIES — (0.4%)Other Securities. . . . . . . . . . . . . . . . . . . . . . . . . . . . . . . . . . . . . . . 1,660,014 0.4%
TOTAL COMMON STOCKS(Cost $413,476,830). . . . . . . . . . . . . . . . . . . . . . . . . . . . . . . . . . . . . . . 455,410,516 99.9%
SECURITIES LENDING COLLATERAL — (0.1%)@§ The DFA Short Term Investment Fund. . . . . . . . . . . . . . . . . . 53,508 619,143 0.1%
TOTAL INVESTMENTS—(100.0%)(Cost $414,095,980). . . . . . . . . . . . . . . . . . . . . . . . . . . . . . . . . . . . . . . $456,029,659 100.0%
VA U.S. LARGE VALUE PORTFOLIO
CONTINUED
24

Summary of the Portfolio’s investments as of October 31, 2020, based on their valuation inputs, is as follows (see SecurityValuation Note):
Investments in Securities (Market Value)
Level 1 Level 2 Level 3 Total
Common StocksCommunication Services. . . . . . . . . . . . . . . . . . . $ 57,028,130 — — $ 57,028,130Consumer Discretionary. . . . . . . . . . . . . . . . . . . 29,633,508 — — 29,633,508Consumer Staples. . . . . . . . . . . . . . . . . . . . . . . . . 24,905,823 — — 24,905,823Energy. . . . . . . . . . . . . . . . . . . . . . . . . . . . . . . . . . . 29,906,698 — — 29,906,698Financials. . . . . . . . . . . . . . . . . . . . . . . . . . . . . . . . . 85,967,879 — — 85,967,879Health Care. . . . . . . . . . . . . . . . . . . . . . . . . . . . . . . 81,828,586 — — 81,828,586Industrials. . . . . . . . . . . . . . . . . . . . . . . . . . . . . . . . 60,363,374 — — 60,363,374Information Technology. . . . . . . . . . . . . . . . . . . . 48,533,431 — — 48,533,431Materials. . . . . . . . . . . . . . . . . . . . . . . . . . . . . . . . . . 34,063,934 — — 34,063,934Real Estate. . . . . . . . . . . . . . . . . . . . . . . . . . . . . . . 1,519,139 — — 1,519,139Utilities. . . . . . . . . . . . . . . . . . . . . . . . . . . . . . . . . . . 1,660,014 — — 1,660,014
Securities Lending Collateral. . . . . . . . . . . . . . . . . — $619,143 — 619,143
TOTAL. . . . . . . . . . . . . . . . . . . . . . . . . . . . . . . . . . . . . . $455,410,516 $619,143 — $456,029,659
VA U.S. LARGE VALUE PORTFOLIO
CONTINUED
See accompanying Notes to Financial Statements.
25

VA INTERNATIONAL VALUE PORTFOLIO
SUMMARY SCHEDULE OF PORTFOLIO HOLDINGS
October 31, 2020
Shares Value»Percentage
of Net Assets‡
COMMON STOCKS — (95.4%)AUSTRALIA — (5.8%)
Australia & New Zealand Banking Group, Ltd.. . . . . . . . . . . 222,491 $ 2,952,596 1.1%National Australia Bank, Ltd.. . . . . . . . . . . . . . . . . . . . . . . . . . . 210,829 2,758,271 1.0%Westpac Banking Corp.. . . . . . . . . . . . . . . . . . . . . . . . . . . . . . . . 271,300 3,433,806 1.2%
# Westpac Banking Corp., Sponsored ADR. . . . . . . . . . . . . . . 11,850 150,495 0.1%Other Securities. . . . . . . . . . . . . . . . . . . . . . . . . . . . . . . . . . . . . . . 7,411,984 2.5%
TOTAL AUSTRALIA. . . . . . . . . . . . . . . . . . . . . . . . . . . . . . . . . . . . . . . . . . 16,707,152 5.9%
AUSTRIA — (0.0%)Other Security. . . . . . . . . . . . . . . . . . . . . . . . . . . . . . . . . . . . . . . . 104,011 0.0%
BELGIUM — (0.7%)Other Securities. . . . . . . . . . . . . . . . . . . . . . . . . . . . . . . . . . . . . . . 2,036,171 0.7%
CANADA — (8.3%)# Bank of Montreal. . . . . . . . . . . . . . . . . . . . . . . . . . . . . . . . . . . . . . 37,085 2,208,176 0.8%
Bank of Montreal. . . . . . . . . . . . . . . . . . . . . . . . . . . . . . . . . . . . . . 22,673 1,348,363 0.5%Bank of Nova Scotia (The). . . . . . . . . . . . . . . . . . . . . . . . . . . . . 51,251 2,129,207 0.8%Bank of Nova Scotia (The). . . . . . . . . . . . . . . . . . . . . . . . . . . . . 27,370 1,137,497 0.4%Canadian Imperial Bank of Commerce. . . . . . . . . . . . . . . . . . 27,656 2,062,939 0.7%Canadian Natural Resources, Ltd.. . . . . . . . . . . . . . . . . . . . . . 126,905 2,024,135 0.7%Magna International, Inc.. . . . . . . . . . . . . . . . . . . . . . . . . . . . . . . 41,970 2,145,087 0.8%Other Securities. . . . . . . . . . . . . . . . . . . . . . . . . . . . . . . . . . . . . . . 11,075,827 3.9%
TOTAL CANADA. . . . . . . . . . . . . . . . . . . . . . . . . . . . . . . . . . . . . . . . . . . . . 24,131,231 8.6%
DENMARK — (2.6%)DSV Panalpina A.S.. . . . . . . . . . . . . . . . . . . . . . . . . . . . . . . . . . . 9,641 1,564,170 0.6%Vestas Wind Systems A.S.. . . . . . . . . . . . . . . . . . . . . . . . . . . . . 16,721 2,868,722 1.0%Other Securities. . . . . . . . . . . . . . . . . . . . . . . . . . . . . . . . . . . . . . . 3,019,822 1.0%
TOTAL DENMARK. . . . . . . . . . . . . . . . . . . . . . . . . . . . . . . . . . . . . . . . . . . 7,452,714 2.6%
FINLAND — (1.2%)Other Securities. . . . . . . . . . . . . . . . . . . . . . . . . . . . . . . . . . . . . . . 3,477,269 1.2%
FRANCE — (9.0%)* BNP Paribas SA. . . . . . . . . . . . . . . . . . . . . . . . . . . . . . . . . . . . . . 51,999 1,813,453 0.6%* Cie de Saint-Gobain. . . . . . . . . . . . . . . . . . . . . . . . . . . . . . . . . . . 54,149 2,109,293 0.8%
Cie Generale des Etablissements Michelin SCA. . . . . . . . . 20,054 2,165,851 0.8%Orange SA. . . . . . . . . . . . . . . . . . . . . . . . . . . . . . . . . . . . . . . . . . . . 133,175 1,495,505 0.5%Total SE. . . . . . . . . . . . . . . . . . . . . . . . . . . . . . . . . . . . . . . . . . . . . . 167,429 5,072,548 1.8%Other Securities. . . . . . . . . . . . . . . . . . . . . . . . . . . . . . . . . . . . . . . 13,455,159 4.8%
TOTAL FRANCE. . . . . . . . . . . . . . . . . . . . . . . . . . . . . . . . . . . . . . . . . . . . . 26,111,809 9.3%
GERMANY — (7.2%)Allianz SE. . . . . . . . . . . . . . . . . . . . . . . . . . . . . . . . . . . . . . . . . . . . 17,558 3,092,922 1.1%BASF SE. . . . . . . . . . . . . . . . . . . . . . . . . . . . . . . . . . . . . . . . . . . . . 33,510 1,834,947 0.6%Bayer AG. . . . . . . . . . . . . . . . . . . . . . . . . . . . . . . . . . . . . . . . . . . . . 30,892 1,451,631 0.5%Bayerische Motoren Werke AG. . . . . . . . . . . . . . . . . . . . . . . . . 29,120 1,990,024 0.7%Daimler AG. . . . . . . . . . . . . . . . . . . . . . . . . . . . . . . . . . . . . . . . . . . 92,360 4,773,949 1.7%Volkswagen AG. . . . . . . . . . . . . . . . . . . . . . . . . . . . . . . . . . . . . . . 3,115 484,577 0.2%
26

Shares Value»Percentage
of Net Assets‡
GERMANY — (Continued)Other Securities. . . . . . . . . . . . . . . . . . . . . . . . . . . . . . . . . . . . . . . $ 7,101,425 2.6%
TOTAL GERMANY. . . . . . . . . . . . . . . . . . . . . . . . . . . . . . . . . . . . . . . . . . . 20,729,475 7.4%
HONG KONG — (2.5%)Other Securities. . . . . . . . . . . . . . . . . . . . . . . . . . . . . . . . . . . . . . . 7,238,690 2.6%
IRELAND — (0.7%)Other Securities. . . . . . . . . . . . . . . . . . . . . . . . . . . . . . . . . . . . . . . 1,908,408 0.7%
ISRAEL — (0.3%)Other Securities. . . . . . . . . . . . . . . . . . . . . . . . . . . . . . . . . . . . . . . 991,994 0.4%
ITALY — (1.7%)* Fiat Chrysler Automobiles NV. . . . . . . . . . . . . . . . . . . . . . . . . . 108,100 1,326,129 0.5%
Other Securities. . . . . . . . . . . . . . . . . . . . . . . . . . . . . . . . . . . . . . . 3,594,424 1.2%
TOTAL ITALY. . . . . . . . . . . . . . . . . . . . . . . . . . . . . . . . . . . . . . . . . . . . . . . . 4,920,553 1.7%
JAPAN — (23.4%)Hitachi, Ltd.. . . . . . . . . . . . . . . . . . . . . . . . . . . . . . . . . . . . . . . . . . . 45,300 1,526,805 0.5%Honda Motor Co., Ltd.. . . . . . . . . . . . . . . . . . . . . . . . . . . . . . . . . 108,400 2,563,978 0.9%Mitsubishi UFJ Financial Group, Inc.. . . . . . . . . . . . . . . . . . . . 386,000 1,521,575 0.5%Sumitomo Mitsui Financial Group, Inc.. . . . . . . . . . . . . . . . . . 47,100 1,303,817 0.5%Toyota Motor Corp.. . . . . . . . . . . . . . . . . . . . . . . . . . . . . . . . . . . . 113,770 7,468,646 2.7%Other Securities. . . . . . . . . . . . . . . . . . . . . . . . . . . . . . . . . . . . . . . 53,355,669 19.0%
TOTAL JAPAN. . . . . . . . . . . . . . . . . . . . . . . . . . . . . . . . . . . . . . . . . . . . . . . 67,740,490 24.1%
NETHERLANDS — (4.1%)Koninklijke Ahold Delhaize NV. . . . . . . . . . . . . . . . . . . . . . . . . 114,386 3,135,994 1.1%Koninklijke DSM NV. . . . . . . . . . . . . . . . . . . . . . . . . . . . . . . . . . . 12,952 2,071,381 0.7%
* Koninklijke Philips NV. . . . . . . . . . . . . . . . . . . . . . . . . . . . . . . . . 40,457 1,873,837 0.7%Other Securities. . . . . . . . . . . . . . . . . . . . . . . . . . . . . . . . . . . . . . . 4,875,155 1.7%
TOTAL NETHERLANDS. . . . . . . . . . . . . . . . . . . . . . . . . . . . . . . . . . . . . . 11,956,367 4.2%
NEW ZEALAND — (0.3%)Other Securities. . . . . . . . . . . . . . . . . . . . . . . . . . . . . . . . . . . . . . . 928,755 0.3%
NORWAY — (0.8%)Other Securities. . . . . . . . . . . . . . . . . . . . . . . . . . . . . . . . . . . . . . . 2,236,741 0.8%
PORTUGAL — (0.1%)Other Securities. . . . . . . . . . . . . . . . . . . . . . . . . . . . . . . . . . . . . . . 240,352 0.1%
SINGAPORE — (0.9%)Other Securities. . . . . . . . . . . . . . . . . . . . . . . . . . . . . . . . . . . . . . . 2,740,263 1.0%
SPAIN — (1.6%)* Banco Santander SA. . . . . . . . . . . . . . . . . . . . . . . . . . . . . . . . . . 1,416,166 2,835,951 1.0%
Other Securities. . . . . . . . . . . . . . . . . . . . . . . . . . . . . . . . . . . . . . . 1,862,649 0.7%
TOTAL SPAIN. . . . . . . . . . . . . . . . . . . . . . . . . . . . . . . . . . . . . . . . . . . . . . . 4,698,600 1.7%
SWEDEN — (3.0%)* Volvo AB, Class B. . . . . . . . . . . . . . . . . . . . . . . . . . . . . . . . . . . . . 78,205 1,520,085 0.5%
VA INTERNATIONAL VALUE PORTFOLIO
CONTINUED
27

Shares Value»Percentage
of Net Assets‡
SWEDEN — (Continued)Other Securities. . . . . . . . . . . . . . . . . . . . . . . . . . . . . . . . . . . . . . . $ 7,265,426 2.6%
TOTAL SWEDEN. . . . . . . . . . . . . . . . . . . . . . . . . . . . . . . . . . . . . . . . . . . . 8,785,511 3.1%
SWITZERLAND — (9.7%)ABB, Ltd.. . . . . . . . . . . . . . . . . . . . . . . . . . . . . . . . . . . . . . . . . . . . . 91,170 2,212,241 0.8%Cie Financiere Richemont SA. . . . . . . . . . . . . . . . . . . . . . . . . . 31,128 1,945,618 0.7%Lonza Group AG. . . . . . . . . . . . . . . . . . . . . . . . . . . . . . . . . . . . . . 4,268 2,586,024 0.9%Novartis AG. . . . . . . . . . . . . . . . . . . . . . . . . . . . . . . . . . . . . . . . . . . 22,893 1,783,882 0.6%Novartis AG, Sponsored ADR. . . . . . . . . . . . . . . . . . . . . . . . . . 62,740 4,898,739 1.7%Swisscom AG. . . . . . . . . . . . . . . . . . . . . . . . . . . . . . . . . . . . . . . . . 2,547 1,295,406 0.5%UBS Group AG. . . . . . . . . . . . . . . . . . . . . . . . . . . . . . . . . . . . . . . . 128,899 1,500,638 0.5%Zurich Insurance Group AG. . . . . . . . . . . . . . . . . . . . . . . . . . . . 9,456 3,140,768 1.1%Other Securities. . . . . . . . . . . . . . . . . . . . . . . . . . . . . . . . . . . . . . . 8,713,603 3.2%
TOTAL SWITZERLAND. . . . . . . . . . . . . . . . . . . . . . . . . . . . . . . . . . . . . . 28,076,919 10.0%
UNITED KINGDOM — (11.5%)Anglo American P.L.C.. . . . . . . . . . . . . . . . . . . . . . . . . . . . . . . . . 78,278 1,836,650 0.7%Aviva P.L.C.. . . . . . . . . . . . . . . . . . . . . . . . . . . . . . . . . . . . . . . . . . . 443,489 1,479,291 0.5%BP P.L.C.. . . . . . . . . . . . . . . . . . . . . . . . . . . . . . . . . . . . . . . . . . . . . 652,394 1,664,050 0.6%BP P.L.C., Sponsored ADR. . . . . . . . . . . . . . . . . . . . . . . . . . . . 99,837 1,545,475 0.6%British American Tobacco P.L.C.. . . . . . . . . . . . . . . . . . . . . . . . 89,371 2,832,647 1.0%
# British American Tobacco P.L.C., Sponsored ADR. . . . . . . 14,611 465,799 0.2%* Glencore P.L.C.. . . . . . . . . . . . . . . . . . . . . . . . . . . . . . . . . . . . . . . 759,106 1,531,295 0.5%
HSBC Holdings P.L.C., Sponsored ADR. . . . . . . . . . . . . . . . 132,381 2,777,353 1.0%Royal Dutch Shell P.L.C., Class B. . . . . . . . . . . . . . . . . . . . . . 36,847 444,350 0.2%Royal Dutch Shell P.L.C., Sponsored ADR, Class B. . . . . 223,164 5,389,411 1.9%Vodafone Group P.L.C.. . . . . . . . . . . . . . . . . . . . . . . . . . . . . . . . 1,569,855 2,094,136 0.7%
# Vodafone Group P.L.C., Sponsored ADR. . . . . . . . . . . . . . . . 63,098 852,452 0.3%Other Securities. . . . . . . . . . . . . . . . . . . . . . . . . . . . . . . . . . . . . . . 10,558,357 3.7%
TOTAL UNITED KINGDOM. . . . . . . . . . . . . . . . . . . . . . . . . . . . . . . . . . . 33,471,266 11.9%
TOTAL COMMON STOCKS. . . . . . . . . . . . . . . . . . . . . . . . . . . . . . . . . . 276,684,741 98.3%
PREFERRED STOCKS — (1.2%)
GERMANY — (1.2%)Volkswagen AG . . . . . . . . . . . . . . . . . . . . . . . . . . . . . . . . . . . . . . 18,370 2,675,849 1.0%Other Securities. . . . . . . . . . . . . . . . . . . . . . . . . . . . . . . . . . . . . . . 702,164 0.2%
TOTAL GERMANY. . . . . . . . . . . . . . . . . . . . . . . . . . . . . . . . . . . . . . . . . . . 3,378,013 1.2%
TOTAL INVESTMENT SECURITIES(Cost $350,668,755). . . . . . . . . . . . . . . . . . . . . . . . . . . . . . . . . . . . . . . 280,062,754
Value†
SECURITIES LENDING COLLATERAL — (3.4%)@§ The DFA Short Term Investment Fund. . . . . . . . . . . . . . . . . . 851,508 9,852,801 3.5%
TOTAL INVESTMENTS—(100.0%)(Cost $360,518,212). . . . . . . . . . . . . . . . . . . . . . . . . . . . . . . . . . . . . . . $289,915,555 103.0%
VA INTERNATIONAL VALUE PORTFOLIO
CONTINUED
28

Summary of the Portfolio’s investments as of October 31, 2020, based on their valuation inputs, is as follows (see SecurityValuation Note):
Investments in Securities (Market Value)
Level 1 Level 2 Level 3 Total
Common StocksAustralia. . . . . . . . . . . . . . . . . . . . . . . . . . . . . . . . . . $ 150,495 $ 16,556,657 — $ 16,707,152Austria. . . . . . . . . . . . . . . . . . . . . . . . . . . . . . . . . . . . — 104,011 — 104,011Belgium. . . . . . . . . . . . . . . . . . . . . . . . . . . . . . . . . . — 2,036,171 — 2,036,171Canada. . . . . . . . . . . . . . . . . . . . . . . . . . . . . . . . . . . 24,131,231 — — 24,131,231Denmark. . . . . . . . . . . . . . . . . . . . . . . . . . . . . . . . . . — 7,452,714 — 7,452,714Finland. . . . . . . . . . . . . . . . . . . . . . . . . . . . . . . . . . . — 3,477,269 — 3,477,269France. . . . . . . . . . . . . . . . . . . . . . . . . . . . . . . . . . . . 196,872 25,914,937 — 26,111,809Germany. . . . . . . . . . . . . . . . . . . . . . . . . . . . . . . . . 442,594 20,286,881 — 20,729,475Hong Kong. . . . . . . . . . . . . . . . . . . . . . . . . . . . . . . — 7,238,690 — 7,238,690Ireland. . . . . . . . . . . . . . . . . . . . . . . . . . . . . . . . . . . . 953,831 954,577 — 1,908,408Israel. . . . . . . . . . . . . . . . . . . . . . . . . . . . . . . . . . . . . 249,828 742,166 — 991,994Italy. . . . . . . . . . . . . . . . . . . . . . . . . . . . . . . . . . . . . . 360,813 4,559,740 — 4,920,553Japan. . . . . . . . . . . . . . . . . . . . . . . . . . . . . . . . . . . . — 67,740,490 — 67,740,490Netherlands. . . . . . . . . . . . . . . . . . . . . . . . . . . . . . . 595,589 11,360,778 — 11,956,367New Zealand. . . . . . . . . . . . . . . . . . . . . . . . . . . . . . — 928,755 — 928,755Norway. . . . . . . . . . . . . . . . . . . . . . . . . . . . . . . . . . . — 2,236,741 — 2,236,741Portugal. . . . . . . . . . . . . . . . . . . . . . . . . . . . . . . . . . — 240,352 — 240,352Singapore. . . . . . . . . . . . . . . . . . . . . . . . . . . . . . . . — 2,740,263 — 2,740,263Spain. . . . . . . . . . . . . . . . . . . . . . . . . . . . . . . . . . . . . 204,563 4,494,037 — 4,698,600Sweden. . . . . . . . . . . . . . . . . . . . . . . . . . . . . . . . . . — 8,785,511 — 8,785,511Switzerland. . . . . . . . . . . . . . . . . . . . . . . . . . . . . . . 6,607,933 21,468,986 — 28,076,919United Kingdom. . . . . . . . . . . . . . . . . . . . . . . . . . . 13,421,727 20,049,539 — 33,471,266
Preferred StocksGermany. . . . . . . . . . . . . . . . . . . . . . . . . . . . . . . . . — 3,378,013 — 3,378,013
Securities Lending Collateral. . . . . . . . . . . . . . . . . — 9,852,801 — 9,852,801
TOTAL. . . . . . . . . . . . . . . . . . . . . . . . . . . . . . . . . . . . . . $47,315,476 $242,600,079 — $289,915,555
VA INTERNATIONAL VALUE PORTFOLIO
CONTINUED
See accompanying Notes to Financial Statements.
29

VA INTERNATIONAL SMALL PORTFOLIO
SUMMARY SCHEDULE OF PORTFOLIO HOLDINGS
October 31, 2020
Shares Value»Percentage
of Net Assets‡
COMMON STOCKS — (94.5%)AUSTRALIA — (6.6%)
Other Securities. . . . . . . . . . . . . . . . . . . . . . . . . . . . . . . . . . . . . . . $16,014,375 7.0%
AUSTRIA — (1.2%)voestalpine AG. . . . . . . . . . . . . . . . . . . . . . . . . . . . . . . . . . . . . . . . 14,745 410,012 0.2%Other Securities. . . . . . . . . . . . . . . . . . . . . . . . . . . . . . . . . . . . . . . 2,548,735 1.1%
TOTAL AUSTRIA. . . . . . . . . . . . . . . . . . . . . . . . . . . . . . . . . . . . . . . . . . . . . 2,958,747 1.3%
BELGIUM — (1.3%)Other Securities. . . . . . . . . . . . . . . . . . . . . . . . . . . . . . . . . . . . . . . 3,145,277 1.4%
CANADA — (10.0%)Alamos Gold, Inc., Class A. . . . . . . . . . . . . . . . . . . . . . . . . . . . . 49,619 453,246 0.2%
# Element Fleet Management Corp.. . . . . . . . . . . . . . . . . . . . . . 47,730 449,607 0.2%* Kinaxis, Inc.. . . . . . . . . . . . . . . . . . . . . . . . . . . . . . . . . . . . . . . . . . . 2,617 399,494 0.2%* SSR Mining, Inc.. . . . . . . . . . . . . . . . . . . . . . . . . . . . . . . . . . . . . . 29,810 551,754 0.3%
TFI International, Inc.. . . . . . . . . . . . . . . . . . . . . . . . . . . . . . . . . . 9,351 416,349 0.2%Tourmaline Oil Corp.. . . . . . . . . . . . . . . . . . . . . . . . . . . . . . . . . . . 31,248 404,819 0.2%Yamana Gold, Inc.. . . . . . . . . . . . . . . . . . . . . . . . . . . . . . . . . . . . 75,682 420,929 0.2%Other Securities. . . . . . . . . . . . . . . . . . . . . . . . . . . . . . . . . . . . . . . 21,133,756 9.0%
TOTAL CANADA. . . . . . . . . . . . . . . . . . . . . . . . . . . . . . . . . . . . . . . . . . . . . 24,229,954 10.5%
DENMARK — (2.2%)Pandora A.S.. . . . . . . . . . . . . . . . . . . . . . . . . . . . . . . . . . . . . . . . . . 9,985 792,104 0.3%Royal Unibrew A.S.. . . . . . . . . . . . . . . . . . . . . . . . . . . . . . . . . . . . 5,725 558,239 0.2%SimCorp A.S.. . . . . . . . . . . . . . . . . . . . . . . . . . . . . . . . . . . . . . . . . 4,681 558,320 0.2%Other Securities. . . . . . . . . . . . . . . . . . . . . . . . . . . . . . . . . . . . . . . 3,473,986 1.6%
TOTAL DENMARK. . . . . . . . . . . . . . . . . . . . . . . . . . . . . . . . . . . . . . . . . . . 5,382,649 2.3%
FINLAND — (2.6%)Huhtamaki Oyj. . . . . . . . . . . . . . . . . . . . . . . . . . . . . . . . . . . . . . . . 11,540 563,700 0.3%Metso Outotec Oyj. . . . . . . . . . . . . . . . . . . . . . . . . . . . . . . . . . . . 72,230 509,183 0.2%
# Nokian Renkaat Oyj. . . . . . . . . . . . . . . . . . . . . . . . . . . . . . . . . . . 13,093 402,321 0.2%Orion Oyj, Class B. . . . . . . . . . . . . . . . . . . . . . . . . . . . . . . . . . . . 10,750 460,096 0.2%Valmet Oyj. . . . . . . . . . . . . . . . . . . . . . . . . . . . . . . . . . . . . . . . . . . . 15,697 374,639 0.2%Other Securities. . . . . . . . . . . . . . . . . . . . . . . . . . . . . . . . . . . . . . . 3,999,072 1.6%
TOTAL FINLAND. . . . . . . . . . . . . . . . . . . . . . . . . . . . . . . . . . . . . . . . . . . . . 6,309,011 2.7%
FRANCE — (4.0%)Ω Euronext NV. . . . . . . . . . . . . . . . . . . . . . . . . . . . . . . . . . . . . . . . . . 4,991 519,670 0.2%
Iliad SA. . . . . . . . . . . . . . . . . . . . . . . . . . . . . . . . . . . . . . . . . . . . . . . 2,484 480,236 0.2%#* Ingenico Group SA. . . . . . . . . . . . . . . . . . . . . . . . . . . . . . . . . . . . 7,134 1,025,693 0.5%* Rexel SA. . . . . . . . . . . . . . . . . . . . . . . . . . . . . . . . . . . . . . . . . . . . . 37,300 392,719 0.2%
Other Securities. . . . . . . . . . . . . . . . . . . . . . . . . . . . . . . . . . . . . . . 7,255,524 3.1%
TOTAL FRANCE. . . . . . . . . . . . . . . . . . . . . . . . . . . . . . . . . . . . . . . . . . . . . 9,673,842 4.2%
GERMANY — (5.8%)GEA Group AG. . . . . . . . . . . . . . . . . . . . . . . . . . . . . . . . . . . . . . . . 16,713 556,605 0.3%Gerresheimer AG. . . . . . . . . . . . . . . . . . . . . . . . . . . . . . . . . . . . . . 4,083 410,441 0.2%Lanxess AG. . . . . . . . . . . . . . . . . . . . . . . . . . . . . . . . . . . . . . . . . . . 10,424 528,682 0.2%Rheinmetall AG. . . . . . . . . . . . . . . . . . . . . . . . . . . . . . . . . . . . . . . 5,414 395,675 0.2%
30

Shares Value»Percentage
of Net Assets‡
GERMANY — (Continued)TAG Immobilien AG. . . . . . . . . . . . . . . . . . . . . . . . . . . . . . . . . . . 16,544 $ 487,545 0.2%Other Securities. . . . . . . . . . . . . . . . . . . . . . . . . . . . . . . . . . . . . . . 11,501,871 4.9%
TOTAL GERMANY. . . . . . . . . . . . . . . . . . . . . . . . . . . . . . . . . . . . . . . . . . . 13,880,819 6.0%
HONG KONG — (2.4%)Other Securities. . . . . . . . . . . . . . . . . . . . . . . . . . . . . . . . . . . . . . . 5,893,916 2.6%
IRELAND — (0.2%)Other Securities. . . . . . . . . . . . . . . . . . . . . . . . . . . . . . . . . . . . . . . 445,762 0.2%
ISRAEL — (1.3%)Other Securities. . . . . . . . . . . . . . . . . . . . . . . . . . . . . . . . . . . . . . . 3,138,211 1.4%
ITALY — (3.2%)Other Securities. . . . . . . . . . . . . . . . . . . . . . . . . . . . . . . . . . . . . . . 7,728,177 3.4%
JAPAN — (23.4%)Other Securities. . . . . . . . . . . . . . . . . . . . . . . . . . . . . . . . . . . . . . . 56,347,533 24.5%
NETHERLANDS — (2.5%)Aalberts NV. . . . . . . . . . . . . . . . . . . . . . . . . . . . . . . . . . . . . . . . . . . 11,558 387,761 0.2%ASR Nederland NV. . . . . . . . . . . . . . . . . . . . . . . . . . . . . . . . . . . . 16,636 504,827 0.2%IMCD NV. . . . . . . . . . . . . . . . . . . . . . . . . . . . . . . . . . . . . . . . . . . . . 6,473 749,191 0.3%
*Ω Signify NV. . . . . . . . . . . . . . . . . . . . . . . . . . . . . . . . . . . . . . . . . . . . 13,843 491,362 0.2%Other Securities. . . . . . . . . . . . . . . . . . . . . . . . . . . . . . . . . . . . . . . 3,781,121 1.7%
TOTAL NETHERLANDS. . . . . . . . . . . . . . . . . . . . . . . . . . . . . . . . . . . . . . 5,914,262 2.6%
NEW ZEALAND — (0.6%)Other Securities. . . . . . . . . . . . . . . . . . . . . . . . . . . . . . . . . . . . . . . 1,564,016 0.7%
NORWAY — (0.9%)Other Securities. . . . . . . . . . . . . . . . . . . . . . . . . . . . . . . . . . . . . . . 2,149,034 0.9%
PORTUGAL — (0.3%)Other Securities. . . . . . . . . . . . . . . . . . . . . . . . . . . . . . . . . . . . . . . 608,047 0.3%
SINGAPORE — (1.2%)Other Securities. . . . . . . . . . . . . . . . . . . . . . . . . . . . . . . . . . . . . . . 2,783,152 1.2%
SPAIN — (2.0%)Enagas SA. . . . . . . . . . . . . . . . . . . . . . . . . . . . . . . . . . . . . . . . . . . 20,888 450,842 0.2%Other Securities. . . . . . . . . . . . . . . . . . . . . . . . . . . . . . . . . . . . . . . 4,282,830 1.8%
TOTAL SPAIN. . . . . . . . . . . . . . . . . . . . . . . . . . . . . . . . . . . . . . . . . . . . . . . 4,733,672 2.0%
SWEDEN — (3.5%)Other Securities. . . . . . . . . . . . . . . . . . . . . . . . . . . . . . . . . . . . . . . 8,403,083 3.6%
SWITZERLAND — (6.5%)Allreal Holding AG. . . . . . . . . . . . . . . . . . . . . . . . . . . . . . . . . . . . . 1,908 404,113 0.2%
* ams AG. . . . . . . . . . . . . . . . . . . . . . . . . . . . . . . . . . . . . . . . . . . . . . 30,565 654,448 0.3%Belimo Holding AG. . . . . . . . . . . . . . . . . . . . . . . . . . . . . . . . . . . . 52 386,709 0.2%Clariant AG. . . . . . . . . . . . . . . . . . . . . . . . . . . . . . . . . . . . . . . . . . . 23,714 406,830 0.2%Georg Fischer AG. . . . . . . . . . . . . . . . . . . . . . . . . . . . . . . . . . . . . 501 506,034 0.2%PSP Swiss Property AG. . . . . . . . . . . . . . . . . . . . . . . . . . . . . . . 5,247 634,498 0.3%
VA INTERNATIONAL SMALL PORTFOLIO
CONTINUED
31

Shares Value»Percentage
of Net Assets‡
SWITZERLAND — (Continued)SIG Combibloc Group AG. . . . . . . . . . . . . . . . . . . . . . . . . . . . . 25,699 $ 528,597 0.2%
* Sunrise Communications Group AG. . . . . . . . . . . . . . . . . . . . 4,346 520,885 0.2%Swiss Prime Site AG. . . . . . . . . . . . . . . . . . . . . . . . . . . . . . . . . . 4,527 380,856 0.2%
Ω VAT Group AG. . . . . . . . . . . . . . . . . . . . . . . . . . . . . . . . . . . . . . . . 3,471 651,211 0.3%Other Securities. . . . . . . . . . . . . . . . . . . . . . . . . . . . . . . . . . . . . . . 10,530,557 4.5%
TOTAL SWITZERLAND. . . . . . . . . . . . . . . . . . . . . . . . . . . . . . . . . . . . . . 15,604,738 6.8%
UNITED KINGDOM — (12.8%)Diploma P.L.C.. . . . . . . . . . . . . . . . . . . . . . . . . . . . . . . . . . . . . . . . 18,167 523,127 0.2%Electrocomponents P.L.C.. . . . . . . . . . . . . . . . . . . . . . . . . . . . . . 56,828 498,939 0.2%
* G4S P.L.C.. . . . . . . . . . . . . . . . . . . . . . . . . . . . . . . . . . . . . . . . . . . . 172,346 454,463 0.2%Games Workshop Group P.L.C.. . . . . . . . . . . . . . . . . . . . . . . . 5,956 800,703 0.4%IG Group Holdings P.L.C.. . . . . . . . . . . . . . . . . . . . . . . . . . . . . . 43,731 431,559 0.2%IMI P.L.C.. . . . . . . . . . . . . . . . . . . . . . . . . . . . . . . . . . . . . . . . . . . . . 31,889 427,585 0.2%Spectris P.L.C.. . . . . . . . . . . . . . . . . . . . . . . . . . . . . . . . . . . . . . . . 14,576 467,821 0.2%Tate & Lyle P.L.C.. . . . . . . . . . . . . . . . . . . . . . . . . . . . . . . . . . . . . 50,269 387,513 0.2%
* Travis Perkins P.L.C.. . . . . . . . . . . . . . . . . . . . . . . . . . . . . . . . . . 30,483 418,662 0.2%William Hill P.L.C.. . . . . . . . . . . . . . . . . . . . . . . . . . . . . . . . . . . . . 141,047 500,925 0.2%Other Securities. . . . . . . . . . . . . . . . . . . . . . . . . . . . . . . . . . . . . . . 26,075,040 11.3%
TOTAL UNITED KINGDOM. . . . . . . . . . . . . . . . . . . . . . . . . . . . . . . . . . . 30,986,337 13.5%
TOTAL COMMON STOCKS. . . . . . . . . . . . . . . . . . . . . . . . . . . . . . . . . . 227,894,614 99.1%
PREFERRED STOCKS — (0.4%)
GERMANY — (0.4%)Other Securities. . . . . . . . . . . . . . . . . . . . . . . . . . . . . . . . . . . . . . . 886,338 0.4%
UNITED KINGDOM — (0.0%)Other Security. . . . . . . . . . . . . . . . . . . . . . . . . . . . . . . . . . . . . . . . 434 0.0%
TOTAL PREFERRED STOCKS. . . . . . . . . . . . . . . . . . . . . . . . . . . . . . . 886,772 0.4%
RIGHTS/WARRANTS — (0.0%)
CANADA — (0.0%)Other Security. . . . . . . . . . . . . . . . . . . . . . . . . . . . . . . . . . . . . . . . 14,324 0.0%
FRANCE — (0.0%)Other Security. . . . . . . . . . . . . . . . . . . . . . . . . . . . . . . . . . . . . . . . 65 0.0%
SPAIN — (0.0%)Other Security. . . . . . . . . . . . . . . . . . . . . . . . . . . . . . . . . . . . . . . . 10,250 0.0%
TOTAL RIGHTS/WARRANTS. . . . . . . . . . . . . . . . . . . . . . . . . . . . . . . . . 24,639 0.0%
TOTAL INVESTMENT SECURITIES(Cost $244,031,693). . . . . . . . . . . . . . . . . . . . . . . . . . . . . . . . . . . . . . . 228,806,025
Value†
SECURITIES LENDING COLLATERAL — (5.1%)@§ The DFA Short Term Investment Fund. . . . . . . . . . . . . . . . . . 1,071,726 12,400,938 5.4%
TOTAL INVESTMENTS—(100.0%)(Cost $256,430,548). . . . . . . . . . . . . . . . . . . . . . . . . . . . . . . . . . . . . . . $241,206,963 104.9%
VA INTERNATIONAL SMALL PORTFOLIO
CONTINUED
32

Summary of the Portfolio’s investments as of October 31, 2020, based on their valuation inputs, is as follows (see SecurityValuation Note):
Investments in Securities (Market Value)
Level 1 Level 2 Level 3 Total
Common StocksAustralia. . . . . . . . . . . . . . . . . . . . . . . . . . . . . . . . . . $ 98,472 $ 15,915,903 — $ 16,014,375Austria. . . . . . . . . . . . . . . . . . . . . . . . . . . . . . . . . . . . — 2,958,747 — 2,958,747Belgium. . . . . . . . . . . . . . . . . . . . . . . . . . . . . . . . . . 175,796 2,969,481 — 3,145,277Canada. . . . . . . . . . . . . . . . . . . . . . . . . . . . . . . . . . . 24,210,199 19,755 — 24,229,954Denmark. . . . . . . . . . . . . . . . . . . . . . . . . . . . . . . . . . — 5,382,649 — 5,382,649Finland. . . . . . . . . . . . . . . . . . . . . . . . . . . . . . . . . . . — 6,309,011 — 6,309,011France. . . . . . . . . . . . . . . . . . . . . . . . . . . . . . . . . . . . — 9,673,842 — 9,673,842Germany. . . . . . . . . . . . . . . . . . . . . . . . . . . . . . . . . 197,914 13,682,905 — 13,880,819Hong Kong. . . . . . . . . . . . . . . . . . . . . . . . . . . . . . . — 5,893,916 — 5,893,916Ireland. . . . . . . . . . . . . . . . . . . . . . . . . . . . . . . . . . . . — 445,762 — 445,762Israel. . . . . . . . . . . . . . . . . . . . . . . . . . . . . . . . . . . . . 55,333 3,082,878 — 3,138,211Italy. . . . . . . . . . . . . . . . . . . . . . . . . . . . . . . . . . . . . . — 7,728,177 — 7,728,177Japan. . . . . . . . . . . . . . . . . . . . . . . . . . . . . . . . . . . . — 56,347,533 — 56,347,533Netherlands. . . . . . . . . . . . . . . . . . . . . . . . . . . . . . . 46,075 5,868,187 — 5,914,262New Zealand. . . . . . . . . . . . . . . . . . . . . . . . . . . . . . — 1,564,016 — 1,564,016Norway. . . . . . . . . . . . . . . . . . . . . . . . . . . . . . . . . . . — 2,149,034 — 2,149,034Portugal. . . . . . . . . . . . . . . . . . . . . . . . . . . . . . . . . . — 608,047 — 608,047Singapore. . . . . . . . . . . . . . . . . . . . . . . . . . . . . . . . — 2,783,152 — 2,783,152Spain. . . . . . . . . . . . . . . . . . . . . . . . . . . . . . . . . . . . . — 4,733,672 — 4,733,672Sweden. . . . . . . . . . . . . . . . . . . . . . . . . . . . . . . . . . 65,794 8,337,289 — 8,403,083Switzerland. . . . . . . . . . . . . . . . . . . . . . . . . . . . . . . 520,885 15,083,853 — 15,604,738United Kingdom. . . . . . . . . . . . . . . . . . . . . . . . . . . — 30,986,337 — 30,986,337
Preferred StocksGermany. . . . . . . . . . . . . . . . . . . . . . . . . . . . . . . . . — 886,338 — 886,338United Kingdom. . . . . . . . . . . . . . . . . . . . . . . . . . . — 434 — 434
Rights/WarrantsCanada. . . . . . . . . . . . . . . . . . . . . . . . . . . . . . . . . . . — 14,324 — 14,324France. . . . . . . . . . . . . . . . . . . . . . . . . . . . . . . . . . . . — 65 — 65Spain. . . . . . . . . . . . . . . . . . . . . . . . . . . . . . . . . . . . . — 10,250 — 10,250
Securities Lending Collateral. . . . . . . . . . . . . . . . . — 12,400,938 — 12,400,938
TOTAL. . . . . . . . . . . . . . . . . . . . . . . . . . . . . . . . . . . . . . $25,370,468 $215,836,495 — $241,206,963
VA INTERNATIONAL SMALL PORTFOLIO
CONTINUED
See accompanying Notes to Financial Statements.
33

VA SHORT-TERM FIXED PORTFOLIO
SCHEDULE OF INVESTMENTS
October 31, 2020
FaceAmount Value†
(000)
AGENCY OBLIGATIONS — (2.0%)Federal Farm Credit Banks
Funding Corp., FloatingRate Note, 1M USD LIBOR+ 0.045%, FRN
(r) 0.191%, 04/16/21. . . . . . . 5,000 $5,001,256Federal Home Loan Bank
0.000%, 11/13/20. . . . . . . 1,000 999,975Federal National Mortgage
Association1.375%, 02/26/21. . . . . . . 1,000 1,003,972
TOTAL AGENCYOBLIGATIONS. . . . . . . . . . . . . 7,005,203
BONDS — (25.9%)African Development Bank,
Floating Rate Note, 3MUSD LIBOR + 0.010%,FRN
(r) 0.260%, 12/15/21. . . . . . . 6,000 5,999,668Asian Development Bank,
Floating Rate Note, 3MUSD LIBOR + 0.010%,FRN
(r) 0.260%, 12/15/21. . . . . . . 6,000 5,999,340Asian Development Bank,
Floating Rate Note, SOFR+ 0.240%, FRN
(r) 0.328%, 09/10/21. . . . . . . 3,000 3,001,017Australia & New Zealand
Banking Group, Ltd.,Floating Rate Note, 3MUSD LIBOR + 0.460%,FRN
(r)Ω 0.740%, 05/17/21. . . . . . . 2,000 2,004,873Bank of Montreal, Floating
Rate Note, 3M USD LIBOR+ 0.460%, FRN
(r) 0.684%, 04/13/21. . . . . . . 710 711,459Bank of Montreal, Floating
Rate Note, 3M USD LIBOR+ 0.790%, FRN
(r) 1.041%, 08/27/21. . . . . . . 1,844 1,855,842Bank of Nova Scotia (The),
Floating Rate Note, 3MUSD LIBOR + 0.290%,FRN
(r) 0.520%, 01/08/21. . . . . . . 1,000 1,000,512
FaceAmount Value†
(000)
Canadian Imperial Bank ofCommerce, Floating RateNote, 3M USD LIBOR +0.315%, FRN
(r) 0.529%, 02/02/21. . . . . . . 3,990 $3,992,613Commonwealth Bank of
Australia, Floating RateNote, 3M USD LIBOR +0.830%, FRN
(r)Ω 1.078%, 09/06/21. . . . . . . 1,000 1,006,596Equinor ASA
2.900%, 11/08/20. . . . . . . 2,000 2,000,727European Investment Bank,
Floating Rate Note, 3MUSD LIBOR + 0.110%,FRN
(r)Ω 0.333%, 03/24/21. . . . . . . 1,000 1,000,295European Investment Bank,
Floating Rate Note, SOFR+ 0.290%, FRN
(r)Ω 0.378%, 06/10/22. . . . . . . 2,750 2,751,264Inter-American Development
Bank, Floating Rate Note,3M USD LIBOR - 0.020%,FRN
(r) 0.195%, 10/25/21. . . . . . . 4,000 3,998,080Inter-American Development
Bank, Floating Rate Note,SOFR + 0.260%, FRN
(r) 0.348%, 09/16/22. . . . . . . 4,000 4,003,040Inter-American Investment
Corp., Floating Rate Note,3M USD LIBOR + 0.090%,FRN
(r)Ω 0.314%, 10/12/21. . . . . . . 8,000 7,997,888International Finance Corp.,
Floating Rate Note, 1MUSD LIBOR + 0.130%,FRN
(r) 0.278%, 08/23/21. . . . . . . 2,000 1,998,790Kommunalbanken A.S.,
Floating Rate Note, 3MUSD LIBOR + 0.040%,FRN
(r)Ω 0.289%, 03/12/21. . . . . . . 1,850 1,850,240
34

FaceAmount Value†
(000)
Kommunalbanken A.S.,Floating Rate Note, 3MUSD LIBOR + 0.080%,FRN
(r)Ω 0.336%, 02/24/22. . . . . . . 2,500 $2,501,563Kommunalbanken A.S.,
Floating Rate Note, 3MUSD LIBOR + 0.130%,FRN
(r)Ω 0.378%, 09/08/21. . . . . . . 1,000 1,000,528Kuntarahoitus Oyj, Floating
Rate Note, 3M USD LIBOR+ 0.050%, FRN
(r)Ω 0.330%, 02/17/21. . . . . . . 2,200 2,200,365Landeskreditbank
Baden-WuerttembergFoerderbank, Floating RateNote, SOFR + 0.035%,FRN
(r)Ω 0.437%, 03/15/22. . . . . . . 9,200 9,206,808Nederlandse
Waterschapsbank NV,Floating Rate Note, 3MUSD LIBOR + 0.070%,FRN
(r)Ω 0.320%, 12/15/21. . . . . . . 3,000 3,001,659NRW. Bank, Floating Rate
Note, 3M USD LIBOR +0.040%, FRN
(r)Ω 0.283%, 02/08/21. . . . . . . 3,200 3,200,064Oesterreichische Kontrollbank
AG, Floating Rate Note,3M USD LIBOR + 0.010%,FRN
(r)Ω 0.266%, 11/22/21. . . . . . . 1,000 999,877Royal Bank of Canada,
Floating Rate Note, 3MUSD LIBOR + 0.390%,FRN
(r) 0.604%, 04/30/21. . . . . . . 2,000 2,003,520Svensk Exportkredit AB,
Floating Rate Note, 3MUSD LIBOR + 0.050%,FRN
(r) 0.299%, 12/14/20. . . . . . . 1,000 1,000,122Svenska Handelsbanken AB
2.450%, 03/30/21. . . . . . . 6,500 6,558,332Toronto-Dominion Bank
(The), Floating Rate Note,3M USD LIBOR + 0.240%,FRN
(r) 0.455%, 01/25/21. . . . . . . 2,000 2,001,046
FaceAmount Value†
(000)
Toyota Motor Credit Corp.,Floating Rate Note, 3MUSD LIBOR + 0.125%,FRN
(r) 0.379%, 08/13/21. . . . . . . 1,698 $ 1,699,239Toyota Motor Credit Corp.,
Floating Rate Note, 3MUSD LIBOR + 0.540%,FRN
(r) 0.770%, 01/08/21. . . . . . . 969 969,939Walmart, Inc., Floating Rate
Note, 3M USD LIBOR +0.230%, FRN
(r) 0.453%, 06/23/21. . . . . . . 1,330 1,332,149Westpac Banking Corp.
2.100%, 05/13/21. . . . . . . 1,246 1,258,028
TOTAL BONDS. . . . . . . . . . . . . . . 90,105,483
U.S. TREASURY OBLIGATIONS — (15.2%)U.S. Treasury Bills# 0.098%, 11/17/20. . . . . . . 1,000 999,967# 0.097%, 11/27/20. . . . . . . 3,000 2,999,823U.S. Treasury Notes, Floating
Rate Note, 3M USTMMR +0.055%, FRN
(r) 0.155%, 07/31/22. . . . . . . 32,000 31,998,587U.S. Treasury Notes, Floating
Rate Note, 3M USTMMR +0.114%, FRN
(r) 0.214%, 04/30/22. . . . . . . 16,650 16,667,444
TOTAL U.S. TREASURYOBLIGATIONS. . . . . . . . . . . . . 52,665,821
TOTAL INVESTMENTSECURITIES(Cost $149,751,370). . . . . . . . 149,776,507
CERTIFICATES OF DEPOSIT — (0.9%)National Australia Bank, Ltd.,
Floating Rate Note, 1MUSD LIBOR + 0.220%,FRN
(r) 0.372%, 05/28/21. . . . . . . 3,000 3,002,464
COMMERCIAL PAPER — (54.4%)Australia & New Zealand
Banking Group, Ltd.0.180%, 03/09/21. . . . . . . 8,250 8,245,025
Banque Et Caisse0.180%, 12/04/20. . . . . . . 1,600 1,599,857
VA SHORT-TERM FIXED PORTFOLIO
CONTINUED
35

FaceAmount Value†
(000)
Banque Et Caisse d’Epargnede l’Etat
0.300%, 12/09/20. . . . . . . 2,000 $1,999,7930.200%, 03/02/21. . . . . . . 5,000 4,997,6770.180%, 03/04/21. . . . . . . 1,500 1,499,286
BNG Bank NV0.193%, 03/03/21. . . . . . . 5,000 4,997,2960.183%, 03/08/21. . . . . . . 2,000 1,998,8530.140%, 11/23/20. . . . . . . 3,000 2,999,736
Caisse Des Depots EtConsignations
0.180%, 02/02/21. . . . . . . 3,500 3,498,3650.173%, 02/25/21. . . . . . . 2,750 2,748,3050.190%, 03/03/21. . . . . . . 4,000 3,997,382
Commonwealth Bank ofAustralia
0.190%, 03/05/21. . . . . . . 1,400 1,399,392Corpoerative Centrale Bank
0.200%, 05/13/21. . . . . . . 5,000 4,994,448Erste Abwicklungsanstalt
0.220%, 11/24/20. . . . . . . 7,500 7,499,568European Investment Bank
0.170%, 02/05/21. . . . . . . 3,500 3,498,7230.130%, 12/16/20. . . . . . . 2,000 1,999,739
Exxon Mobil Corp.0.390%, 01/04/21. . . . . . . 5,000 4,998,9730.400%, 02/01/21. . . . . . . 4,500 4,498,567
FMS Wertmanagement0.230%, 12/11/20. . . . . . . 1,750 1,749,8080.240%, 01/11/21. . . . . . . 2,000 1,999,5580.244%, 01/14/21. . . . . . . 6,000 5,998,594
Hydro-Quebec0.228%, 11/17/20. . . . . . . 5,000 4,999,820
Kingdom of Denmark0.140%, 11/02/20. . . . . . . 7,000 6,999,9590.140%, 11/19/20. . . . . . . 3,000 2,999,878
Kreditanstalt fuerWiederaufbau
0.270%, 12/15/20. . . . . . . 6,500 6,498,912Landesbank
Hessen-Thuringen0.170%, 12/01/20. . . . . . . 8,000 7,999,211
National Australia Bank, Ltd.0.180%, 02/03/21. . . . . . . 6,000 5,998,336
NederlandseWaterschapsbank NV
0.200%, 02/04/21. . . . . . . 5,500 5,497,9400.210%, 02/16/21. . . . . . . 1,500 1,499,378
Nordea Bank AB0.195%, 03/15/21. . . . . . . 5,000 4,996,770
Novartis Finance SA0.180%, 04/12/21. . . . . . . 3,000 2,998,018
FaceAmount Value†
(000)
OesterreichischePostsparkasse AG
0.150%, 01/25/21. . . . . . . 2,000 $ 1,999,473Pfizer, Inc.
0.250%, 11/02/20. . . . . . . 2,000 1,999,9880.105%, 11/30/20. . . . . . . 3,000 2,999,742
Province of Alberta0.200%, 03/09/21. . . . . . . 3,000 2,998,5920.180%, 04/19/21. . . . . . . 3,000 2,997,905
PSP Capital, Inc.0.190%, 04/07/21. . . . . . . 2,750 2,748,4210.183%, 04/15/21. . . . . . . 7,250 7,245,628
Queensland Treasury Corp.0.205%, 01/28/21. . . . . . . 9,750 9,747,319
Royal Bank Of Canada0.180%, 04/26/21. . . . . . . 2,000 1,998,705
Shell International FinanceBV
0.500%, 05/25/21. . . . . . . 3,500 3,494,788Skandinaviska Enskilda
Banken AB0.223%, 04/20/21. . . . . . . 2,250 2,247,6670.223%, 04/21/21. . . . . . . 2,750 2,747,1190.180%, 02/19/21. . . . . . . 1,500 1,499,0900.198%, 02/26/21. . . . . . . 3,250 3,247,862
Svenska Handelsbanken AB0.244%, 12/10/20. . . . . . . 3,000 2,999,6690.203%, 03/16/21. . . . . . . 500 499,658
Total Capital Canada, Ltd.0.223%, 02/03/21. . . . . . . 8,000 7,996,6930.200%, 03/18/21. . . . . . . 2,250 2,248,341
TOTAL COMMERCIALPAPER(Cost $189,394,612). . . . . . . . 189,423,827
Shares
TEMPORARY CASH INVESTMENTS — (0.4%)State Street Institutional
U.S. GovernmentMoney Market Fund0.026%. . . . . . . . . . . . . . . 1,569,706 1,569,706
SECURITIES LENDING COLLATERAL — (1.2%)@§ The DFA Short Term
Investment Fund . . . . . 352,886 4,083,240
TOTAL INVESTMENTS — (100.0%)(Cost $347,798,751). . . . . . . . $347,855,744
VA SHORT-TERM FIXED PORTFOLIO
CONTINUED
36

Summary of the Portfolio’s investments as of October 31, 2020, based on their valuation inputs, is as follows (see SecurityValuation Note):
Investments in Securities (Market Value)
Level 1 Level 2 Level 3 Total
Agency Obligations. . . . . . . . . . . . . . . . . . . . . . . . . . — $ 7,005,203 — $ 7,005,203Bonds. . . . . . . . . . . . . . . . . . . . . . . . . . . . . . . . . . . . . . — 90,105,483 — 90,105,483U.S. Treasury Obligations. . . . . . . . . . . . . . . . . . . . — 52,665,821 — 52,665,821Certificates of Deposit. . . . . . . . . . . . . . . . . . . . . . . — 3,002,464 — 3,002,464Commercial Paper. . . . . . . . . . . . . . . . . . . . . . . . . . . — 189,423,827 — 189,423,827Temporary Cash Investments. . . . . . . . . . . . . . . . . $1,569,706 — — 1,569,706Securities Lending Collateral. . . . . . . . . . . . . . . . . — 4,083,240 — 4,083,240
TOTAL. . . . . . . . . . . . . . . . . . . . . . . . . . . . . . . . . . . . . . $1,569,706 $346,286,038 — $347,855,744
VA SHORT-TERM FIXED PORTFOLIO
CONTINUED
See accompanying Notes to Financial Statements.
37

VA GLOBAL BOND PORTFOLIO
SCHEDULE OF INVESTMENTS
October 31, 2020
FaceAmount^ Value†
(000)
BONDS — (100.0%)AUSTRALIA — (5.9%)ASB Finance, Ltd.
0.500%, 06/10/22. . . . . . . EUR 700 $ 822,923Australia & New Zealand
Banking Group, Ltd.Floating Rate Note
Australia & New ZealandBanking Group, Ltd.Floating Rate Note
(r) 1.230%, 08/16/21. . . . . . . AUD 500 354,290(r) 0.982%, 02/08/22. . . . . . . AUD 500 354,784(r) 1.090%, 03/07/22. . . . . . . AUD 500 355,467(r) 1.120%, 12/06/23. . . . . . . AUD 500 359,888(r) 0.860%, 08/29/24. . . . . . . AUD 500 357,455(r) 0.840%, 01/16/25. . . . . . . AUD 4,500 3,217,242Commonwealth Bank of
Australia Floating RateNote
Commonwealth Bank ofAustralia Floating RateNote
(r) 0.940%, 07/25/22. . . . . . . AUD 1,000 711,748(r) 1.210%, 01/11/24. . . . . . . AUD 500 361,055National Australia Bank, Ltd.National Australia Bank, Ltd.
3.000%, 05/12/21. . . . . . . AUD 500 356,6740.350%, 09/07/22. . . . . . . EUR 1,650 1,942,744
National Australia Bank, Ltd.Floating Rate Note
(r) 0.990%, 07/05/22. . . . . . . AUD 500 355,871(r) 0.902%, 02/10/23. . . . . . . AUD 1,000 712,455(r) 1.000%, 05/16/23. . . . . . . AUD 1,000 714,956(r) 1.010%, 09/26/23. . . . . . . AUD 1,500 1,075,367(r) 1.010%, 06/19/24. . . . . . . AUD 2,000 1,436,753(r) 0.830%, 01/21/25. . . . . . . AUD 5,000 3,576,202Westpac Banking Corp.Westpac Banking Corp.
0.250%, 01/17/22. . . . . . . EUR 888 1,041,3662.625%, 12/14/22. . . . . . . GBP 400 540,155
Westpac Banking Corp.Floating Rate Note
(r) 1.210%, 02/07/22. . . . . . . AUD 500 355,752(r) 1.050%, 11/16/23. . . . . . . AUD 1,000 717,784(r) 1.200%, 04/24/24. . . . . . . AUD 3,500 2,530,622(r) 0.980%, 08/16/24. . . . . . . AUD 3,000 2,153,899
TOTAL AUSTRALIA. . . . . . . . . . 24,405,452
FaceAmount^ Value†
(000)
AUSTRIA — (1.3%)Oesterreichische Kontrollbank
AG Floating Rate Note(r) 0.266%, 11/22/21. . . . . . . 3,000 $ 2,999,632Oesterreichische Kontrollbank
AG0.750%, 03/07/22. . . . . . . GBP 1,836 2,396,952
TOTAL AUSTRIA. . . . . . . . . . . . . 5,396,584
BELGIUM — (3.0%)Dexia Credit Local SADexia Credit Local SA
2.000%, 01/22/21. . . . . . . EUR 2,300 2,693,5410.250%, 06/02/22. . . . . . . EUR 2,900 3,419,2651.125%, 06/15/22. . . . . . . GBP 2,300 3,022,1510.250%, 06/01/23. . . . . . . EUR 2,400 2,849,403
Euroclear Bank SA0.250%, 09/07/22. . . . . . . EUR 400 470,781
TOTAL BELGIUM. . . . . . . . . . . . . 12,455,141
CANADA — (20.0%)Bank of MontrealBank of Montreal
1.880%, 03/31/21. . . . . . . CAD 11,000 8,310,2300.250%, 11/17/21. . . . . . . EUR 400 469,137
Bank of Montreal FloatingRate Note
(r) 0.007%, 09/28/21. . . . . . . EUR 2,020 2,361,938(r) 0.012%, 03/14/22. . . . . . . EUR 600 702,039(r) 1.010%, 10/06/22. . . . . . . AUD 800 569,040Bank of Nova Scotia (The)Bank of Nova Scotia (The)
3.270%, 01/11/21. . . . . . . CAD 1,500 1,132,4930.375%, 04/06/22. . . . . . . EUR 500 587,615
Canada Housing Trust No 1Floating Rate Note
Canada Housing Trust No 1Floating Rate Note
(r)Ω 0.665%, 03/15/22. . . . . . . CAD 2,000 1,509,405(r)Ω 0.605%, 09/15/22. . . . . . . CAD 2,000 1,510,020(r)Ω 0.445%, 09/15/23. . . . . . . CAD 3,000 2,259,536(r)Ω 0.455%, 03/15/24. . . . . . . CAD 1,000 753,374(r)Ω 0.465%, 03/15/25. . . . . . . CAD 8,000 6,028,312Canadian Imperial Bank of
CommerceCanadian Imperial Bank of
Commerce1.900%, 04/26/21. . . . . . . CAD 1,900 1,437,0582.900%, 09/14/21. . . . . . . CAD 1,000 766,8840.750%, 03/22/23. . . . . . . EUR 1,900 2,263,943
38

FaceAmount^ Value†
(000)
CANADA — (Continued)Export Development Canada
2.400%, 06/07/21. . . . . . . AUD 2,000 $ 1,424,490Export Development Canada
Floating Rate Note(r) 0.365%, 05/29/24. . . . . . . GBP 1,000 1,297,041(r) 0.384%, 01/17/25. . . . . . . GBP 1,000 1,294,955Hydro-Quebec Floating Rate
Note(r) 0.700%, 04/14/23. . . . . . . CAD 3,000 2,265,526Province of Manitoba CanadaProvince of Manitoba Canada
0.750%, 12/15/21. . . . . . . GBP 500 650,7261.500%, 12/15/22. . . . . . . GBP 150 198,939
Province of Ontario CanadaFloating Rate Note
Province of Ontario CanadaFloating Rate Note
(r) 0.750%, 10/27/21. . . . . . . CAD 500 377,081(r) 0.655%, 06/27/22. . . . . . . CAD 3,000 2,265,593(r) 0.561%, 08/21/23. . . . . . . CAD 11,000 8,319,312Province of Quebec Canada
0.875%, 05/24/22. . . . . . . GBP 800 1,045,762Province of Quebec Canada
Floating Rate Note(r) 0.905%, 10/13/24. . . . . . . CAD 13,500 10,347,568Royal Bank of CanadaRoyal Bank of Canada
2.860%, 03/04/21. . . . . . . CAD 4,000 3,028,9571.650%, 07/15/21. . . . . . . CAD 420 318,1071.583%, 09/13/21. . . . . . . CAD 7,000 5,309,6071.968%, 03/02/22. . . . . . . CAD 4,611 3,527,590
Toronto-Dominion Bank (The)Toronto-Dominion Bank (The)
0.625%, 03/08/21. . . . . . . EUR 882 1,030,9811.994%, 03/23/22. . . . . . . CAD 9,500 7,277,1303.005%, 05/30/23. . . . . . . CAD 320 254,5730.625%, 07/20/23. . . . . . . EUR 1,144 1,361,770
TOTAL CANADA. . . . . . . . . . . . . 82,256,732
DENMARK — (1.6%)KommunekreditKommunekredit
0.000%, 09/08/22. . . . . . . EUR 1,072 1,261,0620.250%, 03/29/23. . . . . . . EUR 3,000 3,562,8440.125%, 08/28/23. . . . . . . EUR 1,611 1,912,182
TOTAL DENMARK. . . . . . . . . . . . 6,736,088
FINLAND — (1.7%)Kuntarahoitus Oyj Floating
Rate Note(r) 0.330%, 02/17/21. . . . . . . 3,500 3,500,580
FaceAmount^ Value†
(000)
FINLAND — (Continued)Nordea Bank Abp
2.000%, 02/17/21. . . . . . . EUR 250 $ 293,224OP Corporate Bank P.L.C.
0.750%, 03/03/22. . . . . . . EUR 2,700 3,186,912
TOTAL FINLAND. . . . . . . . . . . . . 6,980,716
FRANCE — (11.2%)Agence Francaise de
Developpement0.125%, 04/30/22. . . . . . . EUR 1,700 1,998,595
Agence Francaise deDeveloppement EPIC
0.125%, 03/31/21. . . . . . . EUR 4,000 4,669,827Agence Francaise de
Developpement EPICFloating Rate Note
(r) 0.368%, 06/07/21. . . . . . . 3,600 3,601,116Bpifrance Financement SABpifrance Financement SA
0.100%, 02/19/21. . . . . . . EUR 300 349,9370.750%, 10/25/21. . . . . . . EUR 1,800 2,120,860
Caisse d’Amortissement de laDette Sociale
Caisse d’Amortissement de laDette Sociale
3.375%, 04/25/21. . . . . . . EUR 500 593,0250.125%, 10/25/23. . . . . . . EUR 3,700 4,399,411
Caisse des Depots etConsignations
1.000%, 01/25/21. . . . . . . GBP 600 778,795France Treasury Bill BTFFrance Treasury Bill BTF
(0.585%), 12/09/20. . . . . . EUR 3,875 4,515,819(0.580%), 02/10/21. . . . . . EUR 3,000 3,500,303
SanofiSanofi
0.000%, 03/21/22. . . . . . . EUR 1,700 1,988,8660.500%, 03/21/23. . . . . . . EUR 6,600 7,832,830
SNCF ReseauSNCF Reseau
0.100%, 05/27/21. . . . . . . EUR 2,100 2,452,6335.500%, 12/01/21. . . . . . . GBP 720 985,388
Total Capital International SATotal Capital International SA
2.125%, 03/15/23. . . . . . . EUR 1,600 1,969,1530.250%, 07/12/23. . . . . . . EUR 900 1,063,048
Total Capital International SA2.250%, 12/17/20. . . . . . . GBP 486 631,084
Unedic Asseo2.250%, 04/05/23. . . . . . . EUR 100 124,268
UNEDIC ASSEOUNEDIC ASSEO
0.000%, 11/25/20. . . . . . . EUR 200 232,965
VA GLOBAL BOND PORTFOLIO
CONTINUED
39

FaceAmount^ Value†
(000)
FRANCE — (Continued)0.875%, 10/25/22. . . . . . . EUR 1,800 $ 2,153,027
TOTAL FRANCE. . . . . . . . . . . . . 45,960,950
GERMANY — (6.7%)Deutsche Bahn Finance
GMBHDeutsche Bahn Finance
GMBH3.750%, 06/01/21. . . . . . . EUR 1,229 1,465,6364.375%, 09/23/21. . . . . . . EUR 500 606,700
FMS Wertmanagement1.125%, 09/07/23. . . . . . . GBP 800 1,064,720
Kreditanstalt fuerWiederaufbau
Kreditanstalt fuerWiederaufbau
5.550%, 06/07/21. . . . . . . GBP 2,500 3,344,6430.125%, 06/03/22. . . . . . . SEK 4,000 450,660
Land Baden-WuerttembergFloating Rate Note
(r) 0.348%, 07/19/21. . . . . . . EUR 260 304,488Landeskreditbank
Baden-WuerttembergFoerderbank
LandeskreditbankBaden-WuerttembergFoerderbank
0.125%, 11/05/20. . . . . . . EUR 500 582,3450.875%, 03/07/22. . . . . . . GBP 100 130,747
LandeskreditbankBaden-WuerttembergFoerderbank Floating RateNote
(r) 0.353%, 09/27/21. . . . . . . 400 400,259Landwirtschaftliche
Rentenbank Floating RateNote
(r) 0.000%, 01/15/21. . . . . . . EUR 500 582,983Landwirtschaftliche
Rentenbank4.250%, 01/09/25. . . . . . . AUD 1,000 814,907
NRW BankNRW Bank
0.125%, 03/10/23. . . . . . . EUR 1,000 1,183,1030.125%, 07/07/23. . . . . . . EUR 6,250 7,412,357
NRW. Bank Floating RateNote
(r) 0.283%, 02/08/21. . . . . . . 600 600,012
FaceAmount^ Value†
(000)
GERMANY — (Continued)State of North
Rhine-Westphalia GermanyFloating Rate Note
(r) 0.109%, 10/29/21. . . . . . . GBP 5,700 $ 7,378,116State of North
Rhine-Westphalia Germany0.375%, 02/16/23. . . . . . . EUR 850 1,011,963
State of Saxony-Anhalt3.750%, 04/06/21. . . . . . . EUR 230 272,761
TOTAL GERMANY. . . . . . . . . . . 27,606,400
JAPAN — (3.7%)Total Capital Canada, Ltd.
1.125%, 03/18/22. . . . . . . EUR 2,500 2,969,532Toyota Credit Canada, Inc.Toyota Credit Canada, Inc.
2.200%, 02/25/21. . . . . . . CAD 1,000 755,1452.020%, 02/28/22. . . . . . . CAD 8,150 6,229,3092.350%, 07/18/22. . . . . . . CAD 800 616,930
Toyota Finance Australia, Ltd.Toyota Finance Australia, Ltd.
0.000%, 04/09/21. . . . . . . EUR 1,500 1,749,6730.500%, 04/06/23. . . . . . . EUR 1,400 1,657,612
Toyota Motor Credit Corp.Toyota Motor Credit Corp.
0.000%, 07/21/21. . . . . . . EUR 200 233,5380.750%, 07/21/22. . . . . . . EUR 810 959,0602.375%, 02/01/23. . . . . . . EUR 43 52,969
TOTAL JAPAN. . . . . . . . . . . . . . . 15,223,768
NETHERLANDS — (8.1%)BNG Bank NVBNG Bank NV
1.000%, 06/17/22. . . . . . . GBP 2,000 2,625,5730.050%, 07/11/23. . . . . . . EUR 6,333 7,497,429
Cooperatieve Rabobank UACooperatieve Rabobank UA
2.750%, 01/10/22. . . . . . . 1,050 1,080,6134.000%, 01/11/22. . . . . . . EUR 1,839 2,254,0474.750%, 06/06/22. . . . . . . EUR 300 377,6470.500%, 12/06/22. . . . . . . EUR 2,213 2,620,129
NederlandseWaterschapsbank NVFloating Rate Note
NederlandseWaterschapsbank NVFloating Rate Note
(r) 0.320%, 12/15/21. . . . . . . 8,000 8,004,424(r)Ω 0.320%, 12/15/21. . . . . . . 1,000 1,000,553
VA GLOBAL BOND PORTFOLIO
CONTINUED
40

FaceAmount^ Value†
(000)
NETHERLANDS — (Continued)Shell International Finance
BVShell International Finance
BV1.625%, 03/24/21. . . . . . . EUR 1,220 $ 1,431,8561.250%, 03/15/22. . . . . . . EUR 2,292 2,727,7251.000%, 04/06/22. . . . . . . EUR 2,450 2,906,6092.375%, 08/21/22. . . . . . . 710 735,537
TOTAL NETHERLANDS. . . . . . 33,262,142
NORWAY — (3.8%)Equinor ASAEquinor ASA
5.625%, 03/11/21. . . . . . . EUR 1,000 1,189,1780.875%, 02/17/23. . . . . . . EUR 2,250 2,681,792
Kommunalbanken A.S.Kommunalbanken A.S.
0.875%, 12/08/20. . . . . . . GBP 500 648,2491.125%, 12/15/21. . . . . . . GBP 1,500 1,963,1440.125%, 03/21/22. . . . . . . SEK 12,000 1,349,0631.125%, 11/30/22. . . . . . . GBP 150 197,9811.500%, 12/15/23. . . . . . . GBP 500 673,085
Kommunalbanken A.S.Floating Rate Note
(r) 0.277%, 04/15/21. . . . . . . 1,000 1,000,145(r) 0.378%, 09/08/21. . . . . . . 3,908 3,910,063(r)Ω 0.336%, 02/24/22. . . . . . . 2,000 2,001,250
TOTAL NORWAY. . . . . . . . . . . . . 15,613,950
SINGAPORE — (1.6%)DBS Bank, Ltd. Floating Rate
Note(r) 0.720%, 09/13/22. . . . . . . AUD 1,000 707,621Monetary Authority of
Singapore Bill0.278%, 11/27/20. . . . . . . SGD 2,420 1,771,353
Temasek Financial I, Ltd.0.500%, 03/01/22. . . . . . . EUR 1,970 2,310,995
United Overseas Bank, Ltd.Floating Rate Note
(r) 0.590%, 07/25/22. . . . . . . AUD 2,500 1,765,128
TOTAL SINGAPORE. . . . . . . . . 6,555,097
SUPRANATIONAL ORGANIZATION OBLIGATIONS — (18.6%)African Development Bank
Floating Rate Note(r) 0.260%, 12/15/21. . . . . . . 2,000 1,999,889African Development Bank
0.250%, 01/24/24. . . . . . . EUR 500 596,756
FaceAmount^ Value†
(000)
SUPRANATIONAL ORGANIZATION OBLIGATIONS —(Continued)
Asian Development BankFloating Rate Note
Asian Development BankFloating Rate Note
(r) 0.314%, 02/01/22. . . . . . . GBP 3,500 $4,539,880(r) 0.344%, 03/19/24. . . . . . . GBP 1,373 1,780,396(r) 0.340%, 05/28/24. . . . . . . 4,500 4,501,597Asian Development Bank
0.200%, 05/25/23. . . . . . . EUR 1,157 1,373,935EUROFIMA Floating Rate
NoteEUROFIMA Floating Rate
Note(r) 0.370%, 11/15/21. . . . . . . 1,400 1,400,238(r) 0.350%, 03/11/22. . . . . . . 3,500 3,498,005European Bank for
Reconstruction &Development Floating RateNote
European Bank forReconstruction &Development Floating RateNote
(r) 0.314%, 01/18/22. . . . . . . GBP 1,750 2,268,621(r) 0.346%, 08/19/22. . . . . . . 1,125 1,124,795(r) 0.304%, 02/27/23. . . . . . . GBP 515 668,110(r) 0.355%, 02/28/24. . . . . . . GBP 1,831 2,376,059(r) 0.369%, 10/15/24. . . . . . . 5,000 4,996,387European Investment BankEuropean Investment Bank
3.500%, 01/14/21. . . . . . . SEK 9,000 1,018,4271.500%, 05/12/22. . . . . . . NOK 8,840 941,6270.500%, 07/19/22. . . . . . . SEK 10,000 1,133,3501.054%, 09/08/25. . . . . . . GBP 946 1,271,192
European Investment BankFloating Rate Note
(r) 0.334%, 01/10/22. . . . . . . GBP 750 973,432(r) 0.404%, 06/29/23. . . . . . . GBP 1,700 2,211,793(r) 0.368%, 03/05/24. . . . . . . 1,800 1,798,789(r) 0.364%, 01/15/25. . . . . . . GBP 1,833 2,385,417European Stability
Mechanism Treasury BillEuropean Stability
Mechanism Treasury Bill(0.562%), 12/03/20. . . . . . EUR 4,000 4,660,620(0.552%), 12/17/20. . . . . . EUR 2,307 2,688,556
Inter-American DevelopmentBank Floating Rate Note
Inter-American DevelopmentBank Floating Rate Note
(r) 0.437%, 07/15/21. . . . . . . 50 50,036
VA GLOBAL BOND PORTFOLIO
CONTINUED
41

FaceAmount^ Value†
(000)
SUPRANATIONAL ORGANIZATION OBLIGATIONS —(Continued)
(r) 0.237%, 01/15/22. . . . . . . 358 $ 357,857(r) 0.348%, 09/16/22. . . . . . . 4,000 4,003,040Inter-American Development
Bank4.750%, 08/27/24. . . . . . . AUD 2,000 1,638,568
Inter-American InvestmentCorp. Floating Rate Note
(r) 0.314%, 10/12/21. . . . . . . 4,900 4,898,706International Bank for
Reconstruction &Development
0.294%, 10/04/23. . . . . . . GBP 2,000 2,592,694International Bank for
Reconstruction &Development Floating RateNote
(r) 0.325%, 05/15/24. . . . . . . GBP 868 1,125,967(r) 0.478%, 06/17/24. . . . . . . 2,516 2,514,166(r) 0.387%, 08/06/24. . . . . . . 5,868 5,872,511International Finance Corp.
Floating Rate Note(r) 0.304%, 01/18/22. . . . . . . GBP 1,000 1,296,593Nordic Investment Bank
1.375%, 06/19/23. . . . . . . NOK 18,000 1,929,598
TOTAL SUPRANATIONALORGANIZATIONOBLIGATIONS. . . . . . . . . . . . . 76,487,607
SWEDEN — (6.2%)Kommuninvest I Sverige ABKommuninvest I Sverige AB
0.250%, 06/01/22. . . . . . . SEK 57,330 6,474,4790.750%, 02/22/23. . . . . . . SEK 20,150 2,303,0731.000%, 11/13/23. . . . . . . SEK 5,000 578,085
Skandinaviska EnskildaBanken AB
1.250%, 08/05/22. . . . . . . GBP 100 131,339Svensk Exportkredit ABSvensk Exportkredit AB
0.625%, 12/07/20. . . . . . . GBP 1,500 1,944,2481.375%, 12/15/22. . . . . . . GBP 4,150 5,505,5971.375%, 12/15/23. . . . . . . GBP 500 669,854
Svensk Exportkredit ABFloating Rate Note
(r) 0.357%, 07/15/21. . . . . . . 2,000 2,003,500(r) 0.369%, 12/13/21. . . . . . . 1,500 1,501,517Svenska Handelsbanken ABSvenska Handelsbanken AB
0.250%, 02/28/22. . . . . . . EUR 934 1,096,714
FaceAmount^ Value†
(000)
SWEDEN — (Continued)1.125%, 12/14/22. . . . . . . EUR 2,700 $ 3,241,691
TOTAL SWEDEN. . . . . . . . . . . . . 25,450,097
SWITZERLAND — (1.6%)Nestle Finance International,
Ltd.1.750%, 09/12/22. . . . . . . EUR 500 605,560
Nestle Holdings, Inc.Nestle Holdings, Inc.
1.750%, 12/09/20. . . . . . . GBP 500 648,7351.875%, 03/09/21. . . . . . . 798 801,361
Novartis Finance SANovartis Finance SA
0.750%, 11/09/21. . . . . . . EUR 1,583 1,863,9100.500%, 08/14/23. . . . . . . EUR 1,500 1,784,825
Roche Finance Europe BV0.500%, 02/27/23. . . . . . . EUR 800 949,922
TOTAL SWITZERLAND. . . . . . . 6,654,313
UNITED KINGDOM — (0.4%)Transport for LondonTransport for London
2.250%, 08/09/22. . . . . . . GBP 1,333 1,778,383
UNITED STATES — (4.6%)3M Co.3M Co.
0.375%, 02/15/22. . . . . . . EUR 1,500 1,759,8920.375%, 02/15/22. . . . . . . EUR 800 938,609
Apple, Inc.1.000%, 11/10/22. . . . . . . EUR 2,550 3,050,763
Berkshire Hathaway, Inc.Berkshire Hathaway, Inc.
0.625%, 01/17/23. . . . . . . EUR 2,467 2,922,2370.750%, 03/16/23. . . . . . . EUR 700 831,6171.300%, 03/15/24. . . . . . . EUR 560 681,471
Coca-Cola Co. (The)0.750%, 03/09/23. . . . . . . EUR 1,200 1,426,440
Merck & Co., Inc.1.125%, 10/15/21. . . . . . . EUR 1,750 2,058,409
Oracle Corp.2.250%, 01/10/21. . . . . . . EUR 750 877,689
Pfizer, Inc.0.250%, 03/06/22. . . . . . . EUR 1,950 2,287,124
Procter & Gamble Co. (The)Procter & Gamble Co. (The)
4.125%, 12/07/20. . . . . . . EUR 500 584,6582.000%, 11/05/21. . . . . . . EUR 500 595,7642.000%, 08/16/22. . . . . . . EUR 100 121,392
VA GLOBAL BOND PORTFOLIO
CONTINUED
42

FaceAmount^ Value†
(000)
UNITED STATES — (Continued)Walmart, Inc.
1.900%, 04/08/22. . . . . . . EUR 500 $ 597,967
TOTAL UNITED STATES.. . . . . 18,734,032
TOTAL BONDSCost ($408,799,990). . . . . . . . 411,557,452
Shares Value†
SECURITIES LENDING COLLATERAL — (0.0%)@§ The DFA Short Term
Investment Fund. . . . . . 12 $ 143
TOTAL INVESTMENTS — (100.0%)(Cost $408,800,133). . . . . . . . $411,557,595
As of October 31, 2020, VA Global Bond Portfolio had entered into the following forward currency contracts and the net unrealizedforward currency gain (loss) is reflected in the accompanying financial statements:
Currency Purchased Currency Sold CounterpartySettlement
Date
UnrealizedForeign
ExchangeAppreciation
(Depreciation)
USD 1,020,269 GBP 786,035 JP Morgan 11/03/20 $ 1,961USD 28,404,894 AUD 39,336,456 Bank of America Corp. 11/06/20 754,784USD 78,732,744 EUR 67,107,051 Bank of America Corp. 12/29/20 467,053USD 65,384,866 GBP 50,413,592 State Street Bank and Trust 12/31/20 42,131USD 864,220 EUR 732,350 Citibank, N.A. 01/06/21 9,912USD 79,107,596 EUR 67,112,225 Bank of America Corp. 01/13/21 807,228USD 2,378,673 EUR 2,021,069 HSBC Bank 01/13/21 20,675USD 2,757,252 EUR 2,362,637 UBS AG 01/13/21 744USD 13,433,747 SEK 119,103,453 Morgan Stanley and Co. 01/14/21 35,484USD 1,357,411 CAD 1,806,110 Citibank, N.A. 01/20/21 1,231USD 74,343,426 CAD 98,023,220 Royal Bank of Scotland 01/20/21 739,292
Total Appreciation $2,880,495
USD 60,651,332 GBP 47,048,562 Citibank, N.A. 11/03/20 $ (300,061)USD 3,412,008 GBP 2,652,208 JP Morgan 11/03/20 (23,926)GBP 50,486,805 USD 65,458,667 State Street Bank and Trust 11/03/20 (53,033)AUD 974,057 USD 693,185 Citibank, N.A. 11/06/20 (8,507)USD 1,766,290 SGD 2,418,984 Citibank, N.A. 11/10/20 (4,614)USD 3,525,567 NOK 33,811,373 Bank of America Corp. 11/27/20 (15,723)NOK 6,211,055 USD 652,306 Bank of America Corp. 11/27/20 (1,781)EUR 1,809,135 USD 2,120,300 Citibank, N.A. 12/29/20 (10,339)EUR 1,473,177 USD 1,742,452 HSBC Bank 12/29/20 (24,313)EUR 732,350 USD 866,568 HSBC Bank 01/06/21 (12,259)
Total (Depreciation) $ (454,556)
Total Appreciation(Depreciation) $2,425,939
VA GLOBAL BOND PORTFOLIO
CONTINUED
43

Summary of the Portfolio’s investments as of October 31, 2020, based on their valuation inputs, is as follows (see SecurityValuation Note):
Investments in Securities (Market Value)
Level 1 Level 2 Level 3 Total
BondsAustralia. . . . . . . . . . . . . . . . . . . . . . . . . . . . . . . . . . — $ 24,405,452 — $ 24,405,452Austria. . . . . . . . . . . . . . . . . . . . . . . . . . . . . . . . . . . . — 5,396,584 — 5,396,584Belgium. . . . . . . . . . . . . . . . . . . . . . . . . . . . . . . . . . — 12,455,141 — 12,455,141Canada. . . . . . . . . . . . . . . . . . . . . . . . . . . . . . . . . . . — 82,256,732 — 82,256,732Denmark. . . . . . . . . . . . . . . . . . . . . . . . . . . . . . . . . . — 6,736,088 — 6,736,088Finland. . . . . . . . . . . . . . . . . . . . . . . . . . . . . . . . . . . — 6,980,716 — 6,980,716France. . . . . . . . . . . . . . . . . . . . . . . . . . . . . . . . . . . . — 45,960,950 — 45,960,950Germany. . . . . . . . . . . . . . . . . . . . . . . . . . . . . . . . . — 27,606,400 — 27,606,400Japan. . . . . . . . . . . . . . . . . . . . . . . . . . . . . . . . . . . . — 15,223,768 — 15,223,768Netherlands. . . . . . . . . . . . . . . . . . . . . . . . . . . . . . . — 33,262,142 — 33,262,142Norway. . . . . . . . . . . . . . . . . . . . . . . . . . . . . . . . . . . — 15,613,950 — 15,613,950Singapore. . . . . . . . . . . . . . . . . . . . . . . . . . . . . . . . — 6,555,097 — 6,555,097Supranational Organization Obligations. . . . . — 76,487,607 — 76,487,607Sweden. . . . . . . . . . . . . . . . . . . . . . . . . . . . . . . . . . — 25,450,097 — 25,450,097Switzerland. . . . . . . . . . . . . . . . . . . . . . . . . . . . . . . — 6,654,313 — 6,654,313United Kingdom. . . . . . . . . . . . . . . . . . . . . . . . . . . — 1,778,383 — 1,778,383United States. . . . . . . . . . . . . . . . . . . . . . . . . . . . . — 18,734,032 — 18,734,032
Securities Lending Collateral. . . . . . . . . . . . . . . . . — 143 — 143Forward Currency Contracts**. . . . . . . . . . . . . . . . — 2,425,939 — 2,425,939
TOTAL. . . . . . . . . . . . . . . . . . . . . . . . . . . . . . . . . . . . . . — $413,983,534 — $413,983,534
** Valued at the unrealized appreciation/(depreciation) on the investment.
VA GLOBAL BOND PORTFOLIO
CONTINUED
See accompanying Notes to Financial Statements.
44

VIT INFLATION-PROTECTED SECURITIES PORTFOLIO
SCHEDULE OF INVESTMENTS
October 31, 2020
FaceAmount± Value†
(000)
U.S. TREASURY OBLIGATIONS — (99.9%)Treasury Inflation Protected Security
0.625%, 01/15/26. . . . . . . . . . . . . . . . . . . . . . . . . . . . . . . . . . . . . . . . . . . . . . . . . . . . . . . . . 8,025 $ 9,600,2230.125%, 07/15/26. . . . . . . . . . . . . . . . . . . . . . . . . . . . . . . . . . . . . . . . . . . . . . . . . . . . . . . . . 5,300 6,184,0220.375%, 01/15/27. . . . . . . . . . . . . . . . . . . . . . . . . . . . . . . . . . . . . . . . . . . . . . . . . . . . . . . . . 12,150 14,261,6552.375%, 01/15/27. . . . . . . . . . . . . . . . . . . . . . . . . . . . . . . . . . . . . . . . . . . . . . . . . . . . . . . . . 8,025 12,629,8350.375%, 07/15/27. . . . . . . . . . . . . . . . . . . . . . . . . . . . . . . . . . . . . . . . . . . . . . . . . . . . . . . . . 8,200 9,587,2930.500%, 01/15/28. . . . . . . . . . . . . . . . . . . . . . . . . . . . . . . . . . . . . . . . . . . . . . . . . . . . . . . . . 16,020 18,737,0001.750%, 01/15/28. . . . . . . . . . . . . . . . . . . . . . . . . . . . . . . . . . . . . . . . . . . . . . . . . . . . . . . . . 9,980 14,913,0883.625%, 04/15/28. . . . . . . . . . . . . . . . . . . . . . . . . . . . . . . . . . . . . . . . . . . . . . . . . . . . . . . . . 9,392 20,439,3030.750%, 07/15/28. . . . . . . . . . . . . . . . . . . . . . . . . . . . . . . . . . . . . . . . . . . . . . . . . . . . . . . . . 8,100 9,555,7090.875%, 01/15/29. . . . . . . . . . . . . . . . . . . . . . . . . . . . . . . . . . . . . . . . . . . . . . . . . . . . . . . . . 13,400 15,878,1372.500%, 01/15/29. . . . . . . . . . . . . . . . . . . . . . . . . . . . . . . . . . . . . . . . . . . . . . . . . . . . . . . . . 10,300 16,087,8393.875%, 04/15/29. . . . . . . . . . . . . . . . . . . . . . . . . . . . . . . . . . . . . . . . . . . . . . . . . . . . . . . . . 7,790 17,486,0270.250%, 07/15/29. . . . . . . . . . . . . . . . . . . . . . . . . . . . . . . . . . . . . . . . . . . . . . . . . . . . . . . . . 500 561,5560.125%, 01/15/30. . . . . . . . . . . . . . . . . . . . . . . . . . . . . . . . . . . . . . . . . . . . . . . . . . . . . . . . . 17,800 19,612,0813.375%, 04/15/32. . . . . . . . . . . . . . . . . . . . . . . . . . . . . . . . . . . . . . . . . . . . . . . . . . . . . . . . . 6,220 13,606,5482.125%, 02/15/40. . . . . . . . . . . . . . . . . . . . . . . . . . . . . . . . . . . . . . . . . . . . . . . . . . . . . . . . . 5,950 10,760,566
TOTAL U.S. TREASURY OBLIGATIONSCost ($197,398,232). . . . . . . . . . . . . . . . . . . . . . . . . . . . . . . . . . . . . . . . . . . . . . . . . . . . . . . . . . . 209,900,882
Shares
TEMPORARY CASH INVESTMENTS — (0.1%)State Street Institutional U.S. Government Money Market Fund 0.026%. . . . . . 252,312 252,312
TOTAL INVESTMENTS — (100.0%)(Cost $197,650,544). . . . . . . . . . . . . . . . . . . . . . . . . . . . . . . . . . . . . . . . . . . . . . . . . . . . . . . . . . . $210,153,194
Summary of the Portfolio’s investments as of October 31, 2020, based on their valuation inputs, is as follows (see SecurityValuation Note):
Investments in Securities (Market Value)
Level 1 Level 2 Level 3 Total
U.S. Treasury Obligations. . . . . . . . . . . . . . . . . . . . — $209,900,882 — $209,900,882Temporary Cash Investments. . . . . . . . . . . . . . . . . $252,312 — — 252,312
TOTAL. . . . . . . . . . . . . . . . . . . . . . . . . . . . . . . . . . . . . . $252,312 $209,900,882 — $210,153,194
See accompanying Notes to Financial Statements.
45

VA GLOBAL MODERATE ALLOCATION PORTFOLIO
SCHEDULE OF INVESTMENTS
October 31, 2020
Shares Value†
AFFILIATED INVESTMENT COMPANIES — (100.0%)Investment in U.S. Core Equity 2 Portfolio of
DFA Investment Dimensions Group Inc.. . . . . . . . . . . . . . . . . . . . . . . . . . . . . . . . . . . . . . . . . . . . . 2,061,996 $ 46,992,888Investment in VA Global Bond Portfolio of
DFA Investment Dimensions Group Inc.. . . . . . . . . . . . . . . . . . . . . . . . . . . . . . . . . . . . . . . . . . . . . 1,752,079 18,607,080Investment in DFA Selectively Hedged Global Fixed Income Portfolio of
DFA Investment Dimensions Group Inc.. . . . . . . . . . . . . . . . . . . . . . . . . . . . . . . . . . . . . . . . . . . . . 1,906,463 18,607,076Investment in U.S. Core Equity 1 Portfolio of
DFA Investment Dimensions Group Inc.. . . . . . . . . . . . . . . . . . . . . . . . . . . . . . . . . . . . . . . . . . . . . 662,272 16,715,741Investment in International Core Equity Portfolio of
DFA Investment Dimensions Group Inc.. . . . . . . . . . . . . . . . . . . . . . . . . . . . . . . . . . . . . . . . . . . . . 1,338,542 16,169,586Investment in Emerging Markets Core Equity Portfolio of
DFA Investment Dimensions Group Inc.. . . . . . . . . . . . . . . . . . . . . . . . . . . . . . . . . . . . . . . . . . . . . 385,184 7,834,641Investment in DFA Two-Year Global Fixed Income Portfolio of
DFA Investment Dimensions Group Inc.. . . . . . . . . . . . . . . . . . . . . . . . . . . . . . . . . . . . . . . . . . . . . 751,904 7,519,042Investment in VA Short-Term Fixed Portfolio of
DFA Investment Dimensions Group Inc.. . . . . . . . . . . . . . . . . . . . . . . . . . . . . . . . . . . . . . . . . . . . . 732,850 7,519,042Investment in VA U.S. Large Value Portfolio of
DFA Investment Dimensions Group Inc.. . . . . . . . . . . . . . . . . . . . . . . . . . . . . . . . . . . . . . . . . . . . . 148,432 3,350,111Investment in DFA Real Estate Securities Portfolio of
DFA Investment Dimensions Group Inc.. . . . . . . . . . . . . . . . . . . . . . . . . . . . . . . . . . . . . . . . . . . . . 61,423 2,101,280Investment in VA International Value Portfolio of
DFA Investment Dimensions Group Inc.. . . . . . . . . . . . . . . . . . . . . . . . . . . . . . . . . . . . . . . . . . . . . 163,450 1,564,219
TOTAL INVESTMENTS IN AFFILIATED INVESTMENT COMPANIES(Cost $122,689,786). . . . . . . . . . . . . . . . . . . . . . . . . . . . . . . . . . . . . . . . . . . . . . . . . . . . . . . . . . . . . . . $146,980,706
Summary of the Portfolio’s investments as of October 31, 2020, based on their valuation inputs, is as follows (see SecurityValuation Note):
Investments in Securities (Market Value)
Level 1 Level 2 Level 3 Total
Affiliated Investment Companies. . . . . . . . . . . . . . $146,980,706 — — $146,980,706
TOTAL. . . . . . . . . . . . . . . . . . . . . . . . . . . . . . . . . . . . . . $146,980,706 — — $146,980,706
See accompanying Notes to Financial Statements.
46

VA EQUITY ALLOCATION PORTFOLIO
SCHEDULE OF INVESTMENTS
October 31, 2020
Shares Value†
AFFILIATED INVESTMENT COMPANIES — (100.0%)Investment in U.S. Core Equity 1 Portfolio of
DFA Investment Dimensions Group Inc.. . . . . . . . . . . . . . . . . . . . . . . . . . . . . . . . . . . . . . . . . . . . . 908,724 $22,936,206Investment in U.S. Large Company Portfolio of
Dimensional Investment Group Inc.. . . . . . . . . . . . . . . . . . . . . . . . . . . . . . . . . . . . . . . . . . . . . . . . . 730,699 18,340,538Investment in VA U.S. Targeted Value Portfolio of
DFA Investment Dimensions Group Inc.. . . . . . . . . . . . . . . . . . . . . . . . . . . . . . . . . . . . . . . . . . . . . 715,563 10,404,293Investment in International Core Equity Portfolio of
DFA Investment Dimensions Group Inc.. . . . . . . . . . . . . . . . . . . . . . . . . . . . . . . . . . . . . . . . . . . . . 814,282 9,836,525Investment in Emerging Markets Core Equity Portfolio of
DFA Investment Dimensions Group Inc.. . . . . . . . . . . . . . . . . . . . . . . . . . . . . . . . . . . . . . . . . . . . . 334,191 6,797,452Investment in VA U.S. Large Value Portfolio of
DFA Investment Dimensions Group Inc.. . . . . . . . . . . . . . . . . . . . . . . . . . . . . . . . . . . . . . . . . . . . . 257,558 5,813,074Investment in VA International Small Portfolio of
DFA Investment Dimensions Group Inc.. . . . . . . . . . . . . . . . . . . . . . . . . . . . . . . . . . . . . . . . . . . . . 270,115 3,030,696Investment in VA International Value Portfolio of
DFA Investment Dimensions Group Inc.. . . . . . . . . . . . . . . . . . . . . . . . . . . . . . . . . . . . . . . . . . . . . 237,838 2,276,108Investment in DFA Real Estate Securities Portfolio of
DFA Investment Dimensions Group Inc.. . . . . . . . . . . . . . . . . . . . . . . . . . . . . . . . . . . . . . . . . . . . . 53,005 1,813,285
TOTAL INVESTMENTS IN AFFILIATED INVESTMENT COMPANIES(Cost $76,675,784). . . . . . . . . . . . . . . . . . . . . . . . . . . . . . . . . . . . . . . . . . . . . . . . . . . . . . . . . . . . . . . . $81,248,177
Summary of the Portfolio’s investments as of October 31, 2020, based on their valuation inputs, is as follows (see SecurityValuation Note):
Investments in Securities (Market Value)
Level 1 Level 2 Level 3 Total
Affiliated Investment Companies. . . . . . . . . . . . . . $81,248,177 — — $81,248,177
TOTAL. . . . . . . . . . . . . . . . . . . . . . . . . . . . . . . . . . . . . . $81,248,177 — — $81,248,177
See accompanying Notes to Financial Statements.
47

VA U.S.Targeted Value
Portfolio*VA U.S. Large
Value Portfolio*
VAInternational
Value Portfolio*
VAInternational
Small Portfolio*
ASSETS:Investment Securities at Value (including $12,302, $1,009,
$10,304 and $15,674 of securities on loan,respectively). . . . . . . . . . . . . . . . . . . . . . . . . . . . . . . . . . . . . . . . . . . . . $ 317,016 $ 455,411 $ 280,063 $ 228,806
Collateral from Securities on Loan Invested in Affiliate atValue (including cost of $5,552, $619, $9,849 and$12,399, respectively). . . . . . . . . . . . . . . . . . . . . . . . . . . . . . . . . . . 5,554 619 9,853 12,401
Foreign Currencies at Value. . . . . . . . . . . . . . . . . . . . . . . . . . . . . . . . — — 156 223Cash . . . . . . . . . . . . . . . . . . . . . . . . . . . . . . . . . . . . . . . . . . . . . . . . . . . . . . 17 — — —Receivables:
Investment Securities Sold. . . . . . . . . . . . . . . . . . . . . . . . . . . . . . . 1,390 1,313 1,001 630Dividends and Interest. . . . . . . . . . . . . . . . . . . . . . . . . . . . . . . . . . . 152 820 1,335 729Securities Lending Income. . . . . . . . . . . . . . . . . . . . . . . . . . . . . . . 25 1 2 43Fund Shares Sold. . . . . . . . . . . . . . . . . . . . . . . . . . . . . . . . . . . . . . . 29 16 60 43
Unrealized Gain on Foreign Currency Contracts. . . . . . . . . . . . — — 1 1Total Assets. . . . . . . . . . . . . . . . . . . . . . . . . . . . . . . . . . . . . . . . . 324,183 458,180 292,471 242,876
LIABILITIES:Payables:
Due to Custodian . . . . . . . . . . . . . . . . . . . . . . . . . . . . . . . . . . . . . . . — — 6 —Upon Return of Securities Loaned. . . . . . . . . . . . . . . . . . . . . . . 5,548 619 9,848 12,400Investment Securities Purchased. . . . . . . . . . . . . . . . . . . . . . . . — — 476 104Fund Shares Redeemed. . . . . . . . . . . . . . . . . . . . . . . . . . . . . . . . . 263 415 110 135Due to Advisor. . . . . . . . . . . . . . . . . . . . . . . . . . . . . . . . . . . . . . . . . . . 97 102 101 103Line of Credit. . . . . . . . . . . . . . . . . . . . . . . . . . . . . . . . . . . . . . . . . . . . 392 852 319 219
Accrued Expenses and Other Liabilities. . . . . . . . . . . . . . . . . . . . 66 85 62 71Total Liabilities. . . . . . . . . . . . . . . . . . . . . . . . . . . . . . . . . . . . . . 6,366 2,073 10,922 13,032
NET ASSETS. . . . . . . . . . . . . . . . . . . . . . . . . . . . . . . . . . . . . . . . . . . . . . $ 317,817 $ 456,107 $ 281,549 $ 229,844SHARES OUTSTANDING, $0.01 PAR VALUE (1). . . . . . . . . . 21,851,224 20,208,600 29,407,254 20,484,995NET ASSET VALUE, OFFERING AND REDEMPTION
PRICE PER SHARE. . . . . . . . . . . . . . . . . . . . . . . . . . . . . . . . . . . . . $ 14.54 $ 22.57 $ 9.57 $ 11.22Investment Securities at Cost. . . . . . . . . . . . . . . . . . . . . . . . . . . . . . $ 352,940 $ 413,477 $ 350,669 $ 244,032Foreign Currencies at Cost. . . . . . . . . . . . . . . . . . . . . . . . . . . . . . . . . $ — $ — $ 156 $ 223NET ASSETS CONSIST OF:Paid-In Capital. . . . . . . . . . . . . . . . . . . . . . . . . . . . . . . . . . . . . . . . . . . . . $ 353,333 $ 421,646 $ 357,201 $ 238,660Total Distributable Earnings (Loss). . . . . . . . . . . . . . . . . . . . . . . . . (35,516) 34,461 (75,652) (8,816)NET ASSETS. . . . . . . . . . . . . . . . . . . . . . . . . . . . . . . . . . . . . . . . . . . . . . $ 317,817 $ 456,107 $ 281,549 $ 229,844(1) NUMBER OF SHARES AUTHORIZED. . . . . . . . . . . . . . . . . 1,000,000,000 1,000,000,000 1,000,000,000 1,000,000,000
* See Note J in the Notes to Financial Statements for additional information about securities lending collateral.
DFA INVESTMENT DIMENSIONS GROUP INC.
STATEMENTS OF ASSETS AND LIABILITIES
OCTOBER 31, 2020(Amounts in thousands, except share and per share amounts)
See accompanying Notes to Financial Statements.
48

VA Short-Term FixedPortfolio*
VA GlobalBond Portfolio
VIT Inflation-ProtectedSecuritiesPortfolio
ASSETS:Investment Securities at Value (including $4,000, $0 and $0 of securities
on loan, respectively). . . . . . . . . . . . . . . . . . . . . . . . . . . . . . . . . . . . . . . . . . . . . . . . . . . . . $ 342,203 $ 411,557 $ 209,901Temporary Cash Investments at Value & Cost. . . . . . . . . . . . . . . . . . . . . . . . . . . . . . . 1,570 — 252Collateral from Securities on Loan Invested in Affiliate at Value (including
cost of $4,083, $0 and $0, respectively). . . . . . . . . . . . . . . . . . . . . . . . . . . . . . . . . . . 4,083 — —Foreign Currencies at Value. . . . . . . . . . . . . . . . . . . . . . . . . . . . . . . . . . . . . . . . . . . . . . . . . — 92 —Cash . . . . . . . . . . . . . . . . . . . . . . . . . . . . . . . . . . . . . . . . . . . . . . . . . . . . . . . . . . . . . . . . . . . . . . . — 4,849 —Receivables:
Investment Securities Sold. . . . . . . . . . . . . . . . . . . . . . . . . . . . . . . . . . . . . . . . . . . . . . . . — 3,178 —Dividends and Interest. . . . . . . . . . . . . . . . . . . . . . . . . . . . . . . . . . . . . . . . . . . . . . . . . . . . 121 1,292 453Fund Shares Sold. . . . . . . . . . . . . . . . . . . . . . . . . . . . . . . . . . . . . . . . . . . . . . . . . . . . . . . . 16,161 908 10
Unrealized Gain on Forward Currency Contracts. . . . . . . . . . . . . . . . . . . . . . . . . . . . — 2,880 —Unrealized Gain on Foreign Currency Contracts. . . . . . . . . . . . . . . . . . . . . . . . . . . . . — 8 —Prepaid Expenses and Other Assets . . . . . . . . . . . . . . . . . . . . . . . . . . . . . . . . . . . . . . . . — 3 —
Total Assets. . . . . . . . . . . . . . . . . . . . . . . . . . . . . . . . . . . . . . . . . . . . . . . . . . . . . . . . . . 364,138 424,767 210,616LIABILITIES:Payables:
Upon Return of Securities Loaned. . . . . . . . . . . . . . . . . . . . . . . . . . . . . . . . . . . . . . . . 4,080 — —Investment Securities Purchased. . . . . . . . . . . . . . . . . . . . . . . . . . . . . . . . . . . . . . . . . . — 7,415 —Fund Shares Redeemed. . . . . . . . . . . . . . . . . . . . . . . . . . . . . . . . . . . . . . . . . . . . . . . . . . 73 381 268Due to Advisor. . . . . . . . . . . . . . . . . . . . . . . . . . . . . . . . . . . . . . . . . . . . . . . . . . . . . . . . . . . . 52 75 18
Unrealized Loss on Forward Currency Contracts. . . . . . . . . . . . . . . . . . . . . . . . . . . . — 455 —Unrealized Loss on Foreign Currency Contracts. . . . . . . . . . . . . . . . . . . . . . . . . . . . . — 2 —Accrued Expenses and Other Liabilities. . . . . . . . . . . . . . . . . . . . . . . . . . . . . . . . . . . . . 62 70 43
Total Liabilities. . . . . . . . . . . . . . . . . . . . . . . . . . . . . . . . . . . . . . . . . . . . . . . . . . . . . . . 4,267 8,398 329NET ASSETS. . . . . . . . . . . . . . . . . . . . . . . . . . . . . . . . . . . . . . . . . . . . . . . . . . . . . . . . . . . . . . . $ 359,871 $ 416,369 $ 210,287SHARES OUTSTANDING, $0.01 PAR VALUE (1). . . . . . . . . . . . . . . . . . . . . . . . . . . 35,064,427 39,209,862 18,724,101NET ASSET VALUE, OFFERING AND REDEMPTION PRICE PER
SHARE. . . . . . . . . . . . . . . . . . . . . . . . . . . . . . . . . . . . . . . . . . . . . . . . . . . . . . . . . . . . . . . . . . . $ 10.26 $ 10.62 $ 11.23Investment Securities at Cost. . . . . . . . . . . . . . . . . . . . . . . . . . . . . . . . . . . . . . . . . . . . . . . $ 342,146 $ 408,798 $ 197,399Foreign Currencies at Cost. . . . . . . . . . . . . . . . . . . . . . . . . . . . . . . . . . . . . . . . . . . . . . . . . . $ — $ 92 $ —NET ASSETS CONSIST OF:Paid-In Capital. . . . . . . . . . . . . . . . . . . . . . . . . . . . . . . . . . . . . . . . . . . . . . . . . . . . . . . . . . . . . . $ 358,018 $ 415,904 $ 194,917Total Distributable Earnings (Loss). . . . . . . . . . . . . . . . . . . . . . . . . . . . . . . . . . . . . . . . . . 1,853 465 15,370NET ASSETS. . . . . . . . . . . . . . . . . . . . . . . . . . . . . . . . . . . . . . . . . . . . . . . . . . . . . . . . . . . . . . . $ 359,871 $ 416,369 $ 210,287(1) NUMBER OF SHARES AUTHORIZED. . . . . . . . . . . . . . . . . . . . . . . . . . . . . . . . . . . 1,000,000,000 1,000,000,000 1,000,000,000
* See Note J in the Notes to Financial Statements for additional information about securities lending collateral.
DFA INVESTMENT DIMENSIONS GROUP INC.
STATEMENTS OF ASSETS AND LIABILITIES
OCTOBER 31, 2020(Amounts in thousands, except share and per share amounts)
See accompanying Notes to Financial Statements.
49

VAGlobal
ModerateAllocationPortfolio
VA EquityAllocationPortfolio
ASSETS:Investments in Affiliated Investment Companies at Value. . . . . . . . . . . . . . . . . . . . . . . . . . . . . . . . . . . . . . . $ 146,981 $ 81,248Receivables:
Investment Securities/Affiliated Investment Companies Sold. . . . . . . . . . . . . . . . . . . . . . . . . . . . . . . . . . 611 548Fund Shares Sold. . . . . . . . . . . . . . . . . . . . . . . . . . . . . . . . . . . . . . . . . . . . . . . . . . . . . . . . . . . . . . . . . . . . . . . . . . . 14 —
Prepaid Expenses and Other Assets . . . . . . . . . . . . . . . . . . . . . . . . . . . . . . . . . . . . . . . . . . . . . . . . . . . . . . . . . . . — 1Total Assets. . . . . . . . . . . . . . . . . . . . . . . . . . . . . . . . . . . . . . . . . . . . . . . . . . . . . . . . . . . . . . . . . . . . . . . . . . . . . 147,606 81,797
LIABILITIES:Payables:
Fund Shares Redeemed. . . . . . . . . . . . . . . . . . . . . . . . . . . . . . . . . . . . . . . . . . . . . . . . . . . . . . . . . . . . . . . . . . . . . 61 178Due to Advisor. . . . . . . . . . . . . . . . . . . . . . . . . . . . . . . . . . . . . . . . . . . . . . . . . . . . . . . . . . . . . . . . . . . . . . . . . . . . . . . 6 6Line of Credit. . . . . . . . . . . . . . . . . . . . . . . . . . . . . . . . . . . . . . . . . . . . . . . . . . . . . . . . . . . . . . . . . . . . . . . . . . . . . . . . 537 507
Accrued Expenses and Other Liabilities. . . . . . . . . . . . . . . . . . . . . . . . . . . . . . . . . . . . . . . . . . . . . . . . . . . . . . . . 24 23Total Liabilities. . . . . . . . . . . . . . . . . . . . . . . . . . . . . . . . . . . . . . . . . . . . . . . . . . . . . . . . . . . . . . . . . . . . . . . . . . 628 714
NET ASSETS. . . . . . . . . . . . . . . . . . . . . . . . . . . . . . . . . . . . . . . . . . . . . . . . . . . . . . . . . . . . . . . . . . . . . . . . . . . . . . . . . . $ 146,978 $ 81,083SHARES OUTSTANDING, $0.01 PAR VALUE (1). . . . . . . . . . . . . . . . . . . . . . . . . . . . . . . . . . . . . . . . . . . . . . 11,142,712 7,385,115NET ASSET VALUE, OFFERING AND REDEMPTION PRICE PER SHARE. . . . . . . . . . . . . . . . . . . $ 13.19 $ 10.98Investments in Affiliated Investment Companies at Cost. . . . . . . . . . . . . . . . . . . . . . . . . . . . . . . . . . . . . . . . $ 122,690 $ 76,676NET ASSETS CONSIST OF:Paid-In Capital. . . . . . . . . . . . . . . . . . . . . . . . . . . . . . . . . . . . . . . . . . . . . . . . . . . . . . . . . . . . . . . . . . . . . . . . . . . . . . . . . $ 120,832 $ 77,733Total Distributable Earnings (Loss). . . . . . . . . . . . . . . . . . . . . . . . . . . . . . . . . . . . . . . . . . . . . . . . . . . . . . . . . . . . . 26,146 3,350NET ASSETS. . . . . . . . . . . . . . . . . . . . . . . . . . . . . . . . . . . . . . . . . . . . . . . . . . . . . . . . . . . . . . . . . . . . . . . . . . . . . . . . . . $ 146,978 $ 81,083(1) NUMBER OF SHARES AUTHORIZED. . . . . . . . . . . . . . . . . . . . . . . . . . . . . . . . . . . . . . . . . . . . . . . . . . . . . . 1,000,000,000 500,000,000
DFA INVESTMENT DIMENSIONS GROUP INC.
STATEMENTS OF ASSETS AND LIABILITIES
OCTOBER 31, 2020(Amounts in thousands, except share and per share amounts)
See accompanying Notes to Financial Statements.
50

VA U.S.Targeted Value
Portfolio#VA U.S. Large
Value Portfolio#
VAInternational
Value Portfolio#
VAInternational
Small Portfolio#
Investment IncomeDividends (Net of Foreign Taxes Withheld of $7, $0, $919
and $499, respectively). . . . . . . . . . . . . . . . . . . . . . . . . . . . . . . . . . . $ 6,107 $ 13,426 $ 8,814 $ 5,491Income from Securities Lending. . . . . . . . . . . . . . . . . . . . . . . . . . . . . 211 13 141 455
Total Investment Income. . . . . . . . . . . . . . . . . . . . . . . . . . . . . . . . 6,318 13,439 8,955 5,946Expenses
Investment Management Fees. . . . . . . . . . . . . . . . . . . . . . . . . . . . . . 1,112 1,259 1,213 1,178Accounting & Transfer Agent Fees. . . . . . . . . . . . . . . . . . . . . . . . . . 26 34 31 28Custodian Fees. . . . . . . . . . . . . . . . . . . . . . . . . . . . . . . . . . . . . . . . . . . . . 12 9 27 65Filing Fees. . . . . . . . . . . . . . . . . . . . . . . . . . . . . . . . . . . . . . . . . . . . . . . . . . 4 13 7 4Shareholders’ Reports. . . . . . . . . . . . . . . . . . . . . . . . . . . . . . . . . . . . . . 28 31 28 28Directors’/Trustees’ Fees & Expenses. . . . . . . . . . . . . . . . . . . . . . . 2 4 2 1Professional Fees. . . . . . . . . . . . . . . . . . . . . . . . . . . . . . . . . . . . . . . . . . . 7 11 9 7Other. . . . . . . . . . . . . . . . . . . . . . . . . . . . . . . . . . . . . . . . . . . . . . . . . . . . . . . 12 18 15 15
Total Expenses. . . . . . . . . . . . . . . . . . . . . . . . . . . . . . . . . . . . . . . . . 1,203 1,379 1,332 1,326Fees Paid Indirectly (Note C). . . . . . . . . . . . . . . . . . . . . . . . . . . . . . . . — — 15 6Net Expenses. . . . . . . . . . . . . . . . . . . . . . . . . . . . . . . . . . . . . . . . . . . . . . . 1,203 1,379 1,317 1,320Net Investment Income (Loss). . . . . . . . . . . . . . . . . . . . . . . . . . . . . 5,115 12,060 7,638 4,626
Realized and Unrealized Gain (Loss)Net Realized Gain (Loss) on:
Investment Securities Sold**. . . . . . . . . . . . . . . . . . . . . . . . . . . . . . (3,253) (16,804) (6,347) 4,961Affiliated Investment Companies Shares Sold. . . . . . . . . . . . . (1) — 3 —Futures. . . . . . . . . . . . . . . . . . . . . . . . . . . . . . . . . . . . . . . . . . . . . . . . . . . — (80) 142 52Foreign Currency Transactions. . . . . . . . . . . . . . . . . . . . . . . . . . . . — — (3) (46)
Change in Unrealized Appreciation (Depreciation) of:Investment Securities and Foreign Currency. . . . . . . . . . . . . . (42,292) (59,166) (62,012) (17,200)Affiliated Investment Companies Shares. . . . . . . . . . . . . . . . . . — (1) 1 1Translation of Foreign Currency-Denominated Amounts. . . — — 22 9
Net Realized and Unrealized Gain (Loss). . . . . . . . . . . . . . . . . (45,546) (76,051) (68,194) (12,223)Net Increase (Decrease) in Net Assets Resulting from
Operations. . . . . . . . . . . . . . . . . . . . . . . . . . . . . . . . . . . . . . . . . . . . . . . . . $(40,431) $(63,991) $(60,556) $ (7,597)
** Net of foreign capital gain taxes withheld of $0, $0, $0 and $0, respectively.# Portion of income is from investment in affiliated fund.
DFA INVESTMENT DIMENSIONS GROUP INC.
STATEMENTS OF OPERATIONS
FOR THE YEAR ENDED OCTOBER 31, 2020(Amounts in thousands)
See accompanying Notes to Financial Statements.
51

VA Short-Term FixedPortfolio#
VA GlobalBond Portfolio#
VIT Inflation-ProtectedSecuritiesPortfolio
Investment IncomeInterest. . . . . . . . . . . . . . . . . . . . . . . . . . . . . . . . . . . . . . . . . . . . . . . . . . . . . . . . . . . . . . . . . . . . . . . . . . . . $3,636 $ 2,606 $ 2,347Income from Securities Lending. . . . . . . . . . . . . . . . . . . . . . . . . . . . . . . . . . . . . . . . . . . . . . . . . . . . 13 — —
Total Investment Income. . . . . . . . . . . . . . . . . . . . . . . . . . . . . . . . . . . . . . . . . . . . . . . . . . . . . . . 3,649 2,606 2,347Expenses
Investment Management Fees. . . . . . . . . . . . . . . . . . . . . . . . . . . . . . . . . . . . . . . . . . . . . . . . . . . . . 588 870 159Accounting & Transfer Agent Fees. . . . . . . . . . . . . . . . . . . . . . . . . . . . . . . . . . . . . . . . . . . . . . . . . 26 31 20Custodian Fees. . . . . . . . . . . . . . . . . . . . . . . . . . . . . . . . . . . . . . . . . . . . . . . . . . . . . . . . . . . . . . . . . . . . 12 30 2Filing Fees. . . . . . . . . . . . . . . . . . . . . . . . . . . . . . . . . . . . . . . . . . . . . . . . . . . . . . . . . . . . . . . . . . . . . . . . . 3 7 4Shareholders’ Reports. . . . . . . . . . . . . . . . . . . . . . . . . . . . . . . . . . . . . . . . . . . . . . . . . . . . . . . . . . . . . 28 27 20Directors’/Trustees’ Fees & Expenses. . . . . . . . . . . . . . . . . . . . . . . . . . . . . . . . . . . . . . . . . . . . . . 3 3 2Professional Fees. . . . . . . . . . . . . . . . . . . . . . . . . . . . . . . . . . . . . . . . . . . . . . . . . . . . . . . . . . . . . . . . . . 7 9 4Other. . . . . . . . . . . . . . . . . . . . . . . . . . . . . . . . . . . . . . . . . . . . . . . . . . . . . . . . . . . . . . . . . . . . . . . . . . . . . . 7 10 4
Total Expenses. . . . . . . . . . . . . . . . . . . . . . . . . . . . . . . . . . . . . . . . . . . . . . . . . . . . . . . . . . . . . . . . 674 987 215Fees Paid Indirectly (Note C). . . . . . . . . . . . . . . . . . . . . . . . . . . . . . . . . . . . . . . . . . . . . . . . . . . . . . . — 32 —Net Expenses. . . . . . . . . . . . . . . . . . . . . . . . . . . . . . . . . . . . . . . . . . . . . . . . . . . . . . . . . . . . . . . . . . . . . . 674 955 215Net Investment Income (Loss). . . . . . . . . . . . . . . . . . . . . . . . . . . . . . . . . . . . . . . . . . . . . . . . . . . . 2,975 1,651 2,132
Realized and Unrealized Gain (Loss)Net Realized Gain (Loss) on:
Investment Securities Sold**. . . . . . . . . . . . . . . . . . . . . . . . . . . . . . . . . . . . . . . . . . . . . . . . . . . . . 52 (1,284) 1,853Affiliated Investment Companies Shares Sold. . . . . . . . . . . . . . . . . . . . . . . . . . . . . . . . . . . . 3 — —Foreign Currency Transactions. . . . . . . . . . . . . . . . . . . . . . . . . . . . . . . . . . . . . . . . . . . . . . . . . . . — (13) —Forward Currency Contracts. . . . . . . . . . . . . . . . . . . . . . . . . . . . . . . . . . . . . . . . . . . . . . . . . . . . . — (11,128) —
Change in Unrealized Appreciation (Depreciation) of:Investment Securities and Foreign Currency. . . . . . . . . . . . . . . . . . . . . . . . . . . . . . . . . . . . . (184) 8,796 9,705Affiliated Investment Companies Shares. . . . . . . . . . . . . . . . . . . . . . . . . . . . . . . . . . . . . . . . . (1) — —Translation of Foreign Currency-Denominated Amounts. . . . . . . . . . . . . . . . . . . . . . . . . . — 12 —Forward Currency Contracts.. . . . . . . . . . . . . . . . . . . . . . . . . . . . . . . . . . . . . . . . . . . . . . . . . . . . . — 8,218 —
Net Realized and Unrealized Gain (Loss). . . . . . . . . . . . . . . . . . . . . . . . . . . . . . . . . . . . . . . . (130) 4,601 11,558Net Increase (Decrease) in Net Assets Resulting from Operations. . . . . . . . . . . . . . . . $2,845 $ 6,252 $13,690
** Net of foreign capital gain taxes withheld of $0, $0 and $0, respectively.# Portion of income is from investment in affiliated fund.
DFA INVESTMENT DIMENSIONS GROUP INC.
STATEMENTS OF OPERATIONS
FOR THE YEAR ENDED OCTOBER 31, 2020(Amounts in thousands)
See accompanying Notes to Financial Statements.
52

VAGlobal
ModerateAllocationPortfolio*
VA EquityAllocationPortfolio*
Investment IncomeInvestment IncomeIncome Distributions Received from Affiliated Investment Companies. . . . . . . . . . . . . . . . . . . . . . . . . . . . . . . . . . . . . $2,849 $ 1,486
Total Investment Income. . . . . . . . . . . . . . . . . . . . . . . . . . . . . . . . . . . . . . . . . . . . . . . . . . . . . . . . . . . . . . . . . . . . . . . . . . . 2,849 1,486Expenses
Investment Management Fees. . . . . . . . . . . . . . . . . . . . . . . . . . . . . . . . . . . . . . . . . . . . . . . . . . . . . . . . . . . . . . . . . . . . . . . . . 354 229Accounting & Transfer Agent Fees. . . . . . . . . . . . . . . . . . . . . . . . . . . . . . . . . . . . . . . . . . . . . . . . . . . . . . . . . . . . . . . . . . . . . 12 11Custodian Fees. . . . . . . . . . . . . . . . . . . . . . . . . . . . . . . . . . . . . . . . . . . . . . . . . . . . . . . . . . . . . . . . . . . . . . . . . . . . . . . . . . . . . . . . 1 3Filing Fees. . . . . . . . . . . . . . . . . . . . . . . . . . . . . . . . . . . . . . . . . . . . . . . . . . . . . . . . . . . . . . . . . . . . . . . . . . . . . . . . . . . . . . . . . . . . . — 3Shareholders’ Reports. . . . . . . . . . . . . . . . . . . . . . . . . . . . . . . . . . . . . . . . . . . . . . . . . . . . . . . . . . . . . . . . . . . . . . . . . . . . . . . . . 16 9Directors’/Trustees’ Fees & Expenses. . . . . . . . . . . . . . . . . . . . . . . . . . . . . . . . . . . . . . . . . . . . . . . . . . . . . . . . . . . . . . . . . . 1 1Professional Fees. . . . . . . . . . . . . . . . . . . . . . . . . . . . . . . . . . . . . . . . . . . . . . . . . . . . . . . . . . . . . . . . . . . . . . . . . . . . . . . . . . . . . . 2 2Previously Waived Fees Recovered by Advisor (Note C). . . . . . . . . . . . . . . . . . . . . . . . . . . . . . . . . . . . . . . . . . . . . . . 2 19Other. . . . . . . . . . . . . . . . . . . . . . . . . . . . . . . . . . . . . . . . . . . . . . . . . . . . . . . . . . . . . . . . . . . . . . . . . . . . . . . . . . . . . . . . . . . . . . . . . . 1 2
Total Expenses. . . . . . . . . . . . . . . . . . . . . . . . . . . . . . . . . . . . . . . . . . . . . . . . . . . . . . . . . . . . . . . . . . . . . . . . . . . . . . . . . . . . 389 279Fees Waived, Expenses Reimbursed by Advisor (Note C). . . . . . . . . . . . . . . . . . . . . . . . . . . . . . . . . . . . . . . . . . . . . . 288 167Fees Paid Indirectly (Note C). . . . . . . . . . . . . . . . . . . . . . . . . . . . . . . . . . . . . . . . . . . . . . . . . . . . . . . . . . . . . . . . . . . . . . . . . . — 1Net Expenses. . . . . . . . . . . . . . . . . . . . . . . . . . . . . . . . . . . . . . . . . . . . . . . . . . . . . . . . . . . . . . . . . . . . . . . . . . . . . . . . . . . . . . . . . . 101 111Net Investment Income (Loss). . . . . . . . . . . . . . . . . . . . . . . . . . . . . . . . . . . . . . . . . . . . . . . . . . . . . . . . . . . . . . . . . . . . . . . 2,748 1,375
Realized and Unrealized Gain (Loss)Capital Gain Distributions Received from Affiliated Investment Companies. . . . . . . . . . . . . . . . . . . . . . . . . . . . . . 1,246 735Net Realized Gain (Loss) on:
Affiliated Investment Companies Shares Sold. . . . . . . . . . . . . . . . . . . . . . . . . . . . . . . . . . . . . . . . . . . . . . . . . . . . . . . . 251 (2,085)Futures. . . . . . . . . . . . . . . . . . . . . . . . . . . . . . . . . . . . . . . . . . . . . . . . . . . . . . . . . . . . . . . . . . . . . . . . . . . . . . . . . . . . . . . . . . . . . . — (15)
Change in Unrealized Appreciation (Depreciation) of:Affiliated Investment Companies Shares. . . . . . . . . . . . . . . . . . . . . . . . . . . . . . . . . . . . . . . . . . . . . . . . . . . . . . . . . . . . . 761 1,122
Net Realized and Unrealized Gain (Loss). . . . . . . . . . . . . . . . . . . . . . . . . . . . . . . . . . . . . . . . . . . . . . . . . . . . . . . . . . . . 2,258 (243)Net Increase (Decrease) in Net Assets Resulting from Operations. . . . . . . . . . . . . . . . . . . . . . . . . . . . . . . . . . . . $5,006 $ 1,132
* Investment Income and Realized and Unrealized Gain (Loss) were distributed from the Portfolio’s Underlying Funds (Affiliated InvestmentCompanies).
DFA INVESTMENT DIMENSIONS GROUP INC.
STATEMENTS OF OPERATIONS
FOR THE YEAR ENDED OCTOBER 31, 2020(Amounts in thousands)
See accompanying Notes to Financial Statements.
53

VA U.S. TargetedValue Portfolio
VA U.S. LargeValue Portfolio
YearEndedOct 31,
2020
YearEndedOct 31,
2019
YearEndedOct 31,
2020
YearEndedOct 31,
2019
Increase (Decrease) in Net AssetsOperations:
Net Investment Income (Loss). . . . . . . . . . . . . . . . . . . . . . . . . . . . . . . . . . . . . . . . . . . . . . . . . . $ 5,115 $ 4,685 $ 12,060 $ 11,376Net Realized Gain (Loss) on:
Investment Securities Sold*,**. . . . . . . . . . . . . . . . . . . . . . . . . . . . . . . . . . . . . . . . . . . . . . . . . (3,253) 9,134 (16,804) 6,225Affiliated Investment Companies Shares Sold. . . . . . . . . . . . . . . . . . . . . . . . . . . . . . . . . (1) 2 — —Futures. . . . . . . . . . . . . . . . . . . . . . . . . . . . . . . . . . . . . . . . . . . . . . . . . . . . . . . . . . . . . . . . . . . . . . — — (80) (186)
Change in Unrealized Appreciation (Depreciation) of:Investment Securities and Foreign Currency. . . . . . . . . . . . . . . . . . . . . . . . . . . . . . . . . . (42,292) (10,074) (59,166) 17,569Affiliated Investment Companies Shares. . . . . . . . . . . . . . . . . . . . . . . . . . . . . . . . . . . . . . — 2 (1) 1
Net Increase (Decrease) in Net Assets Resulting from Operations. . . . . . . . . . (40,431) 3,749 (63,991) 34,985Distributions:
Institutional Class Shares. . . . . . . . . . . . . . . . . . . . . . . . . . . . . . . . . . . . . . . . . . . . . . . . . . . . (14,346) (23,676) (18,000) (21,355)Capital Share Transactions (1):
Shares Issued. . . . . . . . . . . . . . . . . . . . . . . . . . . . . . . . . . . . . . . . . . . . . . . . . . . . . . . . . . . . . . . . . . 99,139 67,530 110,491 141,404Shares Issued in Lieu of Cash Distributions. . . . . . . . . . . . . . . . . . . . . . . . . . . . . . . . . . . . . 14,186 23,427 17,966 21,314Shares Redeemed. . . . . . . . . . . . . . . . . . . . . . . . . . . . . . . . . . . . . . . . . . . . . . . . . . . . . . . . . . . . . (81,339) (61,471) (143,466) (94,509)
Net Increase (Decrease) from Capital Share Transactions. . . . . . . . . . . . . . . . . . 31,986 29,486 (15,009) 68,209Total Increase (Decrease) in Net Assets. . . . . . . . . . . . . . . . . . . . . . . . . . . . . . . . . . . . (22,791) 9,559 (97,000) 81,839
Net AssetsBeginning of Year. . . . . . . . . . . . . . . . . . . . . . . . . . . . . . . . . . . . . . . . . . . . . . . . . . . . . . . . . . . . . . 340,608 331,049 553,107 471,268End of Year. . . . . . . . . . . . . . . . . . . . . . . . . . . . . . . . . . . . . . . . . . . . . . . . . . . . . . . . . . . . . . . . . . . . $317,817 $340,608 $ 456,107 $553,107
(1) Shares Issued and Redeemed:Shares Issued. . . . . . . . . . . . . . . . . . . . . . . . . . . . . . . . . . . . . . . . . . . . . . . . . . . . . . . . . . . . . . . . . . 7,252 3,967 4,976 5,579Shares Issued in Lieu of Cash Distributions. . . . . . . . . . . . . . . . . . . . . . . . . . . . . . . . . . . . . 800 1,507 662 925Shares Redeemed . . . . . . . . . . . . . . . . . . . . . . . . . . . . . . . . . . . . . . . . . . . . . . . . . . . . . . . . . . . . . (5,754) (3,573) (6,312) (3,748)
Net Increase (Decrease) from Shares Issued and Redeemed. . . . . . . . . . . . . . 2,298 1,901 (674) 2,756
* Net of foreign capital gain taxes withheld for the fiscal year ended October 31, 2020 of $0 and $0, respectively.** Net of foreign capital gain taxes withheld for the fiscal year ended October 31, 2019 of $0 and $0, respectively.
DFA INVESTMENT DIMENSIONS GROUP INC.
STATEMENTS OF CHANGES IN NET ASSETS
(Amounts in thousands)
See accompanying Notes to Financial Statements.
54

VA International ValuePortfolio
VA InternationalSmall Portfolio
YearEndedOct 31,
2020
YearEndedOct 31,
2019
YearEndedOct 31,
2020
YearEndedOct 31,
2019
Increase (Decrease) in Net AssetsOperations:
Net Investment Income (Loss). . . . . . . . . . . . . . . . . . . . . . . . . . . . . . . . . . . . . . . . . . . . . . . . . . $ 7,638 $ 11,023 $ 4,626 $ 5,447Net Realized Gain (Loss) on:
Investment Securities Sold*,**. . . . . . . . . . . . . . . . . . . . . . . . . . . . . . . . . . . . . . . . . . . . . . . . . (6,347) (3,322) 4,961 3,184Affiliated Investment Companies Shares Sold. . . . . . . . . . . . . . . . . . . . . . . . . . . . . . . . 3 1 — —Futures. . . . . . . . . . . . . . . . . . . . . . . . . . . . . . . . . . . . . . . . . . . . . . . . . . . . . . . . . . . . . . . . . . . . . . 142 (25) 52 —Foreign Currency Transactions. . . . . . . . . . . . . . . . . . . . . . . . . . . . . . . . . . . . . . . . . . . . . . . (3) (24) (46) 15
Change in Unrealized Appreciation (Depreciation) of:Investment Securities and Foreign Currency. . . . . . . . . . . . . . . . . . . . . . . . . . . . . . . . . . (62,012) 4,158 (17,200) 6,143Affiliated Investment Companies Shares. . . . . . . . . . . . . . . . . . . . . . . . . . . . . . . . . . . . . . 1 1 1 2Translation of Foreign Currency-Denominated Amounts. . . . . . . . . . . . . . . . . . . . . . 22 16 9 11
Net Increase (Decrease) in Net Assets Resulting from Operations. . . . . . . . . . (60,556) 11,828 (7,597) 14,802Distributions:
Institutional Class Shares. . . . . . . . . . . . . . . . . . . . . . . . . . . . . . . . . . . . . . . . . . . . . . . . . . . . (11,671) (9,209) (9,750) (14,630)Capital Share Transactions (1):
Shares Issued. . . . . . . . . . . . . . . . . . . . . . . . . . . . . . . . . . . . . . . . . . . . . . . . . . . . . . . . . . . . . . . . . . 63,163 75,579 37,967 43,378Shares Issued in Lieu of Cash Distributions. . . . . . . . . . . . . . . . . . . . . . . . . . . . . . . . . . . . . 11,637 9,183 9,621 14,442Shares Redeemed. . . . . . . . . . . . . . . . . . . . . . . . . . . . . . . . . . . . . . . . . . . . . . . . . . . . . . . . . . . . . (48,549) (39,005) (44,815) (32,498)
Net Increase (Decrease) from Capital Share Transactions. . . . . . . . . . . . . . . . . . 26,251 45,757 2,773 25,322Total Increase (Decrease) in Net Assets. . . . . . . . . . . . . . . . . . . . . . . . . . . . . . . . . . . . (45,976) 48,376 (14,574) 25,494
Net AssetsBeginning of Year. . . . . . . . . . . . . . . . . . . . . . . . . . . . . . . . . . . . . . . . . . . . . . . . . . . . . . . . . . . . . . 327,525 279,149 244,418 218,924End of Year. . . . . . . . . . . . . . . . . . . . . . . . . . . . . . . . . . . . . . . . . . . . . . . . . . . . . . . . . . . . . . . . . . . . $281,549 $327,525 $229,844 $244,418
(1) Shares Issued and Redeemed:Shares Issued. . . . . . . . . . . . . . . . . . . . . . . . . . . . . . . . . . . . . . . . . . . . . . . . . . . . . . . . . . . . . . . . . . 6,366 6,447 3,547 3,761Shares Issued in Lieu of Cash Distributions. . . . . . . . . . . . . . . . . . . . . . . . . . . . . . . . . . . . . 948 832 775 1,375Shares Redeemed . . . . . . . . . . . . . . . . . . . . . . . . . . . . . . . . . . . . . . . . . . . . . . . . . . . . . . . . . . . . . (4,857) (3,333) (4,058) (2,820)
Net Increase (Decrease) from Shares Issued and Redeemed. . . . . . . . . . . . . . 2,457 3,946 264 2,316
* Net of foreign capital gain taxes withheld for the fiscal year ended October 31, 2020 of $0 and $0, respectively.** Net of foreign capital gain taxes withheld for the fiscal year ended October 31, 2019 of $0 and $0, respectively.
DFA INVESTMENT DIMENSIONS GROUP INC.
STATEMENTS OF CHANGES IN NET ASSETS
(Amounts in thousands)
See accompanying Notes to Financial Statements.
55

VA Short-Term FixedPortfolio
VA GlobalBond Portfolio
VIT Inflation-ProtectedSecurities Portfolio
YearEndedOct 31,
2020
YearEndedOct 31,
2019
YearEndedOct 31,
2020
YearEndedOct 31,
2019
YearEndedOct 31,
2020
YearEndedOct 31,
2019
Increase (Decrease) in Net AssetsOperations:
Net Investment Income (Loss). . . . . . . . . . . . . . . . . . . . . . . . . . . . . . . . . . . . . . . . $ 2,975 $ 7,236 $ 1,651 $ 2,653 $ 2,132 $ 2,544Net Realized Gain (Loss) on:
Investment Securities Sold*,**. . . . . . . . . . . . . . . . . . . . . . . . . . . . . . . . . . . . . . . 52 481 (1,284) (4,529) 1,853 315Affiliated Investment Companies Shares Sold. . . . . . . . . . . . . . . . . . . . . . . . . 3 1 — — — —Foreign Currency Transactions. . . . . . . . . . . . . . . . . . . . . . . . . . . . . . . . . . . . . — — (13) (61) — —Forward Currency Contracts. . . . . . . . . . . . . . . . . . . . . . . . . . . . . . . . . . . . . . . . — — (11,128) 23,776 — —
Change in Unrealized Appreciation (Depreciation) of:Investment Securities and Foreign Currency. . . . . . . . . . . . . . . . . . . . . . . . . . (184) 1,301 8,796 8,224 9,705 8,522Affiliated Investment Companies Shares. . . . . . . . . . . . . . . . . . . . . . . . . . . . . . (1) 1 — — — —Translation of Foreign Currency-Denominated Amounts. . . . . . . . . . . . . . . . . — — 12 30 — —Forward Currency Contracts. . . . . . . . . . . . . . . . . . . . . . . . . . . . . . . . . . . . . . . . — — 8,218 (11,796) — —
Net Increase (Decrease) in Net Assets Resulting from Operations. . . . . . 2,845 9,020 6,252 18,297 13,690 11,381Distributions:
Institutional Class Shares. . . . . . . . . . . . . . . . . . . . . . . . . . . . . . . . . . . . . . . . . . (7,178) (4,625) (10,398) (16,766) (2,615) (2,654)Capital Share Transactions (1):
Shares Issued. . . . . . . . . . . . . . . . . . . . . . . . . . . . . . . . . . . . . . . . . . . . . . . . . . . . . 113,261 111,821 72,377 81,565 148,651 55,296Shares Issued in Lieu of Cash Distributions. . . . . . . . . . . . . . . . . . . . . . . . . . . . . 7,165 4,616 10,284 16,569 2,615 2,654Shares Redeemed. . . . . . . . . . . . . . . . . . . . . . . . . . . . . . . . . . . . . . . . . . . . . . . . . . (75,693) (94,275) (67,855) (54,947) (102,786) (43,691)
Net Increase (Decrease) from Capital Share Transactions. . . . . . . . . . . . . 44,733 22,162 14,806 43,187 48,480 14,259Total Increase (Decrease) in Net Assets. . . . . . . . . . . . . . . . . . . . . . . . . . . . 40,400 26,557 10,660 44,718 59,555 22,986
Net AssetsBeginning of Year. . . . . . . . . . . . . . . . . . . . . . . . . . . . . . . . . . . . . . . . . . . . . . . . . . . 319,471 292,914 405,709 360,991 150,732 127,746End of Year. . . . . . . . . . . . . . . . . . . . . . . . . . . . . . . . . . . . . . . . . . . . . . . . . . . . . . . . $359,871 $319,471 $416,369 $405,709 $ 210,287 $150,732
(1) Shares Issued and Redeemed:Shares Issued. . . . . . . . . . . . . . . . . . . . . . . . . . . . . . . . . . . . . . . . . . . . . . . . . . . . . 11,040 10,905 6,845 7,695 13,642 5,430Shares Issued in Lieu of Cash Distributions. . . . . . . . . . . . . . . . . . . . . . . . . . . . . 703 454 982 1,612 255 277Shares Redeemed . . . . . . . . . . . . . . . . . . . . . . . . . . . . . . . . . . . . . . . . . . . . . . . . . (7,374) (9,154) (6,438) (5,200) (9,662) (4,351)
Net Increase (Decrease) from Shares Issued and Redeemed. . . . . . . . . . 4,369 2,205 1,389 4,107 4,235 1,356
* Net of foreign capital gain taxes withheld for the fiscal year ended October 31, 2020 of $0, $0 and $0, respectively.** Net of foreign capital gain taxes withheld for the fiscal year ended October 31, 2019 of $0, $0 and $0, respectively.
DFA INVESTMENT DIMENSIONS GROUP INC.
STATEMENTS OF CHANGES IN NET ASSETS
(Amounts in thousands)
See accompanying Notes to Financial Statements.
56

VA Global ModerateAllocation Portfolio
VA Equity AllocationPortfolio
YearEndedOct 31,
2020
YearEndedOct 31,
2019
YearEndedOct 31,
2020
YearEndedOct 31,
2019
Increase (Decrease) in Net AssetsOperations:
Net Investment Income (Loss). . . . . . . . . . . . . . . . . . . . . . . . . . . . . . . . . . . . . . . . . . . . . . . . . . . $ 2,748 $ 3,052 $ 1,375 $ 969Capital Gain Distributions Received from Affiliated Investment Companies. . . . . . . . 1,246 539 735 626Net Realized Gain (Loss) on:
Affiliated Investment Companies Shares Sold. . . . . . . . . . . . . . . . . . . . . . . . . . . . . . . . . . 251 394 (2,085) (425)Futures. . . . . . . . . . . . . . . . . . . . . . . . . . . . . . . . . . . . . . . . . . . . . . . . . . . . . . . . . . . . . . . . . . . . . . . . — 69 (15) (27)
Change in Unrealized Appreciation (Depreciation) of:Affiliated Investment Companies Shares. . . . . . . . . . . . . . . . . . . . . . . . . . . . . . . . . . . . . . . 761 6,346 1,122 4,204
Net Increase (Decrease) in Net Assets Resulting from Operations. . . . . . . . . . . 5,006 10,400 1,132 5,347Distributions:
Institutional Class Shares. . . . . . . . . . . . . . . . . . . . . . . . . . . . . . . . . . . . . . . . . . . . . . . . . . . . . . (4,249) (2,963) (1,816) (1,003)Capital Share Transactions (1):
Shares Issued. . . . . . . . . . . . . . . . . . . . . . . . . . . . . . . . . . . . . . . . . . . . . . . . . . . . . . . . . . . . . . . . . . . 22,341 28,787 25,377 26,434Shares Issued in Lieu of Cash Distributions. . . . . . . . . . . . . . . . . . . . . . . . . . . . . . . . . . . . . . 4,249 2,963 1,816 1,003Shares Redeemed. . . . . . . . . . . . . . . . . . . . . . . . . . . . . . . . . . . . . . . . . . . . . . . . . . . . . . . . . . . . . . . (19,207) (19,207) (15,255) (5,283)
Net Increase (Decrease) from Capital Share Transactions. . . . . . . . . . . . . . . . . . . 7,383 12,543 11,938 22,154Total Increase (Decrease) in Net Assets. . . . . . . . . . . . . . . . . . . . . . . . . . . . . . . . . . . . . 8,140 19,980 11,254 26,498
Net AssetsBeginning of Year. . . . . . . . . . . . . . . . . . . . . . . . . . . . . . . . . . . . . . . . . . . . . . . . . . . . . . . . . . . . . . . . 138,838 118,858 69,829 43,331End of Year. . . . . . . . . . . . . . . . . . . . . . . . . . . . . . . . . . . . . . . . . . . . . . . . . . . . . . . . . . . . . . . . . . . . . . $146,978 $138,838 $ 81,083 $69,829
(1) Shares Issued and Redeemed:Shares Issued. . . . . . . . . . . . . . . . . . . . . . . . . . . . . . . . . . . . . . . . . . . . . . . . . . . . . . . . . . . . . . . . . . . 1,779 2,297 2,492 2,472Shares Issued in Lieu of Cash Distributions. . . . . . . . . . . . . . . . . . . . . . . . . . . . . . . . . . . . . . 322 254 157 104Shares Redeemed . . . . . . . . . . . . . . . . . . . . . . . . . . . . . . . . . . . . . . . . . . . . . . . . . . . . . . . . . . . . . . (1,513) (1,515) (1,454) (492)
Net Increase (Decrease) from Shares Issued and Redeemed. . . . . . . . . . . . . . . . 588 1,036 1,195 2,084
DFA INVESTMENT DIMENSIONS GROUP INC.
STATEMENTS OF CHANGES IN NET ASSETS
(Amounts in thousands)
See accompanying Notes to Financial Statements.
57

VAU
.S.
Targ
eted
Val
ue
Po
rtfo
lioVA
U.S
.L
arg
eV
alu
eP
ort
folio
Yea
rE
nd
edO
ct31
,20
20
Yea
rE
nd
edO
ct31
,20
19
Yea
rE
nd
edO
ct31
,20
18
Yea
rE
nd
edO
ct31
,20
17
Yea
rE
nd
edO
ct31
,20
16
Yea
rE
nd
edO
ct31
,20
20
Yea
rE
nd
edO
ct31
,20
19
Yea
rE
nd
edO
ct31
,20
18
Yea
rE
nd
edO
ct31
,20
17
Yea
rE
nd
edO
ct31
,20
16
Net
Ass
etVa
lue,
Beg
inni
ngof
Year
....
....
....
....
....
....
....
....
....
....
....
....
....
....
....
.$
17.4
2$
18.7
5$
20.4
2$
17.2
3$
17.9
4$
26.4
9$
26.0
0$
26.8
8$
22.2
2$
22.8
3
Inco
me
from
Inve
stm
entO
pera
tions
(A)
Net
Inve
stm
entI
ncom
e(L
oss)
....
....
....
....
....
....
....
....
....
....
....
....
....
....
....
..0.
240.
240.
230.
200.
210.
570.
580.
530.
510.
48N
etG
ains
(Los
ses)
onS
ecur
ities
(Rea
lized
and
Unr
ealiz
ed).
....
....
....
....
....
....
....
....
....
....
(2.4
1)(0
.24)
(0.4
2)3.
860.
54(3
.63)
1.08
0.15
4.76
0.43
Tota
lfro
mIn
vest
men
tOpe
ratio
ns..
....
....
....
....
....
....
....
....
....
....
....
....
....
...
(2.1
7)—
(0.1
9)4.
060.
75(3
.06)
1.66
0.68
5.27
0.91
Less
Dis
tribu
tions
:
Net
Inve
stm
entI
ncom
e..
....
....
....
....
....
....
....
....
....
....
....
....
....
....
....
....
.(0
.26)
(0.1
9)(0
.21)
(0.1
9)(0
.24)
(0.5
7)(0
.59)
(0.4
9)(0
.44)
(0.4
7)N
etR
ealiz
edG
ains
....
....
....
....
....
....
....
....
....
....
....
....
....
....
....
....
....
.(0
.45)
(1.1
4)(1
.27)
(0.6
8)(1
.22)
(0.2
9)(0
.58)
(1.0
7)(0
.17)
(1.0
5)
Tota
lDis
tribu
tions
....
....
....
....
....
....
....
....
....
....
....
....
....
....
....
....
....
(0.7
1)(1
.33)
(1.4
8)(0
.87)
(1.4
6)(0
.86)
(1.1
7)(1
.56)
(0.6
1)(1
.52)
Net
Ass
etVa
lue,
End
ofYe
ar..
....
....
....
....
....
....
....
....
....
....
....
....
....
....
....
...
$14
.54
$17
.42
$18
.75
$20
.42
$17
.23
$22
.57
$26
.49
$26
.00
$26
.88
$22
.22
Tota
lRet
urn
....
....
....
....
....
....
....
....
....
....
....
....
....
....
....
....
....
....
....
.(1
3.18
%)
0.85
%(1
.05%
)23
.81%
4.87
%(1
2.12
%)
7.08
%2.
47%
24.0
5%4.
52%
Net
Ass
ets,
End
ofYe
ar(th
ousa
nds)
....
....
....
....
....
....
....
....
....
....
....
....
....
....
....
$317
,817
$340
,608
$331
,049
$326
,805
$247
,103
$456
,107
$553
,107
$471
,268
$374
,564
$270
,245
Rat
ioof
Exp
ense
sto
Ave
rage
Net
Ass
ets
....
....
....
....
....
....
....
....
....
....
....
....
....
....
0.38
%0.
38%
0.37
%0.
37%
0.38
%0.
27%
0.27
%0.
27%
0.27
%0.
27%
Rat
ioof
Net
Inve
stm
entI
ncom
eto
Ave
rage
Net
Ass
ets
....
....
....
....
....
....
....
....
....
....
....
...
1.61
%1.
42%
1.14
%1.
05%
1.25
%2.
39%
2.30
%1.
97%
2.02
%2.
25%
Por
tfolio
Turn
over
Rat
e..
....
....
....
....
....
....
....
....
....
....
....
....
....
....
....
....
...
23%
19%
24%
28%
33%
12%
8%9%
18%
15%
See
page
1-2
for
the
Def
initi
ons
ofA
bbre
viat
ions
and
Foo
tnot
es.
DFA
INV
ES
TM
EN
TD
IME
NS
ION
SG
RO
UP
INC
.
FIN
AN
CIA
LH
IGH
LIG
HT
S
(fo
ra
shar
eo
uts
tan
din
gth
rou
gh
ou
tea
chp
erio
d)
See
acco
mpa
nyin
gN
otes
toF
inan
cial
Sta
tem
ents
.
58

VAIn
tern
atio
nal
Val
ue
Po
rtfo
lioVA
Inte
rnat
ion
alS
mal
lP
ort
folio
Yea
rE
nd
edO
ct31
,20
20
Yea
rE
nd
edO
ct31
,20
19
Yea
rE
nd
edO
ct31
,20
18
Yea
rE
nd
edO
ct31
,20
17
Yea
rE
nd
edO
ct31
,20
16
Yea
rE
nd
edO
ct31
,20
20
Yea
rE
nd
edO
ct31
,20
19
Yea
rE
nd
edO
ct31
,20
18
Yea
rE
nd
edO
ct31
,20
17
Yea
rE
nd
edO
ct31
,20
16
Net
Ass
etVa
lue,
Beg
inni
ngof
Year
....
....
....
....
....
....
....
....
....
....
....
....
....
....
....
.$
12.1
5$
12.1
3$
13.5
7$
11.0
8$
11.4
4$
12.0
9$
12.2
3$
14.3
0$
11.6
5$
11.6
7
Inco
me
from
Inve
stm
entO
pera
tions
(A)
Net
Inve
stm
entI
ncom
e(L
oss)
....
....
....
....
....
....
....
....
....
....
....
....
....
....
....
..0.
260.
430.
410.
380.
360.
220.
280.
290.
270.
26N
etG
ains
(Los
ses)
onS
ecur
ities
(Rea
lized
and
Unr
ealiz
ed).
....
....
....
....
....
....
....
....
....
....
(2.4
1)(0
.03)
(1.4
8)2.
46(0
.36)
(0.6
1)0.
37(1
.65)
2.74
0.34
Tota
lfro
mIn
vest
men
tOpe
ratio
ns..
....
....
....
....
....
....
....
....
....
....
....
....
....
...
(2.1
5)0.
40(1
.07)
2.84
—(0
.39)
0.65
(1.3
6)3.
010.
60
Less
Dis
tribu
tions
:
Net
Inve
stm
entI
ncom
e..
....
....
....
....
....
....
....
....
....
....
....
....
....
....
....
....
.(0
.43)
(0.3
4)(0
.37)
(0.3
5)(0
.36)
(0.3
3)(0
.22)
(0.3
4)(0
.27)
(0.2
4)N
etR
ealiz
edG
ains
....
....
....
....
....
....
....
....
....
....
....
....
....
....
....
....
....
.—
(0.0
4)—
——
(0.1
5)(0
.57)
(0.3
7)(0
.09)
(0.3
8)
Tota
lDis
tribu
tions
....
....
....
....
....
....
....
....
....
....
....
....
....
....
....
....
....
(0.4
3)(0
.38)
(0.3
7)(0
.35)
(0.3
6)(0
.48)
(0.7
9)(0
.71)
(0.3
6)(0
.62)
Net
Ass
etVa
lue,
End
ofYe
ar..
....
....
....
....
....
....
....
....
....
....
....
....
....
....
....
...
$9.
57$
12.1
5$
12.1
3$
13.5
7$
11.0
8$
11.2
2$
12.0
9$
12.2
3$
14.3
0$
11.6
5
Tota
lRet
urn
....
....
....
....
....
....
....
....
....
....
....
....
....
....
....
....
....
....
....
.(1
8.49
%)
3.61
%(8
.12%
)26
.32%
0.19
%(3
.66%
)6.
30%
(9.9
7%)
26.7
3%5.
54%
Net
Ass
ets,
End
ofYe
ar(th
ousa
nds)
....
....
....
....
....
....
....
....
....
....
....
....
....
....
....
$281
,549
$327
,525
$279
,149
$252
,128
$179
,768
$229
,844
$244
,418
$218
,924
$227
,185
$151
,209
Rat
ioof
Exp
ense
sto
Ave
rage
Net
Ass
ets
....
....
....
....
....
....
....
....
....
....
....
....
....
....
0.43
%0.
44%
0.43
%0.
44%
0.46
%0.
56%
0.56
%0.
55%
0.57
%0.
60%
Rat
ioof
Exp
ense
sto
Ave
rage
Net
Ass
ets
(Exc
ludi
ngFe
esP
aid
Indi
rect
ly).
....
....
....
....
....
....
....
....
0.44
%0.
45%
0.43
%0.
44%
0.46
%0.
56%
0.57
%0.
55%
0.57
%0.
60%
Rat
ioof
Net
Inve
stm
entI
ncom
eto
Ave
rage
Net
Ass
ets
....
....
....
....
....
....
....
....
....
....
....
...
2.52
%3.
68%
3.06
%3.
11%
3.46
%1.
96%
2.40
%2.
10%
2.10
%2.
29%
Por
tfolio
Turn
over
Rat
e..
....
....
....
....
....
....
....
....
....
....
....
....
....
....
....
....
...
16%
16%
20%
20%
15%
19%
17%
19%
12%
12%
See
page
1-2
for
the
Def
initi
ons
ofA
bbre
viat
ions
and
Foo
tnot
es.
DFA
INV
ES
TM
EN
TD
IME
NS
ION
SG
RO
UP
INC
.
FIN
AN
CIA
LH
IGH
LIG
HT
S
(fo
ra
shar
eo
uts
tan
din
gth
rou
gh
ou
tea
chp
erio
d)
See
acco
mpa
nyin
gN
otes
toF
inan
cial
Sta
tem
ents
.
59

VAS
ho
rt-T
erm
Fix
edP
ort
folio
VAG
lob
alB
on
dP
ort
folio
Yea
rE
nd
edO
ct31
,20
20
Yea
rE
nd
edO
ct31
,20
19
Yea
rE
nd
edO
ct31
,20
18
Yea
rE
nd
edO
ct31
,20
17
Yea
rE
nd
edO
ct31
,20
16
Yea
rE
nd
edO
ct31
,20
20
Yea
rE
nd
edO
ct31
,20
19
Yea
rE
nd
edO
ct31
,20
18
Yea
rE
nd
edO
ct31
,20
17
Yea
rE
nd
edO
ct31
,20
16
Net
Ass
etVa
lue,
Beg
inni
ngof
Year
....
....
....
....
....
....
....
....
....
....
....
....
....
....
....
.$
10.4
1$
10.2
8$
10.2
7$
10.2
5$
10.2
3$
10.7
3$
10.7
1$
10.8
6$
11.0
0$
10.9
3
Inco
me
from
Inve
stm
entO
pera
tions
(A)
Net
Inve
stm
entI
ncom
e(L
oss)
....
....
....
....
....
....
....
....
....
....
....
....
....
....
....
..0.
090.
230.
170.
110.
070.
040.
070.
110.
180.
18N
etG
ains
(Los
ses)
onS
ecur
ities
(Rea
lized
and
Unr
ealiz
ed).
....
....
....
....
....
....
....
....
....
....
—0.
06(0
.06)
(0.0
2)(0
.01)
0.12
0.44
(0.0
6)(0
.08)
0.11
Tota
lfro
mIn
vest
men
tOpe
ratio
ns..
....
....
....
....
....
....
....
....
....
....
....
....
....
...
0.09
0.29
0.11
0.09
0.06
0.16
0.51
0.05
0.10
0.29
Less
Dis
tribu
tions
:
Net
Inve
stm
entI
ncom
e..
....
....
....
....
....
....
....
....
....
....
....
....
....
....
....
....
.(0
.24)
(0.1
6)(0
.10)
(0.0
7)(0
.03)
(0.2
7)(0
.49)
(0.1
9)(0
.18)
(0.1
7)N
etR
ealiz
edG
ains
....
....
....
....
....
....
....
....
....
....
....
....
....
....
....
....
....
.—
——
—(0
.01)
——
(0.0
1)(0
.06)
(0.0
5)
Tota
lDis
tribu
tions
....
....
....
....
....
....
....
....
....
....
....
....
....
....
....
....
....
(0.2
4)(0
.16)
(0.1
0)(0
.07)
(0.0
4)(0
.27)
(0.4
9)(0
.20)
(0.2
4)(0
.22)
Net
Ass
etVa
lue,
End
ofYe
ar..
....
....
....
....
....
....
....
....
....
....
....
....
....
....
....
...
$10
.26
$10
.41
$10
.28
$10
.27
$10
.25
$10
.62
$10
.73
$10
.71
$10
.86
$11
.00
Tota
lRet
urn
....
....
....
....
....
....
....
....
....
....
....
....
....
....
....
....
....
....
....
.0.
84%
2.86
%1.
13%
0.89
%0.
60%
1.54
%5.
00%
0.42
%1.
00%
2.68
%
Net
Ass
ets,
End
ofYe
ar(th
ousa
nds)
....
....
....
....
....
....
....
....
....
....
....
....
....
....
....
$359
,871
$319
,471
$292
,914
$250
,072
$192
,872
$416
,369
$405
,709
$360
,991
$310
,320
$268
,729
Rat
ioof
Exp
ense
sto
Ave
rage
Net
Ass
ets
....
....
....
....
....
....
....
....
....
....
....
....
....
....
0.21
%0.
23%
0.27
%0.
27%
0.27
%0.
23%
0.24
%0.
24%
0.24
%0.
24%
Rat
ioof
Exp
ense
sto
Ave
rage
Net
Ass
ets
(Exc
ludi
ngFe
esP
aid
Indi
rect
ly).
....
....
....
....
....
....
....
....
0.21
%0.
23%
0.27
%0.
27%
0.27
%0.
24%
0.24
%0.
24%
0.24
%0.
24%
Rat
ioof
Net
Inve
stm
entI
ncom
eto
Ave
rage
Net
Ass
ets
....
....
....
....
....
....
....
....
....
....
....
...
0.91
%2.
23%
1.68
%1.
05%
0.65
%0.
40%
0.70
%1.
07%
1.66
%1.
63%
Por
tfolio
Turn
over
Rat
e..
....
....
....
....
....
....
....
....
....
....
....
....
....
....
....
....
...
97%
37%
70%
86%
50%
49%
45%
67%
67%
47%
See
page
1-2
for
the
Def
initi
ons
ofA
bbre
viat
ions
and
Foo
tnot
es.
DFA
INV
ES
TM
EN
TD
IME
NS
ION
SG
RO
UP
INC
.
FIN
AN
CIA
LH
IGH
LIG
HT
S
(fo
ra
shar
eo
uts
tan
din
gth
rou
gh
ou
tea
chp
erio
d)
See
acco
mpa
nyin
gN
otes
toF
inan
cial
Sta
tem
ents
.
60

VIT
Infl
atio
n-P
rote
cted
Sec
uri
ties
Po
rtfo
lioVA
Glo
bal
Mo
der
ate
Allo
cati
on
Po
rtfo
lio
Yea
rE
nd
edO
ct31
,20
20
Yea
rE
nd
edO
ct31
,20
19
Yea
rE
nd
edO
ct31
,20
18
Yea
rE
nd
edO
ct31
,20
17
Yea
rE
nd
edO
ct31
,20
16
Yea
rE
nd
edO
ct31
,20
20
Yea
rE
nd
edO
ct31
,20
19
Yea
rE
nd
edO
ct31
,20
18
Yea
rE
nd
edO
ct31
,20
17
Yea
rE
nd
edO
ct31
,20
16
Net
Ass
etVa
lue,
Beg
inni
ngof
Per
iod.
....
....
....
....
....
....
....
....
....
....
....
...
$10
.40
$9.
73$
10.1
4$
10.3
0$
9.77
$13
.15
$12
.49
$12
.78
$11
.32
$11
.12
Inco
me
from
Inve
stm
entO
pera
tions
(A)
Net
Inve
stm
entI
ncom
e(L
oss)
....
....
....
....
....
....
....
....
....
....
....
....
..0.
150.
190.
280.
190.
170.
250.
300.
200.
190.
17N
etG
ains
(Los
ses)
onS
ecur
ities
(Rea
lized
and
Unr
ealiz
ed).
....
....
....
....
....
....
....
0.85
0.69
(0.4
4)(0
.22)
0.39
0.19
0.67
(0.1
7)1.
530.
20
Tota
lfro
mIn
vest
men
tOpe
ratio
ns..
....
....
....
....
....
....
....
....
....
....
....
1.00
0.88
(0.1
6)(0
.03)
0.56
0.44
0.97
0.03
1.72
0.37
Less
Dis
tribu
tions
:
Net
Inve
stm
entI
ncom
e..
....
....
....
....
....
....
....
....
....
....
....
....
....
.(0
.17)
(0.2
1)(0
.25)
(0.1
2)(0
.03)
(0.3
0)(0
.27)
(0.2
2)(0
.18)
(0.1
5)N
etR
ealiz
edG
ains
....
....
....
....
....
....
....
....
....
....
....
....
....
....
.—
——
(0.0
1)—
(0.1
0)(0
.04)
(0.1
0)(0
.08)
(0.0
2)
Tota
lDis
tribu
tions
....
....
....
....
....
....
....
....
....
....
....
....
....
....
.(0
.17)
(0.2
1)(0
.25)
(0.1
3)(0
.03)
(0.4
0)(0
.31)
(0.3
2)(0
.26)
(0.1
7)
Net
Ass
etVa
lue,
End
ofP
erio
d...
....
....
....
....
....
....
....
....
....
....
....
....
.$
11.2
3$
10.4
0$
9.73
$10
.14
$10
.30
$13
.19
$13
.15
$12
.49
$12
.78
$11
.32
Tota
lRet
urn
....
....
....
....
....
....
....
....
....
....
....
....
....
....
....
....
.9.
72%
9.18
%(1
.60%
)(0
.25%
)5.
79%
3.35
%8.
07%
0.15
%15
.50%
3.44
%
Net
Ass
ets,
End
ofP
erio
d(th
ousa
nds)
....
....
....
....
....
....
....
....
....
....
....
..$2
10,2
87$1
50,7
32$1
27,7
46$1
18,6
37$9
3,69
8$1
46,9
78$1
38,8
38$1
18,8
58$1
36,3
48$1
16,2
14R
atio
ofE
xpen
ses
toA
vera
geN
etA
sset
s..
....
....
....
....
....
....
....
....
....
....
..0.
14%
0.15
%0.
12%
0.15
%0.
18%
0.30
%(B
)0.
33%
(B)
0.40
%(B
)0.
40%
(B)
0.40
%(B
)R
atio
ofE
xpen
ses
toA
vera
geN
etA
sset
s(E
xclu
ding
Fees
Wai
ved,
Exp
ense
sR
eim
burs
edby
Adv
isor
)..
0.14
%0.
15%
0.12
%0.
12%
0.19
%0.
50%
(B)
0.53
%(B
)0.
50%
(B)
0.51
%(B
)0.
52%
(B)
Rat
ioof
Net
Inve
stm
entI
ncom
eto
Ave
rage
Net
Ass
ets
....
....
....
....
....
....
....
....
...
1.34
%1.
88%
2.84
%1.
92%
1.72
%1.
94%
2.40
%1.
57%
1.56
%1.
54%
Por
tfolio
Turn
over
Rat
e..
....
....
....
....
....
....
....
....
....
....
....
....
....
...
48%
43%
31%
25%
21%
N/A
N/A
N/A
N/A
N/A
*Th
eR
atio
ofE
xpen
ses
toA
vera
geN
etA
sset
sis
incl
usiv
eof
acqu
ired
fund
fees
and
expe
nses
incu
rred
byth
eP
ortfo
lioin
dire
ctly
asa
resu
ltof
Por
tfolio
’sin
vest
men
tin
Und
erly
ing
Fund
sas
follo
ws:
....
....
....
....
....
....
....
....
....
....
....
....
....
....
....
....
...
N/A
N/A
N/A
N/A
N/A
0.23
%0.
24%
0.24
%0.
24%
0.26
%
See
page
1-2
for
the
Def
initi
ons
ofA
bbre
viat
ions
and
Foo
tnot
es.
DFA
INV
ES
TM
EN
TD
IME
NS
ION
SG
RO
UP
INC
.
FIN
AN
CIA
LH
IGH
LIG
HT
S
(fo
ra
shar
eo
uts
tan
din
gth
rou
gh
ou
tea
chp
erio
d)
See
acco
mpa
nyin
gN
otes
toF
inan
cial
Sta
tem
ents
.
61

VAE
qu
ity
Allo
cati
on
Po
rtfo
lio
Yea
rE
nd
edO
ct31
,20
20
Yea
rE
nd
edO
ct31
,20
19
Yea
rE
nd
edO
ct31
,20
18
Per
iod
Jul
10,
2017
Ʊto
Oct
31,
2017
Net
Ass
etV
alue
,B
egin
ning
ofP
erio
d...
....
....
....
....
....
....
....
....
....
....
....
....
....
....
....
....
....
....
....
....
....
....
....
$11
.28
$10
.55
$10
.72
$10
.00
Inco
me
from
Inve
stm
ent
Ope
ratio
ns(A
)
Net
Inve
stm
ent
Inco
me
(Los
s)..
....
....
....
....
....
....
....
....
....
....
....
....
....
....
....
....
....
....
....
....
....
....
....
....
.0.
190.
190.
180.
03N
etG
ains
(Los
ses)
onS
ecur
ities
(Rea
lized
and
Unr
ealiz
ed)
....
....
....
....
....
....
....
....
....
....
....
....
....
....
....
....
....
....
(0.2
0)0.
79(0
.20)
0.69
Tota
lfro
mIn
vest
men
tO
pera
tions
....
....
....
....
....
....
....
....
....
....
....
....
....
....
....
....
....
....
....
....
....
....
....
.(0
.01)
0.98
(0.0
2)0.
72
Less
Dis
trib
utio
ns:
Net
Inve
stm
ent
Inco
me
....
....
....
....
....
....
....
....
....
....
....
....
....
....
....
....
....
....
....
....
....
....
....
....
....
....
.(0
.21)
(0.1
9)(0
.15)
—N
etR
ealiz
edG
ains
....
....
....
....
....
....
....
....
....
....
....
....
....
....
....
....
....
....
....
....
....
....
....
....
....
....
....
(0.0
8)(0
.06)
(—)
—
Tota
lDis
trib
utio
ns..
....
....
....
....
....
....
....
....
....
....
....
....
....
....
....
....
....
....
....
....
....
....
....
....
....
....
.(0
.29)
(0.2
5)(0
.15)
—
Net
Ass
etV
alue
,E
ndof
Per
iod.
....
....
....
....
....
....
....
....
....
....
....
....
....
....
....
....
....
....
....
....
....
....
....
....
....
$10
.98
$11
.28
$10
.55
$10
.72
Tota
lRet
urn
....
....
....
....
....
....
....
....
....
....
....
....
....
....
....
....
....
....
....
....
....
....
....
....
....
....
....
....
....
.(0
.25%
)9.
60%
(0.1
9%)
7.20
%(C
)
Net
Ass
ets,
End
ofP
erio
d(t
hous
ands
)..
....
....
....
....
....
....
....
....
....
....
....
....
....
....
....
....
....
....
....
....
....
....
...
$81,
083
$69,
829
$43,
331
$18,
787
Rat
ioof
Exp
ense
sto
Ave
rage
Net
Ass
ets
*(B
)...
....
....
....
....
....
....
....
....
....
....
....
....
....
....
....
....
....
....
....
....
....
0.39
%0.
40%
0.40
%0.
32%
(D)(
E)
Rat
ioof
Exp
ense
sto
Ave
rage
Net
Ass
ets
(Exc
ludi
ngF
ees
Wai
ved,
Exp
ense
sR
eim
burs
edby
Adv
isor
)*(
B).
....
....
....
....
....
....
....
....
0.59
%0.
63%
0.66
%0.
66%
(D)(
E)
Rat
ioof
Net
Inve
stm
ent
Inco
me
toA
vera
geN
etA
sset
s..
....
....
....
....
....
....
....
....
....
....
....
....
....
....
....
....
....
....
....
.1.
80%
1.80
%1.
65%
0.99
%(D
)(E
)
*T
heR
atio
ofE
xpen
ses
toA
vera
geN
etA
sset
sis
incl
usiv
eof
acqu
ired
fund
fees
and
expe
nses
incu
rred
byth
eP
ortfo
lioin
dire
ctly
asa
resu
ltof
Por
tfolio
’sin
vest
men
tin
Und
erly
ing
Fun
dsas
follo
ws:
....
....
....
....
....
....
....
....
....
....
....
....
....
....
....
....
....
....
....
0.25
%0.
26%
0.25
%0.
26%
See
page
1-2
for
the
Def
initi
ons
ofA
bbre
viat
ions
and
Foo
tnot
es.
DFA
INV
ES
TM
EN
TD
IME
NS
ION
SG
RO
UP
INC
.
FIN
AN
CIA
LH
IGH
LIG
HT
S
(fo
ra
shar
eo
uts
tan
din
gth
rou
gh
ou
tea
chp
erio
d)
See
acco
mpa
nyin
gN
otes
toF
inan
cial
Sta
tem
ents
.
62

DFA INVESTMENT DIMENSIONS GROUP INC.
NOTES TO FINANCIAL STATEMENTS
A. Organization:
DFA Investment Dimensions Group Inc. (the �Fund� or �IDG�) is an open-end management investment companyregistered under the Investment Company Act of 1940, whose shares are generally offered without a sales charge,to institutional investors, retirement plans and clients of registered investment advisors. The Fund consists of onehundred and six operational portfolios, nine of which (the “Portfolios”) are included in this report. The remainingportfolios are presented in separate reports. The Portfolios are only available through a select group of insuranceproducts. The Portfolios are investment companies, and accordingly, follow the accounting and reporting guidanceunder the Financial Accounting Standards Board (“FASB”) Accounting Standards Certification (“ASC”), Topic 946,“Financial Services-Investment Companies.”
VA Global Moderate Allocation Portfolio (formerly known as DFA VA Global Moderate Allocation Portfolio) andVA Equity Allocation Portfolio (each, a �Fund of Funds�) invest in other portfolios within the Fund and DimensionalInvestment Group Inc. (�DIG�) (the �Underlying Funds�). The Funds of Funds may also invest in affiliated andunaffiliated registered and unregistered money market funds. Certain of the Underlying Funds’ shareholder reportsare not covered by this report. Copies of the Underlying Funds’ shareholder reports are available from the EDGARdatabase on the SEC’s website at http://www.sec.gov.
As of October 31, 2020, each Fund of Funds was the owner of record of the following approximate percentagesof the total outstanding shares of the following Underlying Funds as detailed below:
Funds of Funds Underlying Funds
PercentageOwnership
at 10/31/2020
VA Global Moderate Allocation Portfolio U.S. Core Equity 1 Portfolio (IDG) —U.S. Core Equity 2 Portfolio (IDG) —International Core Equity Portfolio (IDG) —Emerging Markets Core Equity Portfolio (IDG) —DFA Two-Year Global Fixed Income Portfolio(IDG) —DFA Selectively Hedged Global Fixed IncomePortfolio (IDG) 2%VA U.S. Large Value Portfolio (IDG) 1%VA International Value Portfolio (IDG) 1%DFA Real Estate Securities Portfolio (IDG) —VA Short-Term Fixed Portfolio (IDG) 2%VA Global Bond Portfolio (IDG) 5%
VA Equity Allocation Portfolio U.S. Core Equity 1 Portfolio (IDG) —DFA Real Estate Securities Portfolio (IDG) —International Core Equity Portfolio (IDG) —Emerging Markets Core Equity Portfolio (IDG) —VA U.S. Large Value Portfolio (IDG) 1%VA U.S. Targeted Value Portfolio (IDG) 3%U.S. Large Company Portfolio (DIG) —VA International Value Portfolio (IDG) 1%VA International Small Portfolio (IDG) 1%
63

B. Significant Accounting Policies:
The following significant accounting policies are in conformity with accounting principles generally accepted inthe United States of America. Such policies are consistently followed by the Fund in preparation of its financialstatements. The preparation of financial statements in accordance with accounting principles generally accepted inthe United States of America requires management to make estimates and assumptions that affect the fair value ofinvestments, the reported amounts of assets and liabilities, the disclosure of contingent assets and liabilities at thedate of the financial statements, and the reported amounts of increases and decreases in net assets from operationsduring the reporting period. Actual results could differ from those estimates, and those differences could be material.
1. Security Valuation: The Portfolios use a fair value hierarchy, which prioritizes the inputs-to-valuationtechniques used to measure fair value into three broad levels described below:
• Level 1 – inputs are quoted prices in active markets for identical securities (including equity securities,open-end investment companies, and futures contracts)
• Level 2 – other significant observable inputs (including quoted prices for similar securities, interest rates,prepayment speeds, credit risk, etc.)
• Level 3 – significant unobservable inputs (including the Portfolios’ own assumptions in determining the fairvalue of investments)
Securities held by VA U.S. Targeted Value Portfolio and VA U.S. Large Value Portfolio (the �Domestic EquityPortfolios�) and by VA International Value Portfolio and VA International Small Portfolio (the “International EquityPortfolios”), including over-the-counter securities, are valued at the last quoted sale price of the day. Internationalequity securities are subject to a fair value factor, as described later in this note. Securities held by the DomesticEquity Portfolios and the International Equity Portfolios that are listed on Nasdaq are valued at the Nasdaq OfficialClosing Price (“NOCP”). If there is no last reported sale price or NOCP for the day, the Domestic Equity Portfoliosand the International Equity Portfolios value the securities within the range of the most recent quoted bid and askprices. Price information on listed securities is taken from the exchange where the security is primarily traded.Generally, securities issued by open-end management investment companies are valued using their respective netasset values or public offering prices, as appropriate, for purchase orders placed at the close of the New York StockExchange (NYSE). These securities are generally categorized as Level 1 in the hierarchy.
Securities for which no market quotations are readily available (including restricted securities), or for whichmarket quotations have become unreliable, are valued in good faith at fair value in accordance with proceduresadopted by the Board of Directors of the Fund. Fair value pricing may also be used if events that have a significanteffect on the value of an investment (as determined in the discretion of Dimensional Fund Advisors LP) occur beforethe net asset value of the Portfolio is calculated. When fair value pricing is used, the prices of securities used by theDomestic Equity Portfolios and the International Equity Portfolios may differ from the quoted or published prices forthe same securities on their primary markets or exchanges. These securities are generally categorized as Level 2 inthe hierarchy.
The International Equity Portfolios will also apply a fair value price in the circumstances described below.Generally, trading in foreign securities markets is completed each day at various times prior to the close of the NYSE.For example, trading in the Japanese securities markets is completed each day at the close of the Tokyo StockExchange (normally, 2:00 a.m. ET), which is fourteen hours before the close of the NYSE (normally, 4:00 p.m. ET)and the time at which the net asset values of the International Equity Portfolios’ are computed. Due to the timedifferences between the closings of the relevant foreign securities exchanges and the pricing of the InternationalEquity Portfolios price their shares at the close of the NYSE, the International Equity Portfolios will fair-value theirforeign investments when it is determined that the market quotations for the foreign investments are either unreliableor not readily available. The fair value prices will attempt to reflect the impact of the U.S. financial markets’perceptions and trading activities on the International Equity Portfolios’ foreign investments since the last calculatedclosing prices of the foreign investments on their primary foreign securities markets or exchanges. For thesepurposes, the Board of Directors of the Fund has determined that movements in relevant indices or other appropriatemarket indicators, after the close of the Tokyo Stock Exchange or the London Stock Exchange, demonstrate thatmarket quotations may be unreliable. Fair valuation of portfolio securities may occur on a daily basis. The fair value
64

pricing by the International Equity Portfolios uses data furnished by an independent pricing service (and that datadraws upon, among other information, the market values of foreign investments). When the International EquityPortfolios use fair value pricing, the values assigned to the foreign investments may not be the quoted or publishedprices of the investments on their primary markets or exchanges. These securities are generally categorized asLevel 2 in the hierarchy.
Debt securities held by the VA Short-Term Fixed Portfolio, VA Global Bond Portfolio and VIT Inflation-ProtectedSecurities Portfolio (the �Fixed Income Portfolios�), are valued on the basis of evaluated prices provided by one ormore pricing services or other reasonably reliable sources including broker/dealers that typically handle the purchaseand sale of such securities. Securities that are traded over-the-counter and on a stock exchange generally will bevalued according to the broadest and most representative market, and it is expected that for bonds and other fixedincome securities, this ordinarily will be the over-the-counter market. Securities for which quotations are not readilyavailable (including restricted securities), or for which market quotations have become unreliable, are valued in goodfaith at fair value in accordance with procedures adopted by the Board of Directors of the Fund. These securities aregenerally categorized as Level 2 in the hierarchy.
Futures contracts held by the Portfolios are valued using the settlement price established each day on theexchange on which they are traded. These valuations are generally categorized as Level 1 in the hierarchy.Over-the-counter derivative contracts, which include forward currency contracts, do not require material subjectivityas pricing inputs are observed from quoted markets and are categorized as Level 2 in the hierarchy.
Shares held by the VA Global Moderate Allocation Portfolio and the VA Equity Allocation Portfolio of theUnderlying Funds, which are treated as regulated investment companies, and the shares held by the Portfolios inother investment companies, are valued at their respective daily net asset values as reported by their administrator.These securities are generally categorized as Level 1 in the hierarchy. A summary of the inputs used to value thePortfolios’ investments by each major security type, industry and/or country is disclosed previously in this note.Valuation hierarchy tables have been included at the end of the Portfolios’ Summary Schedules of PortfolioHoldings/Schedules of Investments. The methodology or inputs used for valuing securities are not necessarily anindication of the risk associated with investing in those securities.
2. Foreign Currency Translation: Securities and other assets and liabilities of the International Equity Portfoliosand VA Global Bond Portfolio whose values are initially expressed in foreign currencies are translated to U.S. dollarsusing the mean between the most recent bid and ask prices for the U.S. dollar as quoted by generally recognizedreliable sources. To facilitate the translation, the Portfolios enter into foreign currency contracts. A foreign currencycontract is a spot agreement between two parties to buy and sell currencies at current market exchange rates, forsettlement generally within two business days. Dividend and interest income and certain expenses are translated toU.S. dollars at the rate of exchange on their respective accrual dates. Receivables and payables denominated inforeign currencies are marked-to-market daily based on daily exchange rates and exchange gains or losses arerealized upon ultimate receipt or disbursement. The VA Global Bond Portfolio also enters into forward currencycontracts solely for the purpose of hedging against fluctuations in currency exchange rates. These contracts aremarked-to-market daily based on daily forward exchange rates.
The International Equity Portfolios do not isolate the effect of foreign exchange rate fluctuations from the effectof fluctuations in the market prices of securities, whether realized or unrealized. However, the VA Global BondPortfolio does isolate the effect of foreign currency rate fluctuations when determining the realized gain or loss uponthe sale or maturity of foreign currency-denominated debt obligations pursuant to U.S. Federal income taxregulations; such amounts are categorized as foreign exchange gain or loss for income tax reporting purposes.
Realized gains or losses on foreign currency transactions represent net foreign exchange gains or losses fromthe disposition of foreign currencies, currency gains or losses realized between the trade and settlement dates ofsecurities transactions, and the difference between amounts of interest, dividends and any foreign withholding taxesrecorded on the books of the International Equity Portfolios and VA Global Bond Portfolio and the U.S. dollarequivalent amounts actually received or paid.
65

3. Treasury Inflation-Protected Securities (TIPS): Inflation-protected securities (also known as inflation indexedsecurities) are securities whose principal and/or interest payments are adjusted for inflation, unlike conventional debtsecurities that make fixed principal and interest payments. Inflation-protected securities include TreasuryInflation-Protected Securities (“TIPS”), which are securities issued by the U.S. Treasury. The principal value of TIPSis adjusted for inflation (payable at maturity) and the semi-annual interest payments by TIPS equal a fixed percentageof the inflation-adjusted principal amount. These inflation adjustments are based upon the Consumer Price Index forUrban Consumers (CPI-U). The original principal value of TIPS is guaranteed, even during period of deflation. Atmaturity, TIPS are redeemed at the greater of their inflation-adjusted principal or par amount at original issue. Othertypes of inflation-protected securities may use other methods to adjust for inflation and other measures of inflation.Additionally, inflation-protected securities issued by entities other than the U.S. Treasury may not provide a guaranteeof principal value at maturity.
4. Deferred Compensation Plan: Each eligible Director of the Fund may elect to participate in the Fee DeferralPlan for Independent Directors and Trustees (the “Plan”). Under the Plan, effective January 1, 2002, such Directorsmay defer payment of all or a portion of their total fees earned as a Director. These deferred amounts may be treatedas though such amounts had been invested in shares of the following funds: the U.S. Large Cap Value Portfolio,U.S. Core Equity 1 Portfolio, U.S. Core Equity 2 Portfolio, U.S. Vector Equity Portfolio, U.S. Micro Cap Portfolio, DFAInternational Value Portfolio, International Core Equity Portfolio, Emerging Markets Portfolio, Emerging Markets CoreEquity Portfolio, and/or DFA Two-Year Global Fixed Income Portfolio. Contributions made under the Plan and thechange in unrealized appreciation (depreciation) and income are included in Directors’/ Trustees’ Fees & Expenses.
The Directors may receive their distributions of proceeds by one of the following methods: lump sum, annualinstallments over a period of agreed-upon years, or quarterly installments over a period of agreed-upon years. EachDirector shall have the right in a notice of election (the “Notice”) to defer the receipt of the Director’s deferredcompensation until a date specified by such Director in the Notice. The date may not be sooner than the earlier of: (i)the first business day of January following the year in which such Director ceases to be a member of the Board ofDirectors of the Fund; and (ii) five years following the effective date of the Director’s first deferral election. If a Directorwho elects to defer fees fails to designate in the Notice a time or date as of which payment of the Director’s deferredfee account shall commence, payment of such amount shall commence as of the first business day of Januaryfollowing the year in which the Director ceases to be a member of the Board (unless the Director files an amendedNotice selecting a different distribution date). As of October 31, 2020, none of the Directors have requested orreceived a distribution of proceeds of a deferred fee account.
5. Other: Security transactions are accounted for as of the trade date. Costs used in determining realized gainsand losses on the sale of investment securities and foreign currency are accounted for on the basis of identified cost.Dividend income and distributions to shareholders are recorded on the ex-dividend date. Distributions received onsecurities that represent a return of capital or capital gains are recorded as a reduction of cost of investments or asa realized gain, respectively. The Portfolios estimate the character of received distributions that may be consideredreturn of capital distributions. Interest income is recorded on an accrual basis. Discount and premium on debtsecurities purchased are amortized over the lives of the respective securities, using the effective interest method.Expenses directly attributable to a Portfolio are directly charged. Common expenses of the Fund or the Portfolios areallocated using methods approved by the Board, generally based on average net assets.
Organizational costs are expensed during the fiscal year of inception of the Portfolios. Offering costs areamortized over a twelve-month period from the inception of the Portfolios.
The International Equity Portfolios may be subject to taxes imposed by countries in which they invest, withrespect to their investments in issuers existing or operating in such countries. Such taxes are generally based onincome earned or repatriated and capital gains realized on the sale of such investments. The International EquityPortfolios accrue such taxes when the related income or capital gains are earned or throughout the holding period.Some countries require governmental approval for the repatriation of investment income, capital or the proceeds ofsales earned by foreign investors. Additionally, if there is a deterioration in a country’s balance of payments or forother reasons, a country may impose temporary restrictions on foreign capital remittances abroad.
66

C. Investment Advisor:
The Advisor, Dimensional Fund Advisors LP, provides investment management services to the Portfolios. For theyear ended October 31, 2020, the Portfolios’ investment management fees were accrued daily and paid monthly tothe Advisor based on the following effective annual rates of average daily net assets:
VA U.S. Targeted Value Portfolio. . . . . . . . . . . . . . . . . . . . . . . . . . . . . . . . . . . . . . . . . . . . . . . . . . . . . . . . . . . . . . . . . 0.35%VA U.S. Large Value Portfolio. . . . . . . . . . . . . . . . . . . . . . . . . . . . . . . . . . . . . . . . . . . . . . . . . . . . . . . . . . . . . . . . . . . . 0.25%VA International Value Portfolio. . . . . . . . . . . . . . . . . . . . . . . . . . . . . . . . . . . . . . . . . . . . . . . . . . . . . . . . . . . . . . . . . . 0.40%VA International Small Portfolio. . . . . . . . . . . . . . . . . . . . . . . . . . . . . . . . . . . . . . . . . . . . . . . . . . . . . . . . . . . . . . . . . . 0.50%VA Short-Term Fixed Portfolio. . . . . . . . . . . . . . . . . . . . . . . . . . . . . . . . . . . . . . . . . . . . . . . . . . . . . . . . . . . . . . . . . . . . 0.18%VA Global Bond Portfolio. . . . . . . . . . . . . . . . . . . . . . . . . . . . . . . . . . . . . . . . . . . . . . . . . . . . . . . . . . . . . . . . . . . . . . . . . 0.21%*VIT Inflation-Protected Securities Portfolio. . . . . . . . . . . . . . . . . . . . . . . . . . . . . . . . . . . . . . . . . . . . . . . . . . . . . . 0.10%VA Global Moderate Allocation Portfolio. . . . . . . . . . . . . . . . . . . . . . . . . . . . . . . . . . . . . . . . . . . . . . . . . . . . . . . . . 0.25%VA Equity Allocation Portfolio. . . . . . . . . . . . . . . . . . . . . . . . . . . . . . . . . . . . . . . . . . . . . . . . . . . . . . . . . . . . . . . . . . . . . 0.30%
* The VA Global Bond Portfolio’s investment management fees are based on an effective annual rate of 0.25% of the first $100 million ofaverage daily net assets and 0.20% of average daily net assets exceeding $100 million.
Pursuant to an Amended and Restated Fee Waiver and/or Expense Assumption Agreement (a “Fee WaiverAgreement”), the Advisor has contractually agreed to waive certain fees, and in certain instances, assume certainexpenses of the VIT Inflation-Protected Securities Portfolio, VA Global Moderate Allocation Portfolio and VA EquityAllocation Portfolio, as described in the notes below. The Fee Waiver Agreement for the Portfolios will remain in effectthrough February 28, 2021, may only be terminated by the Fund’s Board of Directors prior to that date and shallcontinue in effect from year to year thereafter unless terminated by the Fund or the Advisor. During the year endedOctober 31, 2020, the Portfolios had expense limits based on a percentage of average net assets on an annualizedbasis, and the Advisor recovered previously waived fees and/or assumed expenses (amounts in thousands), as listedbelow. The net amount of waived fees/expenses assumed (recovered previously waived fees/expenses assumed)during the year ended October 31, 2020, and the previously waived fees/expenses assumed subject to futurerecovery by the Advisor as of October 31, 2020, are also reflected below (amounts in thousands). At any time thatthe Portfolio Expenses (defined below) of the Institutional Class of a Portfolio are less than the Expense LimitationAmount listed below, the Advisor retains the right to recover fees previously waived and/or expenses previouslyassumed to the extent that the expense ratio following such recovery would be less than the Expense LimitationAmount that was in place when such prior year fees were waived and/or expenses assumed, and less than thecurrent Expense Limitation Amount in place for the Portfolio. The Fund, on behalf of the Portfolios, is not obligatedto reimburse the Advisor for fees previously waived or expenses previously assumed by the Advisor more thanthirty-six months before the date of recovery. With respect to the VA Equity Allocation Portfolio, the Advisor shall alsonot be reimbursed for any management fees previously waived to offset the Portfolio’s proportionate share of themanagement fees paid by such Portfolio through its investment in other funds managed by the Advisor.
Institutional Class Shares
ExpenseLimitationAmount
TotalManagement
Fee Limit
Recoveryof PreviouslyWaived Fees/
Expenses Assumed
Waived Fees/ExpensesAssumed
PreviouslyWaived Fees/
Expenses AssumedSubject to Future
Recovery
VIT Inflation-Protected SecuritiesPortfolio (1). . . . . . . . . . . . . . . . . . . . . . 0.15% — — — —
VA Global Moderate AllocationPortfolio (2). . . . . . . . . . . . . . . . . . . . . . 0.30% — $ 2 $288 $686
VA Equity Allocation Portfolio (3).. 0.40% 0.30% 19 167 —
(1) Effective February 28, 2020, the Advisor has contractually agreed to waive all or a portion of its management fee and to assume theordinary operating expenses of a class of the Portfolio (excluding the expenses that the Portfolio incurs indirectly through its investment in otherinvestment companies) (“Portfolio Expenses”) to the extent necessary to limit the Portfolio Expenses of a class of the Portfolio to the rate listed
67

above as a percentage of the Portfolio’s average net assets on an annualized basis (the “Expense Limitation Amount”). Prior to February 28,2020, the Expense Limitation Amount was 0.18%.
(2) Effective February 28, 2019, the Advisor has agreed to waive all or a portion of its management fee and to assume the expenses ofthe Institutional Class shares of the Portfolio (including the expenses that the Portfolio bears as a shareholder of other funds managed by theAdvisor but excluding the expenses that the Portfolio incurs indirectly through investment of its securities lending cash collateral in The DFA ShortTerm Investment Fund (the “Money Market Series”) and its investment in unaffiliated investment companies) (“Portfolio Expenses”) to the extentnecessary to limit the Portfolio Expenses of the Institutional Class shares of the Portfolio, on an annualized basis, to the rate listed above as apercentage of such class of the Portfolio’s average daily net assets (the “Expense Limitation Amount”). Prior to February 28, 2019, the ExpenseLimitation Amount was 0.40% of the average net assets of such class of the Portfolio on an annualized basis.
(3) The Advisor has contractually agreed to waive up to the full amount of the Portfolio’s management fee of 0.30% to the extent necessaryto offset the proportionate share of the management fees paid by the Portfolio through its investment in other funds managed by the Advisor,except for the fees paid through its investment of securities lending cash collateral in the Money Market Series. In addition, under the Fee WaiverAgreement, the Advisor has also agreed to waive all or a portion of the management fee and to assume the ordinary operating expenses of aclass of the Portfolio (including the expenses that the Portfolio bears as a shareholder of other funds managed by the Advisor, excluding moneymarket funds, but excluding the expenses that the Portfolio incurs indirectly through its investment in unaffiliated investment companies)(“Portfolio Expenses”) to the extent necessary to limit the Portfolio Expenses of a class of the Portfolio to the rate listed above as a percentageof the average net assets of a class of the Portfolio on an annualized basis (the “Expense Limitation Amount”).
Earned Income Credit:
Additionally, the Portfolios have entered into arrangements with their custodian whereby net interest earned onuninvested cash balances was used to reduce a portion of the Portfolios’ custody expenses. Custody expense in theaccompanying financial statements is presented before reduction for credits. The impact of such credits is generallyless than one basis point of each Portfolio’s net assets. During the year ended October 31, 2020, expenses reducedwere as follows (amounts in thousands):
Fees PaidIndirectly
VA International Value Portfolio. . . . . . . . . . . . . . . . . . . . . . . . . . . . . . . . . . . . . . . . . . . . . . . . . . . . . . . . . . . . . . $15VA International Small Portfolio. . . . . . . . . . . . . . . . . . . . . . . . . . . . . . . . . . . . . . . . . . . . . . . . . . . . . . . . . . . . . . 6VA Global Bond Portfolio. . . . . . . . . . . . . . . . . . . . . . . . . . . . . . . . . . . . . . . . . . . . . . . . . . . . . . . . . . . . . . . . . . . . . 32VA Equity Allocation Portfolio. . . . . . . . . . . . . . . . . . . . . . . . . . . . . . . . . . . . . . . . . . . . . . . . . . . . . . . . . . . . . . . . 1
Fees Paid to Officers and Directors/Trustees:
Certain Officers and Directors of the Advisor are also Officers and Directors of the Fund; however, such Officersand Directors (with the exception of the Chief Compliance Officer (“CCO”)) receive no compensation from the Fund.For the year ended October 31, 2020, the total related amount paid by the Fund to the CCO was $309 (in thousands).The total related amounts paid by each of the Portfolios are included in Other Expenses on the Statements ofOperations.
D. Deferred Compensation:
As of October 31, 2020, the total liability for deferred compensation to Directors is included in Accrued Expensesand Other Liabilities on the Statements of Assets and Liabilities as follows (amounts in thousands):
VA U.S. Targeted Value Portfolio. . . . . . . . . . . . . . . . . . . . . . . . . . . . . . . . . . . . . . . . . . . . . . . . . . . . . . . . . . . . . . . . . $ 8VA U.S. Large Value Portfolio. . . . . . . . . . . . . . . . . . . . . . . . . . . . . . . . . . . . . . . . . . . . . . . . . . . . . . . . . . . . . . . . . . . . . 10VA International Value Portfolio. . . . . . . . . . . . . . . . . . . . . . . . . . . . . . . . . . . . . . . . . . . . . . . . . . . . . . . . . . . . . . . . . . . 7VA International Small Portfolio. . . . . . . . . . . . . . . . . . . . . . . . . . . . . . . . . . . . . . . . . . . . . . . . . . . . . . . . . . . . . . . . . . . 6VA Short-Term Fixed Portfolio. . . . . . . . . . . . . . . . . . . . . . . . . . . . . . . . . . . . . . . . . . . . . . . . . . . . . . . . . . . . . . . . . . . . 8VA Global Bond Portfolio. . . . . . . . . . . . . . . . . . . . . . . . . . . . . . . . . . . . . . . . . . . . . . . . . . . . . . . . . . . . . . . . . . . . . . . . . . 10VIT Inflation-Protected Securities Portfolio. . . . . . . . . . . . . . . . . . . . . . . . . . . . . . . . . . . . . . . . . . . . . . . . . . . . . . . 2VA Global Moderate Allocation Portfolio. . . . . . . . . . . . . . . . . . . . . . . . . . . . . . . . . . . . . . . . . . . . . . . . . . . . . . . . . . 2VA Equity Allocation Portfolio. . . . . . . . . . . . . . . . . . . . . . . . . . . . . . . . . . . . . . . . . . . . . . . . . . . . . . . . . . . . . . . . . . . . . —
68
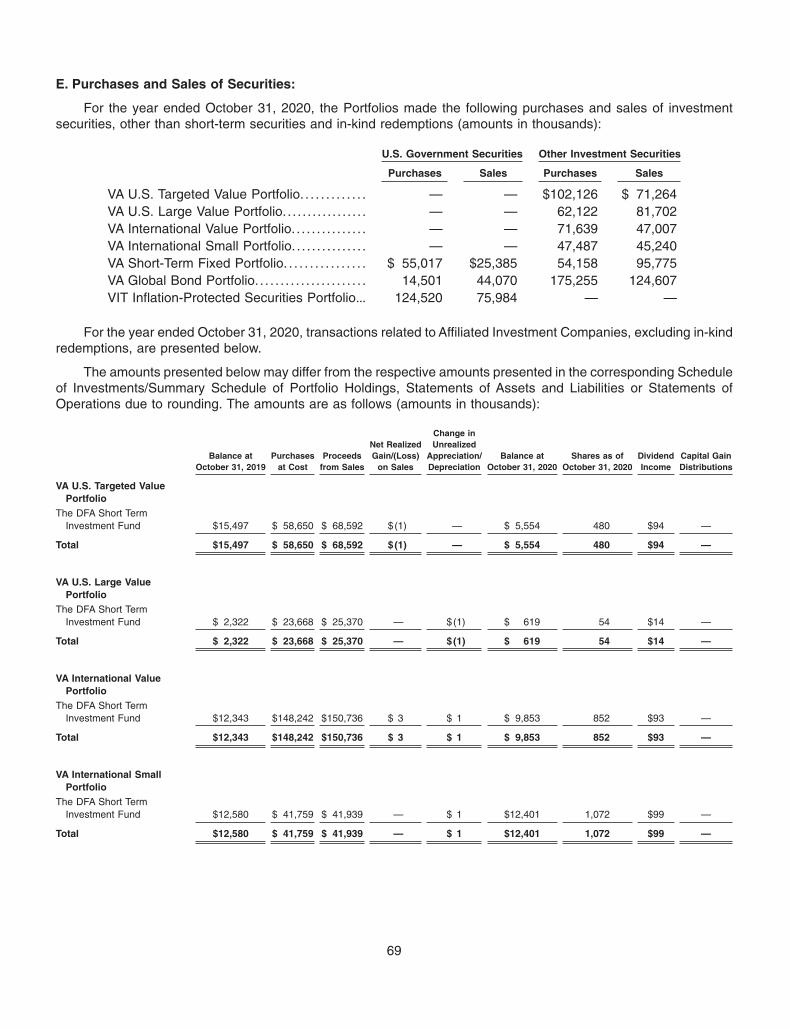
E. Purchases and Sales of Securities:
For the year ended October 31, 2020, the Portfolios made the following purchases and sales of investmentsecurities, other than short-term securities and in-kind redemptions (amounts in thousands):
U.S. Government Securities Other Investment Securities
Purchases Sales Purchases Sales
VA U.S. Targeted Value Portfolio. . . . . . . . . . . . . — — $102,126 $ 71,264VA U.S. Large Value Portfolio. . . . . . . . . . . . . . . . . — — 62,122 81,702VA International Value Portfolio. . . . . . . . . . . . . . . — — 71,639 47,007VA International Small Portfolio. . . . . . . . . . . . . . . — — 47,487 45,240VA Short-Term Fixed Portfolio. . . . . . . . . . . . . . . . $ 55,017 $25,385 54,158 95,775VA Global Bond Portfolio. . . . . . . . . . . . . . . . . . . . . . 14,501 44,070 175,255 124,607VIT Inflation-Protected Securities Portfolio... 124,520 75,984 — —
For the year ended October 31, 2020, transactions related to Affiliated Investment Companies, excluding in-kindredemptions, are presented below.
The amounts presented below may differ from the respective amounts presented in the corresponding Scheduleof Investments/Summary Schedule of Portfolio Holdings, Statements of Assets and Liabilities or Statements ofOperations due to rounding. The amounts are as follows (amounts in thousands):
Balance atOctober 31, 2019
Purchasesat Cost
Proceedsfrom Sales
Net RealizedGain/(Loss)
on Sales
Change inUnrealized
Appreciation/Depreciation
Balance atOctober 31, 2020
Shares as ofOctober 31, 2020
DividendIncome
Capital GainDistributions
VA U.S. Targeted ValuePortfolio
The DFA Short TermInvestment Fund $15,497 $ 58,650 $ 68,592 $(1) — $ 5,554 480 $94 —
Total $15,497 $ 58,650 $ 68,592 $(1) — $ 5,554 480 $94 —
VA U.S. Large ValuePortfolio
The DFA Short TermInvestment Fund $ 2,322 $ 23,668 $ 25,370 — $(1) $ 619 54 $14 —
Total $ 2,322 $ 23,668 $ 25,370 — $(1) $ 619 54 $14 —
VA International ValuePortfolio
The DFA Short TermInvestment Fund $12,343 $148,242 $150,736 $ 3 $ 1 $ 9,853 852 $93 —
Total $12,343 $148,242 $150,736 $ 3 $ 1 $ 9,853 852 $93 —
VA International SmallPortfolio
The DFA Short TermInvestment Fund $12,580 $ 41,759 $ 41,939 — $ 1 $12,401 1,072 $99 —
Total $12,580 $ 41,759 $ 41,939 — $ 1 $12,401 1,072 $99 —
69

Balance atOctober 31, 2019
Purchasesat Cost
Proceedsfrom Sales
Net RealizedGain/(Loss)
on Sales
Change inUnrealized
Appreciation/Depreciation
Balance atOctober 31, 2020
Shares as ofOctober 31, 2020
DividendIncome
Capital GainDistributions
VA Short-Term FixedPortfolio
The DFA Short TermInvestment Fund $ 17,047 $268,250 $281,216 $ 3 $ (1) $ 4,083 353 $ 69 —
Total $ 17,047 $268,250 $281,216 $ 3 $ (1) $ 4,083 353 $ 69 —
VA Global Bond PortfolioThe DFA Short Term
Investment Fund $ 172 $ 2,374 $ 2,546 — — — — $ 1 —
Total $ 172 $ 2,374 $ 2,546 — — — — $ 1 —
VA Global ModerateAllocation Portfolio
U.S. Core Equity 2 Portfolio $ 43,560 $ 9,600 $ 8,210 $ 381 $1,662 $ 46,993 2,062 $ 698 $ 948
VA Global Bond Portfolio 17,175 6,977 5,074 (123) (64) 18,891 1,779 448 —
DFA Selectively HedgedGlobal Fixed IncomePortfolio 17,176 4,636 2,877 (40) (21) 18,874 1,934 435 —
U.S. Core Equity 1 Portfolio 15,712 2,113 2,081 190 782 16,716 662 259 261
International Core EquityPortfolio 17,636 2,413 3,153 (116) (610) 16,170 1,339 384 —
Emerging Markets CoreEquity Portfolio 6,490 1,335 391 — 401 7,835 385 167 —
DFA Two-Year Global FixedIncome Portfolio 6,778 2,929 2,132 (11) (15) 7,549 755 107 —
VA Short-Term Fixed Portfolio 6,779 3,007 2,132 (13) (92) 7,549 736 160 —
VA U.S. Large Value Portfolio 3,160 617 15 1 (413) 3,350 148 68 34
DFA Real Estate SecuritiesPortfolio 2,598 119 152 (18) (446) 2,101 61 56 3
VA International ValuePortfolio 1,919 68 — — (423) 1,564 163 67 —
Total $138,983 $ 33,814 $ 26,217 $ 251 $ 761 $147,592 10,024 $2,849 $1,246
VA Equity AllocationPortfolio
U.S. Core Equity 1 Portfolio $ 19,194 $ 5,531 $ 2,698 $ (178) $1,087 $ 22,936 909 $ 342 $ 332
U.S. Large Company Portfolio 15,389 4,003 2,363 (41) 1,353 18,341 731 335 81
VA U.S. Targeted ValuePortfolio 8,571 4,990 2,203 (799) (155) 10,404 716 132 230
International Core EquityPortfolio 9,677 3,057 2,170 (414) (313) 9,837 814 226 —
Emerging Markets CoreEquity Portfolio 4,982 2,734 1,073 (167) 321 6,797 334 138 —
VA U.S. Large Value Portfolio 4,796 2,441 783 (154) (487) 5,813 258 105 53
VA International SmallPortfolio 2,986 887 687 (177) 22 3,031 270 83 36
VA International ValuePortfolio 2,213 901 352 (104) (382) 2,276 238 80 —
DFA Real Estate SecuritiesPortfolio 2,018 477 307 (51) (324) 1,813 53 45 3
Total $ 69,826 $ 25,021 $ 12,636 $(2,085) $1,122 $ 81,248 4,323 $1,486 $ 735
70

F. Federal Income Taxes:
Each Portfolio has qualified and intends to continue to qualify as a regulated investment company underSubchapter M of the Internal Revenue Code for federal income tax purposes and to distribute substantially all of itstaxable income and net capital gains to shareholders. Accordingly, no provision has been made for federal incometaxes.
Distributions from net investment income and net realized capital gains are determined in accordance with U.S.federal income tax regulations, which may differ from those amounts determined under accounting principlesgenerally accepted in the United States of America. These book/tax differences are either temporary or permanentin nature. To the extent that these differences are permanent, they are charged or credited to paid-in capital ordistributable earnings as appropriate, in the period that the differences arise. Accordingly, the permanent differencesas of October 31, 2020, can occur as a result of realized gains on securities considered to be “passive foreigninvestment companies,” non-deductible expenses, realized foreign capital gains tax, tax-equalization, non-deductible90-day stock issuance cost, net foreign currency gains/losses, distributions received from real estate investmenttrusts and distribution redesignations, and were reclassified to the accounts mentioned above. Thesereclassifications had no effect on net assets or net asset value per share.
The tax character of dividends and distributions declared and paid during the years ended October 31, 2019,and October 31, 2020, were as follows (amounts in thousands):
Net InvestmentIncome andShort-Term
Capital GainsLong-Term
Capital GainsTax Exempt
Income Total
VA U.S. Targeted Value Portfolio2019. . . . . . . . . . . . . . . . . . . . . . . . . . . . . . . . . . . . . . . . . . . . . . . . . . . . . . . . . . . . $ 8,215 $15,461 — $23,6762020. . . . . . . . . . . . . . . . . . . . . . . . . . . . . . . . . . . . . . . . . . . . . . . . . . . . . . . . . . . . 6,713 7,633 — 14,346VA U.S. Large Value Portfolio2019. . . . . . . . . . . . . . . . . . . . . . . . . . . . . . . . . . . . . . . . . . . . . . . . . . . . . . . . . . . . 10,763 10,592 — 21,3552020. . . . . . . . . . . . . . . . . . . . . . . . . . . . . . . . . . . . . . . . . . . . . . . . . . . . . . . . . . . . 11,939 6,061 — 18,000VA International Value Portfolio2019. . . . . . . . . . . . . . . . . . . . . . . . . . . . . . . . . . . . . . . . . . . . . . . . . . . . . . . . . . . . 8,346 863 — 9,2092020. . . . . . . . . . . . . . . . . . . . . . . . . . . . . . . . . . . . . . . . . . . . . . . . . . . . . . . . . . . . 11,672 — — 11,672VA International Small Portfolio2019. . . . . . . . . . . . . . . . . . . . . . . . . . . . . . . . . . . . . . . . . . . . . . . . . . . . . . . . . . . . 4,619 10,011 — 14,6302020. . . . . . . . . . . . . . . . . . . . . . . . . . . . . . . . . . . . . . . . . . . . . . . . . . . . . . . . . . . . 6,752 2,997 — 9,749VA Short-Term Fixed Portfolio2019. . . . . . . . . . . . . . . . . . . . . . . . . . . . . . . . . . . . . . . . . . . . . . . . . . . . . . . . . . . . 4,625 — — 4,6252020. . . . . . . . . . . . . . . . . . . . . . . . . . . . . . . . . . . . . . . . . . . . . . . . . . . . . . . . . . . . 7,178 — — 7,178VA Global Bond Portfolio2019. . . . . . . . . . . . . . . . . . . . . . . . . . . . . . . . . . . . . . . . . . . . . . . . . . . . . . . . . . . . 16,766 — — 16,7662020. . . . . . . . . . . . . . . . . . . . . . . . . . . . . . . . . . . . . . . . . . . . . . . . . . . . . . . . . . . . 10,398 — — 10,398VIT Inflation-Protected Securities Portfolio2019. . . . . . . . . . . . . . . . . . . . . . . . . . . . . . . . . . . . . . . . . . . . . . . . . . . . . . . . . . . . 2,654 — — 2,6542020. . . . . . . . . . . . . . . . . . . . . . . . . . . . . . . . . . . . . . . . . . . . . . . . . . . . . . . . . . . . 2,615 — — 2,615VA Global Moderate Allocation Portfolio2019. . . . . . . . . . . . . . . . . . . . . . . . . . . . . . . . . . . . . . . . . . . . . . . . . . . . . . . . . . . . 2,209 755 — 2,9642020. . . . . . . . . . . . . . . . . . . . . . . . . . . . . . . . . . . . . . . . . . . . . . . . . . . . . . . . . . . . 3,360 889 — 4,249VA Equity Allocation Portfolio2019. . . . . . . . . . . . . . . . . . . . . . . . . . . . . . . . . . . . . . . . . . . . . . . . . . . . . . . . . . . . 773 230 — 1,003
71

Net InvestmentIncome andShort-Term
Capital GainsLong-Term
Capital GainsTax Exempt
Income Total
2020. . . . . . . . . . . . . . . . . . . . . . . . . . . . . . . . . . . . . . . . . . . . . . . . . . . . . . . . . . . . $ 1,301 $ 515 — $ 1,816
As of October 31, 2020, the Portfolios did not have any net investment income and short-term capital gains orlong-term capital gains distributions designated for federal income tax purposes due to the use of accumulatedearnings and profits distributed to shareholders upon redemption of shares.
As of October 31, 2020, the components of distributable earnings (accumulated losses) were as follows(amounts in thousands):
UndistributedNet Investment
Income andShort-Term
Capital Gains
UndistributedLong-Term
Capital GainsCapital Loss
Carryforwards
UnrealizedAppreciation
(Depreciation)
Total NetDistributable
Earnings(Accumulated
Losses)
VA U.S. Targeted Value Portfolio. . . . . . . . . $4,582 — $ (3,484) $(36,033) $(34,935)VA U.S. Large Value Portfolio.. . . . . . . . . . . . 9,233 — (16,869) 42,107 34,471VA International Value Portfolio. . . . . . . . . . . 6,523 — (11,025) (71,143) (75,645)VA International Small Portfolio. . . . . . . . . . . 5,908 $3,126 — (17,848) (8,814)VA Short-Term Fixed Portfolio. . . . . . . . . . . . 1,981 — (178) 56 1,859VA Global Bond Portfolio. . . . . . . . . . . . . . . . . . — — (2,369) 2,844 475VIT Inflation-Protected Securities
Portfolio. . . . . . . . . . . . . . . . . . . . . . . . . . . . . . . . . . 1,905 1,009 — 12,457 15,371VA Global Moderate Allocation Portfolio.. 1,087 1,861 — 23,200 26,148VA Equity Allocation Portfolio. . . . . . . . . . . . . 695 224 — 2,431 3,350
For federal income tax purposes, the Fund measures its capital loss carryforwards annually at October 31, itsfiscal year end. Capital loss carryforwards may be carried forward and applied against future capital gains. Under theRegulated Investment Company Modernization Act of 2010, capital losses incurred by these Portfolios afterOctober 31, 2011, will not be subject to expiration and will retain their character as either short-term or long-termcapital losses. As of October 31, 2020, the Portfolios had the following capital loss carryforwards available to offsetfuture realized capital gains with no expiration date (amounts in thousands):
Unlimited Total
VA U.S. Targeted Value Portfolio. . . . . . . . . . . . . . . . . . . . . . . . . . . . . . . . . . . . . . . . . . . . . . . . . . . . . . . . . . . . . . . . . . . . $ 3,484 $ 3,484VA U.S. Large Value Portfolio. . . . . . . . . . . . . . . . . . . . . . . . . . . . . . . . . . . . . . . . . . . . . . . . . . . . . . . . . . . . . . . . . . . . . . . 16,869 16,869VA International Value Portfolio. . . . . . . . . . . . . . . . . . . . . . . . . . . . . . . . . . . . . . . . . . . . . . . . . . . . . . . . . . . . . . . . . . . . . . 11,025 11,025VA International Small Portfolio. . . . . . . . . . . . . . . . . . . . . . . . . . . . . . . . . . . . . . . . . . . . . . . . . . . . . . . . . . . . . . . . . . . . . — —VA Short-Term Fixed Portfolio. . . . . . . . . . . . . . . . . . . . . . . . . . . . . . . . . . . . . . . . . . . . . . . . . . . . . . . . . . . . . . . . . . . . . . . 178 178VA Global Bond Portfolio. . . . . . . . . . . . . . . . . . . . . . . . . . . . . . . . . . . . . . . . . . . . . . . . . . . . . . . . . . . . . . . . . . . . . . . . . . . . 2,369 2,369VIT Inflation-Protected Securities Portfolio. . . . . . . . . . . . . . . . . . . . . . . . . . . . . . . . . . . . . . . . . . . . . . . . . . . . . . . . . — —VA Global Moderate Allocation Portfolio. . . . . . . . . . . . . . . . . . . . . . . . . . . . . . . . . . . . . . . . . . . . . . . . . . . . . . . . . . . . — —VA Equity Allocation Portfolio. . . . . . . . . . . . . . . . . . . . . . . . . . . . . . . . . . . . . . . . . . . . . . . . . . . . . . . . . . . . . . . . . . . . . . . . — —
During the year ended October 31, 2020, the following Portfolio used the following capital loss carryforwards tooffset realized capital gains for federal income tax purposes (amounts in thousands):
VA Short-Term Fixed Portfolio. . . . . . . . . . . . . . . . . . . . . . . . . . . . . . . . . . . . . . . . . . . . . . . . . . . . . . . . . . . . . . . . . . . $ 54VA Global Bond Portfolio. . . . . . . . . . . . . . . . . . . . . . . . . . . . . . . . . . . . . . . . . . . . . . . . . . . . . . . . . . . . . . . . . . . . . . . . . 900
72
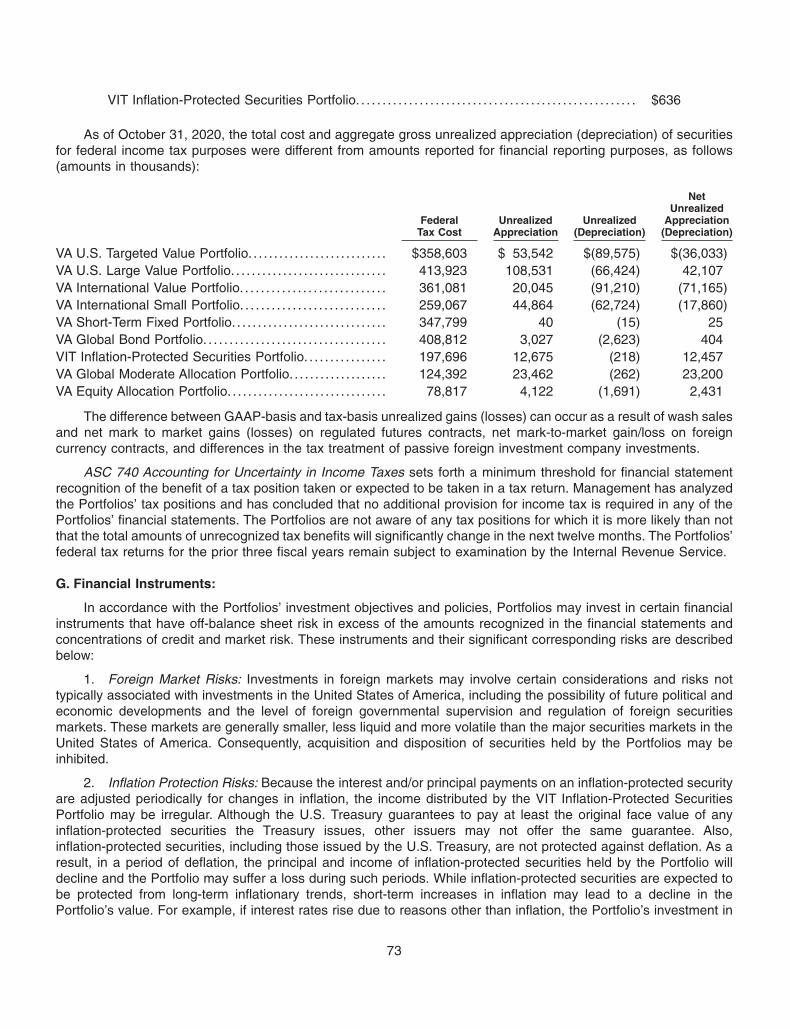
VIT Inflation-Protected Securities Portfolio. . . . . . . . . . . . . . . . . . . . . . . . . . . . . . . . . . . . . . . . . . . . . . . . . . . . . $636
As of October 31, 2020, the total cost and aggregate gross unrealized appreciation (depreciation) of securitiesfor federal income tax purposes were different from amounts reported for financial reporting purposes, as follows(amounts in thousands):
FederalTax Cost
UnrealizedAppreciation
Unrealized(Depreciation)
NetUnrealized
Appreciation(Depreciation)
VA U.S. Targeted Value Portfolio. . . . . . . . . . . . . . . . . . . . . . . . . . . $358,603 $ 53,542 $(89,575) $(36,033)VA U.S. Large Value Portfolio. . . . . . . . . . . . . . . . . . . . . . . . . . . . . . 413,923 108,531 (66,424) 42,107VA International Value Portfolio. . . . . . . . . . . . . . . . . . . . . . . . . . . . 361,081 20,045 (91,210) (71,165)VA International Small Portfolio. . . . . . . . . . . . . . . . . . . . . . . . . . . . 259,067 44,864 (62,724) (17,860)VA Short-Term Fixed Portfolio. . . . . . . . . . . . . . . . . . . . . . . . . . . . . . 347,799 40 (15) 25VA Global Bond Portfolio. . . . . . . . . . . . . . . . . . . . . . . . . . . . . . . . . . . 408,812 3,027 (2,623) 404VIT Inflation-Protected Securities Portfolio. . . . . . . . . . . . . . . . 197,696 12,675 (218) 12,457VA Global Moderate Allocation Portfolio. . . . . . . . . . . . . . . . . . . 124,392 23,462 (262) 23,200VA Equity Allocation Portfolio. . . . . . . . . . . . . . . . . . . . . . . . . . . . . . . 78,817 4,122 (1,691) 2,431
The difference between GAAP-basis and tax-basis unrealized gains (losses) can occur as a result of wash salesand net mark to market gains (losses) on regulated futures contracts, net mark-to-market gain/loss on foreigncurrency contracts, and differences in the tax treatment of passive foreign investment company investments.
ASC 740 Accounting for Uncertainty in Income Taxes sets forth a minimum threshold for financial statementrecognition of the benefit of a tax position taken or expected to be taken in a tax return. Management has analyzedthe Portfolios’ tax positions and has concluded that no additional provision for income tax is required in any of thePortfolios’ financial statements. The Portfolios are not aware of any tax positions for which it is more likely than notthat the total amounts of unrecognized tax benefits will significantly change in the next twelve months. The Portfolios’federal tax returns for the prior three fiscal years remain subject to examination by the Internal Revenue Service.
G. Financial Instruments:
In accordance with the Portfolios’ investment objectives and policies, Portfolios may invest in certain financialinstruments that have off-balance sheet risk in excess of the amounts recognized in the financial statements andconcentrations of credit and market risk. These instruments and their significant corresponding risks are describedbelow:
1. Foreign Market Risks: Investments in foreign markets may involve certain considerations and risks nottypically associated with investments in the United States of America, including the possibility of future political andeconomic developments and the level of foreign governmental supervision and regulation of foreign securitiesmarkets. These markets are generally smaller, less liquid and more volatile than the major securities markets in theUnited States of America. Consequently, acquisition and disposition of securities held by the Portfolios may beinhibited.
2. Inflation Protection Risks: Because the interest and/or principal payments on an inflation-protected securityare adjusted periodically for changes in inflation, the income distributed by the VIT Inflation-Protected SecuritiesPortfolio may be irregular. Although the U.S. Treasury guarantees to pay at least the original face value of anyinflation-protected securities the Treasury issues, other issuers may not offer the same guarantee. Also,inflation-protected securities, including those issued by the U.S. Treasury, are not protected against deflation. As aresult, in a period of deflation, the principal and income of inflation-protected securities held by the Portfolio willdecline and the Portfolio may suffer a loss during such periods. While inflation-protected securities are expected tobe protected from long-term inflationary trends, short-term increases in inflation may lead to a decline in thePortfolio’s value. For example, if interest rates rise due to reasons other than inflation, the Portfolio’s investment in
73

these securities may not be protected to the extent that the increase is not reflected in the securities’ inflationmeasures. Additionally, positive adjustments to principal generally will result in taxable income to the Portfolio at thetime of such adjustments (which generally would be distributed by the Portfolio as part of its taxable dividends), eventhough the principal amount is not paid until maturity. The current market value of inflation-protected securities is notguaranteed and will fluctuate.
Derivative Financial Instruments:
Summarized below are the specific types of derivative instruments used by the Portfolios.
3. Forward Currency Contracts: The VA Global Bond Portfolio may acquire and sell forward currency contractsto hedge against adverse changes in the relationship of the U.S. dollar to foreign currencies (foreign exchange raterisk) or to transfer balances from one currency to another currency. The decision to hedge the Portfolio’s currencyexposure with respect to a foreign market will be based primarily on the Portfolio’s existing exposure to a givenforeign currency. Each contract is valued daily and the change in value is recorded by the Portfolio as an unrealizedgain or loss, which is presented in the Statement of Operations as the change in unrealized appreciation ordepreciation of forward currency contracts. When the contract is closed or offset with the same counterparty, thePortfolio records a realized gain or loss equal to the change in the value of the contract when it was opened and thevalue at the time it was closed or offset. This is presented in the Statement of Operations as a net realized gain orloss on forward currency contracts. Risks may arise upon entering into these contracts from the potential inability ofcounterparties to meet the terms of their contracts and from unanticipated movements in the value of foreign currencyrelative to the U.S. dollar.
4. Futures Contracts: The Portfolios listed below may purchase or sell futures contracts and options on futurescontracts for foreign or U.S. equity securities and indices, to adjust market exposure based on actual or expectedcash inflows to or outflows from the Portfolio. The Portfolios, however, do not intend to sell futures contracts toestablish short positions in individual securities or to use derivatives for purposes of speculation or leveraginginvestment returns.
Upon entering into a futures contract, a Portfolio deposits cash or pledges U.S. Government securities to abroker in an amount equal to the minimum “initial margin” requirements of the exchange on which the contract istraded. Subsequent payments are received from or paid to the broker each day, based on the daily fluctuation in themarket value of the contract. These receipts or payments are known as “variation margin” and are recorded daily bythe Portfolio as unrealized gains or losses until the contracts are closed. When the contracts are closed, the Portfoliorecords a realized gain or loss, which is presented in the Statements of Operations as a net realized gain or loss onfutures, equal to the difference between the value of the contract at the time it was opened and the value at the timeit was closed.
Risks may arise upon entrance into futures contracts from potential imperfect price correlations between thefutures contracts and the underlying securities, from the possibility of an illiquid secondary market for theseinstruments and from the possibility that the Portfolios could lose more than the initial margin requirements. APortfolio entering into stock index futures is subject to equity price risk from those futures contracts. Counterpartycredit risk related to exchange-traded futures is minimal because the exchange’s clearinghouse, as counterparty toall exchange-traded futures, guarantees the futures against default.
The average volume (based on the open positions at each fiscal month-end) of derivative activity for the yearended October 31, 2020 was as follows (amounts in thousands):
ForwardCurrency
Contracts* Futures**
VA International Value Portfolio. . . . . . . . . . . . . . . . . . . . . . . . . . . . . . . . . . . . . . . . . . . . . . . . . $ — $218VA Global Bond Portfolio. . . . . . . . . . . . . . . . . . . . . . . . . . . . . . . . . . . . . . . . . . . . . . . . . . . . . . . . 393,209 —
* Average amount of Currency Purchased/Sold in USD
** Average Notional Value of contracts
74

The following is a summary of the VA Global Bond Portfolio’s derivative instrument holdings categorized byprimary risk exposure as of October 31, 2020 (amounts in thousands):
Asset Derivatives Value
Total Valueat
October 31, 2020
ForwardCurrency
Contracts (1)
VA Global Bond Portfolio. . . . . . . . . . . . . . . . . . . . . . . . . . . . . . . . . . . . . . . . . . . . . . . . . . . . . . . . . $2,880 $2,880
Liability Derivatives Value
Total Valueat
October 31, 2020
ForwardCurrency
Contracts (2)
VA Global Bond Portfolio. . . . . . . . . . . . . . . . . . . . . . . . . . . . . . . . . . . . . . . . . . . . . . . . . . . . . . . . . $(455) $(455)
(1) Presented on Statements of Assets and Liabilities as Unrealized Gain on Forward Currency Contracts.
(2) Presented on Statements of Assets and Liabilities as Unrealized Loss on Forward Currency Contracts.
The following is a summary of the realized and change in unrealized gains and losses from the Portfolios’derivative instrument holdings categorized by primary risk exposure for the year ended October 31, 2020 (amountsin thousands):
Realized Gain (Loss) onDerivatives
Total
ForwardCurrency
Contracts (1)Equity
Contracts (2)
VA U.S. Large Value Portfolio. . . . . . . . . . . . . . . . . . . . . . . . . . . . . . . . . . . . . . . . . . . $ (80) — $ (80)*VA International Value Portfolio. . . . . . . . . . . . . . . . . . . . . . . . . . . . . . . . . . . . . . . . . 142 — 142*VA International Small Portfolio. . . . . . . . . . . . . . . . . . . . . . . . . . . . . . . . . . . . . . . . . 52 — 52*VA Global Bond Portfolio. . . . . . . . . . . . . . . . . . . . . . . . . . . . . . . . . . . . . . . . . . . . . . . . (11,128) $(11,128) —VA Equity Allocation Portfolio. . . . . . . . . . . . . . . . . . . . . . . . . . . . . . . . . . . . . . . . . . . (15) — (15)*
Change in Unrealized Appreciation(Depreciation) on Derivatives
Total
ForwardCurrency
Contracts (3)
VA Global Bond Portfolio. . . . . . . . . . . . . . . . . . . . . . . . . . . . . . . . . . . . . . . . . . . . . . . . . . . . . . . $8,218 $8,218
(1) Presented on Statements of Operations as Net Realized Gain (Loss) on: Forward Currency Contracts.
(2) Presented on Statements of Operations as Net Realized Gain (Loss) on: Futures.
(3) Presented on Statements of Operations as Change in Unrealized Appreciation (Depreciation) of: Forward Currency Contracts.
* As of October 31, 2020, there were no futures contracts outstanding. During the year ended October 31, 2020, the Portfolios had limited
activity in futures contracts.
Offsetting of Derivative Assets and Derivative Liabilities
In order to better define its contractual rights and to secure rights that will help the Fund mitigate its counterpartyrisk, the Fund entered into an International Swaps and Derivatives Association, Inc. Master Agreement (ISDA MasterAgreement) or a similar agreement with certain of its derivative contract counterparties. An ISDA Master Agreement
75

is a bilateral agreement between the Fund and a counterparty that governs over-the-counter (OTC) derivatives andforward currency contracts and typically contains, among other things, provisions in the event of a default and/ortermination event and may also include collateral posting items. Under an ISDA Master Agreement, the Fund may,under certain circumstances, offset with the counterparty certain derivative financial instruments’ payables and/orreceivables with collateral held and/or posted, if any, and create one single net payment. The provisions of the ISDAMaster Agreement typically permit a single net payment in the event of a default (close-out), including the bankruptcyor insolvency of the counterparty. However, bankruptcy or insolvency laws of a particular jurisdiction may imposerestrictions on or prohibitions against the right of offset in bankruptcy, insolvency, or other events.
For financial reporting purposes, the Fund does not offset derivative assets and derivative liabilities that aresubject to netting arrangements in the Statements of Assets and Liabilities.
The following table presents the VA Global Bond Portfolio’s gross and net amount of assets and liabilitiesavailable for offset under netting arrangements as well as any related collateral received or pledged by the Portfolioas of October 31, 2020 (amounts in thousands):
NetAmounts
ofAssets
Presentedin the
Statementsof Assets
andLiabilities
Gross Amounts NotOffset in the
Statements of Assetsand Liabilities
NetAmounts
ofLiabilitiesPresented
in theStatementsof Assets
andLiabilities
Gross Amounts NotOffset in the
Statements of Assetsand Liabilities
Description
GrossAmounts ofRecognized
Assets(a)
FinancialInstruments
(b)
CashCollateralReceived
NetAmount
(c)
GrossAmounts ofRecognizedLiabilities
(a)
FinancialInstruments
(d)
CashCollateralPledged
NetAmount
(e)
Assets Liabilities
VA Global Bond PortfolioCitibank, N.A.. . . . . . . . . . . . . . . . . . . . . . . $ 11 $ 11 $(11) — — $323 $323 $(11) — $312
Bank of America Corp.. . . . . . . . . . . . . . . . 2,029 2,029 (17) — $2,012 17 17 (17) — —
JP Morgan. . . . . . . . . . . . . . . . . . . . . . . . . 2 2 (2) — — 24 24 (2) — 22
Morgan Stanley and Co.. . . . . . . . . . . . . . . 35 35 — — 35 — — — — —
Royal Bank of Scotland. . . . . . . . . . . . . . . 739 739 — — 739 — — — — —
HSBC Bank. . . . . . . . . . . . . . . . . . . . . . . . 21 21 (21) — — 37 37 (21) — 16
State Street Bank and Trust. . . . . . . . . . . . 42 42 (42) — — 53 53 (42) — 11
UBS AG. . . . . . . . . . . . . . . . . . . . . . . . . . . 1 1 — — 1 — — — — —
Total $2,880 $2,880 $(93) — $2,787 $454 $454 $(93) — $361
(a) No amounts have been netted against the gross amounts recognized in the Statements of Assets and Liabilities.
(b) Represents the amount of assets that could be offset by liabilities with the same counterparty under master netting or similar agreementsthat management elects not to offset on the Statements of Assets and Liabilities.
(c) Represents the net amount due from counterparties in the event of default.
(d) Represents the amount of liabilities that could be offset by assets with the same counterparty under master netting or similar agreementsthat management elects not to offset on the Statements of Assets and Liabilities.
(e) Represents the net amount due to counterparties in the event of default.
Note J contains information regarding securities lending amounts that are subject to netting arrangements.
H. Line of Credit and Interfund Lending Program:
The Fund, together with other Dimensional-advised portfolios, has entered into a $500 million uncommitted,unsecured discretionary line of credit effective April 8, 2020, with its domestic custodian bank. A line of credit withsimilar terms was in effect through April 8, 2020. Each portfolio is permitted to borrow, subject to its investmentlimitations, up to a maximum of $500 million, as long as total borrowings under the line of credit do not exceed$500 million in the aggregate. Borrowings under the line of credit are charged interest at rates agreed upon by the
76

parties at the time of borrowing. Each portfolio is individually, and not jointly, liable for its particular advances underthe line of credit. There is no commitment fee on the unused portion of the line of credit. The agreement for thediscretionary line of credit may be terminated by either party at any time. The agreement for the line of credit expireson April 7, 2021.
The Fund, together with other Dimensional-advised portfolios, has also entered into an additional $700 millionunsecured line of credit with its international custodian bank effective January 2, 2020. A line of credit with similarterms was in effect through January 2, 2020. Each portfolio is permitted to borrow, subject to its investmentlimitations, up to a maximum of $500 million, as long as total borrowings under the line of credit do not exceed$700 million in the aggregate. Each portfolio is individually, and not jointly, liable for its particular advances under theline of credit. Borrowings under the line of credit are charged interest at rates agreed upon by the parties at the timeof borrowing. There is no commitment fee on the unused portion of the line of credit. The agreement for thediscretionary line of credit may be terminated by either party at any time. The line of credit agreement expires onJanuary 1, 2021.
For the year ended October 31, 2020, borrowings by the following Portfolios under the lines of credit were asfollows (amounts in thousands, except percentages and days):
WeightedAverage
Interest Rate
WeightedAverage
Loan Balance
Number ofDays
Outstanding*
InterestExpenseIncurred
Maximum AmountBorrowed During
the Period
OutstandingBorrowings
as of 10/31/2020
VA U.S. Targeted ValuePortfolio. . . . . . . . . . . . . . . . . . . . 0.83% $ 973 22 — $2,820 $392
VA U.S. Large ValuePortfolio. . . . . . . . . . . . . . . . . . . . 1.43% 1,791 72 $ 4 8,601 852
VA International ValuePortfolio. . . . . . . . . . . . . . . . . . . . 0.94% 529 41 1 3,006 320
VA International SmallPortfolio. . . . . . . . . . . . . . . . . . . . 0.94% 221 67 — 1,370 220
VA Global Bond Portfolio.... 0.84% 3,560 3 — 3,560 —VA Global Moderate
Allocation Portfolio. . . . . . . . 1.36% 423 39 — 2,621 538VA Equity Allocation
Portfolio. . . . . . . . . . . . . . . . . . . . 1.15% 233 54 — 2,278 507* Number of Days Outstanding represents the total of single or consecutive days during the year ended October 31, 2020, that each
Portfolio’s available line of credit was used.
Pursuant to an exemptive order issued by the SEC (the “Order”), the Portfolios may participate in an interfundlending program among certain portfolios managed by the Advisor (portfolios that operate as feeder funds do notparticipate in the program). The program allows the participating portfolios to borrow money from and loan money toeach other for temporary or emergency purposes, subject to the conditions in the Order. A loan can only be madethrough the program if the interfund loan rate on that day is more favorable to both the borrowing and lendingportfolios as compared to rates available through short-term bank loans or investments in overnight repurchaseagreements and money market funds, respectively, as detailed in the Order. Further, a portfolio may participate in theprogram only if and to the extent that such participation is consistent with its investment objectives and limitations.Interfund loans have a maximum duration of seven days and may be called on one business day’s notice.
The Portfolios did not use the interfund lending program during the year ended October 31, 2020.
I. Affiliated Trades:
Cross trades for the year ended October 31, 2020, if any, were executed by the Portfolios pursuant toprocedures adopted by the Board of Directors of the Fund to ensure compliance with Rule 17a-7 under theInvestment Company Act of 1940 (the “1940 Act”). Cross trading is the buying or selling of portfolio securitiesbetween series of investment companies, or between a series of an investment company and another entity, that are
77

or could be considered affiliates by virtue of a common investment advisor (or affiliated investment advisors),common Directors/Trustees and/or common Officers. At its regularly scheduled meetings, the CCO certifies to theBoard that the 17a-7 transactions entered into by the Portfolios complied with the Rule 17a-7 Procedures adoptedby the Board of Directors of the Fund.
For the year ended October 31, 2020, cross trades by the Portfolios under Rule 17a-7 were as follows (amountsin thousands):
Portfolio Purchases Sales Realized Gain (Loss)
VA U.S. Targeted Value Portfolio. . . . . . . . . . . . . . . . . . . . . . . . . . . . . . . . . . . . . . . . . . . . $23,304 $12,138 $ 556VA U.S. Large Value Portfolio. . . . . . . . . . . . . . . . . . . . . . . . . . . . . . . . . . . . . . . . . . . . . . . 13,788 11,147 (1,430)VA International Value Portfolio. . . . . . . . . . . . . . . . . . . . . . . . . . . . . . . . . . . . . . . . . . . . . . 6,447 5,197 (1,779)VA International Small Portfolio. . . . . . . . . . . . . . . . . . . . . . . . . . . . . . . . . . . . . . . . . . . . . . 4,376 5,615 743
J. Securities Lending:
As of October 31, 2020, some of the Portfolios had securities on loan to brokers/dealers, for which suchPortfolios received cash collateral. Additionally, the following Portfolios received non-cash collateral consisting ofshort-and/or long-term U.S. Treasuries and U.S. government agency securities as follows (amounts in thousands):
Non-CashCollateral
MarketValue
VA U.S. Targeted Value Portfolio. . . . . . . . . . . . . . . . . . . . . . . . . . . . . . . . . . . . . . . . . . . . . . . . . . . . . . . . . . . . $7,297VA U.S. Large Value Portfolio. . . . . . . . . . . . . . . . . . . . . . . . . . . . . . . . . . . . . . . . . . . . . . . . . . . . . . . . . . . . . . . 395VA International Value Portfolio. . . . . . . . . . . . . . . . . . . . . . . . . . . . . . . . . . . . . . . . . . . . . . . . . . . . . . . . . . . . . . 1,392VA International Small Portfolio. . . . . . . . . . . . . . . . . . . . . . . . . . . . . . . . . . . . . . . . . . . . . . . . . . . . . . . . . . . . . . 5,214
Each Portfolio with securities on loan invests the cash collateral, as described below, and records a liability forthe return of the collateral, during the period the securities are on loan. Loans of securities are expected at all timesto be secured by collateral in an amount (i) equal to at least 100% of the current market value of the loaned securitieswith respect to securities of the U.S. government or its agencies, (ii) generally equal to 102% of the current marketvalue of the loaned securities with respect to U.S. securities, and (iii) generally equal to 105% of the current marketvalue of the loaned securities with respect to foreign securities. However, daily market fluctuations could cause thePortfolio’s collateral to be lower or higher than the expected thresholds. If this were to occur, the collateral would beadjusted the next business day to ensure adequate collateralization. In the event of default or bankruptcy by the otherparty to the agreement, realization and/or retention of the collateral may be subject to legal proceedings. If theborrower fails to return loaned securities, cash collateral being maintained by the borrower is insufficient to cover thevalue of loaned securities, and such collateral insufficiency is not the result of investment losses, the lending agenthas agreed to pay the amount of the shortfall to the Portfolio or, at the option of the lending agent, to replace thesecurities. In the event of the bankruptcy of the borrower, the Portfolio could experience delay in recovering theloaned securities or only recover cash or a security of equivalent value.
Subject to their stated investment policies, each Portfolio with securities on loan will generally invest the cashcollateral received for the loaned securities in The DFA Short Term Investment Fund (the �Money Market Series�), anaffiliated registered money market fund advised by the Advisor for which the Advisor receives a management fee of0.05% of the average daily net assets of the Money Market Series. Income received from the Money Market Seriesis netted with fees for securities lending and collateral investment expenses and with other payments to and fromborrowers of securities. The Portfolios also may invest the cash collateral received for the loaned securities insecurities of the U.S. government or its agencies, repurchase agreements collateralized by securities of the U.S.
78

government or its agencies, and affiliated or unaffiliated money market funds that are registered or unregistered. Forpurposes of this paragraph, agencies include both agency debentures and agency mortgage-backed securities.Additionally, each Portfolio will be able to terminate the loan at any time and will receive reasonable interest on theloan, as well as amounts equal to any dividends, interest or, other distributions on the loaned securities. However,dividend income received from loaned securities may not be eligible for taxation at qualified dividend income rates.
The following table reflects a breakdown of transactions accounted for as secured borrowings, the grossobligation by the type of collateral pledged, and the remaining contractual maturity of those transactions as ofOctober 31, 2020:
Remaining Contractual Maturity of the AgreementsAs of October 31, 2020
Overnight andContinuous <30 days
Between30 & 90 days >90 days Total
Securities Lending TransactionsVA U.S. Targeted Value Portfolio
Common Stocks, Preferred Stocks. . . . . . . . . . . . . . . . . . . . $ 5,548 — — — $ 5,548VA U.S. Large Value Portfolio
Common Stocks. . . . . . . . . . . . . . . . . . . . . . . . . . . . . . . . . . . . . . . . 619 — — — 619VA International Value Portfolio
Common Stocks, Preferred Stocks. . . . . . . . . . . . . . . . . . . . 9,848 — — — 9,848VA International Small Portfolio
Common Stocks, Preferred Stocks,Rights/Warrants. . . . . . . . . . . . . . . . . . . . . . . . . . . . . . . . . . . . . . 12,400 — — — 12,400
VA Short-Term Fixed PortfolioAgency Obligations, Bonds, U.S. Treasury
Obligations. . . . . . . . . . . . . . . . . . . . . . . . . . . . . . . . . . . . . . . . . . . 4,080 — — — 4,080VA Global Bond Portfolio
Bonds. . . . . . . . . . . . . . . . . . . . . . . . . . . . . . . . . . . . . . . . . . . . . . . . . . . — — — — —
K. Indemnitees; Contractual Obligations:
Under the Fund’s organizational documents, its Officers and Directors are indemnified against certain liabilitiesarising out of the performance of their duties to the Fund.
In the normal course of business, the Fund enters into contracts that contain a variety of representations andwarranties that provide general indemnification. The Fund’s maximum exposure under these arrangements isunknown, as this would involve future claims that may be made against the Fund and/or its affiliates that have notyet occurred. However, based on experience, the Fund expects the risk of loss to be remote.
L. Recently Issued Accounting Standards:
In March 2017, the Financial Accounting Standards Board (FASB) issued Accounting Standards Update (ASU)2017-08 which changes the amortization period for a callable debt security from the maturity date to the earliest calldate. The ASU is effective for annual periods beginning after December 15, 2018, and interim periods within thoseannual periods. The Portfolios’ adoption of ASU 2017-08 disclosure requirements are reflected within these financialstatements prepared as of October 31, 2020 and management has concluded that the change in accounting principledoes not materially impact the financial statement amounts.
In August 2018, the FASB issued ASU No. 2018-13, “Fair Value Measurements” (“ASU 2018-13”). This updatemakes certain removals from, changes to and additions to existing disclosure requirements for fair valuemeasurement. ASU 2018-13 does not change fair value measurements already required or permitted by existing
79

standards. ASU 2018-13 is effective for financial statements issued for fiscal years beginning after December 15,2019, and interim periods within those fiscal years. The Portfolios’ early adoption of all of the ASU 2018-13 disclosurerequirements are reflected within these financial statements prepared as of October 31, 2020.
On July 27, 2017, the head of the United Kingdom’s Financial Conduct Authority announced the intention tophase out the use of London Interbank Offered Rate (“LIBOR”) by the end of 2021. In the interim, there remainsuncertainty regarding the impact the transition to replacement rates may have on the value of LIBOR-basedinvestments. In March 2020, the FASB issued ASU 2020-04 which provides optional guidance to ease the potentialaccounting burden associated with transitioning away from the LIBOR and other reference rates that are expectedto be discontinued. The ASU is effective immediately upon release of the update on March 12, 2020 throughDecember 31, 2022. At this time, management is evaluating implications of these changes on the financialstatements.
M. Coronavirus (COVID-19) Pandemic:
The continued worldwide spread of novel coronavirus (COVID-19) and its impact on international businessoperations, supply chains, travel, commodity prices, consumer confidence and business forecasts, and theassociated impact on domestic and international equity markets and fixed income yields, has caused uncertainty forthe global economy and financial markets. If market expectations regarding the impact of COVID-19 worsen, or ifexpected returns change because investors demand higher returns to invest in these uncertain times, there may bea detrimental impact on returns in the near term.
N. Other:
As of October 31, 2020, the following number of shareholders held the following approximate percentages of thePortfolios’ outstanding shares. One or more of the shareholders may be omnibus accounts, which typically holdshares for the benefit of several other underlying investors.
Number ofShareholders
ApproximatePercentage
of OutstandingShares
VA U.S. Targeted Value Portfolio. . . . . . . . . . . . . . . . . . . . . . . . . . . . . . . . . . . . . . . . . . . . . . . . . . . . . . . . . . . 5 64%VA U.S. Large Value Portfolio. . . . . . . . . . . . . . . . . . . . . . . . . . . . . . . . . . . . . . . . . . . . . . . . . . . . . . . . . . . . . . 6 74%VA International Value Portfolio. . . . . . . . . . . . . . . . . . . . . . . . . . . . . . . . . . . . . . . . . . . . . . . . . . . . . . . . . . . . . 5 78%VA International Small Portfolio. . . . . . . . . . . . . . . . . . . . . . . . . . . . . . . . . . . . . . . . . . . . . . . . . . . . . . . . . . . . . 5 70%VA Short-Term Fixed Portfolio. . . . . . . . . . . . . . . . . . . . . . . . . . . . . . . . . . . . . . . . . . . . . . . . . . . . . . . . . . . . . . 5 82%VA Global Bond Portfolio. . . . . . . . . . . . . . . . . . . . . . . . . . . . . . . . . . . . . . . . . . . . . . . . . . . . . . . . . . . . . . . . . . . 6 83%VIT Inflation-Protected Securities Portfolio. . . . . . . . . . . . . . . . . . . . . . . . . . . . . . . . . . . . . . . . . . . . . . . . 3 89%VA Global Moderate Allocation Portfolio. . . . . . . . . . . . . . . . . . . . . . . . . . . . . . . . . . . . . . . . . . . . . . . . . . . 5 87%VA Equity Allocation Portfolio. . . . . . . . . . . . . . . . . . . . . . . . . . . . . . . . . . . . . . . . . . . . . . . . . . . . . . . . . . . . . . . 3 94%
The Portfolios are subject to claims and suits that arise from time to time in the ordinary course of business.Although management currently believes that resolving claims against the Portfolios, individually or in aggregate, willnot have a material adverse impact on the Portfolios’ financial position, results of operations, or cash flows, thesematters are subject to inherent uncertainties and management’s view of these matters may change in the future.
The VA U.S. Large Value Portfolio has been named as a defendant in a multi-district litigation pending in theUnited States District Court for the Southern District of New York (the “District Court”), captioned IN RE TRIBUNECOMPANY FRAUDULENT CONVEYANCE LITIGATION, No. 11-MD-2296-RJS (the “Tribune MDL”). The TribuneMDL arises from the 2007 leveraged buyout of The Tribune Company (“Tribune”) (the “LBO”) and Tribune’ssubsequent bankruptcy and reorganization. In connection with the LBO, thousands of Tribune shareholders,including the VA U.S. Large Value Portfolio, sold Tribune shares back to Tribune for $34 per share. The Tribune MDLincludes a series of lawsuits brought by individual creditors of Tribune (the “Individual Creditor Actions”) and a lawsuitbrought by the trustee of a litigation trust (the “Trustee”) to whom Tribune’s committee of unsecured creditors
80

assigned claims (the “Committee Action,” and with the Individual Creditor Actions, collectively referred to as the“Tribune Lawsuits”). The Tribune Lawsuits seek to unwind the LBO stock repurchases as fraudulent transfers andrecover the stock repurchase proceeds paid to the Tribune shareholders who participated in the LBO.
On September 23, 2013, the District Court entered an order dismissing the Individual Creditor Actions in theirentirety on the grounds that the individual creditor plaintiffs lacked standing to pursue their claims. The partiesappealed the District Court’s dismissal order to the United States Court of Appeals for the Second Circuit (the“Second Circuit”), and on March 29, 2016, the Second Circuit affirmed the dismissal, albeit on the grounds that theindividual creditor plaintiffs’ claims are preempted and barred by the Bankruptcy Code’s safe harbor for securitiestransactions. The individual creditor plaintiffs filed a petition for certiorari with the Supreme Court of the United States(the “Supreme Court”), seeking review of the Second Circuit’s ruling. Thereafter, the individual creditor plaintiffsmoved the Second Circuit to review its prior ruling in light of the Supreme Court’s decision in MERIT MANAGEMENTGROUP, LP v. FTI CONSULTING, INC., 138 S.Ct. 883 (2018) (“Merit Mgmt.”), which addressed the scope of theBankruptcy Code’s safe harbor for securities transactions. The Second Circuit agreed to review the matter andwithdrew its mandate with respect to the affirmance of the dismissal order. Consequently, the Supreme Courtdismissed the individual creditor plaintiffs’ petition for certiorari. On December 19, 2019, the Second Circuit againaffirmed the District Court’s dismissal of the Individual Creditor Actions on the grounds that the individual creditorplaintiffs’ claims are preempted and barred by the Bankruptcy Code’s safe harbor for securities transactions. Theindividual creditor plaintiffs moved the Second Circuit for rehearing, which the Second Circuit denied. The individualcreditor plaintiffs recently filed a second petition for certiorari with the Supreme Court, which is pending.
On January 6, 2017, the District Court granted the shareholder defendants’ motion to dismiss the claims againstthem in the Committee Action. The Trustee moved for leave from the District Court to file an amended complaint toassert new constructive fraudulent transfer claims against the shareholder defendants in light of the Merit Mgmt.decision. The District Court denied the motion, ruling that the proposed amendment would unduly prejudice theshareholder defendants and would be futile because the Trustee’s proposed constructive fraudulent transfer claimswould be barred by the Bankruptcy Code’s safe harbor for securities transactions, notwithstanding the Merit Mgmt.decision. The Trustee appealed the District Court’s dismissal order and order denying the Trustee’s motion for leaveto amend to the Second Circuit. The Second Circuit held oral argument on August 24, 2020, and the parties awaitthe Second Circuit’s ruling.
Litigation counsel to the VA U.S. Large Value Portfolio in the Tribune Lawsuits has advised management that itdoes not believe that it is possible to predict with any reasonable certainty the probable outcome of the TribuneLawsuits or quantify the ultimate exposure to the VA U.S. Large Value Portfolio arising from the Tribune Lawsuits.Until the VA U.S. Large Value Portfolio can do so, no reduction of the net asset value of the VA U.S. Large ValuePortfolio will be made relating to the Tribune Lawsuits. However, even if the plaintiffs in the Tribune Lawsuits wereto obtain the full recovery the plaintiffs seek, the amount would be less than 1% of the net asset value of the VAU.S. Large Value Portfolio at this time.
The VA U.S. Large Value Portfolio also cannot quantify the cost of the Tribune Lawsuits that could potentially bededucted from its net asset value. Therefore, at this time, those investors buying or redeeming shares of the VAU.S. Large Value Portfolio will pay or receive, as the case may be, a price based on the net asset value of the VAU.S. Large Value Portfolio, with no adjustment relating to the Tribune Lawsuits. The attorneys’ fees and costs relatingto the Tribune Lawsuits will be borne by the VA U.S. Large Value Portfolio as incurred and in a manner similar to anyother expenses incurred by the VA U.S. Large Value Portfolio.
O. Subsequent Event Evaluations:
On November 12, 2020, President Trump issued an Executive Order titled �Addressing the Threat fromSecurities Investments that Finance Communist Chinese Military Companies” (the “Order”). Beginning January 11,2021, the Order will prohibit U.S. entities from participating in certain types of transactions involving securities ofChinese companies known to be associated with the Chinese military. Management is currently evaluating theOrder’s effect on the Funds.
81

Report of Independent Registered Public Accounting Firm To the Board of Directors of DFA Investment Dimensions Group Inc. and Shareholders of VA U.S. Targeted Value Portfolio, VA U.S. Large Value Portfolio, VA International Value Portfolio, VA International Small Portfolio, VA Short-Term Fixed Portfolio, VA Global Bond Portfolio, VIT Inflation-Protected Securities Portfolio, VA Global Moderate Allocation Portfolio and VA Equity Allocation Portfolio Opinions on the Financial Statements We have audited the accompanying statements of assets and liabilities, including the summary schedules of portfolio holdings of VA U.S. Targeted Value Portfolio, VA U.S. Large Value Portfolio, VA International Value Portfolio and VA International Small Portfolio and schedules of investments of VA Short-Term Fixed Portfolio, VA Global Bond Portfolio, VIT Inflation-Protected Securities Portfolio, VA Global Moderate Allocation Portfolio and VA Equity Allocation Portfolio (nine of the portfolios constituting DFA Investment Dimensions Group Inc., hereafter collectively referred to as the “Portfolios”) as of October 31, 2020, the related statements of operations for the year ended October 31, 2020, the statements of changes in net assets for each of the two years in the period ended October 31, 2020, including the related notes, and the financial highlights for each of the periods indicated therein (collectively referred to as the “financial statements”). In our opinion, the financial statements present fairly, in all material respects, the financial position of each of the Portfolios as of October 31, 2020, the results of each of their operations for the year then ended, the changes in each of their net assets for each of the two years in the period ended October 31, 2020, and each of the financial highlights for each of the periods indicated therein in conformity with accounting principles generally accepted in the United States of America. Basis for Opinions These financial statements are the responsibility of the Portfolios’ management. Our responsibility is to express an opinion on the Portfolios’ financial statements based on our audits. We are a public accounting firm registered with the Public Company Accounting Oversight Board (United States) (PCAOB) and are required to be independent with respect to the Portfolios in accordance with the U.S. federal securities laws and the applicable rules and regulations of the Securities and Exchange Commission and the PCAOB. We conducted our audits of these financial statements in accordance with the standards of the PCAOB. Those standards require that we plan and perform the audit to obtain reasonable assurance about whether the financial statements are free of material misstatement, whether due to error or fraud. Our audits included performing procedures to assess the risks of material misstatement of the financial statements, whether due to error or fraud, and performing procedures that respond to those risks. Such procedures included examining, on a test basis, evidence regarding the amounts and disclosures in the financial statements. Our audits also included evaluating the accounting principles used and significant estimates made by management, as well as evaluating the overall presentation of the financial statements. Our procedures included confirmation of securities owned as of October 31, 2020 by correspondence with the custodians, brokers and transfer agents of the investee funds; when replies were not received from brokers, we performed other auditing procedures. We believe that our audits provide a reasonable basis for our opinions. /s/PricewaterhouseCoopers LLP Philadelphia, Pennsylvania December 18, 2020 We have served as the auditor of one or more investment companies in Dimensional Fund Advisors L.P. investment company group since 1981.

FUND MANAGEMENT
(Unaudited)
Trustees/Directors
Each Board of Trustees/Directors (each, the “Board” and collectively, the “Boards”) of The DFA Investment TrustCompany (“DFAITC”), DFA Investment Dimensions Group Inc. (“DFAIDG”), Dimensional Investment Group Inc.(“DIG”), and Dimensional Emerging Markets Value Fund (“DEM”) (each, the “Fund” and collectively, the “Funds”) isresponsible for establishing the Funds’ policies and for overseeing the management of the Funds. The Trustees/Directors of the Funds, including all of the disinterested Trustees/Directors, have adopted written procedures tomonitor potential conflicts of interest that might develop between portfolios of the Funds (the “Feeder Portfolios”) thatinvest in certain series of DFAITC or DEM (the “Master Funds”).
Each Board has three standing committees, an Audit Committee, a Nominating Committee, and an InvestmentStrategy Committee (the “Strategy Committee”). The Audit Committee is composed of George M. Constantinides,Roger G. Ibbotson, Abbie J. Smith and Ingrid M. Werner. Each member of the Audit Committee is a disinterestedTrustee/Director. The Audit Committee oversees the Fund’s accounting and financial reporting policies and practices,the Fund’s internal controls, the Fund’s financial statements and the independent audits thereof and performs otheroversight functions as requested by the Board. The Audit Committee recommends the appointment of each Fund’sindependent registered certified public accounting firm and acts as a liaison between the Fund’s independentregistered certified public accounting firm and the full Board. There were two Audit Committee meetings held duringthe fiscal year ended October 31, 2020.
Each Board’s Nominating Committee is composed of George M. Constantinides, Roger G. Ibbotson, Myron S.Scholes, Abbie J. Smith, Douglas W. Diamond, Darrell Duffie and Ingrid M. Werner. Each member of the NominatingCommittee is a disinterested Trustee/Director. The Nominating Committee for each Board makes recommendationsfor nominations of disinterested and interested members on the Board to the disinterested Board members and to thefull Board. The Nominating Committee evaluates a candidate’s qualification for Board membership and theindependence of such candidate from the Advisor and other principal service providers. The Nominating Committeedid not meet during the fiscal year ended October 31, 2020.
Each Board’s Strategy Committee is composed of Gerard K. O’Reilly, Douglas W. Diamond, Myron S. Scholes andDarrell Duffie. The Strategy Committee assists the Board in carrying out its fiduciary duties with respect to theoversight of the Fund and its performance. At the request of the Board or the Advisor, the Strategy Committee (i)reviews the design of possible new series of the Fund, (ii) reviews performance of existing portfolios of the Funds anddiscusses and recommends possible enhancements to the portfolios’ investment strategies, (iii) reviews proposalsby the Advisor to modify or enhance the investment strategies or policies of each portfolio, and (iv) considers issuesrelating to investment services for each portfolio of the Fund. There were three Strategy Committee meetings heldduring the fiscal year ended October 31, 2020.
Certain biographical information for each disinterested Trustee/Director and interested Trustee/Director of the Fundsis set forth in the tables below, including a description of each Trustee/Director’s experience as a Trustee/ Directorof the Funds and as a Director or Trustee of other funds, as well as other recent professional experience.
The statements of additional information (together, “SAI”) of the Funds include additional information about eachTrustee/Director. You may obtain copies of the SAI and prospectus of each Fund advised by Dimensional FundAdvisors LP by calling collect (512) 306-7400 or by mailing a request to Dimensional Fund Advisors LP, 6300 BeeCave Road, Building One, Austin, TX 78746. Prospectuses are also available at http://us.dimensional.com.
83

Disinterested Directors
Name, Address and Year of Birth Position
Term of Office1 and Length of
Service Principal Occupation During Past 5 Years
Portfolios within the DFA Fund Complex2 Overseen
Other Directorships of
Public Companies Held
During Past 5 Years
George M. Constantinides University of Chicago Booth School of Business 5807 S. Woodlawn Avenue Chicago, IL 60637
1947
Director DFAIDG - Since 1983; DIG & DEM – Since 1993; DFAITC – Since 1992
Leo Melamed Professor of Finance, University of Chicago Booth School of Business (since 1978).
132 portfolios in 5 investment companies
None
Douglas W. Diamond c/o Dimensional Fund Advisors LP 6300 Bee Cave Road, Building One Austin, TX 78746
1953
Director Since 2017 for the Funds
Merton H. Miller Distinguished Service Professor of Finance, University of Chicago Booth School of Business (since 1988). Visiting Scholar, Federal Reserve Bank of Richmond (since 1990). Formerly, Fischer Black Visiting Professor of Financial Economics, Alfred P. Sloan School of Management, Massachusetts Institute of Technology (2015 to 2016).
132 portfolios in 5 investment companies
None
Darrell Duffie c/o Dimensional Fund Advisors LP 6300 Bee Cave Road, Building One Austin, TX 78746
1954
Director Since March 2019 for the Funds
Dean Witter Distinguished Professor of Finance, Graduate School of Business, Stanford University (since 1984).
132 portfolios in 5 investment companies
Formerly, Director, Moody’s Corporation (financial information and information technology) (2008- April 2018).
Roger G. Ibbotson Yale School of Management 165 Whitney Avenue New Haven, CT 06511
1943
Director DFAIDG - Since 1981; DIG & DEM – Since 1993; DFAITC – Since 1992
Professor in Practice Emeritus of Finance, Yale School of Management (since 1984). Chairman and Partner, Zebra Capital Management, LLC (hedge fund and asset manager) (since 2001). Formerly, Consultant to Morningstar, Inc. (2006 - 2016).
132 portfolios in 5 investment companies
None
Myron S. Scholes c/o Dimensional Fund Advisors LP 6300 Bee Cave Road, Building One Austin, TX 78746
1941
Director DFAIDG - Since 1981; DIG & DEM – Since 1993; DFAITC – Since 1992
Chief Investment Strategist, Janus Henderson Investors (since 2014). Frank E. Buck Professor of Finance, Emeritus, Graduate School of Business, Stanford University (since 1981).
132 portfolios in 5 investment companies
Formerly, Adviser, Kuapay, Inc. (2013-2014). Formerly, Director, American Century Fund Complex (registered investment companies) (43 Portfolios) (1980-2014).
84

Name, Address and Year of Birth Position
Term of Office1 and Length of
Service Principal Occupation During Past 5 Years
Portfolios within the DFA Fund Complex2 Overseen
Other Directorships of
Public Companies Held
During Past 5 Years
Abbie J. Smith University of Chicago Booth School of Business 5807 S. Woodlawn Avenue Chicago, IL 60637
1953
Director Since 2000 for the Funds
Boris and Irene Stern Distinguished Service Professor of Accounting, University of Chicago Booth School of Business (since 1980).
132 portfolios in 5 investment companies
Director (since 2000) and formerly, Lead Director (2014-2017), HNI Corporation (office furniture); Director, Ryder System Inc. (transportation, logistics and supply-chain management) (since 2003); and Trustee, UBS Funds (3 investment companies within the fund complex) (19 portfolios) (since 2009).
Ingrid M. Werner c/o Dimensional Fund Advisors LP 6300 Bee Cave Road, Building One Austin, TX 78746
1961
Director Since March 2019 for the Funds
Martin and Andrew Murrer Professor of Finance, Fisher College of Business, The Ohio State University (since 1998). Adjunct Member, the Prize Committee for the Swedish Riksbank Prize in Economic Sciences in Memory of Alfred Nobel (annual award for significant scientific research contribution) (since January 2018). President, Western Finance Association (global association of academic researchers and practitioners in finance) (since June 2018). Director, American Finance Association (global association of academic researchers and practitioners in finance) (since January 2019). Member, Economic Advisory Committee, FINRA (since 2017). Chairman, Scientific Advisory Board, Swedish House of Finance (institute supporting academic research in finance) (since 2014). Member, Scientific Board, Danish Finance Institute (institute supporting academic research in finance) (since 2017). Member, Academic Board, Mistra Financial Systems (organization funding academic research on environment, governance and climate/sustainability in finance) (since 2016). Fellow, Center for Analytical Finance (academic research) (since 2015). Associate Editor, Journal of Finance (since 2016).
132 portfolios in 5 investment companies
Director, Fourth Swedish AP Fund (pension fund asset management) (since 2017).
85

Interested Director
The following interested Director is described as such because he is deemed to be an “interested person,” as that term is defined under the 1940 Act, due to his position with the Advisor.
Name, Address and Year of
Birth Position
Term of Office1 and Length of
Service Principal Occupation During Past 5 Years
Portfolios within the DFA Fund Complex2
Overseen
Other Directorships of Public Companies Held During Past 5
Years David G. Booth 6300 Bee Cave Road, Building One Austin, TX 78746
1946
Chairman and Director
DFAIDG - Since 1981; DIG & DFAITC – Since 1992; DEM – Since 1993
Chairman, Director/Trustee, and formerly, President and Co-Chief Executive Officer (each until March 2017) of “DEM, DFAIDG, “DIG and DFAITC. Executive Chairman, and formerly, President and Co-Chief Executive Officer (each until February 2017) of Dimensional Holdings Inc., Dimensional Fund Advisors LP, Dimensional Investment LLC and DFA Securities LLC (collectively with DEM, DFAIDG, DIG and DFAITC, the “DFA Entities”). Formerly, Chairman and Director (2009-2018) and Co-Chief Executive Officer (2010 – June 2017) of Dimensional Fund Advisors Canada ULC. Trustee, University of Chicago (since 2002). Trustee, University of Kansas Endowment Association (since 2005). Member of Hoover Institution Board (since September 2019). Formerly, Director of Dimensional Fund Advisors Ltd. (2002 – July 2017), DFA Australia Limited (1994 – July 2017), Dimensional Advisors Ltd. (2012 – July 2017), Dimensional Funds plc (2006 – July2017) and Dimensional Funds II plc (2006 – July2017). Formerly, Director and President ofDimensional Japan Ltd. (2012 – April 2017).Formerly, President, Dimensional SmartNest (US)LLC (2009-2014); and Limited Partner, VSCInvestors, LLC (2007-2015). Formerly, Chairman, Director, President and Co-Chief Executive Officer ofDimensional Cayman Commodity Fund I Ltd. (2010-September 2017).
132 portfolios in 5 investment companies
None
1 Each Director holds office for an indefinite term until his or her successor is elected and qualified.
2 Each Director is a director or trustee of each of the five registered investment companies within the DFA Fund Complex, which include: DFAIDG; DIG; DFAITC; DEM; and Dimensional ETF Trust. Each disinterested Director also serves on the Independent Review Committee of the Dimensional Funds, mutual funds registered in the provinces of Canada and managed by the Advisor’s affiliate, Dimensional Fund Advisors Canada ULC.
86

4163938v.6
Officers
Below is the name, year of birth, information regarding positions with the Funds and the principal occupation for each officer of the Funds. The address of each officer is 6300 Bee Cave Road, Building One, Austin, TX 78746. Each of the officers listed below holds the same office (except as otherwise noted) in the DFA Entities.
Name and Year of Birth Position
Term of Office1 and Length of
Service Principal Occupation During Past 5 Years Valerie A. Brown 1967
Vice President and Assistant Secretary
Since 2001 Vice President and Assistant Secretary of o all the DFA Entities (since 2001) o DFA Australia Limited (since 2002) o Dimensional Fund Advisors Ltd. (since 2002) o Dimensional Cayman Commodity Fund I Ltd. (since 2010) o Dimensional Fund Advisors Pte. Ltd. (since 2012) o Dimensional Hong Kong Limited (since 2012) o Dimensional ETF Trust (since June 2020)
Director, Vice President and Assistant Secretary (since 2003) of o Dimensional Fund Advisors Canada ULC
Ryan P. Buechner 1982
Vice President and Assistant Secretary
Since September 2019
Vice President and Assistant Secretary of o DFAIDG, DIG, DFAITC and DEM (since September 2019) o Dimensional ETF Trust (since June 2020)
Vice President (since January 2018) of o Dimensional Holdings Inc. o Dimensional Fund Advisors LP o Dimensional Investment LLC o DFA Securities LLC
David P. Butler 1964
Co-Chief Executive Officer
Since 2017 Co-Chief Executive Officer of o all the DFA entities (since 2017) o Dimensional ETF Trust (since June 2020)
Director (since 2017) of o Dimensional Holdings Inc. o Dimensional Fund Advisors Canada ULC o Dimensional Japan Ltd. o Dimensional Advisors Ltd.o Dimensional Fund Advisors Ltd. o DFA Australia Limited
Director and Co-Chief Executive Officer (since 2017) of o Dimensional Cayman Commodity Fund I Ltd.
Head of Global Financial Advisor Services (since 2007) for o Dimensional Fund Advisors LP
Formerly, Vice President (2007 – 2017) of o all the DFA Entities
Stephen A. Clark 1972
Executive Vice President
Since 2017 Executive Vice President of o all the DFA entities (since 2017) o Dimensional ETF Trust (since June 2020)
Director and Vice President (since 2016) of o Dimensional Japan Ltd.
President and Director (since 2016) of o Dimensional Fund Advisors Canada ULC
Vice President (since 2008) and Director (since 2016) of o DFA Australia Limited
Director (since 2016) of o Dimensional Advisors Ltd.
87

4163938v.6
Name and Year of Birth Position
Term of Office1 and Length of
Service Principal Occupation During Past 5 Years o Dimensional Fund Advisors Pte. Ltd. o Dimensional Hong Kong Limited
Vice President (since 2016) of o Dimensional Fund Advisors Pte. Ltd.
Formerly, Vice President (2004 – 2017) of o all the DFA Entities
Formerly, Vice President (2010 – 2016) of o Dimensional Fund Advisors Canada ULC
Formerly, Head of Institutional, North America (2012 – 2013) and Head of Global Institutional Services (2014-2018) for
o Dimensional Fund Advisors LP Randy Olson 1980
Chief Compliance Officer
Since August 2020
Chief Compliance Officer (since August 2020) o DFA Investment Dimensions Group Inc. o Dimensional Investment Group Inc. o The DFA Investment Trust Company o Dimensional Emerging Markets Value Fund
Chief Compliance Officer (since September 2020) o Dimensional ETF Trust
Formerly, Vice President – Senior Compliance Officer o Dimensional Investment Advisors LP (January 2020 – August 2020
and July 2014 – March 2017)
Formerly, Vice President – Head of Compliance & Operations Asia Ex-Japan o Dimensional Investment Advisors LP (April 2017 – January 2020)
Lisa M. Dallmer 1972
Vice President, Chief Financial Officer, and Treasurer
Since March 2020
Vice President, Chief Financial Officer, and Treasurer of o the DFA Fund Complex (since March 2020) o Dimensional ETF Trust (since June 2020)
Executive Vice President (since January 2020) o Dimensional Holdings Inc. o Dimensional Fund Advisors LP o Dimensional Investments LLC o DFA Securities LLC
Chief Operating Officer (since December 2019) o Dimensional Holdings Inc. o Dimensional Fund Advisors LP o Dimensional Investments LLC o DFA Securities LLC
Formerly, Interim Chief Financial Officer and Treasurer (April 2020 - September 2020)
o Dimensional Fund Advisors Canada ULC Jeff J. Jeon 1973
Vice President Since 2004 Vice President (since 2004) and Assistant Secretary (2017-2019) of o all the DFA Entities
Vice President (since June 2020) o Dimensional ETF Trust
Vice President and Assistant Secretary (since 2010) of o Dimensional Cayman Commodity Fund I Ltd.
Joy Lopez 1971
Vice President and Assistant Treasurer
Vice President since 2015 and
Assistant Treasurer since
2017
Vice President (since 2015) of o all the DFA Entities
Assistant Treasurer (since 2017) of o the DFA Fund Complex
Vice President and Assistant Treasurer (since June 2020)
88

4163938v.6
Name and Year of Birth Position
Term of Office1 and Length of
Service Principal Occupation During Past 5 Years o Dimensional ETF Trust
Formerly, Senior Tax Manager (2013 – 2015) for o Dimensional Fund Advisors LP
Kenneth M. Manell 1972
Vice President Since 2010 Vice President of o all the DFA Entities (since 2010) o Dimensional ETF Trust (since June 2020) o Dimensional Cayman Commodity Fund I Ltd. (since 2010)
Catherine L. Newell 1964
President and General Counsel
President since 2017 and
General Counsel since 2001
President of o the DFA Fund Complex (since 2017) o Dimensional ETF Trust (since June 2020)
General Counsel (since 2001) of o all the DFA Entities (since 2001) o Dimensional ETF Trust (since June 2020)
Executive Vice President (since 2017) and Secretary (since 2000) of o Dimensional Fund Advisors LP o Dimensional Holdings Inc. o DFA Securities LLC o Dimensional Investment LLC
Director (since 2002), Vice President (since 1997) and Secretary (since 2002) of o DFA Australia Limitedo Dimensional Fund Advisors Ltd.
Vice President and Secretary of o Dimensional Fund Advisors Canada ULC (since 2003) o Dimensional Cayman Commodity Fund I Ltd. (since 2010)o Dimensional Japan Ltd. (since 2012) o Dimensional Advisors Ltd (since 2012)o Dimensional Fund Advisors Pte. Ltd. (since 2012)
Director of o Dimensional Funds plc (since 2002) o Dimensional Funds II plc (since 2006) o Director of Dimensional Japan Ltd. (since 2012)o Dimensional Advisors Ltd. (since 2012)o Dimensional Fund Advisors Pte. Ltd. (since 2012)o Dimensional Hong Kong Limited (since 2012)o Dimensional Ireland Limited (since 2019)
Formerly, Vice President and Secretary (2010 – 2014) of o Dimensional SmartNest (US) LLC
Formerly, Vice President (1997 – 2017) and Secretary (2000 – 2017) of o the DFA Fund Complex
Formerly, Vice President of o Dimensional Fund Advisors LP (1997 – 2017) o Dimensional Holdings Inc. (2006 – 2017) o DFA Securities LLC (1997 – 2017) o Dimensional Investment LLC (2009 – 2017)
Carolyn L. O 1974
Vice President and Secretary
Vice President since 2010 and Secretary since
2017
Vice President (since 2010) and Secretary (since 2017) of o the DFA Fund Complex
Vice President and Secretary of o Dimensional ETF Trust (since June 2020)
Vice President (since 2010) and Assistant Secretary (since 2016) of o Dimensional Fund Advisors LP o Dimensional Holdings Inc. o Dimensional Investment LLC
89

4163938v.6
Name and Year of Birth Position
Term of Office1 and Length of
Service Principal Occupation During Past 5 Years
Vice President of o DFA Securities LLC (since 2010) o Dimensional Cayman Commodity Fund I Ltd. (since 2010)o Dimensional Fund Advisors Canada ULC (since 2016)
Gerard K. O’Reilly 1976
Co-Chief Executive Officer and Chief Investment Officer
Co-Chief Executive
Officer and Chief
Investment Officer since
2017
Co-Chief Executive Officer and Chief Investment Officer of o all the DFA Entities (since 2017) o Dimensional Fund Advisors Canada ULC (since 2017) o Dimensional ETF Trust (since June 2020)
Director, Chief Investment Officer and Vice President (since 2017) of o DFA Australia Limited
Chief Investment Officer (since 2017) and Vice President (since 2016) of o Dimensional Japan Ltd.
Director, Co-Chief Executive Officer and Chief Investment Officer (since 2017) of
o Dimensional Cayman Commodity Fund I Ltd.
Director of o Dimensional Funds plc (since 2014) o Dimensional Fund II plc (since 2014) o Dimensional Holdings Inc. (since 2017) o Dimensional Ireland Limited (since 2019)
Formerly, Co-Chief Investment Officer of o Dimensional Japan Ltd. (2016 – 2017) o DFA Australia Limited (2014 – 2017)
Formerly, Executive Vice President (2017) and Co-Chief Investment Officer (2014 – 2017) of
o all the DFA Entities
Formerly, Vice President (2007 – 2017) of o all the DFA Entities
Formerly, Vice President and Co-Chief Investment Officer (2014 – 2017) of o Dimensional Fund Advisors Canada ULC
Formerly, Director (2017 – 2018) of o Dimensional Fund Advisors Pte. Ltd.
James J. Taylor 1983
Vice President and Assistant Treasurer
Since March 2020
Vice President and Assistant Treasurer of o the DFA Fund Complex (since March 2020) o Dimensional ETF Trust (since June 2020)
Vice President (since 2016) of o Dimensional Holdings Inc. o Dimensional Fund Advisors LP o Dimensional Investment LLC o DFA Securities LLC
Formerly, Accounting Manager (2015-2016) o Dimensional Fund Advisors LP
1 Each officer holds office for an indefinite term at the pleasure of the Boards of Directors/Trustees and until his or her successor is elected and qualified.
90

VOTING PROXIES ON FUND PORTFOLIO SECURITIES
A description of the policies and procedures that the Fund uses in voting proxies relating to securities held in theportfolio is available (1) without charge, upon request, by calling collect: (512) 306-7400; (2) from the Advisor’swebsite at http://us.dimensional.com; and (3) on the SEC’s website at http://www.sec.gov. Information regarding howthe Advisor votes these proxies is available from the EDGAR database on the SEC’s website at http://www.sec.govand from the Advisor’s website at http://us.dimensional.com and reflects the twelve-month period beginning July 1stand ending June 30th.
91

NO
TIC
ETO
SH
AR
EH
OL
DE
RS
(Un
aud
ited
)
For
shar
ehol
ders
that
dono
thav
ean
Oct
ober
31,2
020
tax
year
end,
this
notic
eis
for
info
rmat
iona
lpur
pose
son
ly.F
orsh
areh
olde
rsw
ithan
Oct
ober
31,
2020
tax
year
end,
plea
seco
nsul
tyou
rta
xad
viso
ras
toth
epe
rtin
ence
ofth
isno
tice.
For
the
fisca
lyea
rN
ovem
ber
01,2
019
toO
ctob
er31
,202
0,ea
chP
ortfo
liois
desi
gnat
ing
the
follo
win
gite
ms
with
rega
rdto
dist
ribut
ions
paid
durin
gth
efis
cal
year
.A
llde
sign
atio
nsar
eba
sed
onfin
anci
alin
form
atio
nav
aila
ble
asof
the
date
ofth
isan
nual
repo
rtan
d,ac
cord
ingl
yar
esu
bjec
tto
chan
ge.
For
each
item
,it
isth
ein
tent
ion
ofth
eP
ortfo
lioto
desi
gnat
eth
em
axim
umam
ount
perm
itted
unde
rth
eIn
tern
alR
even
ueC
ode
and
the
regu
latio
nsth
ereu
nder
.The
fund
desi
gnat
esth
em
axim
umam
ount
allo
wab
leas
Sec
tion
199A
divi
dend
sas
defin
edin
Pro
pose
dTr
easu
ryR
egul
atio
n§1
.199
A-3
(d).
DFA
Inve
stm
ent
Dim
ensi
on
sG
rou
pIn
c.
Net
Inve
stm
ent
Inco
me
Dis
trib
uti
on
s
Sh
ort
-Ter
mC
apit
alG
ain
Dis
trib
uti
on
s
Lo
ng
-Ter
mC
apit
alG
ain
Dis
trib
uti
on
sR
etu
rno
fC
apit
alTa
x-E
xem
pt
Inte
rest
Tota
lD
istr
ibu
tio
ns
Qu
alif
yin
gF
or
Co
rpo
rate
Div
iden
ds
Rec
eive
dD
edu
ctio
n(1
)
Qu
alif
yin
gD
ivid
end
Inco
me
(2)
U.S
.G
ove
rnm
ent
Inte
rest
(3)
Fo
reig
nTa
xC
red
it(4
)
Fo
reig
nS
ou
rce
Inco
me
(5)
Qu
alif
yin
gIn
tere
stIn
com
e(6
)
Qu
alif
yin
gS
ho
rt-
Term
Cap
ital
Gai
n(7
)
VA
U.S
.Ta
rget
edV
alue
Por
tfolio
...
36%
11%
53%
——
100%
77%
85%
——
9%—
—V
AU
.S.
Larg
eV
alue
Por
tfolio
....
.66
%—
34%
——
100%
82%
86%
——
6%—
—V
AIn
tern
atio
nalV
alue
Por
tfolio
....
100%
——
——
100%
—71
%—
6%10
0%—
—V
AIn
tern
atio
nalS
mal
lPor
tfolio
....
69%
—31
%—
—10
0%—
56%
—6%
73%
——
VA
Sho
rt-T
erm
Fix
edP
ortfo
lio..
...
100%
——
——
100%
——
——
——
—V
AG
loba
lBon
dP
ortfo
lio..
....
....
100%
——
——
100%
——
——
——
—V
ITIn
flatio
n-P
rote
cted
Sec
uriti
esP
ortfo
lio..
....
....
....
....
....
100%
——
——
100%
——
——
——
100%
VA
Glo
balM
oder
ate
Allo
catio
nP
ortfo
lio..
....
....
....
....
....
75%
4%21
%—
—10
0%—
36%
——
——
—V
AE
quity
Allo
catio
nP
ortfo
lio..
....
72%
—28
%—
—10
0%—
26%
——
——
—
(1)
Qua
lifyi
ngD
ivid
ends
repr
esen
tsdi
vide
nds
that
qual
ifyfo
rth
eco
rpor
ate
divi
dend
sre
ceiv
edde
duct
ion
and
isre
flect
edas
ape
rcen
tage
ofor
dina
ryin
com
edi
strib
utio
ns(t
heto
talo
fsh
ort-
term
capi
talg
ain
and
net
inve
stm
ent
inco
me
dist
ribut
ions
).(2
)T
hepe
rcen
tage
inth
isco
lum
nre
pres
ents
the
amou
ntof
�Qua
lifyi
ngD
ivid
end
Inco
me�
ascr
eate
dby
the
Jobs
and
Gro
wth
Tax
Rel
ief
Rec
onci
liatio
nA
ctof
2003
and
isre
flect
edas
ape
rcen
tage
ofor
dina
ryin
com
edi
strib
utio
ns(t
heto
talo
fsh
ort-
term
capi
talg
ain
and
net
inve
stm
ent
inco
me
dist
ribut
ions
).P
leas
eno
teth
atth
ese
perc
enta
ges
are
desi
gnat
edon
ly,
refe
rto
your
1099
for
actu
alqu
alifi
eddi
vide
ndin
com
e.(3
)�U
.S.
Gov
ernm
ent
Inte
rest
�re
pres
ents
the
amou
ntof
inte
rest
that
was
deriv
edfr
omdi
rect
U.S
.G
over
nmen
tob
ligat
ions
and
dist
ribut
eddu
ring
the
fisca
lyea
r.T
his
amou
ntis
refle
cted
asa
perc
enta
geof
tota
lord
inar
yin
com
edi
strib
utio
ns(t
heto
talo
fsh
ort-
term
capi
talg
ain
and
net
inve
stm
ent
inco
me
dist
ribut
ions
).G
ener
ally
,in
tere
stfr
omdi
rect
U.S
.G
over
nmen
tob
ligat
ions
isex
empt
from
stat
ein
com
eta
x.(4
)�F
orei
gnTa
xC
redi
t�re
pres
ents
divi
dend
sw
hich
qual
ifyfo
rth
efo
reig
nta
xcr
edit
pass
thro
ugh
and
isre
flect
edas
ape
rcen
tage
ofin
vest
men
tco
mpa
nyta
xabl
ein
com
e.(5
)�F
orei
gnS
ourc
eIn
com
e�re
pres
ents
the
port
ion
ofdi
vide
nds
deriv
edfr
omfo
reig
nso
urce
s,an
dis
refle
cted
asa
perc
enta
geof
inve
stm
ent
com
pany
taxa
ble
inco
me.
(6)
The
perc
enta
gein
this
colu
mn
repr
esen
tsth
eam
ount
of�Q
ualif
ying
Inte
rest
Inco
me�
ascr
eate
dby
The
Am
eric
anJo
bsC
reat
ion
Act
of20
04.
The
info
rmat
ion
isre
flect
edas
ape
rcen
tage
ordi
nary
inco
me
dist
ribut
ions
(the
tota
lof
shor
t-te
rmca
pita
lgai
nan
dne
tin
vest
men
tin
com
edi
strib
utio
ns).
(7)
The
perc
enta
gein
this
colu
mn
repr
esen
tsth
eam
ount
of�Q
ualif
ying
Sho
rt-T
erm
Cap
italG
ain�
ascr
eate
dby
The
Am
eric
anJo
bsC
reat
ion
Act
of20
04.
The
info
rmat
ion
isre
flect
edas
ape
rcen
tage
ofor
dina
ryin
com
edi
strib
utio
ns(t
heto
talo
fsh
ort-
term
capi
talg
ain
and
net
inve
stm
ent
inco
me
dist
ribut
ions
).
92


DFA103120-004A00253045