dewey - agricultural economics extension : rural development
TRANSCRIPT

Dewey
The Importance of the Health Care Sector on the Economy of Dewey County, Oklahoma
Report Prepared by:
Fred C. Eilrich, Assistant Extension Specialist Cheryl F. St.Clair, Assistant Extension Specialist
Gerald A. Doeksen, Regents Professor and Extension Economist
Rural Development Oklahoma Cooperative Extension Service
Oklahoma State University 405-744-6081
Report Prepared for:
Oklahoma Rural Health Association, Gerald A. Doeksen, President Oklahoma Office of Rural Health, Val Schott, Director
August 2002
1
The Importance of the Health Care Sector on the Economy of Dewey County, Oklahoma
The delivery of health services in rural counties—including Dewey County—is changing
rapidly, thus, having the potential to greatly impact the availability of health care services in the
future. These changes, positive and negative, include:
• the movement to managed care that may cause (or require) patients to bypass local health
care services;
• reductions in Medicare and Medicaid payments to hospitals and providers that may force
a reduction in the provision of health care services;
• the creation of provider networks that may substantially change the delivery of and
access to local health care services;
• the use of telemedicine that could increase access to primary, consultative and specialty
health care services at the county level; and
• the development of critical access hospitals (new licensure care) that could help health
care services remain in rural counties.
The health care sector also can have a large economic impact on the local economy. For all of
these reasons, therefore, it is imperative that decision-makers in Dewey County become pro-
active in maintaining and revitalizing their local health care services.
To help local decision-makers understand this connection and its importance, this report
will discuss and demonstrate the relationship between the health sector and economic
development in Dewey County. Specifically, the report:
• discusses the role the health sector plays in rural development;
• presents information about the economic potential of the health sector for Dewey
County;

2
• discusses important trends and changes that are occurring in the health sector; and
• measures the employment, income, retail sales, and sales tax impact of the health
sector on the Dewey County economy.
HEALTH CARE CHANGES – WHAT THESE MEAN FOR DEWEY COUNTY
The huge changes occurring in the health care sector are having a substantial impact on
rural communities. Many rural people find it more difficult to get health care coverage,
insurance premiums are higher, and rural providers are reimbursed less than their urban
counterparts for doing the same work. At the same time, changes in urban health systems also
impact rural health care delivery, with the result that some rural communities are no longer in a
position to make decisions about their local health care.
Rapid increases in health care costs have been the driving force behind these changes.
For example, in 1970, the average amount spent annually on each person for health care (per
capita) was $348 and the typical family spent $175 per year on health care. By 2001, however,
the annual per individual (per capita) expenditure for health care had risen to over $5,000, and
the typical family spent nearly $3,600 for health insurance premiums, deductibles and co-pays.
Health care spending, which made-up approximately seven percent of the gross domestic product
(GDP) in 1970, was double (14.0 percent of the GDP) in 2001. The major purchasers of health
care services—employers and the federal government (through Medicare, Medicaid, and other
programs)—have little choice but to try to slow this rapid growth in health care expenditures.
Typically, rural communities pay little attention to their health care system until they
need it. As a result, many rural people have little idea of the non-medical importance of the
health care system to the local communities, such as its importance to the local economy, the
number of jobs it currently provides, and its potential to provide more jobs. To ensure that

3
health care services remain available locally, rural communities need to understand these non-
medical ramifications. First, rural communities need to learn about their own local health needs
and take stock or do an inventory of their local health care system. While the emphasis at the
national level is on controlling costs and eliminating duplication and overcapacity in the system
(de-licensing unused hospital beds, for example), the issues are very different in rural
communities.
One of the issues that underlie the differences between health care systems in rural and
urban areas is demographics. In rural areas there are proportionately more elderly, more children
living in poverty, higher unemployment and lower incomes. Rural people report poorer health
and more have chronic health conditions. Rural people are more likely to be uninsured and have
fewer health services available in the town where they live. Yet, they are more likely to derive
part of their income from the health care industry (either directly or indirectly). Another issue
that underlies the differences between urban and rural health care systems is the structure of the
systems themselves. In general, there are fewer providers and hospitals in rural areas, and these
and other providers operate fairly close to the margin. In fact, many rural hospitals operate at a
loss, with too few patients to cover daily operating costs. Also, until recently, most health care
had been locally operated and controlled. However, managed care has started to change this
aspect of the rural system.
Many people believe that managed care has not penetrated rural communities because
fewer rural people are enrolled in managed care plans. While this belief is mostly true, it can be
misleading. Indeed, managed care is having a significant impact on rural communities. First,
reimbursement levels by major payers have declined regardless of where care is delivered.
Second, rural providers are directly affected as more and more urban health care systems reach

4
out to rural areas. Whether the vehicle is commercial managed care plans or Medicaid managed
care plans, both rural and urban providers are being pushed toward coordination and
consolidation of health services. Various types of networks are being formed in rural areas,
ranging from loosely formed confederacies of providers to formal, incorporated entities that may
assume risk and act as an insurance company; and many of these networks have urban partners.
The Balanced Budget Act of 1997 (BBA) and the Balanced Budget Revised Act of 1999
(BBRA) contained several provisions that could have positive and negative effects on rural
communities. On the positive side, Congress included provisions that gradually increase
Medicare reimbursement levels in an effort to attract managed care plans to rural areas and to
make it easier for other rural managed care entities to form. These acts also included a children’s
health insurance program, which could provide assistance to rural uninsured low-income
children. On the down side, however, Congress allows states to implement the children’s
insurance program in selected geographic areas—a loophole that states could use to exclude rural
communities or delay implementation of the program in rural areas. Also on the negative side,
and in an effort to further contain costs, Congress changed reimbursement policies for nursing
homes and home health agencies which may ultimately harm rural patients, rural nursing homes,
and home health providers.
Pressures outside of the health care system also come into play in rural communities,
thereby creating stresses not applicable to urban systems. A re-emergence of the farm crisis—
driven primarily by low commodity prices—is undermining the financial viability of family
farms and businesses tied to farming, such as farm implement manufacturers and dealers.
Businesses located in rural areas tend to be small, often do not provide health insurance, and are
highly vulnerable to changing economic conditions. Although these stresses can lead to mental

5
and physical health problems, many people will not seek help for their health problems. Some
will say they have little time to seek out health care services, especially if they are working two
jobs to make ends meet; but for others, the strong sense of pride and self-reliance inherent among
rural people may preclude many from seeking care, especially if they cannot afford it.
What is the ultimate impact of all these changes and stresses on rural communities? Will
it be a net gain or net loss, or will it all balance out in the end?
On the positive side, urban-based specialists may set up periodic office hours in rural
clinics, health centers and hospitals; an urgent care center may open; and air medivac helicopters
and other emergency medical services may be strategically located in a rural community. These
services, while provided by urban health systems, are convenient for rural residents, which
otherwise may not be available to rural communities.
On the negative side, ties with urban and financially strong health care providers can be
detrimental to rural providers if the rural providers lose decision-making responsibility. Rural
providers may also find themselves aligned with an organization that does not share their mission
and values, or the rural provider may be unable to meet the expectations of the larger provider.
Anecdotal evidence suggests that the downsides can be significant and the potential for
rural disaster great. Rural clinics and hospitals have been purchased by urban or other outside
interests and then closed because they did not provide sufficient profit. Employers have signed
contracts with insurance plans, which push patients to the city for their health care, bypassing
local, more convenient services; emergency medical service providers have changed their service
areas or closed their doors. When urban health organizations encourage insured rural residents
to spend their health care dollars in the city rather than “buy local,” the economic impact can be
astounding, and worse yet, many rural communities are surprised to learn that neither the

6
community nor local health providers have any control over what is happening. The net result is
loss of control and loss of health dollars within the local community.
Rural communities need to overcome inertia and take stock of local health care. Rural
providers should be challenged to organize into systems, whether through formal or informal
mechanisms, so they can compete with urban systems and function as a united front to offset
dominant urban interests. In general, regional strategies will probably work better than local
ones. Providers must be willing to take risk and coordinate services.
Well-positioned rural health systems can meet these challenges head on. Fragmentation
is a big problem in health systems, but rural systems, which are smaller and interdependent, have
more opportunity to create linkages. The scarce resources available to rural health have yielded
innovation and efficiencies simply to survive. Strong local leadership helps sustain these
systems. Many rural health organizations are committed to fiscal accountability expressed as
quality health care at low cost. It should not be too difficult to remind rural residents of the long-
term commitment these rural providers have made in the communities they serve. In time, rural
providers need to offer health care services which best meets community need.
Success in meeting these challenges can be measured in terms of increased local services,
more local spending on health care, local control of their own health resources, success in
fending off larger urban systems, negotiation of good reimbursement rates and high levels of
community satisfaction with local health care.
If rural health providers do not act, they will lose jobs, rural communities will lose health
care services, and everybody will lose local control of their health care.

7
HEALTH SERVICES AND RURAL DEVELOPMENT
The nexus between health care services and rural development is often overlooked. At
least three primary areas of commonality exist. A strong health care system can help attract and
maintain business and industry growth, and attract and retain retirees. A strong health care
system can also create jobs in the local area.
Table 1 Services that Impact Rural Development
Type of Growth Services Important to Attract Growth
Industrial and Business
Health and Education
Retirees
Health and Safety
Business and Industry Growth
Studies have found that quality-of-life (QOL) factors are playing a dramatic role in
business and industry location decisions. Among the most significant of those QOL variabilities
are health care services, which is important for at least three reasons. First, as noted by a
member of the Board of Directors of a community economic development corporation, good
health and education services are imperative to industrial and business leaders as they select a
community for location. Employees and participating management may offer strong resistance if
they are asked to move into a community with substandard or inconveniently located health
services.
Secondly, when a business or industry makes a location decision, it wants to ensure that
the local labor force will be productive, and a key factor in productivity is good health. Thus,
investments in health care services can be expected to yield dividends in the form of increased
labor productivity.

8
The cost of health care services is the third factor that is considered by business and
industry in development decisions. A 1990 site selection survey concluded that corporations are
taking a serious look at health care costs. Sites that provide health care services at a low cost are
sometimes given priority. In fact, 17 percent of the respondents indicated that their companies
used health care costs as a tie-breaking factor between comparable sites (Lyne, 1990).
Health Services and Attracting Retirees
A strong and convenient health care system is important to retirees, a special group of
residents whose spending and purchasing can be a significant source of income for the local
economy. Many rural areas have environments (e.g., moderate climate and outdoor activities)
that enable them to be in a good position to attract and retain retirees. The amount of spending
embodied in this population, including the purchasing power associated with Social Security,
Medicare, and other transfer payments, is substantial. Additionally, middle and upper income
retirees often have substantial net worth. Although the data are limited, several studies suggest
health services may be a critical variable that influences the location decision of retirees. For
example, one study found that four items were the best predictors of retirement locations: safety,
recreational facilities, dwelling units, and health care. Another study found that nearly 60
percent of potential retirees said health services were in the “must have” category when
considering a retirement community. Only protective services were mentioned more often than
health services as a “must have” service.
Health Services and Job Growth
A factor important to the success of rural economic development is job creation.
Nationally, employment in health care services increased by 32 percent from 1990 to 2001, and
by more than 225 percent since 1970 (Table 2). In rural areas, employment in health-related

9
services often accounts for 10 to 15 percent of total employment. This is reflected in the fact that
the hospital is often the second largest employer in a rural community.
It is also important to note that the health sector is a growing sector. Table 2 shows how
health services, as a share of gross domestic product (GDP), have increased over time. In 1970,
Americans spent $73.1 billion on health care, which accounted for 7.0 percent of the GDP. In
2001, health care costs ballooned to over $1.4 trillion, or 14.0 percent of the GDP. If current
trends continue, it will not be long before Americans will be spending more than 18 percent of
GDP on health care. Capturing this economic growth can only help a rural community.
Table 2
National Health Expenditures and Employment Data 1970-2001
Year
Total Expenditures ($$ Billions)
Per Capita Expenditures
($$)
Expenditures as a Percent
of GDP
Employment in Health Sector
(000 Jobs)
Annual Increase in
Employment
1970 $ 73.1 $348 7.0 3,052 1980 245.8 1,067 8.8 5,278 7.3% 1990 695.6 2,738 12.0 7,814 4.8% 1996 1,038.0 3,842 13.3 9,478 2.7% 1997 1,093.9 4,011 13.2 9,703 2.4% 1998 1,149.8 4,177 13.1 9,852 1.5%1999 1,215.6 4,377 13.1 9,977 1.3%2000 1,299.5 4,637 13.2 10,096 1.2%2001 1,423.8 5,039 14.0 10,344 2.5%
SOURCES: Bureau of Labor Statistics; Bureau of Economic Analysis; Centers for Medicare & Medicaid Services, website: <http://cms.hhs.gov>
10
DETERMINING YOUR COMMUNITY’S ECONOMIC POTENTIAL FOR HEALTH CARE
So, how can your community take advantage of the economic benefits of health care? Do
you have a strong health care system that is well supported by the community, or are the health
care dollars from your community “out-migrating” to the next largest community? Do you want
to attract new businesses and residents to your area and expand your economic base? Active
participation in the health care decision-making process in your community-by-community
citizens and leaders can make a huge difference and, hopefully, reap the rewards economically
and health-wise for the entire community.
For 2001, the average annual per person expenditure on health care in the U.S. was
$5,039. The amount of this health spending retained by a rural community depends on several
factors and may have a potentially large and immediate impact on the local economy, the number
of jobs created, and the number of new residents moving into the community. The secondary
impact of increased health care spending, such as higher retail sales in non-health areas or new
housing starts, may also have a sizeable impact on the community.
Determining the Potential
How can you determine if health care is important or should be important to your
community’s economy? The first step is to determine what types of health services are used in
your community, and what the expenditures are for those services. Using Dewey County,
Oklahoma, Table 3 shows the 2001 per capita expenditures by major categories of health care.
The second column estimates the percent of the health care services that could be provided
locally. The third column estimates per capita medical expenditures for your community.
Column four shows the potential economic impact of providing those services in the local
community. (See Appendix A for a detailed description of how these numbers were derived.)

11
To achieve the total potential impact (figures shown in column four), multiply the per
capita expenditures by the service area’s population. In 2000, Dewey County, Oklahoma had an
estimated population of 4,743. By multiplying the hospital per capita expenditure of $964 by the
population of 4,743, the potential hospital expenditures for Dewey County are $4,572,252. The
same procedure is applied to the remaining categories. Therefore, the total potential health
expenditures for Dewey County are $15,485,895.
By comparing the potential impact with actual local data, your community can determine
how much health care is provided locally, and if there is an opportunity to expand these
offerings, thus bringing more health dollars into the local economy. For example, the hospital
will have an annual estimate of total billings. If this figure is below the potential, there may be
room to expand hospital services and retain more dollars in your community. Another example
is nursing homes, a service that can be provided completely within the service area. One simple
way to determine if local needs are being met is to see if there is a waiting list at the existing
facilities or if residents are using facilities outside the service area. If residents are going outside
the service area, then there is a potential to expand locally.
These estimates provide a starting point (albeit a somewhat crude one to be sure) to
measure the potential for health spending in rural communities. The most important caveat to
remember in this process is that health spending involves the use of goods and services, which
may not be produced locally. While laboratory and radiology services may be provided locally,
particularly if there is a large clinic or hospital in the community, other goods and services are
imported and provide little economic wealth to the community. This can include supplies,
equipment, drugs, and itinerant sub-specialist physicians.

12
Table 3 Estimated Potential Primary Care Expenditure
For Dewey County, Oklahoma 2001 1
Percent Primary Dewey County U.S. Per Primary Care Potential
Health Services Capita Care Per Capita Expenditures a Hospital Care $1,580 61% 2 $964 $4,572,252 Professional Services Physician/Clinical Services 1,099 75% 3 824 3,908,232 Dental Services 228 75% 3 171 811,053 Other Prof. Care 151 75% 3 113 535,959 Other Prof. Health Care 147 75% 3 110 521,730 Home Health Care 127 100% 4 127 602,361 Nursing Home Care 351 100% 4 351 1,664,793 Prescription Drugs 502 75% 3 377 1,788,111 Other Medical Products 187 75% 3 140 664,020 Gov’t Administration and Net Cost of Insurance 328 0% 6 0 0 Gov’t Public Health Activities 175 50% 7 88 417,384 Investment (Research) 164 0% 6 0 0 Total $5,039 65% 8 $3,265 $15,485,895
Numbered footnotes are presented in Appendix A. a Based on 2000 U.S. Census Estimates SOURCE: Bureau of Labor Statistics; Bureau of Economic Analysis; Centers for Medicare & Medicaid Services, 1970-2001, website: <http://cms.hhs.gov>
Very few rural communities have realized the full potential of local health care as an
economic and community development tool. Rural communities have an extraordinary
opportunity to shift the tide in their local economies and develop health care as a local business.
The “warms you twice” adage of wood chopping also can be applied to health care. Every health
care service provided locally benefits the rural community twice—first, it improves people’s
health, and second, it improves the health of the local economy.
13
What Do You Know About Your County?
To make informed decisions about the economic impact of health care on your
community, it is imperative that you understand the “who, what, where, when, and how” about
your community. The rest of the information in this report discusses county-specific information
that will help your community determine its “health impact.”
Demographics
Population information detailing race, age, education, and growth for Dewey County and
Oklahoma are presented in Table 4. Between 1990 and 2000, Oklahoma’s population increased
9.7 percent. Over that same period, Dewey County experienced a change of -14.6 percent,
compared to the trend from the previous decade (1980 to 1990) when the county population
changed -6.3 percent. In 2000, Dewey County population was 92.2 percent white, 4.6 percent
American Indian, 0.1 percent black, and 0.8 percent “other” (Asian Americans, Native
Hawaiians, Pacific Islanders, and all others). Approximately 2.3 percent indicated two or more
races while 2.7 percent of Dewey County were of Hispanic origin. These estimates show a slight
deviation from the state’s numbers. Population by age estimates revealed that 26.2 percent of the
population were age 19 and under, while 26.3 percent were age 60 years or older. Compared to
the state’s estimates, Dewey County has a larger proportion of older population.
Economic Indicators and Personal Income
Data presented in Table 5 give general observations of economic indicators for Dewey
County and the state. The 2001 average per capita income was $21,406 for the county compared
to $24,145 for Oklahoma. An estimated 16.8 percent of Dewey County’s population had
personal incomes below the poverty rate compared to the state rate of 16.1 percent. A more
detailed view of personal income is presented in Table 6. The data indicates that 66.2 percent of

14
total personal income for Dewey County came from total earnings (adjusted to place of
residence) with transfer payments contributing 23.1 percent. Of total transfer payments for
Dewey County in 2000, retirement and disability payments represented 36 percent and medical
payments 34.4 percent.
Employment
Estimated total employment for Dewey County was 1,917, with an unemployment rate of
2.7 percent compared to the state’s rate of 3.8 percent (Table 5). The distribution of
employment in Dewey County is provided in Figure 1. In 2001, Farm employment (31.9
percent) and Government and government enterprises (19.4 percent) were the leading
employment sectors.
Health and Health Sector Statistics
Health resources are summarized in Tables 7 and 8. These statistics demonstrate the
availability of physicians and health care services, and detail Medicare and Medicaid utilization.
Table 7 details the availability of selected medical providers. The rate of health service
providers in the county was less than the state in most categories. The Council on Graduate
Medical Education (COGME) established the goal of 60-80 primary care physicians per 100,000
population. By comparing the number of primary care physicians to the COGME goals, counties
can evaluate the availability of primary care physicians relative to need (based on population).
Based on the midpoint of 70 primary care physicians per 100,000 people, Dewey County has a
shortage of primary care physicians (COGME change needed of 0). However, the state COGME
rate of -1 indicates that there are enough primary care physicians to serve the overall population.
This suggests that the primary care physicians are not appropriately distributed. The rate of
EMTs (including intermediates) was 6.33 per 1,000 population and the rate of paramedics was

15
NA. In 2000, Dewey County was designated as a non- county health professional shortage area
(HPSA) and a full county medically underserved area (MUA).
Information concerning hospital admissions and Medicare and Medicaid enrollment are
detailed in Table 8. Critical health statistics such as TAN-F and food stamp recipients along
with infant mortality rates, births to teens, and child abuse cases are also shown. Dewey County
had a five-year average (1996-2000) infant mortality rate of 18.5 per 1,000 live births compared
to the state’s rate of 8.2. Approximately 0.7 percent of teens, age 15-17, or 7.3 per 1,000 gave
birth in Dewey County. This estimate compares to 32.2 births per 1,000 for the state. It was
estimated that 217 children under the age of 18 were receiving Medicaid. Compared to the state
rate, Dewey County has relatively less children receiving Medicaid. Data in Table 8 show total
Medicare enrollment for Dewey County was 1,005 residents, age 65 and older and 91 disabled
residents under age 65.
Health Sector Impact
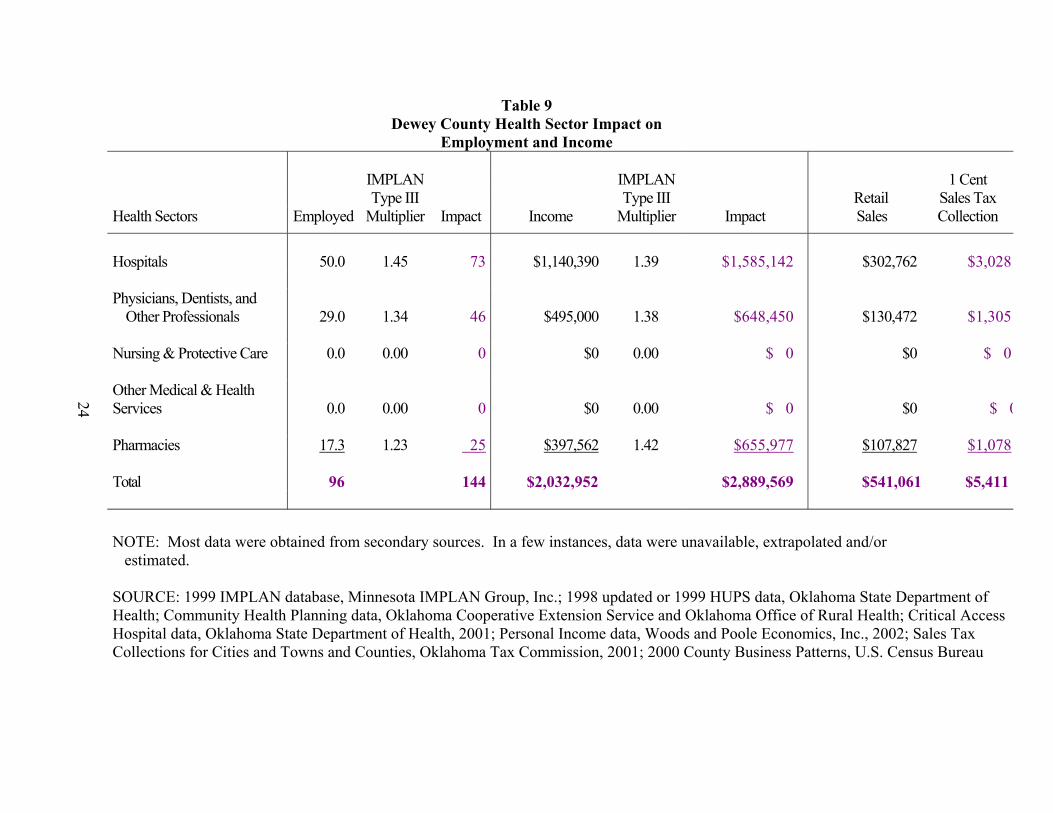
Table 9 reports the impact of the health sector on Dewey County. The most current data
available shows that the county’s health sector provides 96 jobs. Specifically, hospitals employ
50, while the offices of doctors, dentists, and other professionals employ 29 people. Nursing and
protective care facilities provide 0.0 jobs, while other medical and health services provide 0.0
jobs. Pharmacies in Dewey County provide 17.3 jobs. Total payroll for these 96 positions is
$2,032,952.
The employment and income levels in the health sector have a significant impact on
employment and income throughout other industries in Dewey County, as is demonstrated when
using the IMPLAN Type III Multiplier. For example, the employment multiplier for the hospital
sector in Dewey County is 1.45. This indicates that for each job created in the hospital sector,

16
another 0.45 jobs are created in other businesses and industries in Dewey County. The direct
impact of the 50 hospital employees in Dewey County results in an indirect and induced impact
of 23 additional jobs (50 x 0.45 = 23) throughout all businesses and industries in the county.
Thus, the hospital sector employment in Dewey County has a total impact on county
employment at a level of 73 jobs (50 x 1.45 = 73).
Likewise, the total impact of the $1,140,390 payroll for hospital employees can be
estimated. The income multiplier for the hospital industry in Dewey County is 1.39. This
multiplier indicates that for each one dollar of income generated in the hospital sector, another
$0.39 is generated in other businesses and industries in Dewey County. Thereby, the estimated
total impact on income throughout all businesses and industries in the county is $1,585,142
($1,140,390 x 1.39 = $1,585,142).
Following these same procedures, the total employment and income impacts throughout
the county from the other health sector categories can also be estimated. The total employment
impact of Dewey County’s health sector is an estimated 144 jobs for the county’s economy.
The health sector income results in a total county income impact of $2,889,569.
County data indicates that 19.1 percent of personal income is spent in retail stores that
collect sales tax. Thus, $541,061 ($2,889,569 x 19.1) is the total retail sales generated from the
health sector. A one-cent sales tax generates $5,411 for the county.

17
Table 4 Selected Demographic Data for Dewey County and the
State of Oklahoma
Selected Item Dewey County Percent State Percent
Population Growth (1980-90) 5,922-5,551 -6.3 4.0 Population Growth (1990-00) 5,551-4,743 -14.6 9.7 Population Growth (1980-00) 5,922-4,743 -19.9 14.1 Population by Race (2000)
White 4,371 92.2 76.2 Black 6 0.1 7.6 American Indian1 220 4.6 7.9 Other2 38 0.8 3.8 Two or more races3 108 2.3 4.5 Hispanic4 127 2.7 5.2
Population by Age (2000)
0 – 9 515 10.9 13.9 10-19 726 15.3 15.1 20-24 201 4.2 7.2 25-34 401 8.5 13.1 35-44 686 14.5 15.2 45-54 644 13.6 13.1 55-59 322 6.8 5.0 60-64 253 5.3 4.1 65-74 423 8.9 7.0 75-84 367 7.7 4.5
85+ 205 4.3 1.7
Population Projections: Year 2005 = 4,712 Year 2010 = 4,700 Year 2015 = 4,684
1Native American includes American Indians and Alaska Natives 2Other is defined as Asian Americans, Native Hawaiians, Pacific Islanders and all others. 3Two or more races indicate a person is included in more than one race group. 4Hispanic population is not a race group but rather a description of ethnic origin; Hispanics are
included in all four race groups. SOURCE: U.S. Census, Woods and Poole Economics, Inc. 2002 State Profile.

18
Table 5 Economic Indicators for Dewey County, the
State of Oklahoma and the Nation
Indicator County State Nation
Total Personal Income (2001)1 $101,291,664 $84,049,891,783 $8,541,068,616,916
Per Capita Income (2001) $21,406 $24,145 $29,985
Employment (2001) 1,917 1,601,917 NA
Unemployment (2001) 55 63,507 NA
Unemployment Rate (2001) 2.7% 3.8% 4.8%
Poverty Rate (1998)1 16.8% 16.1% 12.7%
Transfer Dollars (2001)1 $20,857,297 $13,107,079,560 $1,116,837,268,785
Transfer Dollars as percentage of Total Personal Income (2001) 20.6% 15.6% 13.1%
1 Definitions are in Appendix B, Glossary of Terms NA: Not Applicable SOURCE: Woods and Poole Economics, Inc. 2002 State Profile, Oklahoma Employment Security Commission, U.S. Census Bureau.

19
Table 6 Personal Income Data for Dewey County,
The State of Oklahoma, and the Nation, 2000 and 2001
County County State Nation Source Total Percent Percent Percent
Total Personal Income1 (2001) $101,291,664
Earnings by Place of Residence2 (2001) $55,391,564 66.2% 70.6% 72.4% Transfer Payments (2001) $20,857,297 23.1% 15.0% 13.1% Total Earnings3 (2001) $49,817,839 Wages and Salaries (2001) $28,351,482 56.9% 74.1% 79.5% Proprietors’ Income (2001) $17,184,279 34.5% 16.3% 11.7% Other Labor Income (2001) $4,282,078 8.6% 9.6% 8.8% Transfer Payments (2000) $19,976,000 Retirement and Disability (2000) $9,393,000 36.0% 43.0% 39.7% Medical Payments (2000) $7,383,000 34.4% 35.7% 39.5% Other (2000) $3,200,000 16.0% 21.4% 20.7%
1 Definitions are in Appendix B, Glossary of Terms 2 Total earnings adjusted to reflect earnings by place of residence. 3 Total earnings by place of work. SOURCE: Bureau of Economic Analysis (2000 Data) and Woods and Poole Economics, Inc. 2002 (2001 Data)

20
Figure 1.
Employment by Sector for DEWEY County
Retail Trade11.3%
Government19.4%
Health Services3.2%
Farm Employm31.9%
Mining4.3%
Transportation3.4%
Ag Services (Other)2.2%
Manufacturing2.3%
Construction3.3% Wholesale Trade
2.1%
Finance, Ins. & Real Estate
4.5%
Services (except Health)12.0%
County
Health
Farm Empl
Mining
Retail
Wholesale
Constru
Finance,
Services
Governme
Ag Servi
Manufact
Transport
DEWEY
96 954 128 339 62 98 135 359 580 67 68 102

21
Table 7 Availability of Selected Medical Providers
in Dewey County, Oklahoma
County County State
Provider Number Rate / 1,0001 Rate / 1,000
Hospitals (1998, 1999)2
Licensed Hospital Beds 18 3.8 n/a
Staffed Hospital Beds 18 3.8 n/a
Geriatric Day Services3
Number Licensed Patients (2000) 0 NA 709
Total Persons Served (2001) 0 NA 761
New Referrals (2001) 0 NA 402
Estimated Utilization4 12 NA 5,699
Nursing Homes (1998)
Beds 154 269 164
Health Care Practitioners
M.D.s (2000) 3 0.63 1.43
D.O.s (2000) 0 NA 0.28
Primary Care Physicians (2000) 3 0.63 0.70
COGME5,6 Midpoint (2000) 3 0 -1
Physician Assistants (1999) 0 NA 0.12
Dentists (1998) 0 NA 0.44
Emergency Medical Personnel (1999)
First Responders 27 5.69 0.22
EMT Basics & Intermediates 30 6.33 0.62
Paramedics 0 NA 0.34
Federally Designated Areas Designation
2000 Health Professional Shortage Areas (HPSAs) non-
2000 Medically Underserved Areas (MUAs) full

22
1 Rate/1000 based on appropriate year population estimates provided by Woods and Poole 2 Data presented is for hospitals reporting to HUPS for latest year available (1998, 1999). Total beds (licensed and staffed) may include long term care beds. 3 State rates are totals as rates are unavailable. 4 The need for adult day services is based on 15% of the age 65 and over population; estimated
utilization of adult day services is based on 1.25% of the age 65 and over population; based on research study by Halpert and Isbell, “Adult Day Care: Will it Work for the Community,” University of Missouri-Columbia.
5 COGME (Council on Graduate Medical Education) established the goal of 60-80 primary care physicians per 100,000 population; midpoint is based on 70 primary care physicians/100,000 population. 6 Rates indicate county and state changes needed to meet COGME recommendations NR: Not Reported NA: Not Applicable n/a: not available SOURCES:
Hospital Utilization and Plan Survey (1998, 1999), Oklahoma State Department of Health; Geriatric Day Services, DHS Annual Report 2001, Oklahoma Department of Human
Services; “A Community Development Guide for Adult Day Services,” Oklahoma Agricultural
Experiment Station, MP-142 “Directory of Oklahoma Licensed Long Term Care Facilities, Oklahoma State Department of
Health; Oklahoma Board of Medical Licensure and Supervision; Oklahoma Board of Osteopathic Examiners; “Physician Workforce 2000 Oklahoma,” Oklahoma State University, Center for Health
Sciences, Center for Health Policy Research; American Academy of Physician Assistants, 1999 Projections; American Dental Association; Emergency Medical Services Division, Oklahoma State Department of Health; Bureau of Primary Care, Human Resources and Services Administration, DHHS
<http://bphc.hrsa.gov>.

23
Table 8 Health Status and Health Indicators for Dewey
County and the State of Oklahoma
County County State Status or Indicator1 Number Percent/Rate Percent/Rate Hospital Admissions/Occupancy Rate (%) (1998, 1999) 490 34.0 n/a Medicare Enrollment (1999):
Aged (65 and over) 1,005 20.9 14.7 Disabled (Under 65) 91 1.9 2.0
Medicaid Enrollment (2000) Medicaid Eligible 397 8.3 12.6 Medicaid Served 380 95.7 92.7
Medicare Discharges (1998, 1999) 387 78.7 n/a Medicaid Discharges (1998, 1999) 24 4.9 n/a TAN-F Recipients (2001)2 12 0.3 1.0
Adult Recipients 0 0.0 0.3 Child Recipients 12 1.1 3.0
Food Stamps (persons) (2001) 171 3.6 7.4 Infant Mortality (1996-2000)2 4 18.5 8.2 Births to Teens (2000)3 1.0 7.3 32.2 Child Abuse Cases Confirmed (2001)4 8 7.2 15.0 Children Receiving Medicaid Ages 0-17 (2001) 217 20.5 30.0
1 Definitions are in Appendix B, Glossary of Terms 2 Number represents total resident live births and deaths for 5 year period; Rates displayed as
average annual rate per 1,000 live births 3 Number represents total resident live births to mothers age 15-17 rate displayed as births per
1,000 females (age 15-17). 4 Rates displayed as confirmations per 1,000 children under age 18. NR: Not Reported NA: Not Applicable n/a: not available SOURCES: Hospital Utilization and Plan Survey, Oklahoma State Department of Health; Centers for Medicare & Medicaid Services (CMS) <http://www.cms.hhs.gov> SoonerCare Program, Oklahoma Department of Human Services; DHS Annual Report 2000, Oklahoma Department of Human Services; Maternal Child Health Division, Oklahoma State Department of Health
24
Table 9 Dewey County Health Sector Impact on
Employment and Income
IMPLAN IMPLAN 1 Cent Type III Type III Retail Sales Tax
Health Sectors Employed Multiplier Impact Income Multiplier Impact Sales Collection
Hospitals 50.0 1.45 73 $1,140,390 1.39 $1,585,142 $302,762 $3,028 Physicians, Dentists, and
Other Professionals 29.0 1.34 46 $495,000 1.38 $648,450 $130,472 $1,305 Nursing & Protective Care 0.0 0.00 0 $0 0.00 $ 0 $0 $ 0 Other Medical & Health Services 0.0 0.00 0 $0 0.00 $ 0 $0 $ 0 Pharmacies 17.3 1.23 25 $397,562 1.42 $655,977 $107,827 $1,078 Total 96 144 $2,032,952 $2,889,569 $541,061 $5,411 NOTE: Most data were obtained from secondary sources. In a few instances, data were unavailable, extrapolated and/or estimated. SOURCE: 1999 IMPLAN database, Minnesota IMPLAN Group, Inc.; 1998 updated or 1999 HUPS data, Oklahoma State Department of Health; Community Health Planning data, Oklahoma Cooperative Extension Service and Oklahoma Office of Rural Health; Critical Access Hospital data, Oklahoma State Department of Health, 2001; Personal Income data, Woods and Poole Economics, Inc., 2002; Sales Tax Collections for Cities and Towns and Counties, Oklahoma Tax Commission, 2001; 2000 County Business Patterns, U.S. Census Bureau

25
NEXT STEPS
By documenting the importance of health care in attracting business and industry and
retirees, and for creating jobs and generating incomes, this report demonstrates the need for a
strong health sector in Dewey County. And, as the county’s health care sector continues to
change, local decision makers may find it necessary to seek assistance as they work to evaluate,
maintain, or expand the health sector. To this end, a resource team consisting of representatives
from the Oklahoma State Department of Health, the Oklahoma Office of Rural Health, the Area
Health Education Center (AHEC) in the community’s area, and the Oklahoma Cooperative
Extension Service is available to provide education and technical assistance. Two primary types
of assistance that may be most beneficial to the communities, both vital to maintaining a viable
health sector, are strategic health planning and feasibility studies.
Strategic Health Planning
Strategic health planning is a process that helps local communities identify their health
care needs; examine the social, economic, and political realities affecting the local delivery of
health care; determine what is wanted and what realistically can be achieved to meet their
identified health care needs; and develop and mobilize an action plan based on their analysis and
planning. Strategic health planning involves cooperation among people and organizations to
pursue common goals. The process is designed to answer three questions:
(1) Where is the community now?
(2) Where does the community want to go?
(3) How will the community get there?

26
For the strategic health planning process to be most effective, it must be based in the
community and driven by the community. Local residents and their leaders must participate—a
current knowledge of the health care industry is not necessary. This process is about local people
solving local problems. The local hospital and health care providers should have input into the
decision-making and should support and “trust” the outcomes, but not be the main force behind
the process. The community must provide the energy and commitment.
The strategic health planning process begins with a group of citizens of a community
becoming interested in reviewing and analyzing their health care system, when community
leaders can be mobilized to take action, and when a resource team or facilitating group can be
identified to assist the community to carry out the process. The resource team (described above)
will provide technical assistance that includes the development, presentation and analysis of data
and information, surveys, and health services and facilities. It also includes analytical skills,
facilitation skills, and strategic planning skills. Using a resource team can be extremely
beneficial to the community as the team is trained in the community development process, has
health sector expertise, and can bring in other agencies that may be able to provide special
technical assistance and other resources.
Over 20 counties or communities in Oklahoma have been involved in the strategic
planning process, which takes about nine months and is fairly labor intensive. However, the
outcomes have been worth the efforts—the entire community gets involved in the process and
positive changes are occurring.
Feasibility Studies
The strategic health planning process often identifies the need to provide a new health-
related service. For example, the community might determine they need adult daycare services

27
or an assisted living facility. Whatever the identified need, all relevant information must be
gathered and analyzed before action is initiated. Again, the resource team can be extremely
helpful in completing the feasibility study, which includes estimating the need for the service,
projecting capital and operating costs, and estimating profit or loss. Feasibility studies that
already have been completed include:
• Emergency Medical Services;
• Physicians;
• Rural Transportation;
• Adult Day Services;
• Free Clinics;
• Outpatient Rehabilitation; and
• Critical Access Hospitals.
CONCLUSION
If the local citizens and decision-makers are interested in strengthening their local health
care system, they are encouraged to contact a member of their state resource team. The team
members will help get the community started on strategic health planning and/or a feasibility
study. The resource team members can also provide other information such as other programs
available to the local community and other agencies that may be of assistance to the community.

28
SELECTED REFERENCES
Chirilos, Thomas N. and Gilbert Nostel (1985). “Further Evidence on the Economic Effects of Poor Health.” Review of Economics and Statistics. 67(1), 61-69.
Doeksen, Gerald A., Tom Johnson, Diane Biard-Holmes and Val Schott (1988). “A Healthy
Health Sector is Crucial for Community Economic Development.” Journal of Rural Health. Vol. 14, No. 1, pp. 66-72.
Lyne, Jack (1988). “Quality-of-Life Factors Dominate Many Facility Location Decision.” Site
Selection Handbook. (33) 868-870. Lyne, Jack (1990). “Health Care and Education: Important QOL Factors, But Who’s Accurately
Measuring Them?” Site Selection Handbook. 35(5), 832-838. McGuire T. (1986). On the Relationship Between Infrastructure and Economic Development.
Stoney Brook: State University of New York. Reginer, V. and L.E. Gelwicks (1981). “Preferred Supportive Services for Middle to Higher
Income Retirement Housing.” The Gerontologist. 21(1), 54-58. Scott, Loren C., Lewis H. Smith, and Brian Rungeling (1997). “Labor Force Participation in
Southern Rural Labor Markets.” American Journal of Agricultural Economics. 59(2), 266-274.
Toseland, R., and J. Rasch (1978). “Factors Contributing to Older Persons’ Satisfaction with
Their Communities.” The Gerontologist. 18(4), 395-402.

29
Appendix A
Footnotes for Table 3

30
Appendix A Footnotes for Table 3
1. See Table 2. The Health Care Financing Administration develops the per capita expenditure
for health care annually. Excepting for private insurance expenditure data (which is collected by HCFA through a survey), the data are secondary sources that are tabulated for other purposes. National health expenditures reported here include spending by type of expenditure (i.e., hospital care, physician care, dental care, and other professional care; home health; drugs and other medical non-durables; vision products and other medical durables; nursing home care and other personal health expenditures; plus non-personal expenditures for such items as public health, research, construction of medical facilities and administration); and by source of funding (e.g. private health insurance, out-of-pocket payments, and a range of public programs including Medicare, Medicaid and those operated by the Department of Veteran Affairs.)
2. This estimate is an extrapolation from Kentucky experience. Kentucky’s Medicaid program
offers a wider range of services than required by Medicaid. To restrain Medicaid cost increases, Kentucky established a primary care gatekeeper program several years ago. This program is thought to have an impact with respect to appropriate utilization of care, but is not felt to be fully effective. Kentucky Medicaid eligible may use health care more appropriately than individuals insured through commercial insurance plans. A 1996 study compared local to non-local use by 300,500 Medicaid eligible who reside in 49 rural counties in Southeast Kentucky. The aggregate of the 49 counties retained 61% of all hospital expenditures. Measuring by expenditure is important, particularly in hospital care, because tertiary care is far more expensive. This percent was applied to Table 3. Other examples of hospital expenditure retention include a large (50,000) rural county in the western part of Kentucky with two large hospitals. These hospitals reported an aggregate retention of 96% of all inpatient admissions (expenditure data were not available). A small, 71-bed hospital in a county with 17,000 people retained 64% of all admissions. A very large 288-bed hospital in a county of 30,000 retained 77% of all admissions. This county has as a large sub-specialty complement of physicians.
3. The federal Bureau of Primary Health Care (BPHC) required that applicants for
Community/Migrant Health Centers (C/MHC) grants (330 clinics) develop a needs assessment to justify staffing of the clinic with physicians, midlevels, dentists, optometrists, pharmacists, and other providers. To help support the needs assessment and assure consistency in needs assessment assumptions, BPHC provided a formula, based on age and sex of the service area population that derived the total number of all ambulatory care visits. The formula estimates that 75% of all ambulatory care visits would be to primary care physicians. Note that these estimates use visits as the denominator. The problem with applying use rates in Table 2 to estimate expenditure retention is that a visit to a sub-specialist costs more than a visit to the primary care provider. However, the difference in expenditure is not as great as comparing a hospital stay for a simple appendectomy with a hospital stay for open-heart surgery. The BPHC rate was applied here.
4. Home health care is low technology care and can easily be offered by rural-based providers.

31
5. Nursing home care is low technology care, yet very expensive. In Kentucky, the average
annual cost per patient excluding physician services and drugs is $35,000 per patient year. Nursing home costs may vary significantly by state. Nursing home care can easily be provided in any rural community.
6. Most insurance companies are located in urban areas. This figure also includes
administrative costs of federally financed health programs. 7. This includes the National Health Service Corps, Indian Health Service (IHS), Graduate
Medical Education funds, federal dollars that flow to local health departments; grant programs to communities, etc. The 50% potential expenditure retention is an estimate of the total U.S. value of these programs. This estimate could vary significantly in rural western and southwestern U.S. counties where there are large American Indian populations.
8. Potential expenditure retention is an estimate of the total U.S. value of these programs, which
may be absorbed, in rural communities. This estimate could vary significantly in rural western and southwestern states where there are fairly large rural American Indian populations.

32
Appendix B
Glossary of Terms

33
Appendix B Glossary of Terms
The Rural Health Works team recommended that a glossary be included at the end of the county report. Unless otherwise noted, definitions were adapted from the National Rural Health Association monograph “Rural Health Dictionary of Terms, Acronyms and Organizations,” 1997, Kansas City, Missouri. Balanced Budget Act (BBA): signed in 1997 by President Clinton, this omnibus legislative
package was primarily intended to balance the federal budget by 2002. This legislation contains major Medicare and Medicaid reforms, and a number of key rural health provisions. (RUPRI P98-4, August 25, 1998, p.ii)
Co-pay: a form of cost sharing in which a fixed amount of money is paid by the insured to a
provider practitioner or facility for each health care service provided. Critical access hospital (CAH): a program incorporated in provisions of the BBA which
provides options for rural hospital restructuring toward service delivery which more appropriately meets health care needs.
Deductible: the amount that an insured must pay before an insurer will assume any liability for
all or part of the remaining cost of covered services. Gross domestic product (GDP): the total output of goods and services produced by labor and
property located in the United States (Statistical Abstracts of the United States, 1994, U.S. Department of Commerce, p. 441).
Income multipliers: the estimated rate of impact each dollars worth of income generated in the
health care sector has on business and industries in the community (adapted from page 17 of sample county report).
Indirect impact: county jobs and income created in other sectors due to health business spending
money locally. Induced impact: county jobs and income created in other sectors due to health employees’
spending money locally. Managed care: a system of health care delivery that tries to manage the cost of health care, its
quality and access. Medicaid: state administered program, funded by state and federal governments, which provides
medical assistance to persons meeting local income and other eligibility criteria. Medicare: Federal national insurance program which covers certain health services for persons
over age 65 and other selected eligible persons.

34
Medicare + Choice: a new program where Medicare beneficiaries will have a choice of selecting to obtain Medicare benefits through a variety of health plan options rather than be limited to “traditional” Medicare (consolidated definition)
Personal income: income received by individuals from all sources. Poverty rate: percent of individuals who live at or below the federal poverty level. In 1998, the
federal poverty level of a family of four was $16,450. Primary care physicians: generally refers to family physicians, general practitioners,
obstetricians and gynecologists, and general internists. Primary care physicians provide the first level of comprehensive health care.
Proprietor’s Income: consists of current-production income of sole proprietorships and
partnerships and of tax-exempt cooperatives; generally presented in two parts: nonfarm proprietor’s income and farm proprietor’s income.
Prospective payment: any method of paying hospitals or other health programs in which
amounts or rates of payment are established in advance for a defined period. Provider network: formal affiliations of providers, organized and operated to provide an
integrated network of health care providers with which third parties, such as insurance companies, HMOs and others, may contract for health care services to covered individuals.
TAN-F (Transitional Assistance for Needy Families): the name given to the new welfare reform
program designed to reduce the number of families and individuals on assistance. This program replaces Aid for Families with Dependent Children (AFDC). (consolidated definition)
Telemedicine: the use of telecommunications to facilitate medical diagnosis, patient care and/or
distance learning. Transfer dollars: dollars flowing to individuals in the community as income or income subsidy
from state or federal sources, such as government payments for health care (Medicare and Medicaid), supplemental security income (SSI), social security and other retirement income, and TAN-F.
Type III employment multiplier: indicates total jobs created in the county due to one job in the
health sector. Type III income multiplier: indicates total income generated in the county due to one dollar
worth of income in the health sector.