development - pphe.com/media/files/p/pphe/downloads/annual report...30 key performance indicators...
TRANSCRIPT

S M A R T
D E V E L O P M E N T
Annual Report2014
PPHE H
otel Group A
nnual Report 2014

CREATING SHAREHOLDER VALUE BY BECOMING ONE OF THE LEADING HOTEL COMPANIES IN THE UPSCALE AND LIFESTYLE HOTEL SEGMENTS
We are an international hospitality management company, with a strong asset base and ownership of, and access to, world-class brands. Our vision is to realise growth potential and our primary objective is to create and realise shareholder value by becoming one of the leading hotel companies in the upscale and lifestyle hotel segments.
Our portfolio of owned, managed, leased and franchised hotels comprises 38 hotels, offering a total of over 8,300 guest rooms. Our development pipeline includes four new hotel projects, one hotel extension and reconfiguration and two rebranding projects. Our key markets are the United Kingdom, the Netherlands, Germany and Croatia.
pphe.com
Front cover artist’s impressions:
Left: new hotel development near London Waterloo Station
Right: Park Plaza Riverbank London with five-storey extension

Park Plaza Belvedere Medulin in Croatia
N E W I N 2 0 14
1

O U R H I G H L I G H T S
F I N A N C I A L
€270.4m+1 0 . 5 % T O TA L R E V E N U E
19p+ 3 5 . 7 % D I V I D E N D
P E R S H A R E 1
€105.2m +1 2 . 9 % E B I T D A R
€94.8m +1 4 . 6 % E B I T D A
€41.6m+ 5 2 . 5 % P R O F I T B E F O R E TA X
€32.9m + 5 0 . 4 % N O R M A L I S E D P R O F I T
B E F O R E TA X 2
€1.0+ 4 9 . 6 % E A R N I N G S P E R S H A R E
€0.79 + 4 6 . 8 % N O R M A L I S E D
E A R N I N G S P E R S H A R E 2
35.1% +1 3 0 B P S E B I T D A M A R G I N 3
€113.6 +1 2 . 0 % R E V PA R 4
83.7% + 3 0 0 B P S O C C U PA N C Y
€135.6 + 8 .1 % AV E R A G E R O O M R AT E
1 Including an interim dividend of 9p and a proposed final dividend of 10p per share. 2 See page 35. 3 EBITDA divided by total revenue.4 Revenue per available room.
2

B U S I N E S S
Successful divestment
Entered into 50:50 joint venture for two hotels in Berlin, Germany, while continuing to manage these
hotels under long-term management contracts
25-year milestone
Celebrated our 25-year journey since Eli Papouchado, the Company’s Chairman, acquired the first hotel
that is Park Plaza Eindhoven today
Completed €24.0m refinancing
Completed €24.0 million refinancing for art’otel amsterdam which opened in 2013
Building 1,023 roomsConstruction commenced at
three hotels in London and one in Nuremberg
Secured £80.0m development loan
Secured up to £80.0 million loan to develop new hotel near London Waterloo Station
Record guest satisfaction
Achieved a record guest satisfaction level of 8.36 on a scale of 1–10
Appointed Deputy CEO
Promoted Chen Moravsky to Deputy CEO to assist with the Company’s next stage of growth
Record service levels
Delivered record service levels as rated by our guests, of 8.62 on a scale of 1–10
Opened 4th Park Plaza in Croatia
Opened the fully refurbished Park Plaza Belvedere Medulin in Croatia with 427 rooms, our fourth Park
Plaza hotel in this market
Record employee satisfaction
Recorded an all-time high employee satisfaction score of 83.5% on a scale of 1–100
3

C O N T E N T S6OUR BUSINESS AT A GLANCE
With a history dating back to 1989, we are an international, dynamic hospitality company with a strong asset base and ownership of, and access to, world-class brands
12CHAIRMAN’S STATEMENT
Record revenue, increased operating profit and improved earnings per share
32DEPUTY CEO AND CFO’S STATEMENT
Our overall underlying trading performance improved year on year
50CORPORATE SOCIAL RESPONSIBILITY
Our social and environmental considerations have been integrated into our hotel management operations
14CEO’S STATEMENT
2014 has been a very exciting year for us, with many highlights, records and progress made on our new developments
20STRATEGY
We have been able to deliver clear progress across our six core strategic objectives
4

Strategic report
6 Our business at a glance12 Chairman’s statement 14 Chief Executive Officer’s statement20 Strategy22 Business model30 Key performance indicators 32 Deputy Chief Executive Officer &
Chief Financial Officer’s statement 40 Review of the year 50 Corporate Social Responsibility
Governance
54 Board of Directors 56 Directors’ report60 Corporate governance65 Report of the Audit Committee67 Report of the Remuneration Committee
and Directors’ Remuneration Report
Financial statements
70 Independent auditor’s report71 Consolidated statement of financial position72 Consolidated income statement73 Consolidated statement of comprehensive
income74 Consolidated statement of changes in equity75 Consolidated statement of cash flows77 Notes to Consolidated financial statements117 Appendices to Consolidated financial
statements119 Glossary121 Current and committed projects122 Contacts
C O N T E N T S
54DIRECTORS’ REPORT AND GOVERNANCE
Principal risks, largest shareholders and corporate governance
30KEY PERFORMANCE INDICATORS
Financial and operating key performance indicators
69FINANCIAL STATEMENTS
Auditor’s report, Consolidated financial statements and appendices
22BUSINESS MODEL
We create shareholder value through a variety of business models, each with their own merits
5

A DY N A M I C H O S P I TA L I T Y C O M PA N Y
DURING THE LAST 25 YEARS, PPHE HOTEL GROUP HAS BECOME AN INTERNATIONAL, DYNAMIC HOSPITALITY COMPANY, WITH A STRONG ASSET BASE AND OWNERSHIP OF, AND ACCESS TO, WORLD-CLASS BRANDS INCLUDING AN EXCLUSIVE BRAND LICENCE FROM CARLSON, ONE OF THE WORLD’S LARGEST HOSPITALITY COMPANIES.
Our portfolio of owned, managed, leased and franchised hotels comprises 38 hotels, offering a total of over 8,300 guest rooms, more than 200 meeting rooms, several destination restaurants, bars, health clubs and spas.
Our key markets are the United Kingdom, the Netherlands, Germany and Croatia. The United Kingdom is our primary market, with nine hotels and nearly 2,800 rooms in operation, including six hotels in central London near major transport hubs and landmarks, plus hotels in Leeds, Nottingham and Cardiff. In the Netherlands, we have three hotels in the city of Amsterdam with a fourth hotel near Amsterdam Airport Schiphol. Our portfolio in this country also includes hotels in Utrecht and Eindhoven. In Germany, we have five hotels in Berlin as well as Cologne, Dresden and Trier. In Croatia, our 13 hotels and apartment complexes are located in and around Pula and Medulin on the Adriatic coast in Istria. In addition, we offer hotels in Hungary and Israel.
Our development pipeline includes four new hotel projects, three of which are located in London and one in Nuremberg, Germany. In addition, we have one extension and reconfiguration and two rebranding projects. These developments are expected to add over 1,000 new rooms to our portfolio by the end of 2016 and an additional 352 rooms by the end of 2019.
PPHE Hotel Group’s corporate office is located in Amsterdam, with additional support offices in Amsterdam, Berlin and London. Taking into account the Group’s entire estate (including managed and franchised hotels), over 2,500 employees worked across our estate as at 31 December 2014.
The PPHE Hotel Group portfolio includes 38 properties offering a total of more than 8,300 guest rooms in Europe and the Middle East across owned, managed and franchised operations. Our primary activities are owning, leasing, developing, operating and franchising full-service upscale and lifestyle hotels.
pphe.com
6

CORE SERVICES
• Development and construction
• Hotel operation
• Asset management
• People development and human resources
• Revenue generation (revenue management, sales, e-commerce, marketing, distribution)
• Financial management
• Legal affairs
• Technology
• Procurement
6 countries
38 hotels
8,300 rooms in operation
1,375 rooms under development
2,500+ employees
1989Acquisition of first hotel
T R U S T
Trust is the belief and confidence in the organisation
and its employees, where achievable and realistic
promises are made and kept.
T E A M W O R K
Active participation in the realisation and achievement
of common goals.
R E S P E C T
Understanding differences in people and organisations,
while behaving with integrity and valuing their role.
E N T H U S I A S MChoosing to be positive,
energetic and happy.
C O M M I T M E N TBelieving in these values,
developing them in yourself, the team and organisation.
C A R E
Showing compassion and being able to adjust when
dealing with colleagues and guests alike, regardless of
the situation.
O U R V I S I O NREALISE GROWTH POTENTIAL
O U R M I S S I O N S TAT E M E N TINSPIRING OUR GUESTS THROUGH INDIVIDUALITY AND PASSION
O U R VA L U E STHE GROUP FEELS THAT IT IS IMPORTANT TO HAVE POSITIVE WORKING RELATIONSHIPS AND TO FOSTER AN ENVIRONMENT BASED ON TRUST, RESPECT, TEAMWORK, ENTHUSIASM, COMMITMENT AND CARE. THESE CRITERIA HAVE THEREFORE BEEN ADOPTED AS OUR COMPANY VALUES.
7

1
2
3
A W E L L -I N V E S T E D H O T E L P O R T F O L I O
Unlike many other hotel groups we own or co-own the majority of our hotels and many were developed, converted or extensively renovated and repositioned by us to provide accommodation to our own high standards and specific requirements. We have a strong eye for identifying, optimising and realising real estate values, while delivering excellent returns through our management expertise.
Our hotels are usually located in city centres, near major transport hubs and local landmarks. In addition, we focus on maximising revenue from each hotel through generating income from other areas such as meetings, events, restaurants, bars and spas. In 2008, we entered the resort segment of the market through our partnership with Arenaturist in Croatia, with whom we have successfully redeveloped and rebranded five hotels to Park Plaza to date, with a sixth hotel currently being refurbished and scheduled to reopen for the 2015 summer season.
CORE MARKETS: LONDON 2,296 rooms in operation and 1,198 in development
AMSTERDAM 893 rooms in operation
BERLIN 716 rooms in operation
CROATIA 2,814 rooms in operation of which 1,370 have been redeveloped and rebranded to date
18.0%Return on capital employed on operational assets in full ownership (2013: 15.7%)
€323.9MNet asset value at 31 December 2014 (2013: €298.1m)
15% increase in rooms expected by mid 2019
10Major renovations planned across key assets, including: — Park Plaza Victoria Amsterdam — Park Plaza Sherlock Holmes London
€200.0Mearmarked for new hotel projects and renovations
8

4
5 1 Park Plaza Riverbank London
2 TOZI at Park Plaza Victoria London
3 art’otel amsterdam
4 Park Plaza Histria Pula
5 art’otel berlin city center west
12Wholly owned
6Operating
leases
4
Management and franchise agreements
4New hotel projects
(all ownership of 50% or more) 16
Part owned
9

Individual design, city centre locations and excellent meeting facilities are key features of the upscale Park Plaza® Hotels & Resorts1 brand, making it ideal for both corporate and leisure guests. The hotels’ modern function spaces are flexible for conferences, exhibitions and private event use. Park Plaza® Hotels & Resorts’ event facilities are perfectly complemented by stylish guestrooms, award-winning restaurants and bars and a reliable service that is flawlessly delivered.
parkplaza.com Perpetual territorial exclusive licence agreement
W O R L D - C L A S S B R A N D S
We use our two distinctive hotel brands, Park Plaza® Hotels & Resorts and art’otel®, for operating leases, franchise agreements and management contracts as they offer the greatest scope for sustained expansion and continued profits.
In Croatia, we operate a variety of leisure orientated products, such as hotels, resorts and campsites. Five hotels have been extensively renovated and rebranded as Park Plaza between 2012 and 2014.
The remaining hotels, resorts and campsites in the portfolio operate under the Arenaturist brand.
We own several award-winning, successful restaurant and bar concepts and we license concepts from third parties where we believe they add value.
When it comes to hotels, restaurants, bars and spas, we believe in a bespoke approach. We tailor each product to the market to maximise its true potential, but they all share the same philosophy of providing a high quality experience with a strong focus on excellent service delivery.
1 This overview excludes Park Plaza branded hotels and developments outside of Europe, the Middle East and Africa, as these hotels are managed or franchised directly by the Carlson Rezidor Hotel Group.
2 Four out of the 13 hotels and apartment complexes from the Arenaturist portfolio are Park Plaza branded and are counted in both the Park Plaza and Arenaturist counts presented here.
3 Includes Arenaturist’s Hotel Park which is currently undergoing extensive renovations and, once completed, this hotel will reopen in summer 2015 as Park Plaza Arena Pula.
4 Room count includes 184 new rooms at Park Plaza Riverbank London.
222 H O T E L S
5,843 R O O M S
1,1981,4
R O O M S ( 43 H O T E L S ) I N T H E P I P E L I N E
10

art’otels are a contemporary collection of hotels that fuse exceptional architectural style with art-inspired interiors, located in cosmopolitan centres across Europe. At the brand’s core is the art itself. Each hotel displays a collection of original works designed or acquired specifically for that art’otel®, rendering each a unique art gallery in its own right. art’otel® has created a niche for itself in the hotel world, differentiating it from traditional hotels.
artotels.com Wholly owned brand
Arenaturist is one of Croatia’s best known hospitality groups and consists of seven hotels, six holiday apartment complexes, eight campsites and over 50 food and beverage outlets, all of which are located in Istria. Arenaturist caters primarily for tourists and all properties are located in prime locations by the sea and are only a short distance from either the 3,000-year-old city of Pula or the touristic Medulin.
arenaturist.com Management agreement
7 H O T E L S
1,058R O O M S
352R O O M S
( 1 H O T E L ) I N T H E P I P E L I N E
132 H O T E L S
2,814R O O M S
11

P P H E H O T E L G R O U P A N N U A L R E P O R T A N D A C C O U N T S 2 0 14
ELI PAPOUCHADOCHAIRMAN
12

2010 20132011 2012 2014
13
9.8
20
2.4
2
42
.1
24
4.8
2
70
.4
GROUP REVENUE €m
C H A I R M A N ’ SS TAT E M E N T
REPORTED RECORD REVENUE, INCREASED OUR OPERATING PROFIT AND IMPROVED EARNINGS PER SHARE
Dear shareholders, 2014 was a very special year for PPHE Hotel Group, and for me personally, as we celebrated a 25-year journey which started in 1989 when I acquired my first hotel in Eindhoven in the Netherlands. Today, PPHE Hotel Group has an attractive 38-strong multi-brand hotel portfolio, managed by a highly experienced team of professionals, with a strong pipeline of new hotels under development.
We are pleased to report another year of significant progress against our strategy with record reported revenue, increased operating profit and improved earnings per share. Our performance was ahead of the Board’s and market expectations. On behalf of the Board, I would like to extend my sincere appreciation to our 2,500+ team members around Europe who have contributed to such great results.
All our operating regions reported growth, with the United Kingdom, and London in particular, reporting the most solid results. With three new hotel projects and one extension under way, we expect to further benefit from the attractive and resilient London market in years ahead.
Being able to consistently deliver exemplary service to our guests is the true differentiator in our industry and our teams have once again raised the bar by achieving
the best service rating since we started measuring this in 2008. In recent years we have focused on improving our service delivery and culture and we are pleased to see that we are benefiting from these initiatives. Our performance hasn’t gone unnoticed and during the year the Company and our individual hotels and restaurants won various awards and accolades from trusted independent organisations. Our flagship hotel in the Netherlands, art’otel amsterdam, opened in 2013 and has since won multiple awards and performed well above expectations.
The Board is proposing the payment of an increased final dividend of 10.0 pence per share, which when combined with the interim dividend of 9.0 pence per share paid on 16 October 2014, amounts to a total dividend for the year ended 31 December 2014 of 19.0 pence per share, an increase of 35.7%. The increased dividend reflects the Board’s confidence in the strength of PPHE Hotel Group. In respect of future years, the Board expects to continue to follow its progressive dividend policy.
Looking ahead, we will focus on the delivery of our new hotel projects in Germany and the United Kingdom and the extensive renovations planned across all of our operating regions. Not only will our improved and newly developed hotels further strengthen our footprint in key European markets, we also anticipate long-term benefits from increased scale and brand recognition.
In 2015, the Board will continue to focus on improving returns on shareholders’ capital whilst growing the business and will remain alert to acquisition and disposal opportunities. I would like to thank members of the Board for their guidance during 2014 and I look forward to what is expected to be another exciting year filled with further growth prospects.
ELI PAPOUCHADOCHAIRMAN
13

BORIS IVESHAPRESIDENT & CHIEF E XECUTIVE OFFICER
P P H E H O T E L G R O U P A N N U A L R E P O R T A N D A C C O U N T S 2 0 14
14

C H I E F E X E C U T I V E O F F I C E R ’ S S TAT E M E N T
“FAST FORWARD TO 2019 AND WE WILL
HAVE NEARLY 10,000 ROOMS IN OPERATION.”
Welcome,2014 has been a very exciting year for us as we continued to deliver solid growth. We were thrilled to celebrate 25 years since the first hotel in Eindhoven was acquired in 1989. Since then, the Group has gone from strength to strength.
We currently operate over 8,300 rooms and anticipate that by 2019 we will have nearly 10,000 rooms in operation, with the vast majority located in key capital cities in Europe. At that time, we expect to offer over 3,500 rooms in London alone which will add to our already strong platform in markets such as Amsterdam and Berlin.
Our strategy is to create and realise shareholder value by growing the Company into one of the leading hotel companies in the upscale and lifestyle segments. Strong markets such as London continued to perform well and recovering markets, such as the Netherlands and Germany, showed further signs of improvement. Our total revenue for the year increased by 10.5%, predominantly as a result of improved trading and we also benefited from the first full-year contribution from art’otel amsterdam and the strengthening of Sterling against the Euro.
Our corporate strategy is built around six core strategic objectives and we have been able to deliver clear progress across all of these in 2014.
In recent years, our environmental and community initiatives have become and will continue to be an integral part of our day-to-day operations.
Improved EBITDA margin Our EBITDA margin in the year increased by 130 basis points (bps) to 35.1%, reflecting improved trading, whilst we also focused on managing our cost base. During 2014, we entered into several Group-wide and regional procurement agreements, generating savings across all regions. With the recent appointment of a Group Procurement Manager we expect to see further efficiency benefits in this area in the years ahead. As we expand our portfolio, we are constantly looking to leverage our scale and improve efficiencies and synergies. In addition, our lean organisational structure enables us to absorb further portfolio growth with a minimal increase in overheads. Looking ahead, we will focus on maintaining our high EBITDA margin.
15

Enhanced service quality Delivering a consistent, high quality and memorable guest experience is at the very heart of our business. Particularly at a time when consumers are looking for, and sharing, unique travel experiences we encourage our teams to deliver a guest experience that exceeds expectations.
We developed extensive training programmes around this philosophy and in recent years have seen the benefits of these. In 2014, we implemented our Foundation in Management training programme, which is aimed at management, across all our operating regions, nurturing talent and preparing participants for their next step in their career with us. To ensure we retain these team members, and support other talents in our business, we have introduced a Talent Management Programme in the year. These tools will not only benefit us in the short term through an improved service delivery, but will benefit our planned new hotel openings. With employee demographics and behaviour changing rapidly, we are focusing more and more on positioning our Group and our brands as an inspiring work place. During the year, we developed our employer branding proposition and focused on online direct recruitment through our newly launched careers website and social media networks such as LinkedIn.
Our activities in this field have not gone unnoticed. The contribution to our performance has been significant and our guests rate their stays with us very highly. In 2014, our Guest Satisfaction score was the highest since we introduced this measurement in 2008. Overall Guest Satisfaction was rated 8.36 by our guests (on a scale of 1-10). Of particular importance is that this high score was mainly the result of a strong score for service provided. Our Service Performance score was a record 8.62 (on a scale of 1-10). Naturally, we are proud of our teams delivering such a great result. Employee satisfaction during the year was 83.5%, another record for our Group.
P P H E H O T E L G R O U P A N N U A L R E P O R T A N D A C C O U N T S 2 0 14
C H I E F E X E C U T I V E O F F I C E R ’ S S TAT E M E N T C O N T I N U E D
“WE WANT TO OFFER OUR GUESTS HIGH QUALITY EXPERIENCES AND WE WILL BE SIGNIFICANTLY INVESTING IN OUR HOTEL PORTFOLIO.”
16
We were awarded several accolades in 2014, including the ‘Excellence in Learning and Talent Development Award’ at the HR in Hospitality Awards and the ‘Best Customer Service Programme Award’ for our Inspirational Service Programme, awarded by the Training Journal Awards.
With our service performance at such a high level, we aim to maintain this in 2015, whilst further improving our guest experience through product enhancements.
Improving and expanding our portfolioIn January 2014, we entered into a 50:50 joint venture for the freehold interests of the two art’otels in Berlin which we acquired in July 2013, which enables us to reinvest the capital that was released in other projects. Following this transaction, we continued to benefit from the long-term management contracts in place for both hotels.
In June 2014, we opened Park Plaza Belvedere Medulin in Croatia. This striking new resort hotel is part of the Arenaturist group, and following extensive renovations it was rebranded as a Park Plaza. This hotel is now the largest Park Plaza hotel in Croatia, offering 427 rooms and extensive facilities. Between 2012 and 2014, we have transformed and rebranded approximately 50.0% of Arenaturist’s hotel rooms.
During the year we continued to invest in our development pipeline and we made significant progress with the various projects. Construction is now well under way for two new hotels in London and one hotel in Nuremberg as well as the extension of Park Plaza Riverbank London.
We are owner/operators and we take a lot of pride in our assets. It is essential to offer our guests high quality experiences and, as previously announced, we will be significantly investing in our existing hotel portfolio over and above our routine capital expenditure plans, between 2015 and 2016. These renovations are part of the refinancing entered into in December 2013. During this process, we aim to minimise disruption to our guests and our business and we believe that this investment will bring long-term benefits to the Group and our brands.
To support this exciting phase of investment, hotel upgrades and growth, we promoted Chen Moravsky to Deputy Chief Executive Officer in August 2014 alongside his role as Chief Financial Officer.
Innovative revenue generation The emergence of new booking channels, mobile devices and digital tools for customers to use before, during and after their stay with us is exciting and filled with potential. The travel landscape will continue to change in years to come and it is therefore paramount that our commercial teams constantly monitor trends in the market and tailor their strategies accordingly. In 2014, we have seen benefits from our commercially integrated, cross-channel approach whereby we strive to offer our guests instant access to our products, using their device of choice, at the best available rate.
Our focus has been on driving business for our hotels based on demand patterns and search and booking behaviour. To facilitate this, we have focused on analysing the significant amount of data available to us and created appealing marketing campaigns. Our primary focus is to grow direct business as it is the most cost effective and enables us to establish a one-to-one relationship with our guests. Our revenue and digital teams work closely with their peers at the Carlson Rezidor Hotel Group (‘Carlson’) to ensure we benefit from all knowledge, expertise and tools available to us. Another area of focus for the year was the significant expansion of our online advertising activities with the world’s major search engines. Our online advertising campaigns have now been rolled out across many international markets driving demand to our brand websites.
Other successful initiatives introduced during the year include new or improved collaborations with influential partners such as Expedia, TripAdvisor and Singapore Airlines.
17

Leveraged our partnership with Carlson Our strategic partnership with Carlson has brought us many benefits in the years that we have been working together. Our industry is evolving rapidly and through our partnership with Carlson, we can continue to ensure our products have a truly global reach through the distribution, marketing and sales platforms they provide. Fostering loyalty, and offering point-based loyalty programmes, continues to play a significant role in our industry. Scale is important to ensure guests have significant opportunities to earn or redeem their points. Our strategic partnership with Carlson brings those benefits as we collectively offer over 1,350 hotels in operation across seven different brands, offering the customer choice. Club Carlson is the global loyalty scheme and our hotels have once again benefited from its membership base of 13.5 million plus. Our teams constantly focus on driving activity from and engagement with these members. A significant proportion of our occupancy is related to this reward programme and its members have booked more point-based room nights at our hotels in 2014 than ever before.
Just before Christmas, we were pleased to be able to join the Carlson Rezidor Hotel Group gift card programme. Guests can buy and redeem their gift cards at nearly 400 hotels in Europe, the Middle East and Africa. Gift cards are sold at all participating hotels, through the various brand websites and through third parties including some of Europe’s leading airlines. This programme is an exciting new opportunity for our hotels to market their product to new customers and generate incremental revenue as a result.
P P H E H O T E L G R O U P A N N U A L R E P O R T A N D A C C O U N T S 2 0 14
C H I E F E X E C U T I V E O F F I C E R ’ S S TAT E M E N T C O N T I N U E D
“OVER THE NEXT TWO YEARS, WE WILL BE
SIGNIFICANTLY INVESTING IN OUR PORTFOLIO WITH
RENOVATIONS PLANNED ACROSS MANY OF
OUR HOTELS.”18

Managed our impact on the environment Operating responsibly is part of our day-to-day operations and in 2014 we progressed with several new initiatives in this field, such as the installation of real-time electricity meters, new recycling machines and the introduction of a paperless system at our central reservation office in London. We succeeded in further reducing our CO2 footprint, with all regions successfully reducing their energy consumption. Following a successful trial period, we have implemented a Group-wide new initiative in which we provide guests with a choice of housekeeping services when they stay more than one night at any of our hotels. If guests decide to forego certain services, we reward them with bonus points for the Club Carlson scheme, a discount in our bars or restaurants or a donation to a charitable cause. This initiative will help preserve resources and minimise the adverse environmental impact our business may have. It demonstrates that by working together we can achieve great things.
Throughout the year, our teams and hotels participated in several community events and fundraising initiatives. We are also proud to announce that our flagship Park Plaza Westminster Bridge London was awarded the ‘Accessibility Award’ by the Caterer and Hotelkeeper Awards (the Cateys) for its initiatives and services offered to guests with disabilities.
Current trading and outlook Over the next two years, we will be significantly investing in our portfolio with renovations planned across many of our hotels. This work is undertaken to ensure our hotels continue to improve on their strong market positions. During this investment period we aim to minimise the impact on our operations through careful planning and a phased approach where possible. However, once renovations commence, we anticipate reduced capacities and a short-term impact on revenue due to temporary closures of rooms and public areas. Although this may be at the expense of short-term revenue gains, we believe that this investment will have a positive impact on our long-term results and position in the markets in which we operate.
The Company continues its discussions regarding the release of part of the value of its hotel assets, whilst retaining operational control. This process is underway and will take a number of months.
The first quarter of the year is traditionally our weakest. Nevertheless, in comparison with 2014, and notwithstanding ongoing renovations and extension works, our RevPAR performance in January and February of 2015 improved year-on-year, which was aided by the mild winter across our operating regions. Overall results are in line with the Board’s expectations in all markets.
BORIS IVESHAPRESIDENT & CHIEF E XECUTIVE OFFICER
“THROUGH OUR PARTNERSHIP WITH CARLSON, WE CAN CONTINUE TO ENSURE OUR PRODUCTS HAVE A TRUE GLOBAL REACH THROUGH THE DISTRIBUTION, MARKETING AND SALES PLATFORMS THEY PROVIDE.”
19

P P H E H O T E L G R O U P A N N U A L R E P O R T A N D A C C O U N T S 2 0 14
S T R AT E G Y
2 0 1 5 S T R A T E G I C
O B J E C T I V E S P E R F O R M A N C E I N T H E Y E A R I N D I C A T O R S R I S K S L I N K E D T O S T R AT E G Y * L O O K I N G F O R W A R D
D E L I V E R I N G S TA B I L I S E D
A N N UA L R E T U R N O N
S H A R E H O L D E R C A P I TA L
Notwithstanding the Group’s various development projects, increased dividend by 35.7% 18.0%
return on capital employed (based on owned hotels in operation)
19pdividend per share
• The Group’s borrowings
• Foreign exchange rate fluctuations
Maintain progressive dividend policy as long as profitability allows for it
M A I N TA I N I N G O U R H I G H
E B I T DA M A R G I N
Our EBITDA margin increased year-on-year as a result of improved trading and proactive cost management 35.1%
reported EBITDA margin (EBITDA / Total Revenue)
• Fixed operating expenses
• Hotel industry risks
Maintain our high EBITDA margin by improving operational performance, tight cost controls, centralised procurement and further developing our financial structure and asset management initiatives
I M P R O V I N G O U R G U E S T
E X P E R I E N C E T H R O U G H
A C O N S I S T E N T S E R V I C E
D E L I V E R Y A N D P R O D U C T
E N H A N C E M E N T S
Continued investment in operational and management training programmes across all our regions
Achieved record level of guest satisfaction and service performance scores
Product investment and renovations
8.36overall Guest Satisfaction score (on a scale of 1–10)
8.62 Service Performance score (on a scale of 1-10)
• Employee turnover
• Capital required to maintain product standards
Continue to grow guest and employee satisfaction and loyalty by consistent delivery of exceptional customer service, significant product enhancements and investment in our people development activities
427opened 427-room Park Plaza Belvedere Medulin, Croatia
D R I V I N G G R O W T H
B Y E X PA N D I N G O U R
H O T E L P O R T F O L I O
T H R O U G H A VA R I E T Y
O F B U S I N E S S M O D E L S
Entered into a 50:50 joint venture for two art’otels in Berlin
Started construction of three new hotels
Commenced extension and reconfiguration of one hotel
50:50 joint venture
1,023new rooms under construction
• Development projects
• The Group’s borrowings
Focus on driving growth through construction projects and extending our development pipeline
I M P R O V I N G O U R
O V E R A L L P E R F O R M A N C E
T H R O U G H I N N O VAT I V E
R E V E N U E G E N E R AT I O N
A N D M A R K E T I N G
I N I T I AT I V E S
Approximately 50% of our wholly owned and leased hotels outperformed their competitive sets
Increased focus on driving business direct through our own channels, with several successes booked
• Market share
• Business generated through direct channels
• Hotel industry risks
• Capital required to maintain product standards
• Market disruptors
• Information technology and systems
Actively look for opportunities to improve our revenue generation through analysis of demand patterns and customer behaviour, new distribution channels, digital marketing, customer engagement, and collaboration with third parties
L E V E R A G I N G O U R
PA R T N E R S H I P W I T H
C A R L S O N T O F U R T H E R
G R O W R E V E N U E S
Entered into several new global distribution and marketing agreements
Focused on driving loyalty programme member engagement through compelling offers and propositions
Participation in the Carlson Rezidor Hotel Group Gift Card programme
Extended the airline partner network with the addition of Singapore Airlines
• Cost-effective distribution of our products
• Business generated through brand channels and loyalty programmes
• The Park Plaza® Hotels & Resorts brand and reservation system
Embrace all marketing, sales, distribution and e-commerce channels and programmes available through this global network and increase customer loyalty and engagement from the various loyalty programmes
* For an overview of risks and mitigation, please refer to page 59.
20

PPHE Hotel Group’s primary objective is to create and realise shareholder value by growing the Company into one of the leading hotel companies in the upscale and lifestyle hotel segments. We aim to grow prudently, passionately and confidently through acquiring, developing and managing hotels in city centre, airport and resort locations.
2 0 1 5 S T R A T E G I C
O B J E C T I V E S P E R F O R M A N C E I N T H E Y E A R I N D I C A T O R S R I S K S L I N K E D T O S T R AT E G Y * L O O K I N G F O R W A R D
D E L I V E R I N G S TA B I L I S E D
A N N UA L R E T U R N O N
S H A R E H O L D E R C A P I TA L
Notwithstanding the Group’s various development projects, increased dividend by 35.7% 18.0%
return on capital employed (based on owned hotels in operation)
19pdividend per share
• The Group’s borrowings
• Foreign exchange rate fluctuations
Maintain progressive dividend policy as long as profitability allows for it
M A I N TA I N I N G O U R H I G H
E B I T DA M A R G I N
Our EBITDA margin increased year-on-year as a result of improved trading and proactive cost management 35.1%
reported EBITDA margin (EBITDA / Total Revenue)
• Fixed operating expenses
• Hotel industry risks
Maintain our high EBITDA margin by improving operational performance, tight cost controls, centralised procurement and further developing our financial structure and asset management initiatives
I M P R O V I N G O U R G U E S T
E X P E R I E N C E T H R O U G H
A C O N S I S T E N T S E R V I C E
D E L I V E R Y A N D P R O D U C T
E N H A N C E M E N T S
Continued investment in operational and management training programmes across all our regions
Achieved record level of guest satisfaction and service performance scores
Product investment and renovations
8.36overall Guest Satisfaction score (on a scale of 1–10)
8.62 Service Performance score (on a scale of 1-10)
• Employee turnover
• Capital required to maintain product standards
Continue to grow guest and employee satisfaction and loyalty by consistent delivery of exceptional customer service, significant product enhancements and investment in our people development activities
427opened 427-room Park Plaza Belvedere Medulin, Croatia
D R I V I N G G R O W T H
B Y E X PA N D I N G O U R
H O T E L P O R T F O L I O
T H R O U G H A VA R I E T Y
O F B U S I N E S S M O D E L S
Entered into a 50:50 joint venture for two art’otels in Berlin
Started construction of three new hotels
Commenced extension and reconfiguration of one hotel
50:50 joint venture
1,023new rooms under construction
• Development projects
• The Group’s borrowings
Focus on driving growth through construction projects and extending our development pipeline
I M P R O V I N G O U R
O V E R A L L P E R F O R M A N C E
T H R O U G H I N N O VAT I V E
R E V E N U E G E N E R AT I O N
A N D M A R K E T I N G
I N I T I AT I V E S
Approximately 50% of our wholly owned and leased hotels outperformed their competitive sets
Increased focus on driving business direct through our own channels, with several successes booked
• Market share
• Business generated through direct channels
• Hotel industry risks
• Capital required to maintain product standards
• Market disruptors
• Information technology and systems
Actively look for opportunities to improve our revenue generation through analysis of demand patterns and customer behaviour, new distribution channels, digital marketing, customer engagement, and collaboration with third parties
L E V E R A G I N G O U R
PA R T N E R S H I P W I T H
C A R L S O N T O F U R T H E R
G R O W R E V E N U E S
Entered into several new global distribution and marketing agreements
Focused on driving loyalty programme member engagement through compelling offers and propositions
Participation in the Carlson Rezidor Hotel Group Gift Card programme
Extended the airline partner network with the addition of Singapore Airlines
• Cost-effective distribution of our products
• Business generated through brand channels and loyalty programmes
• The Park Plaza® Hotels & Resorts brand and reservation system
Embrace all marketing, sales, distribution and e-commerce channels and programmes available through this global network and increase customer loyalty and engagement from the various loyalty programmes
* For an overview of risks and mitigation, please refer to page 59.
We intend to use our established portfolio and network, paired with our entrepreneurial spirit, to grow the number of hotels and brands in our portfolio, increase profitability through revenue growth and cost management, and utilise the Carlson Rezidor Hotel Group partnership as the contributor to further grow revenues.
21

P u r c h a s e l a n d a n d b u i l d i n g s
C r e a t i n g v a l u e
(Re
) de
ve
lopB
ran
di n
g
H o t e l o p e r a t i o n s
S h a r e h o l d e r v a l u e
Creating value
TRANSFORMINGPOTENTIAL INTO PROFITAt PPHE Hotel Group we create shareholder value through a variety of business models. We own or co-own the majority of the hotels in our portfolio, but also lease, manage and franchise hotels.
All hotels in our portfolio benefit from being part of a dynamic, full-service international hotel group led by a highly experienced, loyal and involved senior management team. Our shareholders have benefited from our business model, developments and operating skills in the form of progressive dividend payments.
INVESTING IN RESILIENT MARKETS
Owned properties Joint ventures and associates
In operation
€m
Under development
€m
Operating leases
€m
In operation
€m
Under development
€m
Managementand central
costs€m
Reported €m
Capital employed 191.2 14.6 2.5 28.9 17.3 69.4 323.9Adjusted EBITDA 94.7 – 2.1 3.4 – (5.4) 94.8Normalised profit before tax 31 December 2014 34.4 (1.2) 1.7 3.8 0.1 (5.9) 32.9Normalised profit before tax 31 December 2013 27.4 (1.3) 0.4 2.6 0.2 (7.4) 21.9
* For further details on this table see page 38.
P P H E H O T E L G R O U P A N N U A L R E P O R T A N D A C C O U N T S 2 0 14
B U S I N E S S M O D E L
22

Creating value
O W N E R S H I P
Owning and operating hotels is the primary focus of our business. This is a capital intense, but highly profitable business model. At 31 December 2014, we had employed €191.2 million capital in hotels in operation, generating €94.7 million adjusted EBITDA and €34.4 normalised profit before tax. The return on capital employed for the year was 18.0%.
PPHE Hotel Group aims to own hotels in key gateway cities in Europe where capital value is likely to appreciate over time.
Examples of owned hotels in operation are:
Park Plaza Victoria AmsterdamThis 306-room landmark property in central Amsterdam was bankrupt when we took it over in 1993 with a coherent and strong repositioning plan. With knowledgeable decision-making, significant investment and a skilful rebranding, Park Plaza Victoria Amsterdam has consistently generated very attractive returns. The hotel is wholly owned and operated by PPHE Hotel Group.
Park Plaza Westminster Bridge LondonThis spectacular 1,019-room hotel was one of the largest to open in London in 40 years and exemplifies our creative vision to regenerate a key London site and to achieve a self-financing, environmentally friendly development. Carried out in partnership with Gear Construction, the project covered 68,500m3 and was completed a year ahead of schedule. The hotel has delivered strong results since it opened in 2010. The hotel is part owned, and operated, by PPHE Hotel Group.
23

Creating value
P R O J E C T S
One of our core strengths is that we know what to look for when identifying assets with development potential, from plots of land to tired buildings in need of investment. Developing new hotels and redeveloping existing hotels is capital intense, but we have a proven track record that on completion of our projects we create a clear upside in property value and start benefiting from operating revenues.
At 31 December 2014, we had employed €14.6 million capital in hotels under development.
PPHE Hotel Group’s pipeline includes three new hotel projects and one extension in London and one new hotel project in Nuremberg, Germany. The Group is actively pursuing several other opportunities in markets where it expects that capital value is likely to appreciate over time.
P P H E H O T E L G R O U P A N N U A L R E P O R T A N D A C C O U N T S 2 0 14
B U S I N E S S M O D E L
24

Creating value
O P E R AT I N G L E A S E S
Institutional investors may favour operating leases, whereby we lease their property and pay them rent. We manage all aspects of the operation of the hotel, from sales and marketing to reservations and food and beverage to human resources. The benefit of such agreements is that this model is capital light.
At 31 December 2014, our revenue generated from hotels operating under leases was €28.5 million, with adjusted EBITDA at €2.1 million. Normalised profit before tax was €1.7 million.
PPHE Hotel Group will consider expansion through operational leases in exceptional circumstances only.
Examples of hotels the Group operates under lease agreements are:
Park Plaza Wallstreet Berlin MitteOne of our key hotels in Germany, Park Plaza Wallstreet Berlin Mitte is a fresh take on a business hotel. The property is owned by Union Investment, one of Europe’s leading institutional investors and leased to PPHE Hotel Group on a long-term occupational lease.
art’otel cologneLocated in the Rheinauhafen area, art’otel cologne is one of the city’s newest hotels occupying a prime riverside location. The hotel offers a truly unique hotel experience in Cologne, with original contemporary art on display in the public areas and rooms, and is home of Chino Latino® restaurant and bar. The property is owned by Quantum AG and leased to PPHE Hotel Group on a long-term occupational lease.
25
Creating value
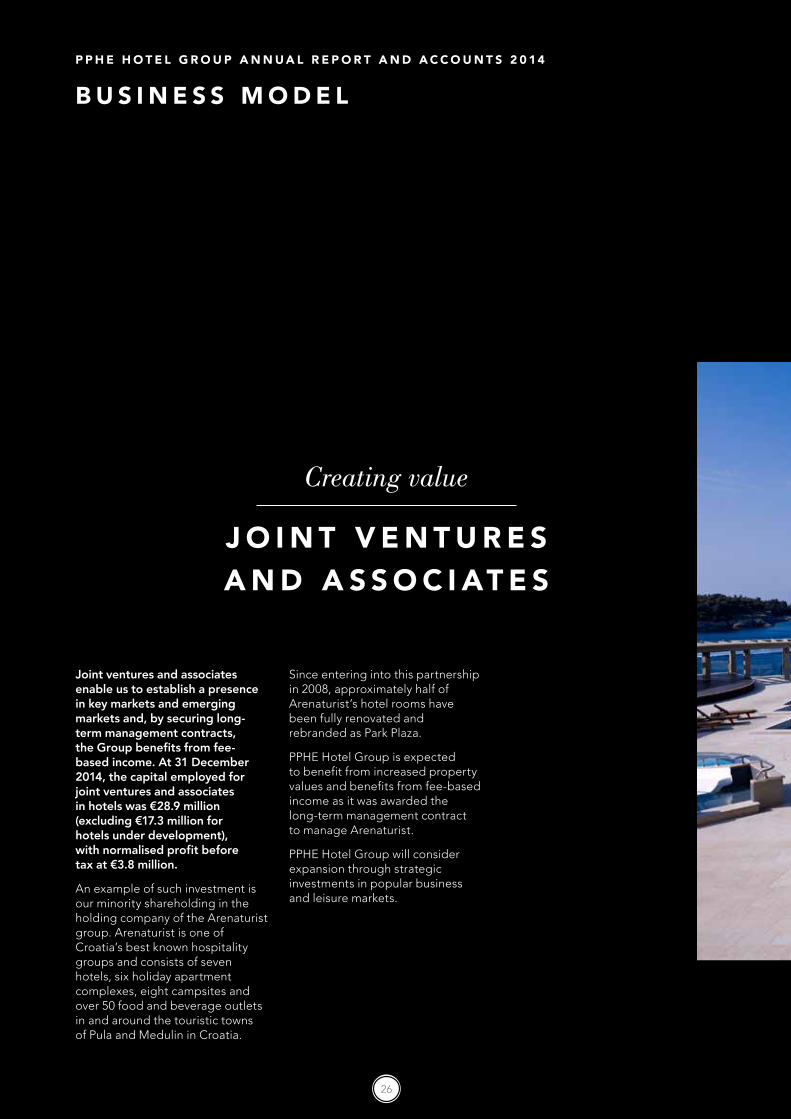
J O I N T V E N T U R E S A N D A S S O C I AT E S
Joint ventures and associates enable us to establish a presence in key markets and emerging markets and, by securing long-term management contracts, the Group benefits from fee-based income. At 31 December 2014, the capital employed for joint ventures and associates in hotels was €28.9 million (excluding €17.3 million for hotels under development), with normalised profit before tax at €3.8 million.
An example of such investment is our minority shareholding in the holding company of the Arenaturist group. Arenaturist is one of Croatia’s best known hospitality groups and consists of seven hotels, six holiday apartment complexes, eight campsites and over 50 food and beverage outlets in and around the touristic towns of Pula and Medulin in Croatia.
Since entering into this partnership in 2008, approximately half of Arenaturist’s hotel rooms have been fully renovated and rebranded as Park Plaza.
PPHE Hotel Group is expected to benefit from increased property values and benefits from fee-based income as it was awarded the long-term management contract to manage Arenaturist.
PPHE Hotel Group will consider expansion through strategic investments in popular business and leisure markets.
P P H E H O T E L G R O U P A N N U A L R E P O R T A N D A C C O U N T S 2 0 14
B U S I N E S S M O D E L
26

27

Creating value
M A N AG E M E N T A N D C E N T R A L C O S T S
PPHE Hotel Group has management contracts in place for all hotels it owns or co-owns, as well as for those hotels leased by the Group and hotels which are owned by third parties. A management contract with a third party allows owners to retain ownership of their property while we undertake the day-to-day management. They have the confidence of working with a leading hotel brand while we run their hotel with efficiency and passion.
In addition, the Group has entered into several franchise contracts, providing third party hotel owners the right to use the Park Plaza® brand name and giving them access to the global reservation system, distribution channels and various marketing programmes.
For both contract types, PPHE Hotel Group benefits from fee-based income.
At 31 December 2014, capital employed to service all hotels operating under management and franchise contracts was €69.4 million.
Looking ahead, PPHE Hotel Group believes that this segment has great potential to realise portfolio growth without requiring significant capital as a solid support infrastructure is already in place. The Group is therefore actively seeking opportunities to grow through either of these contract types.
Examples of hotels the Group manages or franchises are:
Park Plaza County Hall LondonWidely acknowledged as a model opening in 2008, Park Plaza County Hall London is now one of London’s most admired contemporary upscale hotels. We operate this hotel under a long-term management contract and, even during the recent downturn we have continued to hit budgets and exceed expectations, delivering superb returns to the owner.
Park Plaza Cardiff The award-winning Park Plaza Cardiff opened in 2005 and is now rated as one of the city’s best hotels. The hotel is owned by a third party and PPHE Hotel Group has a long-term franchise contract in place.
P P H E H O T E L G R O U P A N N U A L R E P O R T A N D A C C O U N T S 2 0 14
B U S I N E S S M O D E L
28

29
2010 20132011 2012 2014
13
9.8
20
2.4
2
42
.1
24
4.8
2
70
.4
TOTAL RE VENUE€m
CAGR 17.9
%
2010 20132011 2012 2014
46
.5
75
.0 9
6.8
9
3.2
1
05
.2
EBITDAR€m
CAGR 22.6
%
2010 20132011 2012 2014
6.1
1
3.6
2
4.1
2
1.9
3
2.9
NORMALISED PROFIT BEFORE TAX €m
2010 20132011 2012 2014
37
.6
65
.0 8
5.6
8
2.7
9
4.8
EBITDA€m
CAGR 26.0
%
0.1
6
0.3
3
0.5
9
0.5
4
0.7
9
NORMALISEDEARNINGS PER SHARE €
2010 20132011 2012 2014 2011 20142012 2013
0.0
6
0.1
2
0.1
4
0.1
9
DIVIDEND PER SHARE £
P P H E H O T E L G R O U P A N N U A L R E P O R T A N D A C C O U N T S 2 0 14
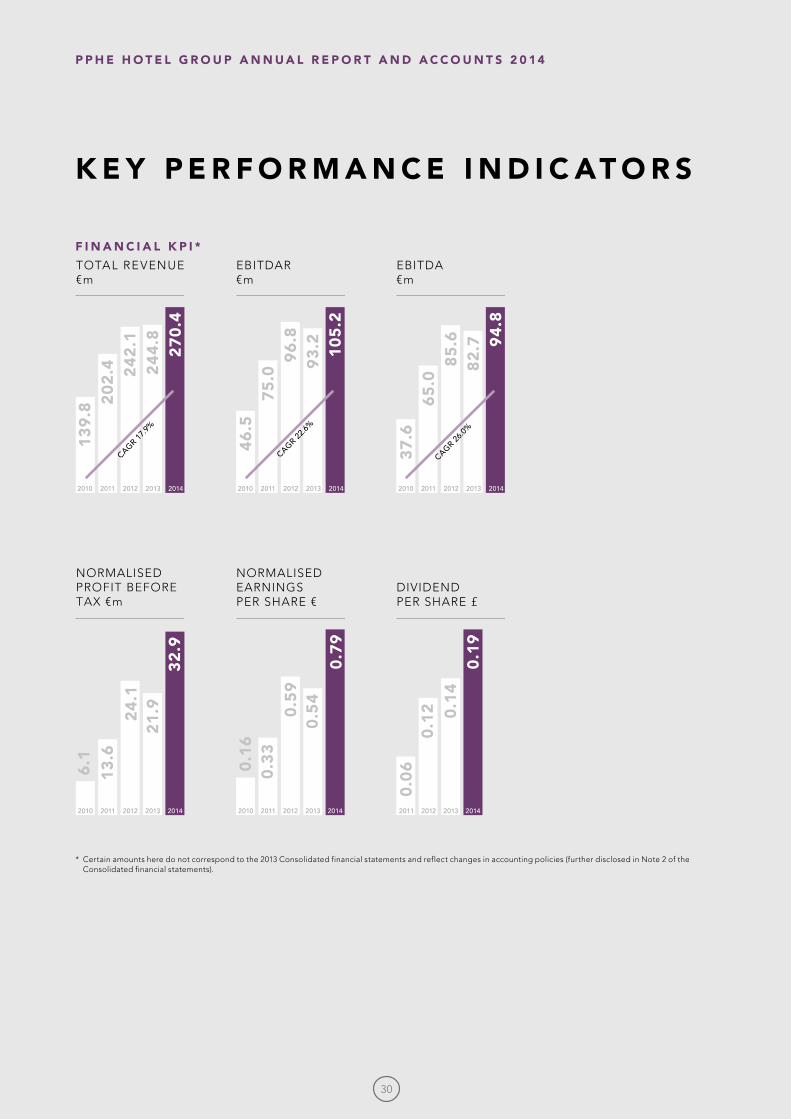
K E Y P E R F O R M A N C E I N D I C AT O R S
F I N A N C I A L K P I *
* Certain amounts here do not correspond to the 2013 Consolidated financial statements and reflect changes in accounting policies (further disclosed in Note 2 of the Consolidated financial statements).
30
2010 20132011 2012 2014
77
.4
77
.7
77
.4
80
.7
83
.7
OCCUPANCY%
2010 20132011 2012 2014
11
0.7
1
19
.2
13
0.9
1
25
.5
13
5.6
AVERAGE ROOM RATE €
2010 20132011 2012 2014
81
.0 83
.3
82
.1
82
.9
83
.5
EMPLOYEESATISFACTION(SCALE 1–100%)
2010 20132011 2012 2014
8.2
7
8.2
3
8.3
0
8.3
0
8.3
6
GUESTSATISFACTION(SCALE 1–10)
2010 20132011 2012 2014
8.3
9
8.3
8
8.4
8
8.5
0
8.6
2
SERVICEPERFORMANCE(SCALE 1–10)
2010 20132011 2012 2014
85
.7
92
.6
10
1.3
1
01
.4
11
3.6
REVPAR€
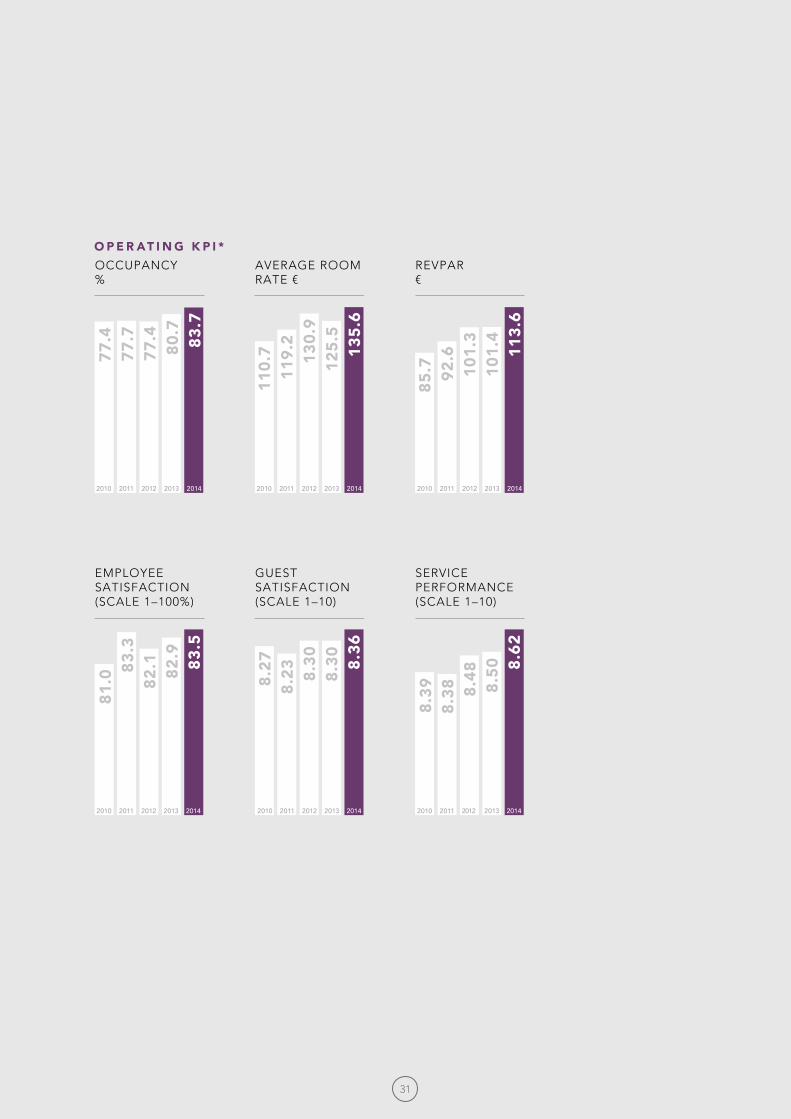
O P E R AT I N G K P I *
31

P P H E H O T E L G R O U P A N N U A L R E P O R T A N D A C C O U N T S 2 0 14
CHEN MORAVSK YDEPUT Y CHIEF E XECUTIVE OFFICER & CHIEF FINANCIAL OFFICER
32
D E P U T Y C H I E F E X E C U T I V E O F F I C E R & C H I E F F I N A N C I A L O F F I C E R ’ S S TAT E M E N T
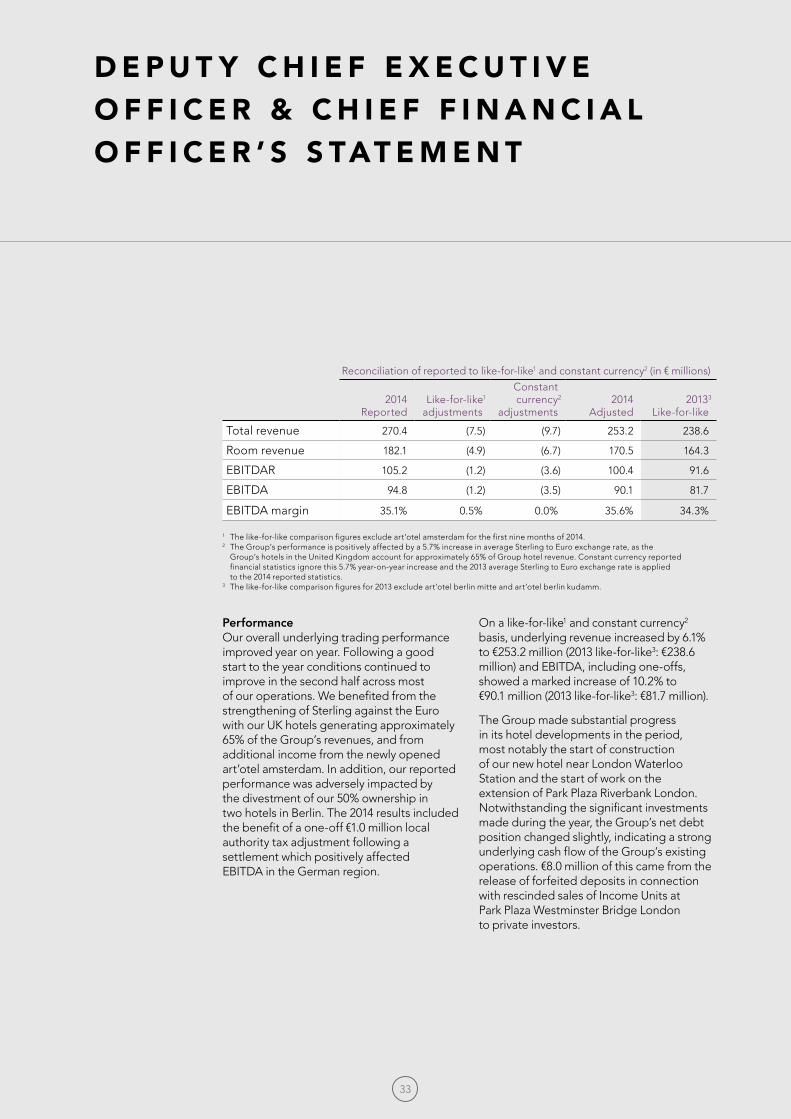
Reconciliation of reported to like-for-like1 and constant currency2 (in € millions)
2014Reported
Like-for-like1
adjustments
Constant currency2
adjustments2014
Adjusted20133
Like-for-like
Total revenue 270.4 (7.5) (9.7) 253.2 238.6
Room revenue 182.1 (4.9) (6.7) 170.5 164.3
EBITDAR 105.2 (1.2) (3.6) 100.4 91.6
EBITDA 94.8 (1.2) (3.5) 90.1 81.7
EBITDA margin 35.1% 0.5% 0.0% 35.6% 34.3%
1 The like-for-like comparison figures exclude art’otel amsterdam for the first nine months of 2014. 2 The Group’s performance is positively affected by a 5.7% increase in average Sterling to Euro exchange rate, as the
Group’s hotels in the United Kingdom account for approximately 65% of Group hotel revenue. Constant currency reported financial statistics ignore this 5.7% year-on-year increase and the 2013 average Sterling to Euro exchange rate is applied to the 2014 reported statistics.
3 The like-for-like comparison figures for 2013 exclude art’otel berlin mitte and art’otel berlin kudamm.
PerformanceOur overall underlying trading performance improved year on year. Following a good start to the year conditions continued to improve in the second half across most of our operations. We benefited from the strengthening of Sterling against the Euro with our UK hotels generating approximately 65% of the Group’s revenues, and from additional income from the newly opened art’otel amsterdam. In addition, our reported performance was adversely impacted by the divestment of our 50% ownership in two hotels in Berlin. The 2014 results included the benefit of a one-off €1.0 million local authority tax adjustment following a settlement which positively affected EBITDA in the German region.
On a like-for-like1 and constant currency2
basis, underlying revenue increased by 6.1% to €253.2 million (2013 like-for-like3: €238.6 million) and EBITDA, including one-offs, showed a marked increase of 10.2% to €90.1 million (2013 like-for-like3: €81.7 million).
The Group made substantial progress in its hotel developments in the period, most notably the start of construction of our new hotel near London Waterloo Station and the start of work on the extension of Park Plaza Riverbank London. Notwithstanding the significant investments made during the year, the Group’s net debt position changed slightly, indicating a strong underlying cash flow of the Group’s existing operations. €8.0 million of this came from the release of forfeited deposits in connection with rescinded sales of Income Units at Park Plaza Westminster Bridge London to private investors.
33

P P H E H O T E L G R O U P A N N U A L R E P O R T A N D A C C O U N T S 2 0 14
D E P U T Y C E O & C H I E F F I N A N C I A L O F F I C E R ’ S S TAT E M E N T C O N T I N U E D
RevPAR
Reported2013
€101.4
€4.4
€4.2€2.6
12.0% RevPAR growth
€1.0 €113.6
Growth FXimpact
Divestments Newopenings
Reported2014
80.0
85.0
90.0
95.0
100.0
105.0
110.0
115.0
120.0
YEAR-ON-YEAR RevPAR GROWTH €
We successfully improved our RevPAR through occupancy growth and increased average room rate. Both the Group’s occupancy and average room rate reached a record level of 83.7% (2013: 80.7%) and €135.6 (2013: €125.5) respectively. This RevPAR improvement
reflected a reported room revenue increase of 7.6% to €182.1 million (2013: €169.2 million) during the period. On a like-for-like basis1, room revenue increased by 7.9% to €177.2 million, of which an increase of 4.1% was due to the strengthening of Sterling against the Euro.
Total revenue
200,000
210,000
220,000
230,000
240,000
250,000
260,000
270,000
280,000
YEAR-ON-YEAR TOTAL REVENUE GROWTH €’000
€244.8
€14.6
€9.7 €(6.2) €7.5 €270.4
Reported2013
Growth
10.5% total revenue growth
Divestments Newopenings
Reported2014
FXimpact
Reported total revenue for the Group increased by 10.5% to €270.4 million (2013: €244.8 million). This increase was driven by the first full year of trading of art’otel amsterdam, an increase of RevPAR and improved Food and Beverage operations.
On a like-for-like basis1, total revenue increased by 10.2% to €262.9 million (2013 like-for-like3: €238.6 million); adjusted for currency effects the like-for-like growth was 6.1%, reflecting a strong underlying performance across all regions.
34

EBITDA
50,000
55,000
60,000
65,000
70,000
75,000
80,000
85,000
90,000
95,000
100,000
YEAR-ON-YEAR EBITDA GROWTH €’000
€82.7
€8.4€3.5
€(1.0)€1.2 €94.8
Reported2013
Growth
14.6% EBITDA growth
Divestments Newopenings
Reported2014
FXimpact
EBITDA increased by 14.6% to €94.8 million (2013: €82.7 million) and our reported EBITDA margin for the year increased by 130bps to 35.1% (2013: 33.8%). On a like-for-like basis1, our EBITDA increased by 14.5% to €93.6 million (2013 like-for-like3: €81.7 million) and our EBITDA margin increased to 35.6%. 4.3%
of the like-for-like EBITDA growth was caused by currency exchange effects. The primary reason for the increased EBITDA margin is tight cost control. The increased EBITDA in 2014 includes a one-off benefit of €1.0 million, as a result of a local authority tax settlement in the German region.
Normalised profit before taxReconciliation reported to normalised profit
Year ended 31 Dec 2014
€ million
Year ended 31 Dec 2013
Restated1
€ million
Reported profit before tax 41.6 27.3
Fair value movements on derivatives recognised in the profit and loss (0.3) (0.8)
Fair value adjustment of the deferred purchase price of the acquisition of the remaining interests in three hotels and one development in the Netherlands (2012) and three hotels in the United Kingdom (2010) (2.5) (0.8)
Sale of 50% interest in art’otel berlin mitte and art’otel berlin kudamm (1.8) –
Sale of Thai development project – (2.8)
Pre-opening expenses – 0.9
Fair value adjustment on income swaps private investors Park Plaza Westminster Bridge London 3.6 (1.5)
Buy-back of Income Units Park Plaza Westminster Bridge London 0.3 –
Forfeited deposits from rescinded sale contracts of Income Units at Park Plaza Westminster Bridge London to private investors (8.0) (0.3)
Strategic advice expenses – (0.1)
Normalised profit before tax* 32.9 21.9
* The normalised earnings per share amounts to €0.79, calculated with 41,544 thousand average outstanding shares. 1 Certain amounts here do not correspond to the 2013 Consolidated financial statements; see Note 2(c) to the Consolidated
financial statements.
35

P P H E H O T E L G R O U P A N N U A L R E P O R T A N D A C C O U N T S 2 0 14
D E P U T Y C E O & C H I E F F I N A N C I A L O F F I C E R ’ S S TAT E M E N T C O N T I N U E D
Normalised profit before tax increased by 50.4% to €32.9 million (2013: €21.9 million). The increase in profit is mainly caused by a higher EBITDA and a €1.7 million currency exchange gain on foreign currency assets. Adjustments made to normalise reported results relate to items that the Group considers unrelated to its day-to-day
business activities. Reported profit before tax was €41.6 million (2013: €27.3 million) and includes a profit of €8.0 million following the settlement of a dispute in relation to forfeited deposits on the rescinded sales of Income Units at Park Plaza Westminster Bridge London to private investors.
Earnings and reported net asset value per share
IPO 2008 2009 2010 2011 2012 2013 2014
50,000
100,000
150,000
200,000
250,000
300,000
350,000
VALUATION
■ Net asset value € ‘000 ■ Market cap € ‘000
€0.67). Normalised earnings per share was Reported basic/diluted earnings per share for the period increased by 49.6% to €1.00 (2013: €0.79 (2013: €0.54), representing a 46.8% increase. Reported net asset value per share (total equity / number of outstanding shares) amounts to €7.80 (2013: €7.18).
Dividend For 2014, the Board is proposing the payment of an increased final dividend of 10.0 pence per share (2013: 8.0 pence per share), which when combined with the interim dividend of 9.0 pence per share
(2013: 6.0 pence per share), amounts to a total dividend for the year ended 31 December 2014 of 19.0 pence per share (2013: 14.0 pence per share), an increase of 35.7%. Provided that business continues at the same level, we anticipate to follow a progressive dividend policy going forward. Subject to shareholder approval at the Annual General Meeting, to be held on 20 April 2015, the dividend will be paid on 21 April 2015 to shareholders on the register at 20 March 2015. The shares will go ex-dividend on 19 March 2015.
Financial positionLOAN TO VALUEPROPERTIES AT COST1
■ Equity funded■ Bank funded
33%
67%
LOAN TO VALUEPROPERTIES AT FAIR VALUE1,2
■ Equity funded■ Bank funded
44%
56%
1 Property includes the balance of Property, Plant and Equipment (€823 million); bank funding equals the total long and short-term borrowings (€555 million).
2 The fair value is based on the last valuations performed by external valuators, which were prepared for banking purposes.
36

Net bank debt as at 31 December 2014 was €483.1 million, an increase of € 0.1 million (as at 31 December 2013: €483.0 million). This includes €71.6 million of liquid assets (as at 31 December 2013: €43.0 million), of which cash and cash equivalents were €70.2 million (as at 31 December 2013: €41.5 million) and other liquid financial assets of €1.5 million (as at 31 December 2013: €1.5 million). During the period, the movement in net bank debt included, among others, an increase due to the drawdown of €3.0 million out of a €30.0 million term facility; a €20.0 million increase to finance construction of our project near London Waterloo Station; a €3.6 million increase to finance construction of the Park Plaza Nuremberg development; and a €24.1 million increase which relates to foreign exchange. In addition, a decrease of €12.1 million relates to the divestment of 50% interest in two properties in Berlin and a decrease of €12.4 million due to the redemption of loans. The Group’s gearing ratio (net bank debt as a percentage of total capital (equity adjusted for the hedging reserve plus net bank debt) improved by 2.7% to 58.1% (as at 31 December 2013: 60.8%). The vast majority of the Group’s bank borrowings are asset backed. The ratio of bank borrowings to the fair value of the Group’s properties on an aggregate basis on the latest market valuations (LTV) is approximately 56%.
Return on capital employed PPHE Hotel Group actively pursues a strategy of hotel ownership, which is different from many hotel groups where ownership of hotel assets is separated from hotel operations. One of the benefits of our owner/operator model is to ameliorate conflicts of interests. Our strategy has proven to create significant value by enabling the Group to fund its growth in recent years. The Group has the expertise to master the complexities involved in real estate ownership and transactions, including debt/equity structuring, exit strategies, and (re)developing real estate into valuable hotel properties.
Hotel real estate is an important part of the Group’s assets and it is essential to understand this ownership business model to be able to accurately value this critical investment. This model is capital intensive and the funding structure of these properties using debt and equity has a significant
impact on equity returns of the Group. Properties under development place a burden on the capital of the Group, without creating an immediate return. However, once these developments complete, they will add to the profitability of the Group like any other trading asset it owns.
Although the Group pursues full property ownership in many cases, we understand that the capital intensity required for full ownership may hinder the Group’s growth in other attractive markets. Therefore the Group has a mixed portfolio approach that provides a spread of risk and reward. The Group has entered into several strategic investments, whereby a non-controlling stake was taken in the real estate together with long-term management agreements. In some of these cases the Group’s stake is structured via equity interests and debt funding, providing the Group with potential dividends and interest income. One of the main benefits from such arrangements remains the management and incentive fee earned by the Group in managing these hotels. Furthermore, the Group has entered into several lease, management or franchise agreements. Each of these business models has its own merits but have in common that they require little to no capital. This enables the Group to grow the portfolio whilst it benefits from fee-based income.
The table on page 38 provides some selected data for these assets for the year ended 31 December 2014, prepared in Euro millions. This data is additional to the segments that are monitored separately by the board for resource allocations and performance assessment, which are the segments of the Group, see Note 29 on page 109 for further details.
The table on page 38 shows that the return on capital (normalised profit before tax divided by capital employed) for the fully owned properties in operation improved during the year, mainly due to improved operational trading of the hotels. The increased performance in the capital return on joint ventures and associates is mainly due to an increased performance related to incentive fees, as well as the divestment of a 50% interest in two properties in Berlin, for which the remaining stake (non-controlling) is now presented under Joint ventures and associates.
37
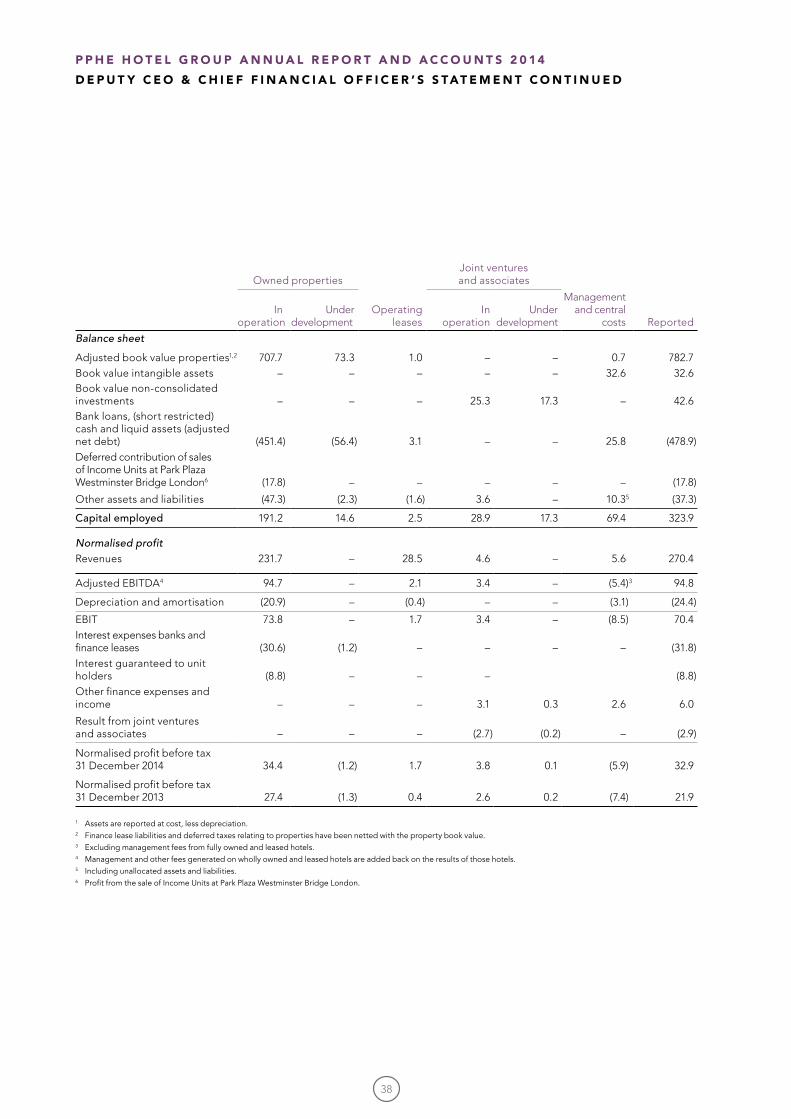
Owned propertiesJoint ventures and associates
In operation
Under development
Operatingleases
Inoperation
Under development
Managementand central
costs Reported
Balance sheet
Adjusted book value properties1,2 707.7 73.3 1.0 – – 0.7 782.7Book value intangible assets – – – – – 32.6 32.6Book value non-consolidated investments – – – 25.3 17.3 – 42.6Bank loans, (short restricted) cash and liquid assets (adjusted net debt) (451.4) (56.4) 3.1 – – 25.8 (478.9)Deferred contribution of sales of Income Units at Park Plaza Westminster Bridge London6 (17.8) – – – – – (17.8)
Other assets and liabilities (47.3) (2.3) (1.6) 3.6 – 10.35 (37.3)
Capital employed 191.2 14.6 2.5 28.9 17.3 69.4 323.9
Normalised profitRevenues 231.7 – 28.5 4.6 – 5.6 270.4
Adjusted EBITDA4 94.7 – 2.1 3.4 – (5.4)3 94.8
Depreciation and amortisation (20.9) – (0.4) – – (3.1) (24.4)
EBIT 73.8 – 1.7 3.4 – (8.5) 70.4Interest expenses banks and finance leases (30.6) (1.2) – – – – (31.8)Interest guaranteed to unit holders (8.8) – – – (8.8)Other finance expenses and income – – – 3.1 0.3 2.6 6.0
Result from joint ventures and associates – – – (2.7) (0.2) – (2.9)
Normalised profit before tax 31 December 2014 34.4 (1.2) 1.7 3.8 0.1 (5.9) 32.9
Normalised profit before tax 31 December 2013 27.4 (1.3) 0.4 2.6 0.2 (7.4) 21.9
1 Assets are reported at cost, less depreciation. 2 Finance lease liabilities and deferred taxes relating to properties have been netted with the property book value.3 Excluding management fees from fully owned and leased hotels.4 Managementandotherfeesgeneratedonwhollyownedandleasedhotelsareaddedbackontheresultsofthose hotels.5 Including unallocated assets and liabilities.6 ProfitfromthesaleofIncomeUnitsatParkPlazaWestminsterBridgeLondon.
P P H E H O T E L G R O U P A N N U A L R E P O R T A N D A C C O U N T S 2 0 14
D E P U T Y C E O & C H I E F F I N A N C I A L O F F I C E R ’ S S TAT E M E N T C O N T I N U E D
38

Developments Joint venture for two freehold hotels in Berlin, Germany On 13 January 2014, the Group announced that it had sold 50% of the shares in the companies which own the freeholds and operating businesses of art’otel berlin mitte and art’otel berlin kudamm. As part of this transaction 50% of the shareholder loans made by the Group were also assigned to the joint venture partner. The total aggregate consideration was €3.2 million. The Company and its joint venture partner also agreed to contribute €1.0 million each for the renovation of these hotels. The Group continues to manage the hotels under long-term hotel management agreements.
Completed €24.0 million refinancing of art’otel amsterdam, the NetherlandsOn 29 January 2014, the Company announced that it had completed the €24.0 million refinancing of art’otel amsterdam with Aareal Bank AG. Further details are set out in Note 17 to the Consolidated financial statements.
Extended existing facility for extension of London hotel On 16 June 2014, the Company completed an extension of an existing facility of £13.5 million (€16.5 million), with Aareal Bank AG, for the construction of the hotel extension at Park Plaza Riverbank London.
Construction financing for development of new London hotel On 19 June 2014, the Group announced that it had secured funding of up to £80.0 million (€98.1 million) from Banque Hapoalim (Luxembourg) S.A. to fund the redevelopment of a former office building near London Waterloo Station. The initial maturity date of the facility is in June 2017. However, subject to certain conditions, the Group has the right to extend the facility so that it matures in April 2018. Further details are set out in Note 17 to the Consolidated financial statements.
Looking ahead2015 will be an exciting year for us, with multiple product improvements under way or at detailed planning stages and several new hotels under construction. As previously announced, the planned renovations across several of our hotels may have a temporary negative impact on the performance of these hotels due to closures of rooms and public areas. However, we believe that our investment in these renovation projects will have a positive impact on our long-term performance.
We will strive to further improve the performance of our existing portfolio through focusing on consistent service delivery, revenue generation initiatives and managing our cost base carefully. Operational consolidation, centralised procurement and ongoing upgrading of our IT infrastructure are focus areas for us. Further improving our operating performance and upgrading and expanding our portfolio, will enable us to continue to maintain a progressive dividend policy in the years ahead.
39

U N I T E D K I N G D O M R E V I E W O F 2 0 14
P P H E H O T E L G R O U P A N N U A L R E P O R T A N D A C C O U N T S 2 0 14
R E V I E W O F T H E Y E A R
United Kingdom hotel portfolio performanceOnce again our hotels in the United Kingdom delivered a solid performance in 2014. The London market has continued to go from strength-to-strength, despite economic and political uncertainty in many feeder markets and the weakness of the Euro against Sterling.
The recovery in the provincial cities in the United Kingdom was encouraging. With the recent increased inward investment in Leeds, such as sporting and shopping facilities including the First Direct Arena and Trinity Leeds Shopping Centre, we expect Leeds’ appeal for leisure visitors to continue to improve.
Total revenue for our hotels in the United Kingdom on a local currency basis increased by 4.1% to £142.8 million (2013: £137.2 million). In Euro, total reported revenue increased by 10.1% to €178.0 million (2013: €161.6 million).
Euro (€)* GBP (£)*
Year ended 31 Dec 2014
Year ended 31 Dec 2013
Year ended 31 Dec 2014
Year ended31 Dec 2013
Total revenue €178.0 million €161.6 million £142.8 million £137.2 million
EBITDAR €66.0 million €58.0 million £53.0 million £49.2 million
EBITDA €64.3 million €56.7 million £51.6 million £48.2 million
Occupancy 87.5% 86.8% 87.5% 86.8%
Average room rate €171.6 €159.4 £137.7 £135.3
RevPAR €150.2 €138.3 £120.5 £117.4
Room revenue €123.1 million €114.1 million £98.7 million £96.9 million
* Franchised and/or managed hotels do not count towards any of the figures presented in the table above.
2,790 Rooms in operation
1,198Rooms in pipeline
Year-on-year growth was achieved despite the negative impact of a reduced number of rooms at Park Plaza Riverbank London due to the hotel extension being built. We expect this trend to continue in 2015.
In local currency, our EBITDAR increased by 7.7% to £53.0 million (2013: £49.2 million). In Euro, EBITDAR increased by 14.0% to €66.0 million (2013: €58.0 million). EBITDA for the period in local currency increased by 7.2% to £51.6 million (2013: £48.2 million) and in Euro EBITDA increased by 13.4% to €64.3 million (2013: €56.7 million).
Occupancy increased by 70bps to 87.5% (2013: 86.8%). In local currency, average room rate increased by 1.7% to £137.7 (2013: £135.3) and in Euro we report a 7.7% increase to €171.6 (2013: €159.4). As a result, our RevPAR for the region in local currency increased by 2.6% to £120.5 (2013: £117.4) and in Euro RevPAR was up by 8.6% to €150.2 (2013: €138.3).
40

Room revenue in local currency increased by 1.9% to £98.7 million (2013: £96.9 million) and in Euro by 7.8% to €123.1 million (2013: €114.1 million).
Two of our four London hotels and one of our two provincial hotels outperformed their competitive set in RevPAR during the year. Park Plaza Westminster Bridge London, our UK flagship hotel for the Park Plaza® brand, once again delivered a strong result with the hotel outperforming its competitive set in occupancy, average room rate and RevPAR. Due to construction work at Park Plaza Riverbank London, its performance was impacted with average room rate under pressure. Once these works and the renovation of our other London hotels are completed, we expect to further improve the competitive performance of our hotels.
Source: STR Global, December 2014.
Renovation projects and development pipelineIn April 2014, demolition started on the interiors of Hercules House, the former office building near London Waterloo Station. Planning and funding for the redevelopment to a hotel was obtained during the year and once complete, in 2016, this hotel will add 494 rooms to our already strong hotel portfolio on London’s Southbank.
In the third quarter of 2014, we began the development of the extension of Park Plaza Riverbank London. Through the addition of five floors and the reconfiguration of the hotel, this property will increase by 184 rooms to 645. This project is expected to be completed during winter 2015/2016. Once completed, the increased room count at this hotel will enable it to host more delegates for residential conferences, improving its appeal for this market segment. The Group is also expected to benefit in the long term from the strength and resilience of London’s real estate value.
In the last quarter of 2014, we progressed with our project near Park Royal in West London. Demolition of the former structure has been completed and construction work to develop a 168-room hotel on this site is under way. This hotel development is expected to be completed in 2016.
Additional work undertaken during the year includes the development and launch of an all-day café, 106 Baker Street, adjacent to Park Plaza Sherlock Holmes London and the progression of extensive renovation plans for this hotel. This renovation programme for this hotel is expected to commence in the third quarter of 2015.
Wholly owned hotelsPark Plaza LeedsPark Plaza NottinghamPark Plaza Riverbank LondonPark Plaza Sherlock Holmes LondonPark Plaza Victoria LondonPlaza on the River London
Part owned hotelPark Plaza Westminster Bridge London
Managed hotel* Park Plaza County Hall London
Franchised hotel*Park Plaza Cardiff
We worked closely with our JV partner during the year to further develop and fine-tune our plans for the development of the art’otel london hoxton. Construction is expected to start in 2015, with completion of this mixed-use scheme expected for 2019.
Looking ahead, we will continue to progress with our various construction projects. Extensive renovation projects are also planned for several of our existing hotels. These renovations are expected to commence in 2015.
The United Kingdom hotel market Hotel performance in greater London improved modestly with RevPAR increasing by 3.3% to £117.0. This growth was driven by a 2.7% increase in average room rate to £140.9 and occupancy increasing by 0.6 percentage points to 83.0%.
Double digit RevPAR growth was achieved by the hotel markets in Leeds and Nottingham. In Leeds, RevPAR increased by 13.7% to £49.1. This growth was primarily the result of a 10.6% increase in average room rate to £64.4, with occupancy increasing by 2.1 percentage points to 76.3%. The Nottingham hotel market reported an 11.5% increase in RevPAR to £41.2. Average room rate increased by 5.6% to £56.1 and occupancy by 3.9 percentage points to 73.5%.
Source: STR Global, December 2014.
41

T H E N E T H E R L A N D S R E V I E W O F 2 0 14
P P H E H O T E L G R O U P A N N U A L R E P O R T A N D A C C O U N T S 2 0 14
R E V I E W O F T H E Y E A R C O N T I N U E D
Our Dutch hotel portfolio performance Our hotel portfolio in the Netherlands reported a 26.7% increase in total revenue to €53.7 million (2013: €42.4 million). This growth was the result of improved trading and first full-year contributions from art’otel amsterdam, which opened in October 2013. On a like-for-like basis, total revenue increased by 9.0% to €46.2 million (2013: €42.4 million).
Reported EBITDAR for the region increased by 35.9% to €15.7 million (2013: €11.5 million) and on a like-for-like basis, growth was 25.5% to €14.5 million (2013: €11.5 million). EBITDA increased by 36.2% to €15.6 million (2013: €11.4 million). Like-for-like EBITDA increased by 25.7% to €14.4 million (2013: €11.4 million).
Occupancy increased by 430bps to 78.4% (2013: 74.1%). Average room rate during the period increased by 10.2% to €118.3 (2013: €107.4) predominantly as a result of a strong performance of art’otel amsterdam. Like-for-like average room rate increased by 3.1% to €110.7 (2013: €107.4). Overall RevPAR improved by 16.6% to €92.8 (2013: €79.6), with like-for-like RevPAR increasing by 9.4% to €87.1 (2013: €79.6).
Room revenue for the region increased by 25.5% to €37.8 million (2013: €30.2 million), with like-for-like room revenue increasing by 9.4% to €33.0 million (2013: €30.2 million).
The positive trends experienced in 2013 continued in 2014, although not all segments of the market are fully recovered and in recent years hotel supply has substantially increased, particularly in Amsterdam. As a result, competitive performances varied by hotel, with Park Plaza Vondelpark, Amsterdam, Park Plaza Utrecht and Park Plaza Eindhoven once
Reported Like-for-like*
Euro (€)Year ended
31 Dec 2014Year ended 31 Dec 2013
Year ended 31 Dec 2014
Year ended 31 Dec 2013
Total revenue €53.7 million €42.4 million €46.2 million €42.4 million
EBITDAR €15.7 million €11.5 million €14.5 million €11.5 million
EBITDA €15.6 million €11.4 million €14.4 million €11.4 million
Occupancy 78.4% 74.1% 78.8% 74.1%
Average room rate €118.3 €107.4 €110.7 €107.4
RevPAR €92.8 €79.6 €87.1 €79.6
Room revenue €37.8 million €30.2 million €33.0 million €30.2 million
* The like-for-like comparison figures exclude art’otel amsterdam for the first nine months of 2014.
1,117 Rooms in operation
42

Wholly owned hotelsart’otel amsterdam
Park Plaza Eindhoven Park Plaza Utrecht Park Plaza Vondelpark, Amsterdam Park Plaza Victoria Amsterdam Park Plaza Amsterdam Airport
again outperforming their respective competitive sets in RevPAR terms. Park Plaza Victoria Amsterdam delivered a solid RevPAR performance against its competitive set and Park Plaza Amsterdam Airport continued to improve its RevPAR performance year on year, while its competitive set lost ground. We are particularly encouraged by the strong start art’otel amsterdam has had in its first full year of operation.
Source: STR Global, December 2014.
Renovation projects and development pipelineDuring the period we continued to review and plan for the extensive renovation of three of our hotels in this region, with works taking place during the course of 2015 and 2016 which will significantly upgrade Park Plaza Victoria Amsterdam, Park Plaza Vondelpark Amsterdam and Park Plaza Utrecht.
The Dutch hotel marketThe hotel market in Amsterdam continued to show an improvement year-on-year, with RevPAR increasing by 6.0% to €91.3. Average room rate increased by 3.6% to €117.2 and occupancy increased by 1.8 percentage points to 77.9%.
In Utrecht, the performance of the general hotel market improved with RevPAR increasing by 3.6% to €57.7. This was the result of a 3.6% increase in average room rate to €87.0, with occupancy flat at 66.3%. The market in Eindhoven was under pressure with RevPAR decreasing by 1.8% to €36.3. Average room rate declined by 0.1% to €69.4 and occupancy dropped by 0.9 percentage points to 52.2%.
Source: STR Global, December 2014.
43

G E R M A N Y A N D H U N G A R Y R E V I E W O F 2 0 14
P P H E H O T E L G R O U P A N N U A L R E P O R T A N D A C C O U N T S 2 0 14
R E V I E W O F T H E Y E A R C O N T I N U E D
German and Hungarian hotel portfolio performance The performance was adversely impacted by a change in accounting policy affecting this region, due to our acquisition in 2013 of the freehold interests in two hotels in Berlin and the subsequent 50:50 joint venture agreement entered into for these two hotels in January 2014. As a result, the 2014 revenue and operating statistics from these hotels is no longer accounted for in the Germany and Hungary segment, but is recognised in Management and Holdings.
Against this backdrop, total revenue for the region decreased by 13.3% to €28.5 million (2013: €32.8 million). However, on a like-for-like basis, total revenue for the region increased by 6.8% from €26.6 million to €28.5 million showing a strong underlying performance.
Reported EBITDAR was flat at €8.5 million (2013: €8.5 million). However, with two hotels now partly owned instead of leased,
our like-for-like EBITDAR improved strongly by 21.6% to €8.5 million (2013: €7.0 million). Our reported EBITDA transformed from a negative in 2013 to €0.4 million positive in 2014. On a like-for-like basis, EBITDA improved from a (€1.0 million) loss in 2013 to €0.4 million profit in 2014. This growth was primarily due to a one-off benefit of €1.0 million, as a result of a local authority tax settlement, as well as improved trading across several hotels.
Occupancy increased by 570bps to 81.1% (2013: 75.4%) and on a like-for-like basis, occupancy increased by 690bps to 81.1% (2013: 74.2%). Average room rate was under pressure and decreased by 2.2% to €69.4 (2013: €71.0) and decreased by 3.1% on a like-for-like basis from €71.6 to €69.4. As a result, RevPAR increased by 5.1% to €56.3 (2013: €53.5) and on a like-for-like basis RevPAR increased by 5.9% to €56.3 (2013: €53.2).
Reported Like-for-like1
Euro (€)Year ended
31 Dec 2014Year ended 31 Dec 2013
Year ended 31 Dec 2014
Year ended 31 Dec 2013
Total revenue €28.5 million €32.8 million €28.5 million €26.6 million
EBITDAR €8.5 million €8.5 million €8.5 million €7.0 million
EBITDA €0.4 million €0 million €0.4 million €(1.0) million
Occupancy 81.1% 75.4% 81.1% 74.2%
Average room rate €69.4 €71.0 €69.4 €71.6
RevPAR €56.3 €53.5 €56.3 €53.2
Room revenue €21.2 million €24.9 million €21.2 million €20.0 million
1 The like-for-like comparison figures for 2013 exclude art’otel berlin mitte and art’otel berlin kudamm.
1,423 Rooms in operation
177Rooms in pipeline
44

Part owned hotels1
art’otel berlin mitteart’otel berlin kudamm
Leased hotelsart’otel budapestart’otel berlin city center westart’otel cologneart’otel dresden
Park Plaza Prenzlauer Berg BerlinPark Plaza Wallstreet Berlin Mitte
Franchised hotel2
Park Plaza Trier
1 The Group acquired the freehold interests in these hotels on 1 July 2013 and subsequently entered into a 50:50 joint venture on 13 January 2014.
2 Franchised hotels do not count towards any of the figures presented in the table on page 44.
Reported room revenue for the period decreased by 14.9% to €21.2 million (2013: €24.9 million), with like-for-like room revenue increasing by 5.9% to €21.2 million from €20.0 million in 2013.
Once again, our best performing hotel against its competitive set in this region was art’otel budapest which outperformed its competitive set in occupancy, average room rate and RevPAR. The performance of the three hotels in Berlin included in this reporting segment was mixed. Park Plaza Wallstreet Berlin Mitte and Park Plaza Prenzlauerberg Berlin outperformed their competitive set in RevPAR terms whilst art’otel berlin city center west showed positive growth year-on-year, but was still trailing its competitive set in RevPAR terms. The last trend also applied to art’otel cologne and art’otel dresden.
Source: STR Global, December 2014.
Renovation projects and development pipelineConstruction of the new Park Plaza Nuremberg project started in 2014 and this exciting new addition to our portfolio is expected to open in the fourth quarter of 2015. During the year we continued to progress with the renovation plans for art’otel berlin mitte and art’otel berlin kudamm, which are expected to commence in 2015. Renovations at art’otel cologne are
currently under way and additional renovations at art’otel budapest are also scheduled for 2015.
The German and Hungarian hotel marketThe hotels in greater Berlin reported a year-on-year increase of 4.5% in RevPAR to €66.4. This growth was the result of a 2.4 percentage point increase in occupancy to 74.3% and a 2.0% increase in average room rate to €89.3.
The hotel performance in Cologne was slightly below last year, with RevPAR decreasing by 0.8% to €63.2. This decrease was a result of the 3% reduction in average room rate to €91.5. Occupancy increased by 1.6 percentage points to 69.1%. In Dresden, the hotel performance improved with RevPAR increasing by 1.3% to €43.6. Occupancy increased by 2.0 percentage points to 66.2% and average room rates decreased by 1.7% to €65.9. In Hungary, the performance of the hotel market in Budapest continued to improve with RevPAR increasing by 11.5% to HUF10,133.5. This growth was a result of a 6.4% increase in average room rate to HUF15,277.1 and a 3.0 percentage point increase in occupancy to 66.3%.
Source: STR Global, December 2014.
45

M A N AG E M E N T A N D H O L D I N G S O P E R AT I O N S R E V I E W O F 2 0 14
P P H E H O T E L G R O U P A N N U A L R E P O R T A N D A C C O U N T S 2 0 14
R E V I E W O F T H E Y E A R C O N T I N U E D
Our performanceAs an owner/operator, a significant part of our hotel portfolio is owned and managed by us, and all related hotel management revenues for these hotels, which are included under the segment ‘Management and Holdings’, are eliminated upon consolidation as intra-Group revenue. This is a presentation adjustment only and does not affect the EBITDA of Management and Holdings. Management considers this segment crucial to its operations and the performance should be reviewed taking all revenue (before elimination) into consideration.
Total Management and Holdings revenue increased by 21.5% to €39.3 million (2013: €32.3 million) due mainly to improved trading, strengthening of Sterling against the Euro and the introduction of a new management fee structure across a large number of the Group’s hotels.
After elimination (consolidated presentation) of intra-Group revenue, reported revenues increased by 30.0% to €10.2 million (2013: €7.9 million). This increase was primarily the result of the improved performance of certain of the Group’s hotels. This increase is also due to revenues from two joint venture hotels in Berlin which were previously fully owned by the Group and therefore consolidated in the German region. The management related revenue in respect of these two hotels is not eliminated and now forms part of external revenues.
Although revenue increased significantly, reported EBITDA stayed flat at €14.5 million (2013: €14.5 million), mainly due to our new management fee structure.
Euro (€)Year ended
31 Dec 2014Year ended31 Dec 2013
Total revenue before elimination 39.3 million 32.3 million
Revenue within the consolidated Group 29.0 million 24.5 million
External and reported revenue 10.2 million 7.9 million
EBITDA 14.5 million 14.5 million
46

47

C R OAT I A R E V I E W O F 2 0 14
P P H E H O T E L G R O U P A N N U A L R E P O R T A N D A C C O U N T S 2 0 14
R E V I E W O F T H E Y E A R C O N T I N U E D
Arenaturist group is one of Croatia’s best known hospitality groups and consists of seven hotels, six holiday apartment complexes, eight campsites and over 50 food and beverage outlets, all of which are located in Istria. Arenaturist group caters primarily for European tourists and the majority of accommodation is only operational during the summer months. All properties are located in prime locations by the sea and are a short distance from either the 3,000-year-old city of Pula or the touristic town of Medulin.
In 2008, we acquired a 20% stake in WH/DMREF Bora B.V. (Bora), the holding company of the Arenaturist group, and we were awarded the management agreement for Arenaturist. Arenaturist d.d. is listed on the Zagreb Stock Exchange. The Arenaturist group is accounted for as an associate in the Consolidated financial statements.
The results from our investment in Bora (consisting of shares and loans) decreased marginally by € 0.1 million. This includes a loss of the investment in shares of €2.9 million (2013: loss of €2.6 million) and an interest income on loans of €3.0 million (2013: €2.7 million). Although this 20% stake contributes marginally towards the profit of the Group, we benefit from the management agreements that were awarded to us as part of this investment. The Group realised a total of €3.0 million of management and marketing fee revenues in the year (2013: €2.5 million).
Following extensive renovations, we reopened three of Arenaturist’s hotels as Park Plaza properties just before the start of the 2012 summer season. In 2013, the remaining rooms at Park Plaza Medulin were fully renovated and our flagship hotel in this market, Park Plaza Histria Pula, was extended by 127 rooms.
A fourth Park Plaza hotel, Park Plaza Belvedere Medulin, opened in summer 2014. The former Hotel Belvedere was rebranded following extensive renovation works and, with 427 rooms, it is our largest hotel in this market. Extensive renovation works started late 2014 at Hotel Park. Once completed, this hotel will reopen in summer 2015 as Park Plaza Arena Pula and will offer 175 rooms.
Notwithstanding challenging economic conditions and limited availability of credit, between 2012 and 2014 we have transformed and rebranded approximately half of Arenaturist’s hotel rooms.
For more information about Arenaturist, please visit arenaturist.com, and for the Park Plaza branded hotels and resorts visit parkplaza.com/croatia.
2,814 Rooms in operation
48

Part owned hotelsPark Plaza Histria PulaPark Plaza Arena Pula*Park Plaza MedulinPark Plaza Belvedere MedulinGuest House RivieraHotel BrioniHotel Holiday
Part owned resortsPark Plaza Verudela PulaAi Pini Medulin ResortHorizont ResortSplendid ResortVerudela Beach and Villas ResortKamp Kazela
* Following extensive renovations the former Hotel Park will reopen in summer 2015 as Park Plaza Arena Pula.
49

C O R P O R AT E S O C I A L R E S P O N S I B I L I T Y *
CertificationIt is important for us to know if we are on the right track with our activities and we therefore highly value external accreditation. Several of our hotels have worked with the respective authorities within the CSR area and have received the relevant accreditation. We will be reviewing similar initiatives for our other hotels.
Park Plaza County Hall London Gold award The Green Tourism Business Scheme, UK
Park Plaza Westminster Bridge London Gold award The Green Tourism Business Scheme, UK
Park Plaza Riverbank London Gold award The Green Tourism Business Scheme, UK
Park Plaza Sherlock Holmes London Silver award The Green Tourism Business Scheme, UK
Park Plaza Victoria London Silver award The Green Tourism Business Scheme, UK
Park Plaza Leeds Silver award The Green Tourism Business Scheme, UK
Park Plaza Nottingham Gold award The Green Tourism Business Scheme, UK
Park Plaza Victoria Amsterdam Silver award The Green Key
Park Plaza Utrecht Gold award Green Pluim (green compliment)
The Green KeyLocal municipality (Ten green businesses in the city)
Park Plaza Eindhoven Gold award The Green Key
Park Plaza Eindhoven Silver award Sustainable Entrepreneur (local municipality)
* All numbers presented in this CSR report apply to the Group’s owned and managed hotels located in the United Kingdom, the Netherlands, Germany and Hungary.
In recent years, we have integrated social and environmental considerations into our hotel management operations and corporate sustainability is now a day-to-day function. Our decisions taken in these areas will influence our goals and aspirations in the short, medium and long-term. Our Corporate Social Responsibility (CSR) activities are driven by the Group’s Executive Team and implemented and managed on hotel level, utilising the TREE (Total Responsibility for Everyone’s Environment) framework we have created.
TREE continuously engages team members, stakeholders, hotels’ green teams and regional and corporate offices across PPHE Hotel Group to reduce consumption of natural resources, reduce waste, support local communities and ensure that all employees are working in an ethical and fair environment with access to training and personal development. PPHE Hotel Group educates and facilitates our employees in environmental issues and actively encourages participation in activities and communication of ideas that will minimise our impact on the environment.
We use our role as an international hotel owner/operator to purchase via sustainable suppliers, and operate with controls that generate net positive benefits to the safety and well-being of our workforce and others and to the environment. New ideas to further improve our delivery in this area are welcomed and encouraged from all of our stakeholders.
As an expanding organisation, we set targets and measure performance against these. We believe that to achieve the right balance of addressing environmental and social issues, we will innovate in areas of process, people, and the environment and introduce core metrics to measure the things that matter in line with our governance structure. We will monitor implementation of this policy and publicly report on our progress.
Environmental initiativesDuring 2014, we succeeded in further reducing our CO2 footprint, with all regions successfully reducing their energy consumption. This achievement confirms our strong commitment and successful
P P H E H O T E L G R O U P A N N U A L R E P O R T A N D A C C O U N T S 2 0 14
50

progress towards our aim to reduce our 2011 carbon footprint by 20% by 2017.
Part of this reduction was achieved through initiatives such as the KiWi Power Demand Response Turn Down initiative at Park Plaza Westminster Bridge London. KiWi Power worked with Park Plaza Westminster Bridge London to install meters providing real-time electricity readings to help identify energy usage within the site, which could be turned down during peak periods and would not negatively impact the guest experience.
Park Plaza Westminster Bridge London uses a building management system to maintain levels of guest comfort and system activity within the hotel. When the National Grid initiates a demand response Short-term operating reserve (STOR) programme, KiWi Power calls upon the property to turn down these assets to pre-agreed and tested levels for up to two hours. KiWi’s technology aggregates this rebalanced power supply with other sites to relieve the demand on the Grid. This spares the National Grid calling upon less efficient and polluting solutions to deliver additional energy nationwide.
Key successes: • KiWi Power’s meter installation required
no capital expenditure investment and was installed within one month in 2013
• Based on the time of year KiWi can generate anywhere from 60-300kW’s of turn down from this site at each event.
These levels would not be enough for them to respond directly to the National Grid, but by working with an aggregator, this generated turn down forms part of a larger STOR programme, relieving pressure from the network during periods of peak demand
• Since installation in 2013, the hotel has been called upon to turn down for a total period of nine hours. The site has responded efficiently and effectively to each of these requests
• In these turn down periods the hotel has delivered 3,035 kWh back to the National Grid
• Our involvement has provided us with both electricity cost savings and additional revenue to put towards other sustainability projects
• This represents on offset for the CRC report of 1.5 tonnes to date
• Given the success of this project at our UK flagship hotel, we will be progressing with a turn down strategy across an additional six hotels in the group in London, Leeds and Nottingham
Across our Group, many of our hotels are equipped with energy efficient lighting. With over 60% of lighting being LED, we are committed to an ongoing phased replacement of halogen to LED lighting as part of our energy saving strategy.
Regional Managers and General Managers
Vision Mission Values Context Strategy
Corporate Social Responsibility
Managing CSR at the GroupOur CSR policy forms an integral part of our values and context and is proactively lived by the hotels and their teams.
51

Our annual participation in the Earth Hour project, through which we encourage our hotels to turn off all their non-essential lights for one hour, helps us to raise awareness among guests for the need to take action on climate change.
Local examples of initiatives undertaken include:
• In the Netherlands a number of hotels liaise with suppliers to remove packaging from deliveries and remove the packaging from site
• The installation of bailer waste recycling machines has significantly reduced waste. In 2014, Park Plaza Leeds reduced waste by over 50% as a result of the installation
• The UK central reservations office now operates a paperless system of operation; the main concept has been introduced to eliminate the printing and storage of paper backups, including the elimination of duplication and distribution of those backups for operational teams
• Park Plaza County Hall London adopted an animal at London Zoo
Team membersTaking into account our entire portfolio, including managed and franchised hotels, over 2,500 employees worked across our brands as at 31 December 2014. Our team consists of more than 30 nationalities, collectively speaking more than 70 languages.
In our Group we strongly believe that giving feedback to, and getting feedback from, our team members is of utmost importance and utilise several tools for this. At least once a year, our employees are invited to participate in an employee satisfaction survey. In 2014, we achieved a record of 83.5% (on a scale of 1-100). The participation rate in this survey was 92% of all employees invited, giving the results real value. 91% of participants perceive us as equally attractive or more attractive than other companies to work for. 86.3% of participants responded that they are willing to pursue a career with our Group.
The survey respondents were nearly evenly split, with 51% being female and 49% male. The largest age group was between 20-29 years of age (at 37%), followed by 35-44 years (21%), 30-34 years (19%), 45-54 years (15%), 55 years or older (5%) and less than 20 years of age (3%).
A place to growWe place great value on the quality of our people, as they are what make our business unique. While working to clearly defined strategies and frameworks, we encourage our people to think differently, to generate new ideas and to have space to be creative. We do not offer templated hospitality, and we differentiate ourselves by being innovative and proactive – and our people are central to this philosophy.
During 2014, we continued to invest in learning and development programmes with two groups of talented managers successfully completing our award-winning ‘Foundation in Management’ programme (aimed at coaching management in our business). With several new hotels in development, we are focused on retaining and further developing talented individuals and have created a bespoke talent management strategy with supporting programmes and initiatives. Our performance and development review system was also optimised to improve target setting.
Throughout the year, more than 100 team members were promoted internally.
P P H E H O T E L G R O U P A N N U A L R E P O R T A N D A C C O U N T S 2 0 14
C O R P O R AT E S O C I A L R E S P O N S I B I L I T Y C O N T I N U E D
52

Charitable activitiesIn 2014, many of our hotels and regional offices participated in a number of cancer charity events such as Breast Cancer Care and Pink Ribbon cancer charity events. Collectively we have raised over €25,000 during 2014.
United KingdomFor the second consecutive year several of our hotels in the United Kingdom supported the Street Smart / Sleep Smart fundraising campaign to help homeless people in local areas. During the year £16,000 was raised for this campaign.
The NetherlandsIn 2014, our hotels in the Netherlands continued to support various local charities with hotels sponsoring overnight stays for the Amsterdam Diner Foundation (dedicated to raising awareness of the importance of good health care in containing AIDS), as well as providing support to the Pink Ribbon breast cancer charity, raising in excess of €6,000.
Germany and HungaryIn Germany we continue to be supportive in carrying out various charity events and activities in order to support seriously ill children through the Kinderhilfe foundation. In addition, one hotel arranged a day at the zoo for local children in support of the Regina Sixt Children’s Aid foundation.
Individual achievementsWe continue to encourage each of our hotels to follow and support local challenges. In addition to the aforementioned foundations, hotels run events for charities of their own choice.
To name some:
• Park Plaza Leeds raised £2,200 for the School For Parents charity during a fashion and beauty pageant
• Park Plaza County Hall London raised over £1,000 for charity as a result of employees taking part in a sponsored abseil and sponsored bike and fun runs
• Several of our hotels in the Netherlands donated excess furniture. Team members of Park Plaza Eindhoven participated in a sponsored charity walk through the city in support of Eindhoven’s Glow charity event
• art’otel dresden supported a local homeless charity by providing dinner on two nights for local homeless people
Looking forwardTo further improve our CSR performance, we have identified key areas of focus for 2015 and beyond.
This includes:
• Proactive quarterly measurement of hotel carbon emission performance data
• Communication of success and targets to hotels through local environmental teams
• Identify further target savings in the four main areas of focus: electricity, gas, water consumption, and waste and recycling
• Develop additional tools and resources for hotel environmental teams to support training, improve communications and provide guidance
• Improve stakeholder engagement through increased communication
• Introduction of a CSR ‘hot topic of the month’ communicated to teams through poster and promotional material
• Consistent measurement of health and safety performance through accident trend analysis
• Work closely with suppliers to set environmental performance criteria and minimise the social and environmental impacts of the products and services we purchase
• Develop and introduce a key tactical activities CSR accreditation programme for hotels with measurable departmental targets to promote bronze, silver and gold levels of accreditation
• Commitment to our 2017 target of 20% reduction in our Carbon Footprint
53

B OA R D O F D I R E C T O R S
P P H E H O T E L G R O U P A N N U A L R E P O R T A N D A C C O U N T S 2 0 14
Skills and experience• Chairman of the Group since
formation
• Founder of the Red Sea Group and acted as its Chairman for 10 years
• Wealth of experience in the construction, design, development, financing, acquisition and management of leading hotels, including Park Plaza Westminster Bridge London, Park Plaza Riverbank London and many others
• Involved in the development of hundreds of thousands of square metres of retail space in shopping malls and large residential projects in the US, Eastern Europe and the Middle East
• Served as Chairman of the Israel Hotel Association
Skills and experience• Appointed Deputy Chief Executive
Officer in August 2014
• Chief Financial Officer of PPHE Hotel Group since 2005
• Financial Director of the Red Sea Group (2001 – 2004)
• Extensive experience in the hotel/leisure business and real estate investment market
• Previously Audit Manager at Deloitte
• Certified Public Accountant (ISR)
• MBA from the University of Manchester and Bachelor of Business from the Tel Aviv College of Management
Skills and experience• President of PPHE Hotel group
since 1991
• Brought Park Plaza® Hotels & Resorts brand to the Group in 1994 in collaboration with the Red Sea Group
• Major influencer in the expansion of the Group’s portfolio
• Established the Yamit Hotel, Israel in 1984 and served as its President
• Director of the Carlton Hotel in Israel (1979-1984)
• General Manager of the Royal Horseguards Hotel in London (1972-1979)
Eli Papouchado, 77 Non-Executive Chairman
Chen Moravsky, 44 Deputy Chief Executive Officer & Chief Financial Officer
Boris Ivesha, 69 President & Chief Executive Officer
54

Skills and experience• Real estate entrepreneur engaged
in various real estate activities in Eastern Europe
• Served as non-executive director of Delek Global Real Estate plc, an AIM-listed real estate company until 2010
• Previously a solicitor at the London offices of US law firms Chadbourne & Parke and Akin, Gump, Strauss, Hauer & Feld and General Counsel at PlaneStation Limited
• LLB law degree from Keio University in Tokyo, Japan and qualified solicitor in England and Wales
Board Committees:Remuneration Nominations Audit
Skills and experience• Member of the Society of Trust
and Estate Practitioners and a director of various regulated investment companies
• Retired Chairman of Carey Group (since joining as Chief Executive in 1999)
• Head of Advisory Services for Paribas International Private Banking and Managing Director of Paribas Suisse in Guernsey (1992-1999)
• Served as Finance Director of Ansbacher offshore banking group, appointed as Chief Executive of Ansbacher’s Guernsey bank and trust company business in 1994
• Held posts in 3 different departments in the States of Guernsey (1973 -1980)
Board Committees:Remuneration Nominations Audit
Skills and experience• Member of the Royal Institution
of Charted Surveyors (since 1989)
• Chief Executive of ComProp Limited (2001-2007) whilst it traded as an AIM-listed property company and during that time was responsible for major office developments including headquarter offices for Fortis, Kleinwort Benson and Generali, along with retail stores for B&Q and Waitrose
• Initially worked in Southampton for Humberts and dealt with management of coastal land forming part of the Crown Estate
• Moved to Guernsey and later established the Island’s first dedicated Commercial property practice in 1995
Board Committees:Nominations Audit
Elisha Flax, 53Non-Executive Director
Kevin McAuliffe, 57 Non-Executive Director & Senior Independent Director
Nigel Jones, 53Non-Executive Director
55

D I R E C T O R S ’ R E P O R T
The Directors present their report and the audited financial statements of the Company for the year ended 31 December 2014.
Principal activitiesThe Company is a Guernsey registered company and through its subsidiaries, jointly-controlled entities and associates, owns, leases, operates, franchises and develops full-service upscale and lifestyle hotels in major gateway cities and regional centres predominantly in Europe.
The Group’s hotels operate under three distinct brands, Park Plaza® Hotels & Resorts, art’otel® and Arenaturist.
The Group has an exclusive licence from CarlsonSM, a global privately owned hospitality and travel company, to develop and operate Park Plaza® Hotels & Resorts in Europe, the Middle East and Africa. The art’otel® brand is wholly owned by the Group.
The Group has a minority ownership interest in the Arenaturist group, one of Croatia’s leading hospitality companies.
The Group’s portfolio of owned, leased, managed and franchised hotels comprises 38 hotels offering a total of more than 8,300 rooms.
The Group’s development pipeline includes the construction of four new hotels, the extension and reconfiguration of one hotel, and the rebranding of two hotels which together are expected to add over 1,000 new rooms to the portfolio by the end of 2016 and an additional 352 rooms by the end of 2019.
Business review A review of the business during the year is contained in the Chairman’s statement, Chief Executive Officer’s statement, strategy and performance overview, Deputy Chief Executive & Chief Financial Officer’s statement and review of 2014.
Results and 2014 dividend The results for the year are set out in the attached Consolidated financial statements. Basic and diluted earnings per share for the year was €1.00 (2013: €0.67). The Board recommends to the Annual General Meeting to declare the payment of a final dividend of 10.0 pence per share for the year ended 31 December 2014.
As a matter of Guernsey law, any payment of dividends must be made in accordance with the provisions of the Companies (Guernsey) Law, 2008 (as amended). Prior to declaring any dividends, the Directors are required to carry out a liquidity or cash flow test and a balance sheet solvency test and must satisfy themselves on reasonable grounds that the Company will, immediately after the payment of the dividend remain solvent i.e. be able to pay its debts as they fall due and the value of its assets will continue to exceed the value of its liabilities. The test requires the Directors to make a future assessment by making reference to the solvency test being satisfied immediately after a distribution or dividend payment is made. If at the time a dividend or distribution payment is to be made, the Directors believe that the solvency test cannot be passed, then no payment may be made to the holders of shares.
Number of issued shares 43,492,792
Held in treasury by PPHE Hotel Group 1,862,000
Number of issued shares (excluding treasury) 41,630,792
Shareholders with holdings of 3% or more of the Company’s issued share capital (excluding treasury) as at 16 February 2015
Numberof shares
Percentage of issued share capital (excluding treasury)
Red Sea Group 18,552,714 44.56
Molteno Limited 7,990,027 19.19
Aroundtown Property Holdings Limited 3,762,000 9.04
Hargreave Hale 2,657,982 6.38
P P H E H O T E L G R O U P A N N U A L R E P O R T A N D A C C O U N T S 2 0 14
56

Principal risks and uncertainties Internal controls and an effective risk management regime are integral to the Group’s continued operation. Overall responsibility for the risk management processes adopted by the Group lies with the Board. On behalf of the Board, the Audit Committee reviews the effectiveness of the Group’s internal control policies and procedures for the identification, assessment and reporting of risks. In order to maintain oversight and seek comfort as to Group policies and procedures, the Group has an internal auditor who acts as a tool to rigorously and continuously test Group procedures. For further details in respect of the Group’s internal control processes, please refer to the Corporate Governance Report.
In this section we describe the Group’s principal risks and uncertainties. We provide information on the nature of the risk, actions to mitigate risk exposure and an indication of the significance of the risk by reference to its potential impact on the Group’s business, financial condition and results of operation and/or the likelihood of the risk materialising. Not all potential risks are listed overleaf. Some risks are excluded because the Board considers them not to be material to the Group as a whole. Additionally, there may be risks and uncertainties not presently known to the Directors, or which the Directors currently deem immaterial that may also have an adverse effect upon the Group.
DirectorsThe Directors, who served throughout the year, were as follows:
• Eli Papouchado (Non-Executive Chairman)
• Boris Ivesha (President & Chief Executive Officer)
• Chen Moravsky (Deputy Chief Executive Officer & Chief Financial Officer)
• Kevin McAuliffe (Senior Independent Non-Executive Director)
• Elisha Flax (Independent Non-Executive Director)
• Nigel Jones (Independent Non-Executive Director)
On 13 May 2013, Eli Papouchado appointed Yoav Papouchado as his alternate Director.
In accordance with good corporate governance practice, the entire Board will stand for re-election at the forthcoming Annual General Meeting. Details of the Directors’ remuneration are included within the Remuneration Report.
EmployeesDuring 2014, taking into account all our hotels, under all types of contract, approximately 2,500 team members were working for the Group.
Share capitalThe issued share capital of the Company together with the details of the movements in the Company’s share capital during the year are shown in Note 14 to the Consolidated financial statements.
Largest shareholdersThe table provided on page 56 contains shareholders holding 3% or more of the issued Ordinary shares (excluding treasury) as at 16 February 2015, of which the Company has been notified by its Registrar.
AuditorsKost Forer Gabbay & Kasierer, a member of Ernst & Young Global, have expressed their willingness to continue in office as auditors and a resolution to re-appoint them will be proposed at the forthcoming Annual General Meeting.
Going concernThe Board believes it is taking all appropriate steps to support the sustainability and growth of the Group’s activities. Detailed budgets and cash flow projections have been prepared for 2015 and 2016 which show that the Group’s hotel operations will be cash generative during the period. This, taken together with their conclusions on the matters referred to below and in Note 1(c) to the Consolidated financial statements, has led the Directors to conclude that it is appropriate to prepare the 2014 Consolidated financial statements on a going concern basis.
Financial risk management objectives and policiesIn addition, Note 31 to the Consolidated financial statements includes the Company’s objectives, policies and processes for managing its capital, its financial risk management objectives, details of its financial instruments and hedging activities and its exposure to credit risk and liquidity risk.
57

Important events since the end of the financial yearThe proposed payment of a final dividend of 10.0 pence per share for the year ended 31 December 2014, details of which are set out in Note 32 to the Consolidated financial statements.
Directors’ responsibilities The Directors are required to prepare the Directors’ Report and the Consolidated financial statements for each financial year which give a true and fair view of the state of affairs of the Company and the undertakings included in the consolidation taken as a whole, as at the end of the financial year and of the profit or loss for that year.
In preparing the Consolidated financial statements, the Directors are required to:
• select suitable accounting policies and apply them consistently;
• make judgements and estimates that are reasonable;
• state whether applicable accounting standards have been followed, subject to any material departures disclosed and explained in the Consolidated financial statements; and
• prepare the Consolidated financial statements on a going concern basis unless it is inappropriate to presume that the Company will continue in business.
The Directors confirm that they have complied with the above requirements in preparing the Consolidated financial statements.
The Directors are responsible for keeping proper accounting records which disclose with reasonable accuracy at any time the financial position of the Company and enable them to ensure that the Consolidated financial statements have been properly prepared in accordance with the Companies (Guernsey) Law, 2008 (as amended). The Directors are responsible for safeguarding the assets of the Company and hence for taking reasonable steps for the prevention and detection of fraud and other irregularities.
Directors’ declarationSo far as each of the Directors is aware, there is no relevant audit information of which the Company’s auditor is unaware and each has taken all the steps he ought to have taken as a Director to make himself aware of any relevant audit information and to establish that the Company’s auditor is aware of that information.
Directors’ responsibility statement The Board confirms to the best of its knowledge that the Consolidated financial statements, which have been prepared in accordance with International Financial Reporting Standards (IFRS) as adopted by the European Union, give a true and fair view of the assets, liabilities, financial position and profit and loss of the Company and the undertakings included in the consolidation taken as a whole.
The Business review, the Chairman’s statement, the Chief Executive Officer’s statement and the Deputy Chief Executive Officer & Chief Financial Officer’s statement, all of which are incorporated into this report, include a true and fair view of the development and performance of the business and the position of the Company and the undertakings included in the consolidation taken as a whole, together with a description of the principal risks and uncertainties that they face and provides information necessary for shareholders to assess the Company’s performance, business model and strategies.
BORIS IVESHA PRESIDENT & CHIEF E XECUTIVE OFFICER
CHEN MORAVSK Y DEPUT Y CHIEF E XECUTIVE OFFICER & CHIEF FINANCIAL OFFICER
27 February 2015
P P H E H O T E L G R O U P A N N U A L R E P O R T A N D A C C O U N T S 2 0 14
D I R E C T O R S ’ R E P O R T C O N T I N U E D
58

Risk and impact Mitigation Grading Year-on-year
Information technology and systems The Group is reliant on certain technologies and systems for the operation of its business. Any material disruption or slowdown of the Group’s information systems, especially any failures relating to its reservation system, could cause valuable information to be lost or operations to be delayed.
In addition, the Group and its hotels maintain personal customer data, which is shared with and retained by the Group’s partners. Such information may be misused by employees of the Group or its partners or other outsiders if there is an inappropriate or unauthorised access to the relevant information systems.
The Group invests in appropriate IT systems so as to obtain as much operational resilience as possible. Further, a variety of security measures are implemented in order to maintain the safety of personal customer information.
High
Hotel industry risks The Group’s operations and their results are subject to a number of factors that could adversely affect the Group’s business, many of which are common to the hotel industry and beyond the Group’s control, such as the global economic downturn and the increase of acts of terrorism. The impact of any of these factors (or a combination of them) may adversely affect sustained levels of occupancy, room rates and/or hotel values.
Although management continually seeks to identify risks at the earliest opportunity, many of these risks are beyond the control of the Group. The Group has in place contingency and recovery plans to enable it to respond to major incidents or crises and takes steps to minimise these exposures to the greatest extent possible.
High
The Group’s borrowings The vast majority of the Group’s bank borrowings are with two banks and these financing arrangements contain either cross-collaterisation or cross-default provisions. Therefore, there is a risk that more than one property may be affected by a default under these financing arrangements. The Group is exposed to a variety of risks associated with the Group’s existing bank borrowings and its ability to satisfy debt covenants. Failure to satisfy obligations under any current or future financing arrangements could give rise to default risk and require the Group to refinance its borrowings.
The Group uses debt to partly finance its property investment. By doing so, the Group leverages its investment and is able to acquire properties without raising equity. Leverage magnifies both gains and losses, therefore the risk of using leverage is that the loss is much greater than it would have been if the investment had not been leveraged. The risk exists that interest expenses and default on debt covenants negatively impact shareholder value and return.
The Board monitors funding needs regularly. Financial covenant ratios are monitored and sensitised as part of normal financial planning procedures. For details of the Company’s hedging arrangements and financial covenants, please refer to Notes 31(h) and 17 to the Consolidated financial statements.
Medium
Fixed operating expenses The Group’s operating expenses, such as personnel costs, operating leases, information technology and telecommunications, are to a large extent fixed. As such, the Group’s operating results may be vulnerable to short-term changes in its revenues.
The Group has appropriate management systems in place (such as staff outsourcing) designed to create flexibility in the operating cost base so as to optimise operating profits in volatile trading conditions.
Medium
Foreign exchange rate fluctuations The exchange rates between the functional currency of the Group’s subsidiaries operating outside the Eurozone, and the Euro (the reporting currency for the purposes of the Consolidated financial statements) may fluctuate significantly, affecting the Group’s financial results. In addition, the Group may incur a currency transaction risk in the event that one of the Group companies enters into a transaction using a different currency from its functional currency.
The Group eliminates currency transaction risk by matching commitments, cash flows and debt in the same currency with the exception of the outstanding consideration in Thai Baht relating to the disposal of the site in Pattaya Bay, Thailand. After due and careful consideration, the Group decided not to hedge this currency risk.
Medium
The Park Plaza® Hotels & Resorts brand and reservation system The Group’s rights to the Park Plaza® Hotels & Resorts brand stem from a territorial licence agreement with CarlsonSM, pursuant to which the Group has the exclusive right to use (and to sub-license others to use) the Park Plaza® Hotels & Resorts trademark in 56 countries within the EMEA region. This agreement also allows the Group to use CarlsonSM’s global central reservation system, participate in its various loyalty schemes and have access to global distribution channels connected to their central reservation system. Failure to maintain these rights could adversely affect the Group’s brand recognition and its profitability. The Group is also dependent on CarlsonSM to invest in the further development of its global reservation system and associated technologies and infrastructure. The Park Plaza® Hotels & Resorts outside of the EMEA region are managed or franchised by CarlsonSM directly, and failure on their end to control and maintain a similar quality level of hotels may have a detrimental effect on the reputation of the Park Plaza® brand and the hotels operating under the brand name.
The Group’s rights to use the Park Plaza® Hotels & Resorts brand and CarlsonSM’s central reservation system are in perpetuity. This unique and exclusive partnership is reinforced by the Group’s continued focus on operational efficiency and portfolio growth through its intensified cooperation with CarlsonSM. To ensure the Group’s interests are represented, several of its executives and managers participate in collaborative groups initiated by CarlsonSM to discuss, review and optimise the collective performance in areas such as Sales, Loyalty Marketing, Partnerships, E-commerce and Distribution.
Medium
Development projectsThe Group has various ongoing development projects which are capital intensive. These development projects may increase the Group’s expenses and reduce the Group’s cash flows and revenues. If capital expenditures exceed the Group’s expectations, this excess would have an adverse effect on the Group’s available cash. There is a risk that such developments may not be available on favourable terms, that construction may not be completed on schedule or within budget, and that the property market conditions are subject to changes on environmental law and regulations, zoning laws and other governmental rules and fiscal policies.
The Group retains an ownership interest in the development sites and therefore it is well placed to capitalise on any future rises in property prices. The Group tends to enter into fixed price turn-key contracts in respect of its developments in order to minimise the risk of cost overrun. The Group draws on its previous experience in running and managing developments to manage potential development risks.
Medium
Capital required to maintain product standardsThe Group owns and co-owns many of its hotels. As is common in owning hotels, this business model requires capital to maintain the high quality level of the products and facilities offered. In addition to maintenance costs and capital expenditure, the Group may be exposed to disruptions on revenue if hotels are to be (part) closed for product improvements.
The Group focuses heavily on preventative maintenance across its portfolio and employs engineers and technicians to ensure its hotels are maintained to a high standard. In addition, as part of its operating agreements, the Group has capital expenditure reserves for each hotel to invest in medium- to large renovations and replacements of technical installations. To minimise short-term revenue displacements due to renovations, the Group develops – prior to undertaking such renovations – detailed renovation planning programmes which take into account factors such as hotel closures, phased approaches, seasonality and demand patterns.
Medium
Market disruptorsThe travel industry has changed considerably in recent years as a result of changes in travel patterns, emergence of low-cost airlines and online travel agents, new technologies and changes in customer booking behaviour and travel expectations. This trend is expected to continue and the travel industry is expected to continue to be impacted by the rise of online travel booking agents and other dominant forces such as search engines and social media networks. The Group is exposed to risks such as the dominance of one such third party over another, the loss of control over its inventory and/or pricing and challenges to keep up with developments in the market.
The Group invests in areas such as connectivity to third parties, distribution and marketing of its products, e-commerce and technology. The Group further mitigates this risk by working closely with CarlsonSM, ensuring global trends are identified and acted upon in a concerted manner, benefiting from the scale, negotiating power, knowledge and skills that our global partnership brings. Executives and managers of the Group regularly attend seminars, workshops and trainings to ensure their knowledge is kept up-to-date.
Medium
Employee turnover The success of the Group’s business is partially attributable to the efforts and abilities of its (senior) managers and key executives. Failure to retain its executive management team or other key personnel may threaten the success of the Group’s operations. The consistent delivery of high quality service levels depends on the skills and knowledge of our teams. A high turnover rate may threaten the consistent delivery of this service level.
The Group has appropriate systems in place for recruitment, reward and compensation and performance management. Development and maintenance of a Group culture and comprehensive training programmes and feedback systems also play a leading role in minimising this risk.
Low
Unchanged during the year Increased during the year Reduced during the year
59

C O R P O R AT E G OV E R N A N C E
KEVIN MCAULIFFENON - E XECUTIVE DIREC TOR & SENIOR INDEPENDENT DIREC TOR
P P H E H O T E L G R O U P A N N U A L R E P O R T A N D A C C O U N T S 2 0 14
60

IntroductionAs a company, whose shares are admitted to the standard listing segment of the Official List of the UK Listing Authority, the Company is not required to comply with the requirements of the UK Corporate Governance Code published by the Financial Reporting Council (FRC) in 2012 (the ‘Corporate Governance Code’) and available from the FRC website (www.frc.org.uk). However, the Board recognises the value of high standards and has put in place a framework for corporate governance as described below and which, in the Directors’ opinion, is appropriate for the Group.
The Directors are committed to maintaining a high standard of corporate governance and intend to continue to comply with those aspects of the Corporate Governance Code which they consider appropriate, taking into account the size of the Company and the nature of its business.
Board composition, roles and independence The Company currently has six Directors, four of whom are Non-Executives (including the Chairman, Eli Papouchado). The two Executive Directors are Boris Ivesha, Chief Executive Officer and Chen Moravsky, Deputy Chief Executive Officer & Chief Financial Officer.
The Corporate Governance Code recommends that the Board of Directors of a listed company includes a balance of Executive and Non-Executive Directors such that no individual or small group of individuals can dominate the Board’s decision-making. The Corporate Governance Code further recommends that the Chairman, on appointment, be independent.
The Company’s Chairman, Eli Papouchado, is the founder of the Red Sea Group (of which Euro Plaza Holding B.V., the Company’s largest shareholder, is a part) and was not therefore on appointment, and is not, independent of the Company. However, the Board believes that Eli Papouchado’s extensive experience and knowledge of the Group’s business as well
as the hotel business generally justify this departure from the recommendations of the Corporate Governance Code. On 13 May 2013, Eli Papouchado appointed Yoav Papouchado as his alternate Director.
As recommended by the Corporate Governance Code, three of the Directors (being more than half of the Board excluding the Chairman), namely Elisha Flax, Kevin McAuliffe and Nigel Jones are regarded by the Company as being independent of management and free from any business or other relationship that could materially interfere with the exercise of their independent judgement. Kevin McAuliffe has an indirect 1% interest in C.L. Secretaries Limited, the Company’s Secretary. The Board does not, however, consider this interest to be sufficiently material to affect Mr. McAuliffe’s independence.
As recommended by the Corporate Governance Code, the Board has appointed Kevin McAuliffe as the Senior Independent Director to provide a sounding board for the Chairman and to serve as an intermediary for the other Directors when necessary. During the year, the independent Non-Executive Directors held meetings without the presence of Executive Directors and the Chairman.
The Board has responsibility for the Group’s strategic and financial policies and meets regularly. All the Directors have access to the advice and services of the Group’s General Counsel and Company Secretary and are able to gain access to external independent advice at the Company’s expense should they wish to do so in the furtherance of their duties.
An appropriate balance of Executive and Non-Executive members of the Board is maintained and the Board is supplied with regular and timely information concerning the activities of the Group in order to enable it to exercise its responsibilities and control functions in a proper and effective manner.
The Board has a breadth of experience relevant to the Company, and the Directors believe that any changes to the Board’s composition can be managed without
61

Meeting and Committee attendance
Name RoleBoard
meetingsAd Hoc
CommitteeAudit
CommitteeRemuneration
CommitteeNominations
Committee
Eli Papouchado Non-Executive Chairman 1 – NA NA NA
Boris Ivesha President & Chief Executive Officer 4 – NA NA NA
Chen Moravsky Deputy Chief Executive Officer & Chief Financial Officer
4 1 NA NA NA
Kevin McAuliffe Non-Executive Director & Senior Independent Director
5 6 5 3 1
Elisha Flax Non-Executive Director 4 1 3 3 1
Nigel Jones Non-Executive Director 5 5 5 NA 1
Total meetings held 5 6 5 3 1
undue disruption. With any new Director appointment to the Board, an appropriate induction will be set up.
The Board considers agenda items laid out in the notice of Board meeting and agenda which are formally circulated to the Board in advance of the Board meetings as part of the Board papers and therefore Directors may request any agenda items to be added that they consider appropriate for Board discussion. In instances when the Chairman is not present, the Senior Independent Director will chair the meeting. Each Director is required to inform the Board of any potential or actual conflicts of interest prior to Board discussion.
The primary focus at Board meetings is a review of operating performance, potential investments and joint ventures and matters such as financing arrangements, as well as marketing/investor relations, risk management, general administration and compliance, peer group information and industry issues.
The Board evaluates its performance and considers the tenure of each Director on an annual basis, and believes that the mix of skills, experience, ages and length of service is appropriate to the requirements of the Company. The entire Board retires and stands for re-election annually at the Annual General Meeting.
The roles of the Chairman and the Chief Executive Officer are separate and clearly defined. The scope of these roles is approved and kept under review by the Board so that no individual has unfettered decision-making powers.
The Chairman is responsible for the leadership and governance of the Board and the Chief Executive Officer for the management of the Group and the implementation of Board
strategy and policy on the Board’s behalf. In discharging his responsibilities, the Chief Executive Officer is advised and assisted by senior management.
During the financial year, the Board held five Board and six ad hoc Board Committee meetings.
Directors’ dutiesThe Directors have adopted a set of reserved powers, which establish the key purpose of the Board and detail its major duties.
These duties cover the following areas of responsibility:
• statutory obligations and public disclosure;
• strategic matters and financial reporting;
• oversight of management and personnel matters;
• risk assessment and management, including reporting;
• monitoring, governance and control; and
• other matters having material effects on the Company.
These reserved powers of the Board have been adopted by the Directors to clearly demonstrate the seriousness with which the Board takes its fiduciary responsibilities and as an ongoing means of measuring and monitoring the effectiveness of its actions.
External appointmentsDirectors may hold directorships or other significant interests with companies outside of the Group which may have business relationships with the Group. Executive Directors may not accept external directorships and retain any fees earned from those directorships without prior discussion with the Chief Executive Officer. Provided always that this does not lead to any conflicts of interest and that they do not hold more
P P H E H O T E L G R O U P A N N U A L R E P O R T A N D A C C O U N T S 2 0 14
C O R P O R AT E G O V E R N A N C E C O N T I N U E D
62

than one non-executive directorship in a FTSE 100 company nor the chairmanship of such company. In the case of the Chief Executive Officer, prior discussion will need to be held with the Chairman.
Directors’ indemnities and protectionsThe Company has arranged appropriate insurance cover in respect of any legal action against Directors and senior managers of companies within the Group. In addition, the Articles of Incorporation of the Company permit the Directors and officers of the Company to be indemnified in respect of liabilities incurred as a result of their office.
Board CommitteesIn accordance with the Corporate Governance Code, the Company has established the following Committees in order to carry out work on behalf of the Board: an Audit Committee, a Remuneration Committee and a Nominations Committee.
Audit Committee The Audit Committee is comprised of Kevin McAuliffe (Non-Executive Director & Senior Independent Director), Elisha Flax (Non-Executive Director) and Nigel Jones (Non-Executive Director).
Contrary to the requirements of the Corporate Governance Code, none of the members of the Audit Committee have recent and relevant experience, which for these purposes is taken to be a professional qualification from one of the professional accounting bodies. However, the Board considers that the members’ substantial experience of dealing with financial matters is more than adequate to enable the Audit Committee to properly discharge its duties in light of the nature of the Company’s business.
There have been five Audit Committee meetings during 2014.
For further details in respect of the Audit Committee’s role, function and responsibilities, please refer to the Audit Committee Report in this section.
Remuneration CommitteeA Remuneration Committee has been established and comprises Elisha Flax (Chairman) and Kevin McAuliffe. The Remuneration Committee advises the Board on an overall remuneration policy and meets as and when required. The Remuneration Committee also determines, on behalf of the Board, and with the benefit of advice from external consultants, the remuneration packages of the Executive Directors. The
Board determines the remuneration of the Non-Executive Directors.
There have been three Remuneration Committee meetings during 2014.
Nominations CommitteeA Nominations Committee has been established and comprises Elisha Flax (Chairman), Nigel Jones and Kevin McAuliffe. Whenever possible, all such Non-Executive Directors are present at meetings of the Nominations Committee. The Nominations Committee carries out the selection process for the appointment of candidates to the Board and proposes names for approval by the full Board.
There was one Nominations Committee Meeting held during 2014.
Communications with shareholdersThe Board is accountable to the Company’s shareholders and as such it is important for the Board to appreciate the aspirations of the shareholders and equally that the shareholders understand how the actions of the Board and short-term financial performance relate to the achievement of the Company’s longer-term goals.
The Board reports to the shareholders on its stewardship of the Company through the publication of interim and final results each year. Press releases are issued throughout the year and the Company maintains a website (pphe.com) on which press releases and the Annual Report and accounts are available to view. Additionally, this Annual Report contains extensive information about the Company’s activities. Enquiries from individual shareholders on matters relating to the business of the Company are welcomed. The Executive Directors and Non-Executive Directors also meet with major shareholders to discuss and review the progress of the Company and to understand their issues and concerns, as well as discussing governance and strategy.
The Chief Executive Officer and the Deputy Chief Executive & Chief Financial Officer provide periodic feedback to the Board following meetings with shareholders.
The Annual General Meeting provides an opportunity for communication with all shareholders and the Board encourages the shareholders to attend and welcomes their participation. The Directors attend the Annual General Meeting and are available to answer questions. Details of resolutions to be proposed at the Annual General Meeting of the Company to be held on 20 April 2015
63
are included in the notice of Annual General Meeting which has been posted to shareholders and can be found on the Company’s website pphe.com.
Internal controlsThe Directors acknowledge their responsibility for establishing and maintaining the Group’s & the Company’s systems of internal control. These are designed to safeguard the assets of the Group and to ensure the reliability of financial information for both internal use and external publication.
The Group’s internal control procedures include Board approval for all significant projects. All major expenditures require either senior management or Board approval at the appropriate stages of each transaction. A system of regular reporting covering both technical progress of projects and the state of the Group’s financial affairs provides appropriate information to management to facilitate control. The Board reviews, identifies, evaluates and manages the significant risks that face the Group.
The Group has in place internal control and risk management systems in relation to the Group’s financial reporting process and the Group’s process for preparing consolidated accounts. These systems include policies and procedures to ensure that adequate accounting records are maintained and transactions are recorded accurately and fairly to permit the preparation of Consolidated financial statements in accordance with IFRS.
Any systems of internal control can only provide reasonable, and not absolute, assurance that material financial irregularities will be detected or that the risk of failure to achieve business objectives is eliminated. The Directors, having reviewed the effectiveness of the system of internal financial, operational and compliance controls and risk management, consider that the system of internal control operated effectively throughout the financial year and up to the date the financial statements were signed.
Share dealing codeThe Company has adopted a share dealing code for Directors and relevant employees, which is in accordance with the requirements of the Model Code for Securities Dealings (as set out in the Listing Rules of the UK Listing Authority).
Shareholder enquiriesFor information about the management of shareholdings please contact our registrar:
Shareholder Services Capita Asset Services The Registry 34 Beckenham Road Beckenham Kent BR3 4TU United Kingdom
T: UK 0871 664 0300
Calls cost 10p per minute plus network extras.
T: Overseas +44 208 639 3399
Lines are open Monday to Friday 9.00am to 5.30pm, excluding public holidays.
Investor relations enquiries Chen Moravsky Deputy Chief Executive Officer & Chief Financial Officer Viñoly Tower, 5th floor Claude Debussylaan 14 1082 MD Amsterdam The Netherlands
T: +31 (0)20 717 8602
F: +31 (0)20 717 8699
WebsiteAnnual reports, half year reports and shared information are all available on our website pphe.com
Financial calendarFinancial year: 1 January to 31 December
Interim: Six months ending 30 June
Results Interims: August 2015 Final: March 2016
Annual General Meeting: 20 April 2015
London Stock Exchange trading codeLSE: PPH
P P H E H O T E L G R O U P A N N U A L R E P O R T A N D A C C O U N T S 2 0 14
C O R P O R AT E G O V E R N A N C E C O N T I N U E D
64

R E P O R T O F T H E AU D I T C O M M I T T E E
Audit CommitteeAudit Committee MembersThe Audit Committee is comprised of Kevin McAuliffe (Non-Executive Director & Senior Independent Director), Elisha Flax (Non-Executive Director) and Nigel Jones (Non-Executive Director).
RoleThe Audit Committee assists the Board in observing its responsibility of ensuring that the Group’s financial systems provide accurate and up-to-date information on its financial position and that the published Consolidated financial statements represent a true and fair reflection of this position. It also assists the Board in ensuring that appropriate accounting policies, internal financial controls and compliance procedures are in place.
The Audit Committee receives and reviews information from the Deputy Chief Executive & Chief Financial Officer, the Company Secretary, the internal audit team and the external auditors regularly throughout the year.
External audit and external auditorsKost Forer Gabbay & Kasierer, a member of Ernst & Young Global, are the Company’s current external auditors.
The Audit Committee considers the appointment and re-appointment of the external auditors and reviews their terms of appointment and negotiates fees on behalf of the Company prior to making recommendations through the Board to the shareholders to consider at each Annual General Meeting.
Kost Forer Gabbay & Kasierer have expressed their willingness to continue in office as auditors and a resolution to re-appoint them will be proposed at the forthcoming Annual General Meeting.
In accordance with corporate governance requirements, the Audit Committee reviewed the independence and objectivity of the external auditors and has reported to the Board that it considers that the external auditors’ independence and objectivity have been maintained.
To analyse audit effectiveness, the Audit Committee meets with management to
discuss the performance of the external auditors without them being present. Separate meetings are also held with the external auditors without the presence of any member of executive management.
Internal auditThe Audit Committee monitors and reviews the effectiveness of the internal auditor; agrees his annual work plan and reviews whether the internal auditor has the proper resources to enable him to satisfactorily complete such work plans. It also reviews status reports and considers management’s response to any major finding, providing support, if necessary, for any follow-up action required and ensures that the team obtains free and unrestricted access to all Group activities, records, property and personnel necessary to fulfil its agreed objectives.
To analyse audit effectiveness, the Audit Committee meets with management to discuss the performance of the internal auditor without him being present. Separate meetings are also held with the internal auditor without the presence of any member of executive management.
Financial reportingPrior to submission to the Board, the Audit Committee monitors the integrity of the financial statements and annual accounts and confirms that they have been properly prepared in accordance with IFRS and the requirements of Guernsey law.
The Audit Committee reviews draft annual and interim reports before recommending their publication to the Board. The Audit Committee discusses with the Chief Executive Officer, Deputy Chief Executive & Chief Financial Officer and external auditors the significant accounting policies, estimates and judgments applied in preparing these reports.
The Audit Committee also reviews the reports to shareholders and any other public announcement concerning the Group’s financial position, corporate governance statements and statements on the Group’s system of internal controls and reports its views to the Board to assist in its approval of the results announcements and the Annual Report.
65

Audit Committee attendance and meetingsThe Audit Committee met five times during the year and received regular monthly financial updates from the Chief financial Officer on the Group’s performance. Attendance of the individual Directors, who all served on the committee throughout the year, is shown in the table below.
Throughout the year, the Audit Committee reviewed and considered the following:
• The financial information that is publicly disclosed, which included the accounts for the year ended 31 December 2014; and the interim results for the period ended 30 June 2014
• The performance of the Group’s assets throughout the year
• Arrangements reached with related parties
• Selection and appointment of Auditors
• The Group’s internal control and risk management policies and systems, and their effectiveness, including reviewed reports from the internal audit team relating to:
– payroll systems and procedures
– business continuity planning
– franchise agreements
– Group bank borrowing
– non-core revenue recognition
– Hungarian hotel operations
• An annual review of the effectiveness of the Group’s system of internal control and risk management procedures
• The Group’s risk management strategy to ensure that any required remedial action on any identified weaknesses is taken; and
• During the year, the Audit Committee visited one major site and one large scale renovation project to assess the project management expertise in place.
Objectives achieved following recommendations by the Audit Committee• Appointment of Kost Forer Gabbay &
Kasierer as auditors
• Increased focus on business continuity planning
• Increased reliability of internal operational control
Audit Committee meetings and attendance Name 27 Feb 18 March 3 Apr 8 Apr 27 Aug
Kevin McAuliffe
Elisha Flax – –
Nigel Jones
Total attendees 3 3 2 2 3
On behalf of the Board
KEVIN MCAULIFFECHAIRMAN OF THE AUDIT COMMIT TEE
P P H E H O T E L G R O U P A N N U A L R E P O R T A N D A C C O U N T S 2 0 14
R E P O R T O F T H E A U D I T C O M M I T T E E C O N T I N U E D
66

R E P O R T O F T H E R E M U N E R AT I O N C O M M I T T E E A N D D I R E C T O R S ’ R E M U N E R AT I O N R E P O R T
Remuneration policy The Company’s remuneration policy is designed to attract, motivate and retain high calibre individuals to enable the Group to operate strategically for the continued benefit of shareholders, over the long term. The Remuneration Committee aims to provide Executive Directors and senior managers with packages which are sufficiently competitive to attract, retain and motivate individuals of the quality required to achieve the Group’s strategic objectives and enhance shareholder value. Remuneration packages are aimed at balancing both short-term and long-term rewards, as well as performance and non-performance related pay.
The remuneration of Non-Executive Directors is a matter for the Board. No Director or manager may be involved in any decisions as to his/her own remuneration.
Within the framework of the agreed remuneration policy the Remuneration Committee determines the remuneration package of the Chairman, the Executive Directors and other senior managers, including the size of, and the performance conditions applying to, awards made under the Company’s cash bonus and share option schemes. The Chief Executive Officer and the Deputy Chief Executive & Chief Financial Officer may provide advice to the Remuneration Committee as necessary (save in respect of their own remuneration).
Contracts and letters of appointment The Executive Directors have rolling contracts which may be terminated on 12 months’ notice by the Group or on 6 months’ notice by the Executive Director. There are provisions for earlier termination by the Group in certain specific circumstances.
Each Non-Executive Director has specific terms of reference. Save for the Chairman, whose term is indefinite, the Non-Executive Directors’ respective letters of appointment provide for a fixed term expiring on the ninth anniversary of each Director’s date of appointment.
All the Non-Executive Directors’ appointment letters are subject to termination by either side on three months’ notice. The letters of appointment contain no entitlement of compensation for early termination. Details of the contract dates and notice periods are set out in the table below.
Non-performance related remuneration Basic salaries and benefits are reviewed by the Remuneration Committee annually. Executive Directors and Non-Executive Directors are entitled to D&O insurance.
The Chairman‘s and Non-Executive Directors‘ fees are reviewed on an annual basis by the entire Board.
Pensions Mr. Ivesha and Mr. Moravsky are entitled to pension contributions. The other Directors are not entitled to pension plans.
Name of Director Date of appointment Notice period
Elisha Flax 26 June 2007 3 months
Boris Ivesha 14 June 2007 12 months from Group, 6 months from Mr. Ivesha
Kevin McAuliffe 15 June 2007 3 months
Chen Moravsky 14 June 2007 12 months from Group, 6 months from Mr. Moravsky
Nigel Jones 26 June 2007 3 months
Eli Papouchado 26 June 2007 3 months
67

Other than salary and benefits in relation to the notice period described above, there are no other terms in any of the contracts which would give rise to compensation payable for early termination, or any other liability of the Company.
Performance related remuneration The Company did not grant performance related remuneration in the years ended 31 December 2014 and 2013.
The auditors have audited the following parts of the Remuneration Report:
Directors’ remuneration €’000
Chairman and Executive DirectorsEli
PapouchadoBoris
IveshaChen
Moravsky Total
Salary and fees 125 406 360 891
Performance related incentive – 140 104 244
Other taxable benefits – 146 137 283
Total remuneration for the year ended 31 December 2014 125 692 601 1,418
Total remuneration for the year ended 31 December 2013 120 726 527 1,373
Non-Executive DirectorsKevin
McAuliffeNigel Jones
Elisha Flax Total
Salary and fees 66 54 60 179
Total remuneration for the year ended 31 December 2014 66 54 60 179
Total remuneration for the year ended 31 December 2013 58 52 58 168
Details of share awards and options granted to Directors are included in the table below. No share awards or options have been exercised during the year.
DirectorNumber
of options
Number vested as at
31 December 2014
Exercise price
Chen Moravsky 95,000 95,000 £1.00
210,000 140,000 £2.33
On behalf of the Board
ELISHA FLA XCHAIRMAN OF THE REMUNER ATION COMMIT TEE
P P H E H O T E L G R O U P A N N U A L R E P O R T A N D A C C O U N T S 2 0 14
R E P O R T O F T H E R E M U N E R AT I O N C O M M I T T E E A N D D I R E C T O R S ’
R E M U N E R AT I O N R E P O R T C O N T I N U E D
68

69
PPHE HOTEL GROUP ANNUAL REPORT AND ACCOUNTS 2014
FINANCIAL STATEMENTS
Financial statements 70 Independent auditor’s report 71 Consolidated statement of financial position72 Consolidated income statement 73 Consolidated statement of comprehensive income74 Consolidated statement of changes in equity75 Consolidated statement of cash flows 77 Notes to Consolidated financial statements117 Appendices to Consolidated financial statements119 Glossary 121 Current and committed projects 122 Contacts
P P H E H O T E L G R O U P A N N U A L R E P O R T A N D A C C O U N T S 2 0 14
F I N A N C I A L S TAT E M E N T S
69

70
PPHE HOTEL GROUP ANNUAL REPORT AND ACCOUNTS 2014
INDEPENDENT AUDITORS’ REPORT TO SHAREHOLDERS OF PPHE HOTEL GROUP LIMITED
We have audited the accompanying Consolidated financial statements of PPHE Hotel Group Limited and its subsidiaries (the Group), which comprise the consolidated statement of financial position as at 31 December 2014, and the consolidated income statement, consolidated statement of comprehensive income, consolidated statement of changes in equity and consolidated statement of cash flows for the year then ended, and a summary of significant accounting policies and other explanatory information.
Management’s responsibility for the Consolidated financial statements Management is responsible for the preparation and fair presentation of these Consolidated financial statements in accordance with International Financial Reporting Standards as adopted by the European Union and the requirements of the Companies (Guernsey) Law, 2008, and for such internal control as management determines is necessary to enable the preparation of Consolidated financial statements that are free from material misstatement, whether due to fraud or error.
Auditors’ responsibility Our responsibility is to express an opinion on these Consolidated financial statements based on our audit. We conducted our audit in accordance with International Standards on Auditing. Those standards require that we comply with ethical requirements and plan and perform the audit to obtain reasonable assurance about whether the financial statements are free from material misstatement.
An audit involves performing procedures to obtain audit evidence about the amounts and disclosures in the Consolidated financial statements. The procedures selected depend on the auditor’s judgment, including the assessment of the risks of material misstatement of the Consolidated financial statements, whether due to fraud or error. In making those risk assessments, the auditor considers internal control relevant to the entity’s preparation and fair presentation of the Consolidated financial statements in order to design audit procedures that are appropriate in the circumstances, but not for the purpose of expressing an opinion on the effectiveness of the entity’s internal control. An audit also includes evaluating the appropriateness of accounting policies used and the reasonableness of accounting estimates made by management, as well as evaluating the overall presentation of the Consolidated financial statements.
We believe that the audit evidence we have obtained is sufficient and appropriate to provide a basis for our audit opinion.
Opinion In our opinion, the Consolidated financial statements:
• give a true and fair view of the state of the Group’s affairs as at 31 December 2014 and of its profit for the yearthen ended;
• have been properly prepared in accordance with IFRSs as adopted by the European Union; and• have been prepared in accordance with the requirements of the Companies (Guernsey) Law, 2008.
Matters on which we are required to report by exception We have nothing to report in respect of the following: Under the Companies (Guernsey) Law, 2008 we are required to report to you if, in our opinion:
• proper accounting records have not been kept; or• the financial statements are not in agreement with the accounting records; or• we have not received all the information and explanations we require for our audit.
Under the Listing Rules we are required to review:
• the part of the Corporate Governance Statement relating to the company’s compliance with the nine provisionsof the UK Corporate Governance Code specified for our review.
RONEN KIMCHI (FOR AND ON BEHALF OF KOST FORER GABBAY & KASIERER, MEMBER OF ERNST & YOUNG GLOBAL) TEL AVIV 27 FEBRUARY 2015
P P H E H O T E L G R O U P A N N U A L R E P O R T A N D A C C O U N T S 2 0 14
I N D E P E N D E N T A U D I T O R S ’ R E P O R T T O S H A R E H O L D E R S O F
P P H E H O T E L G R O U P L I M I T E D
70

71
CONSOLIDATED STATEMENT OF FINANCIAL POSITION
* Certain amounts here do not correspond to the 2013 Consolidated financial statements and reflect adjustments made, refer to Note 2(c).
The accompanying notes are an integral part of the Consolidated financial statements.
Date of approval of the financial statements 27 February 2015.
BORIS IVESHA PRESIDENT & CHIEF EXECUTIVE OFFICER
CHEN MORAVSKY DEPUTY CHIEF EXECUTIVE OFFICER & CHIEF FINANCIAL OFFICER
As at 31 December
Note2014
€’000
2013 Restated*
€’000Assets Non-current assets: Intangible assets 4 32,588 35,386 Property, plant and equipment 5 988,667 943,325 Prepaid leasehold payments 6 417 435 Investment in associates 7 21,286 21,387 Investment in joint ventures 8 21,328 15,583 Other non-current financial assets 9 18,717 19,888 Restricted deposits and cash 16(b) – 9,482
1,083,003 1,045,486 Current assets: Restricted deposits and cash 16(b) 4,107 3,871 Inventories 1,132 1,290 Other current financial assets 10 1,464 1,538 Trade receivables 11 15,096 15,762 Other receivables and prepayments 12 7,693 5,875 Cash and cash equivalents 13 70,173 41,498
99,665 69,834 Total assets 1,182,668 1,115,320
Equity and liabilities Equity: 14 Issued capital – – Share premium 239,814 239,504 Other reserves (36,124) (36,174)Treasury shares (3,701) (3,701)Foreign currency translation reserve (30,305) (34,543)Hedging reserve (24,104) (12,642)Accumulated earnings 178,288 145,672 Total equity 323,868 298,116 Non-current liabilities: Bank borrowings 17 538,809 500,733 Financial liability in respect of Income Units sold to private investors 18 180,142 173,003 Deposits received in respect of Income Units sold to private investors 16(b) 147 8,864 Other financial liabilities 19 67,665 51,744 Deferred income taxes 27 12,898 12,492
799,661 746,836 Current liabilities: Trade payables 12,744 12,188 Other payables and accruals 20 30,432 32,745 Bank borrowings 17 15,963 25,435
59,139 70,368 Total liabilities 858,800 817,204 Total equity and liabilities 1,182,668 1,115,320
C O N S O L I D AT E D S TAT E M E N T O F F I N A N C I A L P O S I T I O N
71

72
PPHE HOTEL GROUP ANNUAL REPORT AND ACCOUNTS 2014
CONSOLIDATED INCOME STATEMENT
* Certain amounts here do not correspond to the 2013 Consolidated financial statements and reflect adjustments made, refer to Note 2(c).
The accompanying notes are an integral part of the Consolidated financial statements.
Year ended 31 December
Note2014
€’000
2013 Restated*
€’000Revenues 21 270,442 244,761 Operating expenses 22 (165,259) (151,576)EBITDAR 105,183 93,185 Rental expenses (10,385) (10,483)EBITDA 94,798 82,702 Depreciation, amortisation and impairment loss 4, 5 (24,405) (23,862)EBIT 70,393 58,840 Financial expenses 23 (32,083) (30,005)Financial income 24 6,599 4,772 Other income and expenses 25 11,980 3,135 Net expenses for financial liability in respect of Income Units sold to private investors 26 (12,312) (6,774)Share in result of associate and joint ventures 7, 8 (2,928) (2,658)Profit before tax 41,649 27,310 Income tax 27 (236) 349 Profit for the year 41,413 27,659
Basic and diluted earnings per share in Euro 28 1.00 0.67
P P H E H O T E L G R O U P A N N U A L R E P O R T A N D A C C O U N T S 2 0 14
C O N S O L I D AT E D I N C O M E S TAT E M E N T
72

73
CONSOLIDATED STATEMENT OF COMPREHENSIVE INCOME
1 There is no other comprehensive income that will not be reclassified to the profit and loss in subsequent periods. 2 Included in other reserves. 3 Included in hedging reserve. 4 Included in foreign currency translation reserve.
The accompanying notes are an integral part of the Consolidated financial statements.
Year ended 31 December
2014
€’000 2013 €’000
Profit for the year 41,413 27,659 Other comprehensive income (loss) to be recycled through profit and loss in subsequent periods:1 Fair value gain (loss) on available-for-sale financial assets2 (74) 206 Profit (loss) from cash flow hedges3 (11,462) 9,984 Foreign currency translation adjustments of foreign operations4 4,200 (74)Foreign currency translation adjustment of associate and joint ventures4 38 2 Other comprehensive (loss) income (7,298) 10,118 Total comprehensive income 34,115 37,777
C O N S O L I D AT E D S TAT E M E N T O F C O M P R E H E N S I V E I N C O M E
73

74
PPHE HOTEL GROUP ANNUAL REPORT AND ACCOUNTS 2014
CONSOLIDATED STATEMENT OF CHANGES IN EQUITY
* No par value. ** The dividend distribution comprises a final dividend for the year ended 31 December 2013 of 8.0 pence per share and an interim dividend of 9.0 pence per share paid
on 16 October 2014. *** Certain amounts here do not correspond to the 2013 Consolidated financial statements and reflect adjustments made, refer to note 2(c).
The accompanying notes are an integral part of the Consolidated financial statements.
In €’000 Issued capital*
Share premium
Other reserves
Treasury shares
Foreign currency
translation reserve
Hedging reserve
Accumulated earnings
Total equity
Balance as at 1 January 2013 (Restated***) – 239,504 (36,524) (3,701) (34,471) (22,626) 123,881 266,063
Profit for the year – – – – – – 27,659 27,659 Other comprehensive loss for the year – – 206 – (72) 9,984 – 10,118
Total comprehensive income – – 206 – (72) 9,984 27,659 37,777 Share-based payments – – 144 – – – – 144 Dividend distribution – – – – – – (5,868) (5,868)Balance as at 31 December 2013 – 239,504 (36,174) (3,701) (34,543) (12,642) 145,672 298,116
Profit for the year – – – – – – 41,413 41,413 Other comprehensive loss for the year – – (74) – 4,238 (11,462) – (7,298)
Total comprehensive income – – (74) – 4,238 (11,462) 41,413 34,115 Share-based payments – – 124 – – – – 124 Issue of shares – 310 – – – – – 310 Dividend distribution** – – – – – – (8,797) (8,797)Balance as at 31 December 2014 – 239,814 (36,124) (3,701) (30,305) (24,104) 178,288 323,868
P P H E H O T E L G R O U P A N N U A L R E P O R T A N D A C C O U N T S 2 0 14
C O N S O L I D AT E D S TAT E M E N T O F C H A N G E S I N E Q U I T Y
74

75
CONSOLIDATED STATEMENT OF CASH FLOWS
* Certain amounts here do not correspond to the 2013 Consolidated financial statements and reflect adjustments made, refer to note 2(c).
The accompanying notes are an integral part of the Consolidated financial statements.
Year ended 31 December
Note2014
€’000
2013 Restated*
€’000Cash flows from operating activities: Profit for the year 41,413 27,659 Adjustment to reconcile profit to cash provided by operating activities: Financial expenses and expenses for financial liability in respect of Income Units sold to private investors
44,395 36,779
Financial income 24 (6,599) (4,772)Income tax charge (benefit) 27 236 (349)Capital gain upon sale of Berlin hotels to joint venture 3(a) (1,753) – Loss on buy back of Income Units sold to private investors 25 329 – Capital gain upon sale of subsidiary in Thailand – (2,757)Fair value gain deferred consideration business combinations 19 (2,509) (799)Share in results of joint ventures 8 (8) 97 Share in loss of associates 7(c) 2,936 2,561 Depreciation, amortisation and impairment loss 4, 5 24,405 23,862 Share-based payments 124 144
61,556 54,766
Changes in operating assets and liabilities: Increase in inventories under construction – (2,261)(Increase) decrease in inventories 109 (47)Decrease in trade and other receivables 498 3,399 Increase in trade and other payables 1,623 3,557
2,230 4,648
Cash paid and received during the period for: Interest paid (40,068) (37,549)Interest received 97 123 Taxes (paid) received (137) 198
(40,108) (37,228)
Net cash provided by operating activities 65,091 49,845
Cash flows from investing activities: Investments in property, plant and equipment 5 (42,624) (63,744)Investments jointly controlled entities and loans to partners in jointly controlled entities
(523) –
Net change in cash upon divestment of Berlin hotels to joint venture 3(a) (3,000) – Net change in cash upon divestment of subsidiary in Thailand – (1,595)(Increase) decrease in restricted deposits (661) 1,335 Decrease in restricted cash – 116
Net cash used in investing activities (46,808) (63,888)
C O N S O L I D AT E D S TAT E M E N T O F C A S H F L O W
75

76
PPHE HOTEL GROUP ANNUAL REPORT AND ACCOUNTS 2014
CONSOLIDATED STATEMENT OF CASH FLOWS CONTINUED
* Certain amounts here do not correspond to the 2013 Consolidated financial statements and reflect adjustments made, refer to Note 2(c).
The accompanying notes are an integral part of the Consolidated financial statements.
Year ended 31 December
2014
€’000
2013 Restated*
€’000Cash flows from financing activities: Issuance of shares upon exercise of options 310 – Proceeds from long-term loans 26,423 42,853 Buy back of Income Units previously sold to private investors (2,092) – Repayment of long-term bank loans and other long-term liabilities (12,485) (20,037)Proceeds from finance leases 6,231 – Dividend payment (8,797) (5,868)Advance receipt of loan for equity investment from future joint venture partner – 4,180 (Repayment of) loans from jointly controlled entities and from partners in jointly controlled entities – (9,360)Net cash provided by financing activities 9,590 11,768 Increase in cash and cash equivalents 27,873 (2,275)Net foreign exchange differences 802 (1,033)Cash and cash equivalents at beginning of year 41,498 44,806 Cash and cash equivalents at end of year 70,173 41,498
P P H E H O T E L G R O U P A N N U A L R E P O R T A N D A C C O U N T S 2 0 14
C O N S O L I D AT E D S TAT E M E N T O F C A S H F L O W C O N T I N U E D
76

77
NOTES TO CONSOLIDATED FINANCIAL STATEMENTS
Note 1 General a. The Consolidated financial statements of PPHE Hotel Group Limited (the “Company”) and its subsidiaries (together
the “Group”) for the year ended 31 December 2014 were authorised for issuance in accordance with a resolution of the Directors on 27 February 2015.
b. Description of business and formation of the Company:
The Company was incorporated and registered in Guernsey on 14 June 2007. The shares of the Company are publicly traded.
The Company’s primary activity is owning, leasing, developing, operating and franchising primarily full-service upscale and lifestyle hotels in major gateway cities and regional centres predominantly in Europe.
c. Assessment of going concern:
As part of their ongoing responsibilities, the Directors have recently undertaken a thorough review of the Group’s cash flow forecast and potential liquidity risks. Detailed budgets and cash flow projections have been prepared for 2015 and 2016 which show that the Group’s hotel operations will be cash generative during the period.
The Group has entered into a number of loan facilities, the details of which are set out in Note 17. The Board believes that the Group currently has adequate resources and in the future will generate sufficient funds to honour its financial obligations and continue its operations as a going concern for the foreseeable future. The Group analyses its ability to comply with debt covenants in the near future.
Note 2 Summary of significant accounting policies a. Basis of preparation:
The Consolidated financial statements of the Group have been prepared on a historical cost basis, except for derivative financial instruments and available-for-sale financial assets that have been measured at fair value. The Consolidated financial statements are presented in Euro and all values are rounded to the nearest thousand (€’000) except where otherwise indicated.
Statement of compliance:
The Consolidated financial statements of the Group have been prepared in accordance with International Financial Reporting Standards (IFRS) as adopted by the European Union, which comprise standards and interpretations issued by the International Accounting Standards Board (IASB) and International Financial Reporting Standards Interpretations Committee (IFRIC) and endorsed by the European Union.
The accounting policies used in preparing the Consolidated financial statements for the years ended 31 December 2014 and 2013 are set out below. These accounting policies have been consistently applied to the periods presented except as described in (c) below.
b. Basis of consolidation: The Consolidated financial statements comprise the financial statements of the Company and its subsidiaries as at 31 December 2014. Control is achieved when the Group is exposed, or has rights, to variable returns from its involvement with the investee and has the ability to affect those returns through its power over the investee.
The financial statements of the subsidiaries are prepared for the same reporting year as the parent company, using consistent accounting policies. All inter-company balances and transactions, income and expenses, and profits and losses resulting from intra-Group transactions are eliminated in full. Subsidiaries are fully consolidated from the date of acquisition, being the date on which the Group obtains control, and continue to be consolidated until the date on which such control ceases.
Non-controlling interests represent the portion of profit or loss and net assets not held by the Group and presented separately in the income statement and within equity in the consolidated statement of financial position, separately from parent shareholders’ equity.
A change in the ownership interest of a subsidiary, without a loss of control, is accounted for as an equity transaction.
If the Group loses control over a subsidiary, it derecognises the related assets (including goodwill), liabilities, non-controlling interest and other components of equity while any resultant gain or loss is recognised in profit or loss. Any investment retained is recognised at fair value.
The Group has interests in hotels in the Netherlands, United Kingdom, Germany, Hungary and Croatia. For details on the Company’s subsidiaries and investments as at 31 December 2014 see Appendix A.
N O T E S T O C O N S O L I D AT E D F I N A N C I A L S TAT E M E N T S
77

78
PPHE HOTEL GROUP ANNUAL REPORT AND ACCOUNTS 2014
NOTES TO CONSOLIDATED FINANCIAL STATEMENTS CONTINUED
Note 2 Summary of significant accounting policies continued c. Restatement: Change in accounting treatment In 2010, the construction of Park Plaza Westminster Bridge London was completed and the hotel, comprising 1,019
rooms, opened to guests. As at 31 December 2010, the Group had sold 535 rooms to private investors (under 999 year leases). On completion of each sale, a wholly owned subsidiary, Marlbray Limited (“Marlbray”), entered into income swap agreements with these investors. The income swap agreements include an obligation of the investor to assign the right to receive the net income derived from the room to Marlbray and an undertaking by Marlbray to pay the investors a guaranteed return of approximately 6% of the original purchase price for a five-year period commencing from the date of completion of the sale. Marlbray holds the sole voting rights in the management company of the hotel and therefore has control over all the rooms. The Company had concluded that until significant risks and rewards of ownership of, and control over, the sold rooms had passed to the investors, all of the conditions for revenue recognition from the sale of rooms were not met. Therefore, in the Consolidated financial statements the room assets were not derecognised and the amounts received from the investors were accounted for as an advance payment until such time as such amounts could be recognised as revenue. The sold rooms were not depreciated as their residual value was deemed to be equal to their carrying amount.
In 2014, management reconsidered the accounting treatment in view of the current facts and circumstances surrounding the sale of these rooms. Marlbray will continue to effectively control the management company through the Group's ownership of nearly 50% of the voting shares for the foreseeable future. Therefore, each of the transactions with the private investors in 2010 should not be viewed as a sale of assets but rather as a sale of future cash flows derived from the net income generated by the rooms (“Income Units”). Accordingly, management concluded that the more appropriate accounting treatment that should have been reflected in the Consolidated financial statements is to include the rooms as depreciable property, plant and equipment, to recognise the amounts received from the investors as a variable rate financial liability and to account for the income swap based on expected cash flow. Furthermore, as the investors are required to fund all capital expenditures ("Capex") to be made in connection with the Income Units, a receivable is recorded each period for any excess of depreciation expense over the amounts paid by the investors on account of Capex. This receivable is offset from the liability to the investors.
The Company has restated the 2013 Consolidated financial statements in order to retrospectively reflect therein the effects of the change in accounting treatment. The effects of the restatement on the consolidated statement of financial position as at 31 December 2013 are principally a reclassification of the Income Units in the amount of €159.6 million (net of accumulated depreciation of €9.7 million) to property, plant and equipment, and the recognition of non-current financial assets for the income swap and the receivable (which receivable has been offset from the non-current financial liability in respect of Income Units) in the amounts of €7.7 million and €9.7 million, respectively. The beginning balance of accumulated earnings as at 1 January 2013 has been increased by €6.2 million. In the consolidated income statement for the year ended 31 December 2013, depreciation expense has been increased by €2.6 million, financial income has been increased by €1.5 million in respect of the income swap, and net expense for the liability in respect of Income Units has been decreased by €2.6 million. The net effect on profit and earnings per share for the year was an increase of €1.5 million and €0.04 respectively. The restatement had no impact on other comprehensive income for the year.
IFRS 11 Joint arrangements On 1 January 2014, the Company adopted IFRS 10 Consolidated financial statements, IFRS 11 Joint Arrangements,
IFRS 12 Disclosure of Interest in Other Entities and IAS 28 Investments in Associates and Joint Ventures. The application of IFRS 11 impacted the Group's accounting for its 50% interest in Aspirations Limited. Prior to the transition to IFRS 11, Aspirations Limited was classified as a jointly controlled entity and the Group’s share of the assets, liabilities, revenue, income and expenses was proportionately consolidated in the Consolidated financial statements. Upon adoption of IFRS 11, the Group has determined that its interest in Aspirations Limited (a joint arrangement that holds the art’otel london hoxton development) should be classified as a joint venture under IFRS 11 and accounted for using the equity method in accordance with IAS 28. The transition was applied retrospectively as required by IFRS 11 and the comparative information for the immediately preceding period (2013) has been restated. The effect of applying IFRS 11on the Group’s financial statements is not material. As at 31 December 2013, property plant and equipment has been reduced, and the investment in joint ventures has been increased, by approximately €15.6 million.
The adoption of IFRS 12 required additional disclosures which have been provided in the Consolidated financial statements. The adoption of IFRS 10 had no material impact on the Consolidated financial statements.
P P H E H O T E L G R O U P A N N U A L R E P O R T A N D A C C O U N T S 2 0 14
N O T E S T O C O N S O L I D AT E D F I N A N C I A L S TAT E M E N T S C O N T I N U E D
78

79
Note 2 Summary of significant accounting policies continued d. Significant accounting judgments, estimates and assumptions:
The preparation of the Group’s Consolidated financial statements requires management to make judgments, estimates and assumptions that affect the reported amounts of revenues, expenses, assets and liabilities, and the disclosure of contingent liabilities, at the reporting date. However, uncertainty about these assumptions and estimates could result in outcomes that require a material adjustment to the carrying amount of the asset or liability affected in future periods.
Judgments In the process of applying the Group’s accounting policies, Management has made the following judgments, which have the most significant effect on the amounts recognised in the Consolidated financial statements:
Acquisition of subsidiaries that are not business combinations At the acquisition date of subsidiaries and operations, the Company determines whether the transaction constitutes an acquisition of a business in a business combination transaction pursuant to IFRS 3. If the acquisition does not constitute a business as defined in IFRS 3, the cost of purchase is allocated only to the identifiable assets and liabilities of the acquired company on the basis of their relative fair values at the date of purchase without allocating any amount to goodwill or deferred taxes, and including any minority interest according to its share of the fair value of net identifiable assets at the acquisition date.
In determining whether a business was acquired, the Company evaluates whether the entity which was acquired is an integrated set of activities and assets capable of being conducted and managed for the purpose of providing a return to investors. The following criteria which indicate acquisition of a business are considered: the variety of assets acquired the extent to which ancillary services to operate the property are provided and the complexity of the management of the property.
When the Group acquires a business, it assesses the fair value of the assets acquired and liabilities assumed, as well as ensuring appropriate classification and designation in accordance with the contractual terms, economic circumstances and other relevant information at the acquisition date.
Finance lease commitments – Group as lessee The Group has entered into commercial land leases. The Group has determined, based on an evaluation of the terms and conditions of the arrangements, that it holds all the significant risks and reward of ownership of the land and accounts for the contracts as finance leases.
Estimates and assumptions The key assumptions made in the Consolidated financial statements concerning uncertainties at the reporting date and the critical estimates computed by the Group for which there is a risk of causing a material adjustment to the carrying amounts of assets and liabilities within the next financial year are discussed below.
Determination of fair value of financial derivatives The group engages independent valuation specialists to determine the fair value of the interest rate swaps. The swaps are valued according to the discounted cash flow method.
79
80
PPHE HOTEL GROUP ANNUAL REPORT AND ACCOUNTS 2014
NOTES TO CONSOLIDATED FINANCIAL STATEMENTS CONTINUED
Note 2 Summary of significant accounting policies continued d. Significant accounting judgments, estimates and assumptions continued Impairment of non-financial assets
The Group’s impairment test for tangible and intangible assets is based on value in use calculations that use a discounted cash flow model. The cash flows are derived from the budget of the cash-generating unit being tested. The recoverable amount is most sensitive to the discount rate used for the discounted cash flow model as well as the expected future cash inflows and the growth rate used for extrapolation purposes.
Deferred tax assets Deferred tax assets are recognised for unused carry forward tax losses and temporary differences to the extent that it is probable that taxable profit will be available against which the losses can be utilised. The amount of deferred tax assets that can be recognised is based upon the likely timing and level of future taxable profits together with future tax planning strategies. Additional information is provided in Note 26.
Taxes The Group is subject to income and capital gains taxes in numerous jurisdictions. Significant judgment is required to determine the total provision for current and deferred taxes. The Group recognises liabilities for current taxes based on estimates of whether additional taxes will be due. Where the final tax outcome of these matters is different from the amounts that were initially recorded, such differences will impact the income and deferred tax provisions in the period in which the determination is made.
e. Business combinations and goodwill: Business combinations are accounted for using the acquisition method. The cost of an acquisition is measured as the aggregate of the consideration transferred, measured at acquisition date fair value and the amount of any non-controlling interest in the acquiree. For each business combination, the acquirer measures the non-controlling interest in the acquiree either at fair value or at the non-controlling interest’s proportionate share of the acquiree’s identifiable net assets. Acquisition costs incurred are expensed and included in administrative expenses.
When the Group acquires a business, it assesses the financial assets and liabilities assumed for appropriate classification and designation in accordance with the contractual terms, economic circumstances and pertinent conditions as at the acquisition date. This includes the separation of embedded derivatives in host contracts of the acquiree.
If the business combination is achieved in stages, the acquisition date fair value of the acquirer’s previously held equity interest in the acquiree is remeasured to fair value at the acquisition date through profit or loss. Any contingent consideration to be transferred by the acquirer will be recognised at fair value at the acquisition date. Subsequent changes to the fair value of the contingent consideration which is deemed to be an asset or liability will be recognised in accordance with IAS 39 either in profit or loss or as a change to other comprehensive income. If the contingent consideration is not within the scope of IAS 39, it is measured in accordance with the appropriate IFRS. If the contingent consideration is classified as equity, it is not remeasured and final settlement is accounted for within equity.
Goodwill is initially measured at cost being the excess of the aggregate of the consideration transferred and the amount recognised for non-controlling interest over the net identifiable assets acquired and liabilities assumed. If this consideration is lower than the fair value of the net assets of the subsidiary acquired, the difference is recognised in profit or loss.
After initial recognition, goodwill is measured at cost less any accumulated impairment losses. For the purpose of impairment testing, goodwill acquired in a business combination is, from the acquisition date, allocated to each of the Group’s cash-generating units that are expected to benefit from the combination, irrespective of whether other assets or liabilities of the acquiree are assigned to those units. Where goodwill forms part of a cash-generating unit and part of the operation within that unit is disposed of, the goodwill associated with the operation disposed of is included in the carrying amount of the operation when determining the gain or loss on disposal of the operation. Goodwill disposed of in this circumstance is measured based on the relative values of the operation disposed of and the portion of the cash-generating unit retained.
Business combinations involving entities under common control The Group accounts for business combinations that include entities under common control using the acquisition method provided that the transaction has substance.
P P H E H O T E L G R O U P A N N U A L R E P O R T A N D A C C O U N T S 2 0 14
N O T E S T O C O N S O L I D AT E D F I N A N C I A L S TAT E M E N T S C O N T I N U E D
80
81
Note 2 Summary of significant accounting policies continued f. Investment in an associate and joint ventures:
An associate is an entity over which the Group has significant influence. Significant influence is the power to participate in the financial and operating policy decisions of the investee, but is not control or joint control over those policies.
A joint venture is a type of joint arrangement whereby the parties that have joint control of the arrangement have rights to the net assets of the joint venture. Joint control is the contractually agreed sharing of control of an arrangement, which exists only when decisions about the relevant activities require unanimous consent of the parties sharing control.
The Group’s investment in its associate and joint ventures is accounted for using the equity method. Under the equity method, the investment in the associate or joint venture is carried in the statement of financial position at cost plus post acquisition changes in the Group’s share of net assets of the associate or joint venture. Goodwill relating to the associate or joint venture is included in the carrying amount of the investment and is neither amortised nor individually tested for impairment.
The income statement reflects the share of the results of operations of the associate and joint ventures. Where there has been a change recognised directly in the equity of the associate or joint venture, the Group recognises its share of any changes and discloses this, when applicable, in the statement of changes in equity. Unrealised gains and losses resulting from transactions between the Group and the associate or joint venture are eliminated to the extent of the interest in the associate or joint venture.
The aggregate of the Group’s share of profit or loss of an associate and a joint venture is shown on the face of the statement of profit or loss outside EBIT and represents profit or loss after tax and non-controlling interests in the subsidiaries of the associate or joint venture.
The financial statements of the associate are prepared for the same reporting period as the Group. Where necessary, adjustments are made to bring the accounting policies in line with those of the Group.
For details on the Company’s interests in an associate and joint ventures see Appendix B.
g. Foreign currency translation: The functional currency of the Company is the Pound Sterling. The Consolidated financial statements are presented in Euro. Each entity of the Group determines its own functional currency and items included in the financial statements of each entity are measured using that functional currency.
Transactions in foreign currencies are initially recorded at the exchange rates prevailing on the dates of the transactions. Monetary assets and liabilities denominated in foreign currencies are retranslated into functional currency at the rates prevailing on the reporting date. Profits and losses arising from exchange differences are included in the income statement.
Assets and liabilities translated from functional currency to presentation currency at exchange rates prevailing on the reporting date. Income and expense items are translated at the average exchange rates for the period. Exchange differences arising on the translation to presentation currency are classified as a separate component of equity (foreign currency translation reserve).
On consolidation, the assets and liabilities of the entities whose functional currency is other than Euro are translated at exchange rates prevailing on the reporting date. Income and expense items are translated at the average exchange rates for the period. Equity items are translated at the historic exchange rates. Exchange differences arising on the translation are classified as a separate component of equity (foreign currency translation reserve). Such translation differences are recognised in the income statement in the period in which the entity is disposed of.
Goodwill and fair value adjustments arising on the acquisition of a foreign operation are treated as assets and liabilities of the foreign operation and translated at the closing rate.
Exchange differences in respect of loans denominated in Euro which were granted by the Company to its subsidiaries are reflected in the foreign currency translation reserve in equity, as these loans are designated as a hedge of the Group’s net investment in a foreign operation.
81

82
PPHE HOTEL GROUP ANNUAL REPORT AND ACCOUNTS 2014
NOTES TO CONSOLIDATED FINANCIAL STATEMENTS CONTINUED
Note 2 Summary of significant accounting policies continued g. Foreign currency translation continued
The following exchange rates in relation to the Euro were prevailing at reporting dates:
Percentages increase (decrease) in exchange rates during the year:
h. Intangible assets: Intangible assets acquired separately are measured on initial recognition at cost. The cost of intangible assets acquired in a business combination is their fair value at the date of acquisition. Following initial recognition, intangible assets are carried at cost less any accumulated amortisation and any accumulated impairment losses.
Intangible assets are amortised using the straight-line method over their estimated useful life and assessed for impairment whenever there is an indication that the intangibles may be impaired. The amortisation period and the amortisation method are reviewed at least at each financial year end. Changes in the expected useful life or the expected pattern of consumption of future economic benefits embodied in the assets are accounted for by changing the amortisation period or method, as appropriate, and are treated as changes in accounting estimates. The amortisation expense for intangible assets is recognised in the income statement.
Gains or losses arising from derecognition of an intangible asset are measured at the difference between the net disposal proceeds and the carrying amount of the asset and recognised in the income statement when the asset is derecognised.
i. Property, plant and equipment: Property, plant and equipment are measured at cost, less accumulated depreciation and impairment losses. Depreciation is calculated using the straight-line method, over the shorter of the estimated useful life of the assets or the lease term as follows:
The costs of maintaining property, plant and equipment are recognised in the income statement as they are incurred. Costs incurred that significantly increase the recoverable amount of the asset concerned are added to the asset’s cost as an improvement and depreciated over the expected useful life of the improvement.
An item of property, plant and equipment, and any significant part initially recognised is derecognised upon disposal or when no future economic benefits are expected from its use or disposal. Any gain or loss arising on derecognition of the asset (calculated as the difference between the net disposal proceeds and the carrying amount of the asset) is included in the income statement when the asset is derecognised.
The assets’ residual values, useful lives and methods of depreciation are reviewed at each financial year end, and adjusted prospectively, if appropriate.
As at 31 December
2014
In Euro 2013
In EuroPound Sterling 1.283 1.202 Hungarian Forint 0.003 0.003
As at 31 December
2014
% 2013
%Pound Sterling 6.7 (2.1)Hungarian Forint (5.8) (1.8)
YearsLand under finance lease 50 to 125 Hotel buildings 50 to 95 Furniture and equipment 2 to 15
P P H E H O T E L G R O U P A N N U A L R E P O R T A N D A C C O U N T S 2 0 14
N O T E S T O C O N S O L I D AT E D F I N A N C I A L S TAT E M E N T S C O N T I N U E D
82

83
Note 2 Summary of significant accounting policies continued j. Impairment of non-financial assets:
At each reporting date, the Group reviews the carrying amounts of its non-financial assets to determine whether there is any indication that those assets may be impaired. If any such indication exists, the recoverable amount of the asset is estimated. Where it is not possible to estimate the recoverable amount of an individual asset, the Group estimates the recoverable amount of the cash-generating unit to which the asset belongs.
Recoverable amount is the higher of an asset’s fair value less costs to sell and its value in use. In assessing value in use, the estimated future cash flows are discounted to their present value using a pre-tax discount rate that reflects current market assessments of the time value of money and the risks specific to the asset.
If the recoverable amount of an asset (or cash-generating unit) is estimated to be less than its carrying amount, the asset is considered impaired and the carrying amount of the asset (cash-generating unit) is reduced to its recoverable amount. Impairment losses are recognised as an expense immediately.
Where an impairment loss subsequently reverses, the carrying amount of the asset (cash-generating unit) is increased to the revised estimate of its recoverable amount, but not in excess of the carrying amount that would have been determined had no impairment loss been previously recognised for the asset (cash-generating unit). A reversal of an impairment loss is recognised as income immediately.
k. Financial instruments: Financial assets within the scope of IAS 39 are initially recognised at fair value plus directly attributable transaction costs, except for investments at fair value through profit or loss in respect of which transaction costs are carried to the income statement.
After initial recognition, the accounting treatment of investments in financial assets is based on their classification into one of the following categories:
1. Loans and receivables: The Group has loans and receivables that are financial assets (non-derivative) with fixed or determinable payments that are not quoted in an active market. After initial recognition, loans and receivables are measured at amortised cost using the effective interest method taking into account transaction costs and less any allowance for impairment. Gains and losses are recognised in the income statement when the loans and receivables are derecognised or impaired, as well as through the systematic amortisation process. Except for available for sale financial assets, all financial assets of the Company are classified as “loans and receivables”.
2. Available-for-sale financial assets: The Group has available-for-sale financial assets (presented in the financial statements under “other current financial assets”) that are financial assets (non-derivative) that are designated as available-for-sale or are not classified as loans and receivables. After initial recognition, available-for-sale financial assets are measured at fair value. Gains or losses from fair value adjustments are recognised directly in other comprehensive income in the net unrealised gains reserve (included in other reserves in equity). When the investment is disposed of or in case of impairment, the cumulative gain or loss previously recorded in equity is recognised in the income statement. Interest income on investments in debt instruments is recognised in the income statement using the effective interest method. Dividends earned on investments are recognised in the income statement when the right of payment has been established.
3. Fair value: The Group uses the following hierarchy for determining and disclosing the fair value of financial instruments by valuation technique (see Note 31(g) for specific valuation methodologies):
Level 1: quoted (unadjusted) prices in active markets for identical assets or liabilities.
Level 2: other techniques for which all inputs which have significant effect on the recorded fair value are observable, either directly or indirectly.
Level 3: techniques which use inputs which have a significant effect on the recorded fair value that are not based on observable market data.
The fair value of investments that are actively traded in organised financial markets is determined by reference to market prices on the reporting date. For investments where there is no active market, fair value is determined using valuation techniques. Such techniques include using recent arm’s length market transactions; reference to the current market value of another instrument which is substantially the same; discounted cash flow or other valuation models.
83

84
PPHE HOTEL GROUP ANNUAL REPORT AND ACCOUNTS 2014
NOTES TO CONSOLIDATED FINANCIAL STATEMENTS CONTINUED
Note 2 Summary of significant accounting policies continued k. Financial instruments continued 4. Financial liabilities:
Interest-bearing loans and borrowings are initially recognised at fair value plus directly attributable transaction costs. After initial recognition, interest-bearing loans and borrowings are measured at amortised cost using the effective interest method which also accounts for directly attributable transaction costs. Gains and losses are recognised in the income statement when the loan is derecognised as well as through the systematic amortisation process.
The proceeds received from the sale of future cash flows of hotel rooms (“Income Units”) for 999 years are accounted for as a variable rate financial liability. The net revenues attributable to the sold Income Units are recognised as an expense in the period in which they occur.
5. Derecognition of financial instruments: Financial assets
A financial asset is derecognised when the contractual rights to the cash flows from the financial asset expire or the Group has transferred its contractual rights to receive cash flows from the financial asset or assumes an obligation to pay the cash flows in full without material delay to a third party and has transferred substantially all the risks and rewards of the asset, or has neither transferred nor retained substantially all the risks and rewards of the asset, but has transferred control of the asset.
Financial liabilities A financial liability is derecognised when it is extinguished, i.e. when the obligation is discharged or cancelled or expires. A financial liability is extinguished when the debtor (the Group) discharges the liability by paying in cash, other financial assets, goods or services; or is legally released from the liability.
Where an existing financial liability is exchanged with another liability from the same lender on substantially different terms, or the terms of an existing liability are substantially modified, such an exchange or modification is accounted for as an extinguishment of the original liability and the recognition of a new liability and the difference in the respective carrying amounts is recognised in the income statement.
6. Impairment of financial assets: The Group assesses at each reporting date whether the following financial asset or group of financial assets is impaired as follows:
• Assets carried at amortised cost: Evidence of impairment may include indications that the debtors are experiencing significant financial difficulty, default or delinquency in interest or principal payments or other observable data of a measurable decrease in the estimated future cash flows. If there is objective evidence that an impairment loss on loans and receivables and held-to-maturity investments carried at amortised cost has been incurred, the amount of the loss carried to the income statement is measured as the difference between the asset’s carrying amount and the present value of estimated future cash flows (excluding future credit losses that have not been incurred) discounted at the financial asset’s original effective interest rate. In a subsequent period, the amount of the impairment loss is reversed if the recovery of the asset can be related objectively to an event occurring after the impairment was recognised. The amount of the reversal, as above, is credited to the income statement up to the amount of any previous impairment.
• Available-for-sale financial assets: For debt securities, if any such evidence exists the cumulative loss – measured as the difference between the acquisition cost and the current fair value, less any impairment loss on that financial asset previously recognised in profit or loss – is removed from equity and recognised in profit or loss. If, in a subsequent period, the fair value of a debt instrument classified as available for sale increases and the increase can be objectively related to an event occurring after the impairment loss was recognised in profit or loss, the impairment loss is reversed through the consolidated income statement.
For equity investments, a significant or prolonged decline in the fair value of the security below its cost is also evidence that the assets are impaired. If any such evidence exists the cumulative loss – measured as the difference between the acquisition cost and the current fair value, less any impairment loss on that financial asset previously recognised in profit or loss – is removed from equity and recognised in profit or loss. Impairment losses recognised in the consolidated income statement on equity instruments are not reversed through the consolidated income statement.
P P H E H O T E L G R O U P A N N U A L R E P O R T A N D A C C O U N T S 2 0 14
N O T E S T O C O N S O L I D AT E D F I N A N C I A L S TAT E M E N T S C O N T I N U E D
84
85
Note 2 Summary of significant accounting policies continued k. Financial instruments continued 7. Offsetting financial instruments:
Financial assets and liabilities are offset and the net amount reported in the balance sheet when there is a legally enforceable right to offset the recognised amounts and there is an intention to settle on a net basis or realise the asset and settle the liability simultaneously. The legally enforceable right must not be contingent on future events and must be enforceable in the normal course of business and in the event of default, insolvency or bankruptcy of the company or the counterparty.
l. Inventories: Inventories include food and beverages and are valued at the lower of cost and net realisable value. Cost includes purchase cost on a first in-first out basis.
Net realisable value is the estimated selling price in the ordinary course of business less the estimated costs necessary to make the sale.
m. Inventories under construction: Inventories under construction are measured at the lower of cost and net realisable value. Cost of inventories includes direct identifiable construction costs, indirect costs and capitalised borrowing costs. Net realisable value is the estimated selling price in the ordinary course of business, less the estimated costs of completion and the estimated costs necessary to sell.
n. Cash and cash equivalents: Cash and cash equivalents comprise cash at bank and in hand and short-term deposits with an original maturity of three months or less.
o. Derivative financial instruments and hedge accounting: The Group uses derivative financial instruments such as interest rate swaps to hedge its risks associated with interest rate fluctuations. Such derivative financial instruments are initially recognised at fair value on the date on which a derivative contract is entered into and are subsequently re-measured at fair value. Derivatives are carried as assets when the fair value is positive and as liabilities when the fair value is negative.
Any gains or losses arising from changes in fair value on derivatives that do not qualify for hedge accounting are taken directly to the income statement.
The fair value of interest rate swap contracts is determined using valuation techniques, including the discounted cash flow model.
For the purpose of hedge accounting, hedges are classified as cash flow hedges when hedging the exposure to variability in cash flows that is either attributable to a particular risk associated with a recognised asset or liability or a highly probable forecast transaction.
At the inception of a hedge relationship, the Group formally designates and documents the hedge relationship to which the Group wishes to apply hedge accounting and the risk management objective and strategy for undertaking the hedge. The documentation includes identification of the hedging instrument, the hedged item or transaction, the nature of the risk being hedged and how the entity will assess the hedging instrument’s effectiveness in offsetting the exposure to changes in the cash flows attributable to the hedged risk. Such hedges are expected to be highly effective in achieving offsetting changes in cash flows and are assessed on an ongoing basis to determine that they actually have been highly effective throughout the financial reporting periods for which they were designated.
The effective portion of the gain or loss on the hedging instrument is recognised directly in other comprehensive income, while the ineffective portion is recognised in profit or loss. Amounts taken to other comprehensive income are transferred to the income statement when the hedged transaction affects profit or loss, such as when the hedged financial income or financial expense is recognised.
p. Trade receivables: Trade receivables recognised under current assets are stated at amortised cost (which in most cases is equal to their nominal amount) as reduced by appropriate allowances for estimated uncollectible amounts.
85

86
PPHE HOTEL GROUP ANNUAL REPORT AND ACCOUNTS 2014
NOTES TO CONSOLIDATED FINANCIAL STATEMENTS CONTINUED
Note 2 Summary of significant accounting policies continued q. Revenue recognition:
Revenue is recognised to the extent that it is probable that the economic benefits will flow to the Group and the revenue can be reliably measured, regardless of when the payment is being made. Revenue is measured at the fair value of the consideration received or receivable, taking into account contractually defined terms of payment and excluding taxes or duty. The Group assesses its revenue arrangements against specific criteria in order to determine if it is acting as principal or agent. The Group has concluded that it is acting as a principal in all of its revenue arrangements. The following specific recognition criteria must also be met before revenue is recognised:
Owned and leased hotels Primarily derived from hotel operations, including the rental of rooms, food and beverage sales and other services from owned and leased hotels operated under the Group’s brand names. Revenue is recognised when rooms are occupied, food and beverages are sold and services are performed.
Management fees Earned from hotels managed by the Group, under long-term contracts with the hotel owner. Management fees include a base fee, which is generally a percentage of hotel revenue, and an incentive fee, which is based on the hotel’s profitability. Revenue is recognised when earned and realised or realisable under the terms of the agreement.
Franchise fees Received in connection with a licence of the Group’s brand names, under long-term contracts with the hotel owner. The Group charges franchise royalty fees as a percentage of hotel revenue. Revenue is recognised when earned and realised or realisable under the terms of the agreement.
Marketing fees Received in connection with the sales and marketing services offered by the Group, under long-term contracts with the hotel owner. The Group charges marketing fees as a percentage of hotel revenue. Revenue is recognised when earned and realised or realisable under the terms of the agreement.
Customer loyalty programme The Group participates in the Club CarlsonSM customer loyalty programme to provide customers with incentives to buy room nights. This customer loyalty programme is owned and operated by CarlsonSM and therefore the entity retains no obligations in respect of the award credits other than to pay the programme operator for the granted award credits. The customers are entitled to utilise the awards as soon as they are granted.
The Group purchases these award credits from CarlsonSM and issues these to its customers in order to enhance its customer relationships rather than to earn a margin from the sale of these award credits. The Group concluded that it is acting as principal in this transaction and, in substance, is earning revenue from supplying these awards to its customers. The Group measures these revenues at fair value and recognises these gross from the costs of participating in the programme.
r. Non-GAAP measures: EBITDAR Earnings before interest, tax, depreciation, amortisation, impairment loss and rental expenses, share of associate
and exceptional items presented as other income and tax (EBITDAR) correspond to revenue less cost of revenues (operating expenses). EBITDAR, together with EBITDA is used as a key management indicator.
EBITDA Earnings before interest, tax, depreciation and amortisation, exceptional items presented as other income and impairment loss (EBITDA) correspond to gross profit after the operating costs of holding leased hotels.
EBIT Earnings before interest, exceptional items presented as other income and tax (EBIT) correspond to gross operating profit after the operating costs of holding both leased and owned assets.
s. Leases: Leases are classified as finance leases whenever the terms of the lease transfer substantially all the risks and rewards of ownership to the lessee. All other leases are classified as operating leases.
The Group as lessor Rental income from operating leases is recognised on a straight-line basis over the term of the relevant lease.
P P H E H O T E L G R O U P A N N U A L R E P O R T A N D A C C O U N T S 2 0 14
N O T E S T O C O N S O L I D AT E D F I N A N C I A L S TAT E M E N T S C O N T I N U E D
86

87
Note 2 Summary of significant accounting policies continued s. Leases continued The Group as lessee
Finance leases, which transfer to the Group substantially all the risks and benefits incidental to ownership of the leased item, are capitalised at the commencement of the lease at the fair value of the leased property or, if lower, at the present value of the minimum lease payments.
Lease payments are apportioned between finance charges and reduction of the lease liability so as to achieve a constant rate of interest on the remaining balance of the liability. Finance charges are recognised in the income statement.
Leased assets are depreciated over the useful life of the asset. However, if there is no reasonable certainty that the Group will obtain ownership by the end of the lease term, the asset is depreciated over the shorter of the estimated useful life of the asset and the lease term.
Operating lease payments are recognised as an expense in the income statement on a straight-line basis over the term of the lease.
Prepaid leasehold payments Prepaid leasehold payments are up-front payments to acquire a long-term leasehold interest in land and building. These payments are stated at cost and are amortised on a straight-line basis over the respective period of the leases (50 years).
t. Employee benefits: Share-based payments
The Board has adopted a “Share Option Plan”, under which employees and Directors of the Company and its subsidiaries receive remuneration in the form of share-based payment transactions, whereby employees render services as consideration for equity instruments (equity-settled transactions).
The cost of equity-settled transactions with employees is measured by reference to the fair value at the date on which they are granted. The fair value is determined by using an appropriate pricing model, further details of which are given in Note 15.
The cost of equity-settled transactions is recognised, together with a corresponding increase in equity, over the period in which the performance and/or service conditions are fulfilled. The cumulative expense recognised for equity-settled transactions at each reporting date until the vesting date reflects the extent to which the vesting period has expired and the Group’s best estimate of the number of equity instruments that will ultimately vest. The income statement expense or credit for a period represents the movement in cumulative expense recognised at the beginning and end of that period.
No expense is recognised for awards that do not ultimately vest, except for equity-settled transactions where vesting is conditional upon a market or non-vesting condition, which are treated as vesting, irrespective of whether or not the market or non-vesting condition is satisfied, provided that all other performance and/or service conditions are satisfied.
Where the terms of an equity-settled transaction award are modified, the minimum expense recognised is the expense as if the terms had not been modified, if the original terms of the award are met. An additional expense is recognised for any modification that increases the total fair value of the share-based payment transaction, or is otherwise beneficial to the employee, as measured at the date of modification.
Where an equity-settled award is cancelled, it is treated as if it vested on the date of cancellation, and any expense not yet recognised for the award is recognised immediately. This includes any award where non-vesting conditions within the control of either the entity or the employee are not met. However, if a new award is substituted for the cancelled award, and designated as a replacement award on the date that it is granted, the cancelled and new awards are treated as if they were a modification of the original award, as described in the previous paragraph. All cancellations of equity-settled transaction awards are treated equally.
Pension The Group has a defined contribution pension plan where the employer is liable only for the employer’s part of the contribution towards the individual’s pension plan.
The Group will have no legal obligation to pay further contributions. The contributions in the defined contribution plan are recognised as an expense and no additional provision is required in the Consolidated financial statements.
87

88
PPHE HOTEL GROUP ANNUAL REPORT AND ACCOUNTS 2014
NOTES TO CONSOLIDATED FINANCIAL STATEMENTS CONTINUED
Note 2 Summary of significant accounting policies continued u. Borrowing costs for qualifying assets:
Borrowing costs directly attributable to the acquisition, construction or production of qualifying assets, are capitalised to the cost of those assets, until such time as the assets are substantially ready for their intended use or sale. Investment income earned on the temporary investment of specific borrowings pending their expenditure on qualifying assets is deducted from the borrowing costs eligible for capitalisation.
All other borrowing costs are recognised in the income statement in the period in which they are incurred.
v. Taxation: Current income tax
Current income tax assets and liabilities for the current and prior periods are measured at the amount expected to be recovered from or paid to the taxation authorities. The tax rates and tax laws used to compute the amount are those that are enacted or substantively enacted by the reporting date.
Deferred income tax Deferred income tax is provided using the liability method on temporary differences at the reporting date between the tax bases of assets and liabilities and their carrying amounts for financial reporting purposes. Deferred tax liabilities are recognised for all taxable temporary differences, except where the deferred tax liability arises from the initial recognition of goodwill or from an asset or liability in a transaction that is not a business combination and, at the time of the transaction, affects neither the accounting profit nor taxable profit or loss; and in respect of taxable temporary differences associated with investments in subsidiaries, associates and jointly controlled entities, where the timing of the reversal of the temporary differences can be controlled and it is probable that the temporary differences will not reverse in the foreseeable future.
Deferred tax assets and liabilities and changes in them relating to items recognised directly in equity or other comprehensive income are recognised in equity or other comprehensive income and not in the income state.
Deferred tax assets are recognised for all deductible temporary differences, the carry forward of unused tax credits and any unused tax losses. Deferred tax assets are recognised to the extent that it is probable that taxable profit will be available against which the deductible temporary differences and the carry forward of unused tax losses can be utilised, except:
when the deferred income tax asset relating to the deductible temporary difference arises from the initial recognition of an asset or liability in a transaction that is not a business combination and, at the time of the transaction, affects neither the accounting profit nor taxable profit or loss; and
in respect of deductible temporary differences associated with investments in subsidiaries, associates and jointly controlled entities, deferred tax assets are recognised only to the extent that it is probable that the temporary differences will reverse in the foreseeable future and taxable profit will be available against which the temporary differences can be utilised.
The carrying amount of deferred income tax assets is reviewed at each reporting date and reduced to the extent that it is no longer probable that sufficient taxable profit will be available to allow all or part of the deferred income tax asset to be utilised. Unrecognised deferred income tax assets are reassessed at each reporting date and are recognised to the extent that it has become probable that future taxable profit will allow the deferred tax asset to be recovered.
Deferred tax assets and liabilities are measured at the tax rates that are expected to apply in the year when the asset is realised or the liability is settled, based on tax rates (and tax laws) that have been enacted or substantively enacted at the reporting date.
Deferred tax assets and deferred tax liabilities are offset, if a legally enforceable right exists to set-off current tax assets against current tax liabilities and the deferred taxes relate to the same taxable entity and the same taxation authority.
w. Treasury shares: Company shares held by the Company are recognised at cost and presented as a deduction from equity. Any purchase, sale, issue or cancellation of treasury shares is recognised directly in equity.
x. Earnings (loss) per share: Basic earnings (loss) per share amounts are calculated by dividing the net profit (loss) for the year attributable to shareholders of the parent company by the weighted average number of Ordinary shares outstanding during the year.
P P H E H O T E L G R O U P A N N U A L R E P O R T A N D A C C O U N T S 2 0 14
N O T E S T O C O N S O L I D AT E D F I N A N C I A L S TAT E M E N T S C O N T I N U E D
88
89
Note 2 Summary of significant accounting policies continued x. Earnings (loss) per share: continued
Diluted earnings (loss) per share amounts are calculated by dividing the net profit (loss) for the year by the weighted average number of Ordinary shares outstanding during the year plus the weighted average number of Ordinary shares that would be issued on the conversion of all the dilutive potential Ordinary shares into Ordinary shares.
y. Standards issued but not yet applied Standards issued but not yet effective, or subject to adoption by the European Union, up to the date of issuance of the Group’s Consolidated financial statements are listed below. This listing of standards and interpretations issued are those that the Group reasonably expects to have an impact on disclosures, financial position or performance when applied at a future date. The Group intends to adopt these standards when they become mandatory.
The following standards have been issued by the IASB and are not yet effective or are subject to adoption by the European Union.
IFRS 9 Financial Instruments In July 2014, the IASB issued the final version of IFRS 9 Financial Instruments which reflects all phases of the financial instruments project and replaces IAS 39 Financial Instruments: Recognition and Measurement and all previous versions of IFRS 9. The standard introduces new requirements for classification and measurement, impairment, and hedge accounting. IFRS 9 is effective for annual periods beginning on or after 1 January 2018, with early application permitted. Retrospective application is required, but comparative information is not compulsory. The Group is yet to assess IFRS 9’s full impact and will determine the date to adopt IFRS 9 once it is endorsed for use in the EU.
IFRS 15 Revenue from Contract with Customers IFRS 15 was issued in May 2014 and establishes a new five-step model that will apply to revenue arising from contracts with customers. Under IFRS 15 revenue is recognised at an amount that reflects the consideration to which an entity expects to be entitled in exchange for transferring goods or services to a customer. The principles in IFRS 15 provide a more structured approach to measuring and recognising revenue. The new revenue standard is applicable to all entities and will supersede all current revenue recognition requirements under IFRS. Either a full or modified retrospective application is required for annual periods beginning on or after 1 January 2017 with early adoption permitted. The Group is currently assessing the impact of IFRS 15 and plans to adopt the new standard on the required effective date.
IFRIC Interpretation 21 Levies (IFRIC 21) IFRIC 21 clarifies that an entity recognises a liability for a levy when the activity that triggers payment, as identified by the relevant legislation, occurs. For a levy that is triggered upon reaching a minimum threshold, the interpretation clarifies that no liability should be anticipated before the specified minimum threshold is reached. IFRIC was endorsed by the Europe Union in June 2014 and will be effective for annual periods beginning on or after 17 June 2014. The Group is currently assessing the impact of IFRIC 21.
89
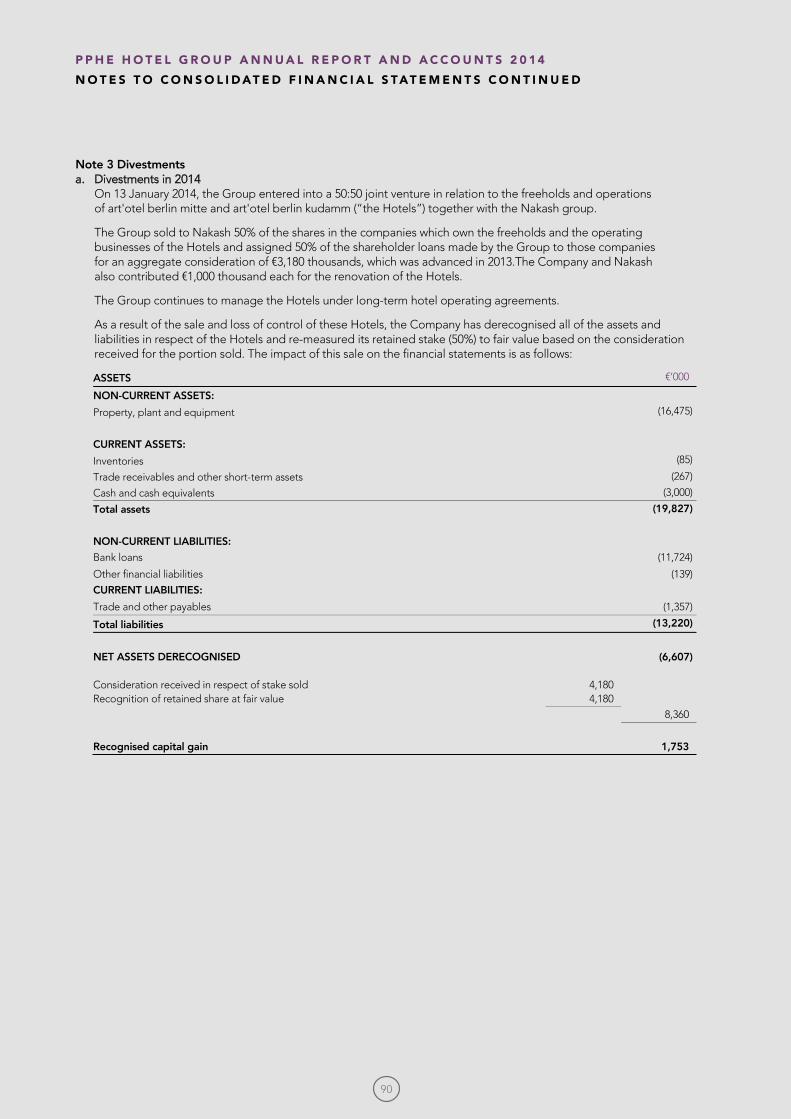
90
PPHE HOTEL GROUP ANNUAL REPORT AND ACCOUNTS 2014
NOTES TO CONSOLIDATED FINANCIAL STATEMENTS CONTINUED
Note 3 Divestments a. Divestments in 2014
On 13 January 2014, the Group entered into a 50:50 joint venture in relation to the freeholds and operations of art'otel berlin mitte and art'otel berlin kudamm (“the Hotels”) together with the Nakash group.
The Group sold to Nakash 50% of the shares in the companies which own the freeholds and the operating businesses of the Hotels and assigned 50% of the shareholder loans made by the Group to those companies for an aggregate consideration of €3,180 thousands, which was advanced in 2013.The Company and Nakash also contributed €1,000 thousand each for the renovation of the Hotels.
The Group continues to manage the Hotels under long-term hotel operating agreements.
As a result of the sale and loss of control of these Hotels, the Company has derecognised all of the assets and liabilities in respect of the Hotels and re-measured its retained stake (50%) to fair value based on the consideration received for the portion sold. The impact of this sale on the financial statements is as follows:
ASSETS €‘000
NON-CURRENT ASSETS:
Property, plant and equipment (16,475)
CURRENT ASSETS:
Inventories (85)
Trade receivables and other short-term assets (267)
Cash and cash equivalents (3,000)
Total assets (19,827)
NON-CURRENT LIABILITIES:
Bank loans (11,724)
Other financial liabilities (139)
CURRENT LIABILITIES:
Trade and other payables (1,357)
Total liabilities (13,220)
NET ASSETS DERECOGNISED Consideration received in respect of stake sold Recognition of retained share at fair value
4,180 4,180
(6,607)
8,360
Recognised capital gain 1,753
P P H E H O T E L G R O U P A N N U A L R E P O R T A N D A C C O U N T S 2 0 14
N O T E S T O C O N S O L I D AT E D F I N A N C I A L S TAT E M E N T S C O N T I N U E D
90

91
Note 3 Divestments continued b. Divestments in 2013
The Company completed a sale to Red Sea Hotels Limited (“Red Sea”) of all the Company’s shares in its subsidiary, Leno Finance Limited (“Leno”), the company through which the Company owned its interest in the site in Pattaya Bay, Thailand, and certain related loans and receivables, for a total consideration of Thai Baht 600 million (€15.0 million). Red Sea is controlled by Mr. Eli Papouchado, Chairman of PPHE Hotel Group, who, together with his family trusts, owns 44.63% of the voting rights in the Company. Mr.Papouchado (and his family trusts) was deemed to be acting in concert with Mr. Boris Ivesha (the President & Chief Executive Officer of the Company) and his family trust, which owns 19.25% of the voting rights in the Company.
None of the consideration for the disposal was paid on completion, but will be payable by Red Sea in cash by no later than January 2017 (by when it is expected that the project will be completed). However, Red Sea will be required to pay the consideration (in whole or in part, as applicable) earlier to the extent either that revenues from the sale of condominium units and serviced apartments exceed the aggregate of the total project development costs (including all financing costs) and related tax liabilities or that value from the project is otherwise released to Red Sea.
The present value of the outstanding consideration is calculated at Thai Baht 419 million (€10.5 million), taking into account a discount rate of 10%.
The Company recognised a profit on the transaction of €2.8 million, which was presented under “Other income and expenses”.
As security for payment of the consideration, the Company has been granted a charge over shares in Leno representing 63% of Leno’s share capital. Under the terms of the United Overseas Bank (“UOB”) facilities, the Company is obliged, among other things, to provide certain financial support in the event of a cost overrun or funding shortfall in relation to the project and, in the event of default by Bali Hai Company Limited (the Thai company undertaking the project that is the borrower under the UOB facility) after completion of the project, UOB can require the Company to purchase the serviced apartments for a consideration equal to the amount then outstanding under the UOB facilities, subject to a maximum of Thai Baht 600 million (€13.3 million). It was a condition of UOB’s consent to the sale of Leno that the Company continues to be bound by these obligations. Red Sea and Leno have agreed to indemnify the Company in respect of certain of these continuing obligations and as security Leno has pledged the shares held by it in Bali Hai Company Limited and certain affiliated Thai companies to the Company.
At the time of the sale, the Company was granted an option to acquire the serviced apartment element of the project for Thai Baht 600 million and to manage the completed development. The Group is under no obligation to Red Sea to proceed with this and have elected not to enter into the management agreement for this project.
91

92
PPHE HOTEL GROUP ANNUAL REPORT AND ACCOUNTS 2014
NOTES TO CONSOLIDATED FINANCIAL STATEMENTS CONTINUED
Note 4 Intangible assets
a. Acquisition of Park Plaza® Hotels & Resorts management and franchise rights and lease rights: 1. Management rights – rights held by the Group relating to the management of Park Plaza® Hotels & Resorts
in Europe, the Middle East and Africa. The management rights are included in the Consolidated financial statements at their fair value as at the date of acquisition and are being amortised over a period of 20 years, based on the terms of the existing contracts and management estimation of their useful life. The remaining amortisation period is 13.5 years.
2. Franchise rights relating to the brand “Park Plaza® Hotels & Resorts” are included in the Consolidated financial statements at their fair value as at the date of acquisition and are being amortised over 20 years, based on management’s estimation of their useful life. The remaining amortisation period is 13.5 years.
b. Acquisition of art’otel® rights: The Group acquired in July 2007, the worldwide rights to use the art’otel® brand name for an unlimited period of time. The rights are being amortised over 20 years based on management’s estimation of their useful life. The remaining amortisation period is 13.5 years.
c. Other intangible assets: These include development costs incurred in connection with a new concept which has been developed by the Group using modular construction to minimise the construction period as well as the construction costs. The development of the new concept is completed and is being amortised over five years.
d. Impairment: In 2014, there were no indicators of impairment.
Park Plaza®
Hotels & Resorts
management rights(a)¹
€’000
Park Plaza® Hotels &
Resorts franchise rights (a)²
€’000
art’otel®
franchise rights (b)
€’000
Other intangible assets (c)
€’000 Total€’000
Cost: Balance as at 1 January 2013 23,936 24,468 4,000 998 53,402 Adjustment for exchange rate differences – – – 3 3 Additions during the year – – – – – Balance as at 31 December 2013 23,936 24,468 4,000 1,001 53,405 Accumulated amortisation: Balance as at 1 January 2013 6,456 6,855 1,917 – 15,228 Amortisation 1,206 1,214 149 222 2,791 Balance as at 31 December 2013 7,662 8,069 2,066 222 18,019 Net book value as at 31 December 2013 16,274 16,399 1,934 779 35,386
Cost: Balance as at 1 January 2014 23,936 24,468 4,000 1,001 53,405 Adjustment for exchange rate differences – – – (7) (7)Additions during the year – – – – – Balance as at 31 December 2014 23,936 24,468 4,000 994 53,398 Accumulated amortisation: Balance as at 1 January 2014 7,662 8,069 2,066 222 18,019 Amortisation 1,204 1,216 149 222 2,791 Balance as at 31 December 2014 8,866 9,285 2,215 444 20,810 Net book value as at 31 December 2014 15,070 15,183 1,785 550 32,588
P P H E H O T E L G R O U P A N N U A L R E P O R T A N D A C C O U N T S 2 0 14
N O T E S T O C O N S O L I D AT E D F I N A N C I A L S TAT E M E N T S C O N T I N U E D
92

93
Note 5 Property, plant and equipment
Land €’000
Hotel buildings
€’000
Income Units sold to private investors*
€’000
Furniture and equipment
€’000 Total€’000
Cost: Balance as at 1 January 2013 261,117 464,189 172,812 101,765 999,883
Additions during the year 27,550 26,402 – 9,792 63,744 Adjustment for exchange rate differences (1,925) (5,928) (3,586) (1,642) (13,081)
Balance as at 31 December 2013 286,742 484,663 169,226 109,915 1,050,546 Accumulated depreciation and impairment:
Balance as at 1 January 2013 9,056 24,747 7,265 46,405 87,473 Provision for depreciation 723 7,674 2,507 10,149 21,053 Adjustment for exchange rate differences (26) (400) (155) (724) (1,305)
Balance as at 31 December 2013 9,753 32,021 9,617 55,830 107,221 Net book value as at 31 December 2013 276,989 452,642 159,609 54,085 943,325
* This includes 531 rooms (“Income Units”) (2013: 535) in Park Plaza Westminster Bridge London, for which the cash flows, derived from the net income generated by these rooms, were sold to private investors (see Note 2(c)). The proceeds from the purchases have been accounted for as a variable rate financial liability (see note 18). See Note 9 for information regarding income swap agreements in respect of certain of these Income Units.
a. Cumulative expenditure for hotels under development, in the amount of €37,483 thousands (2013: €5,119 thousands), relates to the renovation and conversion of the development of, the Park Royal London project, the development site near London Waterloo Station and Park Plaza Nuremberg.
b. The amount of borrowing costs capitalised during the year ended 31 December 2014 was €1,150 thousands (2013: €781 thousands). The rate used to determine the amount of borrowing costs eligible for capitalisation was 4.8% (2013: 4.8%), which is the average effective interest rate of the specific borrowing.
c. For information regarding liens, see Note 16.
d. Land under finance lease:
The Group leases certain land in London under lease agreements longer than 100 years.
Cost: Balance as at 1 January 2014 286,742 484,663 169,226 109,915 1,050,546
Additions during the year – 39,167 – 3,457 42,624 Disposal of subsidiaries (4,823) (10,088) – (1,891) (16,802)Buy back of Income Units sold to private investors 206 1,379 (1,676) 91 – Adjustment for exchange rate differences 9,052 21,365 11,692 4,886 46,995
Balance as at 31 December 2014 291,177 536,486 179,242 116,458 1,123,363 Accumulated depreciation and impairment:
Balance as at 1 January 2014 9,753 32,021 9,617 55,830 107,221 Provision for depreciation 743 8,014 2,653 10,186 21,596 Disposal of subsidiaries – – – (327) (327)Buy back of Income Units sold to private investors – 72 (121) 49 – Adjustment for exchange rate differences 96 1,809 1,044 3,257 6,206
Balance as at 31 December 2014 10,592 41,916 13,193 68,995 134,696 Net book value as at 31 December 2014 280,585 494,570 166,049 47,463 988,667
As at 31 December
2014
€’000 2013€’000
Cost – capitalised finance leases 18,430 19,653 Accumulated depreciation (1,401) (1,223)Net book value 17,029 18,430
93

94
PPHE HOTEL GROUP ANNUAL REPORT AND ACCOUNTS 2014
NOTES TO CONSOLIDATED FINANCIAL STATEMENTS CONTINUED
Note 6 Prepaid leasehold payments In 1988, Utrecht Victoria Hotel B.V. entered into a land lease agreement for a period of 50 years ending in 2038, which has been fully prepaid.
Note 7 Investment in associate In April 2008, Euro Sea Hotels N.V., a wholly owned subsidiary of the Company, acquired 20% of the shares of WH/DMREF Bora B.V. (“Bora”). Bora currently owns approximately 74% of Arenaturist d.d., a public company listed on the Zagreb (Croatia) Stock Exchange, and 100% of three related private companies. These companies together own seven hotels, six apartment complexes and eight camp-sites in or around Pula on the Istrian coast of Croatia. As part of the transaction, the Company also acquired 20% of the debt owed by Bora to its shareholders. The total consideration for the acquisition, including the debt acquired, was €22.4 million, which was funded by the Company from its existing cash resources. The investment in Bora is accounted for under the equity method in accordance with IAS 28.
a. The investment in Bora comprised as follows:
* The loan is denominated in Kuna and bears interest of 8.9% per annum. The loan is due on 31 August 2020.
b. The loan to Bora comprised as follows:
Year ended 31 December
2014
€’000 2013€’000
Cost: Balance as at 1 January 466 466 Additions – – Balance as at 31 December 466 466 Accumulated amortisation: Balance as at 1 January 31 13 Provision for amortisation 18 18 Balance as at 31 December 49 31 Amortised cost as at 31 December 417 435
As at 31 December
2014
€’000 2013€’000
Loan to associate* 35,060 32,241 Foreign currency translation adjustment 385 369 Share of associate’s net assets under equity method (14,159) (11,223)
Loan to associate (adjusted for losses recognised under the equity method) 21,286 21,387
As at 31 December
2014
€’000 2013€’000
Opening balance 32,241 29,906 Interest on loans 2,962 2,723 Foreign currency translation reserve (143) (388)
Closing balance 35,060 32,241
P P H E H O T E L G R O U P A N N U A L R E P O R T A N D A C C O U N T S 2 0 14
N O T E S T O C O N S O L I D AT E D F I N A N C I A L S TAT E M E N T S C O N T I N U E D
94
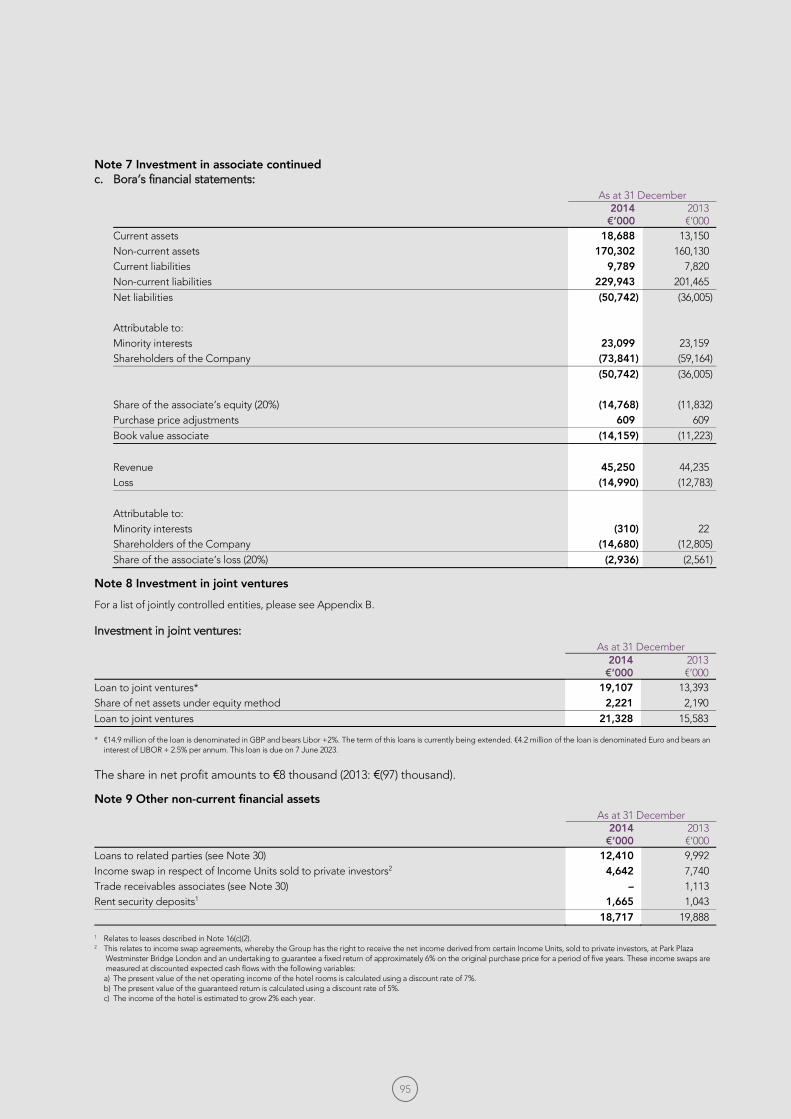
95
Note 7 Investment in associate continued c. Bora’s financial statements:
Note 8 Investment in joint ventures For a list of jointly controlled entities, please see Appendix B.
Investment in joint ventures:
* €14.9 million of the loan is denominated in GBP and bears Libor +2%. The term of this loans is currently being extended. €4.2 million of the loan is denominated Euro and bears an interest of LIBOR + 2.5% per annum. This loan is due on 7 June 2023.
The share in net profit amounts to €8 thousand (2013: €(97) thousand).
Note 9 Other non-current financial assets
1 Relates to leases described in Note 16(c)(2). 2 This relates to income swap agreements, whereby the Group has the right to receive the net income derived from certain Income Units, sold to private investors, at Park Plaza
Westminster Bridge London and an undertaking to guarantee a fixed return of approximately 6% on the original purchase price for a period of five years. These income swaps are measured at discounted expected cash flows with the following variables: a) The present value of the net operating income of the hotel rooms is calculated using a discount rate of 7%. b) The present value of the guaranteed return is calculated using a discount rate of 5%. c) The income of the hotel is estimated to grow 2% each year.
As at 31 December
2014
€’000 2013€’000
Current assets 18,688 13,150 Non-current assets 170,302 160,130 Current liabilities 9,789 7,820 Non-current liabilities 229,943 201,465 Net liabilities (50,742) (36,005) Attributable to: Minority interests 23,099 23,159 Shareholders of the Company (73,841) (59,164) (50,742) (36,005) Share of the associate’s equity (20%) (14,768) (11,832)Purchase price adjustments 609 609 Book value associate (14,159) (11,223)
Revenue 45,250 44,235 Loss (14,990) (12,783) Attributable to: Minority interests (310) 22 Shareholders of the Company (14,680) (12,805)Share of the associate’s loss (20%) (2,936) (2,561)
As at 31 December
2014
€’000 2013 €’000
Loan to joint ventures* 19,107 13,393 Share of net assets under equity method 2,221 2,190 Loan to joint ventures 21,328 15,583
As at 31 December
2014
€’000 2013€’000
Loans to related parties (see Note 30) 12,410 9,992 Income swap in respect of Income Units sold to private investors2 4,642 7,740 Trade receivables associates (see Note 30) – 1,113 Rent security deposits1 1,665 1,043 18,717 19,888
95

96
PPHE HOTEL GROUP ANNUAL REPORT AND ACCOUNTS 2014
NOTES TO CONSOLIDATED FINANCIAL STATEMENTS CONTINUED
Note 10 Other current financial assets
1 The fair value of the available-for-sale investment in shares is based on quoted market prices. The currency of these investments is Euro. 2 Gains (losses) from unrealised available-for-sale investment in shares for an amount of €(74,000) (2013: €206,000) were recorded in other comprehensive income.
Note 11 Trade receivables a. Composition:
Trade receivables are non-interest bearing. The Group’s policy provides an average of 30 days’ payment terms.
b. Movements in the allowance for doubtful accounts were as follows:
c. As at 31 December, the ageing analysis of trade receivables is as follows:
Note 12 Other receivables and prepayments
* The amount owed by related parties bears no interest and has no repayment date; see Note 30.
Note 13 Cash and cash equivalents Cash at banks earns interest at floating rates based on daily bank deposit rates. Short-term deposits are made for varying periods of between one day and three months, depending on the immediate cash requirements of the Group, and earn interest at the respective short-term deposit rates.
As at 31 December
2014
€’000 2013€’000
Available-for-sale investment in shares1, 2 1,464 1,538
As at 31 December
2014
€’000 2013€’000
Trade receivables 11,762 13,655 Related parties – Arenaturist Group (see Note 30) 3,623 2,425 Less – allowance for doubtful debts (289) (318) 15,096 15,762
€’000As at 1 January 2013 448 Deductions (121)Exchange rate differences (9)As at 31 December 2013 318 Deductions (43)Exchange rate differences 14 As at 31 December 2014 289
Past due but not impaired
Total €’000
Neither past due nor
impaired€’000
< 30 days€’000
30 to 60 days€’000
60 to 90 days €’000
> 90 days€’000
2014 15,385 6,235 6,052 1,961 414 723 2013 16,080 4,407 7,354 2,223 659 1,437
As at 31 December
2014
€’000 2013 €’000
Prepaid expenses 5,198 4,098 VAT 1,391 897 Related parties* 245 196 Others 859 684 7,693 5,875
P P H E H O T E L G R O U P A N N U A L R E P O R T A N D A C C O U N T S 2 0 14
N O T E S T O C O N S O L I D AT E D F I N A N C I A L S TAT E M E N T S C O N T I N U E D
96

97
Note 14 Equity a. Share capital:
The authorised share capital of the Company is represented by an unlimited number of ordinary shares with no par value.
As at 31 December 2014, the number of Ordinary shares issued was 43,492,792 (2013: 43,377,292), 1,862,000 of which were held as treasury shares (2013: 1,862,000). The increase of the number of shares issued in 2014 was due to the exercise of share options (see note 15).
The Company’s shares are admitted to the standard listing segment of the Official List of the UK Listing Authority and to trading on the Main Market for listed securities of the London Stock Exchange.
The Directors consider that the issued capital and the share premium reserve constitute the Share Capital account for the purpose of the Companies (Guernsey) Law, 2008.
b. Treasury shares: On 29 September 2009, the Company purchased 862,000 of its ordinary shares at a price per share of 111 pence. On 26 October 2011, the Company purchased 800,000 of its ordinary shares at a price of 227 pence. On 29 August 2012, the Company purchased 200,000 of its ordinary shares at a price of 210 pence. The total number of treasury shares amounts to 1,862,000.
c. Nature and purpose of reserves: Other reserves
The other reserves mainly consist of results of transactions that affected the equity of the Group before and during the listing on the Stock Exchange in 2007, the change in fair value of the available for sale financial assets and share-based payments.
Foreign currency translation reserve The foreign currency translation reserve is used to record exchange differences arising from the translation of the financial statements of foreign operations.
Hedging reserve This reserve is comprised of the gain or loss on a hedging instrument in a cash flow hedge that is determined to be an effective hedge.
Note 15 Share-based payments During 2007, the Company established a share option plan (the “Plan”) with the following principal terms:
a. The Plan has two types of options: Option A and Option B. The exercise price of both options will not be less than the closing price of a share on the dealing day immediately preceding the date of grant (as published in the Financial Times on the date of grant). Option A vests over a period of three years from date of grant and Option B vests at the end of three years from grant date. Unexercised options expire ten years after the date of grant. The Plan does not include any performance conditions.
b. At any time, the total number of shares issued and/or available for grant (in a ten-year period) under the Plan or under any other employee share scheme which the Company may establish in the future may not exceed 5% of the Company’s issued share capital at that time. For the purpose of this calculation, any option granted under the Plan immediately following admission to the AIM in July 2007 is disregarded.
The fair value of the options is estimated at the grant date using the binomial pricing model according to the terms and conditions upon which the options were granted.
The expense arising from equity-settled share-based payment transactions during 2014 is €124,000 (2013: €144,000). As at 31 December 2014, 262,000 options became exercisable (2013: 262,000). Total exercisable options at 31 December 2014 amounts to 642,950 (2013: 506,800).
97

98
PPHE HOTEL GROUP ANNUAL REPORT AND ACCOUNTS 2014
NOTES TO CONSOLIDATED FINANCIAL STATEMENTS CONTINUED
Note 15 Share-based payments continued Movements during the year The following table illustrates the number (No.) and weighted average exercise prices (EP) of, and movements in, share options during 2014 and 2013:
The weighted average remaining contractual life for the share options outstanding as at 31 December 2014 is seven years (2013: eight years).
Note 16 Pledges, contingent liabilities and commitments a. Pledges, collateral and securities:
Substantially all of the Group’s assets and all of the rights connected or related to the ownership of the assets (including shares of subsidiaries and restricted deposits) are pledged in favour of banks and financial institutions as security for loans received. For most of the loans, specific assets are pledged as the sole security provided.
b. Restricted cash: (i) As part of the development of Park Plaza Westminster Bridge London, Marlbray sold the net operating income
of certain rooms (“Income Units”) in the Park Plaza Westminster Bridge London to private investors during the construction phase of the hotel. Typically these investors entered into contracts to acquire an Income Unit and paid a deposit of up to 25% of the purchase price. Upon completion of the hotel, investors were required to pay the balance of the purchase price. A number of the investors who entered into contracts to buy Income Units and paid deposits failed to pay the balance due on the contract at completion and Marlbray rescinded their contracts and forfeited their deposits.
As at 31 December 2013, a balance of £7.6 million (€9.3 million), being forfeited deposits, was held in respect of the rescinded contracts. Certain of these investors instigated legal proceedings seeking recovery of the forfeited deposits. The proceedings comprised two actions, namely a larger action with over 100 investors, and a smaller action with a handful of investors. Whilst the proceedings were ongoing, the deposits were held in a solicitor’s escrow account and could not be released to the Group.
The larger action relating to £7.5 million (€9.2 million) has been settled and on 26 June 2014 £5.9 million (€7.4 million), was released from the escrow account to Marlbray and the balance paid to the claimants. With regard to the smaller action, the proceedings are ongoing, and £0.1m (€0.1m) of forfeited deposits remain in the escrow account (presented under short term restricted cash and deposits).
The receipt of €7.4 million in respect of the larger action together with €0.6 million preliminarily received from the escrow account in previous years have been accounted for as a profit in other income and expenses in the 2014 consolidated income statement.
(ii) Under Marlbray’s facility agreement with Bank Hapoalim (Luxembourg) S.A. (Bank Hapoalim), sufficient funds are required to be deposited in the DSCR account until the sum deposited is equal to twice the amount of interest payable on the next interest payment date. The deposits in the DSCR account in the amount of £3.2 million (€4.0 million) are presented as restricted in the financial statements.
c. Commitments: 1. Management and franchise agreements:
(i) The Group entered into a Territorial Licence Agreement (the “Master Agreement”) with Carlson Hotels Worldwide, Inc. (“CarlsonSM”). Under the Master Agreement, the Group, amongst other rights, is granted an exclusive licence to use the brand “Park Plaza® Hotels & Resorts” in 56 territories throughout Europe, the Middle East and Africa in perpetuity (the “Territory”).
The Master Agreement also allows the Group to use, and license others to use, the CarlsonSM Systems within the Territory which right includes the right to utilise the CarlsonSM System’s international marketing and reservations facilities and to receive other promotional assistance. The Group pays CarlsonSM a fee based on a percentage of the hotels’ gross room revenue.
No. of options A No. of options B EPOutstanding as at 1 January 2014 929,550 101,250 £2.02 Options forfeited during the year – (10,350) £1.00 Options exercised in the year (115,500) – £2.34 Options granted during the year – – Outstanding as at 31 December 2014 814,050 90,900 £1.77 Outstanding as at 31 December 2013 929,550 101,250 £2.02
P P H E H O T E L G R O U P A N N U A L R E P O R T A N D A C C O U N T S 2 0 14
N O T E S T O C O N S O L I D AT E D F I N A N C I A L S TAT E M E N T S C O N T I N U E D
98

99
Note 16 Pledges, contingent liabilities and commitments continued c. Commitments continued
(ii) The Group entered into several management agreements with operated hotels and developed hotels located in the Netherlands, United Kingdom, Germany, Hungary and Croatia in consideration for an annual fee of 2% to 3% of the hotels’ revenues, as applicable, as well as 7% to 10% of the (adjusted) gross operating profit. The Group is also charging sales, marketing and service fees as a percentage of total revenue, and is partially reimbursed for certain portions of the expenses incurred. The management agreements are for periods of between 15 and 25 years.
(iii) Within the terms of the management agreements, the hotels were granted by the Group a licence allowing them the utilisation, throughout the term of the management agreements, of the “Park Plaza® Hotels & Resorts or art’otel®”name.
2. Lease agreements:
(i) The Group has entered into several finance lease agreements for the rental of land. Certain of the leases are subject to periodic rent reviews. The Group’s share in the future minimum rental payments under non-cancellable leases are as follows:
2014
€’000 2013€’000
Within one year 1,816 1,448 After one year but not more than five years 7,263 5,791 More than five years 254,146 161,479 263,225 168,718 Less amounts representing finance charges (235,836) (149,065)Present value of minimum lease payments 27,389 19,653
The present value of the minimum lease payments is as follows:
Details regarding the finance lease agreements are as below:
a) Grandis Netherlands Holding B.V. (“Grandis”) has a land leasehold interest expiring in 2095, of Park Plaza Sherlock Holmes London. The current annual rent amounts to £1,090,000 (subject to “open market value” rent review every five years).
Grandis has an option to extend the lease to a total of 125 years, expiring in 2121. The Company also has an option to terminate the lease in 2059.
As at 31 December 2014, an arbitrator, appointed to determine the rent review of 29 September 2011 has rendered her arbitral award for the reviewed 2011 rent at £1,090,000. Grandis has appealed the arbitrator’s decision. The result of that appeal is not yet known. Grandis has paid the balance of rent due from 29 September 2011 plus interest, plus the increased rent going forward in accordance with the terms of the lease. Depending on the outcome of the appeal, Grandis could recover some rent or might be liable to pay a proportion of the landlord’s legal costs.
b) Riverbank Hotel Holding B.V. has a land leasehold interest expiring in 2125, for Park Plaza Riverbank London, subject to rent review every five years. A deed of variation of the lease of Park Plaza Riverbank London was entered into on 13 June 2014 under which the rent payable under the lease increases to £864,334 (€1.1 million) per annum. The tenant is granted a right to renew the lease for an additional 60 years. At completion of the deed, the landlord paid £5.0 million (€6.3 million) to Riverbank Hotel Holding B.V., which is accounted for as a long-term finance lease liability.
2014
€’000 2013€’000
Within one year – – After one year but not more than five years 1 1 More than five years 27,388 19,652
27,389 19,653
99
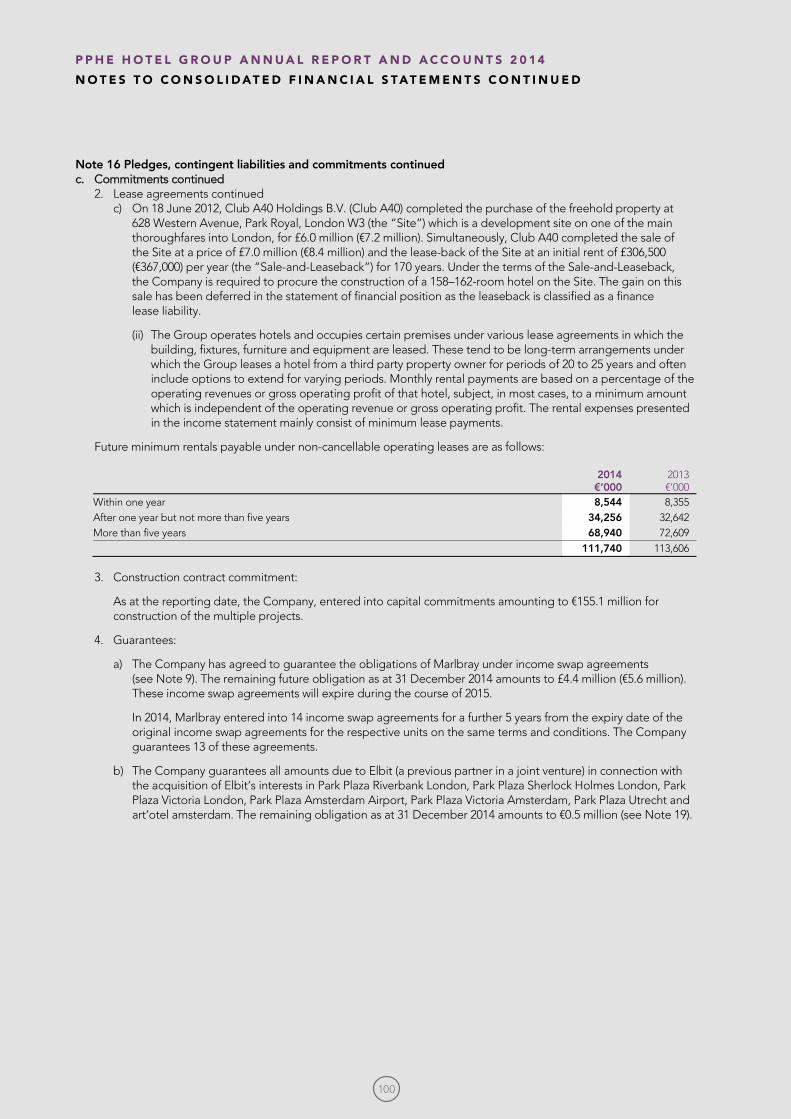
100
PPHE HOTEL GROUP ANNUAL REPORT AND ACCOUNTS 2014
NOTES TO CONSOLIDATED FINANCIAL STATEMENTS CONTINUED
Note 16 Pledges, contingent liabilities and commitments continued c. Commitments continued 2. Lease agreements continued
c) On 18 June 2012, Club A40 Holdings B.V. (Club A40) completed the purchase of the freehold property at 628 Western Avenue, Park Royal, London W3 (the “Site”) which is a development site on one of the main thoroughfares into London, for £6.0 million (€7.2 million). Simultaneously, Club A40 completed the sale of the Site at a price of £7.0 million (€8.4 million) and the lease-back of the Site at an initial rent of £306,500 (€367,000) per year (the “Sale-and-Leaseback”) for 170 years. Under the terms of the Sale-and-Leaseback, the Company is required to procure the construction of a 158–162-room hotel on the Site. The gain on this sale has been deferred in the statement of financial position as the leaseback is classified as a finance lease liability.
(ii) The Group operates hotels and occupies certain premises under various lease agreements in which the building, fixtures, furniture and equipment are leased. These tend to be long-term arrangements under which the Group leases a hotel from a third party property owner for periods of 20 to 25 years and often include options to extend for varying periods. Monthly rental payments are based on a percentage of the operating revenues or gross operating profit of that hotel, subject, in most cases, to a minimum amount which is independent of the operating revenue or gross operating profit. The rental expenses presented in the income statement mainly consist of minimum lease payments.
Future minimum rentals payable under non-cancellable operating leases are as follows:
3. Construction contract commitment:
As at the reporting date, the Company, entered into capital commitments amounting to €155.1 million for construction of the multiple projects.
4. Guarantees:
a) The Company has agreed to guarantee the obligations of Marlbray under income swap agreements (see Note 9). The remaining future obligation as at 31 December 2014 amounts to £4.4 million (€5.6 million). These income swap agreements will expire during the course of 2015.
In 2014, Marlbray entered into 14 income swap agreements for a further 5 years from the expiry date of the original income swap agreements for the respective units on the same terms and conditions. The Company guarantees 13 of these agreements.
b) The Company guarantees all amounts due to Elbit (a previous partner in a joint venture) in connection with the acquisition of Elbit’s interests in Park Plaza Riverbank London, Park Plaza Sherlock Holmes London, Park Plaza Victoria London, Park Plaza Amsterdam Airport, Park Plaza Victoria Amsterdam, Park Plaza Utrecht and art’otel amsterdam. The remaining obligation as at 31 December 2014 amounts to €0.5 million (see Note 19).
2014
€’000 2013€’000
Within one year 8,544 8,355 After one year but not more than five years 34,256 32,642 More than five years 68,940 72,609 111,740 113,606
P P H E H O T E L G R O U P A N N U A L R E P O R T A N D A C C O U N T S 2 0 14
N O T E S T O C O N S O L I D AT E D F I N A N C I A L S TAT E M E N T S C O N T I N U E D
100
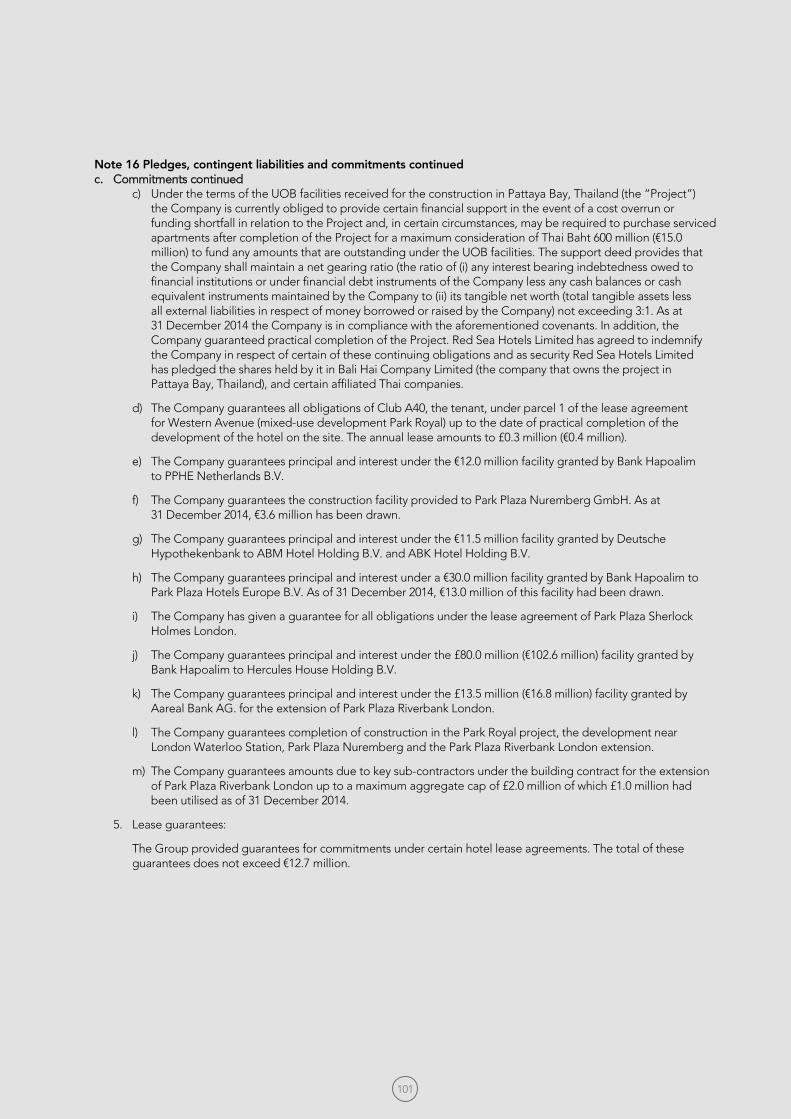
101
Note 16 Pledges, contingent liabilities and commitments continued c. Commitments continued
c) Under the terms of the UOB facilities received for the construction in Pattaya Bay, Thailand (the “Project”) the Company is currently obliged to provide certain financial support in the event of a cost overrun or funding shortfall in relation to the Project and, in certain circumstances, may be required to purchase serviced apartments after completion of the Project for a maximum consideration of Thai Baht 600 million (€15.0 million) to fund any amounts that are outstanding under the UOB facilities. The support deed provides that the Company shall maintain a net gearing ratio (the ratio of (i) any interest bearing indebtedness owed to financial institutions or under financial debt instruments of the Company less any cash balances or cash equivalent instruments maintained by the Company to (ii) its tangible net worth (total tangible assets less all external liabilities in respect of money borrowed or raised by the Company) not exceeding 3:1. As at 31 December 2014 the Company is in compliance with the aforementioned covenants. In addition, the Company guaranteed practical completion of the Project. Red Sea Hotels Limited has agreed to indemnify the Company in respect of certain of these continuing obligations and as security Red Sea Hotels Limited has pledged the shares held by it in Bali Hai Company Limited (the company that owns the project in Pattaya Bay, Thailand), and certain affiliated Thai companies.
d) The Company guarantees all obligations of Club A40, the tenant, under parcel 1 of the lease agreement for Western Avenue (mixed-use development Park Royal) up to the date of practical completion of the development of the hotel on the site. The annual lease amounts to £0.3 million (€0.4 million).
e) The Company guarantees principal and interest under the €12.0 million facility granted by Bank Hapoalim to PPHE Netherlands B.V.
f) The Company guarantees the construction facility provided to Park Plaza Nuremberg GmbH. As at 31 December 2014, €3.6 million has been drawn.
g) The Company guarantees principal and interest under the €11.5 million facility granted by Deutsche Hypothekenbank to ABM Hotel Holding B.V. and ABK Hotel Holding B.V.
h) The Company guarantees principal and interest under a €30.0 million facility granted by Bank Hapoalim to Park Plaza Hotels Europe B.V. As of 31 December 2014, €13.0 million of this facility had been drawn.
i) The Company has given a guarantee for all obligations under the lease agreement of Park Plaza Sherlock Holmes London.
j) The Company guarantees principal and interest under the £80.0 million (€102.6 million) facility granted by Bank Hapoalim to Hercules House Holding B.V.
k) The Company guarantees principal and interest under the £13.5 million (€16.8 million) facility granted by Aareal Bank AG. for the extension of Park Plaza Riverbank London.
l) The Company guarantees completion of construction in the Park Royal project, the development near London Waterloo Station, Park Plaza Nuremberg and the Park Plaza Riverbank London extension.
m) The Company guarantees amounts due to key sub-contractors under the building contract for the extension of Park Plaza Riverbank London up to a maximum aggregate cap of £2.0 million of which £1.0 million had been utilised as of 31 December 2014.
5. Lease guarantees:
The Group provided guarantees for commitments under certain hotel lease agreements. The total of these guarantees does not exceed €12.7 million.
101

102
PPHE HOTEL GROUP ANNUAL REPORT AND ACCOUNTS 2014
NOTES TO CONSOLIDATED FINANCIAL STATEMENTS CONTINUED
Note 17 Bank borrowings The bank borrowings of the Group are composed as follows:
For securities and pledges, see Note 16.
* In this overview hedging arrangements have been taken into account in presentation of the interest rates; for details on these hedging arrangements refer to Note 31(h).
As at 31 December 2014 Maturity analysis
Bank/facility
Note Currency Interest rate MaturityOutstanding
amount Year 1 Year 2 Year 3 Year 4 Year 5 Thereafter
Aareal Bank
17(1) GBP 5.665% Dec 2018 175,080 – – – 175,080 – – (eight hotels in GBP 3M LIBOR Dec 2018 28,747 2,178 2,150 3,224 21,195 – – The Netherlands +2.9% and the United EUR 4.599% Dec 2018 120,399 1,292 1,262 1,938 115,907 – – Kingdom) EUR 3M EURIBOR Dec 2018 23,760 240 240 360 22,920 – – +2.9% Bank Hapoalim 17(2) GBP 5.29% Jun 2018 69,248 1,487 1,766 1,859 64,136 – – (Park Plaza Westminster GBP 5.83% Jun 2018 68,142 1,463 1,737 1,829 63,113 – – Bridge London)
Royal Bank of Scotland
17(3) GBP 6.43% Jan 2019 14,002 177 299 329 352 12,845 –
(Park Plaza Leeds) GBP 7.78% Jan 2019 2,762 59 100 110 117 2,376 –
Royal Bank of Scotland
17(4) GBP 6.84% May 2027 7,305 95 131 141 148 154 6,636
(Park Plaza Nottingham) Bank Hapoalim 17(5) EUR EURIBOR May 2015 7,250 7,250 – – – – – (PPHE Netherlands) +3.9% Bank Hapoalim 17(5) EUR EURIBOR Dec 2018 13,000 2,080 2,080 4,420 4,420 – – (Park Plaza Hotels
Europe B.V.)
+4.4%
Bank Hapoalim GBP LIBOR Jun 2017 34,207 – – 34,207 – – – (Waterloo development) +3.25–3.5%
Deutsche Hypothekenbank
17(6) EUR
3M EURIBOR +1.6% Dec 2016 3,600 – 3,600 – – – –
(Park Plaza Nuremberg) 567,502 16,321 13,365 48,417 467,388 15,375 6,636 Capitalised transaction costs and other adjustments (12,730) (358) 554,772 15,963
P P H E H O T E L G R O U P A N N U A L R E P O R T A N D A C C O U N T S 2 0 14
N O T E S T O C O N S O L I D AT E D F I N A N C I A L S TAT E M E N T S C O N T I N U E D
102

103
Note 17 Bank borrowings continued
For securities and pledges, see Note 16.
* As the refinance of this facility is agreed before balance sheet date and effected after balance sheet date, the maturity analysis is performed based on the new loan.
As at 31 December 2013 Maturity analysis
Bank/facility
Note Currency Interest
rate MaturityOutstanding
amount Year 1 Year 2Year
3 Year 4 Year 5 Thereafter
Aareal Bank
17(1) GBP 5.665% Dec 2018 164,085 – – – – 164,085 – (eight hotels in GBP 3M LIBOR Dec 2018 28,897 2,014 2,014 2,014 2,615 20,240 – The Netherlands +2.9% and the United EUR 4.599% Dec 2018 121,691 1,292 1,292 1,292 1,938 115,877 – Kingdom)
EUR 3M
EURIBOR Dec 2018 – – – – – – – +2.9% Bank Hapoalim 17(2) GBP 5.29% Jun 2018 66,301 1,394 1,394 1,394 1,655 60,464 – (Park Plaza Westminster GBP 5.83% Jun 2018 65,186 1,370 1,370 1,370 1,627 59,449 – Bridge London)
Bank Hapoalim*
EUR 3M
EURIBOR Mar 2014 26,000 2,240 240 240 360 22,920 – (art’otel amsterdam) +2.5% Refinanced
to Dec
2018
Royal Bank of Scotland
17(3) GBP 6.43% Jan 2019 13,260 274 292 401 457 495 11,341
(Park Plaza Leeds) GBP 7.78% Jan 2019 2,653 55 59 80 91 99 2,269
Royal Bank of Scotland
17(4) GBP 6.84% May 2027 6,918 74 88 123 132 139 6,362
(Park Plaza Nottingham) Bank Hapoalim 17(5) EUR EURIBOR May 2015 9,750 2,500 7,250 – – – – (PPHE Netherlands) +3.9% Bank Hapoalim 17(5) EUR EURIBOR Dec 2018 10,000 – 1,600 1,600 3,400 3,400 – (Park Plaza Hotels Europe B.V.) +4.4% Bank Hapoalim GBP LIBOR Dec 2014 14,420 14,420 – – – – –
(Waterloo development)
+3.25–3.5%
Deutsche Hypothekenbank
EUR 3.93% Apr 2023 12,310 388 403 421 438 456 10,204
(art’otel berlin mitte and
art’otel berlin kudamm)
541,471 26,021 16,002 8,935 12,713 447,624 30,176
Capitalised transaction costs and other adjustments (15,303) (586)
526,168 25,435
103

104
PPHE HOTEL GROUP ANNUAL REPORT AND ACCOUNTS 2014
NOTES TO CONSOLIDATED FINANCIAL STATEMENTS CONTINUED
Note 17 Bank borrowings continued The Group companies in the above facilities are required to comply with certain financial covenants as described below:
1. Under the Aareal Bank AG (“Aareal”) facility the borrowers must ensure that the aggregate amount of the outstanding facilities does not exceed 65% of the value of the hotels as set out in the most recent valuation. In addition, the borrowers must ensure that, on each interest payment date, the Debt Service Cover Ratio (”DSCR”) (the net operating income of the hotels for each of the four preceding financial quarters relative to the principal, interest and other costs payable by the borrowers for the next four financial quarters) is not less than 115%.
2. Under the Bank Hapoalim facility for Park Plaza Westminster Bridge London the borrowers must ensure that the aggregate amount of the outstanding facility does not exceed 75% of the value of the hotel as set out in the most recent valuation. In addition, the borrowers must ensure that, on each interest payment date, the DSCR is not less than 130%.
3. Under the Royal Bank of Scotland plc facility for Park Plaza Leeds the borrowers must ensure that the aggregate amount of the outstanding facility does not exceed 88% of the value of the hotel as set out in the most recent valuation.
4. Under the Royal Bank of Scotland plc facility for Park Plaza Nottingham the borrowers must ensure that the aggregate amount of the outstanding facilities does not exceed 60% of the value of the hotel as set out in the most recent valuation.
5. Under the Bank Hapoalim facility for each of PPHE Netherlands B.V., Park Plaza Hotels Europe B.V. and Hercules House Holding B.V. the following covenants apply:
a) the shareholders equity of the Company is not less than the lower of €150.0 million (if calculated in Euro), or £110.0 million (if calculated in Sterling);
b) the shareholders equity of the Company, less the equity invested in development projects by the Group, which are subject to construction facilities (in which there is no recourse to the borrower there under), is not less than €93.0 million;
c) the adjusted shareholders equity of the Company shall not be less than the value of 20% of the Relevant Assets Value, as such terms are defined in the agreement;
d) the adjusted shareholders equity of the Company, less the equity invested in development projects, which are subject to construction facilities (in which there is no recourse to the borrower there under), is not less than 20% of the relevant assets value.
In addition to the above covenants the following covenants apply to PPHE Netherlands B.V. and Park Plaza Hotels Europe B.V. individually:
PPHE Netherlands B.V. a) the outstanding loan under the Aareal facility in the Netherlands (Note 17(1)) does not exceed 70% of the value
of the mortgaged properties under the Aareal facility, and
b) the debt service cover ratio under the Aareal facility in the Netherlands (Note 17(1)) (which is the net operating income of the hotels mortgaged under the Aareal facility in the Netherlands for each of the four preceding financial quarters relative to the principal, interest and other costs payable by the borrowers for the next four financial quarters) is not less than 120%.
Park Plaza Hotels Europe B.V. a) The ratio of the consolidated financial indebtness of the borrower and its subsidiaries to Consolidated EBITDA
of the borrower shall not exceed 5 to 1.
6. Under the Deutsche Hypothekenbank facility for Park Plaza Nuremberg the borrowers must ensure throughout the entire term of the loan that, the outstanding amount of the outstanding loan does not exceed 65%of the value of the property and that the DSCR is not less than 140%.
For guarantees under the above facility agreements see Note 16(c)(4). For hedging arrangements under the above facilities see Note 31(h).
As at 31 December 2014, the Group is in compliance with all its banking covenants.
P P H E H O T E L G R O U P A N N U A L R E P O R T A N D A C C O U N T S 2 0 14
N O T E S T O C O N S O L I D AT E D F I N A N C I A L S TAT E M E N T S C O N T I N U E D
104

105
Note 18 Financial liability in respect of Income Units sold to private investors
This liability originated from the proceeds received from the sale to private investors of the future 999 year cash flows, derived from certain hotel rooms in Park Plaza Westminster Bridge London. Furthermore, as the investors are required to fund all capital expenditures ("Capex") to be made in connection with these rooms, a receivable is recorded in each period for any excess of depreciation expense over the amounts paid by the investors on account of Capex. This receivable is offset from the liability to the investors. See note 9 for income swap agreements.
This liability is amortised over the term of the agreement, being 999 years.
Note 19 Other financial liabilities
1 This relates to the 2010 business combination for the acquisition of various hotels in the United Kingdom. The amount may be reduced depending on the performance of the Company’s shares during the five-year period following completion as follows. 2013 also includes €0.9 million due to the 2012 business combination for the acquisition of hotels in the Netherlands. The deferred consideration for the UK transaction has the following reduction mechanism:
a) If at the settlement date, the average share price of the Company (over the last 60 business days) is higher than a certain amount (“Cap”), the remaining cash payment is cancelled.
b) If at the settlement date, the average share price of the Company (over the last 60 business days) is lower than the Cap but higher than £1.50, the remaining cash payment will be reduced by the difference between the share price and £1.50 (“Floor”) multiplied by 1,000 thousand shares.
c) If at the settlement date, the average share price of the Company (over the last 60 business days) is lower than the Floor the remaining cash payment is £3.5 million (€4.1 million).
The fair value is estimated using the following variables:
i) The present value of the contingent cash payment using a discount rate of 5%.
ii) Plus the value of an American call option (using a binomial model) with an exercise price of the Floor.
iii) Minus the value of an American call option (using a binomial model) with an exercise price of the Cap.
The following lists the inputs to the binomial model used in 2014 for the fair value measurement of the American call options:
As at 31 December
2014
€’000 2013 €’000
Total liability 193,108 182,738 Due from investors for re-imbursement of capital expenditure (12,966) (9,735) 180,142 173,003
As at 31 December
2014
€’000 2013€’000
Derivative financial instruments (see Note 31(h)) 31,225 20,318 Lease liability (see Note 16(c)(2)) 27,389 19,653 Deferred consideration business combination1 520 2,943 Other 8,531 8,830 67,665 51,744
Dividend yield (%) 3.8 Expected volatility of the share prices (%) 15.8 Risk-free interest rate (%) 0.223 Expected life of share options (years) 1.5
105

106
PPHE HOTEL GROUP ANNUAL REPORT AND ACCOUNTS 2014
NOTES TO CONSOLIDATED FINANCIAL STATEMENTS CONTINUED
Note 20 Other payables and accruals
Note 21 Revenues
Note 22 Operating expenses
As at 31 December
2014
€’000 2013€’000
Employees 2,071 1,574 VAT and taxes 5,903 6,678 Accrued interest 1,941 1,802 Corporate income taxes 116 201 Accrued expenses 9,612 9,014 Advance payments received 7,845 6,170 Other loans from third parties – 4,180 Accrued rent 2,235 2,848 Related parties 709 278 30,432 32,745
Year ended 31 December
2014
€’000 2013€’000
Rooms 182,072 169,158 Food and beverage 72,656 62,249 Minor operating 5,320 5,372 Management fee (see Note 16(c)(1)) 5,452 3,653 Franchise and reservation fee (see Note 16(c)(1)) 2,335 1,926 Marketing 1,692 1,358 Other 915 1,045 270,442 244,761
Year ended 31 December
2014
€’000 2013€’000
Salaries and related expenses 73,214 65,297 Defined contribution pension premiums 1,004 769 IT expenses 2,324 2,386 Utilities 7,395 7,985 Supplies 3,557 3,225 Laundry, linen and cleaning 4,778 4,557 Administration costs 5,328 5,673 Communication, travel and transport 2,212 2,070 Maintenance 4,855 4,545 Marketing expenses 1,501 1,652 Food and beverage 14,956 13,119 Franchise fees, reservation and commissions (see Note 16(c)(1)) 20,610 17,619 Leases 157 1,215 Insurance and property taxes 13,603 14,012 Other expenses 9,765 7,452 165,259 151,576
P P H E H O T E L G R O U P A N N U A L R E P O R T A N D A C C O U N T S 2 0 14
N O T E S T O C O N S O L I D AT E D F I N A N C I A L S TAT E M E N T S C O N T I N U E D
106

107
Note 23 Financial expenses
Note 24 Financial income
Note 25 Other income and expenses
Note 26 Net expenses for financial liability in respect of Income Units sold to private investors
Note 27 Income taxes a. Tax expense (benefit) included in the income statement:
Year ended 31 December
2014
€’000 2013€’000
Interest and other finance expenses on bank loans 31,773 26,645 Interest on other loans from third parties – 655 Interest on finance lease liability 1,224 1,060 Foreign exchange differences – 2,181 Other 236 245 33,233 30,786 Less – borrowing costs capitalised (1,150) (781) 32,083 30,005
Year ended 31 December
2014
€’000 2013€’000
Interest on restricted deposit 8 47 Foreign exchange differences 1,696 – Interest on bank deposits 89 76 Interest from related parties (see Note 30(b)) 1,052 804 Adjustment to fair value on derivative financial instruments (see Note 31(h)) 311 798 Interest and other financial income from jointly controlled entities (see Note 30(b)) 481 324 Interest and other financial income from associates (see Note 7) 2,962 2,723 6,599 4,772
Year ended 31 December
2014
€’000 2013€’000
Income from forfeited deposits (See Note 16b(i)) 8,047 296 Capital gains 1,753 2,757 Capital gain/(loss) on buy back of Income Units previously sold to private investors (329) – Pre-opening expenses – (881)Fair value adjustment of deferred business combinations consideration 2,509 799 Strategic advice expenses – 164 11,980 3,135
Year ended 31 December
2014
€’000 2013€’000
Guaranteed return (see Note 2c) 11,414 10,763 Re-imbursement of depreciation expenses (see Note 2c) (2,621) (2,477)Change in expected cash flow income swaps (see Note 9) 3,519 (1,512) 12,312 6,774
Year ended 31 December
2014 €’000
2013€’000
Current taxes 137 223 Deferred taxes 99 (572)
236 (349)
107

108
PPHE HOTEL GROUP ANNUAL REPORT AND ACCOUNTS 2014
NOTES TO CONSOLIDATED FINANCIAL STATEMENTS CONTINUED
Note 27 Income taxes continued b. The following are the major deferred tax (liabilities) and assets recognised by the Group and changes therein during
the period:
c. Reconciliation between tax benefit (expense) and the product of accounting profit multiplied by the Group’s tax rate is as follows:
1 The tax rate that was used is the tax rate of the Netherlands, since the majority of the tax exposure is in this tax jurisdiction.
d. Tax laws applicable to the Group companies:
1. The Company is subject to taxation under the law of Guernsey. The Company is therefore taxed at the standard rate of 0%.
2. Foreign subsidiaries are subject to income taxes in their country of domicile in respect of their income, as follows:
a) Taxation in the Netherlands: corporate income tax rate is 25% (2013: 25%).
b) Taxation in the United Kingdom: corporate income tax rate for domiciled companies is 25% and for non-domiciled 20%.
c) Taxation in Germany: corporate income tax rate and business rates is 30.2%.
d) Taxation in Hungary: corporate income tax rate is 18%.
e. Losses carried forward for tax purposes:
The Company and its subsidiaries have carry forward losses for tax purposes estimated at approximately €159.1 million (2013: €170.3 million). The Group did not establish deferred tax assets in respect of losses amounting to €159.1 million (2013: €160.6 million) of which tax losses amounting to €16.4 million may be utilised for a period up to seven years. The reason for not recognising deferred tax assets is that the recovery of carried forward tax losses is uncertain. The remaining tax losses may be carried forward indefinitely.
Tax losscarry
forward €’000
Income swaps €’000
Property, plant and
equipment and
intangible assets €’000
Total€’000
Balance as at 31 December 2012 2,646 (1,582) (13,929) (12,865)Amounts charged to income statement 291 (378) 659 572 Enhanced capital allowance claim made in the year – – (302) (302)Adjustments for exchange rate differences (25) 25 103 103 Balance as at 31 December 2013 2,912 (1,935) (13,469) (12,492)Amounts charged to income statement (1,857) 880 878 (99)Adjustments for exchange rate differences 105 (105) (307) (307)Balance as at 31 December 2014 1,160 (1,160) (12,898) (12,898)
Year ended 31 December
2014
€’000 2013€’000
Profit before income taxes 41,649 27,310 Expected tax at the tax rate of the Netherlands 25%1 (2013: 25%) (10,412) (6,828)Adjustments in respect of: Effects of other tax rates 4,392 4,359 Non-deductible expenses (1,451) (657)Utilisation of previously unrecorded tax losses 3,331 4,568 Non-taxable income 3,201 809 Unrecognised current year tax losses (919) (690)Other differences 1,622 (1,212)Income tax (expense) benefit reported in the income statement (236) 349
P P H E H O T E L G R O U P A N N U A L R E P O R T A N D A C C O U N T S 2 0 14
N O T E S T O C O N S O L I D AT E D F I N A N C I A L S TAT E M E N T S C O N T I N U E D
108

109
Note 28 Earnings per share The following reflects the income and share data used in the basic earnings per share computations:
Potentially dilutive instruments 645,000 in 2014 (2013: 358,000) had an immaterial effect on the basic earnings per share.
Note 29 Segments For management purposes, the Group’s activities are divided into Owned Hotel Operations and Management Activities (for further details see Note 16(c)(1)). Owned Hotel Operations are further divided into three reportable segments: the Netherlands, Germany and Hungary, and the United Kingdom. The operating results of each of the aforementioned segments are monitored separately for the purpose of resource allocations and performance assessment. Segment performance is evaluated based on EBITDA, which is measured on the same basis as for financial reporting purposes in the consolidated income statement.
1 Consist of inter-company eliminations. For further details, see Note 16(c)(1).
Year ended 31 December
2014
€’000 2013€’000
Profit 41,413 27,659 Weighted average number of ordinary shares outstanding 41,544 41,515
Year ended 31 December 2014
The Netherlands
€’000
Germany and Hungary
€’000
United Kingdom
€’000Management
€’000
Holding companies
and adjustments1
€’000 Consolidated
€’000Revenue Third party 53,733 28,457 178,017 10,235 – 270,442 Inter-segment 29,053 (29,053) – Total revenue 53,733 28,457 178,017 39,288 (29,053) 270,442 Segment EBITDA 15,573 408 64,341 14,476 – 94,798 Depreciation, amortisation and impairment (24,405)Financial expenses (32,083)Financial income 6,599 Net expenses for liability in respect of Income Units sold to private investors (12,312)Other income, net 11,980 Share in loss of associate and joint ventures (2,928)Profit before tax 41,649
Year ended 31 December 2013
The Netherlands
€’000
Germany and Hungary
€’000
United Kingdom
€’000Management
€’000
Holding companies
and adjustments1
€’000 Consolidated
€’000Revenue Third party 42,406 32,836 161,645 7,874 – 244,761 Inter-segment – – – 24,468 (24,468) – Total revenue 42,406 32,836 161,645 32,342 (24,468) 244,761 Segment EBITDA 11,437 (41) 56,740 14,566 – 82,702 Depreciation, amortisation and impairment (23,862)Financial expenses (30,005)Financial income 4,772 Net expenses for liability in respect of Income Units sold to private investors (6,774)Other income, net 3,135 Share in loss of associate and joint ventures (2,658)Profit before tax 27,310
109

110
PPHE HOTEL GROUP ANNUAL REPORT AND ACCOUNTS 2014
NOTES TO CONSOLIDATED FINANCIAL STATEMENTS CONTINUED
Note 30 Related parties a. Balances with related parties:
b. Transactions with related parties:
1 The Group holds 20% of the equity in WH/DMREF Bora B.V. (see Note 7). 2 Includes loans bearing fixed interest of LIBOR+2.5% per annum. 3 For details see Note 3(b).
Significant other transactions with related parties a. On 18 June 2014, Hercules House Holding B.V. entered into a building contract with WW Gear Construction Limited
("Gear"), a related party, for the design and construction of the hotel near London Waterloo Station on a "turn-key" basis. The basic contract price payable to Gear is £70,480,000 for 494 rooms. An early completion bonus is payable to Gear calculated as £150,000 multiplied by the number of months prior to 30 September 2016 that the hotel is completed. The Non-Executive Directors of the Company had Gear's tender for the construction of the hotel independently reviewed to ensure that it was competitive.
On 1 August 2014, Riverbank Hotel Holding B.V. entered into a building contract with Gear for a six-storey extension to Park Plaza Riverbank London. The basic contract price payable to Gear is £24,741,879 for the 148 room extension.
On 23 December 2014, Club A40, Hotel Club Construction B.V. (“Hotel Club”) and Gear entered into a deed of novation and variation (“Deed”) in relation to a building contract entered into between Club A40 and Hotel Club dated 11 June 2012 (“2012 Building Contract”). Under the Deed, Hotel Club is released from its obligations under the 2012 Building Contract and Gear accepts the liabilities of Hotel Club and agrees to perform all of the duties and to discharge all of the obligations of Hotel Club and to be bound by all its terms and conditions in favour of Gear in every way as if Gear were named in the 2012 Building Contract as a party in place of Hotel Club. Under the Deed, the varied basic contract price payable to Gear is £16,520,183 for a hotel comprising of 168 rooms.
The Directors consider that the above building contracts have been entered into on arm's length terms and are in the interests of the Group. Gear is a company in whose shares the Chairman of the Company and certain members of his family are interested. Under the relationship agreement entered into between Euro Plaza Holdings B.V. (Euro Plaza), the principal shareholder of the Company (in whose shares the Chairman and certain members of his family are also interested) and the Company, transactions between the Company and Euro Plaza (and its associates, which include Gear) are required to be on arm's length terms.
As at 31 December
2014
€’000 2013€’000
Loan to associate – WH/DMREF Bora B.V.1 35,060 32,241 Loans to jointly controlled entities2 19,107 13,395 Loan to Red Sea Hotels Limited3 12,412 9,991 Short-term receivables 245 196 Trade receivables – the Arenaturist group1 3,623 3,538 Construction liability WW Gear Construction Limited 709 –
Year ended 31 December
2014
€’000 2013€’000
Management fees income – the Arenaturist group1 2,103 1,797 Reimbursement of expenses – the Arenaturist group1 256 376 Sales and marketing fees – the Arenaturist group1 884 722 Development management fees – the Arenaturist group1 614 – Construction charges – Gear Construction Management Limited (see a below) 31,181 804 Interest from associate – WH/DMREF Bora B.V.1 2,962 2,723 Interest income from jointly controlled entities 481 –
P P H E H O T E L G R O U P A N N U A L R E P O R T A N D A C C O U N T S 2 0 14
N O T E S T O C O N S O L I D AT E D F I N A N C I A L S TAT E M E N T S C O N T I N U E D
110
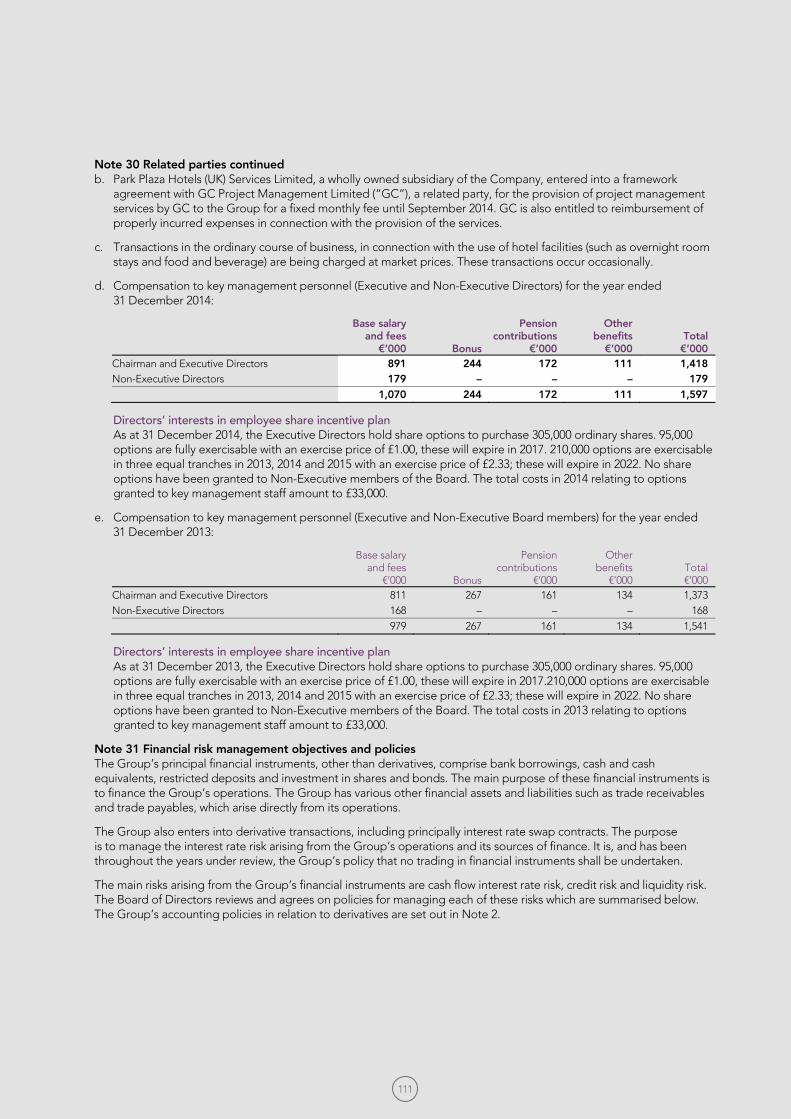
111
Note 30 Related parties continued b. Park Plaza Hotels (UK) Services Limited, a wholly owned subsidiary of the Company, entered into a framework
agreement with GC Project Management Limited (“GC”), a related party, for the provision of project management services by GC to the Group for a fixed monthly fee until September 2014. GC is also entitled to reimbursement of properly incurred expenses in connection with the provision of the services.
c. Transactions in the ordinary course of business, in connection with the use of hotel facilities (such as overnight room stays and food and beverage) are being charged at market prices. These transactions occur occasionally.
d. Compensation to key management personnel (Executive and Non-Executive Directors) for the year ended 31 December 2014:
Directors’ interests in employee share incentive plan As at 31 December 2014, the Executive Directors hold share options to purchase 305,000 ordinary shares. 95,000 options are fully exercisable with an exercise price of £1.00, these will expire in 2017. 210,000 options are exercisable in three equal tranches in 2013, 2014 and 2015 with an exercise price of £2.33; these will expire in 2022. No share options have been granted to Non-Executive members of the Board. The total costs in 2014 relating to options granted to key management staff amount to £33,000.
e. Compensation to key management personnel (Executive and Non-Executive Board members) for the year ended 31 December 2013:
Directors’ interests in employee share incentive plan As at 31 December 2013, the Executive Directors hold share options to purchase 305,000 ordinary shares. 95,000 options are fully exercisable with an exercise price of £1.00, these will expire in 2017.210,000 options are exercisable in three equal tranches in 2013, 2014 and 2015 with an exercise price of £2.33; these will expire in 2022. No share options have been granted to Non-Executive members of the Board. The total costs in 2013 relating to options granted to key management staff amount to £33,000.
Note 31 Financial risk management objectives and policies The Group’s principal financial instruments, other than derivatives, comprise bank borrowings, cash and cash equivalents, restricted deposits and investment in shares and bonds. The main purpose of these financial instruments is to finance the Group’s operations. The Group has various other financial assets and liabilities such as trade receivables and trade payables, which arise directly from its operations.
The Group also enters into derivative transactions, including principally interest rate swap contracts. The purpose is to manage the interest rate risk arising from the Group’s operations and its sources of finance. It is, and has been throughout the years under review, the Group’s policy that no trading in financial instruments shall be undertaken.
The main risks arising from the Group’s financial instruments are cash flow interest rate risk, credit risk and liquidity risk. The Board of Directors reviews and agrees on policies for managing each of these risks which are summarised below. The Group’s accounting policies in relation to derivatives are set out in Note 2.
Base salaryand fees
€’000 Bonus
Pension contributions
€’000
Other benefits
€’000 Total
€’000Chairman and Executive Directors 891 244 172 111 1,418 Non-Executive Directors 179 – – – 179
1,070 244 172 111 1,597
Base salaryand fees
€’000 Bonus
Pension contributions
€’000
Other benefits
€’000 Total €’000
Chairman and Executive Directors 811 267 161 134 1,373 Non-Executive Directors 168 – – – 168
979 267 161 134 1,541
111

112
PPHE HOTEL GROUP ANNUAL REPORT AND ACCOUNTS 2014
NOTES TO CONSOLIDATED FINANCIAL STATEMENTS CONTINUED
Note 31 Financial risk management objectives and policies continued a. Foreign currency risk:
The Group is exposed to minimal foreign currency risk, due to transactions in foreign currency, as most of the transactions of each of the entities in the Group are denominated in the functional currency of the relevant entity, except for the outstanding consideration in Thai Baht relating to the disposal of the site in Pattaya Bay Thailand. After careful consideration the Group decided not to hedge this currency risk. A decrease in the Thai Baht against the Euro of 5%, results in the Group recording an exchange loss of approximately €0.6 million.
b. Interest rate risk: The Group’s exposure to the risk for changes in market interest rates relates primarily to the Group’s long-term debt obligations with a floating interest rate.
The Group has six variable interest rate loans that are not hedged with interest rate swaps. Based on a sensitivity analysis calculation, the management estimates that with an increase/decrease of the three-month market (LIBOR) interest rate by 50bps the results of the Group would be changed by €0.6 million.
The Group’s policy is to manage its interest costs using fixed rate debt. To manage its interest costs, the Group enters into interest rate swaps, in which the Group agrees to exchange, at specified intervals, the difference between fixed and variable rate interest amounts calculated by reference to an agreed upon notional principal amount. Furthermore, the Group uses fixed interest rate debts. For this reason the Group’s cash flow is not sensitive to possible changes in market interest rates. Possible changes in interest rates do, however, affect the Group’s equity as the fair value of the swap agreements changes with interest rate changes. These swaps are designated to hedge underlying debt obligations.
The fair value of the swaps of the Group as at 31 December 2014 amounts to a liability of €31.2 million (2013: liability of €20.3 million). The Group performed a sensitivity analysis for the effect of market interest rate changes on the fair value of the swaps which was calculated by an external valuator. Based on this sensitivity analysis calculation, management estimates that with an increase/decrease of the three-month market interest rate by 50bps, the fair value of the swaps, and the hedge reserve in equity would increase/decrease by €7.2 million (2013: €8.7million) with no material impact on profit or loss.
The Group uses short-term deposits (weekly and monthly) for cash balances held in banks.
c. Credit risk: The Group trades only with recognised, creditworthy third parties. It has policies in place to ensure that sales of products are made to customers with an appropriate credit history. The Company’s policies ensure that sales to customers are settled through advance payments, in cash or by major credit cards (individual customers). Since the Group trades only with recognised third parties, there is no requirement for collateral for debts with third parties. Furthermore, the Group has no dependency on any of its customers. The receivable balances are monitored on an ongoing basis. Management monitors the collection of receivables through credit meetings and weekly reports on individual balances of receivables. Impairment of trade receivables is recorded when there is objective evidence that the Company will not be able to collect all amounts due according to the original terms of receivables. The maximum credit exposure equals the carrying amount of the trade receivables and other receivables since the amount of all trade and other receivables has been written down to their recoverable amount. The result of these actions is that the Group’s exposure to bad debts is not significant.
With respect to credit risk arising from other financial assets of the Group, which comprise cash and cash equivalents and investment in securities, the Group’s exposure to credit risk arises from default of the counterparty, with a maximum exposure equal to the carrying amount of these instruments. The Group has limited concentration risk in respect of its cash at banks.
d. Market risk: As at 31 December 2014, the Group has an available-for-sale investment in securities, in the amount of €1.5 million (2013: €1.5 million). The securities are presented at their quoted market price and changes in market price are recorded in equity. If the market prices of the securities increase/decrease by an average of 5%, the equity of the Group would increase/decrease by €75,000 (2013: €75,000).
e. Liquidity risk: The Group’s objective is to maintain a balance between continuity of funding and flexibility through the use of bank overdrafts and bank loans. The Group’s policy is to arrange medium-term bank facilities to finance its construction operation and then to convert them into long-term borrowings when required.
P P H E H O T E L G R O U P A N N U A L R E P O R T A N D A C C O U N T S 2 0 14
N O T E S T O C O N S O L I D AT E D F I N A N C I A L S TAT E M E N T S C O N T I N U E D
112

113
Note 31 Financial risk management objectives and policies continued e. Liquidity risk continued:
The table below summarises the maturity profile of the Group’s financial liabilities as at 31 December 2014 and 2013 based on contractual undiscounted payments.
1 See Note 17for further information. 2 Lease liability includes three leases with upward rent reviews based on future market rates in one lease and changes in the CPI in the other lease and, thus, future payments
have been estimated using current market rentals and current United Kingdom based CPIs, respectively. 3 Presented according to discounted amount due to the variability of the payments over the balance of the 999-year term.
e. Liquidity risk continued: The Group has the following undrawn borrowing facilities:
2014
€’000 2013€’000
Floating rate: Expiring within one year 33,478 10,000 Expiring beyond a year 93,836 60,000 127,314 70,000
As at 31 December 2014
Less than 3 months
€’000
3 to 12 months
€’000
1 to 2 years€’000
3 to 5 years€’000
> 5 years €’000
Total€’000
Interest bearing loans and borrowings1 11,088 33,263 39,687 585,139 9,972 679,149 Deposits received in respect of Income Units sold to private investors – – – – 147 147 Financial liability in respect of Income Units sold to private investors 4,344 13,032 17,723 55,326 180,1423 270,567 Derivative financial instruments 1,202 3,607 4,810 14,429 7,177 31,225 Loans from third parties – 520 – – – 520 Lease liability2 454 1,361 1,815 5,446 224,934 234,010 Trade payables 12,744 – – – – 12,744 Other liabilities 13,683 16,103 – – 12,898 42,684 43,515 67,886 64,035 660,340 435,270 1,271,046
As at 31 December 2013
Less than 3 months
€’000
3 to 12 months
€’000
1 to 2 years€’000
3 to 5 years€’000
> 5 years €’000
Total€’000
Interest bearing loans and borrowings1 9,368 42,624 41,512 539,681 35,288 668,473 Deposits received in respect of Income Units sold to private investors – – – – 8,864 8,864 Financial liability in respect of Income Units sold to private investors 4,259 12,776 17,376 54,241 173,0033 261,655 Derivative financial instruments 956 2,867 3,823 11,470 1,200 20,316 Loans from third parties 4,180 – – 3,815 – 7,995 Lease liability2 359 1,076 1,435 4,305 182,972 190,147 Trade payables 12,189 – – – – 12,189 Other liabilities 14,643 13,920 – – 12,492 41,055
45,954 73,263 64,146 613,512 413,819 1,210,694
113

114
PPHE HOTEL GROUP ANNUAL REPORT AND ACCOUNTS 2014
NOTES TO CONSOLIDATED FINANCIAL STATEMENTS CONTINUED
Note 31 Financial risk management objectives and policies continued f. Capital management:
The primary objective of the Group’s capital management is to ensure that it maintains a strong credit rating and healthy capital ratios in order to support its business and maximise shareholder value.
The Group manages its capital structure and makes adjustments to it in light of changes in economic conditions. The Group monitors capital using a gearing ratio, which is net bank debt divided by total capital plus net bank debt. The Group’s policy is to keep the gearing ratio between 60% and 70%. The Group includes within net bank debt, interest bearing bank loans and borrowings, less cash and cash equivalents and other liquid assets. Capital includes equity less the hedging reserve.
g. Fair value of financial instruments: The fair values of the financial assets and liabilities are included in the amount at which the instrument could be exchanged in a current transaction between willing parties, other than in a forced or liquidation sale. The following methods and assumptions were used to estimate the fair values:
The fair values of cash and cash equivalents, trade receivables, trade payables, and other current assets and liabilities approximate their carrying amounts largely due to the short-term maturities of these instruments.
Long-term fixed-rate and variable-rate receivables are evaluated by the Group based on parameters such as interest rates, specific country risk factors, and individual creditworthiness of the customer and the risk characteristics of the financed project. Based on this evaluation, allowances are taken to account for the expected losses of these receivables.
The fair value of loans from banks and other financial liabilities, obligations under finance leases as well as other non-current financial liabilities is estimated by discounting future cash flows using rates currently available for debt on similar terms, credit risk and remaining maturities.
Fair value of available-for-sale financial assets is derived from quoted market prices in active markets. A market is regarded as active if quoted prices are readily and regularly available from an exchange, dealer, broker, industry group, pricing service, or regulatory agency, and those prices represent actual and regularly occurring market transactions on an arm’s length basis. The quoted market price used for financial assets held by the Group is the current bid price. These instruments are included in Level 1. The Group enters into derivative financial instruments with financial institutions with investment grade credit ratings. Derivatives are valued using valuation techniques, for swap models, using present value calculations. The models incorporate various inputs including the credit quality of counterparties, and interest rate curves (see note 18 for further details).
The fair value of financial instruments that are not traded in an active market (for example, over-the-counter derivatives) is determined by using valuation techniques, based on a discounted cash flow. These valuation techniques maximise the use of observable market data where it is available and rely as little as possible on entity specific estimates. If all significant inputs required to fair value an instrument are observable, the instrument is included in Level 2.
If one or more of the significant inputs is not based on observable market data, the instrument is included in Level 3.
2014
€’000 2013€’000
Interest bearing bank loans and borrowings 554,772 526,166 Less – cash and cash equivalents (70,173) (41,498)Less – other liquid assets (1,464) (1,538)Net debt 483,135 483,130
Equity 323,868 298,116 Hedging reserve 24,104 12,642 Total capital 347,972 310,758 Capital and net debt 831,107 793,888 Gearing ratio 58.1% 60.8%
P P H E H O T E L G R O U P A N N U A L R E P O R T A N D A C C O U N T S 2 0 14
N O T E S T O C O N S O L I D AT E D F I N A N C I A L S TAT E M E N T S C O N T I N U E D
114

115
Note 31 Financial risk management objectives and policies continued g. Fair value of financial instruments continued: Fair value hierarchy
The Group uses the following hierarchy for determining and disclosing the fair value of financial instruments by valuation technique based on the lowest level input that is significant to the fair value so determined:
Level 1: quoted (unadjusted) prices in active markets for identical assets or liabilities.
Level 2: other techniques for which all inputs which have significant effect on the recorded fair value are observable, either directly or indirectly.
Level 3: techniques which use inputs which have a significant effect on the recorded fair value that are not based on observable market data.
As at 31 December 2014, the Group held the following financial instruments measured at fair value:
Assets
Liabilities
During 2014, there were no transfers between Level 1 and Level 2 fair value measurements, and no transfers into and out of Level 3 fair value measurements.
As at 31 December 2013, the Group held the following financial instruments measured at fair value:
Assets
Liabilities
During 2013, there were no transfers between Level 1 and Level 2 fair value measurements, and no transfers into and out of Level 3 fair value measurements.
The carrying amounts and fair values of the Group’s financial instruments other than those whose carrying amount approximates their fair value:
Carrying amount
31 December Fair value 31 December
2014
€’0002013€’000
2014 €’000
2013€’000
Financial assets Other non-current financial assets1 68,244 44,388 71,216 46,789 1 Based on Level 2 inputs.
31 December 2014
€’000Level 1
€’000Level 2
€’000 Level 3
€’000Available-for-sale financial assets 1,464 1,464
31 December 2014
€’000Level 1
€’000Level 2
€’000 Level 3
€’000Deferred consideration business combinations 520 520 Interest rate swaps used for hedging 31,225 31,225
31 December 2014
€’000Level 1
€’000Level 2
€’000 Level 3
€’000Available-for-sale financial assets 1,538 1,538 – –
31 December 2013€’000
Level 1€’000
Level 2 €’000
Level 3€’000
Deferred consideration business combinations 2,943 – 2,943 – Interest rate swaps used for hedging 20,318 – 20,318 –
115

116
PPHE HOTEL GROUP ANNUAL REPORT AND ACCOUNTS 2014
NOTES TO CONSOLIDATED FINANCIAL STATEMENTS CONTINUED
Note 31 Financial risk management objectives and policies continued h. Derivative financial instruments:
The majority of the Group’s borrowings are at variable interest rates based on LIBOR or EURIBOR. To limit its exposure to changes in the rates of the LIBOR and EURIBOR on its cash flows and interest expense, the Group has entered into various interest rate swaps, as described below. The Company meets the relevant criteria in IAS 39 to apply hedge accounting and the fair value changes of swaps in the hedge relationship that are determined to be effective are recorded in other comprehensive income. All fair value movements that are determined to be ineffective are recorded in profit and loss.
1. On 3 December 2013, the Group entered into two interest rate swaps with Aareal with a nominal value of £136.5 million (€174.7 million) and €121.7 million with fixed quarterly interest payments at a rate of 2.77% and 1.70% per annum respectively.
As at 31 December 2014, the fair value of the swaps is estimated at a liability of €18.1million.
The change in fair value determined to be effective recorded in other comprehensive income amounts to €7.5 million. The total amount of ineffectiveness recorded in the income statement amounts to €0.1 million.
2. In 2004, Laguna Estates (Leeds) Limited (“Laguna“) and Katmandu Limited (“Katmandu“) entered into an interest rate swap according to which they swapped the variable interest rate as follows:
Laguna swapped the variable interest rate of three month LIBOR on a loan of £15.0 million (€19.2 million) received from the Royal Bank of Scotland plc, bearing fixed quarterly interest payments, at the rate of 5.13% for the period until January 2019. As at 31 December 2014, the fair value of the swap is estimated at a liability of £2.2 million (€2.8 million). Katmandu swapped the variable interest rate of three-month LIBOR on a loan of £6.0 million (€7.7 million) received from the Royal Bank of Scotland plc, bearing fixed quarterly interest payments, at the rate of 5.54% for the period until 31 May 2027. As at December 2014, the fair value of the swap is estimated at a liability of £2.1 million (€2.7 million).
The change in fair value and recorded in the other comprehensive income amounts to €1.3 million. The total amount of ineffectiveness recorded in the income statement amounts to €0.4 million.
3. In 2011, Marlbray entered into several interest rate swap transactions pursuant to which Marlbray swapped the variable interest rate of three month LIBOR on a loan from Bank Hapoalim. The swap nominal amounts are £111.0 million, with amortising nominal amounts. The swap bears a fixed quarterly interest payment, at a rate of 2.64%–3.18% per annum, for the period until June 2018. As at 31 December 2014, the fair value of the swap is estimated at a liability of £5.9 million (€7.6 million). All fair value movements were assessed effective and the change in fair value recorded in other comprehensive income amounted to £1.1 million (€1.3 million).
Note 32 Subsequent events The Directors are proposing a final dividend of 10.0 pence per share (2013: 8.0 pence per share), which will absorb £4.1 million of equity.
P P H E H O T E L G R O U P A N N U A L R E P O R T A N D A C C O U N T S 2 0 14
N O T E S T O C O N S O L I D AT E D F I N A N C I A L S TAT E M E N T S C O N T I N U E D
116

117
PPHE HOTEL GROUP ANNUAL REPORT AND ACCOUNTS 2014
APPENDICES TO CONSOLIDATED FINANCIAL STATEMENTS
Appendix A: Subsidiaries included in the Group
Name of company Principal activityCountry of incorporation
Direct and indirect holdings %
Euro Sea Hotels N.V.2 Holding company The Netherlands 100 The Mandarin Hotel B.V.2 Hotel operation The Netherlands 100 Suf Holding B.V.2 Holding company The Netherlands 100 Victory Enterprises I B.V.2 Holding company The Netherlands 100 Victory Enterprises II B.V.2 Holding company The Netherlands 100 Amalfa Investments B.V.2 Holding company The Netherlands 100 Victoria Monument B.V.2 Hotel operation The Netherlands 100 Victoria Hotel and Restaurant Investment B.V.2 Holding company The Netherlands 100 Victoria Schiphol Holding B.V.2 Holding company The Netherlands 100 Victoria Hotel and Restaurant Management Services B.V.2 Hotel operation The Netherlands 100 Utrecht Victoria Hotel C.V.2 Hotel operation The Netherlands 100 Victoria Hotel C.V.2 Hotel operation The Netherlands 100 Melbourne Personeel B.V.2 Holding company The Netherlands 100 Schiphol Victoria Hotel C.V.2 Hotel operation The Netherlands 100 Riverbank Hotel Operator Limited2 Hotel operation United Kingdom 100 Riverbank Hotel Holding B.V.2 Holding company The Netherlands 100 Victoria London Hotel Holding B.V.2 Holding company The Netherlands 100 Victoria Park Plaza Operator Limited2 Hotel operation United Kingdom 100 Sherlock Holmes Park Plaza Limited2 Hotel operation United Kingdom 100 Grandis Netherlands Holding B.V.2 Holding company The Netherlands 100 Sherlock Holmes Hotel Shop Limited2 Hotel operation United Kingdom 100 Marlbray Limited2 Holding company United Kingdom 100 1 Westminster Bridge Plaza Management Company Limited2 Holding company United Kingdom 100 Park Plaza Hospitality Services (UK) Limited2 Hotel operation United Kingdom 100 PPHE Club Limited¹ Holding company Guernsey 100 Waterford Investments Limited1 Holding company Guernsey 100 Leno Investment Limited¹ Holding company Guernsey 100 Laguna Estates (Leeds) Limited2 Holding company United Kingdom 100 Katmandu Limited2 Holding company British Virgin Islands 100 Sandbach Investments Limited2 Holding company British Virgin Islands 100 Hotel Leeds Holding B.V.2 Holding company The Netherlands 100 Hotel Nottingham Holding B.V.2 Holding company The Netherlands 100 Nottingham Park Plaza Operator Limited2 Hotel operation United Kingdom 100 Park Plaza Hotels Europe Holdings B.V.2 Holding company The Netherlands 100 Park Plaza Hotels Europe B.V.2 Management The Netherlands 100 Park Plaza Hotels (Germany) Services GmbH2 Management Germany 100 Park Plaza Hotels Europe (Germany) B.V.2 Management The Netherlands 100 Sugarhill Investments B.V.2 Holding company The Netherlands 100 Park Plaza Germany Holdings GmbH2 Holding company Germany 100 Park Plaza Nűrnberg GmbH Hotel operation Germany 100 Park Plaza Berlin Hotelbetriebsgesellschaft mbH2 Hotel operation Germany 100 Park Plaza Hotels Berlin Wallstrasse GmbH2 Hotel operation Germany 100 art’otel berlin city center west GmbH2 Hotel operation Germany 100 art’otel dresden/Park Plaza Betriebsgesellschaft mbH2 Hotel operation Germany 100 SW Szállodaüzemeltetö Kft2 Hotel operation Hungary 100 art’otel köln betriebsgesellschaft mbH2 Hotel operation Germany 100
A P P E N D I C E S T O C O N S O L I D AT E D F I N A N C I A L S TAT E M E N T S
117

118
PPHE HOTEL GROUP ANNUAL REPORT AND ACCOUNTS 2014
APPENDICES TO CONSOLIDATED FINANCIAL STATEMENTS CONTINUED
Appendix A: Subsidiaries included in the Group continued
Name of company Principal activityCountry of incorporation
Direct and indirect holdings %
Parkvondel Hotel Real Estate B.V.2 Holding company The Netherlands 100 Parkvondel Hotel Holding B.V. 2 Holding company The Netherlands 100 Parkvondel Hotel Management B.V. 2 Hotel operation The Netherlands 100 Golden Wall Investments Limited1 Finance company British Virgin Islands 100 Apex Holdings (UK) Limited1 Holding company British Virgin Islands 100 Park Plaza Coöperatief UA1 Holding company The Netherlands 100 PPHE Histria Charter d.o.o.2 Holding company Croatia 100 Park Plaza Hotels (UK) Services Limited2 Management United Kingdom 100 Artotel (I.L.) Management Services Limited2 Holding company Israel 100 Westminster Bridge Holdings B.V.2 Holding company The Netherlands 100 Westminster Bridge Hotel Operator Limited2 Hotel operation United Kingdom 100 Club Euro Hotels B.V.2 Holding company The Netherlands 100 Club A40 Hotel Holding B.V.2 Holding company The Netherlands 100 Club A40 Hotel Operator Limited Holding company United Kingdom 100 Club Luton Hotel Holding B.V.2 Holding company The Netherlands 100 A40 Data Centre B.V.2 Holding company The Netherlands 100 A40 Office B.V.2 Holding company The Netherlands 100 Hotel Club Construction B.V.2 Holding company The Netherlands 100 PPHE Netherlands B.V.2 Holding company The Netherlands 100 Park Plaza Hotels (UK) Limited 1 Holding company United Kingdom 100 PPHE Germany B.V.2 Holding company The Netherlands 100 PPHE Arena Holding B.V.2 Holding company The Netherlands 100 Westminster Investments B.V.2 Holding company The Netherlands 100 PPHE Art Holding B.V.2 Holding company The Netherlands 100 Hercules House Holding B.V.2 Holding company The Netherlands 100 PPHE NL Region B.V.2 Holding company The Netherlands 100 Tozi Restaurant Operator Limited2 Operation United Kingdom 100 PPHE Management (Croatia) B.V.2 Holding company The Netherlands 100
Appendix B: Jointly controlled entities and associates
1 Direct holdings. 2 Indirect holdings. 3 Investment in an associate.
Name of company Principal activityCountry of incorporation
Proportion of ownership interest
%WH/DMREF Bora B.V.2, 3 Holding company The Netherlands 20 W2005/Twenty Eight B.V.2, 3 Holding company The Netherlands 20 Bora Finco B.V.2, 3 Holding company The Netherlands 20 art’otel berlin mitte/Park Plaza Betriebsgesellschaft mbH2 Hotel operation Germany 50 Park Plaza Betriebsgesellschaft mbH Hotel operation Germany 50 ABK Hotel Holding B.V.2 Holding company The Netherlands 50 ABM Hotel Holding B.V.2 Holding company The Netherlands 50 Aspirations Limited2 Holding company British Virgin Islands 50
P P H E H O T E L G R O U P A N N U A L R E P O R T A N D A C C O U N T S 2 0 14
A P P E N D I C E S T O C O N S O L I D AT E D F I N A N C I A L S TAT E M E N T S C O N T I N U E D
118

A Arenaturist: One of Croatia’s best known hospitality groups and consists of seven hotels, six holiday apartment complexes, eight campsites and over 50 food and beverage outlets, all of which are located in Istria. PPHE Hotel Group has a minority ownership interest in the Arenaturist group. www.arenaturist.com
ARR: Average Room Rate. Total room revenue divided by number of rooms sold.
art’otel®: A contemporary collection of hotels that fuse exceptional architectural style with art inspired interiors, located in cosmopolitan centres across Europe. PPHE Hotel Group is owner of the art’otel® brand worldwide. www.artotels.com
artotels.com: Brand website for art’otel®.
B Board members: Eli Papouchado (Non-Executive Chairman of the Board), Boris Ivesha (President & Chief Executive Officer), Chen Moravsky (Deputy Chief Executive Officer & Chief Financial Officer), Kevin McAuliffe (Non-Executive Director & Senior Independent Director), Elisha Flax (Non-Executive Director), Nigel Jones (Non-Executive Director).
C CAGR: Compound Annual Growth Rate; the year-on-year growth rate of an investment over a specified period of time.
CarlsonSM: A global, privately-held, hospitality and travel company with its head office based in Minneapolis, Minnesota, USA. www.carlson.com
Carlson Hotels: The hotel business unit within CarlsonSM. Hotel brands owned by CarlsonSM are Quorvus Collection, Radisson Blu®, Radisson®, Radisson Red®, Park Plaza®, Park Inn® by Radisson and Country Inns & Suites By CarlsonSM.Carlson’s other business unit is Carlson Wagonlit Travel.
Carlson Rezidor Hotel Group: Created in early 2012, Carlson Rezidor Hotel Group is one of the world’s largest hotel groups. The portfolio of the Carlson Rezidor Hotel Group includes more than 1,350 hotels, located across 105 countries, operating under global hotel brands. CarlsonSM is the majority shareholder of the Rezidor Hotel Group.
Chino Latino®: A modern Pan Asian cuisine and Latin cocktail bar concept, owned by PPHE Hotel Group, which is available at Park Plaza® Hotels & Resorts and art’otels® in Cologne, Leeds, London and Nottingham. www.chinolatino.eu
Club CarlsonSM: The hotel rewards programme of Park Plaza® Hotels & Resorts and art’otel®. The programme is owned by CarlsonSM. Gold Points® is the name of the currency earned through the Club CarlsonSM programme. www.clubcarlson.com
Club CarlsonSM for Business: A hotel rewards programme specifically designed for small and medium-sized businesses. www.clubcarlson.com/business
Club CarlsonSM For Planners: A global programme allowing meeting planners to earn Gold Points® for meetings and events held at Park Plaza® Hotels & Resorts and art’otels and other CarlsonSM hotel brands. www.clubcarlson.com/planners
CSR: Corporate Social Responsibility. PPHE Hotel Group’s Corporate Social Responsibility policy is a genuine, active and responsible commitment to our environment and society.
D Distribution: Encompasses all the electronic channels of distribution, which includes GDS, brand web sites and third party intermediaries. These distribution channels can be accessed through the Internet, an intranet or through an interfaced connection.
E Earnings (loss) per share: Basic earnings (loss) per share amounts are calculated by dividing the net profit (loss) for the year by the weighted average number of Ordinary shares outstanding during the year. Diluted earnings (loss) per share amounts are calculated by dividing the net profit (loss) for the year by the weighted average number of Ordinary shares outstanding during the year plus the weighted average number of Ordinary shares that would be issued on the conversion of all the dilutive potential Ordinary shares into Ordinary shares.
EBITDA: Earnings Before Interest, Tax, Depreciation and Amortisation.
EBITDA margin: EBITDA divided by total revenue.
EBITDAR: Earnings Before Interest, Tax, Depreciation, Amortisation, Impairment Loss and Rental Expenses, share of associate and exceptional items presented as other income and tax (EBITDAR) correspond to revenue less cost of revenues (operating expenses). EBITDAR, together with EBITDA is used as a key management indicator.
F Franchise: A form of business organisation in which a company which already has a successful product or service (the franchisor) enters into a continuing contractual relationship with other businesses (franchisees) operating under the franchisor’s trade name and usually with the franchisor’s guidance, in exchange for a fee.
G Gold Points®: The name of the currency earned through the Club CarlsonSM rewards programme.
GSI: Guest Satisfaction Index.
H – L Income Units: Cash flows, derived from the net income generated by rooms in Park Plaza Westminster Bridge London, sold to private investors.
Like-for-like: Results achieved through operations that are comparable with the operations of the previous year. Current years’ reported results are adjusted to have an equivalent comparison with previous years’ results in the same period, with similar seasonality and the same set of hotels.
Look To BookSM: The travel agent rewards programme of Park Plaza® Hotels & Resorts and art’otel®. The programme is owned by CarlsonSM. www.looktobook.com
LPI: Loyalty Performance Index.
LSE: London Stock Exchange. PPHE Hotel Group shares are traded on the standard listing segment of the Official List of the UK Listing Authority.
G L O S S A R Y
119

P P H E H O T E L G R O U P A N N U A L R E P O R T A N D A C C O U N T S 2 0 14
G L O S S A R Y C O N T I N U E D
M – N Market share: The amount of total sales of an item or group of products by a company in a particular market. It is often shown as a percentage, and is a good indicator of performance compared to competitors in the same market sector.
Medallia: Guest feedback management and analysis system.
O Occupancy rate: total occupied rooms divided by net available rooms or RevPAR divided by ARR.
OTA: Online Travel Agency. Same as third party intermediaries, third party web site that sells hotel rooms. Within PPHE Hotel Group we also refer to TPIs.
P parkplaza.com: Brand web site for Park Plaza® Hotels & Resorts.
Park Plaza® hotel: One hotel from the Park Plaza® Hotels & Resorts brand.
Park Plaza® Hotels & Resorts: Upscalehotel brand. PPHE Hotel Group is master franchisee of the Park Plaza® Hotels & Resorts brand owned by Carlson Hotels. PPHE Hotel Group has the exclusive right to develop the brand across Europe, the Middle East and Africa. www.parkplaza.com
PPHE Hotel Group Limited: PPHE Hotel Group Limited is also referred to as the Company and is the Guernsey incorporated company listed on the Main Market of the London Stock Exchange plc.
PPHE Hotel Group Context: PPHE Hotel Group aims to differentiate itself from its competitors by offering a different experience to guests. This model has been designed to support this and includes the desired guest experience, PPHE Hotel Group behaviour, working climate and leadership.
PPHE Hotel Group: An international hotel group that owns, leases, develops, manages and franchises primarily full-service contemporary lifestyle hotels primarily in Europe. The majority of the Group’s hotels operate under the Park Plaza® Hotels & Resorts brand (part of CarlsonSM), over which the Group has exclusive rights in 56 countries in Europe, the Middle East and Africa, or art’otel®, a brand which the group fully owns. www.pphe.com
Q – R RevPAR: Revenue Per Available Room. Total rooms revenue divided by net available rooms or ARR x occupancy %.
S SPI: Service Performance Index.
T TPIs: Third Party Intermediaries. Third party web sites that sell hotel rooms e.g. Booking.com, Expedia, hotels.com. Also referred to as OTAs.
120

C U R R E N T A N D C O M M I T T E D P R O J E C T S
Project Location Operating structure No. of rooms Status
Park Plaza Arena Pula* Pula, Croatia Co-owned and management contract
175 Expected to open 2015
Park Plaza Nuremberg Nuremberg, Germany Owned and management contract
177 Expected to open 2015
Park Plaza Riverbank London extension and reconfiguration
London, United Kingdom Owned and management contract
184 Expected to open 2015
Park Royal London project London, United Kingdom Owned and management contract
168 Expected to open 2016
Project near London Waterloo Station
London, United Kingdom Owned and management contract
494 Expected to open 2016
art’otel london hoxton London, United Kingdom Joint venture and management contract
352 Expected to open 2019
* Following extensive renovations, Hotel Park (which is part of the Arenaturist group) will be rebranded to Park Plaza Arena Pula, and this is therefore not a new hotel for the Group.
121

P P H E H O T E L G R O U P A N N U A L R E P O R T A N D A C C O U N T S 2 0 14
C O N TA C T S
DirectorsEli Papouchado (Non-Executive Chairman) Boris lvesha (President & Chief Executive Officer)Chen Moravsky (Deputy Chief Executive Officer
& Chief Financial Officer)EIisha Flax (Non-Executive Director) Kevin McAuliffe (Senior Independent Director) Nigel Jones (Non-Executive Director)
PPHE Hotel Group Corporate Office Viñoly Tower, 5th floor Claude Debussylaan 14 1082 MD Amsterdam The Netherlands T: +31 (0)20 717 8602 F: +31 (0)20 717 8699 E: [email protected] pphe.com
ContactsChen Moravsky (Deputy Chief Executive Officer
& Chief Financial Officer)Inbar Zilberman (General Counsel) Robert Henke (Vice President Marketing & Branding)
AdministratorC.L. Secretaries Limited 1st and 2nd Floors Elizabeth House Les Ruettes Brayes St. Peter Port Guernsey GY1 1EW Channel lslands
Auditors to the Company and Reporting AccountantsErnst & Young LLP PO Box 9 Royal Chambers St. Julian’s Avenue St. Peter Port Guernsey GY1 4AF Channel Islands
Legal Advisers to the Company as to Guernsey law Carey Olsen Carey House P.O. Box 98 Les Banques St. Peter Port Guernsey GY1 4BZ Channel lslands
Registered Office1st and 2nd Floors Elizabeth House Les Ruettes Brayes St. Peter Port Guernsey GY1 1EW Channel lslands
RegistrarCapita Registrars (Guernsey) Limited Mont Crevelt House Bulwer Avenue St. Sampson Guernsey GY2 4LH Channel Islands
Company SecretaryC.L. Secretaries Limited 1st and 2nd Floors Elizabeth House Les Ruettes Brayes St. Peter Port Guernsey GY1 1EW Channel lslands
Financial Advisers and brokers Oriel Securities Limited 150 Cheapside London EC2V 6ET United Kingdom
FinnCap Corporate Finance 60 New Broad Street London EC2M 1JJ United Kingdom
Financial Public RelationsHudson Sandler 29 Cloth Fair London EC1A 7NN United Kingdom
Useful linksCorporate website: pphe.comFor reservations: parkplaza.com artotels.com arenaturist.com arenacamps.com
Strategic partner:carlson.com carlsonrezidor.com
Forward-looking statementsThis annual report and financial statements may contain certain “forward-looking statements” which reflect the Company’s and/or the Directors’ current views with respect to financial performance, business strategy and future plans, both with respect to the Group and the sectors and industries in which the Group operates. Statements which include the words “expects”, “intends”, “plans”, “believes”, “projects”, “anticipates”, “will”, “targets”, “aims”, “may”, “would”, “could”, “continue” and similar statements are of a future or forward-looking nature. All forward-looking statements address matters that involve risks and uncertainties. Accordingly, there are or will be important factors that could cause the Group’s actual results to differ materially from those indicated in these statements. Any forward-looking statements in this annual report and financial statements reflect the Group’s current views with respect to future events and are subject to risks, uncertainties and assumptions relating to the Group’s operations, results of operations and growth strategy.These forward-looking statements speak only as of the date of this annual report and financial statements. Subject to any legal or regulatory obligations, the Company undertakes no obligation publicly to update or review any forward-looking statement, whether as a result of new information, future developments or otherwise. All subsequent written and oral forward-looking statements attributable to the Group or individuals acting on behalf of the Group are expressly qualified in their entirety by this paragraph. Nothing in this publication should be considered as a profit forecast.
122

N O T E S
123

P P H E H O T E L G R O U P A N N U A L R E P O R T A N D A C C O U N T S 2 0 14
N O T E S
124

This annual report is printed on Omnia Board and Edixion Offset.Designed and produced by luminous.co.uk

PPHE H
otel Group A
nnual Report 2014
PPHE Hotel Group Corporate Office Viñoly Tower, 5th floor Claude Debussylaan 14 1082 MD Amsterdam The Netherlands
T: +31 (0) 20 717 8603 F: +31 (0) 20 717 8699
pphe.com