development of understanding of the interaction between
TRANSCRIPT

HAL Id: emse-01063619https://hal-emse.ccsd.cnrs.fr/emse-01063619
Submitted on 12 Sep 2014
HAL is a multi-disciplinary open accessarchive for the deposit and dissemination of sci-entific research documents, whether they are pub-lished or not. The documents may come fromteaching and research institutions in France orabroad, or from public or private research centers.
L’archive ouverte pluridisciplinaire HAL, estdestinée au dépôt et à la diffusion de documentsscientifiques de niveau recherche, publiés ou non,émanant des établissements d’enseignement et derecherche français ou étrangers, des laboratoirespublics ou privés.
Development of Understanding of The Interactionbetween Localized deformation and SCC of Austenitic
Stainless Steels Exposed to Primary EnvironmentThierry Couvant, Laurent Legras, Antoine Herbelin, Andrey Musienko,
Gabriel Ilbevare, David Delafosse, Georges Cailletaud, J. Hickling
To cite this version:Thierry Couvant, Laurent Legras, Antoine Herbelin, Andrey Musienko, Gabriel Ilbevare, et al.. De-velopment of Understanding of The Interaction between Localized deformation and SCC of AusteniticStainless Steels Exposed to Primary Environment. 14th International Conference on Environmen-tal Degradation of Materials in Nuclear Power Systems- Water Reactors, Sep 2010, Virginia Beach,United States. pp.182-194. �emse-01063619�

DEVELOPMENT OF UNDERSTANDING OF THE INTERACTION BETWEEN LOCALIZED
DEFORMATION AND SCC OF AUSTENITIC STAINLESS STEELS EXPOSED TO PRIMARY PWR
ENVIRONMENT
T. Couvant 1, L. Legras
1, A. Herbelin
1, A. Musienko
2, G. Ilevbare
3, D. Delafosse
4, G. Cailletaud
2,
J. Hickling 5
1 EDF R&D - MMC, Route de Sens, 77818 Moret-sur-Loing, France
2 ENSMP, Evry, France
3 ENSM-SE, 157 Cours Fauriel, 42023 St-Etienne cedex 2, France
4 EPRI, Palo Alto, USA
5 CMC, Cyprus
Understanding and quantification of interactions
between localized deformation in materials and
environmental-assisted cracking (EAC) could play
an important role in maintaining the integrity of
LWR components. Thus, a detailed understanding
of strain localization during plastic deformation
and of the underlying mechanisms is of great
importance for the manufacturing and design of
materials exposed to the environment of the
primary circuit of PWRs. Thus, the crystal plasticity
law of a 304L austenitic stainless steel has been
identified, in order to quantify the effect of a change
of strain path on the strain localization and
increase the understanding of the contribution of
the strain hardening and the strain
incompatibilities on the mechanisms of initiation of
SCC. Pre-deformation of the specimens used for
SCC tests was evaluated using image correlation.
Constant elongation rate tests and constant
elongation tests were conducted for different levels
of pre-deformations (0.07 < < 0.18).
Examinations indicated the severe and deleterious
effect of the strain localization due to a change of
strain path on intergranular SCC susceptibility.
Intergranular cracks initiated systematically in the
low-deformed areas, where limited deformation
(less than 1%) occurred during the exposure to the
environment, and where high stress levels due to
strain incompatibilities are expected.
1. INTRODUCTION
Understanding and quantification of interactions
between localized deformation in materials and
environmental-assisted cracking (EAC) could play
an important role in maintaining the integrity of
LWR components. A previous (1) review of the
different types of identified strain localization-EAC
interactions allowed key gaps to be identified.
Thus, a detailed understanding of strain localization
during plastic deformation and of the underlying
mechanisms is important for the manufacture and
design of materials exposed to the environment of
the primary circuit of PWRs. Previous studies (2)
have demonstrated the deleterious effect of cross
tests on susceptibility of 304L to IGSCC in PWR
primary water at 360°C. This result has been
interpreted by the authors as a consequence of
strain localization induced by orthogonal strain
paths as defined by Schmitt (3). The objectives of
this study were to correlate strain localization and
selective oxidation using approaches based on
quantitative and fundamental understanding, in
order to evaluate the relevance of interactions
between localized deformation and stress corrosion
cracking (SCC) in austenitic alloys exposed to a
PWR primary water. Thus, a wide range of
techniques was deployed in this program to
characterize the microstructures, to quantify strain
localization and associated oxidation.
2. MATERIALS
Austenitic alloys tested in this work (304L and
316L) are 30-mm-thick plates. Chemical
compositions and mechanical properties of the
materials as manufactured are given in Table 1 and
Table 2, respectively. Unlike 316L, 304L contains
less than 5% of residual -ferrite and is subject to
strain-induced martensite transformation: Ms = –
133°C, Md30 = –3°C, as predicted by Angel (4).
Concerning the 316L heat, Ms = –133°C, Md30 = –
40°C. The staking fault energy (SFE) of 304L is 24
mJ.m–2
and 33 mJ.m–2
for 316L (5). Non-sensitized
304L and 316L were solution annealed at 1050°C
and water quenched. The resultant microstructures,
with no evidence of any carbide precipitates in the
matrix or along the grain boundaries, were
characterized using EBSD. Mean grain diameter is
27 µm for 304L and 90 µm for 316L. The
distribution of misorientation angles in the range 6°
< < 59°, including twin boundaries ( > 54°).
Distributions are very similar for 304L and 316L.
Thus, in these two materials, 30 to 50% of
boundaries are twin boundaries. Misorientation
angles in the range 37° < < 54° correspond to
about 30% of the boundaries. Inverse pole figures
are given in Figure 1, at the same scale.

Table 1 – Chemical composition (wt. %).
Material Heat C
(%)
S
(%)
P
(%) Si (%)
Mn
(%)
Fe
(%)
Ni
(%) Cr (%)
Mo
(%)
N
(%)
Al
(%)
316L XY183 0.026 0.004 0.033 0.42 1.81 65.75 12.00 17.34 2.57 0.050 -
AISI Requirement for 316L < 0.03 < 0.03 < 0.045 < 1 < 2 10-13 16.5-18.5 2-2.5 < 0.11
304L T2575 0.026 0.002 0.027 0.52 1.49 68.68 9.45 19.23 0.24 0.064 0.033
AISI Requirement for 304L < 0.03 < 0.03 < 0.045 < 1 < 2 8-10 18-20 < 0.11
Table 2 – Mechanical properties in air at room temperature.
Material Heat Ys0,2 (MPa) UTS (MPa) El. (%) HV30
316L XY183 255 553 63
304L T2575 247 582 60 160
RCCM-M220 requirement > 170 > 500 > 45 126-179
Figure 1 – Example of inverse pole figures of 304L (left) and 316L (right) at similar scales.
3. APPROACH
3.1. Specimens
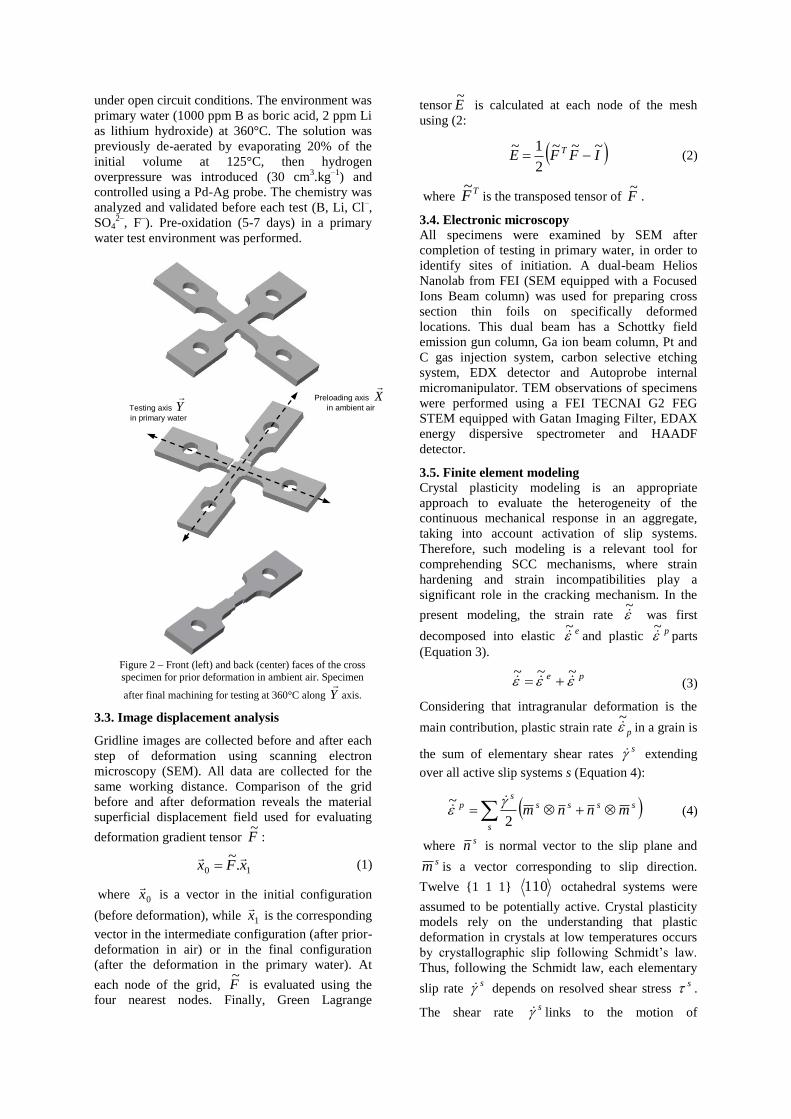
Cross tests were used to promote strain localization
(Figure 2). This design was optimized to guaranty
strain localization in the cross-area of the specimen
during prior-straining and second deformation in
primary water and to avoid significant deleterious
deformation in specimen fillets. The specimen is
not symmetrical: only the front face is perfectly
plane, designed to perform an easy mechanical
polishing, material characterization and local strain
evaluation. All characterizations and observations
were done on 1 mm2 at the center of the specimen’s
front face, prepared as described below:
Three-step local polishing of each specimen,
including mechanical polishing (0.04 µm
finish) to remove superficial cold work,
electropolishing (20°C, 19 V) in Struers A2
electrolyte A2 solution containing 73%
ethanol, 10% butoxyethanol, 9% water, and
8% perchloric acid, and ionic polishing to
remove the chemically affected superficial
metal layer for relevant oxidation
characterization.
EBSD characterization at the center of each
specimen (1 mm2).
Grid deposition (1 mm2, mesh size = 5 µm),
by electronic micro lithography, at the center
of the specimens using the following
procedure: the center of the sample is coated
by centrifugation with about 200 nm of a
photosensitive polymer (poly methyl
metacrylate). After heating (30 min at
135°C), the sample is locally irradiated (4
C/m2) by a SEM beam (tension of
acceleration = 30 kV, probe current = 3 nA,
working distance = 30 mm), drawing a grid.
The irradiated resin is then dissolved in a
solution composed of methyl cetone (35%)
and isopropylic alcohol (65%). A thin layer
of gold is then deposited, first by cathodic
pulverization, then by evaporation under
vacuum. Residual resin is eliminated in a
solution of ethyl acetate.
All cross specimens were finally prior deformed in
ambient air, along X
axis.
3.2. Tensile tests
After pre-straining, a final machining of specimens
is achieved by cutting off the arms used for pres-
straining to insure that deformation will be
localized at the center of the specimen during the
second loading at 360°C (Figure 2). Specimens
were ultrasonically rinsed in ethanol and then in
distilled water. Tests were carried out in Hastelloy
(C-276) autoclaves. Specimens were insulated from
the autoclave by oxidized Zircalloy to avoid
galvanic coupling. Experiments were conducted
under open circuit conditions. The environment was
primary water (1000 ppm B as boric acid, 2 ppm Li
as lithium hydroxide) at 360°C. The solution was
previously de-aerated by evaporating 20% of the
initial volume at 125°C, then hydrogen
overpressure was introduced (30 cm3.kg
–1) and
controlled using a Pd-Ag probe. The chemistry was
analyzed and validated before each test (B, Li, Cl–,
SO42–
, F–). Pre-oxidation (5-7 days) in a primary
water test environment was performed.
Figure 2 – Front (left) and back (center) faces of the cross
specimen for prior deformation in ambient air. Specimen
after final machining for testing at 360°C along Y
axis.
3.3. Image displacement analysis
Gridline images are collected before and after each
step of deformation using scanning electron
microscopy (SEM). All data are collected for the
same working distance. Comparison of the grid
before and after deformation reveals the material
superficial displacement field used for evaluating
deformation gradient tensor F~
:
10 .
~xFx
(1)
where 0x
is a vector in the initial configuration
(before deformation), while 1x
is the corresponding
vector in the intermediate configuration (after prior-
deformation in air) or in the final configuration
(after the deformation in the primary water). At
each node of the grid, F~
is evaluated using the
four nearest nodes. Finally, Green Lagrange
tensor E~
is calculated at each node of the mesh
using (2:
IFFE T ~~~
2
1~ (2)
where TF
~is the transposed tensor of F
~.
3.4. Electronic microscopy
All specimens were examined by SEM after
completion of testing in primary water, in order to
identify sites of initiation. A dual-beam Helios
Nanolab from FEI (SEM equipped with a Focused
Ions Beam column) was used for preparing cross
section thin foils on specifically deformed
locations. This dual beam has a Schottky field
emission gun column, Ga ion beam column, Pt and
C gas injection system, carbon selective etching
system, EDX detector and Autoprobe internal
micromanipulator. TEM observations of specimens
were performed using a FEI TECNAI G2 FEG
STEM equipped with Gatan Imaging Filter, EDAX
energy dispersive spectrometer and HAADF
detector.
3.5. Finite element modeling
Crystal plasticity modeling is an appropriate
approach to evaluate the heterogeneity of the
continuous mechanical response in an aggregate,
taking into account activation of slip systems.
Therefore, such modeling is a relevant tool for
comprehending SCC mechanisms, where strain
hardening and strain incompatibilities play a
significant role in the cracking mechanism. In the
present modeling, the strain rate ~ was first
decomposed into elastic e
~ and plastic
p~ parts
(Equation 3).
pe ~~~ (3)
Considering that intragranular deformation is the
main contribution, plastic strain rate p~ in a grain is
the sum of elementary shear rates s extending
over all active slip systems s (Equation 4):
s
sssss
p mnnm2
~
(4)
where sn is normal vector to the slip plane and
sm is a vector corresponding to slip direction.
Twelve {1 1 1} 110 octahedral systems were
assumed to be potentially active. Crystal plasticity
models rely on the understanding that plastic
deformation in crystals at low temperatures occurs
by crystallographic slip following Schmidt’s law.
Thus, following the Schmidt law, each elementary
slip rate s depends on resolved shear stress
s .
The shear rate s links to the motion of
Preloading axis X
in ambient air Testing axis Y
in primary water
dislocations in active slip systems. Thus, flow rule s is described by a phenomenological Norton-like
viscoplastic relation (Equation 5), where Ks is
viscosity constant, ns is stress sensitivity, and sc is
the critical resolved shear stress on s:
ss
ssn
s
sc
ss
s
x
x
K
xs
)( (5)
Resolved shear stress s on slip system s is the
projection of the stress tensor on orientation
tensor sm~ (Equation 6):
ss m~:~ (6)
sx is the kinematic hardening, proportional
tos (Equations 7 and 8):
xs = c s
(7)
ssss d (8)
where c is a constant. sc is the isotropic
hardening, depending on cumulated strain rcum (Equations 9 and 10):
)exp(10rcum
r
rssc bhQ
(9)
t
rrcum dt (10)
where h is an interaction matrix, describing the self
hardening (diagonal components) due to the
interactions between coplanar slip systems, and the
latent hardening (non-diagonal components) due to
the interactions between secant slip systems. All
components hrs of h are normalized by the self-
hardening components. When strain hardening is
isotropic, it is independent of the active slip system.
Therefore, in this situation hsr = 1. Usually, self-
hardening components are inferior to latent
components. Both isotropic and kinematic
hardenings are considered when modeling the
behavior of the material. Nevertheless, in a first
approach (6), it is assumed that hrs = 1.
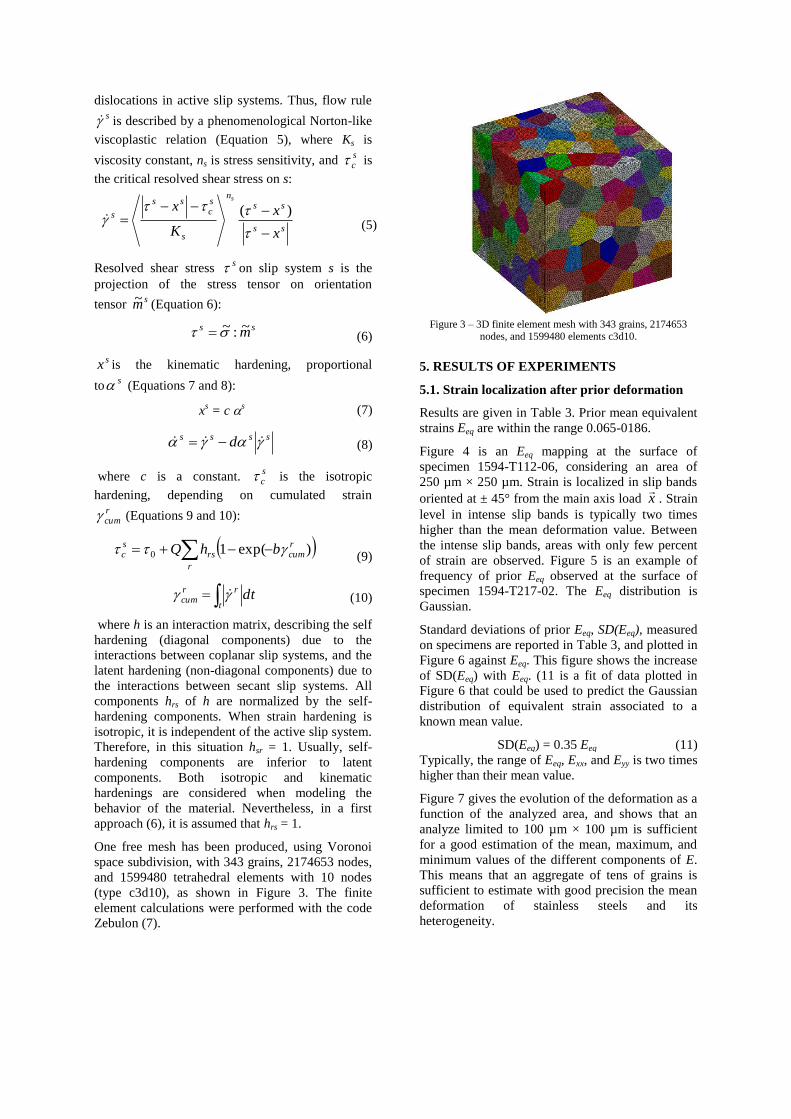
One free mesh has been produced, using Voronoi
space subdivision, with 343 grains, 2174653 nodes,
and 1599480 tetrahedral elements with 10 nodes
(type c3d10), as shown in Figure 3. The finite
element calculations were performed with the code
Zebulon (7).
Figure 3 – 3D finite element mesh with 343 grains, 2174653
nodes, and 1599480 elements c3d10.
5. RESULTS OF EXPERIMENTS
5.1. Strain localization after prior deformation
Results are given in Table 3. Prior mean equivalent
strains Eeq are within the range 0.065-0186.
Figure 4 is an Eeq mapping at the surface of
specimen 1594-T112-06, considering an area of
250 µm × 250 µm. Strain is localized in slip bands
oriented at ± 45° from the main axis load x
. Strain
level in intense slip bands is typically two times
higher than the mean deformation value. Between
the intense slip bands, areas with only few percent
of strain are observed. Figure 5 is an example of
frequency of prior Eeq observed at the surface of
specimen 1594-T217-02. The Eeq distribution is
Gaussian.
Standard deviations of prior Eeq, SD(Eeq), measured
on specimens are reported in Table 3, and plotted in
Figure 6 against Eeq. This figure shows the increase
of SD(Eeq) with Eeq. (11 is a fit of data plotted in
Figure 6 that could be used to predict the Gaussian
distribution of equivalent strain associated to a
known mean value.
SD(Eeq) = 0.35 Eeq (11)
Typically, the range of Eeq, Exx, and Eyy is two times
higher than their mean value.
Figure 7 gives the evolution of the deformation as a
function of the analyzed area, and shows that an
analyze limited to 100 µm × 100 µm is sufficient
for a good estimation of the mean, maximum, and
minimum values of the different components of E.
This means that an aggregate of tens of grains is
sufficient to estimate with good precision the mean
deformation of stainless steels and its
heterogeneity.

Table 3 – Mean prior-deformation (in x
direction) in ambient air.
Material Specimen Analyzed
area (mm²) Mean(Exx) Mean(Eyy) Mean(Exy) Mean(
xxE )
(s–1) Mean(Eeq) SD(Eeq)
RES(Eeq)
(mm²)
304L
1594-T112-02 0.01 0.120 - - 10–3 - - -
1594-T112-07 0.12 0.110 – 0.018 0.006 1.2 10–3 0.136 0.050 -
1594-T112-03 0.50 0.115 – 0.024 – 0.003 1.6 10–3 0.127 0.037 0.014
1594-T112-04 0.04 0.069 – 0.047 0.001 1.0 10–3 0.070 0.025 -
1594-T112-06 0.06 0.087 – 0.055 0.000 1.0 10–3 0.088 0.038 0.016
1594-T112-08 0.01 0.178 – 0.089 0.016 1.0 10–3 0.186 0.068 -
316L
1594-T217-01 0.50 0.066 – 0.047 0.001 1.3 10–3 0.073 0.038 0.103
1594-T217-02 0.01 0.038 – 0.029 0.000 1.1 10–3 0.043 - -
1594-T217-04 0.29 0.077 – 0.047 – 0.005 1.5 10–3 0.085 0.037 0.045
1594-T217-07 0.01 0.065 –0.056 – 0.002 1.1 103 0.075 0.028 -
1594-T217-08 0.01 0.156 – 0.069 0.013 1.5 103 0.159 0.044 -
1594-T217-10 0.04 0.065 – 0.039 0.005 1.0 10–3 0.069 0.026 -
0 0.05 0.1 0.15 0.2 0.25 0.3 0.350
0.05
0.1
0.15
0.2
0.25
Prior strain Eeq distribution
Fre
quency
Mean value = 0.092888
Median value = 0.088738
SD = 0.037705
Analyzed surface = 0.0625 mm²
Density = 40000 measures/mm²
Figure 4 – Map of equivalent deformation evaluated at the surface of
specimen 1594-T112-06 (304L). Analyzed area = 0.06 mm2. Figure 5 – Evolution of min., mean, median, max. deformation Eeq
and SD versus analyzed surface (40000 measures.mm–2) of specimen
1594-T217-01 (316L).
y = 0,3533x
R2 = 0,6932
0,00
0,01
0,02
0,03
0,04
0,05
0,06
0,07
0,08
0,00 0,05 0,10 0,15 0,20
Mean prior equivalent strain
SD
(Equiv
ale
nt
str
ain
)
0 0.05 0.1 0.15 0.2 0.25 0.3 0.35 0.4 0.45 0.5
0
0.05
0.1
0.15
0.2
0.25
0.3
0.35
Analysed surface (mm²)
Valu
e
Representative elementary surface = 0.10294 mm²
Max
Mean
Median
Min
Figure 6 – Evolution of SD(Eeq) versus mean(Eeq) for 10 prior-deformed specimens.
Figure 7 – Evolution of min., mean, median, max. deformation Eeq and SD versus analyzed surface (40000 measures.mm–2) of specimen
1594-T217-01 (316L).
5.2. Initiation of SCC in primary water
Results of constant elongation rate tests in primary
water are presented in Table 4. Strain and strain
rates are within the ranges 0.003 0.500 and 1.4
109
s1
9.9 108
s1
respectively. As expected,
initiation of SCC was essentially intergranular.
The test on specimen 1594-T112-02 was
interrupted for SEM examination after 270 hours of
tension in a primary hydrogenated environment at
360°C. No initiation of SCC was noticed. Then, the
specimen was tested again up to failure.
Observations of the fracture surface indicated a
preferential intergranular initiation in the pre-
strained area of the specimen (Figure 8). By
contrast SCC propagation was essentially
transgranular in the most deformed part of the
specimen (Figure 9). This result indicates that
IGSCC was enhanced by the change of strain path
after prior deformation, while TGSCC was clearly
promoted by the continuous deformation during
testing.
Test on specimen 1594-T112-07 indicated an
important susceptibility to IGSCC for a limited
exposure to primary water (313 h). Prior

deformation Exx and second deformation Eyy levels
were similar. By contrast, prior (prior Exx = 0.17)
and second (second Eyy < 0.01) deformations
applied to specimen 1594-T112-08 were
completely different. However, significant IGSCC
initiation was observed on both specimens.
Therefore, intergranular cracking resulted in the
change of strain path, and large deformation during
exposure to the environment is not required for IG
cracking.
Figure 8 – IGSCC initiation followed by transition to TGSCC on
fracture surface of specimen 1594-T112-2 after 1400 h of
tension in primary environment.
Figure 9 – TGSCC propagation on fracture surface of specimen 1594-T112-2 after 1400 h of tension in primary environment.
Test on specimen 1594-T217-01 (316L) revealed a
shallow intergranular initiation (Figure 10)
appropriate for local strain evaluations. By
constrast intergranular cracks were too opened in
the case of specimen 1594-T217-02 (Figure 11).
TGSCC was also noticed on this specimen.
No initiation was observed on specimen 1594-
T217-10 after 577 h in primary water, for a prior
deformation similar to those of specimen 1594-
T217-01 and a limited second deformation (Eyy =
0.003). Thus, time to initiation probably decreases
when prior and second strain levels increase.
One test was conducted under constant
displacement on specimen 1594-T112-03. Based on
previous results [9], no relaxation was expected
during the SCC test (1864 hours). A limited number
of intergranular cracks were observed. Slip line
traces are observed on the flanks of the cracks. This
result suggests that IGSCC initiation is possible
under constant load following a complex strain path
when the second strain is limited.
Correlation between initiation and local
deformation Eyy in primary water is illustrated in
Figure 12 and Figure 13. These figures indicate that
SCC initiated at grain boundary where local strain
gradients are significant. Therefore, an important
effect of strain incompatibilities on intergranular
cracking is expected. The cracked grain boundaries
were in addition favorably oriented for cracking
against loading axis.
Non-initiation (gray dots), IG- (red crosses) and
TGSCC initiation (blue crosses) conditions are
plotted against prior deformation Exx in ambient air,
second deformation Eyy in primary water in Figure
14. 0.3 mm² of the surface of the specimen 1594-
T217-01 were analyzed, including 12182 measures
of strain. 418 nodes were considered as
representative sites for initiation. Most of the cracks
were intergranular, confirming the appropriate
design and loading used in this study to investigate
IGSCC. No crack initiated where deformation was
compressive during the exposure to primary water
(Second Eyy < 0). Most of the cracks initiated for
0.05 < prior-Exx < 0.1 and 0.01 < second-Eyy < 0.04.
It is confirmed that high levels of deformation
during the exposure to the primary water are not
necessary to initiate.
Table 4 – Results of tensile tests (in y
direction) in a primary PWR environment at 360°C.
Material Specimen Mean Prior-Exx Duration (h) Mean Eyy Mean yyE (s–1) Remarks
304L
1594-T112-02 0.120 1400 0.500 9.9 10–8
No initiation after 270 h. Initiation of
IGSCC then TGSCC propagation up to
failure.
1594-T112-06 0.070 519 0.040 2.1 10–8 Significant IGSCC initiation + shallow
TGSCC initiation
1594-T112-07 0.100 313 0.110 9.8 10–8 Significant IGSCC initiation + shallow
TGSCC initiation
1594-T112-08 0.170 430 0.006 3.9 10–9 Significant IGSCC initiation + shallow
TGSCC initiation
1594-T112-03 0.111 1864 0.010 0 Few sites of IGSCC
316L
1594-T217-01 0.066 720 0.020 7.7 10–9 Shallow IGSCC initiation
1594-T217-02 0.040 1606 0.270 4.7 10–8 Significant IGSCC initiation + TGSCC
1594-T217-10 0.060 577 0.003 1.4 10–9 No initiation

Figure 10 – IGSCC initiation on specimen 1594-T217-1 after 720 h
of tension in primary environment.
Figure 11 – IGSCC initiation on specimen 1594-T217-2 after 1600
h of tension in primary environment.
Figure 12 – Deformation Eyy (in primary water) at the surface of specimen 1594-T217-1 (316L) after testing in a primary water
(360°C).
Figure 13 – Deformation Eyy (in primary water) at the surface of specimen 1594-T217-1 (316L) after testing in a primary water
(360°C).
Figure 14 – Preferential conditions for SCC initiation as a function of prior deformation in ambient air and second strain in
primary water. Specimen 1594-T217-01 (316L) after testing in a
primary water (360°C).
5.3. Oxide characterization
Several sites of sampling were chosen at the surface
of specimens 1594-T112-06 and 15946T217-01.
Each site of sampling was superposed with a local
deformation map in order to correlate strain
localization with local passive layer thickness.
Figure 15 is an example of such correlation for the
sites 1A and 1B. The level of prior deformation Exx
in ambient air and second deformation Eyy in
primary water corresponding to the sampling for
TEM examinations are reported in Table 5.
Figure 16 shows the details of the oxide formed in
site 1A. In this figure, the metal-oxide interface is
clearly below the grid-oxide interface, suggesting
the anionic growth of the inner Cr-rich oxide layer
in the metal. The thickness of the oxide below the
grid does not seem affected by the presence of the
grid. A preferential oxidation can be also noticed
within pre-established shear bands from prior
deformation in air. Spinels (magnetite) grew on the
inner Cr-rich oxide layer and on the grid. Spinels
are in epitaxy with the metal, despite the presence
of the inner Cr-rich oxide layer.
Figure 17 is a STEM observation of site 1B,
showing the possible differences of density between

the outer and the inner part of the Cr-rich oxide
layer. The outer part, at the interface with the
spinels appears very regular and dense. This could
be the result of the fine polishing including electro-
then ionic polishing. By contrast, the inner part
seems composed of small ‘grains’ growing
inhomogeneously in the metal. The typical size of
‘grains’ observed in the inner oxide is similar to the
fine dislocation structures in the underlaying metal.
Figure 15 – Strain localization (second strain Eyy) in site 1 at the
surface of specimen 1594-T112-06.
Figure 16 – Oxide observation (STEM, bright field) at the
surface of specimen 1594-T112-06 (304L).
Figure 17 – STEM on site 1B at the surface of specimen 1594-
T112-06 (304L).
Figure 18 indicates the position of the EDS scan
presented in Figure 19. Shear bands are crossing the
metal-oxide interface, and ‘lines’ are continuing in
the oxide, suggesting that shear bands were
emerging before testing in primary water. So, the
more pronounced oxide penetration along slip
bands probably result in prior deformation. The
origin of the x-axis in Figure 19 is in metal. No O is
observed during the EDX scan up to 120 nm.
Nevertheless, in this range of position, a decrease of
Fe content is associated to an increase of Ni content
and a stable Cr content. In addition, the increase of
the Cr content is only observed for a position > 120
nm. The maximum concentration of Ni correspond
to the position = 120 nm. This clearly indicates that
oxidation at the metal-oxide interface (position >
120 nm) essentially results in Fe depletion followed
by its diffusion within the inner oxide layer to the
outer interface of Cr-rich oxide. Trends of O and Cr
concentrations are similar in the metal and in the
oxide. By contrast, trends of Ni and Fe
concentrations are opposite in the metal and similar
in the oxide. The Fe depleted zone in the metal is
approximately 45 nm deep. The thickness of the Cr-
oxide layer, affected by localized prior deformation,
is about 100 nm. The mean chemical composition
in the inner oxide is 50% Cr, 40% Fe and 10% Ni.
Figure 18 – Location of EDX profile on site 1A at the surface of
specimen 1594-T112-06 (304L). STEM, HAADF detector.
Figure 20 indicates the position of the EDX scan
presented in Figure 21. This last scan was realized
perpendicularly to oxidized slip bands. On the most
oxidized slip band, 50 nm ahead of the mean local
metal-oxide interface, Fe content is 20% lower than
Fe in the metal, 10 nm away. By contrast relative
Cr content increases up to 17% and relative Ni
content increases up to 56%. The Cr enrichment is
observed approximately 6 nm away from the
oxidized slip band. The Ni enrichment affects 10
nm, similarly to Fe depletion. The narrow oxidation
of emerging slip bands is supposed to be a
precursor of crack extension, limited to tens of nm,
leading to initiation.
0
10
20
30
40
50
60
70
80
90
100
0 50 100 150 200 250 300
Position (nm)
Fra
cti
on
(w
eig
ht%
)
18
23
28
33
38
43
48
53
58
63
68
Oxyg
en
(a.u
.)
Fe
Cr
Ni
O
Figure 19 – EDX profile located in Figure 19. Site 1A at the
surface of specimen 1594-T112-06 (304L).
Last, Figure 22 illustrates the significant porosity in
the inner oxide layer, especially close to the metal-
oxide interface. This important porosity could result
in the local deformation (Eyy = 0.075) during
350 nm
Shear bands
Microgrid
Metal
Internal oxide
Oxide
penatration along shear
bands
Site 1B
Site 1A
100 nm
Magnetite

exposure to primary water.
Figure 20 – Location of EDX profile on site 2 at the surface of
specimen 1594-T112-06 (304L). STEM, HAADF detector.
0
10
20
30
40
50
60
70
80
90
100
0 20 40 60 80 100
Position (nm)
Fra
cti
on
(w
eig
ht%
)
0
1
2
3
4
5
6
7
8
9
10
Oxyg
en
(a.u
.)Fe
Cr
Ni
O
Figure 21 – EDX profile located in Figure 19. Site 2 at the
surface of specimen 1594-T112-06 (304L).
Figure 22 – Porosity in inner oxide layer, at the interface with
the metal. STEM on site 2 at the surface of specimen 1594-
T112-06 (304L).
Detailed analyses were done in order to evaluate the
effect of strain localization on oxide penetration
and on metal-oxide interface. Figure 23 is an
example of EFTEM Cr-map. Figure 24 is the
associated binary map obtained after filtering.
Image analysis of this binary map allows to
quantify the thickness of the inner Cr-rich oxide
layer (Figure 25). In this situation, the mean oxide
penetration is 50 nm. Finally, results obtained after
image analysis of inner oxide layers are
summarized in Table 5.
Figure 23 Cr-mapping of oxide layer at the surface of
specimen 1594-T112-06 (304L), in site 1B.
Figure 24. Binary Cr mapping of image presented in Figure 23.
Specimen 1594-T112-06 (304L), in site 1B.
20 30 40 50 60 70 800
0.05
0.1
0.15
0.2
0.25
0.3
0.35
Oxide thickness (nm)
Num
ber
fraction
mean value = 49
median value = 49
Figure 25. Distribution of the thickness of the rich-Cr inner
oxide layer formed at the surface of specimen 1594-T112-06
(304L) after image analysis (Figure 24).
Table 5 – Analysis of Cr-rich inner oxide penetrations at the surface of the specimens.
Material Site Resolution
(nm/pixel)
Local strain in the sample Analysed
length
(nm)
Cr-rich inner oxide penetration (nm)
Prior Exx Second Eyy Mean Median Min. Max. SD
304L
1A 2.82 0.10 0.02 1386 102 96 31 172 30
1A 1.35 0.00 0.00 688 102 100 55 170 30
1B 2.56 0.00 0.075 694 49 49 23 87 12
2 1.41 0.02 0.07 679 81 82 54 101 9
316L
1G 5.88 0.02 0.10 1188 72 71 12 124 27
1D 5.88 0.00 0.02 988 90 88 59 135 17
2G 5.95 0.00 0.02 2077 46 48 6 101 25
2D 1.72 0.10 0.01 890 73 74 40 105 14
3G 5.88 0.10 0.01 2941 96 94 41 141 16
3D 1.74 0.10 0.02 880 61 61 19 92 16
5.3. Crack tip examination
Thin foils were removed (dual beam sampling) at
the surface of specimens 1594-T112-06 (304L) and
1594-T217-01 (316L). Active intergranular crack
tips were observed. Indeed, contrary to usually
observed crack propagation tips, there is a high
probability that all of the tips observed are active,
because they correspond to the earlier stage of
initiation, before any branching and screening by
other cracks. Cracks usually initiated where
gradient of deformations are observed. Figure 26
and Figure 27 clearly exhibits cracks on grain
boundaries separating grains with clear different
densities of dislocations. Crack depth did not
exceed few microns. Cracks are usually opened
(Figure 26), 200 nm typically, in good agreement
200 nm
Metal

with SEM observations at the surface (Figure 10).
Opened cracks are filled with Fe oxide (Figure 28).
A significant depletion of Fe is also observed up to
200 nm on the grain boundary, ahead of the tip.
Similarly, a slight Cr depletion is observed on the
grain boundary. Conversely, an important
enrichment in Ni is observed.
Figure 26. IGSCC initiated between grains with apparent
different levels of deformation. Sampling on specimen 1594-
T217-01 (316L), in site 2 (Prior-Exx = 0, second Eyy = 0.03).
Figure 27. IGSCC initiated between grains with apparent
different levels of deformation. Sampling on specimen 1594-
T217-01 (316L), in site 3 (Prior-Exx 0.1, second Eyy 0.03).
Figure 28. EFTEM O, Fe, Cr and Ni maps on an intergranular
crack initiated between grains with apparent different levels of deformation. Sampling on specimen 1594-T217-01 (316L), in
site 2 (Prior-Exx = 0, second Eyy = 0.03).
6. RESULTS OF FEM
6.1. Identification of crystal plasticity law
The identification of the crystal plasticity law of the
304L is based on:
Monotonic tensile tests at 20°C ( = 2 10–
3 s
–1) and at 360°C ( = 10
–6 s
–1).
Monotonic shear tests at 20°C ( = 10–3
s–1
, = 10–1
s–1
).
Cyclic shear test at 20°C (2 cycles, /2 =
0.1, = 10–3
s–1
).
Cyclic hardening at 20°C (50 cycles, =
0.024, = 4 10–3
s–1
).
Creep test at 20°C under constant load
(250 MPa, 216 h) and under trapezoidal
load (max = 250 MPa, min / max = 0.8,
hold time = 3420 s, unload time = 90 s,
reload time = 90 s, 201 h).
Creep test at 360°C (250 MPa, 6000h),
including the preloading tension curve (
= 10–3
s–1
). Creep rate is very low ( = 1.7
10–12
s–1
).
Creep test at 360°C (400 MPa, 8000h),
including the preloading tension curve (
= 10–3
s–1
). Creep rate is very low ( = 2.8
10–12
s–1
).
Non-isothermal (20°C-360°C) relaxation
at 250MPa and 350MPa
Cross test (complex loading path)
including:
o Prior-tension 1 = 0.31, 20°C, 2 10–3
s–1
o Loading (2 = 0.06, 360°C, 2 10–3
s–1
)
of a secondary specimen removed
at 90° from the pre-tension axis.
The elasto-viscoplastic constitutive law was
identified by homogenization approach. The
procedure of identification was the following:
Isotropic elasticity was supposed, Young’s
modulus (E =185000 MPa) and Poisson’s
ratio ( = 0.3) were taken from ASTM
Material Handbook.
Yield limit (0) was evaluated has the ratio
of the macroscopic yield strength (170
MPa) and the mean value of the resolved
shear stress (2.65).
If no explicit information is available for
the interaction matrix the first estimation is
hrs = 1.
For the creep power law, the value n = 7
was initially taken, in agreement with
deformation-mechanism maps proposed by
Frost and Ashby (8) for the same material.
High value of kinematic hardening (d) was
chosen, in order to fit the first cyclic
loading on kinematic hardening, while low
value of isotropic hardening (b) was
200 nm
500 nm
chosen to fit the following cycles of
loading on isotropic hardening.
Experimental data at room temperature (20°C) were
used for the first identification. The final set of
parameters is presented in Table 6.
Table 6 – Material parameters after identification.
Temp.
(°C)
E
(MPa)
0
(MPa) Q b
Ks
(MPa.s1/n) n c d
20 200000 0.3 65 45 3 65 7 600 20
360 185000 0.3 50 45 3 10 4 600 20
6.2. Effect of the strain path on stress and strain
distributions
Parallel computations were done, after subdomain
decomposition, in order to distribute the
computations on different processors of the cluster.
A complex loading path was applied, including
prior-elongation in 20 s till 2% in direction x
,
unloading in 5 s and a second elongation in 20 s till
2% in perpendicular direction y
.
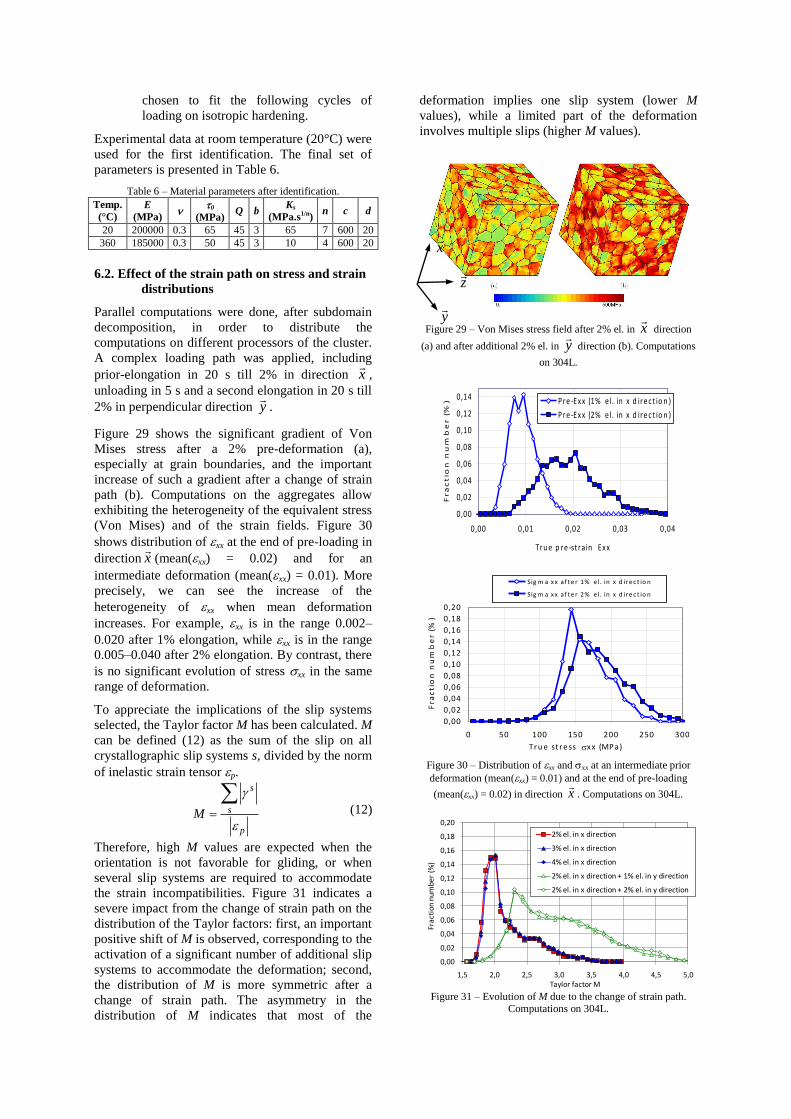
Figure 29 shows the significant gradient of Von
Mises stress after a 2% pre-deformation (a),
especially at grain boundaries, and the important
increase of such a gradient after a change of strain
path (b). Computations on the aggregates allow
exhibiting the heterogeneity of the equivalent stress
(Von Mises) and of the strain fields. Figure 30
shows distribution of xx at the end of pre-loading in
direction x
(mean(xx) = 0.02) and for an
intermediate deformation (mean(xx) = 0.01). More
precisely, we can see the increase of the
heterogeneity of xx when mean deformation
increases. For example, xx is in the range 0.002–
0.020 after 1% elongation, while xx is in the range
0.005–0.040 after 2% elongation. By contrast, there
is no significant evolution of stress xx in the same
range of deformation.
To appreciate the implications of the slip systems
selected, the Taylor factor M has been calculated. M
can be defined (12) as the sum of the slip on all
crystallographic slip systems s, divided by the norm
of inelastic strain tensor p.
p
s
s
M
(12)
Therefore, high M values are expected when the
orientation is not favorable for gliding, or when
several slip systems are required to accommodate
the strain incompatibilities. Figure 31 indicates a
severe impact from the change of strain path on the
distribution of the Taylor factors: first, an important
positive shift of M is observed, corresponding to the
activation of a significant number of additional slip
systems to accommodate the deformation; second,
the distribution of M is more symmetric after a
change of strain path. The asymmetry in the
distribution of M indicates that most of the
deformation implies one slip system (lower M
values), while a limited part of the deformation
involves multiple slips (higher M values).
Figure 29 – Von Mises stress field after 2% el. in x
direction
(a) and after additional 2% el. in y
direction (b). Computations
on 304L.
0,00
0,02
0,04
0,06
0,08
0,10
0,12
0,14
0,00 0,01 0,02 0,03 0,04
Tru e p re -st ra in Ex x
Fr
ac
tio
n n
um
be
r (
%) P re -Ex x (1% e l. in x d ire c t io n )
Pre -Ex x (2% e l. in x d ire c t io n )
0,00
0,02
0,04
0,06
0,08
0,10
0,12
0,14
0,16
0,18
0,20
0 50 100 150 200 250 300
Tru e st re ss x x (MPa)
Fra
cti
on
nu
mb
er
(%)
Sig m a x x af t e r 1% e l. in x d ir e c t io n
Sig m a x x af t e r 2% e l. in x d ir e c t io n
Figure 30 – Distribution of xx and xx at an intermediate prior
deformation (mean(xx) = 0.01) and at the end of pre-loading
(mean(xx) = 0.02) in direction x
. Computations on 304L.
0,00
0,02
0,04
0,06
0,08
0,10
0,12
0,14
0,16
0,18
0,20
1,5 2,0 2,5 3,0 3,5 4,0 4,5 5,0
Frac
tio
n n
um
ber
(%
)
Taylor factor M
2% el. in x direction
3% el. in x direction
4% el. in x direction
2% el. in x direction + 1% el. in y direction
2% el. in x direction + 2% el. in y direction
Figure 31 – Evolution of M due to the change of strain path.
Computations on 304L.
y
x
z

7. DISCUSSION
7.1. Correlation between strain hardening and
oxidation
Results obtained after image analysis of inner oxide
layers are plotted in Figure 32. These results
suggest an increase of the mean oxide penetration
with the local cumulated equivalent deformation cumaxialE . The evolution of the maximum oxide
penetration max(p) against cumaxialE follows an
ATAN law, given in (13):
1212526140)max( cumaxialEATANp
(13)
where p is in nm. By contrast, the mean penetration
increased linearly with cumaxialE . Typically, the
maximum and the mean oxide penetrations
increased by a factor 2 when 12% of axial
deformation is reached. The increase of the mean
value of the Cr-rich layer could indicate the
decrease of the efficiency of passivity property of
the oxide when strain hardening increases. This
could result in the effect of the local non-
homogeneous diffusion in the metal on the
microstructure of the oxide (grain size) and
associated transport properties. Previous studies (9)
already mentioned the increase of the Cr-rich oxide
layer with pH in primary water, associated to an
increase of the IGSCC susceptibility. Thus, both
mechanical and chemical properties are susceptible
to alter the properties of the passive layer formed at
the surface of stainless steels exposed to primary
environment. The alteration of these properties
promotes SCC initiation when, in addition, local
stress concentration can fracture the passive layer.
y = 264,6x + 54,6
R2 = 0,5
y = 161,5x + 20,2
R2 = 0,2
0
20
40
60
80
100
120
140
160
180
0 0,02 0,04 0,06 0,08 0,1 0,12 0,14 0,16 0,18 0,2
Local cumulated axial strain
Cr-
rich
oxid
e p
en
etr
atio
n (
nm
)
Max
Mean
Min
SD
Figure 32 – Evolution of Cr-rich oxide penetration (min., mean, max., SD) at the surface of 304L stainless steel as a function of
local cumulated axial strain cumaxialE .
7.2. Correlation between loading and initiation
Most cracks identified in this study are
intergranular. Nevertheless, shallow transgranular
cracking also initiated. By contrast, following a
simple monotonic strain path, pure trans-granular
stress corrosion cracking is usually observed (2).
Therefore, complex loading promotes intergranular
initiation of SCC.
Strain is not homogeneous by nature. In this study,
distribution of deformation levels were measured
and calculated at the scale of the polycrystal. Local
stress and especially intergranular stress are
associated with strain heterogeneity. Strain
heterogeneity at the scale of the polycrystal
aggregate seems to control possible sites of
cracking. Indeed, cracks initiate where the strain
gradients are important. Therefore, intergranular
stress due to strain incompatibilities seems to drive
the stress corrosion cracking mechanism.
Consequently, slip traces intersecting intergranular
cracks are often observed on one grain adjacent to
the crack. The typical range of angle of intersection
is 45° to 90°. This observation also is in good
agreement with previous observations of
intergranular crack tip (9).
7.3. Assumed mechanism
Based on previous considerations, the following
basic mechanism is assumed to describeboth
initiation and propagation of SCC in stainless steels
exposed to primary water:
1. Oxidation, leading to the formation of a
superficial Cr-rich passive layer with a
mean thickness of 50 nm. The maximum
oxide penetration does not exceed 100 nm
at 360°C, when 7 < pH320°C < 8, if the
material is not strain hardened.
Nevertheless, the mean and maximum
oxide penetrations increase for higher pH
values and when the material is strain
hardened.
2. When sufficient, local stresses lead to the
fracture of the oxide or metal-oxide
interface. Strain hardening, loading
fluctuations, intergranular strain
incompatibilies and irregular metal-oxide
interfaces promote stress concentrations
and, as a consequence, initiation or crack
tip extension. Changes of strain path
enhance stress concentrations on the grain
boundaries.
8. CONCLUSION
Understanding and quantification of interactions
between localized deformation in materials and
environmental-assisted cracking could play role in
maintaining the integrity of LWR components.
Thus, a detailed understanding of strain localization
during plastic deformation and of the underlying
mechanisms is important for the manufacture and
design of materials exposed to the environment of
the primary circuit of PWRs.
The objectives of this study was to evaluate the
relevance of interactions between localized
deformation and initiation of stress corrosion
cracking in austenitic stainless steels exposed to a

PWR primary environment and to correlate
quantitatively strain localization and selective
oxidation. Experimental investigations and
computations helped to quantify the effect of a
change of strain path on strain localization and to
increase understanding of the contribution of local
strain and stress on SCC.
Works are in progress in order to evaluate strain
localization effect on oxidation and IGSCC of Ni-
based alloys.
Future works will focus on the coupling of
identified mechanisms (deformation, oxidation,
fracture) in order to model initiation.
REFERENCES
1. HICKLING, ‘Understanding the interaction
between localized deformation in materials and
environmently assisted cracking’, EPRI technical
report 1011789, 2005.
2. T. COUVANT, F. VAILLANT, JM. BOURSIER, D.
DELAFOSSE, ‘Effect of strain path on SCC of
AISI 304L stainless steel in PWR primary
environment at 360°C’ (Paper presented at
Eurocorr’2004, Nice, France, 2004).
3. SCHMITT, AERNOUDT, BAUDELET, ‘Yield loci for
polycristalline metals without texture’, Material
Science and Engeneering, 75 (1985), 13-20.
4. ANGEL, ‘Formation of martensite in austenitic
stainless steels’, Journal of the Iron and Steel
Institute, 177 no 1 (1954), 165-174.
5. LACOMBE, BERANGER, ‘Structures et
diagrammes d’équilibre des diverses nuances
d’acier inoxydables. Conséquences sur leurs
traitements thermiques’, Les aciers inoxydables,
éd. P. Lacombe, pp. 13-58, 1990.
6. G. CAILLETAUD, ‘A micromechanical approach
to inelastic behaviour of metals’, International
Journal of Plasticity, Volume 8, Issue 1, 1992,
Pages 55-73.
7. J. BESSON, R. LE RICHE, R. FOERCH, G.
CAILLETAUD, ‘Object-oriented programming
applied to the finite element method. Part II:
application to material behaviors’, Rev. Eur.
Elements Finis 7, 567–588. 1998.
8. H. J. FROST, M. F. ASHBY, ‘Deformation-
Mechanism Maps, The Plasticity and Creep of
Metals and Ceramics’, Cambridge University,
UK. http://engineering.dartmouth.edu/defmech/.
9. T. COUVANT, L. LEGRAS, C. POKOR, F.
VAILLANT, Y. BRECHET, J.M. BOURSIER, P.
MOULART, ‘Investigations on the mechanisms of
PWSCC of strain hardened austenitic stainless
steels’, 13th International Conference on
environmental degradation of materials in nuclear
systems-water reactors, Whistler (Canada), 2007.