development of scenarios & urban mobility plan report · development of scenarios & urban...
TRANSCRIPT
CTTP for Nashik
June 2017
Development of Scenarios & Urban Mobility Plan Report
Development of Scenarios and Urban Mobility Plan Report 1
D IS C L A IMER:
This document has been prepared for the ”Comprehensive Traffic and Transportation Plan for Nashik” and should not be relied upon or used for any other project without an independent check being carried out as to its suitability and prior written authority of UMTC being obtained. UMTC accepts no responsibility or liability for the consequence of this document being used for a purpose other than the purposes for which it was commissioned. Any person using or relying on the document for such other purpose agrees, and will by such use or reliance be taken to confirm his agreement to indemnify UMTC for all loss or damage resulting there from. UMTC accepts no responsibility or liability for this document to any party other than the person by whom it was commissioned.
Development of Scenarios and Urban Mobility Plan Report 2
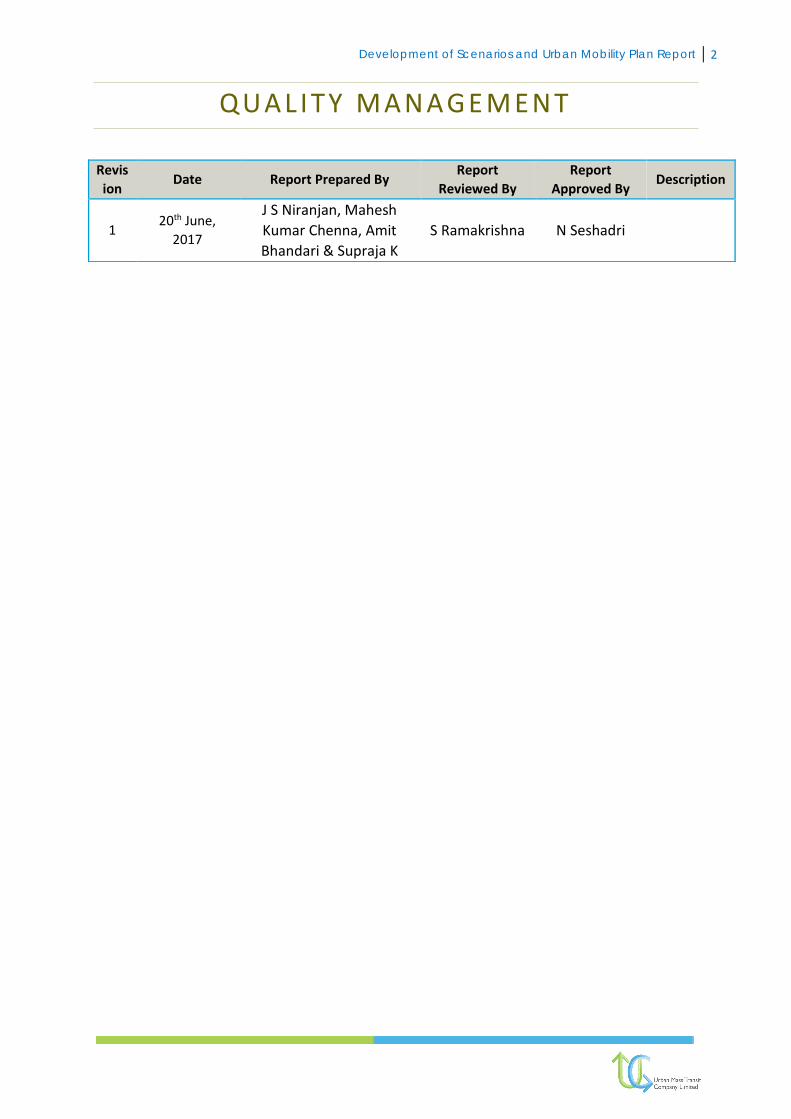
QUA L ITY MA NA GE M ENT
Revis
ion Date Report Prepared By
Report
Reviewed By Report
Approved By Description
1 20th June,
2017
J S Niranjan, Mahesh
Kumar Chenna, Amit
Bhandari & Supraja K
S Ramakrishna N Seshadri

Development of Scenarios and Urban Mobility Plan Report 3
TABLE OF CONTENTS
Table of Contents ................................................................................................................................................... 3
LIST OF FIGURES ..................................................................................................................................................... 4
LIST OF TABLES ....................................................................................................................................................... 6
ABBREVIATIONS ...................................................................................................................................................... 8
1. Introduction .................................................................................................................................................... 9
1.1. Background ........................................................................................................................................... 9
1.2. Objective of the Study ........................................................................................................................... 9
1.3. Organization of the Report ................................................................................................................... 9
2. Travel Demand Modelling and Forecasting .................................................................................................. 10
2.1. Pre-Modeling Analysis ......................................................................................................................... 11
2.2. Base Year Travel Demand Modeling ................................................................................................... 19
2.3. Business As Usual Scenario ................................................................................................................. 29
2.4. SUSTAINABLE urban transport Scenario ............................................................................................. 41
2.5. Comparison of Scenarios ..................................................................................................................... 49
3. Meetings Conducted .................................................................................................................................... 51
3.1. Stakeholders Meeting ......................................................................................................................... 51
3.2. Action Taken on Review Meetings ...................................................................................................... 52
3.3. Stakeholders meeting on CTTP Proposals ........................................................................................... 52
4. VISION and GOALS ........................................................................................................................................ 53
4.1. VISION ................................................................................................................................................. 53
4.2. GOALS .................................................................................................................................................. 54
4.3. BENCHMARKS ..................................................................................................................................... 55
5. URBAN MOBILITY STRATEGIES ..................................................................................................................... 57
5.1. LAND USE AND TRANSPORT STRATEGY .............................................................................................. 57
5.2. NON-MOTORIZED TRANSPORT STRATEGY .......................................................................................... 58
5.3. PUBLIC TRANSPORT STRATEGY ........................................................................................................... 58
5.4. ROAD NETWORK STRATEGY ................................................................................................................ 59
5.5. FREIGHT MANAGEMENT STRATEGY.................................................................................................... 59
5.6. DEMAND MANAGEMENT STRATEGY .................................................................................................. 60
5.7. TRAFFIC ENGINEERING STRATEGY ...................................................................................................... 60
5.8. TECHNOLOGICAL STRATEGY................................................................................................................ 60
6. URBAN MOBILITY PLAN ................................................................................................................................ 61
6.1. LAND USE TRANSPORT PLAN .............................................................................................................. 61
6.2. ROAD NETWORK DEVELOPMENT STRATEGY ...................................................................................... 70
Development of Scenarios and Urban Mobility Plan Report 4
6.3. NON-MOTORIZED TRANSPORT PLAN .................................................................................................. 75
6.4. PUBLIC TRANSPORT IMPROVEMENT PLAN ......................................................................................... 91
6.5. FREIGHT MANAGEMENT PLAN ......................................................................................................... 103
6.6. TRAFFIC ENGINEERING AND MANAGEMENT MEASURES ................................................................. 106
6.7. TECHNOLOGICAL MEASURES ............................................................................................................ 144
6.8. TRAVEL DEMAND MANAGEMENT MEASURES .................................................................................. 151
6.9. PARKING STRATEGIES / PROPOSALS ................................................................................................. 153
On-Street Parking- Location-wise Recommendations .................................................................................... 160
7. Way Forward .............................................................................................................................................. 175
LIST OF FIGURES
Figure 2-1 Traffic Analysis Zones Nashik ............................................................................................................... 11
Figure 2-2 Base year road network - 2016 ........................................................................................................... 13
Figure 2-3 bus route map of nashik - 2016 ........................................................................................................... 14
Figure 2-4 Procedures for Calibration of Base Year Matrices ............................................................................... 16
Figure 2-5 Desire lines FOR BASE YEAR - passenger vehicles - passengers .......................................................... 18
Figure 2-6 Desire line Diagram for Base Year - freight vehicles ............................................................................ 19
Figure 2-7 Travel demand framework .................................................................................................................. 19
Figure 2-8 Travel time distribution curve ............................................................................................................. 22
Figure 2-9: V/C Ratio for Base Year (2016) ........................................................................................................... 28
Figure 2-10 PT phpdt for base year (2016) ........................................................................................................... 29
Figure 2-11 Base Year Landuse (2016) .................................................................................................................. 33
Figure 2-12 Horizon Year Landuse (2036) ............................................................................................................. 34
Figure 2-13: Distribution of Population Density for Base and Horizon Years (2016-2036) in BAU Scenario ........ 35
Figure 2-14: Distribution of Employment Density for Base and Horizon Years (2016-2036) in BAU Scenario ..... 36
Figure 2-15 Desire lines for horizon year trips-Passenger trips ............................................................................ 37
Figure 2-16: Desire line Diagram for Horizon Year-goods pcus ............................................................................ 38
Figure 2-17: V/C Ratio for Horizon Year (2036) .................................................................................................... 40
Figure 2-18: PT PHPDT for Horizon Year (2036) ................................................................................................... 41
Figure 2-19: Distribution of Population Density for Base and Horizon Years (2016-2036) in SUT Scenario ........ 43
Figure 2-20: Distribution of Employment Density for Base and Horizon Years (2016-2036) in SUT Scenario ..... 44
Figure 2-21: Alternative Network for Sustainable Scenario for Horizon Year-2036 ............................................. 45
Figure 2-22: Desire line Diagrams for Horizon Year-2036 .................................................................................... 46
Figure 2-23: V/C Ratio for Horizon Year (2036) .................................................................................................... 48
Figure 2-24: PT PHPDT for Horizon Year (2036) ................................................................................................... 49
Figure 3-1: Stakeholder discusssion ..................................................................................................................... 51
Figure 6-1 ring and radial road network in nashik ................................................................................................ 62
Figure 6-2 ROW sections - FP: Footpath, CT: Cycle Track, MUZ: Multi Utility Zone, CW: Carriage Way, Med:
Median, SR: Service Road ..................................................................................................................................... 63
Figure 6-3 9m row section .................................................................................................................................... 63
Figure 6-4 18 m row section ................................................................................................................................. 64
Figure 6-5 24 m row section ................................................................................................................................. 64
Development of Scenarios and Urban Mobility Plan Report 5
Figure 6-6 30 m row section ................................................................................................................................. 65
Figure 6-7 36 m row section ................................................................................................................................. 65
Figure 6-8 45 m row section ................................................................................................................................. 66
Figure 6-9 60 m row section ................................................................................................................................. 66
Figure 6-10 Mobility Corridor Concepts ............................................................................................................... 67
Figure 6-11 road network development vs economic nodes in the city .............................................................. 68
Figure 6-12 Concept of Transit Oriented Development ....................................................................................... 69
Figure 6-13 transit oriented development across major mobility corridors ........................................................ 69
Figure 6-14 Roads for widening in the city ........................................................................................................... 72
Figure 6-15 Outer Ring Road- Missing Links ......................................................................................................... 73
Figure 6-16 Proposed Rail and River Over Bridge Locations................................................................................. 74
Figure 6-17 Road hierarchy in the horizon year- A: arterial, sa: sub arterail, c: collector, L: local. ...................... 75
Figure 6-18 proposed footpath network in nashik ............................................................................................... 78
Figure 6-19 proposed cycle tracks by type ........................................................................................................... 82
Figure 6-20 LOCATIONS FOR AREA BASED NMT PLAN ......................................................................................... 86
Figure 6-21 Additional buses required as per Moud norms ................................................................................. 94
Figure 6-22 major pt corridors .............................................................................................................................. 95
Figure 6-23 routes suggested for mass rapid transit system ................................................................................ 98
Figure 6-24 existing key pt and ipt routes in the city ......................................................................................... 101
Figure 6-25 key ipt routes proposed .................................................................................................................. 102
Figure 6-26 Proposed truck terminals for the city .............................................................................................. 105
Figure 6-27 Estimated vehicle growth at junctions ............................................................................................ 107
Figure 6-28 Type of junction based on traffic flows (IHT 1997) ......................................................................... 108
Figure 6-29 Junctions for geometry improvement ............................................................................................. 109
Figure 6-30 Typical Improvement Measures .................................................................................................. 110
Figure 6-31 Junction improvement for lokmat circle ......................................................................................... 110
Figure 6-32 CBS Area ........................................................................................................................................ 112
Figure 6-33 CBS Area Issues ............................................................................................................................ 112
Figure 6-34 Propose Circulation at CBS Area ................................................................................................. 113
Figure 6-35 Shalimar Junction ......................................................................................................................... 114
Figure 6-36 Shalimar Issues ............................................................................................................................. 115
Figure 6-37 Sarda Circle ................................................................................................................................... 116
Figure 6-38 Dwarka Junction ........................................................................................................................... 117
Figure 6-39 Proposed intervention at Dwarka Junction ................................................................................ 119
Figure 6-40 Nashik Road railway station area ............................................................................................... 120
Figure 6-41 Railway Station Area Proposal .................................................................................................... 121
Figure 6-42 Ravivar Karanja ............................................................................................................................ 122
Figure 6-43 Nimani Chowk ................................................................................................................................. 124
Figure 6-44 Meher Chowk .................................................................................................................................. 126
Figure 6-45 Canada Corner .............................................................................................................................. 127
Figure 6-46 Circulation Pattern For Canada Corner ........................................................................................... 128
Figure 6-47 PTA Kulkarni Chowk .................................................................................................................... 129
Figure 6-48 Issues At PTA Kulkarni Chowk .......................................................................................................... 129
Figure 6-49 Vidya Vikas Junction ........................................................................................................................ 130
Figure 6-50 Jehan Circle ................................................................................................................................... 131
Figure 6-51 Ashok Stambh ............................................................................................................................... 132
Figure 6-52 Issues at Ashok Stambh ................................................................................................................... 133
Figure 6-53 Proposed intervention at Ashok Stambh .................................................................................... 134

Development of Scenarios and Urban Mobility Plan Report 6
Figure 6-54 Issues At Shivaji Chowk.................................................................................................................... 135
Figure 6-55 Vijay Mamta Signal .......................................................................................................................... 135
Figure 6-56 Upanagar Chowk ............................................................................................................................. 137
Figure 6-57 Bytco Junction ................................................................................................................................. 138
Figure 6-58 Market Yard Junction ................................................................................................................... 139
Figure 6-59 Indira Nagar Underpass ............................................................................................................... 140
Figure 6-60 Mandatory Signs .............................................................................................................................. 142
Figure 6-61 Cautionary or Warning Signs ........................................................................................................... 143
Figure 6-62 Informatory Signs ............................................................................................................................ 143
Figure 6-63 Broad Overview Of ITS ..................................................................................................................... 144
Figure 6-64 WitracC Installation ..................................................................................................................... 149
Figure 6-65 ATCS Project Junctions in Pune ................................................................................................... 150
Figure 6-66 Proposed Corridor & Junctions for ATCS .................................................................................... 151
Figure 6-67: Angular VS perpendicular parking in single and double row configurations ................................. 154
Figure 6-68: Parking signs and road marking ...................................................................................................... 155
Figure 6-69 4-BD BHALEKAR HIGH SCHOOL GROUND,OPP KALIDAS KALA MANDIR OPEN SPACE .................... 158
Figure 6-70 Chatur Sampraday Akhada .............................................................................................................. 159
Figure 6-71 CBS to shalimar ................................................................................................................................ 165
Figure 6-72 Jehan to ABB circle - part 1 ............................................................................................................. 166
Figure 6-73 Jehan to ABB circle - part 2 ............................................................................................................. 167
Figure 6-74 Jehan to ABB circle - part 3 .............................................................................................................. 168
Figure 6-75 Jehan to ABB circle - part 4 .............................................................................................................. 169
Figure 6-76 riverside - part 1 .............................................................................................................................. 170
Figure 6-77 RIVERSIDE - PART 2 .......................................................................................................................... 171
Figure 6-78 RIVERSIDE bus parking ..................................................................................................................... 172
Figure 6-79 shalimar to mahabal chowk - part 1 ................................................................................................ 173
Figure 6-80 SHALIMAR TO MAHABAL CHOWK - PART 2 ..................................................................................... 174
LIST OF TABLES
Table 2-1: Link Details of Base Year Transport Network ...................................................................................... 12
Table 2-2: Data Sources for Generation of O-D Person Trip Matrices .................................................................. 14
Table 2-3: Summary of Base Year Trips ................................................................................................................ 15
Table 2-4: Mode-wise Occupancy and PCU conversion factors ........................................................................... 17
Table 2-5: Observed Validation ............................................................................................................................ 18
Table 2-6: Trip End models – VMA ....................................................................................................................... 20
Table 2-7: Cumulative Annual Growth Rate (%) for External Trips....................................................................... 21
Table 2-8: Constants and Variables ...................................................................................................................... 21
Table 2-9 Results of Trip Distribution Model Calibration ..................................................................................... 22
Table 2-10 Results of Calibrated Mode Choice Model ......................................................................................... 23
Table 2-11 Proportion of Captive Riders in private modes .................................................................................. 24
Table 2-12 BPR Function ....................................................................................................................................... 26
Table 2-13: Synthetics Validation of Base Year Network ...................................................................................... 27
Table 2-14: V/C on Major Roads for Base Year 2016 ............................................................................................ 27
Table 2-15 Public Transport PHPDT along Major Corridors for the Base year (2016) .......................................... 28
Table 2-16: Population Projections for Nashik ..................................................................................................... 32

Development of Scenarios and Urban Mobility Plan Report 7
Table 2-17: External Trips Growth Rates .............................................................................................................. 38
Table 2-18: Travel Demand Forecast – BAU Scenario .......................................................................................... 39
Table 2-19: V/C on Major Roads for Horizon Year 2036 ....................................................................................... 39
Table 2-20 Public Transport PHPDT along Major Corridors for the Horizon year (2036) ..................................... 40
Table 2-21: Travel Demand Forecast – SUT Scenario ........................................................................................... 47
Table 2-22: V/C on Major Roads for Horizon Year 2036 ....................................................................................... 47
Table 2-23 Public Transport PHPDT along Major Corridors for the Horizon year (2036) ..................................... 48
Table 2-24: Comparison of Traffic and Travel Characteristics for various Scenarios ........................................... 49
Table 2-25 PHPDT for Public Transport for the Base year (2016) and Horizon Year (2036) ................................. 50
Table 4-1 Benchmarks .......................................................................................................................................... 55
Table 6-1 Proposed Roads for widening ............................................................................................................... 71
Table 6-2 Proposal - orr and irr Missing/new links ............................................................................................... 74
Table 6-3 links to be developed - orr .................................................................................................................... 74
Table 6-4 Proposed Footpath Roads .................................................................................................................... 78
Table 6-5 List of Proposed NMV lanes .................................................................................................................. 83
Table 6-6 Bus Routes and trips of MSRTC buses in Nashik ................................................................................... 93
Table 6-7 Route Rationalization Proposals ........................................................................................................... 93
Table 6-8 Fleet requirement over the years in nashik .......................................................................................... 93
Table 6-9 bus type vs PHPDT ................................................................................................................................ 94
Table 6-10 Location and capacity of existing bus terminals in the city ................................................................ 95
Table 6-11 SELECTION OF MASS RAPID TRANSIT ................................................................................................. 97
Table 6-12 PHPDT Values along Mobility Corridors In 2036 ................................................................................. 97
Table 6-13 Proposed MRT system in Phases ........................................................................................................ 98
Table 6-14 Feeder Route Details ........................................................................................................................ 102
Table 6-15 Land Identified For Freight Terminal ................................................................................................ 106
Table 6-16 List of Junctions with type of improvement ..................................................................................... 108
Table 6-17 junctions for geometry improvement .............................................................................................. 109
Table 6-18 PV2 analysis for various juncions in nashik ....................................................................................... 111

Development of Scenarios and Urban Mobility Plan Report 8
ABBREVIATIONS
CTTP – Comprehensive Traffic and Transportation Plan
DBOT – Design Build Operate Transfer
DEMU – Diesel Electrical Multiple Unit
ICT – International Container Terminal
ITS – Intelligent Transportation Systems
LRT-Light Rail Transit
MLCP – Multi Level Car Parking
MRT – Mass Rapid Transit
MSRTC – Maharashtra State Road Transport Corporation
NGO – Non Governmental Organization
NMC – Nashik Municipal Corporation
NMC – Nashik Municipal Corporation
NMT – Non Motorized Transport
NUTP – National Urban Transport Policy
PPP – Public Private Partnership
PT – Public Transport
SPV – Special Purpose Vehicle
TOD – Transit Oriented Development
TTMC – Traffic and Transit Management Center
UMTC – Urban Mass Transit Company Limited
UTF – Urban Transport Fund
VPC – Vehicle Parking Certificate
Development of Scenarios and Urban Mobility Plan Report 9
1. INTRODUCTION
1.1. BACKGROUND
Nashik is the third largest urban area in the state of Maharashtra covering an area of about 267.48 square kilometers (i.e. 26747.75 hectares) with a population of 1.48 million as per 2011 census. Nashik Municipal Corporation includes 25 villages out of which Vihitgaon, Vadner and Pimpalgaon Khamb are partly included. With increasing migration to urban areas, increasing population brings with it rapid motorization leading to congestion and pollution.
To alleviate the existing and future transport problems of Nashik, it is essential to develop a Comprehensive Traffic and Transport Plan that provides a long term vision and mobility solutions for the citizens of Nashik.
Nashik Municipal Corporation (NMC) is a civic body for overseeing infrastructure projects in Nashik city. NMC has awarded the project titled “Comprehensive Traffic and Transportation Plan for Nashik Municipal Corporation” to Urban Mass Transit Company Limited vide Letter No. O.No.PWD/Desk-8/69-1/2016 dated April 27, 2016. As part of the study, data collection details andanalysis were presented in the earlier report. The current report details out the Development of scenarios and urban mobility plan.
1.2. OBJECTIVE OF THE STUDY
The objective of this study is to prepare a Comprehensive Traffic and Transportation Plan for NMC for the period 2016-2036 supporting the economic growth, and providing safe, affordable and clean mobility for all the residents and tourists of Nashik, which in turn improves the quality of life.
Accordingly, the overall objective of the CTTP is to provide a long term strategy, which ensures desirable mobility, safety and accessibility to people across gender and socio-economic profiles.
1.3. ORGANIZATION OF THE REPORT
This current report is organized into 5 Sections as outlined below.
Chapter 1: Introduction
Chapter 2: Travel Demand Modelling and Forecast (Development of Scenarios)
Chapter 3: Urban Mobility Strategies
Chapter 4: Urban Mobility Plan
Chapter 5: Way Forward

2. TRAVEL DEMAND MODELLING AND FORECASTING
The main focus of the study is to develop a long-term transportation strategy for Nashik with the help of an urban transport planning model. The process of replicating the “real world” transportation system and forecasting the state of the system for the horizon year is generally referred to as Transport Demand Modeling. Often this is done by the use of advanced state of the art computer packages such as CUBE, EMME2, TRANSCAD, TRANPLAN etc. built explicitly for such purposes.
The data that would affect the travel patterns are changes in the transportation system (e.g., new roads, wider roads, Metro etc); changes in the land use (e.g., more residential development, more employment, SEZ etc.); and changing demographics (satellite towns, increasing per capita income, access to certain vehicle modes, etc.). The base network is developed in GIS using current roadway inventory data. Socio-economic data such as household size, automobile availability, employment data and other census data are also utilized.
Once the computer model, with reasonable confidence, replicates the base year i.e., existing conditions of the study area, it can then be used for forecasting purposes using altered model inputs to reflect future year conditions. By simulating roadway conditions and travel demand on those roadways, deficiencies in the system can be assessed. Potential major future network enhancements such as introduction of MRTS or land use modifications can be analyzed by this tool and its efficacy can be established at planning level. Governments around the world want to build projects which will give them the maximum utility. So they rank alternative project schemes so as to give the best value for public money. Without the help of such travel demand models it would be difficult to assess the need and utilization of each project without which policy makers will not be able to make effective decisions.
In a developing economy such as India there has been an increasing awareness that Government do not have enough money as well as land in urban areas to build roads to cater for all the demand from private transport modes such as cars and two wheelers. The emphasis now is on to build a sustainable transport infrastructure utilizing the role of alternative modes of transport especially public transport. Understanding and planning for such situations require detailed and complex models to address them properly. The models must incorporate commuter behaviour and utilize various techniques such as multinomial logit functions, stated and revealed preferences, crowd modeling for public transport, and disaggregate modeling techniques as the situation and need demands.
Over the recent years planning agencies are developing short term, medium term and long term infrastructure-cum-land use master plans for development of the cities. These plans can be made with the help of such models provided they are periodically updated to take cognizance of the changes in demographics, spatial developments and economic situation in the planning area.
This report discusses on the following key objectives of the CTTP study including,

1. Identify travel pattern of the residents of Nashik city
2. Develop and operationalize an Urban Transport Planning model using state-of-
the-art modeling techniques and software package, appropriate to the conditions
and planning needs of Nashik
2.1. PRE-MODELING ANALYSIS
2.1.1. STUDY AREA AND ITS DELINEATION
The study area comprises Nashik Municipal Corporation Area (NMC) with an area of 268 sq.km. It has been subdivided into smaller physical units, termed as Traffic Analysis Zones (TAZs) to facilitate analysis of travel demand. Consultants have chosen current demarcated wards as zones for which demographic, socio-economic and other planning data is readily available from secondary sources.
2.1.2. INTERNAL ZONES
The Nashik Municipal Corporation (NMC) Area is divided into 108 TAZs as per prevailing demarcation of wards. These wards are taken as internal zones.
2.1.3. EXTERNAL ZONES
Regions beyond the NMC have been delineated into external zones based on the catchment of the existing transport links feeding into the study area. A total of 10 external zones are considered representing the outer cordons of the study area. In summary, study area is divided into total 118 zones as shown in Figure 2-1.
FIGURE 2-1 TRAFFIC ANALYSIS ZONES NASHIK
Towards
Peth
Towards
Ozar
Towards
Girnare
Towards Gangapur
Towards
Dindori
Towards Lam
Towards
Pune
Towards
Aurangabad
Towards
Triambak
Towards Mumbai

2.1.4. PLAN PERIOD
Year 2016 is considered as Base Year. As per Terms of Reference (TOR) travel demand forecasts are to be prepared up to 2036. Therefore for the purpose of sequential planning and design of the systems, these travel demand forecasts are presented for short, medium and long -term durations i.e., for the years 2021, 2026, 2031 and 2036.
2.1.5. PREPARATION OF DATA BASE
Data required for the analysis of travel demand can be categorized into three types:
1. Planning variables
2. Transport network
3. Travel Demand and Characteristics
The base year data is summarized in the following sections:
Planning Variables
Planning variables i.e. population and employment are some of the important data required for estimating the travel demand generated at zonal level. Base year demographic data is obtained from the Census and NMC database. Zone wise employment is collated from various published reports. Compilation of zone-wise planning variables and forecast is discussed in detail in Chapter 3.
Transport Network
The transport network in the study area includes road network and public transport network. Figure 2-2 and Figure 2-3 show the base year road network and bus route map in the study area. All the characteristics of the road links are collected by network inventory and, speed and delay surveys. Link characteristics collected include length, carriageway type (divided/ undivided), type of operation (one-way/ two-way), number of lanes, average speed, capacity etc. Table 2-1 shows different types of road links in the study area and their characteristics.
TABLE 2-1: LINK DETAILS OF BASE YEAR TRANSPORT NETWORK
S. No Area Number
1 Links 2400 2 Nodes 2017 3 Centroids 118 4 Traffic Analysis Zones 108
Public Transport Network includes all roads on which public transport buses operate. Details of bus routes, frequencies, seating capacities, maximum load factor, fares have been collected and coded. In addition, in this study, Auto rickshaw is considered as an intermediate public transport and is made available on the road links. The road network

is properly connected to all zone centroids by means of dummy links. The base year transport network has about 2400 road links and 556 bus routes.
FIGURE 2-2 BASE YEAR ROAD NETWORK - 2016

FIGURE 2-3 BUS ROUTE MAP OF NASHIK - 2016
2.1.6. TRAVEL DEMAND AND CHARACTERISTICS
Various traffic surveys are conducted to assess the base year traffic and travel characteristics in the study area. Home Interview Survey is conducted to obtain the socioeconomic and travel characteristics of resident population. Outer cordon O-D and Public Transport terminal surveys are conducted to assess the intercity travel demand and its characteristics. Details of Field surveys and analysis were presented in earlier report.
2.1.7. GENERATION OF O-D PERSON-TRIP MATRICES AND CALIBRATION
Using the zonal expansion factors, O-D trip matrices have been generated for the intra-city and inter-city trips by mode using the data source as presented in Table 2-2.
TABLE 2-2: DATA SOURCES FOR GENERATION OF O-D PERSON TRIP MATRICES
Intra/Intercity Trips Category Data Source
Intra-city Trips Home based trips HIS
Non-home based trips HIS (Supplemented by O-D surveys at terminals)
Inter-city Trips Internal – External Outer Cordon O-D surveys (Supplemented by HIS and O-D surveys at Terminals)
External – Internal Outer Cordon O-D surveys (Supplemented by HIS and O-

Intra/Intercity Trips Category Data Source
D surveys at Terminals)
External – External Outer Cordon O-D surveys
These trips were assigned on to the transport network and calibrated by validating the outer cordon and screen line counts. Table 2-3 summarizes the trips obtained from calibrated matrices. The procedure adopted to obtain validated O-D matrices is shown as a flow chart in Figure 2-4.
TABLE 2-3: SUMMARY OF BASE YEAR TRIPS
Mode I-I I-E E-I E-E Total
Walk Trips 671173 2152 2014 0 675339
% share 99.4 0.3 0.3 0 100
Car Trips 115936 51643 53865 5720 227163
% share 51 22.7 23.7 2.5 100
2-W Trips 861599 39145 41958 4682 947386
% share 90.9 4.1 4.4 0.5 100
Auto Trips 468631 8262 8223 592 485707
% share 96.5 1.7 1.7 0.1 100
Bus Trips 198153 59994 58052 12262 328461
% share 60.3 18.3 17.7 3.7 100
Cycle Trips 61602 564 589 50 62805
% share 98.1 0.9 0.9 0.1 100
Total 2377094 161761 164700 23305 2726861

FIGURE 2-4 PROCEDURES FOR CALIBRATION OF BASE YEAR MATRICES
2.1.8. OBSERVED VALIDATION
The observed highway and public transport matrices were assigned on the base year network. The assigned traffic volume has been compared with the observed traffic counts on screen lines. The assignment is carried out in two stages with assignment of Transit trips followed the Highway PCU Assignment.
Initially commercial vehicles and NMT are taken as pre loads. The transit assignment is the assignment of commuters on a Public Transit Network which comprises buses that are linked on to the zonal system via walk links.
Highway assignment is the assignment of vehicles on roads.
Highway Assignment
A user-equilibrium multi-modal assignment procedure based on travel time was used for loading matrices in PCU values.

The mode wise trip matrices developed from the primary surveys have been converted into PCUs by applying the equivalent passenger conversion factors. The occupancy and PCUs considered for different modes are presented in Table 2-4.
TABLE 2-4: MODE-WISE OCCUPANCY AND PCU CONVERSION FACTORS
Private Vehicles & IPT,PT Modes Occupancy PCU Values
2 wheeler 1.60 0.75
Car 2.67 1.00
Auto 3.20 1.18
BUS 36.39 2.70
Cycle 1.00 0.45
Commercial Vehicles LCV, Truck, MAV 2.94
Goods vehicle and NMT matrices developed from the road side interview matrix and Household interview were converted into peak hour PCU units and were pre-loaded on the highway network. Private vehicles were assigned on to the network after transit assignment.
Public Transit Assignment
Transit assignment estimates the passenger ridership volumes on individual transit routes and respective segments. The public transport assignment process initially enumerates and evaluate the “reasonable” or “attractive” multiple discrete routes between zones, considering:
Number of transfers
The margin of cost over the minimum cost route
Non transit and in-vehicle costs
Boarding and transfer penalties by mode
Waiting time, derived from the combined frequency of services at stop nodes
Fares
The demand will be loaded in the form of trips between zone pairs using multipath procedure based on PT Comp cost. The components of PT Comp cost are in-vehicle travel time (IVTT), waiting time (WT), access/egress time, transfer time (TR), and fare (all in cost units).
PT Comp Cost = Fare/ VOT + Initial wait time + IVTT + Walk time (Access) + Transfer Time + Walk time (Egress).
The assigned flows along screen lines and cordons for peak period have been compared with observed flows and the results are presented in Table 2-5. From the results, it is found that all the assigned values for screen lines/cordons are found within the acceptable limit of +-15%.
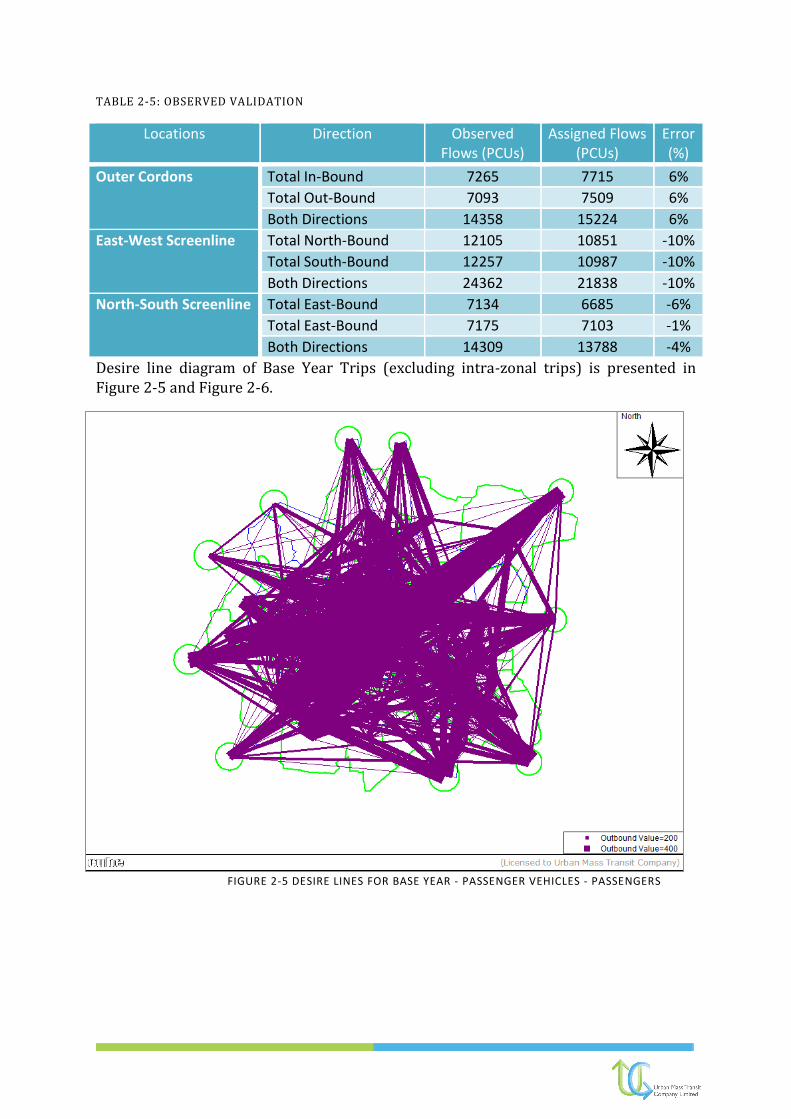
TABLE 2-5: OBSERVED VALIDATION
Locations Direction Observed Flows (PCUs)
Assigned Flows (PCUs)
Error (%)
Outer Cordons Total In-Bound 7265 7715 6%
Total Out-Bound 7093 7509 6%
Both Directions 14358 15224 6%
East-West Screenline Total North-Bound 12105 10851 -10%
Total South-Bound 12257 10987 -10%
Both Directions 24362 21838 -10%
North-South Screenline Total East-Bound 7134 6685 -6%
Total East-Bound 7175 7103 -1%
Both Directions 14309 13788 -4%
Desire line diagram of Base Year Trips (excluding intra-zonal trips) is presented in Figure 2-5 and Figure 2-6.
FIGURE 2-5 DESIRE LINES FOR BASE YEAR - PASSENGER VEHICLES - PASSENGERS
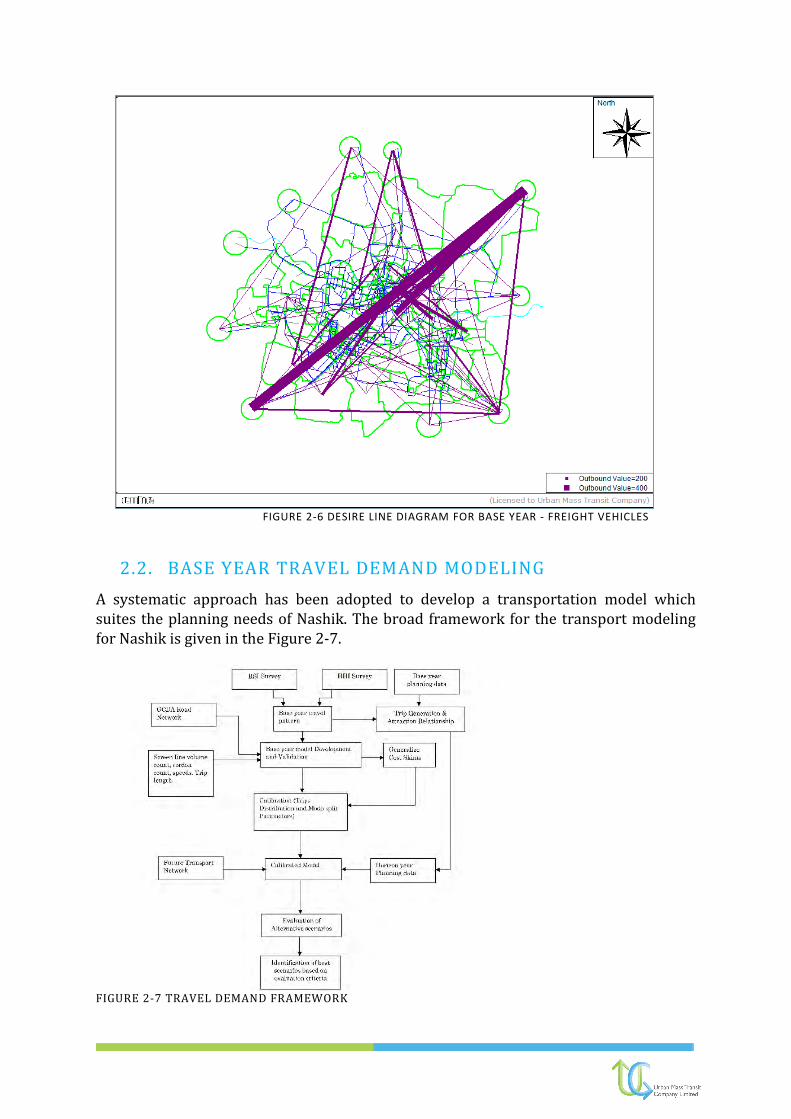
FIGURE 2-6 DESIRE LINE DIAGRAM FOR BASE YEAR - FREIGHT VEHICLES
2.2. BASE YEAR TRAVEL DEMAND MODELING
A systematic approach has been adopted to develop a transportation model which suites the planning needs of Nashik. The broad framework for the transport modeling for Nashik is given in the Figure 2-7.
FIGURE 2-7 TRAVEL DEMAND FRAMEWORK

The general four-step modeling framework has been adopted for Nashik Urban Travel Demand Model. The model developed is a four stage transportation model including, trip generation, trip distribution, mode choice and assignment. Each of these stages basically is a set of mathematical equations. Calibration involves estimating the values of various constants and parameters for each of these stages of the model structure. Estimating model coefficients and constants is usually done by solving the model equation for the parameters of interest after supplying observed values of both the dependent and independent variables. The observed values of variables are obtained from the surveys of actual travel patterns. Details of Various traffic surveys are discussed previously in Interim Report. The estimation process is a trial and error effort that seeks the parameter values which have the greatest probability or maximum likelihood of being accurate within acceptable tolerance of error.
Once satisfactory estimates of the parameters for all models have been obtained, the models must be checked to assure that they adequately perform the functions for which they are intended. This is usually done by (process called validation) assigning the developed matrices on the network and checking the assigned flows across the screen line/cordon against the observed count. Few other parameters that will be compared include trip length distribution, journey time, and mode share. This process will establish the credibility of the model by demonstrating its ability to replicate actual traffic patterns.
The four stage transportation /land use model is a sequential procedure.
1. Trip Generation – estimating number of origins and destinations for each zone.
2. Trip Distribution – attaching the origins and destinations for each trip to
complete trips.
3. Mode Choice – determining the mode of travel for each trip (Private, PT, IPT and
NMT).
4. Assignment – establishing routes and transit paths.
2.2.1. TRIP GENERATION
Trip ends of internal trips for the base year (2016) are calculated from the validated O-D matrices. Trip generation models were built to forecast the number of person trips that will begin from or end in each travel analysis zone with in the region for a typical day of the target year. Trip end models are developed using stepwise multiple linear regression technique. The explanatory variables include Population and Employment which play a major role in developing the equations. The Trip generation models developed for this study is presented in Table 2-6.
TABLE 2-6: TRIP END MODELS – VMA
Trip Type Productions Model R 2 value
F test value
T test Value
Trip Productions 1.23 * Population + 472.08 * Area (sq.km) 0.85 306 18.49

Trip Type Productions Model R 2 value
F test value
T test Value
Trip Attractions 1.37 * Employment + 14770.02 0.73 285 16.88
It can be observed that t-values are significant for developed coefficients.
2.2.2. GROWTH FACTORS FOR EXTERNAL TRIPS
Based on the past growth of traffic at the external cordon points, following traffic growth rates have been assumed for the external trips and are presented in Table 2-7.
TABLE 2-7: CUMULATIVE ANNUAL GROWTH RATE (%) FOR EXTERNAL TRIPS
Year Passenger Trips Goods
2016-2021 4.0% 6.0%
2021-2031 3.5% 5.5%
2031-2036 3.0% 5.0%
2.2.3. TRIP DISTRIBUTION MODEL FOR INTRA-CITY TRIPS
A gravity type trip distribution model of the following form is calibrated to represent base year travel pattern for the study area.
Tij =Ai Oi Bj Dj Fij
Fij = k Cbije – cCij
(Calibrated Parameters: b = - 0.02; c = 0.12; k = adjustment factor)
TABLE 2-8: CONSTANTS AND VARIABLES
Constants and Variables
O Trip Productions D Trip Attractions
A & B Balancing factors F Deterrence Function
C Impedance between zones E Euler’s Number
This gravity model is calibrated on the intra-city trips performed by the residents of the study area using zone to zone shortest time matrix generated by computer program. Friction Factors were calibrated for obtaining least error between observed and estimated trip lengths. Maximum likelihood method of calibration is used in order to estimate the friction factor. Iterative procedure has been used to calibrate the friction factors for each trip length range. Table 2-9 gives the results for calibration of the gravity type trip distribution model.

TABLE 2-9 RESULTS OF TRIP DISTRIBUTION MODEL CALIBRATION
Trip Distribution Avg. Travel Time (min)
Error (%)
Estimated Mean Trip Length (Excluding Intra-Zonal) 12.5 1.6
Observed Mean Trip Length (Excluding Intra-Zonal) 12.7
Figure 2-8 gives the travel time distributions for the observed trips. As modelled no. of trips increases initially with travel time and then decreased gradually. A coincidence ratio of 93% was achieved between observed and modelled trip distribution.
FIGURE 2-8 TRAVEL TIME DISTRIBUTION CURVE
2.2.4. MODE CHOICE MODEL FOR INTRA-CITY TRIPS
A multinomial mode choice model of the following form had been developed in order to split the trips among the modes, car, two wheeler, auto, public transport, cycle and walk.
Where,
Pj = probability of choosing mode j,

Vj = deterministic component of utility for mode j
j and l are indices for modes
The cost skims that are obtained in the assignment are used to calibrate the mode choice model. From the home interview survey data a choice based sample is produced containing information on the mode chosen, vehicle ownership, travel time and travel cost for each individual. The information on the alternate modes, i.e., travel time and travel cost available to him, are generated from the time and cost skims obtained in public transport and highway assignment procedures. The results of calibration of the above mode choice model are given in Table 2-10. The utility functions calibrated for the modes car, two-wheeler, auto and public transport are listed below.
VCar = 0.0012*(TRAVEL DISTANCE *{VOC_TW})-0.0031*(TRAVEL TIME *{VOT_TW}))
VTW = 0.0445*(TRAVEL DISTANCE *{VOC_CAR})-0.2027*(TRAVEL TIME*{VOT_CAR}))
VAuto = -0.0190*(15+TRAVEL DISTANCE*1.66+{VOT_AUTO}* TRAVEL TIME)
VPT = -0.1228*BUS TIME-0.0799*WAIT TIME+0.3608*BUS DISTANCE
VCycle = -0.3376 * TRAVEL TIME
VWalk = - 0.0124 * WALK TIME
TABLE 2-10 RESULTS OF CALIBRATED MODE CHOICE MODEL
Mode Observed Trips
Modelled Trips
Observed Share
Modelled Share
% Error
Walk 288844 280319 15.9% 15.8% -3.0%
Car 105315 105358 5.8% 6.0% 0.0%
2-Wheeler 767710 745277 42.1% 42.1% -2.9%
Auto-Rickshaw
426815 383291 23.4% 21.7% -10.2%
Bus 188881 207376 10.4% 11.7% 9.8%
Cycle 44592 48484 2.4% 2.7% 8.7%
Total 1822158 1770106 100.0% 100.0% -2.9%
Following are the mode wise characteristics considered in the model:
Mode VOC (Rs. Per Km) VOT (Rs. Per Hr)
2- Wheeler 2.70 72.3
Car 6.06 103.4
Auto - 58.0
Bus - 57.8
The above mode choice model is applicable only to the choice riders, i.e., the individuals to whom atleast car or two-wheeler is available. The individuals who do not own any car/two-wheeler or do not have license are captive to private mode/public transport.

Number of captive trips by each mode is determined initially from household survey, then proportion of choice riders by mode is determined. These trips are modelled through an incremental logit model. To obtain the total split for a particular mode the captive part trips as well as choice riders trips are added for that mode.
In Nashik, overall 68% of the persons are choice riders i.e atleast one vehicle is available to them (i.e. Two Wheeler, Car) and 32% of the persons are captive to private mode/public transport. In order to see the validity of the above model, the utilities for all the modes are calculated using the travel time and travel cost skims obtained from public transport and highway assignment. The probability of choosing each mode is then worked out for each cell of the OD matrix of intra-city trips made by residents. These probabilities need to be applied only to the choice riders in order to get the exact number of trips by car, two-wheeler, auto and public transport. The proportion of captive riders for PVT, PT and NMT are estimated from household survey and is tabulated in Table 2-11.
About 46% of Captive riders are using PT. The proportion of two wheeler and car in private captive riders calculated for Base year and Horizon years and is presented in Table 2-11.
TABLE 2-11 PROPORTION OF CAPTIVE RIDERS IN PRIVATE MODES
Year 2-Wheeler Car
2016 86% 14%
2021 85% 15%
2026 84% 16%
2031 83% 17%
2036 82% 18%
An Incremental logit model has been used for Modal split of captive riders. This model forecasts the change in demand based on change in cost from the known base situation. Initially total trips are split into motorised trips and non-motorised trips. Motorised trips are split into private trips (Car & 2-Wheeler) and public transport trips (i.e. Bus and Auto). In the next step private vehicles and public transport has been split. Non-motorised trips are split into Walk and Cycle. The procedure adopted is presented below:
The model inputs are base demand by mode (DPvt, DPt), base costs by mode (CPvt, CPt) and forecast costs by mode (C’Pvt, C’Pt). The change in cost is denoted by DCPvt and DCPt where:
△CPvt =C’Pvt- CPvt
△CPt =C’Pt- CPt
Base probabilities are denoted by PPvt and PPt where:

The choice model now takes the form of the equation below where P’ denotes the forecast choice probability and λ is the scale parameter.
D’Pvt =( D’Pvt + D’Pt ) P’Pvt
D’Pt =( D’Pvt + D’Pt ) P’Pt
The incremental composite cost (DC) is given by:
2.2.5. COMMERCIAL VEHICLE (CV) MATRIX ESTIMATION
Base year CV matrix has been estimated from link counts. Daily directional volumes of commercial vehicles are available on links within the study area at the external cordon (from the primary traffic surveys). These links are spread all over the study area. Using the Analyst module of Cube, which works on the principle of entropy maximisation, a reasonable estimate of the daily CV matrix is obtained. The total number of commercial vehicles estimated using Analyst program is 40,752 PCUs. The program uses the paths that are built during highway assignment, the observed link volumes of commercial vehicles, seed matrix and the associate confidence levels for the link volumes. During the estimation process the links on which CVs are not allowed are switched off to get a realistic estimation of the CV matrix. It reproduced the observed link volumes when assigned on to the highway network. The future CV matrices are obtained by applying appropriate growth factors and by furnessing.
2.2.6. TRIP ASSIGNMENT
Trip assignment was carried using calibrated BPR functions which will be used for calculating the congested travel time and costs. These functions were developed using speed and delay data on the network for peak periods. These functions were developed for each category of road and were calibrated.
The form of the BPR function is
TC =T0 *(1+α *(v/c) ^β)
Where
Tc – Congested Link Travel time
T0 – Link Free flow time
V – Link Volumes
C – Link Capacity
α and β – Calibrated Parameters
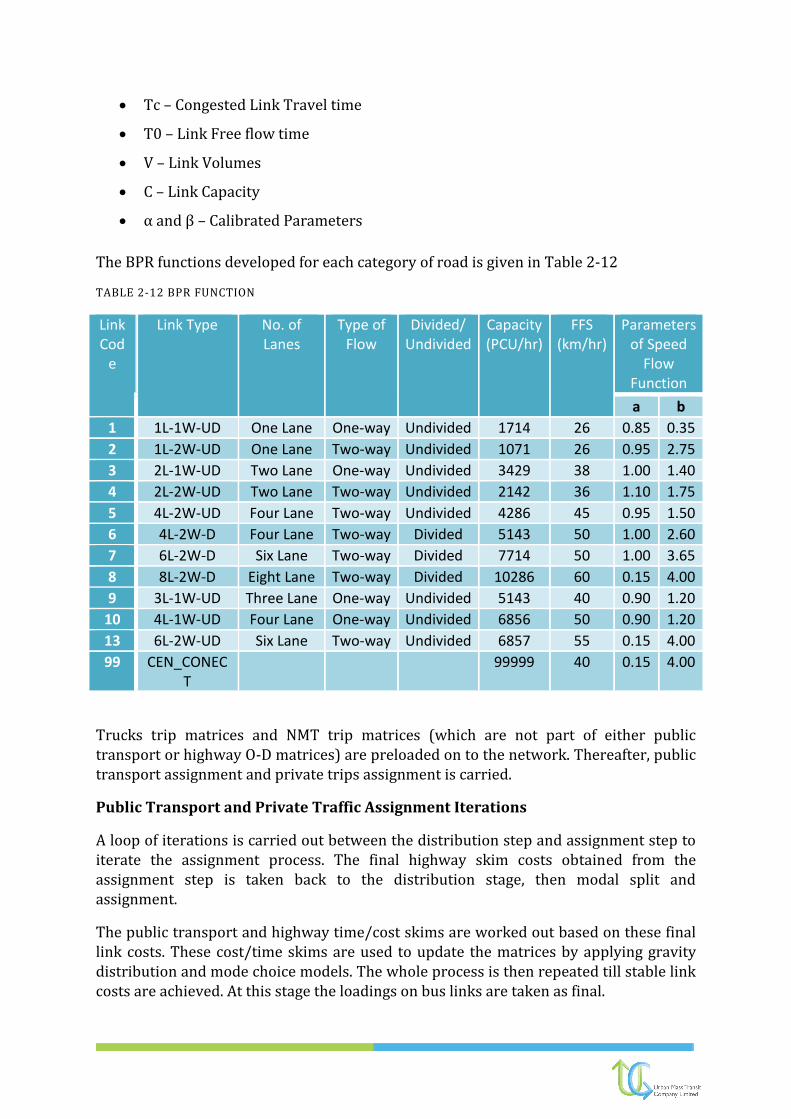
The BPR functions developed for each category of road is given in Table 2-12
TABLE 2-12 BPR FUNCTION
Link Cod
e
Link Type No. of Lanes
Type of Flow
Divided/ Undivided
Capacity (PCU/hr)
FFS (km/hr)
Parameters of Speed
Flow Function
a b
1 1L-1W-UD One Lane One-way Undivided 1714 26 0.85 0.35
2 1L-2W-UD One Lane Two-way Undivided 1071 26 0.95 2.75
3 2L-1W-UD Two Lane One-way Undivided 3429 38 1.00 1.40
4 2L-2W-UD Two Lane Two-way Undivided 2142 36 1.10 1.75
5 4L-2W-UD Four Lane Two-way Undivided 4286 45 0.95 1.50
6 4L-2W-D Four Lane Two-way Divided 5143 50 1.00 2.60
7 6L-2W-D Six Lane Two-way Divided 7714 50 1.00 3.65
8 8L-2W-D Eight Lane Two-way Divided 10286 60 0.15 4.00
9 3L-1W-UD Three Lane One-way Undivided 5143 40 0.90 1.20
10 4L-1W-UD Four Lane One-way Undivided 6856 50 0.90 1.20
13 6L-2W-UD Six Lane Two-way Undivided 6857 55 0.15 4.00
99 CEN_CONECT
99999 40 0.15 4.00
Trucks trip matrices and NMT trip matrices (which are not part of either public transport or highway O-D matrices) are preloaded on to the network. Thereafter, public transport assignment and private trips assignment is carried.
Public Transport and Private Traffic Assignment Iterations
A loop of iterations is carried out between the distribution step and assignment step to iterate the assignment process. The final highway skim costs obtained from the assignment step is taken back to the distribution stage, then modal split and assignment.
The public transport and highway time/cost skims are worked out based on these final link costs. These cost/time skims are used to update the matrices by applying gravity distribution and mode choice models. The whole process is then repeated till stable link costs are achieved. At this stage the loadings on bus links are taken as final.

2.2.7. CALIBRATION AND VALIDATION OF BASE YEAR NETWORK
Base year network has been calibrated and validated for the observed counts at Screen line locations and cordon locations. It has been observed that the error between the observed and modelled flows at screen lines and cordon locations are within +/- 15% and validation results are presented in Table 2-13. Hence the base year network is validated.
TABLE 2-13: SYNTHETICS VALIDATION OF BASE YEAR NETWORK
Locations Direction Observed Flows (PCUs)
Assigned Flows (PCUs)
Error (%)
Outer Cordons Total In-Bound 7265 7753 7%
Total Out-Bound 7093 7531 6%
Both Directions 14358 15284 6%
East-West Screenline Total North-Bound 12105 10453 -14%
Total South-Bound 12257 10435 -15%
Both Directions 24362 20889 -14%
North-South Screenline Total East-Bound 7134 7095 -1%
Total East-Bound 7175 8176 14%
Both Directions 14309 15272 7%
2.2.8. BASE YEAR MODEL RESULTS
Base year model stands validated and V/C ratios on some of the major roads have been compiled and presented in Table 2-14. Link flow diagram is presented in Figure 2-9.
TABLE 2-14: V/C ON MAJOR ROADS FOR BASE YEAR 2016
S. No Name of the Road V/C Ratio
1 Aurangabad Road 0.45
2 Jail Road 0.61
3 Kamathwade-Trimurti Chowk Link Road 0.93
4 Lam Road 0.57
6 Nashik-Mumbai Highway 0.26
7 Nashik-Pune Road 0.74
8 Old Agra Road 0.51
9 Panchvati Karanja Road 0.54
10 Panchvati Road 0.83
11 Peth Road 0.47
12 Trimbak Road 0.76
13 Untawadi Road 0.71
14 Dindori Road 0.65
Inferences:
It has been observed that 12% of the existing road network has V/C greater
than 0.7

Some of the major roads which require immediate attention are
Kamathwade-Trimurti Chowk Link Road and Panchvati Road.
FIGURE 2-9: V/C RATIO FOR BASE YEAR (2016)
2.2.9. PHPDT ON MAJOR CORRIDORS
The PHPDT numbers of the public transport on major corridors were estimated for base year using the model and have been summarized in Table 2-25. Public Transport PHPDT flow diagram is presented in Figure 2-9.
TABLE 2-15 PUBLIC TRANSPORT PHPDT ALONG MAJOR CORRIDORS FOR THE BASE YEAR (2016)
Corridor No. Corridor Description PT PHPDT
1 Old Agra Road 5218
2 Nashik-Pune Road 4262
3 Nashik-Mumbai Highway 3045
4 Trimbak Road 3387
5 Panchvati Road 2631
6 Dindori Road 3313
7 Panchvati Karanja Road 3049
8 Aurangabad Road 2108

FIGURE 2-10 PT PHPDT FOR BASE YEAR (2016)
2.3. BUSINESS AS USUAL SCENARIO
A development plan was prepared for Nashik in the year 2016 considering the future developments. Hence, for the purpose of study, zonal development plan was considered along with consultations to assess future development directions and required transport network. Considering the various transportation improvements consultants have arrived at 2 scenarios for horizon year modelling as per RFP. They are:
1. Business As Usual (Current Scenario+ Committed Projects) Scenario
2. Sustainable (BAU + Proposed Projects + Transit Oriented Development)
Scenario
The present scenario represents the future based on the continuation of past trends and is often used as a reference point or benchmark for assessing the need for policy interventions. The BAU scenario extrapolates existing trends and assumes no radical policy interventions for sustainable development and emission mitigations. Future transport demand is based on the preferences of different socio- economic groups in the base year. In terms of passenger transport, the BAU Scenario predicts increased car ownership and higher demand for motorization.

2.3.1. SOCIO-ECONOMIC TRANSITIONS
The urban transport model that has been developed for Nashik was used to predict the travel characteristics for the horizon year under various transport network scenarios and land use. The model outputs will be used to identify the imbalance in the transportation systems against the growing demand in the traffic. This process will lead to the major requirement of the study i.e. to develop medium and long term strategies to tackle the transportation issues for the coming twenty years.
2.3.2. WORK FORCE PARTICIPATION RATE OF NASHIK
From the census, total work force in the NMC area is 6.18 Lakhs, which constitutes 35.4% of the total population. Figure 14 represents the distribution of worker population within the administrative divisions of NMC. It could be observed from the figure that there is low density of worker population within the core area of Nashik and high density of worker population in the peripheral areas of the city, especially in the areas such as etc. This essentially means that the people reside in the peripheral areas of the city and travel to the city for various purposes on a day to day basis.
2.3.3. POPULATION PROJECTIONS
Population projections are carried out by various methods to identify the most appropriate method for projecting the future population. The various methods considered are Arithmetic Increase method, Geometric Increase Method, Incremental Increase Method and Component Method. All the methods are explained and projections by each method are presented below.
Arithmetic Increase Method
This method is based on the assumption that the population is increasing at a constant rate, i.e. the rate of change of population with time is constant. From the population data for the last 4 to 5 decades, the average increase per decade is calculated which is then used as the design rate of increase for calculating the design population. This method is of limited value and may be useful for smaller design periods for old and very large cities with no industries and which have practically reached their maximum development. For developing areas, which develop faster than the past, this method is likely to give low results.
Geometric Increase Method
In this method, it is assumed that the percentage increase in population from decade remains constant. Therefore, the average value of the percentage increase is calculated and the future populations are calculated at this rate. For a young city, which at present is expanding at a faster rate, this method may give very high results and is useful for old developed cities.

Incremental Increase Method
In this method the average increase per decade is found out. The average incremental increase for each decade is also found out. The future population is calculated from the average increase and average incremental increase of population. This method is a combination of the above two methods and therefore gives the advantages of both and hence gives satisfactory results.
Exponential Growth Method
Exponential growth method is applied for limited regions, where unbounded growth is not physically realistic. Exponential growth method uses when growth of population is proportional to current population. In this method the population growth rate measures the change in the number of individuals in a population over a specified length of time. Population growth can be shaped by a variety of factors, and so population biologists have developed different mathematical expressions, or models, to describe population growth rate.
Exponential population growth model is unrealistic, because in the exponential model, the per capita growth rate is independent of population size (density independent). However, this is unlikely because both per capita birth rate and per capita death rate are expected to change with population size (they are density dependent).
Component Method
The component method uses the components of demographic change to project population growth. In this method, it is assumed that the percentage increase in population from decade is found out and growth of population age groups, sex, ethnicity, fertility, mortality and migration are also found. The same is used and the future populations are calculated at this rate. This is a universally accepted method of making population projections because of the fact that the growth of population is determined by fertility, mortality and migration rates. Hence this method gives satisfactory results.
Population forecast for Nashik Municipal Corporation area
Year Population Decadal Growth (%) CAGR (%)
1991 7,33,000
2001 10,77,236 46.96 3.9
2011 14,86,053 37.95 3.3
According to census the population since 1991 to 2011 is increasing constantly at an average decadal growth rate around 3.6%. Considering the present stature of NMC, future developments, magnitude of migrating population and educational centres etc., this observed historical trend may misguide in estimating the future years population. Considering the optimistic scenario and also the different population projection methods, Population for the horizon year is calculated and the same is presented in Table 2-16.
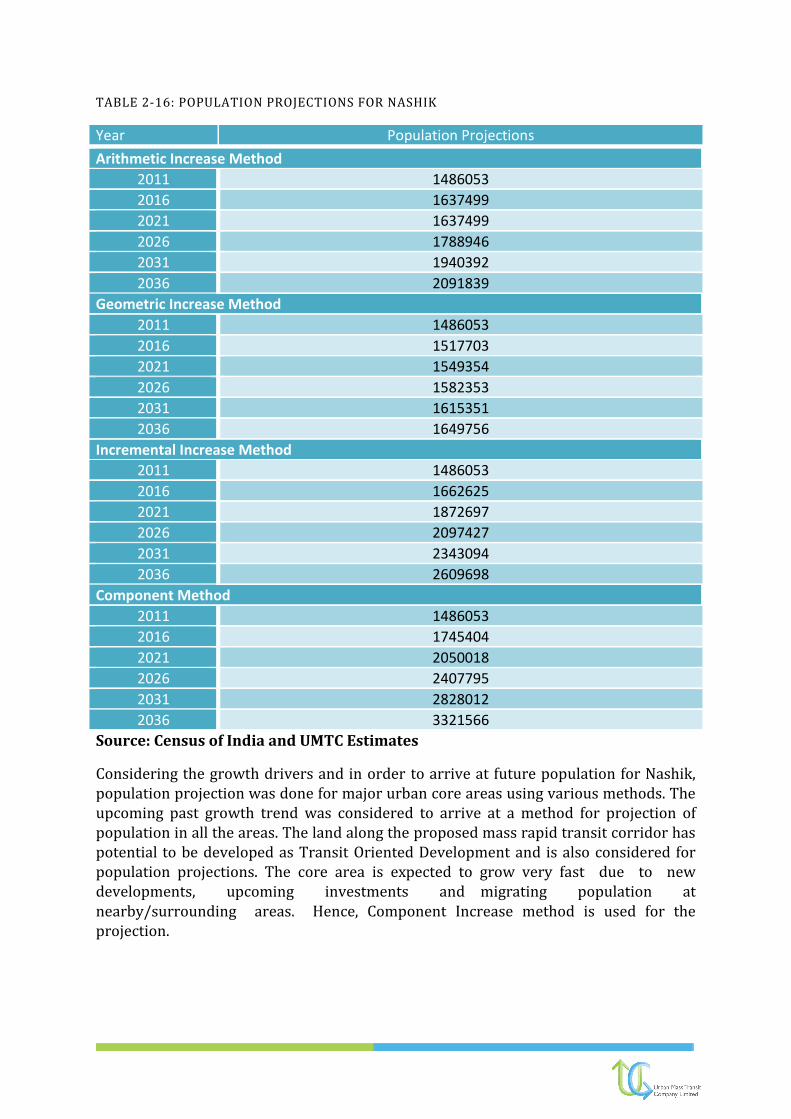
TABLE 2-16: POPULATION PROJECTIONS FOR NASHIK
Year Population Projections
Arithmetic Increase Method
2011 1486053
2016 1637499
2021 1637499
2026 1788946
2031 1940392
2036 2091839
Geometric Increase Method
2011 1486053
2016 1517703
2021 1549354
2026 1582353
2031 1615351
2036 1649756
Incremental Increase Method
2011 1486053
2016 1662625
2021 1872697
2026 2097427
2031 2343094
2036 2609698
Component Method
2011 1486053
2016 1745404
2021 2050018
2026 2407795
2031 2828012
2036 3321566
Source: Census of India and UMTC Estimates
Considering the growth drivers and in order to arrive at future population for Nashik, population projection was done for major urban core areas using various methods. The upcoming past growth trend was considered to arrive at a method for projection of population in all the areas. The land along the proposed mass rapid transit corridor has potential to be developed as Transit Oriented Development and is also considered for population projections. The core area is expected to grow very fast due to new developments, upcoming investments and migrating population at nearby/surrounding areas. Hence, Component Increase method is used for the projection.

2.3.4. LAND USE IN TRAVEL DEMAND MODEL
The proposed land use used in Travel demand model to estimate the trip generation is shown in the Figure 2-12. TAZ wise proposed population and employment is extracted based on the proposed land use and is used in the model. Population and employment density for base year and horizon years is shown in FIGURE 2-13. Based on the calibrated models, the future travel demand is estimated.
The following forecast assumptions were used in the model. The various assumptions in the forecast model are:
Planning period: The projection has been done for the year 2021, 2026, 2031 and 2036.
Vehicle Operating Cost will grow at 2% points below inflation (to take in to account the efficiency due to improved vehicle technology)
Value of Time will grow at +6.8% /annum (in line with per capita income growth) in real terms.
FIGURE 2-11 BASE YEAR LANDUSE (2016)

FIGURE 2-12 HORIZON YEAR LANDUSE (2036)

FIGURE 2-13: DISTRIBUTION OF POPULATION DENSITY FOR BASE AND HORIZON YEARS (2016-2036) IN BAU SCENARIO

FIGURE 2-14: DISTRIBUTION OF EMPLOYMENT DENSITY FOR BASE AND HORIZON YEARS (2016-2036) IN BAU SCENARIO

2.3.5. NETWORK SCENARIO
Business As Usual Scenario corresponds to addition of committed projects. Following projects were considered for horizon years proposed by Public Works Department and NHAI.
Provision of Entry/Entry points to Mumbai-Agra Flyover and also
extension of flyover towards Ozar road.
Development of PWD Ring Road around Nashik Municipal Corporation –
Length – 131km.
2.3.6. INTERNAL TRAVEL DEMAND ESTIMATION
The trip ends for the horizon year 2021, 2026, 2031 and 2036 were obtained for total travel using the calibrated trip end models. Trips are then split between the modes (Car, Two Wheeler, IPT and Public Transport) using the combined distribution and mode choice model. The horizon year trip distribution is different for alternative network scenarios due to different inter-zonal generalized cost. Thus, for each of the future networks and development scenarios peak passenger trip matrices were developed by an iterative mechanism considering the interaction between distribution, modal split and assignment stages. Desire line diagram of Horizon Year Trips (excluding intra-zonal trips) is presented in Figure 2-15 and Figure 2-16.
FIGURE 2-15 DESIRE LINES FOR HORIZON YEAR TRIPS-PASSENGER TRIPS

FIGURE 2-16: DESIRE LINE DIAGRAM FOR HORIZON YEAR-GOODS PCUS
2.3.7. EXTERNAL TRIPS
The outer cordon road side interviews of the present study have been utilized for the purpose of modelling external trips. In order to project the external trips for horizon year, the growth factors were established for each of the external zones based on secondary sources. Conventional Furness technique has been employed for developing the mode wise forecast matrices. Following growth rates were considered for external trips.
TABLE 2-17: EXTERNAL TRIPS GROWTH RATES
Year Passenger Trips Goods Vehicles
2016-2021 4.00% 6.00%
2021-2031 3.50% 5.50%
2031-2036 3.00% 5.00%
2.3.8. TRAVEL DEMAND FORECAST
By adopting the forecast assumptions detailed above and with the help of the urban model developed for the study area, travel demand has been estimated. Calibrated

model has been used to estimate the demand for the horizon years 2021, 2026, 2031 and 2036. The travel demand and projected mode share is presented in Table 2-18.
TABLE 2-18: TRAVEL DEMAND FORECAST – BAU SCENARIO
Trips % Share Walk 2016 2021 2026 2031 2036 2016 2021 2026 2031 2036
Car 280319 258549 270263 323982 439501 15.8% 12.5% 11.2% 11.5% 13.4%
2 w 105358 130864 162544 201894 250770 6.0% 6.3% 6.7% 7.2% 7.6%
Auto 745277 947251 1183173 1465343 1773889 42.1% 45.9% 49.1% 52.1% 53.9%
PT 383291 449427 492473 498902 481217 21.7% 21.8% 20.5% 17.7% 14.6%
Cycle 207376 228141 248278 268328 284232 11.7% 11.1% 10.3% 9.5% 8.6%
Total 48484 49296 51443 54529 58817 2.7% 2.4% 2.1% 1.9% 1.8%
1770106 2063528 2408174 2812978 3288427 100.0% 100.0% 100.0% 100.0% 100.0%
2.3.9. OUTCOMES OF BAU SCENARIO
Traffic and V/C ratios on some of the major roads for horizon year 2036 have been compiled and presented in Table 2-14. Link flow diagram is presented in Figure 2-9.
TABLE 2-19: V/C ON MAJOR ROADS FOR HORIZON YEAR 2036
S. No Name of the Road V/C Ratio
1 Aurangabad Road 1.07
2 Jail Road 1.23
3 Kamathwade-Trimurti Chowk Link Road 1.54
4 Lam Road 1.36
6 Nashik-Mumbai Highway 1.41
7 Nashik-Pune Road 0.52
8 Old Agra Road 1.28
9 Panchvati Karanja Road 1.10
10 Panchvati Road 1.13
11 Peth Road 1.83
12 Trimbak Road 1.04
13 Untawadi Road 1.38
14 Dindori Road 1.15
It is observed that about 57% of the existing road network will have V/C greater than 0.7.
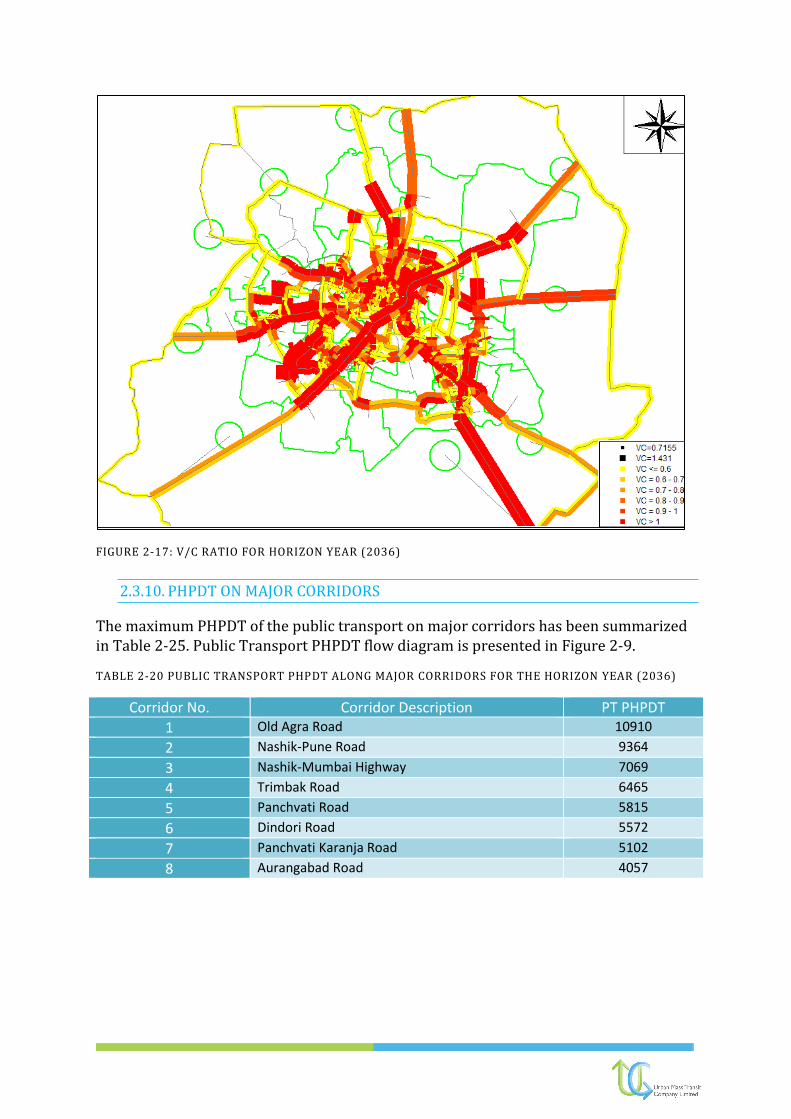
FIGURE 2-17: V/C RATIO FOR HORIZON YEAR (2036)
2.3.10. PHPDT ON MAJOR CORRIDORS
The maximum PHPDT of the public transport on major corridors has been summarized in Table 2-25. Public Transport PHPDT flow diagram is presented in Figure 2-9.
TABLE 2-20 PUBLIC TRANSPORT PHPDT ALONG MAJOR CORRIDORS FOR THE HORIZON YEAR (2036)
Corridor No. Corridor Description PT PHPDT
1 Old Agra Road 10910
2 Nashik-Pune Road 9364
3 Nashik-Mumbai Highway 7069
4 Trimbak Road 6465
5 Panchvati Road 5815
6 Dindori Road 5572
7 Panchvati Karanja Road 5102
8 Aurangabad Road 4057

FIGURE 2-18: PT PHPDT FOR HORIZON YEAR (2036)
2.4. SUSTAINABLE URBAN TRANSPORT SCENARIO
The proposals based on BAU scenario illustrates more of road widening which encourages private trips and reduces the share of public transport from 11.7% to 8.6%. As per Ministry of Urban Development guidelines and RFP, a sustainable scenario has to be considered to optimize the infrastructure requirement and encourage public transport/non-motorised modes. Hence, a Sustainable scenario has been developed for achieving following goals.
Improve Public Transport (PT) modes: Provision of dedicated lanes/ROW for public transport modes
Improve Public Transport (PT) accessibility: Densification along major public transport corridors and integration with feeder services
Improve Non-Motorized Transport (NMT) modes: Provision of cycle tracks and footpath facilities improving safety
Reduce private motorized trips: Reduce private motorized trips and fatalities per year through Congestion Pricing
Pollution Reduction: Encouraging low carbon emission modes by providing Public Bicycle Sharing schemes and incentive and taxation for highly polluted private vehicles.
In this scenario, following proposals have been prioritized and considered based on the outputs of BAU and secondary reports (i.e. MRT feasibility report, Development plan, CMP, etc.). These proposals have been evaluated in the calibrated travel demand model.
Transit Oriented Development along mobility corridors
Augmentation of buses
Development of mass transit corridors
Development of inner ring road and outer ring road
Development of other roads that have been identified based on specific purpose (i.e. missing links, Hierarchy road system, part of public transit corridor)
2.4.1. LAND USE IN TRAVEL DEMAND MODEL
The land use scenario considered, involves distribution of population and employment based on appropriate weightages given to factors such as availability of land for development and accessibility by various modes of transit and transport. This approach is termed as land use and transport scenario. The land use/transport based approach is based on the underlying principle that the spatial distribution of additional population in the study area will depend on transport network options (accessibility) and land use (including concentration of population and employment at growth centers). This scenario also helps us identify clusters with higher potentials for development.
The additional population and employment in this scenario are distributed based on weights assigned to each of the selected criteria. The parameters identified for the allocation of additional population and employment to the clusters are: lengths of bus route network, metro and other transit network, national highway, state highway, and all other existing and proposed major (4 lane and above) roads that pass through the cluster, number of potential growth centers areas in each cluster, and existing land uses. Such considerations are taken to employ and achieve population and employment distribution for future years based on the concept of Transit Oriented Development (TOD). TAZ wise proposed population and employment is extracted based on the proposed land use including TOD. Population and employment density for base year and horizon year is shown in FIGURE 2-19.

FIGURE 2-19: DISTRIBUTION OF POPULATION DENSITY FOR BASE AND HORIZON YEARS (2016-2036) IN SUT SCENARIO

FIGURE 2-20: DISTRIBUTION OF EMPLOYMENT DENSITY FOR BASE AND HORIZON YEARS (2016-2036) IN SUT SCENARIO

2.4.2. NETWORK SCENARIO
Forecasting the future growth of Nashik, an alternate road network plan is evolved for the horizon year 2036 with the following premises/hypothesis and is presented in Figure 2-21:
Committed Projects + Development of mass transit corridors + Development of IRR and ORR + Development of Other Roads (i.e. Missing links, Hierarchy road
system)
FIGURE 2-21: ALTERNATIVE NETWORK FOR SUSTAINABLE SCENARIO FOR HORIZON YEAR-2036
2.4.3. INTERNAL TRAVEL DEMAND ESTIMATION
The trip ends for the horizon year 2021, 2026, 2031 and 2036 were obtained for total travel using the calibrated trip end models. Trips are then split between the modes (Car, Two Wheeler, IPT and Public Transport) using the combined distribution and mode choice model. The horizon year trip distribution is different for alternative network scenarios due to different inter-zonal generalized cost. Thus, for each of the future networks and development scenarios peak passenger trip matrices were developed by an iterative mechanism considering the interaction between distribution, modal split and assignment stages. Desire line diagram of Horizon Year Trips (excluding intra-zonal trips) is presented in Figure 2-22.
Proposed Highway Network
Proposed MRT Network

Passenger Vehicles – Passengers
Freight Vehicles - PCUs
FIGURE 2-22: DESIRE LINE DIAGRAMS FOR HORIZON YEAR-2036

2.4.4. TRAVEL DEMAND FORECAST
By adopting the forecast assumptions detailed above and with the help of the urban model developed for the study area, travel demand has been estimated. Calibrated model has been used to estimate the demand for the horizon year 2036. The travel demand and projected mode share is presented in Table 2-18.
TABLE 2-21: TRAVEL DEMAND FORECAST – SUT SCENARIO
Year 2016 2036
Mode share Trips % Share Trips % Share
Walk 280319 15.8% 681201 20.7%
Car 105358 6.0% 61452 1.9%
Two wheeler 745277 42.1% 1011994 30.8%
Auto Rickshaw 383291 21.7% 64011 1.9%
Public Transport 207376 11.7% 1359670 41.4%
Cycle 48484 2.7% 109442 3.3%
Total 1770106 100.0% 3287770 100.0%
2.4.5. OUTCOMES OF SUSTAINABLE TRANSPORTATION SCENARIO
Traffic and V/C ratios on along some of the major roads for horizon years have been compiled and presented in Table 2-14. Link flow diagram is presented in Figure 2-9.
TABLE 2-22: V/C ON MAJOR ROADS FOR HORIZON YEAR 2036
S. No Name of the Road V/C Ratio
1 Aurangabad Road 0.72
2 Jail Road 0.61
3 Kamathwade-Trimurti Chowk Link Road 0.33
4 Lam Road 0.81
5 Nashik Road 0.79
6 Nashik-Mumbai Highway 0.38
7 Nashik-Pune Road 0.89
8 Old Agra Road 0.83
9 Panchvati Karanja Road 1.07
10 Panchvati Road 0.71
11 Peth Road 0.44
12 Trimbak Road 0.76
13 Untawadi Road 0.67
14 Dindori Road 0.90
15 Proposed ORR 0.36
16 Proposed IRR 0.27
It is observed that about 13% of the existing road network will have V/C greater than 0.7.

FIGURE 2-23: V/C RATIO FOR HORIZON YEAR (2036)
2.4.6. PHPDT ON MAJOR CORRIDORS
The PHPDT of the public transport on major corridors were arrived for horizon year at using the 4 stage travel demand modeling and has been summarized in Table 2-25. Public Transport PHPDT flow diagram is presented in Figure 2-9.
TABLE 2-23 PUBLIC TRANSPORT PHPDT ALONG MAJOR CORRIDORS FOR THE HORIZON YEAR (2036)
Corridor No. Corridor Description PT PHPDT
1 Dindori Road 15562
2 Panchvati Karanja Road 14560
3 Nashik-Pune Road 14345
4 Trimbak Road 13991
5 Old Agra Road 12467
6 Nashik-Mumbai Highway 7723
7 Jail Road 7294
8 Lam Road 6769
9 Panchvati Road 5879
10 Peth Road 5672
11 Aurangabad Road 5490
12 Untawadi Road 4854
13 Proposed IRR 3747
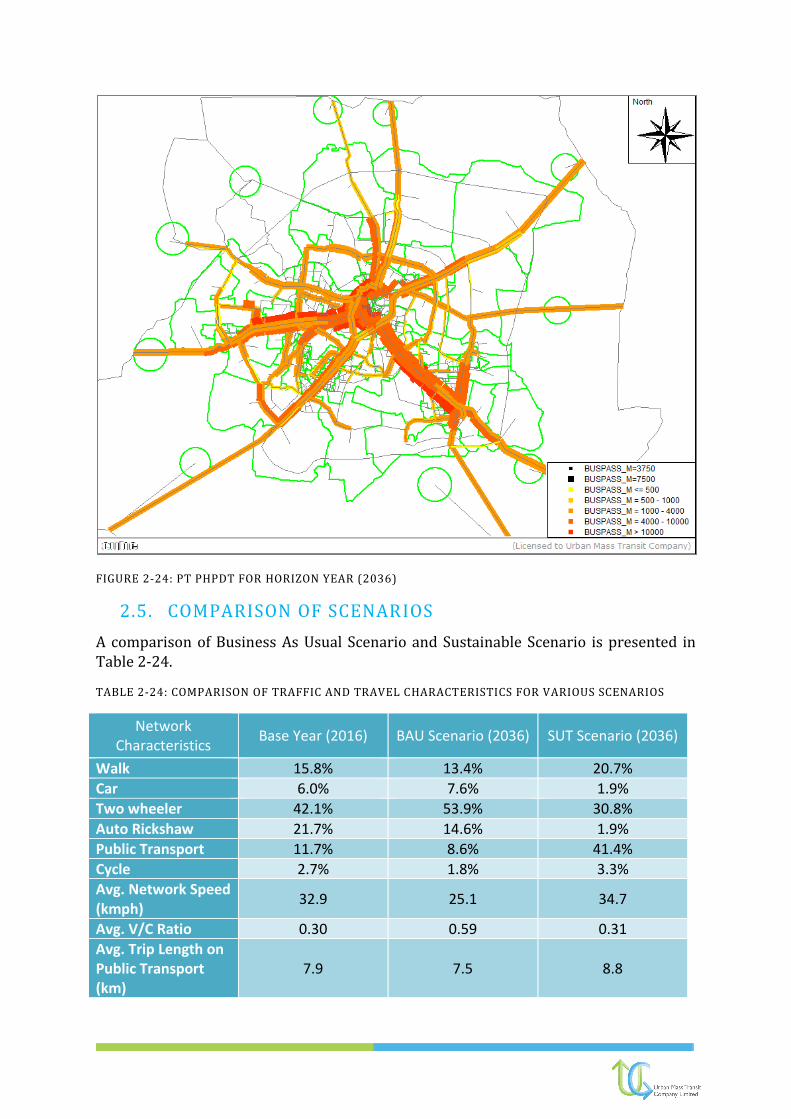
FIGURE 2-24: PT PHPDT FOR HORIZON YEAR (2036)
2.5. COMPARISON OF SCENARIOS
A comparison of Business As Usual Scenario and Sustainable Scenario is presented in Table 2-24.
TABLE 2-24: COMPARISON OF TRAFFIC AND TRAVEL CHARACTERISTICS FOR VARIOUS SCENARIOS
Network Characteristics
Base Year (2016) BAU Scenario (2036) SUT Scenario (2036)
Walk 15.8% 13.4% 20.7%
Car 6.0% 7.6% 1.9%
Two wheeler 42.1% 53.9% 30.8%
Auto Rickshaw 21.7% 14.6% 1.9%
Public Transport 11.7% 8.6% 41.4%
Cycle 2.7% 1.8% 3.3%
Avg. Network Speed (kmph)
32.9 25.1 34.7
Avg. V/C Ratio 0.30 0.59 0.31
Avg. Trip Length on Public Transport (km)
7.9 7.5 8.8

It is observed that the share of Public Transport (Bus and MRT) in Sustainable scenario has increased five times in Sustainable scenario compared to Business As Usual Scenario. Also, average V/C ratio has reduced by 47% and average network speed has increased by 38% in Sustainable scenario. Sustainable scenario is selected for proposing various transport improvement proposals.
2.5.1. RIDERSHIP FOR MASS RAPID TRANSIT
The PHPDT of the public transport corridors were arrived at using the 4 stage travel demand modeling and has been summarized in Table 2-25. Based on traffic pattern of the city and ridership evaluation, 2 corridors are eligible for MRT. However, a feasibility study is required to evaluate these corridors for various options.
TABLE 2-25 PHPDT FOR PUBLIC TRANSPORT FOR THE BASE YEAR (2016) AND HORIZON YEAR (2036)
Corridor No.
Corridor Description Base (2016)
PT PHPDT MRT PHPDT
Sustainable -(2036)
Business-As-Usual
(2036)
Sustainable (2036)
1 Dindori Road 3313 5572 15562 2893
2 Panchvati Karanja Road 3049 5102 14560
3 Nashik-Pune Road 4262 9364 14345 8033
4 Trimbak Road 3387 6465 13991
5 Old Agra Road 5218 10910 12467 3640
6 Nashik-Agra Highway 3045 7069 7723 3137
7 Panchvati Road 2631 5815 5879
8 Aurangabad Road 2108 4057 5490
9 Proposed IRR 3747
10 Gangapur Road to Nashik-Mumbai Highway
3575

3. MEETINGS CONDUCTED
Stakeholder meetings were conducted at various stages of the project both formally and informally. During the project, consultants interacted with various stakeholders and are presented below.
1. Commissioner, NMC
2. Additional Commissioner, NMC
3. Additional Commissioner of Police (Traffic), NMC
4. City Engineer, NMC
5. Executive Engineer, NMC
6. Deputy Engineer (Traffic Cell), NMC
7. Director, Town planning, NMC
8. Executive Engineer, State PWD
9. Divisional Controller, MSRTC
10. Project Engineer, NHAI
11. Regional Transport Office
12. Chief engineer, MSEB
13. Nashik First
14. ITDP
3.1. STAKEHOLDERS MEETING
The local stakeholders were made aware about the project and its usefulness. The Consultants made detailed presentation about the objectives of the study and how they are planning to proceed. The Consultants also requested the local to extend cooperation for data collection which is a crucial step f or formulation of the proposals. In addition to these, consultants have discussed some of the key traffic management issues along with stakeholders. Figure 3-1 represents stakeholder discussion with Commissioner, NMC and other department officials.
FIGURE 3-1: STAKEHOLDER DISCUSSSION
Below are some of the important points made during the Stakeholder Consultation:
Provision of signals at important junctions
Rotaries and channelizes for traffic management at junctions

Demarcation of parking areas for On-street parking facility and
Development of Multi-Level parking areas. Electronic components of system
that is automated, semi-automated ticketing system and smart card system for
off street parking
Pedestrian facilities and pedestrian phase signals
Widening of congested roads
Public Bike Sharing model for Nashik city
Improvement of Bus Transport
3.2. ACTION TAKEN ON REVIEW MEETINGS
The consultations helped the consultant further discussions on the projects (proposed
or in the pipeline) taken up by various agencies for the city and its surroundings. These
projects have been duly taken up in the development of proposals. The CTTP thus has
suggested proposals and strategies that would complement the development scenario
envisioned by various agencies.
3.3. STAKEHOLDERS MEETING ON CTTP PROPOSALS
Consultants presented the scenarios and urban mobility plan that covered the existing
and proposed transportation scenario. Some of important press clippings are shown
below.

4. VISION AND GOALS
Comprehensive Traffic and Transportation Plan (CTTP) is a long term vision for the
development of transport in Nashik and ideally should follow or guide the land-use
planning for the region.
The Transport Plan seeks to develop a most optimal transport road map keeping in
view the National Urban Transport Policy which strongly suggests that if transport has
to be sustainable, a radical shift must be made towards public transport supply and
non-motorized transport modes.
The goals and objectives set for the transportation needs of Nashik can be achieved by
formulating a series of strategies as per NUTP guidelines. Each of the strategies will be
evaluated to see their suitability and applicability for Nashik.
4.1. VISION
As stated earlier, the CTTP is a long term vision for desirable accessibility and mobility
pattern for people and goods in Nashik to provide safe, secure, efficient, reliable and
seamless connectivity that supports and enhance economic, social and environmental
sustainability. In order to provide the same for the citizens of Nashik, the vision of
Comprehensive Traffic and Transportation Plan (CTTP) for Nashik is defined as:
“To attain a People Centric Urban Transport System with an integrated, efficient,
livable and sustainable transport system for improving mobility of people and
goods”

4.2. GOALS
To ensure urban transport solutions for Nashik are sustainable and in conformity with
sustainable transport, following goals have been formulated:
Goal 1: Ensure safety and mobility of pedestrians and cyclists by designing
streets and areas that make a more desirable, livable city for residents and
visitors and support the public transport system.
Goal 2: Develop public transit system in conformity with the land use that is
accessible, efficient and effective.
Goal 3: Develop traffic and transport solutions that are economically/ financially
viable and environmentally sustainable for efficient and effective movement of
people and goods
Goal 4: Develop a Parking System that reduces the demand for parking and need
for private mode of transport and also facilitate organized parking for various
types of vehicles.
Each goal can be achieved by meeting the following objectives:
4.2.1. GOAL 1
Develop public transit system in conformity with the land use that is accessible, efficient
and effective
Objectives
Provide good quality of public transport system that is accessible, efficient and
effective
Develop strategy to integrate public transport system with existing IPT System
Develop strategies to encourage people to use public transport system and
discourage use of private vehicles
Develop policies that encourage concentrated mixed land use development along
the public transport corridors
4.2.2. GOAL 2
Ensure safety and mobility of Pedestrian and cyclist by designing streets and areas that
make a more desirable, livable city for residents and visitors and support the public
transport system.
Objectives
To provide facilities to pedestrians and ensure safety to segregate their
movement from vehicles along major corridors
To encourage pedestrian movement in heavy pedestrian movement areas and
restrict use of private vehicles
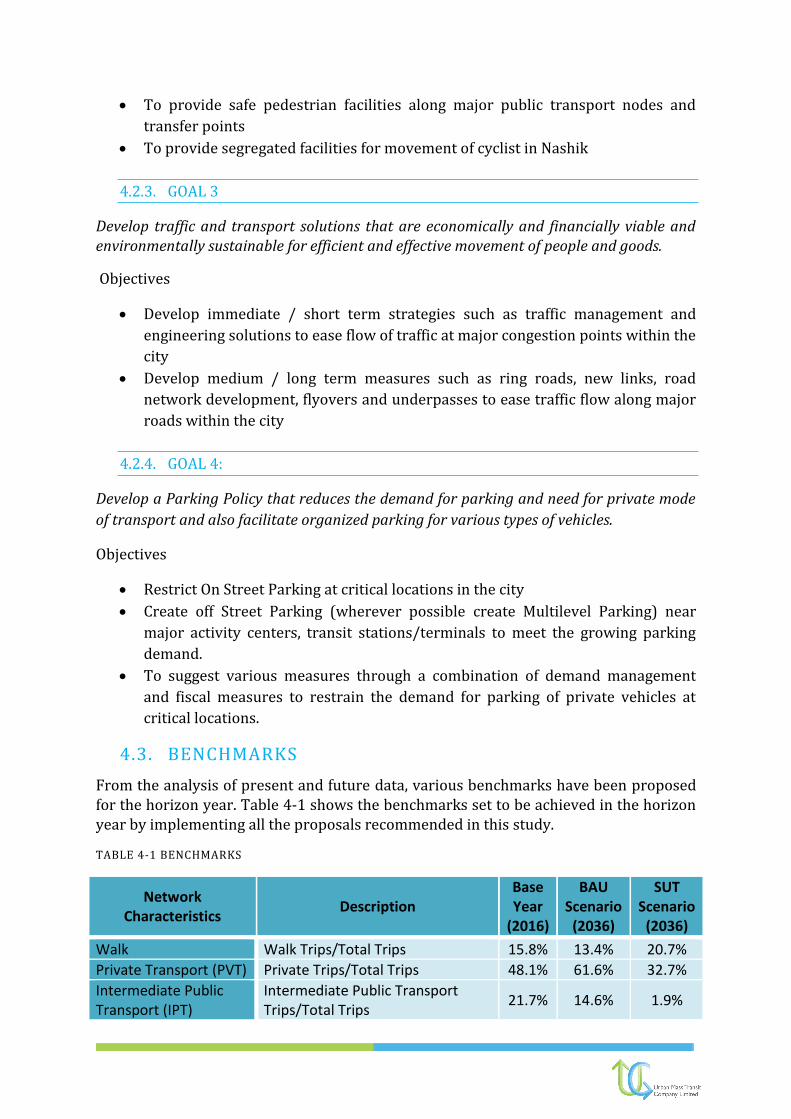
To provide safe pedestrian facilities along major public transport nodes and
transfer points
To provide segregated facilities for movement of cyclist in Nashik
4.2.3. GOAL 3
Develop traffic and transport solutions that are economically and financially viable and environmentally sustainable for efficient and effective movement of people and goods.
Objectives
Develop immediate / short term strategies such as traffic management and
engineering solutions to ease flow of traffic at major congestion points within the
city
Develop medium / long term measures such as ring roads, new links, road
network development, flyovers and underpasses to ease traffic flow along major
roads within the city
4.2.4. GOAL 4:
Develop a Parking Policy that reduces the demand for parking and need for private mode
of transport and also facilitate organized parking for various types of vehicles.
Objectives
Restrict On Street Parking at critical locations in the city
Create off Street Parking (wherever possible create Multilevel Parking) near
major activity centers, transit stations/terminals to meet the growing parking
demand.
To suggest various measures through a combination of demand management
and fiscal measures to restrain the demand for parking of private vehicles at
critical locations.
4.3. BENCHMARKS
From the analysis of present and future data, various benchmarks have been proposed for the horizon year. Table 4-1 shows the benchmarks set to be achieved in the horizon year by implementing all the proposals recommended in this study.
TABLE 4-1 BENCHMARKS
Network Characteristics
Description Base Year
(2016)
BAU Scenario
(2036)
SUT Scenario
(2036)
Walk Walk Trips/Total Trips 15.8% 13.4% 20.7%
Private Transport (PVT) Private Trips/Total Trips 48.1% 61.6% 32.7%
Intermediate Public Transport (IPT)
Intermediate Public Transport Trips/Total Trips
21.7% 14.6% 1.9%

Network Characteristics
Description Base Year
(2016)
BAU Scenario
(2036)
SUT Scenario
(2036)
Public Transport Public Transport Trips/Total Trips 11.7% 8.6% 41.4%
Cycle Cycle Trips/Total Trips 2.7% 1.8% 3.3%
Avg. Network Speed (kmph)
Average Journey Speed for all vehicles
32.9 25.1 34.7
Avg. Trip Length on Public Transport (km)
Passenger-Kms/Passengers 7.9 7.5 8.8
Walkability Footpath length/Total Road Length (Arterial and Sub-Arterial)
4% 4% 100%
Cyclability Cycle track length/ Total Road Length (Arterial and Sub-Arterial)
0% 0% 100%
Fatality Fatality per lakh population 12 -- 0
Local Emissions (Tonnes/day)
Emissions from all vehicles 16.0 18.8 6.4
GHG Emissions (Tonnes/day)
Equivalent CO2 Emissions from all vehicles
349.0 516.6 236.0
Vehicle-km travelled (PVT) in Thousands
Total PVT Vehicles * Average Trip Lengths/1000
3645 8368 4441
Public Transport Accessibility
% Population along Major Public Transport Corridors
41% 41% 54%
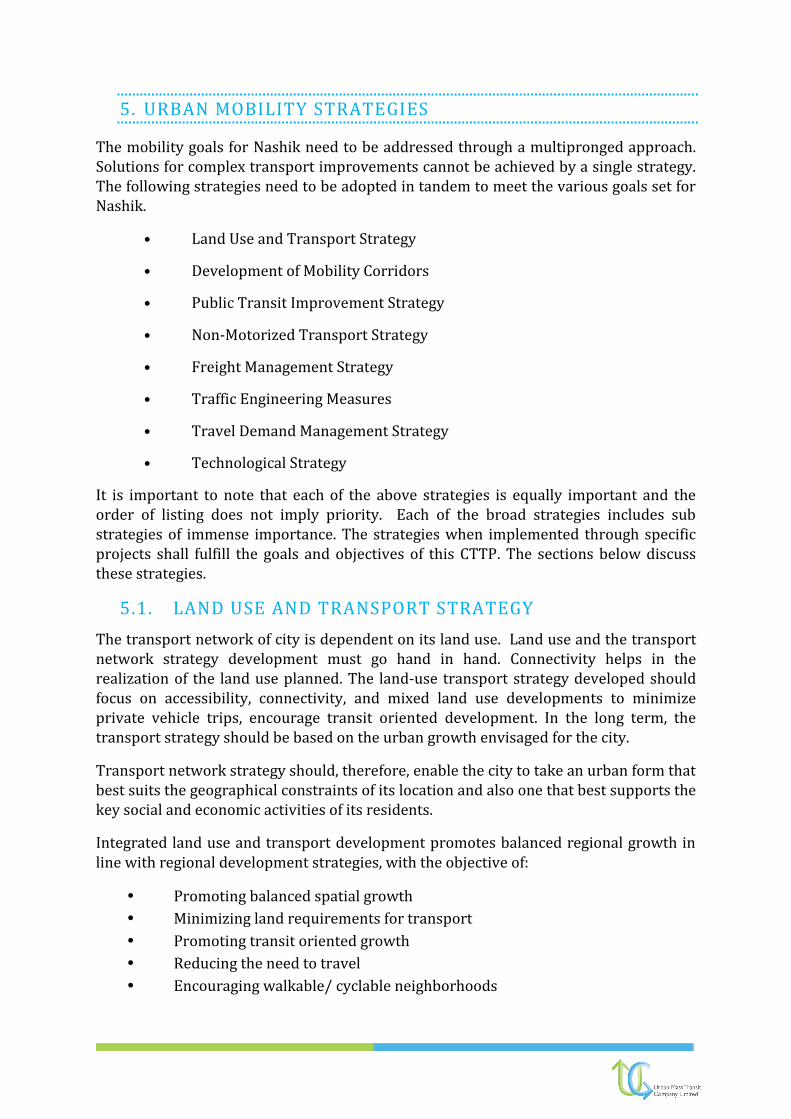
5. URBAN MOBILITY STRATEGIES
The mobility goals for Nashik need to be addressed through a multipronged approach. Solutions for complex transport improvements cannot be achieved by a single strategy. The following strategies need to be adopted in tandem to meet the various goals set for Nashik.
• Land Use and Transport Strategy
• Development of Mobility Corridors
• Public Transit Improvement Strategy
• Non-Motorized Transport Strategy
• Freight Management Strategy
• Traffic Engineering Measures
• Travel Demand Management Strategy
• Technological Strategy
It is important to note that each of the above strategies is equally important and the order of listing does not imply priority. Each of the broad strategies includes sub strategies of immense importance. The strategies when implemented through specific projects shall fulfill the goals and objectives of this CTTP. The sections below discuss these strategies.
5.1. LAND USE AND TRANSPORT STRATEGY
The transport network of city is dependent on its land use. Land use and the transport network strategy development must go hand in hand. Connectivity helps in the realization of the land use planned. The land-use transport strategy developed should focus on accessibility, connectivity, and mixed land use developments to minimize private vehicle trips, encourage transit oriented development. In the long term, the transport strategy should be based on the urban growth envisaged for the city.
Transport network strategy should, therefore, enable the city to take an urban form that best suits the geographical constraints of its location and also one that best supports the key social and economic activities of its residents.
Integrated land use and transport development promotes balanced regional growth in line with regional development strategies, with the objective of:
• Promoting balanced spatial growth
• Minimizing land requirements for transport
• Promoting transit oriented growth
• Reducing the need to travel
• Encouraging walkable/ cyclable neighborhoods

To deal with the problems of traffic and transport and future growth of the development area, an integrated land use and transport strategy has to be devised. The proposed and expected growth of the area and accordingly the capacities of mobility corridor links will be proposed to cater to the future traffic load generating from these zones.
One of the strategies integrating land use and transport that can be adopted for Nashik is the Transit Oriented Development (TOD) strategy. A TOD is a mixed‐use of land for residential and commercial activities, designed to minimize the need for transport and maximize the access to public transport, and often incorporates features to encourage transit ridership. This concept can be applied along the major identified mobility corridors that have the potential to carry higher order mass transit systems.
5.2. NON-MOTORIZED TRANSPORT STRATEGY
Non-motorized transport strategy is a key element in successfully encouraging clean urban transport. It can be a very attractive mode of transport for relatively short distances, which make up the largest share of trips in cities.
The key to reversing the trend towards more private vehicle use is making walking and cycling attractive, together with improving public transport. This can be done by a range of activities including construction of sidewalks and bike lanes, bike sharing programs, urban planning and pedestrian-oriented development. NMT is a highly cost-effective transportation strategy and brings about large health, economic and social co-benefits, particularly for the urban poor.
The various action plans framed for improving non-motorized transport infrastructure include:
a) Develop ‘’pedestrian only’’ plazas and streets
b) Provide a complete footpath network in the city
c) Introduce cycle tracks for safe movement of cyclists in the city
d) Redesign the intersections to ensure better accessibility for pedestrians
and bicycles
e) Introduce public bike sharing systems
f) Provide safe accessibility to public transport
5.3. PUBLIC TRANSPORT STRATEGY
Public transport is a shared passenger transport service which is available for use by the general public, as distinct from modes such as taxicab, carpooling or hired buses which are not shared by strangers without private arrangement. Improving public transport includes NMT also as any public transport trip includes a component of access and egress which is already covered under NMT Strategy. Improving public transport includes improvements in bus service and mass rapid transit with compatible pedestrian and bicycle infrastructure.
Mass Transit is a form of public transport that can transport a greater volume of passengers and provide a higher quality of services than conventional services through
a systematic combination of infrastructure, equipment and information technologies. Mass transit options could include Bus Rapid Transit (BRT), light rail, a metro rail system, a mono rail system or commuter/sub urban rail services also. Public transport strategy includes following action plans:
a. Proposal for mass transit corridors with NMT access facilities
b. Restructuring of existing city bus routes
c. Phased expansion of bus fleet
d. Creation of adequate infrastructure in the form of depot, terminals, bus
queue shelters and signage
e. The intermediate public transport (IPT) system comprising shared and
private auto‐rickshaws, which currently cater to a major part of overall
trips in the city have to be integrated with proposed public transport
system for the city. The following strategies are proposed in this regard:
f. Restructuring of corridors to allow plying of IPT modes so as to reduce
overlap of routes between them and the city bus system. This shall ensure
that the IPT modes work as a feeder system to the PT system and both the
systems are financially viable.
g. Creation of signage to demarcate the IPT stops to reduce the chaos
occurring on the streets due to erratic stoppages of IPT modes.
h. Creation of adequate spaces for parking of IPT vehicles in the city away
from the traffic junctions.
i. Integrate the multiple modes of transport to provide single journey
experience
5.4. ROAD NETWORK STRATEGY
Road network is a system of interconnected paved carriageways which are designed to carry buses, cars, goods vehicles or any other moving travel mode. The road network generally forms the most basic level of transport infrastructure with urban areas. In order to provide mobility solutions for Nashik, it is vital that there is effective integration between land use and transport in the entire region. The city of Nashik is already having a development pattern similar to the multi-nodal network with many urban centers dispersed from the city center. The Road network strategy includes:
a. Development of Mobility Corridors
b. Development of ring-radial network pattern for Nashik
c. Development of flyovers, underpasses, ROBs, RUBs wherever necessary
5.5. FREIGHT MANAGEMENT STRATEGY
Freight movement in a city is an inevitable process of trade and economy. The entry of heavy commercial vehicles into the city will interfere with the easy traffic flow. Hence the action plans are prepared such that the freight movement will not interfere the traffic movement.

The action plans for improving freight movement are:
a. Frame policies to restrict the heavy vehicle flow in the city
b. Identify freight corridors with the city
c. Permit heavy vehicles into the city only during specific hours
d. Identify truck parking locations (freight terminals)
5.6. DEMAND MANAGEMENT STRATEGY
Travel demand management (TDM) is an intervention, (excluding provision of major infrastructure), to modify travel decisions so that more desirable transport, social, economic and/or environmental objectives can be achieved, and the adverse impact of travel can be reduced. A combination of TDM strategies and policies help to reduce travel demand or redistribute this demand in space or in time. Detailed Strategies are explained in Chapter 4.
5.7. TRAFFIC ENGINEERING STRATEGY
In this CTTP, an equal emphasis is given on the traffic movement in the city which should be safe and accessible for all transport users. Traffic movement in the city should enhance the use of sustainable travel choices. The policies should be framed to increase the generalized cost of travel of motorized modes as compared to NMT and PT mode. The various action plans under traffic engineering strategy are:
a. Junction Improvements
b. Parking Management and off street parking locations
c. One way plans
d. Road markings and signage improvements
5.8. TECHNOLOGICAL STRATEGY
Last but not the least, technological improvements are important for the city to be smart. Technological improvements can encompass changes in vehicle design, fuel use, energy use and reduction in CO2 emissions related to the electrically driven vehicles. Various actions framed for the same are:
a) Area Traffic Control Systems
b) Smart signaling at intersections
c) Real time information systems for public transport
d) Integrated ticketing system
e) Use of smart parking technologies

6. URBAN MOBILITY PLAN
6.1. LAND USE TRANSPORT PLAN
Urban transport characteristics are influenced by the distribution (spatially) of land-use activities in the city. By envisioning an optimum spatial structure of locations in the urban environment, a land use plan can contribute to a marked reduction in the vehicle kilometers travelled and in turn support a high public transit share. Mixed Use development helps to keep walking and cycling attractive.
Nashik is already a multi nuclei city with different nodes around the city. The transport infrastructure in the smaller nodes should substantiate the land use development and should complement the development. Nashik Core City is the major node in the area. Sneha Nagar, Balram Nagar, Kailash Nagar, Vijay Mamta, Vadala, Lavathe Nagar and Ganagapur Naka are the minor nodes around Nashik City. In order to decongest the core city area and for efficient and equitable distribution of transport demand throughout the city, it is imperative to develop sub-city center in different places of the city. The CTTP for Nashik has proposed the development of sub-city Centres at the areas where different transport modes intersect with each other.
6.1.1. ROAD NETWORK FOR NASHIK – RING AND RADIAL
Nashik city clearly has a characteristic ring-radial network development. In Nashik, these major radials are either state/national highways, and are important mobility corridors. In addition there is a possibility to develop rings which bind these radial roads together providing a ring radial pattern for the network.
The streets need to be classified into primary, secondary and tertiary so as to provide uniform standards of road geometry and public transit services. We can consider radial lines as primary transit network and rings as secondary transit network. These primary and secondary transit network together constitute the major mobility corridors for the city.
In essence, mobility corridors maximize throughput of people, focusing on mass transport and non-motorized traffic, rather than vehicle traffic. These mobility corridors offer a strong network providing connectivity to major attraction centers in the city along with regional connectivity. These corridors should be considered for an augmented public transport system.
The radial corridors are:
1. Mumbai-Agra Highway 2. Triambak Road 3. Nashik Pune Highway 4. Gangapur Road 5. Dindori Road 6. Peth Road

The Rings binding these radials are:
1. Tilak Road 2. Old Agra Road 3. Old Canal Link Road 4. Meri Rasbihari Link Road
FIGURE 6-1 RING AND RADIAL ROAD NETWORK IN NASHIK
Since these corridors include all the major spines within Nashik city, they should be designed based on the standards. A mobility corridor should have right of way of at least 25 m for mixed traffic conditions. In Nashik, the radial network is present but the network needs to be upgraded to mobility corridor standards. Some portions of these networks need to be widened to function as a mobility corridor. These corridors would be expected to have the following cross-sectional elements:
1. Continuous kerb, footpath-cum-drain and bi-cycle lanes 2. Service roads where feasible 3. Restriction or preferably prohibition of parking on the carriageway/shoulders 4. At-grade/grade-separated public transport systems as per the public
transport/mass transport master plan The following figures show the indicative cross sections of various ROWs of roads to be followed.

FIGURE 6-2 ROW SECTIONS - FP: Footpath, CT: Cycle Track, MUZ: Multi Utility Zone, CW: Carriage Way, Med: Median, SR: Service Road
Figure 6-3 9m row section

FIGURE 6-4 18 M ROW SECTION
FIGURE 6-5 24 M ROW SECTION
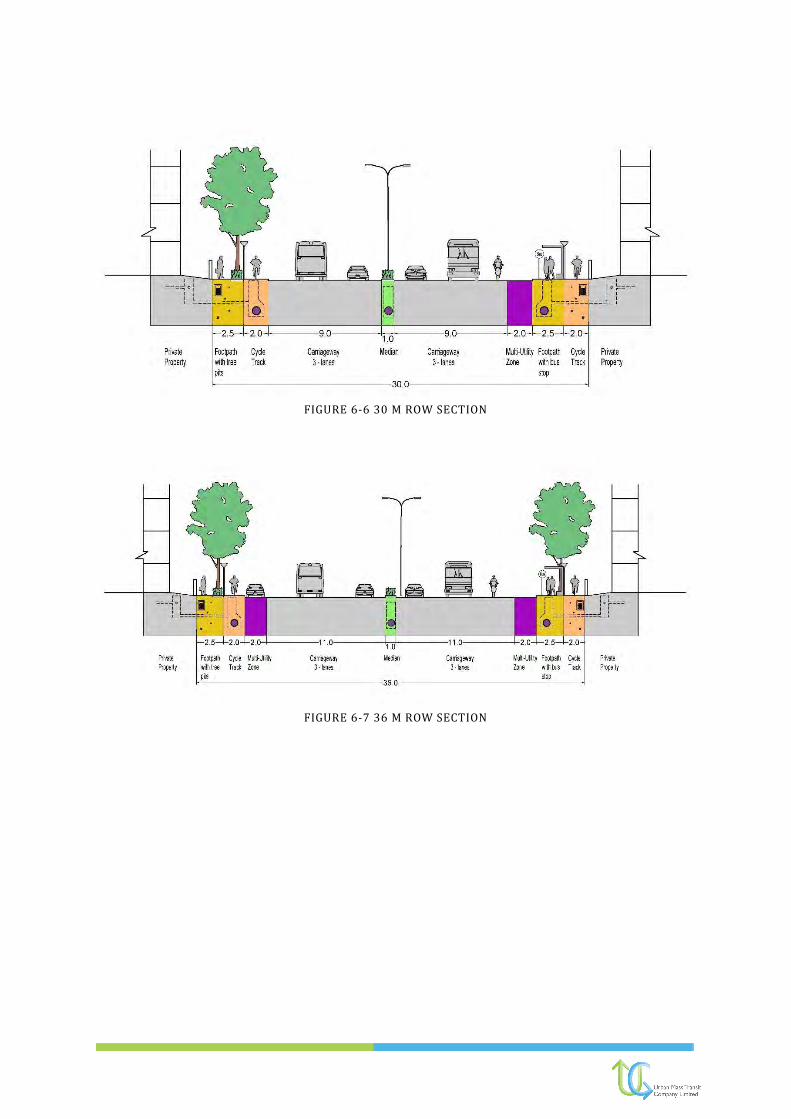
FIGURE 6-7 36 M ROW SECTION
FIGURE 6-6 30 M ROW SECTION

FIGURE 6-8 45 M ROW SECTION
FIGURE 6-9 60 M ROW SECTION
6.1.2. MULTI NODAL TRANSIT CONCEPT FOR NASHIK
The urban form and its spatial structure are articulated by two structural elements: Nodes & Linkages.
Nodes are reflected in the centrality of urban activities - can be related to the spatial accumulation of economic activities or to the accessibility to the transport system. - Terminals, such as ports, railyards, and airports, are important nodes around which activities agglomerate at the local or regional level. Nodes have a hierarchy related to their importance and contribution to urban functions, such as production, management, retailing and distribution. While, Linkages are the infrastructures supporting flows from, to and between nodes. The lowest level of linkages includes streets, which are the defining elements of the urban spatial structure.
The spread of activities in Nashik shows a multi-nodal model of development. Major Economic Nodes in Nashik- The commercial area of the city mainly lies in the core area of the city. It includes Main road CBS Panchavati area and Nashik road. The industrial

zone is mainly located in the Western part of the Nashik city around N. H. No. 3 and Satpur MIDC Ambad MIDC area. The ring radial road network of the city ensures good linkage of these nodes with minor ones.
Hybrid Development
Different Primary transit network concepts are developed world wide and have been implemented across the world. The concepts are Multi nodal transit network where there are major transit corridors and different nodes dispersed around the main city center Figure 6-10 compact development like Barcelona, Curitiba where the development of the city region is restricted up to certain limits and a hybrid concept which is a combination of dispersed and compact development.
FIGURE 6-10 Mobility Corridor Concepts
The development of a ring-radial road network will allow the city to grow in all the directions as it is growing in recent times. Nashik Corporation area can be the main city center. The sub centers can be divided based on the proximity to the main city center, i.e within immediate proximity (along inner ring road), medium proximity (between IRR and ORR) and Low proximity (along outer ring road).
Immediate Proximity (Along Inner ring road )
Medium Proximity (b/w IRR and ORR)
Low Proximity (Along Outer Ring Road)
Shalimar
Panchavati
Bhadrakali
Tapovan
Mahatma Nagar
Sharanpur
Indira Nagar
Hirawadi
Shramik Nagar
Ashok Nagar
Pathardi
Nashik Road Area
Jail Road Area
CIDCO

However, the sub centers can also be classified based on its importance to the region i.e Major Nodes and Minor Nodes
Major Node Minor Node
Shalimar
Panchavati
Bhadrakali
Mahatma Nagar
Sharanpur
Nashik Road Area
Jail Road Area
CIDCO
Pathardi
Hirawadi
Tapovan
Shramik Nagar
Ashok Nagar
Indira Nagar
FIGURE 6-11 ROAD NETWORK DEVELOPMENT VS ECONOMIC NODES IN THE CITY
Each of these can adopt a land use development strategy. All major nodes should consider a transport development strategy in accordance with the overall vision of the city. For example, the major nodes like Panchavati, etc. can develop a Non-motorized transport plan, Public transport plan so that the node is well connected for inter node travel as well as intra node travel.

6.1.3. TRANSIT ORIENTED DEVELOPMENT
FIGURE 6-12 Concept of Transit Oriented Development
Image Source: www. Wordpress.org accessed on 27th September 2016
The ring-radial network is designated as mobility corridors. To maximize the passenger throughput, these corridors should be developed on the concepts of transit oriented development. Mixed use development that is cognizant of the low income users of the transit system is important. It is necessary to create urban and sub-urban environments where walking and transit are viable transportation options by making it easier to go from one transportation mode to another, the connection between community and development is enhanced ensuring that a community is accessible to all. Resilient neighborhoods will provide the needs of daily living, within walking distance (1/2 to 1 km radius). Nashik has the potential to adopt these principles.
FIGURE 6-13 TRANSIT ORIENTED DEVELOPMENT ACROSS MAJOR MOBILITY CORRIDORS

The TOD planning process includes:
a) Travel Connections: Convenient and direct pedestrian connections, pedestrian
scale blocks, interconnected street network including bicycle circulation and
parking.
b) Building Scale and Orientation: Building placement is a powerful tool in
reinforcing streets as public amenities. The quality of “out of vehicle”
experiences is influenced by the placement of buildings in relation to the street
and other buildings, as well as their height and scale (Figure 6-12).
c) Public Spaces: This would include pedestrian-friendly streets including
adoption of traffic calming measures, parks and Plazas as community gathering
spaces to enable social interaction, quality facilities for transit users
d) Parking: Parking structures/shared parking lots are two ways to reduce the
amount of space occupied by parking facilities.
6.2. ROAD NETWORK DEVELOPMENT STRATEGY
A connected and well planned road network is essential for the city. Road network development also includes improving the intersections to give equal emphasis to all road users. The road network development should add to the overall development strategy for the city. The network should have sufficient capacity to carry the vehicles. Road Network proposals are considered only if it is absolutely necessary. Provision of more flyovers and more widening will support more and more use pf private vehicles, hence those proposals are considered only if it is absolutely necessary. The proposals of improving road network include:
Widening of the roads

Outer Ring Road
Road Infrastructure (Rail Crossings and Bridges)
6.2.1. ROAD WIDENING
Section 2.1.1 explained the ring radial concept for Nashik. These corridors will form the arterial network and is presented in Table 6-1. In the corridors considered, a few roads need to be widened to act as a Mobility Corridor. Widening of roads is a must when the volume carried increases considerably compared to its capacity. All the roads identified for road widening shall be provided with median in between to reduce accidents and safety. The major highways shall be provided with service lane to reduce multiple entry/exit points.
TABLE 6-1 PROPOSED ROADS FOR WIDENING
S.no
Name Length in km
Lane Configuration
2016 2021 2026 2031 2036
A Mobility Corridors (with PT as priority)
1 Mumbai-Agra Highway 10.38 6 8
2 Trimbak Road 12.34 4 6
3 Nashik Pune Highway 9.30 4 6 8
4 Gangapur Road 7.95 4 6
5 Dindori Road 6.30 4 6
6 Peth Road 10.72 4 6
7 Old Agra Road 2.42 4 6
8 Tilak Road 1.20 4 6
60.61
B Other Roads
9 Amrutdham Road 2.47 2 4 6
10 Ambad-Kamathwade Link Road 1.40 2 4 6
11 Ambad-Satpur Link Road 5.35 4 6
12 Ambad-Uttamnagar Road 2.34 3
6
13 Amrutdham Road 4.98 2
4
14 Ashoka Road 1.61 3 4 6
15 Aurangabad Road 8.65 4 6
16 Gangapur-Satpur Link Road 5.10 4 6
17 ITI-Ambad Road 2.42 2 4
18 Jail Road 4.90 4 6
19 Kamathwade-Trimurti Chowk Link Road
1.60 2
4
6
20 Lam Road 4.50 4 6
21 Mahatma Nagar-Untawadi Road 1.16 4 6
22 Panchvati Road 2.36 3 4
23 Ramdas Swami Road 1.23 4 6
24 Ravi Shankar Road 1.49 2 4 6

S.no
Name Length in km
Lane Configuration
2016 2021 2026 2031 2036
25 Sri Shri Ravishankar Road 1.68 3 4 6
26 Tikde Colony Road 2.14 4 6
27 Untawadi Road 2.05 4 6 6
28 Mahatma Nagar Road 2.03 4 6
29 Samathanagar Road 1.14 2 4 6
30 Satpur MIDC Road 3.56 3 4
64.16
Figure 6-14 shows the roads to be widened other than mobility corridors.
FIGURE 6-14 ROADS FOR WIDENING IN THE CITY

6.2.2. MISSING LINKS-OUTER RING ROAD
The multi nodal transit concept for Nashik was explained in section 2.1.2. An outer ring road has been developed during Sinhastha connecting. This corridor can be considered as the spine of the region away from the city. The road connects the major low proximity towns around Nashik. The road can act as a bypass for the traffic moving from North to South or vice versa. The outer ring road will reduce the external-external trips coming to the city which is around 12% of the total traffic in the city.
The proposed outer ring road also connects all the major radials emerging out of the city and hence will also give an easy way of connectivity from one radial to another without reaching the city center. This will help in the decongestion of city center.
The tentative alignment of outer ring road is shown in Figure 6-15. Approximate length of the ORR is 58.25 km. The inner ring road proposed connects Makhmalabad Road, Amrutdham Road, Ramdas Swami Marg, Old Canal Link Road and Mahatma Nagar Road. The tentative alignment of inner ring road is shown in Figure 6-15. Approximate length of the IRR is 25.2 km.
FIGURE 6-15 Outer Ring Road- Missing Links

TABLE 6-2 PROPOSAL - ORR AND IRR MISSING/NEW LINKS
Network Lane Configuration Year of Implementation
Inner Ring Road 6 Lane 2031
Outer Ring Road 4 Lane 2036
TABLE 6-3 LINKS TO BE DEVELOPED - ORR
S.no Link Information Length (km)
1 Sinnar Phata to Soubhagya Nagar 2.43
2 Soubhagya Nagar to Pandavlene 10.76
3 Bardan Phata to Makhmalabad (outside NMC) 4.75
4 Makhmalabad Naka to Adgaon 14.20
5 Adgaon to Sultanpur 4.50
6 Sultanpur to Panchak 3.56
6.2.3. ROAD INFRASTRUCTURE (BRIDGES/RAIL CROSSINGS)
Adequate and properly maintained road infrastructure is always necessary to support smooth flow of passengers. More efficient infrastructure will enable better mobility for people and goods as well as provide better connection between regions. Nashik being a region with rivers and canals road infrastructure should be well supported to surpass these natural barriers.
The study, recognizes that there is a need for two bridges - Gadekar Mala Road to Deolali Camp Road (Crossing and and at Vadner Dumala Gaon locations in order to facilitate the creation of an Outer Ring Road for the City. Figure 6-16 shows the proposed bridge locations.
FIGURE 6-16 Proposed Rail and River Over Bridge Locations
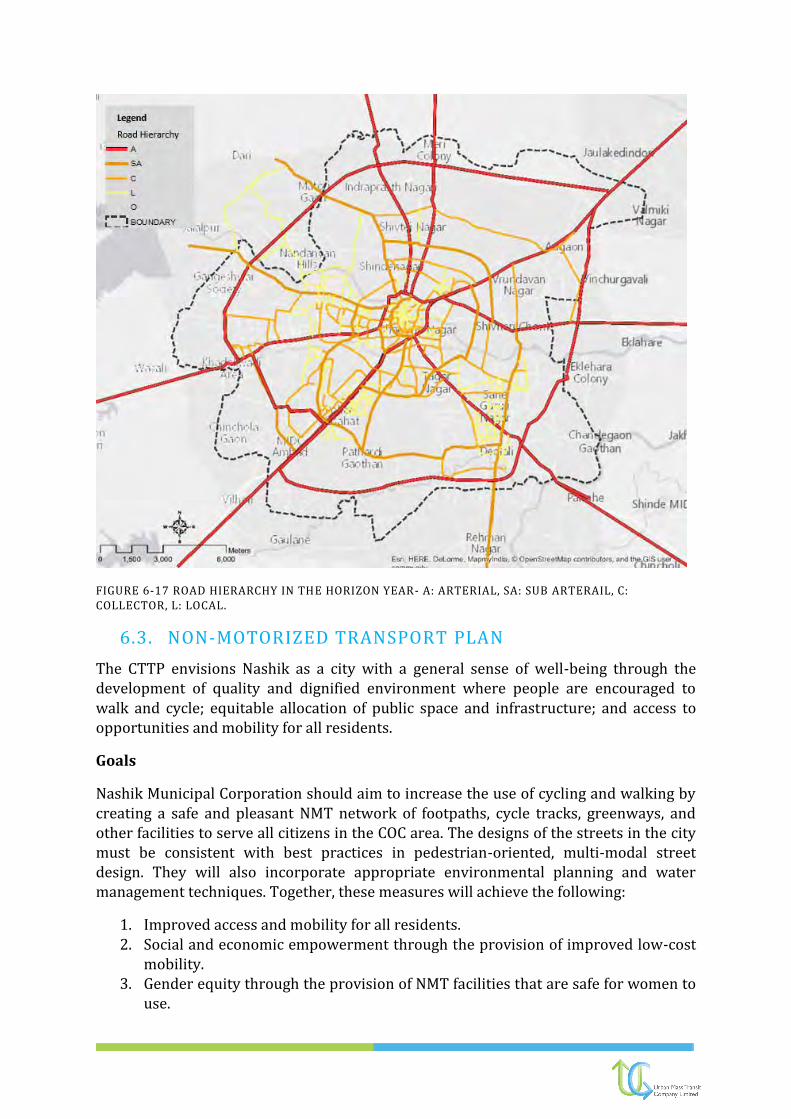
FIGURE 6-17 ROAD HIERARCHY IN THE HORIZON YEAR- A: ARTERIAL, SA: SUB ARTERAIL, C: COLLECTOR, L: LOCAL.
6.3. NON-MOTORIZED TRANSPORT PLAN
The CTTP envisions Nashik as a city with a general sense of well-being through the development of quality and dignified environment where people are encouraged to walk and cycle; equitable allocation of public space and infrastructure; and access to opportunities and mobility for all residents.
Goals
Nashik Municipal Corporation should aim to increase the use of cycling and walking by creating a safe and pleasant NMT network of footpaths, cycle tracks, greenways, and other facilities to serve all citizens in the COC area. The designs of the streets in the city must be consistent with best practices in pedestrian-oriented, multi-modal street design. They will also incorporate appropriate environmental planning and water management techniques. Together, these measures will achieve the following:
1. Improved access and mobility for all residents. 2. Social and economic empowerment through the provision of improved low-cost
mobility. 3. Gender equity through the provision of NMT facilities that are safe for women to
use.

4. Social inclusion in creating NMT facilities that follow principles of universal design and are usable to the greatest extent possible by everyone, regardless of his or her age, ability, or status in life.
5. Reduced local and global environmental impacts of COC’s transport system through expanded use of zero pollution modes.
6. A changed culture that accepts the use of cycling and walking as acceptable and aspirational means to move around in the city.
7. Participation of local residents, businesses, and other stakeholders in the preparation of designs and standards in order to foster the community’s active use and sense of ownership of these spaces.
6.3.1. DEVELOPMENT OF FOOTPATHS
Pedestrian trips are generally short trips and can be observed everywhere in a city. And hence, ideally pedestrian walkways should be provided on all major roads and streets in the city. However, special consideration for pedestrians should be given near junctions (dangerous intersections), major activity nodes (like schools, colleges, etc.).
Safe Route to Schools programs should be conducted and should be encouraged to follow in all the schools in Nashik. The streets accessing the schools should be designed for pedestrians.
The smaller local streets/residential streets may not have sufficient width to provide a segregated pedestrian walkway. But these residential streets should also provide safe route to pedestrians. This can be achieved by
a) limiting the speed of motorized vehicles

b) installing speed breakers at frequent intervals
c) Providing table top crossings etc.
Comprehensive Traffic and Transportation Plan for Nashik has identified all the major spines of Nashik for immediate need of footpaths. All the junctions in Nashik should be designed with due consideration for pedestrians.
The footpath design should be uniform across the city. Depending on the volume of pedestrians, the area requires footpaths with minimum width of 1.8m and maximum height of 150mm from the finished road surface. In certain cases, where the available road RoW makes it difficult to provide 1.8 m barrier free space for footpaths, the widths can be reduced to a minimum of 1.2 m. However, the maximum width of 150 mm cannot be compromised in any circumstance. Increasing the footpath height to more than 150 mm makes them unusable by pedestrians, thereby defeating the purpose of providing the footpaths.
Accordingly, CTTP has identified 150 km of roads within NMC where the footpaths have to be built immediately or the existing footpath should be reconstructed according to the design standards. And local authorities should develop the footpaths in all other streets following the development of footpaths in the priority streets.

FIGURE 6-18 PROPOSED FOOTPATH NETWORK IN NASHIK
TABLE 6-4 Proposed Footpath Roads
S.no Name Stretch Length (km)
1 ITI-Ambad Link Road ITI to DGP 2 Bus Stop 3.76
2 Untawadi Road Mico Circle to Trimurti Chowk 2.12
3 Kamathwade Road Trimurti Chowk to DGP2 1.59
4 Satpur-Ambad Link Road Papaya Nursary to Chunchale phata 3.30
5 Ambad-Pathardi Road Pathardi Phata to Ambad Bus stop 2.29
6 Uttamnagar Road Trimurti Chowk to Upendranagar bus stop 2.77
7 Ambad-Satpur Link Road Garware to Chunchale phata 2.49
8 Canal Road Indira Nagar to Mico 2.37
9 Pelican Park Road Rane Nagar bus stop to CIDCO college 1.42
10 Vijay Nagar Road 2.40
11 NH3 Garware to Mumbai Naka 6.43
12 Tilak Road Dwarka to Shalimar 1.56
13 Shivaji Road CBS to Shalimar 0.46
14 Old Agra Road Ashok Stambh to Mumbai Naka 2.27
15 MG Road Meher chowk to Katya Maruti 1.70
16 Old Agra Road Ramwadi to NH3 2.40
17 Ravivar Karanja Road Nimani To Shivaji Road 1.83
18 Abdul Hamid to Damodar Theatre 1.09
19 Amardham Road Dwarka to Katya maruti 1.95
20 Sarda Circle to Gadkari Chowk GPO Road 2.05

S.no Name Stretch Length (km)
21 NH3 Mumbai Naka to Aurangabad Naka 3.65
22 Jail Road Bytco to Nandur Naka 4.92
23 Old Saikheda ROad Sailani Baba to Ichhamni lawns 2.92
24 Tapovan Road Nashik Pune Highway to samta nagar 1.23
25 Kathe Lane Kathe Galli Chowk to Takli road 1.06
26 Tapovan Road Nashik Pune Highway to Takli road 1.40
27 Narayan Bapu Chowk Road Sailani Baba to Narayan Bapu chwok 0.59
28 Panchak Road Panchak to Sailani Baba 1.72
29 Canal Road Upanagar Bus Stop to Jail Road 2.31
30 Takli Road Takli Phata to Tapovan road 0.97
31 Gangapur Road Ashok Stambh to Pipeline road 4.30
32 Trimbak Road Modak Point to Amrut Garden 6.94
33 Sharanpur Link Road Old Gangapur naka to Mico 1.46
34 Sharanpur Road CBS to Canada Corner 1.30
35 College Road Canada Corner to Lokmat circle 1.72
36 Mahatma Nagar Road Jehan circle to ABB 2.00
37 Shramik Nagar Road Amrut Garden to Bardan Phata 5.09
38 Satpur MIDC road Satpur Bus stand to Shramik Nagar 3.21
39 Pipeline Road Pipeline road junction to Satpur MIDC 2.45
40 Gangapur Road Pipeline road junction to Bardan Phata 2.81
41 NH3 Aurangabad Naka to Konark Nagar 4.06
42 Hirawadi Road Katya Maruti To Hirawadi 2.02
43 Meri Link Road Hirawadi to Makhmalabad road 2.92
44 Makhmalabad Road Makhmalabad naka to Mandlik mala 1.78
45 Peth Road Peth Naka to Rau Hotel 3.81
46 Dindori Road Makhmalabad naka to Nimani 4.46
47 Ambedkar Road Shivaji Chowk to Railway Station 0.52
48 Lam Road Bytco Chowk to Deoliali 1.87
49 NH50 Dwarka to Shivaji Chowk 6.58
50 Sawta Mali Road DGP Chowk to Indira Nagar 4.09
51 Wadala Pathardi road wadala Naka to Pathardi 5.78
52 Pathardi Phata Road Pathardi Phata to Pathardi 2.21
53 Jai Bhavani Road Upanagar Bus Stop to Artilary Road 2.51
54 Arty Road Lam Road to Jai Bhavani road 1.07
55 Datta Mandir Road Datta Madir Chowk to Artilary road 1.00
56 Indira Nagar Road Kalanagar bus stop to Lekha nagar bus stop 0.98
57 Ashoka Marg Vijay Mamta to Wadala Pathardi road 1.96
58 Bhabha Nagar Road Kathe Galli Chowk to Mumbai Naka 1.55
6.3.2. DEVELOPMENT OF CYCLIST-FRIENDLY STREETS
Cycling is increasingly recognized as a clean, sustainable mode of transport and an essential part of an inter-modal plan for sustainable urban travel. More cycling in urban areas in place of car use could contribute to less energy consumption from travel activity and reduced congestion. Increasing cycling could be a promising way to contribute to the reduction of greenhouse and other emissions. More than capturing the captive users to use the cycles for movement, the development of cycle tracks should attract more uninterested citizens to use cycles.
Bicycle friendly streets are designed considering following principles:

• Safety: Segregated cycle tracks for increased sense of security and safe route to schools and bus stops.
• Connectivity: The NMT network should connect major attractions and a complete consistent network with fewer missing links.
• Comfort: A more comfortable pedestrian and cycle path with facilities to support and encourage the use of NMT.
• Ambience: To make cycling a pleasant and great experience to its users.
Design Appropriate Measures
Once appropriate measures conforming to a city’s cycle policy have been selected, they should be designed appropriately. Most cities worldwide tend to adopt and develop their own detailed design guidelines, however the following section provides guidance on the basic design of common measures and can be used as advisory design notes.
NMV lanes can generally be classified into four main categories as listed below.
Types of NMV Lane
Type Cross Section
Type I NMV Lane
NMV lanes shared with MVs and designated by signs
Type II NMV Lane
NMV lanes designated by lane markings (e.g. striping) and within the highway right-of-way
Type III NMV Lane
NMV-exclusive lanes physically separated from MVs by barriers (e.g. concrete blocks, steel railing, raised curb) and within the highway right-of-way

Type IV NMV Lane
NMV-exclusive lanes within an independent right-of-way (often referred to as NMV paths)
Minimum recommended widths for bicycle lanes vary from country to country, however they typically fall within the range of 1.2–2.0 meters, which allows for the physical width of a bicycle’s handlebar plus a margin of safety. For different NMV types, recommended lane widths are provided in Table 5.
Recommended NMV Lane Width
NMV Type Type II Lane Type III & IV Lanes
Increment Increase
Minimum Standard Minimum Standard Minimum Standard
Bicycles 1.2 1.4 1.5 1.5 1.0 1.0
Cycle-Rickshaws
1.8 2.3 2.3 2.5 1.5 1.7
Animal Carts 2.0 2.4 2.5 2.7 1.7 1.8
Note: These NMV lanes are considered to operate as one-way facilities
In cities with high use of one or more NMV types, these lanes should be widened to provide sufficient capacity. The recommended increment to increase the width of the facility is also provided in the Table.
The recommended maximum gradient of NMV lanes should be no greater than 5%. This is the maximum slope that would still allow safe downhill speeds and reasonable climbing effort for NMV operators.
If Type II, III, or IV NMV lanes are to be provided, a certain percentage of expected (or observed) NMV traffic volume during the peak hour should be used to determine the number of NMV lanes that would be required to meet demand. An indication of volume/hour that could be accommodated by type of lane is shown in Table 6.

Maximum NMV Demand by Type of NMV Lane
Type II Types III & IV
Bicycles 1,210 2,070
Cycle-Rickshaws 640 1,120
Animal Carts 310 570
Note: These NMV lanes are considered to operate as one-way facilities
NMV lanes for Nashik
Total for 54 km of dedicated bicycle tracks along with 93.5km of shared NMT routes are proposed in the plan connecting important activity centers and trip attractors. The bicycle tracks can be classified in three different categories.
FIGURE 6-19 PROPOSED CYCLE TRACKS BY TYPE
Given its considerable share of cycle trips, Nashik needs to improve the infrastructure to create a safe environment for its cyclists. Table 6-5 presents list of proposed dedicated bicycle lanes and allied infrastructure.

Table 6-5 List of Proposed NMV lanes
S. No
Name Stretch Length (km)
Dedicated NMV Lanes
1 Ambad-Pathardi Road Pathardi Phata to Ambad Bus stop 2.29
2 Canal Road Indira Nagar to Mico 2.37
3 NH3 Garware to Mumbai Naka 6.43
4 NH3 Mumbai Naka to Aurangabad Naka 3.65
5 Jail Road Bytco to Nandur Naka 4.92
6 Tapovan Road Nashik Pune Highway to Takli road 1.40
7 Trimbak Road Modak Point to Amrut Garden 6.94
8 Shramik Nagar Road Amrut Garden to Bardan Phata 5.09
9 Satpur MIDC road Satpur Bus stand to Shramik Nagar 3.21
10 NH3 Aurangabad Naka to Konark Nagar 4.06
11 Peth Road Peth Naka to Rau Hotel 3.81
12 Sawta Mali Road DGP Chowk to Indira Nagar 4.09
13 Wadala Pathardi road wadala Naka to Pathardi 5.78
Shared NMV Lanes 1 ITI-Ambad Link Road ITI to DGP 2 Bus Stop 3.8
2 Untawadi Road Mico Circle to Trimurti Chowk 2.1
3 Kamathwade Road Trimurti Chowk to DGP2 1.6
4 Satpur-Ambad Link Road
Papaya Nursary to Chunchale phata 3.3
5 Uttamnagar Road Pathardi Phata to Ambad Bus stop 2.8
6 Ambad-Satpur Link Road
Trimurti Chowk to Upendranagar bus stop 2.5
7 Pelican Park Road Garware to Chunchale phata 1.4
8 Vijay Nagar Road 2.4
9 Tilak Road Dwarka to Shalimar 1.6
10 Shivaji Road Shalimar to CBS 0.5
11 Old Agra Road Ashok Stambh to Mumbai Naka 2.3
12 MG Road Meher chowk to Katya Maruti 1.7
13 Old Agra Road Ramwadi to NH3 2.4
14 Ravivar Karanja Road Nimani To Shivaji Road 1.8
15 Abdul Hamid to Damodar Theatre 1.1
16 Amardham Road Dwarka to Katya maruti 1.9
17 GPO Road Sarda Circle to Gadkari Chowk 2.1
18 Old Saikheda ROad Sailani Baba to Ichhamni lawns 2.9
19 Tapovan Road Nashik Pune Highway to samta nagar 1.2
20 Kathe Lane Kathe Galli Chowk to Takli road 1.1
21 Narayan Bapu Chowk Rd
Sailani Baba to Narayan Bapu chwok 0.6
22 Panchak Road Panchak to Sailani Baba 1.7

S. No
Name Stretch Length (km)
24 Canal Road Upanagar Bus Stop to Jail Road 2.3
25 Takli Road Takli Phata to Tapovan road 1.0
26 Gangapur Road Ashok Stambh to Pipeline road 4.3
27 Sharanpur Link Road Old Gangapur naka to Mico 1.5
28 Sharanpur Road CBS to Canada Corner 1.3
29 College Road Canada Corner to Lokmat circle 1.7
30 Mahatma Nagar Road Jehan circle to ABB 2.0
31 Pipeline Road Pipeline road junction to Satpur MIDC 2.5
32 Gangapur Road Pipeline road junction to Bardan Phata 2.8
33 Hirawadi Road Katya Maruti To Hirawadi 2.0
34 Meri Link Road Hirawadi to Makhmalabad road 2.9
35 Makhmalabad Road Makhmalabad naka to Mandlik mala 1.8
36 Dindori Road Makhmalabad naka to Nimani 4.5
37 Ambedkar Road Shivaji Chowk to Railway Station 0.5
38 Lam Road Bytco Chowk to Deoliali 1.9
39 NH50 Dwarka to Shivaji Chowk 6.6
40 Pathardi Phata Road Pathardi Phata to Pathardi 2.2
41 Jai Bhavani Road Upanagar Bus Stop to Artilary Road 2.5
42 Artilary Road Lam Road to Jai Bhavani road 1.1
43 Datta Mandir Road Datta Madir Chowk to Artilary road 1.0
44 Indira Nagar Road Kalanagar bus stop to Lekha nagar bus stop
1.0
45 Ashoka Marg Vijay Mamta to Wadala Pathardi road 2.0
46 Bhabha Nagar Road Kathe Galli Chowk to Mumbai Naka 1.5
BICYCLE SHARING SCHEME
Public Bicycle Sharing is one of the emerging mode of transport system. In this system bicycle docking stations are provided across the city at important locations. User can rent a bike for short duration from one docking station and return it same or any docking station in the city. Based on the duration of use bicycle users is charged nominal fees. Such system can act as feeder system to other public transport system and help in improving the first and last mile connectivity.
Conceptually the system works on a hub-and-spoke model. Typically, there is a main docking station and 6-7 sub-stations within a catchment area of 2.5 to 3 kms. The main docking station can accommodate around 25-30 bicycles and is usually installed next to a transit node. The sub-stations are located nearby in residential colonies, work centers or commercial hubs, as the case may be. A person willing to rent a cycle, goes to either the main docking station or any of the sub-stations, pays a membership fee and fills in a membership form containing certain details of the user, (both being a one-time affair), swipes a smart-card issued to him, and takes the cycle. To deposit the cycle, he goes to any docking station and swipes the card which deducts the rent for his usage period and

deposits the cycle. To avail of the membership, he can go to any docking station, fill up the membership form and pay the membership fees or otherwise do it through the internet as per his convenience.
For Nashik city docking stations are proposed at following locations:
Main Docking Station Sub Stations
CBS
Canada Corner
MG road
Pandit Colony
Golf Club
Shalimar
Ravivar Karanja
Doodh Bazar
Bhadrakali
Sarda Circle
Dwarka
KTHM College
Mahajan Garden
Saptarang Circle
Jehan Circle
College Road
Nimani Bus Stand
Panchvati Karanja
Peth Naka
Ghat Area
The development of bicycle friendly streets and Non-Motorized Transport Plan for Nashik is addressed by proposing area based NMT recommendations. The recommendations include:
a) Redevelopment of streets in the area considering pedestrians and cyclists
b) Provision of public bike sharing and docking stations

c) Creation of pedestrian malls d) Removal of on street parking etc.
Accordingly, multiple urban areas in Nashik has been categorized based on the land use of the area Figure 6-20. The land use classification used is
Core City Area/ Area with Heritage Importance Other Urban Areas
Panchavati College Road Area
Nashik Road Area
The characteristics including Right of Way, Historical Importance, Land Use and Gradient are considered further to select the area for the preparation of NMT Plan. Consequently, area based NMT Plans are prepared for Panchavati, College Road and Nashik Road area. The NMT plans for all the areas are discussed in detail in following sub-sections.
FIGURE 6-20 LOCATIONS FOR AREA BASED NMT PLAN

6.3.3. AREA-WISE NMT RECOMMENDATIONS
1. Core city area (Panchavati)
Like other city’s core area of Nashik also suffers from narrow and irregular ROWs, unplanned development and encroachments. This area is important from religious point of view as it hosts the Kumbh Mela and has many temples located within it. Along with these major trip attractors like bus terminal (CBS, Nimani), schools and colleges as well as important institutional buildings like Civil Court and District collectors office are located in the area. The core city area also consist of commercial land use on MG Road, Panchavti Karanja Area and Ravivar karanja Area.
Footpaths are present on Tilak Road near Ganjmal Area but are encroached by vendors. Similar case is found near Nehru Garden as well. Due to one way traffic rules in Shalimar area buses coming from Nimani to Nashik Road or Pathardi cannot come via CBS hence most passengers have to walk or take another mode like auto to reach Shalimar to catch a bus. This create major pedestrian traffic between CBS and Shalimar, however no footpaths are provided for the stretch. The ROW in the area varies from 6m in residential area to 30m on Old Agra Road.
Considering these, the following recommendations are made for the area along major stretches.
Central Bus terminal is located on Old Agra Road along with Civil Court and District
Collector’s Office. Shared bicycle lanes are proposed for the stretch.
For connectivity between CBS Bus stand and Shalimar bus, elevated pedestrian
walkway is proposed, with access to the walkway at CBS Chowk, Amdebkar statue,
Shalimar Hotel and Shalimar Bus stop.
No dedicated cycle tracks are proposed for this area and carriage way is shared with
regular traffic.
In the area where ROW is narrow and dedicated footpaths cannot be provided,
speed restrictions should be imposed and speed calming measures like speed
breakers should be constructed.
Special care is to be taken at schools and colleges, barricaded footpaths should be
provided near ITI College, Ravivar Karanja road, MG road where higher pedestrian
traffic is expected.
In the Ghat area considerable footfalls are expected during the weekends. Holkar
Bridge to Gadge Maharaj Bridge Stretch is converted to Pedestrian only stretch
during the weekend. Vehicular traffic is diverted on Panchavati Karanja to Gadge

Maharaj Bridge Stretch. Footpaths are proposed in the roads connecting to Kalaram
Mandir.
Signals are installed on CBS chowk, Gadkari Chowk and Modak Chowk for traffic
management, pedestrian phase of least 10 sec. should be added to the signal cycle
time.
College Road Area:
College road is one of the prime localities in the city. College road, Gangapur
Road and Mahatma Nagar road are major roads in the area. The area is highly
commercialized with majority of commercial establishments along these three road.
BYK College and PTA Kulkarni College are located on college road whereas KTHM
College is located on Gangapur road. Varity of shops are present on Gangapur road and
Mahtma Nagar from small shops to showrooms whereas malls and food joints are
located on Collge road.
NMT plan for college road:

College road is mostly congested during the evening peak hours due to presence
of colleges and food joints. Four wheeler traffic should be restricted on Canada
corner to PTA Kulkarni Chowk Stretch during peak hours and can be diverted on
Gangapur road and other adjacent parallel streets.
Paid parking is proposed on D’Souza colony road and Thatte Nagar road and
Arora mall on Canada Corner hence no parking should be allowed on College
Road. Excess parking can be provided on Ramdas colony road and Kusumagraj
Marg.
Gangapur road is 6 lane road and footpaths are provided however footpaths are
at grade at many locations and are encroached by vendors and parked cars.
Raised footpaths are proposed for all the streets and all the encroachments
should be removed. Authorized vending places should be provided for street
vendors by converting the parking spaces into vending places.
Shared bicycle lane are provided on all the three roads.
Nashik Road Area:
Nashik railway station is located in this area. Ambedkar Road, Lam Road, Nashik-
Pune Highway are the important roads in the area. Lam Road and Ambedkar Road are
highly commercialized. Ambedkar Road connects Nashik Railway station to Nashik
Pune Highway and majority of establishments along the road are hotels. It’s a 4 lane
road and footpaths on this street are encroached by on street vendors. Major tourist
attraction - “Muktidham Temple”,is located on Lam Road. Somani Garden which also
major trip attractor is on the road. Vegetable market is located under the flyover on
Nashik-Pune Highway which is a major trip attractor.
Following Recommendations are made for the area:
Safe and encroachment free footpaths should be provided from Nashik railway
station to Nashik-Pune Highway.
Auto Stand near Shivaji Chowk can be shifted under flyover which is currently
located in the junction area which will help utilized the area currently occupied
by autos.
Somani Garden road is to be converted to NMT only corridor and traffic on this
road to shifted to adjacent parallel street (Sneha Bandhan Colony and Artillery
Center road)
Pedestrian crossings should be provided on Nashik Pune Highway for people to
access the vegetable market.
Parking should be restricted on this road and relocated to internal roads.
Authorized vending places are to be provided to the street vendors by
converting on-street parking lots hence providing encroachment free footpaths.
Raised footpaths are proposed in the area along with shared bicycle lanes.

6.4. PUBLIC TRANSPORT IMPROVEMENT PLAN
Public transport is one of the most environmentally sustainable forms of transport. CTTP divides public transport improvement plans into a number of sections, including service improvements for buses, trams and para-transit, appropriate Mass Rapid Transit (MRT) Options and infrastructure development plans and intermodal integration plans.
Provision of Public transport is complex and in order to evolve an effective and efficient service, it is necessary to understand this complexity. The complexity exists both within the organization of a service provider and the environment in which the service provider operates. As the external environment impacts the transport system to a large extent, it is necessary for the external environment to be examined properly. Similarly, the internal sub-systems need to be fully appreciated. Adopting a correct and well-informed approach is a pre-requisite for improving public transport.
At present bus transport is the sole public transport system in operation in Nashik. MSRTC (Maharashtra State Road Transport Corporation) provides the public transport services.
The public transport system for Nashik should be convenient, efficient, affordable, reliable and integrated. Improving the existing public transport involves infrastructure improvements like reserving lanes and tracks and operational improvements like

optimizing routes and schedules. The improvement in public transport is likely to not only maintain the existing modal share of public transport, but also to create a shift from other modes to public transport.
Public transport system planning will not only consider where terminal, routes and stops are placed but also whether they are accessible to all potential users. The plans for the system should take into account the accessibility issues for pedestrians and cyclists, the differently abled and elderly people as well as private vehicle users after they have parked their vehicles.
The proposals under public transport improvement plan are:
a) Rationalization of existing city bus services for efficient public transport
systems
b) Development of mass rapid transit systems.
c) Restructuring and reviving of the water transport (ferry services for public
transportation)
d) Ensuring multi-modal integration in public transport
e) Providing adequate infrastructure facilities for public transport in terms of
intermodal mobility hubs, bus stops
f) Implementation of ITS to improve the reliability of public transport systems
g) Promoting public participation and campaigning mass awareness programs.
6.4.1. ROUTE RATIONALIZATION AND FLEET AUGMENTATION
NEED FOR ROUTE RATIONALIZATION
The existing bus routes need modification as there are multiple overlapping bus routes running across the city. But the existing bus route network is able to cater to almost all the major production and attractions in the area. The present structure of routes in Nashik has led to higher frequencies, bunching of buses, over speeding and lower patronization for public transport. Comprehensive Traffic and Transportation Plan has identified the need to update the route and schedules which in technical terms is called as route rationalization plan.

ROUTES TO BE RATIONALIZED TABLE 6-6 BUS ROUTES AND TRIPS OF MSRTC BUSES IN NASHIK
No. of Bus Trips per Route % Bus Routes % Bus Trips
1 50.6% 5.0%
2 17.0% 8.0%
3 7.0% 5.6%
4 4.9% 5.6%
5 3.4% 5.0%
10 11.0% 24.5%
15 2.2% 8.7%
20 1.3% 7.7%
25 0.6% 4.3%
>=25 1.9% 25.4%
At present, there are 508 city bus routes and with 243 buses operating in NMC. However, among these routes, 67 % of city bus routes undertake only 1 or 2 trips. The route rationalization plan for Nashik has been done based on the trunk feeder network concept. Trunk line will be provided in the corridors with high PHPDT. These lines will have comparatively low frequency and will have high capacity buses or mass rapid transit systems running. Since, the mass rapid transit proposals put forward in the earlier sub section is a long term strategy, the route rationalization plan has to be implemented in short term with the trunk line as buses.
The route rationalization plan has identified the routes that need modification; that are to be terminated and retained. The details are given in Table 6-7.
TABLE 6-7 Route Rationalization Proposals
Total No. of Routes 508
Total No. of Routes for termination 316
Total No. of Routes for Retaining 192
BUS AUGMENTATION
Based on the route rationalization plan prepared, the number of buses required in Nashik for the horizon years are computed. CIRT norms suggest 0.4 buses per thousand population in order to achieve an indicative LoS of 1.
TABLE 6-8 FLEET REQUIREMENT OVER THE YEARS IN NASHIK
Fleet Requirement (MoUD norm) 2016 2021 2026 2031 2036
Existing Bus Fleet 243
Proposed Bus Fleet 698 820 963 1131 1329
Addl. Fleet Required 455 122 143 168 198
Fleet Requirement (SUT Scenario demand) 2016 2021 2026 2031 2036
Existing Bus Fleet 243
Proposed Bus Fleet 1047 1230 1445 1697 2059
Addl. Fleet Required 804 183 215 252 362
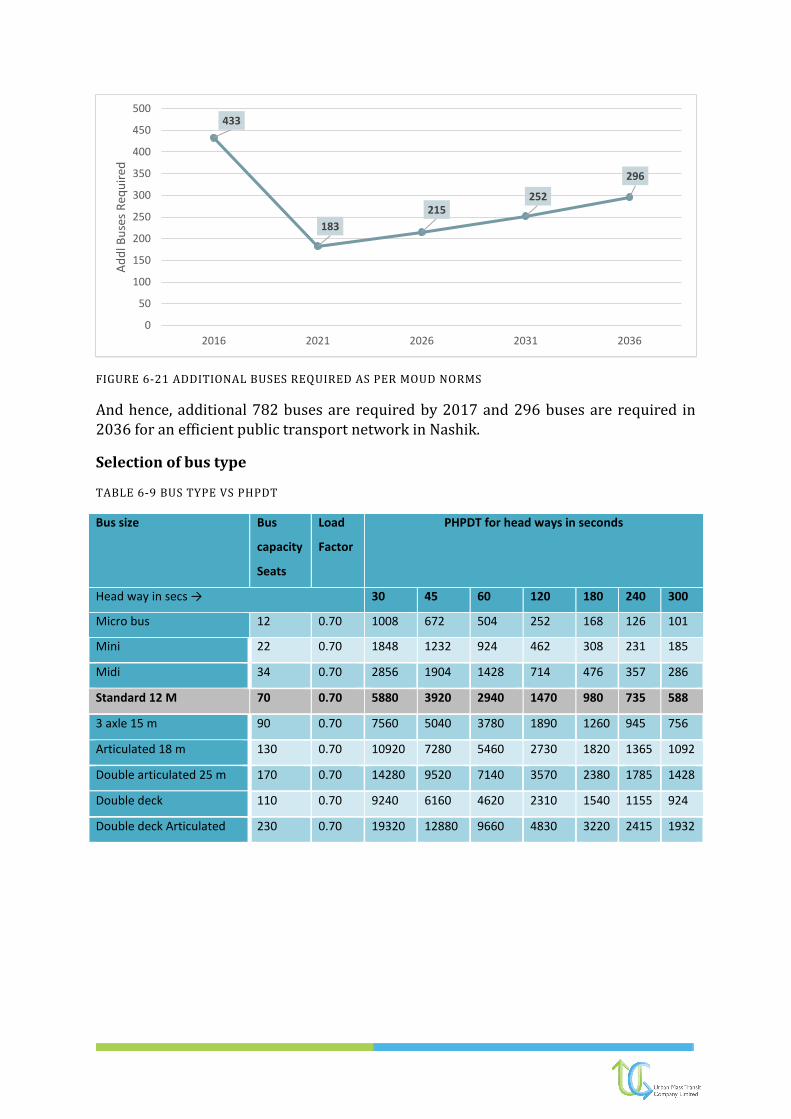
FIGURE 6-21 ADDITIONAL BUSES REQUIRED AS PER MOUD NORMS
And hence, additional 782 buses are required by 2017 and 296 buses are required in 2036 for an efficient public transport network in Nashik.
Selection of bus type
TABLE 6-9 BUS TYPE VS PHPDT
Bus size Bus
capacity
Seats
Load
Factor
PHPDT for head ways in seconds
Head way in secs → 30 45 60 120 180 240 300
Micro bus 12 0.70 1008 672 504 252 168 126 101
Mini 22 0.70 1848 1232 924 462 308 231 185
Midi 34 0.70 2856 1904 1428 714 476 357 286
Standard 12 M 70 0.70 5880 3920 2940 1470 980 735 588
3 axle 15 m 90 0.70 7560 5040 3780 1890 1260 945 756
Articulated 18 m 130 0.70 10920 7280 5460 2730 1820 1365 1092
Double articulated 25 m 170 0.70 14280 9520 7140 3570 2380 1785 1428
Double deck 110 0.70 9240 6160 4620 2310 1540 1155 924
Double deck Articulated 230 0.70 19320 12880 9660 4830 3220 2415 1932
433
183
215252
296
0
50
100
150
200
250
300
350
400
450
500
2016 2021 2026 2031 2036
Ad
dl B
use
s R
equ
ired

FIGURE 6-22 MAJOR PT CORRIDORS
Bus Terminals
The CTTP suggests that the buses reaching the city form Pune, Mumbai , Ahmednagar , etc. should be terminated at Mahamarg Bus Stand in order to decongest the Central Bus stand. Mahamarg has the capacity to handle such a traffic and also enjoys good connectivity with the rest of the city. CBS – Old and New, Mela Bus Stand are proposed to only handle city bus services.
TABLE 6-10 LOCATION AND CAPACITY OF EXISTING BUS TERMINALS IN THE CITY
S No Terminal Area in Acres Capacity (no. of buses)
1 Old CBS 1.5 31
2 New CBS+ Mela Bus Stand 7.9 158
3 Satpur 5.9 118
4 Nashik Road 1.0 21
5 Nimani 1.5 31
6 Mahamarg 47.4 948
7 Deolali 0.3 7
Depot
1 Panchavati 5.8 115
2 MSRTC Divisional Workshop 4.9 98

6.4.2. HIGHER ORDER MASS TRANSIT SYSTEMS
The amount of space required to transport the same number of passengers: car, bicycle, and bus. Source: Poster displayed at the City of Muenster Planning Office, August 2001
A Mass Transit System is designed to move large numbers of people at one time. Mass Rapid Transit system usually runs in special guideways which will lead to lower travel time, and decreased congestion.
A number of technologies are available for public transport and as some of the technologies, especially metro rail, are highly capital intensive, it is necessary to have certain guidelines for choice of different modes. However, it is emphasized that buses are and will continue to be the major mode of public transport in Nashik, and hence citywide organized city bus service as per urban bus specifications is required.
Need For A Mass Transit System
From energy efficiency point of view, the use of mass transit is vastly superior when compared to using personalized modes of travel. Available literature shows that, to meet each kilometer of passenger travel demand: A. A car consumes nearly five times more energy than a
52 seater bus with 82% average load factor B. A car occupies over 38 times more road space per
passenger in comparison to a bus C. The fuel cost of two wheelers is 6.8 times, three
wheelers 7 times and cars 11.8 times when compared to a bus.
(Source: UNDP Reference Guide, Vol 2 : Public Transport – 2013, MoUD, GoI)
Selection Criteria
A. Effectiveness of mode in meeting demand B. Cost C. Right of way availability D. Environmental Impact E. Journey Time F. Safety G. Comfort H. Flexibility I. Reliability J. Fare K. Technical Sophistication L. Implementation Complexities M. Image
The guidelines for selection of mass rapid choice for the city is given Table 6-11 as specified by working group for recommendations on 12th Five Year Plan of India.

TABLE 6-11 SELECTION OF MASS RAPID TRANSIT
Mode Choice Desirable PHPDT Population (Million) Average Trip Length (km)
Metro Rail # >15000 for at least 5 km continuous
length >=2 >7-8
LRT primarily at grade
<=10000 >1 >7-8
Monorail <=10000 >1 About 5-6
BRT >=4000 and up to 20000
>1 >5
Organized City Bus Service as per urban bus specifications
>1 lac, 50,000 in
case of hilly towns >2 to 3
The urban transport model developed for Nashik has evaluated the PHPDT values on all major corridors of Nashik (Urban Mobility Corridors) for 2036. The PHPDT values along the urban mobility corridors are shown in
TABLE 6-12 PHPDT Values along Mobility Corridors In 2036
Corridor No. Corridor Description PT PHPDT
1 Dindori Road 15562
2 Panchvati Karanja Road 14560
3 Nashik-Pune Road 14345
4 Trimbak Road 13991
5 Old Agra Road 12467
6 Nashik-Mumbai Highway 7723
7 Jail Road 7294
8 Lam Road 6769
9 Panchvati Road 5879
10 Peth Road 5672
11 Aurangabad Road 5490
12 Untawadi Road 4854
13 Proposed IRR 3747

FIGURE 6-23 ROUTES SUGGESTED FOR MASS RAPID TRANSIT SYSTEM
Based on the PHPDT values, the implementation of an appropriate Mass Transit System is recommended on four routes. However, feasibility studies and preliminary DPRs need to be carried in order to identify appropriate mass transit systems on the mobility corridors. However, this Study will indicate the possible systems to be implemented on the mobility corridors based on the forecasted PHPDT numbers and the right-of-way considerations.
Table 6-13 Proposed MRT system in Phases
Route no
From To Route Length (km)
2021 2026 2031 2036 Estimate
d MRT PHPDT
Route 1
Nashik Road Railway station
Shramik Nagar
17.8
Medium Capacity MRT System
High Capacity MRT System
8033
Route 2
Garware
Gangapur
15.8
Medium Capacity MRT System
3575
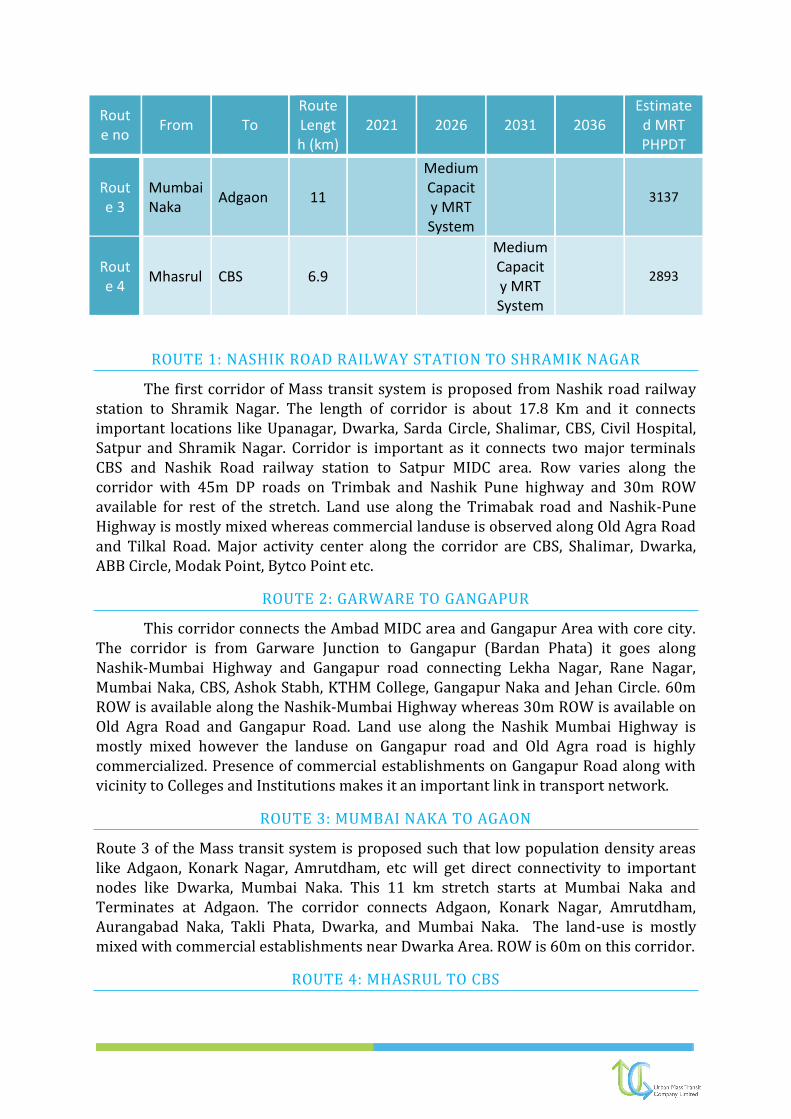
Route no
From To Route Length (km)
2021 2026 2031 2036 Estimate
d MRT PHPDT
Route 3
Mumbai Naka
Adgaon 11
Medium Capacity MRT System
3137
Route 4
Mhasrul CBS 6.9
Medium Capacity MRT System
2893
ROUTE 1: NASHIK ROAD RAILWAY STATION TO SHRAMIK NAGAR
The first corridor of Mass transit system is proposed from Nashik road railway station to Shramik Nagar. The length of corridor is about 17.8 Km and it connects important locations like Upanagar, Dwarka, Sarda Circle, Shalimar, CBS, Civil Hospital, Satpur and Shramik Nagar. Corridor is important as it connects two major terminals CBS and Nashik Road railway station to Satpur MIDC area. Row varies along the corridor with 45m DP roads on Trimbak and Nashik Pune highway and 30m ROW available for rest of the stretch. Land use along the Trimabak road and Nashik-Pune Highway is mostly mixed whereas commercial landuse is observed along Old Agra Road and Tilkal Road. Major activity center along the corridor are CBS, Shalimar, Dwarka, ABB Circle, Modak Point, Bytco Point etc.
ROUTE 2: GARWARE TO GANGAPUR
This corridor connects the Ambad MIDC area and Gangapur Area with core city. The corridor is from Garware Junction to Gangapur (Bardan Phata) it goes along Nashik-Mumbai Highway and Gangapur road connecting Lekha Nagar, Rane Nagar, Mumbai Naka, CBS, Ashok Stabh, KTHM College, Gangapur Naka and Jehan Circle. 60m ROW is available along the Nashik-Mumbai Highway whereas 30m ROW is available on Old Agra Road and Gangapur Road. Land use along the Nashik Mumbai Highway is mostly mixed however the landuse on Gangapur road and Old Agra road is highly commercialized. Presence of commercial establishments on Gangapur Road along with vicinity to Colleges and Institutions makes it an important link in transport network.
ROUTE 3: MUMBAI NAKA TO AGAON
Route 3 of the Mass transit system is proposed such that low population density areas like Adgaon, Konark Nagar, Amrutdham, etc will get direct connectivity to important nodes like Dwarka, Mumbai Naka. This 11 km stretch starts at Mumbai Naka and Terminates at Adgaon. The corridor connects Adgaon, Konark Nagar, Amrutdham, Aurangabad Naka, Takli Phata, Dwarka, and Mumbai Naka. The land-use is mostly mixed with commercial establishments near Dwarka Area. ROW is 60m on this corridor.
ROUTE 4: MHASRUL TO CBS

Route 4 of the mass transit system proposed along the Dindori Road and connects Mhasrul area to Core City area at CBS. The route is prosed such that it will connect Mashrul to CBS via Nimani, Panchvati Karanja, Ravivar Karanja, and Shalimar. Length of stretch is about 6.9km and it runs along the major core city roads like Panchvati Karanja Road, Ravivar Karanja Road etc. It also connects two bus terminals i.e. Nimani And CBS. Peth road which runs parallel to Dindori road will also benefit from this corridor. The Land use is mostly commercial along the stretch, with panchvati karanja and Ravivar karanja area observing very high commercial activity.
INTERMEDIATE PUBLIC TRANSIT / FEEDER SERVICES
Unreliable last mile connectivity impacts the overall quality and usage of mass transit and results in a mode share shift of public transport. While efforts are being made to enhance mass public transport, last mile connectivity has to be improved and linked into existing services.
An integrated system will aid ease of access for users. Auto-rickshaws and cycle-rickshaws not only act as good feeder services to these mass transit options but can also be a mode of choice for occasional or short trips. They play a key role in improving sustainability for urban transport. There is a need to introduce new models of regulation and reforms that can be adopted for a more efficient and safer system that enable the rickshaw to have an optimal role in the transport mix.
Due to the restrictive policies, IPT providers largely operate informally
1. Drivers lack job security and benefits 2. They also do not have documentation of income, which limits access to credit to
purchase their rickshaws 3. Drivers are often subjected to harassment and confiscation of vehicles 4. Negative environmental implications due to lack of regulation on emissions
Passenger service is also often poor
1. No regulation of fares 2. Little integration between modes due to lack of co-operation inconveniences
passengers 3. Lack of safety regulations puts passengers at risk 4. Concern for safety due to mixed traffic flow driven by growth in private vehicles
Attempts need to be made to organize IPT
1. Provide better service to passengers 2. Transparency of fares and complaints hotline 3. Driver behavior and road safety training 4. Dispatch services or “dial-a-rickshaw” 5. Include added features such as seatbelts, newspapers,etc. 6. Organisedrivers and provide basic insurance, credit and allowances 7. Tea vendors can co-ordinate bookings and dispatch in return for rent-free space
and a captive market of drivers 8. Medical and accident insurance and discounted medical facilities
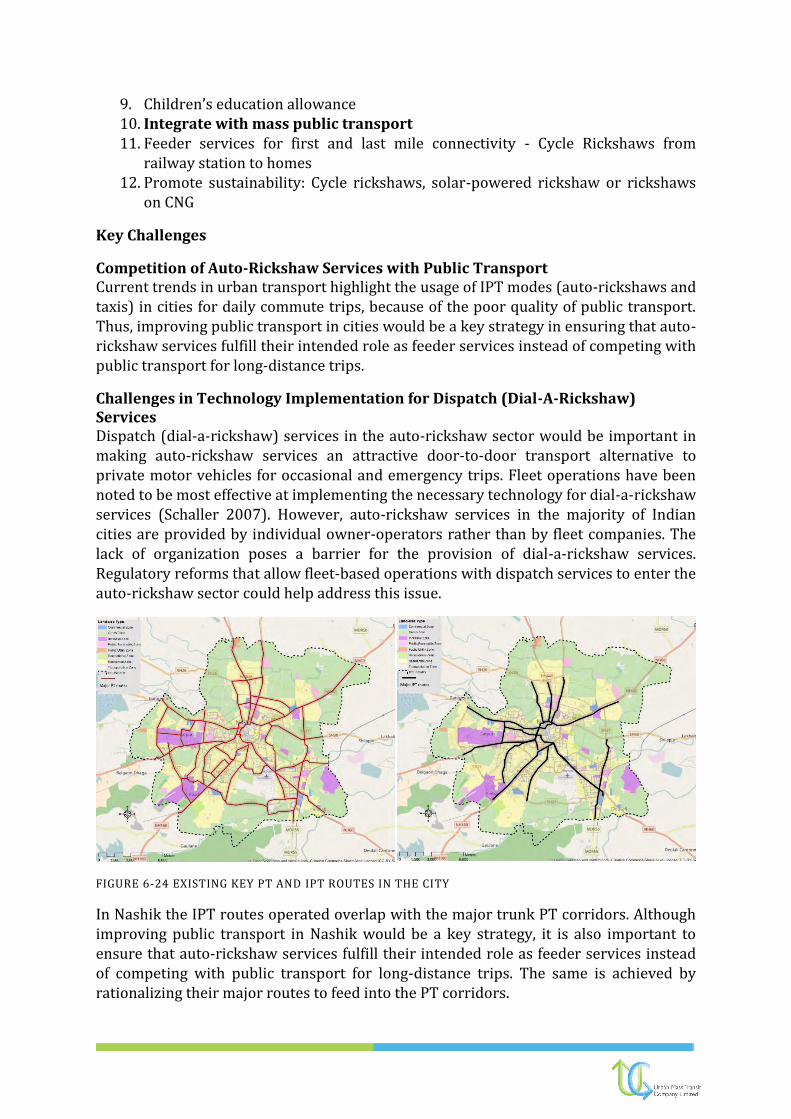
9. Children’s education allowance 10. Integrate with mass public transport 11. Feeder services for first and last mile connectivity - Cycle Rickshaws from
railway station to homes 12. Promote sustainability: Cycle rickshaws, solar-powered rickshaw or rickshaws
on CNG
Key Challenges
Competition of Auto-Rickshaw Services with Public Transport Current trends in urban transport highlight the usage of IPT modes (auto-rickshaws and taxis) in cities for daily commute trips, because of the poor quality of public transport. Thus, improving public transport in cities would be a key strategy in ensuring that auto-rickshaw services fulfill their intended role as feeder services instead of competing with public transport for long-distance trips.
Challenges in Technology Implementation for Dispatch (Dial-A-Rickshaw) Services Dispatch (dial-a-rickshaw) services in the auto-rickshaw sector would be important in making auto-rickshaw services an attractive door-to-door transport alternative to private motor vehicles for occasional and emergency trips. Fleet operations have been noted to be most effective at implementing the necessary technology for dial-a-rickshaw services (Schaller 2007). However, auto-rickshaw services in the majority of Indian cities are provided by individual owner-operators rather than by fleet companies. The lack of organization poses a barrier for the provision of dial-a-rickshaw services. Regulatory reforms that allow fleet-based operations with dispatch services to enter the auto-rickshaw sector could help address this issue.
FIGURE 6-24 EXISTING KEY PT AND IPT ROUTES IN THE CITY
In Nashik the IPT routes operated overlap with the major trunk PT corridors. Although improving public transport in Nashik would be a key strategy, it is also important to ensure that auto-rickshaw services fulfill their intended role as feeder services instead of competing with public transport for long-distance trips. The same is achieved by rationalizing their major routes to feed into the PT corridors.

It is proposed to provide 16 new IPT routes which will feed to the major trunk PT corridors. The list is given in Table 6-14.
FIGURE 6-25 KEY IPT ROUTES PROPOSED
TABLE 6-14 Feeder Route Details
S. No Route No Origin Destination Route Length(km)
1 1 Makhmalabad Dugav 12
2 2 Hotel Sebal Mandalik Mala 4.5
3 3 Mico Hunumanwadi 3.5
4 4 Nandur Mhasrul 10
5 5 Matori Gangapur naka 4.5
6 6 Katya Maruti Chowk Hirawadi 2
7 7 Mandalik Mala Amrut Dham 4.5
8 8 Gangapur Naka Mumbai Naka 4.5
9 9 Dwarka DGP Nagar 1 2.7
10 10 Indira Nagar Vijay Mamta 4.3
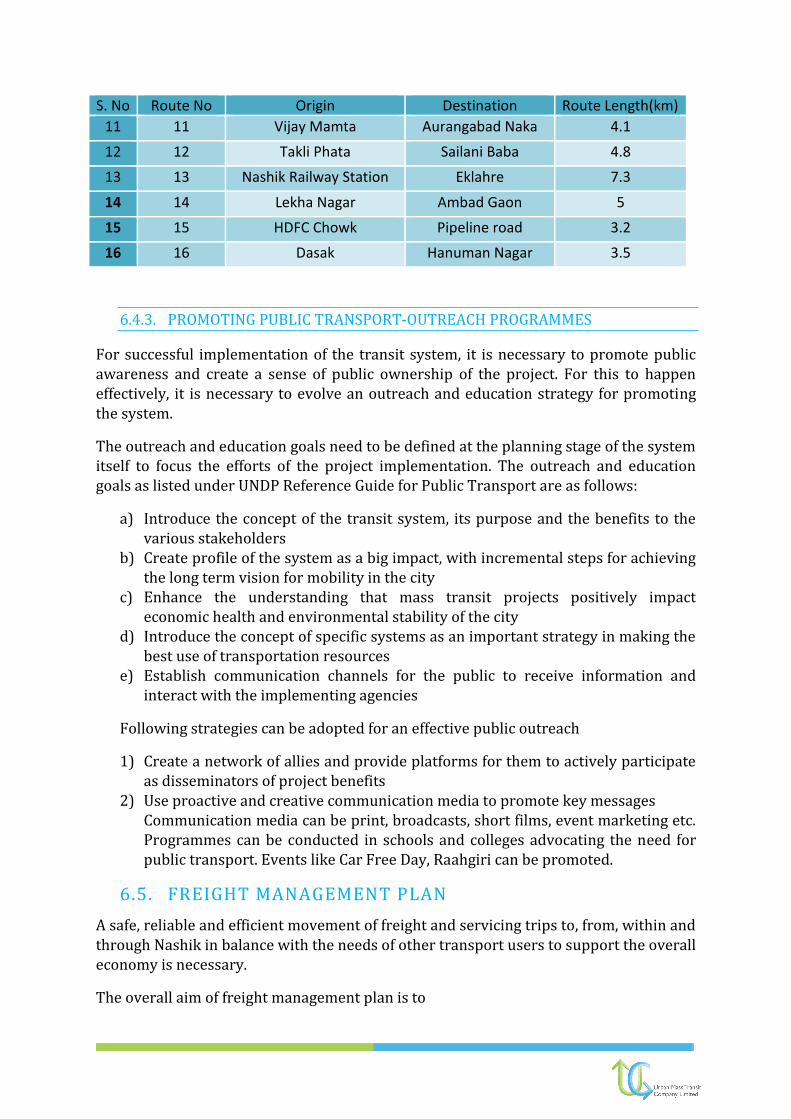
S. No Route No Origin Destination Route Length(km)
11 11 Vijay Mamta Aurangabad Naka 4.1
12 12 Takli Phata Sailani Baba 4.8
13 13 Nashik Railway Station Eklahre 7.3
14 14 Lekha Nagar Ambad Gaon 5
15 15 HDFC Chowk Pipeline road 3.2
16 16 Dasak Hanuman Nagar 3.5
6.4.3. PROMOTING PUBLIC TRANSPORT-OUTREACH PROGRAMMES
For successful implementation of the transit system, it is necessary to promote public awareness and create a sense of public ownership of the project. For this to happen effectively, it is necessary to evolve an outreach and education strategy for promoting the system.
The outreach and education goals need to be defined at the planning stage of the system itself to focus the efforts of the project implementation. The outreach and education goals as listed under UNDP Reference Guide for Public Transport are as follows:
a) Introduce the concept of the transit system, its purpose and the benefits to the various stakeholders
b) Create profile of the system as a big impact, with incremental steps for achieving the long term vision for mobility in the city
c) Enhance the understanding that mass transit projects positively impact economic health and environmental stability of the city
d) Introduce the concept of specific systems as an important strategy in making the best use of transportation resources
e) Establish communication channels for the public to receive information and interact with the implementing agencies
Following strategies can be adopted for an effective public outreach
1) Create a network of allies and provide platforms for them to actively participate as disseminators of project benefits
2) Use proactive and creative communication media to promote key messages Communication media can be print, broadcasts, short films, event marketing etc. Programmes can be conducted in schools and colleges advocating the need for public transport. Events like Car Free Day, Raahgiri can be promoted.
6.5. FREIGHT MANAGEMENT PLAN
A safe, reliable and efficient movement of freight and servicing trips to, from, within and through Nashik in balance with the needs of other transport users to support the overall economy is necessary.
The overall aim of freight management plan is to

Ensure that the Nashik road network allows efficient and reliable handling and
distribution of goods vehicles
Minimize the impact of congestion
Minimize the impact of pollution
Shift gradually to more sustainable freight movement.
Nashik with its growing economy also has many industrial bases scattered across the area and hence there is a significant freight movement with the city also. Under the freight management strategy, three projects are considered namely:
1) Freight Policy
2) Truck Terminals
6.5.1. FREIGHT POLICY
Freight has always remained as an unnoticed transportation policy. The word “FREIGHT” should be considered in all the planning and policy documents to give considerable recognition to its management. For an efficient management of freight within the city, periodic stakeholder consultations should be held. Nashik being an industrial base city, should have representatives from MIDC, NMC, NHAI etc as stakeholders. The freight policy will be aimed at the overarching aim of efficient and reliable handling and distribution of goods and services. Freight policy principles adopted for Nashik are:
a) Manage the heavy demands placed on the regional infrastructure, by balancing
the needs of freight and passenger traffic
b) Improve the array of transportation options available to regional freight users
c) Restrict the heavy vehicles entering the city during day time.
d) Develop truck terminals near cordon points and distribute the goods in
LCV/sustainable transport choices
e) By pass the freight traffic passing through the city.
f) It is advisable to develop a Freight Operator Recognition Scheme. A tiered set of
membership levels can be given to frequent operators coming to the city.
g) Develop a freight information portal i.e a single interface is available for
information on the freight movement.
6.5.2. FREIGHT TERMINALS
A freight terminal is a processing node for freight. Freight terminals are required for the efficient movement of freight vehicles within the city so that congestion is very limited. Freight Terminals need to be provided near various sensitive areas in the city which attract heavy vehicles and also in the outskirts.
Nashik is known for its contribution in agro products and industries. About 40% of total cargo transport in Nashik consists of food and agro based products. Presence of APMC on Peth road and two industrial estates of MIDC in Satpur and Ambad have contributed
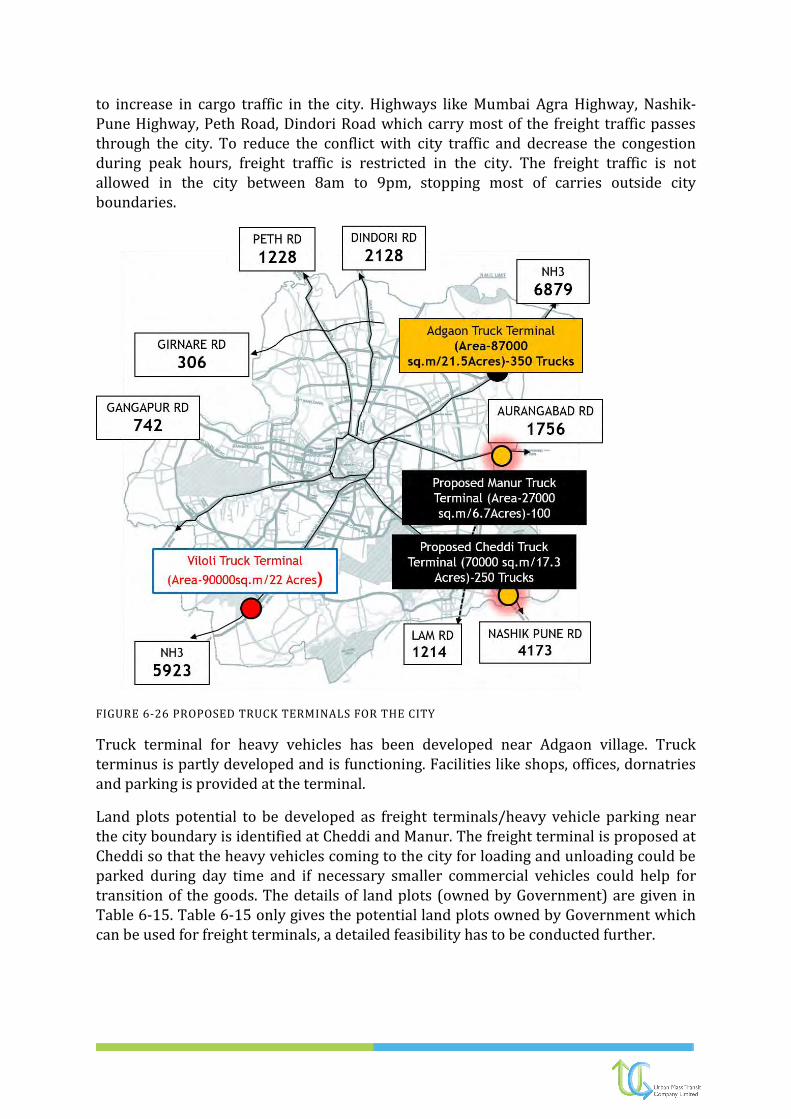
to increase in cargo traffic in the city. Highways like Mumbai Agra Highway, Nashik-Pune Highway, Peth Road, Dindori Road which carry most of the freight traffic passes through the city. To reduce the conflict with city traffic and decrease the congestion during peak hours, freight traffic is restricted in the city. The freight traffic is not allowed in the city between 8am to 9pm, stopping most of carries outside city boundaries.
FIGURE 6-26 PROPOSED TRUCK TERMINALS FOR THE CITY
Truck terminal for heavy vehicles has been developed near Adgaon village. Truck terminus is partly developed and is functioning. Facilities like shops, offices, dornatries and parking is provided at the terminal.
Land plots potential to be developed as freight terminals/heavy vehicle parking near the city boundary is identified at Cheddi and Manur. The freight terminal is proposed at Cheddi so that the heavy vehicles coming to the city for loading and unloading could be parked during day time and if necessary smaller commercial vehicles could help for transition of the goods. The details of land plots (owned by Government) are given in Table 6-15. Table 6-15 only gives the potential land plots owned by Government which can be used for freight terminals, a detailed feasibility has to be conducted further.

TABLE 6-15 Land Identified For Freight Terminal
No Survey No Village Area
(Hectare)
Capacity
1 1727p,1729p, 2003p, 2004, 2005p,2006p, 2008p, 2009p, 2010p, 2011,2012, 2013p, 2024p, 2025p
Adgaon 232110 350 trucks
2 23p, 24p, 25p, 26p, 28p, 120p,126p Cheddi 74295 250 trucks
3 65p, 69p Mannur 27900 100 trucks
6.6. TRAFFIC ENGINEERING AND MANAGEMENT MEASURES
Traffic engineering aims at achieving safe and efficient movement of people and goods on roadways. It focusses on road geometry, sidewalks, crosswalks, cycling infrastructure, traffic signs, road surface markings, traffic signals etc. Traffic management includes various strategies adopted to efficiently manage the movement of vehicles like one-way systems, no parking zones etc.
These measures generally qualify as short term measures for bringing in immediate relief from traffic problems. A combination of several measures can prove to be effective mean of problem solving. These measures are not very capital intensive and give instant results.
6.6.1. JUNCTION IMPROVEMENTS
It is noticed that traffic accident rates are usually higher at intersections. Many factors affect accident occurrence at intersections, including traffic volume, traffic control, and frequency of access points, the number of arms, the speed limit, the median type and
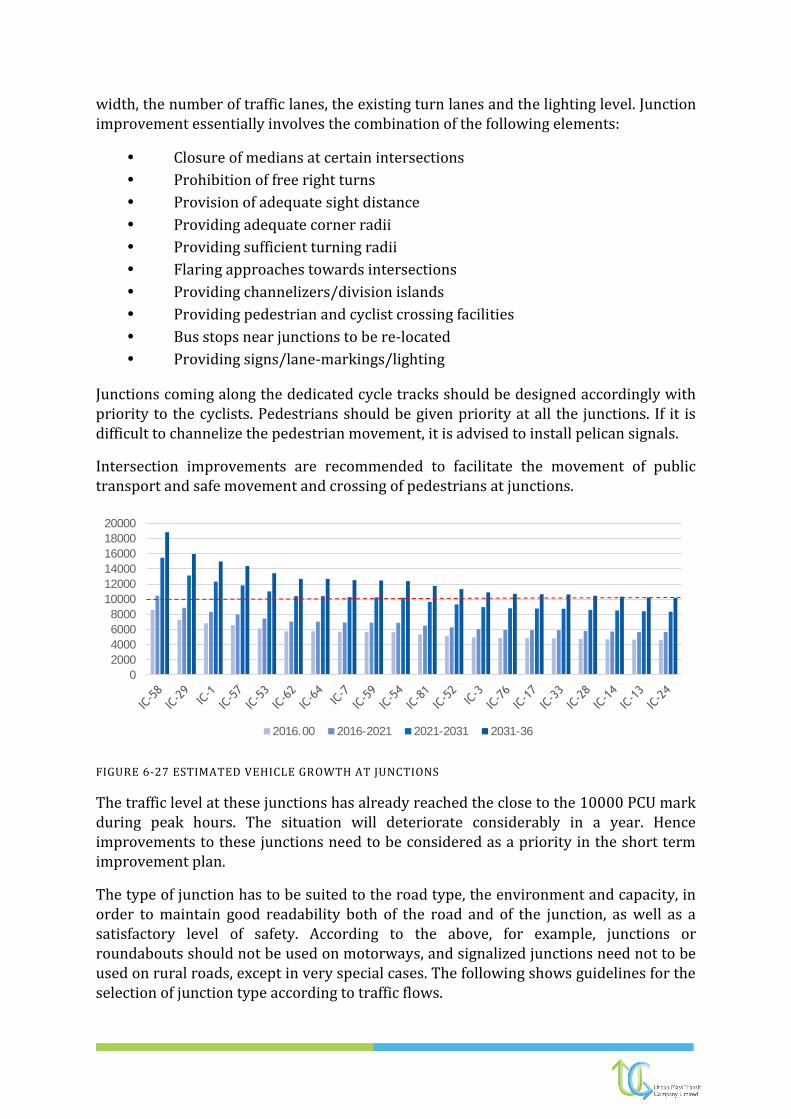
width, the number of traffic lanes, the existing turn lanes and the lighting level. Junction improvement essentially involves the combination of the following elements:
• Closure of medians at certain intersections
• Prohibition of free right turns
• Provision of adequate sight distance
• Providing adequate corner radii
• Providing sufficient turning radii
• Flaring approaches towards intersections
• Providing channelizers/division islands
• Providing pedestrian and cyclist crossing facilities
• Bus stops near junctions to be re-located
• Providing signs/lane-markings/lighting
Junctions coming along the dedicated cycle tracks should be designed accordingly with priority to the cyclists. Pedestrians should be given priority at all the junctions. If it is difficult to channelize the pedestrian movement, it is advised to install pelican signals.
Intersection improvements are recommended to facilitate the movement of public transport and safe movement and crossing of pedestrians at junctions.
FIGURE 6-27 ESTIMATED VEHICLE GROWTH AT JUNCTIONS
The traffic level at these junctions has already reached the close to the 10000 PCU mark during peak hours. The situation will deteriorate considerably in a year. Hence improvements to these junctions need to be considered as a priority in the short term improvement plan.
The type of junction has to be suited to the road type, the environment and capacity, in order to maintain good readability both of the road and of the junction, as well as a satisfactory level of safety. According to the above, for example, junctions or roundabouts should not be used on motorways, and signalized junctions need not to be used on rural roads, except in very special cases. The following shows guidelines for the selection of junction type according to traffic flows.
0
2000
4000
6000
8000
10000
12000
14000
16000
18000
20000
2016.00 2016-2021 2021-2031 2031-36

FIGURE 6-28 TYPE OF JUNCTION BASED ON TRAFFIC FLOWS (IHT 1997)
However, 9 junctions have been prioritized for grade separation by weighting them across various criteria – RoW availability, PHPDT along the corridor (in order to cross compare the commuters impacted in these locations) and the volume of traffic through the junction. The outcome of this exercise identifies the following junctions for grade separation:
TABLE 6-16 LIST OF JUNCTIONS WITH TYPE OF IMPROVEMENT
S.no Name of the Junction
2016 2021 2026 2031 2036
1 CBS Signalization
Grade Separation
Grade Separation
Grade Separation
Grade Separation
2 Modak Point
Signalization Grade
Separation Grade
Separation Grade
Separation Grade
Separation
3 Datta Mandir Chowk
Signalization Grade
Separation Grade
Separation Grade
Separation Grade
Separation
4 Vijay Mamata Signal
Signalization Grade
Separation Grade
Separation Grade
Separation Grade
Separation
5 Khadkali Chowk
Rotary Rotary Grade
Separation Grade
Separation Grade
Separation
6 Kathe Galli
Signalization Signalization Grade
Separation Grade
Separation Grade
Separation
7 DGP Nagar
Signalization Signalization Signalization Grade
Separation Grade
Separation
8 Sinnar Phata
Signalization Signalization Signalization Grade
Separation Grade
Separation
9 Mumbai Naka
Rotary Signalization Signalization Signalization Grade
Separation

Following is the list of junctions proposed for improvement in their Geometry:
TABLE 6-17 JUNCTIONS FOR GEOMETRY IMPROVEMENT
S.no Name of the Junction
1 Bytco Chowk
2 CBS
3 Modak Point
4 Datta Mandir Chowk
5 Vijay Mamata Signal
6 ITI Chowk
7 City Center Mall Junction
8 Shubham Park
9 Ingale Nagar Chowk
10 Khadkali Chowk
11 Kathe Galli
12 Dwaraka Chowk
13 Peth Naka
14 DGP Nagar
15 Shivaji Putala Chowk
16 Mico Circle
17 Gadkari Chowk
18 Thatte Nagar
FIGURE 6-29 JUNCTIONS FOR GEOMETRY IMPROVEMENT

Typical junction improvement at Lokmat circle is shown in the Figure 6-31. Detailed improvements can be discussed after conducting the necessary topographic surveys at the locations.
FIGURE 6-30 TYPICAL IMPROVEMENT MEASURES
FIGURE 6-31 JUNCTION IMPROVEMENT FOR LOKMAT CIRCLE
Of all the locations surveyed for pedestrian volume, maximum numbers of pedestrians were observed at Bytco Chowk with almost 31000 pedestrians in a day followed by Jhasi Rani Chowk with almost 29000 pedestrians. The maximum peak hour pedestrians were observed at Bytco Chowk with 2200 pedestrians. Table 6-18 shows the calculations for PV2/(2*108) at major locations. It was observed that most of the locations has PV2/(2*108) values higher than 2, this indicates a considerable need to improve the pedestrian crossing facilities. Based on the PV2 value and ROW constraints, following proposals were made at important junctions.
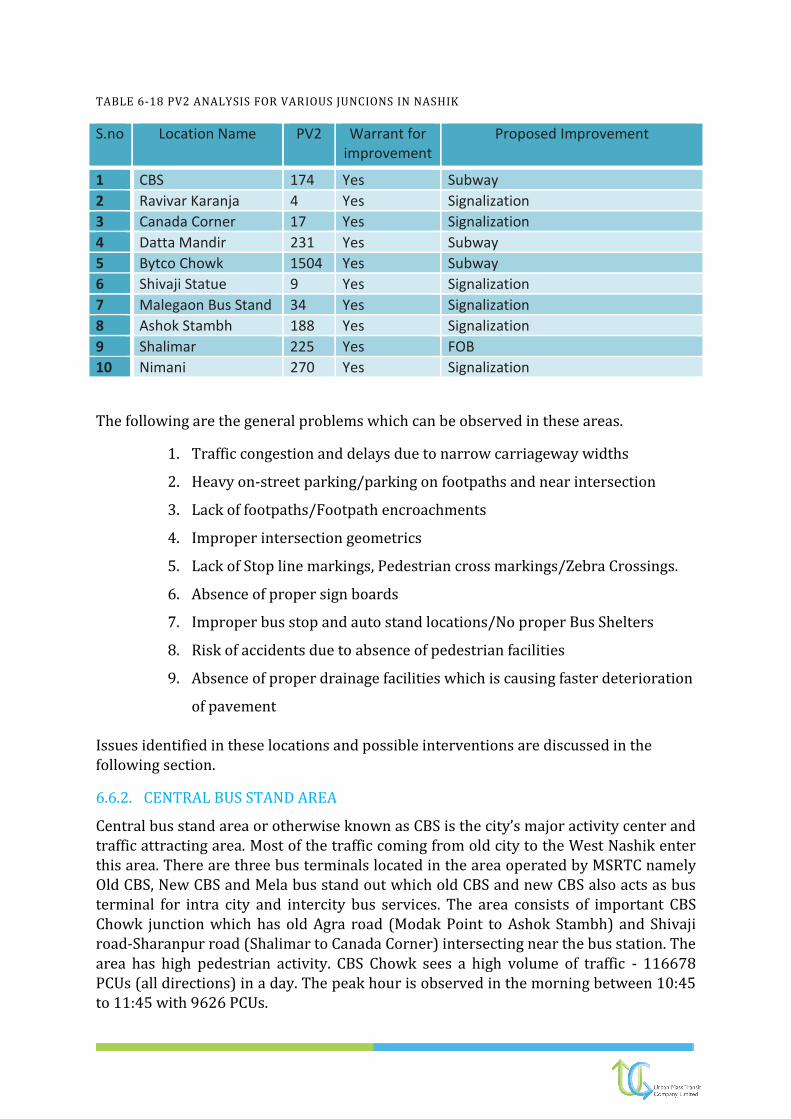
TABLE 6-18 PV2 ANALYSIS FOR VARIOUS JUNCIONS IN NASHIK
S.no Location Name PV2 Warrant for improvement
Proposed Improvement
1 CBS 174 Yes Subway
2 Ravivar Karanja 4 Yes Signalization
3 Canada Corner 17 Yes Signalization
4 Datta Mandir 231 Yes Subway
5 Bytco Chowk 1504 Yes Subway
6 Shivaji Statue 9 Yes Signalization
7 Malegaon Bus Stand 34 Yes Signalization
8 Ashok Stambh 188 Yes Signalization
9 Shalimar 225 Yes FOB
10 Nimani 270 Yes Signalization
The following are the general problems which can be observed in these areas.
1. Traffic congestion and delays due to narrow carriageway widths
2. Heavy on-street parking/parking on footpaths and near intersection
3. Lack of footpaths/Footpath encroachments
4. Improper intersection geometrics
5. Lack of Stop line markings, Pedestrian cross markings/Zebra Crossings.
6. Absence of proper sign boards
7. Improper bus stop and auto stand locations/No proper Bus Shelters
8. Risk of accidents due to absence of pedestrian facilities
9. Absence of proper drainage facilities which is causing faster deterioration
of pavement
Issues identified in these locations and possible interventions are discussed in the following section.
6.6.2. CENTRAL BUS STAND AREA
Central bus stand area or otherwise known as CBS is the city’s major activity center and traffic attracting area. Most of the traffic coming from old city to the West Nashik enter this area. There are three bus terminals located in the area operated by MSRTC namely Old CBS, New CBS and Mela bus stand out which old CBS and new CBS also acts as bus terminal for intra city and intercity bus services. The area consists of important CBS Chowk junction which has old Agra road (Modak Point to Ashok Stambh) and Shivaji road-Sharanpur road (Shalimar to Canada Corner) intersecting near the bus station. The area has high pedestrian activity. CBS Chowk sees a high volume of traffic - 116678 PCUs (all directions) in a day. The peak hour is observed in the morning between 10:45 to 11:45 with 9626 PCUs.
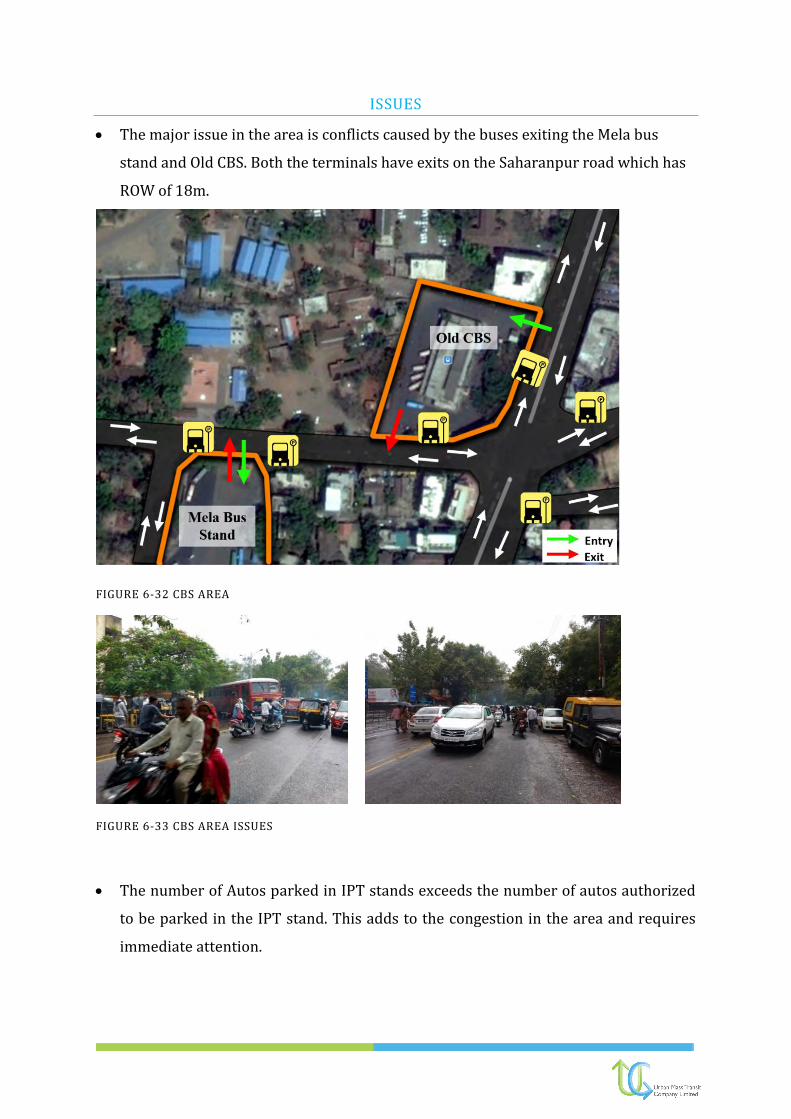
ISSUES
The major issue in the area is conflicts caused by the buses exiting the Mela bus
stand and Old CBS. Both the terminals have exits on the Saharanpur road which has
ROW of 18m.
FIGURE 6-32 CBS AREA
FIGURE 6-33 CBS AREA ISSUES
The number of Autos parked in IPT stands exceeds the number of autos authorized
to be parked in the IPT stand. This adds to the congestion in the area and requires
immediate attention.

The area sees the heavy pedestrian traffic yet no pedestrian facilities are provided,
except for the pedestrian underpass near Civil Court. This too is underutilized as
most pedestrians prefer at grade crossing.
The pedestrian phase in the signal is 5 seconds per cycle, a number too low and
ineffective for a pedestrian to cross the junction. This situation adds on to the
pedestrian-vehicular conflicts in the area.
Considerable parking is observed on Shivaji road (CBS to Shalimar).
Hawking activity is observed on Sharanpur road near the Old CBS exit. This creates
an unnecessary congestion on the Sharanpur road.
PROPOSED INTERVENTIONS AND IMPROVEMENTS
Circulation pattern for the Mela bus stand needs to be reworked. At present, the
buses exit on the sharanpur road. It is proposed that the buses exit on the road
adjacent to the bus terminal or the exit of New CBS. The traffic observed is low and
bus can be rerouted to the CBS chowk via Modak junction. (As shown in figure)
FIGURE 6-34 PROPOSE CIRCULATION AT CBS AREA

The number of autos in the IPT Stand needs to be regulated. It is proposed that the
IPT stand be shifted to the Police Staff Colony Road.
For safer crossing of pedestrians Hooters and Pedestrian signals needs to be
installed and signal timing needs to be increased (with a phase time of at least 15
sec/cycle).
Hawkers should not be allowed on the four major roads in CBS area and need to be
relocated.
Lane markings, Pedestrian crossing where ever are faded need to be marked.
6.6.3. SHALIMAR
Shalimar is one of the important commercial areas of the city. The area has a major bus stop and hence has high public transport traffic. The IPT stand and Taxi Stand present here are unregulated. The volume count at Shalimar is 64563 PCUs in 16 hrs. The peak is observed in the evening between 18:00 to 19:00 with 5468 PCUs.
ISSUES:
The current circulation pattern in the area is shown in the following diagram.
FIGURE 6-35 SHALIMAR JUNCTION
Shalimar junction is a T-junction formed by roads intersecting from Nehru Garden
(15m), Shivaji Road (18m) and Tilak road (24m).
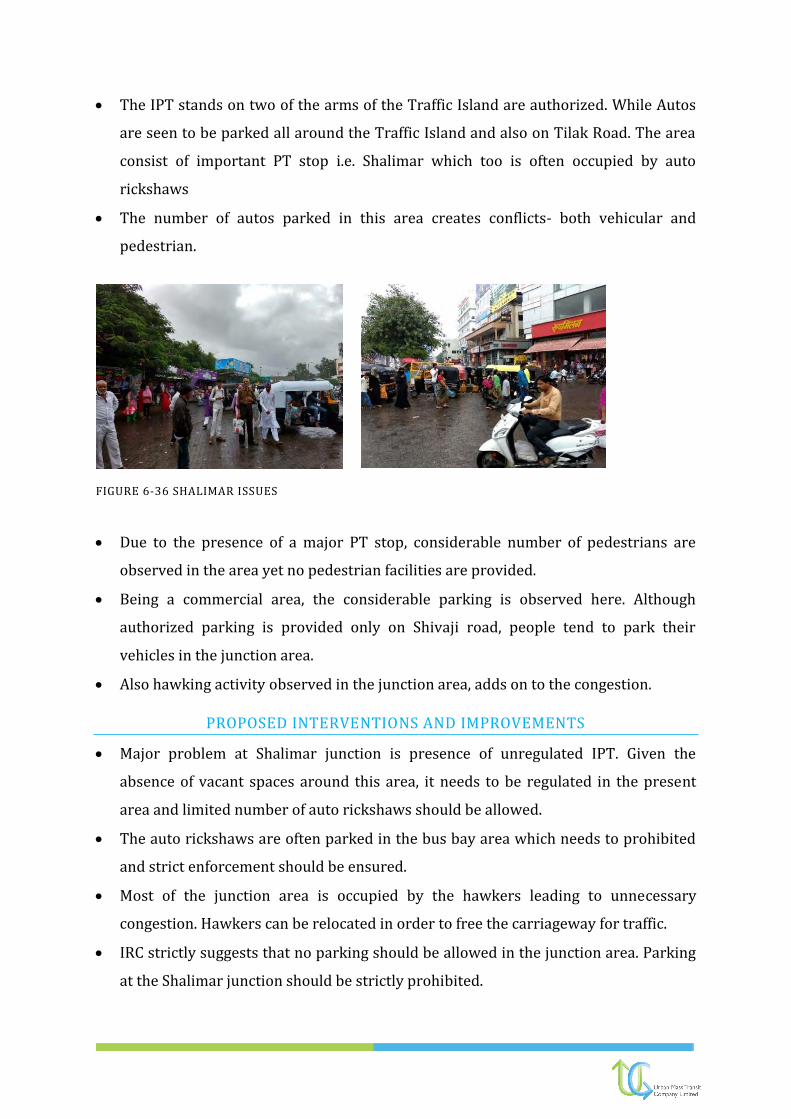
The IPT stands on two of the arms of the Traffic Island are authorized. While Autos
are seen to be parked all around the Traffic Island and also on Tilak Road. The area
consist of important PT stop i.e. Shalimar which too is often occupied by auto
rickshaws
The number of autos parked in this area creates conflicts- both vehicular and
pedestrian.
FIGURE 6-36 SHALIMAR ISSUES
Due to the presence of a major PT stop, considerable number of pedestrians are
observed in the area yet no pedestrian facilities are provided.
Being a commercial area, the considerable parking is observed here. Although
authorized parking is provided only on Shivaji road, people tend to park their
vehicles in the junction area.
Also hawking activity observed in the junction area, adds on to the congestion.
PROPOSED INTERVENTIONS AND IMPROVEMENTS
Major problem at Shalimar junction is presence of unregulated IPT. Given the
absence of vacant spaces around this area, it needs to be regulated in the present
area and limited number of auto rickshaws should be allowed.
The auto rickshaws are often parked in the bus bay area which needs to prohibited
and strict enforcement should be ensured.
Most of the junction area is occupied by the hawkers leading to unnecessary
congestion. Hawkers can be relocated in order to free the carriageway for traffic.
IRC strictly suggests that no parking should be allowed in the junction area. Parking
at the Shalimar junction should be strictly prohibited.

6.6.4. SARDA CIRCLE:
Sarda circle is a 5 arm junction which connects the CBS and Mahamarg bus stand to the Dwarka and core city to the west part of Nashik. The traffic is regulated through the rotary island. Road coming from Gadkari Chowk, Shalimar Chowk and Dwarka carries the majority of traffic. The junction sees a lot of bus traffic as most of the PT routes pass through the junction. The junction carries a volume of 58437 PCUs in 16Hrs (for all direction traffic). The peak is observed in the morning at 9:45 to10:45 with 4710 PCUs in an Hr.
FIGURE 6-37 SARDA CIRCLE
ISSUES:
The congestion is majorly observed in the peak hours.
The land-use is mixed in the area and a lot of on-street parking is observed.
The regional transport buses coming from CBS and Mahamarg bus station
passthrough the junction which increases the traffic congestion due to queueing
behind the buses.
PROPOSED INTERVENTIONS AND IMPROVEMENTS
The rotary should be redesigned such that it will allow smooth movement of traffic.
Parking should not be allowed in the junction area.

Gadkari Chowk to Mumbai Naka is part of Old Agra Highway and has sufficient ROW.
ROW at this section is 18m
Hence, the regional transport buses coming from Mahamarg Bus stand and CBS via
Gadkari Chowk can be rerouted through Mumbai Naka which will reduce the
congestion at the Sarda circle.
It is highly recommended that a pedestrian signal be provided.
Considering the crossing distance for a pedestrian, refuge islands, signage and
proper road markings need to be provided at the junction.
6.6.5. DWARKA JUNCTION:
Dwarka junction is one of the most important junctions in the city. Two of the major traffic carrying highways Agra Mumbai Highway (NH3) and Nashik-Pune Highway (SH50) intersect at Dwarka Junction. Both private and freight traffic is observed at the junction. A roundabout is constructed to manage the traffic at the junction. A flyover is constructed for swift passage of vehicles on the NH 3 to bypass the city traffic. The all direction traffic at Dwarka is 85761 PCUs over16Hrs. The peak is observed in the evening at 16:30 to 19:30 with 6809 PCUs in an Hour.
FIGURE 6-38 DWARKA JUNCTION
ISSUES:
Dwarka junction is the most congested junction in the city. The roundabout
provided at the junction needs to redesigned or replaced with signals.
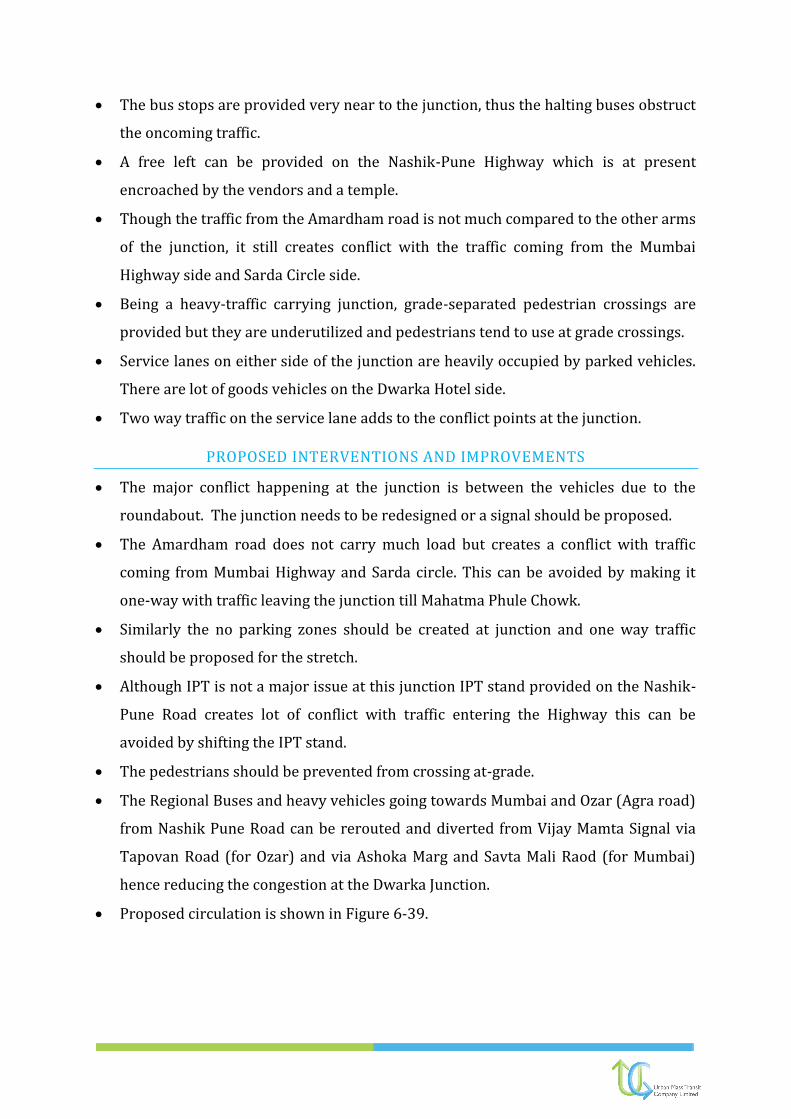
The bus stops are provided very near to the junction, thus the halting buses obstruct
the oncoming traffic.
A free left can be provided on the Nashik-Pune Highway which is at present
encroached by the vendors and a temple.
Though the traffic from the Amardham road is not much compared to the other arms
of the junction, it still creates conflict with the traffic coming from the Mumbai
Highway side and Sarda Circle side.
Being a heavy-traffic carrying junction, grade-separated pedestrian crossings are
provided but they are underutilized and pedestrians tend to use at grade crossings.
Service lanes on either side of the junction are heavily occupied by parked vehicles.
There are lot of goods vehicles on the Dwarka Hotel side.
Two way traffic on the service lane adds to the conflict points at the junction.
PROPOSED INTERVENTIONS AND IMPROVEMENTS
The major conflict happening at the junction is between the vehicles due to the
roundabout. The junction needs to be redesigned or a signal should be proposed.
The Amardham road does not carry much load but creates a conflict with traffic
coming from Mumbai Highway and Sarda circle. This can be avoided by making it
one-way with traffic leaving the junction till Mahatma Phule Chowk.
Similarly the no parking zones should be created at junction and one way traffic
should be proposed for the stretch.
Although IPT is not a major issue at this junction IPT stand provided on the Nashik-
Pune Road creates lot of conflict with traffic entering the Highway this can be
avoided by shifting the IPT stand.
The pedestrians should be prevented from crossing at-grade.
The Regional Buses and heavy vehicles going towards Mumbai and Ozar (Agra road)
from Nashik Pune Road can be rerouted and diverted from Vijay Mamta Signal via
Tapovan Road (for Ozar) and via Ashoka Marg and Savta Mali Raod (for Mumbai)
hence reducing the congestion at the Dwarka Junction.
Proposed circulation is shown in Figure 6-39.

FIGURE 6-39 PROPOSED INTERVENTION AT DWARKA JUNCTION
6.6.6. NASHIK ROAD RAILWAY STATION:
Nashik Road railway station is one of the important terminals in the city as it consists of railway station, intercity bus terminal and intra city bus terminal. It is located on Ambedkar road near Nashik-Pune Highway (NH 50). The majority of traffic on the Ambedkar Road is private and buses. The area also has a major IPT stand which is unregulated. IPT stand near the entry of the station shows a capacity of 20 autos but it was observed that most of the time more than 20 autos are stationed. A separate one way entry and exit is provided for railway station which reduces the conflict.
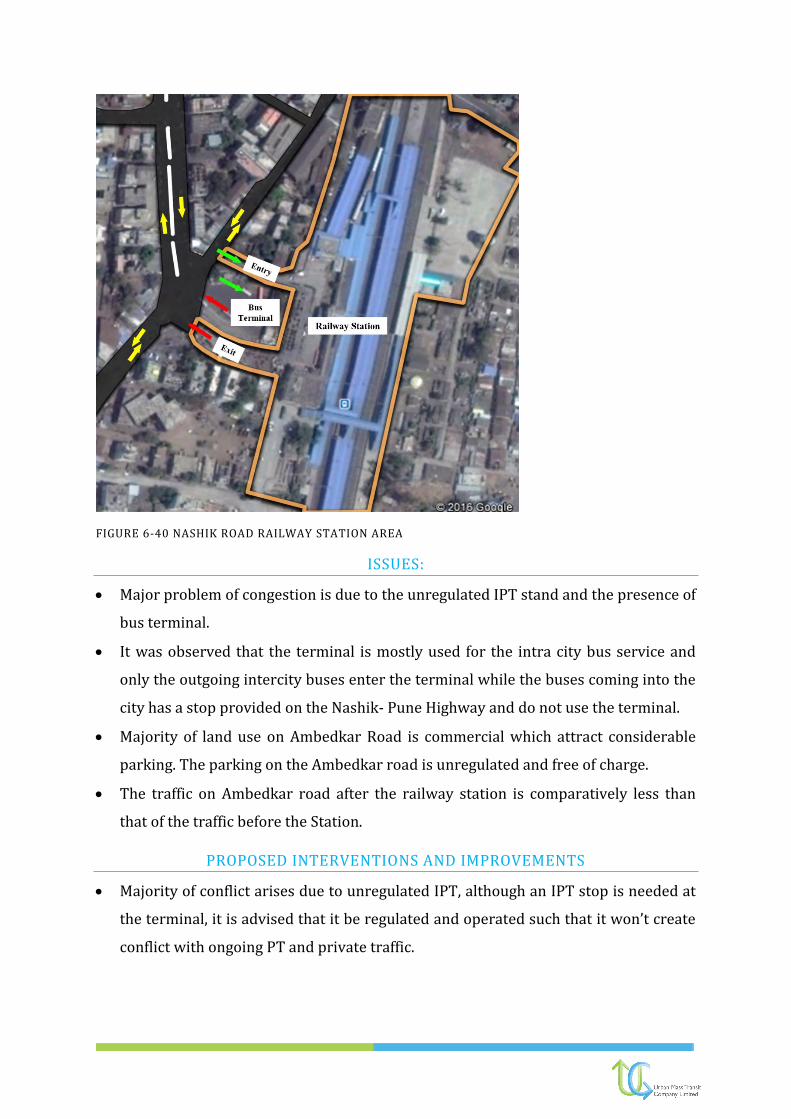
FIGURE 6-40 NASHIK ROAD RAILWAY STATION AREA
ISSUES:
Major problem of congestion is due to the unregulated IPT stand and the presence of
bus terminal.
It was observed that the terminal is mostly used for the intra city bus service and
only the outgoing intercity buses enter the terminal while the buses coming into the
city has a stop provided on the Nashik- Pune Highway and do not use the terminal.
Majority of land use on Ambedkar Road is commercial which attract considerable
parking. The parking on the Ambedkar road is unregulated and free of charge.
The traffic on Ambedkar road after the railway station is comparatively less than
that of the traffic before the Station.
PROPOSED INTERVENTIONS AND IMPROVEMENTS
Majority of conflict arises due to unregulated IPT, although an IPT stop is needed at
the terminal, it is advised that it be regulated and operated such that it won’t create
conflict with ongoing PT and private traffic.

No auto rickshaws should be allowed in the IPT stand beyond certain decided
number and the IPT stand should be placed in the open space identified after the
Ambedkar statue. (shown in Figure bellow)
FIGURE 6-41 RAILWAY STATION AREA PROPOSAL
The parking on Ambedkar road should be regulated. Paid 30 degree angular parking
is proposed on Odd even days for the road.
As the terminal is only used by outgoing inter city buses, a new bus stop/bay can be
proposed on Nashik-Pune Highway for the inter city buses.
The bus stop/bay can be proposed on Nashik Pune Highway after the Shivaji chowk.
Which can reduce the bus traffic in to the terminal.
6.6.7. RAVIVAR KARANJA:
Ravivar karanja is located in the central part of the city. Ravivar Karanja is important point as it connects the Panchvati area to the city. The traffic movement is shown in the image.

FIGURE 6-42 RAVIVAR KARANJA
Ravivar Karnaja Junction carries the one way traffic on Ravivar peth road and Tilak road towards Mahabal Chowk while the Main road and Tilak road towards Ahilyabai Holkar Bridge carries the two way Traffic. There is an authorized rickshaw stand provided on tilak road. The all direction traffic is 45871 PCUs in 16HRs and peak is in the morning at 10:45 to 11:45 with 3671 PCUs in an Hr.
ISSUES:
Major problem at the junction is the bottleneck on the Tilak road towards Ahilyabai
Holkar Bridge. 15m ROW reduces to 12m forming a bottleneck for the traffic coming
from the Main road and Ravivar peth road.
The Road carries two way traffic which further increases the problem during the
peak hours.
There is authorized IPT stand provided but it is underutilized and Autos are found to
be taking customers outside the stand on Tilak road. Due to the parked autos on the
Tilak road available carriage way is further reduced hence increasing the congestion
at the junction.
The junction also sees lot of pedestrian activity yet no pedestrian facility is provided.
PROPOSED INTERVENTIONS AND IMPROVEMENTS
The hawkers in this area can be relocated and parking should be restricted in the
junction area. This will ease the congestion problem.
Parking if provided, should be on pay and park basis.
IPT stand should be maintained in a disciplined manner like at Mela bus stand and
strict enforcement can be implemented for the autos parked outside the stand.
Encroachments in the area should be removed and road widening if possible can be
taken up to remove the bottleneck formed at Tilak road.
For safe pedestrian movement proper footpaths should be provided and it is
recommended that a pedestrian signal should be provided.
6.6.8. PANCHAVTI KARANJA:
Panchvati karanja is an important junction and bus stop in the core city area. It connects the Nimani and rest of the Panchvati division to the main city. It is an important boarding and alighting point for commuters especially from core city areas like Kalaram Mandir, Katya Maruti, Ramkund. The land use in the area is mixed. The all direction traffic is observed 25299 in 16Hrs. peak is observed between 18:15 to 19:15 with 1718 PCUs per Hr.
ISSUES:
Being a mixed land use area the area sees a lot of parking. The parking provided is
unregulated and free.
Most of the vehicles are parked in the intersection area reducing the carriage way
width and causing the congestion.
There is also an unauthorized IPT stand in the junction area where often taxis are
also parked.
Being very near to the Nimani bus terminal and important boarding alighting point
for commuters Panchvati Karanja sees very high bus traffic. Almost every bus stops
at this point and the frequency of their services is also very high.

The bus stop being placed exactly on the junction makes it difficult for the second
bus to arrive at the stop. The second bus is more likely to be stopped at the junction
blocking the rest of the traffic.
PROPOSED INTERVENTIONS AND IMPROVEMENTS
The parking should be completely restricted in this area.
The bus stop if possible should be shifted towards the Indrakund side so as to
accommodate the high number of buses.
Even with significant pedestrian activity the area lacks the pedestrian facilities
which need to be provided.
6.6.9. NIMANI BUS STAND
FIGURE 6-43 NIMANI CHOWK

Nimani bus stand is one of the most important terminals in the city. The area consists of mix land use with a high share of commercial properties. It is an important intersection as it connects the Mumbai-Agra Highway to Peth and Dindori Road. Both of which carries the traffic to and from Gujarat. The area also sees heavy private bus traffic in the night coming from Shirdi towards the Gujarat. The area also consists of a Taxi stand mostly for the commuters/devotees going to Vani.
ISSUES:
The unregulated parking in the junction area reduces the carriage way for traffic and
results into congestion.
There is lot of conflict between buses coming out of the terminal and the ongoing
traffic causing the congestion at the terminal gate.
There is unauthorized auto stand right in front of terminal gate reducing the turning
radius for the buses as well as obstructing the ongoing traffic.
Even though there is an authorized taxi stand provided on Dinori road, the number
of taxis is not controlled.
PROPOSED INTERVENTIONS AND IMPROVEMENTS
The conflict between buses and ongoing traffic can be resolved by manning the
intersection or by providing a signal.
No parking should be provided near the entry and exit of bus terminal and IPT stand
should be relocated.

The number of Taxis should be fixed and regulated so as to reduce the congestion
problem on Dindori Road.
6.6.10. MEHER RESTAURANT CHOWK.
Meher restaurant chowk is a T-Junction which carries the traffic from Ashok Stambh and MG Road which brings the traffic from the old city. Its third arm carries the traffic from CBS. The land use in the area is mostly commercial hence high parking activity is observed. This is a signalized junction with average green time of 26 seconds for each arm. There are pedestrian signals provided but the time for pedestrian phase is limited to 5 seconds only.
ISSUES:
MG Road sees most of the traffic with very less carriage way for the traffic flow due
to encroachment and illegal parking in the area.
Considerable pedestrian activity is observed here, yet the pedestrian phase of signal
is limited to 5 seconds only which is neither sufficient nor safe for the pedestrians to
cross the junction. Pedestrian marking is also faded in the area.
PROPOSED INTERVENTIONS AND IMPROVEMENTS:
Encroachments and illegal constructions should be removed from the area.
Pedestrian signal timing should be increased and proper footpaths and pedestrian
crossing should be provided in the area
As the area is highly commercial, parking should be regulated and pay and park
facilities should be provided
6.6.11. CANADA CORNER:
Canada Corner is located in the busy sharanpur area of nashik city. The Intersection brings the traffic from sharanpur road, Gangapur road and Sharnpur link road which connects the sharanpur area to Nashik-Trimbak Highway. Traffic on the Vijayan
FIGURE 6-44 MEHER CHOWK
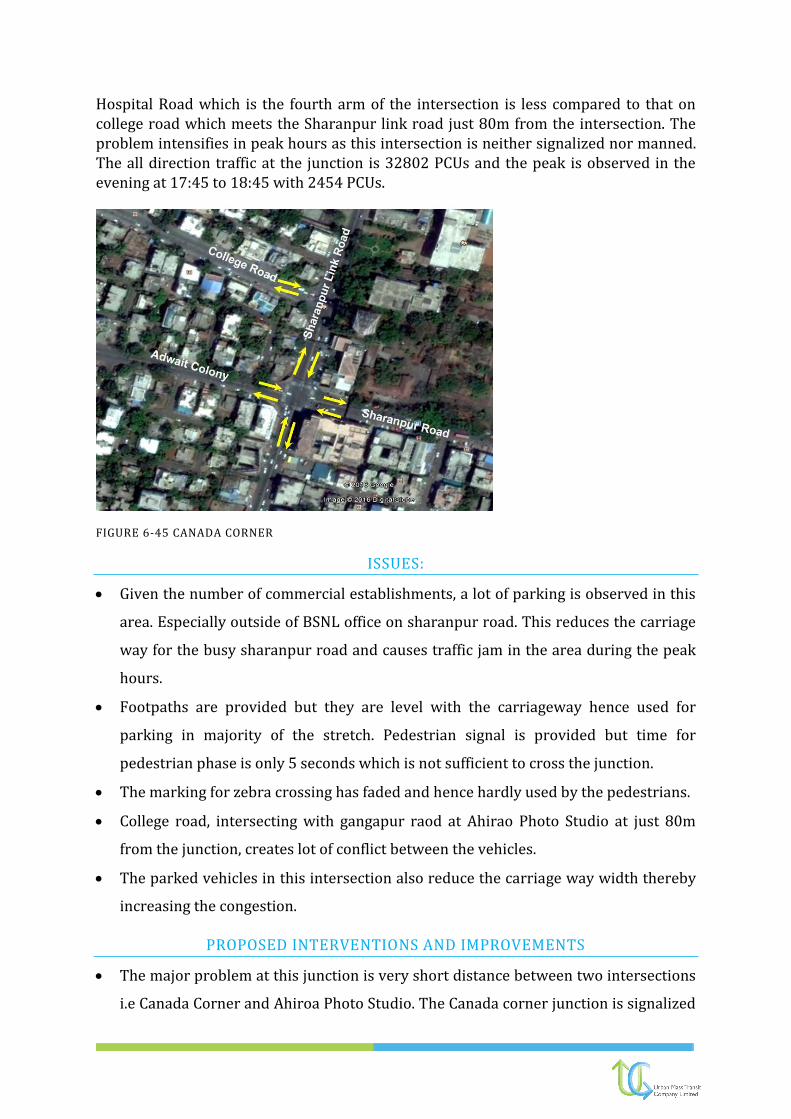
Hospital Road which is the fourth arm of the intersection is less compared to that on college road which meets the Sharanpur link road just 80m from the intersection. The problem intensifies in peak hours as this intersection is neither signalized nor manned. The all direction traffic at the junction is 32802 PCUs and the peak is observed in the evening at 17:45 to 18:45 with 2454 PCUs.
FIGURE 6-45 CANADA CORNER
ISSUES:
Given the number of commercial establishments, a lot of parking is observed in this
area. Especially outside of BSNL office on sharanpur road. This reduces the carriage
way for the busy sharanpur road and causes traffic jam in the area during the peak
hours.
Footpaths are provided but they are level with the carriageway hence used for
parking in majority of the stretch. Pedestrian signal is provided but time for
pedestrian phase is only 5 seconds which is not sufficient to cross the junction.
The marking for zebra crossing has faded and hence hardly used by the pedestrians.
College road, intersecting with gangapur raod at Ahirao Photo Studio at just 80m
from the junction, creates lot of conflict between the vehicles.
The parked vehicles in this intersection also reduce the carriage way width thereby
increasing the congestion.
PROPOSED INTERVENTIONS AND IMPROVEMENTS
The major problem at this junction is very short distance between two intersections
i.e Canada Corner and Ahiroa Photo Studio. The Canada corner junction is signalized

hence does not create conflict between the traffic. The T-junction at College road,
being an uncontrolled intersection creates conflicts in the traffic movement. This can
be avoided by making college road one way as there are two streets parallel to
College road through which traffic can be re-routed. Following traffic flow pattern
can be adopted for the college road area.
Another way this problem can be solved is by installing signal in synchronization
with the signal at Canada corner thereby reducing the conflict at the junction.
The problem of parking can be solved by providing an off street parking facility at
Agora mall. Utilizing the area within BSNL office for parking is also a possibility.
No Parking should be allowed near the junction area and on-street parking should
be regulated and priced.
The signal time for pedestrian signal should be increased. The footpath should be
raised according to IRC norms. Visible pedestrian crossing should be provided at the
junction.
6.6.12. PTA KULKARNI CHOWK:
The intersection is located in the busy College road area. The land use in the area is commercial and institutional. The majority of traffic consists of commuters traveling to the institutes like HTP College, BYK College, Don Bosco School etc. The area is one of the highly commercial areas of the city with major shopping complexes. The area suffers from traffic congestion during the peak hours. The area sees lot of parking near the shopping complexes and eating joints, most of which are encroached on the street. The
FIGURE 6-46 CIRCULATION PATTERN FOR CANADA CORNER

all direction traffic at the junction is 50552 and peak is observed in the morning 18:15 to 19:15 with peak hr PCUs of 3962
FIGURE 6-47 PTA KULKARNI CHOWK
ISSUES:
With the land use being majorly institutional, most of the commuters are students
on foot. Despite the high NMT traffic, the area lacks footpaths.
The junction is an unmanned intersection and the conflicts between the vehicles
increases in the peak hours and creates a major congestion problem.
Due to nearby institutes and colleges there are lot food joints along the street which
do not have any parking provision of their own. Thus most of the vehicles are parked
on-street, reducing the carriage way for the traffic.
Reckless driving by the college students is one of the major issue in the area.
FIGURE 6-48 ISSUES AT PTA KULKARNI CHOWK

PROPOSED INTERVENTIONS AND IMPROVEMENTS
Footpaths are vital in such an institutional area. Pedestrian marking and sign boards
should also be provided.
Installing signal at the intersection will reduce the conflicts between the vehicles
and will help in reducing the congestion.
Encroachments if any should be removed.
Parking should be regulated and priced.
Awareness campaign should be undertaken for the students and strict enforcement
should be ensured to tackle rash driving.
6.6.13. VIDYA VIKAS JUNCRION
Vidya vikas junction is located on Gangapur road and is one of the important junctions. The all direction traffic at the junction is 75580 PCUs and peak is observed in the
evening at 18:15 to 19:15 with peak PCUs of 5693.
ISSUES:
Major issue at the junction is conflict between the traffic from Kusumagraj Path and
Gangapur road.
Gangapur road carries fast moving traffic and contributes to the majority of traffic at
the junction.
For managing the traffic roundabout is provided, junction sees high congestion
during the peak hours.
The land use in this area is mixed and hence a high parking demand is observed.
FIGURE 6-49 VIDYA VIKAS JUNCTION

PROPOSED INTERVENTIONS AND IMPROVEMENTS
Traffic signal needs to be installed for regulating the traffic. The pedestrian phase
should also be included with minimum time of 10 Sec. to cross.
Pedestrian signboards and markings should be provided.
No parking should be allowed in the junction area and on street parking should be
regulated and priced.
6.6.14. JEHAN CIRCLE:
Jehan circle is one of the most important junctions on Gangapur road. Majority of land use in this area is commercial. Junction has a rotary to manage the traffic.
FIGURE 6-50 JEHAN CIRCLE
ISSUES:
Major issue at Jehan circle is the conflicting traffic from Mahatma Nagar road and
Gangapur road. Junction faces the traffic congestion especially during the peak
hours.
As the area is commercial area considerable parking is observed. The parking is not
regulated or paid.
The junction does not consist of any channelizers and hence creates conflicts with
left turning movements.
Footpaths are present but they level with the carriageway and often used for
parking.

The bus stop is provided at the junction which creates the obstruction to ongoing
traffic.
PROPOSED INTERVENTIONS AND IMPROVEMENTS
The traffic can be managed by installing the traffic signal instead of rotary. The
pedestrian signal phase can also be incorporated so as to provide the safe passage to
the pedestrians.
Parking can be regulated and priced with no parking allowed in the junction area.
Raised footpaths needs to be provided and encroachments if any should be removed.
Bus stop needs to be shifted so as to cause no obstruction to ongoing traffic.
The junction needs to be designed incorporating channelizers.
6.6.15. ASHOK STAMBH:
Ashok stambh is a very import junction in the city as it links Panchvati to the rest of Nashik. Ravivar karanja to Mahabal Chowk part of the Tilak road allows only one way traffic due to which the entire traffic coming from satpur, CBS, Nashik road etc has to pass through ashok stambh. Ravivar peth road and Vakilwadi raod carries one way traffic whereas rest of the arms carry two way traffic. The area has mixed land use with most of the commercial properties on the main roads.
FIGURE 6-51 ASHOK STAMBH
ISSUES:

Most of the traffic going to the core city passes through it as it is the shortest and
direct route. However, Gharpure Ghat road is very narrow and creates a bottleneck
at the junction.
There is conflict between the traffic from Gharpure Ghat road and traffic going to
Ravivar Karanja
Due to vendors and commercial properties, lot of parking happens on street which
reduces the carriage way width and creates major traffic congestion during the peak
hours
INTERVENTION:
Providing the signal can be a solution to reduce the conflict but it might create
further problem as nearest signal is at Meher Restaurant which is about 200m from
the junction. This can be avoided by providing synchronized signals along Old-Agra
Road from Modak Point to Ashok Stambh.
As the junction is already congested and narrow, parking should not be allowed in
the area. On street parking if provided should be curbed to at least 50m before the
junction. All the encroachments should be removed.
Pedestrian markings and sign boards should be provided if absent.
Traffic going towards the Ramwadi from Gangapur road can be diverted from the
Rokel Lane hence decreasing the traffic on the junction.
FIGURE 6-52 ISSUES AT ASHOK STAMBH

FIGURE 6-53 PROPOSED INTERVENTION AT ASHOK STAMBH
6.6.16. SHIVAJI CHOWK:
Shivaji chowk is located right at entry of the city. The intersection consist of Nashik Pune Highway and the connecting road to Nashik Railway Station. There is a flyover provided for the traffic to pass directly into the city, with an additional exit at this junction for the vehicles going to the railway.
ISSUE:
Bus terminal is located at the station and most of the buses going out of the city goes
towards the terminal which creates conflicts with the incoming traffic. Buses
entering the city does not go to terminal but stop at Shivaji Statue obstructing the
ongoing traffic.
The signal is provided at the junction but it is not working.
The IPT stops at the junction adds to the congestion. There are also presence of
hawkers on the station road.
Footpath is present and in well condition but most of the footpath is encroached by
the hawkers hence are not usable for pedestrians.

PROPOSED INTERVENTIONS AND IMPROVEMENTS
The bus stop for the regional transport can be shifted on the Nashik-Pune Highway
such that MSRTC buses don’t have to enter the railway station area hence decreasing
the conflict with the traffic.
The IPT stand should be regulated and the number of autos should be limited.
The encroachment on the footpath needs be removed and hawkers should be
relocated.
The parking should be regulated and priced.
The signal should be made operational so as to regulate the traffic.
The Pedestrian markings are faded which needs to be repainted.
6.6.17. VIJAY MAMTA SIGNAL:
FIGURE 6-54 ISSUES AT SHIVAJI CHOWK
FIGURE 6-55 VIJAY MAMTA SIGNAL

Vijay Mamta Signal is one of the important junctions on the Nashik Pune Highway. The junction connects the residential areas on either side of highway through Ashoka Marg and Tapovan road. These roads are often used by the commuters to go to Mumbai Agra highway avoiding the traffic at Dwarka Junction.
ISSUES:
Vijay Mamta junction is listed in the blackspot for the accidents by the Nashik Traffic
Branch. The junction observed 5 fatal accidents and 1 major accident last year. The
accidents caused 7 fatalities and 3 severe injuries.
The main cause of accident is slow moving traffic from Tapovan road and Akshoka
Marg intersecting with the fast moving traffic on the Nashik-Pune road.
Although signals are provided, majority of these accidents happened during the
night timing when signals were not operational.
The channelizer are provided but only on Tapovan road, rest of the arms of the
junction do not have channelizers.
The pedestrian markings and sign boards are absent at the junction.
PROPOSED INTERVENTIONS AND IMPROVEMENTS
As the majority of accidents happened during the night when signals are non-
operational traffic calming measures need to be undertaken at this junction. Speed
breaker should be provided on the Tapovan Road and Ashoka Marg.
The caution signs (Accident Prone Area) need to be posted for the ongoing traffic.
The junction should be redesigned so as to incorporate the channelizers on the
Ashoka Marg and Nashik-Pune Highway. And dividers need to be provided on the
Ashoka Marg.
Pedestrian signboards and marking need to be provided.
6.6.18. UPANAGAR JUNCTION:
Upanagar Junction connects the residential area of Upanager, Indraprastha Nagar to Nashik Pune highway by canal road. The pedestrian activity observed at the junction is due to the presence of bus stop near the junction.

ISSUES
Major problem of traffic congestion occurs at Upanagar Junction due to presence of
bus stop.
Being an important and busy bus stop, halting buses obstruct the ongoing traffic.
The junction is a 3 Arm junction and signal is provided. Jai Bhavani road meets the
Nashik-Pune highway 40m off the junction. Although the merging traffic does not
create much conflicts with the ongoing traffic going to Jai Bhavani road from canal
road and Nashik Side of Nashik-Pune Highway creates conflicts with the traffic.
Majority of pedestrians cross the junction to access the bus stop on the Nashik-Pune
Highway. However, the pedestrian phase in the signal cycle is only for 5 sec and the
pedestrian markings faded, signboards absent.
PROPOSED INTERVENTIONS AND IMPROVEMENTS
The major problem at the junction is due to the location of the bus stop hence the
bus stop needs to be relocated. The bus stop can be relocated near Dargah in front of
Ichhamani Lawns after the junction.
The pedestrian phase need to be increased at least upto 10 seconds so as to give
pedestrians enough time to cross the junction safely. Refuge can also be provided on
the Nashik-Pune Highway.
Pedestrian marking and signboards need to be provided at the junction.
FIGURE 6-56 UPANAGAR CHOWK
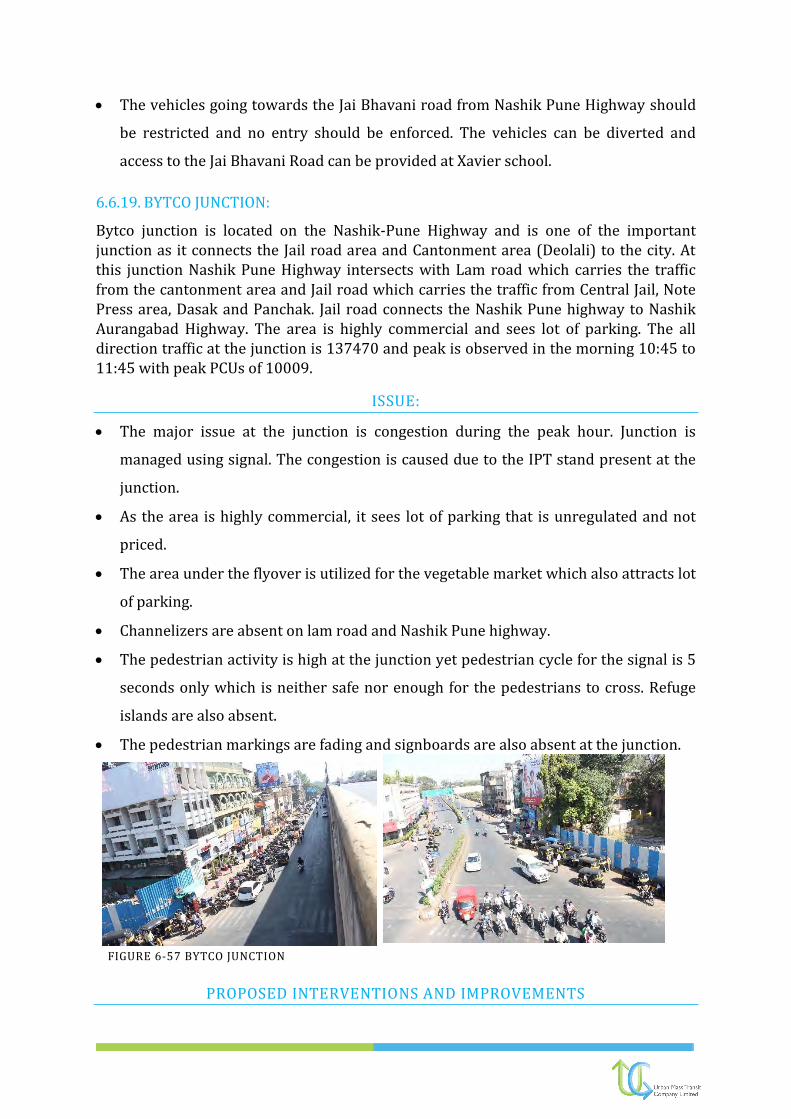
The vehicles going towards the Jai Bhavani road from Nashik Pune Highway should
be restricted and no entry should be enforced. The vehicles can be diverted and
access to the Jai Bhavani Road can be provided at Xavier school.
6.6.19. BYTCO JUNCTION:
Bytco junction is located on the Nashik-Pune Highway and is one of the important junction as it connects the Jail road area and Cantonment area (Deolali) to the city. At this junction Nashik Pune Highway intersects with Lam road which carries the traffic from the cantonment area and Jail road which carries the traffic from Central Jail, Note Press area, Dasak and Panchak. Jail road connects the Nashik Pune highway to Nashik Aurangabad Highway. The area is highly commercial and sees lot of parking. The all direction traffic at the junction is 137470 and peak is observed in the morning 10:45 to 11:45 with peak PCUs of 10009.
ISSUE:
The major issue at the junction is congestion during the peak hour. Junction is
managed using signal. The congestion is caused due to the IPT stand present at the
junction.
As the area is highly commercial, it sees lot of parking that is unregulated and not
priced.
The area under the flyover is utilized for the vegetable market which also attracts lot
of parking.
Channelizers are absent on lam road and Nashik Pune highway.
The pedestrian activity is high at the junction yet pedestrian cycle for the signal is 5
seconds only which is neither safe nor enough for the pedestrians to cross. Refuge
islands are also absent.
The pedestrian markings are fading and signboards are also absent at the junction.
PROPOSED INTERVENTIONS AND IMPROVEMENTS
FIGURE 6-57 BYTCO JUNCTION
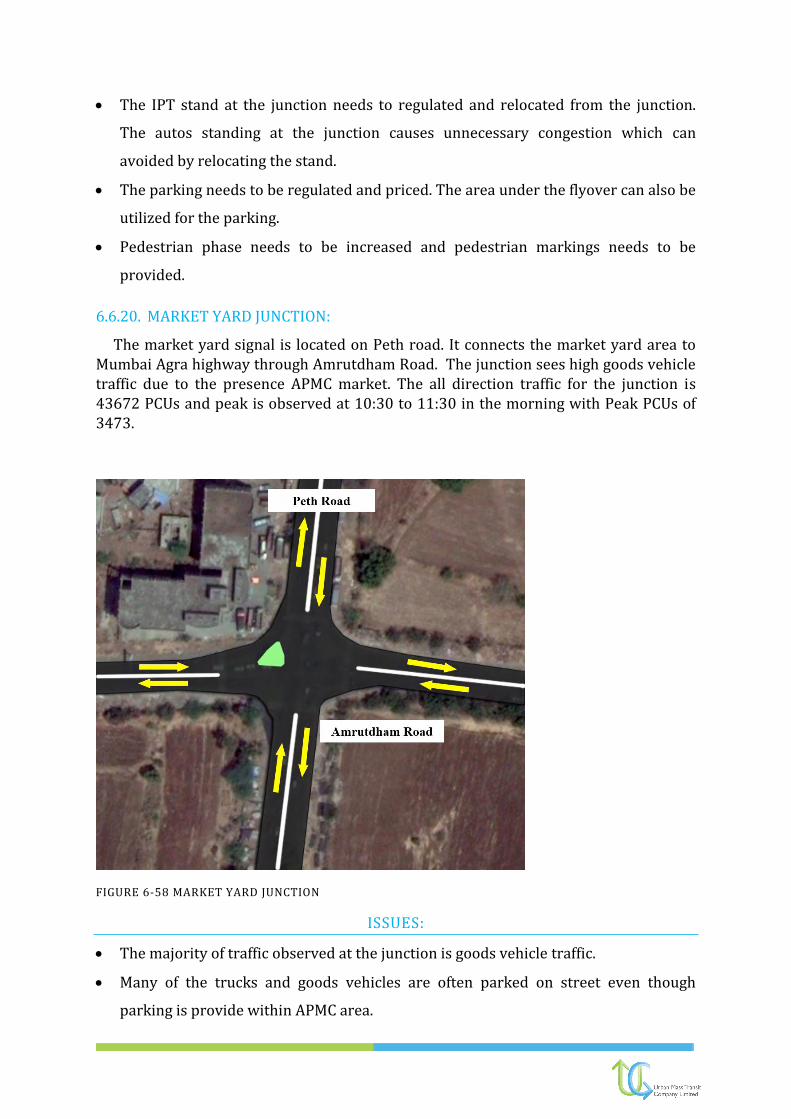
The IPT stand at the junction needs to regulated and relocated from the junction.
The autos standing at the junction causes unnecessary congestion which can
avoided by relocating the stand.
The parking needs to be regulated and priced. The area under the flyover can also be
utilized for the parking.
Pedestrian phase needs to be increased and pedestrian markings needs to be
provided.
6.6.20. MARKET YARD JUNCTION:
The market yard signal is located on Peth road. It connects the market yard area to Mumbai Agra highway through Amrutdham Road. The junction sees high goods vehicle traffic due to the presence APMC market. The all direction traffic for the junction is 43672 PCUs and peak is observed at 10:30 to 11:30 in the morning with Peak PCUs of 3473.
FIGURE 6-58 MARKET YARD JUNCTION
ISSUES:
The majority of traffic observed at the junction is goods vehicle traffic.
Many of the trucks and goods vehicles are often parked on street even though
parking is provide within APMC area.

The signal provided for controlling the traffic is non-functional.
PROPOSED INTERVENTIONS AND IMPROVEMENTS
The goods vehicles should not be allowed to park on-street and penalty should be
enforced on the parked vehicles.
The traffic signals should be repaired made operational even though there is no high
pedestrian activity it is recommended that pedestrian phase in the signal, pedestrian
markings and sign boards should be provided.
6.6.21. INDIRA NAGAR JUNCTION
Mumbai Agra Highway (NH3) and Sawta Mali road intersects at Indira Nagar junction. Sawta mali road and old canal road carries majority of city traffic crossing the NH3. It’s a grade separated intersection. Underpass is provided for the traffic to cross the NH3. One of the exits to the NH3 flyover is provided at the junction.
FIGURE 6-59 INDIRA NAGAR UNDERPASS
ISSUES:
Major issue at the junction is obstruction of traffic crossing the NH3. The underpass
provided for crossing the intersection is very narrow and cannot accommodate the
volume of traffic.

The service lane on either side of NH3 carries the two way traffic which increases
the conflicts at the junction.
Due to the exit at the junction, the major road with high speed traffic conflicts with
slow speed traffic on minor road thus increasing the chances of accidents.
PROPOSED INTERVENTIONS AND IMPROVEMENTS
One of the interventions that can be implemented is allowing only 2 wheelers and
NMTs through the underpass which will reduce the congestion at the underpass.
The 4 wheelers and other vehicles can be rerouted via Lekhanagar junction and
Mumbai Naka.
As the fast moving traffic from NH3 meets the slow moving traffic from the Indira
nagar and Govind nagar, at the exit , traffic calming measures can be used to avoid
the accidents. Traffic calming measures like rumble strips can be installed at the
intersection to reduce the speed of incoming traffic.
Allowing only one way traffic on the service lane will also help in reducing the
conflicts.
6.6.22. GENERAL RECOMMENDATIONS
There should be proper pedestrian marking, crossings and sign boards present at
the junction.
The time for pedestrian crossing should be increased and one exclusive pedestrian
phase should be provided for safe pedestrian crossing.
Wherever needed, mid-block crossing should be provided and hooter or pelican
signals should be installed at such places.
For wider junctions where pedestrians may not be able to cross the junction in one
phase refuge islands should be provided.
No parking should be allowed in the junction area. Parking should start at least 50m
away from the junction.
The hawkers and vendors should not be allowed in the junction area, as it attracts
parking and on-lookers creating congestion at the junction.
6.6.23. PAVEMENT MARKINGS AND SIGNAGES
Even though road signs and markings are provided on major road stretches of Nashik, some of the sign boards are not visible and some are not maintained properly. It is
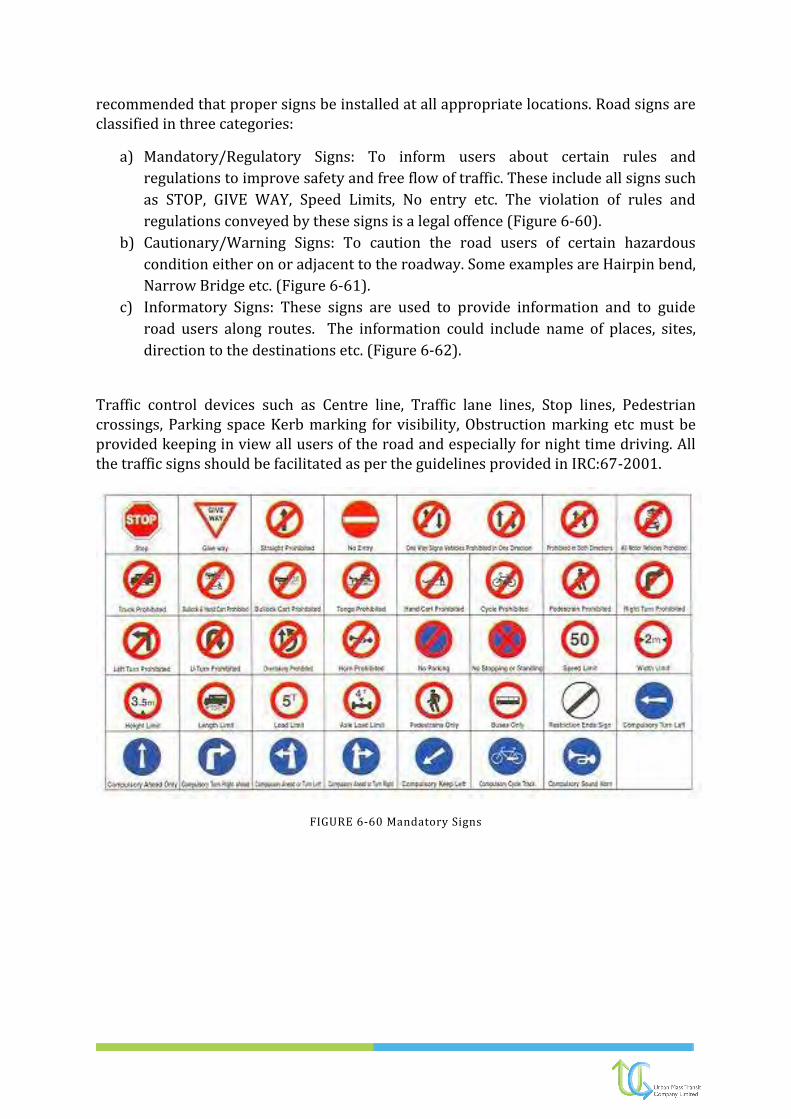
recommended that proper signs be installed at all appropriate locations. Road signs are classified in three categories:
a) Mandatory/Regulatory Signs: To inform users about certain rules and
regulations to improve safety and free flow of traffic. These include all signs such
as STOP, GIVE WAY, Speed Limits, No entry etc. The violation of rules and
regulations conveyed by these signs is a legal offence (Figure 6-60).
b) Cautionary/Warning Signs: To caution the road users of certain hazardous
condition either on or adjacent to the roadway. Some examples are Hairpin bend,
Narrow Bridge etc. (Figure 6-61).
c) Informatory Signs: These signs are used to provide information and to guide
road users along routes. The information could include name of places, sites,
direction to the destinations etc. (Figure 6-62).
Traffic control devices such as Centre line, Traffic lane lines, Stop lines, Pedestrian crossings, Parking space Kerb marking for visibility, Obstruction marking etc must be provided keeping in view all users of the road and especially for night time driving. All the traffic signs should be facilitated as per the guidelines provided in IRC:67-2001.
FIGURE 6-60 Mandatory Signs

FIGURE 6-61 Cautionary or Warning Signs
FIGURE 6-62 Informatory Signs

6.7. TECHNOLOGICAL MEASURES
Technological improvements include advanced applications which, without embodying intelligence as such, aim to provide innovative services relating to different modes of transport and traffic management and enable various users to be better informed and make safer, more coordinated, and 'smarter' use of transport networks.
6.7.1. INTELLIGENT TRANSPORT SYSTEMS
ITS encompasses all modes of transportation- air, sea, road and rail and intersects various components of each mode- vehicles, infrastructure, communication and operational systems. (Reference: Center of Excellence in Urban Transport, IIT-M, Intelligent Transport Systems)
FIGURE 6-63 Broad Overview Of ITS
(Reference: Center of Excellence in Urban Transport, IIT-M, Intelligent Transport Systems)
Intelligent Transport Systems will include:
a) Advanced Traffic Management Systems (ATMS) integrates various sub-systems
(such as CCTV, vehicle detection, communications, variable message signs etc)
into a coherent single interface that provides real information on traffic status.

b) Advanced Traveler Information Systems (ATIS) provides users of transportation
systems both public and private mode users travel related information regarding
routes, estimated travel times etc.
c) Advanced Vehicle Control Systems (AVCS) are tools and concepts that enhance
the driver’s control of the vehicle to make safe and more efficient.

d) Commercial Vehicle Operations for constant monitoring of heavy vehicles. It can
be in the form of smart cards, weigh bridges etc.
e) Advanced Public Transportation Systems to enhance efficiency of public transit
systems through information systems, signal priorities, GPRS etc
SIGNALIZATION
Traffic signals are necessary for safe movement of traffic at a junction. IRC 93:1985 provides the guidelines on designs and installation of road traffic signals. The IRC 93 suggests 5 warrants for the installation of signals at any junction. Traffic control signals should not be installed, unless one or more of the signal warrants specified herein are met. Information should be obtained by means of traffic and engineering studies and compared with the requirements set forth in the warrants. If these requirements are not met, a traffic signal should not be put into operation.
The need for signals at 82 Junctions in the city were checked through Warrants given in IRC 93:1985 (Annexure). Although 68 junctions qualified for signal installation, 26 junctions have been proposed to have signals installed. Given the importance of these locations, it is suggested that these proposals should be implemented as part of short-term improvement plan. The following are the locations for which installation of signals is proposed. These junctions, either do not have a signal or have signals which do not function. The signal phasing diagrams for these junctions can be found in the Annexure.
1. Amrut Garden 2. Jyoti Store Chowk 3. Thatte Nagar 4. Jehan Circle 5. Pipe Line Road Junction 6. Sambhaji Chowk 7. Sailani Baba 8. Narayan Bapu Chowk

9. Sandip Hotel 10. Mico Circle 11. Chandak Circle 12. Rajsarthi Chowk 13. HDFC Chowk 14. PTA Kulkarni Chowk, College road 15. Lokamat Circle, Bhosala 16. Jaishankar Chowk 17. Hotel Sible 18. Nilgiri Baug 19. ABB Circle 20. Sinnar Phata 21. XLO Point 22. Trimurti Chowk 23. Ramwadi Y Junction 24. Goraksha Nagar 25. Mahindra Junction 26. Papaya Nursery
SMART SIGNALIZATION
6.7.2. AREA TRAFFIC CONTROL SYSTEMS – VEHICLE ACTUATED SIGNALS
Now-a-days, controlling traffic congestion relies on having an efficient and well-managed traffic signal control policy. Traffic signals operate in either pre-timed or actuated mode or some combination of the two. Pre-timed control consists of a series of intervals that are fixed in duration. They repeat a preset constant cycle. In contrast to pre-timed signals, actuated signals have the capability to respond to the presence of vehicles or pedestrians at the intersection. Actuated control consists of intervals that are called and extended in response to vehicle detectors. The controllers are capable of not only varying the cycle length & green times in response to detector actuation, but of altering the order and sequence of phases. Adaptive or area traffic control systems (ATCS) belong to the latest generation of signalized intersection control. ATCS continuously detect vehicular traffic volume, compute optimal signal timings based on this detected volume and simultaneously implement them. Reacting to these volume variations generally results in reduced delays, shorter queues and decreased travel times. Coordinating traffic signals along a single route so that vehicles get progressive green signal at each junction is another important aspect of ATCS.
Basic Principle: Vehicle-Actuated Signals require actuation by a vehicle on one or more approaches in order for certain phases or traffic movements to be serviced. They are equipped with detectors and the necessary control logic to respond to the demands placed on them. Vehicle-actuated control uses information on current demands and operations, obtained from detectors within the intersection, to alter one or more aspects of the signal timing on a cycle-by-cycle basis. Timing of the signals is controlled by traffic demand. Actuated controllers may be programmed to accommodate:
Variable phase sequences (e.g., optional protected LT phases)
Variable green times for each phase
Variable cycle length, caused by variable green times
Such variability allows the signal to allocate green time based on current demands and operations. A proper clearance interval between the green & the red phases is also ensured. The various advantages of actuated signals are:
They can reduce delay (if properly timed).
They are adaptable to short-term fluctuations in traffic flow.
Usually increase capacity (by continually reapportioning green time).
Provide continuous operation under low volume conditions.
Especially effective at multiple phase intersections.
Typical Operation of ATCS
An area sub-divided into zones or corridors
Corridors operate on common background cycle

Signal timings and Cycle lengths updated dynamically based on real-time
demand
Signals synchronized for green-wave
Offset deviation corrected at plan transition
CASE STUDY: Vehicle-Actuated Witrac Technology in Pune
The WiTrac is a vehicle-actuated system that uses wireless technology to control traffic signals. The Master control of this system operates several sub-controls by sending wireless signals. The system is also equipped with cameras that constantly monitor traffic status and keep an eye on each and every vehicle within its jurisdiction. A special centralized control room monitors these cameras. The system is power efficient since it runs on solar power with power backup of up to 72 hours. Also its installation does not require digging up of roads to lay cables (it being wireless). The system is highly power efficient, and the mounted solar panels offer the system 72 hours of backup time. A typical Junction Installation is shown below:
FIGURE 6-64 WITRACC INSTALLATION
Trafitronics, the company responsible for marketing of WiTrac, has already installed the system in the following cities:
Location No. Of Junctions
Pune Phase I 38
Pune Phase II 30
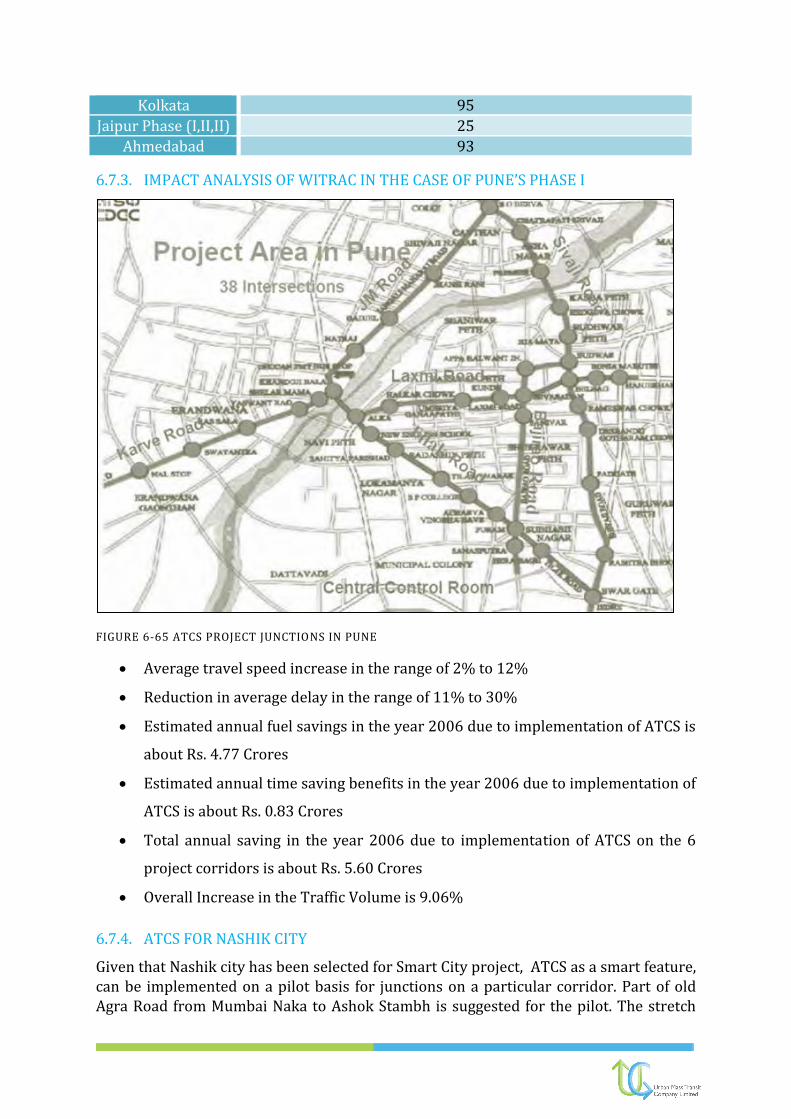
Kolkata 95
Jaipur Phase (I,II,II) 25
Ahmedabad 93
6.7.3. IMPACT ANALYSIS OF WITRAC IN THE CASE OF PUNE’S PHASE I
FIGURE 6-65 ATCS PROJECT JUNCTIONS IN PUNE
Average travel speed increase in the range of 2% to 12%
Reduction in average delay in the range of 11% to 30%
Estimated annual fuel savings in the year 2006 due to implementation of ATCS is
about Rs. 4.77 Crores
Estimated annual time saving benefits in the year 2006 due to implementation of
ATCS is about Rs. 0.83 Crores
Total annual saving in the year 2006 due to implementation of ATCS on the 6
project corridors is about Rs. 5.60 Crores
Overall Increase in the Traffic Volume is 9.06%
6.7.4. ATCS FOR NASHIK CITY
Given that Nashik city has been selected for Smart City project, ATCS as a smart feature, can be implemented on a pilot basis for junctions on a particular corridor. Part of old Agra Road from Mumbai Naka to Ashok Stambh is suggested for the pilot. The stretch

consists of 4 signalized junction namely Gadkari Chowk, Modak Point, CBS Chowk and Meher Chowk whereas Ashok Stambh and Sandeep Hotel Chowk are unmanned junctions. The system can be implemented and impact assessment can be done for the same. Given the assessment shows the considerable improvement, the system can be implemented citywide in a phased manner.
FIGURE 6-66 PROPOSED CORRIDOR & JUNCTIONS FOR ATCS
6.8. TRAVEL DEMAND MANAGEMENT MEASURES
Travel demand management is an intervention (excluding provision of major infrastructure), to modify travel decisions so that more desirable transport, social, economic and/or environmental objectives can be achieved, and the adverse impact of travel can be reduced. A combination of TDM strategies and policies help reduce travel demand or redistribute this demand in space or in time. A demand management approach to transport has the potential to deliver better environmental outcomes, improved public health and stronger communities, and more prosperous and livable cities. A broad range of demand management strategies are available and can be brought to use depending on the situation and suitability. Some of the “tools” used for TDM are listed below:
Subsidizing transit costs for employees or residents.
Car parking controls and pricing
Flex-time work schedules with employers to reduce congestion at peak times
Road space rationing by restricting travel at certain times and places.
Workplace travel plans
Road space reallocation, aiming to re-balance provision between private cars and other sustainable modes

Introducing active trip reduction programs
Public education and awareness programs
Parking Strategies
The city can choose and implement any of these strategies, as they do not have any significant financial implications and most of them are policy decisions.
6.8.1. PARKING POLICY AND MANAGEMENT
Effective parking strategies are essential to manage the unauthorized parking activities in the city. The parking strategies should address the issues which will in turn reduce the automobile dependency. The various measures adopted for parking are:
However, the parking master plan for NMC Report will explain all the parking strategies required for Nashik. The parking management has identified the need for off street parking in 8 locations in the city:
Short term measures
Develop and approve multi-year parking tariff policy
Differential parking tariffs to encourage the use of Multi-level car parks and
off street surface parking, and escalate tariff as per pre-defined increments
Have effective penalties for parking violation and enforce them
No free residential parking on main roads (width > 6m) between 07:00 hrs
and 22:00 hrs; no on –street parking within 75 m of entry/exit points near
important/major traffic junctions, major industries, commercial spaces,
education buildings, hospitals etc.
Improve public transport to realize mode shift
Ban on street parking in CBD/Core city/Commercial Areas
Medium and Long term measures
Promote use of technology for effective enforcement of parking violations-
Develop and approve a differential parking tariff to encourage use of peripheral
parking
Parking Restriction and Enforcement
Congestion Charge
Impose congestion charge during peak hours on entry of private vehicles in
core city area
Cash-out measures, transit incentives, unbundling, curb side parking meters,
price sensitivity, shared parking, parking regulation, remote parking and public
transport facilities, improved enforcement and control
6.9. PARKING STRATEGIES / PROPOSALS
The overall observations made from the extensive paring surveys carried out in Nashik:
a) Average parking duration at on-street parking locations is observed to be less than
half-an-hour (i.e. 19 minutes) whereas it is observed to be around 6 hours at off-
street parking locations (i.e. 364 minutes). Average parking duration at Bus
terminals is observed to be around 7 hours (i.e. 429 minutes), as people travel
through bus transport to nearby places for work purpose.
b) Peak hour share at on-street parking locations is varying from 5% to 15% whereas it
is varying from 9% to 17% at off-street parking locations.
c) In most of the on-street parking locations, peak hour is observed during 18:30 to
19:30 whereas for off-street parking locations it is observed during 16:30 to 17:30.
Peak hour at Indira Nagar location is observed in the early morning (i.e. 07.00 to
08.00) due to presence of Jogging track and Park.
d) Parking index at On-street parking locations is maximum on wawre chowk, Modak
point, CBS etc and minimum on Untawadi Road at Off-street parking locations is
maximum near Annashastri Hospital with 72% and minimum near Indira Nagar
Jogging Track with 2%.
e) Parking turnover rate for 16 hours at on-street parking locations is maximum on
Canada corner-Panasonic gallery road with 19.4 Veh/Bay due to commercial land
use Parking turnover rate for 16 hours at off-street parking locations is maximum
near Muktidham and Somani Garden with 13.6 Veh/Bay and minimum near Indira
Nagar Jogging Track with 0.3 Veh/bay.
f) A user opinion survey was carried for understanding the willingness to pay for
parking, which revealed that about 20% of people are willing to pay for parking at
Rs. 5 per hour.
g) A CAGR of 12% was considered for estimating horizon year parking demand (2021).
6.9.1. GENERAL: ON-STREET PARKING - NORMS
The following norms need to be adopted to ensure better regulated on-street parking. MoUD Study titled “Traffic and Transportation Policies and Strategies in Urban Areas, 1998” recommends some norms for on-street parking.

1. No on-street parking should be permitted at locations on primary and secondary
road network where carriageway width is less than 7m.
2. Street parking should not be allowed on roads where V/C ratio is more than 0.8
or speeds less than 15 Kmph.
3. Suitable kerb side lengths should be kept clear of parked vehicles near bus bays.
4. In central areas, street parking may be permitted on one side of the road and for
short time durations.
5. Capacity of existing facilities should be increased by using currently wasted
areas (corners, edges, undeveloped land, etc.) and by changing from parallel to
angular parking (30 deg).
Figure 6-67: Angular VS perpendicular parking in single and double row configurations
6.9.2. ON-STREET PARKING- DEMAND MANAGEMENT
1. Many of the on-street parking locations show a parking index of less than 50%. NMC
should curtail parking supply by 50% on the stretches where parking index is less
than 50%.
2. Signs and pavement markings: On–street parking areas (eg. for cars, two
wheelers) should be provided with marked parking bays. Parking bays should be
delineated by painted lines, studs, markers or textured surfaces different to the rest
of the area. NMC should provide proper signboards with the words ‘Park in Bays
Only’ and should be used at all entry points to the precinct and the ‘END
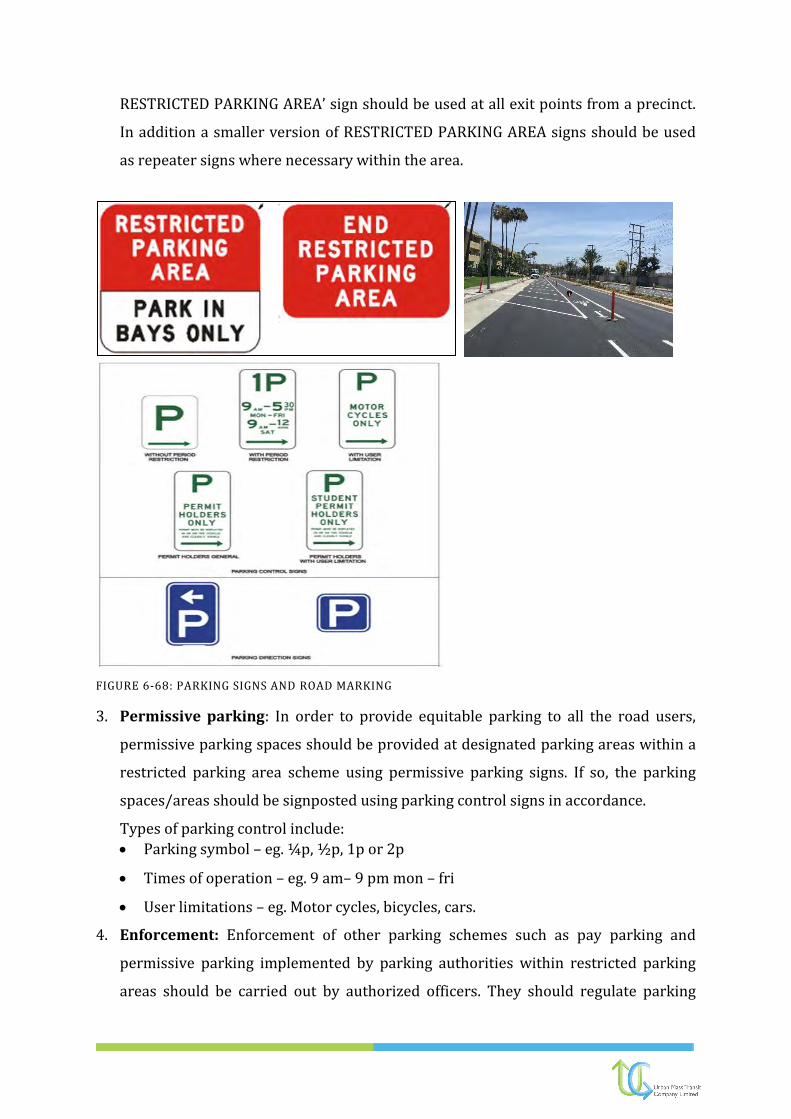
RESTRICTED PARKING AREA’ sign should be used at all exit points from a precinct.
In addition a smaller version of RESTRICTED PARKING AREA signs should be used
as repeater signs where necessary within the area.
FIGURE 6-68: PARKING SIGNS AND ROAD MARKING
3. Permissive parking: In order to provide equitable parking to all the road users,
permissive parking spaces should be provided at designated parking areas within a
restricted parking area scheme using permissive parking signs. If so, the parking
spaces/areas should be signposted using parking control signs in accordance.
Types of parking control include:
Parking symbol – eg. ¼p, ½p, 1p or 2p
Times of operation – eg. 9 am– 9 pm mon – fri
User limitations – eg. Motor cycles, bicycles, cars.
4. Enforcement: Enforcement of other parking schemes such as pay parking and
permissive parking implemented by parking authorities within restricted parking
areas should be carried out by authorized officers. They should regulate parking

demand by issuing high penalty charge for breaching the traffic rules, restricting
parking duration, encouraging employees to use less convenient parking spaces
(such as parking lots at the urban fringe) during peak periods in order to leave the
most convenient spaces for customers, limiting the use of on-street parking for
longer duration by local residents and prohibiting on-street parking on certain
routes during peak periods to increase traffic lanes.
5. Parking Pricing: Parking pricing should be allowed on following road stretches
with proper markings clearly.
It is suggested that a parking fee of Rs.5/- for two-wheelers and Rs. 10/- of cars for one hour should be charged. Time restriction is important to encourage short-term parking. It is also recommended to implement a differential parking fee policy with increasing fee structure in the central area and outer areas or a differential parking fee policy with increasing fee structure in peak hours or duration of parking. Paid parking can also provide a means of revenue generation to the municipality.
6.9.3. SELECTION OF SUITABLE PARKING SYSTEM FOR NASHIK
Based on the people’s discussion held in Nashik, it is recommended to use surface parking system for identified off-street parking sites in Nashik. Following are the identified off-street parking locations.
Chatur Samarth Aakhada
Mahamarg Bus Stand
Old CBS
Devlali Bus Stand
Nimani Bus Stand
New CBS
Mela Bus Stand
Mhasoba Ground (Gadge Maharaj Bridge to Sam Setu bridge)
BD Bhalekar High school Ground, Shalimar
Nashik Road
Satpur Bus Stand
Indira Nagar Jogging Track
However, at few locations, the existing area is not sufficient to cater the future parking needs through surface parking (i.e. parking index is more than 100%). In this scenario, following locations are proposed for multi-level parking system (Ramp Based Multi-Level Parking/Semi-Automated System).
Annashastri Hospital
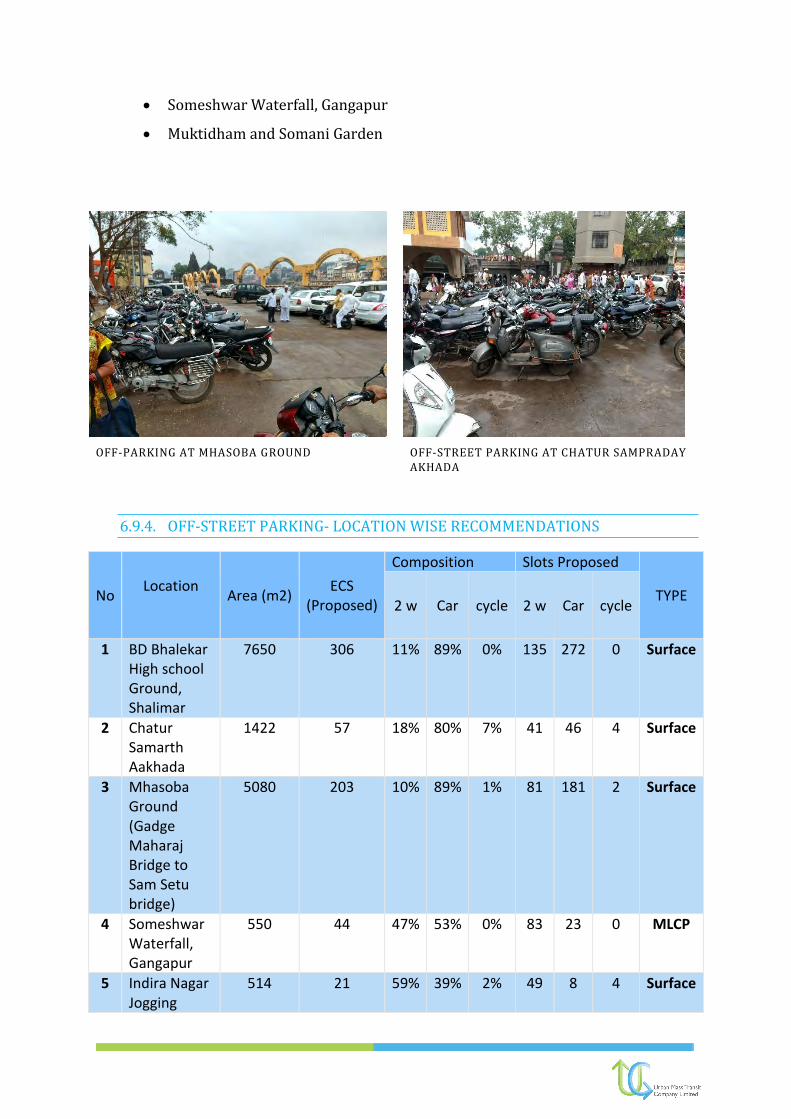
Someshwar Waterfall, Gangapur
Muktidham and Somani Garden
OFF-PARKING AT MHASOBA GROUND
OFF-STREET PARKING AT CHATUR SAMPRADAY AKHADA
6.9.4. OFF-STREET PARKING- LOCATION WISE RECOMMENDATIONS
No Location
Area (m2)
ECS (Proposed)
Composition Slots Proposed
TYPE 2 w Car cycle 2 w Car cycle
1 BD Bhalekar High school Ground, Shalimar
7650 306 11% 89% 0% 135 272 0 Surface
2 Chatur Samarth Aakhada
1422 57 18% 80% 7% 41 46 4 Surface
3 Mhasoba Ground (Gadge Maharaj Bridge to Sam Setu bridge)
5080 203 10% 89% 1% 81 181 2 Surface
4 Someshwar Waterfall, Gangapur
550 44 47% 53% 0% 83 23 0 MLCP
5 Indira Nagar Jogging
514 21 59% 39% 2% 49 8 4 Surface

Track
6 Annashastri Hospital
350 28 26% 74% 0% 29 21 0 MLCP
7 Muktidham and Somani Garder
230 18 11% 88% 1% 8 16 2 MLCP
Source: Primary Survey, 2016 and UMTC Estimates
FIGURE 6-69 4-BD BHALEKAR HIGH SCHOOL GROUND,OPP KALIDAS KALA MANDIR OPEN SPACE

FIGURE 6-70 CHATUR SAMPRADAY AKHADA
6.9.5. ON-STREET PARKING LOCATION-WISE RECOMMENDATIONS
For on-street parking, it is recommended to increase the capacity of existing facilities by using currently wasted areas (corners, edges, undeveloped land, etc.) and by changing from parallel to angular parking (30 deg). Also, in the case of off-street parking being present in the vicinity, steps should be taken to ensure the effective usage of the off-street facility by imposing No-Parking zones around the facility. The location-wise recommendations of on-street parking in Nashik are presented below:

ON-STREET PARKING- LOCATION-WISE RECOMMENDATIONS
S. No Location Stretch length
(m)
Parking Total Parking Parking Type Civil Work Needed
LHS RHS
2 W 4 W 2 W 4 W 2 W 4 W
1 Sales Tax Office to Wavre Chowk 150 18 6 0 0 18 6 30 Degree Angular
Pavement, Sign Boards, Thermoplastic Paints, QR
Post
2 Kulkarni Garden Side on Sadhu Vaswani Road
60 18 0 18 0 36 0 Perpendicular Pavement, Sign Boards, Thermoplastic Paints, QR
Post
3 Behind Kulkakarni Garden 120 0 12 0 12 0 24 30 Degree Angular
Sign Boards, Thermoplastic Paints, QR Post
4 Kulkarni Garden to BSNL Office 230 48 24 0 0 48 24 30 Degree Angular
Sign Boards, Thermoplastic Paints, QR Post
5 veterinary Hospital to Darga 80 0 12 0 0 0 12 30 Degree Angular
Pavement, Sign Boards, Thermoplastic Paints, QR
Post
6 Gole Colony Entry 1 to Gole Colony Entry 2
80 0 0 0 12 0 12 30 Degree Angular
Pavement, Sign Boards, Thermoplastic Paints, QR
Post
7 Vishwadeep Society to Gangapur Naka
647 43 31 112 26 155 57 30 Degree Angular
Pavement, Sign Boards, Thermoplastic Paints, QR
Post
8 Pramod Mahajan Garden Entry 230 33 11 33 11 66 22 30 Degree Angular
Pavement, Sign Boards, Thermoplastic Paints, QR
Post
9 Gangapur Naka Jehan Circle 1632 234 78 234 78 468 156 30 Degree Angular
Sign Boards, Thermoplastic Paints, QR Post

S. No Location Stretch length
(m)
Parking Total Parking Parking Type Civil Work Needed
10 Jehan Circle to Guruji Hospital 1020 0 0 147 49 147 49 30 Degree Angular
Pavement, Sign Boards, Thermoplastic Paints, QR
Post
11 Guruji Hospital to Pipeline Road 260 37 12 0 0 37 12 30 Degree Angular
Pavement, Sign Boards, Thermoplastic Paints, QR
Post
12 D'Souza Colony Road 450 65 22 65 22 130 44 30 Degree Angular
Sign Boards, Thermoplastic Paints, QR Post
13 Thatte Nagar Road 490 70 23 70 23 140 46 30 Degree Angular
Sign Boards, Thermoplastic Paints, QR Post
14 Pandit Colony 490 70 18 70 18 140 36 Parallel Parking for Car
Sign Boards, Thermoplastic Paints
15 Canada Corner to Panasonic Gallery
220 137 0 0 26 137 26 Parallel Parking for Car
Sign Boards, Thermoplastic Paints
16 HDFC chowk to Yahoo Hotel 100 0 0 38 6 38 6 30 Degree Angular
Sign Boards, Thermoplastic Paints, QR Post
17 College Road to PTA Gate 210 80 13 80 13 160 26 30 Degree Angular
Sign Boards, Thermoplastic Paints, QR Post
18 City Center To Lavate Nagar Lane 2
440 112 42 112 42 224 84 30 Degree Angular
Sign Boards, Thermoplastic Paints, QR Post
19 PWD Shed to Global Hospital 400 0 48 102 29 102 77 Parallel Parking for Car
Sign Boards, Thermoplastic Paints
20 Modak Point to Dhadiwal Hospital 160 41 15 41 15 82 30 30 Degree Angular
Sign Boards, Thermoplastic Paints, QR Post
21 Civil Hospital to Swimming Pool 260 67 25 0 0 67 25 30 Degree Angular
Sign Boards, Thermoplastic Paints, QR Post

S. No Location Stretch length
(m)
Parking Total Parking Parking Type Civil Work Needed
22 Ramabai Vidyalaya to ITI 120 32 12 32 12 64 24 30 Degree Angular
Sign Boards, Thermoplastic Paints, QR Post
23 CBS to Meher Chowk 430 0 0 96 36 96 36 30 Degree Angular
Sign Boards, Thermoplastic Paints, QR Post
24 Holkar to Nimani Chowk 380 98 13 61 39 159 52 30 Degree Angular
Sign Boards, Thermoplastic Paints, QR Post
25 Nimani Chowk to Chitrakut 520 115 33 115 33 230 66 30 Degree Angular
Sign Boards, Thermoplastic Paints, QR Post
26 Malegaon Stand to Makhmalabad Naka
320 175 0 0 44 175 44 Parallel Parking for Car
Sign Boards, Thermoplastic Paints, QR Post
27 Jehan Circle to ABB 1830 411 154 411 154 822 308 30 Degree Angular
Sign Boards, Thermoplastic Paints, QR Post
28 MG Road 290 48 27 48 27 96 54 30 Degree Angular
Sign Boards, Thermoplastic Paints, QR Post
29 CBS to Shalimar 290 64 24 33 12 97 36 30 Degree Angular
Sign Boards, Thermoplastic Paints, QR Post
30 Modak Point to Khadkali Road 350 78 29 0 0 78 29 30 Degree Angular
Sign Boards, Thermoplastic Paints, QR Post
31 Khadkali to Dwarka 1370 231 132 231 132 462 264 30 Degree Angular
Sign Boards, Thermoplastic Paints, QR Post
32 Shivaji Putala To Ambedkar Putala (Nashik Road)
390 87 33 87 33 174 66 30 Degree Angular
Sign Boards, Thermoplastic Paints, QR Post
33 Bytco to Mahatma Gandhi 1064 238 89 238 89 476 178 30 Degree Angular
Sign Boards, Thermoplastic Paints, QR Post
34 Kanya Shala to Sailani Baba 1510 338 126 338 126 676 252 30 Degree Angular
Sign Boards, Thermoplastic Paints, QR Post
Total Vehicles 5800 2183
7983

6.9.6. PAYMENT COLLECTION METHOD PROPOSED FOR NASHIK CITY:
Electronic Pay-Per-Space or Time-coded ticket systems are suggested for Nashik city. Following objectives were formulated to introduce paid parking system in Nashik:
1) Manage and price the most convenient parking spaces to favour priority users.
Charge higher rates for longer durations and use shorter pricing periods at more
convenient parking spaces such as on-street and near building entrances to increase
turnover and favor higher-priority users. The increase in turnover does not only link
with higher revenue but also with managing more demand with less number of
parking bays. This is an important initiative for cities like Nashik where land prices
are increasing rapidly. The effective way of management is to charge performance
based prices, set to maintain 85-90% occupancy rates (i.e. Parking index). At more
convenient locations, prices should be higher, time increments smaller, and rates
may increase over time (e.g., Rs. 10 for the first hour, Rs. 20 for the second hour and
Rs. 50 for each subsequent hour) to encourage turnover. Case in which short term
parking is predominant, the parking fees should be higher during peak periods and
lower during off-peak periods. Less convenient locations can have lower rates and
long-term discounts to shift demand from on-street / easy locations to less
convenient off-street locations.
2) Implement parking pricing as part of an integrated parking management program
that also includes improved user information on parking and transportation options,
commuter trip reduction programs, improvements to alternative modes, and
adequate, predictable and courteous enforcement.
3) Avoid excessive parking supply. Apply reduced and more flexible parking standards
that reduce requirements if parking is efficiently managed.
4) Establish pricing policies that respond to changing conditions and demands.
Optimal rates may vary from one location or time to another, and often need
adjustment as supply and demand changes, for example, if nearby parking lots is
closed or new businesses open. Establish performance indicators and identify
additional management strategies that can be deployed as needed if problems
develop.
5) Prices should be well publicized and predicable. Use signs, maps, brochures,
websites and other resources to provide information to users.

6) Avoid discounts for long-term parking leases (i.e., cheap monthly rates). For
example, set daily rates at least 6 times the hourly rates, and monthly rates at least
20 times daily rates. Even better, eliminate unlimited-use passes altogether. Instead,
sell books of daily tickets, so commuters save money every day they avoid driving.
Eliminate early-bird discounts.
7) Management programs should anticipate potential spill over problems, and respond
with appropriate regulations and enforcement.
8) Parking fees should be coordinated throughout a district or region, so that
comparable areas have comparable fees.
9) Dedicate some or all of the revenue from on-street parking to benefit local
businesses and residents.
10) Unbundle parking from building rents, so occupants only pay for the number of
parking spaces they want.
11) Tax parking spaces - Reform existing tax policies that favour free parking. For
example, tax land devoted to parking at the same rate as land used for other
development. Parking pricing implementation requires changing well-entrenched
habits and institutional practices, so it is important to build community support.
Opponents focus on parking pricing problems and costs, while overlooking benefits.
It is important to identify all benefits and to illustrate savings and benefits to typical
households. Clearly communicate the options a community faces.
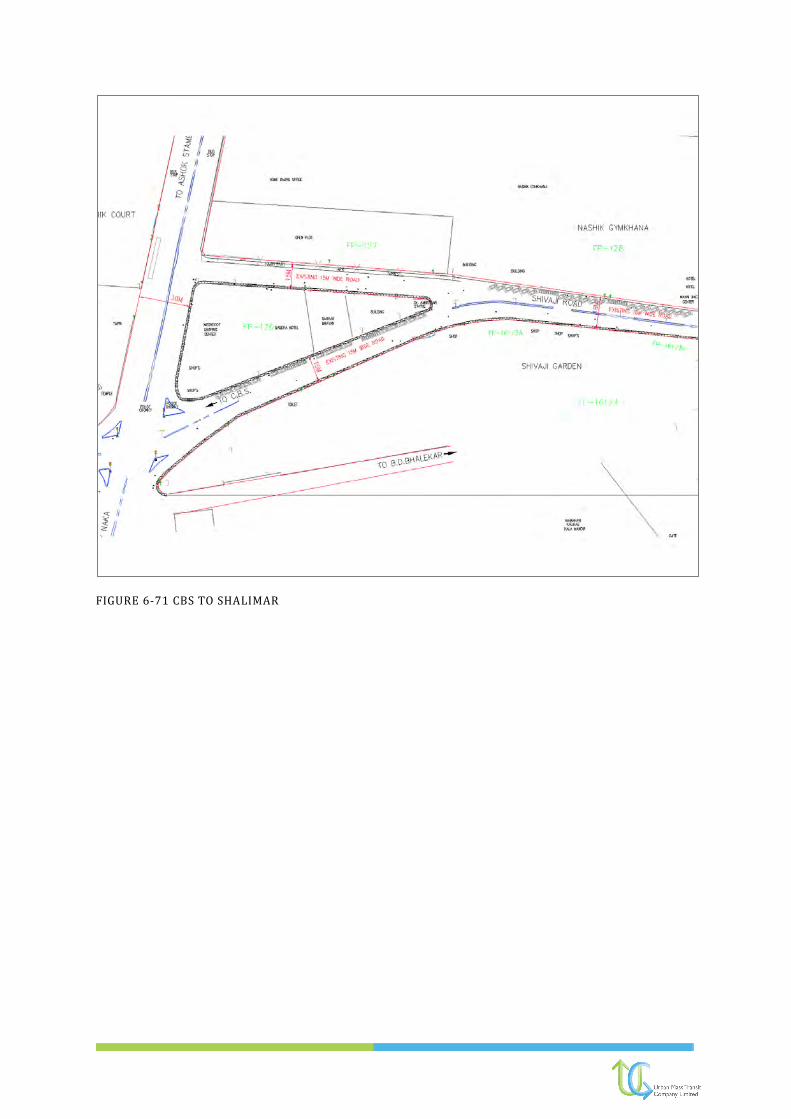
FIGURE 6-71 CBS TO SHALIMAR
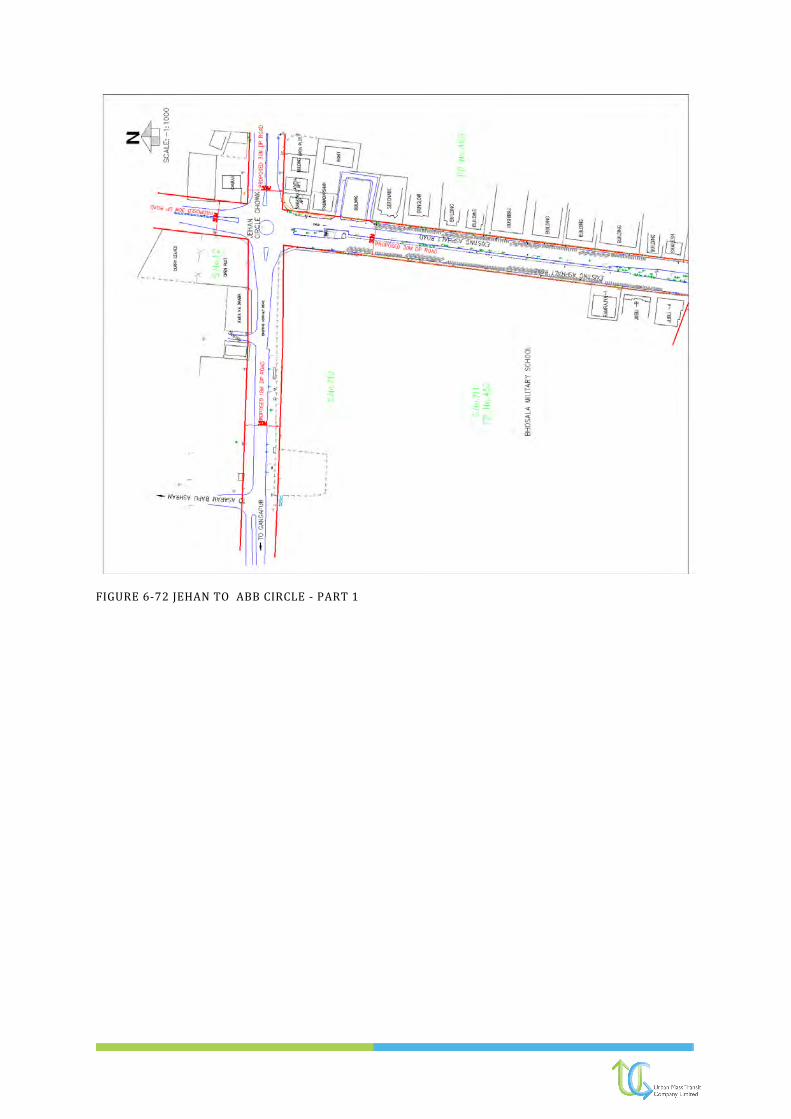
FIGURE 6-72 JEHAN TO ABB CIRCLE - PART 1

FIGURE 6-73 JEHAN TO ABB CIRCLE - PART 2
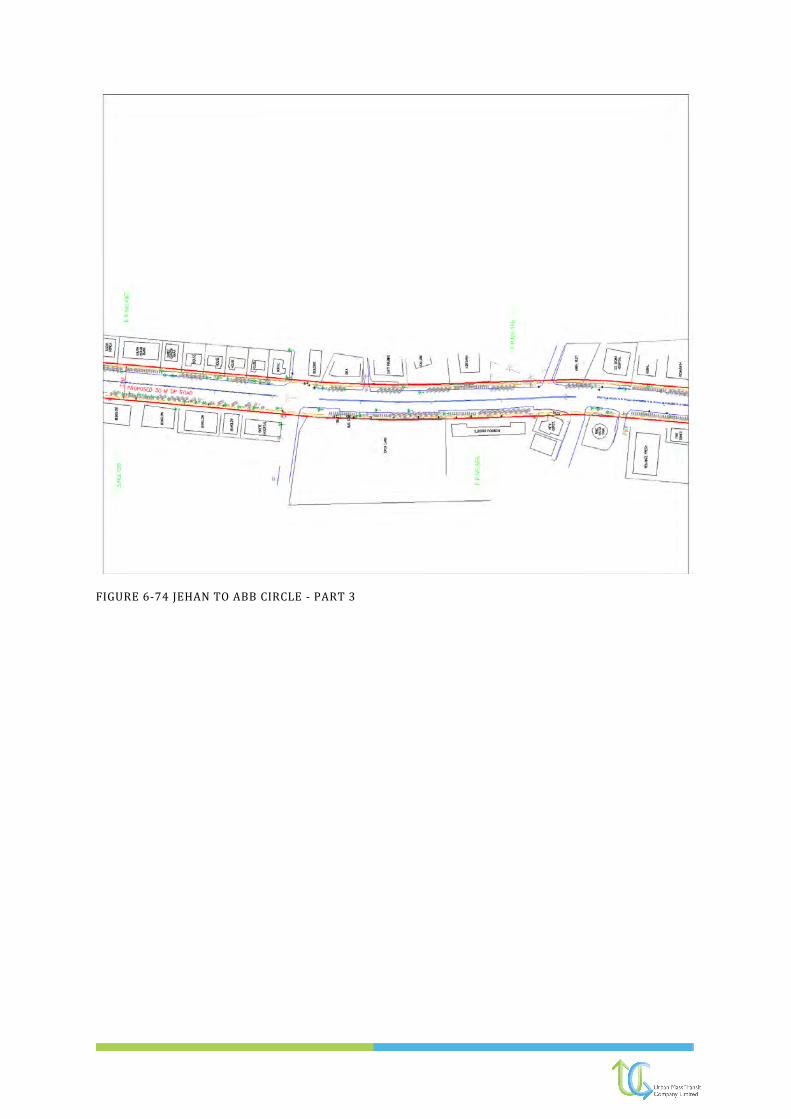
FIGURE 6-74 JEHAN TO ABB CIRCLE - PART 3

FIGURE 6-75 JEHAN TO ABB CIRCLE - PART 4

FIGURE 6-76 RIVERSIDE - PART 1

FIGURE 6-77 RIVERSIDE - PART 2

FIGURE 6-78 RIVERSIDE BUS PARKING

FIGURE 6-79 SHALIMAR TO MAHABAL CHOWK - PART 1

FIGURE 6-80 SHALIMAR TO MAHABAL CHOWK - PART 2

7. WAY FORWARD
Based on the existing analysis, different strategies in accordance with the NUTP have
been adopted and the applicable strategies have been evaluated for Nashik.
This Development of Scenarios and urban Mobility Plan report has explained not
only the base year travel characteristics, but also a detailed future transport scenario
forecasts. Two different scenarios namely (i) Business as-Usual scenario and (ii)
Sustainable Urban Transport Scenario have been tested in the model and the results
have been presented.
The next deliverable is Implementation Program report which includes the following
major outcomes:
Project Costing
Priority projects
Implementation schedules (short, medium and long term)
Institutional Framework