development of reagent-less processes for water … · 2017-12-01 · silis, nurlin abu samah,...
TRANSCRIPT

Development of Reagent-less Processes for Water
Decontamination. Tuning of Temperature and Redox
Parameters to Remove Toxic Oxyanions.
LIU HE 2015
Doctoral Thesis
PhD in Chemistry


Development of Reagent-less Processes for Water
Decontamination. Tuning of Temperature and Redox
Parameters to Remove Toxic Oxyanions.
LIU HE
Doctoral Thesis
PhD in Chemistry
Director: Manuel Valiente Malmagro
Departament de Quimica
Facultat de Ciencies
2015


Dissertation submitted for the degree of doctor
Liu HE
Supervisor
Prof Manuel Valiente Malmagro
Professor of Analytical Chemistry
Department of Chemistry. Centre GTS
Universitat Autònoma de Barcelona
Executive Director of GTS.
08193 Bellaterra (Barcelona), Spain, 28th Sep 2015


Acknowledgements First and formost, I wish to thank my supervisor Prof. Manuel Valiente for his guidance and support. Without his patient instruction, insightful criticism and expert guidance, the project would never matured into a typical thesis. I would also like to thank Prof. Gustavo Perez for his invaluable advice and constant encouragement. In addition, I would like to thank Prof. Olivier for providing me the short stay position in LCABIE, Pau, France, which make me to learn a lot of new techniques for analytical chemistry. I would like to express my gratitude to Prof. Liang Jizhao (my supervisor during Master), who inspired me to do further scientific research. I would also like to take this opportunity to show my heartfelt gratitude to my uncle, Yongquan Li, who encouraged me and helped me a lot. I would like to thank the friendly and generous staff and members of GTS for their help and guidance. My work could not have been proceeded without the assistance of several key staff members. Montserrat Lopez Mesas, Cristina Palet, Montserrat Resina Gallego, Maria dolors, Diego Morillo Martin, Fran blanco, Olga kotkowska, Maribel Restituyo Silis, Nurlin Abu Samah, Itziar, Veronica Verdugo, Shilpi Kumari, Victor Marquina Garces, Maria Angles Subirana, Albert Pell Lorante, Maria Jesus sanchez Martin. I take this opportunity to record my sincere appreciation to my doctoral colleagues, roommates, ball friends and playmates, Guofen Ma, Shuzhen Li, Wusheng Guo, Zhiyu Jia, Helan Zhang, Muling Zeng, Meng Chen, Yuanyuan Lu, Jian Li, Siming Yu, Zhikun Xu, Min Cao, Zhen Zhan, Haijie Liu, Qin Liu, Qinyi Tan, Luyan Teng, Yangchun Xin, Shujing Ding, Ping Sun, Shuangshuang Qi, Dianfei Yuan, Yuan Zhong, for their valuable friendship. Additionally, thanks for the help of Caiyan Feng, Hongyao Yin, who are my friends in Pau, France. I should especially acknowledge the encouragement, support and love given to me by my family, my parents and my brother and sister, without which I could have never reached this point in my life. And most of all, I would simply say to Tong Liu, who is my doctoral colleague and also my husband, “Thanks for you love, it makes everything worthwhile”. And finally, thanks for my little baby “Pedro”, who comes to my life during my PhD study period and I want to say “you are my pretty sunshine”. Last but not least, I would like to gratefully acknowledge the financial support of Chinese scholarship council (CSC) for supporting me to pursue my stay in Spain as a PhD student. In addition, the present thesis has been developed with the financial support of Projects: CHEMSYNCRO (Ministerio de Economia y Competitividad Ref, CTM2012-30970), FP4BATIW (FP7-INCO-2013-9 R2I-ENP, project number 609550) and NANOREMOVAS (H2020-MSCA-RISE-2014, Project Number 645024).


Summary


Summary The studies that have been carried out in the present PhD thesis project are based on the development of
methods to remove water pollutants by using reagent-less processes and to provide and added value to
the contaminated water treatment. In our case, the methods are related to arsenic or selenium oxyanions
removal in aqueous solution. Methods are based on sorption-desorption processes for the indicated
oxyanions. Nanostructured materials have been implemented as adsorption substances, being either iron
or aluminum oxides the nanoparticles active constituents. Reagent-less processes were developed by
using intensive thermodynamic parameters, e.g, temperature and/or redox potential of the target solution.
Appropriate tuning of these parameters will allow both process selectivity and regeneration of the
adsorption material. Synergic interaction of thermo-tuning with redox variation will provide such results.
Thus, this reagentless method could not only provide reagent savings for recovering the adsorbent, but
also the adsorbent recycling to be reused will contribute to a-cost efficient process. The results show as
follows:
The adsorption capacity of arsenate/arsenite on sponge loaded with superparamagnetic iron oxide
nanoparticles (SPION) is influenced by pH, contact time, initial concentration, adsorbent dosage,
temperature as well as redox potential. The maximum adsorption for arsenate on sponge-SPION was
obtained in an acid media (pH 3.6) in 1 hour contact time under 20ºC while desorption equilibrium was
achieved with 2 hours under 70ºC. Equilibrium adsorption constants were determined as log K20=4.198
and log K70=1.023 under 20ºC and 70ºC respectively. These values correlate with the decrease of related
negative ∆G° values, indicating the adsorption increase of As(V) when temperature decreases. ΔH° and
ΔS° were found to be -122.150 kJ mol-1 and 337 J mol-1 K-1 respectively, indicating the adsorption
reaction to be exothermic. The oxidation of As (III) to As(V) and the respective reduction processes were
characterized to prove the concept of using redox potential as key parameter for a reagent-less process.
Oxidation of As(III) to As(V) by potassium dichromate (conversion rate>91%) and reduction As(V) to
As(III) by Zn powder or Sn foil (conversion rate>90%) in presence of the adsorbent, have shown the
effect on the adsorption when tuning the solution redox potential, being As(V) of higher adsorption
capacity than As(III).
In addition, aqueous selenate/ selenite adsorption/desorption characteristics by γ-Al2O3 nanospheres or
SPION loaded sponge were also investigated. The maximum adsorption for selenate and selenite on γ-
Al2O3 nanospheres was achieved at pH 2 in 6 hours under 20ºC and 14 hours under 70ºC, respectively.
The kinetic and thermodynamic studies show that they are fitted very well to the pseudo-second order
and Frendlich isotherm model. The ∆H value of Se (IV) and Se (VI) between 20ºC and 70ºC were -
13.955 KJ mol-1and -3.927 KJ mol-1,respectively. It shows that lower temperature favor removal of
aqueous selenium. The results represent very similar adsorption phenomenon of selenate/selenite on
sponge- SPION as that of arsenate/arsenite on sponge-SPION, thus, sponge-SPION has much higher
adsorption capacity for arsenate or selenate than that of arsenite or selenite. The maximum adsorption
for selenate and selenite on sponge loaded with SPION was achieved at pH 3.6 in 1 hour under 20ºC and
6 hours under 70ºC, respectively, while time for obtaining equilibrium of selenite needs 14 hours under
20ºC and 24 hours under 70ºC.
More importantly, the temperature dependence aspects combined with the redox potential effect for
controlling the adsorption-desorption process have been studied. The column mode for treating the
waste water, which contains the arsenate/ arsenite or selenate/selenite systems, confirms that toxic
oxyanions could be removed by the related adsorbent, which could be regenerated and reused by
controlling the temperature combined with the tuning of the reducing reagent.


Resumen


Resumen Los estudios que se han llevado a cabo en esta tesis se basan en el desarrollo de métodos para la
eliminación de contaminantes en aguas mediante procesos en lo que no se utilizan reactivos, lo que
proporcionan un valor añadido al tratamiento del agua contaminada. En nuestro caso, los métodos
utilizados se centrar en la eliminación de oxoaniones de arsénico y selenio en disoluciones acuosas
mediante procesos de adsorción-desorción. Estos procesos caracterizados por la no utilización de
reactivos se desarrollaron mediante el estudio de parámetros termodinámicos, como por ejemplo, la
temperatura y/o el potencial redox de las disoluciones de estudio. Por tanto, estos métodos no solo nos
proporcionarán un ahorro de reactivos en la recuperación del adsorbente, sino que permitirán el reciclado
de dicho adsorbente y su reutilización.
La capacidad de adsorción del arsenito/arsenato en la esponja cargada con nanoparticulas de óxido de
hierro superparamagneticas (SPION) está influenciada por el pH, el tiempo de contacto, la concentración
inicial, cantidad de adsorbente, la temperatura y por el potencial redox. La adsorción máxima para el
arsenato en el sistema esponja-SPION se ha obtenido en medio ácido (pH 3.6) tras 1 hora a 20ºC, mientras
que el equilibrio de desorción se alcanzó a las 2h a 70ºC. Las constantes del equilibrio de adsorcion se
determinaron como logK20=4,198 y logK70=1.023 a 20°C y 70°C respectivamente. La disminución de
estos valores se relacionan un valor de ∆G negativo, lo que indica un aumento de la adsorción de As(V)
cuando la temperatura disminuye. Los valores de ∆H y ∆S calculados son -122,150 kJ mol-1 y 337 J mol-
1 K-1 respectivamente, lo que indica que el proceso de adsorción es exotérmico. La oxidación de As(III)
a As(V) y el proceso de reducción correspondiente fueron caracterizados para probar el concepto de
potencial redox como parámetro clave en estos procesos. La oxidación de As(III) a As(V) mediante
dicromato de potasio (tasa de conversión>91%) y la reducción de As(V) a As(III) mediante zinc en polvo
o estaño laminado (tasa de conversión>90%) en presencia del adsorbente han mostrado el efecto que
tiene el potencial redox en el proceso de adsorción.
Por otro lado, también se han estudiado las características del proceso de adsorción/desorción de los
aniones selenito/selenato utilizando como adsorbente nanoesferas de γ-Al2O3 y esponja cargada con
SPION. La máxima adsorción que presentan selenato y selenito sobre γ-Al2O3 se alcanzó a las 6 horas
en un medio ácido (pH 2) a 20ºC y a las 14h a 70ºC, respectivamente. Los estudios cinéticos y
termodinámicos muestran que los datos se ajustan a una cinética de pseudo-segundo orden y a una
isoterma de Frendlich. El valor de ∆H obtenido para Se(IV) y Se(VI) entre 20ºC y 70ºC fue de 13,955
KJ mol-1 y -3,927 KJ mol-1 respectivamente. Por tanto, el sistema esponja-SPION tiene una mayor
capacidad de adsorción para arsenato y selenato que para arsenito y selenito. La máxima adsorción para
selenato en el sistema esponja-SPION se alcanzó tras 1h en medio ácido (pH 3,6) a 20ºC y tras 6h a 70ºC
respectivamente, mientras que el tiempo necesario para alcanzar el equilibrio en el caso del selenito fue
de 14h a 20ºC y 24h a 70ºC.
En conclusión, se han estudiado el efecto que tiene sobre el proceso de adsorción-desorcion la
combinación de los aspectos que depende de la temperatura con el potencial redox. El modo en columna
utilizado para el tratamiento de aguas residuales, que contienen arsenato/arsenito o selenato/selenito,
confirma que estos oxoaniones tóxicos se pueden eliminar con estos adsorbentes, que además pueden ser
regenerados y reutilizados controlando combinando la temperatura y el uso de un agente reductor.


Content


1
Content
1. INTRODUCTION ......................................................................................................................... 1
1.1. PROBLEM STATEMENT ................................................................................................................... 1
1.1.1. Arsenic toxicity ............................................................................................................... 4
1.1.2. Selenium toxicity ............................................................................................................ 6
1.2. ARSENIC AND SELENIUM IN THE ENVIRONMENT .................................................................................. 8
1.2.1. Arsenic in the environment ............................................................................................. 8
1.2.2. Selenium in the environment .......................................................................................... 9
1.2.3. Arsenic and selenium in the aquatic system................................................................. 10
1.3. GENERAL CHEMISTRY OF ARSENIC AND SELENIUM ............................................................................. 11
1.3.1. Arsenic chemistry ......................................................................................................... 11
1.3.2. Selenium chemistry ...................................................................................................... 15
1.4. DIFFERENT METHODS AND TECHNOLOGIES FOR ARSENIC AND SELENIUM OXYANIONS REMOVAL ................ 18
1.4.1. Adsorption .................................................................................................................... 20
1.5. ADSORBENTS FOR ARSENIC AND SELENIUM REMOVAL ....................................................................... 22
1.5.1. Adsorbent materials for arsenic-literature review ....................................................... 23
1.5.2. Adsorbent materials for selenium-literature review .................................................... 26
1.6. NANOTECHNOLOGY OVERVIEW ..................................................................................................... 29
1.6.1. Superparamagnetic iron oxide nanoparticles(SPION) .................................................. 32
1.6.2. γ-Al2O3 alumina hollow nanospheres ............................................................................ 35
1.6.3. Supporting materials for SPION–Forager sponge......................................................... 36
1.7. KINETIC AND THERMODYNAMIC ASPECTS ........................................................................................ 39
1.7.1. Kinetic Model ................................................................................................................ 39
1.7.2. Isotherm Model ............................................................................................................ 42
1.7.3. Thermodynamic studies ............................................................................................... 44
1.7.4. Redox potential ............................................................................................................ 48
1.8. OBJECTIVES ............................................................................................................................... 50

2
2. METHODOLOGY ....................................................................................................................... 55
2.1. REAGENTS AND APPARATUS ......................................................................................................... 55
2.2. EXPERIMENT EQUIPMENT ............................................................................................................ 56
2.2.1. Basic experiment equipment ........................................................................................ 56
2.2.2. Colorimetric technique- UV-Vis Spectrophotometer .................................................... 56
2.2.3. Inductively Coupled Plasma Mass Spectrometry(ICP-MS) ............................................ 58
2.2.4. USB microscope ............................................................................................................ 61
2.2.5. Scanning Electron Microscopy ...................................................................................... 62
2.2.6. Transmission Electron Microscopy, TEM ...................................................................... 63
2.2.7. Energy Dispersive X-ray Spectrometer, EDS or EDX ...................................................... 64
2.3. PREPARATION OF THE ADSORBENTS ............................................................................................... 65
2.3.1. Synthesis of SPION ........................................................................................................ 65
2.3.2. Synthesis of 𝜸-Al2O3 nanospheres ................................................................................ 67
2.3.3. Forager sponge pretreatment ...................................................................................... 68
2.3.4. Loading of SPION on the sponge .................................................................................. 69
2.4. EXPERIMENTS ............................................................................................................................ 71
2.4.1. Batch experiment ......................................................................................................... 71
2.4.2. Kinetic study ................................................................................................................. 73
2.4.3. pH effect on the adsorption process ............................................................................. 74
2.4.4. Effect of initial concentration on adsorption process ................................................... 74
2.4.5. Effect of temperature ................................................................................................... 75
2.4.6. Continuous adsorption-desorption experiment ............................................................ 76
2.4.7. Treatment of the real waste water sample. ................................................................. 78
3. RESULTS AND DISCUSSION ...................................................................................................... 83
3.1. TEMPERATURE-DEPENDENCE OF ARSENIC ADSORPTION BY FORAGER SPONGE LOADED WITH
SUPERPARAMAGNETIC IRON OXIDE NANOPARTICLE (SPONGE-SPION)................................................................ 84
3.1.1. Characterization of adsorbent material ....................................................................... 85
3.1.2. Effect of contact time ................................................................................................... 90

3
3.1.3. Effect of initial concentration ....................................................................................... 94
3.1.4. Effect of pH on Arsenic Adsorption Capacity ................................................................ 96
3.1.5. Effect of temperature ................................................................................................... 99
3.1.6. The effect of bed volume ............................................................................................ 102
3.1.7. Adsorption isotherms ................................................................................................. 103
3.1.8. Modeling of Arsenic Adsorption by a Ligand-Exchange Process. ............................... 106
3.1.9. Thermodynamics Studies ............................................................................................ 110
3.1.10. The dependence of separation factors on temperatures and bed volumes: .............. 111
3.2. APPLICATION OF SYNERGIC THERMO-TUNING OF REDOX POTENTIAL FOR CLEAN REMOVAL OF ARSENIC ...... 114
3.2.1. Experimental results of redox potential effect: .......................................................... 115
3.2.2. Further proof of redox potential part ......................................................................... 117
3.2.3. Column Experiments ................................................................................................... 119
3.2.4. As(III)-continuous column mode ................................................................................. 128
3.2.5. As(V)+As (III) adsorption-desorption on sponge loaded SPION in continuous column
mode 130
3.2.6. Cycled column experiment by modeling the real waste water treatment ................. 131
3.2.7. Real waste water ........................................................................................................ 136
3.3. KINETIC AND DYNAMIC ASPECTS OF SELENATE AND SELENITE ADSORPTION BY Γ-AL2O3 NANOSPHERES ...... 139
3.3.1. Characterization of adsorbent material--SEM-EDX analysis ...................................... 139
3.3.2. Comparison of AlOOH, γ-Al2O3 , modified γ-Al2O3 for selenium adsorption .............. 140
3.3.3. pH effect on adsorption. ............................................................................................. 141
3.3.4. Initial concentration effect on selenium adsorption ................................................... 144
3.3.5. Adsorption Isotherm modeling. .................................................................................. 145
3.3.6. Evaluation of thermodynamic parameters ................................................................. 146
3.3.7. Adsorption dynamics .................................................................................................. 147
3.3.8. Adsorption kinetics ..................................................................................................... 148
3.3.9. Comparison of adsorption capacity between γ-Al2O3 nanosphere and modified γ-Al2O3
nanosphere .................................................................................................................................. 152

4
3.4. KINETIC AND DYNAMIC ASPECTS OF SELENATE AND SELENITE ADSORPTION BY SPONGE LOADED WITH
SUPERPARAMAGNETIC IRON OXIDE NANOPARTICLES (SPION) ........................................................................ 153
3.4.1. SEM characterization ................................................................................................. 154
3.4.2. pH effect on selenate and selenite adsorption ........................................................... 155
3.4.3. Contact time effect on selenite and selenate adsorption ........................................... 156
3.4.4. Adsorption kinetic study ............................................................................................. 158
3.4.5. Column continuous mode ........................................................................................... 160
4. CONCLUSIONS ....................................................................................................................... 165
4.1. CONCEPT OF TEMPERATURE TUNING ON ARSENIC OXYANIONS ADSORPTION-DESORPTION BY SPONGE LOADED
WITH SPION ....................................................................................................................................... 165
4.2. APPLICATION OF SYNERGIC THERMO TUNNING OF REDOX POTENTIAL FOR ARSENIC REMOVAL .................. 167
4.3. KINETIC AND DYNAMIC ASPECTS OF SELENATE AND SELENITE ADSORPTION BY Γ-AL2O3 NANOSPHERES ...... 169
4.4. KINETIC AND CONTINUOUS MODE ASPECTS OF SELENATE AND SELENITE ADSORPTION BY SPONGE LOADED WITH
SPION 170
FUTURE PERSPECTIVE ............................................................................................................................. 171
REFERENCES ................................................................................................................................... 173
Annex I
Annex II
Annex III
Annex III

5

6

1
1. INTRODUCTION
1.1. Problem statement
Arsenic and selenium are naturally-occurring, non-metallic elements with complex
chemical and biological behavior in aqueous solutions. Although selenium is an
essential trace nutrient for most organisms, both elements are generally considered
toxic at elevated levels. Arsenic (As) and selenium (Se) are unusual metalloids as they
both induce and cure cancer. They both cause carcinogenesis, pathology, cytotoxicity,
and genotoxicity (Fig 1.1) in humans, with reactive oxygen species playing an
important role. While As induces adverse effects by decreasing DNA methylation and
affecting protein 53 expression, Se induces adverse effects by modifying thioredoxin
reductase1. A common feature is that both elements exist in multiple oxidation states in
aquatic systems2. Aqueous arsenic species exist in the oxidation states As(III) and
As(V), while aqueous selenium species are found in the oxidation states Se(lV) and
Se(VI).3.

2
Fig 1.1 arsenic and selenium toxicity
Arsenic and selenium are among the inorganic contaminants that have become of
evolving environmental concern lately4. Arsenic and selenium could be toxicity for
human and animal if they reach dangerous concentration. Dangerous arsenic or
selenium concentrations in natural water is now a worldwide problem and often referred
to as a disaster5. Ingestion of inorganic arsenic can produce both cancer and non-cancer
related health effects, such as nausea, nerve damage, cancers, and even death6. The
USEPA has classified arsenic as a Class A carcinogen. Chronic exposure to low arsenic
levels (less than 50 ppb) has been linked to health complications, including skin, kidney,
lung, and bladder cancers, as well as other diseases of the skin, and the neurological
and cardiovascular systems. High arsenic concentrations have been reported recently
from the Bangladesh, India, USA, China, Chile, Mexico, Argentina, Poland, Canada,
Hungary and Japan7.

3
Selenium is an essential nutrient for humans and animals but at higher concentrations
can be harmful causing respiratory disease, mutagenic effects, reproductive failure and
death8. Irrigation drainage and industrial wastewater often contain selenium
contaminants8. The presence of toxic selenium in waste and surface waters at elevated
levels causes a severe environmental and health problem9. The toxic effects of both of
these metals have resulted in the U.S. government establishing drinking water limits of
10ppb for arsenic and 50 ppb for selenium.
Table 1.1 As and Se EPA water quality standard10
As(ppb) Se(ppb)
Drinking water 10 10
Irrigation water 100 20
Hazardous waste 5000 1000
Table 1.2 Arsenic maximum permission limits for drinking water in different countries11
Countries Maximum permission limits(ppb)
Bangladesh 50
India 10
USA 10
China 50
Chile 50
Mexico 50
Argentina 50
Hungary -
Japan -

4
1.1.1. Arsenic toxicity
Arsenic compounds can be classified into three major forms: inorganic, organic, and
arsine gas12. Inorganic arsenic may be formed with either trivalent (arsenite) or
pentavalent (arsenate) arsenic. Trivalent arsenic compounds tend to be more toxic than
pentavalent Arsenic compounds although pentavalent species predominate and are
stable in oxygen rich Aerobic environments. Inorganic arsenic is more toxic than the
organic forms although very high doses of certain organic compounds may be
metabolized to inorganic arsenic and result in some of the same effects derived from an
exposure to inorganic compounds. Inorganic arsenic is a naturally occurring toxic
metalloid found primarily in drinking water and food 13, with an estimated 100 million
people worldwide exposed to arsenic at levels exceeding 50 µg/L14.
Arsine gas have the highest toxicity of As compounds and it is formed by the reaction
of hydrogen with arsenic, during the synthesis of organic arsenic compounds, and
generated accidentally during the smelting and refining of nonferrous metals in mining
processes. High levels of naturally occurring arsenic are found in soil and rocks leading
to unacceptable levels of arsenic in drinking water.
The toxicity of arsenic varies widely based on the route of exposure, the form, the dose,
the duration of exposure, and the time elapsed since the exposure. Ingestion and
inhalation are the primary routes of both acute and chronic exposures. Arsine gas is one
of the most toxic forms and is readily absorbed into the body by inhalation. Effects of
acute inorganic arsenic poisoning include fever, anorexia, hepatomegaly, Melanesia,
cardiac arrhythmia and eventual cardiovascular failure, upper respiratory track
symptoms, peripheral neuropathies, gastrointestinal and hematopoietic effects. Dermal
contact with high concentrations of inorganic arsenic compounds may result in skin
irritation, redness, and swelling and high acute exposures may cause cholera like

5
gastrointestinal symptoms of vomiting (often times bloody) and severe diarrhea (often
bloody). Ingestion of large doses of inorganic arsenic (70 to 180 mg) may be fatal.
Arsenic has been classified as a known human carcinogen by multiple agencies based
on the increased prevalence of lung and skin cancer observed in human populations
exposed to arsenic. Every day, lack of access to clean water and sanitation kills
thousands of people, leaving others with reduced quality of life and as cities and slums
grow at increasing rates, the situation worsens. Nowadays clean water is a scarce
resource and arsenic removal from waters has emerged as a major concern in certain
developing countries. There is a growing awareness that the toxicity of arsenic is
strongly dependent on their chemical form, resulting in increasing interests in the
quantitative determination of individual species. Speciation of arsenic in environmental
samples is gaining increasing importance, as the toxic effects of arsenic are related to
its oxidation state15. The toxicity of arsenic increases greatly when arsenic is reduced
from a +5 to a +3 oxidation state. Based on the descriptions in the literature, we may
conclude that As is present in the reduced form as arsenite in most instances of chronic
arsenosis at low exposure levels16. Although arsenic exists in many different chemical
forms in nature, it is found almost exclusively as arsenite (As(III) as H3AsO3) and
arsenate (As(V) as H3AsO4) in water17. As(III) was identified as one of the most
harmful substances in water to human health, and it is 60 times more toxic than As(V)
or organic arsenic compounds18. Thus, As(III) is more toxic than As(V), but both As(III)
and As(V) are known human carcinogen by both the inhalation and oral routes. There
are several ways for arsenic to enter our body i.e. breathing, eating, or drinking the
substance, or by skin contact. The degree of harmfulness of arsenic is measured by the
dose, the duration of exposure, and the nature of contact with the arsenic.
The most important threat of environmental arsenic contamination is in the water,
especially in drinking water due to the diversity of sources. Arsenic concentrations in

6
natural water are low, but elevated arsenic concentrations are common in groundwater
as a result of natural conditions or anthropogenic impacts.
1.1.2. Selenium toxicity
Selenium occurs naturally in the environment and it is important in animal and human
nutrition19. It is an essential micronutrient for mammals within a narrow low
concentration range. Above this range, selenium can be toxic, including potentially
carcinogenic, depending on dose and speciation (US EPA). It has three levels of
biological activity20: (1) trace concentrations are required for normal growth and
development; (2) moderate concentrations can be stored and homeostatic functions
maintained; and (3) elevated concentrations can result in toxic effects.
It is an essential component for plant growth, native vegetation can contain Se levels
that are toxic to animals, creating animal health difficulties. In fact, there is a very
narrow range between deficient and toxic levels of Se in animals. Chronic ingestion by
humans at levels above 5mg/kg-day, the US EPA reference dose for selenium, can
result in gastrointestinal, cardiac, skin and neurological disorders 21. As such, the US
EPA has mandated the maximum contaminant level for selenium in drinking water at
50 ppb21. Anthropogenic activities such as smelting, mining, industrial production, and
agricultural runoff have greatly increased the amount of selenium found in natural
aquatic systems. In California, concentrations as high as 1400 ppb have been observed
22. Selenium occurs in both organic and inorganic forms, but due to the high solubility,
and therefore bioavailability, of inorganic selenium in water, most remediation
techniques focus on the predominant inorganic species at environmentally relevant
conditions, selenite ( Se(IV))and selenate ( Se(VI))20. Although both oxyanions are
toxic, selenate is reported to be more difficult to remove due to the predominance of
electrostatic dependent outer-sphere complexes it forms with many adsorbents and the

7
high solubility of selenate salts which makes adsorption thermodynamically
unfavorable23.
Fig 1.2 comparison of toxicity of arsenate/arsenite and selenate/ selenite

8
1.2. Arsenic and selenium in the environment
1.2.1. Arsenic in the environment
The arsenic is ubiquitous in the environment and occupies approximately 5*10-5% of
the earth’s crust. The total amount of arsenic in the upper earth crust is estimated to be
4.1x10¹⁶Kg24. In the global arsenic cycle 3.7x10⁸ Kt occur in the oceans, another
9.97x10⁵Kt on earth (land), 25x109 Kt in sediments and 8.12Kt in the atmosphere 25.
Arsenic is a naturally occurring in food, water, air25. In sea water, the concentration of
arsenic varies between 0.09 µg/L and 24 µg/L(average:1.5 µg/L) and in freshwater
between 0.15 µg/L and 0.45 µg/L (maximum: 1mg/L)26. The presence of arsenic has
been reported in several parts of the world, like USA, China, Bangladesh, Taiwan,
Mexico, Argentina, Poland, Canada, Hungary, Japan and India. As Figure 1.3 shows.
The arsenic exist in the environment not only due to the natural sources, but also from
the anthropogenic sources. One important anthropogenic source of arsenic
contamination of the environment was the use of arsenical fungicides, herbicides and
insecticides.in agriculture and wood industry27. Another anthropogenic source of
arsenic in the environment is the burning of fossil fuels in households and power plants.
Fig 1.3 arsenic in groundwater and the environment

9
1.2.2. Selenium in the environment
Selenium is a naturally accuring metal-like element(a non-metal)28, it is an essential
element required for the health of humans, other animals, and some plants29.
Specifically, it is necessary for the proper functioning of the structural proteins and
cellular defences against oxidative damage. However, Se in excess and in critical
chemical species in their diet can cause reproductive failures. Selenium has become a
contaminant of potential concern in USA, Canada, Australia and New Zealand as a
result of activities conducted by a wide variety of industrial sector, including mining
and power regeneration. The large geologic extent of Se sources is connected by human
activities that include power generation, oil refining, irrigation drainage, and coal,
phosphate, copper, and uranium mining (Figure 1.4). Development of technologies for
controlling Se pollution and predictive forecasts of ecological effects will become
increasingly critical to commercial exploitation, as well as to faunal conservation.
Fig 1.4 Selenium sources in the environment
10
1.2.3. Arsenic and selenium in the aquatic system
Widespread accumulation of arsenic and selenium has occurred most recently due to
the use of arsenical pesticides, mining and processing of sulfide and uranium ores,
burning of fossil fuels, and irrigation and drainage of newly developed arid and semi-
acid agricultural lands3. The presence of dissolved arsenic and selenium in aquatic
system, such as surface and groundwater has created significant concern on a global
basis. The source of arsenic and selenium in natural water is associated with both
natural and human being reasons, such as geochemical reactions and oxidative
weathering, as well as uncontrolled industrial waste discharges7. Anthropogenic
activities such as smelting, mining, industrial production, and agricultural runoff have
greatly increased the amount of arsenic and selenium found in natural aquatic systems30.
In water, the most prevalent species of the toxic arsenic and selenium are found as
compounds of oxyanions such as arsenate [As (V)], arsenite [As (III)], selenate [Se (VI)]
and selenite [Se (IV)]. The more oxidized species are more prevalent in aerobic surface
waters while the more reduced species are more likely to occur in anaerobic ground
waters. Their relative distributions are influenced by pH and redox conditions, at a pH
between 6 and 9, it exists as oxyanions of arsenic acid [H2AsO4-or HAsO4 2-]. Under
mildly reducing conditions, arsenite is thermodynamically stable and exists as a non-
ionized arsenous.
It is important to note that the most effective way to overcome the adverse health effects
of arsenic and selenium is to avoid the further exposure by providing safe drinking
water, because there is no effective treatment to counteract arsenic or selenium toxicity.
Therefore, the US Environmental Protection Agency, the World Health Organization,
and the European Commission have decided to lower the maximum contaminant level
of arsenic in drinking water from 50ppb to 10ppb. This stringent arsenic standard will
inevitably require new better methods or consider new treatment options.

11
1.3. General chemistry of arsenic and selenium
1.3.1. Arsenic chemistry
Arsenic belongs to group VB (N, P, As, Sb, Bi) of the periodic table, is a nonmetallic
element with the elemental electronic structure [Ar] 3d104s24p3, and is known to be
toxic to plants and animals. The molecular weight of arsenic is 74.92 and an atomic
number of 33. Earth’s crust is the source of arsenic, and it exists as various minerals
including arsenopyrite(FeAsS), orpiment(As2S3), realgar(AsS), and loellingite
(FeAs2).31 Arsenic is found both in organic and inorganic forms. Organic arsenic
compounds(Fig 1.5) include CH5AsO2 (monomethylarsenic acid, MMA), C2HAs7O2
(dimethylarsinic acid, DMA) and arseno-sugars, while inorganic arsenic compounds
include H3AsO3(arsenous acid) and H3AsO4(arsenic acid).32There are four oxidation
states in which arsenic forms inorganic compounds: V, III, 0, -III. As(III) is lightly
soluble in water forming arsenious acid and arsenic acid by oxidation of As(III),
respectively16.

12
Fig 1.5 Arsenic species
The acid base equilibria and redox reactions between the oxidation states of inorganic
arsenic are summarized in Table 1.3. The pE-pH diagram for inorganic arsenic is shown
in Fig 1.6. As (V) is prevalent under oxidized conditions while As (III) is
thermodynamically stable under reducing conditions. Arsenic acid and its ionization
products are of prime importance for arsenic transport under a wide range of Eh and
pH33. The dominant arsenic species at each pH are presented in Fig 1.7a and Fig 1.7b.
The primary method to remove arsenic from water is to convert As (III) to As (V) since
As (V) is easier to be removed.

13
Table 1.3 The acid base equilibra and redox reaction of arsenic34
Fig 1.6 pE-pH diagram for the system As-H2O for conditions 25°C3.

14
a)
b)
Fig 1.7 Asenic species as a pH function for (a)As(III)35 and (b)As(V)36

15
1.3.2. Selenium chemistry
Selenium belongs to group VIB (0, S, Se, Te, Po) of the periodic table and is a non-
metallic element with the elemental structure [Ar] 3d104s24p4. Selenium has strong
chemical similarities to sulfur, with oxidation states VI, IV, 0, and -II being important
in natural systems under different redox conditions. In the environment it is present in
organic and inorganic species (Fig 1.8). Inorganic selenium can exist as selenide (-II) ,
elemental selenium (0), selenite (IV), selenate (VI); in oxic environmental matrices the
main identified species are selenite (SeO32-) and selenate (SeO4
2-) 37. The organic forms
generally encountered are selenoamino acids and methylated compounds as dimethyl
selenide .The aqueous chemistry of selenate is quite similar to sulfate, and researchers
have observed that similar surface complexes form with both oxyanions 38. Another
important and common form of selenium in soils and surface waters is Se (IV) which
exists as the pyramidal oxyanion selenite (SeO32−). Selenite is a weak diprotic acid that
can exist as H2SeO3, HSeO3-), or SeO3
2−) depending upon solution pH (pKa1 is 2.64
and pKa2 is 8.4). In soils and sediments, selenium undergoes a variety of redox
reactions, and can be found in oxidation states ranging from −2 (selenide) to +6
(selenate)39 with the form present in the environment being dependent upon soil redox
status40. The fully oxidized (+6) form, selenate, exists as a tetrahedral oxyanion in
solution as biselenate (HSeO4-) or selenate (SeO4
2- ) with a pKa of 1.7 for this acid
dissociation. The fully protonated selenic acid is a strong acid and does not occur in
water.

16
Fig 1.8 Selenium species
The acid base equilibria and redox reactions between the oxidation states of inorganic
selenium are summarized in Table 1.5. Fig 1.9 is a pE-Ph diagram for inorganic
selenium.

17
Table 1.5 The acid base equilibra and redox reaction of selenium41
Fig 1.9 pE-pH diagram for the system Se-H2O for conditions 25°C3.

18
1.4. Different Methods and technologies for Arsenic and
Selenium oxyanions Removal
Treating the contaminated water which contains arsenic and selenium is thus a
significant environmental issue. Several methods are available for reducing selenium
and arsenic concentrations to acceptable levels in aqueous solutions42. There are many
conventional methods for arsenic and selenium oxyanions removal, including
precipitation43, coagulation, ion exchange44 and membrane filtration like reverse
osmosis10 and nanofiltration, electrochemical treatment, as well as adsorption. Each of
the above processes has its own advantages and disadvantages as compared in Table
1.6. The disadvantages of traditional methods are high cost (coagulation, precipitation
and nanofiltration), high sludge production (coagulation, electrochemical treatment),
membrane fouling (nanofiltration), and constant monitoring of the ions concentration
(ion exchange). These are inherent drawbacks which make the application of these
methods to be limited. Comparing all the disadvantages of above mentioned processes,
adsorption is considered as one of the most popular method for arsenic, selenium
oxyanions removal from aqueous solutions, and is currently considered as an efficient
and economic method for water treatment. Adsorption processes are effective
techniques and they have long been used in the water and wastewater industries to
remove inorganic and organic pollution for its easy handling, minimal sludge
production and its regeneration capability45.

19
Table 1.6 Comparison of removal methods for arsenic from aqueous solution
Method Examples Advantage Disadvantage
precipitation46 Iron
precipitation
Lime softening;
Simple, low cost Disposal problems
High sludge production
Coagulation Dewatering High sludge production;
expensive, handling and
disposal of contaminated
coagulant sludge; requires
use of large-scale facilities
for implementing water
treatment
Membrane
filtration
Reverse
osmosis;
electrodialysis;
nanofiltration
Very effective;
Less chemical
consumption
requires the use of
membranes, which are
expensive to maintain and
replace; Membrane
fouling;
Electrochemic
al treatment
No consumption
of chemical
reagents; Pure
precious metal
can be collected
Expensive; Sensitive
operating conditions, low
efficiency
20
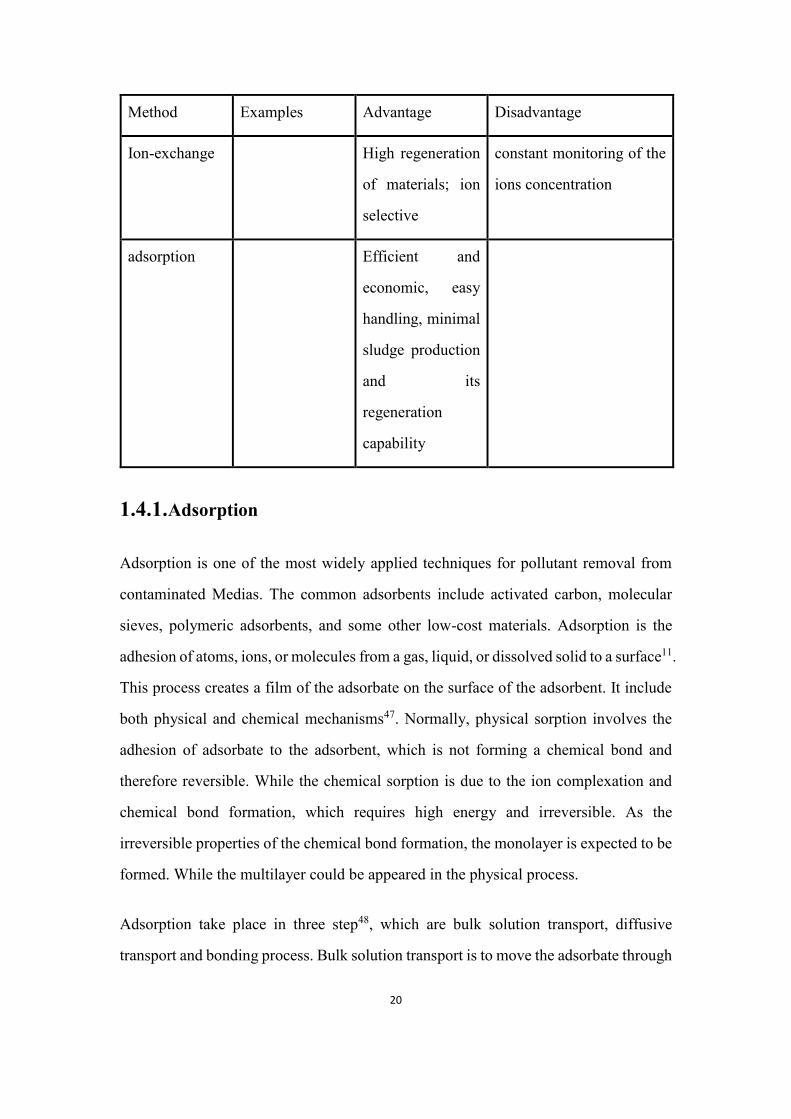
Method Examples Advantage Disadvantage
Ion-exchange High regeneration
of materials; ion
selective
constant monitoring of the
ions concentration
adsorption Efficient and
economic, easy
handling, minimal
sludge production
and its
regeneration
capability
1.4.1. Adsorption
Adsorption is one of the most widely applied techniques for pollutant removal from
contaminated Medias. The common adsorbents include activated carbon, molecular
sieves, polymeric adsorbents, and some other low-cost materials. Adsorption is the
adhesion of atoms, ions, or molecules from a gas, liquid, or dissolved solid to a surface11.
This process creates a film of the adsorbate on the surface of the adsorbent. It include
both physical and chemical mechanisms47. Normally, physical sorption involves the
adhesion of adsorbate to the adsorbent, which is not forming a chemical bond and
therefore reversible. While the chemical sorption is due to the ion complexation and
chemical bond formation, which requires high energy and irreversible. As the
irreversible properties of the chemical bond formation, the monolayer is expected to be
formed. While the multilayer could be appeared in the physical process.
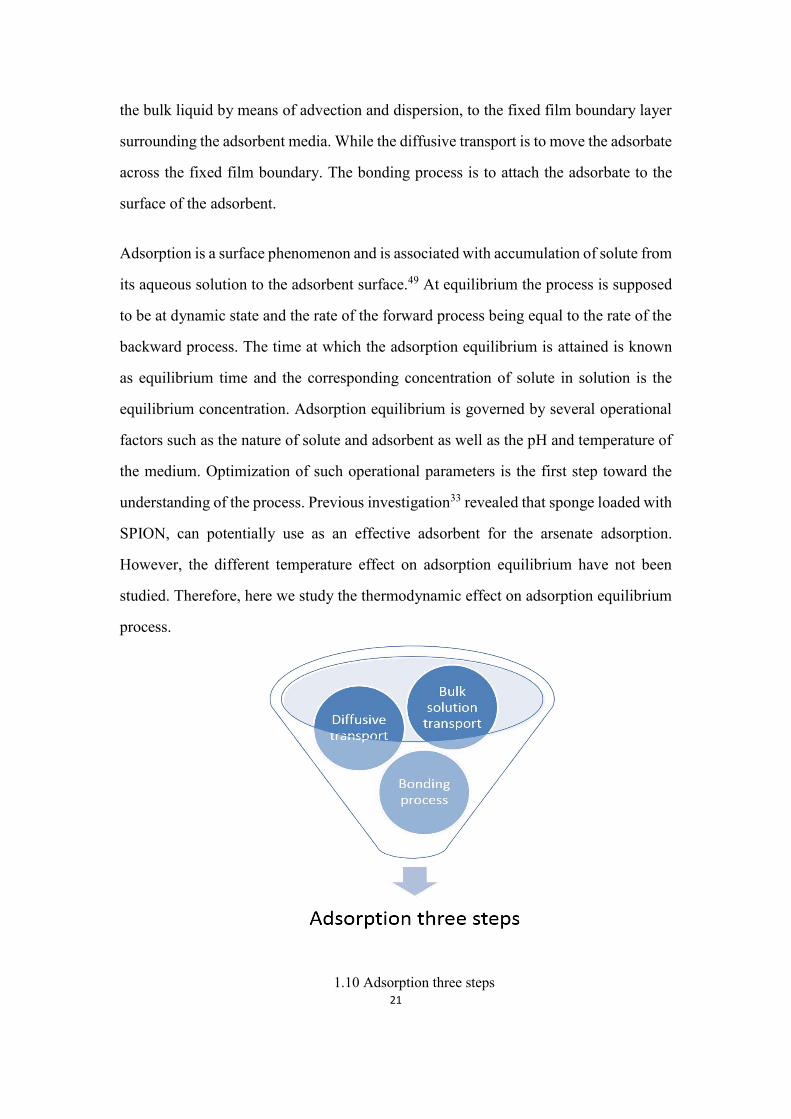
Adsorption take place in three step48, which are bulk solution transport, diffusive
transport and bonding process. Bulk solution transport is to move the adsorbate through
21
the bulk liquid by means of advection and dispersion, to the fixed film boundary layer
surrounding the adsorbent media. While the diffusive transport is to move the adsorbate
across the fixed film boundary. The bonding process is to attach the adsorbate to the
surface of the adsorbent.
Adsorption is a surface phenomenon and is associated with accumulation of solute from
its aqueous solution to the adsorbent surface.49 At equilibrium the process is supposed
to be at dynamic state and the rate of the forward process being equal to the rate of the
backward process. The time at which the adsorption equilibrium is attained is known
as equilibrium time and the corresponding concentration of solute in solution is the
equilibrium concentration. Adsorption equilibrium is governed by several operational
factors such as the nature of solute and adsorbent as well as the pH and temperature of
the medium. Optimization of such operational parameters is the first step toward the
understanding of the process. Previous investigation33 revealed that sponge loaded with
SPION, can potentially use as an effective adsorbent for the arsenate adsorption.
However, the different temperature effect on adsorption equilibrium have not been
studied. Therefore, here we study the thermodynamic effect on adsorption equilibrium
process.
1.10 Adsorption three steps

22
1.5. Adsorbents for Arsenic and Selenium Removal
Several types of adsorbents have been used for the removal of arsenic and selenium
from aqueous effluents, many of them taking advantage of Fe (III) compounds affinity
towards inorganic arsenic species and Al compounds for inorganic selenium species. In
this regard, various methodologies for arsenic removal involve the use of Iron
hydroxyoxides such as goethite (either natural or synthetic), ferrihydrite or hematite
and different Fe bearing materials such as Fe (III) loaded zeolites, alumino silicates or
resins. Materials that have shown capacities for selenium sorption include activated
alumina; iron media (granular ferric hydroxide, iron oxide coated sand, iron pyrites),
synthetic ion exchange resins.

23
1.5.1. Adsorbent materials for arsenic-literature review
Several adsorbents for removing arsenic have been used as shown in Table 1.7,
including: activated alumina , gibbsite 50, aluminum-loaded materials 51, lanthanum
compounds 52, fly ash53, natural solids 54, etc. Fe(III)-bearing materials such as
goethite55, hematite56, ferrihydrite57, silica that containing iron (III) oxide58, Iron-
Treated Activated Carbon and Zeolites59, Ce(IV)-doped iron oxide60, iron oxide-coated
sand61, ferric chloride62, Fe(III)-doped alginate gels63, Water-Dispersible Magnetite-
Reduced Graphene Oxide Composites 64 , and iron oxide-coated polymeric materials65,
Fe(III)-loaded resins66, Fe(III)-loaded sponge36 are used in arsenic treatment because
of the Fe(III) affinity toward inorganic arsenic species and consequent selectivity of the
adsorption process. While most of the Fe (III) oxides present low arsenic adsorption
capacities, Fe(III)-loaded chelating resins are not economically suitable for their use in
a full-scale process. Fe-loaded sponges are not suitable for the trace arsenic adsorption.
Besides these drawbacks, the adsorption process is rather slow, what compromises the
effectiveness of the process and thus its applicability. Therefore, in our study, we use
open-celled cellulose sponge (Forager Sponge) loaded with SPION as the adsorbent
since nanoparticles have the potential to eliminate the arsenic concentration from the
natural water to near zero due to its inherent properties (large surface area and
reactivity)67.
24
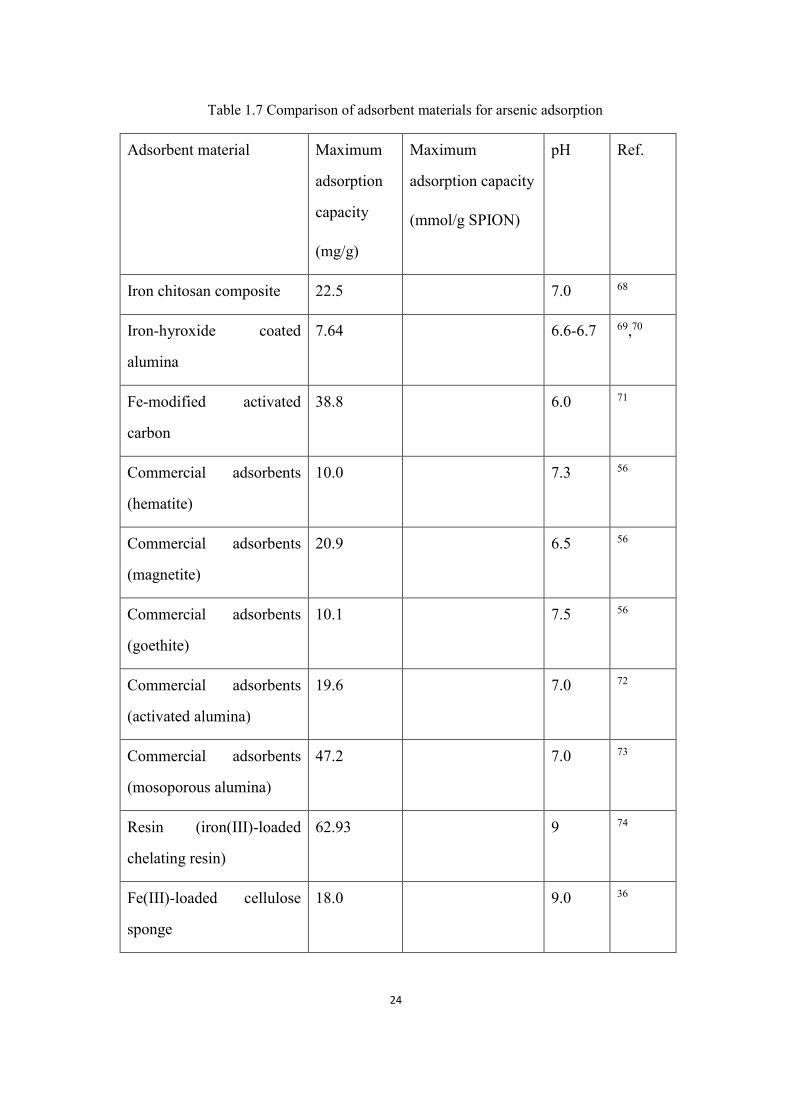
Table 1.7 Comparison of adsorbent materials for arsenic adsorption
Adsorbent material Maximum
adsorption
capacity
(mg/g)
Maximum
adsorption capacity
(mmol/g SPION)
pH Ref.
Iron chitosan composite 22.5 7.0 68
Iron-hyroxide coated
alumina
7.64 6.6-6.7 69,70
Fe-modified activated
carbon
38.8 6.0 71
Commercial adsorbents
(hematite)
10.0 7.3 56
Commercial adsorbents
(magnetite)
20.9 6.5 56
Commercial adsorbents
(goethite)
10.1 7.5 56
Commercial adsorbents
(activated alumina)
19.6 7.0 72
Commercial adsorbents
(mosoporous alumina)
47.2 7.0 73
Resin (iron(III)-loaded
chelating resin)
62.93 9 74
Fe(III)-loaded cellulose
sponge
18.0 9.0 36

25
α-Fe2O3 5.31 75
γ-Fe2O3 4.75 76
Hydrous iron oxide 2.01 4.0 77
Flower-like iron oxides 0.07 4.0 78
Hydrous iron oxide MNPs 0.51 4.5 79
Magnetite-maghemite
nanoparticles
0.05 2.0 80
Fe3O4@CTAB 0.31 3.0 81
SPION 0.91 3.8 82
3-MPA-coated SPION 1.92 3.6 82
Ascorbic acid-coated
SPION
0.22 7.0 83
Ce(IV)-doped iron oxide 16 3-7 60
SPION 0.91 82
Ascorbic acid-coated
SPION
0.22 84
3-MPA coated SPION 1.92 82

26
1.5.2. Adsorbent materials for selenium-literature review
Amounts of methodologies and adsorbents have been used for selenium removal from
aqueous solution (as shown in Table 1.8). Such as zero-valent iron, ferric hydroxide,
ferrihydrite, aluminium hydroxide, activated alumina, activated carbon, aqueous silica,
biological treatment, solvent extraction and so on. But the most effective and efficient
adsorbent should be aluminium or iron oxide materials. Since aluminium oxide could
show complete adsorption for the selenium as well as iron oxide. Thus, in our work, the
aluminium oxide and iron oxide nanostructured materials will be applied for selenium
adsorption.
Table 1.8 comparison of adsorbent for selenium adsorption
material Advantages and disadvantages
Precipication by
zero-valent iron85
This method is not effective for selenate removal and achieves
only 87% removal efficiency
Co-precipitation by
ferric hydroxide or
aluminum
hydroxide
This method is efficient at pH values of 7 or lower and is only
effective for selenite (SeO23-).
Adsorption by
ferrihydrite
These methods are only effective for selenite (SeO23-). It is not
effective for Se (VI), The presence of other aqueous species in
the solution may influence the removal of Se (VI). Activated
Alumina
Ferric hydroxides Manganese hydroxides aluminum hydroxides Metal-oxide coated sand

27
Ion-exchange process
This process is only effective for the removal of Se (VI). The
extraction of Se (VI) is decreased by sulfate.
Biological processes.
Bacterial reduction of selenium species Se4+and Se6+ to
elemental selenium (Se0) requires a long operating time and a
large apparatus size.
Methylation/volatilization to the atmosphere
This method uses bacteria, fungi and algae for methylating Se
in aquatic systems.
The rates of selenium volatilization are dependent on the Se
species present, microbial activity and various environmental
conditions
Solvent extraction This method is highly efficient and selective but has some
disadvantages regarding the complexity of the equipment and
high costs.
Electro-chemical method using dissolvable metal electrodes
The electro-chemical method has high costs affiliated with the
electrolyzer construction and consumes a great deal of energy,
therefore it is ineffective from an economic point of view.
Emulsion liquid membrane
It has shown that Se (VI) is extracted rapidly even in the
presence of sulfate at all pH values> 2. Selenium (IV)
extraction is influenced by the presence of sulfate.
Reduction process -Ferrous hydroxide
The generation of large volumes of iron sludge and the
relatively high cost of reagents makes its application to mine
waters questionable.
Iron The use of iron as a reductant is based on the reduction of
aqueous selenium species in the presence of copper ions. The
elemental iron reduces both selenium and copper to produce a

28
copper selenide on the iron surface.
Lime softening Application of these unit operations to mine waters was not
found in the literature. The achievement of selenium removal
to regulated discharge concentrations by these technologies is
doubtful.
Activated
Carbon Activated carbon is ineffective for adsorbing selenium from
mine waters.
Alumina Alumina-Selenium (IV) adsorption is nearly complete at pH
levels between 3-8.. Selenium (VI) adsorption by alumina is
poor. Selenium (VI) adsorption drops off rapidly with
increasing pH and is less than 50% at pH 7.
Aqueous silica Aqueous silica adsorbs in preference to Se (IV) at pH 7 but is
no problem at pH 4

29
1.6. Nanotechnology overview
Nanotechnology, the engineering and art of manipulating matter at the nanoscale (1–
100 nm), offers the potential of novel nanomaterials for fields such as materials,
electronics, medical remediation, health, medicine, information technology, energy and
environment, food86 and agriculture87(shown in Fig 1.11). Nanoscale science have the
extraordinary impact on the current crucial issues, such as improved medical diagnosis
and treatment, renewable energy, more efficient information technology, and
environmental protection. It involves the production and utilization of a diverse array
of nanomaterials (NMs), which include structures and devices with a size ranging from
1 to 100 nm and displays unique properties not found in bulk-sized materials. In the last
decade, nanotechnology has developed to such an extent that it has become possible to
fabricate, characterize and specially tailor the functional properties of nanoparticles for
waste water and natural water treatment applications88.The treatment of surface water,
groundwater, and wastewater contaminated by toxic metal ions, organic and inorganic
solutes, and microorganisms89. Nanoparticles (NPs) have been recognized as promising
revolution in science and technology due to their unusual properties, high surface area,
well difined structure, high reactivity and easy dispersability90. Nanotechnology (NT)
nowadays is a hot topic and developing very quickly91. Nanotechnology, which is
defined as control of matter at dimensions of roughly 1–100 nm, where unique
phenomena enable novel applications, is making a significant impact on our everyday
lives, making the today’s products much lighter, stronger, smaller, faster, more
durable91-92 Immense progress and improvements of nanotechnology will have
tremendous impact on fields such as materials, electronics, telecommunications,
manufacturing technologies, medicine, health and even environmental remediation33.
Nanoscale science and engineering are providing us with unprecedented understanding
and control of matter at its most fundamental level: the atomic and molecular scales93..

30
Fig 1.11 Nanotechnology impact on different fields
The sciences such as physics, chemistry, biology, engineering, medicine and energy
and environment which complement each other combines and have tremendous effect
on nanotechnology 33, 94. Surface chemistry is especially of great importance concerning
the properties of nanomaterials and nanoparticles in particular. The decreasing
nanoparticles size causes their surface effects to become more significant due to an
increase of surface atoms ration in the volume fraction94. The properties of
nanoparticles are size dependent95 . The small size(shown in Fig 1.12) often results
in higher reactivity since surface atoms make a large contribution to the thermodynamic
characteristics of solids96. Such small size gives nanoparticles a high surface area-to-
volume ratio88a; surface tailor ability and multifunctionality open to multitude of new
possibilities for a wide variety of application in different fields of the science and
technology97. In addition, chemical reactivity is enhanced by the large surface area98,
since large surface area might mean a high concentration of surface defects which
facilitates interaction with several kinds of chemical species, both gaseous and aqueous.
Hence, the properties and functions of nanomaterials often differ drastically from their
bulk counterparts (as shown in Fig 1.13). Nanomaterials will attract more considerable
Nanotechnology has immense impact on the
fields:
Materials
Manufacturing
technologies
Telecomm-unication
Environment
Medicine
Electronics

31
research interest in environmental engineering due to their size effect, high specific
surface area and unique structural properties in recent years99. Functional nanomaterials
are especially attractive because of their improved properties, resulting from their
synergistic and cooperative effects99-100.
Fig 1.12 how small is nano scales
Fig 1.13 Advantages of nanomaterias
•High specific surface area and high surface area-to-volume ratio
•Enhanced chemical reactivity
•well structured
• high concentration of surface defects which facilitates interaction with several kinds of chemical species
Highlights advantages of nanomaterials

32
1.6.1. Superparamagnetic iron oxide nanoparticles(SPION)
In recent years, the synthesis and utilization of iron oxide nanomaterials with novel
properties and functions have been widely studied, due to their size within the nano-
range, high surface area to volume ratios and superparamagnetism101. Regarding to
wastewater treatment, selection of the best method and material for wastewater
treatment is a highly complex task, which should consider a number of factors, such as
the quality standards to be met, the treatment flexibility, the efficiency, environment
security and friendliness as well as the cost. Iron oxide NMs are a promising material
for industrial scale wastewater treatment, due to their low cost, strong adsorption
capacity, easy separation and enhanced stability. Current applications of iron oxide
NMs in contaminated water treatment can be divided into two groups: nanosorbent or
carrier immobilization.
Generally, NMs should be stable to avoid aggregation and with a low deposition rate,
in order to assure their reactivity and mobility. However, it is reported that NMs tend
to aggregate in solution. One attractive potential approach is the modification of NMs,
based on the fact that iron oxide NMs could react with different functional groups. The
use of stabilizers, electrostatic surfactants, and steric polymers has been widely
proposed for facilitating NMs with non-specific moieties, group specific or highly
specific ligands.
Superparamagnetic iron oxide nanoparticles (SPION) with appropriate surface
chemistry have been widely used experimentally for numerous biomedical applications
such as magnetic resonance imaging contrast enhancement, tissue repair, immunoassay,
detoxification of biological fluids, hyperthermia, drug delivery and in cell separation,
etc88a. SPIONs consist of cores made of iron oxides that can be targeted to the required
area through external magnets. They show interesting properties such as
superparamagnetism, high field irreversibility, high saturation field93, 102.Magnetite

33
(Fe3O4), maghemite (γ-Fe2O3) and hematite (α-Fe2O3) are three main iron oxides that
fall under the category of SPIONs. The three main important published routes for the
synthesis of superparamagnetism iron oxide nanoparticles (SPIONs) are co-
precipitation, hydrothermal reactions and high temperature decomposition. Amongst
these methods, co-precipitation of Fe2+ and Fe3+ ions in a basic aqueous media (e.g.
NaOH or NH4OH solutions) is the simplest way and it is quick and has high yield, but
the disadvantage is that the nanoparticles are polydispersed and easy to aggregate.
SPION can be formed by the addition of an alkali solution to an aqueous solution
containing Fe3+ and Fe2+ in a molar ratio of 2, which leads to the formation of complexes
with formula, Fe2+Fe3+Ox(OH) . xH2O, from which SPION precipitates. Also, it has
been suggested that the formation of SPION involves the interaction of Fe2+ with
precipitated ferrihydrite. The equation is shown as follows:
𝐹𝑒2+ + 2𝐹𝑒3+ + 8𝑂𝐻− ↔ 𝐹𝑒3𝑂4 + 4𝐻2𝑂 (1.1)
Magnetic nanoparticles offer some attractive possibilities as shown in Fig 1.15 in water
treatment. First, they have controllable sizes ranging from a few nanometres up to tens
of nanometres103. Second, the nanoparticles are magnetic, which means that they obey
Coulomb’s law, and can be manipulated by an external magnetic field gradient.
Fig1.14 Magnetization curve displaying hysteresis loop104.
Once the SPION has been synthesized, the SPION show superparamagnetism property,
which has no hysteresis. Superparamagnetic materials are those which behave as

34
ferromagnets in bulk state as shown in Fig 1.14, but below sizes of 100nm. In most of
the envisaged applications, the particles perform best when the size of the nanoparticles
is below a critical value, which is dependent on the material but is typically around 10–
20 nm105. They consist of individual magnetic domains, each nanoparticle becomes a
single magnetic domain. When a ferromagnetic is sufficiently small, it acts like a single
magnet spin that is subject to Brownian motion106. Such individual nanoparticles have
a large constant magnetic moment and behave like a giant paramagnetic atom with a
fast response to applied magnetic fields with negligible remanence (residual magnetism)
and coercivity (the field required to bring the magnetization to zero). In the absence of
an external magnetic field, their magnetization appears to be in average zero: such
materials are said to be in the superparamagnetic state. In this state, an external
magnetic field is able to magnetize the nanoparticles, similarly to a paramagnet but with
a higher stability107. If enough energy is supplied, magnetism can be reversed along this
axis, therefore no hyteresis is observed108. These features make superparamagnetic
nanoparticles very attractive for a broad range of biomedical applications because the
risk of forming agglomerates is negligible at room temperature.
35
Fig 1.15 Advantages of superparamagnetic iron oxide nanoparticles (SPION)
1.6.2. γ-Al2O3 alumina hollow nanospheres
Porous aluminum oxides are of great interest because of their widespread applications
in catalysis (as catalyst and catalyst support), adsorption, and separation. Many attempts
have been made to synthesize ordered mesoporous alumina109. Hollow spheres, owing
to their tailored structural, optical, and surface properties, have many potential
applications such as photonic crystals, delivery vehicle system, fillers, and catalysts. So
far, various approaches such as templates and sonochemical, hydrothermal, and
emulsion combustion methods have been developed for the preparation of hollow
spheres of different materials including ceramics, semiconductors, and metals. Hollow
spheres of metal oxide were recently obtained by the emulsion combustion method
(ECM) using metal precursors, kerosene, and surfactant110. It has been shown that the
structure, size, and composition of the hollow spheres can be altered in a controllable
way to tailor various properties over a broad range.

36
AlOOH and γ-Al2O3 have interesting properties and are widely used in industry as
adsorbents, abrasive, catalysts, catalyst supports, and ceramics111. AlOOH is also used
as a template in the preparation of nanostructured materials112. So far, various
morphologies of AlOOH have been prepared such as nanotubes113-114 ,nanowires115,
nanobelts116, nanofibers117 nanorods118 whiskers119 and cantaloupe like113-120 structures.
γ-Al2O3 was usually prepared by dehydration of AlOOH at elevated temperatures.
Several methods for γ-Al2O3 alumina hollow nanospheres chemical synthesis have been
described. Those commonly used are summarized in Table 1.9. Amongst these methods,
microwave-assisted solvothermal method for the preparation of γ-AlOOH
hierarchically nanostructured microspheres firstly and then thermal treatment of the γ-
AlOOH at 600oC produced intact hollow spheres of γ-Al2O3 nanosphere is the simplest
way.
Table 1.9 Comparison of main chemical methods for aluminum nanomaterials synthesis
Synthesis method Properties and advantages Ref. High-Speed Jet Flame Combustion
The process is simple and effective. The size of nanocrystalline of 5 nm and shell thickness of 10-30 nm
110
Hydrothermal method Only one step, very facile, the size of the nanorod is 2.5*1.5µm
113
Hydrothermal method The length of the tubes is 30–70 nm and their outer diameter is 5–6 nm.
121
Microwave-asistted The process is rapid, the morphology is well preserved during the thermal transformation process
111
1.6.3. Supporting materials for SPION–Forager sponge
SPION and γ-Al2O3 nanospheres, which have been widely applied in the areas of
environment protection122 and adsorbents123 have the disadvantages which is easy to
aggregate into large particles via the interparticle dipolar force,124 leading to the loss of
size effect and the decrease of specific surface area. In order to avoid the agglomeration,

37
many materials, such as carbon nanotubes125, reduced graphene oxide126, silica
microspheres127, bacterial cellulose128 and layered double hydroxides129, have been
used as the template to disperse the magnetic nanoparticles. Among these matrix
materials, cellulose has been considered to be an ideal candidate for the dispersion of
these nanoparticles owing to the fact that cellulose is one of the most abundant and
renewable biopolymers on earth. Therefore, composites of cellulose and magnetic
nanomaterials are very promising in many applications.
Forager™ sponge (shown in Fig 1.16) is a high porosity and economic ion exchange
material with selective affinity for dissolved heavy metals in both cationic and anionic
states. Such material is able to promote high rates of adsorption and flexibility which
enables their compressibility into an extremely small volume to facilitate disposal once
the capacity of the material has been exhausted. Forager is an open celled cellulose
sponge which contains a water insoluble polyamide chelating polymer formed by the
reaction of polyethyleneimine and nitrilotriacetic acid. This material is claimed to
contain free available ethyleneamine and iminodiacetate groups to interact with heavy
metals ions by chelation and ion exchange. In this sense, it has selective affinity for
dissolved heavy metals in both cationic and anionic states. Forager sponge and other
adsorbent sponges have been successfully used in the treatment of heavy metals
solutions.
Fig 1.16 Forager sponge
Several advantages of the sponge material were identified. The first was its open celled
nature that allows relatively high flow rates; the second was cost effectiveness; and the
38
third was the material's low affinity for sodium, potassium, and calcium, three common
naturally occurring groundwater ions that can interfere with the effectiveness of typical
ion exchange systems for treating specific priority pollutant metals. The selective
affinity of the polymer enables the Forager™ Sponge to bind toxic heavy metals over
benign monovalent and divalent cations such as calcium, magnesium, potassium and
sodium. In addition, prior studies have shown that the sponge material is effective over
a wide range of pH. The pH at the site was determined to range from 4 to 5 standard
units. Another advantage was that a simple treatment system could be designed and
installed similar to a typical carbon adsorption system. It is an open celled cellulose
housing iminodiacetic acid groups which chelate transition metal cations by cation
exchange processes in the following affinity sequence:
Cd2+>Cu2+>Hg2+>Pb2+>Au3+>Zn2+>Fe3+>Ni2+>Co2+>Al3+.The sponge polymer also
contains tertiary amine salt groups that can bind anionic contaminants, such as the
chromate, arsenic, selenium and uranium oxide species. It can be designed for site
specific needs to contain a cation that forms a highly insoluble solid with the anion of
interest. Another advantage is its high porosity and flexibility which allows its
compressibility into an extremely small volume to facilitate disposal.

39
1.7. Kinetic and Thermodynamic Aspects
1.7.1. Kinetic Model
Adsorption equilibrium studies are necessarily and significant for determining the
efficiency of adsorption process. Predicting the rate at which adsorption takes place for
a given system is probably the most important factor in adsorption system design, with
adsorbate residence time and the reactor dimensions controlled by the system’s
kinetics130. Moreover, it is important to identify the adsorption mechanism and the
potential rate controlling steps such as mass transport and chemical reaction process in
such systems. General models which describe the kinetics of adsorption onto solid
surfaces in liquid-solid phase adsorption system include: pseudo-first order equation,
pseudo-second order equation and the Weber-Morris intraparticle diffusion. A number
of adsorption processes for pollutants have been studied in an attempt to find a suitable
explanation for the mechanisms and kinetics for sorting out environment solutions.
Therefore, adsorption onto solid adsorbent has great environment significance.
When adsorption is concerned, kinetic and thermodynamic aspects should be involved
to know more details about its performance and mechanisms. Especially for adsorption
capacity, kinetic performance of a given adsorbent is also of great significance for the
pilot application. From the kinetic analysis, the solute uptake rate, which determines
the residence time required for completion of adsorption reaction, may be established.
Also, one can know the scale of an adsorption apparatus based on the kinetic
information. Generally speaking, adsorption kinetics is the base to determine the
performance of fixed-bed or any other flow-through.131
1.7.1.1. Pseudo-first order equation
Lagergren (1898) presented a first-order rate equation to describe the kinetic process of
liquid-solid phase adsorption of oxalic acid and malonic acid onto charcoal, which is
believed to be the earliest model pertaining to the adsorption rate based on the

40
adsorption capacity.131 The pseudo-first order has been most widely used for the
adsorption of an adsorbate from aqueous solution, such as for heavy metal ions, organic
compounds.132 This model based on the solid capacity considers that the rate of
occupation of adsorption sites is proportional to the number of unoccupied sites.133 The
best-fit model was selected based on both linear regression correlation coefficient (R2)
and the calculated qe values. The pseudo-first order rate equation is generally expressed
as follows:
dq
dt= k1(qe − qt)…………………………………………………………………(1.2)
where qe and qt (mg/g) are the adsorption capacities(concentration of adsorbed arsenic
or selenium anion per unit of adsorbent mass, mmol/g) at equilibrium and time t (min),
respectively. k1 (min−1) is the pseudo-first-order rate constant for the kinetic model.
Integrating Eq.(1.2) with the boundary conditions of qt=0 at t=0 and qt=qt at t=t, yields
ln (qe
qe−qt) = k1t…………………………………………………………………..(1.3)
Which can be arranged to:
log(qe − qt) = logqe −k1
2.303t…………………………………………………...(1.4)
Where qe and qt are the amount of selenium adsorbed (mg.g-1) at equilibrium and at
time t, respectively. Kf (min-1) is the rate constant of pseudo-first order adsorption
reaction. A plot of log (qe-qt) vs.t is expected to yield a straight line and the rate
constant Kf can be evaluated from the slope.
To distinguish kinetic equations based on adsorption capacity from solution
concentration, Lagergren’s first order rate equation has been called pseudo-first-
order.134 In recent years, it has been widely used to describe the adsorption of pollutants
from wastewater in different fields.130

41
1.7.1.2. Pseudo-second order equation
The main assumptions for the pseudo second-order model for the adsorption is: the rate
of occupation of adsorption sites is proportional to the square of the number of
unoccupied sites. The rate limiting step may be chemical adsorption involving valent
forces through sharing or the exchange of electrons between the reactions. In addition,
the adsorption follows the Langmuir equation.135 It can be expressed as follows:
𝑑𝑞
𝑑𝑡= 𝑘2(𝑞𝑒 − 𝑞𝑡)2 …………………………………………………………..(1.5)
where k2 is the rate constant of sorption, (g mmol-1 min-1), qe is the amount of adsorbed
arsenic or selenium anions per unit of mass adsorbent at equilibrium, (mmol/g), qt is
amount of adsorbed arsenic or selenium anions on the surface of the adsorbent at any
time, t, (mmol/g). Separating the variables in Eq. (1.5) gives:
𝑑𝑞𝑡
(𝑞𝑒−𝑞𝑡)2 = 𝑘𝑑𝑡 ………………………………………………………………..(1.6)
Integrating this for the boundary conditions t=0 to t=t and qt =0 to qt=qt , gives:
1
(𝑞𝑒−𝑞𝑡)=
1
𝑞𝑒+ 𝑘𝑡……………………………………………………………….(1.7)
Which is the intergrated rate law for a pseudo-second order reaction.
𝑞𝑡 =𝑡
1
𝑘𝑞𝑒2+
𝑡
𝑞𝑒
……………………………………………………………………(1.8)
Which has a linear form
𝑡
𝑞𝑡=
1
𝑘𝑞𝑒2 +
𝑡
𝑞𝑒…………………………………………………………………..(1.9)
The plot of t/𝑞𝑒 versus t should give a straight line if second order kinetics are
applicable, and qe and k2 can be determined by the slope and intercept of the plot,

42
respectively. It is important to notice that for the application of this model the
experimental estimation of qe is not necessary. The pseudo-second order equation can
predicts the behavior over the whole range of time studied, and is in agreement with
chemical adsorption as the rate controlling step.
1.7.2. Isotherm Model
The most commonly used isotherm equations for the equilibrium modeling of
adsorption are, the Freundlich and Langmuir isotherms.136 Both represent the
equilibrium amount of toxic element ions removed (qe, mmol/g) as a function of the
equilibrium concentration (Ce, mmol/L) of toxic element ions in the solution,
corresponding to the equilibrium distribution of ions between aqueous and solid phases
as the initial concentration increases.
1.7.2.1. Langmuir Isotherm
Langmuir isotherm is based on the assumption that enthalpy of adsorption is
independent of the amount adsorbed137. A basic of assumption of the Langmuir theory
is that sorption takes place at specific homogenous sites within the sorbent, no further
sorption can take place at that sites138. The Langmuir equation is valid for monolayer
sorption onto a surface with a finite number of identical sites. It incorporates two easily
interpretable constants: qmax, which corresponds to the highest possible adsorbate
uptake; and coefficient b, which is related to the affinity between the adsorbent and
adsorbate. The empirical Freundlich equation, based on the multilayer adsorption on
heterogeneous surface. The Freundlich isotherm describing the non-ideal and reversible
adsorption, not restricted to the formation of monolayer. This empirical model can be
applied to multilayer adsorption, with non-uniform distribution of adsorption heat and
affinities over the heterogeneous surface138. It can be derived assuming a logarithmic
decrease in the enthalpy of adsorption with the increase in the fraction of occupied sites.

43
The Langmuir equation assumes that (i) the solid surface presents a finite number of
identical sites which are energetically uniform; (ii) there is no interactions between
adsorbed species, meaning that the amount adsorbed has no influence on the rate of
adsorption; (iii) a monolayer is formed when the solid surface reaches saturation.136 It
assumes the form:
𝑞𝑒 =𝑄0𝐾𝑙𝐶𝑒
1+𝐾𝑙𝐶𝑒 …………………………………………………………………(1.10)
where Q0 (mg/g) is the maximum amount of arsenic or selenium anion per unit weight
of adsorbent to form a complete monolayer on the surface and KL is the equilibrium
adsorption constant which is related to the affinity of the binding sites. Q0 represents a
practical limiting adsorption capacity when the surface is fully covered with arsenic or
selenium anions and allows the comparison of adsorption performance, particularly in
the cases where the adsorbent did not reach its full saturation in experiments.139 The
Langmuir equation can be described by its linearized form:
𝐶𝑒
𝑞𝑒=
𝐶𝑒
𝑄0+
1
𝑄0𝐾𝐿……………………………………………………………….(1.11)
A plot of 𝐶𝑒/𝑞𝑒 versus Ce gives a straight line with the slope equal to1/𝑄0 , the
intercept equal to 1
𝑄0𝐾𝐿 . while Langmuir isotherm assumes that enthalpy of adsorption
is independent of the amount adsorbed.
1.7.2.2. Freundlich isotherm model
The empirical Freundlich isotherm, based on the multilayer adsorption on
heterogeneous surface, describe the relationship between equilibrium liquid and solid
phase capacity. It can be derived assuming a logarithmic decrease in the enthalpy of
adsorption with the increase in the fraction of occupied sites.136 It also assumes that the
stronger adsorption sites are occupied first and the binding strength decreases with the
increasing degree of site occupation, and is given by:

44
𝑞𝑒 = 𝑘𝐹𝐶𝑒1/𝑛……………………………………………………………….(1.12)
where KF and n are the Freundlich constants characteristics of the system, indicating
the adsorption capacity and adsorption intensity, respectively. Ce is the equilibrium
concentration of the ion in the residual solution (mmol/L),qe is the equilibrium
concentration of the adsorbed per unit of mass of sorbent(mol/g). Eq. (1.12) can be
linearized in logarithmic form (1.13) and the Freundlich constants can be determined:
log𝑞𝑒 = 𝑙𝑜𝑔𝑘𝐹 +1
𝑛𝑙𝑜𝑔𝐶𝑒 ………………………………………………… (1.13)
If the value of n is greater than unity, this is an indication of a favorable adsorption. A
plot of logqe versus logCe will give a straight line of slope 1/n and intercept kF, when
the liquid-solid system follows this model.
1.7.3. Thermodynamic studies
1.7.3.1. Thermodynamic parameters
The thermodynamic feasibility of adsorbent–anion interaction was studied by variation
of temperature of the medium in a temperature range. Thermodynamic parameters such
as ∆𝐺0, ∆𝑆0, ∆𝐻0 were calculated using Van’t Hoff equation:140
0a=- lnG RT K …………………………………………………………………..(1.14)
and
0 0 0= HG T S ……………………………………………………………….(1.15)
where R is the universal gas constant (8.314 J mol−1 K−1), T is the temperature (K), Ka
is the Langumuir equilibrium affinity coefficient shown in equation (1.9), ∆𝐺0 is the
change in free energy. Further, the relationship between Ka vs. standard enthalpy (∆𝐻0)
and standard entropy (∆𝑆0) factors can be represented using the following equation:

45
ln𝐾𝑎 =∆𝑆0
𝑅−
∆𝐻0
𝑅𝑇 …………………………………………………………….(1.16)
Here ∆𝐻0 and ∆𝑆0 parameters can be calculated, respectively, from the slope and
intercept of plot of ln𝐾𝑎vs. 1/T.
1.7.3.2. Thermodynamic studies for arsenic removal-literature review
Previous research has investigated adsorption kinetic as the removal mechanisms of
metals or oxyanions by nanomaterials, comparatively little research has investigated
the detailed adsorption characteristics and thermodynamics of metal or oxyanions
removal by nanomaterials. Table 1.10 shows the Equilibrium, thermodynamic
investigations for arsenic removal from aqueous solution in recent years.

46
Table 1.10 Equilibrium and thermodynamic studies for arsenic removal-literature review
Isotherm adsorbent Temp.(oC)
As(V) /As(III)
∆𝐺0 (KJ/mol)
∆𝐻0 (KJ/mol)
∆𝑆0 (J/molK)
ref
Freundlich Granular ferric hydroxide (GFH)
20 As(V) -11.368 45.940 141 30 -13.376 40 -15.276 20 As(III) -9.033 68.367 30 -11.401 40 -14.330
Langmuir/D-R
Algea 20 As(III) -18.39 -26.69 -38.42 70 30 -18.21 40 -17.70 50 -17.24
D-R Activated aluminum
20 As(III) -33.12 -6.096 -91 142 30 -34.15 40 -34.96 50 -35.87
Dolomite 20 As(V) 80.57 -3.67 -287.35 143 45 87.75 65 93.5 80 97.81
Langmuir Activated red mud
25 As(III) -27.75 69.9 144 40 -29.06 70.8 55 -30.00 70.3 70 -30.90 69.9
Langmuir 25 As(V) -30.36 125.6 40 -32.67 126.9 55 -34.16 125.6 70 -36.88 128.1
1.7.3.3. Thermodynamic study of selenium removal- literature review
Just a few research investigations have been reported in the literature related to the
thermodynamic study of selenium adsorption (shown in Table.1.11). From the previous
report, the thermodynamic parameters for the sorption of Se (VI) and Se (IV) indicate
exothermic or endothermic behavior. Exothermic behavior could make the tuning of
47
the lower temperature to favor the adsorption while higher temperature could help the
desorption process to occur. Endothermic behave in an opposite way. That means, the
adsorption of Se (VI) and Se (IV) could be done by tuning of the higher temperature
and desorption can be realize by tuning of the lower temperature. Lei Zhang145 studied
that removal of selenium ions from aqueous by using nano-TiO2 .The mean energy of
adsorption (14.46 kJ mol−1)was calculated from the Dubinin–Radushkevich (D-R)
adsorption isotherm at room temperature. The thermodynamic parameters for the
sorption were also determined, and the negative ∆H0 and ∆G0 values indicate
exothermic behavior. Mustafa Tuzen146 studied the selenium biosorption from aqueous
solution by green algae, the calculated thermodynamic parameters, ∆Go (between −
18.39 and −16.08 kJ/mol at 20–50oC) and ∆Ho(−45.96 kJ/mol) showed that the
biosorption of Se(IV) onto C. hutchinsiae biomass was feasible, spontaneous and
exothermic, respectively. Ramakrishnan Kamaraj147 has studied selenate removal from
aqueous solution by oxidized multi-walled carbon nanotubes. It has demonstrated that
the calculated values of enthalpy change (∆H) and entropy change (∆S) are 19.474
kJ/mol and 69.9058 J/mol K respectively. Further, these studies revealed that the
adsorption reaction was spontaneous and endothermic process (the ∆H is positive) .

48
Table 1.11 Thermodynamic studies for selenium removal-literature review
isotherm adsorbent Temp.
(K)
Se(IV)
/
Se(VI)
∆𝐺0(𝐾𝐽
/𝑚𝑜𝑙) ∆𝐻0
(𝐾𝐽𝑚𝑜𝑙−1)
∆𝑆0
(𝐽 𝑚𝑜𝑙−1𝐾−1)
ref
Langmuir Cladophora
hutchinsiade
293 Se(IV) -18.93 -45.96 -70.92 146
303 -18.12
313 -17.70
323 -16.08
Langmuir nano-TiO2 273 Se(IV) -4.44 -11.2 -24.76 145
293 -3.71 -25.56
313 -3.12 -25.83
Langmuir oxidized
multiwalled
carbon
nanotubes
(MWCNT)
303 Se(VI) -0.657 19.479 69.9058 147
313 -1.297
323 -1.972
333 -2.428
1.7.4. Redox potential
Redox potential (also known as reduction potential, oxidation / reduction potential, pE
or 𝐸ℎ) is a measure of the tendency of a chemical species to acquire electrons and
thereby be reduced47. Redox potential is measured in volts (V), or millivolts (mV). Each
species has its own intrinsic redox potential; the more positive the potential, the greater
the species' affinity for electrons and tendency to be reduced. pE is a common
measurement for water quality.

49
In the field of environmental chemistry, the redox potential is used to determine if
oxidizing or reducing conditions are prevalent in water or soil, and to predict the states
of different chemical species in the water, such as dissolved metals148. pE values in
water range from -12 to 25; the levels where the water itself becomes reduced or
oxidized, respectively.
The reduction potentials in natural systems often lie comparatively near one of the
boundaries of the stability region of water. Aerated surface water, rivers, lakes, oceans,
rainwater and acid mine water, usually have oxidizing conditions (positive potentials).
In places with limitations in air supply, such as submerged soils, swamps and marine
sediments, reducing conditions (negative potentials) are the norm. Intermediate values
are rare and usually a temporary condition found in systems moving to higher or lower
pE values.

50
1.8. Objectives
From the literature review, the Arsenic and Selenium oxyanions removal will be paid
by more attention due to their toxicity properties and their existence in environment,
especially in aquatic system. Compared with other removal methods, the adsorption
method will be really amazing for both oxyanions removal since it has high efficiency
and capacity. The nanostructured materials, either iron nanoparticles or aluminum
Nanosphere will be applied for such kind of oxyanions removal by taking advantage of
their remarkable properties. The Forager sponge will be used for supporting the
nanomaterial in order to avoid aggregation thus improve the adsorption capacity and
efficiency. The kinetic, equilibrium and thermodynamic studies will be investigated,
which could provide information for understanding the adsorption mechanism and thus
control the adsorption process by modifying the thermodynamic parameters, such as
temperature and redox potential, in order to realize the desorption process.
Desorption and sorbent regeneration is a critical step contributing to increase process
costs. Once the sorbent becomes exhausted, then, either the Arsenic or Selenium
oxyanions must be recovered, the adsorbent regenerated or disposed in a controlled
dumping site for toxic substances that use to be expensive. A successful desorption
process must restore the sorbent close to its initial properties for effective reuse. In most
of the published arsenic sorption studies (some discussed earlier),
desorption/regeneration was not included. Very few desorption studies are detailed in
literature. Few attempts have been made to address the handling of concentrated arsenic
wastes. Tuutijärvi T149 has tried five different alkaline solutions: NaOH, Na2CO3,
Na2HPO4, NaHCO3 and NaAc for arsenate batch desorption and regeneration. But this
process also need to spend a lot of alkaline solution which is very expensive and is not
feasible for industrial sense. Thus, in the thesis work, reagent-less processes has been
developed --Arsenic and Selenium desorption and sorbent regeneration with no
51
reagents added by taking advantage of the thermodynamic properties of the adsorption
system.
The main purpose of the work presented in this PhD thesis is focused on Arsenic
adsorption-desorption by adsorbent systems based on superparamagnetic iron oxide
nanoparticles(SPION) loaded sponge, Selenium adsorption-desorption by γ-Al2O3
nanospheres for waste water treatment application. In addition, in order to overcome
the weakness of using reagents to regenerate the adsorbents, this study find reagent-less
way to remove the oxyanions.Specifically, this work investigate the thermodynamic
aspects of the adsorbent systems and redox potential effect on the Arsenic and Selenium
oxyanions removal. In overall, the major scientific and technical objectives of the PhD
thesis involve:
1. To optimize the synthesis of Superparamagnetic Iron Oxide Nanoparticles (SPION).
To develop a procedure to load SPION on treated Forager sponge by nebulizer in
order to decrease the SPION aggregation. Characterization of nanostructured
adsorbent by SEM and TEM will help on the process optimization
2. To study the parameters which maximize the adsorption capacity of arsenate on
SPION loaded sponge, including pH, contact time, target oxyanions initial
concentration, temperature, redox potential.
3. To study the temperature and redox parameters tuning effect on arsenic oxyanions
removal. To determine the thermodynamic values which have influence on arsenate
adsorption-desorption, including Gibb’s free energy, enthalpy, entropy as well as
redox potential.
4. To develop the continuous column mode for arsenic oxyanions removal, arsenate,
arsenite and arsenate/arsenite mixture. To study the adsorption-desorption recycled
process therefore develop the reagent-less process for water decontamination.
Tuning of Temperature and redox parameters for toxic arsenic oxyanions removal.

52
5. To optimize the synthesis of Ƴ-Al2O3 nanospheres by microwave assistant process.
To modified the Ƴ-Al2O3 nanospheres by diethylammonium N,N-
diethyldithiocarbamate(DDC). To characterize the Ƴ-Al2O3 nanospheres by
Scanning Electron Microscopy (SEM) and X Ray Diffraction (XRD).
6. To determine the effect of parameters including pH, contact time, temperature,
initial concentration and oxidation state on the Selenooxyanions adsorption on Ƴ-
Al2O3 nanospheres . In addition, to evaluate the dynamics of the adsorption process
7. To determine the adsorption parameters such as contact time, pH effect,
concentration effect, both in batch and column continuous mode on the
Selenooxyanions adsorption on SPION loaded sponge.
8. To develop reagent-less processes for Arsenic and Selenium oxyanions adsorption-
desorption and sorbent regeneration with no reagents added by tuning of thermo
and redox potential parameters.

53

54

55
2. Methodology
2.1. Reagents and Apparatus
All the chemicals used were of analytical reagent grade. Stock solutions of separate
oxyanions, such as As (V), As (III), Se (IV), Se (VI) were prepared by dissolving their
sodium salts. The As (V) and As (III) source was sodium arsenate (Na2HAsO4 .7H2O)
and sodium arsenite (NaAsO2), ACS reagent from Aldrich (Milwaukee, USA). The Se
(VI) and Se (IV) source was sodium selenate and sodium selenite, Na2SeO4, Na₂SeO₃,
ACS reagent from Aldrich (Milwaukee, USA). A 1000 ppm stock solutions of each
oxyanion were first prepared, which were then diluted to the aqueous feed initial
oxyanion concentration for each experiment. Sodium acetate trihydrate (>99%, ACS
reagent from Aldrich, USA) and Acetic acid (>99%, ACS reagent from Aldrich) were
used for the preparing the buffer in order to adjust the pH of the feed initial aqueous
solution.
KAl(SO4). 12H2O, Urea , NaAc and HAc were ACS reagents from Panreac S.A.
(Barcelona, Spain) Iron chloride (FeCl3. 6H2O) and Ferrous chloride (FeCl2. 4H2O)
were ACS reagent from Aldrich(Milwaukee, USA),HCl were ACS reagents from
Panreac S.A. (Barcelona, Spain).
Forager Sponge, an open-celled cellulose sponge which contains a water-insoluble
polyamide chelating polymer. (Formed by reaction of polyethyleneimine and
nitrilotriacetic acid), was kindly supplied by Dynaphore Inc. (Richmond, VA, U.S.A.).
This material is claimed to contain free available ethyleneamine and iminodiacetate
groups to interact with heavy metals ions by chelation and ion exchange.
All of the aqueous solution were prepared by deionized water which was purified with
a milli-Q Gradient system from Millipore Corporation. pH standard buffer solutions
were used to calibrate an Omega 300 pH meter(Crison instruments, S.A., Spain) for the
measurement of the initial and final aqueous pH values in all the experiment.

56
2.2. Experiment Equipment
2.2.1. Basic experiment equipment
The experiment performed and developed for this thesis work should be used amount
of basic experiment equipment, such as the balance for weighting the adsorbent,
chemical reagent, the pH-meter for analyzing and confirming the aqueous solution pH,
the centrifuge to separate the adsorbent and suspension, the agitator, the oven for doing
the experiment under high temperature, as well as the micropipettes of different
volumes. Different glass material, such as flasks and bakers, electronic devices, like
pumps, and syringes and needles have also been used.
2.2.2. Colorimetric technique- UV-Vis Spectrophotometer
UV-Vis spectrophotometer is a device in which a light coming from a continuous
source pass through a monochromator, which select a narrow band of wavelengths of
the incident beam150. This monochromatic light go through a cuvette in which the
sample is and measure the radiant power of the light that emerges. The amount of
adsorbed radiation is related with the Lambert – Beer law151:
𝐴 = 𝜀 ∗ 𝑏 ∗ 𝐶……………………………………………………………………………………………………………..(2.1)
Where A= absorbance, ε= molar attenuation coefficient, b= cuvette length, C= Concentration
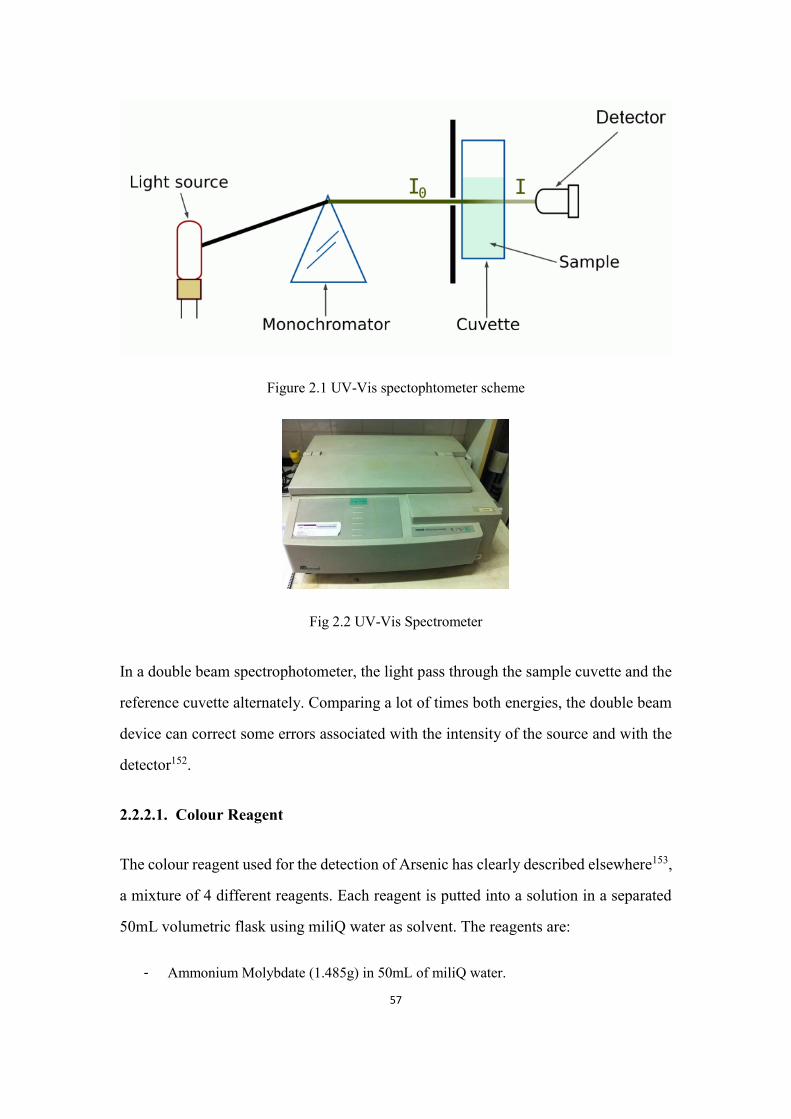
57
Figure 2.1 UV-Vis spectophtometer scheme
Fig 2.2 UV-Vis Spectrometer
In a double beam spectrophotometer, the light pass through the sample cuvette and the
reference cuvette alternately. Comparing a lot of times both energies, the double beam
device can correct some errors associated with the intensity of the source and with the
detector152.
2.2.2.1. Colour Reagent
The colour reagent used for the detection of Arsenic has clearly described elsewhere153,
a mixture of 4 different reagents. Each reagent is putted into a solution in a separated
50mL volumetric flask using miliQ water as solvent. The reagents are:
- Ammonium Molybdate (1.485g) in 50mL of miliQ water.

58
- L-Ascorbic Acid (5.4g) in 50mL of miliQ water.
- Antimony Potassium Tartrate (0.267g) in 50mL of miliQ water.
- Sulfuric Acid (6.71mL) 95-98% in 43.29mL of miliQ water.
The mixture of those reagents is done in the following ratio: 2:2:1:5. After the addition
of Antimony Potassium Tartrate, Sulfuric Acid should be added immediately in order
to avoid turbidity of the colour reagent.154
Currently, the popular methods for arsenic detection are chromatography, spectroscopic
and electrochemistry methods155. These methods tend to be complex, expensive and
time-consuming, so they are neither readily available in developing countries nor
capable of on-site field detection.With the colour reagent, arsenic(V) concentration can
be analysed by UV 156 which is very facile and quickly. since As (V) form a complex
with reduced molybdate that strongly absorbs in the infrared157, while As (III) need to
be oxidized firstly to be As(V) and then analysed18. Doing a calibration curve using
known concentrations of As (V) make possible to obtain the real unknown
concentration of As (V) without the interference of phosphates present in the samples.
The wavelength used to perform these analyses is 860nm.
Arsenic and iron concentrations in solution were determined by the Colorimetric
technique. The wavelength used for analysis were 840 nm(As), 490 nm(Fe).
2.2.3. Inductively Coupled Plasma Mass Spectrometry(ICP-MS)
Inductively coupled plasma mass spectrometry (ICP-MS) is a fast and accurate trace
element determination technique158. ICP-MS is capable to carry out rapid multi-element
determination at the ultra-trace level159. The instrument detection limits are at or below
the single ppt level for most of the periodic table element160. Most analysis performed
on ICP-MS instrumentation are quantitative. The device has to be placed in a white
clean room to avoid contamination of the samples due to the large sensibility of the
instrument. An ICP-MS consist of the following components(shown in Fig 2.3):

59
Sample introduction system (composed of a nebulizer and spray chamber), ICP torch
and RF coil, interface, vacuum system, collision/reaction cell, ion optics, mass
spectrometer, detector and data handling and system controller161.
Figure 2.3 ICP-MS scheme
The sample, usually in liquid form is pumped into a nebulizer, where it is converted
into a fine aerosol with argon gas. The fine droplets of the aerosol, which represent only
1-2% of the sample, are separated from larger droplets by means of a spray chamber.
The fine aerosol then emerges from the exit tube of the spray chamber and is transported
into the plasma torch via sample injector, where the plasma is formed by the interaction
of an intense magnetically field on a tangential flow of gas (normally argon) flowing
through a concentrically quartz tube (torch). This has the effect of ionizing the gas and,
when seeded with a source of electrons from a high-voltage spark, forms a very-high-
temperature plasma discharge at the open end of the tube. The plasma torch, which is
positioned horizontally, is used to generate positively charged ions. It is the production
and the detection of large quantities of these ions that give ICP-MS its characteristic
low ppt detection capability.
Once the ions are produced in the plasma, they are directed into the mass spectrometer
via the interface region, which is maintained at a vacuum with mechanical roughing
pump. This interface region consists of two metallic cones (usually nickel), called the

60
samples and a skimmer cone, each with a small orifice to allow the ions to pass through
to the ion optics, where they are guided into the mass separation device.
The interface region is one of the most critical areas of and ICP-MS because the ions
must be transported efficiently and with electrical integrity from the plasma, which is
at atmospheric pressure, to the mass spectrometer analyser region at approximately 10-
6 Torr. Once the ions have been successfully extracted from the interface region, they
are directed into the main vacuum chamber by a series of electrostatic lens, called ion
optics which have the function of electrostatically focus the ion beam toward the mass
separation device, while stopping photons, particulates, and neutral species from
reaching the detector. The operating vacuum in this region is maintained at about 10-
3Torr with a turbo molecular pump.
The ion beam containing all the analytes and matrix ions exits the ion optics and now
passes into the heart of the mass spectrometer, the mass separation device, which is
kept at an operating vacuum of approximately 10-6 Torr with a second turbo molecular
pump. The separation device allow analyte ions of a particular mass-to-charge ratio
through to the detector and to filter out all the nonanalyte, interfering and matrix ions.
The final process is to convert the ions into an electrical signal with an ion detector.
This electronic signal is then processed by the date handling system and then converted
into analyte concentration using ICP-MS calibration standards.
ICP-MS technique was employed to analyze the arsenic and selenium oxyanion content
in the liquid phases of several adsorption parameters162. ICP-MS is the most sensitive
technique for trace elements in solution163. Typical detection limits for ICP-MS are
around 0.01-1μg /L (ppb) in solution.
When the arsenic, selenium and metal ions concentrations were very low (about ppb
level), ICP-MS was employed after a previous treatment of the sample by diluting them
in 2% nitric acid. Additionally, iron and alumina content was determined to control the

61
stability of SPION and Ƴ-Al2O3 in the experimental media during the adsorption
experiments and the results reveal an iron and alumina content below the detection limit
of the equipment (1 ppb). This content confirms the SPION and γ-Al2O3 stability in all
the performed experiments. The instrumental average uncertainly of metal ions
determination was in all cases lower than 2 %. Equipment description is specified in
Table 2.2.
Table 2.2 ICP-MS equipment description
Equipment ICP-MS
Model VG Plasma Quad ExCell and XSeries 2
Company and country Thermo Scientifics, UK
Laboratory Centre Grup de Tècniques de Separació en
Química, GTS (UAB, Barcelona, Spain)
Image
2.2.4. USB microscope
USB microscope was applied for characterize the general morphology of the blank
sponge, sponge loaded with SPION, sponge loaded with SPION as adsorbent for the
arsenic adsorption. The auto focus USB microscope-UM05 can observe objects by
automatically or manual zoom. The auto focus can be achieved by PC software or
manually press the machine buttons. The delicate UM05 applies the self-developed
application software, and deliver 2M pixels live image to PC by motion JPGE mode,

62
the data is delivered fast without image distortion. User put UM05 over the observed
object, can choose single or continuous auto focus as well as manually turning the clear
focus, so that to control the observable subject. Equipment description is specified in
Table 2.3
Table 2.3 USB microscope equipment description
Equipment USB microscope
Models UM05
Company and Country VITINY Co. USA
Laboratory of analysis Servei de microscopía (UAB, Barcelona,
Spain).
Image
2.2.5. Scanning Electron Microscopy
SEM technique was employed to study the morphology of the adsorbent systems
surface in the case of Forager Sponge loaded SPION, γ-Al2O3 nanospheres. The SEM
equipment (SEM ZEISS EVO® MA 10, Oberkochen, Germany) is a powerful tool
which was used to analyze the morphological structure of the adsorbent materials.
Equipment description is specified in Table 2.3

63
Table 2.3 SEM equipment description
Equipment SEM
Models Zeiss EVA MA 10
Company and Country Carl Zeiss Microscopy, Germany
Laboratory of analysis Servei de microscopía (UAB, Barcelona,
Spain).
Image
2.2.6. Transmission Electron Microscopy, TEM
TEM technique was employed to characterize the morphology of the SPION and their
particle size distribution. For non-soluble nanocomposites (Forager® Sponge), samples
were embedded in an epoxy resin and cross-sectioned with a Leica EM UC6
ultramicrotome using a 35°diamond knife form Diatome. Equipment description is
specified in Table 2.4

64
Table 2.4 TEM equipment description
Equipment TEM
Model JEOL FEG-TEM 2100F
Company and Country Jeol Ltd., Japan
Laboratory of analysis Servei de microscopía (UAB, Barcelona,
Spain)
Image
We have synthesized the SPION for 5 times. And Each time, prepare three kinds of
sample, including 1/100, 1/250, 1/1000(0.1mL SPION on 10mL TMAOH, 0.1mL
SPION on 25mL TMAOH, 0.1mL SPION on 100mL TMAOH). We characterized the
samples by TEM to see the particle size and dispersionSPION are highly dispersible in
solutions. With particle sizes of from 6-20 nm, they offer a large surface area and
superparamagnetic properties.
2.2.7. Energy Dispersive X-ray Spectrometer, EDS or EDX
Coupled to SEM or TEM microscopes, EDS/EDX provides the elemental chemical
composition of the samples based on the X-Rays emitted by specific atoms which have
been interacted with a particular electron beam. Each atom has a unique X-Ray
spectrum, thus the elemental composition can be obtained by detected radiation.

65
2.3. Preparation of the adsorbents
2.3.1. Synthesis of SPION
The synthesis procedure of SPION has been described elsewhere.82 SPION are prepared
in our lab (shown in Fig 2.4) by mixing iron(II) chloride and iron(III) chloride in the
presence of ammonium hydroxide164. First, deoxygenated the solution of NH4OH
(0.7M) by nitrogen. Second, deoxygenated the solution of 12mL HCl (0.1M) by
nitrogen and mix FeCl3·6H2O with it. Third, heat the NH4OH solution at 70°C. Fourth,
Add the FeCl3·6H2O solution into the NH4OH solution and react for 30min. Then, Add
the FeCl2·4H2O in the previous solution with mechanic agitation of about 3000rpm and
waiting for 45min, the dark precipitate will be formed, which consists of nanoparticles
of magnetite. Last, wash it by MiliQ water which has been deoxygenated and
centrifuged four times( 3 times for 3 min and 5000rpm, 1 time for 10 min and 4500rpm)
and preserve it by 50mL 0.1M TMAOH.
Fig 2.4 Procedure for Superparamagnetic iron oxide nanoparticles (SPION) synthesis
First, deoxygenated the solution of NH4OH (0.7M) by nitrogen;
Second,deoxygenated the solution of 12mL HCl (0.1M) by nitrogen and mix FeCl3·6H2O with it;
Third, heat the NH4OH solution at 70°C;
Fourth, Add the FeCl3·6H2O solution into the NH4OH solution and react for 30min.
Then, Add the FeCl2·4H2O in the previous solution and waiting for 45min;
Finally, wash the synthesized particles by deoxygenated MiliQ water.

66
Fig 2.5 The synthesis of SPION procedure
The synthesis of 10 nm Superparamagnetic Iron Oxide Nanoparticles (SPION), as
shows in Fig 2.4, is performed as described elsewhere with some modifications such
as:
The direct addition of Fe2+ as salt powder and not in a mixture solution with Fe3+ to
avoid the partial oxidation of Fe2+ to Fe3+ and a low reaction yield. A fractionated
cleaning process, where the SPION synthesized is divided in different aliquots to get
better cleaning.
The synthesis requires a constant bubbling of nitrogen to prevent oxidation of Fe2+ to
Fe3+ and therefore, the generation of other iron oxides such as maghemite or ferrihydrite.
A stock solution of Fe3+ in a chloride medium is prepared by dissolving FeCl3.6H2O in
a deoxygenated HCl 0.2 M solution. A stock solution of NH4OH 0.7 M is deoxygenated
under nitrogen atmosphere and heated to 70ºC. Later on, Fe3+ solution is added to the
deoxygenated NH4OH solution. The reaction cause a colour change in the solution and
it takes brown colour. A suspension is formed (Figure 2.8). After few minutes,
anhydrous FeCl2 was added, in a ratio 1:2 of Fe2+/Fe3+, generating an immediate colour
change. In this case, the suspension turns black (characteristic SPION colour, Figure
2.8b). Then, the solution is kept 45 minutes under mechanical stirring and nitrogen
bubbling for the aging of nanoparticles. After sample cooling in a water bath, the

67
resulting suspension was centrifuged at 2000 rpm, separating the nanoparticles by a
magnet and washing with deoxygenated water several times. A subsequent redispersion
step of the SPION is realized.
A deoxygenated aqueous solution of tetramethylammonium hydroxide (TMAOH) 0.01
M (pH≈ 12) let to obtain SPION in a stable suspension for 6-8 months under
deoxygenated atmosphere.
2.3.2. Synthesis of 𝛄-Al2O3 nanospheres
The synthesis of nano Ƴ-Al2O3 was described elsewhere.165 Some details has been
changed. The γ-Al2O3 hollow nanospheres adsorbents were readily prepared in our lab
by mixing the aluminum potassium sulfate dodecahydrate (KAl(SO4).12H2O) and Urea
(CO(NH2)2) in distilled water and stirred. The resulting solution was putted into a
microwave vessel for heating. The pH of the resulting solution was adjusted with
sodium hydroxide to 9.0. The obtained white precipitate was separated and washed by
ethanol. The product was dried in the oven for 12h. Finally, the resulting form of the
material synthesized (γ-AlOOH) was converted into nano-Ƴ-Al2O3 by calcinating it in
the muffle. We characterized the samples by scanning electron microscope (SEM
ZEISS EVO@ MA 10, Oberkochen, Germany) to see the particle size and structure.
The procedure for synthesis the γ-Al2O3 nanospheres was described as following:
1. Dissovle 4.85g of KAl(SO4)2 + 1.30g of Urea in 200mL of distilled water and stirred
during 15min.
2. 35mL of the resulting solution was putted into a microwave vessel of 100mL capacity
(2 vessels at the same time).
3. The solution was heated in a microwave oven during 20min at 180oC. Subsequently
it was left for cooling until reaching the ambient temperature.
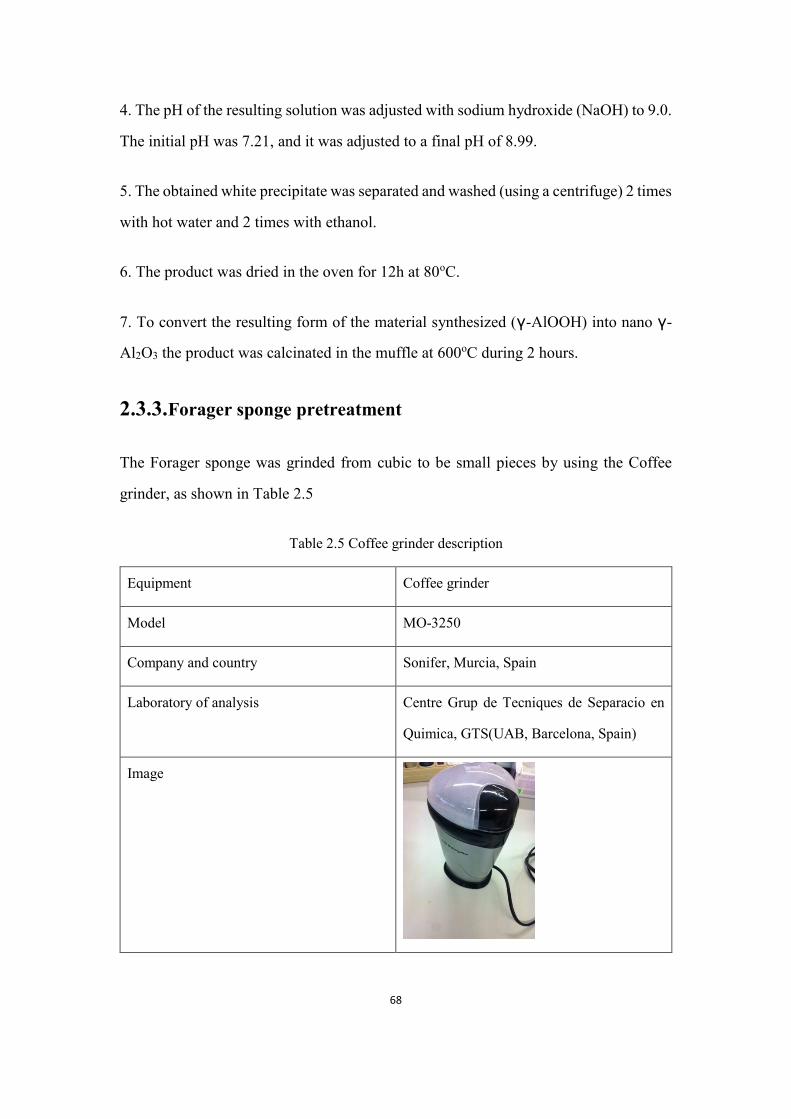
68
4. The pH of the resulting solution was adjusted with sodium hydroxide (NaOH) to 9.0.
The initial pH was 7.21, and it was adjusted to a final pH of 8.99.
5. The obtained white precipitate was separated and washed (using a centrifuge) 2 times
with hot water and 2 times with ethanol.
6. The product was dried in the oven for 12h at 80oC.
7. To convert the resulting form of the material synthesized (γ-AlOOH) into nano γ-
Al2O3 the product was calcinated in the muffle at 600oC during 2 hours.
2.3.3. Forager sponge pretreatment
The Forager sponge was grinded from cubic to be small pieces by using the Coffee
grinder, as shown in Table 2.5
Table 2.5 Coffee grinder description
Equipment Coffee grinder
Model MO-3250
Company and country Sonifer, Murcia, Spain
Laboratory of analysis Centre Grup de Tecniques de Separacio en
Quimica, GTS(UAB, Barcelona, Spain)
Image

69
The Forager sponge should be pretreated. An initial conditioning of the sponge
consisting on the conversion into its acidic form by consecutive treatment with
1.0mol/L HCl, double distilled water, and HCl solution at pH 2.5 was carried out in a
glass preparative column. A portion of this conditioned sponge was separated, dried
during 24 h, and stored in a desiccator for its use. The procedure for treating the sponge
is described as following:
1. Weight 4g of sponge(small pieces). Add 40mL MiliQ water.
2. Shake it and centrifuge it in the speed of 3500rpm for 4min.
3. Remove the water and then put 40mL 1.0M HCl and agitate it for 10min.
4. Wash with MiliQ water for 4 times( 40mL water, 3500rpm, 4min) until the pH=4(use the
color paper- the pH acido to see if it is pH=4).
5. When pH=4, put off the water, and put 30mL pH=2.5 HCl to add into the sponge bottle.
Shake it and centrifuge it in the speed of 3500 rpm for 2 mins.
6. Remove the HCl and put 40mL miliQ water to wash the HCl and shake it, centrifuge it in
3500 rpm for 4mins.
7. Remove the water and filter it and dry it.
8. Place it in the oven under the temperature 40oC for 24h.
2.3.4. Loading of SPION on the sponge
The sponge was loaded with SPION or γ-Al2O3 nanospheres by using the nebulizer and
peristaltic pump as shown in Fig 2.6. The SPION-loaded sponge (shown in Fig 2.7) and
was dried during 24 h, and stored in a desiccator for its use. The SPION loading capacity
was 003.0095.0 mmol Fe/ g sponge.

70
Figure 2.6 Loading of SPION into the Sponge
Figure 2.7 Sponge and SPION loaded sponge

71
2.4. Experiments
2.4.1. Batch experiment
2.4.1.1. Batch experiment for Arsenic removal
The batch adsorption experiments for the removal of arsenic oxyanions from aqueous
solution by using sponge loaded with SPION as adsorbent were carried out under both
batch operation mode and column continuous mode under both 70oC and 20oC
separately. For the arsenic adsorption batch experiment, the 0.050g of adsorbent
(sponge loaded with SPION) was accurately weighted in 50mL plastic extraction tubes,
and 25mL of the corresponding arsenic aqueous solution was added, the As (V), As (III)
and As(V)/As(III) mixture was mixing in 0.2M acetic/acetate buffer media.
2.4.1.2. Batch experiment for selenium removal
The batch adsorption experiments for the removal of selenium oxyanions from aqueous
solution by using γ-Al2O3 nanosphere adsorbent were carried out under both 70oC and
20oC. The 0.005g of adsorbent was accurately weighted in 50mL plastic extraction
tubes, and 25mL of the corresponding selenium aqueous solution was added, the As
(V),As(III) and As(V)/As(III) mixture was mixing in 0.2M acetic/acetate buffer media.
The system was properly shaken on a rotary shaker (as shown in Table 2.6) at 25rpm
for the proper time period. The pH of the solutions was controlled using 1.0M HNO3
or 1.0M NaOH standardized solutions and confirmed with pH measurements (pH meter,
Crison). After that, the two phases were separated firstly by centrifuge and then the
supernatant was filtered through 0.22 μm Millipore filters (Millex-GS, Millipore,
Ireland). Finally, after the filtration step, the arsenic or selenium concentration in the
remaining aqueous supernatant was determined by UV or ICP-MS, as indicated
previously.

72
Table 2.6 Rotary shaker description
Equipment Rotary shaker
Model CE 2000 ABT-4
Company and Country SBS Instruments SA, Barcelona, Spain
Laboratory of analysis Centre Grup de Tècniques de Separació en
Química, GTS (UAB, Barcelona, Spain)
Image
The adsorption capacity (q, mmol/g) is determined measuring the initial (Ci, mmol/l)
and final (Cf, mmol /l) arsenic or selenium concentration for each experiment and
applying the following equation:
q(mmol/g) =(𝐶𝑖−𝐶𝑓)∗𝑉
𝑊…………………………………………………………………..(2.2)
This indicate the arsenic or selenium oxyanion uptake, which is the concentration of
adsorbed oxyanion per unit of mass of adsorbent (in mmol/g).
Through the following sections, specific experimental conditions are going to be
described for the evaluation of each parameter in order to optimize the adsorption
procedure. In this study, all the experiments were carried out in duplicate and the
average values are presented.

73
2.4.2. Kinetic study
2.4.2.1. Kinetic study of arsenic adsorption on SPION loaded sponge
In the arsenic experimental section, for the kinetic study, the experiments were carried
out by mixing 25 mL of 100 ppm of As(V) with a constant amount(0.050g) of the
adsorbent system, working at room temperature (20 ºC) and high temperature (70oC)
under pH 3.6 (after the adsorption process) with the contact time varying in the period
of 2,3,5,8,12,20,40,50,70,100min and1,2,3,4h. At each predetermined interval of time,
the aqueous and the solid phases were separated by filtration (with Millipore filters)
and the concentration of oxyanions in the final aqueous solution was analyzed by UV
or ICP-MS, as indicated. Experiments to determine selenium adsorption in different
contact time were carried out at 2-240mins in batch conditions.
2.4.2.2. Kinetic study of selenium adsorption on Ƴ-Al2O3 nanosphere
The kinetic study of selenium adsorption on Ƴ-Al2O3 nanospheres were carried out by
mixing 25 mL of 1 ppm of Se(IV) or Se(VI) with a constant amount(0.005g) of the Ƴ-
Al2O3 nanospheres , working at room temperature (20 ºC) and high temperature (70oC)
under pH 2.0 (after the adsorption process) with the contact time varying in the period
of 1,2,4,7,10,15,20,30min and1,2,4,6,10,15,18,24,48,72h. At each predetermined
interval of time, the aqueous and the solid phases were separated by filtration (with
Millipore filters) and the concentration of oxyanions in the final aqueous solution was
analyzed by ICP-MS, as indicated.
2.4.2.3. Kinetic study of selenium adsorption on SPION loaded sponge
Experiments to determine selenium adsorption on SPION loaded sponge in different
contact time were carried out at 2, 5, 10, 12, 20, 30, 60, 120, 360, 840, 1440mins in
batch conditions. The following procedures are as same as the previous ones of
selenium adsorption on Ƴ-Al2O3 nanospheres.

74
2.4.3. pH effect on the adsorption process
2.4.3.1. pH effect on arsenic adsorption
These experiments were carried out by mixing 25 mL of 100 ppm of either As (V) or
As(III) with a constant amount of the adsorbent system(50mg) at both 70oC and 20oC
during 1h for arsenic and 6h for selenium. A pH range 2.0-11.0 (pH values after the
adsorption process) was studied in order to identify the optimum adsorption pH. The
pH was adjusted by using 0.1mol/L NaOH and 0.1mol/L HNO3 solutions, alternatively.
2.4.3.2. pH effect on selenium adsorption
These experiments were carried out by mixing 25 mL of 1ppm of either Se (IV) or
Se(VI) with a constant amount of the adsorbent system(5mg) at both 70oC and 20oC
during 1h for arsenic and 6h for selenium. A pH range 2.0-11.0 (pH values after the
adsorption process) was studied in order to identify the optimum adsorption pH. The
pH was adjusted by using 0.1mol/L NaOH and 0.1mol/L HNO3 solutions, alternatively.
2.4.4. Effect of initial concentration on adsorption process
The successful representation of the dynamic sorption separation of solute from
solution onto adsorbent depends upon a good description of equilibrium separation
between two phases166. Different isotherms167 have been used to describe sorption
equilibrium for the uptake of As (V) and Se (VI) species on the solid surface of sponge
loaded with SPION and γ-Al2O3 nanospheres, respectively. Langmuir and Freundlich
isotherms were being used for the present experimental work.

75
2.4.4.1. Effect of arsenic initial concentration on adsorption capacity of the
SPION loaded sponge
Experiments to determine arsenic adsorption capacity in different initial concentration
were carried out at 1-100ppm in batch conditions under 20oC and 70oC. While the
experiments to determine selenium adsorption capacity in different initial concentration
were carried out at 1, 5, 10, 25, 50, 100 ppm. The other parameters are kept to be
constant, such as pH (3.6), adsorbent dosage for arsenic (0.050g), contact time for
arsenic (1h) and aqueous solution volume (25mL).
2.4.4.2. Effect of initial selenium concentration on adsorption capacity of Ƴ-
Al2O3 nanosphere
Experiments to determine selenium adsorption capacity in different initial
concentration were carried out at 2-100ppm in batch conditions under 20oC and 70oC.
While the experiments to determine selenium adsorption capacity in different initial
concentration were carried out at 2, 4, 5, 10, 20, 40, 50, 100 ppm. The other parameters
are kept to be constant, such as pH (2), adsorbent dosage for selenium (0.005g), contact
time for selenium (6h) and aqueous solution volume (25mL).
2.4.5. Effect of temperature
2.4.5.1. Effect of temperature on Arsenic adsorptin
Experiments to determine arsenic adsorption in different temperatures were carried out
at temperature 20oC and 70oC in batch conditions by using tightly plastic tubes
containing weighted amounts of SPION-loaded sponges and measured volumes of
arsenate solutions in the range 1-100 ppm As (V) at a given pH. Corresponding
agitation was carried out in a rotary rack shaker during 1 h (this contact time was
confirmed in separate experiments). In addition, experiments were carried out at
temperature 10oC, 20oC and 70oC in continuous conditions

76
2.4.5.2. Effect of temperature on Selenium adsorption
Experiments to determine selenium adsorption in different temperatures were carried
out at temperature 20oC and 70oC in batch conditions by using tightly plastic tubes
containing weighted amounts of Ƴ-Al2O3 nanosphere and measured volumes of selenate
and selenite solutions in the range 2-100 ppm Se(IV) and Se(VI) at a given pH 2.0.
Corresponding agitation was carried out in a rotary rack shaker during 1 h (this contact
time was
Experiments to determine the whether Fe was lost during As(V) adsorption process
were carried out with 500ppm and 1000 ppm As(V) solutions (13.3 mmol/L) prepared
in a medium containing 0.1 mL SPION under the pH=3.6 condition. Experiments were
repeated for the different conditions a minimum of two times.
2.4.6. Continuous adsorption-desorption experiment
Adsorption experiments in continuous mode were performed to observe the behavior
of the adsorbent system under more practical working conditions in order to assess a
future application of these systems. For this reason, columns are employed.
2.4.6.1. Arsenic continuous mode experiment
Experiments in continuous mode were performed for As(V), As(III) and As(V)/As(III)
mixture adsorption studies with 1g and 4g of sponge loaded with SPION. The size of
the column is 20x1.5 cm. 1L of 250ppm As(V) or 250ppm As(III) or mixture solution
were pumped through the column with a certain flow rate of 2.5ml/min and eluted
solution was sampled periodically. The 50mL of eluted solution was collected by each
plastic tubes (50mL).
After the experiment, the aliquot was centrifuged and decantation with external magnet.
Arsenic and iron content in the obtained supernatant were determined by ICP-MS.The

77
procedure for the adsorption and desorption experiments which are performed in
columns, in continuous mode by gravity was described as follows:
First of all, 1g of SPION loaded Sponge is placed into the column (as shown in Fig 2.7).
For the adsorption experiment, the 250ppm As (V), 250ppm As(III) and 125ppm
As(V)/125ppm As(III) mixture were passed through the column by using a peristaltic
pump with a speed of 2.5mL/min. The elution samples are collected into a 50mL Falcon
tube which are labelled and stored for analysis.
Figure2.7 Column continuous mode experimental set-up for As or Se adsorption
Desorption experiments were performed like the absorption processes while the
working condition changed to be 70oC. The desorption process was also performed by
passing solution through the column which was filled of Tin. After the desorption
process, NaOH 0.05M was used to wash the column.
2.4.6.2. Selenium column experiment
Experiments in continuous mode were performed for selenate mixture adsorption
studies with 1g of SPION loaded sponge. The size of the column is 20x1.5 cm. 1L of
250ppm Se(VI) was pumped through the column with a certain flow rate of 2.5ml/min

78
and eluted solution was sampled periodically. The 50mL of eluted solution was
collected by each plastic tubes (50mL). The following procedure was the same as those
of arsenic analysis by ICP-MS.
2.4.7. Treatment of the real waste water sample.
2.4.7.1. Pre-treatment of the real waste water sample
The real waste water sample is from a river called “Rio Tinto” from Huelva, Andalucia
(Spain) and was proporcioned by AGQ Mining and Bioenergy, a Spanish company.
The pretreatment of the sample is bubbled with air for 4 hours, oxidizing the Fe2+ to
Fe3+, the pH of the real waste water (originally 2.45), is changed to be 3.6 by adding
NaOH. The precipitation is removed by using a filter, obtaining “iron-free” wastewater.
But at the same time, the arsenic is also precipitated by iron precipitation. So the “iron-
free” wastewater was doping by 60ppm arsenate solution, therefore the obtained real
wastewater using for our study is wastewater simulation, which contains 60ppm
arsenate, meanwhile has other ions interferences.
Fig 2.8 Procedure for pre-treatment of real waste water
After doping, the real wastewater which contains “60ppm” arsenate has been adsorbed
by the resin. In fact, the initial concentration could not be 60ppm as it was doped, the

79
reason is that some arsenic co-precipitate with some remaining iron. After analysing by
ICP-MS, the real initial concentration is 42.8ppm.The resin Lewatit S-3428 is used in
the real waste water experiment with the purpose of eliminate the sulphites present in
the sample, otherwise sulphites would compete with arsenic in the absorption process.
The resin has to be treated before use. The pretreatment of the resin was done by
consecutive treatment of HCl, double distilled water, and HCl solution at pH 4 was
carried out in a glass preparative column. A portion of this conditioned resin was
separated, dried during 24 h in the oven in 40oC, and stored in a desiccator for its use.
2.4.7.2. Preparation of the resin.
The resin Lewatit S-3428 was used in the real waste water experiment with the purpose
of eliminate the sulphites present in the sample, otherwise sulphites would compete
with arsenic in the absorption process.The resin has to be treated before use.The pre-
treatment of the resin was done by consecutive treatment of HCl, double distilled water,
and HCl solution at pH 4 was carried out in a glass preparative column. A portion of
this conditioned resin was separated, dried during 24 h in the oven under 40oC, and
stored in a desiccator for its use
2.4.7.3. Absorption and desorption experiments in continuous mode for real
waste water.
The same column experimental was set-up for real waste water treatment (as shown in
Fig 2.8). 3g of the resin are putted into a column, real waste water sample was passed
through the column with a speed of 5mL/min. All the sample is collected in the baker.
After this, the sample is passed to the column containing the SPION loaded sponge in
the same way as previously indicated.

80
Fig 2.8 Column experiment set up for real waste water treatment

81

82
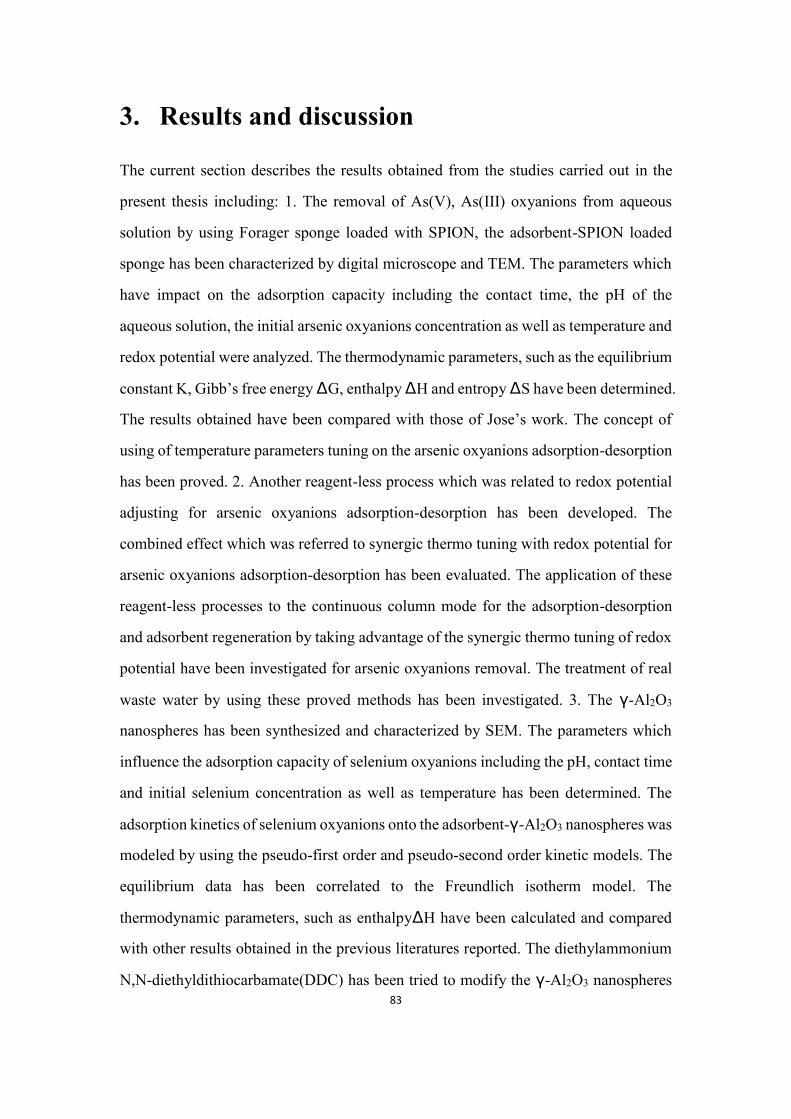
83
3. Results and discussion
The current section describes the results obtained from the studies carried out in the
present thesis including: 1. The removal of As(V), As(III) oxyanions from aqueous
solution by using Forager sponge loaded with SPION, the adsorbent-SPION loaded
sponge has been characterized by digital microscope and TEM. The parameters which
have impact on the adsorption capacity including the contact time, the pH of the
aqueous solution, the initial arsenic oxyanions concentration as well as temperature and
redox potential were analyzed. The thermodynamic parameters, such as the equilibrium
constant K, Gibb’s free energy ∆G, enthalpy ∆H and entropy ∆S have been determined.
The results obtained have been compared with those of Jose’s work. The concept of
using of temperature parameters tuning on the arsenic oxyanions adsorption-desorption
has been proved. 2. Another reagent-less process which was related to redox potential
adjusting for arsenic oxyanions adsorption-desorption has been developed. The
combined effect which was referred to synergic thermo tuning with redox potential for
arsenic oxyanions adsorption-desorption has been evaluated. The application of these
reagent-less processes to the continuous column mode for the adsorption-desorption
and adsorbent regeneration by taking advantage of the synergic thermo tuning of redox
potential have been investigated for arsenic oxyanions removal. The treatment of real
waste water by using these proved methods has been investigated. 3. The γ-Al2O3
nanospheres has been synthesized and characterized by SEM. The parameters which
influence the adsorption capacity of selenium oxyanions including the pH, contact time
and initial selenium concentration as well as temperature has been determined. The
adsorption kinetics of selenium oxyanions onto the adsorbent-γ-Al2O3 nanospheres was
modeled by using the pseudo-first order and pseudo-second order kinetic models. The
equilibrium data has been correlated to the Freundlich isotherm model. The
thermodynamic parameters, such as enthalpy∆H have been calculated and compared
with other results obtained in the previous literatures reported. The diethylammonium
N,N-diethyldithiocarbamate(DDC) has been tried to modify the γ-Al2O3 nanospheres

84
in order to improve the adsorption capacity of the adsorbent for selenium oxyanions
removal. 4. The sponge loaded with SPION has been used as adsorbent for selenium
oxyanions. The sponge loaded with SPION has been characterized by SEM. The
influence of pH of the aqueous solution and contact time have been examined. The
adsorption kinetic studies of selenium oxyanions onto the adsorbent-sponge loaded
with SPION has been done by using the pseudo-second order model. The continuous
column mode for selenium oxyanions adsorption has been applied and determined.
3.1. Temperature-dependence of arsenic adsorption by
Forager sponge loaded with superparamagnetic iron oxide
nanoparticle (sponge-SPION)
Nowadays, there is a great concern on the study of new adsorbent materials for arsenic
clean removal. However, very few studies concern with regeneration and reuse of the
adsorbent. On the other hand, the present section reports the results of a new reagent-
less method based on the temperature dependence of the adsorption-desorption process.
Results collected are shown below and observe the following aspects:
The temperature-dependence of arsenic adsorption by sponge-SPION has been studied.
The results show that under 20oC, as time goes on, the adsorption process reaches
equilibrium at about 1h. Under 70oC, desorption process occurs as contact time
increases, desorption equilibrium was then gradually achieved with contact time. The
effect of temperature on the adsorption of As (V) was studied in the continuous column
mode by evaluating the adsorption at the temperature 10oC, 20oC and 70oC. The
adsorption phenomenon increases with the decrease of temperature.
The results of adsorption were fitted to the Langmuir models. Thermodynamics
parameters of related ion exchange equilibrium have been evaluated including the
equilibrium constant K as well as Gibbs free energy. This value shows the adsorption
85
process to be favorable and spontaneous. The equilibrium constant K values determined
at different temperatures indicate the adsorption to increase with temperature.
Accordingly, a decrease in the negative value of ∆G with the temperature increase is
observed. Separation factor has very strong temperature dependence. Higher
temperature leads to a lower separation. The thermodynamic affinity defined by log
K=4.198 and log K=1.023 under 20oC and 70oC were determined, respectively. Arsenic
is, thus, found to be more strongly adsorbed on the sponge -SPION under 20oC than
under 70oC.
All of the experimental and theoretical studies indicate that we can use the lower
temperature for adsorption and higher temperature for desorption, thereby provide a
reagent-less method for recovery of the toxic element Arsenic and the regeneration of
adsorbents.
3.1.1. Characterization of adsorbent material
3.1.1.1. SPION and SPION loaded sponge characterized by digital microscope
The sponge-SPION adsorbent material was characterized by digital microscope. Fig
3.1 a and Fig 3.1b show the image characterized by digital microscope, the Sponge is
highly porous and elastic thereby promoting convection properties that lead to high
rates for arsenic adsorption on the SPION loaded sponge. Therefore sponge is a very
appropriate substrate for loading SPION and for arsenic oxyanions removal. Absorbed
arsenic anions can be eluted from the Sponge by using the NaOH solution. Following
elution and washing, the Sponge can be reused for the next adsorption cycle. If the
regeneration is not desirable or economical, the Sponge can be compacted to a small
volume to facilitate disposal.
As seen from the Fig 3.2a, b, it is clear that after loading with SPION, the sponge is
saturated with SPION and the surface is very smooth. Maybe it is due to the
homogenous dispersion of the nanoparticles. The porous inside the sponge are fully

86
filled with nanoparticles. The blank sponge can adsorb and immobilize SPION by
chelation through the lone pairs of electrons on the unprotonated amine groups168.
It was shown from the Fig 3.3a, b that after adsorption of Arsenic by using the sponge
loaded with SPION, the sponge looks like shrinkage. In addition, the surface is not
smooth anymore. Probably it’s because of the anion-exchange (arsenate oxyanions
occur in solution from slightly acid to basic pH) between iron oxide nanoparticles and
arsenate oxyanions.
a) b)
Fig 3.1 Forager sponge image by digital microscope
a) b)
Fig 3.2 Sponge loaded with SPION (before adsorption)

87
a) b)
Fig 3.3 SPION Loaded sponge with arsenic (after adsorption)
3.1.1.2. SPION characterization by TEM
Before using (SPION emulsion)
a) b)
c) d)
Fig 3.4 TEM micrograph of synthesized SPION

88
a) b)
c) d)
Fig 3.5 TEM image of SPION loaded on the sponge (before using)
a) b)

89
c) d)
Fig 3.6 TEM image of SPION loaded on the sponge (after Arsenic adsorption)
Fig 3.4a, b, c, d show TEM images of the synthesized SPION of particles size 6-15nm.
When the SPION is first synthesized and poured in the Tetramethylammonium
hydroxide (TMAOH) solution and characterized by the TEM, some of the images show
the nanoparticles are homogenously distributed as single particles but other images
indicate heterogeneity with agglomeration and clustering169.
The using of Forager sponge36 as supporting materials was undertaken to overcome the
difficulties to minimize the aggregation of the SPION, the loading helps to increase the
adsorption capacity. Fig 3.5a,b,c,d shows TEM images of SPION dispersed on the
sponge, the particles are also ~10nm. SPION distribute on the sponge almost
homogeneously, that’s because during the spraying by nebulizer, there is an external
force to push the nanoparticles, in addition, we use the ultra-sonication on nanoparticles
suspension prior nebulization to disperse agglomerates, as it can also add an extra force
to pull the liquid apart to form evacuated cavities or micro-voids.170 The formation and
destruction of these cavities can impose a shear force on agglomerates, capable of
overcoming the van der Waals force holding them together. However, the ultrasonic
applied forces are not strong enough to break the hard bonds of iron oxide molecules.

90
After adsorption (Fig 3.6 a, b, c, d), the SPION show a tendency to agglomerate again since the
absence of external ultrasonic force for some time, makes the van der Waals force to raise
affecting the distribution again.
3.1.2. Effect of contact time
The contact time with aqueous toxic element oxyanions is one of the most important
parameters to be controlled for successful usage of adsorbents. The arsenic (V) aqueous
system is contacted with the adsorbent (SPION loaded sponge) in the range of 2 to 100
minutes and 1 to 4 hours. The adsorption process for removing As (V) oxyanions from
aqueous solution under 20oC obtain ion exchange combined with the ligand exchange
equilibrium at about 1hour as shown in Fig 3.7 a, b. After that, contact time has no
effect in arsenic oxyanion removal percentage. This behavior can be attributed to the
effect of diffusion resistance to reach the ion exchange moieties of the adsorbent. In
another hand, the most possibilities of the complexes formed in our case is, As(V) is
binding to two iron nuclei as adsorbed species. Extended X-ray absorption fine structure
(EXAFS)55 and FTIR spectroscopy171 have shown As(V) to form bidentate inner sphere
surface complexes with iron hydroxide sites as time goes on.36
The effect of contact time on the desorption capacity under 70oC is shown in Fig 3.8a,
b. Very high adsorption rates were achieved at the beginning because of the great
number of sites available for the sorption operation. The adsorption process involves
one of two types of interactions. One is anion exchange of arsenic species
corresponding to the protonated amine groups present in the matrix of sponge36.
Another process is the ligand exchange, provided by the Fe(III) ions immobilized in the
SPION as Equation 3.1 shows82. The adsorption process is reversible process. Suppose
the reaction is exothermic process. The increase in temperature corresponds to
introducing heat into the system. Le Châtelier's Principle172 states that the system will
react to remove the added heat, thus the reaction must proceed in the reverse direction,

91
converting products back to reactants, here we see the desorption starts to occur as time
goes on. Conversely if the temperature of the system were decreased, the system would
react in a direction that opposed the removal of the heat. The forward reaction would
thus occur to release heat in an attempt to offset the heat that was removed from the
system.
R − Fe(III) − OH + X − (R − Fe)X + Z (3.1)

92
a)
b)
Fig 3.7. The effect of contact time on the adsorption capacity (20oC). a) from 10min to
240min, b). from 2min to 60min. The initial arsenate concentration is 50ppm, the pH is 3.6,
and the adsorbent dosage is 50mg.
0.00
0.01
0.02
0.03
0.04
0.05
0.06
0.07
0.08
0.09
0 50 100 150 200 250 300
LOA
D C
AP
AC
ITY(
MM
OL/
G)
TIME (MIN)
0.00
0.01
0.02
0.03
0.04
0.05
0.06
0.07
0.08
0 20 40 60 80
LOA
D C
AP
AC
ITY(
MM
OL/
G)
TIME(MIN)

93
a)
b)
Fig 3.8 The effect of contact time on the adsorption capacity (70oC). a) From 10min to 240min,
b) from 2min to 60min. The initial arsenate concentration is 50ppm, the pH is 3.6, and the
adsorbent dosage is 50mg.
0.00
0.01
0.02
0.03
0.04
0.05
0.06
0 50 100 150 200 250 300
LOA
D C
AP
AC
ITY(
MM
OL/
G)
TIME(MIN)
0.00
0.01
0.02
0.03
0.04
0.05
0.06
0.07
0.08
0 20 40 60 80 100 120
LOA
D C
AP
AC
ITY(
MM
OL/
G)
TIME(MIN)

94
3.1.3. Effect of initial concentration
The initial arsenic oxyanion concentration in the aqueous solution is also a key
parameter which affects to the driving force of the adsorption system.173 The effects of
the initial arsenic concentration (from 5ppm to 50ppm) on the adsorption capacity by
the sponge loaded with SPION under 293K and 343K are shown in Fig 3.9a,b. The
increase of adsorption capacity when the initial arsenic concentration increases, is due
to an increase of the mass transfer driving force. Adsorption capacity limit is reached
when the increase of As (V) initial concentration do not produce any further increase
on the As adsorption. In this case, the surface of the sponge loaded with SPION does
not have free sites for the arsenic oxyanions uptake, being fairly saturated.136 It is
probably another explanation that, as the concentration increased, a higher probability
of collision between adsorbate (arsenate) and adsorbent(sponge loaded with SPION)
surface happens, which could overcome the mass transfer resistance between the
aqueous and the adsorbent phases.174
The process of As(V) adsorption on SPION loaded sponge can occur by two different
ways: one is ion-exchange on the sponge protonated amine groups, another one is As(V)
are bound to iron (hydr)oxides by an inner-sphere ligand-exchange mechanism, in
which the arsenic oxyanion competes with and exchanges with surface≡Fe-OH or ≡Fe-
OH2+ groups at the iron (hydr)oxide surface.33, 36 The increase of adsorption with
concentration is due to the diffusion process and based on the Fick first law. Normally,
the ion exchange reactions are very fast compared to the diffusion of the aqueous ions
to the surface moieties. When the initial concentration is higher, the arsenic oxyanions
move from the solution to the surface of the adsorbent, the amount of arsenic exchanged
onto the sponge and that exchanged onto the SPION increase with increasing initial As
(V) concentration.
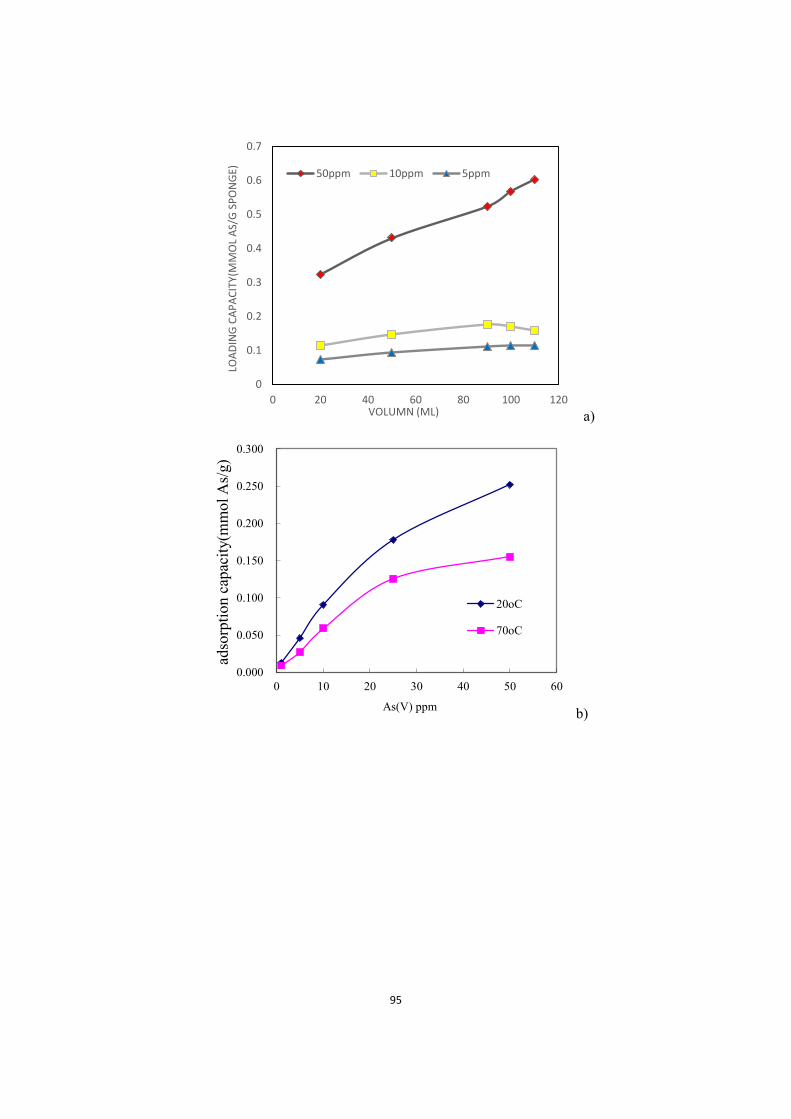
95
a)
b)
0
0.1
0.2
0.3
0.4
0.5
0.6
0.7
0 20 40 60 80 100 120
LOA
DIN
G C
AP
AC
ITY(
MM
OL
AS/
G S
PO
NG
E)
VOLUMN (ML)
50ppm 10ppm 5ppm
0.000
0.050
0.100
0.150
0.200
0.250
0.300
0 10 20 30 40 50 60
adso
rptio
n ca
paci
ty(m
mol
As/
g)
As(V) ppm
20oC
70oC

96
c)
Fig 3.9 The effect of initial As(V) concentration on the adsorption capacity: a) 5ppm, 10ppm,
50ppm under 20oC, b) from 0.5ppm to 10ppm, 20oC and 70oC, c) from10ppm to 100ppm, 20oC
and 70oC
3.1.4. Effect of pH on Arsenic Adsorption Capacity
Because of the acid-base properties of arsenic oxyanions, the pH of the arsenic aqueous
solution is one of the most important parameter affecting the adsorption process. The
pH of the aqueous solution has both influences on the arsenic speciation and on the
chemical function of the adsorbent.
The effect of pH on the As(V) adsorption by the blank and SPION-loaded sponge under
both 20oC and 70oC is shown in Fig 3.10a, b, pH ranging between 1 and 11. The results
obtained revealed that the adsorption of arsenate by both blank and SPION-loaded
sponge under both 20oC and 70oC are pH dependent, this can be explained by the
dependence of the As (V) speciation on the pH. Comparison of the observed results of
pH effect on As (V) adsorption with that of Munoz and Diego36, 82, 168, it shows a similar
behavior under 20oC with the adsorption of As(V) by blank sponge, Fe-loaded sponge,
SPION alone and SPION-loaded sponge. The highest adsorption was observed at pH
0.000
0.100
0.200
0.300
0.400
0.500
0.600
0.700
0.800
0 20 40 60 80 100 120
LOA
DIN
G C
AP
AC
ITY(
MM
OL/
G)
CONCENTRATION(PPM)
20oC
70oC

97
around 3.6-4.0. Specifically, the maximum adsorption of 20oC is under pH 3.6 while
the highest adsorption of 70oC is under 4.0. This similarity supports the conclusion that
the arsenic species is the main reason which is responsible of the adsorption.82 Since
the deprotonated of arsenate species (pKa = 2.2) is present at pH value 3.6-4.0 in a
relatively high ratio, therefore the maximum adsorption is produced at pH=3.6-4.0. For
20oC, lower pH values (1.0–2.0) and for 70oC, lower pH values (1.0-3.0), the formation
of protonated arsenate species leads to a lower adsorption of arsenate species. On the
other hand, for both 20oC and 70oC, at pH > 5.0 the observed decrease on the As (V)
adsorption is due to the increase of OH- species that compete with deprotonated arsenate
for the anion exchange sites of the adsorbent.
From the Fig 3.10a, b. under both 20oC and 70oC, it confirms again that the adsorption
of As (V) is enhanced by loading SPION, and supporting the indicated two ways
proposed for As (V) adsorption on the SPION-loaded sponge. Thus, the ion-exchange
on the protonated amine groups (present in both blank and SPION-loaded sponges) is
accompanied by the additional ligand-exchange mediated by the immobilized Fe3+
(only present in the SPION-loaded sponge) that leads to the observed increase on the
As (V) adsorption.

98
a)
b)
Fig 3.10 The effect of pH on the adsorption capacity, one thousand ppm As solutions and
0.10g of sponge were used in each batch experiment. a) 20oC, b) 70oC
0.00
0.05
0.10
0.15
0.20
0.25
0.30
0.35
0.40
0 2 4 6 8 10
AD
SOR
PTI
ON
CA
PA
CIT
Y(M
MO
L A
S/G
)
PH
only sponge sponge&SPION
0.0
0.1
0.1
0.2
0.2
0.3
0.3
0.4
0.4
0.5
0 2 4 6 8 10 12
AD
SOR
PTI
ON
CA
PA
CIT
Y(M
MO
L A
S/G
)
PH
only sponge sponge&SPION

99
Fig 3.11. pH effect on As(III) adsorption by sponge-SPION under 20oC and 70oC
As shown in Figure 3.11, As (III) adsorption by sponge loaded with SPION at both
20oC and 70oC reveals to be independent of pH, what corresponds to the weak acidic
properties of arsenious acid (pKa1 = 9.2), leading to the reduced presence of
deprotonated arsenite species in the pH range of study. The higher As (III) adsorption
capacity under 20oC than under 70oC may indicate the possible use of temperature to
drive the adsorption/desorption process.
3.1.5. Effect of temperature
The effect of temperature on the adsorption of As (V) was studied in the fixed bed mode
by evaluating the adsorption at the temperature 10oC, 20oC and 70oC under pH 3.6 as
shown in Fig 3.12a. The observed values can be explained in terms of the
thermodynamic parameters. The adsorption phenomenon is more efficient with the
decrease in temperature, which indicate an exothermic process. Generally, an
exothermic adsorption process signifies either physi- or chemi-sorption175. The process
is controlled by the adsorbate-adsorbent interaction. The breakthrough point for 10oC
and 20oC is about 48 bed volume, but for 70oC, the breakthrough point is about 26 bed
volume. The adsorption of arsenate onto sponge-SPION followed at three temperatures,
-0.020
0.000
0.020
0.040
0.060
0.080
0.100
0.120
0.140
0 5 10 15Ad
sorp
tio
n c
apac
ity(
mm
olA
s/g
spo
nge
)
pH
70oC
20oC
100
10oC, 20oC and 70◦C, shows a fast arsenate uptake in all cases The observed decrease
in the adsorption capacity with an increase of the temperature from 10oC to 70oC may
be due to a tendency for the arsenate oxyanions to escape from the solid phase to the
bulk phase with an increase in the temperature of the solution176.
The effect of temperature on the adsorption of As (V) was studied by evaluating the
adsorption at the temperature 10oC, 20oC and 70oC under pH 5.6 is shown in Fig 3.12b.
As indicated before, for both 20oC and 70oC, when pH is more than 5.0, the observed
decrease on the As (V) adsorption is due to the increase of OH- species that compete
with deprotonated arsenate for the anion exchange sites of the adsorbent, which is also
confirmed by the column continuous mode arsenate adsorption.
On the other hand, at pH<2.5(as shown in Fig 3.12c), iron desorbed is very significant
due to protons competition, nevertheless, at pH range 3-9 iron desorption is not quite
important. Thus, in this adsorption process, at the beginning of the arsenic adsorption,
the iron desorbing does not have significant impact on the As (V) adsorption since the
ion exchange process increase the pH value when the process begins. Then, after the
continuous flow of arsenic solutions (pH 2.1) the ion exchange became saturated and
then the solution in column became acidic producing iron desorption from the sponge
gradually, thus leading to a decrease on the arsenic adsorption. Moreover, as the
solution is under pH 2.1, the arsenic desorption occurred after previous adsorption, thus
producing at the column outlet a sharp increase of arsenic concentration leading to a
higher arsenic concentration than in the initial column incoming solution. The final
drop of the As(V) concentration at the column outlet is due to the readsorption of part
of the As(V) in column at the empty sites left by the previous As(V) release and thus
will reach the value of the input solution.

101
a)
b)
-0.5
0.0
0.5
1.0
1.5
2.0
2.5
3.0
0 50 100 150
LOA
DIN
G C
AP
AC
ITY
(MM
OL
AS/
G S
PIO
N)
NUMBER OF BED VOLUME
70oC 20oC 10oC
-1.0
-0.5
0.0
0.5
1.0
1.5
2.0
2.5
0 50 100 150
LOA
DIN
G C
AP
AC
ITY(
MM
OL/
G S
PIO
N)
NUMBER OF BED VOLUME
70oC 20oC 10oC

102
c)
Fig 3.12 The effect of temperature on the adsorption capacity (70oC, 20oC, 10oC).a) pH=3.6,
b) pH=5.6, c) pH=2.1
3.1.6. The effect of bed volume
The influences of the height of the sponge bed on the adsorption capacity are shown in
Fig 3.13a, b. More adsorbent (sponge with SPION) makes the depth of bed volume to
be higher. When the As(V) solution go through the column, it has longer time to contact
with the adsorbent, in addition, multiple layer of the sponge with SPION can adsorb the
arsenic from the top to the bottom one.
0
20
40
60
80
100
120
140
0 20 40 60 80
LEFT
CO
NC
ENTR
ATI
ON
(P
PM
)
NUMBER OF BED VOLUME
70oC 20oC 10oC

103
a)
b)
Fig 3.13 The effect of bed volume (70oC, 20oC, 10oC), initial arsenic concentration 50ppm,
pH=3.6 a)0.5g adsorbent, b)1.5g adsorbent
3.1.7. Adsorption isotherms
3.1.7.1. Langmuir isotherm
The experimental As (V) adsorption data have been treated to fit to Langmuir isotherm
showed in Fig 3.14. Langmuir isotherm equation (3.2) fitted well to the adsorption data.
-0.5
0.0
0.5
1.0
1.5
2.0
2.5
3.0
0 20 40 60 80
AD
SOR
PTI
ON
CA
PA
CIT
YMM
OL/
G()
NUMBER OF BED VOLUME
70oC 20oC 10oC
0.0
0.5
1.0
1.5
2.0
2.5
3.0
0 10 20 30 40
LOA
DIN
G C
AP
AC
ITY(
MM
OL/
G S
PIO
N)
NUMBER OF BED VOLUME
70oC 10oC

104
mm CCKCCxC //1/ (3.2)
-C is the concentration of sorbate in the equilibrated solution, mmol/L
-Cx is the adsorption capacity in SPION, mmol/g
-Cm is the maximum adsorption capacity
-KL is the Langmuir coefficients
The Langmuir coefficients KL and Cm can be determined from the intercepts and slopes of the
plots C/Cx vs C, which are linear.
Fig 3.14 Langmuir model
The isotherm parameters for the adsorption As(V) onto the sponge with SPION at
different temperatures were obtained from the Langmuir model by using the linear
fitting method.
y = 0.9151x + 0.4966R² = 0.9793
y = 1.0698x + 0.6169R² = 0.9936
0.00
0.20
0.40
0.60
0.80
1.00
1.20
1.40
1.60
1.80
2.00
0.000 0.500 1.000 1.500
C/C
X(G
/L)
C (PPM)
20oC
70oC

105
Table 3.1 The isotherm parameters for Langmuir model
T(K) 343 293
Cm(mmol/g SPION) 40.65 47.52
Cm(mmol/g sponge) 0.94 1.10
logKL(L/mmol) 1.73 1.84
0G (kJ/mol) -9.0 -10.3
R2 0.99 0.98
The effect of isotherm shape can be used to predict whether an adsorption system is
“favourable” or “unfavourable” both in fixed-bed systems as well as in batch processes.
The essential features of the Langmuir isotherm can be expressed in terms of a
dimensionless constant separation factor or equilibrium parameter K, which is defined
by the following relationship:
K =1
1+𝐾𝐿𝐶0 (3.3)
K indicate the type of isotherm, C0 is the initial concentration (mg/L), and KL is the Langmuir
constant.
Table 3.2 Equilibrium constants
Values of K Type of isotherm
K>1 Unfavorable
K=1 Liner
0<K<1 Favorable
K=0 Irreversible

106
Fig 3.15 plot of K against initial arsenic concentration at two temperatures.
Fig 3.15 with a relationship between K and C0 was presented to show the essential
features of the Langmuir isotherm. The K values indicate that adsorption is more
favorable for the higher initial As (V) concentration than the lower ones and also it
indicate that adsorption is more favorable for the lower temperature than the higher
ones.
3.1.8. Modeling of Arsenic Adsorption by a Ligand-Exchange
Process.
A monodantate ligand-exchange mechanism, based on the Fe:As stoichiometry 1:1
previously discussed, is proposed for the adsorption of arsenic(V) on the SPION loaded
on the sponge, as it has been considered for other iron-based materials. The
corresponding reactions can be written as follows:
OHAsOFeHxHAsOOHFe xx 2
341
34
…………………………….(3.4)33
With an equilibrium constant
0
0.0005
0.001
0.0015
0.002
0.0025
0.003
0 20 40 60 80 100 120
K
INITIAL CONCENTRATION (PPM)
20oC 70oC

107
AsHFe
AsK
x ……………………………………………………………………(3.5)36
Where As indicates the amount of arsenic species adsorbed on the SPION in the
sponge(mmol/g), Fe indicates the amount of iron adsorbed on the sponge and not
complexed with As(mmol/g), H indicates the concentration of free protons in
solution(mmol/g), and As indicates the free concentrations of the corresponding
34AsO ions in solution(mmol/g) which have been calculated from the experimental
values of total arsenic concentration.
From equation, defining Y (g/mmol)as
AsFe
AsY ………………………………………………………………………..……(3.6)
Then
xpHKY loglog ………………………………………………………………..…....(3.7)
Y value at a given pH is estimated from the experimental data of arsenic adsorption
by considering the formation of monodentate55 Fe-As complexes on the sponge. As
is calculated from the differences in adsorption capacity between the SPION loaded
and the blank sponge at each pH. Fe is calculated by subtracting the arsenic
adsorption capacity and the iron desorbed from the initial amount of Fe(III) in the
SPION-loaded sponge. As in solution is determined as indicated in the experimental
part.
A plot of logY vs pH for As(V) is given in Fig 3.16. The values of x and logK obtained
by the least squares fit are shown in Table 3.3. The model indicates that H2AsO4- are

108
the As(V) chemical forms adsorbed on the SPION loaded in the sponge in the pH range
studied.
When reaction is expressed as a function of the adsorbed species, the stability of the
complexes can be accurately evaluated:
OHFeHAsOAsOHOHFe 2442
…………………………………………..(3.8)
a)
b)
y = -0.398x + 4.1975R² = 0.8424
0.00
0.50
1.00
1.50
2.00
2.50
3.00
3.50
4.00
4.50
0 2 4 6 8 10
LOG
Y
PH
y = -0.1061x + 1.0231R² = 0.3791
-0.4
-0.2
0.0
0.2
0.4
0.6
0.8
1.0
1.2
1.4
1.6
0 2 4 6 8 10 12
LOG
Y
PH

109
Fig 3.16 Modeling of arsenic species adsorption on the SPION-loaded in the sponge: linear
relationship between log Y and pH for As (V).a) 20oC, b) 70oC
Table 3.3 Calculated Results from Fe-As Interaction Modeling Process Indicating the x and
logK Values by the Least-Squares Fit177
pH range X logK R2
20oC 1-8 0.40 4.20 0.84
70oC 1-11 0.10 1.02 0.38
As would be expected, As (V) adsorption on immobilized SPION is preferred under
20oC against that the adsorption performed under 70oC. Reversibility of both process
has already been proved by corresponding arsenic desorption from the SPION-loaded
sponge under 70oC. It also has proved the concept that the adsorption-desorption
process could be controlled by changing the temperature. The regeneration and reusing
of the adsorbent-SPION loaded sponge will be possible after desorption. Alternatively,
the sponge (which is an inexpensive material) could be compacted into an extremely
small volume and disposed as a hazardous waste.36

110
3.1.9. Thermodynamics Studies
The Gibb’s free energy change is calculated using KL obtained from Langmuir model
and showed in Table 3.1. The equations are:
∆𝐺0 = −𝑅𝑇𝑙𝑛𝐾𝐿……………………………………………………..……………………(3.9)
and
0 0 0= HG T S …………………………………………………………………...…(3.10)
where R is universal gas constant (8.314 J mol-1K-1) and T is the absolute temperature
in K.
The negative values of Gibb’s free energy ∆G (-9.0kJ/mol under 70oC and -10.3 KJ/mol
under 20oC) confirmed the feasibility of the process and the spontaneous nature of
adsorption with a high preference of As(V) by Forager sponge with SPION. The
decrease in the negative value of ∆G with a decrease in temperature indicates that the
adsorption process of As (V) on adsorbent becomes more favorable at lower
temperatures. The maximum adsorption capacity for SPION loaded sponge
(0.933mmol/g in 343K, 1.094mmol/g in 293K) is consequence of thermodynamic
characteristics of the adsorption process by the related values of the parameters ∆G.
The enthalpy change, ∆H, and the entropy change, ∆S, for the adsorption processes
were obtained from the intercept and slope of Eq. (3.9) and found to be -122.150 kJ
mol-1 and 337 J mol-1 K-1in the temperature interval 293K to 343K (assume that ∆H
and ∆S is not function of T, is constant in this temperature range), respectively (shown
in Table 3.4). The negative value of ∆H° indicates that the adsorption reaction is
exothermic. The positive value of ∆S suggests that some structural changes occur at the
adsorbent surface, and the randomness at the solid/liquid interface in the adsorption
system increases during the adsorption process.

111
Table 3.4 Thermodynamic parameters calculated
∆G(kJ mol-1) ∆H(kJ mol-1) ∆S(J mol-1K-1)
293K -23.54 -122.15 337.00
343K -6.72
3.1.10. The dependence of separation factors on temperatures and
bed volumes:
As indicated from the above equation 3.8, it was found that pKa <0 and the arsenic acid
is a relatively strong acid and the removal of As(V) by anion-exchange is possible. As
the anion exchange behavior, the equilibrium separation factor, , expressed as
follows.
2 4
2 4
2 4
OH H AsOOH
H AsOH AsO OH
x X
x X
……………………………………………………………...(3.11)
Where x and X are the equivalent fractions of ions under separation in adsorbent and
solution phases, respectively.
Table 3.5 separation factors
separation factor
Bed
volume 70oC 20oC
5 481.8 3061.2
8 545.8 11907.6
11 521.8 17861.9

112
13 529.6 26793.4
16 569.1 17861.9
19 560.1 107176.5
21 664.7 107176.5
24 625.8 21434.5
27 461.0 26793.4
29 141.1 8930.5
32 38.5 4121.2
35 14.9 1622.9
37 7.8 652.5
40 4.5 288.7
43 3.2 143.1
45 2.0 74.5
48 1.6 42.2
51 1.2 25.4
53 0.8 16.2
56 0.6 9.7
59 0.5 6.7
61 0.3 4.9
64 0.3 3.6
67 0.2 2.7
69 0.1 2.1

113
72 0.1 1.7
75 0.0 1.3
77 0.0 1.1
80 0.0 0.9
83 0.0 0.7
As can be seen from Table 3.5 that the separation factor has very strong temperature
dependence. Higher temperature leads to lower separation. The capacity of anion
exchange is very strongly at the beginning and meanwhile, increasing gradually as the
bed volume increases until the point of 21 bed volume.
Table 3.6 Comparison of the result with Jose Munoz’s work36
Fe loading
capacity(mmol Fe/g
sponge)
Maximum adsorption
capacity(mmol As/g
sponge)
maximum adsorption
capacity(mmol
As/mmol Fe)
Fe with
sponge
0.3 ± 0.01
1.8 7.3
SPION with
sponge
0.1 ± 0.003
1.1 11.5
The observed differences on Table 3.6 can be explained that the Fe (III) loaded
adsorption capacity is mainly due to the acid groups in the sponge. But the better
adsorption capacity of SPION loaded sponge is because of not only the acid groups but
also the good properties of SPION which has a high surface-volume ratio. The
nanostructure of the SPION make the adsorbent has big surface area, which has more
free sites for the adsorption. The reactivity of the adsorption process are more quickly
and adsorption are more efficiently.
114
3.2. Application of Synergic thermo-tuning of redox
potential for clean removal of Arsenic
In the previous section, results including Arsenic adsorption-desorption and adsorbent
regeneration by controlling the temperature have been described. Previous
experimental and theoretical studies indicate that we can use the lower temperature for
adsorption and higher temperature for desorption, thereby provide a new method for
recovery of toxic element and regeneration of adsorbents
This section will provide results to demonstrate the concept of tuning redox potential
to achieve the adsorption-desorption and adsorbent regeneration. Then the application
of synergic thermo-tuning of redox potential for removal of arsenic oxyanions has been
studied. The present part relates to a reagent-less recycled method for arsenic oxyanions
removal from wastewater and provide and added value to the water decontamination
process. Thus, the new method for Arsenic adsorption/desorption and sorbent
regeneration with no reagents added by taking advantage of the synergic thermo tuning
of redox potential of the adsorption-desorption system has been developed. Methods
are based on sorption-desorption processes for the indicated oxyanions. Nanostructured
materials have been implemented as adsorption substances, being iron oxides
nanoparticles the active constituents. Reagent-less processes were developed by using
intensive thermodynamic parameters, e.g, temperature and/or redox potential of the
target solution. Appropriate tuning of these parameters will allow both process
selectivity and regeneration of the adsorption material. Synergic interaction of thermo-
tuning with redox variation will provide such results. Thus, this reagent-less method
could not only provide reagent savings for recovering the adsorbent, but also the
adsorbent recycling to be reused will contribute to a-cost efficient process.
After the investigation of temperature influence on adsorption-desorption, the redox
potential effect on adsorption-desorption, adsorbent regeneration has been evaluated.

115
As indicated in the Methodology chapter, potassium dichromate has been used to
oxidize the As (III) to As (V)(conversion rate>91%) and Zn powder or Sn foil have
been used to reduce the As(V) to As(III)(conversion rate>90%). Since the adsorbent
has big difference adsorption capacity between As (V) and As (III), the adsorption-
desorption can be controlled by modifying the oxidation state. For example, the
adsorbent can better adsorb the arsenic by oxidizing all of the As (III) to be As (V) and
desorb the arsenic by reducing the As (V) to be As (III).
3.2.1. Experimental results of redox potential effect:
Fig 3.17 Effect of oxidation state on arsenite and arsenate adsorption, adsorbent dosage 50mg,
pH=3.6, contact time 1hour, the initial concentration 1-100ppm.
Modifying the redox potential, therefore transforming between arsenite and arsenate,
in order to control the adsorption-desorption is attributed to the significant difference
adsorption capacity of SPION loaded sponge for As (V) and As (III), as shown in Fig
3.17. The adsorbent of SPION loaded sponge has much higher adsorption capacity for
the As (V) adsorption than that for the As(III), as consequence of different acid
properties of arsenate and arsenite. Many studies aiming at elucidating the structure of
0.000
0.100
0.200
0.300
0.400
0.500
0.600
0.700
0.800
0 20 40 60 80 100 120
AD
SOR
PTI
ON
CA
PA
CIT
Y(M
MO
L/G
)
INITIAL CONCENTRATION(PPM)
As(III)-20℃
As(III)-70℃
As(V)-20℃
As(V)-70℃

116
arsenate complexes adsorbed on iron oxide nanoparticles have been done. Extended X-
ray absorption fine structure (EXAFS)178 and Fourier Transform Infrared Spectroscopy
(FTIR) 171 have shown As(V) and As(III) to form monodentate and bidentate inner
sphere surface complexes with iron (hydr)oxide sites in co-precipitated and adsorbent
solids.55 In the case of As(V), the possible chemical structures which arsenate may form
on the iron oxide surface upon chemical adsorption are different, such as monodentate,
bidentate mononuclear, bidentate binuclear. Although there is no consensus regarding
to the structure of the complex of arsenate bonding with iron oxide nanoparticles being
monodentate or bidentate, Some literature reports confirmed and demonstrated that
arsenic complexes were formed via the hydroxyl groups at the iron oxide surface.33
This is a very tight bond, and once the bond is formed, removal of the arsenic is difficult.
In the case of As(III) adsorption by iron (hydr)oxides, both bidentate binuclear-bridging
complexes(Fe-O-As(OH)-O-Fe) and monodentate complexes have been observed. 179A
monodentate complex is one in which a single oxygen atom from the arsenite oxyanion
coordinates a single structural Fe3+ at the iron (hydr)oxide surface, which is not
thermodynamically stable and the bond is easy to be broken. 178
By changing the redox potential, the transform between As (V) and As(III) will lead
the adsorption-desorption process and recycled use of the adsorbent. At the same time,
the thermo tuning can help the adsorption-desorption to be much more significant and
much quicker.

117
Fig 3.18 redox potential-different time-desorption
The experiment of redox potential effect on desorption has been carried under 20oC
(shown in Fig 3.18). The adsorbent (sponge loaded with SPION) was used for adsorb
the arsenate, which make the surface and porous of the adsorbent is full of arsenate
(10.34mg arsenic/g adsorbent). Then, 50mg of Tin foil was used as the reduction
reagent for desorption, and the aqueous solution pH 3.6 with the contact time from 10-
300min. As time goes on, Sn could transform the arsenate to arsenite, which has weak
bond to the iron oxide nanoparticles, therefore desorb from the adsorbent. That means
the Tin change the redox potential, which could help to realize the desorption process.
Arsenate (As(V)) react with Sn in buffered aqueous solutions to produce arsenite
(As(III)).180 The electron transfer reactions can be described in terms of
thermodynamics through the use of standard electrode potentials.181
3.2.2. Further proof of redox potential part
The potassium dichromate (K2Cr2O7) could oxidize the arsenite to arsenate by changing the
solution redox potential.
0
1
2
3
4
5
6
7
8
9
0 100 200 300 400
As(
V)
con
cen
trat
ion
,pp
m
Time of agitation(min)
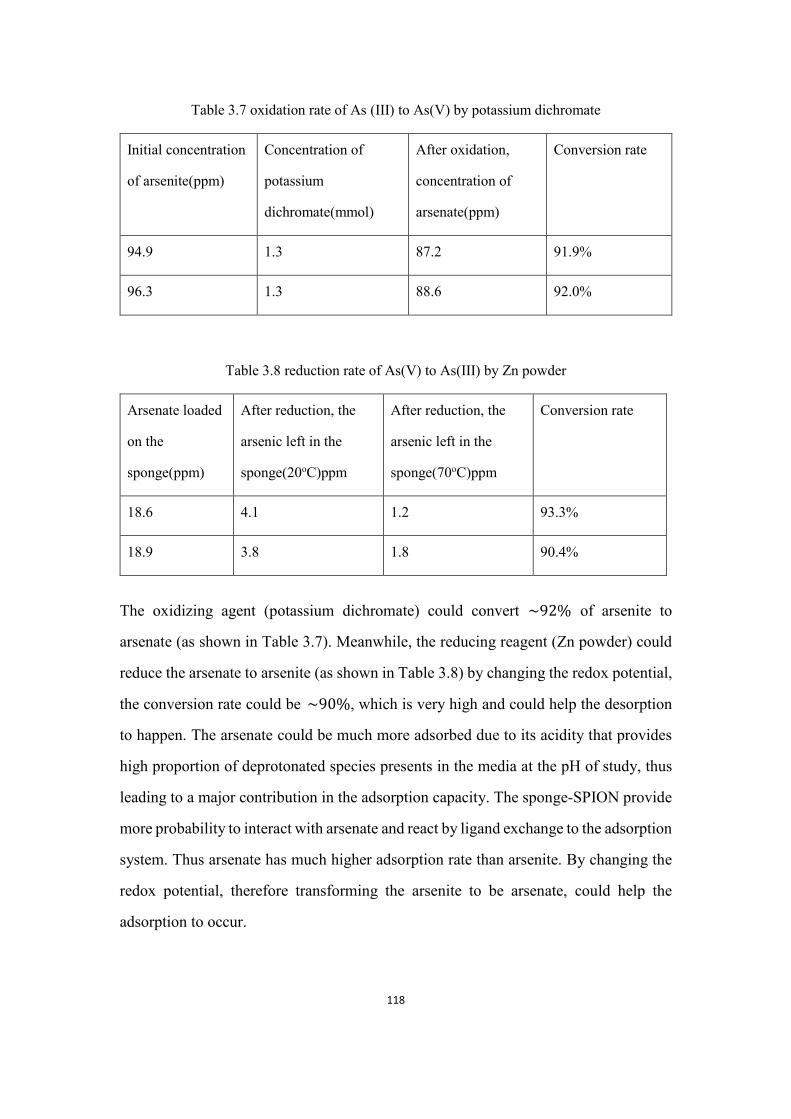
118
Table 3.7 oxidation rate of As (III) to As(V) by potassium dichromate
Initial concentration
of arsenite(ppm)
Concentration of
potassium
dichromate(mmol)
After oxidation,
concentration of
arsenate(ppm)
Conversion rate
94.9 1.3 87.2 91.9%
96.3 1.3 88.6 92.0%
Table 3.8 reduction rate of As(V) to As(III) by Zn powder
Arsenate loaded
on the
sponge(ppm)
After reduction, the
arsenic left in the
sponge(20oC)ppm
After reduction, the
arsenic left in the
sponge(70oC)ppm
Conversion rate
18.6 4.1 1.2 93.3%
18.9 3.8 1.8 90.4%
The oxidizing agent (potassium dichromate) could convert ~92% of arsenite to
arsenate (as shown in Table 3.7). Meanwhile, the reducing reagent (Zn powder) could
reduce the arsenate to arsenite (as shown in Table 3.8) by changing the redox potential,
the conversion rate could be ~90%, which is very high and could help the desorption
to happen. The arsenate could be much more adsorbed due to its acidity that provides
high proportion of deprotonated species presents in the media at the pH of study, thus
leading to a major contribution in the adsorption capacity. The sponge-SPION provide
more probability to interact with arsenate and react by ligand exchange to the adsorption
system. Thus arsenate has much higher adsorption rate than arsenite. By changing the
redox potential, therefore transforming the arsenite to be arsenate, could help the
adsorption to occur.

119
3.2.3. Column Experiments
Working under the optimized parameters, the maximum adsorption capacity was
determined. Thus, the concept of thermodynamic effect on the adsorption-desorption
process was studied in batch mode. Adsorption experiments in continuous mode were
performed in order to observe the behavior of the adsorbent system in more close
conditions to conventional working mode. For such purpose, a laboratory column-
adsorption system, with column size of 20cmx1.5cm Ø, was implemented and
employed. Aqueous solution containing arsenic oxyanions was circulated through the
column and arsenic adsorption was monitored by determining its concentration at the
outlet. As an example, 1L of 250ppm arsenate solution was processed through the
column-adsorption system and the break-through curve was determined, yielding the
sponge-SPION adsorption capacity of 0.17mmol/g sponge (21.64mmol/g SPION),
almost twice the capacity found with the same sample in batch mode. As expected, in
continuous mode, the efficiency of adsorption process is higher than in batch mode.
3.2.3.1. Different dosage effect on adsorption capacity
1L of 250ppm arsenate solution was processed through the filtration and column-
adsorption system, yielding “zero” concentration of arsenic in the elute solution. The
sponge-SPION presents an adsorption capacity of 0.167mmol/g sponge (21.64mmol/g
SPION), almost twice with the same sample in batch mode. In continuous mode, the
efficiency of adsorption process is higher than in batch mode. The results show that
the column adsorptions are more effective than batch adsorptions. The adsorption
capacity of the system is very high at the beginning.

120
Fig 3.19 Column mode –different dosage effect on elute concentration. Initial stock solution
concentration=250ppm, T=293K, 1g sponge loaded with SPION, pH=3.6.(Adsorption
capacity of 4g sponge-SPION=100.06mg As/g sponge, Adsorption capacity of 1g sponge-
SPION=99.14mg As/g sponge)
The observed data in Fig 3.19 shows the adsorption capacity obtained using 4g
adsorbent(sponge loaded with SPION) or 1g adsorbent is the same, which indicates the
homogeneity of the adsorbent prepared.
3.2.3.2. The synergic thermo tuning of redox potential-column mode:
Table 3.9 Combination of temperature effect with redox potential effect for desorption
After adsorption After desorption (20oC+
reduction)
After desorption (70oC+
reduction)
As in
Sponge
(ppm)
As in Sponge-
SPION(ppm)
As in
Sponge(
ppm)
As in
Sponge-
SPION(ppm)
As in
Sponge(ppm)
As in
Sponge-
SPION(ppm)
First
time
18.6 21.4 3.8 9.2 1.2 7.6
repeat 18.9 21.2 3.5 9.5 1.8 7.3
0
50
100
150
200
250
300
0 500 1000 1500 2000
elu
te c
on
cen
trat
ion
,pp
m
Number of bed volumn
4g sponge-SPION
1g sponge-SPION

121
Table 3.9 shows that in the column mode, both of the temperature and redox potential
have significant effect on arsenic adsorption-desorption. It could be combined the
temperature effect with redox potential in order to get the better and stronger desorption
process without adding reagents. It shows that in the column mode, the adsorbent in the
column could firstly adsorb the arsenate and then, the loaded arsenate could be eluted
by the reduced hot solution. After elution, the adsorbent could be reused to adsorb the
arsenic again. Which means, the adsorption-desorption recycled process could be
realized and the adsorbent could be reused for several times.
3.2.3.3. Comparison of desorption by temperature-modifying and reduction-
tuning methods
Fig 3.20 Comparison of desorption by temperature-modifying and reduction-tuning methods.
Heating: 70oC, Reduction: Sn
0
200
400
600
800
1000
1200
1400
1600
0 250 500 750 1000 1250 1500 1750 2000
elu
te c
on
cen
trat
ion
,pp
m
Number of bed volumn
elution2-Reduction
elution1-Heating

122
Table3.10 elution recovery ratio
reduction heating
total elute,mg 101.47 93.08
recovery,% 96.52 85.64
A comparison of the temperature-modifying and reduction-tuning methods for
desorption has been shown in Fig 3.20. The desorption process can be accomplished by
high temperature condition, in our case, we use 70oC hot water to thermostatic the
elution solution passing through the column. Once the high temperature is stable (since
we use thermometer to monitor the temperature), the desorption process occurs.
Another way to realize desorption process is to use the reducing conditions. One small
column (10*1.0cm) was used to be filled by reducing agent, here we use Sn, this column
is connected with the big column which is used for desorption. The results reflect that
both temperature-controlling and reduction-tuning method could make effective the
desorption process. As the desorption efficiency of the system is very high at the
beginning showing a“flash desorption” . The initial concentration of the elution shows
much more than 250ppm (here is 1506ppm), this is due to the concentrate effect of the
sponge-SPION during the adsorption process. The recovery efficiency of the arsenic
adsorbed in the sponge-SPION is high, showing 96.52% and 85.64% for each method,
respectively. Once finishing the desorption process, the adsorbent can be used again
(recycling) to adsorb arsenic oxyanions under room temperature. Such process could
be used in a continuous mode by applying temperature cycles. These experiments were
not yet accomplished and the present results state to establish the experimental
demonstration of the concept.

123
3.2.3.4. Comparison of different methods for desorption
Fig 3.21 comparison of different methods for desorption
Table3.11 comparison of recovery rate by using different methods for desorption
No heating-NaCl Heating+Reduction Reduction Heating+NaNO3
total elute,
mg 86.29 95.79 101.47 93.08
recovery,% 92.80 94.22 96.52 85.64
The comparison of different methods for desorption, the temperature with the help of
NaNO3, the reduction-tuning methods, the thermo tuning of redox potential way as well
as the NaCl as desorption reagent for desorption have been evaluated as shown in Fig
3.21. In the case of NaCl at room temperature (no temperature effect and no redox
conditions), the 92.80% recovery rate is due to the strong affinity of the Cl- for Fe(III)
present in SPION, helping thus the release of adsorbed arsenate. However, in the
desorption step, the effect of the anions NO3- or Cl-, which could compete with the
arsenic oxyanions therefore could help the desorption process, show lower recovery
rate, which is 85.64% and 92.80% than those by the redox potential tuning effect, which
0
200
400
600
800
1000
1200
1400
1600
0 250 500 750 1000 1250 1500 1750 2000
elu
te c
on
cen
trat
ion
,pp
m
Number of bed volumn
elution1-Heating-NaNO3
elution2-Reduction
elution3-both
elution4-no heat-NaCl

124
is 96.52% and 94.22%, respectively. Which means that redox potential tuning has
stronger impact on the desorption process.

125
3.2.3.5. Elution by different methods with different competing anions
Fig 3.22 elution by different methods with different competing anions
The temperature influence has very significant effect on arsenic oxyanion desorption,
which make the process to be very efficient and fast (20ml/min). The comparison of
heating effect with of the help of NO3-, SO4
2-, Cl- have been studied (shown in Fig 3.22).
The desorption is efficient and complete. The complete desorption is attributed to the
thermo tuning effect combined with the function of interference anions. The recovery
proportion is almost >90%.
Above all, the temperature and redox potential both have significant effect on
desorption, which make the desorption to be very efficient and complete. The efficient
and complete desorption process is attributed to the thermo tuning effect and to the
redox potential function. Again, this complete desorption results in a “clean” sponge
loaded with SPION, fully prepared for the next cycle of adsorption. The recovery
proportion is almost >90%.
(200)
0
200
400
600
800
1000
1200
1400
1600
0 250 500 750 1000 1250 1500 1750 2000 2250
elu
te c
on
cen
trat
ion
,pp
m
Number of bed volumn
Heating-NaNO3
Heating-Na2SO4
Heating-Nacl

126
Table 3.12 Comparison of different methods for desorption
Reagent-less Reagent
Method or
striping
solution
Heating Redox
potential
Heating+
redox
potential
NaOH1.0M NaCl
1.0M
Recovery(%) 85.64 96.52 94.22 48.6 67.5
Comparing the reagent-less method with those desorption reagents (shown in Table
3.12), the reagentless method is not only much more effective, but also save the cost
and environmental implication of the use of a reagent. Since our work is aimed for
recycling adsorption-desorption, adsorbent regeneration and reuse, keeping the
adsorbent to be the same and best pH condition for adsorption is very desirable. Thus,
either the temperature-controlling or the redox potential tuning method has no effect to
modify the pH. Reagent-less processes were developed by using these intensive
thermodynamic parameters, e.g, temperature and/or redox potential of the target
solution. Appropriate tuning of these parameters will allow both process selectivity and
regeneration of the adsorption material. Synergic interaction of thermo-tuning with
redox variation will be the object of future development of this process. Thus, this
reagent-less method could not only provide reagent savings for recovering the
adsorbent, but also the adsorbent recycling to be reused will contribute to a-cost and
environmental efficient process.

127
3.2.3.6. Several cycles loading-reuse of the adsorbent (SPION loaded sponge)
Fig 3.23 Adsorption-desorption cycles. Use of the same column in five cycles
The various adsorption-desorption cycles for arsenic in Fig 3.23. The sponge loaded
with SPION as adsorbent under study reflect very good adsorption capacity that is
shown to maintain in the various cycles, therefore the recycled function of the adsorbent
and the reuse process are experimentally confirmed. This recycled process is not only
due to the good adsorption capacity of the adsorbent (sponge-SPION), but also to the
efficient elution method, which make the recovery of arsenic oxyanions to be complete
and the adsorbent (sponge-SPION) to be regenerated. It demonstrate again that thermo
tuning or redox potential effect on the removal of the toxic oxyanions and the adsorbent
regeneration is effective and efficient.
0
50
100
150
200
250
300
0 500 1000 1500 2000 2500 3000
elu
te c
on
cen
trat
ion
,pp
m
Number of bed volumn
1st load2nd load3rd load4st load

128
3.2.4. As(III)-continuous column mode
3.24 As(III) adsorption on sponge loaded with SPION in continuous column mode
3.25 As (III) desorption on sponge loaded SPION in continuous column mode
Although arsenic adsorption/desorption behavior on iron (oxyhydr)oxides has been
extensively studied182, no one study about arsenic(III) adsorption/desorption behavior
using sponge-SPION system. The adsorption and desorption efficiency of As(III) in
continuous column mode has been determined as shown in Fig 3.24 and Fig 3.25,
respectively. For the As(III) adsorption column experiment, the initial concentration of
0
50
100
150
200
250
0 200 400 600 800 1000 1200
Elu
te c
on
cen
trat
ion
, pp
m
Number of bed volumn
0
5
10
15
20
25
30
35
40
45
0 500 1000 1500 2000 2500
Elu
tio
n c
on
cen
trat
ion
,pp
m
Number of bed volumn

129
the As(III) was 250ppm. 1L of 250ppm As(III) contained solution was used to pass
through the column under pH 6.5(since As(III) is not pH dependent, so we use just the
MiliQ purified water instead of buffer pH 3.6 (used for As(V) adsorption) to do the
adsorption/desorption experiment ). The column was filled with 1g of adsorbent-
SPION loaded sponge. While for the As(III) desorption process under the column
continuous mode, the high temperature hot water was used to make that the desorption
was undertaken in 70oC. The low adsorption and desorption capacity and efficiency of
As(III), compared with As(V) adsorption on sponge loaded with SPION confirm the
results obtained previously when working at room temperature168. The maximum
adsorption capacity of As(III) under column continuous mode is around 3.07mg
As(III)/g sponge (or 0.04 mmol As(III)/g sponge). The desorption is only observed in
the first elution tube(50mL) , meaning the process to be fast.
The arsenite could be much less adsorbed due to its acidity that maintain a high
proportion of deprotonated species presents in the media during the adsorption process
and thus leadingthe sponge-SPION to have less possibility to interact with arsenite,
compared with that interaction and affinity to arsenate which react by anion exchange
on the adsorption system. Therefore, this results supports again the concept of the redox
potential as key parameter to tune the Arsenic adsorption/desorption on SPION loaded
sponge system.

130
3.2.5. As(V)+As (III) adsorption-desorption on sponge loaded SPION
in continuous column mode
3.26 As(V)+ As(III) mixture adsorption on sponge loaded with SPION in continuous column
mode
3.27 As (V)+As (III) mixture desorption on sponge loaded SPION in continuous column
mode
0.0
50.0
100.0
150.0
200.0
250.0
300.0
0 500 1000 1500 2000
ELU
TIO
N C
ON
CEN
TRIO
N, P
PM
NUMBER OF BED VOLUME
As(V)/As(V)+As(III)
As(III)/As(V)+As(III)
As(V)+As(III)
(100.0)
0.0
100.0
200.0
300.0
400.0
500.0
600.0
700.0
0 500 1000 1500 2000
ELU
TIO
N C
ON
CEN
TRA
TIO
N,P
PM
NUMBER OF BED VOLUME
As(V)/As(V)+As(III)
As(III)/As(V)+As(III)
As(V)+As(III)

131
The adsorption and desorption efficiency of As(V)+ As(III) mixture solution in
continuous column mode has been determined as shown in Fig 3.26 and Fig 3.27,
respectively. The results observed are due to the competitiveness between arsenate and
arsenite. The column results confirmed the results studies elsewhere that, taking into
account the related results for the individual species, arsenite is also adsorbed and
desorbed but in much less proportion than arsenate.33
3.2.6. Cycled column experiment by modeling the real waste water
treatment
A series of adsorption/desorption experiments for modelling the real wastewater
treatment process were carried out in a column continuous mode to provide the basis
for a possible continuous removal of Arsenic in polluted waters.
a)
0.0
10.0
20.0
30.0
40.0
50.0
60.0
70.0
80.0
0
50
100
150
200
250
300
350
400
0 5 10 15 20
tota
l As
left
on
co
lum
n,m
g
Co
nce
ntr
atio
n,p
pm
Number of sample
adsorption-250ppm
elution-Sn-20ppm
adsorption-250ppm
elution-Sn-20ppm
As on column

132
b)
3.28 Modeling of real wastewater treatment process of adsorption-desorption, a) desorption
only by redox potential tuning, b) desorption by temperature and redox potential tuning
a)
0
10
20
30
40
50
60
70
80
90
100
0
100
200
300
400
500
600
700
800
0 5 10 15 20 25 30
As
left
on
co
lum
n,m
g
Co
nce
ntr
atio
n,p
pm
Number of sample
adsorption-250ppm
elution-heating 70C
adsorption-250ppm
elution-heating 70C
elution-0.05M NaOH
As left on column
0
10
20
30
40
50
60
70
80
0 5 10 15 20 25
Co
nce
ntr
atio
n, p
pm
Number of sample
Heating
Sn redox

133
b)
Fig.3.29 Adsorption/desorption cycles on a column continuous mode by using temperature
or/and redox potential to tune the process, comparing of different methods, a) 20 sample, b) 8
sample
The adsorption-desorption cycling process has been characterized (shown in Fig 3.28,
Fig 3.29). In these experiments, the continuous solution on column is of 50 ppm of
Arsenic. In this way, we will mimic a process of polluted water treatment.
The specific experiments are described as follows:
Experiment 1, elute by heating
1) Loading As(v) 250ppm on the column(1g sponge-SPION), collect the elute in six 50ml tubes to assume column saturation.
2) Elute the column by 50ppm As(v) solution, by heating to 70°C, collect the elute in four 50ml tubes.
3) Repeat steps 1) and 2)
Experiment 2, elute by Sn-reduction precolumn
1) Load As(v) 250ppm on the column(1g sponge-SPION), collect the elute in six 50ml tubes to assure column saturation.
2) Elute the column by 20ppm As(v) solution, by passing the Sn-redox column(80g),collect the elute in four 50ml tubes.
0
10
20
30
40
50
60
70
80
0 1 2 3 4 5 6 7 8
As(
v) le
ft o
n co
lum
n,m
g
Sample volumn, L
Heating
Sn redox
Heating+Redox

134
3) Repeat steps 1) and 2)
Experiment 3, Heating+Redox : In this case, the continuous flowing solution is heated
and passed by the solid Sn precolumn
1) Load As(v) 250ppm on the column(1g sponge-SPION), collect the elute in six 50ml tubes to assure column saturation.
2) Elute the column by 20ppm As(v) solution, passing the heated solution at 70°C by the Sn-redox pre-column(80g), and collect the eluate in four 50ml tubes.
Heating+Redox > Heating > Sn-redox
Fig.3.30 Comparative results of different methods for desorption concentration
0
10
20
30
40
50
60
70
80
0 0.5 1 1.5 2 2.5 3 3.5 4 4.5
As(
v) le
ft o
n co
lum
n,m
g
Sample volumn(20ppm),L
Heating
Sn redox

135
Fig.3.31 Comparative results of different methods for desorption capacity
It is observed that by tuning the thermodynamic parameters, such as the temperature, the redox
potential as well as the combining thermo tuning of redox potential, the desorption is produced.
The comparison of heating, redox as well as the heating combined with redox effect on
desorption process have been performed and studied as shown in Fig 3.30 and Fig 3.31.
Results indicate the positive synergism between temperature and redox potential.
0.13
0.09
0.17
0.00
0.05
0.10
0.15
0.20
0.25
Heating Sn-redox Heating+Redox
Des
orp
tio
n c
apac
ity,
mg/
ml
Desorption method

136
3.2.7. Real waste water
The real waste water sample has a high concentration of iron, which has has to be
eliminated before arsenic removal.
Table 3.13: Original concentrations of different elements in real waste water
ppm
Fe 979
Al27 773.5
Mg 26 715.5
Zn 198.5
Cu 194.8
Mn 55 74.2
Ca 44 39.9
Si 28 34.7
Na 23 14.1
Co 59 7.0
As 3.1
Li 7 2.8
Ni 2.2
Cd 114 2.1
Sr 88 1.8
Ba 138 1.5
Ti 47 1.4

137
Cr 52 1.3
V 51 1.3
Sb 123 1.3
Mo 95 1.3
Ag 107 1.0
Se 82 0.4
Pb 0.2
The real waste water sample is from Rio Tinto river from Huelva province, Andalucia
(Spain) and was provided by the Spanish company AGQ Mining and Bioenergy. Waste
water sample was analysed by ICP-MS and we can observe a high concentration of iron
to be eliminated before arsenic removal.
A sample pretreatment by bubbling air for 4 hours, to oxidize the Fe2+ to Fe3+. In
addition, the pH of the real waste water (originally 2.45), is changed to be 3.6 by adding
NaOH. The precipitate is removed by using a filter, obtaining “iron-free” wastewater.
But at the same time, the arsenic is also partially removed since it is adsorbed on the
precipitated iron hydroxide. For this reason and to observe the influence of the waste
water matrix, we proceeded to doping with 60ppm arsenate the waste water “iron-free”
solution (WW). The resulting WW was treated with sponge-SPION adsorbent
After treating the wastewater, the arsenic is adsorbed and the results are shown below
in the Table 3.14 and the comparison the results with that represent the data previously
obtained for the synthetic As(V) solution was shown in Figure 3.32 . As expected, The
first sample demonstrate that the method performs well because almost all the arsenic
present in the first 50mL has been adsorbed in the SPION loaded sponge despite other
elements presented in the sample can be adsorbed too (ICP show that interfering
elements such as Zinc or Copper are present in a higher concentration than arsenic), the

138
removal efficiency is very good at the beginning (97.82% removal). However, if
passing more volume of the real waste water, the removal percentage of the arsenic
species is sharping down since the interference ions, which compete with the arsenic
oxyanions to be adsorbed. Therefore, the removal of the interference ions before
adsorbing the arsenic species is very necessary and important. The method will perform
better if instead of one column is used creating a system of columns interconnected.
Table 3.14: Real waste water absorption results(initial concentration 45.29ppm)
sample 1 2 3 4 5 6 7 8 9
Real
Concentrati
on(ppm)
0.99 22.7 36.1 39.4 39.6 44.3 43.3 44.0 43.8
Removal
percent(%)
97.8 36.1 20.4 13.1 12.5 2.3 4.5 2.9 3.3
Figure 3.32 Comparison the results of arsenic removal efficiency with that represent the data
previously obtained for the synthetic As(V) solution
0.00
20.00
40.00
60.00
80.00
100.00
120.00
0 200 400 600 800 1000
rem
ova
l per
cen
tage
(%)
No. of bed volume
synthetic water
real waste water

139
3.3. Kinetic and Dynamic Aspects of Selenate and selenite
adsorption by γ-Al2O3 nanospheres
3.3.1. Characterization of adsorbent material--SEM-EDX analysis
Adsorbent (i.e. γ-Al2O3 nanosphere) shape and size impact the adsorption capacity of
the adsorbent. SEM images of fresh γ-Al2O3 nanospheres indicate that the material is
composed of individual, hollow-spherical particles ranging in size from 200 to 400nm
that form aggregates and chains (Fig3.33a). This small γ-Al2O3 nanospheres provides
a large surface area for contaminant adsorption. Energy Dispersive X-ray (EDX)
analysis data (Fig3.33b) show that the main compositions of the sample are Al and O,
which confirms the nanosphere composition. The SEM images of γ-Al2O3 nanospheres
after adsorption for the selenium was shown in Fig 3.33c. The adsorption of selenium
on the γ-Al2O3 nanospheres did not influence the structure of the nanoparticles.
a)

140
b)
c)
Fig 3.33 SEM image of γ-Al2O3 nanospheres a) before adsorption of selenium b) EDX
analysis c) after adsorption of selenium
3.3.2. Comparison of AlOOH, γ-Al2O3 , modified γ-Al2O3 for
selenium adsorption
AlOOH hierarchically nanostructured hollow microspheres165 with nanoflake-like
porous surface textures was fabricated in our lab by chemically induced self-
transformation of metastable solid particles of amorphous aluminum oxyhydroxide
produced in situ within hydrothermal reaction mixtures containing aluminum sulfate
and urea.111 The hollow structured γ-AlOOH microsphere has first been used for
selenium adsorption to see how it behaves and how much the adsorption capacity of the

141
γ-AlOOH microsphere is. AlOOH hierarchically nanostructured microspheres are used
as the precursor and template for the preparation of γ-Al2O3 hierarchically
nanostructured nanospheres by thermal transformation of AlOOH at 600oC in
microwave, and the morphology is well preserved during the thermal transformation
process. This process produce intact hollow spheres of γ-Al2O3. The comparison
between the adsorption of selenate and selenite by γ-AlOOH microsphere and γ-Al2O3
nanospheres has been studied and the results are shown in Fig 3.34. The γ-Al2O3
nanospheres has much higher adsorption capacity for adsorbing selenate and selenite
than that of γ-AlOOH microsphere. Therefore, in the following work, we use γ-Al2O3
nanospheres as the adsorbent for selenate and selenite adsorption.
Fig 3.34 Comparison of Selenium adsorption by either AlOOH or γ-Al2O3
3.3.3. pH effect on adsorption.
The pH level of the aqueous solution is an important variable for the selenium
adsorption process, due to the speciation of the chemical functional groups present on
the adsorbent surface. So, the effect of the aqueous solution pH on the removal
efficiency of the aluminum nanoparticles for selenium was studied between pH 2.0 and
11.0 (acetic/acetate media) under temperature 20oC and 70oC, respectively (Fig 3.36a,
0.0
50.0
100.0
150.0
200.0
250.0
300.0
0 50 100 150 200 250
Ad
sorp
tio
n c
apac
ity,
mg/
g
Conc.,ppm
Se(VI)-γ-AlOOH
Se(IV)-γ-AlOOH
Se(IV)-γ-Al2O3
Se(VI)-γ-Al2O3
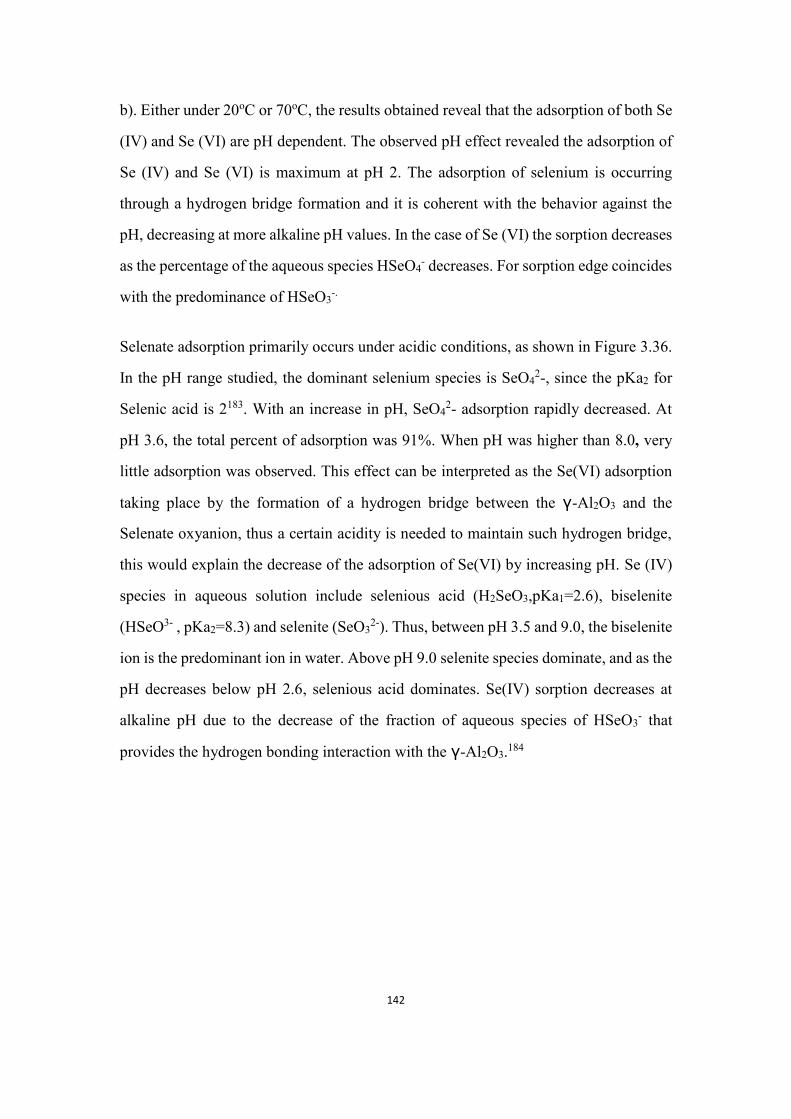
142
b). Either under 20oC or 70oC, the results obtained reveal that the adsorption of both Se
(IV) and Se (VI) are pH dependent. The observed pH effect revealed the adsorption of
Se (IV) and Se (VI) is maximum at pH 2. The adsorption of selenium is occurring
through a hydrogen bridge formation and it is coherent with the behavior against the
pH, decreasing at more alkaline pH values. In the case of Se (VI) the sorption decreases
as the percentage of the aqueous species HSeO4- decreases. For sorption edge coincides
with the predominance of HSeO3-.
Selenate adsorption primarily occurs under acidic conditions, as shown in Figure 3.36.
In the pH range studied, the dominant selenium species is SeO42-, since the pKa2 for
Selenic acid is 2183. With an increase in pH, SeO42- adsorption rapidly decreased. At
pH 3.6, the total percent of adsorption was 91%. When pH was higher than 8.0, very
little adsorption was observed. This effect can be interpreted as the Se(VI) adsorption
taking place by the formation of a hydrogen bridge between the γ-Al2O3 and the
Selenate oxyanion, thus a certain acidity is needed to maintain such hydrogen bridge,
this would explain the decrease of the adsorption of Se(VI) by increasing pH. Se (IV)
species in aqueous solution include selenious acid (H2SeO3,pKa1=2.6), biselenite
(HSeO3- , pKa2=8.3) and selenite (SeO32-). Thus, between pH 3.5 and 9.0, the biselenite
ion is the predominant ion in water. Above pH 9.0 selenite species dominate, and as the
pH decreases below pH 2.6, selenious acid dominates. Se(IV) sorption decreases at
alkaline pH due to the decrease of the fraction of aqueous species of HSeO3- that
provides the hydrogen bonding interaction with the γ-Al2O3.184

143
a)
b)
Fig3.36. pH effect on selenium adsorption, initial concentration: 1ppm, using 0.005g
aluminum nanosphere as adsorbent. 25mL, contact time is 18h. a) 20oC b) 70oC
The observed differences on adsorption behavior between Se (IV) and Se(VI) are due
to the differences on acidity of the corresponding oxyanions that need the formation of
corresponding hydrogen bonding with the corresponding γ-Al2O3.
0.0
0.5
1.0
1.5
2.0
2.5
3.0
3.5
4.0
4.5
5.0
0 2 4 6 8 10 12
Ad
sorp
tio
n c
apac
ity(
mg/
g)
pH
Se(IV)
Se(VI)
0.0
0.5
1.0
1.5
2.0
2.5
3.0
3.5
0 2 4 6 8 10
adso
rpti
on
cap
acit
y(m
g/g)
pH
Se(IV)
Se(VI)

144
3.3.4. Initial concentration effect on selenium adsorption
These experiments are planned to assess the effect of the initial selenate and selenite
concentration on the sorption process and estimate the maximum aluminum nanosphere
adsorption capacity for both species. The adsorption of selenium oxyanions by γ-Al2O3
nanospheres is determined in a proper initial selenium concentration range at pH 2. The
effects of the initial selenium concentration (from 2ppm to 100ppm) on the adsorption
capacity by the γ-Al2O3 nanosphere are shown in Fig 3.36. The increase of adsorption
capacity when the initial selenium concentration increases can be explained in terms of
diffusion resistance. Adsorption capacity equilibrium is reached when the surface of γ-
Al2O3 nanosphere does not have free sites for the selenium oxyanions uptake, being
saturated.136 It is probably another explanation that, as mentioned before, a higher
probability of collision between adsorbate (arsenate) and adsorbent(sponge loaded with
SPION) surface happens as initial concentration increases, which could overcome the
mass transfer resistance between the aqueous and the adsorbent phases.174
.
0.0
0.5
1.0
1.5
2.0
2.5
3.0
3.5
4.0
0 20 40 60 80 100 120
Ad
sorp
tio
n c
apac
ity(
mm
ol/
g)
initial concentration(ppm)
Se(IV)
Se(VI)

145
Fig3.36. Se(VI)and Se(VI) initial concentration effect on selenium adsorption, initial
concentration:1ppm, using 0.005g aluminum nanoparticle as adsorbent. 25mL, contact time is
18h.
3.3.5. Adsorption Isotherm modeling.
In these experiments the effect of the initial Se (IV) and Se (VI) concentration on the sorption
of Se (IV) and Se (VI) was studied in order to estimate the maximum loading capacity of γ-
Al2O3 nanoparticles.The obtained results are not fitted to Langmuir isotherm, fitted to the well-
known Freundlich isotherm model, as shown in Fig3.38. The experimental observation are in
good agreement with the Freundlich model185
Fig3.37 Freundlich isotherm model for the adsorption of Se (VI) and Se(IV) by γ-Al2O3
nanosphere
Table 3.15 Freundlich parameters
logkf 1/n R2
Se(IV) -0.76 0.59 0.92
Se(VI) -0.58 0.65 0.92
y = 0.6528x - 0.5776R² = 0.9249
y = 0.5902x - 0.7647R² = 0.9177
-4.5
-4.0
-3.5
-3.0
-2.5
-2.0
-1.5
-1.0
-0.5
0.0
-6.0 -5.5 -5.0 -4.5 -4.0 -3.5 -3.0
log
qe(
mm
ol/
g)
log Ce(mmol/L)
Se(IV)
Se(IV)
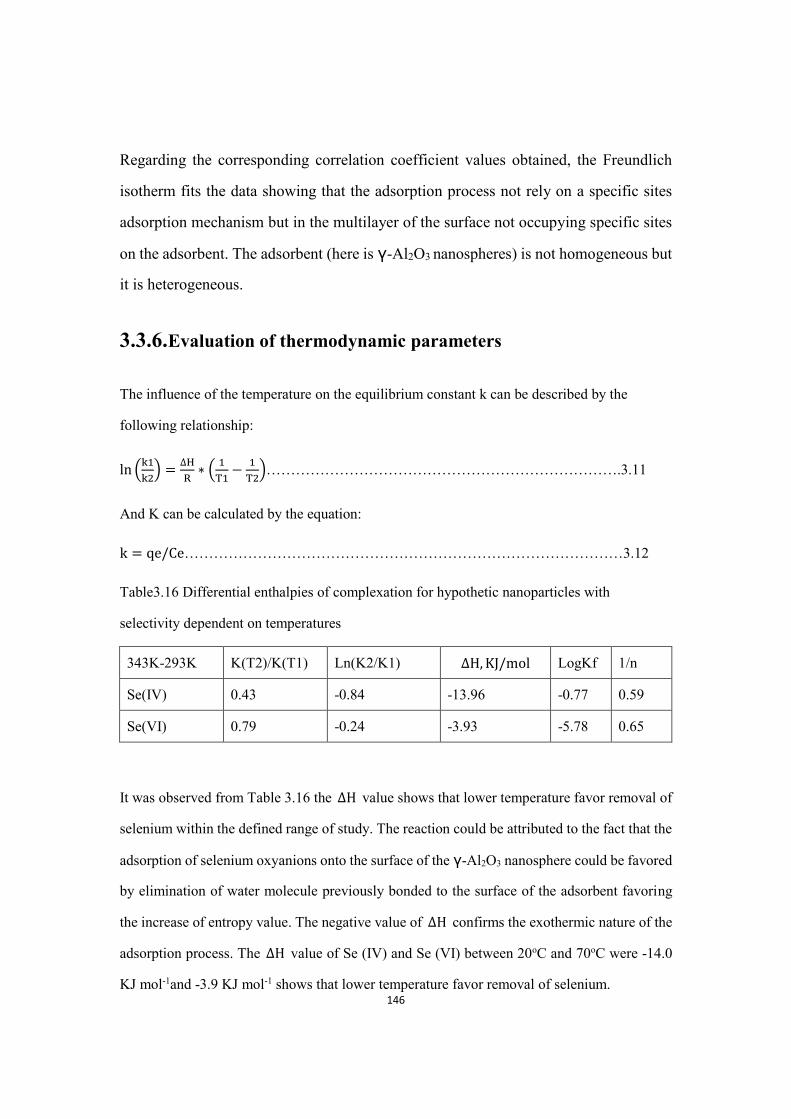
146
Regarding the corresponding correlation coefficient values obtained, the Freundlich
isotherm fits the data showing that the adsorption process not rely on a specific sites
adsorption mechanism but in the multilayer of the surface not occupying specific sites
on the adsorbent. The adsorbent (here is γ-Al2O3 nanospheres) is not homogeneous but
it is heterogeneous.
3.3.6. Evaluation of thermodynamic parameters
The influence of the temperature on the equilibrium constant k can be described by the
following relationship:
ln (k1
k2) =
∆H
R∗ (
1
T1−
1
T2)……………………………………………………………….3.11
And K can be calculated by the equation:
k = qe/Ce………………………………………………………………………………3.12
Table3.16 Differential enthalpies of complexation for hypothetic nanoparticles with
selectivity dependent on temperatures
343K-293K K(T2)/K(T1) Ln(K2/K1) ∆H, KJ/mol LogKf 1/n
Se(IV) 0.43 -0.84 -13.96 -0.77 0.59
Se(VI) 0.79 -0.24 -3.93 -5.78 0.65
It was observed from Table 3.16 the ∆H value shows that lower temperature favor removal of
selenium within the defined range of study. The reaction could be attributed to the fact that the
adsorption of selenium oxyanions onto the surface of the γ-Al2O3 nanosphere could be favored
by elimination of water molecule previously bonded to the surface of the adsorbent favoring
the increase of entropy value. The negative value of ∆H confirms the exothermic nature of the
adsorption process. The ∆H value of Se (IV) and Se (VI) between 20oC and 70oC were -14.0
KJ mol-1and -3.9 KJ mol-1 shows that lower temperature favor removal of selenium.

147
3.3.7. Adsorption dynamics
The variation of contact time is one of the most important parameters in determining
the adsorption potential of an adsorbent material, the adsorption dynamics. Adsorption
of selenium by aluminum nanospheres was studied within a time period of 2-4320min
(2min to 72h). As shown in Fig 3.38, the equilibrium adsorption of selenium can be
obtained in 6h under 20oC at pH 2, the adsorption of selenium presents an anion
exchange behavior. The reason could be attributed to the availability of high surface
area as well as porous structural features facilitating easy removal of selenium. Apart
from this, surface hydrophilicity could be a factor responsible for anion-surface
functional group interaction which is entropically favorable. On the other hand, for
70oC, the maximum adsorption was attained in 14 hours.
a)
0.0
0.5
1.0
1.5
2.0
2.5
3.0
3.5
4.0
4.5
5.0
0 1000 2000 3000 4000 5000
adso
rpti
on
cap
acit
y(m
g/g)
Time, minutes
Se(IV)
Se(VI)

148
b)
Fig3.38 Variation of contact time period, pH=3.6, conc. of Se(IV) or Se(VI): 1ppm; adsorbent
dose:5mg.a)20oC, b) 70oC
3.3.8. Adsorption kinetics
Adsorption of selenium oxyanions on γ-Al2O3 nanospheres is a complex process. The
adsorption mechanism during the present adsorption process involve the potential rate
controlling steps such as mass transport, pore diffusion and chemical reaction processes.
Indeed, the speed of adsorption is strongly influenced by several parameters such as the
status of the solid matrix that has generally heterogeneous reactive sites, and the
physical-chemical conditions under which the adsorption take place.186
In order to understand kinetics process and predict the mechanism involved during the
present adsorption process, the adsorption data were analyzed and two kinetic models
were used to fit the experimental data, namely, pseudo first-order (shown in Fig 3.39)
and pseudo-second-order(shown in Fig 3.40). The pseudo first order kinetic model was
based on the capacity of the solid adsorbent by considering that the rate of occupation
of adsorption sites is proportional to the number of unoccupied sites. The best-fit model
was selected based on both linear regression correlation coefficient (R2) and the
0.0
0.5
1.0
1.5
2.0
2.5
3.0
3.5
4.0
4.5
5.0
0 500 1000 1500 2000
adso
rpti
on
cap
acit
y, m
g/g
Time, min
Se(IV)
Se(VI)
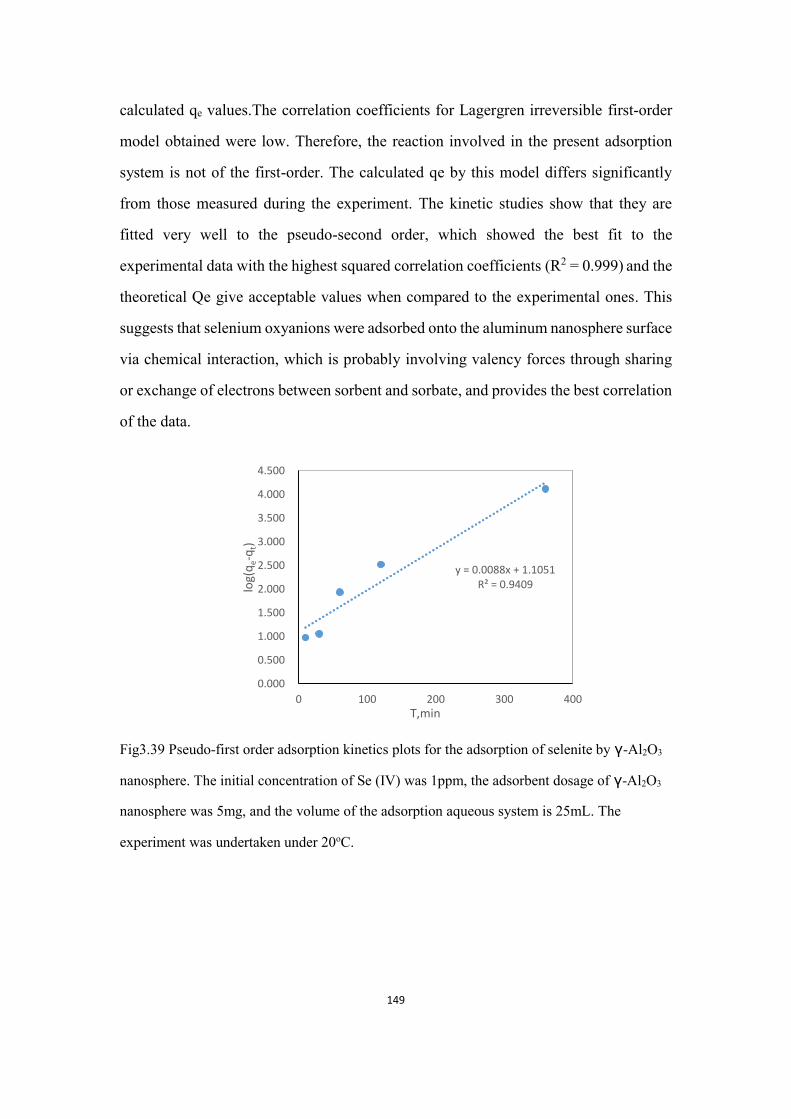
149
calculated qe values.The correlation coefficients for Lagergren irreversible first-order
model obtained were low. Therefore, the reaction involved in the present adsorption
system is not of the first-order. The calculated qe by this model differs significantly
from those measured during the experiment. The kinetic studies show that they are
fitted very well to the pseudo-second order, which showed the best fit to the
experimental data with the highest squared correlation coefficients (R2 = 0.999) and the
theoretical Qe give acceptable values when compared to the experimental ones. This
suggests that selenium oxyanions were adsorbed onto the aluminum nanosphere surface
via chemical interaction, which is probably involving valency forces through sharing
or exchange of electrons between sorbent and sorbate, and provides the best correlation
of the data.
Fig3.39 Pseudo-first order adsorption kinetics plots for the adsorption of selenite by γ-Al2O3
nanosphere. The initial concentration of Se (IV) was 1ppm, the adsorbent dosage of γ-Al2O3
nanosphere was 5mg, and the volume of the adsorption aqueous system is 25mL. The
experiment was undertaken under 20oC.
y = 0.0088x + 1.1051R² = 0.9409
0.000
0.500
1.000
1.500
2.000
2.500
3.000
3.500
4.000
4.500
0 100 200 300 400
log(
qe-
qt)
T,min

150
a)
b)
Fig 3.40. The plot of t qt-1 vs. t showing the linear nature of second-order kinetic model for
aluminum nanoparticle, adsorbent dose, 5mg, pH 3.6. a. Se(IV) and Se(VI), 20oC; b Se(VI) and
Se(VI), 70oC
y = 0.2133x + 0.8652R² = 1
y = 0.2454x + 0.9678R² = 0.9997
0
20
40
60
80
100
120
140
160
180
200
0 200 400 600 800
t/qt,
min
g/m
g
T, min
Se(IV) 20oC
Se(VI) 20oC
y = 0.2352x + 7.5578R² = 0.9992
y = 0.2196x + 5.6117R² = 0.9985
0
50
100
150
200
250
0 200 400 600 800 1000
t/q
t()m
in g
/mg
T,min
Se(IV) Se(VI)

151
Table 3.17 Pseudo-second order kinetic constants for the adsorption of selenium oxyanions on
γ-Al2O3 nanospheres
K2(g/mg min) Qe (mg/g) R2
Se(IV) 20oC 0.054 4.29 0.9999
Se(VI) 20oC 0.058 4.16 0.9998
Se(IV) 70oC 0.053 4.33 0.9996
Se(VI) 70oC 0.048 4,55 0.9985
Pseudo second-order adsorption parameters qe and K2 were determined by plotting t/qt
versus t., the analysis of tabular data (shown in Table 3.17) reveals that values of both qe, exp
and qe.cal for pseudo second order kinetic model are close to each other with relatively higher
correlation coefficient (R2) value. Given the good agreement between model fit and
experimentally observed equilibrium adsorption capacity, this suggests that selenium
ions were adsorbed onto the aluminum nanoparticle surface via chemical interaction.
The adsorption kinetics can be conveniently represented by the pseudo second order model.

152
3.3.9. Comparison of adsorption capacity between γ-Al2O3
nanosphere and modified γ-Al2O3 nanosphere
Fig 3.41 comparison of adsorption capacity between γ-Al2O3 and Modification of γ-Al2O3
Some studies on 3-mercaptoproponic acid (3-MPA) coated SPION have been done in
order to modify the change the aggregation properties of SPION and link the thiol
groups to SPION surface in order to improve the adsorption capacity and selectivity of
SPION82. In our case, the γ-Al2O3 nanosphere has been modified by diethylammonium
N,N-diethyldithiocarbamate(DDC)187, since this organic reagent has the thiol group188,
which also could bond with γ-Al2O3 nanosphere189, therefore make the nanospheres to
be less aggregated and increase the surface area. Thus, it should improve the adsorption
capacity of γ-Al2O3 nanosphere for selenium adsorption. The results of comparison of
adsorption capacity betweenγ-Al2O3 nanosphere and DDC modified γ-Al2O3
nanosphere has shown in Fig 3.41. It has demonstrated that DDC modified γ-Al2O3
nanosphere has higher adsorption capacity for selenate. However, in the pH range of
2.8-6.0, the γ-Al2O3 nanosphere has higher adsorption capacity for selenite than
corresponding to DDC modified γ-Al2O3 nanosphere for selenite. When pH>6.0, the
phenomenon is opposite. This could be interpreted as a change on the type of adsorption
0.0
5.0
10.0
15.0
20.0
25.0
30.0
35.0
40.0
2 4 6 8 10
Ads
orpt
ion
capa
city
, mg/
g
pH
modified Se 6+
Al2O3 Se6+
modified Se 4+
Al2O3 Se 4+

153
interaction between the adsorbent and target Se oxyanions. In the DDC modified
surface, the role of the thiol group much less acidic will provide the needed hydrogen
bond interaction.
3.4. Kinetic and Dynamic Aspects of Selenate and selenite
adsorption by sponge loaded with superparamagnetic iron
oxide nanoparticles (SPION)
From the previous part, it was found that the γ-Al2O3 nanospheres can be used as
potential nano-adsorbents for the removal of Se (IV) and Se (VI) oxyanions, especially
Se (IV) species since it showed higher adsorption capacity for Se (IV) than that for Se
(VI), mostly due to the difference on acidity of the related oxyanions. In this part, the
sponge loaded with SPION is introduced again for the adsorption of selenium
oxyanions. The results show that sponge loaded with SPION has much better adsorption
capacity for selenate than that for selenite.
The results show that when sponge loaded with SPION as the adsorbent for selenium
adsorption, the adsorption capacity of SPION-sponge for selenate is much higher than
that for selenite. The maximum adsorption for selenate and selenite on sponge loaded
with SPION was achieved at pH 3.6 in 1 hour under 20oC and 6 hours under 70oC,
respectively, while time for obtaining equilibrium of selenite needs 14 hours under 20oC
and 24 hours under 70oC.
On the other hand, a comparison of these results with those obtained for Arsenic
adsorption, it is observed a parallel phenomenon, thus, sponge loaded with SPION have
better adsorption capacity for As(V) and Se(VI) and lower adsorption capacity for
As(III) and Se(IV). Such similarities support the suggested chemical interactions
between SPION constituents and target oxyanions. Thus, in this system, the ion
exchange reaction is taking place for both elements and this is why the relatively

154
stronger acids corresponding to oxyanions of As(V) and Se(VI) have higher adsorption
and at lower pH value, since these oxyanions have higher concentrations under such
conditions. On the other hand, the acids corresponding to oxyanions of As(III) and
Se(IV) are much weaker acids, so their ionization take place at high pH values where
the competition with hydroxyl anions hinder their possibilities for adsorption on SPION
based adsorbent.
Moreover, by using sponge-SPION as adsorbent, the selenium continuous column
mode experiment show very similar adsorption-desorption properties as observed for
Arsenic oxyanions adsorption/desorption processes.
Therefore, it can be concluded that selenium adsorption by γ-Al2O3 nanosphere
represent a very different adsorption system behavior than that of SPION based
adsorption even if the thermodynamics show similar trend on the associated ∆H, so,
same temperature-dependence effect on adsorption process while the selenate/selenite
adsorption by sponge-SPION gives the same temperature impact and redox potential
effect as those with arsenate/arsenite adsorption properties by sponge-SPION.
3.4.1. SEM characterization
The surface morphology of sponge and sponge loaded with SPION were characterized
by SEM techniques. Figure 3.42 shows the SEM micrographs of the (a) Forager sponge
and (b) sponge loaded with SPION. It is observed that the sponge is porous and the
SPION is impregnated to penetrate inside of the sponge pores providing a complete
SPION layer on the sponge surface,33 which could be confirmed by the TEM results
reflected in the first part. In addition, these figures reveal the surface texture and
porosity of the blank and loaded adsorbent184. It can be seen from these figures that the
surface texture of the blank adsorbents changes drastically after the loading of SPION.

155
Fig3.42 Scanning electron microscopy(SEM) micrographs of sponge:(a) sponge;(b) sponge
loaded with SPION
3.4.2. pH effect on selenate and selenite adsorption
Once using the sponge loaded with SPION to adsorb the selenate and selenite, the pH
influence on selenate and selenite adsorption capacity has been studied between pH 2.0
and 11.0 (acetic/acetate media)(Fig 3.43a,b). The results obtained revealed that the
adsorption of both Se (IV) and Se (VI) are pH dependent. The observed pH effect
revealed the adsorption of Se (IV) is maximum at pH 2, while for Se (VI),the maximum
adsorption is at pH 3.6. The adsorption of selenium presents an anionic behavior,
decreasing at more alkaline pH values because of the competition of the hydroxyl
groups. In the case of Se(VI) the adsorption decreases as the percentage of the aqueous
species HSeO4- decreases. For sorption edge coincides with the predominance of
HSeO3-.
A comparison of the observed pH effect with those obtained on previous As (V)
adsorbent studies, e.g sponge loaded with SPION, revealed similar behavior with a
maximum adsorption at pH 3.6. This similarity supports that arsenic and selenium
species responsible of the adsorption are of the same type. The arsenic and selenium
oxyanions both show the ion-exchange with amine groups of the sponge and ligand
exchange with the SPION. The arsenate and selenate probably interact with the R-Fe-
OH by forming related ion pair.

156
a)
b)
Fig 3.43 pH effect on selenite adsorption capacity, adsorbent dosage=0.005g, contact time=6h,
the initial concentration of selenite is 1ppm.a) Se(IV), b) Se(VI)
3.4.3. Contact time effect on selenite and selenate adsorption
The results (shown in Fig 3.44) show that when sponge loaded with SPION as selenium
adsorbent, the adsorption capacity of SPION-sponge for selenate is much higher than
that for selenite. This can be interpreted as the anion exchange is more favorable to the
more free anion Selenate against the Selenite less ionized.The maximum adsorption for
0.0
0.5
1.0
1.5
2.0
2.5
3.0
0 2 4 6 8 10 12
adso
rpti
on
cap
acit
y(m
g/g)
pH
0.0
0.5
1.0
1.5
2.0
2.5
3.0
3.5
4.0
4.5
5.0
0 2 4 6 8 10 12
adso
rpti
on
cap
acit
y(m
g/g)
pH

157
selenate on sponge loaded with SPION was achieved at pH 3.6 in 1 hour under 20oC
and 6 hours under 70oC, respectively, while time for obtaining equilibrium of selenite
on sponge loaded with SPION needs 14 hours under 20oC and 24 hours under 70oC.
This result show very similar adsorption phenomenon, therefore sponge loaded with
SPION have better adsorption capacity for As(V) and Se(VI) and lower adsorption
capacity for As(III) and Se(IV) as a results of the different strength of related acids. The
thermodynamic parameters for the sorption of Se (VI) and Se (IV) indicate exothermic
behavior147. Which represents the similar thermodynamic properties as those of As(V)
and As(III). That means, the adsorption-desorption of Se(VI) and Se(IV) could be done
by tuning of the redox potential. Since the sponge loaded SPION has much higher
adsorption capacity for Se(VI) than that for Se(IV), therefore the transformation of
selenite to selenate could help the adsorption happen and reduction of selenate to
selenite could make the desorption to realize.
a)
0.00
0.01
0.02
0.03
0.04
0.05
0.06
0.07
0 500 1000 1500 2000 2500 3000 3500
adso
rpti
on
cap
acit
y(m
mo
l/g)
time(min)
Se(IV)
Se(VI)

158
b)
3.44 Contact time effect on selenium adsorption capacity, adsorbent dosage=0.005g, pH=2,
the initial concentration of selenium is 1 ppm: a) 20oC, b) 70oC
3.4.4. Adsorption kinetic study
Pseudo second order equation was fitted to the experimental data using a non-linear
regression method. This was accomplished by minimizing the respective coefficient of
determination between the experimental data and predicted values184. The best fit
values of qe and k2, along with the correlation coefficients R2 for the selenium adsorbed
by sponge loaded with SPION systems and the optimum values of the kinetic
parameters are given in Table .From the linear test regression presented in Figure 3.45,
it can be concluded that the experimental data fitted well the pseudo-second order
kinetics. The calculated correlation coefficients were also closer to unity for pseudo
second order kinetics, which indicated that chemical sorption is the rate controlling step,
as expected. Therefore, the sorption can be approximated more appropriately by the
pseudo second order kinetic model for the adsorption of Se (IV) and Se (VI) onto
sponge loaded with SPION. The equilibrium adsorption capacity of the sponge loaded
with SPION for selenate and selenite under 20oC were 0.96,1.16mg/g, respectively.
0.000
0.010
0.020
0.030
0.040
0.050
0.060
0.070
0 500 1000 1500 2000
adso
rpti
on
cap
acit
y(m
mo
l/g)
Time(min)
Se(IV)
Se(VI)

159
While under 70oC, the equilibrium adsorption capacity of adsorbent for selenate and
selenite were 1.61, 4.94mg/g, respectively.
a)
b)
Fig3.45 The pseudo second order adsorption kinetics for the selenium adsorption by sponge
loaded with SPION under (a) 20oC (b) 70oC.
0
10
20
30
40
50
60
70
0 20 40 60 80
t/q
t,m
in g
/mg
T,min
Se(IV)
Se(VI)
y = 0.6221x + 0.5529R² = 0.9999
y = 0.2024x + 2.1178R² = 0.9988
0.0
50.0
100.0
150.0
200.0
250.0
0 100 200 300 400
t/q
t m
in g
/mg
T,min
Se(IV)
Se(VI)

160
Table 3.18 Pseudo-second order kinetic constants for the adsorption of selenium oxyanions on
sponge loaded with SPION
K2(g/mg min) Qe (mg/g) R2
Se(IV) 20oC 0.50 1.0 0.9991
Se(VI) 20oC 0.03 5.2 0.9954
Se(IV) 70oC 0.70 1.6 0.9999
Se(VI) 70oC 0.02 4,9 0.9988
3.4.5. Column continuous mode
The column continuous mode of Se (VI) adsorption-desorption is shown in Fig 3.46
and Fig 3.47. The adsorption-desorption behavior of Se(VI) on sponge loaded with
SPION is very similar to that of As(V) on this adsorbent. The adsorption of the system
is very efficient. At the beginning, the Se (VI) concentration of elute solution is about
“zero”, under the detection limit of ICP-MS, which means the concentration for sure
will be lower than “10ppb”. The treated water is having Se level as low as the drinking
water, since it requires the standards of drinking water. After loading, the sponge loaded
with SPION may be saturated of Se (VI). Under this condition, the adsorbent could be
desorbed by tuning temperature or redox potential, as the same procedure as the one
used before for As (V) adsorption-desorption. The desorption shows the similar
behavior as those of sponge loaded with SPION for As (V) too. The desorption process
was performed under high temperature condition, in our case, we use 70oC hot water
for passing through the column. Once the high temperature atmosphere is stable (since
we use thermometer to monitor the temperature), the desorption experiment took place.

161
3.46 column continuous mode study, Se (VI) adsorption in column
3.47 Column continuous mode study, Se (VI) desorption in column
0
50
100
150
200
250
0 50 100 150
arse
nic
co
nce
ntr
atio
n(p
pm
)
No. of bed volume
0
200
400
600
800
1000
1200
0 20 40 60 80
arse
nic
co
nce
ntr
atio
n,p
pm
No. of bed volume

162

163

164

165
4. Conclusions
The results obtained in this work involve the development of methods to recover water
contaminants by adsorption processes and to regenerate and reuse the adsorbent.
Specifically, these methods are related to reagent-less processes for target pollutants
removal, providing thus and added value to the contaminated water treatment. In our
case, the methods concern with arsenic and selenium oxyanions removal in aqueous
solution. Methods are based on sorption-desorption processes for the indicated
oxyanions. Nanostructured materials have been implemented as adsorbent materials,
being either iron oxide nanoparticles or aluminum oxide nanospheres the active
adsorption substances. Influence of intensive thermodynamic parameters such as
aqueous solution Temperature and Redox potential have been investigated. Reagent-
less processes were developed, which allow the adsorption-desorption, adsorbent
regeneration, are based on thermodynamic parameters tuning. Synergic interaction of
thermo-tuning with redox variation will provide such results. It can be concluded that
the method of synergic thermo tuning of redox potential could save amount of reagent
for regenerating the adsorbent, therefore adsorbent recycling to be reused will
contribute to a cost efficient process.
4.1. Concept of temperature tuning on Arsenic oxyanions
adsorption-desorption by sponge loaded with SPION
4.1.1 Digital microscope has been used to observe the morphology of both the blank
sponge, sponge loaded with SPION before and after adsorption of target pollutant. TEM
characterization has been carried out to check the nanoparticle size and dispersion.
Superparamagnetic iron oxide nanoparticles are very easy to aggregate leading to a non
homogeneous distribution. After loading on the sponge, they observe homogenous
dispersion on the surface of the sponge that has porous structure. SPION particle size
are between 6-20nm.

166
4.1.2. The adsorption performance of SPION loaded sponge for arsenic oxyanions have
been evaluated by using both batch and column continuous mode. It can be concluded
that the sponge loaded with SPION has shown good adsorption capacity for arsenic
removal. Compared with other adsorbent previously reported in the literature, they
show better adsorption capacity, therefore can be considered as effective adsorbent for
arsenic removal from the contaminated effluents.
4.1.3. The adsorption capacities of SPION loaded sponge for arsenate/arsenite were
influenced by pH conditions of aqueous solutions, the adsorbent dosage, contact time
periods, and the initial arsenic oxyanion concentration as well as temperature . The
arsenic (V) oxyanion adsorption process and performance are pH dependent while
arsenic (III) is not. Related anion exchange process in on the basis to this behavior,
since for As(V) anionic species are present in the whole range of studied pH because
of its relative strong acid properties, while for As(III) they are only present at very high
pH because of the weak acid properties. In addition,the result shows that under 20oC,
the maximum adsorption for arsenate on sponge-SPION was obtained in an acid media
(pH 3.6) in 1 hour contact time as consequence of the arsenate acidic properties. Under
70oC, desorption process occurs as contact time increases, desorption equilibrium was
then gradually achieved with 2 hours. . The experimental data fitted well to the
Langmuir isotherm models. The maximum adsorption capacity of SPION loaded sponge for
arsenate removal by Langmuir isotherm model were 47.52mmol/g SPION on 20oC and
40.65mmol/g SPION on 70oC, respectively.
4.1.4. Thermodynamic parameters of related adsorption equilibrium have been
evaluated including the equilibrium constant Ka as well as Gibbs free energy. This value
shows the adsorption process to be favorable and spontaneous. The thermodynamic
affinity defined by log K=4.198 and log K=1.023 under 20oC and 70oC were
determined, respectively. Accordingly, the decrease in the negative value of ∆G° with
a decrease in temperature indicates that the adsorption process of As (V) on adsorbent

167
becomes more favorable at lower temperatures. The enthalpy change, ∆H°, and the
entropy change, ∆S°, were found to be -122.150 kJ mol-1 and 337 J mol-1 K-1,
respectively. The negative value of ∆H° indicates that the adsorption reaction is
exothermic. The positive value of ∆S° suggests that some structural changes occur on
the adsorbent, and the randomness at the solid/liquid interface in the adsorption system
increases during the adsorption process. Separation factor has very strong temperature
dependence. Higher temperature leads to a lower separation. Arsenic is, thus, found to
be more strongly adsorbed on the sponge -SPION under 20oC than that under 70oC
4.1.5. The effect of temperature on the adsorption of As (V) was also studied in the
continuous column mode by evaluating the adsorption at the temperature 10oC, 20oC
and 70oC. The adsorption phenomenon increases with the decrease of temperature.
Compared with previous work using Fe(III) loaded sponge, SPION loaded sponge has
a higher adsorption capacity for As(V) (expressed per mol of Fe on adsorbent).Thus,
for SPION the maximum adsorption capacity was found to be 11.455 mmol As/ mmol
Fe while the Fe(III) loaded sponge the maximum adsorption capacity was of 7.32mmol
As/mmol Fe.
4.1.6. All of the experimental and theoretical studies indicate that we can use the lower
temperature for adsorption and higher temperature for desorption, thereby it will
provide a new method for recovery of toxic element and regeneration of adsorbents
4.2. Application of Synergic thermo tunning of redox
potential for Arsenic removal
4.2.1. After the investigation of temperature influence on adsorption-desorption, the
redox potential effect on adsorption-desorption, adsorbent regeneration has been
evaluated. The potassium dichromate has been used to oxidize the As(III) to
As(V)(conversion rate>91%) and the Zn powder or Sn foil have been used to reduce
the As(V) to As(III)(conversion rate>90%). Since the adsorbent has remarkable

168
difference of adsorption capacity between As (V) and As (III), the adsorption-
desorption can be controlled by changing the oxidation state of As. For example, the
adsorbent can adsorb the arsenic by oxidizing all of the As (III) to As (V) and desorb
the arsenic by reducing the As (V) to As(III).
4.2.2. The sponge-SPION provides higher probability to interact with arsenate than
arsenite and react by anion exchange to the adsorption system. Thus arsenate has much
higher adsorption rate than arsenite. By changing the redox potential, the transform
between As(V) and As(III) will lead the adsorption-desorption process and cycling use
of the adsorbent. At the same time, the thermo tunning can help the adsorption-
desorption to be much more significant and much quicker.
4.2.3.Column experiments by using sponge-SPION presents an adsorption capacity of
0.167mmol/g sponge (21.64mmol/g SPION), almost twice of the obtained in batch
mode using the same sample.
4.2.4. Different dosage of adsorbent have revealed the adsorbent to be homogenous.
4.2.5. The results reflect that both temperature-controlling and reduction-tuning method
could make an efficient desorption process. The recovery rate of the arsenic adsorbed
in the sponge-SPION is high, showing 96.52% and 85.64% for temperature tuning
method and redox potential tuning method, respectively.
4.2.6. Once finishing the desorption process, the adsorbent can be used again for adsorb
arsenic oxyanions under room temperature. And then desorb the arsenic oxyanions by
using the reducing agent under 70oC again. The recycled method can be both technical
and economically efficient.
4.2.7. The real waste water treatment process reveal that almost all the arsenic present
in the first 50mL has been adsorbed in the SPION loaded sponge, although it has a lot
of interference elements. The calculated sponge capacity is about 1.25mmol As (V)/ g

169
SPION, considerable lower than in the synthetic solutions that is due to the interefering
ions present in the waste water.
4.3. Kinetic and Dynamic Aspects of Selenate and selenite
adsorption by γ-Al2O3 nanospheres
4.3.1. SEM images of fresh γ-Al2O3 nanospheres indicate that the material is composed
of individual, hollow-spherical particles ranging in size from 200 to 400nm that form
aggregates and chains .This small γ-Al2O3 nanospheres provides a larger surface area
for contaminant adsorption. The adsorption of selenium on the γ-Al2O3 nanospheres
did not influence the structure of the nanospheres.
4.3.2. Under 20oC, the maximum adsorption for selenate and selenite on γ-Al2O3
nanospheres was achieved at pH 2 in 6 hours, the adsorption of selenium presents an
hydrogen bridge forming complex, decreasing at higher pH values. In the case of Se
(VI) the sorption decreases as the percentage of the aqueous species HSeO4- decreases.
While for 70oC, the maximum adsorption was attained in 14 hours. The kinetic studies
show that they are fitted very well to the pseudo-second order, this suggests that
selenium ions were adsorbed onto the aluminum nanosphere surface via chemical
interaction. The adsorption of γ-Al2O3 nanosphere for selenate and selenite were fitted
very well to Frendlich isotherm model, which is indicated that the γ-Al2O3 nanosphere
as adsorbent was multilayer coverage by selenium. The ∆H value of Se (IV) and Se
(VI) between 20oC and 70oC were -13.955 KJ mol-1and -3.927 KJ mol-1 shows that
lower temperature favor removal of selenium.
4.3.3. It has demonstrated that Diethylammonium N,N-diethyldithiocarbamate DDC
modified γ-Al2O3 nanosphere has higher adsorption capacity for selenate. However,
during the pH range of 2.8-6.0, the γ-Al2O3 nanosphere has higher adsorption capacity
for selenite than adsorption capacity of DDC modified γ-Al2O3 nanosphere for selenite.

170
When pH>6.0, the phenomenon is opposite, the γ-Al2O3 nanosphere has lower
adsorption capacity for selenite than that of DDC modified γ-Al2O3 nanosphere for
selenite. The adsorption is occurring through a hydrogen bridge formation and it is
coherent with the behavior against the pH.
4.4. Kinetic and continuous mode Aspects of selenate and
selenite adsorption by sponge loaded with SPION
4.4.1. The SEM images shows that the sponge is porous and the SPION is impregnated
to penetrate inside of the sponge pores providing a complete SPION layer on the sponge
surface. In addition, the images reveal the surface texture and porosity of the blank and
loaded sponge184184. It can be seen that the surface texture of the blank adsorbents
changes drastically after the loading of SPION
4.4.2. The adsorption capacity of SPION-sponge for selenate is much higher than that
for selenite. The maximum adsorption for selenate and selenite on sponge loaded with
SPION was achieved at pH 3.6 in 1 hour under 20oC and 6 hours under 70oC,
respectively, while time for obtaining equilibrium of selenite needs 14 hours under 20oC
and 24 hours under 70oC. This result show very similar adsorption phenomenon,
therefore sponge loaded with SPION have better adsorption capacity for Se(VI) and
lower adsorption capacity for Se(IV).
4.4.3. The selenium continuous column mode experiment show very similar
adsorption-desorption properties by using sponge-SPION as adsorbent for arsenic.
Therefore it can be concluded that selenium adsorption by SPION loaded sponge
represent the same temperature-dependence effect on adsorption process while the
selenate/selenite adsorption by sponge-SPION gives the same temperature impact and
redox potential effect as those with a rsenate/arsenite adsorption properties by sponge-
SPION.

171
Future perspective
Considering the work included in the PhD thesis, the future research will be focused on
arsenic removal from the real waste water, which contains a lot of interference elements.
The problem should be solved in order to treat the real industrial contaminated aqueous
solution. The application of synergic thermo and redox potential tuning method for
recovering the metal and regenerating the adsorbent will be done under big continuous
mode for industrial water treatment, such as mining industry. The pilot plant should be
built up in order to analyze the adsorption-desorption processes and to confirm the
thermodynamic parameters tuning for the metal recovery and adsorbent regeneration
and reuse.
For the selenium adsorption, chemical modification, or combined with the formation of
new functional groups will improve the adsorption capacity of γ-Al2O3 nanospheres,
such as thiol groups. In addition, the interference ions effect on selenium removal
efficiency and adsorption capacity will be investigated. The concept of temperature
controlling and redox potential tuning for adsorbent regeneration will be applied to
selenium adsorption. The competing adsorption capacity of arsenic and selenium from
the combined aqueous solution which contain both arsenic and selenium will be studied.
The regeneration and reuse of the adsorbent should be further studied, pilot plant for
the waste water treatment should be built in order to apply the temperature and redox
potential tuning for toxic oxyanions removal.
The direct speciation method by using the synchrotron radiation techniques will be
applied to analyze the sponge loaded SPION for As(V)/As(III) and γ-Al2O3
nanospheres for Se(IV) and Se(VI)

172

173
References 1. Sun, H.-J.; Rathinasabapathi, B.; Wu, B.; Luo, J.; Pu, L.-P.; Ma, L. Q., Arsenic and selenium
toxicity and their interactive effects in humans. Environment international 2014, 69, 148-158.
2. Yang, L.; Shahrivari, Z.; Liu, P. K.; Sahimi, M.; Tsotsis, T. T., Removal of trace levels of arsenic
and selenium from aqueous solutions by calcined and uncalcined layered double hydroxides (LDH).
Industrial & Engineering Chemistry Research 2005, 44 (17), 6804-6815.
3. Scott, M. J., Kinetics of adsorption and redox processes on iron and manganese oxides: reactions
of As (III) and Se (IV) at goethite and birnessite surfaces. 1991.
4. Goh, K.-H.; Lim, T.-T., Geochemistry of inorganic arsenic and selenium in a tropical soil: effect of
reaction time, pH, and competitive anions on arsenic and selenium adsorption. Chemosphere 2004, 55
(6), 849-859.
5. Zaspalis, V.; Pagana, A.; Sklari, S., Arsenic removal from contaminated water by iron oxide
sorbents and porous ceramic membranes. Desalination 2007, 217 (1-3), 167-180.
6. Choong, T. S. Y.; Chuah, T. G.; Robiah, Y.; Gregory Koay, F. L.; Azni, I., Arsenic toxicity, health
hazards and removal techniques from water: an overview. Desalination 2007, 217 (1-3), 139-166.
7. Bissen, M.; Frimmel, F. H., Arsenic—a review. Part I: occurrence, toxicity, speciation, mobility.
Acta hydrochimica et hydrobiologica 2003, 31 (1), 9-18.
8. Zelmanov, G.; Semiat, R., Selenium removal from water and its recovery using iron (Fe3+)
oxide/hydroxide-based nanoparticles sol (NanoFe) as an adsorbent. Separation and Purification
Technology 2013, 103, 167-172.
9. El-Shafey, E., Sorption of Cd (II) and Se (IV) from aqueous solution using modified rice husk.
Journal of hazardous materials 2007, 147 (1), 546-555.
10. Clarke, S. E.; White, D.; Schaedel, A. L., Oregon, USA, ecological regions and subregions for water
quality management. Environmental Management 1991, 15 (6), 847-856.
11. Mohan, D.; Pittman, C. U., Arsenic removal from water/wastewater using adsorbents—a critical
review. Journal of hazardous materials 2007, 142 (1), 1-53.
12. Londesborough, S.; Mattusch, J.; Wennrich, R., Separation of organic and inorganic arsenic species
by HPLC-ICP-MS. Fresenius' journal of analytical chemistry 1999, 363 (5-6), 577-581.
13. Tchounwou, P., Development of Public Health Advisories for Arsenic in Drinking Water. Reviews
on environmental health 1999, 14 (4), 211-230.
14. Moon, K.; Guallar, E.; Navas-Acien, A., Arsenic exposure and cardiovascular disease: an updated
systematic review. Current atherosclerosis reports 2012, 14 (6), 542-555.
15. Jain, C.; Ali, I., Arsenic: occurrence, toxicity and speciation techniques. Water research 2000, 34
(17), 4304-4312.
16. Ferguson, J. F.; Gavis, J., A review of the arsenic cycle in natural waters. Water research 1972, 6
(11), 1259-1274.
17. Ensafi, A. A.; Ring, A. C.; Fritsch, I., Highly Sensitive Voltammetric Speciation and Determination
of Inorganic Arsenic in Water and Alloy Samples Using Ammonium 2‐ Amino‐ 1‐ Cyclopentene‐
1‐ Dithiocarboxylate. Electroanalysis 2010, 22 (11), 1175-1185.
18. Wu, Y.; Zhan, S.; Wang, F.; He, L.; Zhi, W.; Zhou, P., Cationic polymers and aptamers mediated
aggregation of gold nanoparticles for the colorimetric detection of arsenic (III) in aqueous solution.
Chemical communications 2012, 48 (37), 4459-4461.

174
19. Zhang, P.; Sparks, D. L., Kinetics of selenate and selenite adsorption/desorption at the
goethite/water interface. Environmental Science & Technology 1990, 24 (12), 1848-1856.
20. Rosenfeld, I.; Beath, O. A., Selenium: geobotany, biochemistry, toxicity, and nutrition. Academic
Press: 2013.
21. Goldhaber, S. B., Trace element risk assessment: essentiality vs. toxicity. Regulatory Toxicology
and Pharmacology 2003, 38 (2), 232-242.
22. Min, J. H.; Hering, J. G., Removal of selenite and chromate using iron (III)-doped alginate gels.
Water environment research 1999, 71 (2), 169-175.
23. Sheoran, A.; Sheoran, V., Heavy metal removal mechanism of acid mine drainage in wetlands: a
critical review. Minerals engineering 2006, 19 (2), 105-116.
24. McLennan, S.; Taylor, S., The continental crust: its composition and evolution. An Examination of
the Geochemical Record Preserved in Sedimentary Rocks, Oxford, Blackwell Scientific, Palo Alto, Calif
1985.
25. Mackenzie, F. T.; Lantzy, R. J.; Paterson, V., Global trace metal cycles and predictions. Journal of
the International Association for Mathematical Geology 1979, 11 (2), 99-142.
26. Merian, E., Metals and their compounds in the environment: occurrence, analysis and biological
relevance. VCH Verlagsgesellschaft mbH: 1991.
27. Košutić, K.; Furač, L.; Sipos, L.; Kunst, B., Removal of arsenic and pesticides from drinking water
by nanofiltration membranes. Separation and Purification Technology 2005, 42 (2), 137-144.
28. Chapman, P. M.; Adams, W. J.; Brooks, M.; Delos, C. G.; Luoma, S. N.; Maher, W. A.; Ohlendorf,
H. M.; Presser, T. S.; Shaw, P., Ecological assessment of selenium in the aquatic environment. CRC
Press: 2010.
29. Fordyce, F. M., Selenium deficiency and toxicity in the environment. Springer: 2013.
30. Stolz, J. F.; Basu, P.; Santini, J. M.; Oremland, R. S., Arsenic and Selenium in Microbial
Metabolism*. Annu. Rev. Microbiol. 2006, 60, 107-130.
31. Nriagu, J. O., Arsenic in the environment: Part I: Cycling and characterization. J. Wiley: 1994.
32. Clifford, D.; Lin, C.-C. In Ion exchange, activated alumina, and membrane processes for arsenic
removal from groundwater, Proceedings of the 45th Annual Environmental Engineering Conference,
University of Kansas, 1995.
33. Morillo Martín, D.; Valiente Malmagro, M.; Pérez González, G., Superparamagnetic iron oxide
nanoparticles as arsenic adsorbent. 2014.
34. Scott, M. J.; Morgan, J. J., Reactions at oxide surfaces. 1. Oxidation of As (III) by synthetic
birnessite. Environmental Science & Technology 1995, 29 (8), 1898-1905.
35. Wood, S. A.; Tait, C. D.; Janecky, D. R., A Raman spectroscopic study of arsenite and thioarsenite
species in aqueous solution at 25 C. Geochemical Transactions 2002, 3 (4), 31.
36. Muñoz, J. A.; Gonzalo, A.; Valiente, M., Arsenic adsorption by Fe (III)-loaded open-celled
cellulose sponge. Thermodynamic and selectivity aspects. Environmental science & technology 2002,
36 (15), 3405-3411.
37. Elleouet, C.; Quentel, F.; Madec, C., Determination of inorganic and organic selenium species in
natural waters by cathodic stripping voltammetry. Water research 1996, 30 (4), 909-914.
38. Peak, D.; Sparks, D., Mechanisms of selenate adsorption on iron oxides and hydroxides.
Environmental science & technology 2002, 36 (7), 1460-1466.
39. Shriver, D. F.; Atkins, P. W.; Langford, C. H., Química inorgánica. II. Reverté: 1998; Vol. 2.

175
40. Peak, D., Adsorption mechanisms of selenium oxyanions at the aluminum oxide/water interface.
Journal of colloid and interface science 2006, 303 (2), 337-345.
41. Blaylock, M. J.; James, B. R., Redox transformations and plant uptake of selenium resulting from
root-soil interactions. Plant and soil 1994, 158 (1), 1-12.
42. Misra, M.; Nayak, D. C., Process for removal of selenium and arsenic from aqueous streams.
Google Patents: 1997.
43. Misra, M.; Nanor, J.; Priyadarshan, G., Process for removal and stabilization of arsenic and
selenium from aqueous streams and slurries. Google Patents: 2001.
44. O'neill, G. A.; Novak, J. W.; Martin, E. S., Method for removing arsenic or selenium from an
aqueous solution containing a substantial background of another contaminant. Google Patents: 1990.
45. Jeon, C. S.; Baek, K.; Park, J. K.; Oh, Y. K.; Lee, S. D., Adsorption characteristics of As(V) on
iron-coated zeolite. Journal of hazardous materials 2009, 163 (2-3), 804-8.
46. Kartinen, E. O.; Martin, C. J., An overview of arsenic removal processes. Desalination 1995, 103
(1), 79-88.
47. Masscheleyn, P. H.; Delaune, R. D.; Patrick Jr, W. H., Effect of redox potential and pH on arsenic
speciation and solubility in a contaminated soil. Environmental Science & Technology 1991, 25 (8),
1414-1419.
48. Ruthven, D. M., Principles of adsorption and adsorption processes. John Wiley & Sons: 1984.
49. Mills, G.; Jónsson, H., Quantum and thermal effects in H 2 dissociative adsorption: Evaluation of
free energy barriers in multidimensional quantum systems. Physical review letters 1994, 72 (7), 1124.
50. Manning, B. A.; Goldberg, S., Modeling competitive adsorption of arsenate with phosphate and
molybdate on oxide minerals. Soil Science Society of America Journal 1996, 60 (1), 121-131.
51. Xu, Y.-h.; Nakajima, T.; Ohki, A., Adsorption and removal of arsenic (V) from drinking water by
aluminum-loaded Shirasu-zeolite. Journal of hazardous materials 2002, 92 (3), 275-287.
52. Tokunaga, S.; Wasay, S. A.; Park, S.-W., Removal of arsenic (V) ion from aqueous solutions by
lanthanum compounds. Water Science and Technology 1997, 35 (7), 71-78.
53. Diamadopoulos, E.; Ioannidis, S.; Sakellaropoulos, G. P., As (V) removal from aqueous solutions
by fly ash. Water research 1993, 27 (12), 1773-1777.
54. Elizalde-González, M.; Mattusch, J.; Einicke, W.-D.; Wennrich, R., Sorption on natural solids for
arsenic removal. Chemical Engineering Journal 2001, 81 (1), 187-195.
55. Fendorf, S.; Eick, M. J.; Grossl, P.; Sparks, D. L., Arsenate and chromate retention mechanisms on
goethite. 1. Surface structure. Environmental science & technology 1997, 31 (2), 315-320.
56. Giménez, J.; Martínez, M.; de Pablo, J.; Rovira, M.; Duro, L., Arsenic sorption onto natural
hematite, magnetite, and goethite. Journal of hazardous materials 2007, 141 (3), 575-580.
57. Richmond, W. R.; Loan, M.; Morton, J.; Parkinson, G. M., Arsenic removal from aqueous solution
via ferrihydrite crystallization control. Environmental science & technology 2004, 38 (8), 2368-2372.
58. Zeng, L., A method for preparing silica-containing iron (III) oxide adsorbents for arsenic removal.
Water research 2003, 37 (18), 4351-4358.
59. Payne, K. B.; Abdel-Fattah, T. M., Adsorption of arsenate and arsenite by iron-treated activated
carbon and zeolites: effects of pH, temperature, and ionic strength. Journal of Environmental Science
and Health 2005, 40 (4), 723-749.
60. Zhang, Y.; Yang, M.; Huang, X., Arsenic (V) removal with a Ce (IV)-doped iron oxide adsorbent.
Chemosphere 2003, 51 (9), 945-952.

176
61. Joshi, A.; Chaudhuri, M., Removal of arsenic from ground water by iron oxide-coated sand. Journal
of environmental engineering 1996, 122 (8), 769-771.
62. Meng, X.; Bang, S.; Korfiatis, G. P., Effects of silicate, sulfate, and carbonate on arsenic removal
by ferric chloride. Water research 2000, 34 (4), 1255-1261.
63. Min, J. H.; Hering, J. G., Arsenate sorption by Fe (III)-doped alginate gels. Water research 1998,
32 (5), 1544-1552.
64. Chandra, V.; Park, J.; Chun, Y.; Lee, J. W.; Hwang, I.-C.; Kim, K. S., Water-dispersible magnetite-
reduced graphene oxide composites for arsenic removal. ACS nano 2010, 4 (7), 3979-3986.
65. Katsoyiannis, I. A.; Zouboulis, A. I., Removal of arsenic from contaminated water sources by
sorption onto iron-oxide-coated polymeric materials. Water research 2002, 36 (20), 5141-5155.
66. Rau, I.; Gonzalo, A.; Valiente, M., Arsenic (V) removal from aqueous solutions by iron (III) loaded
chelating resin. Journal of Radioanalytical and Nuclear Chemistry 2000, 246 (3), 597-600.
67. Saiz, J.; Bringas, E.; Ortiz, I., Functionalized magnetic nanoparticles as new adsorption materials
for arsenic removal from polluted waters. Journal of Chemical Technology and Biotechnology 2014, 89
(6), 909-918.
68. Gupta, A.; Chauhan, V. S.; Sankararamakrishnan, N., Preparation and evaluation of iron–chitosan
composites for removal of As (III) and As (V) from arsenic contaminated real life groundwater. Water
research 2009, 43 (15), 3862-3870.
69. Hlavay, J.; Polyák, K., Determination of surface properties of iron hydroxide-coated alumina
adsorbent prepared for removal of arsenic from drinking water. Journal of colloid and interface science
2005, 284 (1), 71-77.
70. Sarı, A.; Uluozlü, Ö. D.; Tüzen, M., Equilibrium, thermodynamic and kinetic investigations on
biosorption of arsenic from aqueous solution by algae (Maugeotia genuflexa) biomass. Chemical
Engineering Journal 2011, 167 (1), 155-161.
71. Chen, W.; Parette, R.; Zou, J.; Cannon, F. S.; Dempsey, B. A., Arsenic removal by iron-modified
activated carbon. Water research 2007, 41 (9), 1851-1858.
72. Maliyekkal, S. M.; Philip, L.; Pradeep, T., As (III) removal from drinking water using manganese
oxide-coated-alumina: performance evaluation and mechanistic details of surface binding. Chemical
Engineering Journal 2009, 153 (1), 101-107.
73. Kim, Y.; Kim, C.; Choi, I.; Rengaraj, S.; Yi, J., Arsenic removal using mesoporous alumina
prepared via a templating method. Environmental science & technology 2004, 38 (3), 924-931.
74. Matsunaga, H.; Yokoyama, T.; Eldridge, R. J.; Bolto, B. A., Adsorption characteristics of arsenic
(III) and arsenic (V) on iron (III)-loaded chelating resin having lysine-N α, N α-diacetic acid moiety.
Reactive and functional polymers 1996, 29 (3), 167-174.
75. Cao, C.-Y.; Qu, J.; Yan, W.-S.; Zhu, J.-F.; Wu, Z.-Y.; Song, W.-G., Low-cost synthesis of
flowerlike α-Fe2O3 nanostructures for heavy metal ion removal: adsorption property and mechanism.
Langmuir : the ACS journal of surfaces and colloids 2012, 28 (9), 4573-4579.
76. Tuutijärvi, T.; Lu, J.; Sillanpää, M.; Chen, G., As (V) adsorption on maghemite nanoparticles.
Journal of hazardous materials 2009, 166 (2), 1415-1420.
77. Hsia, T.-H.; Lo, S.-L.; Lin, C.-F.; Lee, D.-Y., Characterization of arsenate adsorption on hydrous
iron oxide using chemical and physical methods. Colloids and Surfaces A: Physicochemical and
Engineering Aspects 1994, 85 (1), 1-7.

177
78. Sun, Y.-P.; Li, X.-Q.; Zhang, W.-X.; Wang, H. P., A method for the preparation of stable dispersion
of zero-valent iron nanoparticles. Colloids and Surfaces A: Physicochemical and Engineering Aspects
2007, 308 (1), 60-66.
79. Pradeep, T., Noble metal nanoparticles for water purification: a critical review. Thin solid films
2009, 517 (24), 6441-6478.
80. Chowdhury, S. R.; Yanful, E. K., Arsenic and chromium removal by mixed magnetite–maghemite
nanoparticles and the effect of phosphate on removal. Journal of environmental management 2010, 91
(11), 2238-2247.
81. Cao, C.-Y.; Qu, J.; Wei, F.; Liu, H.; Song, W.-G., Superb adsorption capacity and mechanism of
flowerlike magnesium oxide nanostructures for lead and cadmium ions. ACS applied materials &
interfaces 2012, 4 (8), 4283-4287.
82. Morillo, D.; Uheida, A.; Pérez, G.; Muhammed, M.; Valiente, M., Arsenate removal with 3-
mercaptopropanoic acid-coated superparamagnetic iron oxide nanoparticles. Journal of colloid and
interface science 2015, 438, 227-234.
83. Xu, P.; Zeng, G. M.; Huang, D. L.; Feng, C. L.; Hu, S.; Zhao, M. H.; Lai, C.; Wei, Z.; Huang, C.;
Xie, G. X., Use of iron oxide nanomaterials in wastewater treatment: a review. Science of the Total
Environment 2012, 424, 1-10.
84. Feng, L.; Cao, M.; Ma, X.; Zhu, Y.; Hu, C., Corrigendum to “Superparamagnetic high-surface-area
Fe3O4 nanoparticles as adsorbents for arsenic removal”[J. Hazard. Mater. 217–218 (2012) 439–446].
Journal of hazardous materials 2012, (227-228), 484.
85. Mondal, K.; Jegadeesan, G.; Lalvani, S. B., Removal of selenate by Fe and NiFe nanosized particles.
Industrial & engineering chemistry research 2004, 43 (16), 4922-4934.
86. Sanguansri, P.; Augustin, M. A., Nanoscale materials development–a food industry perspective.
Trends in Food Science & Technology 2006, 17 (10), 547-556.
87. Salamanca-Buentello, F.; Persad, D. L.; Court, E. B.; Martin, D. K.; Daar, A. S.; Singer, P. A.,
Nanotechnology and the developing world. PLoS Medicine 2005, 2 (5), 383.
88. (a) Gupta, A. K.; Gupta, M., Synthesis and surface engineering of iron oxide nanoparticles for
biomedical applications. Biomaterials 2005, 26 (18), 3995-4021; (b) Moghimi, S. M.; Hunter, A. C.;
Murray, J. C., Long-circulating and target-specific nanoparticles: theory to practice. Pharmacological
reviews 2001, 53 (2), 283-318.
89. Theron, J.; Walker, J. A.; Cloete, T. E., Nanotechnology and water treatment: applications and
emerging opportunities. Critical reviews in microbiology 2008, 34 (1), 43-69.
90. Mahmoudi, M.; Laurent, S.; Shokrgozar, M. A.; Hosseinkhani, M., Toxicity evaluations of
superparamagnetic iron oxide nanoparticles: cell “vision” versus physicochemical properties of
nanoparticles. ACS nano 2011, 5 (9), 7263-7276.
91. Martin, C. R.; Mitchell, D. T., Peer reviewed: nanomaterials in analytical chemistry. Analytical
chemistry 1998, 70 (9), 322A-327A.
92. Hristovski, K.; Baumgardner, A.; Westerhoff, P., Selecting metal oxide nanomaterials for arsenic
removal in fixed bed columns: from nanopowders to aggregated nanoparticle media. Journal of
hazardous materials 2007, 147 (1), 265-274.
93. Mahmoudi, M.; Sant, S.; Wang, B.; Laurent, S.; Sen, T., Superparamagnetic iron oxide
nanoparticles (SPIONs): development, surface modification and applications in chemotherapy.
Advanced drug delivery reviews 2011, 63 (1), 24-46.

178
94. Alonso González, A.; Muñoz Tapia, M.; Muraviev, D., Development of polymeric nanocomposites
with enhanced distribution of catalytically active or bactericide nanoparticles. 2012.
95. Spanier, J. E.; Robinson, R. D.; Zhang, F.; Chan, S.-W.; Herman, I. P., Size-dependent properties
of CeO 2− y nanoparticles as studied by Raman scattering. Physical Review B 2001, 64 (24), 245407.
96. Auffan, M.; Rose, J.; Bottero, J.-Y.; Lowry, G. V.; Jolivet, J.-P.; Wiesner, M. R., Towards a
definition of inorganic nanoparticles from an environmental, health and safety perspective. Nature
nanotechnology 2009, 4 (10), 634-641.
97. Salata, O. V., Applications of nanoparticles in biology and medicine. Journal of nanobiotechnology
2004, 2 (1), 3.
98. Carnes, C. L.; Klabunde, K. J., Synthesis, isolation, and chemical reactivity studies of
nanocrystalline zinc oxide. Langmuir : the ACS journal of surfaces and colloids 2000, 16 (8), 3764-3772.
99. Nata, I. F.; Sureshkumar, M.; Lee, C.-K., One-pot preparation of amine-rich magnetite/bacterial
cellulose nanocomposite and its application for arsenate removal. RSC Advances 2011, 1 (4), 625-631.
100. Yu, X.; Tong, S.; Ge, M.; Zuo, J.; Cao, C.; Song, W., One-step synthesis of magnetic composites
of cellulose@ iron oxide nanoparticles for arsenic removal. Journal of Materials Chemistry A 2013, 1
(3), 959-965.
101. Afkhami, A.; Saber-Tehrani, M.; Bagheri, H., Modified maghemite nanoparticles as an efficient
adsorbent for removing some cationic dyes from aqueous solution. Desalination 2010, 263 (1), 240-248.
102. Kodama, R., Magnetic nanoparticles. Journal of magnetism and magnetic materials 1999, 200 (1),
359-372.
103. Pankhurst, Q. A.; Connolly, J.; Jones, S.; Dobson, J., Applications of magnetic nanoparticles in
biomedicine. Journal of physics D: Applied physics 2003, 36 (13), R167.
104. hysteresis loop of a ferromagnetic material. http://what-when-how.com/electronic-properties-of-
materials/magnetic-phenomena-and-their-interpretationclassical-approach-magnetic-properties-of-
materials-part-1/.
105. Lu, A. H.; Salabas, E. e. L.; Schüth, F., Magnetic nanoparticles: synthesis, protection,
functionalization, and application. Angewandte Chemie International Edition 2007, 46 (8), 1222-1244.
106. Mishima, N.; Petrosky, T. Y.; Minowa, H.; Goto, S., Model experiment of two‐ dimensional
Brownian motion by microcomputer. American Journal of Physics 1980, 48 (12), 1050-1055.
107. Shen, T.; Weissleder, R.; Papisov, M.; Bogdanov, A.; Brady, T. J., Monocrystalline iron oxide
nanocompounds (MION): physicochemical properties. Magnetic Resonance in Medicine 1993, 29 (5),
599-604.
108. Gittleman, J.; Abeles, B.; Bozowski, S., Superparamagnetism and relaxation effects in granular Ni-
Si O 2 and Ni-Al 2 O 3 films. Physical review B 1974, 9 (9), 3891.
109. Ren, T.-Z.; Yuan, Z.-Y.; Su, B.-L., Microwave-assisted preparation of hierarchical mesoporous-
macroporous boehmite AlOOH and γ-Al2O3. Langmuir : the ACS journal of surfaces and colloids 2004,
20 (4), 1531-1534.
110. Hu, Y.; Li, C.; Gu, F.; Ma, J., Preparation and formation mechanism of alumina hollow nanospheres
via high-speed jet flame combustion. Industrial & Engineering Chemistry Research 2007, 46 (24), 8004-
8008.
111. Zhang, L.; Zhu, Y.-J., Microwave-assisted solvothermal synthesis of AlOOH hierarchically
nanostructured microspheres and their transformation to γ-Al2O3 with similar morphologies. The
Journal of Physical Chemistry C 2008, 112 (43), 16764-16768.

179
112. Van Bruggen, M., Preparation and properties of colloidal core-shell rods with adjustable aspect
ratios. Langmuir : the ACS journal of surfaces and colloids 1998, 14 (9), 2245-2255.
113. Feng, Y.; Lu, W.; Zhang, L.; Bao, X.; Yue, B.; lv, Y.; Shang, X., One-step synthesis of hierarchical
cantaloupe-like AlOOH superstructures via a hydrothermal route. Crystal Growth and Design 2008, 8
(4), 1426-1429.
114. Lu, C.; Lv, J.; Xu, L.; Guo, X.; Hou, W.; Hu, Y.; Huang, H., Crystalline nanotubes of γ-AlOOH
and γ-Al2O3: hydrothermal synthesis, formation mechanism and catalytic performance. Nanotechnology
2009, 20 (21), 215604.
115. Tang, B.; Ge, J.; Zhuo, L.; Wang, G.; Niu, J.; Shi, Z.; Dong, Y., A Facile and Controllable Synthesis
of γ‐ Al2O3 Nanostructures without a Surfactant. European journal of inorganic chemistry 2005, 2005
(21), 4366-4369.
116. Zhang, M.; Lu, Y.; Chen, J.-F.; Zhang, T.-K.; Liu, Y.-Y.; Yang, Y.; Yao, W.-T.; Yu, S.-H.,
Selective Synthesis of Zn1− x Mn x Se Nanobelts and Nanotubes from [Zn1− x Mn x Se](DETA) 0.5
Nanbelts in Solution (x= 0− 0.15) and Their EPR and Optical Properties. Langmuir : the ACS journal of
surfaces and colloids 2010, 26 (15), 12882-12889.
117. Zhu, H. Y.; Riches, J. D.; Barry, J. C., γ-alumina nanofibers prepared from aluminum hydrate with
poly (ethylene oxide) surfactant. Chemistry of Materials 2002, 14 (5), 2086-2093.
118. Ma, D.; Zhang, J.; Hu, X.; Zhou, H.; Qian, Y., Surfactant-assisted hydrothermal route to
organometallic tris (8-hydroxyquinoline) aluminum nanorod bundles. Chemistry Letters 2007, 36 (5),
630-631.
119. Hazama, K.; Nakamura, Y.; Nittono, O., Growth of aluminum whiskers below the melting point of
aluminum. Japanese journal of applied physics 1988, 27 (7R), 1142.
120. Zhang, H.; Zhang, L.; Han, L.; Shen, S.; Lu, W., Synthesis, Characterization and Growth
Mechanism of Hierarchical Cantaloupe-Like AlOOH Superstructures by a Simple Hydrothermal Process.
Integrated Ferroelectrics 2011, 129 (1), 111-121.
121. Kuang, D.; Fang, Y.; Liu, H.; Frommen, C.; Fenske, D., Fabrication of boehmite AlOOH and γ-Al
2 O 3 nanotubes via a soft solution route. Journal of Materials Chemistry 2003, 13 (4), 660-662.
122. Rong, C.-b.; Li, D.; Nandwana, V.; Poudyal, N.; Ding, Y.; Wang, Z. L.; Zeng, H.; Liu, J. P., Size‐
dependent chemical and magnetic ordering in L10‐ FePt nanoparticles. Advanced Materials 2006, 18
(22), 2984-2988.
123. Luther, S.; Borgfeld, N.; Kim, J.; Parsons, J., Removal of arsenic from aqueous solution: a study of
the effects of pH and interfering ions using iron oxide nanomaterials. Microchemical Journal 2012, 101,
30-36.
124. Wu, Z.; Li, W.; Webley, P. A.; Zhao, D., General and controllable synthesis of novel mesoporous
magnetic iron oxide@ carbon encapsulates for efficient arsenic removal. Advanced Materials 2012, 24
(4), 485-491.
125. Jin, Z.; Pramoda, K.; Xu, G.; Goh, S. H., Dynamic mechanical behavior of melt-processed multi-
walled carbon nanotube/poly (methyl methacrylate) composites. Chemical Physics Letters 2001, 337 (1),
43-47.
126. Stankovich, S.; Dikin, D. A.; Piner, R. D.; Kohlhaas, K. A.; Kleinhammes, A.; Jia, Y.; Wu, Y.;
Nguyen, S. T.; Ruoff, R. S., Synthesis of graphene-based nanosheets via chemical reduction of exfoliated
graphite oxide. Carbon 2007, 45 (7), 1558-1565.

180
127. Hua, Z.; Zhou, S.; Zhao, M., Fabrication of a surface imprinted hydrogel shell over silica
microspheres using bovine serum albumin as a model protein template. Biosensors and Bioelectronics
2009, 25 (3), 615-622.
128. Olsson, R. T.; Kraemer, R.; Lopez-Rubio, A.; Torres-Giner, S.; Ocio, M. J.; Lagarón, J. M.,
Extraction of microfibrils from bacterial cellulose networks for electrospinning of anisotropic biohybrid
fiber yarns. Macromolecules 2010, 43 (9), 4201-4209.
129. Zhao, Y.; Li, F.; Zhang, R.; Evans, D. G.; Duan, X., Preparation of layered double-hydroxide
nanomaterials with a uniform crystallite size using a new method involving separate nucleation and aging
steps. Chemistry of Materials 2002, 14 (10), 4286-4291.
130. Ho, Y.-S., Review of second-order models for adsorption systems. Journal of hazardous materials
2006, 136 (3), 681-689.
131. Qiu, H.; Lv, L.; Pan, B.-c.; Zhang, Q.-j.; Zhang, W.-m.; Zhang, Q.-x., Critical review in adsorption
kinetic models. Journal of Zhejiang University Science A 2009, 10 (5), 716-724.
132. Yuh-Shan, H., Citation review of Lagergren kinetic rate equation on adsorption reactions.
Scientometrics 2004, 59 (1), 171-177.
133. Boparai, H. K.; Joseph, M.; O’Carroll, D. M., Kinetics and thermodynamics of cadmium ion
removal by adsorption onto nano zerovalent iron particles. Journal of hazardous materials 2011, 186 (1),
458-465.
134. Saiers, J. E.; Hornberger, G. M.; Liang, L., First‐ and second‐ order kinetics approaches for
modeling the transport of colloidal particles in porous media. Water Resources Research 1994, 30 (9),
2499-2506.
135. Ho, Y.-S.; McKay, G., The kinetics of sorption of divalent metal ions onto sphagnum moss peat.
Water research 2000, 34 (3), 735-742.
136. Cruz, C. C.; da Costa, A. C. A.; Henriques, C. A.; Luna, A. S., Kinetic modeling and equilibrium
studies during cadmium biosorption by dead Sargassum sp. biomass. Bioresource technology 2004, 91
(3), 249-257.
137. Limousin, G.; Gaudet, J.-P.; Charlet, L.; Szenknect, S.; Barthes, V.; Krimissa, M., Sorption
isotherms: a review on physical bases, modeling and measurement. Applied Geochemistry 2007, 22 (2),
249-275.
138. Foo, K.; Hameed, B., Insights into the modeling of adsorption isotherm systems. Chemical
Engineering Journal 2010, 156 (1), 2-10.
139. Aksu, Z., Equilibrium and kinetic modelling of cadmium (II) biosorption by C. vulgaris in a batch
system: effect of temperature. Separation and Purification Technology 2001, 21 (3), 285-294.
140. Swain, S. K.; Patnaik, T.; Singh, V. K.; Jha, U.; Patel, R. K.; Dey, R. K., Kinetics, equilibrium and
thermodynamic aspects of removal of fluoride from drinking water using meso-structured zirconium
phosphate. Chemical Engineering Journal 2011, 171 (3), 1218-1226.
141. Banerjee, K.; Amy, G. L.; Prevost, M.; Nour, S.; Jekel, M.; Gallagher, P. M.; Blumenschein, C. D.,
Kinetic and thermodynamic aspects of adsorption of arsenic onto granular ferric hydroxide (GFH). Water
research 2008, 42 (13), 3371-3378.
142. Singh, T. S.; Pant, K., Equilibrium, kinetics and thermodynamic studies for adsorption of As (III)
on activated alumina. Separation and Purification Technology 2004, 36 (2), 139-147.

181
143. Salameh, Y.; Al-Lagtah, N.; Ahmad, M.; Allen, S.; Walker, G., Kinetic and thermodynamic
investigations on arsenic adsorption onto dolomitic sorbents. Chemical Engineering Journal 2010, 160
(2), 440-446.
144. Altundoğan, H. S.; Altundoğan, S.; Tümen, F.; Bildik, M., Arsenic adsorption from aqueous
solutions by activated red mud. Waste Management 2002, 22 (3), 357-363.
145. Zhang, L.; Liu, N.; Yang, L.; Lin, Q., Sorption behavior of nano-TiO 2 for the removal of selenium
ions from aqueous solution. Journal of hazardous materials 2009, 170 (2), 1197-1203.
146. Tuzen, M.; Sarı, A., Biosorption of selenium from aqueous solution by green algae (Cladophora
hutchinsiae) biomass: equilibrium, thermodynamic and kinetic studies. Chemical Engineering Journal
2010, 158 (2), 200-206.
147. Kamaraj, R.; Vasudevan, S., Decontamination of selenate from aqueous solution by oxidized multi-
walled carbon nanotubes. Powder Technology 2015, 274, 268-275.
148. Calmano, W.; Hong, J.; Förstner, U., Binding and mobilization of heavy metals in contaminated
sediments affected by pH and redox potential. 1993.
149. Tuutijärvi, T.; Vahala, R.; Sillanpää, M.; Chen, G., Maghemite nanoparticles for As (V) removal:
desorption characteristics and adsorbent recovery. Environmental technology 2012, 33 (16), 1927-1936.
150. Haiss, W.; Thanh, N. T.; Aveyard, J.; Fernig, D. G., Determination of size and concentration of
gold nanoparticles from UV-vis spectra. Analytical chemistry 2007, 79 (11), 4215-4221.
151. Volkamer, R.; Spietz, P.; Burrows, J.; Platt, U., High-resolution absorption cross-section of glyoxal
in the UV–vis and IR spectral ranges. Journal of Photochemistry and Photobiology A: Chemistry 2005,
172 (1), 35-46.
152. Culbertson, C. T.; Jorgenson, J. W., Lowering the UV absorbance detection limit in capillary zone
electrophoresis using a single linear photodiode array detector. Analytical chemistry 1998, 70 (13), 2629-
2638.
153. Dhar, R. K.; Zheng, Y.; Rubenstone, J.; van Geen, A., A rapid colorimetric method for measuring
arsenic concentrations in groundwater. Analytica chimica acta 2004, 526 (2), 203-209.
154. <As(V) Color.pdf>.
155. Mays, D. E.; Hussam, A., Voltammetric methods for determination and speciation of inorganic
arsenic in the environment—a review. Analytica chimica acta 2009, 646 (1), 6-16.
156. Dhar, R.; Zheng, Y.; Rubenstone, J.; Van Geen, A., A rapid colorimetric method for measuring
arsenic concentrations in groundwater. Analytica chimica acta 2004, 526 (2), 203-209.
157. Stratton, G.; Whitehead, H. C., Colorimetric determination of arsenic in water with silver
diethyldithiocarbamate. Journal (American Water Works Association) 1962, 861-864.
158. Jenner, G.; Longerich, H.; Jackson, S.; Fryer, B., ICP-MS—a powerful tool for high-precision trace-
element analysis in earth sciences: evidence from analysis of selected USGS reference samples.
Chemical Geology 1990, 83 (1), 133-148.
159. Field, M. P.; Sherrell, R. M., Direct determination of ultra-trace levels of metals in fresh water using
desolvating micronebulization and HR-ICP-MS: application to Lake Superior waters. Journal of
Analytical Atomic Spectrometry 2003, 18 (3), 254-259.
160. Stetzenbach, K. J.; Amano, M.; Kreamer, D. K.; Hodge, V. F., Testing the Limits of ICP‐ MS:
Determination of Trace Elements in Ground Water at the Part‐ Per‐ Trillion Level. Groundwater 1994,
32 (6), 976-985.
161. Elmer, P., The 30-minute Guide to ICP-MS. Perkin Elmer, Shelton CT 2001.

182
162. Larsen, E. H.; Stürup, S., Carbon-enhanced inductively coupled plasma mass spectrometric
detection of arsenic and selenium and its application to arsenic speciation. Journal of Analytical Atomic
Spectrometry 1994, 9 (10), 1099-1105.
163. Thomas, R., Practical guide to ICP-MS: a tutorial for beginners. CRC press: 2013.
164. Mahmoudi, M.; Sant, S.; Wang, B.; Laurent, S.; Sen, T., Superparamagnetic iron oxide
nanoparticles (SPIONs): development, surface modification and applications in chemotherapy.
Advanced drug delivery reviews 2011, 63 (1-2), 24-46.
165. Cai, W.; Yu, J.; Mann, S., Template-free hydrothermal fabrication of hierarchically organized γ-
AlOOH hollow microspheres. Microporous and Mesoporous Materials 2009, 122 (1), 42-47.
166. Kamsonlian, S.; Suresh, S.; Ramanaiah, V.; Majumder, C.; Chand, S.; Kumar, A., Biosorptive
behaviour of mango leaf powder and rice husk for arsenic (III) from aqueous solutions. International
Journal of Environmental Science and Technology 2012, 9 (3), 565-578.
167. Kamsonlian, S.; Suresh, S.; Majumder, C.; Chand, S., Biosorption of arsenic from contaminated
water onto solid Psidium guajava leaf surface: equilibrium, kinetics, thermodynamics, and desorption
study. Bioremediation Journal 2012, 16 (2), 97-112.
168. Morillo, D.; Pérez, G.; Valiente, M., Efficient arsenic (V) and arsenic (III) removal from acidic
solutions with Novel Forager Sponge-loaded superparamagnetic iron oxide nanoparticles. Journal of
colloid and interface science 2015, 453, 132-141.
169. Narayanan, T.; Mary, A. R.; Shaijumon, M.; Ci, L.; Ajayan, P.; Anantharaman, M., On the synthesis
and magnetic properties of multiwall carbon nanotube–superparamagnetic iron oxide nanoparticle
nanocomposites. Nanotechnology 2009, 20 (5), 055607.
170. Jiang, J.; Oberdörster, G.; Biswas, P., Characterization of size, surface charge, and agglomeration
state of nanoparticle dispersions for toxicological studies. Journal of Nanoparticle Research 2009, 11
(1), 77-89.
171. Sun, X.; Doner, H. E., An investigation of arsenate and arsenite bonding structures on goethite by
FTIR. Soil Science 1996, 161 (12), 865-872.
172. Melott, A. L., Le Châtelier's principle. Journal of Chemical Education 1968, 45 (6), A519.
173. Malkoc, E.; Nuhoglu, Y., Investigations of nickel (II) removal from aqueous solutions using tea
factory waste. Journal of hazardous materials 2005, 127 (1), 120-128.
174. Ozsoy, H. D.; Kumbur, H., Adsorption of Cu (II) ions on cotton boll. Journal of hazardous
materials 2006, 136 (3), 911-916.
175. Martinez, S.; Stern, I., Thermodynamic characterization of metal dissolution and inhibitor
adsorption processes in the low carbon steel/mimosa tannin/sulfuric acid system. Applied Surface
Science 2002, 199 (1), 83-89.
176. Xu, X.; Gao, B.; Wang, W.; Yue, Q.; Wang, Y.; Ni, S., Adsorption of phosphate from aqueous
solutions onto modified wheat residue: characteristics, kinetic and column studies. Colloids and Surfaces
B: Biointerfaces 2009, 70 (1), 46-52.
177. Weisstein, E. W., Least squares fitting. 2002.
178. Lafferty, B. J.; Loeppert, R., Methyl arsenic adsorption and desorption behavior on iron oxides.
Environmental science & technology 2005, 39 (7), 2120-2127.
179. Manning, B. A.; Fendorf, S. E.; Goldberg, S., Surface structures and stability of arsenic (III) on
goethite: spectroscopic evidence for inner-sphere complexes. Environmental Science & Technology 1998,
32 (16), 2383-2388.

183
180. Cullen, W. R.; Reimer, K. J., Arsenic speciation in the environment. Chemical reviews 1989, 89
(4), 713-764.
181. Carter, D. E., Oxidation-reduction reactions of metal ions. Environmental health perspectives 1995,
103 (Suppl 1), 17.
182. Masue, Y.; Loeppert, R. H.; Kramer, T. A., Arsenate and arsenite adsorption and desorption
behavior on coprecipitated aluminum: iron hydroxides. Environmental science & technology 2007, 41
(3), 837-842.
183. Afkhami, A.; Madrakian, T., Kinetic–spectrophotometric determination of selenium in natural
water after preconcentration of elemental selenium on activated carbon. Talanta 2002, 58 (2), 311-317.
184. Wasewar, K. L.; Prasad, B.; Gulipalli, S., Adsorption of selenium using bagasse fly ash. CLEAN–
Soil, Air, Water 2009, 37 (7), 534-543.
185. Quiñones, I.; Guiochon, G., Derivation and application of a Jovanovic–Freundlich isotherm model
for single-component adsorption on heterogeneous surfaces. Journal of colloid and interface science
1996, 183 (1), 57-67.
186. Wahab, M. A.; Jellali, S.; Jedidi, N., Ammonium biosorption onto sawdust: FTIR analysis, kinetics
and adsorption isotherms modeling. Bioresource technology 2010, 101 (14), 5070-5075.
187. Hocquellet, P.; Candillier, M.-P., Evaluation of microwave digestion and solvent extraction for the
determination of trace amounts of selenium in feeds and plant and animal tissues by electrothermal
atomic absorption spectrometry. Analyst 1991, 116 (5), 505-509.
188. Rausch, H.; Salamon, A., Activation analysis for selenium and tellurium trace impurities in gallium,
arsenic and gallium arsenide. Talanta 1968, 15 (9), 975-978.
189. Hani, N.; Wai, C.; Willmes, H., Dithiocarbamate extraction of trace amounts of selenium from
biological samples for neutron activation analysis. Journal of radioanalytical and nuclear chemistry
1986, 104 (1), 19-28.

184


Temperature-dependence of arsenic adsorption-desorption, reagent-less process for regeneration and reuse of the adsorbent-Forager sponge loaded with superparamagnetic iron oxide nanoparticle (sponge-SPION)
Liu HEa, Tong Liua, Manuel Valiente*
Department de Quimica, Quimica Analitica, Universidad Autonoma de Barcelona, 08193
Bellaterra, Barcelona, Spain
Corresponding author footnote
Centre Grup de Tecniques de Separacio en Quimica.
Tel. +34-935812903
Fax. +34-945811985
Email. [email protected]
Abstract: Nowadays, there is a great concern on the study of new adsorbent materials for arsenic clean
removal. However, very few studies concern about regeneration and reuse the adsorbent. This
article describes a new reagent-less method which could regenerate the adsorbent by controlling
the temperature.
The temperature-dependence of arsenic adsorption by sponge-SPION has been studied. It has
demonstrated that low-temperature could help to realize the adsorption process and high-
temperature can lead the desorption process to happen. The result shows that under 20oC, as
time goes on, the adsorption process reaches equilibrium at about 1h. Under 70oC, desorption
process occurs as contact time increases, desorption equilibrium was then gradually achieved
with contact time. The effect of temperature on the adsorption of As (V) was studied in the
continuous column mode by evaluating the adsorption at the temperature 10oC, 20oC and 70oC.
The adsorption phenomenon increases with the decrease of temperature. The adsorption results
were fitted to the Langmuir models. Thermodynamic parameters of related ion exchange
equilibrium have been evaluated including the equilibrium constant Ka as well as Gibbs free
energy. This value shows the adsorption process to be favorable and spontaneous. The
equilibrium constant KL values determined at different temperatures indicate the adsorption to
increase with the temperature rising. Accordingly, a decrease in the negative value of ∆G° with
the temperature increase is observed. Separation factor has very strong temperature dependence.
Higher temperature leads to a lower separation. The thermodynamic affinity defined by log
K=4.198 and log K=1.023 under 20oC and 70oC were determined, respectively. Arsenic is, thus,
found to be more strongly adsorbed on the sponge -SPION under 20oC than that under 70oC.
All of the experimental and theoretical studies indicate that we can use the lower temperature
for adsorption and higher temperature for desorption, thereby provide a new method for
recovery of toxic element and regeneration of adsorbents.
Key words: Forager sponge, superparamagnetic iron oxide nanoparticle (SPION), arsenic, adsorption, temperature, thermodynamic, Gibb’s free energy, equilibrium

constant, recovery, regeneration
1. Introduction Arsenic is one of the most toxic elements occurring naturally in the environment [1].Arsenic is
abundant in our environment with both natural and anthropogenic sources which is considered
to be one of the major problems in pollution because of their high toxicity and the consequent
risks for human health [2]. Several countries have to deal with the problem of arsenic
contamination of groundwater, used for drinking water, such as Bangladesh and India, China,
United States, Mexico, Australia, Greece, Italy, Hungary, etc [3]. Thus, there is a growing
interest in using low-cost methods and materials to remove arsenic from industrial effluents or
drinking water before it may cause significant contamination [4-5].
Although many different methods such as precipitation [6], coagulation [7], oxidation [8],
reverse osmosis [9], ion-exchange [10] have been used for arsenic removal, there are some
drawbacks of these methods. Coagulation requires use of large-scale facilities for implementing
water treatment [11]. Reverse osmosis requires the use of membranes, which are expensive to
maintain and replace [12]. Coagulation, reverse osmosis, and ion exchange require the
treatment of rejected stream for the ultimate disposal of arsenic contaminants [13]. Therefore,
the adsorption from solution has attracted more attention due to its simple procedure that
overcome most of the drawbacks of other techniques.
However, almost all of the above traditional methods have the problems on adsorbent
regeneration. Once the adsorbent becomes exhausted, then, either the toxic elements must be
recovered or the adsorbent regenerated or disposed in a controlled dumping site for toxic
substances that use to be expensive. Desorption and adsorbent regeneration is a critical step
contributing to increase process costs. A successful desorption process must restore the sorbent
close to its initial properties for effective reuse. In most of the published arsenic sorption studies
(some discussed earlier), desorption/regeneration was not included. Very few desorption studies
are detailed in literature. Furthermore, once arsenic is recovered in the pure and concentrated
form, the problem of its disposal of this concentrated arsenic product must be addressed. This
is a difficult and expensive task. Few attempts have been made to address the handling of
concentrated arsenic wastes. Tuutijärvi T [36] has tried five different alkaline solutions: NaOH,
Na2CO3, Na2HPO4, NaHCO3 and NaAc for arsenate batch desorption and regeneration. But this
process also need to spend a lot of alkaline solution which is very expensive and is not feasible
for industrial sense. Thus, in our work, we develop a new method for Arsenic desorption and
sorbent regeneration with no reagents added by taking advantage of the thermodynamic
properties of the adsorption system. In this paper, the influence of time, concentration, pH as
well as bed volume on the adsorption rate under different temperature has been studied. More
importantly, the temperature effect on the adsorption-desorption properties has been observed.
In addition, the thermodynamic aspects of the adsorption have been studied. The aim of this
article is to provide a reagentless method to recover the metals and regenerate the adsorbents.
2. Experiment 2.1 Reagents and Apparatus

The As(V) source was sodium arsenate (Na2HAsO4 .7H2O), ACS reagent from
Aldrich(Milwaukee, USA). Iron chloride(FeCl3. 6H2O) and Ferrous chloride(FeCl2. 4H2O)
were ACS reagent from Aldrich(Milwaukee, USA),HCl were ACS reagents from Panreac S.A. (Barcelona, Spain).
Forager Sponge, an open-celled cellulose sponge which contains a water-insoluble polyamide
chelating polymer. (formed by reaction of polyethyleneimine and nitrilotriacetic acid), was
kindly supplied by Dynaphore Inc. (Richmond,VA,U.S.A.). This material is claimed to contain
free available ethyleneamine and iminodiacetate groups to interact with heavy metals ions by
chelation and ion exchange
Arsenic and iron concentrations in solution were determined by the Colorimetric technique.
The wavelength used for analysis were 840 nm(As), 490 nm(Fe).
2.2 Preparation of the Adsorbents 2.2.1 Synthesis of adsorbent materials The synthesis procedure of SPION has been described elsewhere[14].SPION are prepared in
our lab by mixing iron(II) chloride and iron(III) chloride in the presence of ammonium
hydroxide. First, deoxygenated the solution of NH4OH (0.7M) by nitrogen. Second,
deoxygenated the solution of 12mL HCl (0.1M) by nitrogen and mix FeCl3·6H2O with it. Third,
heat the NH4OH solution at 70°C. Fourth, Add the FeCl3·6H2O solution into the NH4OH
solution and react for 30min. Then, Add the FeCl2·4H2O in the previous solution with mechanic
agitation of about 3000rpm and waiting for 45min, the dark precipitate will be formed, which
consists of nanoparticles of magnetite. Last, wash it by MiliQ water which has been
deoxygenated and centrifuged four times( 3 times for 3 min and 5000rpm, 1 time for 10 min
and 4500rpm) and preserve it by 50mL 0.1M TMAOH.
2.2.2 Clean of the Forager sponge An initial conditioning of the sponge consisting on the conversion into its acidic form by
consecutive treatment with 1.0mol/L HCl, double distilled water, and HCl solution at pH 2.5
was carried out in a glass preparative column. A portion of this conditioned sponge was
separated, dried during 24 h , and stored in a desiccator for its use
2.2.3 Loading of SPION on the sponge The sponge was loaded with iron oxide nanoparticles by using the nebulizer. The SPION-
loaded sponge was dried during 24 h, and stored in a desiccator for its use. The SPION loading
capacity was 0029.00955.0 mmol Fe/ g sponge
2.3 Characterization We have synthesized the SPION for 5 times. And Each time, prepare three kinds of sample,
including 1/100, 1/250, 1/1000(0.1mL SPION on 10mL TMAOH, 0.1mL SPION on 25mL
TMAOH, 0.1mL SPION on 100mL TMAOH). We characterized the samples by TEM to see
the particle size and dispersion SPION are highly dispersible in solutions. With particle sizes
of from 6-20 nm, they offer a large surface area and superparamagnetic properties.
2.4 Arsenic adsorption and desorption experiment Effect of contact time Experiments to determine arsenic adsorption in different contact time were carried out at 2-
240mins in batch conditions.

Effect of initial concentration Experiments to determine arsenic adsorption capacity in different initial concentration were
carried out at 0.5-100ppm in batch conditions.
Effect of temperature Experiments to determine arsenic adsorption in different temperatures were carried out at
temperature 10oC, 20oC and 70oC in batch conditions by using tightly plastic tubes containing
weighted amounts of SPION-loaded sponges and measured volumes of arsenate solutions in
the range 0.5-100 ppm As(V) at a given pH. Corresponding agitation was carried out in a rotary
rack shaker during 1 h (this contact time was confirmed in separate experiments).Experiments
to determine the interfering effect of Fe on As(V) adsorption were carried out with 500ppm and
1000 ppm As(V) solutions (13.3 mmol/L) prepared in a medium containing 0.1 mL SPION
under the pH=3.6 condition.Experiments were repeated for the different conditions a minimum
of two times.
3. Results and Discussion 3.1 Characterization of adsorbent material The sponge-SPION adsorbent material was characterized by digital microscope. Fig 1 shows
the image characterized by digital microscope, the Sponge is highly porous and elastic thereby
promoting high rates for SPION loading and arsenic absorption. Therefore it’s a very
appropriate substrate for loading SPION and also for adsorbing arsenic anions. Absorbed
arsenic anions can be eluted from the Sponge by using the NaOH solution. Following elution
and washing, the Sponge can be used for the next absorption cycle. If the regeneration is not
desirable or economical, the Sponge can be compacted to a small volume to facilitate disposal.
As seen from the Fig 2a, b, it is clear that after loading with SPION, the sponge is saturated
with SPION and the surface is very smooth. Maybe it is due to the homogenous dispersion of
the nanoparticles. The porous inside the sponge are fully filled with nanoparticles. The blank
sponge can adsorb and immobilize SPION by chelation through the lone pairs of electrons on
the unprotonated amine groups.
It was shown from the Fig 3a,b that After adsorption by using the sponge loaded with SPION,
the sponge looks like shrinkage. And in addition, the surface is not smooth anymore. Probably
it’s because of the anion-exchange (arsenate oxyanions occur in solution from slightly acid to
basic pH) between iron oxide nanoparticles and arsenate oxyanions.
a b

Fig 1 Forager sponge image by digital microscope
a b
Fig 2 sponge with SPION
a b
Fig 3 SPION Loaded sponge with arsenic (after adsorption) SPION characterization by TEM Before using (SPION emulsion)
a b

c d
Fig 4 TEM image of SPION
a b
c d
Fig 5 TEM image of SPION loaded on the sponge (before using)

a b
c d
Fig 6 TEM image of SPION loaded on the sponge(after As adsorption)
Fig 4 shows TEM images of the synthesized SPION that reveals particles are 6-15nm in size.
when the SPION is first synthesized and poured in the TMAOH solution and characterized by
the TEM, some of the images show that the nanoparticles are homogenous but others are not
dispersed very well. They are agglomerated and clustered.
Fig 5 shows TEM images of SPION dispersed on the sponge, the particles are also ~10nm.
SPION distribute on the sponge almost homogeneously, that’s because during the spraying by
nebulizer and nitrogen, there is an external force to push the nanoparticles, and in addition, we
use the ultrasonication on nanoparticles suspension prior nebulization to disperse agglomerates,
as it can also add an extra force to pull the liquid apart to form evacuated cavities or micro-
voids. 1 The formation and destruction of these cavities can impose a shear force on
agglomerates, capable of overcoming the van der Waals force holding them together. However,
the ultrasonic applied forces are not strong enough to break the hard bonds of iron oxide
molecules.
After adsorption (Fig 6), the SPION show a tendency to agglomerated again since the absence
of external ultrasonic force for some time, makes the van der Waals force to raise affecting the
distribution again.

Effect of contact time
a) b)
Fig 7 The effect of contact time on the adsorption capacity (20oC), a). from 10min to 240min,
b). from 2min to 60min
a) b)
Fig 8 The effect of contact time on the adsorption capacity (70oC), a). from 10min to 240min,
b). from 2min to 60min
The contact time with aqueous toxic element oxyanions is one of the most important parameters
to be controlled for successful usage of adsorbents. The arsenic (V) aqueous system is contacted
with the adsorbent (SPION loaded sponge) in the range of 2 to 100 minutes and 1 to 4 hours.
The adsorption process for removing As (V) oxyanions from aqueous solution under 20oC
obtain ion exchange combined with the ligand exchange equilibrium at about 1hour as shown
in Fig 7 a, b. After that, contact time has no effect in arsenic oxyanion removal percentage. This
behavior can be attributed to the effect of diffusion resistance to reach the ion exchange moieties
of the adsorbent. In another hand, the most possibilities of the complexes formed in our case is,
As(V) is binding to two iron nuclei as adsorbed species. Extended X-ray absorption fine
structure (EXAFS)2 and FTIR spectroscopy3 have shown As(V) to form bidentate inner sphere
surface complexes with iron hydroxide sites as time goes on.4
The effect of contact time on the desorption capacity under 70oC is shown in Fig 8a, b. Very
high adsorption rates were achieved at the beginning because of the great number of sites
available for the sorption operation. The adsorption process involves one of two types of
0.00
0.01
0.02
0.03
0.04
0.05
0.06
0.07
0.08
0.09
0 100 200 300
LOA
D C
AP
AC
ITY(
MM
OL/
G)
TIME (MIN)
0.00
0.01
0.02
0.03
0.04
0.05
0.06
0.07
0.08
0 50 100
LOA
D C
AP
AC
ITY(
MM
OL/
G)
TIME(MIN)
0.00
0.01
0.02
0.03
0.04
0.05
0.06
0.07
0 100 200 300
LOA
D C
AP
AC
ITY(
MM
OL/
G)
TIME(MIN)
0.00
0.01
0.02
0.03
0.04
0.05
0.06
0.07
0.08
0 50 100 150
LOA
D C
AP
AC
ITY(
MM
OL/
G)
TIME(MIN)

interactions. One is anion exchange of arsenic species corresponding to the protonated amine
groups present in the matrix of sponge4. Another process is the ligand exchange, provided by
the Fe(III) ions immobilized in the SPION as Equation 1 shows5. The adsorption process is
reversible process. Suppose the reaction is exothermic process. The increase in temperature
corresponds to introducing heat into the system. Le Châtelier's Principle6 states that the system
will react to remove the added heat, thus the reaction must proceed in the reverse direction,
converting products back to reactants, here we see the desorption starts to occur as time goes
on. Conversely if the temperature of the system were decreased, the system would react in a
direction that opposed the removal of the heat. The forward reaction would thus occur to release
heat in an attempt to offset the heat that was removed from the system.
R − Fe(III) − OH + X − (R − Fe)X + Z (1)
Effect of initial concentration
a) b)
c)
Fig 9 The effect of initial As(V) concentration on the adsorption capacity: a) 5ppm, 10ppm,
50ppm under 20oC, b) from 0.5ppm to 10ppm, 20oC and 70oC, c) from10ppm to 100ppm, 20oC
and 70oC
The initial arsenic oxyanion concentration in the aqueous solution is also a key parameter which affects to the driving force of the adsorption system.7 The effects of the initial arsenic
concentration (from 5ppm to 50ppm) on the adsorption capacity by the sponge loaded with
0
0.1
0.2
0.3
0.4
0.5
0.6
0.7
0 50 100 150
CP
(MM
OL
AS/
G S
PO
NG
E)
VOLUMN (ML)
50ppm
10ppm
5ppm
0.000
0.050
0.100
0.150
0.200
0.250
0.300
0 20 40 60
Cp(
mm
ol A
s/g)
As(V) ppm
20…
0.000
0.100
0.200
0.300
0.400
0.500
0.600
0.700
0.800
0 50 100 150
LOA
DIN
G C
AP
AC
ITY(
MM
OL/
G)
CONCENTRATION(PPM)

SPION under 293K and 343K are shown in Fig 9a,b. The increase of adsorption capacity when
the initial arsenic concentration increases, is due to an increase of the mass transfer driving
force. Adsorption capacity limit is reached when the increase of As (V) initial concentration do
not produce any further increase on the As adsorption. In this case, the surface of the sponge
loaded with SPION does not have free sites for the arsenic oxyanions uptake, being fairly
saturated.8 It is probably another explanation that, as the concentration increased, a higher
probability of collision between adsorbate (arsenate) and adsorbent(sponge loaded with SPION)
surface happens, which could overcome the mass transfer resistance between the aqueous and
the adsorbent phases.9
The process of As(V) adsorption on SPION loaded sponge can occur by two different ways:
one is ion-exchange on the sponge protonated amine groups, another one is As(V) are bound to
iron (hydr)oxides by an inner-sphere ligand-exchange mechanism, in which the arsenic
oxyanion competes with and exchanges with surface≡Fe-OH or ≡Fe-OH2+ groups at the iron
(hydr)oxide surface.4, 10 The increase of adsorption with concentration is due to the diffusion
process and based on the Fick first law. Normally, the ion exchange reactions are very fast
compared to the diffusion of the aqueous ions to the surface moieties. When the initial
concentration is higher, the arsenic oxyanions move from the solution to the surface of the
adsorbent, the amount of arsenic exchanged onto the sponge and that exchanged onto the
SPION increase with increasing initial As (V) concentration.
Effect of pH on Arsenic Adsorption Capacity
a)
0.00
0.05
0.10
0.15
0.20
0.25
0.30
0.35
0.40
0 2 4 6 8 10
AD
SOR
PTI
ON
CA
PA
CIT
Y(M
MO
L A
S/G
)
PH
only sponge sponge&SPION

b)
Fig 10 The effect of pH on the adsorption capacity,1000 ppm As solutions and 0.10g of sponge
were used in each batch experiment. a).20oC, b). 70oC
The effect of pH on the As(V) adsorption by the blank and SPION-loaded sponge under both
20oC and 70oC is shown in Figure 10 a, b, pH ranging between 1 and 11. The results obtained
revealed that the adsorption of arsenate by both blank and SPION-loaded sponge under both
20oC and 70oC are pH dependent, this can be explained by the dependence of the As(V)
speciation on the pH.Compared with the observed results of pH effect on As(V) adsorption with
that of Munoz and Diego4-5, 11, it shows the similar behavior in both 20oC and 70oC with the
adsorption of As(V) by blank sponge, Fe-loaded sponge, SPION alone and SPION-loaded
sponge. The highest adsorption was observed at pH around 3.6-4.0. Specifically, the maximum
adsorption of 20oC is under pH 3.6 while the highest adsorption of 70oC is under 4.0. This
similarity supports the conclusion that the arsenic species is the main reason which is
responsible of the adsorption.5 The acidity of arsenate species (pKa = 2.2) can be responsible
of the observed adsorption, a relatively high rate of deprotonated species are present at pH value
3.6-4.0, therefore the maximum adsorption is present at pH=3.6-4.0. For 20oC, lower pH values
(1.0–2.0) and for 70oC, lower pH values (1.0-3.0), the competition of H+ species for arsenate
leads to a lower adsorption. The lower adsorption capacity at pH values below 3.6 is attributed
to the high concentration of H+ ions. In this situation, the concentration of H+ ions far exceeds
the arsenic anions concentration in the solution, which enhance the competence of H+, therefore
the H+ reach the adsorbent surface sites. On the other hand, for both 20oC and 70oC, at pH >
5.0 the observed decrease on the As (V) adsorption is due to the increase of OH- species in
suppressing the process.
From the Fig 10a,b. under both 20oC and 70oC, it confirmed again that the adsorption of As(V)
is enhanced by loading SPION. Which demonstrate that there are two mechanism proposed
0
0.05
0.1
0.15
0.2
0.25
0.3
0.35
0.4
0.45
0 2 4 6 8 10 12
AD
SOR
PTI
ON
CA
PA
CIT
Y(M
MO
L A
S/G
)
PH
only sponge sponge&SPION

for As(V) adsorption on the SPION-loaded sponge. Not only the mechanism of ion-exchange
on the protonated amine groups (present in both blank and SPION-loaded sponges) is proposed,
but also the additional ligand-exchange mediated by the immobilized Fe3+ (only present in the
SPION-loaded sponge) has big impact on the As(V) adsorption.
Fig 11. pH effect on As(III) adsorption by sponge-SPION under 20oC and 70oC
As shown in Figure 11, As (III) adsorption by sponge loaded with SPION at both 20oC and
70oC reveals to be independent of pH, what corresponds to the weak acidic properties of
arsenious acid (pKa1 = 9.2), leading to the reduced presence of deprotonated arsenite species
in the pH range of study. The higher As (III) adsorption capacity under 20oC than under 70oC
may indicate the possible use of temperature to drive the adsorption/desorption process.
Effect of temperature
a)
-0.020
0.000
0.020
0.040
0.060
0.080
0.100
0.120
0.140
0 5 10 15Ad
sorp
tio
n c
apac
ity(
mm
olA
s/g
spo
nge
)
pH
70oC
20oC
-0.5
0
0.5
1
1.5
2
2.5
3
0 50 100 150
CP
(MM
OL
AS/
G F
E)
BV
70oC 20oC

b)
c)
Fig 12 The effect of temperature on the adsorption capacity (70oC, 20oC, 10oC): a). pH=3.6,b)
pH=5.6, c) pH=2.1
The effect of temperature on the adsorption of As (V) was studied in the fixed bed mode by
evaluating the adsorption at the temperature 10oC, 20oC and 70oC under pH 3.6 as shown in Fig
12a. The observed values can be explained in terms of the thermodynamic parameters. The
adsorption phenomenon is more efficient with the decrease in temperature, which indicate an
exothermic process. Generally, an exothermic adsorption process signifies either physi- or
chemi-sorption12. The process is controlled by the adsorbate-adsorbent interaction. The
breakthrough point for 10oC and 20oC is about 48 bed volume, but for 70oC, the breakthrough
point is about 26 bed volume. The adsorption of arsenate onto sponge-SPION followed at three
temperatures, 10oC, 20oC and 70◦C, shows a fast arsenate uptake in all cases The observed
decrease in the adsorption capacity with an increase of the temperature from 10oC to 70oC may
-1
-0.5
0
0.5
1
1.5
2
2.5
0 50 100 150
CP
MM
OL
AS/
G F
E
BV
70oC
20oC
10oC
-20
0
20
40
60
80
100
120
140
0 20 40 60 80AD
SOR
PTI
ON
CA
PA
CIT
Y(M
MO
L/G
)
BV
70oC
20oC
10oC

be due to a tendency for the arsenate oxyanions to escape from the solid phase to the bulk phase
with an increase in the temperature of the solution13.
The effect of temperature on the adsorption of As (V) was studied by evaluating the adsorption
at the temperature 10oC, 20oC and 70oC under pH 5.6 is shown in Fig 12b. As indicated before,
for both 20oC and 70oC, when pH is more than 5.0, the observed decrease on the As (V)
adsorption is due to the increase of OH- species that compete with deprotonated arsenate for
the anion exchange sites of the adsorbent, which is also confirmed by the column continuous
mode arsenate adsorption.
On the other hand, at pH<2.5(as shown in Fig 12c), iron desorbed is very significant due to
protons competition, nevertheless, at pH range 3-9 iron desorption is not quite important. Thus,
in this adsorption process, at the beginning of the arsenic adsorption, the iron desorbing does
not have significant impact on the As (V) adsorption since the ion exchange process increase
the pH value when the process begins. Then, after the continuous flow of arsenic solutions (pH
2.1) the ion exchange became saturated and then the solution in column became acidic
producing iron desorption from the sponge gradually, thus leading to a decrease on the arsenic
adsorption. Moreover, as the solution is under pH 2.1, the arsenic desorption occurred after
previous adsorption, thus producing at the column outlet a sharp increase of arsenic
concentration leading to a higher arsenic concentration than in the initial column incoming
solution. The final drop of the As(V) concentration at the column outlet is due to the
readsorption of part of the As(V) in column at the empty sites left by the previous As(V) release
and thus will reach the value of the input solution.
The effect of bed volume
a)
-0.5
0
0.5
1
1.5
2
2.5
3
0 20 40 60 80
CP
BV
70oC
20oC
10oC

b)
c)
Fig 13 The effect of bed volume (70oC, 20oC, 10oC), pH=3.6: a) 0.5g sponge, b)1.0g sponge,
c) 1.5g sponge
The influences of the height of the sponge bed on the adsorption capacity are shown in Fig 13a,
b. More adsorbent (sponge with SPION) makes the depth of bed volume to be higher. When
the As(V) solution go through the column, it has longer time to contact with the adsorbent, in
addition, multiple layer of the sponge with SPION can adsorb the arsenic from the top to the
bottom one.
Adsorption isotherms Langmuir isotherm The experimental As(V) adsorption data have been subjected to Langmuir isotherm showed in
Fig 14. Langmuir isotherm equation fitted well to the adsorption data.
-0.5
0
0.5
1
1.5
2
2.5
3
0 50 100 150
CP
(MM
OL
AS/
G F
E)
BV
70oC
20oC
10oC
0
0.5
1
1.5
2
2.5
3
0 10 20 30 40
CP
BV
70oC

mm CCCKCxC //1/ a (2)
-C is the concentration of sorbate in the equilibrated solution, mmol/L
-Cx is the adsorption capacity in SPION, mmol/g
-Cm is the maximum adsorption capacity
-Ka is the adsorption equilibrium constant
The langmuir coefficients Ka and Cm can be determined from the intercepts and slopes of the
plots C/Cx vs C, which are linear.
Fig 14 Langmuir model
The isotherm parameters for the adsorption As (V) onto the sponge with SPION at different
temperatures were obtained from the Langmuir model by using the linear fitting method.
Table 1 The isotherm parameters for Langmuir model
T(oC) 70oC 20oC
Cm(mmol/g SPION) 40.65 47.52
Cm(mmol/g sponge) 0.935 1.093
Log Ka(L/mmol) 1.73 1.84
0G (kJ/mol) -11.463 -9.094
R2 0.9936 0.9793
The effect of isotherm shape can be used to predict whether an adsorption system is “favourable”
or “unfavourable” both in fixed-bed systems as well as in batch processes. The essential features
of the Langmuir isotherm can be expressed in terms of a dimensionless constant separation
factor or equilibrium parameter KL, which is defined by the following relationship:
0
11L
a
KK C
(2)
y = 0.9151x + 0.4966R² = 0.9793
y = 1.0698x + 0.6169R² = 0.9936
0.00
0.20
0.40
0.60
0.80
1.00
1.20
1.40
1.60
1.80
2.00
0.000 0.500 1.000 1.500
C/C
X(G
/L)
C (PPM)
20oC
70oC

KL indicate the type of isotherm, C0 is the initial concentration (mg/L), and Ka is the Langmuir
constant.
Table 2 Equilibrium constants
Values of KL Type of isotherm
KL>1 Unfavorable
KL=1 Liner
0<KL<1 Favorable
KL=0 Irreversible
Fig 15 plot of KL against initial arsenic concentration at two temperatures.
Fig 15 with a relationship between KL and C0 was presented to show the essential features of
the Langmuir isotherm. The KL values indicate that adsorption is more favorable for the higher
initial As(V) concentration than the lower ones and also it indicate that adsorption is more
favorable for the lower temperature than the higher ones.
Freundlich isotherm
CN
KC fx ln1
lnln (3)
0
0.0005
0.001
0.0015
0.002
0.0025
0.003
0 50 100 150
KL
CO(PPM)
20oC
70oC

Fig 16 Frendlinch model
Table 3 The isotherm parameters for Freundlich model
T(oC) 70oC 20oC
Kf(mg/g) 3.582 4.413
1/N 0.588 0.583
N 1.701 1.715
R2 0.9943 0.9878
where Cx is the mass of arsenic adsorbed (mmol/g), C is the equilibrium arsenic concentration
(mg/L), and Kf and 1/N are constants. Kf can be used as an indicator of the adsorption capacity
at a specific solution phase concentration, and 1/N reflects the intensity of adsorption.
The Freundlich equation predicts multilayer adsorption on heterogeneous surface,
characterized by an exponential distribution of active sites. The values of the adsorption
intensity obtained in nature favourable of the adsorption of As(V) ions onto sponge with SPION
described by the Freundlich isotherm.
Thermodynamics Studies The Gibb’s free energy change is calculated using Ka obtained from Langmuir model and
showed in table 1. The equations are:
0a=- lnG RT K (4)
and
0 0 0= HG T S (5)
where R is universal gas constant (8.314 J mol-1K-1) and T is the absolute temperature in K.
The negative values of Gibb’s free energy confirmed the feasibility of the process and the
spontaneous nature of adsorption with a high preference of As(V) by Forager sponge with iron
oxide nanoparticles. The decrease in the negative value of ∆G° with an increase in
temperature indicates that the adsorption process of As(V) on sponge becomes more favorable
y = 0.5827x + 1.4846R² = 0.9878
y = 0.588x + 1.2758R² = 0.9943
0.00
0.50
1.00
1.50
2.00
2.50
3.00
3.50
4.00
4.50
0 1 2 3 4 5
LNC
X
LNC
20oC

at lower temperatures. But compared with the maximum adsorption capacity 0.93mmol/g in
343K, the maximum adsorption capacity in 293K is higher, 1.094mmol/g. This means under
lower temperature, it can get higher maximum adsorption capacity than that under higher
temperature.
The enthalpy change, ΔH°, and the entropy change, ΔS°, for the adsorption processes were obtained from the intercept and slope of Eq. (5) and found to be 0.822kJ mol-1 and 0.0338
kJ mol-1 K-1, respectively. The positive value of ΔH° indicates that the adsorption. Reaction is
exothermic. The positive value of ΔS° suggests that some structural changes occur on the adsorbent, and the randomness at the solid/liquid interface in the adsorption system increases
during the adsorption process.
The dependence of separation factors on temperatures and bed volumes:
-2 4 4 2e- +
log 2.5 0.3
F OH H AsO FeHAsO H O
K
(6)
As indicated from the above equation, it was found that pKa <0 and the arsenic acid is a
relatively strong acid and the removal of As (V) by anion-exchange is possible. As the anion exchange behavior, the equilibrium separation factor, , expressed as follows.
2 4
2 4
2 4
OH H AsOOH
H AsOH AsO OH
x X
x X
(7)
Where x and X are the equivalent fractions of ions under separation in sponge and solution
phases, respectively.
Table 4 separation factors
separation factor
Bed volume 70oC 20oC
5 481.8 3061.2
8 545.8 11907.6
11 521.8 17861.9
13 529.6 26793.4
16 569.1 17861.9
19 560.1 107176.5
21 664.7 107176.5
24 625.8 21434.5
27 461.0 26793.4
29 141.1 8930.5
32 38.5 4121.2
35 14.9 1622.9
37 7.8 652.5
40 4.5 288.7
43 3.2 143.1
45 2.0 74.5
48 1.6 42.2

51 1.2 25.4
53 0.8 16.2
56 0.6 9.7
59 0.5 6.7
61 0.3 4.9
64 0.3 3.6
67 0.2 2.7
69 0.1 2.1
72 0.1 1.7
75 0.0 1.3
77 0.0 1.1
80 0.0 0.9
83 0.0 0.7
As can be seen from Table 3 that the separation factor has very strong temperature dependence.
Higher temperature leads to lower separation. The capacity of anion exchange is very strongly
at the beginning. As the experiment goes on, with the increase of bed volume fold, the anion
exchange capacity is going down sharply.
Table 4 Comparison of the result with Jose Munoz’s work
Fe loading
capacity(mmol Fe/g
sponge)
Maximium adsorption
capacity(mmol As/g
sponge)
Maximium adsorption
capacity(mmol As/mmol
Fe)
Fe with
sponge 0.250 0.014 1.83 7.32
SPION with
sponge 0.0955 0.0029 1.094 11.455
After comparing the adsorption capacity of sponge loaded with SPION with that sponge loaded
with Fe(III), it is found that Fe(III) load sponge has a better adsorption capability for As(V) per
unit of sponge, it has a maximum adsorption capacity of 1.83mmol As/g sponge, and the SPION
loaded sponge only has the maximum adsorption capacity of 1.094mmol As/g sponge. However,
the SPION loaded sponge has a better adsorption capacity for As(V) per unit of Fe, it has the
maximum adsorption capacity of 11.455 mmol As/ mmol Fe while the Fe(III) loaded sponge
only has the maximum adsorption capacity of 7.32mmol As/mmol Fe. It is mainly because of
that the Fe(III) loaded adsorption capacity is mainly due to the acid groups in the sponge. But
the better adsorption capacity of SPION loaded sponge is because of not only the acid groups
but also the good properties of SPION which has a high surface-volume ratio.
Modeling of Arsenic Adsorption by a Ligand-Exchange Process. A monodantate ligand-exchange mechanism, based on the Fe:As stoichiometry 1:1 previously
discussed, is proposed for the adsorption of arsenic(V) on the SPION loaded in the sponge, as
it has been considered for other iron-based materials. The corresponding reactions can be
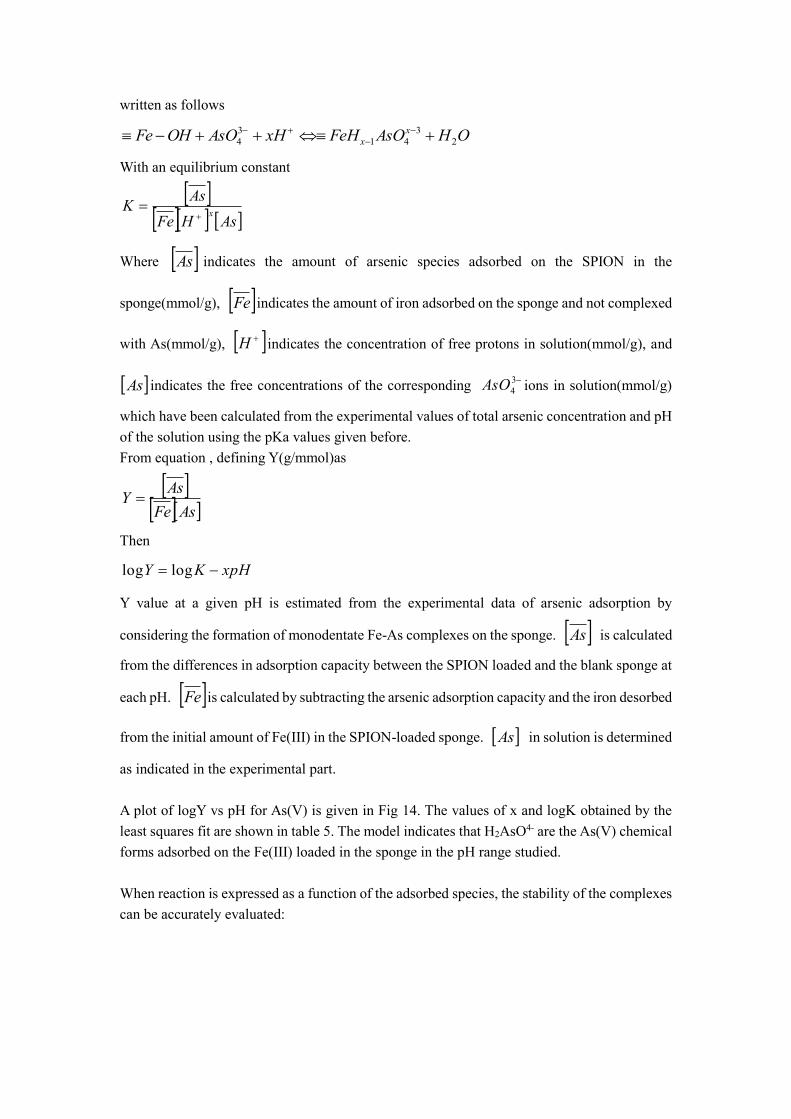
written as follows
OHAsOFeHxHAsOOHFe xx 2
341
34
With an equilibrium constant
AsHFe
AsK
x
Where As indicates the amount of arsenic species adsorbed on the SPION in the
sponge(mmol/g), Fe indicates the amount of iron adsorbed on the sponge and not complexed
with As(mmol/g), H indicates the concentration of free protons in solution(mmol/g), and
As indicates the free concentrations of the corresponding 34AsO ions in solution(mmol/g)
which have been calculated from the experimental values of total arsenic concentration and pH
of the solution using the pKa values given before.
From equation , defining Y(g/mmol)as
AsFe
AsY
Then
xpHKY loglog
Y value at a given pH is estimated from the experimental data of arsenic adsorption by
considering the formation of monodentate Fe-As complexes on the sponge. As is calculated
from the differences in adsorption capacity between the SPION loaded and the blank sponge at
each pH. Fe is calculated by subtracting the arsenic adsorption capacity and the iron desorbed
from the initial amount of Fe(III) in the SPION-loaded sponge. As in solution is determined
as indicated in the experimental part.
A plot of logY vs pH for As(V) is given in Fig 14. The values of x and logK obtained by the
least squares fit are shown in table 5. The model indicates that H2AsO4- are the As(V) chemical
forms adsorbed on the Fe(III) loaded in the sponge in the pH range studied.
When reaction is expressed as a function of the adsorbed species, the stability of the complexes
can be accurately evaluated:

a)
b)
Fig16 Modeling of arsenic species adsorption on the SPION-loaded in the sponge: linear
relationship between log Y and pH for As (V).a) 20oC, b) 70oC
Table 5 Calculated Results from Fe-As Interaction Modeling Process Indicating the x and logK
Values by the Least-Squares Fit
pH range X logK R
20oC 1-8 0.398 4.198 0.842
70oC 1-11 0.1061 1.023 0.379
As would be expected, As (V) adsorption on immobilized SPION is preferred under 20oC against that the adsorption performed under 70oC. Reversibility of both process has already
been proved by corresponding arsenic desorption from the SPION-loaded sponge under 70oC.
It also has proved the concept that the adsorption-desorption process could be controlled by
changing the temperature. The regeneration and reusing of the adsorbent-SPION loaded sponge
y = -0.398x + 4.1975R² = 0.8424
0.00
0.50
1.00
1.50
2.00
2.50
3.00
3.50
4.00
4.50
0 2 4 6 8 10
LOG
Y
PH
y = -0.1061x + 1.0231R² = 0.3791
-0.4
-0.2
0.0
0.2
0.4
0.6
0.8
1.0
1.2
1.4
1.6
0 2 4 6 8 10 12
LOG
Y
PH

will be possible after desorption. Alternatively, the sponge (which is an inexpensive material)
could be compacted into an extremely small volume and disposed as a hazardous waste.4
Acknowledgement Dynaphore Inc. (U.S.A.) is gratefully acknowledged for the samples supplied. I also should
thank staffs from GTS, the Department of analytical chemistry. Thanks for their co-operation
and assistance provided before and during the projects. In addition, thanks for the scholarship
support of Chinese Scholar Council for the scholar-grant received.
Reference [1] Le Zeng, Arsenic Adsorption from Aqueous Solutions on an Fe(III)-Si Binary Oxide
Adsorbent, Water Qual. Res. J. Canada, 2004, 39( 3), 267–275
[2] S U S H I L R A J K A N E L , J E A N - M A R K G R E N E` C H E , A N D H E E C H U
L C H O I, Arsenic(V) Removal from Groundwater Using Nano Scale Zero-Valent Iron as a
Colloidal Reactive Barrier Material. Environ. Sci. Technol. 2006, 40, 2045-2050 [3] Dinesh Mohana, Charles U. Pittman Jr. Arsenic removal from water/wastewater using
adsorbents—A critical review. Journal of Hazardous Materials 142 (2007) 1–53
[4] R.S. Harisha, K.M. Hosamani , R.S. Keri, S.K. Nataraj, T.M. Aminabhavi, Arsenic removal
from drinking water using thin film composite nanofiltration membrane. Desalination 252
(2010) 75–80 [5] Vassilis Zaspalis, Adamantia Pagana, Styliani Sklari, Arsenic removal from contaminated
water by iron oxide sorbents and porous ceramic membranes. Desalination 217 (2007) 167–
180
[6] Ernest O. Kartinen Jr., Christopher J. Martin An overview of arsenic removal processes,
Desalination 103 (1995) 79-88
[7] S. Song, A. Lopez-Valdivieso, D.J. Hernandez-Campos, C. Peng, M.G. Monroy-Fernandez,
I. Razo-Soto, Arsenic removal from high-arsenic water by enhanced coagulation with ferric
ions and coarse calcite, WA T E R R E S E A R C H 4 0 ( 2 0 0 6 ) 3 6 4 – 3 7 2
[8] Myint Zaw, Maree T. Emett, Arsenic removal from water using advanced oxidation
processes, Toxicology Letters 133 (2002) 113–118
[9] Meng, X.; Bang, S.; Korfiatis, G. P. Water Res. 2000, 34(4), 1255-1261. [10] Abrazheev, R. V.; Zorin, A. D. J. Anal. Chem. 1999, 54(12), 1106-1108.
[11] Janet G. Hering, Pen-yuan Chen, etc. arsenic removal from drinking water during
coagulation. Journal of environmental engineering. 1997, 801-807
[12] Joan J. Waypa, Janet G. Hering. Arsenic removal by RO and NF membranes American
Water Works Association. Journal; 1997, 89(10), 102-114
[14] T. Burks, M.Avila, F. Akhatar.etal. J. Colloid Interface. Sci. 425(2014) 36-43.
[14] Vagliasindi, G. A. F.; Henley, M.; Schultz, N.; Benjamin, M. M.Proc. Water Qual. Technol.
Conf. 1996, Vol. Date 1995 (Pt. 2),1829-1853.
[15] Manning, B. A.; Goldberg, S. Soil Sci. Soc. Am. J. 1996, 60(1),121-131.
[16] Xu, Y.; Ohki, A.; Maeda, S. Chem. Lett. 1998, 10, 1015-1016.
[17]Tokunaga, S.; Wasay, S. A.; Park, S. Water Sci. Technol. 1997,35(7), 71-78.

[18] Van der Hoek, E. E.; Bonouvrie, P. A.; Comans, R. N. J. Appl. Geochem. 1994, 9, 403-
412.
[19] Elizalde-Gonza´lez, M. P.; Mattusch, J.; Einicke, W. D.; Wennrich, R. Chem. Eng. J. 2001,
81, 187-195.
[20] Fendorf, S.; Eick, M. J.; Grossl, P.; Sparks, D. L. Environ. Sci.Technol. 1997 31 (2), 315-
320.
[21] Yannick Mamindy-Pajany, Charlotte Hurel, Nicolas Marmier, Miche`le Rome´o, Arsenic
adsorption onto hematite and goethite, C. R. Chimie 12 (2009) 876e881.
[22] Jain, A.; Raven, K. P.; Loeppert, R. H. Environ. Sci. Technol.1999, 33, 1179-1184.
[23] L. Zeng, A method for preparing silica-containing iron (III) oxide adsorbents for arsenic
removal, Water Res., 37 (2003) 4351–4358.
[24] Kelly B. Payne and Tarek M. Abdel-Fattah. Adsorption of Arsenate and Arsenite by Iron-
Treated Activated Carbon and Zeolites: Effects of pH, Temperature, and Ionic Strength. Journal
of Environmental Science and Health, 40:723–749, 2005
[25] Y. Zhang, M. Yang and X. Huang, Arsenic (V) removal with a Ce(IV)-doped iron oxide
adsorbent, Chemosphere, 51 (2003) 945–952
[26] O.S. Thirunavakkarasu, T. Viraraghavan and K.S.Subramanian, Arsenic removal from
drinking water using iron oxide-coated sand, Water, Air, Soil Poll., 142 (2003) 95–111.
[27] M.J. Haron, W.M.Z. Wan Yunus, N.L. Yong and S. Tokunaga, .Sorption of arsenate and
arsenite anions by iron(III)-poly(hydroxamic acid) complex,
Chemosphere, 39 (1999) 2459–2466.
[28] X. Meng, S. Bang and G.P. Korfiatis, Effects of silicate, sulfate, and carbonate on arsenic
removal by ferric chloride, Water Res., 34 (2000) 1255–1261.
[29] J.H. Min and J.G. Hering, Arsenate sorption by Fe(III)-doped alginate gels, Water Res., 32
(1998)1544–1552.
[30] I. Peleanu, M. Zaharescu, I. Rau, M Crisan, A. Jitianu and A. Meghea, Nanocomposite
materials for As(V) removal by magnetically intensified adsorption,
Sep. Sci. Technol., 37 (2002) 3693–3701.
[31] Dmitri Muraviev, Ana Gonzalo, and Manuel Valiente.Ion Exchange on Resins with
Temperature-Responsive Selectivity. 1 .Ion-Exchange Equilibrium of Cu2+ and Zn2+ on
lminodiacetic and Aminomethylphosphonic Resins. Anal. Chem. 1995, 67,3028-3035 [32] Dmitri Muraviev, Ana Gonzaloa, Nikolai A. Tikhonovb, Manuel Valiente. Ion exchange
on resins with temperature-responsive selectivity II. Thermo-induced concentration waves in
ion-exchange column. Journal of Chromatography A, 802 (1998) 251–261
[33] Dmitri Muraviev , Anna Gonzalo, Manuel Valiente. Ion exchange on resins with
temperature-responsive selectivityIII. Influence of complex formation stoichiometry on
temperature dependence of resin selectivity. Journal of Chromatography A, 868 (2000) 143–
152
[34] Dmitri Muraviev, Ana Gonzalo, Nikolai A. Tikhonov, Maxim I. Iljin, Manuel Valiente .
Ion exchange on resins with temperature-responsive selectivity IV. Influence of solution and
column parameters on efficiency of reagentless separation of copper and zinc using thermo-
induced concentration waves technique. Journal of Chromatography A, 867 (2000) 57–69
[35] José Antonio Muñoz, Anna Gonzalo, Manuel Valiente. Kinetic and Dynamic Aspects of
Arsenic Adsorption by Fe(III)-Loaded Sponge. J Solution Chem (2008) 37: 553–565

[36] Abdusalam Uheida, German Salazar-Alvarez, Eva Björkman, Zhang Yu, Mamoun
Muhammed, Fe3O4 and γ -Fe2O3 nanoparticles for the adsorption of Co2+from aqueous solution. Journal of Colloid and Interface Science 298 (2006) 501–507
[37] Abdusalam Uheida, Mònica Iglesias, Clàudia Fontàs, Manuela Hidalgo, Victòria Salvadó,
Yu Zhang, Mamoun Muhammed, Sorption of palladium(II), rhodium(III), and platinum(IV) on
Fe3O4 nanoparticles. Journal of Colloid and Interface Science 301 (2006) 402–408
[38] Glenn A. Waychunas1, Christopher S. Kim, and Jillian F. Banfield1, Nanoparticulate iron
oxide minerals in soils and sediments: unique properties and contaminant scavenging
mechanisms. Journal of Nanoparticle Research (2005) 7: 409–433 [39] J.G. Parsons, M.L. Lopez, J.R. Peralta-Videa, J.L. Gardea-Torresdey. Determination of
arsenic(III) and arsenic(V) binding to microwave assisted hydrothermal synthetically prepared
Fe3O4, Mn3O4, and MnFe2O4 nanoadsorbents. Microchemical Journal 91 (2009) 100–106 [40] José Antonio Muñoz, Anna Gonzalo, Manuel Valiente. Kinetic and Dynamic Aspects of
Arsenic Adsorption by Fe(III)-Loaded Sponge. J Solution Chem (2008) 37: 553–565
[41]Marta A., Gustavo P., Mouhsine E., Laila M., Naaila O., Jose L. B. and Manuel V., The
Open Environmental Pollution & Toxicology Journal, 2012, 3, (Suppl 1-M2) 2-12.
[42] GUSTAVO P., MONTSERRAT L.M., MANUEL V. Environ. Sci. Technol. 2008, 42,
2309–2315
[43] Ang B. C., Iskandar Idris Yaacob. Journal of Materials Processing Technology 191 (2007)
235–237
[44] J.G. Parsons, M.L. Lopez, J.R. Peralta-Videa, J.L. Gardea-Torresdey. Microchemical
Journal 91 (2009) 100–106.
[45] Bilge Alyüz, Sevil Veli, Kinetics and equilibrium studies for the removal of nickel and zinc from aqueous solutions by ion exchange resins. Journal of Hazardous Materials 167 (2009)
482–488 [46] J O S EÄ A N T O N I O MUNO Z A N N A G O N Z A L O , A N D M A N U E L V A L
I E N T E , Arsenic Adsorption by Fe(III)-Loaded Open-Celled Cellulose Sponge.
Thermodynamic and Selectivity Aspects, Environ. Sci. Technol. 2002, 36, 3405-3411
[47] Jing He, Song Hong, Liang Zhang, Fuxing Gan, and Yuh-Shan Ho. EQUILIBRIUM AND
THERMODYNAMIC PARAMETERS OF
ADSORPTION OF METHYLENE BLUE ONTO RECTORITE. Fresenius Environmental
Bulletin, Volume 19 – No 11a. 2010
[48] Chilton Ng, Jack N. Losso, Wayne E. Marshall , Ramu M. Rao. Freundlich adsorption
isotherms of agricultural by-product-based powdered activated carbons in a geosmin–water
system. Bioresource Technology 85 (2002) 131–135 [49] Ming Hua,Shujuan Zhang, Bingcai Pan, Weiming Zhang, Lu Lv, Quanxing Zhang. Heavy
metal removal from water/wastewater by nanosized metal oxides: A review. Journal of
Hazardous Materials 211– 212 (2012) 317– 331
[50] Anna Gó rkaa, Roman Bocheneka, JolantaWarchołb, Krzysztof Kaczmarskia, Dorota Antosa Ion exchange kinetics in removal of small ions. Effect of salt concentration on inter-
and intraparticle diffusion. Chemical Engineering Science 63 (2008) 637 – 650
[51] Dinesh Mohana, Charles U. Pittman Jr. Arsenic removal from water/wastewater using
adsorbents—A critical review. Journal of Hazardous Materials 142 (2007) 1–53
[52] Ming Hua ,Shujuan Zhang, Bingcai Pan, Weiming Zhang, Lu Lv, Quanxing Zhang. Heavy

metal removal from water/wastewater by nanosized metal oxides: A review. Journal of
Hazardous Materials 211– 212 (2012) 317– 331
[53] Jing Hu; Guohua Chen; and Irene M. C. Lo, M.ASCE, Selective Removal of Heavy Metals
from Industrial Wastewater Using Maghemite Nanoparticle: Performance and Mechanisms. J.
Environ. Eng. 2006.132:709-715.
[54] Vimlesh Chandra, Jaesung Park, Young Chun, Jung Woo Lee, In-Chul Hwang, and Kwang
S. Kim, Water-Dispersible Magnetite-Reduced Graphene Oxide Composites for Arsenic
Removal. ACS NANO 2010 VOL. 4 NO. 7 3979–3986
[55] Chang-Yan Cao, Jin Qu, Wen-Sheng Yan, Jun-Fa Zhu, Zi-Yu Wu,and Wei-Guo Song, Low-
Cost Synthesis of Flowerlike α -Fe2O3 Nanostructures for Heavy Metal Ion Removal: Adsorption Property and Mechanism. Langmuir 2012, 28, 4573−4579


Application of Synergic thermo tunning of redox potential for clean removal of Arsenic
Liu Hea, Tong Liua, Manuel Valiente*
Department de Quimica, Quimica Analitica, Universidad Autonoma de Barcelona, 08193
Bellaterra, Barcelona, Spain
Corresponding author footnote
Centre Grup de Tecniques de Separacio en Quimica.
Tel. +34-935812903
Fax. +34-945811985
Email. [email protected]
Abstract Development of new techniques for the clean removal of As(V) from aqueous matrixes is an
important issue due to the high toxicity of this element. The present article relates to a
reagentless recycled method for arsenic removal in water. In this paper, we develop a new
method for Arsenic adsorption-- desorption and sorbent regeneration with no reagents added
by taking advantage of the synergic thermo tunning of redox potential of the adsorption-
desorption system.
Key words: Adsorption, desorption, thermo tunning, redox potential
1.Introduction
There is a growing interest in using low-cost methods and materials to remove arsenic from
industrial effluents or drinking water before it may cause significant contamination. A lot of
adsorbents and filters have been used for the treatment, including: ferric chloride[1], Fe(III)-
doped alginate gels[2], nanocomposite adsorbent based on silica and iron(III) oxide[3], and iron
oxide-coated polymeric materials[4], Fe(III)-loaded resins[5], Fe(III)-loaded sponge[6] are
used in arsenic treatment because of the Fe(III) affinity toward inorganic arsenic species and
consequent selectivity of the adsorption process.
In WO 2014122350A1 a filter for the treatment of liquid comprising a support made from a
polymer material having at least one functional group from the group formed by carboxyl and
thiol, loaded with SPION (SuperParamagnetic Iron oxide Nanoparticles)
In WO 2007/ 032860 a filter for eliminating described arsenic in water comprising a support of
polyacrylonitrile (PAN) loaded with iron hydroxide nanoparticles .
The paper Morillo , D, Valiente , M., Perez , G., "Advances in adsorption Arsenic with
Nanoparticles", Research Project, Master's Degree in Chemical Sciences and Technology ,
Universitat Autònoma de Barcelona , September 2009 , the use of a cellulose sponge as support,
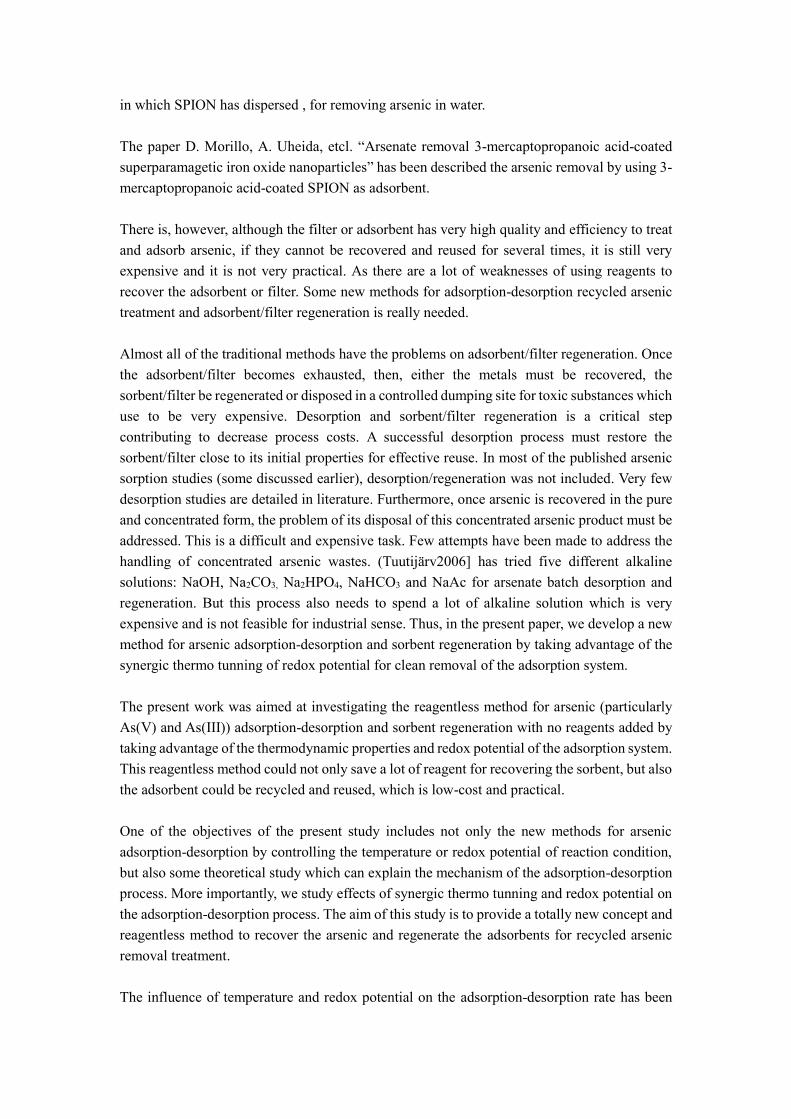
in which SPION has dispersed , for removing arsenic in water.
The paper D. Morillo, A. Uheida, etcl. “Arsenate removal 3-mercaptopropanoic acid-coated
superparamagetic iron oxide nanoparticles” has been described the arsenic removal by using 3-
mercaptopropanoic acid-coated SPION as adsorbent.
There is, however, although the filter or adsorbent has very high quality and efficiency to treat
and adsorb arsenic, if they cannot be recovered and reused for several times, it is still very
expensive and it is not very practical. As there are a lot of weaknesses of using reagents to
recover the adsorbent or filter. Some new methods for adsorption-desorption recycled arsenic
treatment and adsorbent/filter regeneration is really needed.
Almost all of the traditional methods have the problems on adsorbent/filter regeneration. Once
the adsorbent/filter becomes exhausted, then, either the metals must be recovered, the
sorbent/filter be regenerated or disposed in a controlled dumping site for toxic substances which
use to be very expensive. Desorption and sorbent/filter regeneration is a critical step
contributing to decrease process costs. A successful desorption process must restore the
sorbent/filter close to its initial properties for effective reuse. In most of the published arsenic
sorption studies (some discussed earlier), desorption/regeneration was not included. Very few
desorption studies are detailed in literature. Furthermore, once arsenic is recovered in the pure
and concentrated form, the problem of its disposal of this concentrated arsenic product must be
addressed. This is a difficult and expensive task. Few attempts have been made to address the
handling of concentrated arsenic wastes. (Tuutijärv2006] has tried five different alkaline
solutions: NaOH, Na2CO3, Na2HPO4, NaHCO3 and NaAc for arsenate batch desorption and
regeneration. But this process also needs to spend a lot of alkaline solution which is very
expensive and is not feasible for industrial sense. Thus, in the present paper, we develop a new
method for arsenic adsorption-desorption and sorbent regeneration by taking advantage of the
synergic thermo tunning of redox potential for clean removal of the adsorption system.
The present work was aimed at investigating the reagentless method for arsenic (particularly
As(V) and As(III)) adsorption-desorption and sorbent regeneration with no reagents added by
taking advantage of the thermodynamic properties and redox potential of the adsorption system.
This reagentless method could not only save a lot of reagent for recovering the sorbent, but also
the adsorbent could be recycled and reused, which is low-cost and practical.
One of the objectives of the present study includes not only the new methods for arsenic
adsorption-desorption by controlling the temperature or redox potential of reaction condition,
but also some theoretical study which can explain the mechanism of the adsorption-desorption
process. More importantly, we study effects of synergic thermo tunning and redox potential on
the adsorption-desorption process. The aim of this study is to provide a totally new concept and
reagentless method to recover the arsenic and regenerate the adsorbents for recycled arsenic
removal treatment.
The influence of temperature and redox potential on the adsorption-desorption rate has been

studied. In addition, the thermodynamic aspects for realizing the adsorption-desorption process
have been evaluated. Besides that, the application of oxidation of As(III) to As(V) and the
reduction of As(V) to As(III) in order to realize the adsorption-desorption process have been
characterized. More importantly, the thermodynamic aspects combined with the redox potential
effect for controlling the adsorption-desorption process have been developed.
2. Experiment section 2.1Reagents and Apparatus Na2HAsO4 .7H2O, FeCl3. 6H2O,FeCl2. 4H2O,were used as As(V), Fe(III), Fe(II) sources. Zinc powder and Tin foil used for the reduction purpose.Forager Sponge, supplied by Dynaphore
Inc. (Richmond,VA,U.S.A.) was used as the support for the SPION. Metal concentrations in
solution were determined by the Colorimetric technique. The wavelength used for analysis were
840 nm (As), 490 nm(Fe). Lewatit S-3428 resin was supplied by Purolite.
2.2 Preparation of the Adsorbents 2.2.1 Synthesis and characterization of nanoparticles
The synthesis procedure of SPION has been described elsewhere [14]. SPION are prepared in
our lab by mixing iron (II) chloride and iron (III) chloride in the presence of ammonium
hydroxide. First, deoxygenated the solution of NH4OH (0.7M) by nitrogen. Second,
deoxygenated the solution of 12mL HCl (0.1M) by nitrogen and mix FeCl3·6H2O with it. Third,
heat the NH4OH solution at 70 °C. Fourth, Add the FeCl3·6H2O solution into the NH4OH
solution and react for 30min. Then, Add the FeCl2·4H2O in the previous solution with mechanic
agitation of about 3000rpm and waiting for 45min, the dark precipitate will be formed, which
consists of nanoparticles of magnetite. Last, wash it by MiliQ water which has been
deoxygenated and centrifuged four times( 3 times for 3 min and 5000rpm, 1 time for 10 min
and 4500rpm) and preserve it by 50mL 0.1M TMAOH.
2.2.2 Clean of the Forager sponge
An initial conditioning of the sponge consisting on the conversion into its acidic form by
consecutive treatment with 1.0mol/L HCl, double distilled water, and HCl solution at pH 2.5
was carried out in a glass preparative column. A portion of this conditioned sponge was
separated, dried during 24 h, and stored in a desiccator for its use
2.2.3 Loading of SPION on the sponge
The sponge was loaded with SPION by using the nebulizer. The SPION-loaded sponge was
dried during 24 h, and stored in a desiccator for its use. The SPION loading capacity was
0029.00955.0 mmol Fe/ g sponge 2.3 Characterization The SPION, sponge loaded with SPION before using and after using have been characterized
by TEM to see the particle size and dispersion. SPION are highly dispersible in solutions. With
particle sizes of from 6-20 nm, they offer a large surface area and superparamagnetic properties.
2.4 Temperature influence The adsorbent has been used to adsorb the arsenic in the water, the results show that the

adsorption capacity is influenced by the temperature. The adsorption capacity is decreasing as
the temperature increases. That means as temperature increases, the desorption is starting to
occur. Lower temperature helps the adsorbent adsorb the arsenic and higher temperature helps
the adsorbent to desorb the arsenic. So, the inventor adsorbs the arsenic by using the adsorbent
under room temperature and desorbs the arsenic under 70oC.
2.5 Redox potential effect on adsorption- desorption The potassium dichromate has been used to oxidize the As(III) to As(V) and use the Zn powder
or Sn foil to reduce the As(V) to As(III). Since the adsorbent has much higher adsorption
capacity of As(V) than that of As(III), the adsorbent can adsorb the arsenic by oxidizing all of
the As(III) to be As(V) and desorb the arsenic by reducing the As(V) to be As(III).
2.6 column continuous mode The column continuous mode has been made in order to do the adsorption-desorption recycled
processing. The adsorbent could be put inside the column. Once the wastewater which contains
the arsenate and arsenite pass through the column, the arsenate and arsenite is loaded on the
adsorbent and the clean water goes out. After loading, the arsenate and arsenite could be eluted
by passing the hot water (70oC) or hot water combined with Sn. Therefore the adsorbent can be
reused.
Above all, the desorption process can be happened by reducing with the help of higher
temperature and the adsorption process can be happened by oxidizing under room
temperature(if the temperature is lower, for example,10oC, then the adsorption capacity will
higher than that under room temperature, but we consider about the room temperature is normal
and easy to control).
Once finishing the desorption process, the adsorbent can be used again for adsorbing arsenic
under room temperature. And then desorb the arsenic by using the Zn powder under 70oC again.
To repeat this adsorption-desorption process for several cycles, then the adsorbent will be
useless. But the recycled method and process is really amazing since it can be saved a lot of
money for reuse the adsorbent.
2.7 Adsorption-desorption The batch mode and column mode have been used to do the adsorption-desorption process. As
for the batch mode, the arsenic is adsorbed by the adsorbent in a stoppered plastic bottle with
the help of agitating. The desorption process is occurred either by putting the plastic bottle in
the high temperature atmosphere or with the help of Zn powder or Sn. In the column mode, the
arsenic is adsorbed by adsorbent inside the column by passing the wastewater through the
column. The desorption process could be realized by passing the hot water or with the help of
Sn.
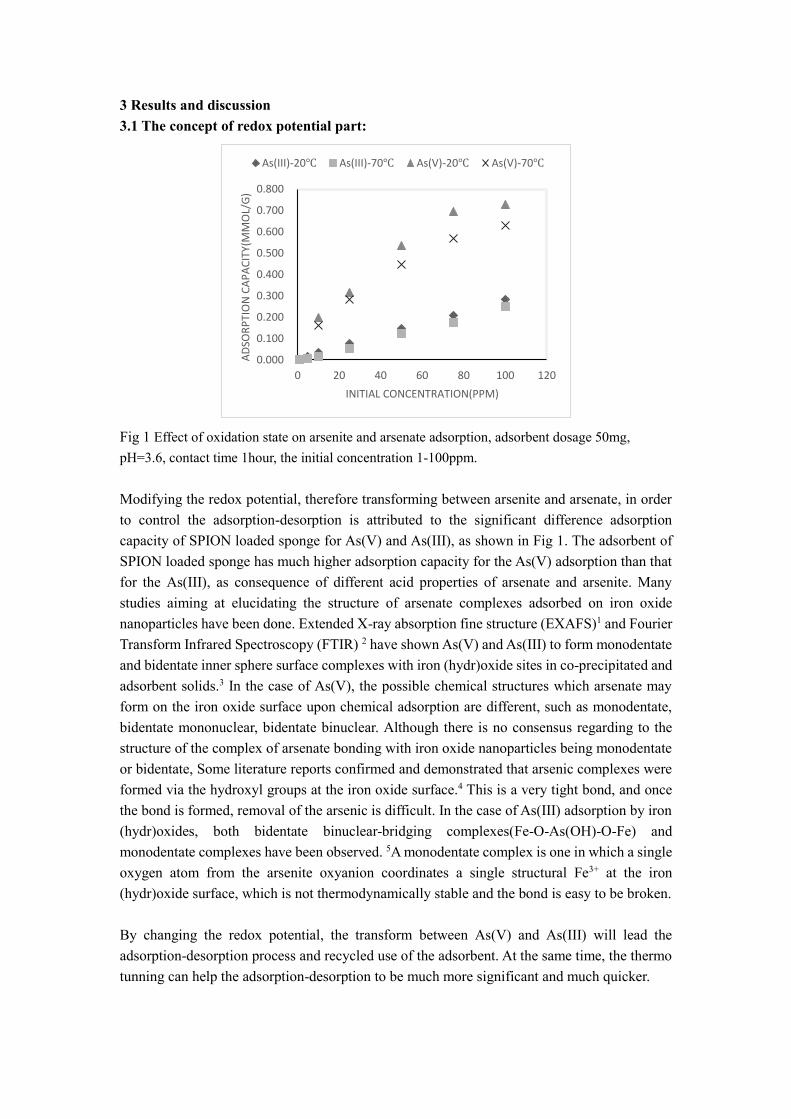
3 Results and discussion 3.1 The concept of redox potential part:
Fig 1 Effect of oxidation state on arsenite and arsenate adsorption, adsorbent dosage 50mg,
pH=3.6, contact time 1hour, the initial concentration 1-100ppm.
Modifying the redox potential, therefore transforming between arsenite and arsenate, in order
to control the adsorption-desorption is attributed to the significant difference adsorption
capacity of SPION loaded sponge for As(V) and As(III), as shown in Fig 1. The adsorbent of
SPION loaded sponge has much higher adsorption capacity for the As(V) adsorption than that
for the As(III), as consequence of different acid properties of arsenate and arsenite. Many
studies aiming at elucidating the structure of arsenate complexes adsorbed on iron oxide
nanoparticles have been done. Extended X-ray absorption fine structure (EXAFS)1 and Fourier
Transform Infrared Spectroscopy (FTIR) 2 have shown As(V) and As(III) to form monodentate
and bidentate inner sphere surface complexes with iron (hydr)oxide sites in co-precipitated and
adsorbent solids.3 In the case of As(V), the possible chemical structures which arsenate may
form on the iron oxide surface upon chemical adsorption are different, such as monodentate,
bidentate mononuclear, bidentate binuclear. Although there is no consensus regarding to the
structure of the complex of arsenate bonding with iron oxide nanoparticles being monodentate
or bidentate, Some literature reports confirmed and demonstrated that arsenic complexes were
formed via the hydroxyl groups at the iron oxide surface.4 This is a very tight bond, and once
the bond is formed, removal of the arsenic is difficult. In the case of As(III) adsorption by iron
(hydr)oxides, both bidentate binuclear-bridging complexes(Fe-O-As(OH)-O-Fe) and
monodentate complexes have been observed. 5A monodentate complex is one in which a single
oxygen atom from the arsenite oxyanion coordinates a single structural Fe3+ at the iron
(hydr)oxide surface, which is not thermodynamically stable and the bond is easy to be broken.
By changing the redox potential, the transform between As(V) and As(III) will lead the
adsorption-desorption process and recycled use of the adsorbent. At the same time, the thermo
tunning can help the adsorption-desorption to be much more significant and much quicker.
0.000
0.100
0.200
0.300
0.400
0.500
0.600
0.700
0.800
0 20 40 60 80 100 120
AD
SOR
PTI
ON
CA
PA
CIT
Y(M
MO
L/G
)
INITIAL CONCENTRATION(PPM)
As(III)-20℃ As(III)-70℃ As(V)-20℃ As(V)-70℃

Fig 2 redox potential-different time-desorption
The experiment of redox potential effect on desorption has been carried under 20oC(shown in
Fig 2). The adsorbent (sponge loaded with SPION) was used for adsorb the arsenate, which
make the surface and porous of the adsorbent is full of arsenate (10.34mg arsenic/g adsorbent).
Then, 50mg of Tin foil was used as the reduction reagent for desorption, and the aqueous
solution pH 3.6 with the contact time from 10-300min. As time goes on, Sn could transform
the arsenate to arsenite, which has weak bond to the iron oxide nanoparticles, therefore desorb
from the adsorbent. That means the Tin change the redox potential, which could help to realize
the desorption process. Arsenate (As(V)) react with Sn in buffered aqueous solutions to
produce arsenite (As(III)).6 The electron transfer reactions can be described in terms of
thermodynamics through the use of standard electrode potentials.7
3.2 Further proof of redox potential part The potassium dichromate (K2Cr2O7) could oxidize the arsenite to arsenate by changing the solution
redox potential.
Table 1 oxidation rate of As(III) to As(V) by potassium dichromate
Initial concentration
of arsenite(ppm)
Concentration of
potassium
dichromate(mmol)
After oxidation,
concentration of
arsenate(ppm)
Conversion rate
94.913 1.33 87.192 91.87%
96.317 1.33 88.615 92.00%
Table 2 reduction rate of As(V) to As(III) by Zn powder
Arsenate loaded
on the
After reduction, the
arsenic left in the
After reduction, the
arsenic left in the
Conversion
rate
0
1
2
3
4
5
6
7
8
9
0 100 200 300 400
As(
V)
con
cen
trat
ion
,pp
m
Time of agitation(min)
Time of agitation vs concentration

sponge(ppm) sponge(20oC)ppm sponge(70oC)ppm
18.569 4.119 1.239 93.33%
18.931 3.780 1.827 90.35%
The oxidizing agent (potassium dichromate) could convert ~92% of arsenite to arsenate (as shown in Table 1). Meanwhile, the reducing reagent (Zn powder) could reduce the arsenate to
arsenite (as shown in Table 2) by changing the redox potential, the conversion rate could be
~90%, which is very high and could help the desorption to happen. The arsenate could be much more adsorbed due to its acidity that provides high proportion of deprotonated species presents
in the media at the pH of study, thus leading to a major contribution in the adsorption capacity.
The sponge-SPION provide more probability to interact with arsenate and react by ligand
exchange to the adsorption system. Thus arsenate has much higher adsorption rate than arsenite.
By changing the redox potential, therefore transforming the arsenite to be arsenate, could help
the adsorption to occur.
3.3 The synergic thermo tunning of redox potential part:
Table3 Combination of temperature effect with redox potential effect for desorption
After adsorption After desorption
(20oC+ reduction)
After desorption
(70oC+ reduction)
adsorbent Sponge
(ppm)
Sponge-
SPION(ppm)
sponge Sponge-
SPION
sponge Sponge-
SPION
concentration 18.569 21.398 3.780 9.165 1.239 7.571
concentration 18.931 21.243 3.532 9.482 1.827 7.323
Table 3 the synergic thermo tunning of redox potential part: shows that in the bed mode, both
of the temperature and redox potential have significant effect on arsenic adsorption-desorption.
It could be combined the temperature effect with redox potential in order to get the better and
stronger desorption process without adding reagents. It shows that in the bed mode, the
adsorbent in the column could firstly adsorb the arsenic and then, the arsenic which are loaded
in the adsorbent could be eluted by hot water with the help of Sn. After elution, the adsorbent
could be reused to adsorb the arsenic again. Which means, the adsorption-desorption recycled
process could be realized and the adsorbent could be reused for several times.
3.4 Column Experiment part

Fig 4 Column mode –different dosage effect on elute concentration. Initial stock solution
concentration=250ppm, T=293K, 1g sponge loaded with SPION, pH=3.6.(Adsorption capacity of
4g sponge-SPION=100.06mg As/g sponge, Adsorption capacity of 1g sponge-SPION=99.14mg
As/g sponge)
The observed data in Fig 4 shows the adsorption capacity obtained using 4g adsorbent(sponge
loaded with SPION) or 1g adsorbent is the same, which indicates the homogeneity of the
adsorbent prepared.
Fig 5 comparison of different methods for desorption
Table 4 comparison of recovery rate by using different methods for desorption
No heating-NaCl Heating+Reduction Reduction Heating+NaNO3
total elute,
mg 86.29 95.79 101.47 93.08
0
50
100
150
200
250
300
0 500 1000 1500 2000
elu
te c
on
cen
trat
ion
,pp
m
Number of bed volumn
bed volumn vs adsorption capacity
4g sponge-SPION
1g sponge-SPION
0
200
400
600
800
1000
1200
1400
1600
0 250 500 750 1000 1250 1500 1750 2000
elu
te c
on
cen
trat
ion
,pp
m
Number of bed volumn
Elution curve of column 2
elution1-Heating-NaNO3

recovery,% 92.80 94.22 96.52 85.64
The comparison of different methods for desorption, the temperature with the help of NaNO3,
the reduction-tuning methods, the thermo tuning of redox potential way as well as the NaCl as
desorption reagent for desorption have been evaluated as shown in Fig 5. In the case of NaCl
at room temperature (no temperature effect and no redox conditions), the 92.80% recovery rate
is due to the strong affinity of the Cl- for Fe(III) present in SPION, helping thus the release of
adsorbed arsenate. However, in the desorption step, the effect of the anions NO3- or Cl-, which
could compete with the arsenic oxyanions therefore could help the desorption process, show
lower recovery rate, which is 85.64% and 92.80% than those by the redox potential tuning
effect, which is 96.52% and 94.22%, respectively. Which means that redox potential tuning has
stronger impact on the desorption process.
Fig 6 elution by different methods with different competing anions
Fig 5 and Fig 6 shows that the temperature and redox potential have significant effect on elution,
which make the desorption to be very efficient. From the Figures, it is clear to see that the
desorption is efficient and complete. The complete desorption process is attributed to the
thermo tuning effect combined with the redox potential function. Furthermore, this completely
desorption results in very “clean ” sponge loaded with SPION, which is fully prepared for the
next cycle of adsorption. The recovery proportion is almost 100%.
(200)
0
200
400
600
800
1000
1200
1400
1600
0 250 500 750 1000 1250 1500 1750 2000 2250
elu
te c
on
cen
trat
ion
,pp
m
Number of bed volumn
Heating-NaNO3
No heat-NaCl
Heating-Na2SO4
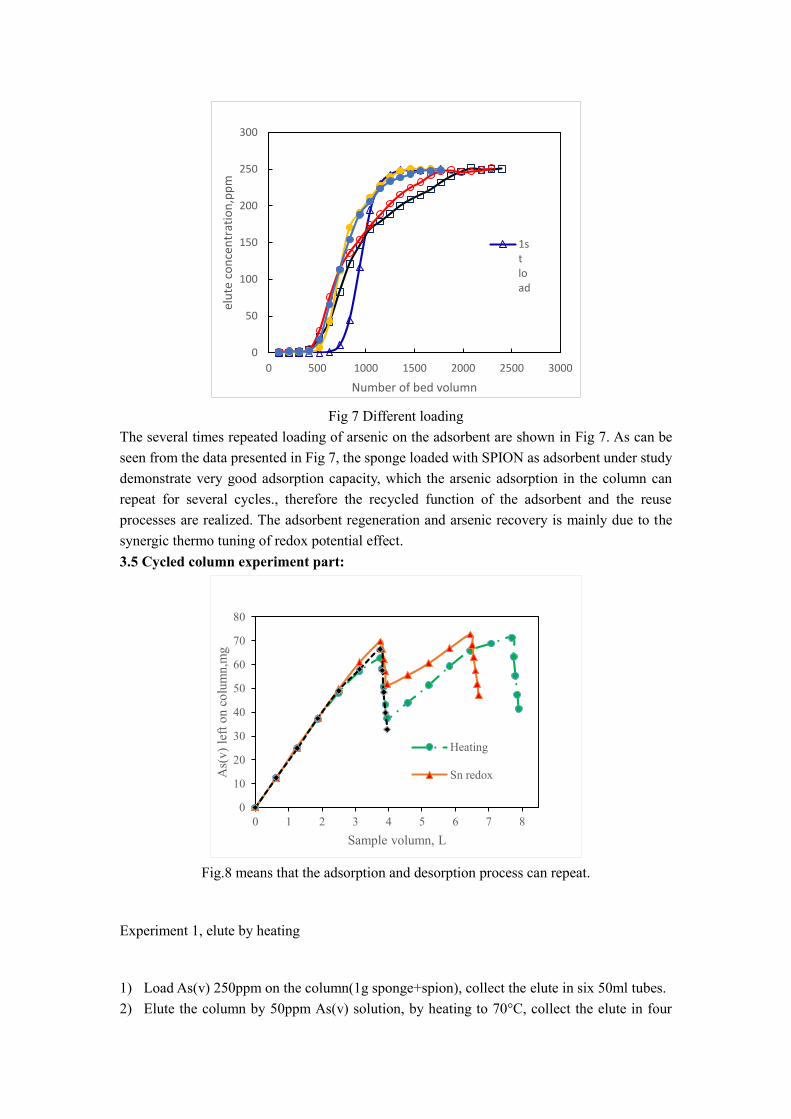
Fig 7 Different loading
The several times repeated loading of arsenic on the adsorbent are shown in Fig 7. As can be
seen from the data presented in Fig 7, the sponge loaded with SPION as adsorbent under study
demonstrate very good adsorption capacity, which the arsenic adsorption in the column can
repeat for several cycles., therefore the recycled function of the adsorbent and the reuse
processes are realized. The adsorbent regeneration and arsenic recovery is mainly due to the
synergic thermo tuning of redox potential effect.
3.5 Cycled column experiment part:
Fig.8 means that the adsorption and desorption process can repeat.
Experiment 1, elute by heating
1) Load As(v) 250ppm on the column(1g sponge+spion), collect the elute in six 50ml tubes.
2) Elute the column by 50ppm As(v) solution, by heating to 70°C, collect the elute in four
0
50
100
150
200
250
300
0 500 1000 1500 2000 2500 3000
elu
te c
on
cen
trat
ion
,pp
m
Number of bed volumn
1stload
0
10
20
30
40
50
60
70
80
0 1 2 3 4 5 6 7 8
As(
v) le
ft o
n co
lum
n,m
g
Sample volumn, L
Heating
Sn redox

50ml tubes.
3) Reload As(v) 250ppm on the column, collect the elute in six 50ml tubes.
4) Elute the column by 50ppm As(v) solution, by heating to 70°C, collect the elute in four
50ml tubes.
Fig.9 means that the desorption effect of the three methods
Experiment 2, elute by Sn-redox
1) Load As(v) 250ppm on the column(1g sponge+spion), collect the elute in six 50ml tubes.
2) Elute the column by 20ppm As(v) solution, by passing the Sn-redox column(80g),collect
the elute in four 50ml tubes.
3) Reload As(v) 250ppm on the column, collect the elute in four 50ml tubes.
4) Elute the column by 20ppm As(v) solution, by passing the Sn-redox column,collect the
elute in four 50ml tubes.
Heating+Redox > Heating > Sn-redox
0
10
20
30
40
50
60
70
80
0 0.5 1 1.5 2 2.5 3 3.5 4 4.5
As(
v) le
ft o
n co
lum
n,m
g
Sample volumn(20ppm),L
As(v) adsorption & desorption on column
Heating
Sn redox
0.00
0.02
0.04
0.06
0.08
0.10
0.12
0.14
0.16
0.18
Heating Sn-redox Heating+Redox
Des
orp
tio
n c
apac
ity,
mg/
ml
Desorption method
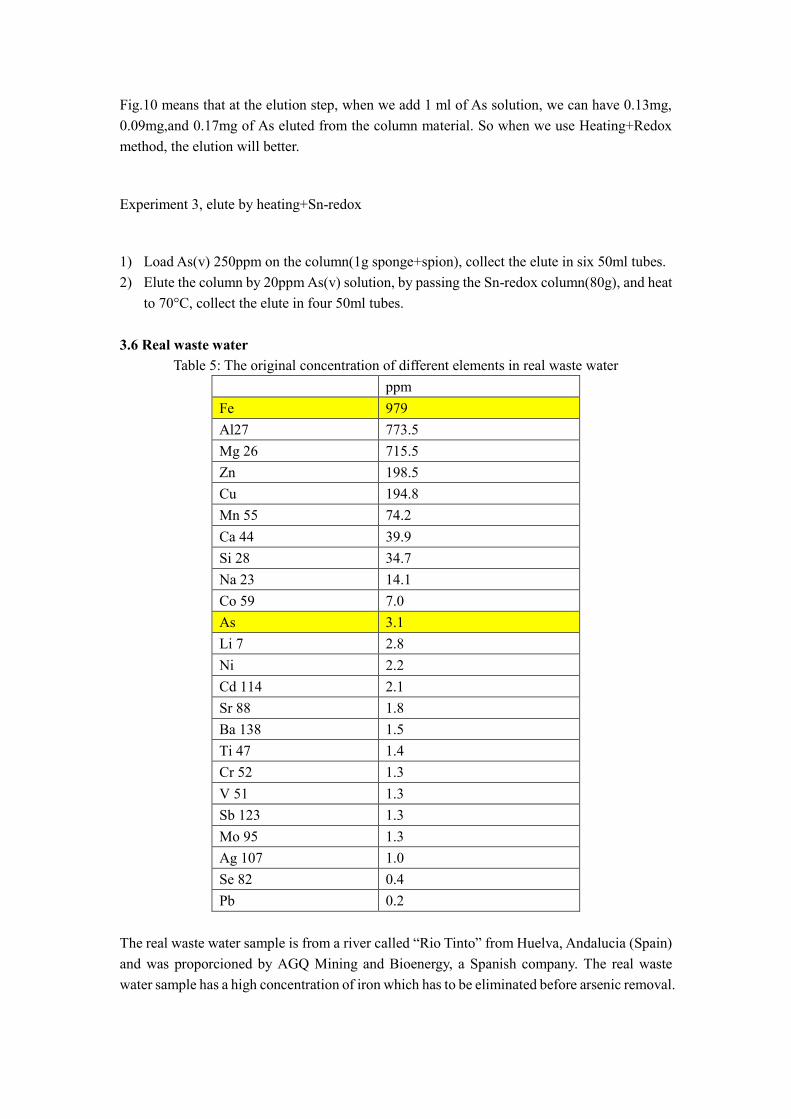
Fig.10 means that at the elution step, when we add 1 ml of As solution, we can have 0.13mg,
0.09mg,and 0.17mg of As eluted from the column material. So when we use Heating+Redox
method, the elution will better.
Experiment 3, elute by heating+Sn-redox
1) Load As(v) 250ppm on the column(1g sponge+spion), collect the elute in six 50ml tubes.
2) Elute the column by 20ppm As(v) solution, by passing the Sn-redox column(80g), and heat
to 70°C, collect the elute in four 50ml tubes.
3.6 Real waste water Table 5: The original concentration of different elements in real waste water
ppm
Fe 979
Al27 773.5
Mg 26 715.5
Zn 198.5
Cu 194.8
Mn 55 74.2
Ca 44 39.9
Si 28 34.7
Na 23 14.1
Co 59 7.0
As 3.1
Li 7 2.8
Ni 2.2
Cd 114 2.1
Sr 88 1.8
Ba 138 1.5
Ti 47 1.4
Cr 52 1.3
V 51 1.3
Sb 123 1.3
Mo 95 1.3
Ag 107 1.0
Se 82 0.4
Pb 0.2
The real waste water sample is from a river called “Rio Tinto” from Huelva, Andalucia (Spain)
and was proporcioned by AGQ Mining and Bioenergy, a Spanish company. The real waste
water sample has a high concentration of iron which has to be eliminated before arsenic removal.

The pretreatment of the sample is bubbled with air for 4 hours, oxidizing the Fe2+ to Fe3+, the
pH of the real waste water (originally 2.45), is changed to be 3.6 by adding NaOH. The
precipitation is removed by using a filter, obtaining “iron-free” wastewater. But at the same
time, the arsenic is also precipitated by iron precipitation. So the “iron-free” wastewater was
doping by 60ppm arsenate solution, therefore the obtained the real wastewater using for our
study is wastewater simulation, which contains inorganic arsenic species, meanwhile has other
ions interferences.
After treating the wastewater, the arsenic is adsorbed and the results are shown below in the
Table 6. As expected, The first sample demonstrate that the method performs well because almost
all the arsenic present in the first 50mL has been adsorbed in the SPION loaded sponge despite other
elements presented in the sample can be adsorbed too (ICP show that interfering elements such as
Zinc or Copper are present in a higher concentration than arsenic), the removal efficiency is very
good at the beginning (97.82% removal). However, if passing more volume of the real waste water,
the removal percentage of the arsenic species is sharping down since the interference ions, which
compete with the arsenic oxyanions to be adsorbed. Therefore, the removal of the interference ions
before adsorbing the arsenic species is very necessary and important. The method will perform
better if instead of one column is used creating a system of columns interconnected.
Table 6 Real waste water absorption results
Sample Real Concentration (ppm) Removal percentatge (%)
Initial
concentration 45,29
After passing
through the resin 44,32
1 0,99 97,82
2 22,66 49,97
3 36,05 20,39
4 39,37 13,08
5 39,63 12,50
6 44,26 2,28
7 43,26 4,49
8 43,99 2,87
9 43,78 3,34
Acknowledgement Dynaphore Inc. (U.S.A.) is gratefully acknowledged for the samples supplied. I also should
thank staffs from GTS, the Department of analytical chemistry. Thanks for their co-operation
and assistance provided before and during the projects. In addition, thanks for the scholarship
support of Chinese Scholar Council for the scholar-grant received.
Reference [1](M.J. Haron, W.M.Z. Wan Yunus, N.L. Yong and S. Tokunaga,1999)
[2](X. Meng, S. Bang and G.P. Korfiatis,2000)

[3](J.H. Min and J.G. Hering,1998)
[4](I. Peleanu, M. Zaharescu, I. Rau, M Crisan, A. Jitianu and A. Meghea,2002)
[5](Dmitri Muraviev, Ana Gonzalo, and Manuel Valiente,1995)
[6](José Antonio Muñoz, Anna Gonzalo, Manuel Valiente, 2008)
[7]Dmitri Muravieva ,1, Ana Gonzaloa, Nikolai A. Tikhonovb, Manuel Valientea,*Ion
exchange on resins with temperature-responsive selectivity II. Thermo-induced
concentration waves in ion-exchange column. Journal of Chromatography A, 802 (1998)
251–261
[8] I-Hsien Lee, Yu-Chung Kuan, Jia-Ming Chern, Equilibrium and kinetics of heavy metal
ion exchange. Journal of the Chinese Institute of Chemical Engineers 38 (2007) 71–84
[9] Dmitri Muraviev, Ana Gonzalo, Nikolai A. Tikhonov, Maxim I. Iljin.
Manuel Valiente. Ion exchange on resins with temperature-responsive selectivity
IV. Influence of solution and column parameters on efficiency of reagentless separation of
copper and zinc using thermo-induced concentration waves technique. Journal of
Chromatography A, 867 (2000) 57–69
[10] Anna Górka, Roman Bocheneka, JolantaWarchoł, Krzysztof Kaczmarskia, Dorota Antos. Ion exchange kinetics in removal of small ions. Effect of salt concentration on
inter- and intraparticle diffusion. Chemical Engineering Science 63 (2008) 637-650
[11]Norman B. Rainer. Ion-adsorbent sponge product. US patent, patent number: 5162404
[12] Raffaela Biesuz, Maria Pesavento, Anna Gonzalo, Manuel Valiente. Sorption of proton
and heavy metal ions on a macroporous chelating resin with an iminodiacetate active
group as a function of temperature. Talanta 47 (1998) 127–136
[13] Dmitri Muraviev, Ana Gonzalo, and Manuel Valiente. Ion Exchange on Resins with
Temperature-Responsive Selectivity. 1 .Ion-Exchange Equilibrium of Cu2+ and Zn2+ on
lminodiacetic and Aminomethylphosphonic Resins. Anal. Chem. 1995, 67,3028-3035.
[14] Dmitri Muraviev* , Anna Gonzalo, Manuel Valiente. Ion exchange on resins with
temperature-responsive selectivity.III. Influence of complex formation stoichiometry on
temperature dependence of resin selectivity. Journal of Chromatography A, 868 (2000)
143–152.


Kinetic and Dynamic Aspects of Selenate and selenite adsorption by Ƴ-Al2O3 nanospheres
Liu Hea, Veronica Verdugoa, Tong Liua, Manuel Valiente
Department de Quimica, Quimica Analitica, Universidad Autonoma de Barcelona, 08193
Bellaterra, Barcelona, Spain
Corresponding author footnote
Centre Grup de Tecniques de Separacio en Quimica.
Tel. +34-935812903
Fax. +34-945811985
Email. [email protected]
Abstract Selenium is a toxic element with a relatively high mobility in the natural waters. In this work
we study the kinetics of adsorption of Se(IV), and Se(VI) on γ-Al2O3 through batch experiments of room temperature and high temperature. Results show that under 20oC, the
maximum adsorption for selenate and selenite on γ-Al2O3 nanospheres was achieved at pH 2 in
6 hours, the adsorption of selenium presents an anion exchange behavior, decreasing at higher
pH values. In the case of Se (VI) the sorption decreases as the percentage of the aqueous species
HSeO4- decreases. While for 70oC, the maximum adsorption was attained in 14 hours. The
kinetic studies show that they are fitted very well to the pseudo-second order, this suggests that
selenium ions were adsorbed onto the aluminum nanosphere surface via chemical interaction.
The adsorption of γ-Al2O3 nanosphere for selenate and selenite were fitted very well to
Frendlich isotherm model, which is indicated that the γ-Al2O3 nanosphere as adsorbent was
multilayer coverage by selenium. The ∆H value of Se (IV) and Se (VI) between 20oC and 70oC were -13.955 KJ mol-1and -3.927 KJ mol-1 shows that lower temperature favor removal
of selenium.
Key words: Selenite, Selenate, kinetic, γ-Al2O3 nanosphere
INTRODUCTION Selenium is a natural trace element present in the Earth´s crust. It is an essential nutrient which
plays an important role in biologic and physiologic body functions. However, when certain
levels are attained, selenium is highly toxic and the effects depend on various factors, including
the oxidation state of the element. The World Health Organisation (WHO) has recommended
the maximum contaminant level (MCL) of 40 g l-1 for total selenium in drinking water3 .
Selenium can exist in different oxidation states, elemental selenium (Se0), selenite (SeO32-),
selenide (Se2-) selenato (SeO42-) and organic selenium. Selenite and selenate are found to be
thermodynamically stable under the pH and redox conditions that are found in most aqueous
media and are the predominant forms1.
Although multiple methods have been reported for selenite and selenate removal, such as

precipitation5, ion exchange6, membrane filtration 6 7, reverse osmosis8, chemical reduction with
iron9,10, microalgae-bacterial treatment 11; adsorption has received more attention due to its high
concentration efficiency and simple procedure that overcome most of the drawbacks of other
techniques.
Numerous adsorbents have been use in selenium adsorption. The adsorbent that have been used
included activated alumina12,13, clays14, iron nanoparticles suspension15, goethite and hematite16
and Fe-loaded activated carbons17. Adsorption of Se by metal oxides such as iron oxides and
aluminum oxide has been demonstrated and shown as promising method for selenium
removal13,18,19.Aluminum and iron are present in most of them, because Al- and Fe-oxides have
high surface areas and point zero charge20. In our study, we choose Al2O3 which is a different type of Al-oxides because of morphological characteristics such as particle/pore size, shape and
structure. It has hollow structure which provide them low density, high specific surface area,
and closely packed interpenetrating networks21. The aim of this work is to investigate the
feasibility and effectiveness of hollow-structured aluminum nanparticles in the sorption of
Se(IV) and Se(VI) ions from acidic aqueous solution. The adsorption mechanism and sorption
properties were studied under static mode of operation.
2 Experimental section 2.1 Reagents and Apparatus The Se(VI) and Se(IV) source was sodium selenate and sodium selenite, Na2SeO4, Na₂SeO₃, ACS reagent from Aldrich(Milwaukee, USA). KAl(SO4). 12H2O, Urea, NaAc and HAc were
ACS reagents from Panreac S.A. (Barcelona, Spain). Selenium concentration in solution was
determined by the ICP-MS technique. In all the experiments, the initial and final pH was
measured, pH was controlled by using a Crison pH meter micropH 2002 (Barcelona, Spain)
with a combined glass electrode.
2.2 Preparation and characterization of the adsorbents The Ƴ-Al2O3 hollow nanospheres adsorbents were readily prepared in our lab by mixing the
aluminium potassium sulfate dodecahydrate(KAl(SO4).12H2O) and Urea(CO(NH2)2) in
distilled water and stirred. The resulting solution was putted into a microwave vessel for heating.
The pH of the resulting solution was adjusted with sodium hydroxide to 9.0. The obtained white
precipitate was sepearated and washed by ethanol. The product was dried in the oven for 12h.
Finally, the resulting form of the material synthesized(r-AlOOH) was converted into nano-r-
Al2O3 by calcinating it in the muffle. We characterized the samples by scanning electron
microscope (SEM ZEISS EVO@ MA 10, Oberkochen, Germany) to see the particle size and
structure.
2.3 Selenium adsorption 2.3.1 Effect of contact time Experiments to determine selenium adsorption in different contact time were carried out at 2-
1440mins in batch conditions.
2.3.2 Effect of initial concentration Experiments to determine selenium adsorption capacity in different initial concentration were
carried out at 2-100ppm in batch conditions.
2.3.3 Effect of pH

Experiments to determine selenium adsorption in different pH were carried out at pH 2.0-11.0
in batch conditions by using stoppered polystyrene tubes. Corresponding agitation was carried
out in a rotary rack shaker during 18 h (this contact time was confirmed in separate experiments).
Once the equilibrium was reached, samples were taken and filtered through 0.22um pore size
filters. Selenium concentration in solution was determined by ICP-MS. Experiments were
repeated for the different conditions a minimum of two times.
2.3 Kinetics on Se(IV ) and Se(VI)Adsorption
The sorption rate was measured by shaking stoppered polystyrene tubes containing 0.005 g of
the adsorbents and 25 mL of a 1 ppm selenate solution in a rotary rack shaker during different
time periods. After the corresponding time, the sample was filtered and the Se(IV) and Se(VI)
content measured by ICP-MS. The saturation degree is calculated by comparison with the initial
Se(IV) and Se(VI) concentration in the solution to evaluate the minimum time for complete
saturation of the adsorbents.
3 Results and discussion 3.1 Characterization of adsorbent material--SEM-EDX analysis
Adsorbent (i.e. γ-Al2O3 nanosphere) shape and size impact the adsorption capacity of the
adsorbent. SEM images of fresh γ-Al2O3 nanospheres indicate that the material is composed of individual, hollow-spherical particles ranging in size from 200 to 400nm that form aggregates
and chains (Fig1a). This small γ-Al2O3 nanospheres provides a larger surface area for contaminant adsorption. Energy Dispersive X-ray (EDX) analysis data (Fig1b) show that the
main compositions of the sample are Al and O, which confirms the nanosphere composition.
The SEM images of γ-Al2O3 nanospheres after adsorption for the selenium was shown in Fig
1c. The adsorption of selenium on the γ-Al2O3 nanospheres did not influence the structure of the nanoparticles.
a)

b)
c) Fig 1 SEM image of γ-Al2O3 nanospheres a) before adsorption of selenium b) EDX analysis c) after adsorption of selenium
3.2 Comparison of AlOOH, γ-Al2O3 , modified γ-Al2O3 for selenium adsorption AlOOH hierarchically nanostructured hollow microspheres21 with nanoflake-like porous
surface textures was fabricated in our lab by chemically induced self-transformation of
metastable solid particles of amorphous aluminum oxyhydroxide produced in situ within
hydrothermal reaction mixtures containing aluminum sulfate and urea.22 The hollow structured
γ-AlOOH microsphere has first been used for selenium adsorption to see how it behaves and
how much the adsorption capacity of the γ-AlOOH microsphere is. AlOOH hierarchically nanostructured microspheres are used as the precursor and template for the preparation of γ-Al2O3 hierarchically nanostructured nanospheres by thermal transformation of AlOOH at
600oC in microwave, and the morphology is well preserved during the thermal transformation
process. This process produce intact hollow sphere spheres of γ-Al2O3. The comparison
between the adsorption of selenate and selenite by γ-AlOOH microsphere and γ-Al2O3
nanospheres has been studied and the results are shown in Fig 2. The γ-Al2O3 nanospheres has
much higher adsorption capacity for adsorbing selenate and selenite than that of γ-AlOOH

microsphere. Therefore, in the following work, we useγ-Al2O3 nanospheres as the adsorbent for selenate and selenite adsorption.
Fig 2 Comparison of Selenium adsorption by AlOOH and by γ-Al2O3
3.3 pH effect on adsorption. The pH level of the aqueous solution is an important variable for the selenium adsorption
process, due to the speciation of the chemical functional groups present on the adsorbent surface.
So, the effect of the aqueous solution pH on the removal efficacy of the aluminum nanoparticles
for selenium was studied between pH 2.0 and 11.0 (acetic/acetate media) under temperature
20oC and 70oC, respectively (Fig 36a, b). Either under 20oC or 70oC, the results obtained
revealed that the adsorption of both Se (IV) and Se (VI) are pH dependent. The observed pH
effect revealed the adsorption of Se (IV) and Se (VI) is maximum at pH 2. The sorption of
selenium presents an anionic behavior, decreasing at more alkaline pH values. In the case of Se
(VI) the sorption decreases as the percentage of the aqueous species HSeO4- decreases. For
sorption edge coincides with the predominance of HSeO32-.
Selenate adsorption primarily occurs under acidic conditions, as shown in Figure 3.36. In the
pH range studied, the dominant selenate species is SeO42-, since the pK2 for selenious acid is
223. With an increase in pH, SeO42- adsorption rapidly decreased. At pH 3.6, the total percent
of adsorption was 91%. When pH was higher than 8.0, very little adsorption was recorded. Because too much acid was required to reduce the pH lower than 3.6 and to maintain a constant
ionic strength, lower pH experiments were not conducted. Se (IV) species in aqueous solution
include selenious acid (H2SeO3), biselenite (HSeO3- ) and selenite (SeO32-). Between pH 3.5
and 9.0, the biselenite ion is the predominant ion in water. Above pH 9.0 selenite species
dominate, and as the pH decreases below pH 3.5, selenious acid dominates. Se(IV) sorption
decreases at alkaline pH due to the decrease of the fraction of aqueous species of HSeO3-.24
0.0
50.0
100.0
150.0
200.0
250.0
300.0
0 50 100 150 200 250
Ad
sorp
tio
n c
apac
ity,
mg/
g
Conc.,ppm
Se(VI)-γ-AlOOH
Se(IV)-γ-AlOOH
Se(IV)-γ-Al2O3
Se(VI)-γ-Al2O3

a)
b)
Fig3.pH effect on selenium adsorption, initial concentration: 1ppm, using 0.005g aluminum
nanosphere as adsorbent. 25mL, 18h. a) 20oC b) 70oC
3.4 Initial concentration effect on selenium adsorption
These experiments are planned to assess the effect of the initial selenate and selenite
concentration on the sorption process and estimate the maximum aluminum nanosphere
adsorption capacity for both species. The adsorption of selenium oxyanions by γ-Al2O3
nanospheres is determined in a proper initial selenium concentration range at pH 2. The effects
of the initial selenium concentration (from 2ppm to 100ppm) on the adsorption capacity by the
γ-Al2O3 nanosphere are shown in Fig 4. The increase of adsorption capacity when the initial selenium concentration increases can be explained in terms of diffusion resistance. Adsorption
capacity equilibrium is reached when the surface of γ-Al2O3 nanosphere does not have free sites for the selenium oxyanions uptake, being saturated.10 It is probably another explanation
that, as mentioned before, a higher probability of collision between adsorbate (arsenate) and
0.0
0.5
1.0
1.5
2.0
2.5
3.0
3.5
4.0
4.5
5.0
0 2 4 6 8 10 12
Ad
sorp
tio
n c
apac
ity(
mg/
g)
pH
Se(IV)
Se(VI)
0.0
0.5
1.0
1.5
2.0
2.5
3.0
3.5
0 2 4 6 8 10
adso
rpti
on
cap
acit
y(m
g/g)
pH
Se(IV)
Se(VI)

adsorbent(sponge loaded with SPION) surface happens as initial concentration increases, which
could overcome the mass transfer resistance between the aqueous and the adsorbent phases.11
.
Fig4. Se ( VI ) and Se(VI) initial concentration effect on selenium adsorption, initial concentration:1ppm, using 0.005g aluminum nanoparticle as adsorbent. 25mL, 18h.
3.5 Adsorption Isotherm modeling.
In these experiments the effect of the initial Se (IV) and Se (VI) concentration on the sorption
of Se (IV) and Se (VI) was studied in order to estimate the maximum loading capacity of γ-
Al2O3 nanoparticles.The obtained results are not fitted to Langmuir isotherm, fitted to the well-
known Freundlich isotherm model, as shown in Fig5. The experimental observation are in good
agreement with the Freundlich model25
0.0
0.5
1.0
1.5
2.0
2.5
3.0
3.5
4.0
0 20 40 60 80 100 120
Ad
sorp
tio
n c
apac
ity(
mm
ol/
g)
initial concentration(ppm)
Se(IV)
Se(VI)

Fig5 Freundlich isotherm model for the adsorption of Se (VI) and Se(IV) by γ-Al2O3
nanosphere
Table 1 Freundlich parameters
logkf 1/n R2
Se(IV) -0.76 0.59 0.9177
Se(VI) -0.58 0.65 0.9249
Regarding the corresponding correlation coefficient values obtained, the Freundlich isotherm
fits the data showing that the adsorption process not rely on a specific sites adsorption
mechanism where adsorbate molecules in the multilayer of the surface not occupy specific sites
on the adsorbent. The adsorbent (here is γ-Al2O3 nanospheres) is not homogeneous and it is heterogeneous.
3.6 Evaluation of thermodynamic parameters The influence of the temperature on the equilibrium constant k con be described by the
following relationship:
ln (k1
k2) =
∆H
R∗ (
1
T1−
1
T2)……………………………………………………………….(1)
And K can be calculated by the equation:
k = qe/Ce………………………………………………………………………………(2)
Table2 Differential enthalpies of complexation for hypothetic nanoparticles with selectivity
dependent on temperatures
343K-293K K(T2)/K(T1) Ln(K2/K1) ∆H,KJ/mol LogKf 1/n
Se(IV) 0.434 -0.835 -13.955 -0.765 0.590
Se(VI) 0.791 -0.235 -3.927 -5.776 0.653
y = 0.6528x - 0.5776R² = 0.9249
y = 0.5902x - 0.7647R² = 0.9177
-4.5
-4.0
-3.5
-3.0
-2.5
-2.0
-1.5
-1.0
-0.5
0.0
-6.0 -5.5 -5.0 -4.5 -4.0 -3.5 -3.0
log
qe(
mm
ol/
g)
log Ce(mmol/L)
Se(IV)
Se(IV)

It was observed from Table 2 the ∆H value shows that lower temperature favor removal of
selenium within the defined range of study. The reaction could be attributed to the fact that the
adsorption of selenium oxyanions onto the surface of the γ-Al2O3 nanosphere could be favored by elimination of water molecule previously bonded to the surface of the adsorbent favoring
increasing in entropy factor. The negative value of ∆H confirms the exothermic nature of the
adsorption process. The ∆H value of Se (IV) and Se (VI) between 20oC and 70oC were -14.0
KJ mol-1and -3.9 KJ mol-1 shows that lower temperature favor removal of selenium.
3.6 Variation of contact time
The variation of contact time is one of the most important parameters in determining the
adsorption potential of an adsorbent material. Adsorption of selenium by aluminum
nanospheres was studied within a time period of 2-4320min (2min to 72h). As shown in Fig 6,
the equilibrium adsorption of selenium can be obtained in 6h under 20oC at pH 2, the adsorption
of selenium presents an anion exchange behavior. The reason could be attributed to the
availability of high surface area as well as porous structural features facilitating easy removal
of selenium. Apart from this, surface hydrophilicity could be a factor responsible for anion-
surface functional group interaction which is entropically favorable. While for 70oC, the
maximum adsorption was attained in 14 hours.
a)
0.0
0.5
1.0
1.5
2.0
2.5
3.0
3.5
4.0
4.5
5.0
0 1000 2000 3000 4000 5000
adso
rpti
on
cap
acit
y(m
g/g)
Time, minutes
Se(IV)
Se(VI)

b)
Fig6 Variation of contact time period, pH=3.6, conc. of Se(IV) or Se(VI): 1ppm; adsorbent
dose:5mg.a)20oC, b) 70oC
3.7 Adsorption kinetics
Adsorption of selenium oxyanions on γ-Al2O3 nanospheres is a complex process. The adsorption mechanism during the present adsorption process involve the potential rate
controlling steps such as mass transport, pore diffusion and chemical reaction processes. Indeed,
the speed of adsorption is strongly influenced by several parameters such as the status of the
solid matrix that has generally heterogeneous reactive sites, and the physical-chemical
conditions under which the adsorption take place.26
In order to understand kinetics process and predict the mechanism involved during the present
adsorption process, the adsorption data was analyzed and two kinetic models were used to fit
the experimental data, namely, pseudo first-order (shown in Fig7) and pseudo-second-
order(shown in Fig 8). The correlation coefficients for Lagergren irreversible first-order model
obtained were low. Therefore, the reaction involved in the present adsorption system is not of
the first-order. The calculated qe by this model differs significantly from those measured during
the experiment. The kinetic studies show that they are fitted very well to the pseudo-second
order, which showed the best fit to the experimental data with the highest squared correlation
coefficients (R2 = 0.999) and the theoretical Qe give acceptable values when compared to the
experimental ones. This suggests that selenium oxyanions were adsorbed onto the aluminum
nanosphere surface via chemical interaction, which is probably involving valency forces
through sharing or exchange of electrons between sorbent and sorbate, and provides the best
correlation of the data.
0.0
0.5
1.0
1.5
2.0
2.5
3.0
3.5
4.0
4.5
5.0
0 500 1000 1500 2000
adso
rpti
on
cap
acit
y, m
g/g
Time, min
Se(IV)
Se(VI)

Fig7 Pseudo-first order adsorption kinetics plots for the adsorption of selenite by γ-Al2O3
nanosphere. The initial concentration of Se (IV) was 1ppm, the adsorbent dosage of γ-Al2O3
nanosphere was 5mg, the volume of the adsorption aqueous system is 25mL. The experiment
was undertaken under 20oC.
a)
y = 0.0088x + 1.1051R² = 0.9409
0.000
0.500
1.000
1.500
2.000
2.500
3.000
3.500
4.000
4.500
0 100 200 300 400
log(
qe-
qt)
T,min
y = 0.2133x + 0.8652R² = 1
y = 0.2454x + 0.9678R² = 0.9997
0
20
40
60
80
100
120
140
160
180
200
0 200 400 600 800
t/q
t, m
in g
/mg
T, min
Se(IV) 20oC
Se(VI) 20oC

b Fig 8 The plot of t qt-1 vs. t showing the linear nature of second-order kinetic model for
aluminum nanoparticle, adsorbent dose, 5mg, pH 3.6. a). Se(IV) and Se(VI), 20oC; b) Se(VI)
and Se(VI), 70oC
Table 3 Pseudo-second order kinetic constants for the adsorption of selenium oxyanions on γ-Al2O3
K2(g/mg min) Qe (mg/g) R2
Se(IV) 20oC 0.054 4.29 1
Se(VI) 20oC 0.058 4.16 0.9998
Se(IV) 70oC 0.053 4.33 0.9996
Se(VI) 70oC 0.048 4,55 0.9985
The analysis of tabular data(shown in Table 3) reveals that values of both qe, exp and qe.cal for
pseudo second order kinetic model are close to each other with relatively higher correlation
coefficient (R2) value. The adsorption kinetics can be conveniently represented by the pseudo
second order model.
3.8 Comparison of adsorption capacity between γ-Al2O3 and modified γ-Al2O3
y = 0.2352x + 7.5578R² = 0.9992
y = 0.2196x + 5.6117R² = 0.9985
0
50
100
150
200
250
0 200 400 600 800 1000
t/q
t()m
in g
/mg
T,min
Se(IV)
Se(VI)

Fig 9 comparison of adsorption capacity between γ-Al2O3 and modified γ-Al2O3
Since some studies on 3-mercaptoproponic acid (3-MPA) coated SPION have been done in
order to modify the change the aggregation properties of SPION and link the the thiol groups
to SPION surface in order to improve the adsorption capacity of SPION. In our case, we try to
modify the γ-Al2O3 nanosphere by using the diethylammonium N,N-diethyldithiocarbamate(DDC), since this organic reagent has the thiol group, which also could
bond with γ-Al2O3 nanosphere, therefore make the nanospheres to be less aggregated and
increase the surface area. Thus, it should improve the adsorption capacity of γ-Al2O3
nanosphere for selenium adsorption. The results of comparison of adsorption capacity
betweenγ-Al2O3 nanosphere and DDC modified γ-Al2O3 nanosphere has shown in Fig 9. It has
demonstrated that DDC modified γ-Al2O3 nanosphere has higher adsorption capacity for
selenate. However, during the pH range of 2.8-6.0, the γ-Al2O3 nanosphere has higher
adsorption capacity for selenite than adsorption capacity of DDC modified γ-Al2O3 nanosphere
for selenite. When pH>6.0, the phenomenon is opposite, the γ-Al2O3 nanosphere has lower
adsorption capacity for selenite than that of DDC modified γ-Al2O3 nanosphere for selenite.
Acknowledgement I should thank staffs from GTS, the Department of analytical chemistry. Thanks for their co-
operation and assistance provided before and during the projects. In addition, thanks for the
scholarship support of Chinese Scholar Council for the scholar-grant received.
0.0
5.0
10.0
15.0
20.0
25.0
30.0
35.0
40.0
2 3 4 5 6 7 8 9
Ads
orpt
ion
capa
city
, mg/
g
pH
modified Se 6+Al2O3 Se6+modified Se 4+Al2O3 Se 4+

Reference
1. Zhang, N., Lin, L.-S. & Gang, D. Adsorptive selenite removal from water using iron-
coated GAC adsorbents. Water Res. 42, 3809–16 (2008).
2. Santos, S., Ungureanu, G., Boaventura, R. & Botelho, C. Selenium contaminated
waters: An overview of analytical methods, treatment options and recent advances in
sorption methods. Sci. Total Environ. 521-522C, 246–260 (2015).
3. Who. Selenium in Drinking-water Background document for development of. World
Heal. Organ. Geneva (2011). doi:WHO/HSE/WSH/10.01/14
4. Goh, K.-H. & Lim, T.-T. Geochemistry of inorganic arsenic and selenium in a tropical
soil: effect of reaction time, pH, and competitive anions on arsenic and selenium
adsorption. Chemosphere 55, 849–59 (2004).
5. Geoffroy, N. & Demopoulos, G. P. The elimination of selenium(IV) from aqueous
solution by precipitation with sodium sulfide. J. Hazard. Mater. 185, 148–54 (2011).
6. Mavrov, V., Stamenov, S., Todorova, E., Chmiel, H. & Erwe, T. New hybrid
electrocoagulation membrane process for removing selenium from industrial
wastewater. Desalination 201, 290–296 (2006).
7. Gui, M. et al. Engineered iron/iron oxide functionalized membranes for selenium and
other toxic metal removal from power plant scrubber water. J. Memb. Sci. 488, 79–91
(2015).
8. Mariñas, B. J. & Selleck, R. E. Reverse osmosis treatment of multicomponent
electrolyte solutions. J. Memb. Sci. 72, 211–229 (1992).
9. Puranen, A., Jonsson, M., Dähn, R. & Cui, D. Immobilization of selenate by iron in
aqueous solution under anoxic conditions and the influence of uranyl. J. Nucl. Mater.
392, 519–524 (2009).
10. Qiu, S. R. et al. Removal of contaminants from aqueous solution by reaction with iron
surfaces. Langmuir 16, 2230–2236 (2000).
11. Zhang, Y. & Frankenberger, W. T. Removal of selenium from river water by a
microbial community enhanced with Enterobacter taylorae in organic carbon coated
sand columns. Sci. Total Environ. 346, 280–5 (2005).
12. Su, T., Guan, X., Tang, Y., Gu, G. & Wang, J. Predicting competitive adsorption
behavior of major toxic anionic elements onto activated alumina: a speciation-based
approach. J. Hazard. Mater. 176, 466–72 (2010).

13. Yamani, J. S., Lounsbury, A. W. & Zimmerman, J. B. Adsorption of selenite and
selenate by nanocrystalline aluminum oxide, neat and impregnated in chitosan
beads. Water Res. 50, 373–81 (2014).
14. Bleiman, N. & Mishael, Y. G. Selenium removal from drinking water by adsorption to
chitosan-clay composites and oxides: Batch and columns tests. J. Hazard. Mater. 183,
590–595 (2010).
15. Olegario, J. T., Yee, N., Miller, M., Sczepaniak, J. & Manning, B. Reduction of Se(VI) to
Se(-II) by zerovalent iron nanoparticle suspensions. J. Nanoparticle Res. 12, 2057–
2068 (2009).
16. Rovira, M. et al. Sorption of selenium(IV) and selenium(VI) onto natural iron oxides:
goethite and hematite. J. Hazard. Mater. 150, 279–84 (2008).
17. Dobrowolski, R. & Otto, M. Preparation and evaluation of Fe-loaded activated carbon
for enrichment of selenium for analytical and environmental purposes. Chemosphere
90, 683–690 (2013).
18. Duc, M. et al. Sorption of selenium anionic species on apatites and iron oxides from
aqueous solutions. J. Environ. Radioact. 70, 61–72 (2003).
19. Kuan, W.-H., Lo, S.-L., Wang, M. K. & Lin, C.-F. Removal of Se(IV) and Se(VI) from
water by aluminum-oxide-coated sand. Water Res. 32, 915–923 (1998).
20. Chan, Y. T., Kuan, W. H., Chen, T. Y. & Wang, M. K. Adsorption mechanism of selenate
and selenite on the binary oxide systems. Water Res. 43, 4412–4420 (2009).
21. Cai, W., Yu, J. & Mann, S. Template-free hydrothermal fabrication of hierarchically
organized ??-AlOOH hollow microspheres. Microporous Mesoporous Mater. 122, 42–
47 (2009).


Synergic thermo tunning of redox potential for clean removal of toxic oxyanions
Liu HE, Tong Liu, Manuel Valiente Department de Quimica, Quimica Analitica, Universidad Autonoma de Barcelona, 08193
Bellaterra, Barcelona, Spain
Corresponding author footnote
Centre Grup de Tecniques de Separacio en Quimica.
Tel. +34-935812903
Fax. +34-945811985
Email. [email protected]
Field of the Invention
The present invention relates to a reagentless recycled method for arsenic removal in water. In
our invention, we develop a new method for Arsenic adsorption-- desorption and sorbent
regeneration with no reagents added by taking advantage of the synergic thermo tunning of
redox potential of the adsorption-desorption system.
State of the art Arsenic is abundant in our environment with both natural and anthropogenic sources which is
considered to be one of the major problems in pollution because of their high toxicity and the
consequent risks for human health(Ernest O. Kartinen Jr., Christopher J. Martin,1995; Le
Zeng,2004; Sushilraj Kanel, Jean – Mark Greneche, Andheechulchoi, 2006). Several countries
have to deal with the problem of arsenic contamination of groundwater, used for drinking water,
such as Bangladesh and India, China, United States, Mexico, Australia, Greece, Italy, Hungary,
etc.
Thus, there is a growing interest in using low-cost methods and materials to remove arsenic
from industrial effluents or drinking water before it may cause significant contamination. In
natural water, arsenic is primarily present in inorganic forms and the dominant arsenic species
are arsenate—As(V) and arsenite-As(III)( R.S. Harisha, K.M. Hosamani , R.S. Keri, S.K.
Nataraj, T.M. Aminabhavi,2010)
The adsorbents and filters have been used for the treatment, including: ferric chloride(M.J.
Haron, W.M.Z. Wan Yunus, N.L. Yong and S. Tokunaga,1999), Fe(III)-doped alginate gels(X.
Meng, S. Bang and G.P. Korfiatis,2000), nanocomposite adsorbent based on silica and iron(III)
oxide(J.H. Min and J.G. Hering,1998), and iron oxide-coated polymeric materials(I. Peleanu,
M. Zaharescu, I. Rau, M Crisan, A. Jitianu and A. Meghea,2002), Fe(III)-loaded resins(Dmitri
Muraviev, Ana Gonzalo, and Manuel Valiente,1995), Fe(III)-loaded sponge(José Antonio
Muñoz, Anna Gonzalo, Manuel Valiente, 2008) are used in arsenic treatment because of the
Fe(III) affinity toward inorganic arsenic species and consequent selectivity of the adsorption
process.
In WO 2014122350A1 a filter for the treatment of liquid comprising a support made from a
polymer material having at least one functional group from the group formed by carboxyl and
thiol, loaded with SPION (SuperParamagnetic Iron oxide Nanoparticles)
In WO 2007/ 032860 a filter for eliminating described arsenic in water comprising a support of
polyacrylonitrile (PAN) loaded with iron hydroxide nanoparticles .
The paper Morillo , D, Valiente , M., Perez , G., "Advances in adsorption Arsenic with
Nanoparticles", Research Project, Master's Degree in Chemical Sciences and Technology ,
Universitat Autònoma de Barcelona , September 2009 , the use of a cellulose sponge as support,
in which SPION has dispersed , for removing arsenic in water.
There is, hower, although the filter or adsorbent has very high quality and efficiency to treat
and adsorb arsenic, if they can not be recovered and reused for several times, it is still very
expensive and it is not very practical. As there are a lot of weaknesses of using reagents to
recover the adsorbent or filter. Some new methods for adsorption-desorption recycled arsenic
treatment and adsorbent/filter regeneration is really needed.
Almost all of the traditional methods have the problems on adsorbent/filter regeneration. Once
the adsorbent/filter becomes exhausted, then, either the metals must be recovered, the
sorbent/filter be regenerated or disposed in a controlled dumping site for toxic substances which
use to be very expensive. Desorption and sorbent/filter regeneration is a critical step
contributing to decrease process costs. A successful desorption process must restore the
sorbent/filter close to its initial properties for effective reuse. In most of the published arsenic
sorption studies (some discussed earlier), desorption/regeneration was not included. Very few
desorption studies are detailed in literature. Furthermore, once arsenic is recovered in the pure
and concentrated form, the problem of its disposal of this concentrated arsenic product must be
addressed. This is a difficult and expensive task. Few attempts have been made to address the
handling of concentrated arsenic wastes. Tuutijärvi T, 2006 has tried five different alkaline
solutions: NaOH, Na2CO3, Na2HPO4, NaHCO3 and NaAc for arsenate batch desorption and
regeneration. But this process also needs to spend a lot of alkaline solution which is very
expensive and is not feasible for industrial sense. Thus, in our invention, we develop a new
method for arsenic adsorption-desorption and sorbent regeneration by taking advantage of the
synergic thermo tunning of redox potential for clean removal of the adsorption system.
The present invention relates to a reagentless method for arsenic (particularly As(V) and As(III))
adsorption-desorption and sorbent regeneration with no reagents added by taking advantage of
the thermodynamic properties and redox potential of the adsorption system. This reagentless
method could not only save a lot of reagent for recovering the sorbent, but also the adsorbent
could be recycled and reused, which is low-cost and practical.
The inventor has studied the adsorption properties of As(V) and As(III) the influence of
temperature and redox potential on the desorption rate. In addition, the inventor has studied the

thermodynamic aspects for realizing the adsorption-desorption process. Besides that, the
oxidation of As(III) to As(V) and the reduction of As(V) to As(III) in order to prove the
concept of redox potential for adsorption-desorption have been studied . More importantly, the
thermodynamic aspects combined with the redox potential effect for controlling the adsorption-
desorption process have been studied.
Detailed Description of the invention The present invention relates to a reagentless method for arsenic (particularly As(V) and As(III))
adsorption-desorption and sorbent regeneration with no reagents added by taking advantage of
the thermodynamic properties and redox potential of the adsorption system.
In this work, the inventor has done the research on the effect of thermal tunning on arsenic
adsorption and also studied the mechanism of thermodynamic properties of this adsorption
system. Furthermore, the inventor has done some study on redox potential of As(III) oxidation
and As(V) reduction.
One of the objectives of the present study includes not only the new methods for arsenic
adsorption-desorption by controlling the temperature or redox potential of reaction condition,
but also some theoretical study which can explain the mechanism of the adsorption-desorption
process. More importantly, we study effects of synergic thermo tunning and redox potential on
the adsorption-desorption process. The aim of the invention is to provide a totally new concept
and reagentless method to recover the arsenic and regenerate the adsorbents for recycled arsenic
removal treatment.
It is accordingly an object of the present invention to provide a highly capacity and
efficiency adsorbent capable of selectively absorbing arsenic from aqueous solution.
It is another object of this invention to provide an adsorbent of the aforesaid nature in the
form of an open-celled sponge loaded with controllable size of nanoparticles.
It is a further object of this invention to provide a method of capable of adsorption-
desorption recycling process by taking advantages of thermo tunning effect.
It is a still further object of this invention to provide a method of capable of aforesaid
adsorption-desorption recycling process by using the concept of redox potential.
It is a yet another object of the invention to provide a method of capable of aforesaid
adsorption-desorption recycling process by synergic thermo tuning of redox potential.
These objects and other objects and advantages of the invention will be apparent from the
following description.
The inventor use the adsorbent to adsorb the arsenic in the water, the results shows that the
adsorption capacity is influenced by the temperature. The adsorption capacity is decreasing as
the temperature increases. That means as temperature increases, the desorption is starting to
occur. Lower temperature helps the adsorbent adsorb the arsenic and higher temperature helps
the adsorbent to desorb the arsenic. So, the inventor adsorbs the arsenic by using the adsorbent
under room temperature and desorbs the arsenic under 70oC.
More importantly, the inventor use the potassium dichromate to oxidize the As(III) to As(V)

and use the Zn powder or Sn to reduce the As(V) to As(III). Since the adsorbent has much
higher adsorption capacity of As(V) than that of As(III), the adsorbent can adsorb the arsenic
by oxidizing all of the As(III) to be As(V) and desorb the arsenic by reducing the As(V) to be
As(III).
The inventor make the column mode in order to do the adsorption-desorption recycled
processing. The adsorbent could be put inside the column. Once the wastewater which contains
the arsenate and arsenite pass through the column, the arsenate and arsenite is loaded on the
adsorbent and the clean water goes out. After loading, the arsenate and arsenite could be eluted
by passing the hot water (70oC) or hot water combined with Sn. Therefore the adsorbent can be
reused.
Above all, the desorption process can be happened by reducing with the help of higher
temperature and the adsorption process can be happened by oxidizing under room
temperature(if the temperature is lower, for example,10oC, then the adsorption capacity will
higher than that under room temperature, but we consider about the room temperature is normal
and easy to control).
Once finishing the desorption process, the adsorbent can be used again for adsorb arsenic under
room temperature. And then desorb the arsenic by using the Zn powder under 70oC again. To
repeat this adsorption-desorption process for several cycles, then the adsorbent will be useless.
But the recycled method and process is really amazing since it can be saved a lot of money for
reuse the adsorbent.
In the first embodiment, the invention is directed to a method to adsorption-desorption
arsenic treatment in aqueous solution. Especially inorganic arsenic species, arsenite and
arsenate. Wherein the arsenate is adorbed by the adsorbent(sponge-SPION) under the pH=3.6
condition under 20°C and the loaded arsenate is desorbed by the reducing agent under 70°C.
In the second embodiment, once the adsorbent is regenerated again(since the desorption
make it clean), the adsorbent can adsorb the arsenate for the second time. The oxidant may help
to change the arsenite to be arsenate, in order to be adsorbed easily.
In the third embodiment, the invention is directed to a reagentless method to adsorption-
desorption recycled arsenic treatment by adjusting the temperature of the adsorption-desorption
process condition.
In the fourth embodiment, the invention is directed to a reagentless method to adsorption-
desorption recycled arsenic treatment by changing the redox potential of the adsorbate
condition.
In the fifth embodiment, the invention is directed to a reagentless to adsorption-desorption
recycled arsenic treatment by synergic thermo tunning of redox potential.
In an embodiment of the invention, the temperatue could be tunned between 5oC to 95oC,
the reducing reagent could be Zn or Sn and the oxidant could be potassium dichromate and
potassium permanganate.

1. Methodology 1.1 Synthesis of iron oxide nanoparticles.
Magnetite nanoparticles are prepared in our lab by mixing iron(II) chloride and iron(III)
chloride in the presence of ammonium hydroxide. First, deoxygenated the solution of NH4OH
(0.7M) by nitrogen. Second, deoxygenated the solution of 12mL HCl (0.1M) by nitrogen and
mix FeCl3·6H2O with it. Third, heat the NH4OH solution at 70 °C. Fourth, Add the FeCl3·6H2O
solution into the NH4OH solution and react for 30min. Then, Add the FeCl2·4H2O in the
previous solution with mechanic agitation of about 3000rpm and waiting for 45min, the dark
precipitate will be formed, which consists of nanoparticles of magnetite. Last, wash it by MiliQ
water which has been deoxygenated and centrifuged four times( 3 times for 3 min and 5000rpm,
1 time for 10 min and 4500rpm) and preserve it by 50mL 0.1M TMAOH.
1.2 Pre-treatment of the Forager sponge
Forager Sponge, an open-celled cellulose sponge which contains a water-insoluble polyamide
chelating polymer. (formed by reaction of polyethyleneimine and nitrilotriacetic acid), was
kindly supplied by Dynaphore Inc. (Richmond,VA,U.S.A.). This material is claimed to contain
free available ethyleneamine and iminodiacetate groups to interact with heavy metals ions by
chelation and ion exchange.
An initial conditioning of the sponge consisting on the conversion into its acidic form by
consecutive treatment with 1.0mol/L HCl, double distilled water, and HCl solution at pH 2.5
was carried out in a glass preparative column. A portion of this conditioned sponge was
separated, dried during 24 h , and stored in a desiccator for its use.
1.3 Loading of nanoparticle on the sponge
The sponge was loaded with iron oxide nanoparticles by using the nebulizer. The SPION-
loaded sponge was dried during 24 h, and stored in a desiccator for its use. The SPION loading
capacity was 0029.00955.0 mmol Fe/ g sponge.
1.4 Characterization
We have synthesized the iron oxide nanoparticles for 5 times. And Each time, prepare three
kinds of sample, including 1/100, 1/250, 1/1000(0.1mL SPION on 10mL TMAOH, 0.1mL
SPION on 25mL TMAOH, 0.1mL SPION on 100mL TMAOH). We characterized the samples
by TEM to see the particle size and dispersion. Iron oxide nanoparticles are highly dispersible
in solutions. With particle sizes of from 6-20 nm, they offer a large surface area and
superparamagnetic properties.
1.5 Adsorption-desorption
We have used the batch mode and column mode to do the adsorption-desorption process. As
for the batch mode, the arsenic is adsorbed by the adsorbent in a plastic bottle with the help of
agitating. The desorption process is occurred either by putting the plastic bottle in the high
temperature atmosphere or with the help of Zn powder or Sn. In the column mode, the arsenic

is adsorbed by adsorbent inside the column by passing the wastewater through the column. The
desorption process could be realized by passing the hot water or with the help of Sn.
Brief description of the figures. The temperature effect part:
Example 1: Fig1a,b,c,d, thermo tunning effect on adsorption-desorption: shows the changing
of temperature for the adsorption-desorption process.
Under 20oC, as time goes on, the adsorption is happened remarkedly, The adsorption process
obtains equilibrium at about 1h. After that, contact time has no effect in heavy metal removal
percentage. Under 70oC, the desorption occurs as contact time increases. Very high adsorption
rates were achieved at the beginning because of the great number of sites available for the
sorption operation, desorption equilibrium were then gradually achieved as time goes on.
Example2: Fig2, thermo tunning effect: shows that in the bed mode, the temperature also has
significant effect on arsenic adsorption, 10oC has better adsorption capability of the adsorbent
than that under 20oC condition, the 70oC has the lowest adsorption capacity for arsenic removal.
Which reveals, as temperature goes down, it will help the adsorbent to adsorb the arsenic, in
opposite, as temperature rise up, it will prevent the adsorbent to adsorb the arsenic. The thermo
tunning effect is very obvious. The effect of temperature could be explained in the
thermodynamic aspect. The adsorption phenomenon is more efficient with the decrease in
temperature. The process is controlled by the adsorbate-adsorbent interaction.
Example 3: Modeling of Arsenic Adsorption by a Ligand-Exchange Process.
A monodantate ligand-exchange mechanism, based on the Fe:As stoichiometry 1:1
previously discussed, is proposed for the adsorption of arsenic(V) on the SPION loaded in the
sponge, as it has been considered for other iron-based materials. The corresponding reactions
can be written as follows
OHAsOFeHxHAsOOHFe xx 2
341
34
With an equilibrium constant
AsHFe
AsK
x
Where As indicates the amount of arsenic species adsorbed on the SPION in the
sponge(mmol/g), Fe indicates the amount of iron adsorbed on the sponge and not complexed
with As(mmol/g), H indicates the concentration of free protons in solution(mmol/g), and
As indicates the free concentrations of the corresponding 34AsO ions in solution(mmol/g)
which have been calculated from the experimental values of total arsenic concentration and pH
of the solution using the pKa values given before.
From equation 1 , defining Y(g/mmol)as
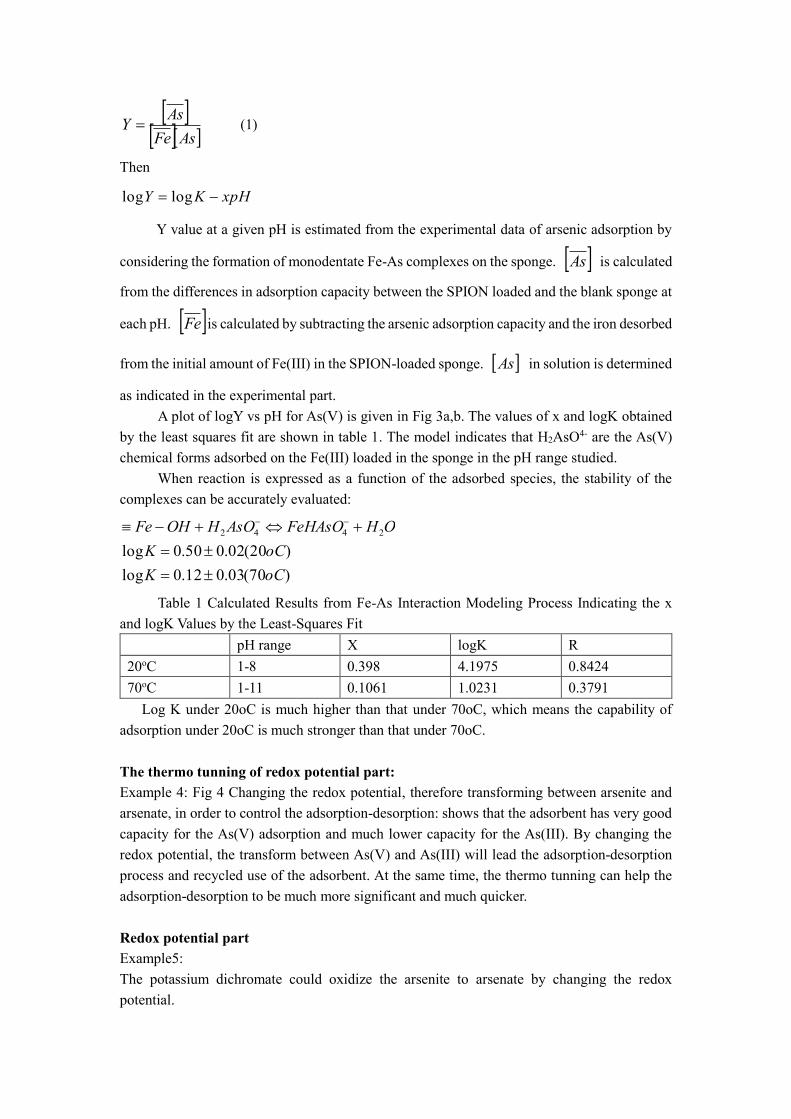
AsFe
AsY (1)
Then
xpHKY loglog
Y value at a given pH is estimated from the experimental data of arsenic adsorption by
considering the formation of monodentate Fe-As complexes on the sponge. As is calculated
from the differences in adsorption capacity between the SPION loaded and the blank sponge at
each pH. Fe is calculated by subtracting the arsenic adsorption capacity and the iron desorbed
from the initial amount of Fe(III) in the SPION-loaded sponge. As in solution is determined
as indicated in the experimental part.
A plot of logY vs pH for As(V) is given in Fig 3a,b. The values of x and logK obtained
by the least squares fit are shown in table 1. The model indicates that H2AsO4- are the As(V)
chemical forms adsorbed on the Fe(III) loaded in the sponge in the pH range studied.
When reaction is expressed as a function of the adsorbed species, the stability of the
complexes can be accurately evaluated:
)70(03.012.0log
)20(02.050.0log2442
oCK
oCK
OHFeHAsOAsOHOHFe
Table 1 Calculated Results from Fe-As Interaction Modeling Process Indicating the x
and logK Values by the Least-Squares Fit
pH range X logK R
20oC 1-8 0.398 4.1975 0.8424
70oC 1-11 0.1061 1.0231 0.3791
Log K under 20oC is much higher than that under 70oC, which means the capability of
adsorption under 20oC is much stronger than that under 70oC.
The thermo tunning of redox potential part: Example 4: Fig 4 Changing the redox potential, therefore transforming between arsenite and
arsenate, in order to control the adsorption-desorption: shows that the adsorbent has very good
capacity for the As(V) adsorption and much lower capacity for the As(III). By changing the
redox potential, the transform between As(V) and As(III) will lead the adsorption-desorption
process and recycled use of the adsorbent. At the same time, the thermo tunning can help the
adsorption-desorption to be much more significant and much quicker.
Redox potential part Example5:
The potassium dichromate could oxidize the arsenite to arsenate by changing the redox
potential.

Table 2 oxidation rate of As(III) to As(V) by potassium dichromate
Initial concentration
of arsenite(ppm)
Concentration of
potassium
dichromate(mmol)
After oxidation,
concentration of
arsenate(ppm)
Conversion rate
94.913 1.33 87.192 91.87%
96.317 1.33 88.615 92.00%
The Zn powder could reduce the arsenate to arsenite by changing the redox potential.
Table 3 reduction rate of As(V) to As(III) by Zn powder
Arsenate loaded on
the sponge(ppm)
After reduction, the
arsenic left in the
sponge(20oC)ppm
After reduction, the
arsenic left in the
sponge(70oC)ppm
18.569 4.119 1.239
18.931 3.780 1.827
The synergic thermo tunning of redox potential part: Example 6: Fig 5 the synergic thermo tunning of redox potential part: shows that in the bed
mode, both of the temperature and redox potential have significant effect on arsenic desorption.
It could be combined the temperature effect with redox potential in order to get the better and
stronger desorption process without adding reagents. It shows that in the bed mode, the
adsorbent in the column could firstly adsorb the arsenic and then, the arsenic which are loaded
in the adsorbent could be eluted by hot water with the help of Sn. After elution, the adsorbent
could be reused to adsorb the arsenic again. Which means, the adsorption-desorption recycled
process could be realized and the adsorbent could be reused for several times.
The real model of continuous mode for treating the real waste water Example 7: Fig 6 the continuous waste water which contains 50ppm As(V) pass through the
column. At the beginning, the arsenic is adsorbed on the adsorbent until the saturation is reached;
Once the saturation reached, the waste water continue to pass through the column, but we
change adsorption condition, for example, to change the temperature or redox potential, then
the adsorption change to be desorption and the striping solution is starting to be highly
concentrated arsenic solution. Fig 6.1 shows that the adsorption-desorption process could be
repeated, therefore the adsorbent could be used for several times by changing the temperature
or redox potential. Fig 6.2 investigate the comparison of the effect of temperature and redox
potential on desorption, it shows that temperature with redox potential has the best effect on the
desorption process. Fig 6.3 shows that at the elution step, when we add 1 ml of As solution, we
can have 0.13mg, 0.09mg,and 0.17mg of As eluted from the column material. So when we use
Heating+Redox method, the elution will be the best.
Claims
1- The method for arsenic adsorption-desorption recycled process could be controlled by
thermo tunning, or redox potential, or synergic of both. As the temperature goes up, The
adsorption process can be changed to desorption process. And vice versa. In addition, the
change of the redox potential can help the adsorption process transformed to be
desorption process and vice versa.
2- If the claim 1 method is controlled by thermo tunning, the temperature could be between

1oC to 99oC.
3- According to claim 2, the adsorption can be done under room temperature and the
desorption can be done under 70oC.
4- According to claim 1, the redox potential can be changed by reducing agent and oxidant.
5- According to claim 4, the reducing agent could be the one which has lower standard
redox potential than that of arsenic, for example, Zn or Sn, and the oxidant could be the
one which has higher standard redox potential than that of arsenic, for example,
potassium dichromate or potassium permanganate.
6-According to claim 1, the redox potential could also be changed by external voltage.
7-According to claim 1, the synergic of lower temperature with higher redox potential could
lead to very strong adsorption capacity. On the opposite, the synergic of higher temperature
with lower redox potential could lead to desorption.
8-According to claim 7, the synergic of 10oC with oxidant make the adsorption process and
the synergic of 70oC with reducing reagent make the desorption process.
9 – The adsorbent could be any kind of adsorbent which has the good capacity for arsenic
adsorption.
10-The adsorbent could be made by sponge--a polymeric material having at least one
functional group formed by carboxyl and thiol.
11- The adsorbent could be made by sponge loaded with the SPION which is loaded on the
sponge by liquid spray method.
12 - The sponge of claim 10, wherein said sponge are an open-celled cellulose sponge which
contains a water-insoluble polyamide chelating polymer, eould be provided by cleanway
company.
13 -The SPION according to claims 11, wherein said SPION has an average particle size
between 15 nm and 100 nm.

a)
b)
0.00
0.01
0.02
0.03
0.04
0.05
0.06
0.07
0.08
0.09
0 50 100 150 200 250 300
LOA
D C
AP
AC
ITY(
MM
OL/
G)
TIME (MIN)
0.00
0.01
0.02
0.03
0.04
0.05
0.06
0.07
0.08
0 20 40 60 80
LOA
D C
AP
AC
ITY(
MM
OL/
G)
TIME(MIN)

c)
d)
Fig 1 The effect of contact time on the adsorption capacity , a). from 10min to 240min, 20oC,
b). from 2min to 60min, 20oC, c). from 10min to 240min, 70oC, d). from 2min to 60min, 70oC,
0.00
0.01
0.02
0.03
0.04
0.05
0.06
0.07
0 50 100 150 200 250 300
LOA
D C
AP
AC
ITY(
MM
OL/
G)
TIME(MIN)
0.00
0.01
0.02
0.03
0.04
0.05
0.06
0.07
0.08
0 20 40 60 80 100 120
LOA
D C
AP
AC
ITY(
MM
OL/
G)
TIME(MIN)

Fig 2 The thermo tunning effect on arsenic adsorption
a)
b) Fig 3 Modeling of arsenic species adsorption on the SPION-loaded in the sponge : linear
-0.5
0
0.5
1
1.5
2
2.5
3
0 50 100 150
CP
(MM
OL
AS/
G F
E)
BV
70oC 20oC 10oC
y = -0.398x + 4.1975R² = 0.8424
0.00
0.50
1.00
1.50
2.00
2.50
3.00
3.50
4.00
4.50
0 2 4 6 8 10
LOG
Y
PH
y = -0.1061x + 1.0231R² = 0.3791
-0.4
-0.2
0.0
0.2
0.4
0.6
0.8
1.0
1.2
1.4
1.6
0 2 4 6 8 10 12
LOG
Y
PH

relationship between logY and pH for As(V). a) 20oC, b) 70oC
Fig 4 changing of redox potential, therefore transforming between the arsenite and arsenate,
in order to control the adsorption-desorption.
Fig 5 a column mode for adsorption-desorption, loading-elution
Ad
sorp
tio
n c
apac
ity(
mm
ol/
g)
Initial concentration(ppm)
As(III)-20℃
As(III)-70℃
As(V)-20℃
As(V)-70℃
0.000
0.020
0.040
0.060
0.080
0.100
0.120
0.140
0.160
0.180
0
50
100
150
200
250
300
0 500 1000 1500 2000
Ad
sorp
tio
n c
apac
ity,
mM
/g s
po
nge
elu
te c
on
cen
trat
ion
,pp
m
Number of bed volumn
Column 1 and column 2
column 1
column 2
column1capacity

Fig 5b Temperature and reduction effect on elution
Fig.6.a means that the adsorption and desorption process can repeat.
0
200
400
600
800
1000
1200
1400
1600
0 250 500 750 1000 1250 1500 1750 2000
elu
te c
on
cen
trat
ion
,pp
m
Number of bed volumn
Elution curve of column 2
elution2-Reduction
elution1-Heating
elution3-both
0
10
20
30
40
50
60
70
80
0 1 2 3 4 5 6 7 8
As(
v) le
ft o
n co
lum
n,m
g
Sample volumn, L
As(v) adsorption & desorption on column
Heating
Sn redox
Heating+Redox

Fig.6.b means that the desorption effect of the three methods :
Heating+Redox > Heating > Sn-redox
Fig.6.c means that at the elution step, when we add 1 ml of As solution, we can have 0.13mg,
0.09mg,and 0.17mg of As eluted from the column material. So when we use Heating+Redox
method, the elution will better.
0
10
20
30
40
50
60
70
80
0 0.5 1 1.5 2 2.5 3 3.5 4 4.5
As(
v) le
ft o
n co
lum
n,m
g
Sample volumn(20ppm),L
As(v) adsorption & desorption on column
Heating
Sn redox
Heating+Redox
0.00
0.02
0.04
0.06
0.08
0.10
0.12
0.14
0.16
0.18
Heating Sn-redox Heating+Redox
Des
orp
tio
n c
apac
ity,
mg/
ml
Desorption method
