development of pavement structural capacity requirements
TRANSCRIPT

Development of Pavement Structural Capacity Requirements for Innovative Pavement Decision-Making and Contracting: Phase II
http://www.virginiadot.org/vtrc/main/online_reports/pdf/16-r20.pdf
JAMES M. BRYCE Graduate Research Assistant, Center for Sustainable Transportation Infrastructure, Virginia Tech Transportation Institute GERARDO W. FLINTSCH, Ph.D., P.E. Director, Center for Sustainable Transportation Infrastructure, Virginia Tech Transportation Institute, and Professor, Charles E. Via, Jr. Department of Civil and Environmental Engineering, Virginia Tech SAMER W. KATICHA, Ph.D. Senior Research Associate, Center for Sustainable Transportation Infrastructure, Virginia Tech Transportation Institute BRIAN K. DIEFENDERFER, Ph.D., P.E. Associate Principal Research Scientist, Virginia Transportation Research Council ALEX SARANT Undergraduate Research Assistant, Center for Sustainable Transportation Infrastructure, Virginia Tech Transportation Institute
Final Report VTRC 16-R20

Standard Title Page - Report on Federally Funded Project
1. Report No.: 2. Government Accession No.: 3. Recipient’s Catalog No.:
FHWA/VTRC 16-R20
4. Title and Subtitle: 5. Report Date:
Development of Pavement Structural Capacity Requirements for Innovative Pavement
Decision-Making and Contracting: Phase II
June 2016
6. Performing Organization Code:
7. Author(s):
James M. Bryce, Gerardo W. Flintsch, Ph.D., P.E., Samer W. Katicha, Ph.D., Brian
K. Diefenderfer, Ph.D., P.E., and Alex Sarant
8. Performing Organization Report No.:
VTRC 16-R20
9. Performing Organization and Address:
Virginia Tech Transportation Institute
3500 Transportation Research Plaza (0536)
Blacksburg, VA 24061
10. Work Unit No. (TRAIS):
11. Contract or Grant No.:
103933
12. Sponsoring Agencies’ Name and Address: 13. Type of Report and Period Covered:
Virginia Department of Transportation
1401 E. Broad Street
Richmond, VA 23219
Federal Highway Administration
400 North 8th Street, Room 750
Richmond, VA 23219-4825
Final Contract 2012-2014
14. Sponsoring Agency Code:
15. Supplementary Notes:
16. Abstract:
The structural capacity of a pavement has been shown to be a good indicator of the required maintenance and expected
performance of pavements. However, results in the literature provide few indices for rigid and composite pavements.
This study developed an index that produced promising results for use with composite pavements. The index relates
deflection measurements to the performance of the pavement. Limited conclusions could be drawn from the results of rigid
pavement testing due to the limited sample size and scope of the available data. The report presents steps for including the
structural indices in pavement evaluation and management processes and a tool that can be used by engineers to calculate the
structural indices for flexible and composite pavements based on defined input parameters.
A number of recommendations for implementation are made based on the findings of this study.
17 Key Words: 18. Distribution Statement:
Deflection Testing, Non-Destructive Evaluation, Network-Level
Decision Making, Structural Capacity Index
No restrictions. This document is available to the public
through NTIS, Springfield, VA 22161.
19. Security Classif. (of this report): 20. Security Classif. (of this page): 21. No. of Pages: 22. Price:
Unclassified Unclassified 45
Form DOT F 1700.7 (8-72) Reproduction of completed page authorized

FINAL REPORT
DEVELOPMENT OF PAVEMENT STRUCTURAL CAPACITY REQUIREMENTS
FOR INNOVATIVE PAVEMENT DECISION-MAKING AND CONTRACTING:
PHASE II
James M. Bryce
Graduate Research Assistant
Center for Sustainable Transportation Infrastructure
Virginia Tech Transportation Institute
Gerardo W. Flintsch, Ph.D., P.E.
Director
Center for Sustainable Transportation Infrastructure
Virginia Tech Transportation Institute
and
Professor
Charles E. Via, Jr. Department of Civil and Environmental Engineering
Virginia Tech
Samer W. Katicha, Ph.D.
Senior Research Associate
Center for Sustainable Transportation Infrastructure
Virginia Tech Transportation Institute
Brian K. Diefenderfer, Ph.D., P.E.
Associate Principal Research Scientist
Virginia Transportation Research Council
Alex Sarant
Undergraduate Research Assistant
Center for Sustainable Transportation Infrastructure
Virginia Tech Transportation Institute
VTRC Project Manager
Brian K. Diefenderfer, Ph.D., P.E., Virginia Transportation Research Council
In Cooperation with the U.S. Department of Transportation
Federal Highway Administration
Virginia Transportation Research Council
(A partnership of the Virginia Department of Transportation
and the University of Virginia since 1948)
Charlottesville, Virginia
June 2016
VTRC 16-20

ii
DISCLAIMER
The project that is the subject of this report was conducted under contract for the Virginia
Department of Transportation, the Virginia Transportation Research Council. The contents of
this report reflect the views of the authors, who are responsible for the facts and the accuracy of
the data presented herein. The contents do not necessarily reflect the official views or policies of
the Virginia Department of Transportation, the Commonwealth Transportation Board, or the
Federal Highway Administration. This report does not constitute a standard, specification, or
regulation. Any inclusion of manufacturer names, trade names, or trademarks is for
identification purposes only and is not to be considered an endorsement.
Each contract report is peer reviewed and accepted for publication by staff of the
Virginia Transportation Research Council with expertise in related technical areas. Final
editing and proofreading of the report are performed by the contractor.
Copyright 2016 by the Commonwealth of Virginia.
All rights reserved.

iii
ABSTRACT
The structural capacity of a pavement has been shown to be a good indicator of the
required maintenance and expected performance of pavements. However, results in the literature
provide few indices for rigid and composite pavements.
This study developed an index that produced promising results for use with composite
pavements. The index relates deflection measurements to the performance of the pavement.
Limited conclusions could be drawn from the results of rigid pavement testing due to the limited
sample size and scope of the available data. The report presents steps for including the structural
indices in pavement evaluation and management processes and a tool that can be used by
engineers to calculate the structural indices for flexible and composite pavements based on
defined input parameters.
A number of recommendations for implementation are made based on the findings of this
study.

1
FINAL REPORT
DEVELOPMENT OF PAVEMENT STRUCTURAL CAPACITY REQUIREMENTS
FOR INNOVATIVE PAVEMENT DECISION-MAKING AND CONTRACTING:
PHASE II
James M. Bryce
Graduate Research Assistant
Center for Sustainable Transportation Infrastructure
Virginia Tech Transportation Institute
Gerardo W. Flintsch, Ph.D., P.E.
Director
Center for Sustainable Transportation Infrastructure
Virginia Tech Transportation Institute
and
Professor
Charles E. Via, Jr. Department of Civil and Environmental Engineering
Virginia Tech
Samer W. Katicha, Ph.D.
Senior Research Associate
Center for Sustainable Transportation Infrastructure
Virginia Tech Transportation Institute
Brian K. Diefenderfer, Ph.D., P.E.
Associate Principal Research Scientist
Virginia Transportation Research Council
Alex Sarant
Undergraduate Research Assistant
Center for Sustainable Transportation Infrastructure
Virginia Tech Transportation Institute
INTRODUCTION
Pavement condition is classified into two main categories: the structural condition and the
functional condition (Park et al., 2007). The failure of a pavement (i.e., the inability of the
pavement to carry traffic at a specified level of service) is generally measured in terms of
functional condition. For example, a pavement may be said to have failed if the roughness of the
pavement exceeds certain thresholds. This differs from the structural condition of a pavement,
which is generally not perceived directly by the user. The structural condition of the pavement
describes the ability of the pavement to carry its design load without appreciable permanent
deformation or damage (Park et al., 2007). The structural condition of the pavement has a direct
impact on the functional performance of the pavement (Bryce et al., 2013). As the structural

2
condition of the pavement deteriorates, the rate of change of the functional condition increases.
Therefore, a pavement with poor structural condition will fail more rapidly than a pavement with
adequate structural condition, as measured in terms of functional condition.
Research has shown that a needs analysis for the pavement network can be improved if
the structural capacity of pavements is included in network-level pavement management
(Zaghloul et al., 1998; Zhang et al., 2003; Bryce et al., 2013). However, literature documenting
the development of structural capacity indices for the network-level evaluation has generally
been limited to flexible pavements (Ali and Tayabji, 1998; Zhang et al., 2003; Chakroborty et al.,
2007; Bryce et al., 2013). It is generally accepted that deflection tests conducted at the network
level on rigid pavements provide little to no useful information regarding expected performance
(Zhang et al., 2003), or no generally accepted model has been developed, as in the case of
composite pavements.
This project continues and expands upon an earlier Virginia Department of
Transportation (VDOT) study that focused on the structural evaluation of pavements at the
network level to enhance the quality of decision-making within the VDOT pavement
management system (PMS). The first phase of this project, titled “Developing a Network-Level
Structural Capacity Index for Structural Evaluation of Pavements,” developed and proposed a
structural capacity index for asphalt pavements (Bryce et al., 2013) and presented data from a
limited number of sections on VDOT’s interstate network. The developed Modified Structural
Index (MSI) uses the effective structural number (SNeff) of the pavement and a measure of the
required structural number of the pavement (SNReq) to create an index that could then be used to
determine the structural adequacy of the pavement section. Two important findings from the
first phase were that (1) traffic greatly influenced the structural adequacy of a pavement (as
measured by the MSI) and (2) the MSI could be used to predict the performance (i.e., the rate of
deterioration of the functional condition over time) of a pavement segment more accurately than
empirical estimates based on historic functional condition deterioration rates of similar
pavements.
PURPOSE AND SCOPE
The scope of this project encompassed two tasks:
1. Calculate MSI values for the entire interstate pavement network for flexible
pavements, and develop plots of the data for use by VDOT district pavement
engineers. This effort expanded on the pilot study of Bryce et al. (2013) and obtained
the MSI of all roadway sections where network-level falling weight deflectometer
(FWD) data are available. These MSI values were summarized by counties.
2. Determine if a network-level structural-based condition index for concrete-surfaced
and composite pavements can be developed and implemented in the VDOT PMS.
For the first task, all the deflection data for flexible interstate pavements were compiled
into a single database, along with the traffic and pavement depth information obtained from the
VDOT PMS. The MSI procedure described in Bryce et al. (2013) was then used to evaluate the

3
flexible pavement network. For the second task, the existing literature that focused on methods
to implement pavement structural condition information into network-level pavement
management applications was reviewed. The current VDOT methodology used to incorporate
structural information into the network-level decision process was also thoroughly evaluated.
The different methods found in the literature were then evaluated by comparing the predicted
performance (using the models found in literature and developed in this report) to the actual
performance of the pavements (taken from the VDOT data). Finally, improved indices for
composite and rigid pavements were developed based on VDOT data.
BACKGROUND
VDOT Structural Capacity Tests
From 2005 to 2007, VDOT conducted structural capacity tests using the FWD along its
entire interstate network at a spacing of 0.2 mi (Diefenderfer, 2008). The effectiveness of the
testing protocol and frequency was evaluated and reported in Alam et al. (2007) and Galal et al.
(2007). The FWD is a static device that imparts a pulse load at the pavement surface and
measures the resulting pavement deflection. The response from the pulse load is measured by a
set of geophones spanned radially across the pavement surface. The FWD is the most
widespread tool used to non-destructively assess the structural capacity of pavements (Hadidi
and Gucunski, 2010). Additional details of the FWD can be found in MACTEC (2006).
Current VDOT Practice
Data Collection
Data collection and management practices are critical to assuring that VDOT manages its
more than 125,000 lane-miles of roads throughout the state as efficiently as possible. Data
collection practices include evaluating the functional condition of the entire interstate and
primary road networks every year, and the secondary road network every 2 to 3 years. For
flexible and composite pavement sections, the distress data collection process includes
evaluating captured digital images using automated systems (Chowdhury, 2010). The collection
of the pavement distress data has been contracted to an outside contractor since 2006. The
contractor uses a vehicle equipped with continuous digital imaging, automated crack detection,
and sensors that measure roughness and rutting data (VDOT, 2010). Rigid pavement sections
are manually rated. The final data set is stored as part of the VDOT PMS, along with databases
of historical pavement condition and construction history, among other information.
Rigid Pavements
The collected distress data are combined into a set of indices that provide a measure of
the functional condition of the pavement. The indices developed are different for the two types
of rigid pavements: continuous reinforced concrete (CRC) pavement and jointed concrete
pavement (JCP). The distress indices used for CRC are known as the Concrete Distress Rating
(CDR) and the Concrete Punch-out Rating (CPR) (VDOT, 2011). The index used for JCP is the
Slab Distress Rating (SDR). All indices have a discrete scale that ranges from 0 to 100. Table 1

4
and Table 2 show the index ranges that are expected to trigger the different maintenance
categories during a network-level evaluation. Table 1 shows that preventive maintenance is not
a maintenance category used for CRC pavements.
Table 1. Maintenance Activities and Index Ranges for CRC Pavements (VDOT, 2011)
Maintenance Action CDR/CPR Range
Do Nothing (DN) ≥80
Corrective Maintenance (CM) 65-79
Restorative Maintenance (RM) 50-64
Major Rehabilitation/Reconstruction (RC) <50
Table 2. Maintenance Activities and Index Ranges for JCP (VDOT, 2011)
Maintenance Action SDR Range
Do Nothing (DN) ≥ 80
Preventive Maintenance (PM) 70 – 79
Corrective Maintenance (CM) 60 – 69
Restorative Maintenance (RM) 50 – 59
Major Rehabilitation/Reconstruction (RC) < 50
Composite Pavements
The indices calculated for composite pavements are the same as the ones used for flexible
pavements. That is, two different indices (i.e., the Load-related Distress Rating [LDR] and the
Non-load-related Distress Rating [NDR]) are calculated from the data collected during the
distress survey; the minimum value of the two is defined as the Critical Condition Index (CCI).
The LDR is calculated from load-related distresses, such as fatigue cracking in the wheel path
(VDOT, 2010). The NDR is calculated from non-load-related distresses, such as construction
deficiencies, bleeding, etc. (VDOT, 2010). CCI values range from 0to 100; the index ranges that
are expected to trigger maintenance actions during a network-level evaluation are shown in
Table 3.
Table 3. Pavement Condition Definitions (VDOT, 2010)
Index Scale (CCI) Pavement Condition Likelihood of Corrective Action
90 and Above Excellent Very Unlikely
70-89 Good Unlikely
60-69 Fair Possibly
50-59 Poor Likely
49 and Below Very Poor Very Likely
Deflection Data Collection
Network-level deflection data were collected between 2005 and 2007 on approximately
2,300 directional miles (3,700 directional km) of interstate pavements. Additional details about

5
the collection of the deflection data can be found in Diefenderfer (2008). The deflection testing
was conducted using a Dynatest Model 8000 FWD placed in the wheel path of the travel (right-
hand) lane of the roadway in both directions. The placements of the sensors during the testing
were at 0, 8, 12, 18, 24, 36, 48, 60, and 72 in. (0, 200, 305, 457, 610, 915, 1220, 1524, and 1830
mm) from the center of a load plate. The testing interval was 0.2 mi (320 m). The testing was
conducted at three load levels: 9, 12, and 16 kips (40, 53 and 71 kN; Diefenderfer, 2008).
METHODS
This section describes the methodology used to expand the MSI to the entire interstate
network and the methods identified to produce candidate structural indices for rigid and
composite pavements.
MSI for Flexible Pavement Segments
A brief description of the MSI follows in this section; additional details about the
development of the MSI can be found in Bryce et al. (2013). The MSI is based on the Structural
Capacity Index (SCI) (Equation 1) proposed by the Texas Department of Transportation (Zhang
et al., 2003). However, to facilitate the calculation of large data sets in a reasonable timeframe, it
was decided in Bryce et al. (2013) that the MSI should be a closed-form equation. The
calculation of SNeff in the SCI equation can be made using many methods, but the method
developed by Rohde (1994) was chosen (Equation 2). A closed-form estimator for the American
Association of State Highway and Transportation Officials (AASHTO) structural number (SN)
equation (AASHTO, 1993) was developed to calculate the SNReq. The estimator specifically
used for flexible pavements on the interstate network is given in the denominator of Equation 4
of the MSI (Bryce et al., 2013).
Req
Eff
SN
SN=SCI (Eq. 1)
where SNeff is the effective structural number of the pavement and SNReq is the required
structural number of the pavement.
k3
p
k2
eff H*SIP*k1=SN (Eq. 2)
where, for asphalt pavements, k1 = 0.4728, k2 = -0.4810, k3 = 0.7581, SIP is calculated
using Equation 3, and HP is the depth of the pavement structure (all layers above the
subgrade).
HpDDSIP 5.10 (Eq. 3)
where D0 is the peak deflection under the 9,000-lb. load, and D1.5Hp is the deflection at 1.5 times
the pavement depth (found through a Lagrangian interpolation function).

6
2.36777
R
0.7581-0.4810
1.5Hp0
9.07605))log(M*2.32-(log(ESAL)*0.05716
Hp*)D-(D*0.4728=MSI
(Eq. 4)
where ESAL is the equivalent single axle load (VDOT, 2003) and MR is the subgrade resilient
modulus (Equation 5).
r*D
0.24*P*C=M
r
R (Eq. 5)
where AASHTO recommends C = 0.33 (VDOT, 2003), P is the load applied (in pounds), and Dr
is the deflection at distance r from the center deflection. The distance r should be chosen so that
it is sufficiently far enough from the load to measure deflections originating only in the subgrade.
Typically, the value for r is taken as the distance to the first sensor that is greater than the
distance of 1.5 times the pavement depth.
MSI Evaluation for VDOT Interstates
Equation 4 was used in this project to calculate the MSI for all of the interstate flexible
pavement sections on which deflection testing was performed (at a spacing of 0.2 mile).
Thickness information was provided by VDOT. The first step was to estimate the pavement
deflection at 1.5 times the pavement height (D1.5Hp). To estimate the pavement deflection at
D1.5Hp, the three deflection points closest to D1.5Hp were identified and entered into Equation 6.
The height of the pavement (or an estimate in some cases) was provided by VDOT for each
testing location.
) (D* B)-(C*A)-(C
B)-(x*A)-(x+)(D*
C)-(B*A)-(B
C)-(x*A)-(x+) (D*
C)-(A*B)-(A
C)-(x*B)-(x=D C BA1.5Hp (Eq. 6)
where x is 1.5 times the depth of the pavement (Hp); A, B, and C are points closest to x where
the deflection is known; and DA, DB, and DC are the deflections at points A, B, and C,
respectively.
The MR was calculated using the deflection information 60 in away from the applied load
because it was assumed that this deflection value was far enough from the load to originate
solely from the subgrade (Rohde, 1994). The final step for calculating the MSI was to calculate
the traffic in terms of ESALs (Equation 7). The annual average daily traffic (AADT) was
obtained from the 2012 traffic data available on the VDOT website (VDOT, 2013). The percent
of trucks was also available with the traffic data.
))(365)()()()()()(( YLDGTTAADTESAL f (Eq. 7)
where T is the percent of trucks, Tf is the truck factor, G is a growth factor, D is a directionality
factor, L is a lane factor, and Y is the number of years in the design period.

7
The truck factor (Tf) was set at 0.46 for Single Unit Trucks and Buses and 1.05 for
Combination Trucks (Smith and Diefenderfer, 2009). A 3% growth rate was assumed across a
20-year design period. The 20-year design period and the lane distribution factor (see Table 4)
were determined using VDOT standard design assumptions (VDOT, 2003) and verified in Bryce
et al. (2013).
Table 4. Lane Distribution Factors
Number of
Lanes
Lane Distribution
Factor
2 0.9
3 0.7
4 or more 0.6
Development of a Structural Index for Rigid Pavements
Unlike the case for flexible pavements, only a relatively small number of structural
indices have been proposed for use with rigid pavements. This is because many past projects
have not identified a link between parameters derived from pavement deflection values and the
pavement performance, which is a critical step in developing a structural index for rigid
pavements (Carvalho et al., 2012). This section describes a few methodologies proposed for
evaluating the structural condition of rigid pavements based on surface deflections.
Alaska Department of Transportation
As described in Carvalho et al. (2012), the Alaska Department of Transportation
(AkDOT) recently implemented a methodology for including FWD results in its PMS.
However, the methodology includes back-calculations to obtain pavement properties, which may
preclude use at the network level where large data sets are encountered. Secondly, a validation
of the AkDOT technique has yet to be made and will require data across a certain number of
years.
Structural Strength Indicator
Flora (2009) proposed a statistical indicator for flexible and rigid pavements based on the
center deflections from the FWD. The indicator proposed, the Structural Strength Indicator
(SSI), is a function based on the cumulative distribution of the center deflections across a given
pavement family. The SSI function is developed on the basis of Equation 8 and is in the form of
Equation 9 (Flora, 2009).
1
1*100jkiFSSI (Eq. 8)
where F[(δijk)1] is the Cumulative Empirical Probability Distribution of (δijk)1.
)( 11100d
jk eSSI (Eq. 9)

8
where δ in Equation 8 is the center deflection; the subscripts j and k denote the pavement family;
and α, β, and γ are found for each pavement family by minimizing the errors between Equations
8 and 9.
The SSI is based on determining the probability that a pavement in a given family will
have a deflection larger than the measured deflection in a given highway section. The index is
on a scale of 0 to 100, with 0 being a poor SSI and 100 being a perfect SSI. To use the values
from the SSI in this project, a set of thresholds would need to be developed for acceptable center
deflections for VDOT rigid pavements, and the relationship between structural adequacy and
center deflections would need to be verified.
VDOT Enhanced Decision Trees
VDOT incorporates the structural adequacy of rigid pavements into the network-level
decision process through a set of enhanced decision trees. The enhanced decision trees were
introduced in 2008 as a method to complement decisions based solely on pavement surface
distresses (VDOT, 2011). The enhanced decision trees lead to a recommended treatment level
for rigid pavements as a function of the treatment level chosen from pavement distresses, the
average annual daily truck traffic (AADTT), the FWD center deflection, and the AREA (a
measure of the deflected area of the pavement resulting from an applied load). According to the
enhanced decision trees, a structurally adequate rigid pavement is considered a pavement with an
AREA value greater than or equal to 32 in (81 cm) and an FWD center deflection less than or
equal to 5 mils (0.13 mm).
FHWA Simplified Method
Carvalho et al. (2012) proposed a method based on predicting acceptable probabilities of
pavement deterioration via certain predictor variables. Using an analysis from the Mechanistic-
Empirical Pavement Design Guide (MEPDG), the following distress thresholds were set for rigid
pavements: a pavement International Roughness Index (IRI) of 172 in/mi (2.7 m/km), joint
faulting of 0.12 in (3 mm), and transverse cracking less than or equal to 15% of slabs. The
analysis was conducted for a 20-year pavement life. Thus, instead of using deflections to back-
calculate the elastic moduli of pavement layers, mechanistic validation was completed by
simulating different pavement structures and material properties using a multilayer elastic theory.
Based on the analysis conducted, Carvalho et al. (2012) proposed models to predict if
pavements would be acceptable throughout their design life. Deflections, stresses, and strains
were used to compute deflection parameters for each model and to estimate the damage and
performance of the pavement. A generalized logistic model was proposed as the method to
calculate the probability of performance of a given pavement based on pavement deflections.
The generalized logistic model is given in Equation 10.
beacceptableP
1
1)( (Eq. 10)
where P(acceptable) is the probability that the pavement will perform at an acceptable level of
service across a 20-year life, e is the base of the natural logarithm, and b is given by Equation 11.

9
iimacb (Eq. 11)
where the values for c, ai, and mi are given in Table 5 for roughness performance and Table 6 for
transverse slab cracking performance.
Table 5. Model Based on Roughness Performance
Coefficient Variables
m1 CI5 (Equation 12)
m2 Average daily Class 9
truck volume
a1 -0.078
a2 -0.0003877
c 2.057
Table 6. Model Based on Transverse Slab Cracking Performance
Coefficient Variables
m1 CI4 (Equation 13)
m2 Average daily Class 9
truck volume
a1 -0.254
a2 -0.001012
c 3.630
The model for joint faulting was not included in this project given that it required the
pavement subgrade to be classified into specific types. In Table 5, CI5 is calculated as follows:
36245 ddCI (Eq. 12)
Where d24 is the deflection (in micrometers) 24 in (61 cm) away from the center of the load plate
and d36 is the deflection (in micrometers) 36 in (91 cm) away from the center of the load plate.
CI4 is calculated as follows:
24184 ddCI (Eq. 13)
Where d18 is the deflection (in micrometers) 18 in (46 cm) away from the center of the load plate
and d24 is the deflection (in micrometers) 24 in (61 cm) away from the center of the load plate.
Pavement Performance
One important aspect of developing a structural index for rigid pavements is the concept
of linking the pavement deflection parameters to pavement performance, as opposed to linking
them to pavement condition. Pavement performance is generally defined as the area under the
condition curve, as a function of time (Zimmerman, 1995). The linkage between expected
pavement performance and the MSI for flexible pavements was discussed in Bryce et al. (2013)
when the MSI was proposed as a potential variable to augment the deterioration curves used by
VDOT. This project expands this concept and attempts to develop structural indices for rigid

10
and composite pavements by studying the link between pavement performance and structural
indicators.
Development of a Structural Index for Composite Pavements
Composite pavements within the state of Virginia are most often the result of the
rehabilitation of rigid pavements and generally comprise hot-mix asphalt (HMA) over CRC or
JCP. A study of composite pavements conducted by Hein et al. (2002) concluded that the
pavement condition ratings based only on the HMA surface do not accurately reflect the
condition of the overall pavement structure and/or concrete base (e.g., faulting and spalling may
be effectively hidden from view). Furthermore, the study noted that there was often early
(within three to five years) deterioration due to reflective cracking in the HMA from the
discontinuities of the underlying rigid layers (Hein et al., 2002).
VDOT currently evaluates the structural adequacy of composite pavements based on the
AREA and k-value of the pavement. The AREA of the pavement is a measure estimating the
area of the deflection basin generated by the FWD, and the k-value is a measure of the modulus
of the subgrade reaction (Huang, 2004). According to the VDOT (2011), a pavement with an
AREA greater than 32 in and a k-value greater than 175 pci can be considered strong.
The literature review did not reveal any agencies outside of VDOT that currently use a
structural index to evaluate the condition or expected performance of composite pavements at the
network level. However, some methodologies have been proposed for the evaluation of the
condition of composite pavements based on deflection basin parameters (Kim and Park, 2002;
Horak, 2008). Flintsch et al. (2008) concluded in a study about composite pavement systems
that composite pavements can mitigate certain distresses typical to flexible pavements,
particularly if an asphalt overlay is placed on a concrete layer in good condition. Furthermore,
the study showed that surface deflection of a composite pavement was approximately one-third
that of deep strength asphalt pavement (asphalt layers placed over a granular base; Flintsch et al.,
2008).
RESULTS
MSI of VDOT Interstate Pavement Network
The MSI at each testing point and the MSI averaged across each pavement section
contained in the PMS were calculated for each interstate and each VDOT maintenance county.
Summary data for each interstate are shown in the Appendix, and detailed plots for each county
can be obtained by contacting the authors of this report. The average MSI for flexible pavements
for the entire network was 1.25, and 38% of the measurements yielded MSI values less than 1.
An MSI value of 1 means that the pavement section has enough structural capacity to carry the
expected traffic for the next 20 years (see Bryce et al., 2013). The distribution of the MSI values
across the interstates follows a lognormal distribution with a mean value of 1.24, standard
deviation of 0.50, and mode of 0.99 (Figure 1). The average MSI values for each interstate are
given in Table 7, and the average MSI values across all interstates within each county

11
maintenance jurisdiction are given in Table 8. The distribution of the MSI values for each
interstate is given in the Appendix.
Figure 1. Distribution of All MSI Values for the Interstate Network
Table 7. Average MSI Values for Each Interstate*
Route
Average
MSI
Value
Number
of Data
Points
Percent of
Data Points
with MSI<1
64 1.52 1,826 24.3%
66 1.46 601 30.0%
77 1.24 1,122 34.9%
81 1.17 3,394 38.7%
85 1.06 399 43.6%
95 0.88 736 74.1%
264 1.19 76 35.5%
381 1.86 30 0%
464 0.97 44 59.1%
581 1.26 62 11.3%
664 0.81 28 85.7%
* MSI is calculated only for flexible pavements.
0 1 2 3 4 5 6 7 8 9 100
500
1000
1500
2000
2500MSI Distribution for all VDOT Interstates
MSI
Fre
quency
Log Normal Distribution With Mean 1.24, Median of 1.15 Standard Deviation of 0.50 and Mode of 0.99Normalized Such That Area Beneath Equals 1
f(x)
0 1 2 3 4 5 6 7 8 9 100
0.02
0.04
0.06
0.08
0.1
12
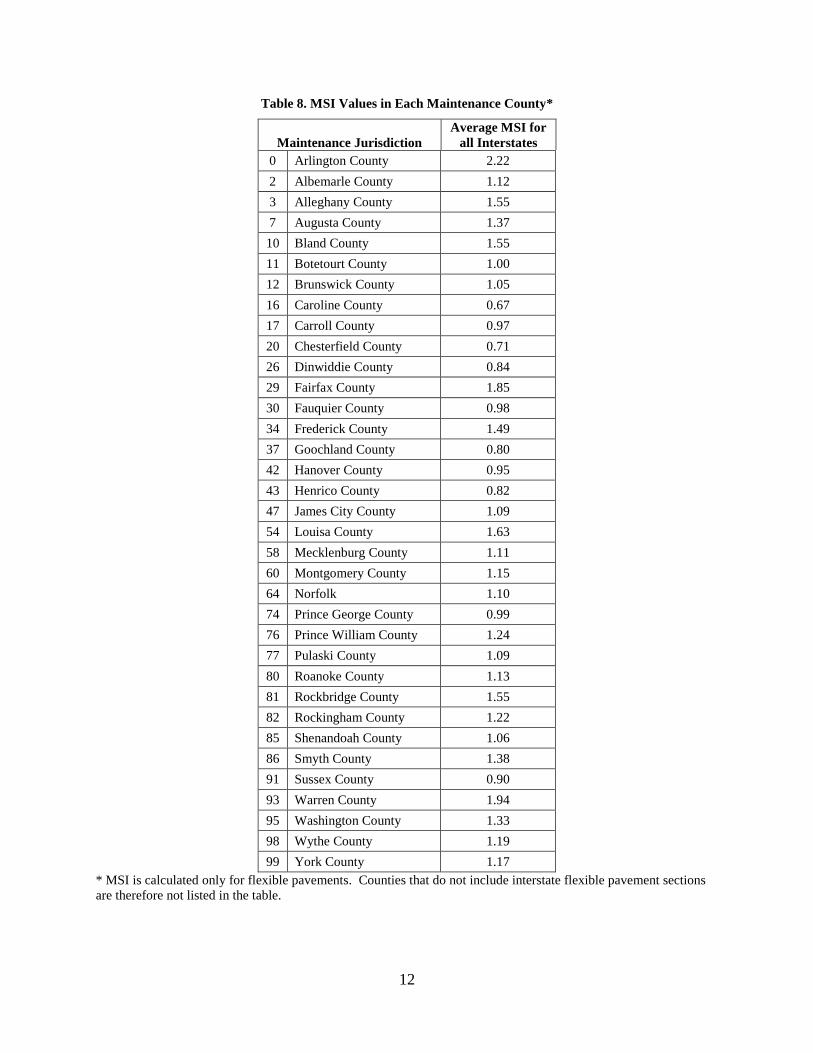
Table 8. MSI Values in Each Maintenance County*
Maintenance Jurisdiction
Average MSI for
all Interstates
0 Arlington County 2.22
2 Albemarle County 1.12
3 Alleghany County 1.55
7 Augusta County 1.37
10 Bland County 1.55
11 Botetourt County 1.00
12 Brunswick County 1.05
16 Caroline County 0.67
17 Carroll County 0.97
20 Chesterfield County 0.71
26 Dinwiddie County 0.84
29 Fairfax County 1.85
30 Fauquier County 0.98
34 Frederick County 1.49
37 Goochland County 0.80
42 Hanover County 0.95
43 Henrico County 0.82
47 James City County 1.09
54 Louisa County 1.63
58 Mecklenburg County 1.11
60 Montgomery County 1.15
64 Norfolk 1.10
74 Prince George County 0.99
76 Prince William County 1.24
77 Pulaski County 1.09
80 Roanoke County 1.13
81 Rockbridge County 1.55
82 Rockingham County 1.22
85 Shenandoah County 1.06
86 Smyth County 1.38
91 Sussex County 0.90
93 Warren County 1.94
95 Washington County 1.33
98 Wythe County 1.19
99 York County 1.17
* MSI is calculated only for flexible pavements. Counties that do not include interstate flexible pavement sections
are therefore not listed in the table.

13
MSI with Respect to PMS Sections
VDOT can view the conditions on its pavement network either at 0.1-mile intervals or
along sections defined as having the same surface type (also known as PMS sections). The MSI
values were averaged across the pavement sections defined in the VDOT PMS using 2012
segment data. MSI data were available for, and averaged across, 579 flexible pavement
management sections. The distribution of the MSI values averaged across the PMS sections is
shown in Figure 2. Of the sections, 213 (approximately 37%) had an MSI value less than 1. The
greatest number of PMS sections that had an average MSI value less than 1 occurred along
Interstate 95, where approximately 77% of the bituminous PMS sections with available
deflection data had an average MSI value less than 1.
Figure 2. Distribution of MSI Averaged Across PMS Sections
MSI and Pavement Condition
Bryce et al. (2013) investigated the relationship between the functional and structural
condition of pavements for given locations on the pavement network. It was determined that no
relationship can be formed to infer the structural condition of the pavement based on its
functional condition, without accounting for the pavement age and expected deterioration.
However, if the condition of a group of pavements with similar ages are compared, it can be
expected that the pavements with a lower MSI will have lower functional condition values (i.e.,
the lower MSI can be linked to a higher rate of deterioration over the same time period).
To investigate the relationship between the CCI and MSI of a group of pavements, the
average CCI was plotted along with the average MSI for each VDOT district (Figure 3). It can
be seen that districts with the lowest average MSI values tended to also have the lowest CCI, as
measured by the 2012 condition data. Given that Bryce et al. (2013) demonstrated that there is a
0 0.5 1 1.5 2 2.5 3 3.5 4 4.50
50
100
150Distribution of MSI Averaged over PMS Sections
MSI
Fre
quency

14
relationship between structural condition and the rate of deterioration of the functional condition,
the districts with the lowest average MSI will be expected to have lower condition values.
Spearman’s rank correlation was conducted to determine the relationship between MSI values
and the average CCI for each of the nine VDOT districts. The rank correlation value
(Spearman’s Rho) was determined as 0.83 with a p-value of 0.0154, indicating a statistically
significant relationship with a relatively ideal fit between the average MSI and average CCI for
each VDOT district. The data were also split into individual counties, and Spearman’s Rho was
lower (0.48) with a p-value of 0.013, indicating a statistically significant relationship with
moderate correlation (Figure 4).
Figure 3. Average CCI and Average MSI With Respect to VDOT District
Figure 4. Average CCI and Average MSI With Respect to VDOT County
50
55
60
65
70
75
80
85
90
95
100
0.5 0.75 1 1.25 1.5 1.75 2
Av
era
ge
CC
I o
f F
lexib
le P
av
emen
ts
MSI Averaged Over All Interstates in District
Average MSI and CCI per District
50
55
60
65
70
75
80
85
90
95
100
0.5 0.75 1 1.25 1.5 1.75 2
Av
era
ge
CC
I o
f F
lexib
le P
av
emen
ts
MSI Averaged Over All Interstates in County
Average MSI and CCI per County

15
Developing an Index for Composite Pavements
The MSI developed in Bryce et al. (2013) is not directly applicable to composite
pavements, given that the denominator of Equation 4 was developed specifically for flexible
pavement design, using the VDOT design assumptions (VDOT, 2003). Therefore, it was
decided that new structural models would be explored for composite pavements. Two steps were
completed for testing models to determine the structural adequacy of composite pavements.
First, the current VDOT practice of using the AREA and k-value to determine the structural
adequacy of a pavement was evaluated. Then, the results were compared to a model developed
as part of this project. Given that the literature review for composite pavements did not yield a
model outside of VDOT that was applicable for the network level, a model was developed using
VDOT PMS data. The model follows literature recommending that the difference in two
deflection measurements, often referred to as deflection basin parameters, is the most appropriate
indicator for the structural evaluation of composite pavements (Kim and Park, 2002; Horak,
2008). Traffic data were also evaluated as potential inputs for the composite models that were
developed.
Performance of Composite Pavements
Following the concepts discussed in Carvalho et al. (2012), the analysis of the current
VDOT method for evaluating the structural adequacy of composite pavements was conducted by
relating the performance of the pavement to the deflection parameters. In other words, the
performance of pavement sections was tracked, and the structural condition of the pavement
section could be defined as weak if it performed worse than expected and adequate otherwise.
Given that different treatments are expected to have different performances, a performance ratio
was designed to be used during the analysis. The performance ratio is defined as Equation 14.
Expected
Actual
ePerformanc
ePerformancPR (Eq. 14)
where PR is the performance ratio, PerformanceActual is the actual performance of the pavement
section given by fitting a curve in the form of Equation 15 to the condition data as a function of
the pavement age, and PerformanceExpected is the expected performance of the pavement given the
deterioration models detailed in Stantec and Lochner (2007).
)1
ln(
100Tbcae (Eq. 15)
where the parameters a and b were taken from Stantec and Lochner (2007) for the specific type
of maintenance performed, T is taken as the age of the pavement following the maintenance, and
the variable c was changed to minimize the sum of the square errors between the model defined
by Equation 15 and the actual condition data.
The concept of the performance ratio is demonstrated in Figure 5. The shaded area in
Figure 5(a) corresponds to the expected deterioration of the pavement that is currently
implemented in the VDOT PMS. The shaded area in Figure 5(b) corresponds to the actual fitted

16
deterioration for the specific pavement section. The performance ratio is defined as the ratio of
the shaded area in Figure 5(b) to the shaded area in Figure 5(a). In this example, the shaded are
in Figure 5(b) is larger than the shaded are in Figure 5(a) and the performance ratio is larger than
one indicating that the pavement is performing better than expected. The performance ratio can
be used to evaluate whether a structural condition index based on FWD testing can classify
pavement into strong pavements (performance ratio > 1) and weak pavement (performance ratio
< 1). The best structural index would be the index that results in the lowest classification error
where an error occurs if a pavement section with a performance ratio greater than 1 is classified
as weak or a section with a performance ratio less than 1 is classified as strong.
(a)
(b)
Figure 5. (a) Expected Performance of Maintenance Action and (b) Actual Performance of Maintenance
Action
Data Used for Composite Pavements
The data used for the comparison of the composite pavement methods were gathered
from the VDOT PMS. Pavement segments were identified on which maintenance was
performed within five years prior to the deflection testing. After these pavement segments were
identified, their condition was investigated and any pavement segment that had a considerable
increase (10 points or higher) in LDR or CCI was removed from the analysis as it was assumed
that these segments received treatment that was not recorded in the PMS. Finally, only the
pavement segments on which the work could be identified in the VDOT construction history
database were used. This is because the different types of maintenance (i.e., preventive,
corrective, restorative, or major rehabilitation/reconstruction) are expected to have different
treatment lives and, thus, different performance.
After reviewing all composite pavement segments and applying the criteria stated in the
previous paragraph, only six pavement segments (totaling approximately 11.5 directional miles)
were available for the analysis. The pavement segments used in the model development are
given in Table 9. Finally, the condition data were obtained in 0.1-mile averaged increments, and
0
10
20
30
40
50
60
70
80
90
100
0 1 2 3 4 5 6 7 8
Co
nd
itio
n o
f P
av
emen
t
Time (Years) Following Maintenance
0
10
20
30
40
50
60
70
80
90
100
0 1 2 3 4 5 6 7 8
Co
nd
itio
n o
f P
av
emen
t
Time (Years) Following Maintenance

17
the condition 0.1 mile on either side of each deflection measurement was treated as the condition
associated with each deflection measurement. By splitting each pavement segment into 0.2-mile
sections, with the center point of each section being the location of a deflection measurement, 81
different sections were identified and used during the analysis.
Table 9. Composite Pavement Segments Used in Analysis
County Route Direction
Begin
County
MP
End
County
MP
Year Work
Performed
Botetourt 81 North 13 14.6 2005/2011
Caroline 95 North 13.68 15.54 2002/2011
Hanover 95 North 0 1.75 2004
Hanover 95 North 1.75 2.39 2005
Louisa 64 West 0 5.18 2005
Spotsylvania 95 South 0 0.53 2002/2011
The performance ratio was calculated for the CCI, LDR, and NDR. The histogram of the CCI
performance ratio is shown in Figure 6. It can be seen in Figure 6 that slightly more than 50% of
the sections performed better than expected, with the rest performing worse than expected.
Figure 6. CCI Performance Ratio on Composite Sections Defined From Segments in Table 9
Evaluation of VDOT Current Practice
To evaluate current VDOT practice, pavement sections with an AREA of less than or
equal to 32 in and a k-value greater than 175 pci were identified as strong; the remaining sections
were defined as weak. The performance ratios for each of the sections were then calculated.
The performance ratios for the strong pavements were then compared to those of the weak
0.75 0.8 0.85 0.9 0.95 1 1.05 1.1 1.15 1.2 1.25 1.30
5
10
15
20
25
Performance Ratio
Nu
mb
er
of P
ave
me
nt S
ectio
ns in
Bin

18
pavement sections. It should be expected that pavements categorized as strong have a higher
performance ratio than those classified as weak. The results are shown in Figure 7. A
nonparametric hypothesis test, the Mann–Whitney–Wilcoxon test, was performed to determine
whether the two data sets in Figure 7 are statistically different. The Mann–Whitney–Wilcoxon
test indicated that the results are significantly different, with a resulting p-value of 0.024 and a z-
value of -2.265. Therefore, it can be said that the pavements identified as weak using the
existing VDOT criteria have statistically lower performance ratios than the pavements identified
as strong.
Figure 7. Comparison of “Weak” and “Strong” Pavements Using the Existing VDOT Criteria
Model Development for Composite Pavements
A second model was developed in this project based on the concept of using deflection
basin parameters to identify the structural adequacy of pavements, as discussed in Kim and Park
(2002) and Horak (2008). In terms of 20-year ESALs (Equation 7), traffic was also included as a
parameter in the model development, although it was determined to be an insignificant variable
in the final model. Several forms were explored for the model, and the function shown in
Equation 16 was determined to be the best fit for the data.
cDD
DDaPR
b
180
80* (Eq. 16)
where a, b, and c are model parameters that were used to fit the function to the data; D0 is the
temperature-corrected center deflection from the FWD; D8 is the measured deflection 8 in (203
mm) away from the center deflection; and D18 is the measured deflection 18 in (457 mm) away
from the center deflection.
The variables a, b, and c were found using nonlinear (orthogonal) regression. The model
was compared against the performance ratio calculated using the LDR (see Figure 5 for how the
performance ratio is calculated using the LDR), given that it is expected that the LDR will relate
most closely to structural inadequacies. The final values for coefficients a, b, and c were 0.4118,
0.8
0.9
1
1.1
1.2
(1) Indicates Strong Pavements; (2) Indicates Weak Pavements
Pe
rfo
rma
nce
Ra
tio
1 2

19
1.793, and 0.8402, respectively. The model and a plot of the differences in the model and data
calculated using condition data are shown in Figure 8.
(a)
(b)
Figure 8. (a) Model Results Compared to Results Obtained From LDR Condition Data and (b) Differences in
Model Results and Results From LDR Data as a Function of the Mean
Finally, to compare the results obtained from the model to the actual performance ratio,
pavements that yielded a performance ratio less than 1 using Equation 16 were identified as
weak. The pavements classified as weak or strong were then compared to the actual
performance ratio using VDOT condition data. The results are shown in Figure 9.
Figure 9. Comparison of “Weak” and “Strong” Pavements Using Equation 16
Analysis of Composite Pavement Models
Given the analysis of the methods for composite pavements, it can be concluded that
implementing a model similar to Equation 16 into the PMS will increase the accuracy of
identifying structurally weak pavements from their counterparts. It can be seen from Figure 9
that pavements classified as weak (i.e., PR of less than 1 when calculated using Equation 16)
typically had performance ratios less than 1, as based on LDR calculations. Furthermore, the
relationship in Equation 16 tends to predict actual pavement performance better than the existing
VDOT criteria for identifying weak pavements (Figure 7). However, the number of pavement
0.7 0.8 0.9 1 1.1 1.2 1.30.7
0.8
0.9
1
1.1
1.2
PR from Model
PR
fro
m C
on
ditio
n D
ata
0.8 0.9 1 1.1 1.2-0.2
-0.1
0
0.1
0.2
Mean of Model and Data Values
Diffe
ren
ce
in
Mo
de
l a
nd
Da
ta
0.8
0.9
1
1.1
1 2
(1) Indicates Strong Pavements; (2) Indicates Weak Pavements
Pe
rfo
rma
nce
Ra
tio
20
sections available for the analysis was limited, and more data may be required for a calibration of
Equation 16.
Model Development for Rigid Pavements
Data Used for Rigid Pavements
The data used for the comparison of the rigid pavement methods were gathered from the
VDOT PMS and included the years from 2007 to 2013. Selection of the rigid pavements used in
the analysis was performed similarly to the selection of the composite pavements. That is,
pavement segments on which maintenance was performed within five years prior to the
deflection testing were identified based on the construction history data. The condition of each
pavement segment was investigated, and any pavement segment that had a considerable increase
(10 points or higher) in the CCI was removed from the analysis. One difference between the
composite pavements and rigid pavements was that some segments of the latter were found to
have CCI values significantly lower than 100 during the year following maintenance. Thus,
these segments were removed from the analysis, as it was assumed that a type of maintenance
(probably patching) was performed and indicated in the construction history database.
After reviewing the remaining pavement segments, it was found that only two met the
criteria. Therefore, two pavement segments on which work was performed during the year
following deflection testing were included in this analysis, and it was assumed that the work did
not significantly impact the structural capacity of the pavements. Finally, the specific category
of work involved in the maintenance (i.e., preventive, corrective, restorative, or major
rehabilitation/reconstruction) was not indicated in the construction history of rigid pavements.
Therefore, only the performance was evaluated for rigid pavements as opposed to the
performance ratio, which was the case in composite pavements.
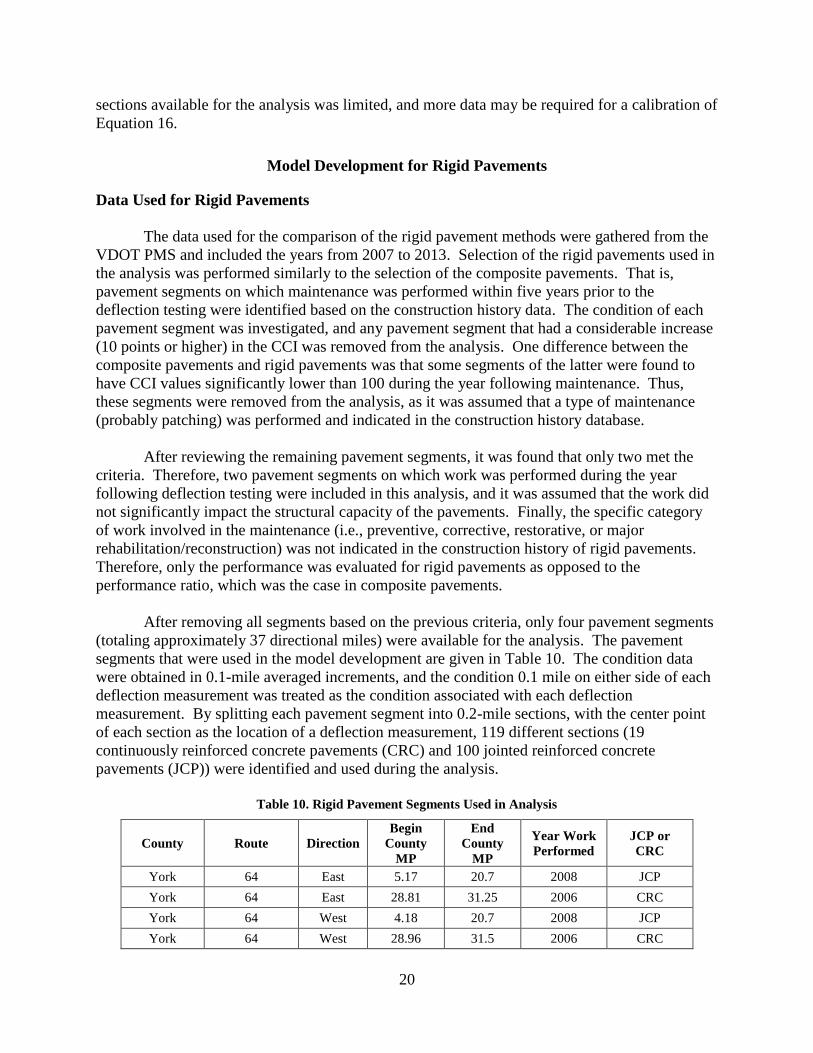
After removing all segments based on the previous criteria, only four pavement segments
(totaling approximately 37 directional miles) were available for the analysis. The pavement
segments that were used in the model development are given in Table 10. The condition data
were obtained in 0.1-mile averaged increments, and the condition 0.1 mile on either side of each
deflection measurement was treated as the condition associated with each deflection
measurement. By splitting each pavement segment into 0.2-mile sections, with the center point
of each section as the location of a deflection measurement, 119 different sections (19
continuously reinforced concrete pavements (CRC) and 100 jointed reinforced concrete
pavements (JCP)) were identified and used during the analysis.
Table 10. Rigid Pavement Segments Used in Analysis
County Route Direction
Begin
County
MP
End
County
MP
Year Work
Performed
JCP or
CRC
York 64 East 5.17 20.7 2008 JCP
York 64 East 28.81 31.25 2006 CRC
York 64 West 4.18 20.7 2008 JCP
York 64 West 28.96 31.5 2006 CRC
21
Evaluation of Current VDOT Practice
To evaluate current VDOT practice, pavement sections with an AREA less than or equal
to 32 in and a center deflection less than 5 mils were identified as strong; the remaining
pavement sections were defined as weak. The performance for each of the sections was then
calculated for a five-year period. The performance values for the strong pavements were then
compared to those of the weak pavement sections. The performance was calculated by
integrating Equation 15 between zero and five years. The values for a and b were 4.244 and
4.22, respectively, for JCP and -9.88 and -9.887, respectively, for CRC. The value of c was
found for each section by minimizing the sum of the square errors between Equation 15 and the
actual performance data from the PMS. Finally, JCP and CRC were initially separated for the
analysis. However, given the relatively small sample size and the fact that the indicators and
thresholds used by VDOT are the same for each, it was decided to analyze the two pavement
types together. It should be noted that these two pavement types are expected to behave
differently and should be analyzed separately in future analysis, given larger sample sizes.
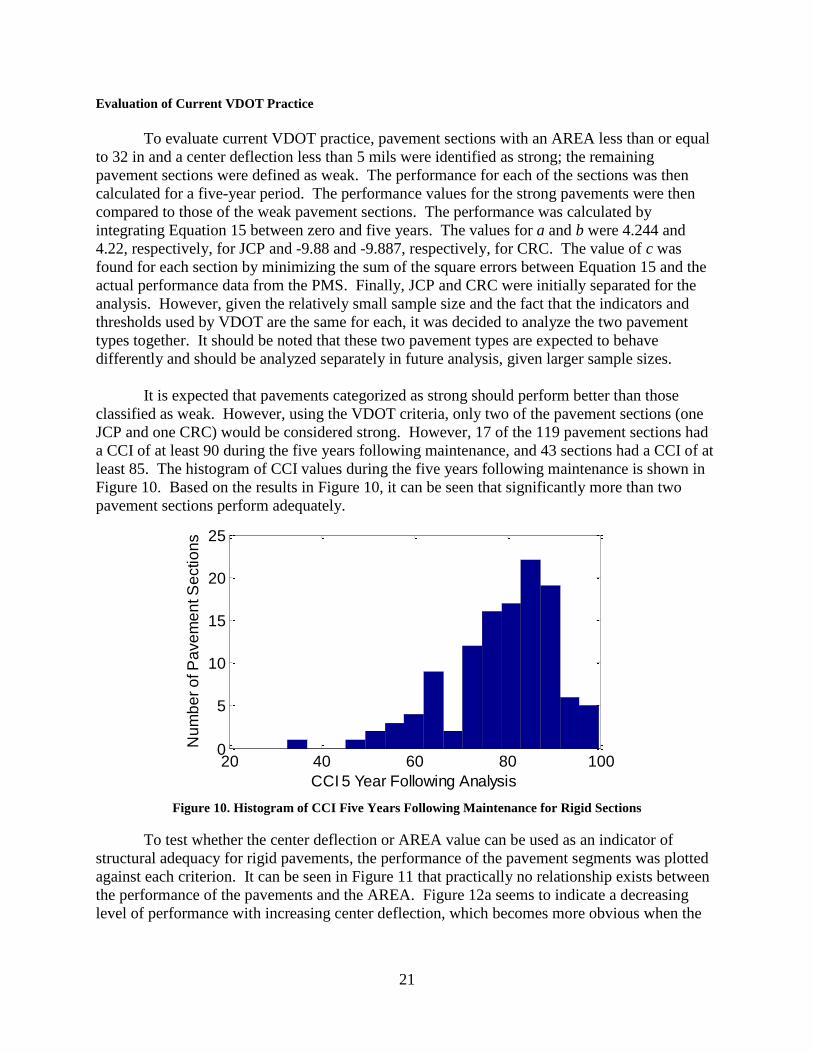
It is expected that pavements categorized as strong should perform better than those
classified as weak. However, using the VDOT criteria, only two of the pavement sections (one
JCP and one CRC) would be considered strong. However, 17 of the 119 pavement sections had
a CCI of at least 90 during the five years following maintenance, and 43 sections had a CCI of at
least 85. The histogram of CCI values during the five years following maintenance is shown in
Figure 10. Based on the results in Figure 10, it can be seen that significantly more than two
pavement sections perform adequately.
Figure 10. Histogram of CCI Five Years Following Maintenance for Rigid Sections
To test whether the center deflection or AREA value can be used as an indicator of
structural adequacy for rigid pavements, the performance of the pavement segments was plotted
against each criterion. It can be seen in Figure 11 that practically no relationship exists between
the performance of the pavements and the AREA. Figure 12a seems to indicate a decreasing
level of performance with increasing center deflection, which becomes more obvious when the
20 40 60 80 1000
5
10
15
20
25
CCI 5 Year Following Analysis
Nu
mb
er
of P
ave
me
nt S
ectio
ns

22
six pavement sections with center deflection values exceeding 15 mils are removed from the
analysis (Figure 12b).
Figure 11. Pavement Performance as a Function of AREA
(a)
(b)
Figure 12. (a) Pavement Performance as a Function of FWD Center Deflection and (b) Pavement
Performance as a Function of FWD Center Deflection Without Outliers
Figure 12 suggests a decreasing trend of performance with increasing center deflection;
therefore, the center deflection of the FWD may be an indicator of the performance of rigid
pavements. This is the basis of the SSI developed by Flora (2009). However, the figure also
shows that the association is at best very weak. To further explore this concept, the value of the
center deflection used as a threshold for defining weak versus strong rigid pavements was varied
between 3 mils and 10 mils, and the difference in the mean performance for weak versus strong
pavements was calculated. The results are shown in Figure 13. It can be seen that the greatest
observed difference in performance between weak and strong rigid pavements occurs at 6 mils.
To test whether the 6-mil threshold for the center deflection may be useful as an indicator
for the structural adequacy of rigid pavements, the 119 pavement sections were classified as
strong or weak based on their center deflection values. The results are shown in Figure 14, and it
can be seen that a statistically significant difference in performance values exists based on the
pavement classification (weak or strong). This was verified by using the Mann–Whitney–
25 30 35 40 45 50 55300
350
400
450
500
AREA Value (inches)
5 Y
ea
r P
erf
orm
an
ce
0 10 20 30 40 50300
350
400
450
500
FWD Center Deflection (mils)
5 Y
ea
r P
erf
orm
an
ce
0 5 10 15
350
400
450
500
FWD Center Deflection (mils)
5 Y
ea
r P
erf
orm
an
ce

23
Wilcoxon test, which indicated a statistically significant difference and a resulting p-value of
practically 0.
Figure 13. Difference in Performance Between “Weak” and “Strong” Rigid Pavements as a Function of the
Center Deflection Value Chosen as the Threshold
Figure 14. Comparison of “Weak” and “Strong” Rigid Pavements Using a Center Deflection Threshold of 6
mils
350
400
450
1 2
(1) Indicates Strong Pavements, (2) Indicates Weak Pavements
5 Y
ea
r P
ave
me
nt P
erf
orm
an
ce

24
Analysis of the Federal Highway Administration (FHWA) Simplified Model
The FHWA simplified models are based on the concept that structurally inadequate
pavements have a lower probability of performing adequately during their design life (Carvalho
et al., 2012). However, the techniques presented by Carvalho et al. (2012) are based on
exceeding a given level of roughness or transverse cracking. To test the methodology using the
VDOT data, the pavement performance was set as the criterion to determine the adequacy of the
pavement. The first analysis was to determine whether a relationship exists between the models
presented by Carvalho et al. (2012) and the performance data for the concrete sections. The
coefficients in Table 5 and Table 6 were used, and the AADTT was taken from the VDOT PMS.
It is important to note that the AADTT reported by VDOT includes more truck classes than the
Class 9 trucks used by Carvalho et al. (2012), but this is not expected to impact whether or not a
relationship can be identified given that both estimations are a measure of the number of trucks
on the road. The results of using VDOT data in the models developed by Carvalho et al. (2012)
are shown in Figure 15. It can be seen that practically no relationship exists between the models
and the performance of the pavement sections. This result could be expected given that the
models in Carvalho et al. (2012) were developed to describe the performance of specific
distresses and not the performance in terms of aggregated condition scores.
(a) (b)
Figure 15. Evaluation of Pavement Adequacy Following Carvalho et al. (2012) Using (a) Roughness Criteria
and b) Transverse Cracking Criteria
To determine whether the methodology in Carvalho et al. (2012) could be used by
VDOT, Equation 11 was evaluated to determine whether the coefficients and parameters could
be calibrated to the data for rigid pavements in this project. Equation 10 was then used to
calculate the probability of the pavement performing adequately (using the value for b calculated
from Equation 11). Three levels of performance were chosen as thresholds to determine whether
a pavement is acceptable or not: (1) 430 CCI-yr, or approximately the 25th percentile of
performance; (2) 440 CCI-yr, or approximately the 35th percentile of performance; and (3) 450
CCI-yr, or approximately the 50th percentile of performance.
A similar process to Carvalho et al. (2012) was followed in this project using VDOT
data, with the exception that Equation 11 was modified to determine a new set of coefficients.
300 350 400 450 500
0.2
0.25
0.3
0.35
0.4
0.45
0.5
Performance of Pavment Section
P(a
cce
pta
ble
) U
sin
g R
ou
gh
ne
ss C
rite
ria
300 350 400 450 5000.1
0.2
0.3
0.4
0.5
0.6
0.7
0.8
Performance of Pavement Sections
P(a
cce
pta
ble
) U
sin
g T
ran
sve
rse
Cra
ck C
rite
ria

25
The variables used in Equation 11 for this analysis were: m1 as the center deflection minus the
deflection at 18 in (d0-d18), m2 as the deflection at 18 in minus the deflection at 24 in (d18-d24), m3
as the deflection at 24 in minus the deflection at 36 in (d24-d36), and m4 as the average AADTT.
To determine the coefficients (ai) and the constant (c), a minimization algorithm was
programmed into MATLAB. The algorithm was configured this way to meet the objective that
pavements above the threshold have a P(acceptable) (from Equation 10) equal to 1, and
pavements below the threshold have a P(acceptable) (from Equation 10) equal to 0.
The steps taken in the algorithm were twofold: (1) determine which pavement sections
perform better than the threshold and set their corresponding values to 1,000 (with the pavements
below the threshold set to 0), and (2) determine the values for ai and c that minimize the sum of
the square of the differences between P(acceptable) (Equations 10 and 11) and the value for the
pavement section set in the first step. The genetic algorithm tool built into the MATLAB global
optimization toolbox was used to perform the minimization. The results for calibrating to a
performance threshold of 440 and 450 can be seen in Figure 16(a) and Figure 16(b), respectively.
It can be seen that there is no relationship between the calibrated logistic models and the
performance of the pavement sections.
(a)
(b)
Figure 16. Models Based on Calibrating the Generalized Logistic Model Presented in Carvalho et al. (2012)
for Performance Thresholds of (a) 440 and (b) 450
Conclusions From the Analysis of Rigid Pavement Models
The results from the previous analysis suggest that center deflection is a better indicator
of pavement structural adequacy in terms of pavement performance than the AREA parameter.
However, this analysis was performed using a very limited data set (i.e., four pavement segments
within one VDOT district). Therefore, any interpretation of the previous models should be made
with the caveat that more data will be required to determine if the results remain consistent as the
sample size increases. It is evident from Figure 11 that the pavement AREA is not expected to
be a good indicator of structural adequacy when used independently. Furthermore, the fact that
only two pavement sections were identified as strong using the AREA and the FWD center
300 350 400 450 5000.1
0.2
0.3
0.4
0.5
0.6
0.7
0.8
0.9
1
Performance of Pavement Sections
P(a
cce
pta
ble
) B
ase
d o
n D
efle
ctio
ns a
nd
AA
DT
T
300 350 400 450 5000
0.1
0.2
0.3
0.4
0.5
0.6
0.7
0.8
0.9
Performance of Pavement Sections
P(a
cce
pta
ble
) B
ase
d o
n D
efle
ctio
ns a
nd
AA
DT
T

26
deflection method indicates that AREA and center deflection taken together are not an accurate
indicator of structural adequacy, particularly when considerably more pavement sections than
identified had five-year CCI values of 90 or greater.
Implementing Structural Capacity Indices Into the Network-level Pavement Evaluation
Given the analysis performed in this report and the analysis in Bryce et al. (2013), the
following sections detail methods that VDOT should follow to collect data for calculating the
structural indices, as well as update the MSI based on work performed.
Data Collection Procedure
The data collection includes information about the spatial test spacing and the relevant
parameters to collect during testing on the VDOT interstate network using the FWD.
Information about the temporal frequency of testing, for all pavement types, has produced
inconclusive results however, much of the literature (e.g., Noureldin et al., 2005; Carvalho et al.,
2012) suggests a five-year cycle for collecting FWD measurements on bituminous pavements.
In Carvalho et al. (2012), it is determined that the cycle for rigid pavement testing can be
expanded to 10 years. Therefore, it is suggested that VDOT follow the five-year cycle for
flexible and composite pavements.
Data That Should Be Collected
When FWD data are collected for flexible pavements, it is recommended that the
following data also be noted: (1) depth of the pavement structure; (2) current air temperature; (3)
average air temperature of the previous day; and (4) pavement temperature at time of testing. In
addition, the analysis will require traffic parameters in terms of the design AADT, truck factor
(or the assumed truck factor), the percent of trucks, and the number of lanes. For the case of
composite pavements, it is expected that collection of only the deflection values is adequate.
Given that the model for structural adequacy of rigid pavements was inconclusive, no guidance
can be given about which data should be collected for calculation of a rigid pavement structural
index.
Spacing Between FWD Tests
Extensive research has been conducted to determine the optimal testing interval for
measuring network-level deflections using the FWD (Noureldin et al., 2005; Alam et al., 2007;
Carvalho et al., 2012). Many of the results indicate that three to five test points per mile can be
collected without too much loss of information. The current VDOT practice to collect five FWD
measurements per directional mile on its interstate pavement network (Diefenderfer, 2008),
which is within the recommended practice. The collection frequency for flexible and composite
pavements is based on the concept that a statistical representation of the pavement can be
gathered using random testing (i.e., the probability of identifying a weak section is not changed
based on the location of testing). The research presented in this report and in Bryce et al. (2013),
shows that for flexible pavements and composite pavements, five FWD tests per mile allows one
to differentiate between strong and weak pavements.
27
The weak association between FWD deflections and performance on rigid pavements
found in this report suggests that the five points per mile test procedure is not effective for rigid
pavements. For jointed rigid pavements, failure tends to occur at joints or in the form of edge
cracking, more so than randomly throughout the slab. This localized mode of failure cannot be
effectively detected through uniform 0.2 miles intervals of FWD testing. On the other hand,
testing of individual joints (or even say 20% of the joints) is currently not a feasible approach for
network-level FWD testing.
Data Preparation
Data preparation for flexible pavements should include correction for the pavement
temperature on the center deflections. This may be accomplished using the VDOT available
program, MODTAG. Pavement temperature corrections may also be made via the MSI code
provided as a deliverable of this project. The code delivered in this project corrects temperature
using the BELLS2 equation as described by FHWA (2011). Additional preparation for flexible
and composite pavements should include placing the data in Microsoft Excel spreadsheets to
make it available for calculations. No recommendations can be made for the case of rigid
pavements based on the results of this report.
Updating of the Structural Condition Index to Reflect Maintenance Treatments
Flexible Pavements
The MSI for flexible pavements is based on the ratio of the required structural number
(SNReq) to the effective structural number (SNeff). Therefore, any significant maintenance
actions are expected to affect the SNeff. To update the MSI value, Equation 20 may be used
when the depth of the maintenance does not exceed the depth of the asphalt layers. If the
maintenance exceeds the depth of the asphalt layers, the numerator in Equation 17 should be
replaced by the SNeff from the pavement design documents.
2.36777
R
0Updated9.07605))log(M*2.32-(log(ESAL)*0.05716
*44.0MSI=MSI
milledplaced dcd (Eq. 17)
where MSIUpdated is the updated value for the MSI, MSI0 is the original value of the MSI, dplaced is
the depth of the asphalt layer (inches) placed, dmilled is the depth of the milled asphalt layer
(inches), and c is a factor based on the condition of the pavement (Huang, 2004). The ESAL and
MR values are the same as defined earlier in this report. The c factor represents the percent of
contributing structure that remains in the removed layer of asphalt. Values of 0.5 to 0.7 should
be used for c with asphalt concrete pavement that exhibits appreciable cracking.
Composite Pavements
The performance ratio (Equation 16) calculated for composite pavements is a function of
the deflection in the top layers and the combined deflection in the top layer and underlying layers
as illustrated in Figure 17. Typically, it is expected that the rigid layers contribute less to the
overall deflection than the asphalt layers. Thus, only significant changes in the structure of the
asphalt layer, or more extensive actions that extend to the rigid layers, are expected to contribute

28
to increasing the performance ratio. Furthermore, updating the performance ratio to indicate
maintenance actions would require linear elastic analysis techniques. Therefore, it is
recommended that FWD testing be conducted on the pavement following significant
maintenance actions to update the performance ratio.
Figure 17. Representation of Deflections Using Equation 19
SUMMARY OF FINDINGS
Whereas many states have begun implementing network-level structural capacity indices into
their PMS’s for flexible pavements, the use of indices to describe the structural adequacy of
rigid and composite pavements is far less prevalent.
No adequate network-level structural capacity model for composite pavements was found in
the literature outside of the VDOT methodology.
It was found that districts with a lower average MSI also have a lower average condition
index (as measured by the CCI) than districts with higher average MSI values. This may be
because each district has a similar distribution of pavement ages.
It was found that the current method for determining the structural adequacy of composite
pavements provides statistically significant results when discriminating between weak and
strong sections. However, the model based on differences in deflection values can
discriminate better than using AREA and center deflection. Note that the results are based on
limited data.
For the sections studied, the AREA value does not seem to provide meaningful information
about the expected performance for rigid pavements when taken independently or when
considered along with the FWD center deflection. It is important to note that the data
available were very limited and this finding is based on the analysis of only four pavement
segments in the same district.
It was found that, on average, the MSI values of the interstate pavement network are greater
than 1, and the mode of the distribution of MSI values is approximately 1.
Asphalt Layer
Rigid Layer
D0 D18D8
D0-D8
D0-D18

29
Sources in the literature suggested that successive rounds of network-level deflection testing
should be conducted in five-year cycles for flexible and composite pavements and 10-year
cycles for rigid pavements.
CONCLUSIONS
Deflection testing using the current VDOT protocol provides useful information for flexible
and composite pavements. However, very few conclusions could be drawn from the results
for rigid pavements. Some sources in the literature suggest that deflection testing at the
network level may not be useful for rigid pavements especially if testing is conducted on a
set interval rather than at specific locations along the slabs. For example, a major concern for
jointed concrete pavements is the load transfer efficiency at the joints. Information on the
load transfer efficiency cannot be obtained at long testing intervals (0.2 miles).
This project confirmed that the MSI can be used to predict the structural adequacy of flexible
pavements. This conclusion was reached based on the evaluation of the entire network and
the trend showing that districts with a lower MSI had pavements in poorer condition than
districts with a higher MSI.
This research showed that a structural index based on deflection ratios can be used to
identify composite pavements that are anticipated to not perform as well as expected.
Although the sample size for composite pavements was limited, the locations (in terms of
counties and roads) of the sample were diverse enough that it is expected the results could be
relatively consistent throughout the remaining composite network.
RECOMMENDATIONS
1. VDOT’s Maintenance Division should replace the current structural criteria for flexible
pavements in the current enhanced decision tree with the MSI as outlined in this report and
in Bryce et al. (2013). The composite structural criteria should also be revised to include the
performance ratio technique discussed in this report, as opposed to the current
methodology. VDOT’s Maintenance Division should further evaluate the new criteria on the
network to determine its effect on suggested maintenance treatments, the cost of maintenance
treatments, and sensitivity of the results to decide on the approach.
2. From the literature review, VDOT’s Maintenance Division and VDOT’s Materials Division
should consider conducting successive rounds of network-level deflection testing in 5-year
cycles for flexible and composite pavements and 10-year cycles for rigid pavements.
3. VDOT’s Materials Division should conduct future network-level deflection testing on jointed
rigid pavements at approximately 0.2-mi intervals but at the transverse joint, as opposed to
maintaining the 0.2-mi testing interval in the current protocol. No changes to the 0.2-mi test
interval for flexible and composite pavements are necessary.

30
4. VDOT’s Maintenance Division should use a D0 threshold of 6 mils to define strong/weak
pavement rather than the currently used approach.
BENEFITS AND IMPLEMENTATION
By including structural information into a network-level decision program, the errors
between the need-based (network-level) pavement budget and the actual project-level needs can
be minimized by using a more accurate assessment. The performance of those pavements that
will require rehabilitation can also be more accurately predicted using models that incorporate
the structure condition of the pavement by identifying inadequate pavement sections before their
functional condition deteriorates.
VDOT’s Maintenance Division will work in cooperation with VDOT’s Information
Technology Division for the evaluation and implementation of the suggested method. The final
product will be the developed MSI index for all interstate pavements incorporated into VDOT’s
Pavement Management System.
VDOT’s Maintenance Division, along with VDOT’s Materials Division, will revise
current network-level testing protocols using the FWD on jointed rigid pavements to test at
specific locations along the slab as outlined in this report. VDOT is also a participant in
Transportation Pooled Fund TPF-5(282), Demonstration of Network Level Pavement Structural
Evaluation with Traffic Speed Deflectometer. If future deflection testing at the network is
conducted with this device, there may not be an opportunity to conduct testing at specific
locations along a slab for network analysis.
Changes to the D0 threshold used to define strong/weak pavement sections will also be
incorporated into VDOT’s Pavement Management System by VDOT’s Maintenance
Division. The suggested value from this study is 6 mils.
ACKNOWLEDGMENTS
The authors acknowledge the invaluable contributions of providing timely data and
detailed feedback by Tanveer Chowdhury, Raja Shekharan, and Akyiaa Hosten, VDOT
Maintenance Division; and Affan Habib, VDOT Materials Division. The members of the
technical review panel included Steven Mullins, Tom Tate, Affan Habib, Raja Shekharan, and
Tanveer Chowdhury, VDOT; and Stacey Diefenderfer, VTRC.
REFERENCES
Alam, J., K.A. Galal, and B. K. Diefenderfer. Network-Level Falling Weight Deflectometer
Testing: Statistical Determination of Minimum Testing Intervals and Number of Drop
Levels on Virginia’s Interstate System. In Transportation Research Record: Journal of

31
the Transportation Research Board, No. 1990. Transportation Research Board of the
National Academies, Washington DC, 2007, pp. 111-118.
Ali, H.A., and S.D. Tayabji. Evaluation of Mechanistic-Empirical Performance Prediction
Models for Flexible Pavements. In Transportation Research Record: Journal of the
Transportation Research Board, No. 1629. Transportation Research Board of the
National Academies, Washington, DC, 1998, pp. 169-180.
American Association of State Highway and Transportation Officials. AASHTO Guide for
Design of Pavement Structures. Washington, DC, 1993.
Bryce, J. M., G.W. Flintsch, S.W. Katicha, and B.K. Diefenderfer. Developing a Network-Level
Structural Capacity Index for Structural Evaluation of Pavements. VCTIR 13-R9.
Virginia Center for Transportation Innovation and Research, Charlottesville, 2013.
Carroll, R.J., D. Ruppert, L.A. Stefanski, and C.M. Crainiceanu. Measurement Error in
Nonlinear Models. Taylor & Francis, Boca Raton, 2006.
Carvalho, R., R. Stubstad, R. Briggs, O. Selezneva, E. Mustafa, and A. Ramachandran.
Simplified Techniques for Evaluation and Interpretation of Pavement Deflections for
Network-Level Analysis. FHWA-HRT-12-023. Federal Highway Administration,
McLean, VA, 2012.
Chakroborty, P., P.K. Agarwal, and A. Das. Simple Model to Predict the Structural Condition of
Asphalt Concrete Pavements at the Network Level. 86th Annual Meeting of the
Transportation Research Board, Washington DC, 2007.
Chowdhury, T. VDOT's Pavement Management Program. Presentation. Virginia Department
of Transportation, Richmond, March 10, 2010.
Diefenderfer, B.K. Network-Level Pavement Evaluation of Virginia's Interstate System Using
the Falling Weight Deflectometer. VTRC 08-R18. Virginia Transportation Research
Council, Charlottesville, 2008.
Federal Highway Administration. LTPP Guide to Asphalt Temperature Prediction and
Correction. FHWA-RD-98-085. Federal Highway Administration, Washington, DC,
August 5, 2011. http://www.fhwa.dot.gov/publications/research/infrastructure/
pavements/ltpp/fwdcd/ delta.cfm#delta36. Accessed March 15, 2013.
Flintsch, G.W., B.K. Diefenderfer, and O. Nunez. Composite Pavement Systems: Synthesis of
Design and Construction Practices. VTRC 09-CR2. Virginia Transportation Research
Council, Charlottesville, 2008.
Flora, W.F. Development of a Structural Index for Pavement Management: An Exploratory
Analysis. Master’s Thesis. Purdue University, West Lafayette, Indiana, 2009.
32
Galal, K., B.K. Diefenderfer, and J. Alam. Determination by the Falling Weight Deflectometer
of the In-Situ Subgrade Resilient Modulus and Effective Structural Number for I-77 in
Virginia. VTRC 07-R1. Virginia Transportation Research Council, Charlottesville,
2007.
Hadidi, R., and N. Gucunski. Comparative Study of Static and Dynamic Falling Weight
Deflectometer Back-Calculations Using Probabilistic Approach. Journal of
Transportation Engineering, Vol. 13, No. 3, 2010, pp. 196-204.
Hein, D.K., C. Olidis, E. Magni, and D. MacRae. A Method for the Investigation and Validation
of Composite Pavement Performance Including the Use of the Falling Weight
Deflectometer. Pavement Evaluation—A Joint Conference of the FWD and Road
Profilers User Groups, Roanoke, VA, 2002.
Horak, E. Benchmarking the Structural Condition of Flexible Pavements with Deflection Bowl
Parameters. Journal of the South African Institution of Civil Engineering, Vol. 50, No. 2,
2008, pp. 2–9.
Huang, Y.H. Pavement Analysis and Design. Prentice-Hall, Upper Saddle River, NY, 2004.
Kim, Y.R., and Park, H. Use of FWD Multi-Load Data for Pavement Strength Estimation.
FHWA/NC/2002-006. North Carolina Department of Transportation, Raleigh, 2002.
MACTEC Engineering and Consulting, Inc. Long-Term Pavement Performance Program
Manual for Falling Weight Deflectometer Measurements, Version 4.1. FHWA-HRT-06-
132. Federal Highway Administration, Washington, DC, 2006.
Noureldin, S., K. Zhu, D.A. Harris, and S. Li. Non-Destructive Estimation of Pavement
Thickness, Structural Number and Subgrade Resilience Along INDOT Highways.
FHWA/IN/JTRP-2004/35. Purdue University, West Lafayette, IN, 2005.
Park, K., N. Thomas, and K.W. Lee. Applicability of the International Roughness Index as a
Predictor of Asphalt Pavement Condition. Journal of Transportation Engineering, Vol.
133, No. 12, 2007, pp. 706-709.
Rohde, G.T. Determining Pavement Structural Number from FWD Testing. In Transportation
Research Record: Journal of the Transportation Research Board, No. 1448.
Transportation Research Board of the National Academies, Washington, DC, 1994, pp.
61-68.
Smith, B., and B.K. Diefenderfer. Development of Truck Equivalent Single-axle Load (ESAL)
Factors Based on Weigh-in-motion Data for Pavement Design in Virginia. VCTIR 09-
R18. Virginia Center for Transportation Innovation and Research, Charlottesville, 2009.

33
Stantec Consulting Services Inc., and H.W. Lochner, Inc. Development of Performance
Prediction Models for Virginia Department of Transportation Pavement Management
System. Richmond, VA, 2007.
Virginia Department of Transportation. Guidelines for the 1993 AASHTO Pavement Design
Guide. VDOT Materials Division, Richmond, 2003.
Virginia Department of Transportation. State of the Pavement 2010. VDOT Maintenance
Division, Richmond, 2010.
Virginia Department of Transportation. Supporting Document for the Development and
Enhancement of the Pavement Maintenance Decision Matrices Used in the Needs Based
Analysis. VDOT Maintenance Division, Richmond, 2011.
Virginia Department of Transportation. VDOT Traffic Data. http://www.virginiadot.org/info/ct-
trafficcounts.asp. Accessed August 15, 2013.
Zaghloul, S., Z. He, N. Vitillo, and J.B. Kerr. Project Scoping Using Falling Weight
Deflectometer Testing: New Jersey Experience. In Transportation Research Record:
Journal of the Transportation Research Board, No. 1643. Transportation Research
Board of the National Academies, Washington, DC, 1998, pp. 34-43.
Zhang, Z.E., L. Manuel, I. Damnjanovic, and Z. Li. Development of a New Methodology for
Characterizing Pavement Structural Condition for Network-Level Applications. 0-4322-
1. Texas Department of Transportation, Austin, 2003.
Zimmerman, K.A. Pavement Management Methodologies to Select Projects and Recommend
Preservation Treatments. NCHRP Synthesis of Highway Practice 222. Transportation
Research Board of the National Academies, Washington, DC, 1995.

34

35
APPENDIX
MSI DISTRIBUTIONS FOR EACH VDOT INTERSTATE

36

37
Figure A1. MSI Distribution for Interstate 64
Figure A2. MSI Distribution for Interstate 66
0 1 2 3 4 5 6 7 8 90
50
100
150
200
250
300
350
400
450
500
MSI Distribution for Interstate 64
MSI
Fre
quency
0 1 2 3 4 5 6 7 80
20
40
60
80
100
120
140MSI Distribution for Interstate 66
MSI
Fre
quency
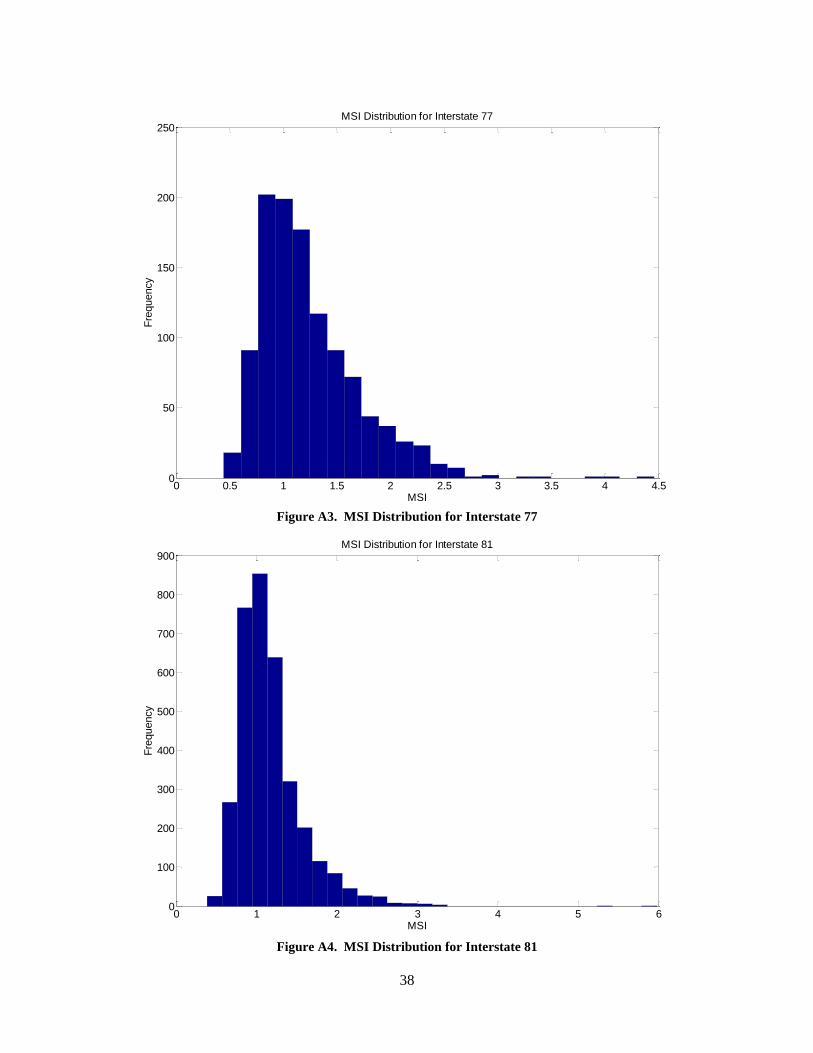
38
Figure A3. MSI Distribution for Interstate 77
Figure A4. MSI Distribution for Interstate 81
0 0.5 1 1.5 2 2.5 3 3.5 4 4.50
50
100
150
200
250MSI Distribution for Interstate 77
MSI
Fre
quency
0 1 2 3 4 5 60
100
200
300
400
500
600
700
800
900MSI Distribution for Interstate 81
MSI
Fre
quency

39
Figure A5. MSI Distribution for Interstate 85
Figure A6. MSI Distribution for Interstate 95
0 0.5 1 1.5 2 2.50
10
20
30
40
50
60
70MSI Distribution for Interstate 85
MSI
Fre
quency
0 0.5 1 1.5 2 2.5 3 3.5 4 4.50
20
40
60
80
100
120
140
160MSI Distribution for Interstate 95
MSI
Fre
quency

40
Figure A7. MSI Distribution for Interstate 264
Figure A8. MSI Distribution for Interstate 381
0.8 1 1.2 1.4 1.6 1.8 2 2.2 2.4 2.60
2
4
6
8
10
12
14
16
18MSI Distribution for Interstate 264
MSI
Fre
quency
1 1.2 1.4 1.6 1.8 2 2.2 2.4 2.6 2.8 30
1
2
3
4
5
6MSI Distribution for Interstate 381
MSI
Fre
quency

41
Figure A9. MSI Distribution for Interstate 464
Figure A10. MSI Distribution for Interstate 581
0.4 0.6 0.8 1 1.2 1.4 1.6 1.8 20
2
4
6
8
10
12
14MSI Distribution for Interstate 464
MSI
Fre
quency
0.8 1 1.2 1.4 1.6 1.8 2 2.2 2.4 2.60
2
4
6
8
10
12
14
16
18MSI Distribution for Interstate 581
MSI
Fre
quency

42
Figure A11. MSI Distribution for Interstate 664
0.4 0.6 0.8 1 1.2 1.4 1.6 1.80
1
2
3
4
5
6
7
8
9MSI Distribution for Interstate 664
MSI
Fre
quency