development of moment connections in glued-laminated
TRANSCRIPT
DEVELOPMENT OF MOMENTCONNECTIONS IN
GLUED-LAMINATEDALBERTA SPRUCE AND
PINE TIMBER
1995
Cliff Peter Hattar and J.J. Roger ChengDepartment of Civil Engineering
University of AlbertaEdmonton, Alberta
T6G 2G7
This is a joint publication of the Canadian Forest Service andLand and Forest Services pursuant to the
Canada-Alberta Partnership Agreement in Forestry.
A
A5020-121
DISCLAIMER
The study on which this report is based was funded in part under the Canada-Alberta PartnershipAgreement in Forestry.
The views, conclusions and recommendations are those of the authors. The exclusion of certainmanufactured products does not necessarily imply disapproval nor does the mention of otherproducts necessarily imply endorsement by the Canadian Forest Service or Land and ForestServices.
(c) Minister of Supply and Services Canada 1995Catalogue No.: Fo42-91/121-1995EISBN: 0-662-23066-3
Additional copies of this publication are available at no charge from:
Canadian Forest ServiceNatural Resources CanadaNorthern Forestry Centre
5320 - 122nd StreetEdmonton, Alberta
T6H 3S5Telephone: (403) 435 - 7210
or
Land and Forest ServicesAlberta Environmental Protection
10th Floor, Bramalea Building9920 - 108th StreetEdmonton, Alberta
T5K 2M4Telephone: (403) 427 - 3551
iii
ABSTRACT
The use of right-angle beam-column moment connections in rigid portal frames in glued laminatedtimber is not common practice. Hence it is the objective of this study to develop a momentresistant connection to be used in glulam timber. The first series of tests employed six differentspecimen patterns: three glulam rivet steel plate connections and three shear-plate boltedconnections. The specimens varied in the pattern of the rivet and bolt layout, lap or butt type ofjoint, and material of the side plates. The rivet joints performed significantly better than the boltedjoints in this series. An additional bolted connection was used to determine the location of theinstantaneous center of the joints. The effect and behaviour of bottom brackets, bearing plates andtop steel rivet brackets on the performance of riveted connections under a moment was examinedin the second phase of tests. Moment rotation curves of the tested specimens are presented. Thebeam-line concept was used to evaluate the viability of the connections in moment resistantframes. In addition, the behaviour of the specimen during the test, modes of failure and variouscomparative analyses are described and discussed.
ACKNOWLEDGMENTS
Financial support was provided by the Canada-Alberta Partnership Agreement in Forestry. Aspecial thanks is extended to Western Archrib for their financial and technical support.
A special gratitude of thanks goes to the Project Officer, Mr. Russel Bohning, for his guidance.
The assistance of the technical staff of the I.F. Morrison Structural Laboratory at the Universityof Alberta is acknowledged.
gs-
iv

TABLE OF CONTENTS
Page1.0 INTRODUCTION 1
1.1 General 11.2 Objectives and Scope 1
2.0 LITERATURE REVIEW 22.1 Research on Moment Connections 2
2.1.1 Bolted Joints 22.1.2 Glued and Epoxy Injected Connections 22.1.3 Nailed Gusset Plates Connections 3
2.2 Research on Timber Fasteners and Timber Joints 42.2.1 Nailed Connections 42.2.2 Glulam Rivet Connections 52.2.3 Shear Plates, Split Rings, and Bolts in Timber Joints 6
3.0 EXPERIMENTAL PROGRAM 73.1 Introduction 73.2 Geometry and Material Specification 7
3.2.1 Specimens and Connections Patterns 73.2.2 Specimen Size, Preparation, and Specified Strengths 8
3.3 Test Setup 83.4 Instrumentation 93.5 Test Procedure 103.6 Material and Embedment Tests 10
4.0 EXPERIMENTAL RESULTS 114.1 Introduction 114.2 Material Properties 114.3 Test Results 11
4.3.1 Phase 1 - Preliminary Investigation 124.3.1.1 General 124.3.1.2 The Riveted Connections 124.3.1.3 The Bolted Connections 13
4.3.2 Phase 2 - Further Studies on Riveted Moment Joints 134.3.2.1 General 134.3.2.2 Specimen Cl 144.3.2.3 Specimen C2 and Specimen C3 144.3.2.4 Specimen C4 16
4.3.3 Location of the Instantaneous Center (I.C.) 17
5.0 DISCUSSION OF THE TEST RESULTS 185.1 Location of the Instantaneous Center (I.C.) 185.2 Design and Evaluation 19
5.2.1 Design Model and Calculation of Design Values 195.2.2 Evaluation of Specimen Performance 20
5.2.2.1 Phase 1 205.2.2.1.1 The Riveted Connections 205.2.2.1.2 The Bolted Connections 20
5.2.2.2 Phase 2 215.3 Effect of Rivet Distribution Pattern 225.4 General Comparison and Implication of the Test Results 235.5 Advantage of Semi-Rigid Joint Application 24
6.0 SUMMARY AND CONCLUSIONS 266.1 General 266.2 Recommendations 27
LITERATURE CITED 28
APPENDIX A - Figures and Tables 31
APPENDIX B - Sample Calculations of Moment Connections' Resistance 79
vi
LIST OF FIGURES
Page2.1 Glulam Timber Reinforcement System (Gardner 1989) 332.2 Typical Portal Knee Developed by Gardner (Gardner 1989) 332.3 Direction of Forces on Bolts 342.4 Load Slip Schematic 342.5 The Glulam Rivet (McGowan 1966) 343.1 Specimen Al (7x10) Pattern 353.2 Specimen A2 (10x10) Pattern 353.3 Specimen A3 (10x7) Pattern 363.4 10x7 Rivet Pattern 363.5 Specimens A4 and B1 (4x2) 373.6 Butt Joint Bolted Connection 373.7 Joint Comparison 383.8 Specimens A5 and A6 (Circular) 383.9 Circular Bolted Pattern 393.10 Bottom Bracket (Series C) 403.11 Specimens C2 and C3 403.12 Specimen C3 413.13 Top Bracket (Specimens C2 and C3) 413.14 Schematic Test Setup 423.15 Photographic Test Setup 433.16 Manual Hydraulic Ram 443.17 Reaction Frame 443.18 Rotation Gauges and Cable Transducer Boxes 453.19 Gauge Layout on Specimen B1 463.20 Gauge Layout on Specimen B1 463.21 Strain Gauge Layout on Side Plate for Specimens Cl, C2, and C3 473.22 Strain Gauge Layout on Side Plate for Specimens Cl, C2, and C3 473.23 Strain Gauge Layout on Side Plate for Specimen C4 483.24 Strain Gauge Layout on Top Bracket 483.25 Strain Gauge Layout on Top Bracket 493.26 Photographic Test Setup for the 5x4 Rivet Plate
Loaded Parallel to the Grain 503.27 Photographic Test Setup for the 4x4 Rivet Plate
Loaded Perpendicular to the Grain 514.1 Typical Stress vs. Strain Plot for Steel Coupons 524.2 Plot of Load vs. Deformation for Embedded Fasteners
Loaded Parallel to the Grain 524.3 Plot of Load vs. Deformation for Embedded Fasteners
Loaded Perpendicular to the Grain 534.4 Moment Rotation Curves for Phase 1 534.5 Moment Rotation Curves for Phase 2 54
vii
4.6 Moment Rotation Curve for Specimen A2Demonstrating the Secant Stiffness 54
4.7 Cracks in End Grain for Specimen Al 554.8 Split Crack in Specimen A2 564.9 Dislocation of Shear Plates in Specimen A4 564.10 Large Cracks in the End Grain for Specimen A4 574.11 Splitting in the Middle Member (Specimen A5) 584.12 Splitting in the End Grain (Specimen A5) 594.13 Cracks in the End Grain (Specimen A6) 604.14 Cracks in the End Grain (Specimen Cl) 614.15 Strain Gauge Readings for Top Part of Side Plate (Specimen Cl) 614.16 Strain Gauge Readings for Bottom Part of Side Plate (Specimen Cl) 624.17 Wood Splitting and Bracket Bending (Specimen C2) 624.18 Brittle Fracture through Member at Bracket Bolts (Specimen C2) 634.19 Strain Gauge Readings for Top Part of Side Plate (Specimens C2,C3) 644.20 Strain Gauge Readings for Bottom Part of Side Plate (Specimens C2,C3) 644.21 Strain Gauge Readings for Top Bracket (Specimens C2,C3) 654.22 Failure in Bearing Plate and Top Bracket (Specimen C4) 664.23 Rivet Withdrawal and Wood Crack in Top Grain (Specimen C4) 674.24 Strain Gauge Readings for Top Part of Side Plate (Specimen C4) 684.25 Strain Gauge Readings for Bottom Part of Side Plate (Specimen C4) 684.26 Strain Gauge Readings for Top Bracket (Specimen C4) 694.27 Cracks in the Side Grain (Specimen B1) 694.28 Strain Readings Ga#1-Ga#2 (Specimen B1) 704.29 Strain Readings Ga#3-Ga#5 (Specimen B1) 704.30 Strain Readings Ga#6-Ga#8 (Specimen B1) 714.31 Strain Readings Ga#9-Ga#11 (Specimen B1) 714.32 Strain Readings Ga#12-Ga#14 (Specimen B1) 725.1 Principal Force Directions on Bolts in Specimen B1 735.2 Axes of Longitudinal Strain Gauges in a Rosette Gauge 735.3 Beam-Line Applied on Moment Rotation Curves 745.4 Bending Moment Diagrams for Various Boundary Conditions 74
viii
LIST OF TABLES
Page3.1 Specified Strengths and Modulus of Elasticity of Specimens 753.2 Specified Properties of Glulam Rivets 754.1 Material Properties for Top Steel Brackets 754.2 Fastener Embedment Strengths 764.3 Summary of Test Results 765.1 Summary of Test Results 775.2 Evaluation of Specimen Performance 77
ix
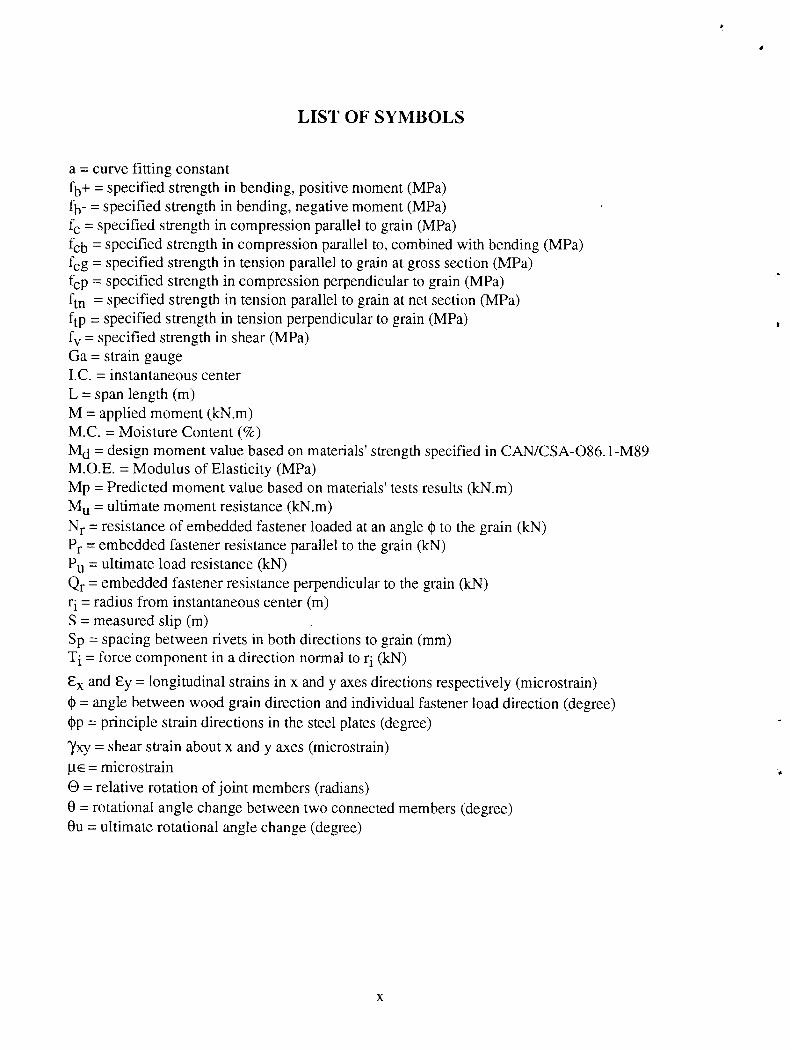
LIST OF SYMBOLS
a = curve fitting constantfb+ = specified strength in bending, positive moment (MPa)fb- = specified strength in bending, negative moment (MPa)fc = specified strength in compression parallel to grain (MPa)fcb = specified strength in compression parallel to, combined with bending (MPa)fcg = specified strength in tension parallel to grain at gross section (MPa)fcp = specified strength in compression perpendicular to grain (MPa)ftn = specified strength in tension parallel to grain at net section (MPa)ftp specified strength in tension perpendicular to grain (MPa)fv = specified strength in shear (MPa)Ga = strain gaugeI.C. = instantaneous centerL = span length (m)M = applied moment (kN.m)M.C. = Moisture Content (%)Md = design moment value based on materials' strength specified in CAN/CSA-086.1-M89M.O.E. = Modulus of Elasticity (MPa)Mp = Predicted moment value based on materials' tests results (kN.m)Mu = ultimate moment resistance (kN.m)Nr = resistance of embedded fastener loaded at an angle 41) to the grain (kN)Pr = embedded fastener resistance parallel to the grain (kN)Pu = ultimate load resistance (kN)Qr = embedded fastener resistance perpendicular to the grain (kN)ri = radius from instantaneous center (m)S = measured slip (m)Sp = spacing between rivets in both directions to grain (mm)Ti = force component in a direction normal to r i (kN)
Ex and Cy = longitudinal strains in x and y axes directions respectively (microstrain)(I) = angle between wood grain direction and individual fastener load direction (degree)
= principle strain directions in the steel plates (degree)
-yxy = shear strain about x and y axes (microstrain)1.1E = microstrain0 = relative rotation of joint members (radians)0 = rotational angle change between two connected members (degree)Ou = ultimate rotational angle change (degree)
1.0 INTRODUCTION
1.1 GENERAL
Moment resistant rigid portal frames have been widely used in steel and concrete structures. Thispractice has lead to the efficient and economical use of materials in steel and concreteconstruction. In wood construction, it is customary to design the connections as simpleconnections, i.e. no moment resisting capability for the connections. This causes not only the useof more wood, but also the need for a bracing system, thus reducing the competitiveness of woodin construction, especially in non-residential construction. There are very few studies on thedesign and/or behaviour of moment connections for wood structures and, in particular, momentjoints for glued-laminated timber.
Of the few researches and applications where moment resistant joints exist, are portal frames withnailed plywood gussets (Batchelar 1982). However, they are only used in light structures. Chapter2 discusses this application further and the few research studies conducted on moment joints inglued-laminated timber.
1.2 OBJECTIVES AND SCOPE
It is the intention of this study to develop practical moment connections to be used in woodenframes; hence, a more economical design can be achieved. Glued-laminated timber manufacturedfrom Alberta spruce and pine is used in this study.
This study includes the two series of the experimental program aiming at studying the behaviourand performance of various types of moment connections under monotonic loading. The resultsfrom the first series were used to further develop and improve certain configurations of glulamrivet joints.
The testing of the first phase was conducted on a total of six specimens: three glulam rivetmoment joints that varied with respect to the rivet layout pattern, and three shear-plate boltedmoment joints (one butt joint type of connection with steel cover plates and two lap joints withcircular bolted patterns, one with plywood cover plates and another with steel cover plates). Themoment capacity results from the tests were compared with those predicted from theory.
The location of the instantaneous center (I.C.) for the butt type joints was determined in thesecond phase where a rectangular shear-plate bolted joint similar to that of the first phase wastested with the appropriate instrumentation. Four glulam rivet moment joints similar to the firstphase were tested with additional improvements. The connections were reinforced with steelbrackets and/or steel bearing plates to improve their performance.
A design model and procedure were developed for the moment connections in glued-laminatedtimber. Further improvements of the strength and stiffness of such joints were also discussed.
2.0 LITERATURE REVIEW
2.1 RESEARCH ON MOMENT CONNECTIONS
There is very little research on moment connections in timber construction. Crews (1990)investigates work in this area throughout the world.
2.1.1 Bolted Joints
Crews (1990) states that in Europe, the use of circular bolted patterns has become widelyaccepted as a means of connection design for moment resisting connections, particularly betweencolumns and rafters in large free-spanning timber structures.
Work conducted by Rodd (1973) on circular connectors and split rings at Brighton Polytechnichas formed the basis of ongoing work to construct moment resistant joints for glued-laminatedtimber portal frames, which can be readily fabricated on site. His observations demonstratedcircular pattern joints made with circular dowels that had high circumferential friction with thetimber increased the strength of the joints. Hence, by filling the tolerance of the bolt holes withresin, strength is increased and all fasteners can be assumed to take up the load instantaneously,leading to stiffer joints. However, the ultimate strength capacity of the joint is governed by thetension strength perpendicular to the grain of lumber. Several conclusions were discussed such asthe shift in the center of rotation away from the centroid of the bolt group resulted in significantdifferences in the loads per bolt. The higher forces tended to occur in bolts closest to the cornersof the connections. It was also concluded that gluing a 3 mm thick plywood to the sides of thelaminates limited the splitting and increased the ductility of the joint, but not significantly thestrength (maximum of 20%).
In truss structures, work by Gehri (1982) has focused upon the development of high capacity endplate connections utilizing dowels. The theory for design is based on Johansen's theory (1949)which assumes that both the fastener and the timber are ideal rigid-plastic materials. His equationspredicted bearing failure of the timber member or simultaneous development of plastic hingeformation in the fastener. Gehri's testing confirmed that a careful selection of fm plate interfaces
dowel size will result in a high strength ductile connection which has a "gentle" failure moderather than a brittle and "catastrophic" timber failure mode.
2.1.2 Glued and Epoxy Injected Connections
Syme (1987) highlighted the use of glued bolt connections. His technique uses slightly undersizedholes (1 mm to 2 mm), which are half filled with glue. A groove is needed along the length of thethread to allow the glue to mix around the embedded portion of the dowel as well as permittingrelief of hydrostatic pressure from the epoxy in the timber. The disadvantages of this system arethat splitting can easily occur within the timber member and quality control is difficult to monitor.It is also impossible to determine whether the glue has been evenly distributed across the interface
2
between the dowel thread and the timber. A newer technique slightly different from the above wasdeveloped by Riberholt (1986). In this technique the rods were placed in oversized holes about2 mm larger than the thread diameter and an epoxy glue is injected through a hole in the timber atthe bottom of the embedment hole for the dowel rod. This tackles the disadvantages of theprevious technique.
Crews (1990) indicates that epoxy injected connections have been used successfully in Denmarkfor over ten years and have resulted in moment resisting connections which have a capacity ofapproximately 75% of that of a glue-laminated beam. Similar work was investigated by Rodd etal. (1989).
Other applications include Gehri's work (1982) on the use of pre-stressed post-tensioned rods andcables ducting inside the laminates, couped with epoxy to cope with high shear and bearingstresses. Gardner's work (1989), however, focuses upon beam elements which have steelreinforcing deformed rods set in high strength epoxy and built into the outer top and bottomlaminates of the beam, to form a "composite" beam section as shown in Figure 2.1'. This systemhas been adapted for use in moment resistant connections as shown in Figure 2.2. Buchanan(1990) indicates that the failure mechanism for this type of connection is a combined tensionparallel and perpendicular to the grain failure, and at the end of the tension dowels.
The analytical models used to predict the performance of the moment joints are normally basedupon rivet/bolt group theory. Modifications to account for the injected resin frictional bond weremade to the models by Rodd et al. (1989).
2.1.3 Nailed Gusset Plates Connections
Research on moment resistant joints in wood structures have been conducted on nailed plywoodgusset joints for timber portal frames by Batchelar (1982). He developed a design procedurecovering laminated beam connections formed with nailed plywood gussets. He modified his designfrom a mitred joint at the intersection of the glued-laminated leg and rafter members to a jointwhere the rafter rested on top of the leg member. This was accompanied by a change in theorientation of the plywood gusset. Further methods of analysis to determine nail loads and gussetstresses were described by Walford (1988). He indicated that a method described by Mitchell(1979) was both simple and consistent over a wide range of joint shapes when compared to an"exact" analysis which allowed for non-linear load/slip behaviour of nails. He also recommendedthat a torsion tube analogy for nail load-slip analysis may be more appropriate in calculation ofultimate joint capacity.
A study by Perkins et al. (1964) concluded that the torsion or rivet formula as in Eqn. 2.1 wasfound to be adequate for most nail patterns. The equation notations are shown schematically inFigure 2.3.
'All figures are in Appendix A.
3
Ti = (M.ri)//r2 (Eqn. 2.1)
where Ti is the force component in a direction normal to the distance ri (radius from the centroidof the pattern) and M is the applied moment.
In their study, the relative rotation of the joint members as shown in Figure 2.4 was related toload-slip behaviour by Eqn. 2.2 and Eqn. 2.3.
0=1\44a a). (Eqn. 2.2)Si = Ori
(Eqn. 2.3)
Where 0 is the angular rotation in radians, Si is the measured slip and a is a fitting constant. Thisformula fitted their test curves quite sufficiently.
The torsional formula makes no provision for distortion in a joint and indicates that the portion ofthe entire load carried by the individual nails will be proportional to their respective distancesfrom the instantaneous center; whereas the cut-vilinearity of the load-slip relationship dictates thatonce a nailed joint does slip there will be automatic lessening of the load on the extreme nail. Thiscauses the other nails in the pattern to share the load in greater than linearly proportionalamounts.
Finally, Kivell et al. (1981) produced hysteretic models of nailed gussets in moment-resistanttimber joints where they later conducted research on cyclic loading on such joints (1982).
2.2 RESEARCH ON TIMBER FASTENERS AND TIMBER JOINTS
2.2.1 Nailed Connections
Through the mid 1970's, Foschi (1974) investigated the load-slip characteristics of nails, which isdefined as a nonlinear relationship between a force applied to the head of a nail (which is alreadydriven into the wood) and the head displacement, caused by a force applied in a normal directionto the nail shank. Foschi's work led to the development of analytical models which are useful inpredicting the yielding mechanism of the nail due to bending and the nonlinear bearing behaviourof the wood material due to the effects of the load.
Characteristic properties of nailed and bolted joints under short-term lateral loads wereinvestigated by Smith et al. (1987). The short-term test observations suggest that boltedconnections are more prone to brittle failure than nailed connections. Higher load factors relatingworking strength to ultimate strength might therefore be reasonably applied. In nailed joints, highload factors are used to reduce the ultimate load capacity to a level which will give a slip that issufficiently low to ensure serviceable connections at the working load levels. Bolts are often usedin connections where slip is less critical and where design loads can be assigned a higherproportion of the ultimate capacities than is appropriate for nailed connections. Rather than using
4

tabulated data for design, Smith et al. suggested that the basic material property equations and theset of yield equations be presented instead. This would enable designers to calculate theappropriate ultimate load for any arrangement, and would identify the mode of failure to beexpected.
2.2.2 Glulam Rivet Connections
In the late 1960's, Madsen developed a high strength nail (commonly called glulam rivet) to beused in conjunction with a steel plate and glued-laminated timber. The glulam rivet has geometricproperties as shown in Figure 2.5, where the rectangular shaft is pushed through an undersizedcircular hole in a steel plate. The high stresses developed on the sides of the shaft holds the nailfirmly in place. The cantilever action from the nails was used to resist the lateral load as shownschematically in Figure 2.5. Research by Aune and Patton-Mallory (1986) has indicated that forjoints with an initial gap between the members, the effect of driving the nails flush to the surface isto increase the lateral load by about 30%. In practical structures nail heads may not be drivenflush to the surface, and the timbers may not be in close contact after shrinkage movements haveoccurred; hence, it is more appropriate to ignore this increase in design.
McGowan (1966) studied the glulam rivet plate connector's performance under different variablessuch as nail length, nail spacing, fixity of nailhead in plate, form of shank, and end and edgedistances. Profound differences were realized. He concluded that where fastenings contained largenumbers of nails, strength on a per nail basis was not constant, but was largely dependent on thenumber of nails aligned in the direction of the applied load. He also found that glulam rivet platefastenings were superior in stiffness properties to bolted shear plate connectors.
In glulam rivet connections, a stress analysis for the cluster of rivets loaded parallel andperpendicular to the grain has been done by Foschi (1974). This analysis, together with a reporton the maximum load-carrying capacity of a single rivet, allows a simple design procedure for thistype of connection. The procedure is advantageous in that it permits taking into account alldifferent parameters controlling the design of these connections such as rivet spacing in bothdirections, end and edge distances, and the number of rows (parallel to the grain) and columns(perpendicular to the grain) of rivets in a joint. Foschi's work was conducted on Douglas firspecies of wood.
Further work by Foschi and Longworth (1975) investigated group behaviour of glulam rivets andthe effects of loads distribution and nailing patterns. The conclusions were:
Nail spacing controls the mode of failure of the connection, with wider spacingproducing nail yielding modes.Close nail spacing may produce brittle wood failures, usually by shearing around thegroups of nails at loads less than the nail capacity.
3) For the same nail spacing a longer end distance increases the ultimate load based uponshear failure.
5
4) It is possible to estimate both nail yielding failure and wood bearing failure so thatwood failures will not occur before nail yielding, thus optimizing nailutilization.
In order to extend the use of glulam rivets to other wood species, Karacabeyli and Fraser (1989)carried out tests using spruce glulam and solid timber. Buchanan and Lai (1993) found that glulamrivets in radiata pine have 70-90% of the strength of rivets in Douglas fir. They also found that theEuropean yield theory (originally developed by Johansen (1949)) gave excellent predictions ofrivet strength and failure mode in those conditions where wood tension failures were notexpected. This theory predicts the ultimate lateral load of a nailed timber joint assuming plasticityin both the wood and the fastener.
2.2.3 Shear Plates, Split Rings, and Bolts in Timber Joints
The investigation of Masse et al. (1988) on the lateral strength and stiffness of single and multiplebolts in glued-laminated timber loaded parallel to the grain was part of a study to determine if theanalytical yield model based on Larsen (1973) could predict adequately the strength of single andmultiple bolt connections. His study dealt only with the experimental determination of boltedconnections with varied end distances, bolt spacing, number of rows, and columns of bolts.
Wilkinson (1993) later investigated the properties of bolted connections with steel side plates. Hefound that the European Yield Model predicted bolted connection yield load with acceptableaccuracy, and that the yield load slightly increased with increased steel member thickness, exceptwhen the increased thickness caused the side member to bear on the bolt threads. He also foundthat connections loaded parallel to the grain by tension or compression loading gave the sameresults.
Lheude (1985) conducted studies where he found that the maximum tension load capacity of102 mm diameter shear plates and split rings was approximately 50% of the compressioncapacity; however, the capacities were similar for the smaller diameter connectors. In addition,where connectors were fitted into grooves cut in the green condition and allowed to dry, splittingreduced the average green tension capacity by 20%. Lheude also found that an increase in enddistance with the larger diameter shear plates improved the tension load capacity for two speciestested.
6
3.0 EXPERIMENTAL PROGRAM
3.1 INTRODUCTION
The experimental program was conducted in two phases. The first was a preliminary investigationto establish a comparison between the different glued-laminated timber moment connectionsbased on the type of mechanical fastener used to hold the joint. The joint with the bestperformance in this phase was further investigated and studied in the second phase whereimprovements were also made and evaluated.
3.2 GEOMETRY AND MATERIAL SPECIFICATION
3.2.1 Specimens and Connections Patterns
The first phase consisted of six specimens (Al to A6): three steel rivet plate connections, andthree bolted connections. The three riveted connections had rivet patterns of 7x10, 10x10 and10x7 for Specimens Al to A3, respectively. Figures 3.1 and 3.2 show the 7x10 and 10x10patterns, respectively. Figures 3.3 and 3.4 show the rivet plate used in Specimen A3 in which10x7 signifies 10 rows of rivets multiplied by 7 columns of rivets. A row of rivets is a line ofrivets parallel to the grain in the top member, whereas the column of rivets is a line of rivets in adirection perpendicular to the grain in the top member (see Figure 3.4). The opposite is true forthe bottom member. The dashed line shows the boundary between the two connecting members.The same patterns were used on each of the two connecting members and on both sides. Thespecimens were designed to study the effects of the number of the rivets and their patterns on thebehaviour of the connections under the action of a moment. Specimen A4 had two steel sideplates (size 270 mm x 600 mm) with a rectangular 4x2 bolt pattern as shown in Figures 3.5 and3.6. These specimens where the two connecting members lie in the same plane are butt typejoints. The differences between butt and lap type joints are shown in Figure 3.7. Two circular boltpatterns as shown in Figures 3.8 and 3.9, one with wooden side plates and another with steel sideplates for Specimens A5 and A6, were tested using lap type joints. This phase aimed at studyingthe effect of various rivet and bolt patterns on the performance of moment connections. All boltedconnections (Specimens A4, A5, A6 and B I) utilized 67 mm (2-5/8") shear plates on each side ofevery member in each joint.
The second phase consisted of five specimens. This phase was further divided into series B and C.Series B consisted of Specimen B1 which had a rectangular bolted connection as shown in Figure3.5, similar to Specimen A4, but different with respect to the thickness of the members. Thisspecimen was designed to study the force distribution among the bolts and locate the I.C. of thebutt type of joints.
Series C consisted of four specimens. Specimen Cl was similar to Specimen A3 (i.e. 10x7 rivetpattern) with the addition of a 6.3 mm thick bottom steel bracket, as shown in Figure 3.10, fixedto the bottom corner of the joint with wood screws. Specimens C2 and C3 (Figures 3.11 and
7
3.12) were also similar to Specimen A3 (i.e. 10x7 rivet pattern) with the addition of a bottomsteel bracket and a rivet 6.3 mm thick top steel bracket as shown in Figure 3.13. Specimen C3 hada larger moment arm than Specimen C2. A steel bearing plate between the two connectingmembers was used in lieu of the bottom steel bracket in Specimen C4. Both the bearing plate andthe top bracket had a thickness of 9.5 mm. In addition, a 5x4 rivet pattern was used in SpecimenC4 instead of the 10x7 used in the other specimens tested in series C. Hence, the spacing betweenthe rivets in both parallel and perpendicular directions to the grain was increased from 25 mm inthe 10x7 patterns to 40 mm in the 5x4 pattern.
3.2.2 Specimen Size, Preparation, and Specified Strengths
Alberta spruce and pine glued-laminated timber manufactured by Western Archib in Edmonton,Alberta, was used for the specimens. The cross section of the main member in the lap joints andboth members in the butt joints were chosen to be 130 mm x 380 mm (i.e. 10 laminates of130 mm x 38 mm timber sections). The smaller section, 80 mm x 380 mm (i.e. 10 laminates of80 mm x 38 mm), was chosen for Specimen B 1 and the side members in the lap joints (A5 andA6) since only one half of the applied force on the middle member is applied on each of the sidemembers.
Specimen C3 had member lengths of 1500 mm and 1880 mm forming a moment lever arm of980 mm. All the other specimens had member lengths of 1120 mm and 1500 mm providing amoment lever arm of 720 mm (see Figure 3.14). The length of all the members in the lap jointswere 1500 mm giving a moment lever arm of 720 mm since the I.C. of the lap joints is in thecenter of the circular bolt pattern as opposed to the bottom corner in all the butt joints.
The timber used was spruce and pine of grade 20f-EX. Its specified strengths are presented inTable 3.1 1 (Canadian Standard Association 1989). The bolts and rivets used conform to therequirements of CSA Standard CAN3-G40.21 (1987) and ASTM Standard A36 (1988). The boltswere 19 mm (3/4") diameter of type ASTM-A307 with a specified shear strength of 33.4 kN insingle shear. The specified properties of the glulam rivets used (also called "griplam nails") areshown in Table 3.2.
The rivets were driven through using a sledge hammer, positioned by aligning their longitudinalaxis parallel to the wood grain of each member. The bolt holes, however, were made using a21 mm (13/16") bit drill to fit the 19 mm (3/4") steel bolts, then a special grooving tool wasattached to the drill to create the groove holes for the 67 mm (2-5/8") shear plates.
3.3 TEST SETUP
The test setup is shown in Figure 3.14. The photographic setup is illustrated in Figure 3.15. Amanual hydraulic ram (shown in Figure 3.16) with a capacity of 200 kN was used to apply the
'All tables are in Appendix A.
8
load. The specimen was mounted on rollers at the load point and on a stub beam bolted to theground at the other end (shown in Figure 3.17) using two steel brackets. The attachment wasachieved using pins to allow rotation at the ends of the specimens. Friction from the pins wasignored since its effect on the moment applied was considered to be negligible. Bolt holes of27 mm (1-1/16") in diameter were created in the brackets and the ends of each specimen, toattach the brackets to the specimen. To prevent out-of-plane side sway of the specimen during thetest, a beam with attached angles was set on two columns and used to brace the specimens at theapex as shown in Figure 3.15.
3.4 INSTRUMENTATION
The instrumentation can be categorized based on the measurements taken: loads, displacements,slips measurements, and strains. Figure 3.14 shows the location of the various instrumentationused.
The main characteristic to be found from this test is the load-rotation (moment-rotation) curve. Aload cell was installed at the load point to measure the applied load. To measure the rotation,electronic rotational gauges were installed approximately on the quarter points of each memberaway from the joint. The influence of the beam bending and verification of rotational gauge datawas of some concern; hence, cable transducers were installed at the quarter points and half pointsof each member to measure the movement of each of the members at points of concern. The cabletransducer boxes were fixed to a plywood board and on a timber column mounted on the board inthe first series of tests; however, they were mounted on the member itself in the later series toreduce the measurement error (see Figure 3.18).
The movement of the point load (i.e. the stroke) was measured using a cable transducer. Theslippage of the reaction frame (stub column) was also measured using a mechanical dial gaugemounted on a fixed point against the frame. Measurements of the movement of the cover (side)steel or wooden plates with respect to the timber were taken throughout the first series using the50 mm spaced demec points at selected locations on both sides of each plate.
Strain gauges were used in the second phase of the experimental program. Rosette strain gaugeswere mounted on the steel plate at the far row of bolts in Specimen Bl as shown in Figures 3.19and 3.20 to locate the principal strains. In series C, longitudinal strain gauges were mounted onthe side plate below certain rivets (see Figures 3.21 and 3.22) to measure the stress distributionbetween the rivets. Since Specimen C4 had a different rivet pattern on the side plates, the straingauge layout varied as in Figure 3.23. Longitudinal strain gauges were also mounted on the topbracket as in Figures 3.24 and 3.25. Some of the gauges were mounted only on the outer surfaceto measure the stress distribution between the rivets. However, at four locations strain gaugeswere placed on both sides of the bracket to measure its total average cross-sectional strain.
9
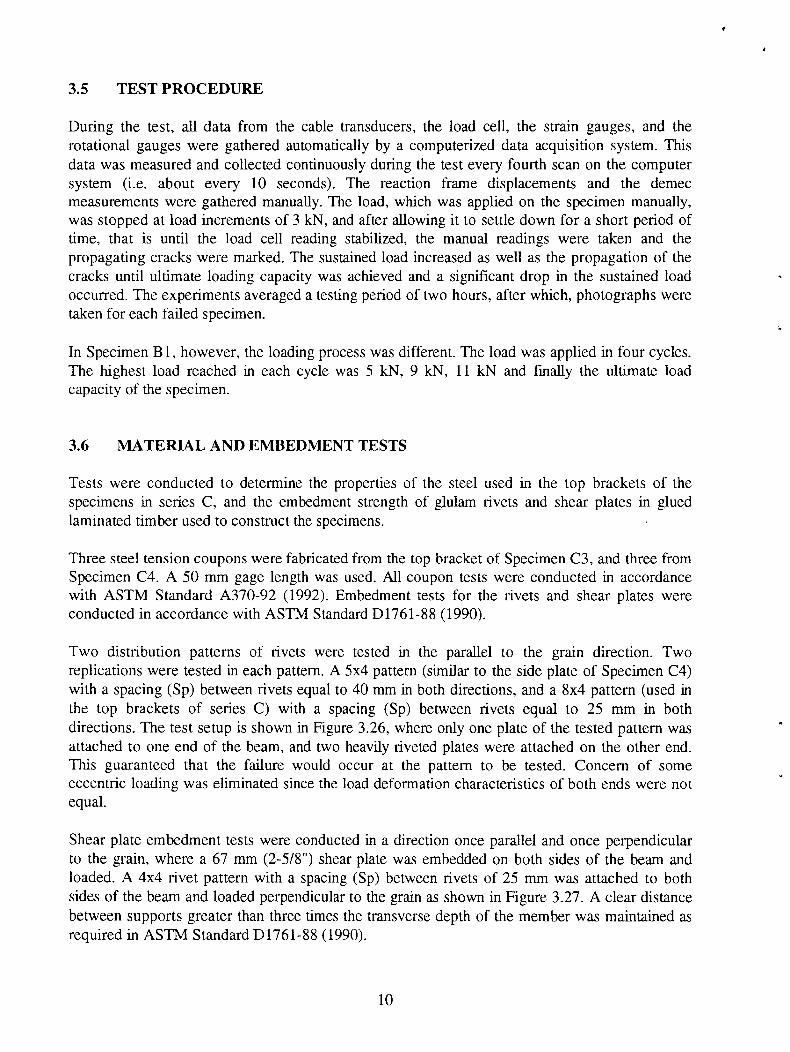
3.5 TEST PROCEDURE
During the test, all data from the cable transducers, the load cell, the strain gauges, and therotational gauges were gathered automatically by a computerized data acquisition system. Thisdata was measured and collected continuously during the test every fourth scan on the computersystem (i.e. about every 10 seconds). The reaction frame displacements and the demecmeasurements were gathered manually. The load, which was applied on the specimen manually,was stopped at load increments of 3 kN, and after allowing it to settle down for a short period oftime, that is until the load cell reading stabilized, the manual readings were taken and thepropagating cracks were marked. The sustained load increased as well as the propagation of thecracks until ultimate loading capacity was achieved and a significant drop in the sustained loadoccurred. The experiments averaged a testing period of two hours, after which, photographs weretaken for each failed specimen.
In Specimen Bl, however, the loading process was different. The load was applied in four cycles.The highest load reached in each cycle was 5 kN, 9 kN, 11 kN and finally the ultimate loadcapacity of the specimen.
3.6 MATERIAL AND EMBEDMENT TESTS
Tests were conducted to determine the properties of the steel used in the top brackets of thespecimens in series C, and the embedment strength of glulam rivets and shear plates in gluedlaminated timber used to construct the specimens.
Three steel tension coupons were fabricated from the top bracket of Specimen C3, and three fromSpecimen C4. A 50 mm gage length was used. All coupon tests were conducted in accordancewith ASTM Standard A370-92 (1992). Embedment tests for the rivets and shear plates wereconducted in accordance with ASTM Standard D1761-88 (1990).
Two distribution patterns of rivets were tested in the parallel to the grain direction. Tworeplications were tested in each pattern. A 5x4 pattern (similar to the side plate of Specimen C4)with a spacing (Sp) between rivets equal to 40 mm in both directions, and a 8x4 pattern (used inthe top brackets of series C) with a spacing (Sp) between rivets equal to 25 mm in bothdirections. The test setup is shown in Figure 3.26, where only one plate of the tested pattern wasattached to one end of the beam, and two heavily riveted plates were attached on the other end.This guaranteed that the failure would occur at the pattern to be tested. Concern of someeccentric loading was eliminated since the load deformation characteristics of both ends were notequal.
Shear plate embedment tests were conducted in a direction once parallel and once perpendicularto the grain, where a 67 mm (2-5/8") shear plate was embedded on both sides of the beam andloaded. A 4x4 rivet pattern with a spacing (Sp) between rivets of 25 mm was attached to bothsides of the beam and loaded perpendicular to the grain as shown in Figure 3.27. A clear distancebetween supports greater than three times the transverse depth of the member was maintained asrequired in ASTM Standard D1761-88 (1990).
10
4.0 EXPERIMENTAL RESULTS
4.1 INTRODUCTION
The results of the two phases of the experimental program are presented in this chapter. Thematerial properties of the test specimens are presented in Section 4.2. The full test behaviour ofeach specimen is presented in Section 4.3. This includes the physical behaviour of the specimens,the moment vs. rotation curves, and the strain distribution in the steel fastener plates.
4.2 MATERIAL PROPERTIES
Table 4.1 presents the results from the steel coupon tests. That includes the elastic modulus, thestatic yield, strength, and the ultimate strength. Both the thin and thick sections provided lowerthan expected elastic moduli. The thick section had a higher average static yield strength than thethinner one, but a lower average ultimate strength. A typical plot of stress vs. strain is shown inFigure 4.1.
The results of the fastener embedment tests are presented in Table 4.2. For the patterns wheremore than one test was performed, the average embedment strength is presented. The specifiedstrength of each connection from CAN/CSA-086.1-M89 (Canadian Standard Association 1989)is also listed. Both the specified and tested strengths were very similar for all but test #3 where theembedment strength of the 67 mm (2-5/8") shear plate loaded parallel to the grain was 50%higher than the specified value.
The embedment strength of the riveted plates was divided by the number of rivets; hence, theaverage strength per rivet in both directions can be used in the analysis to calculate the momentresistance of the moment connections. Typical plots of load vs. deformation for fasteners loadedin both parallel and perpendicular directions to the grain are shown in Figures 4.2 and 4.3. Inaddition, the moisture content (M.C.) for each specimen is presented in Table 4.3.
4.3 TEST RESULTS
The summary of the results from all series of experiments is presented in Table 4.3. The ultimateloads at which the connection failed are presented accompanied by the rotational angles. Therotation values represent the change in the 90 degree angle of the joint. The moment vs. rotationcurves of all specimens are presented in Figures 4.4 and 4.5. The moment was calculated based ona lever arm as shown in Figure 3.14. The Secant Stiffness (The slope of the line that intersects themoment-rotation curve at 50% of the ultimate moment and at zero moment) for each specimen isalso presented in Table 4.3. They are illustrated using the moment vs. rotation curve of SpecimenA2 in Figure 4.6.
11
4.3.1 Phase 1 - Preliminary Investigation
4.3.1.1 General
This section provides a descriptive behaviour of the tested connections. Referring to Figure 4.4,Specimens A2 and A3, which have rivet patterns of 10x10 and 10x7, respectively, appeared tohave performed similarly in terms of strength and stiffness; however, the latter exhibited a longerperiod of plastic rotation. Specimen Al, with 7x10 rivet, yielded less strength and stiffness thanSpecimens A2 and A3. Nevertheless, all three riveted connections performed better than the otherthree bolted specimens (A4 to A6).
Specimens A5 and A6, having circular bolt patterns, performed with higher strength and stiffnessthan Specimen A4 with the rectangular bolt pattern. Specimen A6 with steel side plates performedslightly better than Specimen AS. Nevertheless, all three exhibited large rotations.
4.3.1.2 The Riveted Connections
The ultimate load at which Specimen Al (7x10 rivet) failed was 31 kN corresponding to amoment of 22.3 kN.m. The specimen witnessed an ultimate rotational angle change of 3.9°.After this point, the load dropped dramatically (Figure 4.4). The specimen failed mainly insplitting along the side grain near the farthest rivet from the bottom corner of the connection.Cracks in the end grain started to develop at 8.6 kN.m and opened up as wide as 20 mm at theend of the test, as shown in Figure 4.7. These cracks opened up and spread throughout the topmember. The highest cracks in the end grain occurred first and opened up the most since theywere the ones closest to the most stressed rivet.
Another phenomenon of interest was the crushing of the wood at the bottom corner of the jointwhere the two members met. This was not a cause for failure, but the differential displacementbetween the bottom of the joint (where the crushing occurred) and the top (where the gapopened) contributed to the joint rotation hence reducing the joints stiffness.
Specimen A2 (10x10 rivet) had an ultimate loading capacity of 45 kN, corresponding to amoment of 32.4 kN.m. The ultimate rotational angle change achieved in this specimen was 3.55°.Similar to Specimen Al, Specimen A2 failed in splitting along the side grain. The pattern provideda large number of rivet columns perpendicular to the grain; hence, one big crack occurred justabove the highest row of rivets, as shown in Figure 4.8, leading to a brittle sudden failure. Thecrack spread throughout the specimen similar to Specimen Al. Crushing of the wood at the jointalso occurred in the same manner. Before the test on Specimen A2 commenced, the gap betweenthe two connecting members on the east side was smaller than that on the west side, so during thetest, it was observed that the east side crack spread less through the member than on the westside.
12
Specimen A3 (10x7 rivet) failed ultimately at a load of 43 kN, corresponding to a moment of31.0 kN.m. The ultimate rotational angle change achieved in this specimen was 5.5°. Similar tothe two previous butt joint specimens, the mode of failure was the same. However, since less rivetcolumns perpendicular to the grain existed, more cracks were distributed along the side grain atthe furthest column of rivets from the I.C. than the previous two specimens as shown in Figure3.4.
4.3.1.3 The Bolted Connections
The ultimate load capacities of the bolted connections are smaller than the riveted connections.Specimen A4 (4x2 bolted pattern) failed at a load of 24.5 kN that corresponds to a moment of17.6 kN.m. It witnessed an ultimate rotational angle change of 6.2°. The mode of failure wassomewhat different from the riveted connections. Bearing failure occurred at the location of theshear plates where the top ones crushed through the wood, splitting it along the grain. Figure 4.9shows the dislocation of the shear plates from both sides of the specimen, whereas Figure 4.10shows the splitting of the grain. Similar to the rivet connections, cracks developed and spreadthroughout the top member (where bolt forces occurred perpendicular to grain), and openings inthe end grain as high as 40 mm were observed; however, no damage to the bolts or shear plateswas found.
The connections in double shear exhibited higher strengths than Specimen A4. Specimen AS (lapjoint with wooden side plates) failed at an ultimate load of 30 kN, corresponding to a moment of29.7 kN.m. The ultimate rotational angle change achieved in this specimen was 6.6°. Thisspecimen failed in splitting along the grain mostly in the middle member as shown in Figures 4.11and 4.12. The cracking started at moments about 15.3 kN.m in the middle member. Cracks in theouter members were developed in the end grain at moments around 20 kN.m. Throughout thetest, cracks opened up and spread throughout the middle member as apparent in Figure 4.11,caused by the stress at the bolt closest to the outer edge.
Specimen A6 (lap joint with steel side plates) failed at a higher ultimate load of 36 kN (or amoment of 35.6 kN.m). Similarly, the ultimate rotational angle change achieved in this specimenwas 6.5°. The mode of failure was similar to that of Specimen A5 where splitting along the sideand end grain occurred as shown in Figure 4.13. The difference was that the cracks opened up atloads higher than those in Specimen A5.
4.3.2 Phase 2 - Further Studies on Riveted Moment Joints
4.3.2.1 General
The addition of various combinations of steel plates and steel brackets in series C increased thestrength and stiffness of the rivet connected specimens. Specimens C2 and C3 performed verysimilar to one another since both had a bottom bracket and a top riveted bracket. Specimen C1,with a bottom bracket only, performed with less strength and stiffness than Specimens C2 and C3.
13
The bottom bracket, substituted with a bearing plate in Specimen C4 which also had a top rivetedbracket but less side rivets, performed with more ductility but less strength and stiffness than theprevious three specimens.
4.3.2.2 Specimen Cl
The strength and stiffness exhibited in this specimen were superior to that of Specimen A3 whichhad the same rivet pattern in the side plates as Specimen Cl. The specimen achieved an ultimateload capacity of 50 kN corresponding to a moment of 36 kN.m. The ultimate rotational anglechange obtained was 6.0°. The mode of failure was similar where end grain splitting of the woodoccurred in the top member at the side rivets as in Figure 4.14. Crushing of the top member at thebottom corner of the joint was reduced due to the existence of the bottom bracket.
The longitudinal strain gauges (Ga#1 to Ga#12) mounted on the side plate as in Figures 3.21 and3.22 provided strain readings throughout the loading of the specimen. Figure 4.15 shows thestrain readings for the top portion of the side plate. Strain readings from Ga#1 increased linearlyin compression until a reading of -700 microstrain (4E ) was obtained at the ultimate appliedmoment of 36 kN.m. Ga#2, Ga#3, Ga#4, and Ga#6 all had non-linear increasing tension readingsuntil about 90% of the ultimate loading capacity when these strain readings descended and wentthrough a sign change to exhibit compression behaviour up to a similar strain reading of -1000
. Throughout the loading, Ga#5 and Ga#7 witnessed low compression. Ga#8, however,witnessed very high tension behaviour giving a reading of 1500 [IE
Figure 4.16 shows the strain readings for the bottom portion of the side plate. The strain readingfrom Ga#9 was significantly the highest compared with other gauges in this portion. The strainreading was in tension and reached a high of 800 [1E at the ultimate load capacity after which itstarted to drop until a reading of 200 4E . Ga#10 exhibited negligible readings; however, Ga#11exhibited an increasing tension strain until a reading of 200 [LE was obtained at an appliedmoment of 25 kN.m after which the tension began to decrease. Finally, the strain reading fromGa#12 increased linearly in compression with the load until -120 [LE was achieved at the ultimateapplied load.
4.3.2.3 Specimen C2 and Specimen C3
Both specimens will be discussed together since their behaviour was almost identical. SpecimensC2 and C3 performed with higher strength and stiffness than Specimen Cl. The specimensachieved an ultimate moment capacity of 45 kN.m. This corresponded to a load of 61 kN inSpecimen C2, which had a lever arm of 720 mm (similar to all previous specimens). However, thismoment corresponded to a load of 45 kN in Specimen C3, which had a lever arm of 980 mm. Theultimate rotational angle changes achieved in both specimens were 6.0° and 7.0°, respectively.
The mode of failure in these specimens was somewhat different. During the loading process,splitting along the side grain occurred at the furthest column of rivets from the bottom corner of
14
the joint (see Figure 4.17). At the ultimate load, Specimens C2 and C3 witnessed local yielding atthe apex of the joint in addition to further bending throughout the bracket. Crushing at the bottomcorner of the joint was reduced due to the attachment of the bottom bracket. However, at theultimate load, Specimen C2 (with a moment arm of 0.72 m) witnessed a sudden brittle fracturewhere the grain split wide open at the bracket bolts used to load the specimen as shown in Figure4.18. It was believed that the ultimate moment resistance of the joint was achieved from the yieldplateau on the specimen's moment-rotation curve (Figure 4.5). However, in order to verify suchconclusion, a second test (Specimen C3) with a larger moment arm of 0.98 m was constructedand tested. Precaution was taken to prevent a similar type of sudden brittle failure in the form ofrivet plates nailed at the bottom of the member (where the previous member failed). The ultimatemoment resistance of Specimen C3 reached the same level as Specimen C2. Specimen C3,however, exhibited continuous splitting along the side grain, yielding at the apex, and crushing atthe bottom corner until the ultimate load was reached. The magnitude of the stresses in the sideplates was less than that in Specimen Cl because of the existence of the top bracket.
The longitudinal strain gauges (Ga#1 to Ga#12 and Ga#la to Ga#7b) mounted on the side plateand top bracket respectively, as in Figures 3.21, 3.22, 3.24, and 3.25, provided strain readingsthroughout the loading of the specimens. Strain readings for both specimens were very similar.Therefore, the average strain readings of the two specimens were used in Figures 4.19 and 4.20.
Figure 4.19 shows the strain readings for the top portion of the side plate. Strain readings fromGa#2, Ga#3, and Ga#6 witnessed negligible linear increases up to a maximum of 300 tE intension, then decreased as the ultimate load approached. Ga#4 started in tension up to a strainreading of 50 pE at a moment of 25 kN.m then decreased in tension and increased nonlinearly incompression up to a strain of -500 pe at the ultimate load. Readings from Ga#l, Ga#5, and Ga#7increased linearly in compression at a moment of 35 kN.m then increased nonlinearly up to-1000 1.1E at the ultimate load. Ga#8, however, witnessed a continuous strain increase in tensionup to a strain reading of 1500 pE at the ultimate load.
In the bottom portion of the side plate, Ga#9 gave strain readings that increased linearly in tensionup to around 400 1.1E at 90% of the ultimate load then decreased to 100 tE at the ultimate load.Strain readings from Ga#10 and Ga#11 increased linearly up to -200 i.tE (compression) and200 p.E (tension), respectively, at the ultimate load. Finally, Ga#12 gave negligible strain readingsthroughout the test. Strain readings for the bottom portion of the side plate are shown in Figure4.20.
For the top bracket, every strain gauge gave readings very similar to the readings of theneighbouring gauge on the same line of the top bracket (i.e. Ga#4a and Ga#4b gave similarresults). Therefore, averages of the two are presented in Figure 4.21. From Figure 4.21, there wasnegligible strain at both Ga#4 and Ga#7. Strain readings from Ga#3 and Ga#6 increased linearlyin tension up to 1500 1.1E and 2500 p.E , respectively. There was no plate bending between theglulam rivets; hence, such strain values for the top bracket could be used as the average cross-sectional strain from which the force through the plate could be calculated. However, there wasconsiderable bending at the locations of Ga#1, Ga#2, and Ga#5. Nevertheless, strain readingsfrom Ga#2 (on the outside surface of the bracket) increased linearly in tension until 90% of the
15
ultimate load then nonlinearly up to a strain of 1500 piE . Ga#1 (on the outside surface of thebracket) gave a negligible strain gauge reading until the applied moment was 37 kN.m then itincreased in tension up to 600 VtE at the ultimate load. The strain reading from Ga#5 (on theoutside surface of the bracket) increased linearly in tension up to 2000 VIE at 90% of the ultimateload, then nonlinearly up to 4500 ttE at the ultimate load.
4.3.2.4 Specimen C4
This specimen performed with less strength and stiffness but with more ductility than the otherspecimens in series C. Specimen C4 achieved an ultimate load capacity of 47 kN corresponding toa moment of 34 kN.m. The ultimate rotational angle change that the specimen witnessed was9.50.
The mode of failure for this specimen was somewhat different from the other specimens. Therewas little splitting along the side grain at the furthest column of rivets from the bottom corner ofthe joint. The bearing plate between the two connected members did not significantly reduce thecrushing at the bottom corner of the butt joint, in addition to the fact that the plate bent quitesignificantly as shown in Figure 4.22. Another mode of failure feature is shown in Figure 4.23where the rivets of the top bracket in the top member withdrew completely in addition to thewood split type of failure in the top grain. However, similar to Specimens C2 and C3, localyielding at the apex in the top bracket was noticed in addition to severe bending throughout therest of the bracket as shown in Figure 4.22.
The strain gauges mounted on the side plate are shown in Figure 3.23. The strain gauge readingsfor the side plate and top bracket are shown in Figures 4.24 to 4.26. On the upper side (Figure4.24), only Ga#6 gave a significant strain gauge reading, which increased linearly in tension up to700 .1.E at the ultimate load. Ga#1 to Ga#5 gave negligible strain readings ranging from -100in compression (Ga#5) to 100 in tension at Ga#4. On the lower side (Figure 4.25), Ga#7provided a strain reading of 50 lie at 90% of the ultimate load, then decreased and changed to-150 1JE at the ultimate load. Ga#8 and Ga#10 output readings that increased up to 100 lie intension at the ultimate load. The reading from Ga#9 increased linearly up to 200 VLE in tension atthe ultimate load.
Figure 4.26 shows the strain readings of the top bracket. Only Ga#l, Ga#2 and Ga#5 weremounted on both sides of the top bracket dissimilar to that of Specimens C2 and C3 (see Figure3.21). Readings from Ga#2 increased linearly on both sides up to 1500 ;le in tension on theoutside and -500 11E in compression on the inside at the ultimate load. Ga#1 output low readingsuntil a moment of 28 kN.m when the inside gauge reading increased to -500 lie in compressionand the outside gauge reading increased up to 1000 VIE in tension at the ultimate load. The largestreadings were provided by Ga#5, where the inside gauge reading increased linearly up to-2500 in compression at the ultimate load, and similarly the outside gauge reading increasedlinearly up to 2500 ttE in tension at the ultimate load.
16

4.3.3 Location of the Instantaneous Center (I.C.)
To locate the I.C., Specimen B1 was tested. Similar to Specimen A4, it failed with a low strengthand stiffness. The ultimate load capacity was 18 kN corresponding to a moment of 14.3 kN.m.The ultimate rotational angle change witnessed was 3.7°. The specimen failed after large cracksoccurred along the side grain and in the end grain as shown in Figure 4.27, in addition to plugshear failure in the wood by the shear plates.
Behaviour of the specimen and the stress distribution in the connecting plate was to be determinedfrom the strain gauges mounted as shown in Figure 3.19. The strain readings of Ga#1 and Ga#2are shown in Figure 4.28. Four sets of rosette gauge readings are shown in Figures 4.29 to 4.32.The strain readings from Ga#1 increased linearly up to 180 in tension at the ultimate load.Readings from Ga#2 were in compression at a load of 8 kN in cycle 1, then a slip occurred(friction between shear plate and steel cover plate diminished). Hence, strain readings increased to50 [1E in tension, then in applying the load cycle 3, the strain changed to compression again up to-100 at the ultimate load.
For the rosette gauge (Figure 4.29), that contained Ga#3, Ga#4, and Ga#5, strain readings weremainly in tension. Ga#4 and Ga#5 had readings that increased linearly until the load equaled13 kN then increased nonlinearly up to 250 i_t€ at the ultimate load. Ga#3 witnessed a changewhen the load equaled 7 kN; nevertheless, it provided a negligible strain reading up to 40
From Figure 4.30, the readings from Ga#6 increased in compression up to -100 at the ultimateload. The readings were in the tension zone for a brief period in load cycle 3 after the loadequaled 7 kN. A change in the strain path occurred when the load equaled 13 kN. The strainreadings from Ga#7 and Ga#8 increased linearly in tension, then diverted and increasednonlinearly up to a strain of 200 fiE at the ultimate load.
The readings from Ga#9 to Ga#11 are shown in Figure 4.31. The readings from Ga#9 increased inthe compression zone up to -140 p.E at the ultimate load. A path diversion was noticed at a loadof 10 kN. The readings from Ga#10 and Ga#11 were negligible until a load of 13 kN whenreadings from Ga#11 increased in tension up to 60 at the ultimate load.
In Figure 4.32, the readings from Ga#12 were negligible and increased in compression only after aload of 13 kN, up to -30 ..LE at the ultimate load. The strain readings from Ga#13 were negligiblealso and alternated between tension and compression readings during the first three load cycles. Inload cycle 4, it increased after a load of 13 kN up to -60 fiE at the ultimate load. Finally, thestrain readings from Ga#14 increased in compression up to -40 at a load of 7 kN, thendecreased to zero and increased in tension after a load of 14 kN, up to 20 lie at the ultimate load.
17
5.0 DISCUSSION OF THE TEST RESULTS
5.1 LOCATION OF THE INSTANTANEOUS CENTER (I.C.)
The need to accurately locate the I.C. arises when calculating the moment lever arm about whichthe moment is applied. Specimen B1 was tested to confirm that the I.C. of butt type joints is at thebottom corner of the joint. A simple rectangular bolted pattern butt joint was used for simplicity.The load applied is transferred from the bolts and shear plates in the one member to the steelcover plates then to the other member through the bolts again. Rosette gauges were mounted onthe steel cover plate beneath every bolt to determine the direction of the principal strains in thesteel plates; hence, the direction of the principal force on every bolt could be determined. Theprincipal force lever arms from the bolts are extended to coincide at the I.C. of the joint as shownin Figure 5.1.
A rosette strain gauge consists of three longitudinal strain gauges positioned with 45° betweeneach as in Figure 5.2. The strain readings from the gauges mounted on the steel cover plate asshown in Figure 3.20, are presented in Chapter 4.
Referring to Figure 5.2, the shear strain yxy is calculated as in Eqn. 5.1
7,.2E.-(Ex+Ey) (Eqn. 5.1)
where Ex and Ey are longitudinal strains.
The principal strains are then calculated as in Eqn. 5.2.
ex+Ey-I.{ (E.+0 2. 2 0 5
Ex = 2 +7" 1(Eqn. 5.2)
Most importantly, the principal strain directions are determined as op and op + 90° from the Exaxis as in Eqn. 5.3.
2 yx ytan 20p = (Eqn. 5.3)
( Ex — Ey)
During the initial loading, the force lever arms coincided at a point on the interboundary linebetween the two connecting members 85 mm from the bottom corner of the joint (i.e. point a inFigure 5.1). This point shifted outwards quickly as the load progressed until it reached the bottomcorner of the joint (i.e. point b in Figure 5.1) at a load of 7 kN.
18
PrQ,N r =Pr sin g + (;), cos2
The load was initially carried by the friction between the shear plates and the steel cover plates.After small loads, the friction was overcome and the load path transferred to the bolt bearingagainst the steel cover plates. Also, as soon as cracks developed, the load redistributed itselfamong the bolts. These phenomena are apparent in the individual strain graphs shown inChapter 4.
5.2 DESIGN AND EVALUATION
5.2.1 Design Model and Calculation of Design Values
A design model for the calculation of the moment resistance values was chosen based on elasticanalysis and principle of equilibrium. The design values did not consider the redistribution offorces among the rivets; only elastic analysis was performed. The material strengths specified bythe CAN/CSA-086.1-M89 (Canadian Standard Association 1989) and obtained from the materialtests listed in Table 4.2 were used in calculating the design and predicted moment resistance,respectively. The design (excluding the safety factor) and predicted moment resistance values,compared with the ultimate moment resistance values are presented in Table 5.1. See Appendix Bfor sample calculations and comments.
The design values were calculated as follows:
An analysis was conducted based on the pattern of the rivets or bolts and the assumed I.C.(bottom corner for butt joint and pattern centroid for lap joint). The resultant forcecomponents (x and y) were, then, found based on Eqn. 2.1, as shown in Figure 2.3.
The resistance of the 65 mm rivets and of the embedded 67 mm (2-5/8") shear plates with 19mm (3/4") bolts were calculated in the perpendicular and parallel directions to the grain fromthe resistance values published in the CAN/CSA-086.1-M89 (Canadian Standard Association1989) or obtained from the material tests. The Hankinson Formula (Eqn. 5.4) was used tocalculate Nr which is the resistance of the fastener loaded at an acute angle to the grain.
(Eqn. 5.4)where Pr is the fastener resistance parallel to the grain.
Qr is the fastener resistance perpendicular to thegrain.
3) The load and resistance for each individual fastener parallel and perpendicular to the grain andat angle (1) to the grain was determined based on points 1 and 2 using a spreadsheet as shownin Appendix B. The moment resistance of the joint was, hence, determined as the load-resistance ratio approached 1.0 for the most stressed fastener. The effect of the shear and axialloads on the mechanical fasteners and the joint was ignored because it was significantly lessthan the effect of the moment.
19
5.2.2 Evaluation of Specimen Performance
The results of the experiments show that the specimens failed at loads greater than the designvalues and the predicted values (except Specimen B 1). The comparison of the ultimate momentreached in each specimen with the design values (M u/Md) and the predicted values (M u/Mp) islisted in Table 5.1. Both the M u/Md and the Mu/Mp ratios ranged between 1.0 and 2.0 for allspecimens with the exception of Specimen B1 (M u/Mp = 0.88).
5.2.2.1 Phase 1
5.2.2.1.1 The Riveted Connections
For Specimens Al to A3, no material tests have been conducted for rivet patterns greater than8x4. However, since the various rivet patterns in the material tests gave resistance values within5% of the specified values in CAN/CSA-086.1-M89 (Canadian Standard Association 1989), itwas assumed that the strength of the 10x10, 10x7, and 7x10 rivet patterns would also be similarto the specified values. Hence, the predicted moment resistance values were equated to those ofthe design values.
The riveted connections failed at loads higher than the design and predicted values. Specimen A2(10x10 rivet pattern) failed at a moment of 32.4 kN.m higher than the expected 26.6 kN.m. Theexpected failure moments for Specimens Al and A3 were 14.4 kN.m and 21.6 kN.m,respectively, whereas their ultimate failure moments were 22.3 kN.m and 30.9 kN.m, respectively.The main cause for this discrepancy is that the predicted values were based on the specifiedstrengths published in the CAN/CSA-086.1-M89 (Canadian Standard Association 1989) sincethere is no tested material strength data for rivet patterns greater than 8x4. The use of thespecified strengths led to conservative design values different from the ultimate load capacities.
The mode of failure in the riveted connections is splitting on the side (along the grain) and in theend grain. This is due to the high stresses that occur at the furthest rivets from the I.C. in therectangular rivet pattern in the top member. The cracks then start to spread through the member.During the testing of Specimen A2, the side cracks on the east side were noticed to be muchshorter than the west side. The air gap between the two connecting members on the east side wasinitially smaller than that on the west side; hence, as the test progressed, the smaller gap closedmuch sooner. This led to earlier and higher compressive forces between the laminates through themember on the east side; hence, resisting the spread of the east side.
5.2.2.1.2 The Bolted Connections
Specimen A6 failed at an ultimate moment of 35.6 kN.m higher than the design and predictedvalues of 19.0 kN.m and 22.3 kN.m, respectively. This is a significant increase, caused partly bythe fact that the existence of the steel side plates was not accounted for in the calculation of thedesign failure loads since their interactive behaviour with the shear plates is not well understood.
20
However, they do increase the resistance of the bolted shear plates. The steel plates added moreresistance than the wood sided plates since Specimen A5 (exact same connection, but withwooden side plates) failed at a moment of 29.7 kN.m, still higher than the design and predictedvalues of 19.0 kN.m and 22.3 kN.m respectively, but less than the moment of Specimen A6 (35.6kN.m).
Specimen A4 failed at a moment of 17.6 kN higher than the design and predicted values of14.4 kN.m and 16.2 kN.m, respectively. The addition of the steel side cover plates caused part ofthe difference similar to Specimen A6. Since the bolt pattern in Specimen A4 was a rectangle,high stresses were induced perpendicular to the grain at the most distant bolt from the I.C. whensubjected to a moment, causing an early failure. The use of a circular bolted pattern in SpecimensA5 and A6 appeared to be quite advantageous. It eliminated the high stress point by uniformlydistributing the applied stresses among all bolts. This increased the ultimate moment resistantcapacity of the joint. The failure in circular patterns occurred as splitting of the grain at the boltclosest to the end grain where the edge distance is least.
The use of shear plates in conjunction with bolts increased the bearing area in the wood, hence,providing a higher resistance value. This indicates that the use of high strength bolts would notincrease the resistance of the joint, since its failure was governed by wood failure.
Part of the discrepancy between the design and actual resistance values for the moment joints isattributed to the use of the published specified strengths in the CAN/CSA-086.1-M89 (CanadianStandard Association 1989) which are usually conservative. The predicted values were higherthan the design values, but still lower than the ultimate moment. This is probably due to theredistribution of stresses among the shear plates in the moment joint.
5.2.2.2 Phase 2
Similar to phase 1, the specimens failed generally at moments higher than the design and predictedvalues. As in Table 5.1, Specimen C1 failed at an applied ultimate moment of 36.0 kN.m higherthan the design and predicted value of 21.6 kN.m. The discrepancy is larger than that of SpecimenA3 (ultimate moment of 30.9 kN.m) due to the existence of the bottom steel bracket which wasnot accounted for in the analysis. The bottom bracket was mounted on the inner side at thebottom corner of the joint with eight relatively small screws (size #8x19 mm). Its shear resistancewas considered to be negligible compared to glulam rivets. However, its existence between thetwo members during the loading process increased the stiffness of the moment joint and reducedcrushing of the wood. The side grain and end grain cracks at the furthest column of rivets fromthe I.C. were the main failure criteria.
Specimens C2 and C3 had ultimate moment resistance of 45 kN.m higher than the design andpredicted values of 40.0 kN.m and 41.0 kN.m, repectively. The resistance of the top rivet bracketwas included in the analysis, but not the bottom bracket. Cracks in the side grain did develop;however, failure was attributed to the local yielding at the apex in addition to the overall bendingof the bracket. The bracket kept the end grain from splitting and cracks in the top member
21
confined as the specimen was loaded; hence, increasing its strength. The top bracket strain gaugesshowed that the top bracket carried a significant portion of the load, up to 60% of the totalapplied moment.
Specimen C4 failed at a moment of 34 kN.m higher than the design and predicted values of26.6 kN.m and 27.2 kN.m, repectively. The existence of the bearing plate between the twomembers was not accounted for. However, its contribution to the performance of the specimen islimited to a slight increase in the stiffness of the joint since it commenced to bend at an early stageduring the loading. Its effectiveness in reducing the crushing of the wood between the twomembers was small. It bent as shown in Figure 4.22 and still allowed crushing, but at a later stage.
In this specimen, the spacing between the rivets on the side plate was increased to increase thechance of rivet yield type of failure rather than wood splitting; hence, increasing the ductility ofthe joint. At failure, there was no significant side cracks or cracks in the end grain. The straingauges mounted on the top bracket indicated that it carried up to 85% of the total appliedmoment. Similar to Specimens C2 and C3, the failure was due to local yielding at the apex and theoverall bending of the top bracket.
The magnitude of the stresses in the side plates was less than that in Specimen Cl, again becauseof the existence of the top bracket. Specimen C4 had a top rivet bracket greater in thickness thanthat of Specimens C2 and C3 since it was predicted to carry a larger portion of the applied load.This encouraged the wood shear mode of failure in the top grain and the rivet withdrawal mode offailure at the same location.
Specimen B1 failed at a moment of 14.3 kN.m higher than both the design value of 10.6 kN andthe predicted value of 12.2 kN.m. For the material tests, all shear plates were tested in membersof 130 mm thickness only. However, for Specimen B1 (with a member thickness of 80 mm), aconnector end distance factor of 0.75 (as in CSA/CAN-086.1-M89 (Canadian StandardAssociation 1989)) was included to account for the smaller member thickness.
5.3 EFFECT OF RIVET DISTRIBUTION PATTERN
The strain gauges mounted on the side plates indicate the rivets at the furthest column from theI.C., especially the ones closest to the interboundary line between the two members such as Ga#8in Figure 3.21, were the most critical tension stress in the surrounding steel plate. The steel platesurrounding the rivets in the columns closer to the I.C. was mainly in compression (Ga#1 andGa#7 in Figure 3.21).
The interaction between the steel plate and the wood distributes the load in a non-uniform modein tension joints (Cramer 1968). Similarly in these tests, the steel plate interaction with the woodaffected the load distribution among the rivets. Hence, the rivets in the top row in the top membercarried the most significant loads in their respective columns causing them to bend the most.
22
If it was required to reduce the number of rivets on the side grain, then from the spreadsheetanalysis based on Eqn. 5.4, it appears that by removing the close end column of rivets to the I.C.,a stress increase of 10% takes place among the rest of the rivets. However, by removing the farend column, a stress increase of 25% occurs. If the two rows of rivets closest to the I.C. wereremoved, an increase of 15% would take place as opposed to 43% if the last two rows wereremoved.
So removing the line of rivets with the lowest force component parallel to the grain (the row closeto the I.C.) causes the lowest increase among all rivets and maintains more uniform stressdistribution than if the furthest row (from the I.C.) was removed. Hence, it is preferable not toremove the row of rivets with the highest force component parallel to the grain (furthest from theI.C.).
5.4 GENERAL COMPARISON AND IMPLICATION OF THE TEST RESULTS
The moment rotation curves presented in Figures 4.4 and 4.5 demonstrate the difference inperformance among the different tested specimens. However, any future recommendations basedon this data will be based on the initial portions of the curve (mainly linear), that is the portionswith relatively low rotation changes. Hence, the portion of the curves up to a rotation of 3° ispresented in Figure 5.3. Furthermore, in order to evaluate the performance of the connections in aportal frame application, it is necessary to compare the performance of the moment connectionswith the strength and stiffness of the beam used to construct the tested specimens. This led to theemployment of the beam-line concept as apparent in Figure 5.3.
The y-axis intersection of the beam-line represents a fixed-ended moment for a transverselyloaded beam corresponding to a rotation equal to zero (in this case, it is the maximum bendingmoment that this 130 mm x 380 mm glulam beam can withstand). The x-axis intersection of theline represents the rotation of the end of a simply supported beam under a concentrated momentat the other end, as shown schematically in Figure 5.3 corresponding to span lengths of L= 4.5 mand L= 9 m, respectively.
The intersection of the moment vs. rotation curves with the beam-line indicates the amount ofmoment the connection can absorb. The rigidity ratio of the connection is the ratio between theamount of moment the connection can absorb and the fixed-ended moment. The notation of"Rotation Ratio" is used here to indicate the ratio between the amount of rotation the connectionexhibits (the value of the rotation corresponding to the moment that the connection can absorb)and the rotation of the end of the simply supported beam. The rotation ratio is inverselyproportional with the stiffness of the connection. Hence, as the rotation ratio approaches unity,the connection approaches a simply supported edge boundary condition. Where as the rigidityratio approaches unity, the connection approaches a fixed-ended boundary condition. The stiffnessof such a connection is the slope of the moment-rotation curve. Table 5.2 is based on Figure 5.3and shows the rigidity ratios and rotation ratios of the different moment resistant joints for spanlengths of L= 4.5 m and L=9 m.
23
Table 5.2 shows the superiority of the riveted connections. Rigidity ratios as high as 39% androtation ratios as low as 63% were achieved in Specimens C2 and C3. The rivet plate connectionshave a higher number of fasteners among which they can more uniformly distribute the load;hence, less highly stressed fasteners and higher joint strengths are obtained. This was apparent inSpecimen A4 where there was only a total of eight fasteners; hence, the stress distribution perfastener was high leading to severe cracks at the ultimate load. The rivet joints also had a higherstiffness since the tolerance in the bolt holes allowed more rotation in the bolted joints. SpecimensA2 and A3 performed very similar in terms of strength and stiffness even though Specimen A3 is120 rivets less in total. In addition, since in Specimen A3 there were less columns of rivetsperpendicular to the grain (i.e. holding the grain together), more side grain cracks developed inlieu of one big sudden crack; hence, it performed with much more ductility than Specimen A2.This underlines the importance of the rivet spacing, rivet distribution, and their effect on theperformance of the joint. The distance from the I.C. to the furthest rivet in Specimen Al is longerthan that in Specimen A3. This led to a higher rivet stress perpendicular to the grain; hence,earlier failure in Specimen Al.
In series C, the existence of the bottom bracket increased the stiffness and strength slightly, butboth were increased significantly with the addition of the top bracket. This bracket kept the endgrain splits and cracks in the top member confined as the specimen was loaded; hence, increasingits strength. The ultimate load for Specimens C2 and C3 was achieved when the top steel bracketcommenced yielding at the apex, after which, the specimen underwent large rotations. These twospecimens presented the most strength and stiffness among all tested specimens. The number ofsplits along the side grain and end grain was significantly reduced by increasing the space betweenthe rivets and reducing the number of rivets on the side plate as done in Specimen C4. However,the strength and stiffness achieved in this specimen was less than that of Specimen C 1, but theductility shown by this specimen was the highest among all (ultimate rotation 0 u= 9.5°) (see Table5.2 and Figure 5.3).
5.5 ADVANTAGE OF SEMI-RIGID JOINT APPLICATION
In series C of the tests, Specimens C2 and C3 achieved a moment resistance equal to 39% of thefixed end moment of the beam used in Table 5.2. Hence, when this joint is utilized in a portalframe, it cannot be considered as a fully rigid joint, and to consider it as a fully pin joint would betoo conservative and a waste of its potential as a resistant joint.
It is, therefore, beneficial to utilize such a joint and account for its use in a frame as a partiallyrestrained joint or semi-rigid joint. These joints can be applied to improve strength design orstiffness for serviceability needs. The benefit is significant for reducing beam mid-span deflectionsleading to a reduction in materials and cost.
The use of partially restrained joints reduces the mid-span moments in pinned end connections andredistributes them to the ends as in Figure 5.4. If such restraint was used in design, one shouldcheck the satisfaction of the serviceability requirements.
24

One advantage is that for inertia-oriented loads such as earthquakes, the energy absorption ofsemi-rigid connections could keep excessive lateral drift of tall portal frames within reason.Nevertheless, on a philosophical level, it is apparent that neither pinned nor rigid connections areactually obtained in real structures. The need exists to approach reality. Even approximateestimates of frame flexibility are closer to truth than the assumed ideals of nil or full restraint inthe connections (Chen et al. 1992).
25
6.0 SUMMARY AND CONCLUSIONS
6.1 GENERAL
A preliminary study and experimental program has been conducted to develop a moment resistantjoint in glued-laminated timber manufactured from Alberta spruce and pine. The first phase of thestudy investigated the performance of moment joints made with various types of fasteners.Further investigation and improvements to glulam rivet connections were conducted in the secondphase of the program.
The test results in the first phase exhibit the superior performance (both strength and stiffness) ofthe glulam rivet side plate moment joints compared with the bolted type moment connections. Thetolerance of the bolt holes allow slight bolt free movement; hence, reducing the stiffness of thejoint. Specimens A2 and A3 (10x10 and 10x7) were very similar in their performance even thoughthe number of rivets were reduced by 30% in Specimen A3.
In the second phase, the rosette strain gauges on Specimen B 1 located the I.C. in the rectangularpatterns of butt type of joints to be at the bottom corner of the joint (point (b) in Figure 5.1).
Improvements to glulam rivet joints such as the addition of a bottom steel bracket in Specimen Clincreased the strength and stiffness of the joint. However, a more significant improvement in theperformance was achieved with a top cover rivet steel bracket (in addition to the bottom bracket)as in Specimens C2 and C3. The maximum rigidity achieved was 39% (of the bending strength ofthe beam). The contribution of the top steel bracket in Specimen C3 reached values of 60% of thetotal moment resistance. In Specimen C4, exchanging the steel bottom bracket with a bearingplate between the two members did not eliminate the wood crushing between the two members,nor did it increase the stiffness of the joint. Using the bearing plate and reducing the number ofrivets on the side plates by 70% caused the top cover bracket in this specimen to carry a higherportion of the total applied moment (up to a maximum of 85%).
All failures witnessed wood splitting in the end grain and on the sides at the most distant columnof rivets from the I.C. and at the closest bolt to the outer corner edge in the circular boltedpatterns, indicating the high stresses and the weak tensile strength of the timber perpendicular tothe grain. The splitting of the wood was reduced significantly with the reduction of rivets on theside plates, and the increase of the spacing between the rivets in both directions. This enhances therivet yielding mode of failure; however, in Specimens C2, C3, and C4, the top bracket confinedthe whole connection. Hence the mode of failure was in local yielding in the apex and bending ofthe bracket.
The failures also occurred at loads higher than the design values and the predicted values. Thistook place since the conservative strengths of the materials specified in CAN/CSA-086.1-M89(Canadian Standard Association 1989) were used in the design values° calculation, and since theredistribution of forces among the fasteners was not accounted for in the predicted values'calculation (i.e. only an elastic analysis was performed).
26
6.2 RECOMMENDATIONS
In order to predict the design strength of a moment joint, the use of the torsional formula (Eqn.2.1) and the specified strengths in CAN/CSA-086.1-M89 (Canadian Standard Association 1989)is recommended. The predicted design values found throughout this study are reasonable andconservative results; however, more investigation is required to assess the validity of this formulafor other types of moment joints. Further research should include the examination of benefitsobtained in the use of semi-rigid moment resistant connections in glued-laminated portal timberframes.
Further research to improve the performance of the glulam rivet moment connections is required.The maximum rigidity ratio achieved (39% of the bending strength of the beam) is still moderate.Some of this research should be directed towards the utilization of other fasteners and techniquesto increase the strength and stiffness of the joint, such as the use of fibre reinforced plastic sheetsglued to the end grain to strengthen the tensile strength of the timber perpendicular to the grain.
Other ideas to improve the performance of the joints include prestressing tendons with triangularwedges on each end which could be very effective in increasing the stiffness of the joints. Theresult of split ring use in moment joints was not examined in this study, but is recommended aspart of future research for this project.
The glulam rivet pattern layout on the side plates is an important variable worth investigatingsince the quantity, spacing, and location of the rivets dictate the strength and mode of failure ofthe joint. The effect of the end and edge distances should also be re-examined.
In addition to the above, other variables that should be investigated in future research include thesize effect of the members, the effect of the loading rate, and load duration. The study of cyclicloading on the moment joints is also important to achieve a comprehensive understanding of thejoints' behaviour.
27
LITERATURE CITED
ASTM 1988. Structural steel, A36/A36M-88c, American Society for Testing and Materials,Philadelphia, Pa.
ASTM 1990. Standard test methods for mechanical fasteners in wood, ASTM D1761-88.American Society for Testing and Materials, Philadelphia, Pa.
Aune, P.; Patton-Mallory, M. 1986. Lateral load bearing capacity of nailed joints based on theyield theory: experimental verification. Research paper FPL 470, Madison, Wi, US Department ofAgriculture, Forest Service, Forest Products Laboratory.
Batchelar, M.L. June 1982. Nailed plywood gusset joints for timber portal frames. Dept. CivilEngineering, University of Auckland, N.Z.
Buchanan, A. 1990. Report on portal frame knee joints with epoxied steel dowels. ReportCP/4006 - University of Canterbury.
Buchanan, A.; Lai, J., 1994. Glulam rivets in radiata pine. Canadian Journal of Civil Engineering,Vol. 21 No. 2 pp. 340-350.
CSA (Canadian Standard Association). 1989. Engineering design in wood (Limit States Design).CSA Standard CAN/CSA-086.1-M89. Rexdale, Ontario.
CSA (Canadian Standard Association). 1992. Structural quality steel. CSA Standard CAN/CSA-G40.21-M92. Rexdale, Ontario.
Chen, W.F.; Lorenz, R.; Kato, B. 1992. Semi-rigid connection in steel frames. Council on TallBuildings and Urban Habitat.
Cramer, C. 1968. Load distribution in multiple-bolt tension joints. Journal of the StructuralDivision, Proceedings of the American Society of Civil Engineers. Vol. 94 No. ST5, pp.1101-1117.
Crews, K. 1990. Gottstein report. Forest Research Institute. Rotorua, New Zealand.
Foschi, R.O. 1974. Load-slip characteristics of nails. Wood Science. Vol.7, Nol, pp.69-76.
Foschi, R.O.; Longworth, J. 1975. Analysis and design of griplam nailed connections. Journal ofthe Structural Division, American Society of Civil Engineering. 101(ST12), pp. 2537-2555.
Gardner, G.P. 1989. A reinforced glued laminated timber system. PTEC (Vol.2). Auckland.
28
Gehri, E. 1982. Fachwerktrager aus buche and Fichte mit stahlknotenplatten in eingeschlitztenholzern. ETH. Zurich.
Johansen, K.W. 1949. Theory of timber connections, Int. Assoc. for Bridge and Struc. Engrg., 9,249-262.
Karacabeyli, E.; Fraser, H. 1989. Short-term strength of glulam rivet connections made withspruce and Douglas fir glulam, and Douglas fir solid timber. Unpublished report. Forintek CanadaCorp. Vancouver, BC.
Kivell, B.T.; Moss, P.; Carr, A. Dec. 1981. Hysteretic modelling of moment-resisting nailedtimber joints. Bull. of the N. Z. National Soc. for Earthquake Engineering. Vol. 14, No. 4.
Kivell, B.T.; Moss P.; Carr, A. July 1982. Cyclic load behaviour of two timber portal frames withmoment resistant nailed joints. Transactions of the IPENZ. Civil Engineering Section. Vol. 9No.2, pp.54.
Larsen, H.J. 1973. The yield load of bolted and nailed joints. Proceedings. International Union ofForestry Research Organization Meeting-5 Congress.
Lheude, E.P. 1985. Tension loads for shear plates and split rings in timber loaded parallel to thegrain. Journal of the Institute of Wood Science. London. England.
Masse, D.I.; Salinas, J.J.; Turnbull, J.E. 1988. Lateral strength and stiffness of single and multiplebolts in glue laminated timber loaded parallel to the grain, Eng. and Stat. Research Center,Research Branch, Agriculture Canada. Ottawa.
McGowan, W.M. 1966. A nailed plate connector for glued-laminated timbers. Journal ofMaterials. Vol. 1, No. 3, p. 509.
Mitchell, T.M. 1979. Design of a rigid joint incorporating nailed steel side plates. Section 7.6 ofTimber design and detailing manual. Ministry of Works and Development. Wellington.
Perkins, R.H.; Suddarth, S.K.; Dale, A.C. 1964. Rotational resistance of three-membered nailedjoints subjected to bending moment. U.S. Forestry and Conservation.
Riberholt, H. 1986. Glued bolts in glulam. Department of Structural Engineering, TechnicalUniversity of Denmark.
Rodd, P. 1973. The analysis of timber joints made with circular dowel connections, PhD Thesis,University of Sussex.
Rodd; Hilson; Spriggs, 1989. Resin injected mechanically fastened timber joints. Pacific TimberEngineering Conference.
29

Smith, I.; Rodd, P.; Whale, R.J.; Anderson, C. 1987. Characteristic properties of nailed andbolted joints under short term lateral loads. Parts 1-5, Journal of The Institute of Wood Science.
Syme, D. 1987. A study tour of timber engineering in Europe. Gottstein Report.
Walford, G.B. 1988. Analysis of timber portal frame gusset joints. IPENZ.
Wilkinson, T.L. 1993. Bolted connection design values based on European yield model. Journalof Structure Engineering. Vol. 119, No. 7 pp.2169-2186.
30
APPENDIX A
FIGURES AND TABLES

MIZWZMil5r4rArIll Ir, 15 reif‘za 5 ra g pm ry215011/1
1702 § 0 0 1 . I I = I I III IffIA I VA M IA WA /11~//21%1
Figure 2.1 - Glulam Timber Reinforcement System (Gardner, 1989)
Figure 2.2 - Typical Portal Knee developed by Gardner (Gardner, 1989)
33
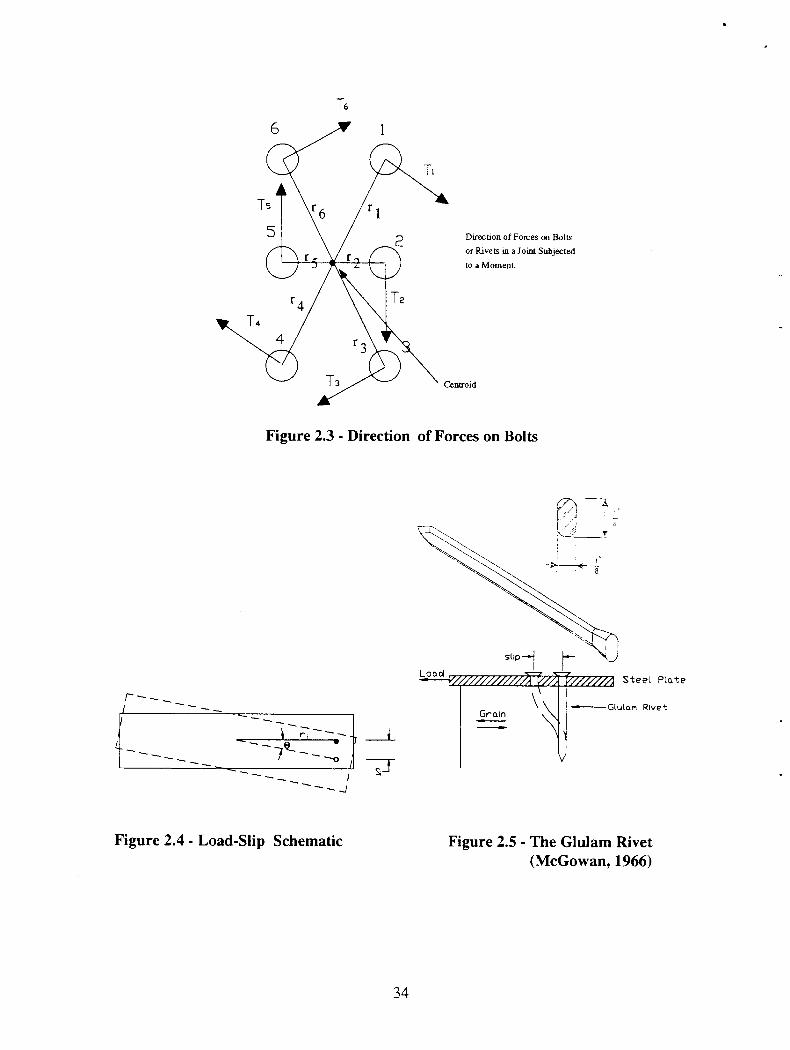
T6
6 1
Direction of Forces on Boltsor Rivets in a Joint Subjectedto a Moment
Centroid
Load
slip) Steel Plate
Glularn Rivet Grain
Figure 2.3 - Direction of Forces on Bolts
Figure 2.4 - Load-Slip Schematic Figure 2.5 - The Glulam Rivet(McGowan, 1966)
34
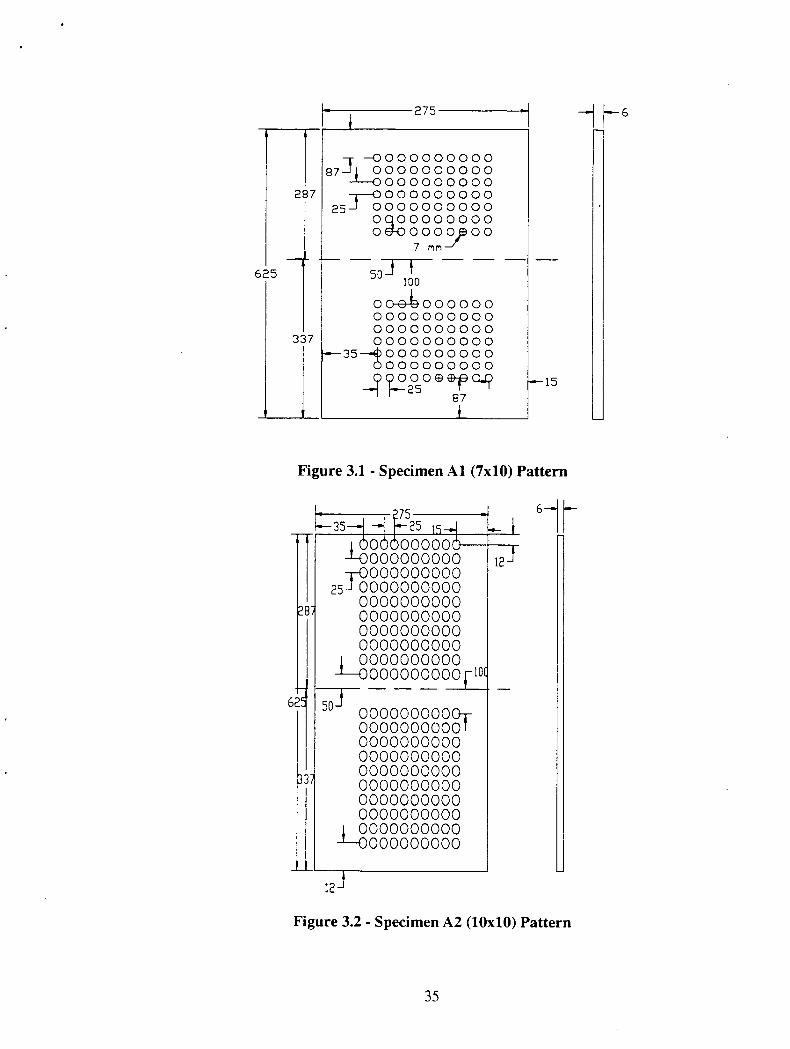
-'1 b6275
-r —o 0 0 0 0 0 0 0 0 07J + 1
'0 0 0 0 0 0 0 0 0 0
0 0 0 0 0 0 0 0 00287 0 0 0 0 0 0 0 0 0
5 -t00 0 0 0 0 0 0 0 0 0oq000000000 40 0 0 0 OilD 00
50 i 100
00-e-60000000 0 0 0 0 0 0 0 0 00 0 0 0 0 0 0 0 0 0337 0 0 0 0 0 0 0 0 0 0
1-*-- 35 -t 0 0 0 0 0 0 0 0 00 0 0 0 0 0 0 0 0
0 TO 205 0 ED ED-19 0.C?-...87i
Figure 3.1 - Specimen Al (7x10) Pattern
6 5
7 rvi
-.- 15
7525 15
1 00 000000
--0000000000 12-11--0000000000
25-1 00000000000000000000000000000000000000000000000000
1 0000000000' 0000000000 [IOC
62
12-1
Figure 3.2 - Specimen A2 (10x10) Pattern
8;
703—0000000000r00000000001000000000000000000000000000000000000000000000000000000000000
1 0000000000' 0000000000
35
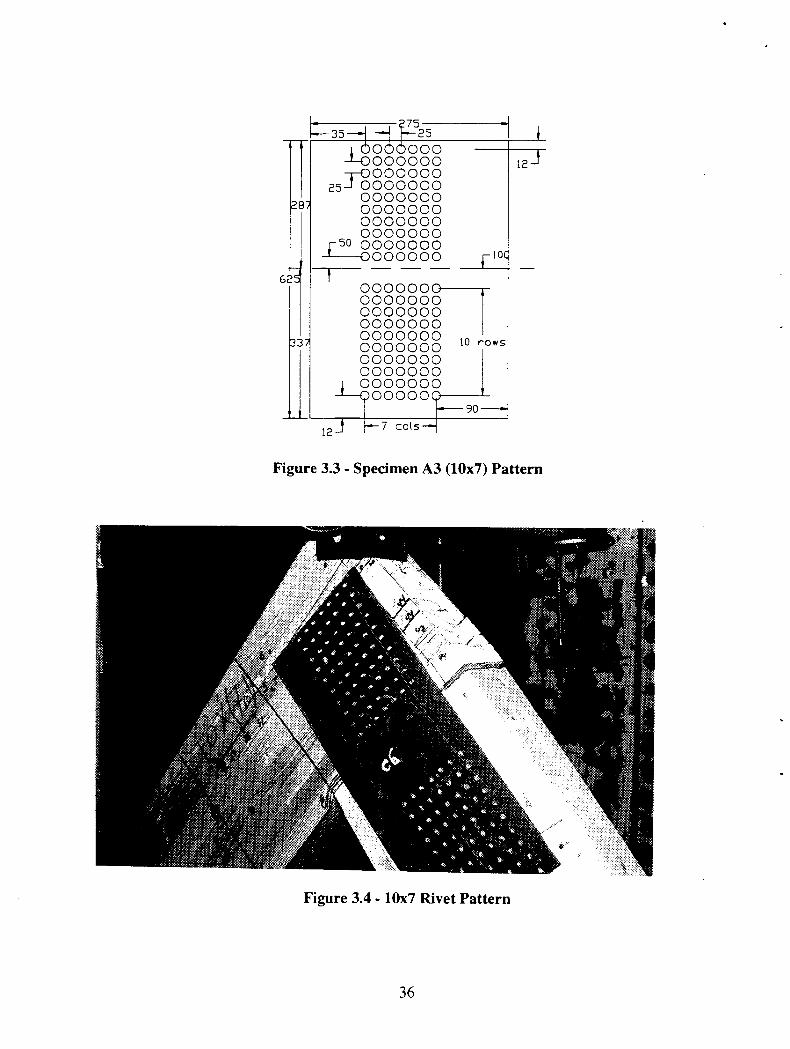
275-mil —25
10000000'-0000000--0000000
25-I 0000000287 0000000
000000000000000000000
50 0000000 [10C000000
62 t000000 0000000000 00000oo oo o o o00 0000000 000000000000o oo 0000
100000000000000
10 rows
12J
90 —.-
12-t cols--
Figure 3.3 - Specimen A3 (10x7) Pattern
Figure 3.4 - 10x7 Rivet Pattern
36
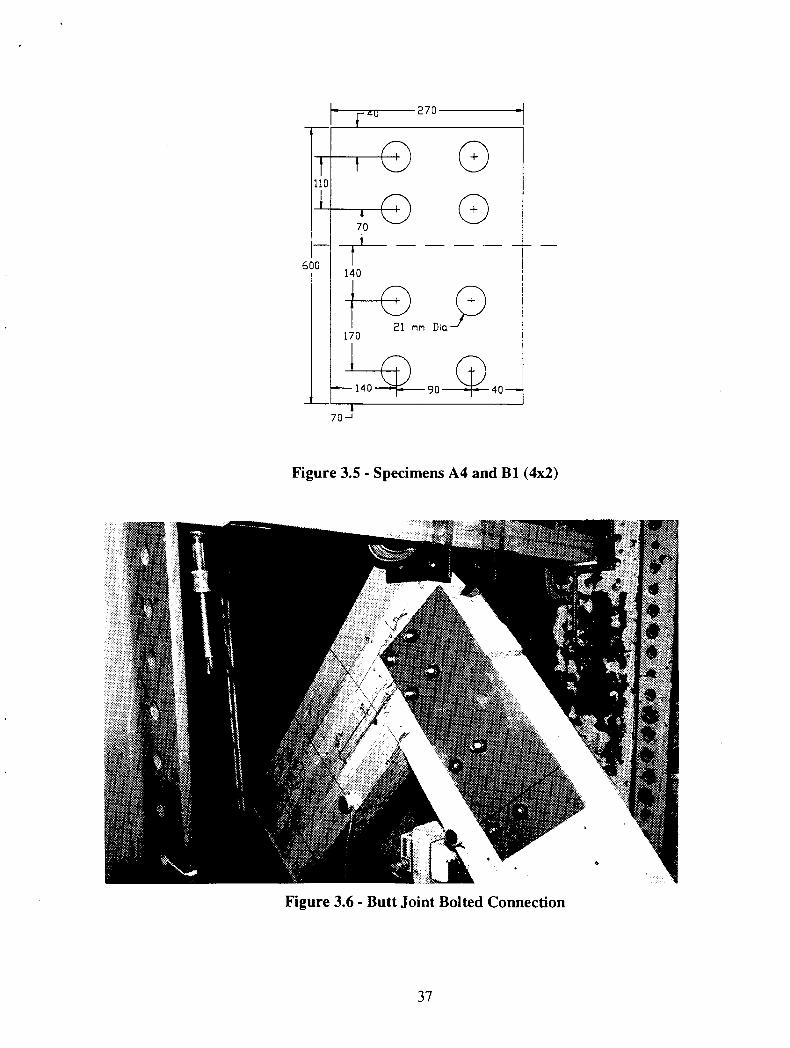
4U
— 140 40—
270
110
f—fell)
140
21 rim Din170
90
6 0
70J
Figure 3.5 - Specimens A4 and B1 (4x2)
Figure 3.6 - Butt Joint Bolted Connection
37
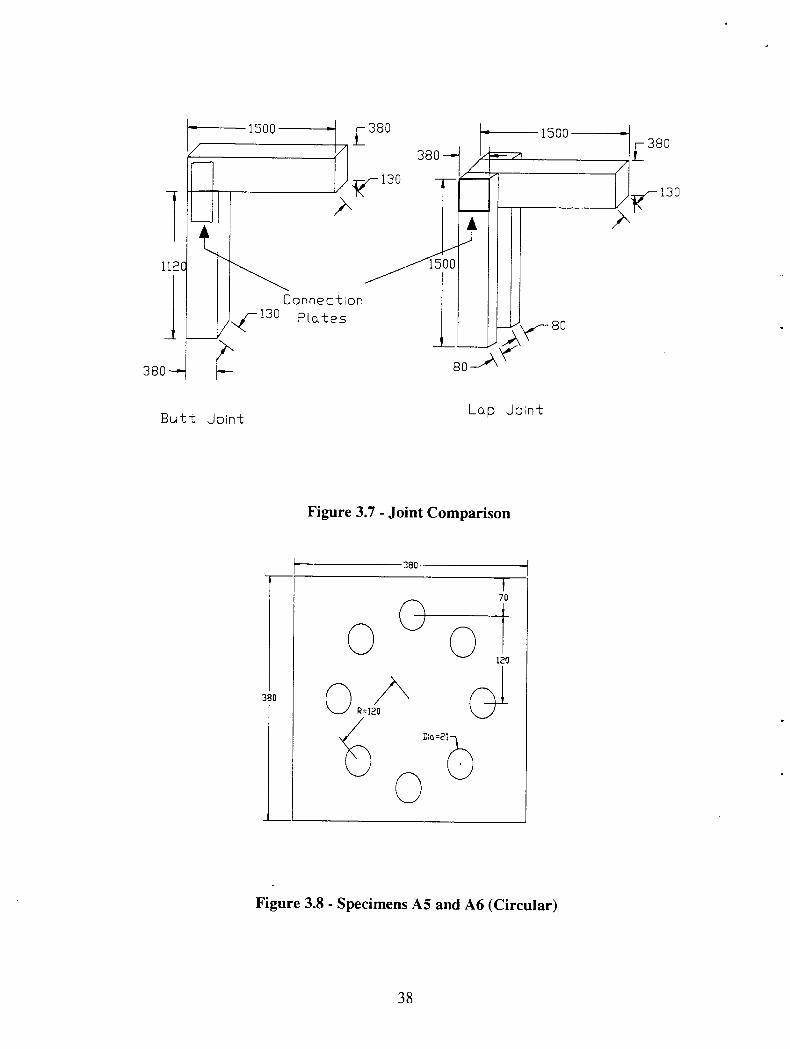
380---
Butt Joint Lap Joint
1500 380 1500
130
11
Connection130 Plates
Figure 3.7 - Joint Comparison
380
'-10_017 0
0120
0 R=120 GI
\.:.)
Dn=21
0
38
Figure 3.8 - Specimens A5 and A6 (Circular)
38
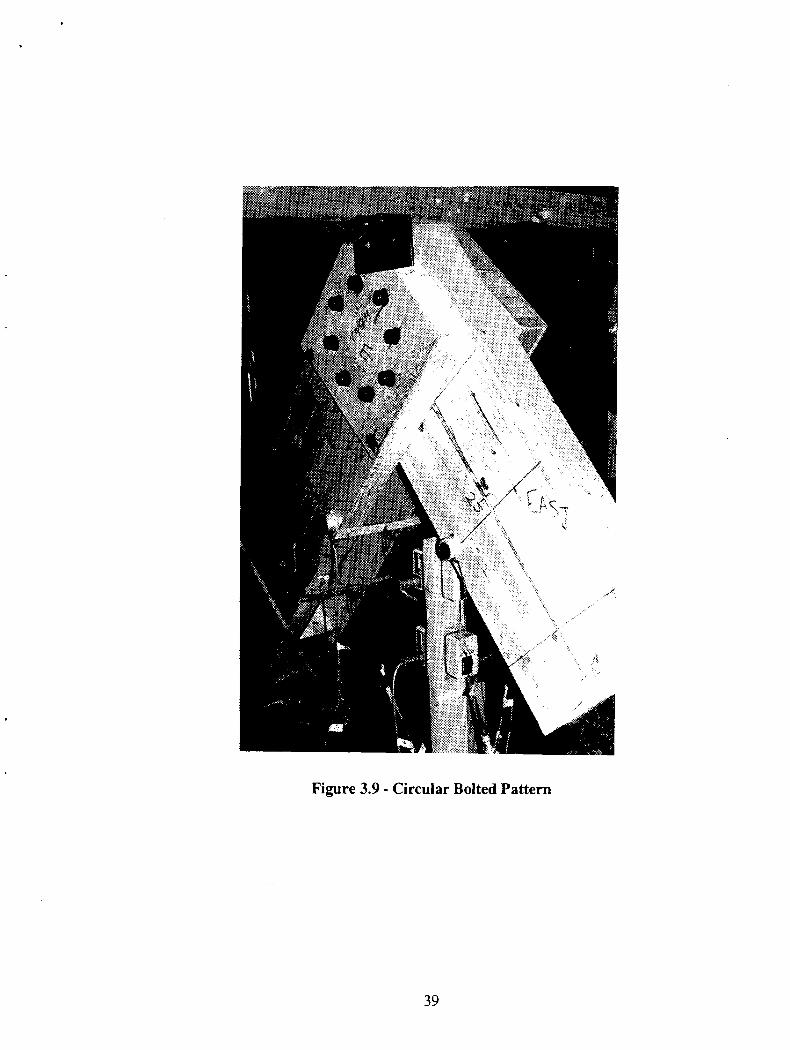
Figure 3.9 - Circular Bolted Pattern
39
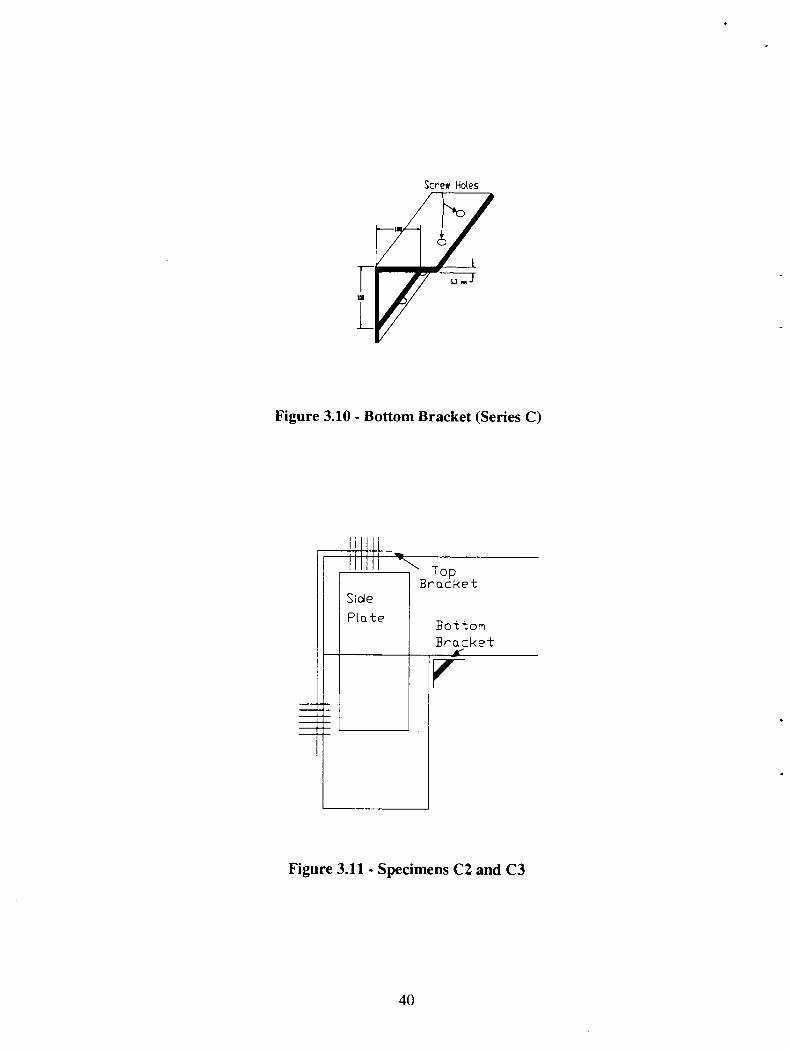
TopBracket
BottomBracket
T.
Screw Holes
Figure 3.10 - Bottom Bracket (Series C)
Figure 3.11 - Specimens C2 and C3
40
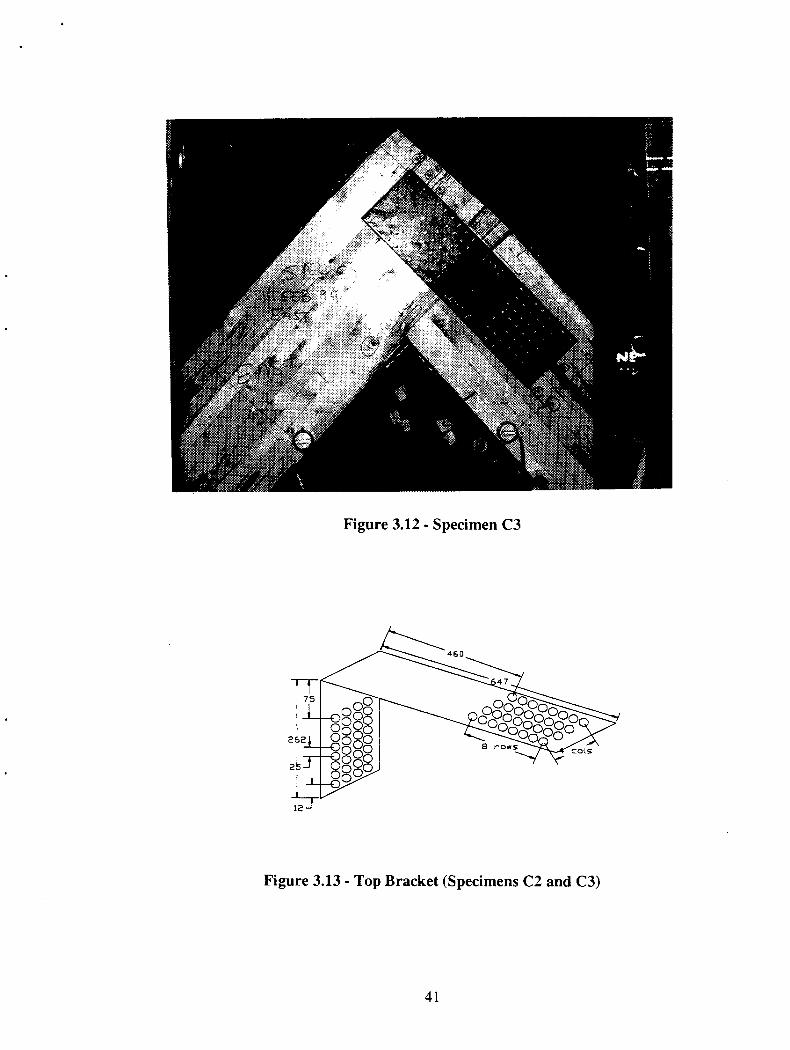
Figure 3.12 - Specimen C3
Figure 3.13 - Top Bracket (Specimens C2 and C3)
41
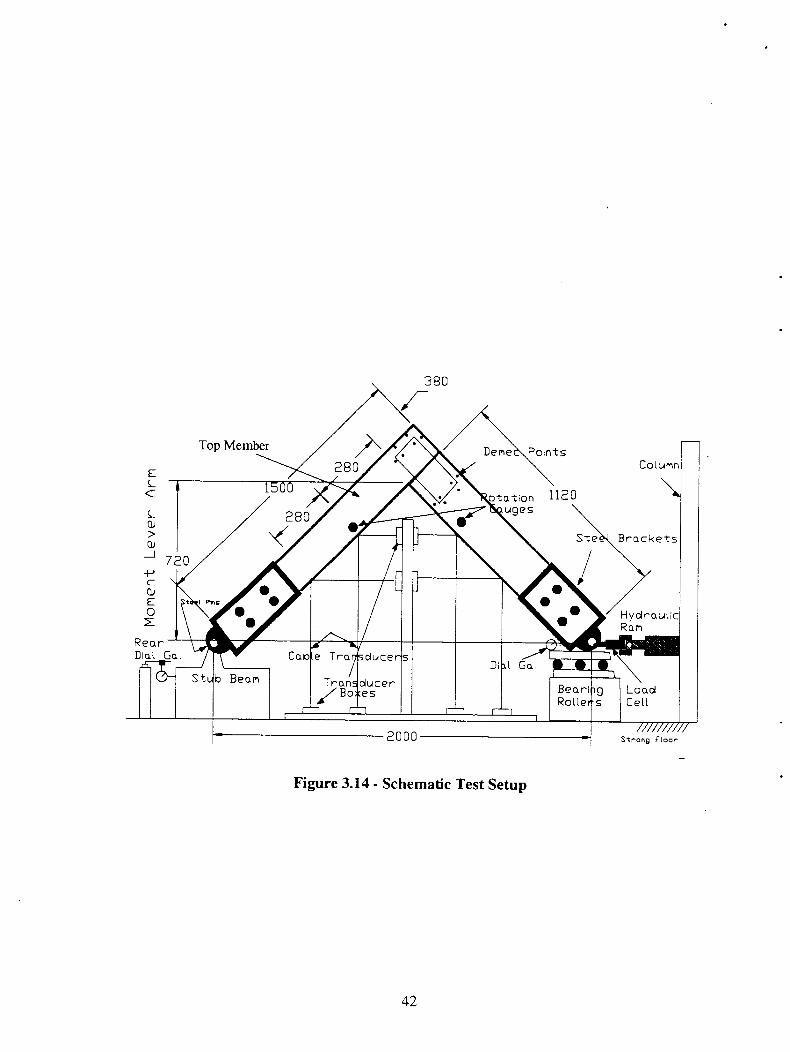
380
Top Member Deme Points
L•CEL0)
720
0)0
RearD al Ga
0
t
"
280
A*.280 ot.ationuges 1120Ste
riP:44111.111116ttyvannGa. Illt
RollersBeareig
CabSt b Beam
Column
Brackets
HydraulicRam14,
LoadCell
20007/////////
Strong Floor
Figure 3.14 - Schematic Test Setup
42
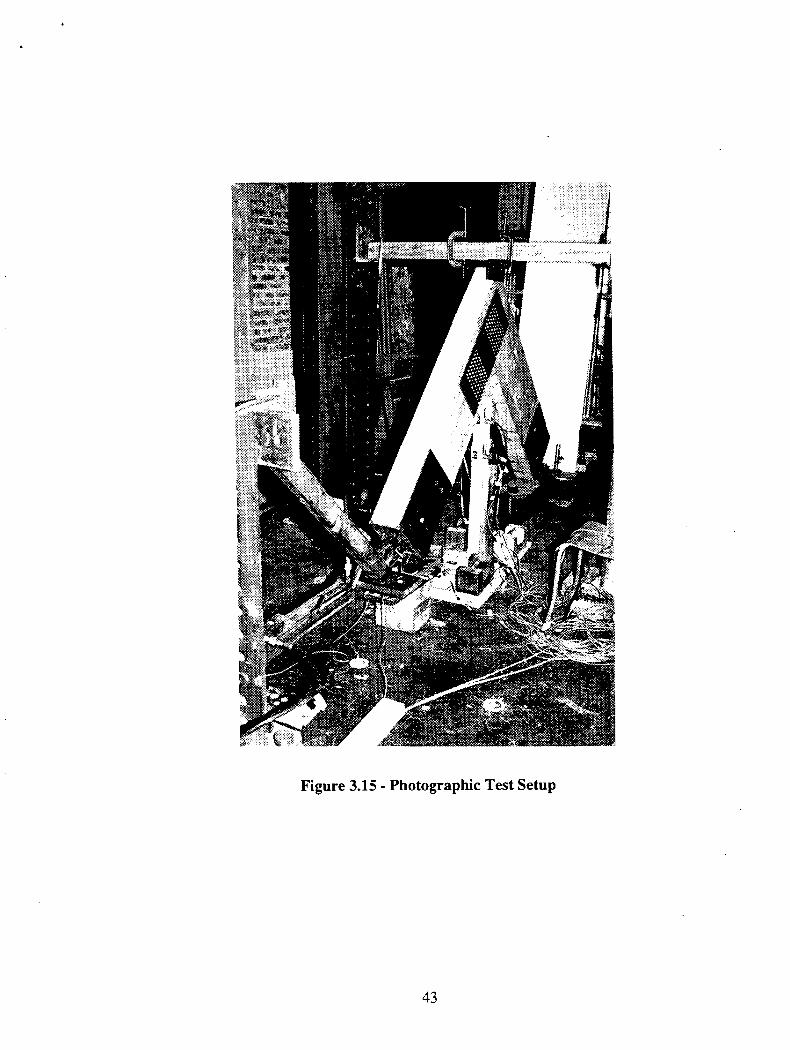
Figure 3.15 - Photographic Test Setup
43
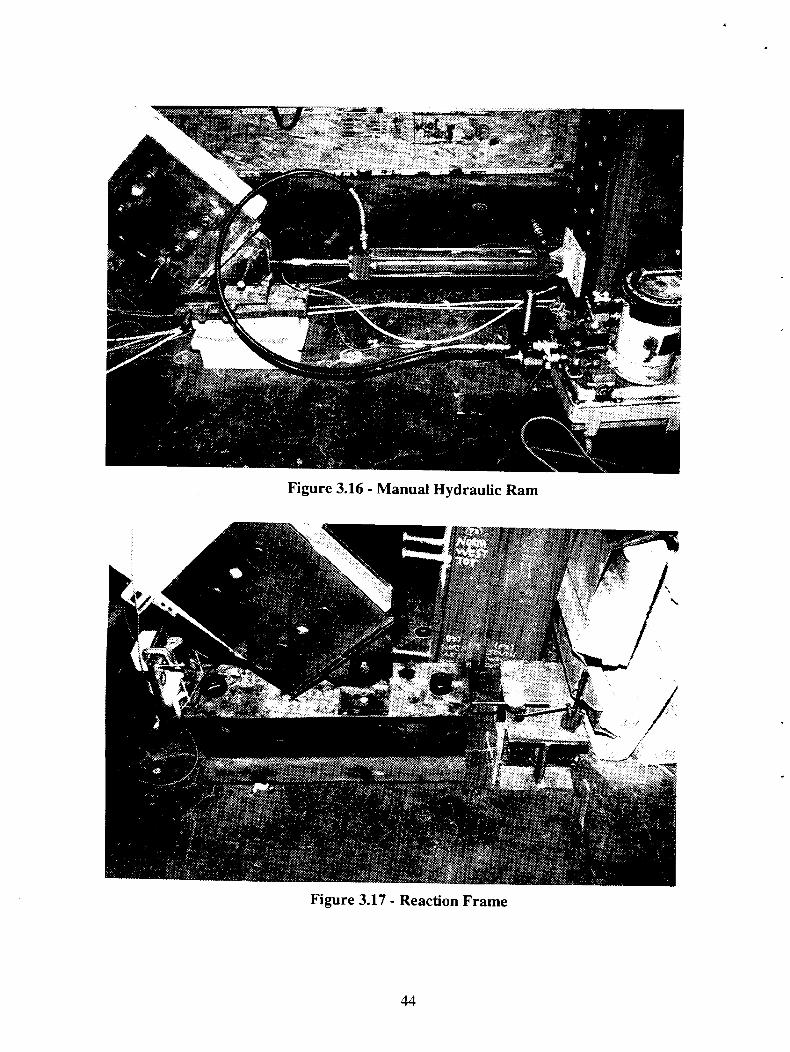
Figure 3.16 - Manual Hydraulic Ram
Figure 3.17 - Reaction Frame
44
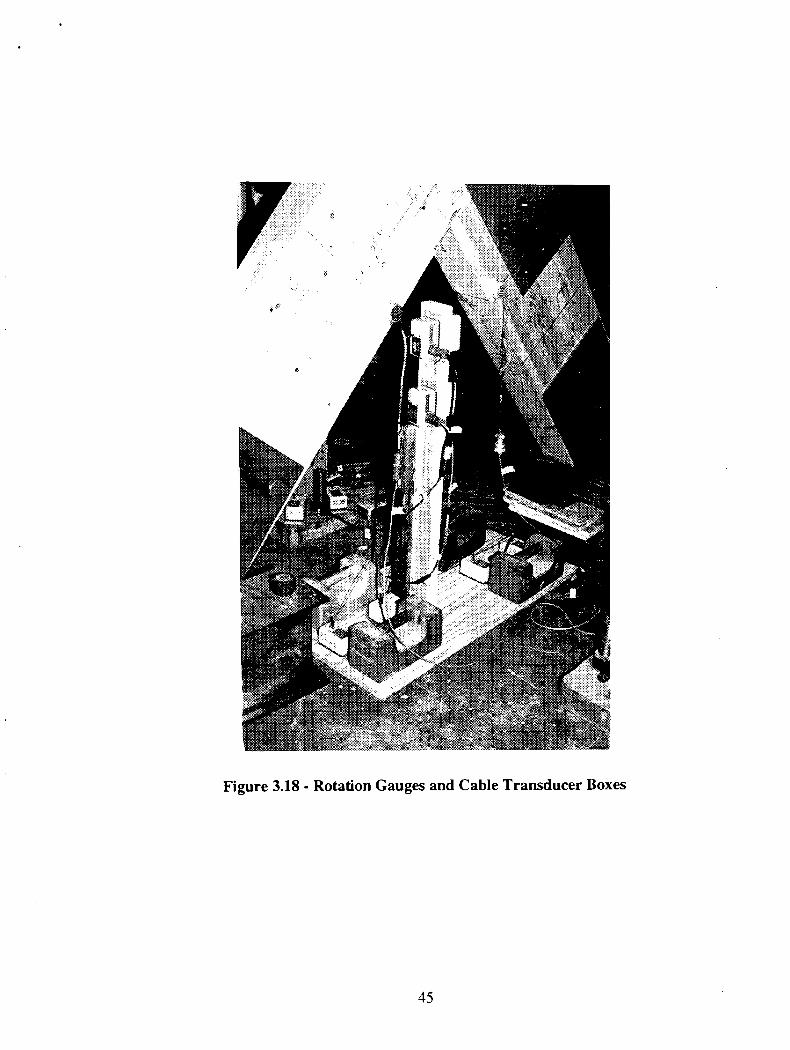
Figure 3.18 - Rotation Gauges and Cable Transducer Boxes
45

I=Rosette" Gauge
1 = LongitudinalGauge
40-- 9f1
t(3,4F 110
el (2) Kt 6,7.3 1)
70J 7140
(9,10,11)170
• K••• i
(12,13,14)
1 (1)
270390
Figure 3.19- Gauge Layout on Specimen B1
Figure 3.20 - Gauge Layout on Specimen B1
105--
46
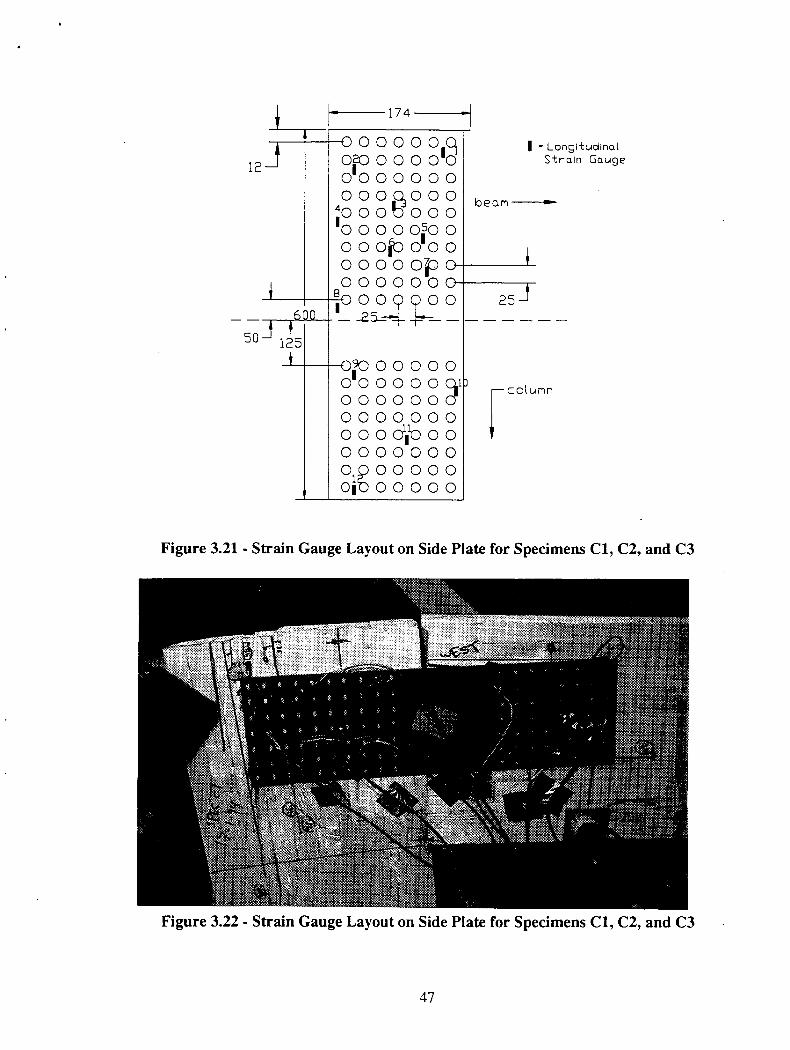
174
0 0 00 012 0E0 0 0 0
01 0 0 0 00 0 0.03 0
40 0 0 10 010 0 0 0 0 500 0 OK 000 0 0 0 010
1 80 00 o
0 0o 9
0
50 125
0900000001000000v0000000"0000000000 oilloo o o o oolp o o o
oo
0 00100 00 00 0
000
0 0
I - LongitudinalStrain Gauge
beam
I
25J
column
Figure 3.21 - Strain Gauge Layout on Side Plate for Specimens Cl, C2, and C3
Figure 3.22 - Strain Gauge Layout on Side Plate for Specimens Cl, C2, and C3
47
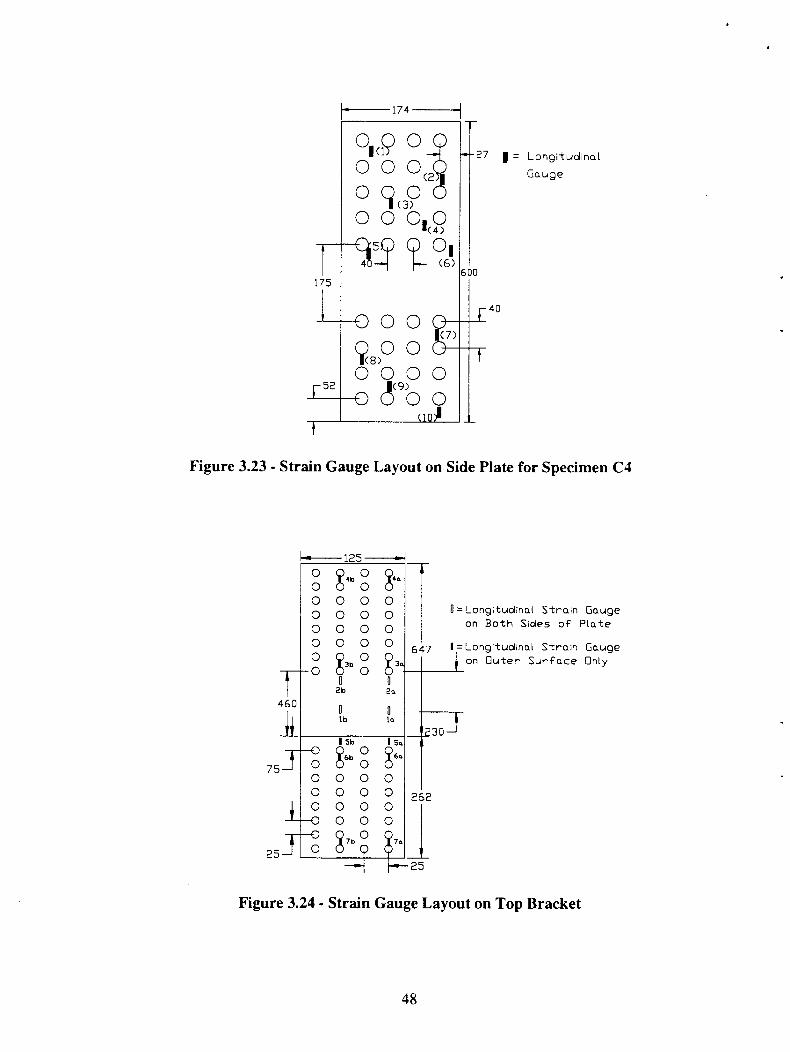
0 0 00 0 00 0 00 0 0
276 0O
7aO
174
600
01 (4o0 0(2
00(3)0 01 0
-(4)41 y40-1 H (6
1
27 I = LongitudinalGauge
175
400 0
(7)44J1? 0
v8)0 0 0
0 (5(9)0 0(10)1
Figure 3.23 - Strain Gauge Layout on Side Plate for Specimen C4
125
F52
647
460
75
94b
094,‘
6 60 0 00 0 00 0 00 0 0
0313
0 g 3a
2b
0 0lb
i 56 I su0 8600
0 = Longitudinal Strain Gaugeon Both Sides of Plate
I=Longitudinal Strain Gaugeon Outer Surface Only
30 j
25J
262
-n-25
Figure 3.24 - Strain Gauge Layout on Top Bracket
48

Figure 3.25 - Strain Gauge Layout on Top Bracket
49
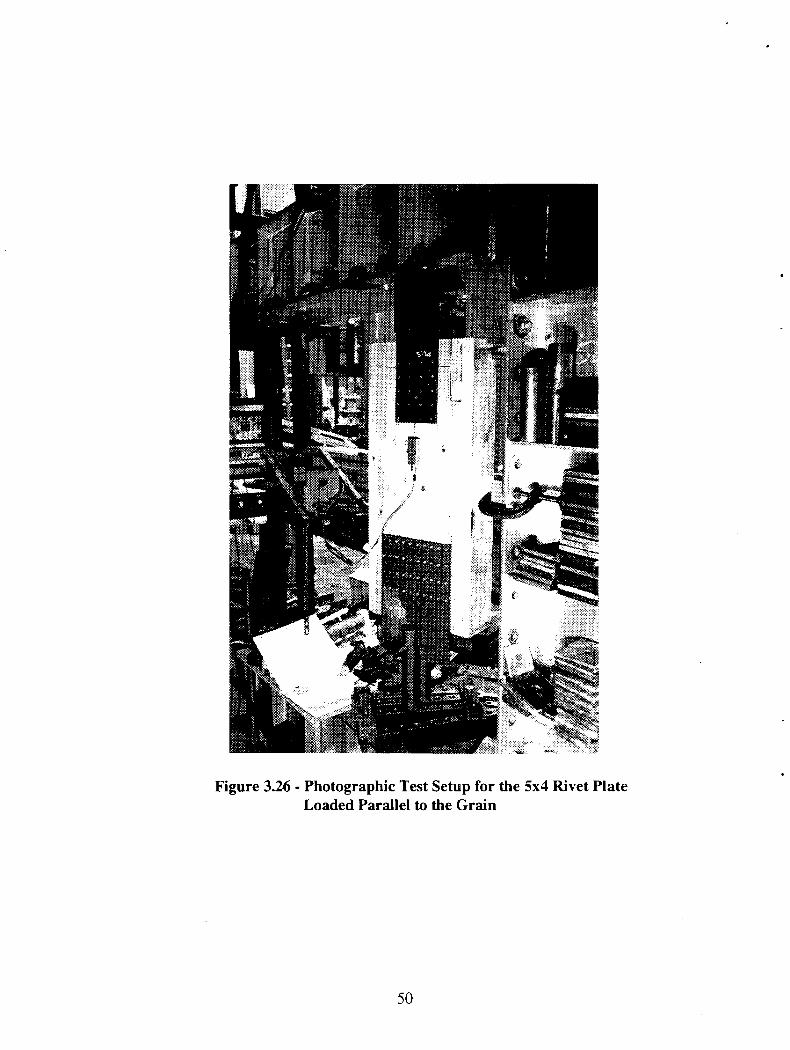
Figure 3.26 - Photographic Test Setup for the 5x4 Rivet PlateLoaded Parallel to the Grain
50
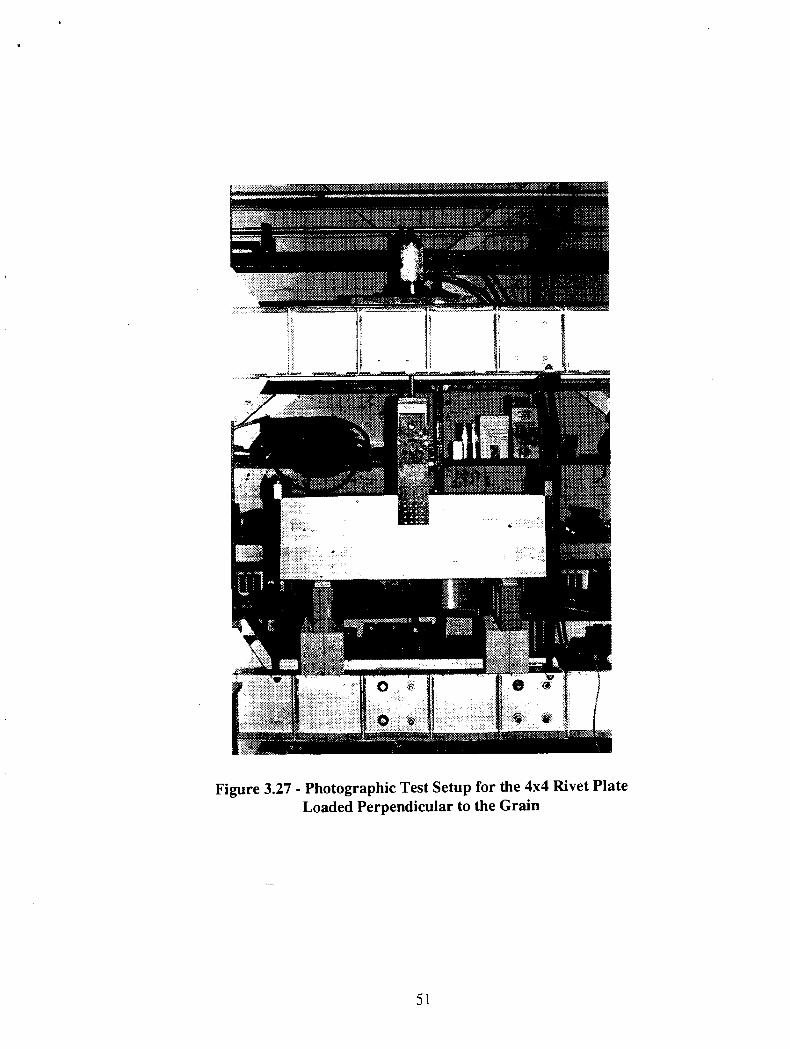
Figure 3.27 - Photographic Test Setup for the 4x4 Rivet PlateLoaded Perpendicular to the Grain
51
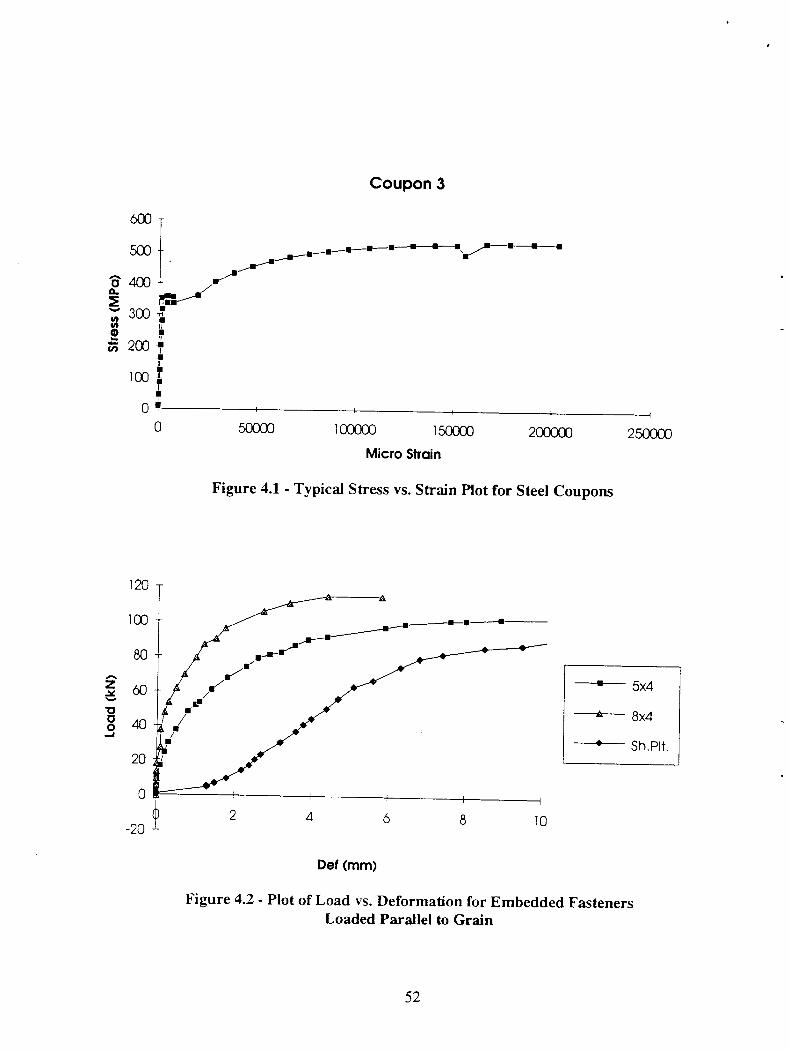
Coupon 3
1:3 400a.
3000ig 200 • nn
100 T
00 50000 100000 150003 200000 250003
Micro Strain
Figure 4.1 - Typical Stress vs. Strain Plot for Steel Coupons
5x4
8x4
• Sh.P1t.
Def (mm)
Figure 4.2 - Plot of Load vs. Deformation for Embedded FastenersLoaded Parallel to Grain
52
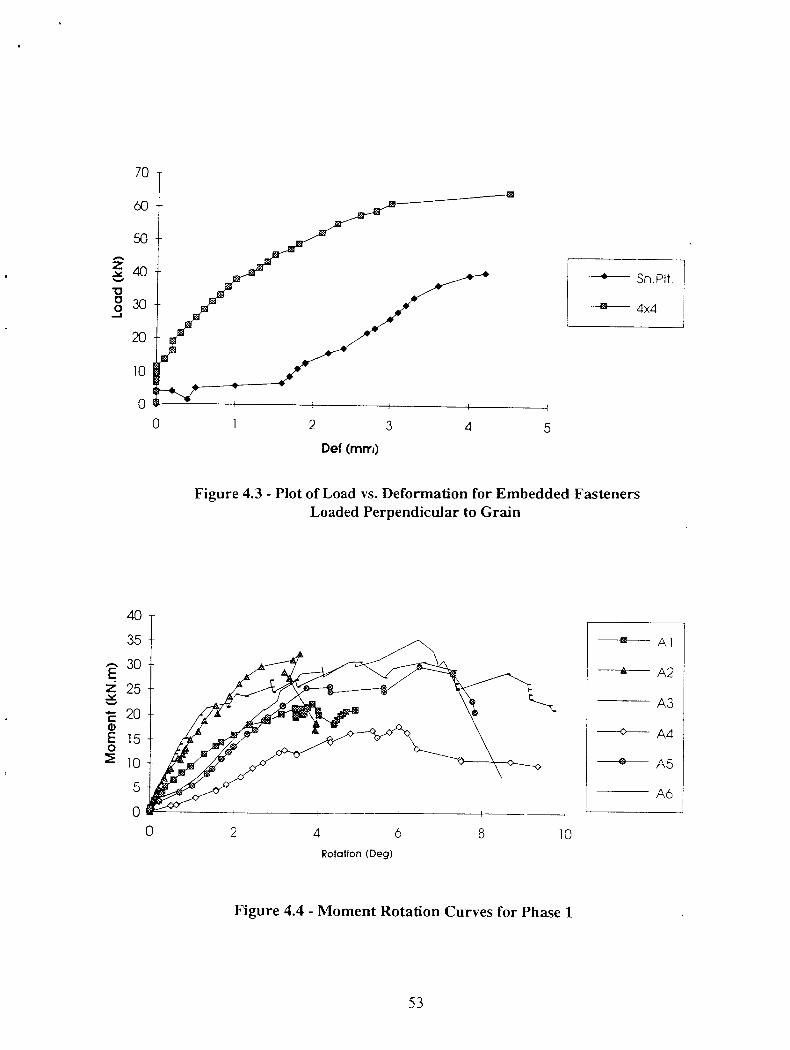
2 8 10
40
35
30
25
20
15
2 10
5
0
0 4 6
Rotation (Deg)
▪
A 1
A2
A3
•
A4
•
A5
A6
Sh.P1t.
4x4
0
1
2 3
4
5
Def (mm)
Figure 4.3 - Plot of Load vs. Deformation for Embedded FastenersLoaded Perpendicular to Grain
Figure 4.4 - Moment Rotation Curves for Phase 1
53
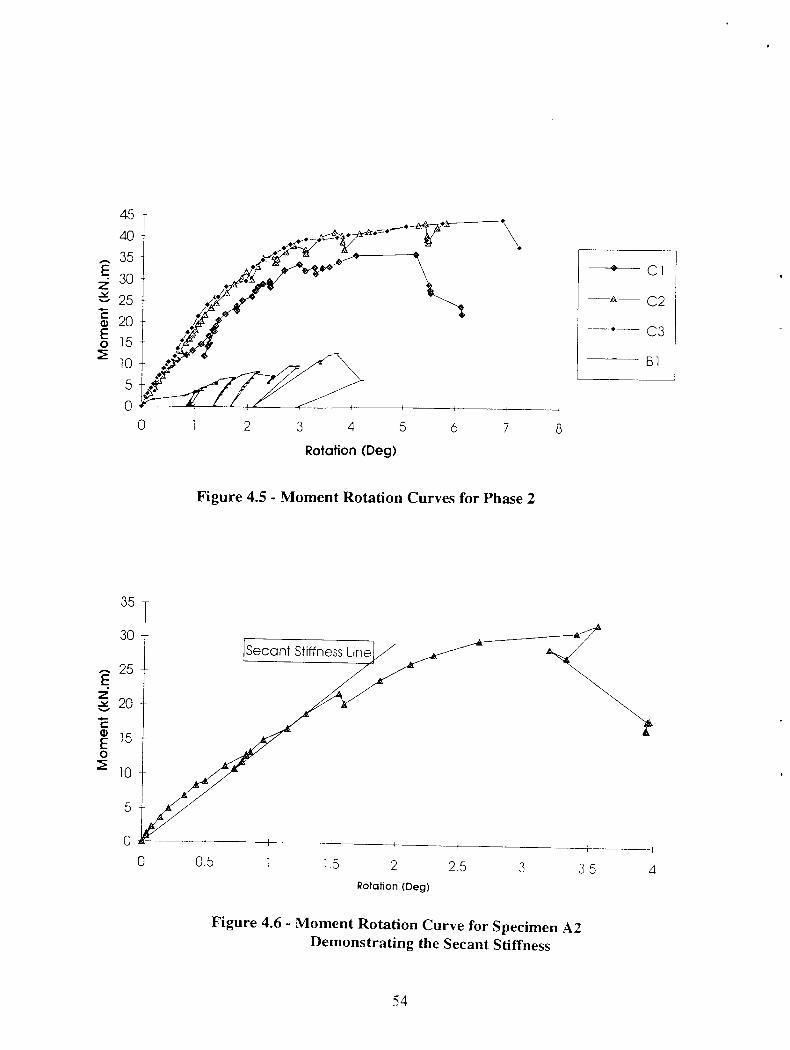
1 2 3 4 5 6 7 8
4540353025 -
w 20§ 15 -2 10
50
0
C 1
C2
C3
B1
Rotation (Deg)
Figure 4.5 - Moment Rotation Curves for Phase 2
0
0.5 1
1. 5 2 2.5 3 3.5 4Rotation (Deg)
Figure 4.6 - Moment Rotation Curve for Specimen A2Demonstrating the Secant Stiffness
54
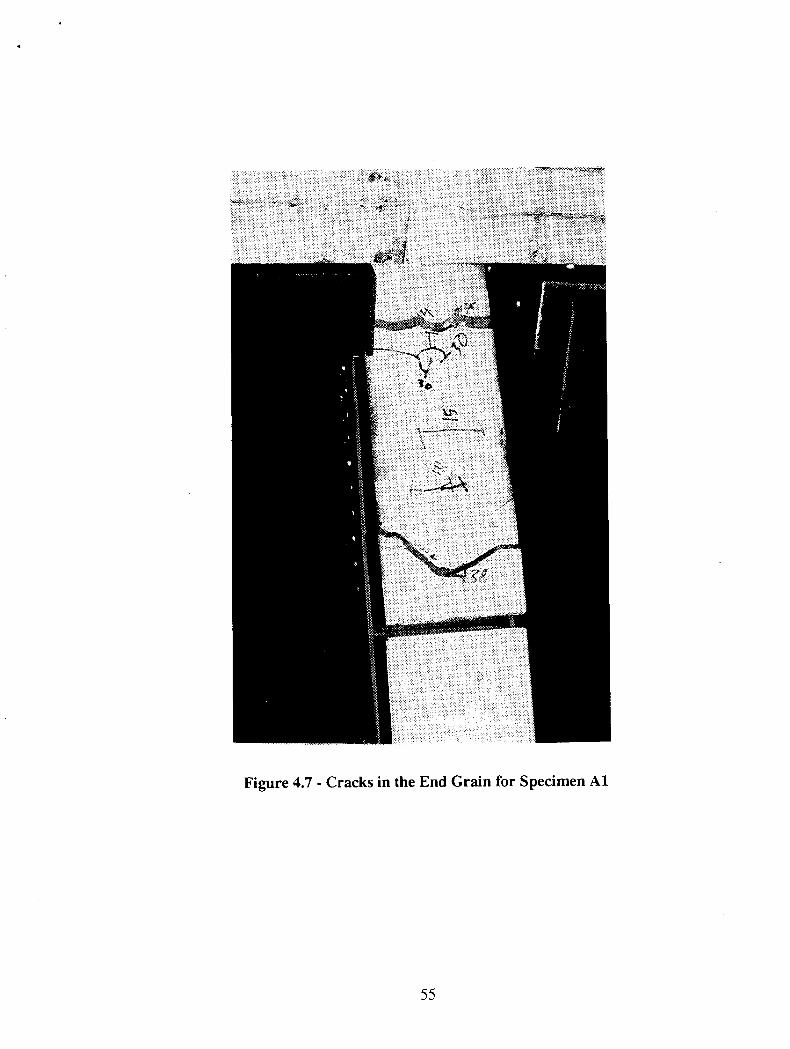
Figure 4.7 - Cracks in the End Grain for Specimen Al
55
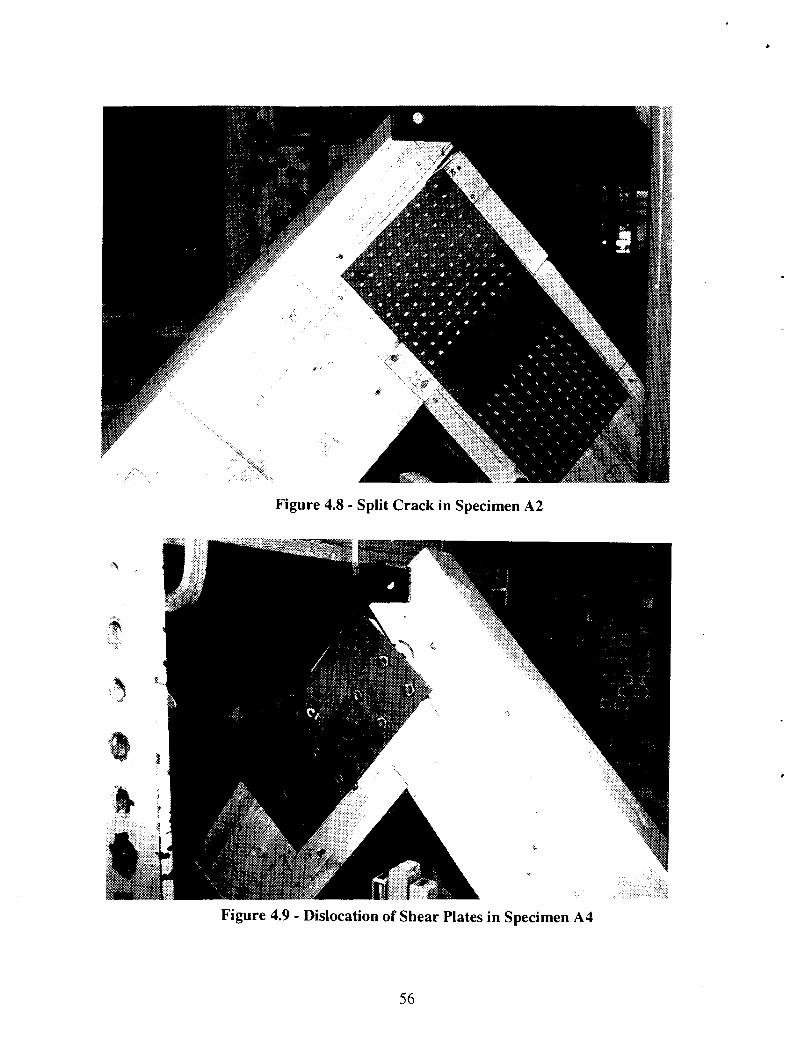
Figure 4.8 - Split Crack in Specimen A2
Figure 4.9 - Dislocation of Shear Plates in Specimen A4
56
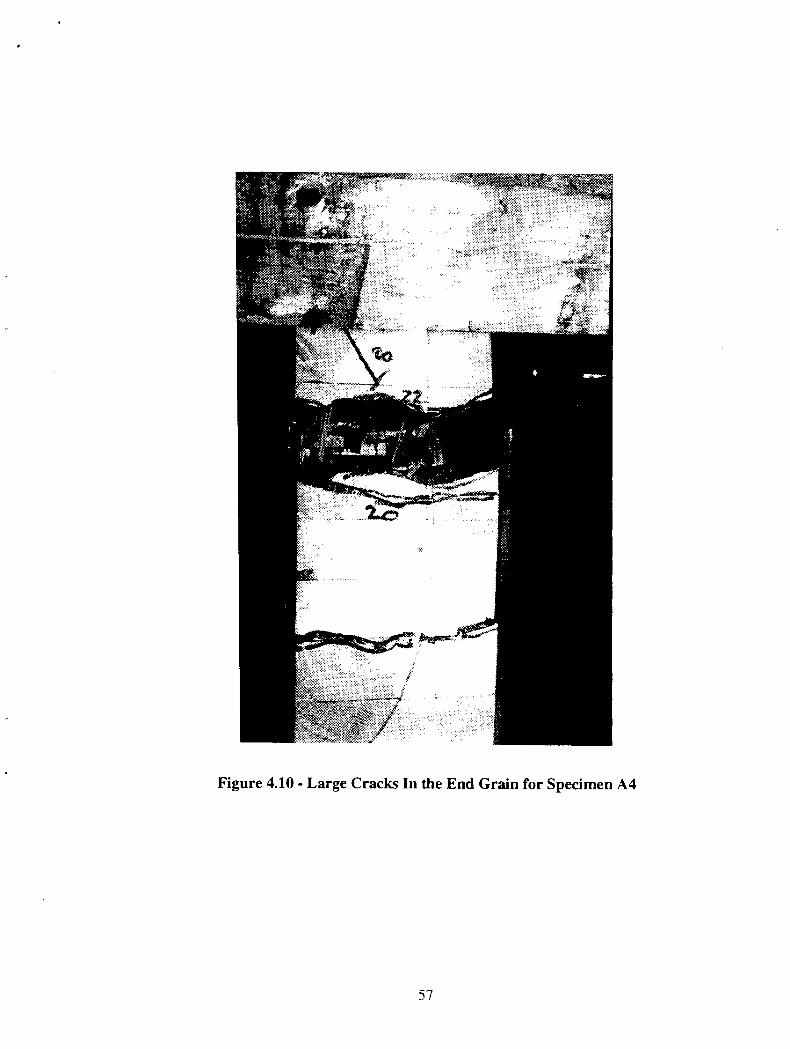
Figure 4.10 - Large Cracks In the End Grain for Specimen A4
57
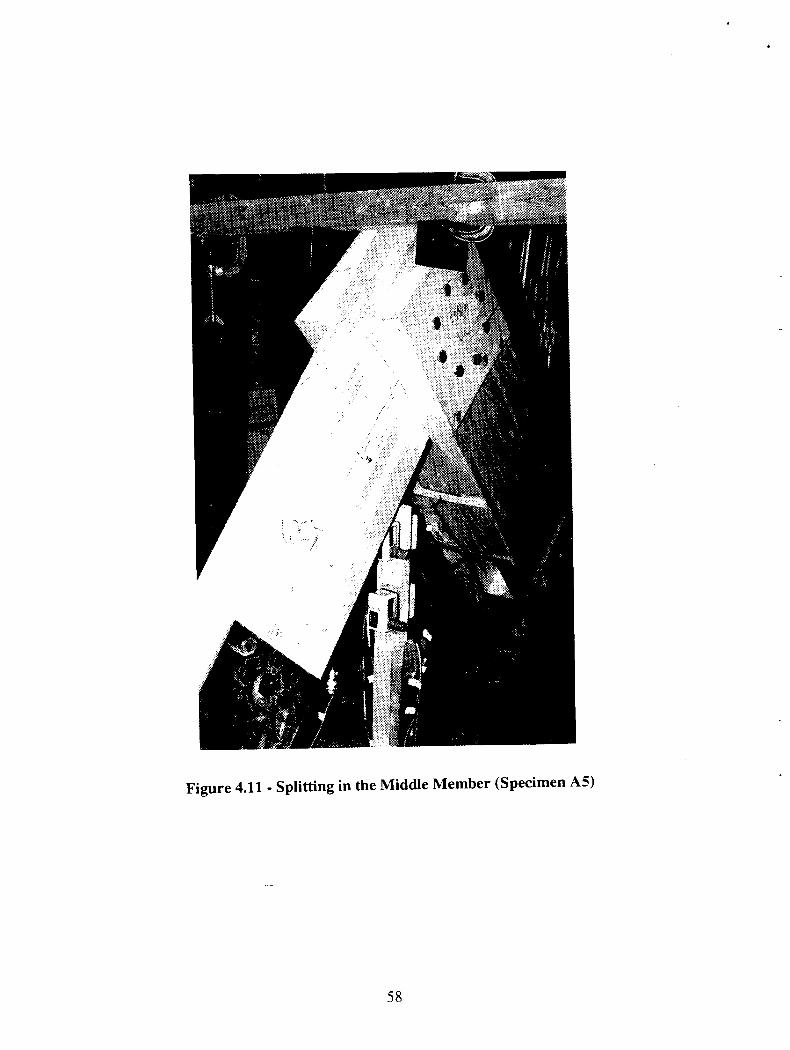
Figure 4.11 - Splitting in the Middle Member (Specimen A5)
58
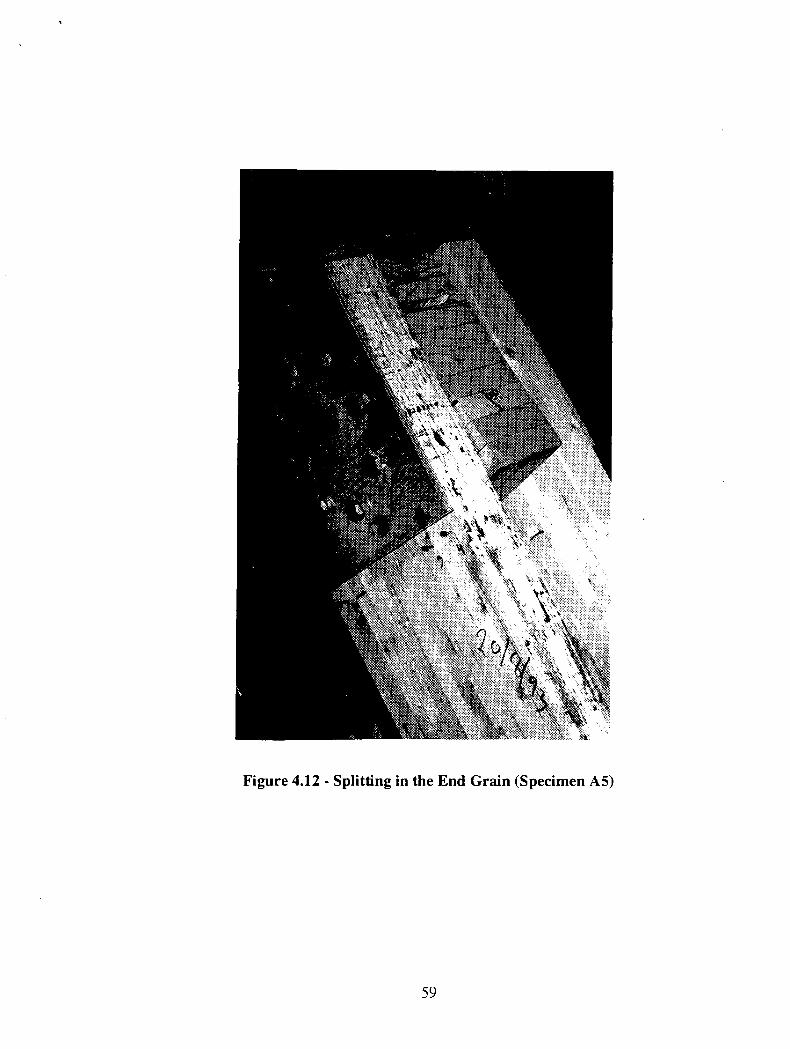
Figure 4.12 - Splitting in the End Grain (Specimen A5)
59
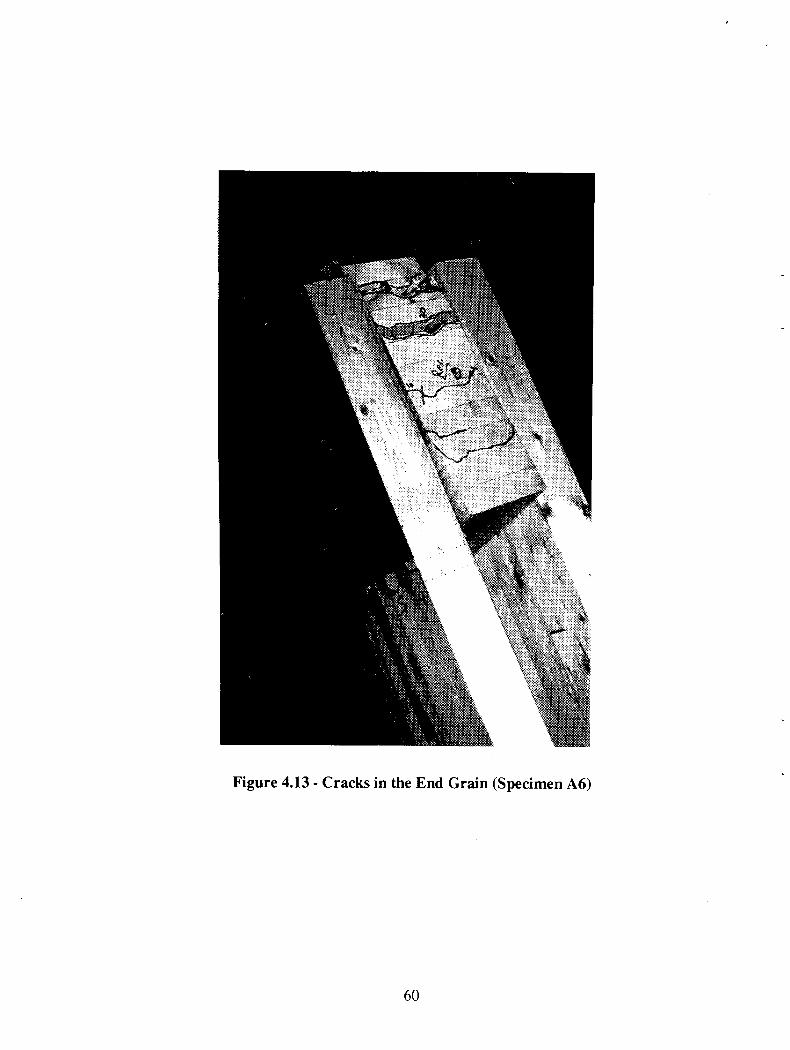
Figure 4.13 - Cracks in the End Grain (Specimen A6)
60

Ezw
2
Figure 4.14 - Cracks in the End Grain (Specimen C1)
G a #
•
• •
-1500 -1000 -500 500 1000 1500 2000
Figure 4.15 - Strain Gauge Readings for Top Part of Side Plate (Specimen C1)
4.••igloo
S•t•
0MicroStrain
1
2
3
o 4
5
6
• 7
8
61
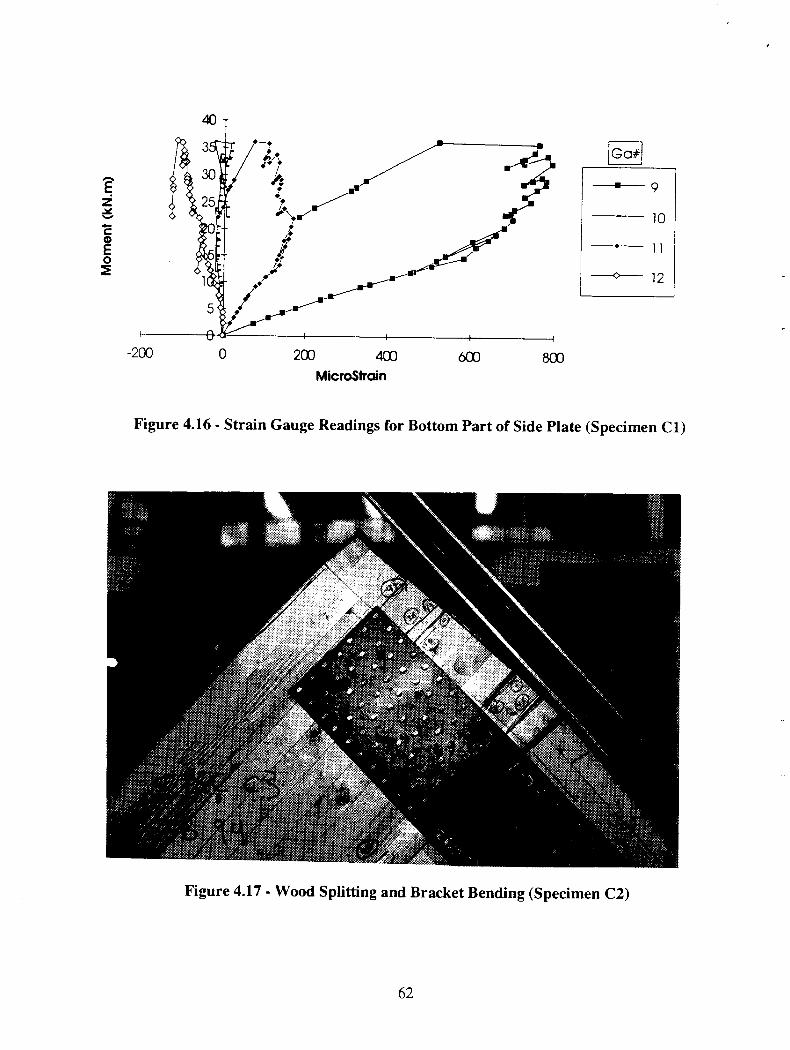
Ga#
9
10
• — 11
12
-200
0
200 400
600
800MicroStrain
Figure 4.16 - Strain Gauge Readings for Bottom Part of Side Plate (Specimen C1)
Figure 4.17 - Wood Splitting and Bracket Bending (Specimen C2)
62
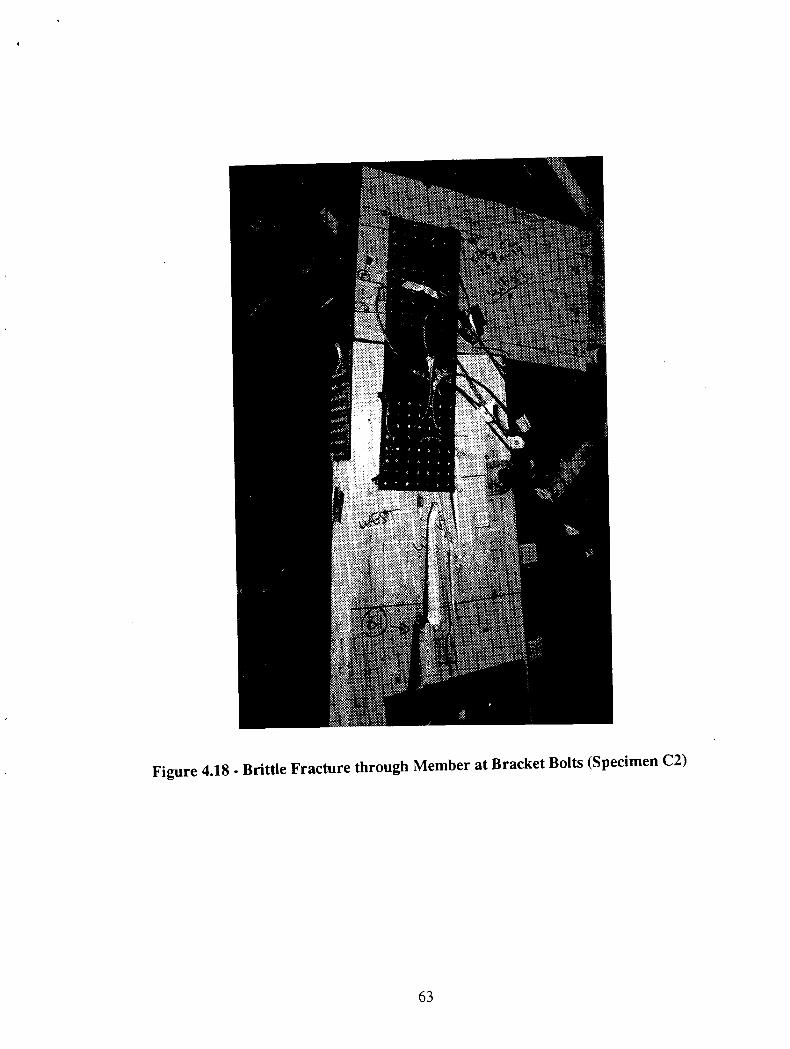
Figure 4.18 - Brittle Fracture through Member at Bracket Bolts (Specimen C2)
63

-500-1000 1000 15000 500
MicroStrain
1
0 2
3
4
• 5
A 6
X 7
*-- 8
G a#
Figure 4.19 - Strain Gauge Readings for Top Part of Side Plate (SpecimensC2 and C3)
G a#
9
--- 10
11
• 12
-200 -100
0 100 200
300
400 500
MicroStrain
Figure 4.20 - Strain Gauge Readings for Bottom Part of Side Plate(Specimens C2 and C3)
64
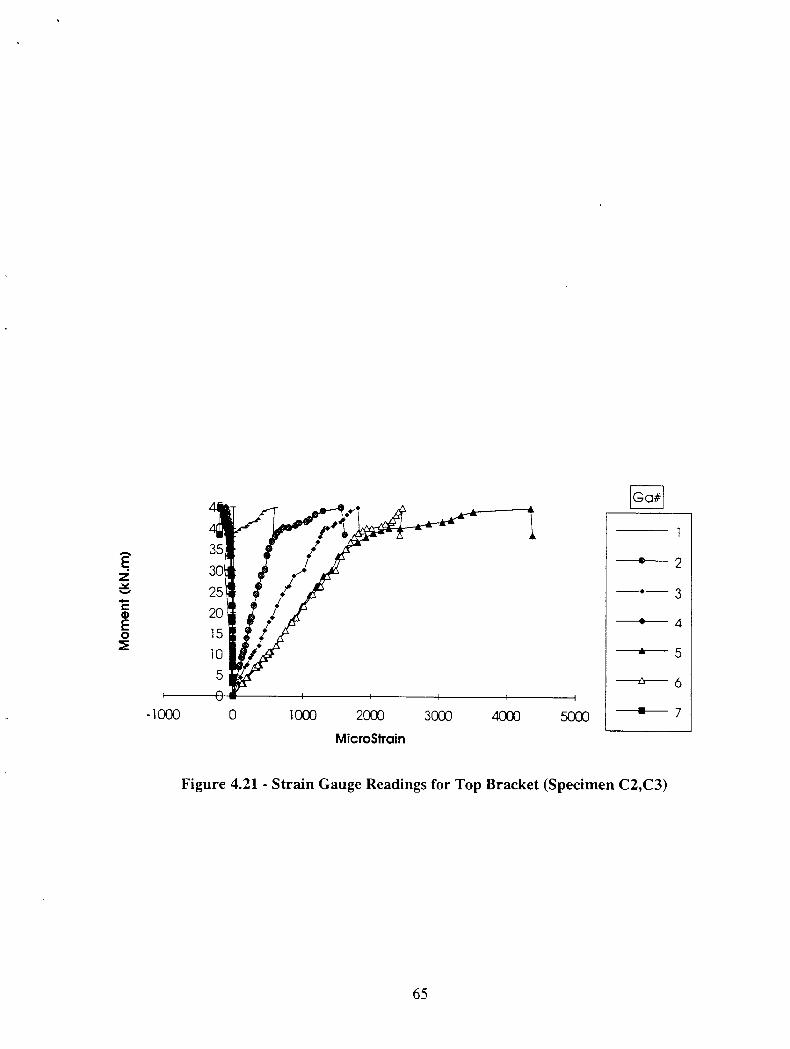
1
2
3
4
5
6
7
3530252015105
-1000
0 1000 2000 3000
4000
5000MicroStrain
z
2
Ga#
Figure 4.21 - Strain Gauge Readings for Top Bracket (Specimen C2,C3)
•
65
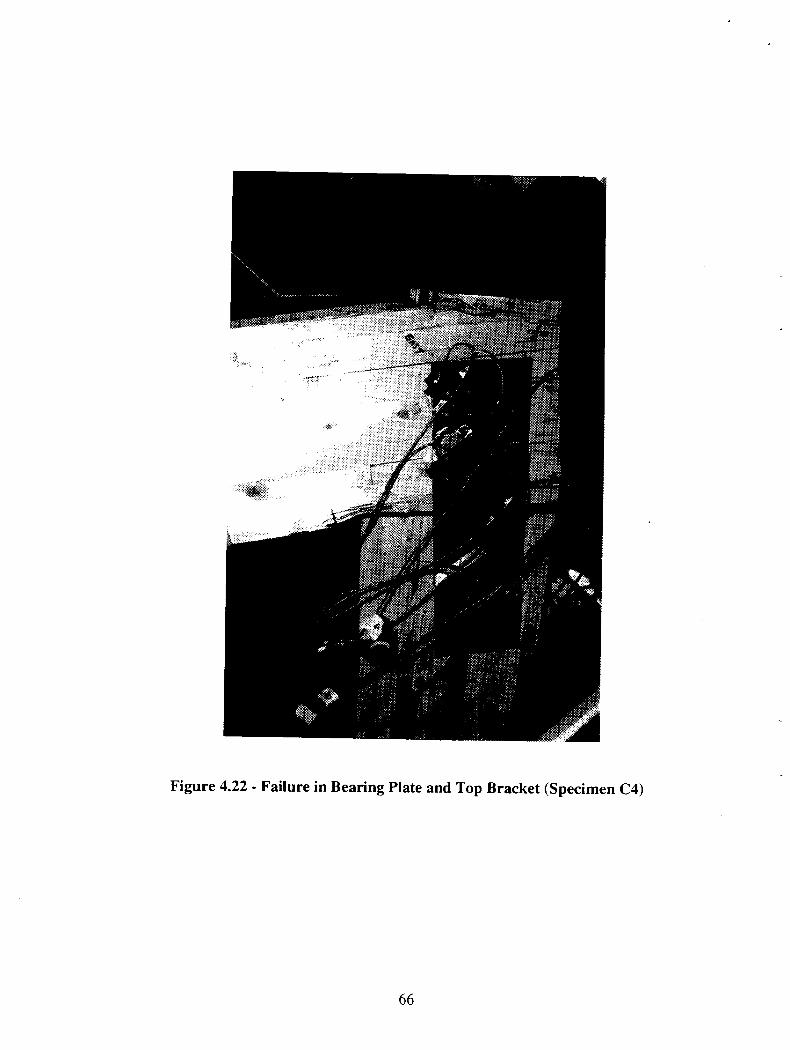
Figure 4.22 - Failure in Bearing Plate and Top Bracket (Specimen C4)
66
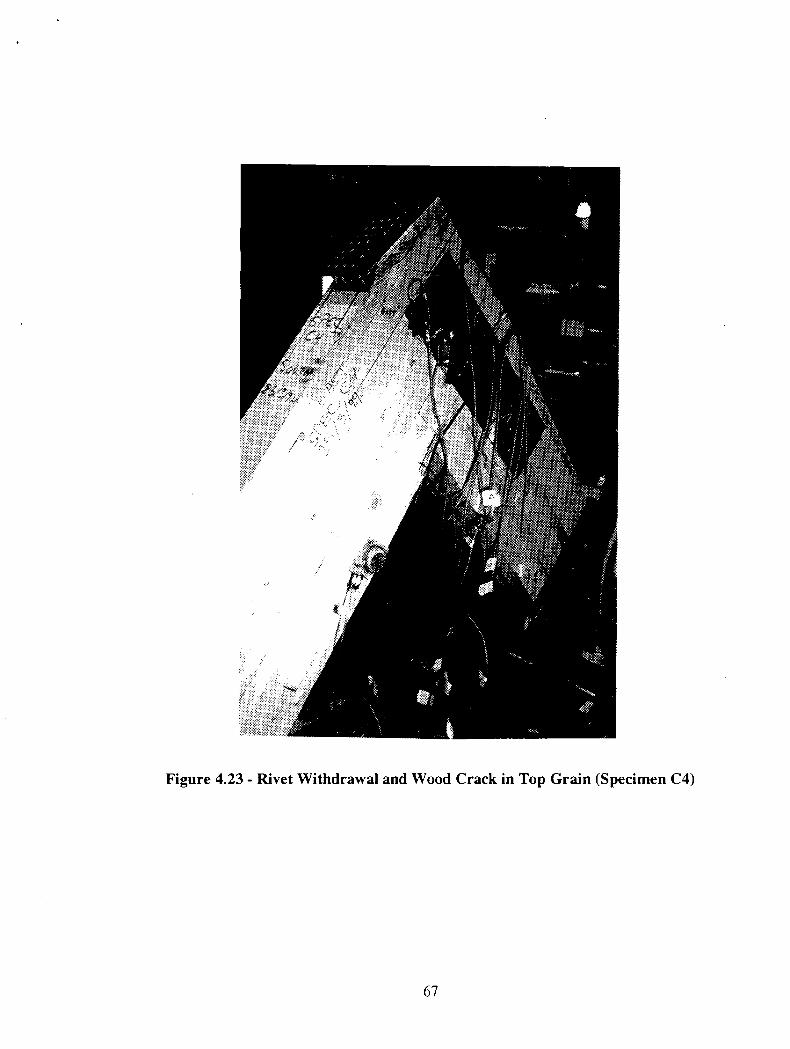
Figure 4.23 - Rivet Withdrawal and Wood Crack in Top Grain (Specimen C4)
67
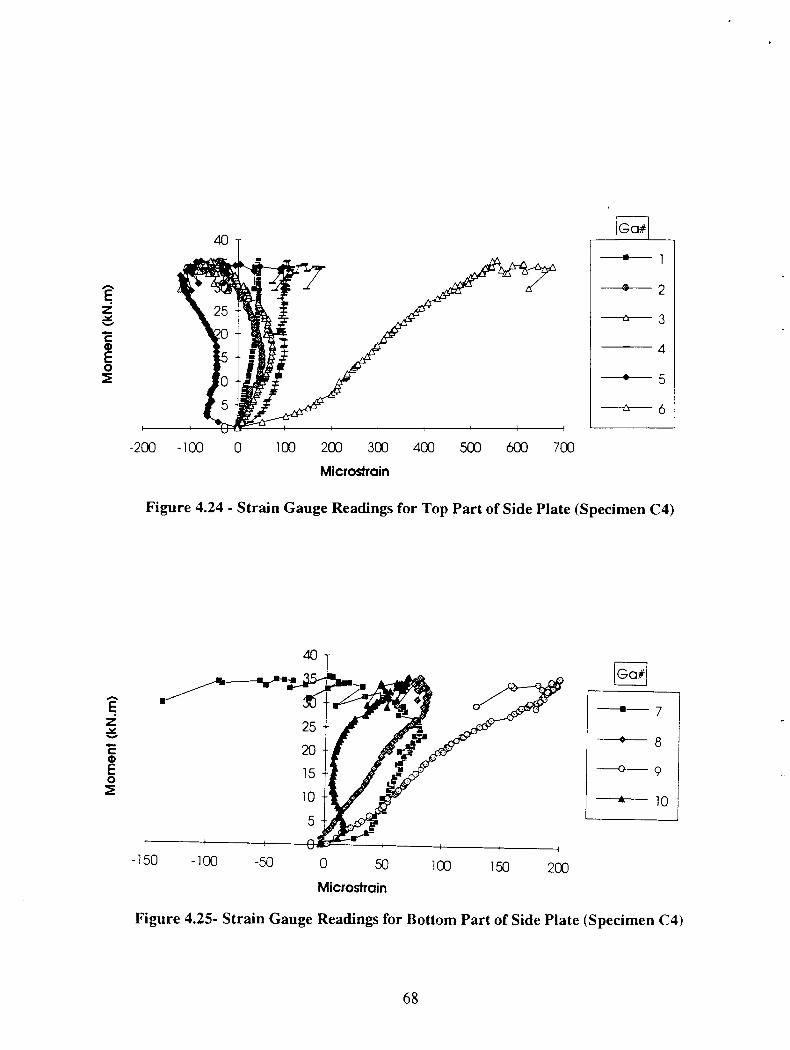
zS.
02
IGa#1
7
o 8
o 9
A--- 10
Go*
Ez
02
1
2
3
4
• 5
6
-200 -100 0 100 200 303 400 500 603 703
Microstrain
Figure 4.24 - Strain Gauge Readings for Top Part of Side Plate (Specimen C4)
-150 -100 -50
0 50
100
150
200
Microstrain
Figure 4.25- Strain Gauge Readings for Bottom Part of Side Plate (Specimen C4)
68
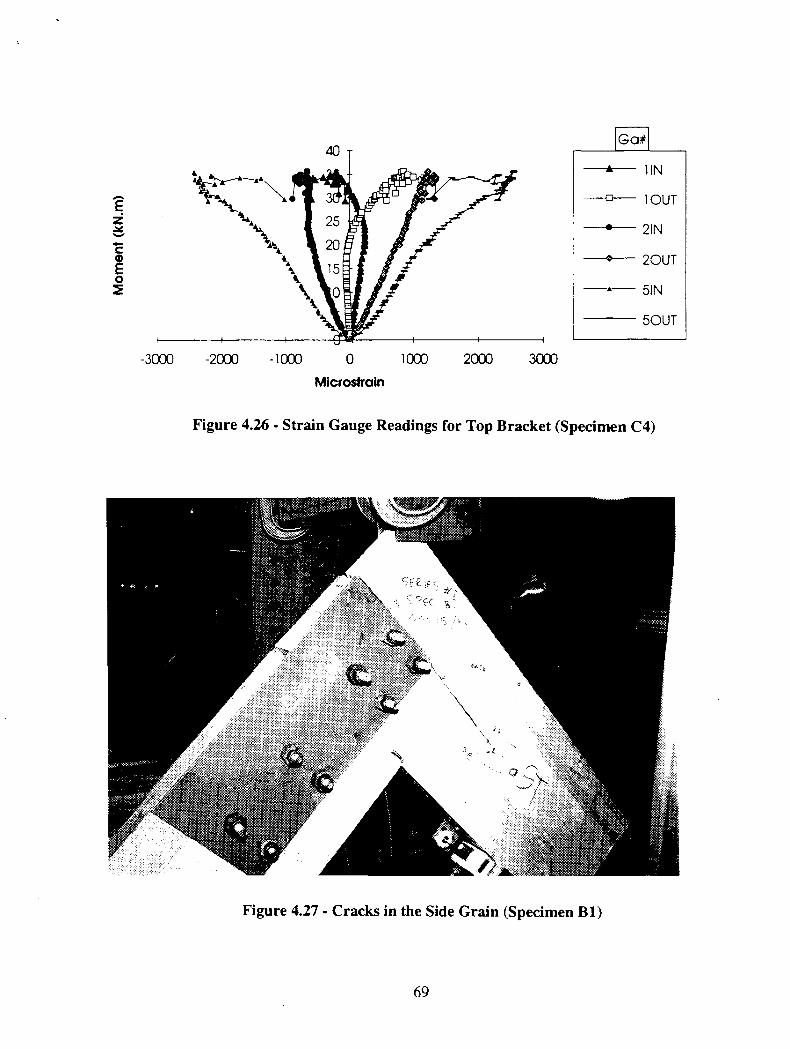
Ga#
--A---- 1 IN
LOUT
• 21N
2OUT
• 51N
5OUT
-3000 -2000 -1000 0 1 003
2000
3000
Microstrain
Figure 4.26 - Strain Gauge Readings for Top Bracket (Specimen C4)
Figure 4.27 - Cracks in the Side Grain (Specimen B1)
69
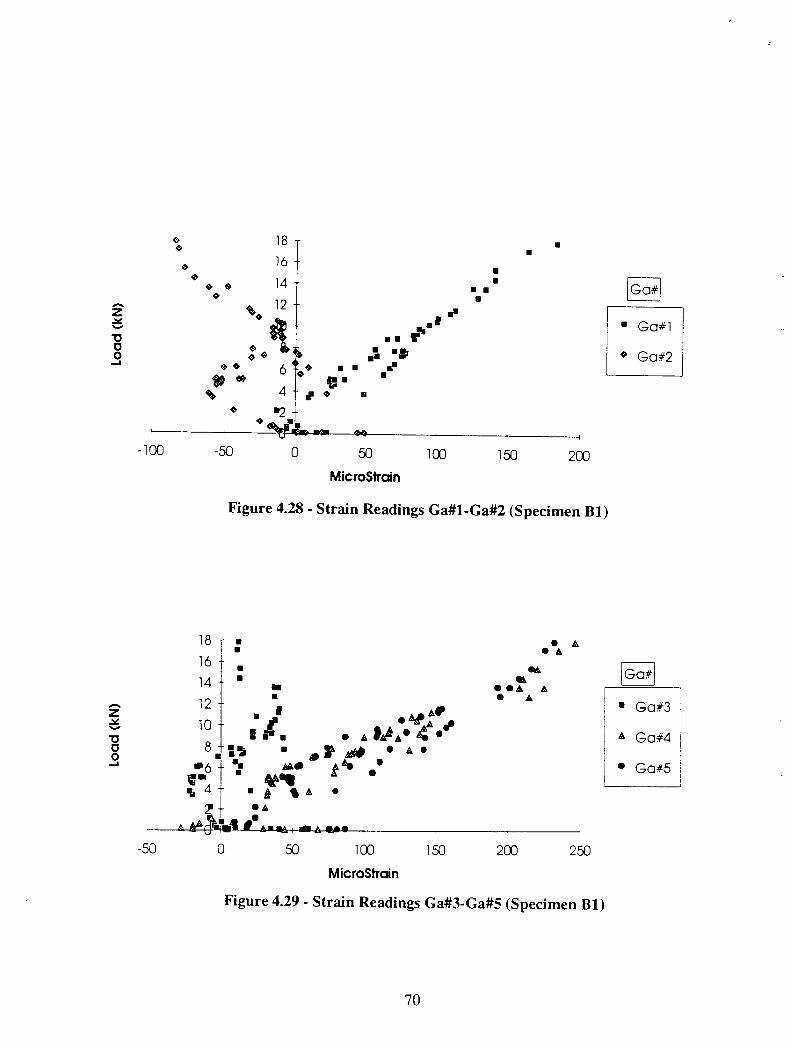
iGa#
Ga#1
Ga#2
16 n•e 14 n n
n
2 ®• 12 .1-,c • I
o • i ..-0 • s r.11. • D
o ° 6 • • s•. a •
S 4 d • n
0 •2*.tellja) OW •0
-100 -50 0 50 100 150 200
MicroStrain
Figure 4.28 - Strain Readings Ga#1-Ga#2 (Specimen B1)
18
16
- n•- •
••
Ga#14 - ' •
a.• A A
• A
2
13
12
10
-•
-I
1as a
MPAP A
A tfr A • 4 04,0
Ga#3
A Ga#40 8;115 n or AO • A •
Ga#5*II
.1:4 - n1 k s A •
21 _ • A•
,_ _ _ ___ _ _ _ L _ e jfil IA 1 A .115 i
-50 0 50 100 150 200 250
MicroStrain
Figure 4.29 - Strain Readings Ga#3-Ga#5 (Specimen B1)
70
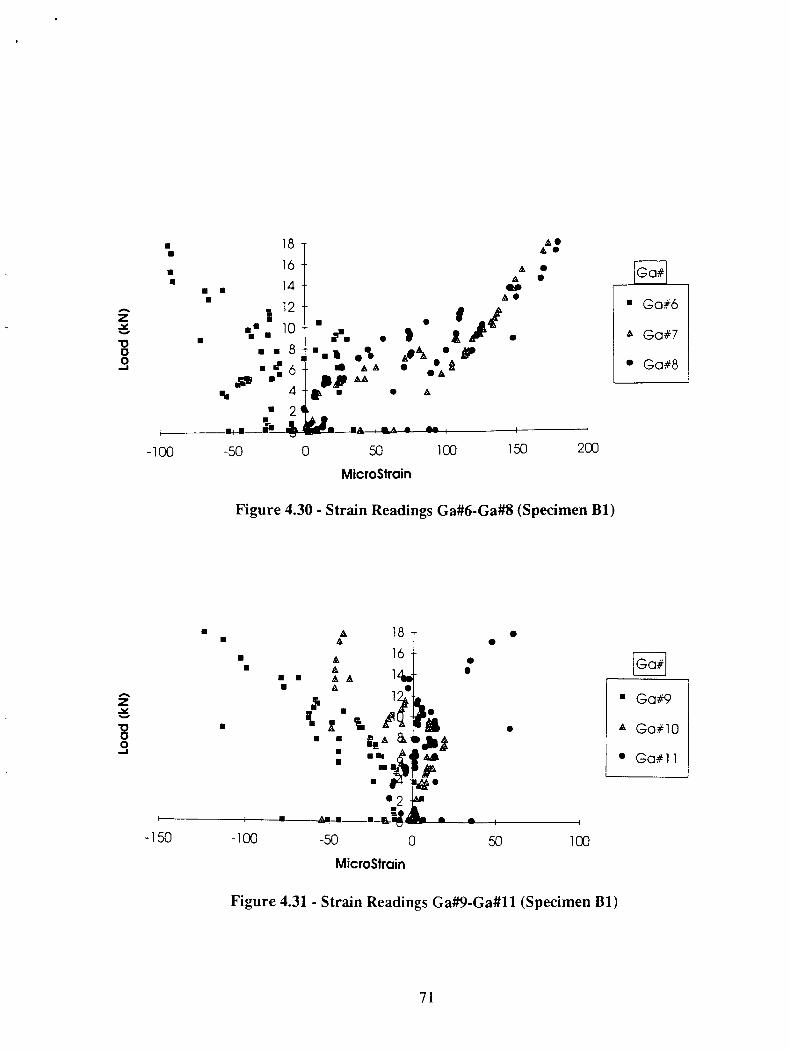
••
• Ga#
•
Ga#9
A Ga#10
Ga#11
2
a
n•n
n n •
18 -
16 -14 -
AA
A •A •
•• Ga#
n12
• 1 A
A • n Ga#6
• •n n
108
is. • I„hi%
1p
• A Ga#7
• •1re • 6 A A •aip AA
A • Ga#8
n• 4 a, n • A
n 2+-•
-100 -50 0 50 100 150 200
MicroStrain
Figure 4.30 - Strain Readings Ga#6-Ga#8 (Specimen B1)
A 18A
A 16
n n AA A 1
1 1;AC IL
•
I it PI IS-8 n• gs A & obi
2 • "
1 g—m-. n e . • I 1
-150 -100 -50 0 50 100
MicroStrain
Figure 4.31 - Strain Readings Ga#9-Ga#11 (Specimen B1)
71
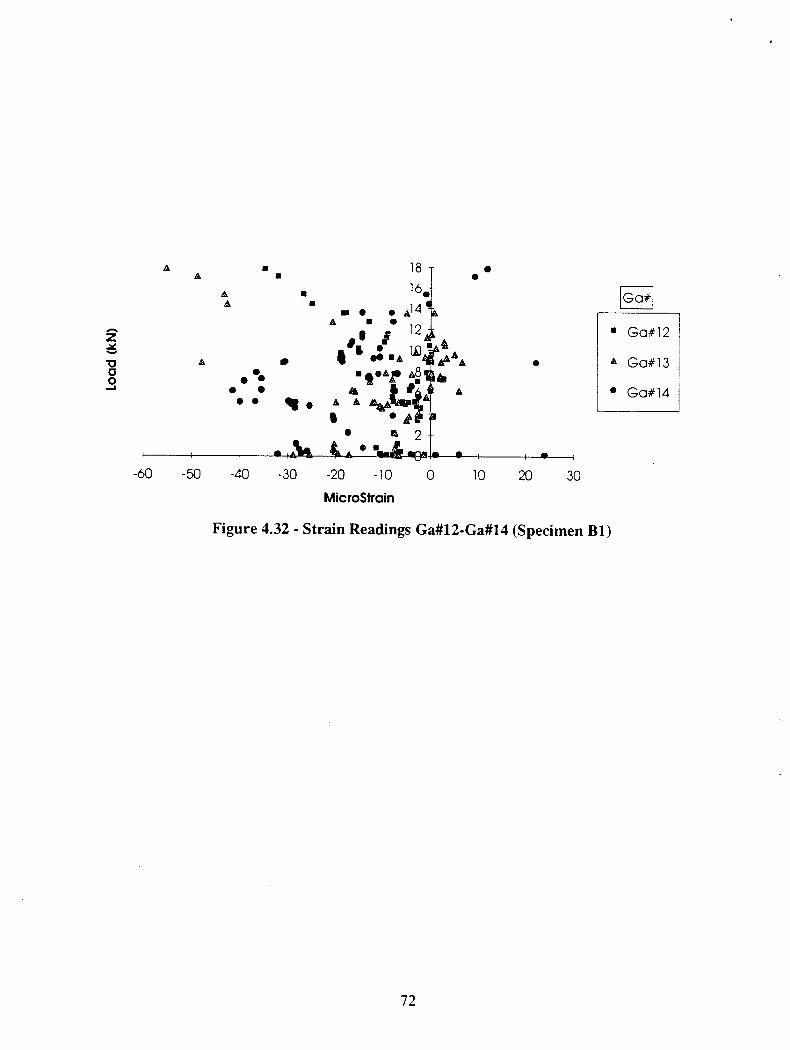
Ga#
Ga#12
♦ Ga#13
Ga#14
A • 18
•A n •
16,
• • A14A n •
2 12..v"0 A . g•ge 044 in—Z.141Ao A8 Iiiiii
•
2••
n j•AID ASO
• 41 •) drii• i•
sA A tivAArit;
a 2I i i It i® C. • •101•1_09s n • I I • r
-60 -50 -40 -30 -20 -10 0 10 20 30
MicroStrain
A nA n
Figure 4.32 - Strain Readings Ga#12-Ga#14 (Specimen B1)
72
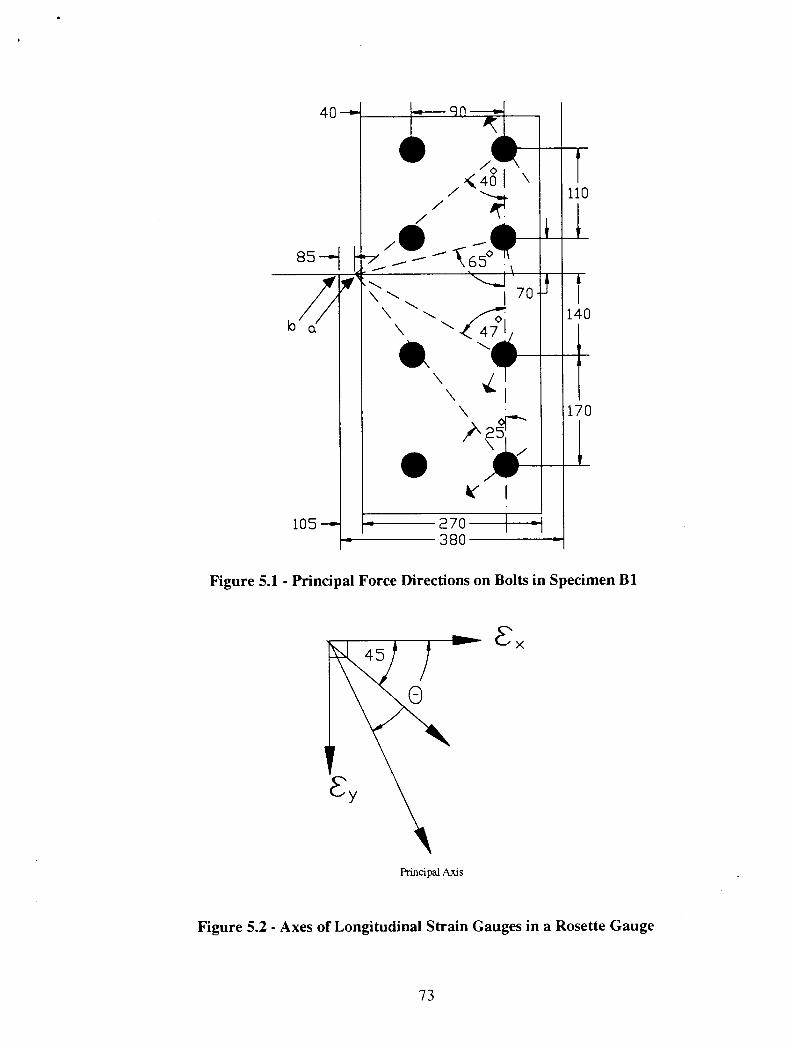
90 ..,
<400I
7,,h.,,o
,--- 1P.- - --650 ,, ,.,....\,. 1 70,
—I\ --...
\ 47#Olk \ ,14
\ 1\ ..,,.?\ 251\)iiV
270380 .
Figure 5.1 - Principal Force Directions on Bolts in Specimen B1
Ex
Principal Axis
40
85
b
105
110
140
170
Figure 5.2 - Axes of Longitudinal Strain Gauges in a Rosette Gauge
73
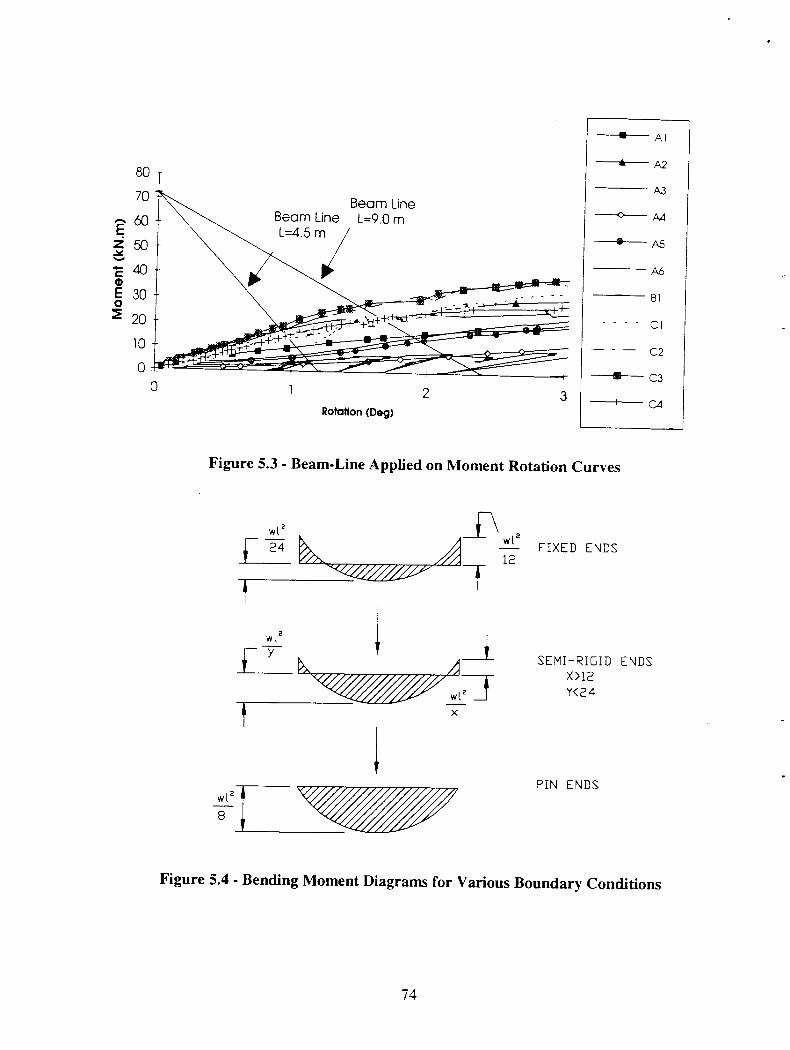
Beam LineBeam Line L=9.0 mL=4.5 m
-_,.--,--:- - -.3----
1
2 3Rotaffon (Deg)
80 -
70
? 60 -
_c 5° --
"E 40a)E 30 -02 20 -
10 -
00
Al
,i___ A2
A3
A4
.—_ A5
A6
B]
C l
— C2
----16 C3
04
Figure 5.3 - Beam-Line Applied on Moment Rotation Curves
[wl2 Ir\ wi224
12
t
[
w2
Y
t
FIXED ENDS
SEMI-RIGID ENDSX>12Y<24
PIN ENDSwl 2 A
8I
n
Figure 5.4 - Bending Moment Diagrams for Various Boundary Conditions
74
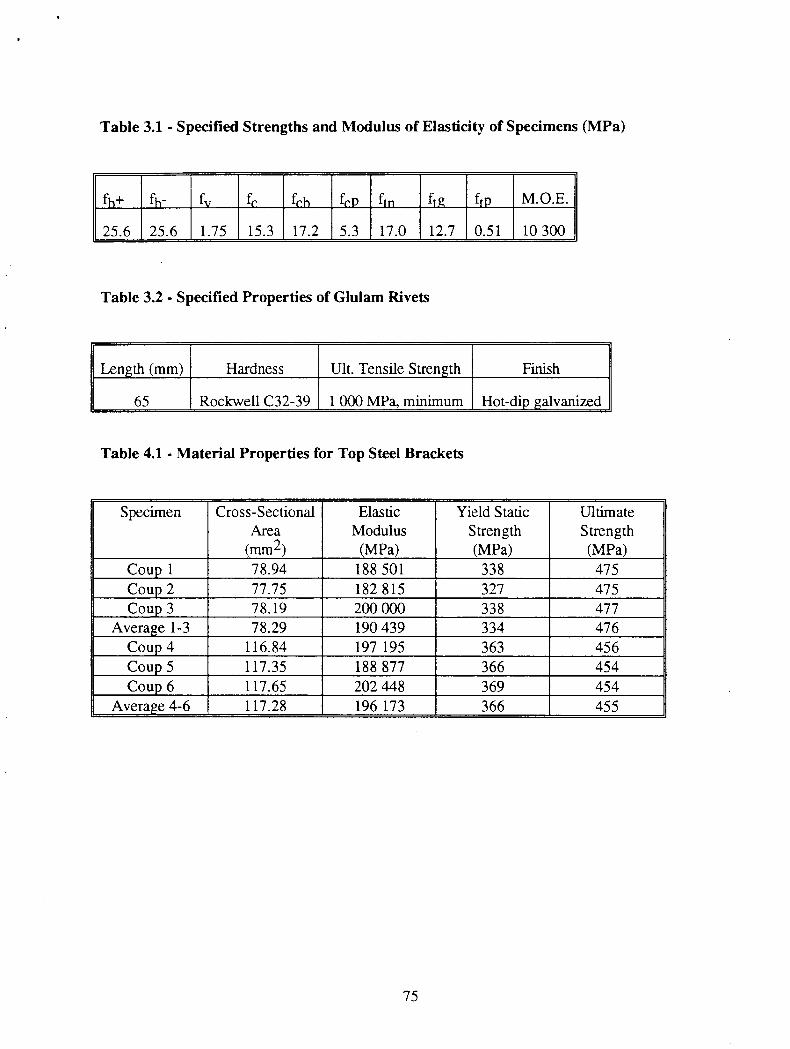
Table 3.1 - Specified Strengths and Modulus of Elasticity of Specimens (MPa)
fh+ fh- fv fr fch fr P fm frg fry M.O.E.
25.6 25.6 1.75 15.3 17.2 5.3 17.0 12.7 0.51 10 300
Table 3.2 - Specified Properties of Glulam Rivets
Length (mm) Hardness Ult. Tensile Strength Finish
65 Rockwell C32-39 1 000 MPa, minimum Hot-dip galvanized
Table 4.1 - Material Properties for Top Steel Brackets
Specimen Cross-SectionalArea
(mm2)
ElasticModulus
(MPa)
Yield StaticStrength(MPa)
UltimateStrength(MPa)
Coup 1 78.94 188 501 338 475Coup 2 77.75 182 815 327 475Coup 3 78.19 200 000 338 477
Average 1-3 78.29 190 439 334 476Coup 4 116.84 197 195 363 456Coup 5 117.35 188 877 366 454Coup 6 117.65 202 448 369 454
Average 4-6 117.28 196 173 366 455
75
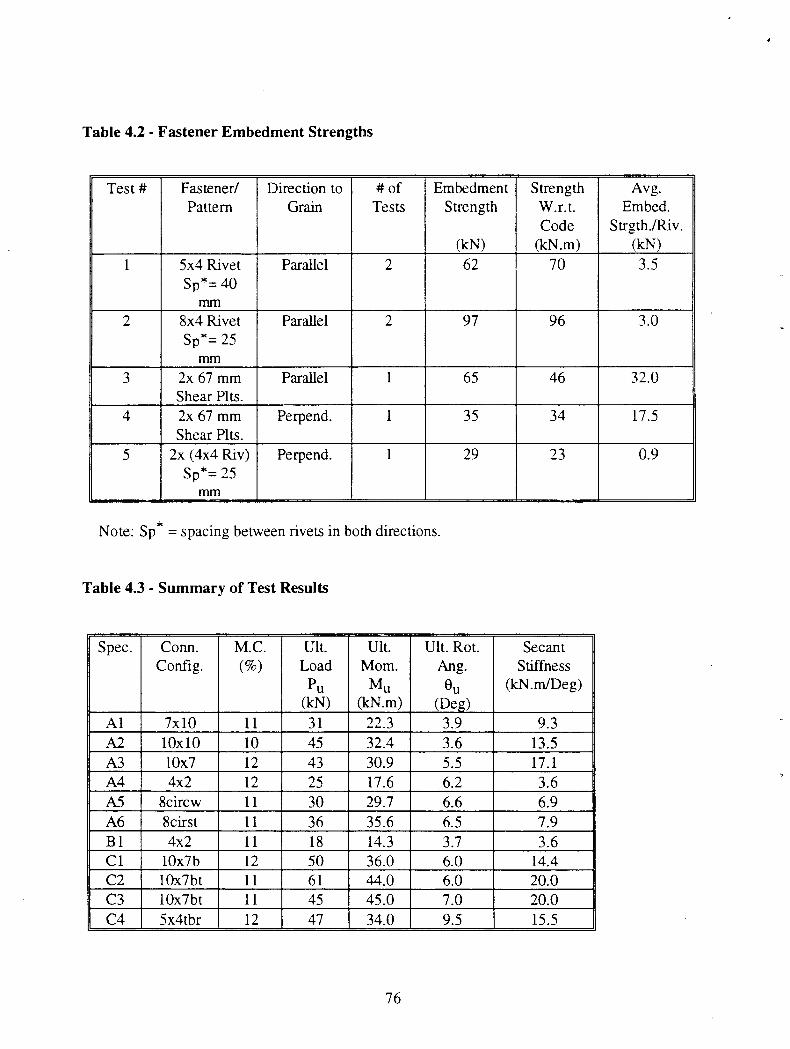
Table 4.2 - Fastener Embedment Strengths
Test # Fastener/Pattern
Direction toGrain
# ofTests
EmbedmentStrength
(kN)
StrengthW.r.t.Code
(kN•m)
Avg.Embed.
Strgth./Riv.(kN)
1 5x4 RivetSp*--,--- 40
mm
Parallel 2 62 70 3.5
2 8x4 RivetSp*= 25
mm
Parallel 2 97 96 3.0
3 2x 67 mmShear Plts.
Parallel 1 65 46 32.0
4 2x 67 mmShear Plts.
Perpend. 1 35 34 17.5
5 2x (4x4 Riv)Sp*= 25
mm
Perpend. 1 29 23 0.9
Note: Sp * = spacing between rivets in both directions.
Table 4.3 - Summary of Test Results
Spec. Conn.Config.
M.C.(%)
Ult.Load
Pu(kN)
Ult.Mom.
Mu(kN.m)
Ult. Rot.Ang.
eu(Deg)
SecantStiffness
(kN.m/Deg)
Al 7x10 11 31 22.3 3.9 9.3A2 10x10 10 45 32.4 3.6 13.5A3 10x7 12 43 30.9 5.5 17.1A4 4x2 12 25 17.6 6.2 3.6AS 8circw 11 30 29.7 6.6 6.9A6 8cirst 11 36 35.6 6.5 7.9B1 4x2 11 18 14.3 3.7 3.6Cl 10x7b 12 50 36.0 6.0 14.4C2 10x7bt 11 61 44.0 6.0 20.0C3 10x7bt 11 45 45.0 7.0 20.0C4 5x4tbr 12 47 34.0 9.5 15.5
76
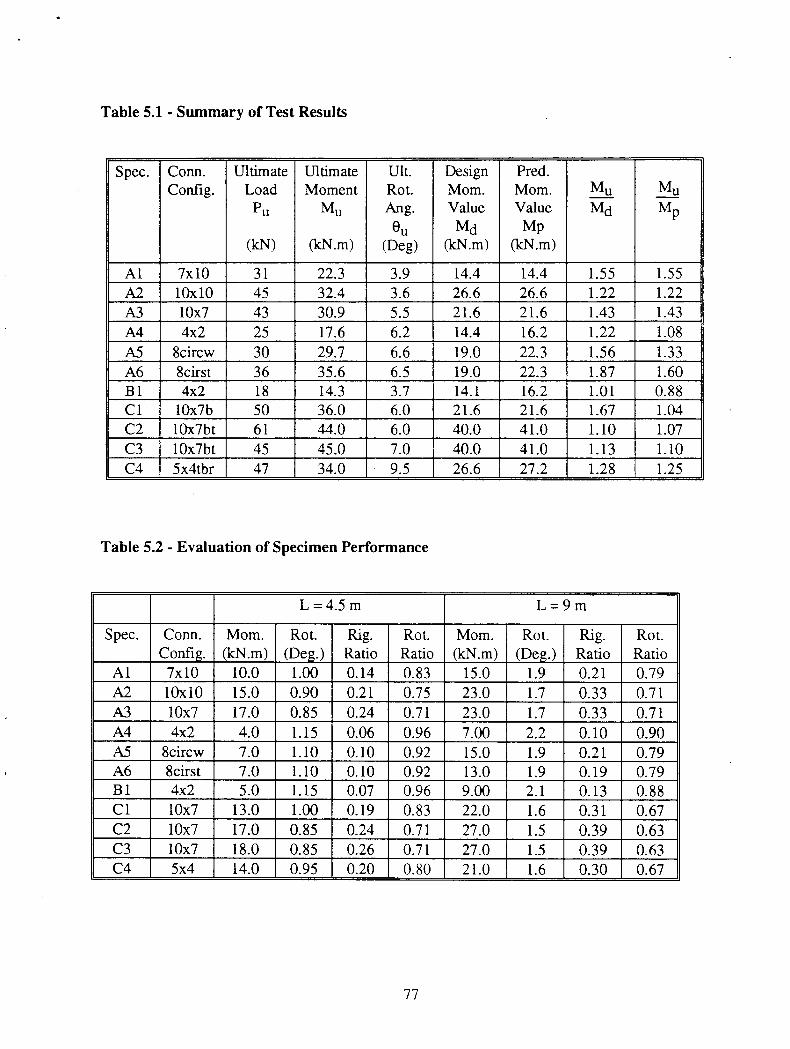
Table 5.1 - Summary of Test Results
Spec. Conn.Config.
UltimateLoad
Pu
(kN)
UltimateMoment
Mu
(kN.m)
Ult.Rot.Mg.
eu(Deg)
DesignMom.ValueMd
(kN.m)
Pred.Mom.ValueMp
(kN.m)
Mu MuMd MP
Al 7x10 31 22.3 3.9 14.4 14.4 1.55 1.55A2 10x10 45 32.4 3.6 26.6 26.6 1.22 1.22A3 10x7 43 30.9 5.5 21.6 21.6 1.43 1.43A4 4x2 25 17.6 6.2 14.4 16.2 1.22 1.08AS 8circw 30 29.7 6.6 19.0 22.3 1.56 L33A6 8cirst 36 35.6 6.5 19.0 22.3 1.87 1.60B1 4x2 18 14.3 3.7 14.1 16.2 1.01 0.88Cl 10x7b 50 36.0 6.0 21.6 21.6 1.67 1.04C2 10x7bt 61 44.0 6.0 40.0 41.0 1.10 1.07C3 10x7bt 45 45.0 7.0 40.0 41.0 1.13 1.10C4 5x4tbr 47 34.0 9.5 26.6 27.2 1.28 1.25
Table 5.2 - Evaluation of Specimen Performance
L .-- 4.5 m L . 9 m
Spec. Conn.Config.
Mom.(kN.m)
Rot.(Deg.)
Rig.Ratio
Rot.Ratio
Mom.(kN.m)
Rot.(Deg.)
Rig.Ratio
Rot.Ratio
Al 7x10 10.0 1.00 0.14 0.83 15.0 1.9 0.21 0.79A2 10x10 15.0 0.90 0.21 0.75 23.0 1.7 0.33 0.71A3 10x7 17.0 0.85 0.24 0.71 23.0 1.7 0.33 0.71A4 4x2 4.0 1.15 0.06 0.96 7.00 2.2 0.10 0.90AS 8circw 7.0 1.10 0.10 0.92 15.0 1.9 0.21 0.79A6 8cirst 7.0 1.10 0.10 0.92 13.0 1.9 0.19 0.79B1 4x2 5.0 1.15 0.07 0.96 9.00 2.1 0.13 0.88C 1 10x7 13.0 1.00 0.19 0.83 22.0 1.6 0.31 0.67C2 10x7 17.0 0.85 0.24 0.71 27.0 1.5 0.39 0.63C3 10x7 18.0 0.85 0.26 0.71 27.0 1.5 0.39 0.63C4 5x4 14.0 0.95 0.20 0.80 21.0 1.6 0.30 0.67
77
APPENDIX B
SAMPLE CALCULATIONS OF MOMENTCONNECTIONS' RESISTANCE
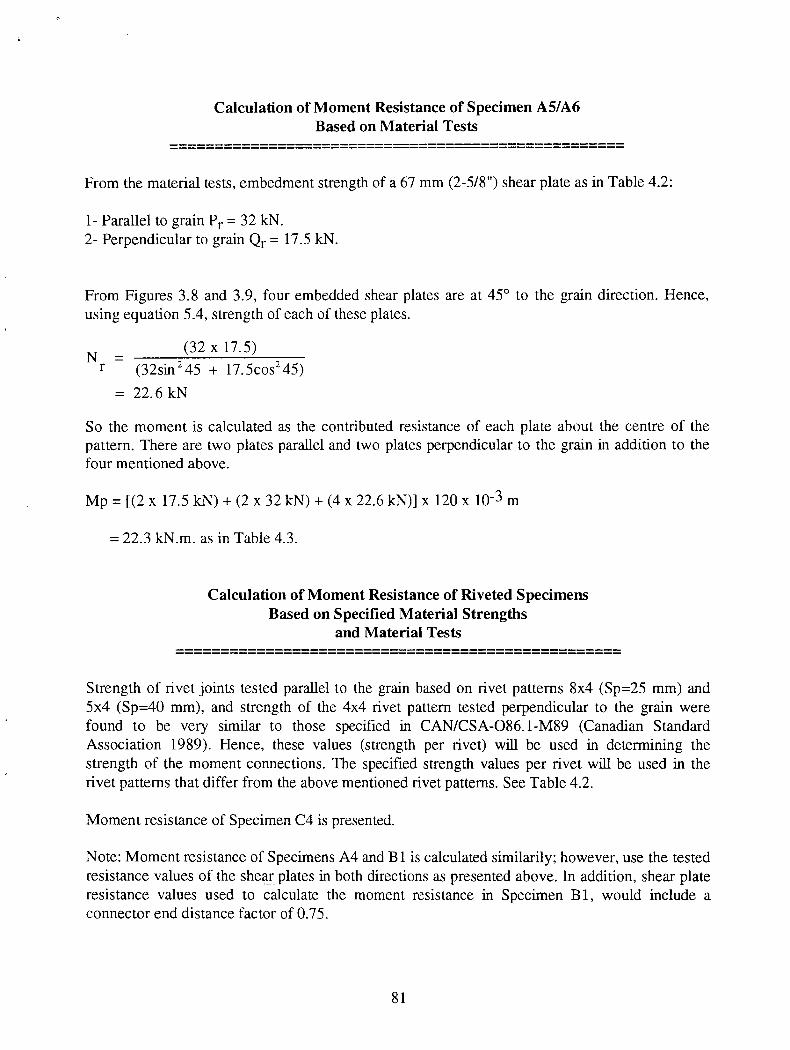
Calculation of Moment Resistance of Specimen A5/A6Based on Material Tests
From the material tests, embedment strength of a 67 mm (2-5/8") shear plate as in Table 4.2:
Parallel to grain Pr = 32 kN.Perpendicular to grain Qr = 17.5 kN.
From Figures 3.8 and 3.9, four embedded shear plates are at 45° to the grain direction. Hence,using equation 5.4, strength of each of these plates.
N =(32 x 17.5)
r (32sin 2 45 + 17.5cos245)
= 22.6 kN
So the moment is calculated as the contributed resistance of each plate about the centre of thepattern. There are two plates parallel and two plates perpendicular to the grain in addition to thefour mentioned above.
Mp = [(2 x 17.5 kN) + (2 x 32 kN) + (4 x 22.6 kN)] x 120 x 10-3m
= 22.3 kN.m. as in Table 4.3.
Calculation of Moment Resistance of Riveted SpecimensBased on Specified Material Strengths
and Material Tests
Strength of rivet joints tested parallel to the grain based on rivet patterns 8x4 (Sp=25 mm) and5x4 (Sp=40 mm), and strength of the 4x4 rivet pattern tested perpendicular to the grain werefound to be very similar to those specified in CAN/CSA-086.1-M89 (Canadian StandardAssociation 1989). Hence, these values (strength per rivet) will be used in determining thestrength of the moment connections. The specified strength values per rivet will be used in therivet patterns that differ from the above mentioned rivet patterns. See Table 4.2.
Moment resistance of Specimen C4 is presented.
Note: Moment resistance of Specimens A4 and B1 is calculated similarily; however, use the testedresistance values of the shear plates in both directions as presented above. In addition, shear plateresistance values used to calculate the moment resistance in Specimen B 1, would include aconnector end distance factor of 0.75.
81
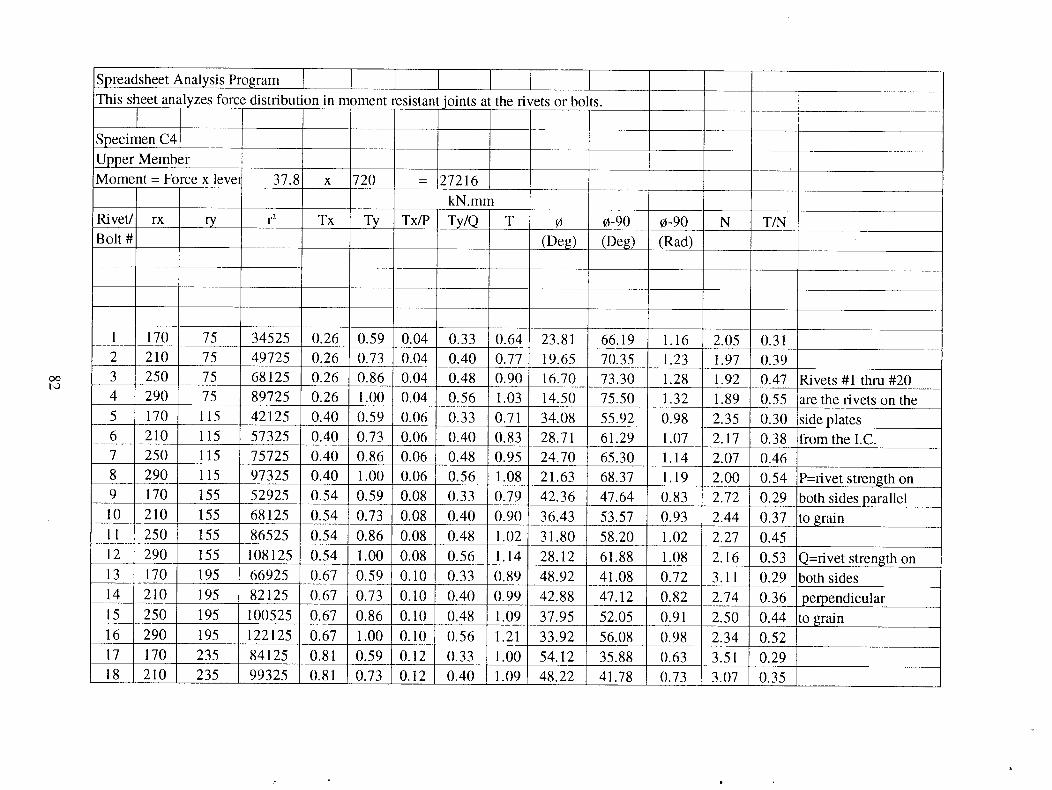
Spreadsheet Analysis Program
This sheet analyzes force distribution in moment resistant joints at the rivets or bolts.
Specimen C4Upper MemberMoment = Force x lever 37.8 x 720 = 27216
kN.mmRivet/ rx rY r2 Tx Ty Tx/P Ty/Q T 0 0-90 0-90 N T/NBolt # (Deg) (Deg) (Rad)
1 170 75 34525 0.26 0.59 0.04 0.33 0.64 23.81 66.19 1.16 2.05 0.312 210 75 49725 0.26 0.73 0.04 0.40 0.77 19.65 70.35 1.23 1.97 0.393 250 75 68125 0.26 0.86 0.04 0.48 0.90 16.70 73.30 1.28 1.92 0.47 Rivets #1 thru #204 290 75 89725 0.26 1.00 0.04 0.56 1.03 14.50 75.50 1.32 1.89 0.55 are the rivets on the5 170 115 42125 0.40 0.59 0.06 0.33 0.71 34.08 55.92 0.98 2.35 0.30 side plates6 210 115 57325 0.40 0.73 0.06 0.40 0.83 28.71 61.29 1.07 2.17 0.38 from the I.C.
7 250 115 75725 0.40 0.86 0.06 0.48 0.95 24.70 65.30 1.14 2.07 0.468 290 115 97325 0.40 1.00 0.06 0.56 1.08 21.63 68.37 1.19 2.00 0.54 P=rivet strength on9 170 155 52925 0.54 0.59 0.08 0.33 0.79 42.36 47.64 0.83 2.72 0.29 both sides parallel10 210 155 68125 0.54 0.73 0.08 0.40 0.90 36.43 53.57 0.93 2.44 0.37 to grain11 250 155 86525 0.54 0.86 0.08 0.48 1.02 31.80 58.20 1.02 2.27 0.4512 290 155 108125 0.54 1.00 0.08 0.56 1.14 28.12 61.88 1.08 2.16 0.53 Q=rivet strength on13 170 195 66925 0.67 0.59 0.10 0.33 0.89 48.92 41.08 0.72 3.11 0.29 both sides14 210 195 82125 0.67 0.73 0.10 0.40 0.99 42.88 47.12 0.82 2.74 0.36 perpendicular15 250 195 100525 0.67 0.86 0.10 0.48 1.09 37.95 52.05 0.91 2.50 0.44 to grain16 290 195 122125 0.67 1.00 0.10 0.56 1.21 33.92 56.08 0.98 2.34 0.5217 170 235 84125 0.81 0.59 0.12 0.33 1.00 54.12 35.88 0.63 3.51 0.2918 210 235 99325 0.81 0.73 0.12 0.40 1.09 48.22 41.78 0.73 3.07 0.35
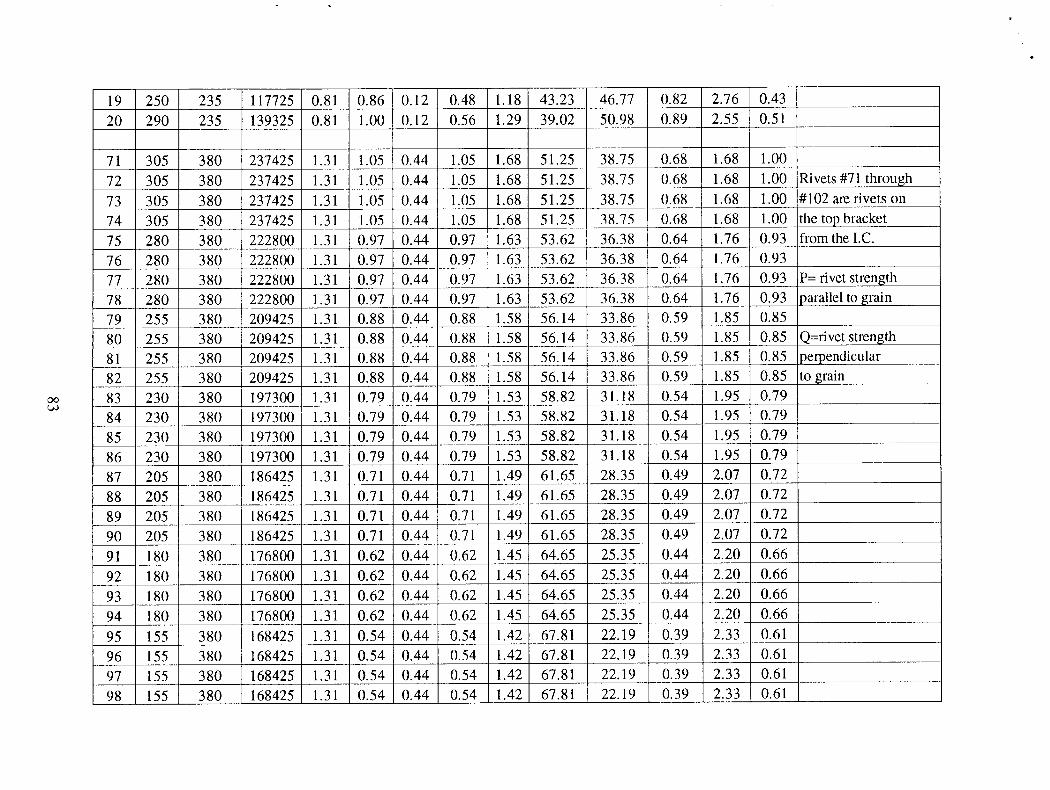
19 250 235 117725 0.81 0.86 0.12 0.48 1.18 43.23 46.77 0.82 2.76 0.43
20 290 235 139325 0.81 1.00 0.12 0.56 1.29 39.02 50.98 0.89 2.55 0.51
71 305 380 237425 1.31 1.05 0.44 1.05 1.68 51.25 38.75 0.68 1.68 1.00
72 305 380 237425 1.31 1.05 0.44 1.05 1.68 51.25 38.75 0.68 1.68 1.00 Rivets #71 through
73 305 380 237425 1.31 1.05 0.44 1.05 1.68 51.25 38.75 0.68 1.68 1.00 #102 are rivets on
74 305 380 237425 1.31 1.05 0.44 1.05 1.68 51.25 38.75 0.68 1.68 1.00 the top bracket
75 280 380 222800 1.31 0.97 0.44 0.97 1.63 53.62 36.38 0.64 1.76 0.93 from the I.C.
76 280 380 222800 1.31 0.97 0.44 0.97 1.63 53.62 36.38 0.64 1.76 0.93
77 280 380 222800 1.31 0.97 0.44 0.97 1.63 53.62 36.38 0.64 1.76 0.93 P= rivet strength parallel to grain78 280 380 222800 1.31 0.97 0.44 0.97 1.63 53.62 36.38 0.64 1.76 0.93
79 255 380 209425 1.31 0.88 0.44 0.88 1.58 56.14 33.86 0.59 1.85 0.85
80 255 380 209425 1.31 0.88 0.44 0.88 1.58 56.14 33.86 0.59 1.85 0.85 Q=rivet strength
81 255 380 209425 1.31 0.88 0.44 0.88 1.58 56.14 33.86 0.59 1.85 0.85 perpendicularto grain82 255 380 209425 1.31 0.88 0.44 0.88 1.58 56.14 33.86 0.59 1.85 0.85
83 230 380 197300 1.31 0.79 0.44 0.79 1.53 58.82 31.18 0.54 1.95 0.79
84 230 380 197300 1.31 0.79 0.44 0.79 1.53 58.82 31.18 0.54 1.95 0.79
85 230 380 197300 1.31 0.79 0.44 0.79 1.53 58.82 31.18 0.54 1.95 0.79
86 230 380 197300 1.31 0.79 0.44 0.79 1.53 58.82 31.18 0.54 1.95 0.79
87 205 380 186425 1.31 0.71 0.44 0.71 1.49 61.65 28.35 0.49 2.07 0.72
88 205 380 186425 1.31 0.71 0.44 0.71 1.49 61.65 28.35 0.49 2.07 0.72
89 205 380 186425 1.31 0.71 0.44 0.71 1.49 61.65 28.35 0.49 2.07 0.72
90 205 380 186425 1.31 0.71 0.44 0.71 1.49 61.65 28.35 0.49 2.07 0.72
91 180 380 176800 1.31 0.62 0.44 0.62 1.45 64.65 25.35 0.44 2.20 0.66
92 180 380 176800 1.31 0.62 0.44 0.62 1.45 64.65 25.35 0.44 2.20 0.66
93 180 380 176800 1.31 0.62 0.44 0.62 1.45 64.65 25.35 0.44 2.20 0.66
94 180 380 176800 1.31 0.62 0.44 0.62 1.45 64.65 25.35 0.44 2.20 0.66
95 155 380 168425 1.31 0.54 0.44 0.54 1.42 67.81 22.19 0.39 2.33 0.61
96 155 380 168425 1.31 0.54 0.44 0.54 1.42 67.81 22.19 0.39 2.33 0.61
97 155 380 168425 1.31 0.54 0.44 0.54 1.42 67.81 22.19 0.39 2.33 0.61
98 155 380 168425 1.31 0.54 0.44 0.54 1.42 67.81 22.19 0.39 2.33 0.61
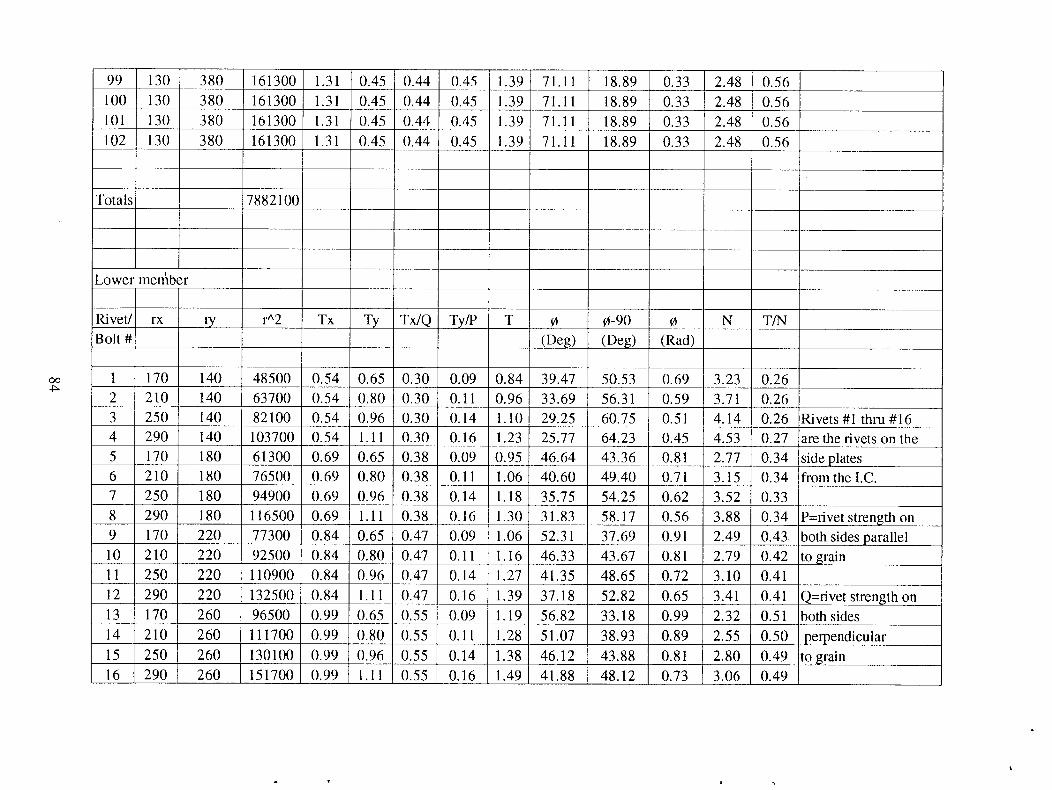
99 130 380 161300 1.31 0.45 0.44 0.45 1.39 71.11 18.89 0.33 2.48 0.56100 130 380 161300 1.31 0.45 0.44 0.45 1.39 71.11 18.89 0.33 2.48 0.56101 130 380 161300 1.31 0.45 0.44 0.45 1.39 71.11 18.89 0.33 2.48 0.56102 130 380 161300 1.31 0.45 0.44 0.45 1.39 71.11 18.89 0.33 2.48 0.56
Totals 7882100
Lower member
Rivet/ rx ry 14'2 Tx Ty Tx/Q Ty/P T 0 0-90 0 N T/NBolt # (Deg) (Deg) (Rad)
1 170 140 48500 0.54 0.65 0.30 0.09 0.84 39.47 50.53 0.69 3.23 0.262 210 140 63700 0.54 0.80 0.30 0.11 0.96 33.69 56.31 0.59 3.71 0.263 250 140 82100 0.54 0.96 0.30 0.14 1.10 29.25 60.75 0.51 4.14 0.26 Rivets #1 thru #164 290 140 103700 0.54 1.11 0.30 0.16 1.23 25.77 64.23 0.45 4.53 0.27 are the rivets on the5 170 180 61300 0.69 0.65 0.38 0.09 0.95 46.64 43.36 0.81 2.77 0.34 side plates6 210 180 76500 0.69 0.80 0.38 0.11 1.06 40.60 49.40 0.71 3.15 0.34 from the I.C.7 250 180 94900 0.69 0.96 0.38 0.14 1.18 35.75 54.25 0.62 3.52 0.338 290 180 116500 0.69 1.11 0.38 0.16 1.30 31.83 58.17 0.56 3.88 0.34 P=rivet strength on9 170 220 77300 0.84 0.65 0.47 0.09 1.06 52.31 37.69 0.91 2.49 0.43 both sides parallel10 210 220 92500 0.84 0.80 0.47 0.11 1.16 46.33 43.67 0.81 2.79 0.42 to grain11 250 220 110900 0.84 0.96 0.47 0.14 1.27 41.35 48.65 0.72 3.10 0.4112 290 220 132500 0.84 1.11 0.47 0.16 1.39 37.18 52.82 0.65 3.41 0.41 Q=rivet strength on13 170 260 96500 0.99 0.65 0.55 0.09 1.19 56.82 33.18 0.99 2.32 0.51 both sides14 210 260 111700 0.99 0.80 0.55 0.11 1.28 51.07 38.93 0.89 2.55 0.50 perpendicular15 250 260 130100 0.99 0.96 0.55 0.14 1.38 46.12 43.88 0.81 2.80 0.49 to grain16 290 260 151700 0.99 1.11 0.55 0.16 1.49 41.88 48.12 0.73 3.06 0.49
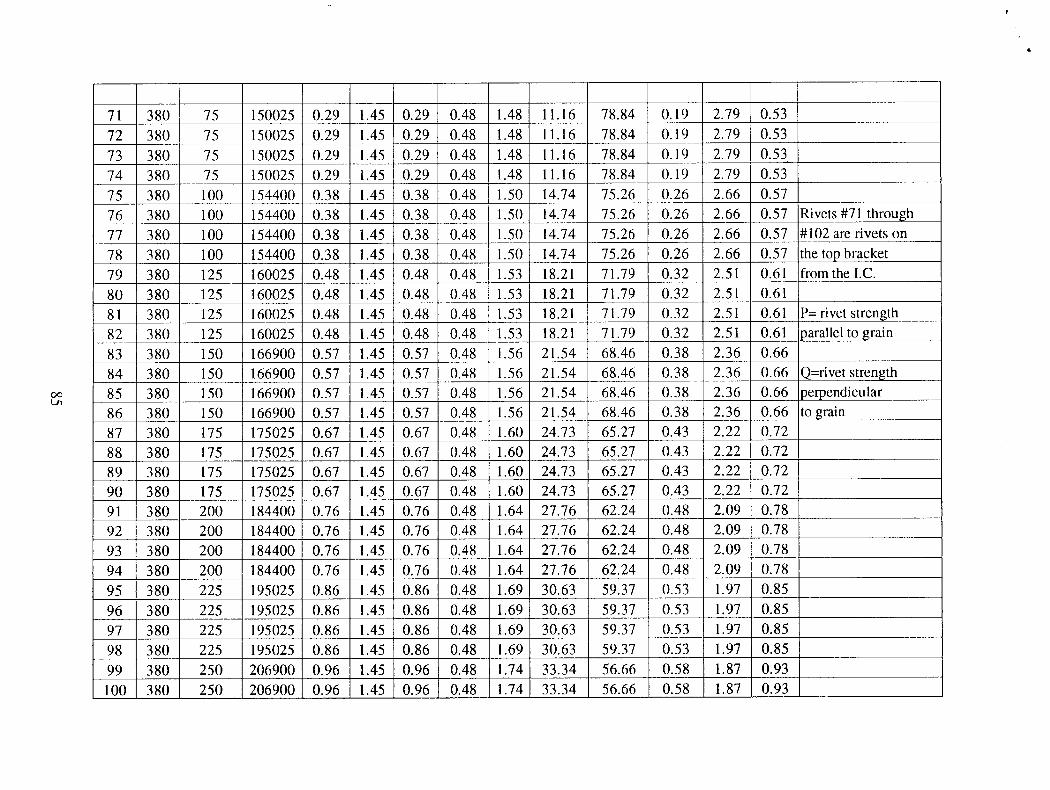
71 380 75 150025 0.29 1.45 0.29 0.48 1.48 11.16 78.84 0.19 2.79 0.53
72 380 75 150025 0.29 1.45 0.29 0.48 1.48 11.16 78.84 0.19 2.79 0.53
73 380 75 150025 0.29 1.45 0.29 0.48 1.48 11.16 78.84 0.19 2.79 0.53
74 380 75 150025 0.29 1.45 0.29 0.48 1.48 11.16 78.84 0.19 2.79 0.53
75 380 100 154400 0.38 1.45 0.38 0.48 1.50 14.74 75.26 0.26 2.66 0.57
76 380 100 154400 0.38 1.45 0.38 0.48 1.50 14.74 75.26 0.26 2.66 0.57 Rivets #71 through
77 380 100 154400 0.38 1.45 0.38 0.48 1.50 14.74 75.26 0.26 2.66 0.57 #102 are rivets on
78 380 100 154400 0.38 1.45 0.38 0.48 1.50 14.74 75.26 0.26 2.66 0.57 the top bracket
79 380 125 160025 0.48 1.45 0.48 0.48 1.53 18.21 71.79 0.32 2.51 0.61 from the I.C.
80 380 125 160025 0.48 1.45 0.48 0.48 1.53 18.21 71.79 0.32 2.51 0.61
81 380 125 160025 0.48 1.45 0.48 0.48 1.53 18.21 71.79 0.32 2.51 0.61 P= rivet strength
82 380 125 160025 0.48 1.45 0.48 0.48 1.53 18.21 71.79 0.32 2.51 0.61 parallel to grain
83 380 150 166900 0.57 1.45 0.57 0.48 1.56 21.54 68.46 0.38 2.36 0.66
84 380 150 166900 0.57 1.45 0.57 0.48 1.56 21.54 68.46 0.38 2.36 0.66 Q=rivet strength
85 380 150 166900 0.57 1.45 0.57 0.48 1.56 21.54 68.46 0.38 2.36 0.66 perpendicular
86 380 150 166900 0.57 1.45 0.57 0.48 1.56 21.54 68.46 0.38 2.36 0.66 to grain
87 380 175 175025 0.67 1.45 0.67 0.48 1.60 24.73 65.27 0.43 2.22 0.72
88 380 175 175025 0.67 1.45 0.67 0.48 1.60 24.73 65.27 0.43 2.22 0.72
89 380 175 175025 0.67 1.45 0.67 0.48 1.60 24.73 65.27 0.43 2.22 0.72
90 380 175 175025 0.67 1.45 0.67 0.48 1.60 24.73 65.27 0.43 2.22 0.72
91 380 200 184400 0.76 1.45 0.76 0.48 1.64 27.76 62.24 0.48 2.09 0.78
92 380 200 184400 0.76 1.45 0.76 0.48 1.64 27.76 62.24 0.48 2.09 0.78
93 380 200 184400 0.76 1.45 0.76 0.48 1.64 27.76 62.24 0.48 2.09 0.78
94 380 200 184400 0.76 1.45 0.76 0.48 1.64 27.76 62.24 0.48 2.09 0.78
95 380 225 195025 0.86 1.45 0.86 0.48 1.69 30.63 59.37 0.53 1.97 0.85
96 380 225 195025 0.86 1.45 0.86 0.48 1.69 30.63 59.37 0.53 1.97 0.85
97 380 225 195025 0.86 1.45 0.86 0.48 1.69 30.63 59.37 0.53 1.97 0.85
98 380 225 195025 0.86 1.45 0.86 0.48 1.69 30.63 59.37 0.53 1.97 0.85
99 380 250 206900 0.96 1.45 0.96 0.48 1.74 33.34 56.66 0.58 1.87 0.93
100 380 250 206900 0.96 1.45 0.96 0.48 1.74 33.34 56.66 0.58 1.87 0.93
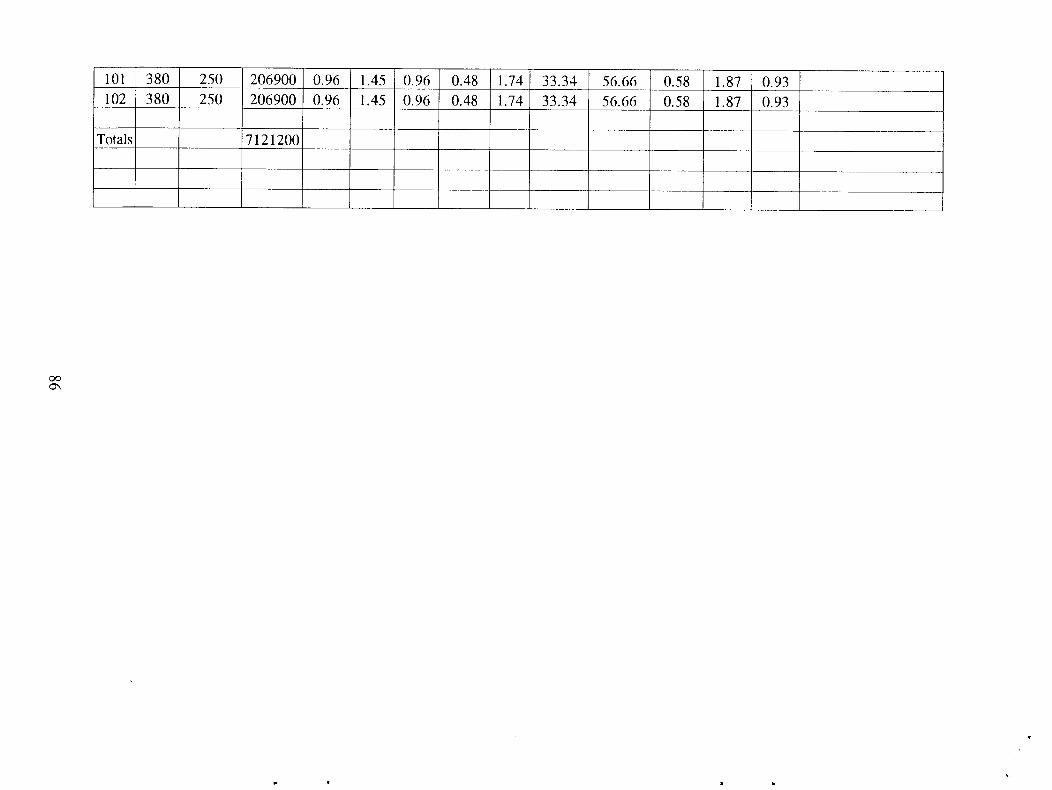
101 380 250 206900 0.96 1.45 0.96 0.48 1.74 33.34 56.66 0.58 1.87 0.93102 380 250 206900 0.96 1.45 0.96 0.48 1.74 33.34 56.66 0.58 1.87 0.93
Totals 7121200