development of fuel briquette from palm oil mill waste
TRANSCRIPT

Development of Fuel Briquette from Palm Oil Mill Waste Mixed with Other
Biomass Fuels
By
Muhamad Faisal bin Ali
Dissertation submitted in partial fulfillment of
the requirements for the
Bachelor of Engineering (Hons)
(Mechanical Engineering)
MAY 2012
Universiti Teknologi PETRONAS
Bandar Seri Iskandar
31750 Tronoh
Perak Darul Ridzuan

i
CERTIFICATION OF APPROVAL
Development of Fuel Briquette from Palm Oil Mill Waste Mixed with Other
Biomass Fuels
By
Muhamad Faisal bin Ali
A project dissertation submitted to the
Mechanical Engineering Programme
Universiti Teknologi PETRONAS
in partial fulfillment of the requirement for the
BACHELOR OF ENGINEERING (Hons)
(MECHANICAL ENGINEERING)
Approved by,
_____________________
(Dr. Suhaimi bin Hassan)
UNIVERSITI TEKNOLOGI PETRONAS
TRONOH, PERAK
MAY 2012

ii
CERTIFICATION OF ORIGINALITY
This is to certify that I am responsible for the work submitted in this project, that the
original work is my own except as specified in the references and
acknowledgements, and that the original work contained herein have not been
undertaken or done by unspecified sources or persons.
____________________________
MUHAMAD FAISAL BIN ALI

iii
ABSTRACT
Palm oil is extracted from the fresh fruit bunch (FFB) by using mechanical process,
where a mill commonly handles 60 to 100 mt per hour of FFB. The modern palm oil
mill is based on concepts developed in the early 50’s. An average size of FFB
weights is about 20-30 kg and contains about 1000-2000 fruits. They are harvested
based on harvesting cycles, and delivered to the mills on the same day. The proper
handling of FFB will determine the quality of crude palm oil.
The products generates from palm oil mill are crude palm oil and kernels, as primary
product and biomass as secondary product. A typical mill has many operation units.
This comprises of sterilization, stripping, digestion and pressing, clarification,
purification, drying and storage. Palm oil industry generates vast amount of palm
biomass. Converting palm biomass into a solid fuel through briquetting process
should be attractive in upgrading its properties and add value. The major by products
produced by the production of crude palm oil (CPO) are palm oil mill effluent
(POME), empty fruit branch (EFB), palm kernel shell and mesocarp fibre. Mostly,
this biomass, especially EFB, palm kernel shell and mesocarp fibres are utilized as
fuel in the mill [1].
Realizing the potential of EFB to generate fuel, briquettes will produced by mixing
the EFB with rice husk and coconut shell. Their physical and chemical properties,
mechanical strength and burning characteristics will be analysed. In this research, the
author will study the characteristics of these biomasses and their potential to yield
biomass energy [1].

iv
ACKNOLEDGEMENT
First of all I would like to thank my UTP Supervisor for my Final Year Project, Dr.
Suhaimi bin Hassan for all the guidance and advices throughout the duration of
completing my Final Year Project. Without his encouragements and motivations, I
would not be able to complete my project on time. His high demands and
expectations drove me into producing the outcome and fulfilling the objectives of my
project.
Secondly, I would like show my warmest gratitude to the Final Year Research
Project Coordinator for Mechanical Engineering Department, Mr. Mohd Faizairi bin
Mohd Nor & Dr. Hasan Fawad for providing together with all the general
information and sufficient reminder to make sure the author complete the project as
scheduled.
Lastly, I would like to thank to all individuals who helped the author in any way, but
whose name is not mentioned here.
Here, I would also want to express a special thanks my university, Universiti
Teknologi Petronas for introducing Final Year Project I and Final Year Project II for
two semesters which had taught me a lot ranging from technical knowledge, soft-
skills and also communication skills. With the skills learned in the university, hard
work and self-determination, I managed to overcome the challenges and it was truly
a bitter sweet memory.

v
TABLE OF CONTENTS
CERTICICATION OF APPROVAL i
CERTIFICATION OF ORIGINALITY ii
ABSTRACT iii
ACKNOLEDGEMENT iv
LIST OF FIGURES vii
LIST OF TABLES viii
ABBREVIATIONS ix
CHAPTER 1 INTRODUCTION
1.1. Background of study 1
1.2. Problem Statements 2
1.3. Objectives and Scope of Study 3
1.4. Feasibility of the Project 3
CHAPTER 2 LITERATURE REVIEW
2.1: Production of Fresh Fruit Bunches (FFB) 5
2.2: Production of Crude Palm Oil 5
2.3: EFB as Fuel for Renewable Energy 8
Power Generation
2.4: Conversion of EFB into Fertilizer 9
2.5: Rice Husk as the Alternative Source of 10
Energy
2.6: Coconut Shell as the Alternative Source 12
of Energy
CHAPTER 3 METHODOLOGY
3.1. Process of Develop Biomass Briquette 11
3.2 Equipment Needs for Research 15
3.3 Feasibility of Plan 16
3.4 Gantt Chart & Key Milestone for FYP I 17
3.5 Gantt Chart & Key Milestone for FYP II 18

vi
CHAPTER 4 RESULTS & DISCUSSIONS
4.1 Sample Preparation 19
4.2 Study of Sample’s Element Content 22
4.3 Production of Briquette 27
4.4 Calorific Value Test 28
4.5 Burning Test 31
4.6 Drop Test 33
4.7 Immerse Test 39
CHAPTER 5 CONCLUSIONS & RECOMMENDATIONS 42
REFERENCES 44
APPENDICES 47

vii
LIST OF FIGURES
Figure 1 Processes in the Production of Fresh Fruit Bunches
4
Figure 2 Crude Palm Oil Milling Process 6
Figure 3 Process of develop biomass briquette 11
Figure 4 A typical briquette for this project. 13
Figure 5 Oven 15
Figure 6 Grinder 15
Figure 7 Autopallet press machine 15
Figure 8 CHNS machine 15
Figure 9 Bomb calorimeter 15
Figure 10 Graph of Initial Weight & Final Weight of Samples 20
Figure 11 Graph of Experimental vs. Theoretical Moisture Content (%) 21
Figure 12 Element content of EFB 25
Figure 13 Element content of 75:25 EFB to rice husk 26
Figure 14 Element content of 75:25 EFB to coconut shell. 26
Figure 15 Element content of 50:25:25 EFB to rice husk to coconut shell. 26
Figure 16 Calorific value of 100% EFB, rice husk and coconut shell. 29
Figure 17 Calorific value of EFB to rice husk. 29
Figure 18 Calorific value of EFB to coconut shell. 30
Figure 19 Calorific Value of EFB to rice husk to coconut shell. 30
Figure 20 Time graph of 100% EFB, rice husk and coconut shell. 32
Figure 21 Time graph of EFB to rice husk. 32
Figure 22 Time graph of EFB to coconut shell. 33
Figure 23 Time graph of EFB to rice husk to coconut shell. 33

viii
LIST OF TABLES
Table 1 Biomass samples used and their physical properties 3
Table 2 Nutrient content of EFB 9
Table 3 Element composition of rice husk sample 11
Table 4 Heating value of selected coal 11
Table 5 XRF analysis of coconut shell ash 12
Table 6 The initial weight, final weight & moisture content of the
samples
20
Table 7 Experimental moisture content and theoretical moisture content 21
Table 8 Percentage difference of moisture content (%) 22
Table 9 The Carbon content (%) in the samples. 24
Table 10 The Hydrogen content (%) in the samples. 24
Table 11 The Nitrogen content (%) in the samples. 25
Table 12 The Sulphur content (%) in the samples. 25
Table 13 The weight of briquettes produced. 27
Table 14 The height of briquettes produced. 28
Table 15 The ignitibility time, time taken to burn to ash and ash content of
samples.
31
Table 16 The results of drop test. 35
Table 17 The results of immerse test. 40
LIST OF APPENDICES
Appendix 1 Ratio quantity of EFB, coconut shell and rice husk in the
briquettes.
46
Appendix 2 The density of briquettes produced. 46
Appendix 3 Calorific value of samples. 47

ix
ABBREVIATIONS
CHNS Carbon, Hydrogen, Nitrogen and Sulphur
XRF X-Ray Fluorescence
CPO Crude Palm Oil
CV Calorific Value
EFB Empty Fruit Bunch
FFB Fresh Fruit Bunch
POME Palm Oil Mill Effluent
FASC First American Scientific Corporation
GHG Green House Gas
RE Renewable Energy
CIRP Christmas Island Rock Phosphate
MOP Muriate of Potash
E Empty Fruit Bunch (EFB)
R Rice Husk
C Coconut Shell
1
CHAPTER 1
INTRODUCTION
1.1 Project Background
Malaysian palm oil industry has grown up tremendously over the last four decades.
Since then, Malaysia has succeeded to maintain its position as among the world’s
premier palm oil production country. However, this industry also generated vast
quantities of palm biomass, mainly from milling and crushing palm kernel. In order
to reduce the quantity of industry waste as well as maximize the usage of biomass,
producing biomass briquettes is one of the appropriate solutions.
Biomass briquetting is the densification of loose biomass material to produce
compact solid composites of different sizes with the application of pressure.
Briquetting is conducted with the application of pressure, heat and binding agent on
the loose materials to yield the briquettes. In order to discover the benefits of
briquettes, the several facts below can be referred:
i) This is one of the alternative methods to save the consumption and
dependency on fuel wood.
ii) They are easy to handle, transport and store.
iii) They are uniform in size and quality.
iv) This process helps to solve residual disposal problem.
v) Fuel wood and deforestation can be reduced.
vi) Indoor air pollution id decreased.

2
1.2 Problem Statement
While extracting crude palm oil (CPO) from the fresh fruit bunch (FFB), it will
generates large amount of wastes, for example empty fruit bunch (EFB) (23%),
mesocarp fibre (12%), shell (5%) and palm oil mill effluent (POME) (60%) for every
tonne of FFB processed in the mills [2]. For every tonne of palm oil produced from
fresh fruit bunches, a farmer harvests around 6 tonnes of waste palm fronds, 1 tonne
of palm trunks, 5 tonnes of empty fruit bunches (EFB), 1 tonne of press fiber (from
the mesocarp of the fruit), half a tonne of palm kernel endocarp, 250 kg of palm
kernel press cake, and 100 tonnes of palm oil mill effluent (POME) [3].
EFB contains high amount of nutrients. In the past, the EFB are burnt to produce ash,
which used as fertilizer. But, the burning of EFB leads to the environmental issues
such as air pollution. It is reported that one of the major sources of Green House Gas
(GHG) in Malaysia has been contributed from the palm oil mill wastewater treatment
system [4].
EFB is one of the palm oil wastes than can be used for producing biomass briquette.
However, it has high moisture content and this will reduce the burning efficiency.
EFB has the moisture of 57.2% and this will decrease the calorific value. The
physical properties of EFB and the other samples can be referred in the Table 1.

3
Table 1: Biomass samples used and their physical properties [5]
1.3 Objective & Scope of Study
The scope of this study will be focusing on the study of the EFB, rice husk and
coconut shell characteristics and their potential of producing biomass energy by
mixing the biomasses with different rate of ratio.
The objectives of this project are:
i) To study the characteristics of EFB, rice husk and coconut shell.
ii) To develop biomass briquette from the combination of EFB with rice husk or
coconut shell or both biomasses.
iii) To study the performance of biomass briquette by conducting several tests
and experiments.
1.4 Feasibility of the Project
The research is a zero cost research whereby the samples are collected from a palm
oil mill, rice factory and coconut processing centre which are near to the university.
However, several equipment required to be purchased to carry out the experimental
works as they are unavailable in the university. The research will be carried out
according to the planning and allocated time frame by the following Gantt chart in
page 22 and 23.
Calorific
value HHV
MJ/kg
Elementary and ash analysis (wt%) using
dried sample
Biomass Moisture
(%)
Wet Dry C H N S O Ash
EFB 57.2 10.57 17.02 45.53 5.46 0.45 0.044 43.40 5.12
Mesocarp
Fibre 37.2 13.33 19.61 46.92 5.89 1.12 0.089 42.66 3.32
Kernel
shell 21.4 16.14 19.78 46.68 6.86 1.01 0.060 42.01 4.38

4
CHAPTER 2
LITERATURE REVIEW
2.1 Production of Fresh Fruit Bunches (FFB)
The key sub-processes involved in the development of plantations for the production
of fresh fruit bunches (FFB) are shown in Figure 1 and the main activities for each
step are summarized below:
Figure 1: Processes in the production of Fresh Fruit Bunches [6]
2.2 Production of Crude Palm Oil
After harvesting, it is important that the FFB are processed quickly. It is done to
prevent a rapid rise in free fatty acids (FFA) which could adversely affect the quality

5
of the CPO. Palm oil mills are generally located in the plantations to facilitate timely
transportation and effective processing of FFB. The palm oil milling process
involves the physical extraction of palm products namely, crude palm oil and palm
kernel from the FFB. The process begins with sterilization of the FFB. The fruit
bunches are steamed in pressurized vessels up to 3 bars to arrest the formation of free
fatty acids and prepare the fruits for subsequent sub-processes.
The sterilized bunches are then stripped of the fruitlets in a rotating drum thresher.
The stripped bunches or EFB are transported to the plantation for mulching while the
fruitlets are conveyed to the press digesters. In the digesters, the fruits are heated
using live steam and continuously stirred to loosen the oil-bearing mesocarp from the
nuts as well as to break open the oil cells present in the mesocarp. The digested mash
is then pressed, extracting the oil by means of screw presses. The press cake is then
conveyed to the kernel plant where the kernels are recovered.
The oil from the press is diluted and pumped to vertical clarifier tanks. The clarified
oil is then fed to purifiers to remove dirt and moisture before being dried further in
the vacuum drier. The clean and dry oil is ready for storage and dispatch. The sludge
from the clarifier sediment is fed into bowl centrifuges for further oil recovery. The
recovered oil is recycled to the clarifiers while the water/sludge mixture which is
referred to as POME is treated in the effluent treatment plant (ETP). The press cake
is conveyed to the depericarper where the fibre and nuts are separated. Fibre is
burned as fuel in the boiler to generate steam. The nuts are cracked and the shell and
kernel are separated by means of a winnower and hydro-cyclone. The clean kernels
are dried prior to storage [6]. The Figure 4 shows the crude palm oil milling process
in the flow chart manner. This figure explains the clear information of this process.

6
Figure 2: Crude palm oil milling process [12]
2.3 EFB as Fuel for Renewable Energy Power Generation
EFB is becoming a popular source of fuel for renewable energy (RE) power
generation. The rapid depletion of fossil fuel and most developed nations are
pursuing the development of biomass as an alternative method of power generation.
Malaysia has a ready source of biomass in EFB conveniently collected and available
for exploitation in all palm oil mills. When convert the energy in the most efficient
manner, Malaysia is well on the way to this most important sustainable source of
energy for this century. The main achievement of using biomass-based RE power
generation is the reduction in greenhouse gas emissions (GHG).
In Sabah, large quantities of palm waste called EFB are available from plantations
where palm oil is produced. In its raw state, EFB is both very fibrous and wet. If it
could be dried, it would be an excellent fuel for power boilers. FASC Malaysia has
installed a KDS machine in the 14 MWe TSH Biomass Power Plant in Kunak,
Malaysia, for the purpose of drying EFB. Called the KDS MF-777, it dries and
shreds EFB so that it can be burned as a fuel. At present, only one-sixth of the fuel
input needed by the TSH power plant is supplied by the KDS MF-777. The KDS

7
MF-777 processes 3750 kg/hr of raw EFB having a moisture content of 52 % and
produces 3000 kg/hr of shredded EFB which has a moisture content of 40 % - this is
dry enough for burning on a grate. The power consumption of the MF-777 is only
200 kW, under these operating conditions. This translates to a drying energy
consumption of only 960 kJ per kg of water removal (= 414 BTU/lb) or only 44 % of
the latent heat of water! No other dryer technology can match the low energy
consumption of the KDS MF-777. It is well-known among power plant engineers
that every percentage point of moisture in the fuel causes 0.5-1 % reduction in the
electricity produced. Thus, the estimated maximum possible increase in the TSH
power plant output because of drying the fuel in the KDS MF-777 is 0.84-1.68 MWe.
Thus, a net overall increase in the total power generated becomes possible due to the
KDS MF-777. Therefore, the cost of the KDS equipment can be recouped from the
extra revenue from the increased electricity production [11].
The Table 2 shows the nutrient content of EFB. Nitrogen, phosphorus, potassium,
magnesium and calcium are the example of the nutrient contained with small
percentage of composition.
Table 2: Nutrient content of EFB [9]
Nutrient Content of EFB
Composition as a percentage of dry matter
(%)
1 Nitrogen (N) 0.44
2 Phosphorous (P) 0.144
3 Potassium (K) 2.24
4 Magnesium (Mg) 0.36
5 Calcium (Ca) 0.36
2.4 Conversion of EFB into Fertilizer
In terms of fertilizer value, one tonne of EFB is equivalent 8 kg urea, 2.9 kg CIRP,
18.3 kg MOP and 4.7 kg kieserite. Besides being rich in plant nutrients, it also
improves soil physical and chemical properties in the following manner when used
as mulch [10].

8
i) Increases soil organic matter content.
ii) Improves soil structure.
iii) Increase infiltration and aeration.
iv) Reduces run-off.
v) Improves soil water retention.
vi) Increases soil fauna micro activity.
vii) Increases cation exchange capacity.
viii) Reduces soil temperature fluctuation.
2.5 Rice Husk as the Alternative Source of Energy
Rice husk, which accounts for 20% by weight of rice, comes from rice milling
process as by-product. Generally, a large amount of rice husk is dumped as waste
which results in waste disposal problem and methane emissions. Moreover, the low
density of rice husk can cause it to be air-borne easily resulting in breathing
problems, if inhaled. Rice husk can be converted to a useful form of energy to meet
the thermal and mechanical energy requirement for the mills themselves. This helps
minimize the waste problem in addition to converting rice husk to a renewable
energy resource. Due to the environmental and economic scenarios, the Thai
government has supported renewable energy production from indigenous sources.
One project that has been conducted under this support is a 10 MW pilot plant in
Roi-Et province, using rice husk as feedstock for water tube boiler type.
Approximately 255 tons of rice husks are supplied daily from the nearby rice mill
(located 2 km from the power plant) as the main source and others from 7 to 125 km.
The water supply (138 tons) is from the Shi river water and 24 MWh of electricity
are required for power production in one day. The maximum power production
capacity is 10.2 MW and the minimum is 6.5 MW, depending on raw materials
availability [8].
9
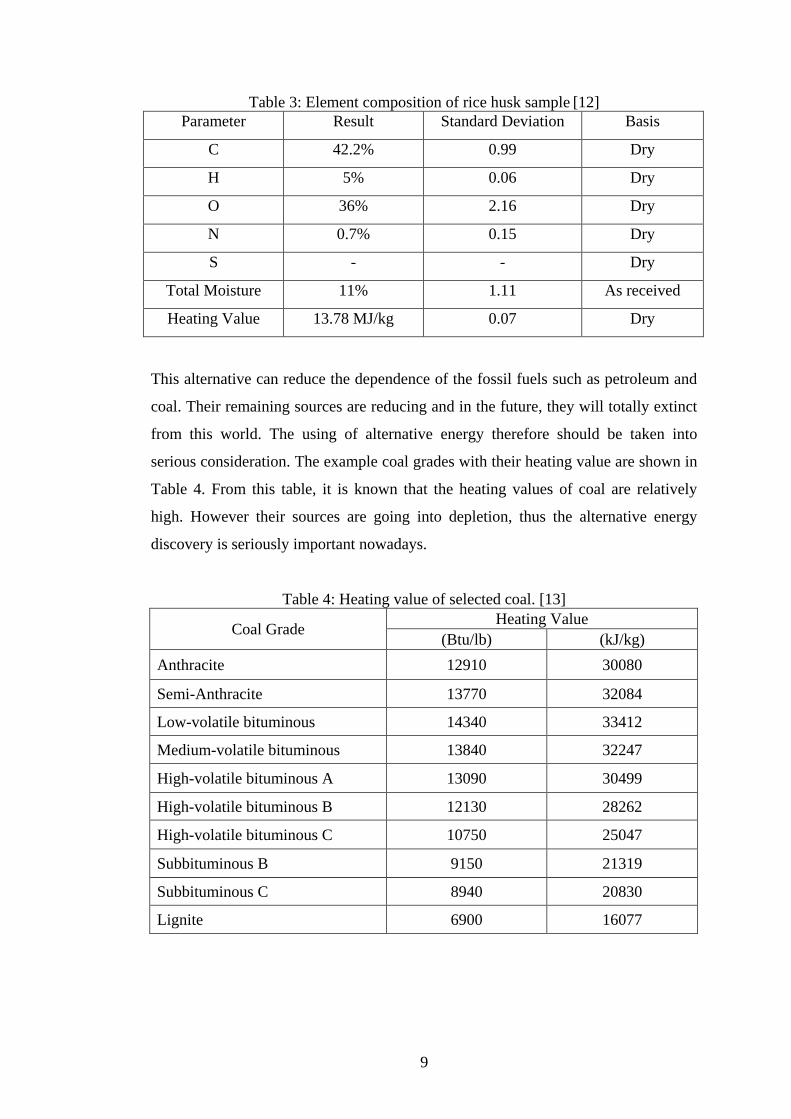
Table 3: Element composition of rice husk sample [12]
Parameter Result Standard Deviation Basis
C 42.2% 0.99 Dry
H 5% 0.06 Dry
O 36% 2.16 Dry
N 0.7% 0.15 Dry
S - - Dry
Total Moisture 11% 1.11 As received
Heating Value 13.78 MJ/kg 0.07 Dry
This alternative can reduce the dependence of the fossil fuels such as petroleum and
coal. Their remaining sources are reducing and in the future, they will totally extinct
from this world. The using of alternative energy therefore should be taken into
serious consideration. The example coal grades with their heating value are shown in
Table 4. From this table, it is known that the heating values of coal are relatively
high. However their sources are going into depletion, thus the alternative energy
discovery is seriously important nowadays.
Table 4: Heating value of selected coal. [13]
Coal Grade Heating Value
(Btu/lb) (kJ/kg)
Anthracite 12910 30080
Semi-Anthracite 13770 32084
Low-volatile bituminous 14340 33412
Medium-volatile bituminous 13840 32247
High-volatile bituminous A 13090 30499
High-volatile bituminous B 12130 28262
High-volatile bituminous C 10750 25047
Subbituminous B 9150 21319
Subbituminous C 8940 20830
Lignite 6900 16077
10
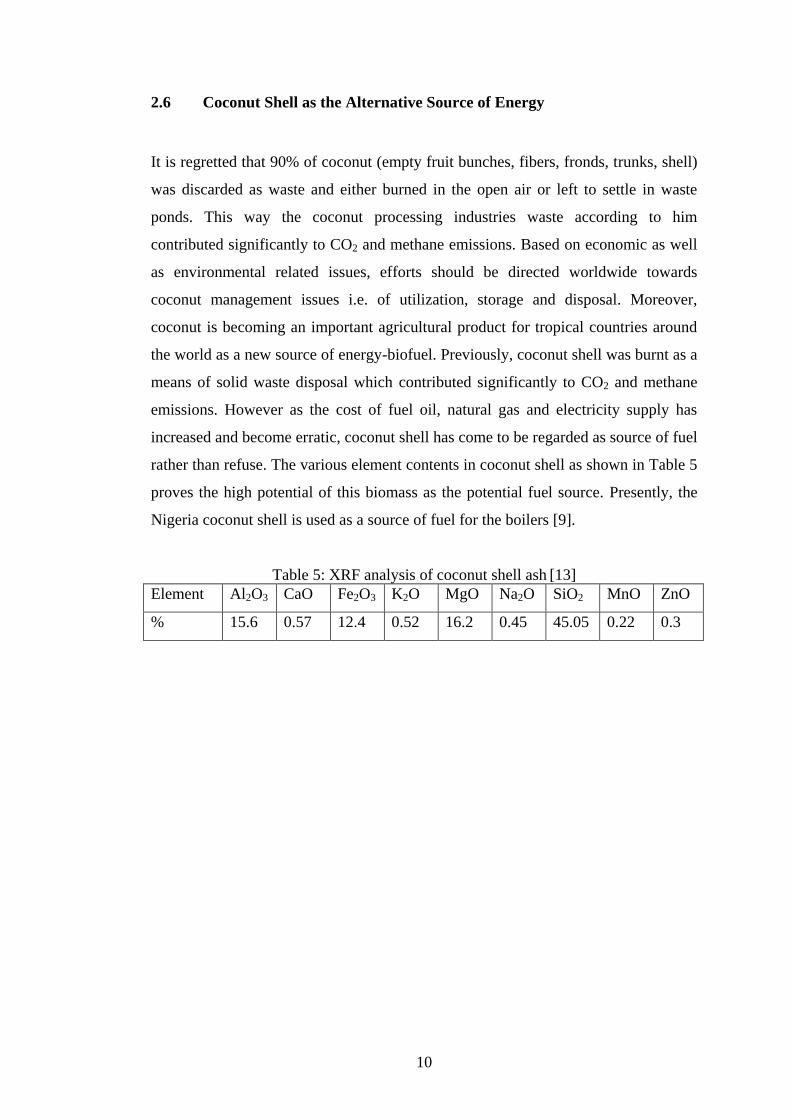
2.6 Coconut Shell as the Alternative Source of Energy
It is regretted that 90% of coconut (empty fruit bunches, fibers, fronds, trunks, shell)
was discarded as waste and either burned in the open air or left to settle in waste
ponds. This way the coconut processing industries waste according to him
contributed significantly to CO2 and methane emissions. Based on economic as well
as environmental related issues, efforts should be directed worldwide towards
coconut management issues i.e. of utilization, storage and disposal. Moreover,
coconut is becoming an important agricultural product for tropical countries around
the world as a new source of energy-biofuel. Previously, coconut shell was burnt as a
means of solid waste disposal which contributed significantly to CO2 and methane
emissions. However as the cost of fuel oil, natural gas and electricity supply has
increased and become erratic, coconut shell has come to be regarded as source of fuel
rather than refuse. The various element contents in coconut shell as shown in Table 5
proves the high potential of this biomass as the potential fuel source. Presently, the
Nigeria coconut shell is used as a source of fuel for the boilers [9].
Table 5: XRF analysis of coconut shell ash [13]
Element Al2O3 CaO Fe2O3 K2O MgO Na2O SiO2 MnO ZnO
% 15.6 0.57 12.4 0.52 16.2 0.45 45.05 0.22 0.3

11
CHAPTER 3
METHODOLOGY
This project research can be divided into nine main parts. They are sample
preparation, moisture removing, grinding, study of sample’s element content,
production of sample of briquettes, calorific value test, burning test and drop test.
Figure 3: Process of develop biomass briquette
3.1 Process of Develop Biomass Briquette
3.1.1 Sample Preparation
EFB, rice husk and coconut shell are collected from the suitable locations near to
UTP area. The high quality of samples should be chosen for the research to obtain
accurate result and produce good quality of briquettes.
Sample Preparation
Moisture Removing
Grinding Study of Sample’s Element Content
Production of Samples of Briquettes
Calorific Value Test Burning Test
Drop Test
Immerse Test

12
3.1.2 Moisture Removing
Part of the EFB, rice husk and coconut shell will be put in the oven to remove the
moisture content. The moisture content of the samples can be calculated by
subtracting the weight of samples (before entering the oven) with the new weight
(after removing the moisture content). The moisture content of the samples is
calculated by using the following equation and the calculation example is shown by
using the EFB data [14].
Moisture content = (
) x 100%
Whereby
w1 = weights of samples before removing moisture content
w2 = weights of samples after removing moisture content
3.1.3 Grinding
The samples are grinded into powder form by using the grinder. This is important
part to make the biomass briquette because the Autopallet Press Machine can only
produce the briquette after the samples has been grind into the powder form.
3.1.4 Study of Sample’s Element Content
XRF/CHNS machine will be used to study the element content of the EFB, rice husk
and coconut shell. The data collected will be recorded and compared with the
reference data.
3.1.5 Production of Samples of Briquettes
There are 12 types of samples are to be tested. Dry samples are the samples where
the moisture content is removed while wet samples are the samples where the
moisture content is not removed. The dry samples are to be used in the production of
briquettes. 10±0.5 gram of each sample will put in the mould of the Autopallet Press
Machine. The load is set to 75 kN force. The, the mould will be put in the hydraulic
press of the Autopallet Press Machine. Five briquettes will be made for each type of

13
sample. The height of the briquette produced are measured and recorded. The
volume or size of the briquette is determined by using the formula:
Volume, V = πr2h
Whereby
r = radius of the briquette
h = height of the briquette
The weight of the produced sample briquettes will be determined to calculate the
density of the samples. The formula to calculate the density is
Density, ρ = _mass_
volume
The typical briquette for this project is shown in Figure 4.
Figure 4: A typical briquette for this project.
3.1.6 Calorific Value Test
The EFB, rice husk and coconut shell samples will be tested. The purpose is to make
sure the sample collected can be burned and the calorific value can be determined.
Bomb calorimeter is used to verify the calorific value of samples. 1.0 g of the pure
EFB, coconut shell and rice husk will be tested. The samples can be used in the other
process if the calorific values are successfully determined. The second section is to
verify the calorific value of the samples. The briquette will be grinded, and then 1.0 g
of sample is tested. The weight of sample is keyed-in by using the prompt screen
of bomb calorimeter before the process gets started. The calorific value, which is

14
shown at the prompt screen, will be recorded. Three tests will be run for each type of
sample and the process is repeated by using sample with different mixture ratio.
3.1.7 Burning Test
The purpose of this test is to test the ignitability and time take to burn the sample to
ash. Bunsen burner will be used in this test. The briquette will put on the wire gauze
and the Bunsen burner is ignited. Every 5 seconds, the briquette will be removed and
placed on a piece of tissue paper to test whether the briquette has ignited or vice
versa. The interval time is recorded until the briquette is ignited. The briquette is
burned and the stop watch is started. When the briquette is burned until become ash,
the stop watch will be stopped and the time is recorded. The ash content of the
samples will be calculated by using this formula [15]:
Ash content (%) = final weight x 100%
initial weight
3.1.8 Drop Test
The objective of drop test is to find out the brittleness of the samples. The brittleness
of the briquettes plays an important role in the transportation, handling and storing of
the briquettes. It is executed by dropping the briquettes from 1 meter height location
for three times per briquette. The briquette will be weighed after each drop. Then, the
result will be collected and analysed [16].
3.1.9 Immerse Test
The purpose of immerse test is to measure its durability when it is immersed under
water. There will be a few cases when flood occurred and affect the storage container
where the biomass briquettes are kept. Referred to this situation, immerse test will
be done to examine the briquette’s condition after immersed under water for one
minute per briquette. The briquette characteristics after immerse test are recorded.

15
3.2 Equipment Needs for Research
i) XRF/CHNS machine – to evaluate the elements contain in the EFB, coconut shell
and rice husk.
ii) Grinder – to grind the specimens. In this project, 2 type of grinder are used:
1) Granulator – to break hard and large sample into smaller size and smoother
condition of sample. In this case, coconut shell and EFB can be grinded in the
granulator. The rice husk is already smooth; we don’t have to put it into this
machine.
2) Mortar Grinder – to grind the specimen of EFB, coconut shell and rice husk
into powder form. Only by this form, the biomass briquettes can be produced.
iii) Oven – to remove the moisture of the samples.
iv) Bunsen – to light the samples.
v) Autopallet Press Machine – to produce briquettes.
vi) Bomb calorimeter - to get the calorific value of the samples.
The pictures of equipment are shown as in the following figures:
Figure 5: Oven Figure 6: Grinder Figure7: Autopallet
press machine
Figure 8: CHNS machine Figure 9: Bomb calorimeter
16
3.3 Feasibility of Plan
For the time being, all tasks in the Gantt chart for FYP 1 are running smoothly
according to the plan. In this part, only two main tasks are been executed; which are
collection of the raw material and study of EFB, rice husk and coconut shell
characteristics. The sample’s collection process from the respective plant and
factories are successfully done without any major difficulties.
On the other hand, the tasks in the Gantt chart for FYP 2 are going efficiently
according to the plan except for the production of briquettes and study of sample’s
element content. The mould required for producing briquettes is missing and unable
to be found by the lab technician. Thus, I need to fabricate the new mould by using
the stainless steel solid cylinder. This fabrication process is taken place at the
manufacturing lab and consuming about two weeks to be completed. The production
of biomass briquettes is carried out in week 8. Furthermore, the XRF machine in
block 17 was break down and the progress of machine service is still in doubt. The
alternative solution of this problem is to use the CHNS machine in block 4 (chemical
engineering department). The test will be carried out in week 9.

17
3.4 Gantt Chart & Key Milestone for FYP 1
Weeks
Tasks 1 2 3 4 5 6 7 8 9 10 11 12 13 14
Topic selection & allocation
Understand the process involved in palm oil
processing
Submission of Extended Proposal
Collect EFB, rice husk and coconut shell
Proposal Defence
Study the characteristics of EFB, rice husk and
coconut shell
Submission of interim draft report
Submission of interim report

18
3.5 Gantt Chart & Key Milestone for FYP II
Weeks
Tasks 1 2 3 4 5 6 7 8 9 10 11 12 13 14
Sample Preparation
Production of briquettes of sample
Drop test
Calorific Value Test
CHNS Test
Submission of Progress Report
Burning Test
Submission of FYP poster
Submission of draft report
Project Dissertation (soft bound)
Submission of Technical Paper
Oral Presentation
Project Dissertation (hard bound)

19
CHAPTER 4
RESULTS AND DISCUSSIONS
4.1 Sample Preparation
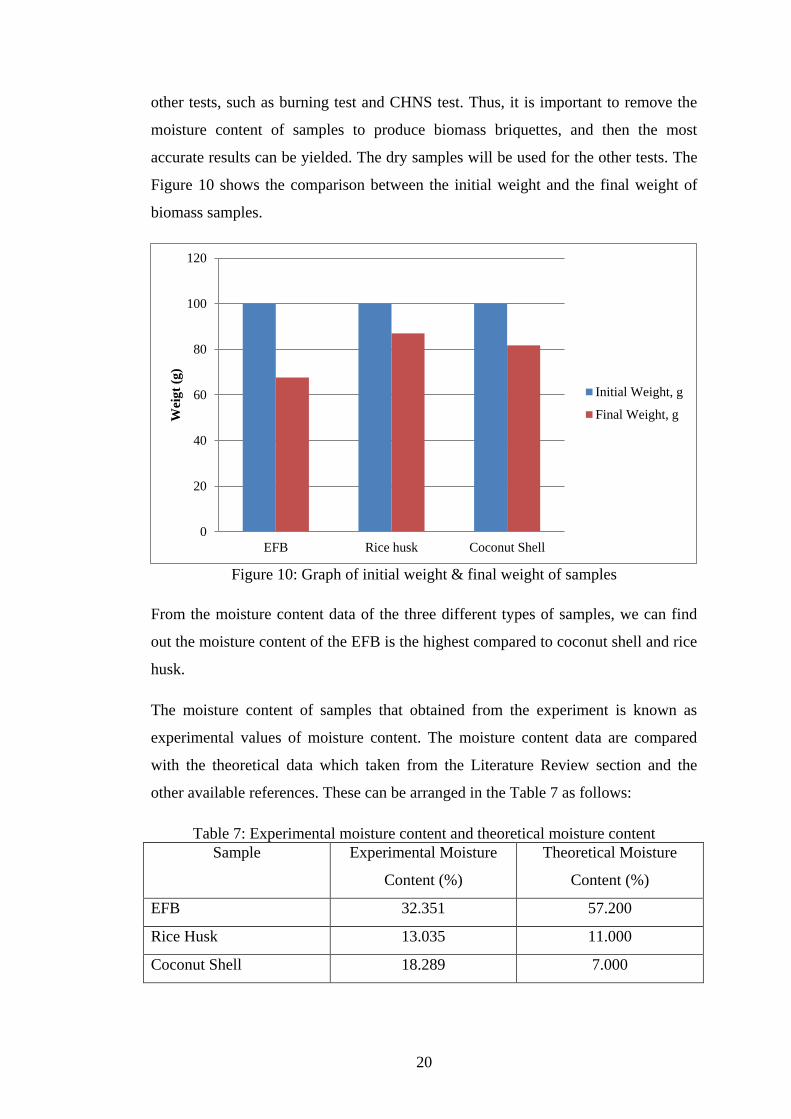
The initial weight and final weight of EFB, rice husk and coconut shell are recorded
in Table 6 and the moisture contents of the samples are calculated.
Table 6: The initial weight, final weight & moisture content of the samples
Samples Initial weight, w1
(g)
Final weight, w2
(g)
Moisture content
(%)
EFB 100 67.649 32.351
Rice husk 100 86.965 13.035
Coconut Shell 100 81.711 18.289
The moisture content of the samples is calculated by using the following equation
and the calculation example is shown by using the EFB data.
Moisture content = (
) x 100%
= (
) x 100%
= 32.351 %
From the data obtained from moisture removing experiment, all samples are showing
reduction in weight value after drying process in the oven. This means that the
biomass samples are having moisture in their initial condition. These samples called
wet samples. The calorific value of the samples cannot be determined by the bomb
calorimeter if the samples found wet. Furthermore, this will affect the result of the
20
other tests, such as burning test and CHNS test. Thus, it is important to remove the
moisture content of samples to produce biomass briquettes, and then the most
accurate results can be yielded. The dry samples will be used for the other tests. The
Figure 10 shows the comparison between the initial weight and the final weight of
biomass samples.
Figure 10: Graph of initial weight & final weight of samples
From the moisture content data of the three different types of samples, we can find
out the moisture content of the EFB is the highest compared to coconut shell and rice
husk.
The moisture content of samples that obtained from the experiment is known as
experimental values of moisture content. The moisture content data are compared
with the theoretical data which taken from the Literature Review section and the
other available references. These can be arranged in the Table 7 as follows:
Table 7: Experimental moisture content and theoretical moisture content
Sample Experimental Moisture
Content (%)
Theoretical Moisture
Content (%)
EFB 32.351 57.200
Rice Husk 13.035 11.000
Coconut Shell 18.289 7.000
0
20
40
60
80
100
120
EFB Rice husk Coconut Shell
Wei
gt
(g)
Initial Weight, g
Final Weight, g

21
Figure 11: Graph of experimental vs. theoretical moisture content (%)
The Figure 11 explains the difference between experimental moisture content and
theoretical moisture content. The theoretical moisture content for EFB is higher than
the experimental value; however the theoretical moisture contents for rice husk and
coconut shell are lower. The percentage difference of moisture content between
experimental moisture content and theoretical moisture content are recorded in Table
8.
Table 8: Percentage difference of moisture content (%)
Sample Experimental
Moisture Content
(%)
Theoretical
Moisture Content
(%)
Percentage
Difference (%)
EFB 32.351 57.200 -76.81
Rice Husk 13.035 11.000 15.61
Coconut Shell 18.289 7.000 61.73
The percentage different between the experimental value of moisture content and
theoretical value of moisture content is calculated by using the following equation
and the calculation example is shown by using the rice husk data.
0
10
20
30
40
50
60
70
EFB Rice husk Coconut Shell
Mo
istu
re C
on
ten
t (%
)
Experimental
Moisture
Content (%)Theoretical
Moisture
Content (%)

22
Percentage different = experimental (%) – theoretical (%) x 100%
experimental (%)
=13.035 – 11.000 x 100%
13.035
=15.61
The moisture for EFB itself which newly discharge from crude palm oil mill may
reach as high as 70% moisture, apart from steam water moisture; it also consists of
small amount of crude palm oil. This is why some of the crude palm oil mill wants
to further proceed to press the EFB for further salvage the crude palm oil. After press
and shredded, the moisture for shredded EFB fibre may reduce to 50-55%, again also
may fluctuate depends on the press machine and shredded machine design and
maintenance status [13]. However the yielded moisture content of EFB is just about
22.4%. This value is about 76.81% less than the theoretical value of moisture
content. This is probably due to the exposure of EFB under the sunshine for quite
long time before it is taken from palm oil factory. Similarly, the experimental values
of coconut shell and rice husk moisture content are slightly different from the
theoretical values. These data may be affected by the surrounding condition and the
storage location of the samples at the initial places.
12 types of sample’s ratio are provided within the required weight percentage. Five
briquettes are produced for each ratio to be used for the sample’s tests that will be
handled to obtain the best ratio of briquette in terms of reliability, durability,
ignitability and the time taken to become ash.
4.2 Study of Sample’s Element Content
The carbon, hydrogen, nitrogen and sulphur content in the samples are tested by
using the CHNS machine. The results are shown in Table 9 to 12. These data are also
being plotted on the graphs in Figure 12 to 15.

23
Table 9: The Carbon content (%) in the samples.
Samples (%) Carbon Content (%)
Test 1 Test 2 Mean
E (100) 47.37 46.62 47.00
R (100) 40.01 39.92 39.97
C (100) 46.81 46.83 46.82
E : R (75 : 25) 44.30 43.69 44.00
E : R (50 : 50) 42.52 42.39 42.46
E : R (25 : 75) 40.40 38.81 39.61
E : C (75 : 25) 45.78 45.79 45.79
E : C (50 : 50) 45.84 47.15 46.50
E : C (25 : 75) 45.70 46.39 46.05
E : R : C (50 : 25 : 25) 44.60 44.96 44.78
E : R : C (25 : 50 : 25) 41.96 42.14 42.05
E : R : C (25 : 25 : 50) 42.29 43.73 43.01
Table 10: The Hydrogen content (%) in the samples.
Samples (%) Hydrogen Content (%)
Test 1 Test 2 Mean
E (100) 5.455 5.221 5.338
R (100) 5.734 5.042 5.388
C (100) 4.433 4.435 4.434
E : R (75 : 25) 5.955 5.354 5.655
E : R (50 : 50) 5.046 4.876 4.961
E : R (25 : 75) 4.109 5.030 4.567
E : C (75 : 25) 5.943 5.479 5.711
E : C (50 : 50) 4.457 4.471 4.464
E : C (25 : 75) 6.683 6.166 6.425
E : R : C (50 : 25 : 25) 5.346 5.228 5.287
E : R : C (25 : 50 : 25) 4.928 4.793 4.861
E : R : C (25 : 25 : 50) 4.372 4.444 4.408

24
Table 11: The Nitrogen content (%) in the samples.
Samples (%) Nitrogen Content (%)
Test 1 Test 2 Mean
E (100) 1.679 1.495 1.587
R (100) 0.816 0.842 0.829
C (100) 0.349 0.386 0.368
E : R (75 : 25) 1.082 1.164 1.123
E : R (50 : 50) 1.104 0.905 1.005
E : R (25 : 75) 0.897 0.834 0.866
E : C (75 : 25) 0.968 1.148 1.058
E : C (50 : 50) 0.691 0.756 0.724
E : C (25 : 75) 0.717 0.516 0.617
E : R : C (50 : 25 : 25) 0.890 0.922 0.906
E : R : C (25 : 50 : 25) 0.916 0.900 0.908
E : R : C (25 : 25 : 50) 0.637 0.774 0.706
Table 12: The Sulphur content (%) in the samples.
Samples (%) Sulphur Content (%)
Test 1 Test 2 Mean
E (100) 0.120 0.038 0.079
R (100) 0.090 0.045 0.068
C (100) 0.012 0.007 0.010
E : R (75 : 25) 0.101 0.072 0.087
E : R (50 : 50) 0.033 0.002 0.018
E : R (25 : 75) 0.003 0.040 0.022
E : C (75 : 25) 0.105 0.088 0.097
E : C (50 : 50) 0.050 0.065 0.058
E : C (25 : 75) 0.055 0.041 0.048
E : R : C (50 : 25 : 25) 0.007 0.023 0.015
E : R : C (25 : 50 : 25) 0.044 0.024 0.034
E : R : C (25 : 25 : 50) 0.001 0.009 0.005

25
By comparing the results obtained from the experiment (100% EFB and 100% rice
husk) with the data in Table 1 and Table 3 respectively, it is observed that there has
the small different rate of data between the study and the literature. The physical
properties of EFB and rice husk depend on the environment condition; hence this
small difference is acceptable.
From the data in Table 11 and Table 12, it is found that the percentage of Nitrogen
and Sulphur are relatively low. This shows that these biomass samples will not create
major pollution in the environment, especially when burning of samples are being
done. Therefore, these samples are suitable to be used for developing biomass
briquette.
The Figure 12-15 shows the element content of the selected briquettes; which are
100% EFB, 75:25 EFB to rice husk, 75:25 EFB to coconut shell and 50:25:25 EFB to
rice husk to coconut shell.
Figure 12: Element content of EFB.
47
5.338
1.587 0.079
0
5
10
15
20
25
30
35
40
45
50
Carbon (%) Hydrogen (%) Nitrogen (%) Sulphur (%)
E (100)

26
Figure 13: Element content of 75:25 EFB to rice husk.
Figure 14: Element content of 75:25 EFB to coconut shell.
Figure 15: Element content of 50:25:25 EFB to rice husk to coconut shell.
44
5.655
1.123 0.087 0
5
10
15
20
25
30
35
40
45
50
Carbon (%) Hydrogen (%) Nitrogen (%) Sulphur (%)
E : R (75 : 25)
45.79
5.711
1.058 0.097 0
5
10
15
20
25
30
35
40
45
50
Carbon (%) Hydrogen (%) Nitrogen (%) Sulphur (%)
E : C (75 : 25)
44.78
5.287
0.906 0.015 0
5
10
15
20
25
30
35
40
45
50
Carbon (%) Hydrogen (%) Nitrogen (%) Sulphur (%)
E : R : C (50 : 25 : 25)

27
4.3 Production of Briquette
The weight and height of briquettes are recorded in Table 13 and Table 14. The
diameter of briquettes is 40 mm and force applied is 75 kN.
Table 13: The weight of briquettes produced.
Samples Weight of Briquettes, w (g)
No. 1 No. 2 No. 3 No. 4 No. 5
E (100) 10.2249 10.2900 10.3522 10.2772 10.2733
R (100) 10.2461 10.2542 10.2643 9.8623 9.2370
C (100) 10.0201 10.2707 9.9231 9.6238 10.0790
E : R (75 : 25) 10.2624 10.2787 10.2600 10.2773 10.2844
E : R (50 : 50) 9.9422 9.9640 9.9478 9.8950 9.9430
E : R (25 : 75) 9.8654 9.9022 9.9010 9.9180 9.9105
E : C (75 : 25) 10.1401 10.1896 10.1952 10.1392 10.3420
E : C (50 : 50) 10.1353 10.0461 10.0399 9.9015 9.9981
E : C (25 : 75) 9.8648 9.8262 9.8445 9.8359 9.7357
E : R : C (50 : 25 : 25) 10.0128 10.0183 10.0272 10.0234 10.0100
E : R : C (25 : 50 : 25) 9.8737 9.8800 9.8661 9.8704 9.8733
E : R : C (25 : 25 : 50) 9.8500 9.8550 9.7480 9.8738 9.7933
From the data in Table 13, the weight of briquettes produced is within the range of
9.24 g to 10.35 g. Although the initial weight of samples is measured in the range of
9.95 g to 10.05 g (+5 g of weight range), the final weight of briquettes obtained is a
bit strayed away from the initial range.

28
Table 14: The height of briquettes produced.
Samples Height of Briquettes, h (mm)
No. 1 No. 2 No. 3 No. 4 No. 5
E (100) 7.0 7.8 8.0 7.5 7.1
R (100) 7.2 7.2 7.3 7.0 6.6
C (100) 7.5 7.5 7.0 7.0 7.5
E : R (75 : 25) 7.0 7.2 6.8 7.1 7.2
E : R (50 : 50) 7.1 7.3 7.2 7.0 7.1
E : R (25 : 75) 7.0 7.5 7.2 8.0 7.8
E : C (75 : 25) 7.5 7.6 7.8 7.5 8.0
E : C (50 : 50) 7.5 7.5 7.4 7.0 7.2
E : C (25 : 75) 7.4 7.2 7.3 7.2 7.0
E : R : C (50 : 25 : 25) 7.4 7.4 7.5 7.5 7.1
E : R : C (25 : 50 : 25) 7.4 7.5 7.0 7.2 7.4
E : R : C (25 : 25 : 50) 7.4 7.5 7.1 7.5 7.3
From the data in Table 14, the height of briquettes produced is within the range of
6.6 mm to 8.0 mm. This is shows that the size of briquettes produced is reasonable
and just a bit difference from one briquette to another briquette.
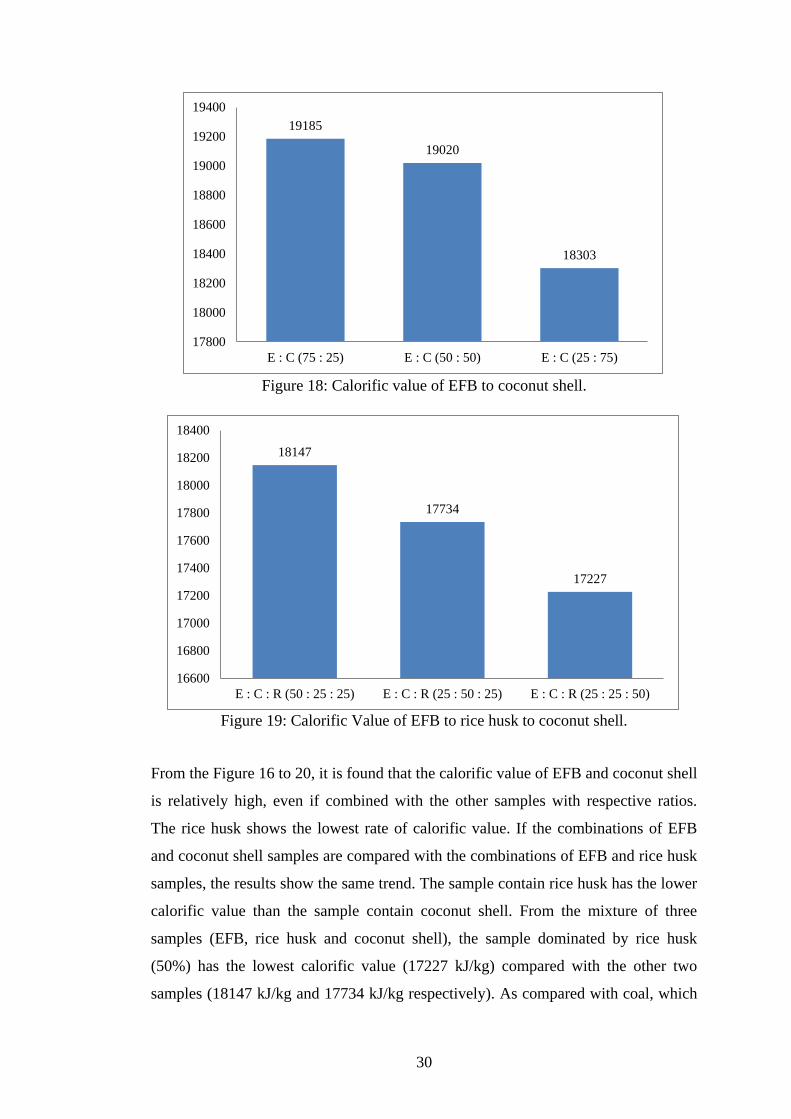
4.4 Calorific Value Test
The Calorific Value of the EFB, rice husk, coconut shell and mixture of these
biomasses are listed in Figure 16 to 19. All samples that been tested are consist of
dry samples. One test has been run for each sample by using bomb calorimeter. 30
minutes are needed to finish every test and obtain required result.
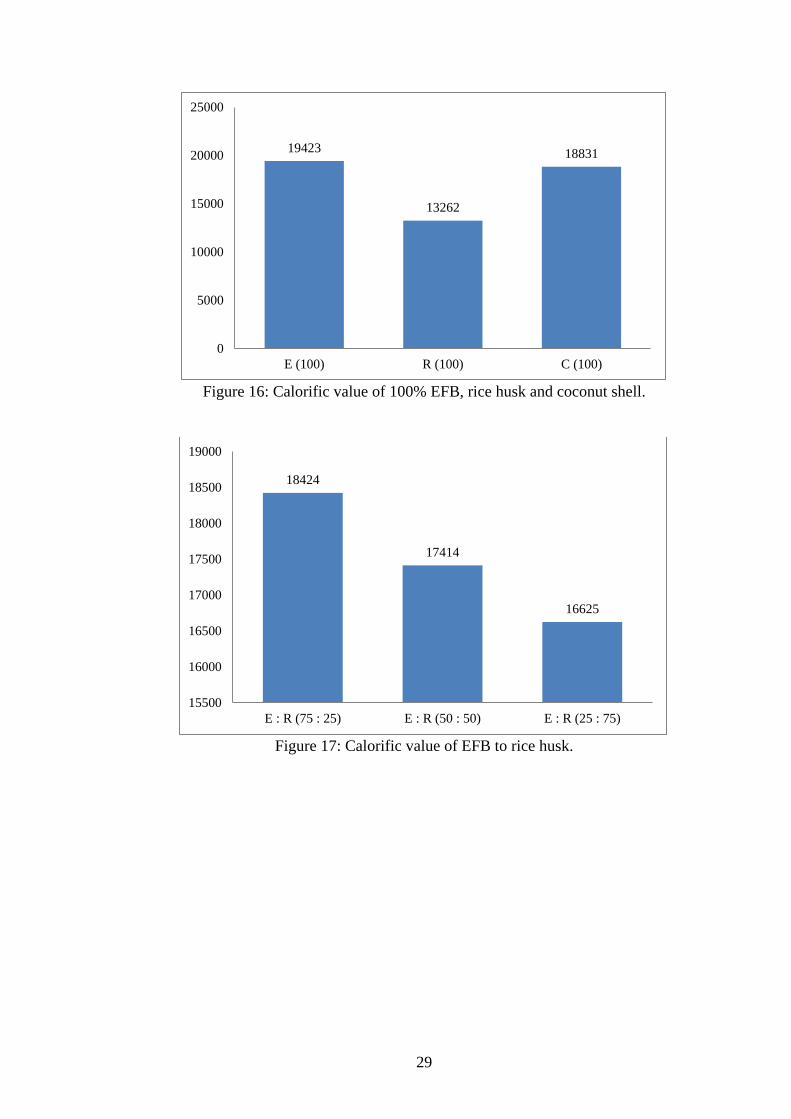
29
Figure 16: Calorific value of 100% EFB, rice husk and coconut shell.
Figure 17: Calorific value of EFB to rice husk.
19423
13262
18831
0
5000
10000
15000
20000
25000
E (100) R (100) C (100)
18424
17414
16625
15500
16000
16500
17000
17500
18000
18500
19000
E : R (75 : 25) E : R (50 : 50) E : R (25 : 75)
30
Figure 18: Calorific value of EFB to coconut shell.
Figure 19: Calorific Value of EFB to rice husk to coconut shell.
From the Figure 16 to 20, it is found that the calorific value of EFB and coconut shell
is relatively high, even if combined with the other samples with respective ratios.
The rice husk shows the lowest rate of calorific value. If the combinations of EFB
and coconut shell samples are compared with the combinations of EFB and rice husk
samples, the results show the same trend. The sample contain rice husk has the lower
calorific value than the sample contain coconut shell. From the mixture of three
samples (EFB, rice husk and coconut shell), the sample dominated by rice husk
(50%) has the lowest calorific value (17227 kJ/kg) compared with the other two
samples (18147 kJ/kg and 17734 kJ/kg respectively). As compared with coal, which
19185
19020
18303
17800
18000
18200
18400
18600
18800
19000
19200
19400
E : C (75 : 25) E : C (50 : 50) E : C (25 : 75)
18147
17734
17227
16600
16800
17000
17200
17400
17600
17800
18000
18200
18400
E : C : R (50 : 25 : 25) E : C : R (25 : 50 : 25) E : C : R (25 : 25 : 50)

31
is the common type of fuel with the average calorific value of 26986 kJ/kg, the
calorific value of biomass briquettes are less.
4.5 Burning Test
The ignitibility time, the time taken to burn briquette into ash and the ash content are
recorded in the Table 15. The method to calculate the ash content is shown by using
the data of 100% EFB.
Table 15: The ignitibility time, time taken to burn to ash and ash content of samples.
Samples
(%)
Ignitability
Time (s)
Time
taken to
burn to
ash (s)
Initial
weight
(g)
Final
Weight
(g)
Ash
content
(%)
E (100) 45 363 10.3522 0.8268 7.99
R (100) 57 363 10.2643 1.7143 16.70
C (100) 10 274 10.2707 0.5985 5.83
E : R (75 : 25) 43 421 10.2600 0.8772 8.55
E : R (50 : 50) 23 341 9.9640 1.0204 10.24
E : R (25 : 75) 33 382 9.9022 1.1920 12.04
E : C (75 : 25) 52 359 10.1952 0.6670 6.54
E : C (50 : 50) 31 332 10.0399 0.6948 6.92
E : C (25 : 75) 23 346 9.8445 0.6274 6.37
E : R : C (50 : 25 : 25) 43 317 10.0234 0.9026 9.00
E : R : C (25 : 50 : 25) 33 422 9.8704 1.0484 10.62
E : R : C (25 : 25 : 50) 32 322 9.8550 0.8287 8.41
Ash content (%) = final weight x 100%
initial weight
= 0.8268 x 100%
10.3522
= 7.99%
From the data in the Table 15, it is observed that the ignitibility time of 100% rice
husk is the highest and its time taken to be burnt into ash is same as the 100% EFB.
The ignitibility time of a good quality biomass briquette has to be short as possible.
Then, the time taken to burn to ash should be as longest as possible. However, the

32
calorific value of 100% rice husk is the lowest among the biomass briquettes
produced. Theoretically, its value of time taken to burn into ash must be shorter than
EFB and coconut shell. This difference result occurred due to its density which is the
highest (average value of 1.1238 g/cm3) compared to the pure EFB and coconut
shell. High value of density will yield the longer time of burning. The largest value
of ash content is shown by the 100% rice husk (16.70%). The amount of ash affects
the ignitibility of the briquette, where the high content of ash reduces the briquette’s
ignitibility. Therefore, the rice husk that showed the highest ash content might not be
a good candidate for fuel briquette.
The Figure 20-23 shows the graphs of ignitibility time and time taken to burn to ash
for all briquettes.
Figure 20: Time graph of 100% EFB, rice husk and coconut shell.
E (100) R (100)
C (100)
E (100)
R (100)
C (100)
0
50
100
150
200
250
300
350
400
0 1 2 3 4
Tim
e (s
)
Weight of biomass in the sample (%)
Ignitability Time (s)
Time taken to burn to
ash (s)
E:R (75:25) E:R (50:50) E:R (25:75)
E:R (75:25)
E:R (50:50)
E:R (25:75)
0
50
100
150
200
250
300
350
400
450
0 1 2 3 4
Tim
e (s
)
Weight of biomass in the sample (%)
Ignitability Time (s)
Time taken to burn to
ash (s)

33
Figure 21: Time graph of EFB to rice husk.
Figure 22: Time graph of EFB to coconut shell.
Figure 23: Time graph of EFB to rice husk to coconut shell.
4.6 Drop Test
The results of the test are shown in Table 16. From the results obtained from the test,
the 100% coconut shell and 25: 75 EFB to coconut shell are the most brittle
briquettes. Parts of the briquettes are broken too much after the second drop test.
After the third drop test, the briquettes are broken into many small pieces. Thus, the
briquettes are not able to be weighted and fail to continue to the next drop tests.
The 50:50 EFB to rice husk has the best results compared to the other briquettes.
There has no any major physical defect found on the briquette after the drop test has
E:C (75:25) E:C (50:50)
E:C (25:75)
E:C (75:25)
E:C (50:50)
E:C (25:75)
0
50
100
150
200
250
300
350
400
0 1 2 3 4
Tim
e (s
)
Weight of biomass in the sample (%)
Ignitability Time (s)
Time taken to burn to ash
(s)
E:R:C (50:25:25) E:R:C (25:50:25)
E:R:C (25:25:50)
E:R:C (50:25:25)
E:R:C (25:50:25)
E:R:C (25:25:50)
0
50
100
150
200
250
300
350
400
450
0 1 2 3 4
Tim
e (s
)
Weight of biomass in the sample (%)
Ignitability Time (s)
Time taken to burn to ash
(s)

34
been completed. After the third drop test, minor crack is found on the briquette. The
crack becomes more obvious after the fourth drop test; however it does not break
into small pieces.
The other nine briquettes are showing almost the same characteristics after finish the
drop test. Parts of the briquettes are broken into small pieces and unable to be
weighed. But, the major part of then are still remains and their final weight can be
measured.
The brittleness of coconut shell occurred due to its moisture content. Compared to
the theoretical value of moisture content, the coconut shell is having the lowest
moisture. It means that coconut shell powder is very dry; the powder is unable to be
hold together strongly and firmly. The higher moisture content in EFB and rice husk
enhances the briquette’s hardness and ductility. The drier the powder of biomass, the
more brittle briquette will be produced.

35
Table 16: The results of drop test.
Samples
Image & Weight
of Samples
(before drop test)
Image and weight of samples (after drop test)
First drop test Second drop test Third drop test Fourth drop test Fifth drop test
EFB
(100%)
Weight: 10.301 g Weight: 10.214 g Weight: 10.115 g Weight: 9.952 g Weight: 9.506 g Weight: 7.408 g
Rice Husk
(100%)
Weight: 9.801 g Weight: 9.781 g Weight: 9.763 Weight: 9.756 Weight: 7.353 g Weight: 7.027 g
Coconut
Shell
(100%)
Weight: 10.402 g Weight: 7.473 g Weight: 1.758
Fail to be
weighted
Fail to be
weighted
Fail to be
weighted

36
EFB : Rice
Husk (75 :
25)
Weight: 10.296 g Weight: 9.989 g Weight: 8.658 Weight: 7.594 g Weight: 6.813 g Weight: 5.595 g
EFB: Rice
Husk
(50 : 50)
Weight: 9.911 g Weight: 9.885 g Weight: 9.839 g Weight: 9.759 g Weight: 9.680 g Weight: 9.047
EFB : Rice
Husk
(25 : 75)
Weight: 9.830 g Weight: 9.754 g Weight: 9.133 g Weight: 8.508 g Weight: 5.567 g Weight: 5.409 g

37
EFB :
Coconut
Shell
(75 : 25)
Weight: 10.358 g Weight: 10.300 g Weight: 8.641 g Weight: 7.388 g Weight: 6.516 g Weight: 6.104 g
EFB :
Coconut
Shell
(50 : 50)
Weight: 10.288 g Weight: 9.543 g Weight: 9.254 g Weight: 6.473 g Weight: 6.342 g Weight: 6.011 g
EFB :
Coconut
Shell
(25 : 75)
Weight: 9.932 g Weight: 8.699 g Weight: 8.049
Fail to be
weighted
Fail to be
weighted
Fail to be
weighted

38
EFB : Rice
Husk :
Coconut
Shell
(50 : 25 :
25)
Weight: 9.987 g Weight: 9.840 Weight: 9.784 Weight: 9.640 Weight: 8.590 g Weight: 5.365 g
EFB : Rice
Husk :
Coconut
Shell
(25 : 50 :
25)
Weight: 9.786 g Weight: 8.606 g Weight: 7.920 g Weight: 5.737 g Weight: 5.466 g Weight: 5.339 g
EFB : Rice
Husk :
Coconut
Shell
(25 : 25 :
50)
Weight: 9.456 g Weight: 8.173 g Weight: 7.641 g Weight: 6.584 g Weight: 6.425 g Weight: 5.120 g

39
4.7 Immerse Test
For the immerse test, the water resistance of the briquettes are evaluated by
observing the characteristics of briquettes when totally disintegrate in water in one
minute. This property is essential as it would enable us to determine the storage
method of location of the briquettes. The results from the immerse test are shown in
the Table 17.
All briquettes are fully immersed in water and the loose particles sank to the bottom
except the 100% coconut shell. The pure coconut shell is hardly dissolved in water.
This could be contributed by the huge amount of wax applied in producing 100%
coconut shell briquette. The result from the immerse test led to one conclusion. The
biomass fuel briquette do not have good water resistance, thus they should be stored
under cover and closed environment. The storage place with high humidity should be
avoided.

40
Table 17: The results of immerse test.
Samples Image of samples (before
immerse test)
Image of samples (after
immerse test)
EFB (100%)
Rice Husk (100%)
Coconut Shell
(100%)
EFB : Rice Husk
(75 : 25)
EFB: Rice Husk
(50 : 50)
EFB : Rice Husk
(25 : 75)

41
EFB : Coconut
Shell
(75 : 25)
EFB : Coconut
Shell
(50 : 50)
EFB : Coconut
Shell
(25 : 75)
EFB : Rice Husk :
Coconut Shell
(50 : 25 : 25)
EFB : Rice Husk :
Coconut Shell
(25 : 50 : 25)
EFB : Rice Husk :
Coconut Shell
(25 : 25 : 50)

42
CHAPTER 5
CONCLUSIONS AND RECOMMENDATIONS
The moisture test result shows that the Empty Fruit Bunch (EFB) has the highest
moisture content, either experimentally or theoretically. A good quality of biomass
briquette should have low moisture content in order to produce the precise rate of
calorific value and accurate time taken to complete the burning test. This is the
reason of drying the samples first before mixing with the ratios given. The dry
samples will produce the appropriate results and reduce the percentage of error.
The Empty Fruit Bunch (EFB) is the best material to be chosen for developing fuel
briquette. Its calorific value is the highest (19423 kJ/kg) among all briquettes that
been produced. In addition, it can be burned in a long time and containing few ash
content. The rice husk is the least preferable material for briquette due to several
factors. Its ash content is quietly large and this will reduce the ignitibility of fuel
briquette. On the other hand, the results of the element content test shows that all
samples contains high value of carbon and hydrogen as well as less value of nitrogen
and sulphur. This shows that burning of raw EFB, coconut shell and rice husk will
not create major pollution to the environment.
Furthermore, it can be concluded that a better quality of briquette could be obtained
by using the combination of materials. This is shown from the tests and analysis done
on various briquettes made from variety type of biomass. The energy content of
biomass briquettes is exactly lower than fossil fuels (coal). Nevertheless, their
potential in creating green fuel for the humankind in the future should not be
neglected and a few improvements should be made in order to make it more reliable.

43
There are a few recommendations that can be made for the improvement of this
project in the future. Further research required to be done to test the gas emission
(smoke) results from the burning of EFB, rice husk and coconut shell. This is to
ensure that the smoke is non-toxic, safe to the humankind and not create major health
problem.
Other than that, proximate analysis should be executed by using the thermo
gravimetric analyzer (TGA) machine. More results could be obtained from this test,
such as the moisture, volatile matter, fixed carbon and ash content of the materials. In
this project, only moisture content and ash content are successfully yielded.
Moreover, stability test can be carried out to determine how a briquette can sustain
its dimensions during storage. This can determine the storage condition of the fuel
briquettes to ensure that they are always in the optimum condition.

44
REFERENCES
[1] Palm Oil Process. Retrieved from
http://lipidlibrary.aocs.org/processing/palmoil/index.htm
[2] A.S Baharuddin, S.H. Lim, M.Z.M. Yusof, N.A.Abdul Rahman, U.K.M. Shah,
M.A. Hassan, M. Wakisaka, K. Sakai and Y. Shirai (2010); Effects of Palm Oil
Mill Eff;uent (POME) anaerobic sludge from 500m3of Closed Anaerobic Methane
Digested Tank on Pressed-shredded Empty Fruit Branch (EFB) Composting
Process.
[3] Oil Palm. Retrieved from http://en.wikipedia.org/wiki/Oil_palm
[4] A.S. Baharudin, M. Wakisaka, Y. Shirai, S. Abd. Aziz, N.A. Abdul Rahman and
M.A. Hassan; Co-Composting of Empty Fruit Branches and Partially Treated
Palm Oil Mill Effluents in Pilot Scale..
[5] Y. Uemura, W. Omar, T. Tsutsui, D. Subbarao and S.Yusop; Relationship
between Calorific Value and Elementary Composition of Torrefied
Lignocellulosic Biomass.
[6] C.H. Teoh (2002); The Palm Oil Industry in Malaysia, From Seed to
Frying Pan.

45
[7] R. Kolop, Haziman W. I.M, J. W. Eng; Properties of Cement Blocks Containing
High Content of Oil Palm Empty Fruit Bunches (EFB) Fibres. Faculty of Civil &
Environmental Engioneering, Universitu Tun Hussein Onn Malaysia.
[8] T. Chungsangunsit, Shabbir H. Gheewala, and S. Patumsawad; Emission
Assessment of Rice Husk Combustion for Power Production.
[9] P.B Madakson, D.S.Yawas and A. Apasi; Characterization of Coconut Shell Ash
for Potential Utilization in Metal Matrix Composites for Automotive
Applications, Department of Mechanical Engineering, Ahmadu Bello University,
Samaru, Zaria, Nigeria.
[10] Palm Oil Mill Effluent (POME) and Empty Fruit Bunch Application as a
Nutrient Source in Oil Palm. Retrieved from
http://www.americanpalmoil.com/sustainable-nutrient.html
[11] Empty fruit bunches (EFB). Retrieved from
http://www.etawau.com/OilPalm/EFB.htm
[12] Crude palm oil milling process. Retrieved from
http://kamdhenu.co.in/future-plans.html
[13] Standard grades of coal and heating values. Retrieved from
http://www.engineeringtoolbox.com/coal-heating-values-d_1675.html
[14] Moisture content. Retrieved from
http://www.knowledgebank.irri.org/rkb/index.php/contributions-and-
references/further-information/31

46
[15] A5TM D 2974-87; Standard Test Methods for Moisture, Ash, and Organic
Matter of Peat and Other Organic Soils. From American Society for
Testing and Materials,1916 Race St., Philadelphia, PA 19103.
[16] T. Poespowati & L. Mustiadi; Municipal Solid Waste Densification as an
Alternative Energy; Chemical Engineering Dept.& Mechanical Engineering
Dept., The Institute of National Technology, Jl. Bend. Sigura-gura 2 Malang
(65145),Indonesia

47
APPENDICES
Appendix 1: Ratio quantity of EFB, coconut shell and rice husk in the briquettes.
EFB (%) Coconut Shell (%) Rice Husk (%)
100 0 0
75 25 0
75 0 25
50 50 0
50 0 50
50 25 25
25 50 25
25 25 50
0 100 0
0 0 100
0 25 75
0 75 25
48
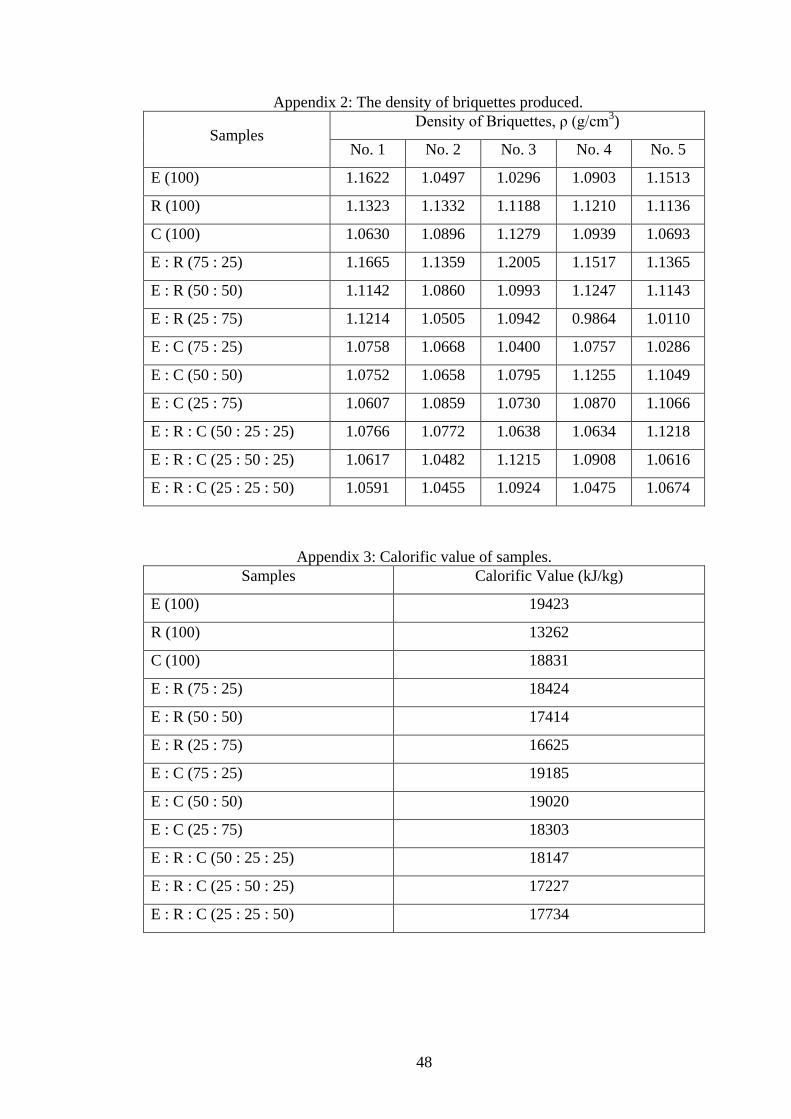
Appendix 2: The density of briquettes produced.
Samples Density of Briquettes, ρ (g/cm
3)
No. 1 No. 2 No. 3 No. 4 No. 5
E (100) 1.1622 1.0497 1.0296 1.0903 1.1513
R (100) 1.1323 1.1332 1.1188 1.1210 1.1136
C (100) 1.0630 1.0896 1.1279 1.0939 1.0693
E : R (75 : 25) 1.1665 1.1359 1.2005 1.1517 1.1365
E : R (50 : 50) 1.1142 1.0860 1.0993 1.1247 1.1143
E : R (25 : 75) 1.1214 1.0505 1.0942 0.9864 1.0110
E : C (75 : 25) 1.0758 1.0668 1.0400 1.0757 1.0286
E : C (50 : 50) 1.0752 1.0658 1.0795 1.1255 1.1049
E : C (25 : 75) 1.0607 1.0859 1.0730 1.0870 1.1066
E : R : C (50 : 25 : 25) 1.0766 1.0772 1.0638 1.0634 1.1218
E : R : C (25 : 50 : 25) 1.0617 1.0482 1.1215 1.0908 1.0616
E : R : C (25 : 25 : 50) 1.0591 1.0455 1.0924 1.0475 1.0674
Appendix 3: Calorific value of samples.
Samples Calorific Value (kJ/kg)
E (100) 19423
R (100) 13262
C (100) 18831
E : R (75 : 25) 18424
E : R (50 : 50) 17414
E : R (25 : 75) 16625
E : C (75 : 25) 19185
E : C (50 : 50) 19020
E : C (25 : 75) 18303
E : R : C (50 : 25 : 25) 18147
E : R : C (25 : 50 : 25) 17227
E : R : C (25 : 25 : 50) 17734