development of ethyl acetate process technology
TRANSCRIPT
Development of Ethyl Acetate ProcessTechnology
A Compandium of Papers Edited byMike Ashley

Development of Ethyl Acetate Process Technology The successful development of a number of processes using vapour phase ester hydrogenation, initiated the idea that it should be possible to use the same equilibrium reaction in reverse to manufacture esters by alcohol dehydrogenation. The production of ethyl acetate from ethanol was an obvious candidate for a commercial process and the initial concept was quickly demonstrated. Improved catalysts and flowsheet concepts led to the development of an economically viable process which was commercialised in South Africa. The process was transferred from laboratory bench-top rigs to in-house “Mini-Plant” units. These generated data of sufficient quality to proceed directly to the design of a commercial plant without recourse to conventional pilot systems. Mini-Plant to commercial plant scale factors for the relevant unit operations varied from approximately 80,000 up to 170,000. Where necessary, fundamental chemical engineering research was conducted to investigate reaction kinetics, fluid flow and transfer processes. The first 50,000 MTPA commercial plant based on ethanol derived from the Fischer-Tropsch process was successfully started-up in May 2001. A second 100,000 MTPA plant is now being built in China and this will use fermentation ethanol as the sole feedstock. This new plant is first example of a truly green process whereby atmospheric carbon dioxide is converted by photosynthesis to starch and after harvesting this is bioprocessed to ethanol which is chemically converted to ethyl acetate. After its use as an industrial solvent, ethyl acetate evaporates to the atmosphere where it bio-degrades back to carbon dioxide so the carbon dioxide cycle is completed and the only by-product is hydrogen which is the ultimate clean fuel. Converting Concepts into Hardware Many organisations in the hydrocarbon processing industries support R&D activities in order to maintain a technical edge and thereby obtain market advantage. Original concepts emanate from laboratory data but to progress to commercial exploitation usually involves the design and construction of a demonstration plant, followed by its operation to generate sufficient engineering data to commence design of the first industrial scale plant. This step in a conventional development route for a typical chemical process takes more than two years and may well cost many millions of pounds. Over the last few years, a new tool has become available and this has proved to be a key differentiator in realising rapid progress to commercialisation. Mini-Plants include all the design elements of a commercial scale plant in a pilot plant that is sufficiently small to be operated on a laboratory scale. They include much of the instrumentation that will be implemented on the ensuing commercial plant so that key process steps can be fully integrated to allow the entire operating envelope to be evaluated. As a result scale factors from Mini-Plant to commercial installation may be as high as 200,000:1. The progress of a development project from chemistry to commercial scale design may be envisaged in four phases, namely: · Design Definition · Mini-Plant Fabrication and Commissioning · Process Operation and · Commercial Realisation In relation to the development of ethyl acetate process technology, these stages are briefly described below. Typical Mini-Plant Rig Design Definition The aim is to generate comprehensive data relating to reaction kinetics, catalyst performance and separation equilibria so that the entire process, including recycle streams, is simulated. A novel process is operated and optimised before commencing long campaigns of continuous operation to prove catalyst life. This definition phase requires the design of equipment items to cover the entire range of process operations. Every unit operation needs to be considered in detail so that each process item is specified for maximum flexibility and instrumented to provide accurate calibration and control. It takes experience of process design and plant operation, together with the interplay of experts in reaction chemistry and process simulation to recognise hitherto undefined problems. It
takes another set of skills to devise test regimes that provide the data to unlock these problems and indicate solutions. At the very small scale that a Mini-Plant operates, the “edge effect” of a high surface to volume ratio is most pronounced and this has to be taken into account when equipment is designed. This effect particularly impacts on fluid dynamics and heat and mass transfer. For example, it is necessary to develop special designs for maintaining the temperature gradients that would normally occur in commercial scale plant by imposing “zero delta T” conditions. It is also necessary to design distillation column packing that can be calibrated without high wall effects. Scalable reactor concepts may entail reproducing a segment the commercial unit thereby maintaining representative transport properties. Mini-Plant Fabrication and Commissioning Close teamwork guided by project and quality assurance controls ensures that all modules of the Mini-Plant are built to schedule and budget. Fabrication, construction and testing phases may be completed in as little as six months. In just the same way as a full-scale plant, each element of the Mini-Plant is checked and tested before systems are commissioned and interconnected. The Mini-Plant often has more extensive instrumentation in key areas than a conventional plant allowing each unit operation to be calibrated as part of the commissioning programme. In operation the Mini-Plant produces a wealth of data so the performance of each unit can be accurately determined. Process Operation “Data is knowledge” is the byword for this phase of the project. Each unit operation and stage of the process must be put through its paces with all recycle streams analysed so that every dimension of the operating envelope is fully explored. The next stage is to test each equipment item to its boundary process conditions and an accurate computer simulation of the entire process can then be prepared. It is at this stage that a strategy for plant operations must be imposed whereby the interaction of changing conditions in one part of the process can be measured throughout the plant and the effect of varying recycles to adjust operations can be assessed. The design of dynamic campaign operation is critical to the efficient building of a comprehensive process model. So too is the interpretation of the data that each campaign produces. Commercial Realisation Reproducing continuous plant operation at very small scale imposes a unique set of problems and it is analysis of these problems that leads to a proper understanding of the process performance. Each reaction stage needs to be examined in terms of the effects of process conditions on thermodynamics, kinetics and equilibrium and repeated for every unit operation in the Mini-Plant. This means that the interactions of process stages are rigorously and fully evaluated so that with a growing knowledge base it is possible to select optimum operating conditions. These optimum conditions must then be demonstrated to satisfactorily prove reliability of control, consistency of product and longevity of catalysts. It is the conclusion of this phase that provides confidence to commit to major capital investment in his new technology. Catalyst Selection for Ethanol Dehydrogenation Work started on a catalyst previously used for vapour phase hydrogenation of maleate esters to 1,4 butanediol. At this stage in the development, pure ethanol was used as feed so that any differences caused by isopropanol or other contaminants in the feed would be highlighted. The first product from the dehydrogenation reactor was collected, analysed and found to contain a significant quantity of ethyl acetate as well as diethyl ether, acetaldehyde, higher esters and ketones, notably methyl ethyl ketone (MEK). Subsequent work was carried out to optimise reaction conditions, but the best results for selectivity and conversion were far below those required for an economically acceptable process. Screening the range of catalysts gave more or less similar results - there appeared to be a common factor that produced unacceptably high levels of by-products. By mid 1996 it had become clear that the initial concept was incorrect: catalysts that were good for hydrogenation of esters to alcohols were not necessarily good for the reverse reaction. An analysis of the mechanism of ethyl acetate and by-product formation indicated that these catalysts were too active. There remained one catalyst, a pelleted version of Raney copper, that had not been tested due to its low surface area and high cost. The expectation was that because of the low surface area, the catalyst would have low activity. This was loaded into the reactor and initial results were
20
25
30
35
40
45
50
55
200 210 220 230 240 250 260 270 280
REACTOR TEMPERATURE, °C
MO
L% C
ON
VE
RS
ION
OF
ETH
AN
OL
60
65
70
75
80
85
90
95
100
MO
L% S
ELE
CT
IVIT
Y T
O E
TH
YL
ET
HA
NO
AT
E
Conversion of EthanolSelectivity to Ethyl Ethanoate
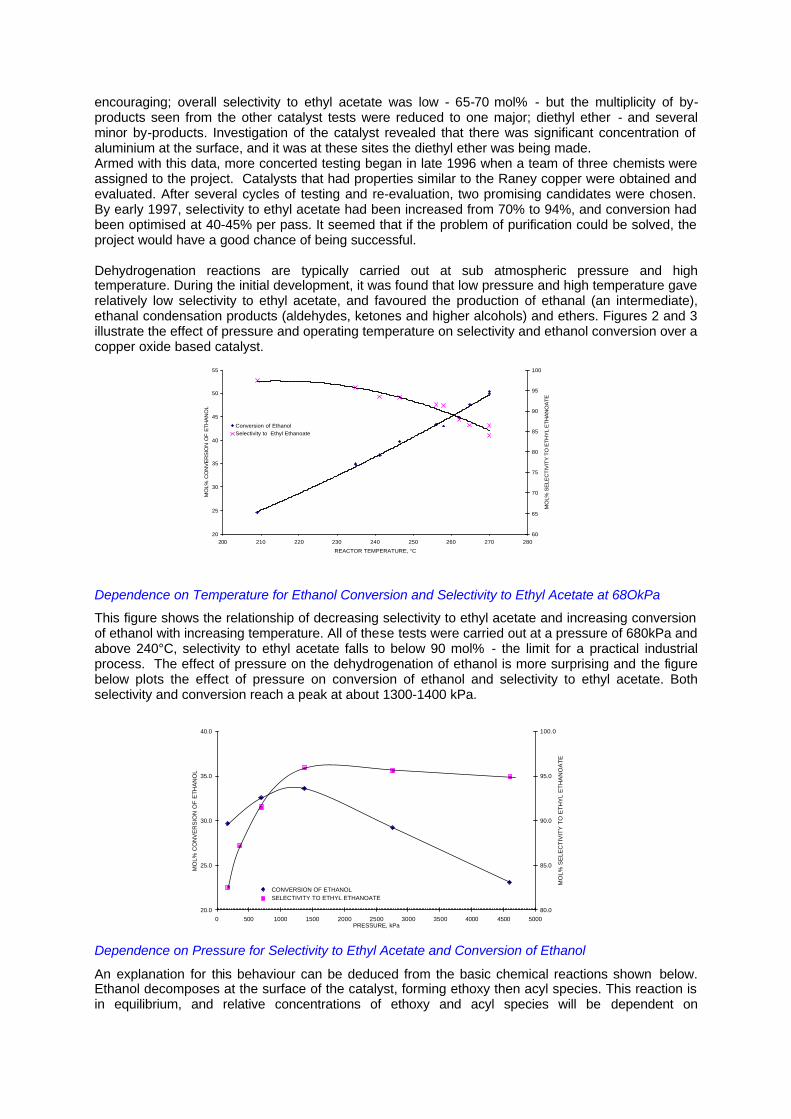
encouraging; overall selectivity to ethyl acetate was low - 65-70 mol% - but the multiplicity of by-products seen from the other catalyst tests were reduced to one major; diethyl ether - and several minor by-products. Investigation of the catalyst revealed that there was significant concentration of aluminium at the surface, and it was at these sites the diethyl ether was being made. Armed with this data, more concerted testing began in late 1996 when a team of three chemists were assigned to the project. Catalysts that had properties similar to the Raney copper were obtained and evaluated. After several cycles of testing and re-evaluation, two promising candidates were chosen. By early 1997, selectivity to ethyl acetate had been increased from 70% to 94%, and conversion had been optimised at 40-45% per pass. It seemed that if the problem of purification could be solved, the project would have a good chance of being successful. Dehydrogenation reactions are typically carried out at sub atmospheric pressure and high temperature. During the initial development, it was found that low pressure and high temperature gave relatively low selectivity to ethyl acetate, and favoured the production of ethanal (an intermediate), ethanal condensation products (aldehydes, ketones and higher alcohols) and ethers. Figures 2 and 3 illustrate the effect of pressure and operating temperature on selectivity and ethanol conversion over a copper oxide based catalyst.
Dependence on Temperature for Ethanol Conversion and Selectivity to Ethyl Acetate at 68OkPa
This figure shows the relationship of decreasing selectivity to ethyl acetate and increasing conversion of ethanol with increasing temperature. All of these tests were carried out at a pressure of 680kPa and above 240°C, selectivity to ethyl acetate falls to below 90 mol% - the limit for a practical industrial process. The effect of pressure on the dehydrogenation of ethanol is more surprising and the figure below plots the effect of pressure on conversion of ethanol and selectivity to ethyl acetate. Both selectivity and conversion reach a peak at about 1300-1400 kPa.
Dependence on Pressure for Selectivity to Ethyl Acetate and Conversion of Ethanol
An explanation for this behaviour can be deduced from the basic chemical reactions shown below. Ethanol decomposes at the surface of the catalyst, forming ethoxy then acyl species. This reaction is in equilibrium, and relative concentrations of ethoxy and acyl species will be dependent on
20.0
25.0
30.0
35.0
40.0
0 500 1000 1500 2000 2500 3000 3500 4000 4500 5000PRESSURE, kPa
MO
L% C
ON
VE
RS
ION
OF
ETH
AN
OL
80.0
85.0
90.0
95.0
100.0
MO
L% S
ELE
CT
IVIT
Y T
O E
TH
YL
ET
HA
NO
AT
E
CONVERSION OF ETHANOL SELECTIVITY TO ETHYL ETHANOATE
temperature and operating pressure. For ethyl acetate formation, an adsorbed acyl species reacts with an adsorbed ethoxy species to form an intermediate hemiacetal; subsequent dehydrogenation forms ethyl acetate. By products, such as ketones, aldehydes and alcohols are formed by the reaction of two acyl species. Another class of by products, ethers, are formed by the reaction of two ethoxy species. The relative concentrations of acyl and ethoxy species on the catalyst surface appear to be at an optimum for ethyl acetate formation at around 1300-1400 kPa.
CH3CH2OH(g) ? CH3CH2O(ad) + H(ad)
CH3CH2O(ad) ? CH3CHO(ad) + H(ad)
CH3CH2O(ad) + CH3CHO(ad) ? CH3CH(OH)CH3CHO(ad) ? CH3CH:CH3CHO(ad)
CH3CH2O(ad) + CH3CHO(ad) ? CH3CH2OCH2CH3 (ad)
Under typical operating conditions for the hydrogenation reaction, the resulting product had 40% ethyl acetate and 58% ethanol as the main components and 1.2% carbonyls.
A program of screening identified a highly selective hydrogenation catalysts that gave, at moderate pressure and low temperature low levels of (MEK) impurities with losses of ethyl acetate of less than 1% and the more reactive acetaldehyde was hydrogenated back to ethanol.
Selective Hydrogenation
A selective hydrogenation step was introduced to the ethyl acetate process to hydrogenate butanone to 2-butanol. Butanone has a similar boiling point to ethyl acetate, and cannot be separated by simple distillation with a commercially viable distillation column. However, 2-butanol has a higher boiling point and can be separated easily. The selective hydrogenation step also converts other ketones and aldehydes present in the dehydrogenation product to their respective alcohols, simplifying the overall distillation scheme. Selective hydrogenation of aldehydes and ketones in the presence of alcohols and esters is not widely practised. A review of commercial and academic literature suggested supported ruthenium as a likely candidate; nickel was also tested for the reaction.
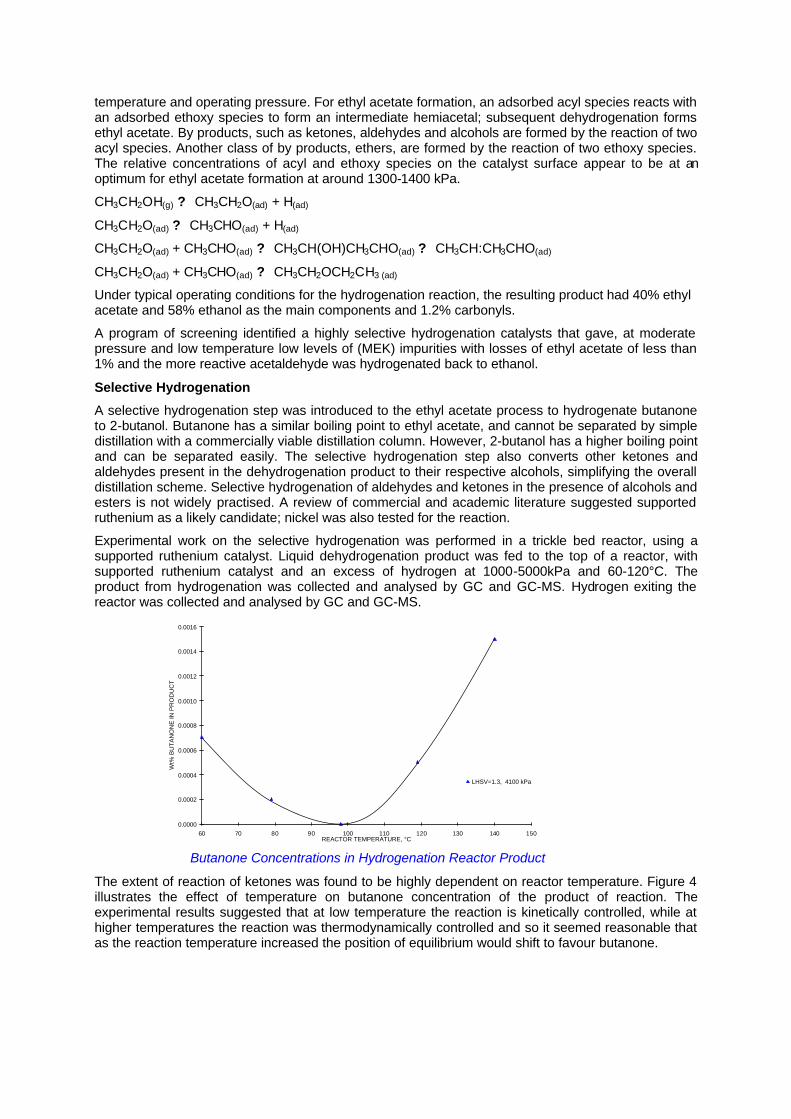
Experimental work on the selective hydrogenation was performed in a trickle bed reactor, using a supported ruthenium catalyst. Liquid dehydrogenation product was fed to the top of a reactor, with supported ruthenium catalyst and an excess of hydrogen at 1000-5000kPa and 60-120°C. The product from hydrogenation was collected and analysed by GC and GC-MS. Hydrogen exiting the reactor was collected and analysed by GC and GC-MS.
Butanone Concentrations in Hydrogenation Reactor Product
The extent of reaction of ketones was found to be highly dependent on reactor temperature. Figure 4 illustrates the effect of temperature on butanone concentration of the product of reaction. The experimental results suggested that at low temperature the reaction is kinetically controlled, while at higher temperatures the reaction was thermodynamically controlled and so it seemed reasonable that as the reaction temperature increased the position of equilibrium would shift to favour butanone.
0.0000
0.0002
0.0004
0.0006
0.0008
0.0010
0.0012
0.0014
0.0016
60 70 80 90 100 110 120 130 140 150REACTOR TEMPERATURE, °C
Wt%
BU
TA
NO
NE
IN P
RO
DU
CT
LHSV=1.3, 4100 kPa
Flowsheet Definition Bench-top investigations revealed that the new process had a conversion efficiency of more than 40% with selectivity of approximately 95% with side reactions producing a small quantity of carbonyls. Among these, methyl ethyl ketone and n-butyraldehyde were particularly difficult to separate from the ethyl acetate product. In order to avoid these difficult separations, the dehydrogenation reaction product could be selectively hydrogenated to convert them to alcohols which may be easily separated by distillation. This resulted in a process flowsheet divided into three sections: reaction, product recovery and ethanol dehydration.
In the reaction section dry ethanol is first heated in a feed/product interchanger and then vaporised before entering the dehydrogenation reactor. The reaction is endothermic and the vapour is reheated in the reactor to maintain the reaction temperature. The reactor outlet stream is cooled in a series of exchangers and then the gas and crude liquid product are separated in a drum. The overhead vapour stream, containing mainly hydrogen, is scrubbed with part of the ethanol feed to recover organics (mainly ethyl acetate) from hydrogen. The liquid product stream from dehydrogenation and a small quantity of hydrogen are fed to a trickle bed reactor, where carbonyl impurities are hydrogenated to alcohols. The reactor product is then separated from any excess hydrogen and passed to the product recovery section.
A number of possibilities for purification of the ethyl acetate product were considered. Extractive distillation using water had been rejected as too complex and expensive, but a new approach using a technique called pressure swing distillation looked attractive. This technique had been used by Davy Process Technology for another difficult separation involving ethanol. The technique takes advantage of the fact that the composition of an azeotrope varies with pressure. The composition of the ethanol-ethyl acetate azeotrope swings from largely ethyl acetate at atmospheric pressure to largely ethanol at higher pressure. The practical upshot of this is to send distillate from an atmospheric pressure column to a high pressure column and recycle the distillate from this column (containing less ethyl acetate) to the low pressure column.
Predictions made from simulations of the pressure swing threw up one more problem. Two of the by-products, acetaldehyde and MEK, appeared in the final ethyl acetate product. Experience in distilling aldehydes indicated that acetaldehyde would form acetals in the overheads of the low pressure column. These acetals would then decompose in the high pressure column, contaminating the ethyl acetate product with acetaldehyde. MEK was predicted to form an azeotrope with ethyl acetate and ethanol, and to contaminate the ethyl acetate product.
Closer examination of the distillation simulations hinted at a solution to this problem. The corresponding alcohol of MEK, 2-butanol, was observed in the crude dehydrogenation product, but this does not form an azeotrope with ethyl acetate and so separation by distillation was therefore possible. This suggested selective hydrogenation of MEK to 2-butanol and this approach had the potential that acetaldehyde would also be hydrogenated solving both problems at once. One catalyst used in the hydrogenation of butanal was nickel based, and this seemed to be an obvious starting point. A new bench-top reactor was designed and built and product from dehydrogenation was passed to this new reactor before it was sent for distillation. The stream leaving the hydrogenation reactor contains mainly ethyl acetate and unreacted ethanol. In addition, there are small quantities of water and other by-products. This stream is fed to a series of columns where the ternary azeotrope is broken, unreacted ethanol is separated for recycle, product ethyl acetate is refined to specification and the light boiling impurities are removed and sent to fuel. In the reaction section, the by-product reactions produce a small amount of water. This water must be removed before the unreacted ethanol can be recycled to the reaction section. The water removal can either be integrated within the ethyl acetate unit or can be part of a larger external ethanol refining facility. If the feed ethanol has a high water content (for example azeotropic ethanol sourced from a fermentation unit), an integrated water removal unit can be designed to dry both the recycle and feed ethanol before it is fed to the reactors. A number of processes are available for drying ethanol. Studies indicate that molecular sieve based processes are generally the most economic, although conventional entrainer distillation or pervaporation processes could also be used. A benefit of the ethanol dehydrogenation route to ethyl acetate is the co-production of hydrogen. This stream can be produced at a purity and pressure to suit the intended use. The basic scheme incorporates ethanol scrubbing to reduce the ethyl acetate content of the by-product hydrogen.
Improved purity can be obtained by using water scrubbing, refrigeration or PSA. The optimum purification system depends on the required hydrogen pressure and purity. Operation of the dehydrogenation reactor was fixed by this experimental work at 1380 kPa and 220-245°C. Even though the reactions taking place over the dehydrogenation reactor are relatively complex, commercial experience with the full scale reactor and catalyst gave performance at the selectivity and conversion predicted from experimental work. Derivation of a Basic Kinetic Model
Based on a good understanding of the chemistry, a simplified reaction network was developed as the basis for the kinetic modelling work. Minor components were omitted to prevent the model from becoming overly complicated. The model was based on the results of a series of experimental tests using an autoclave. This equipment is operated on a continuous basis to approximate a CSTR. The net conversion rate of each component during a test can easily be calculated from the inlet and outlet flows and compositions, and the loaded volume of catalyst. This rate is then equal to the sum of the individual rates of consumption or production for each component in the reactions under consideration. Simple algebra determines the order in which the rate equations should be fitted.
The form of the fitted rate equations was initially based on a power law function of the reacting chemical species. Where an equilibrium was known to exist this was incorporated into the basic equation. Equilibrium constants were taken from literature sources. The basic equation for each reaction was then modified as necessary to obtain the best fit to the experimental data. Where a term was found not to contribute to the fit it was removed from the overall equation. Terms were added, where necessary, to represent any observed auto-catalytic or and inhibitory effects. It was also found necessary to incorporate deactivation terms into the model to achieved adequate fits to the experimental data. The resulting overall form of each rate equation takes the form:
Rate = {Temperature Dependent Arrhenius type expression for rate constant} x {Power Law expression} x {Inhibition Terms} x {Promotion Term} x {Deactivation with time}
The model constants were then optimised to give a minimum value for ? (errors)2 . This optimisation was based on initial autoclave runs, when the variable parameters were temperature, pressure, space velocity and hydrogen flow rate. The kinetic model was added to a basic tubular reactor modelling program to assess whether it correctly predicts the performance of a one inch diameter experimental reactor used for the catalyst life testing.
A tubular reactor model was developed based on the preliminary model described above. Tube diameter, tube length and tube wall temperatures could be changed and the effect on conversion, selectivity and approach to equilibrium (both axially and radially) were calculated. Reaction rate was reasonably constant throughout the length of the tube and emphasises the fact that reliable prediction of performance is always dependent upon a good underlying kinetic model. A multi-bed adiabatic model with inter bed reheat was then developed. This was similar in construction to the tubular reactor model, although no radial calculations were required.
Dehydrogenation Catalyst Life Test
The purpose of the life test was to determine the performance of the catalyst over an extended period. A catalyst deactivation model was developed based on 1500 hours of experimental data that was fitted to an equilibrium constrained, first order rate equation incorporating a catalyst activity factor. The derived model described the level of conversion as a function of space velocity, temperature and time on-line and the rate constant was fitted to an Arrhenius form to account for temperature variations. Catalyst deactivation was modelled with a number of function types (linear, exponential and logarithmic) and the exponential function gave marginally the best fit to experimental data.
It was observed experimentally that the conversion was a linear function of the ethanol throughput. At first sight this observation appeared inconsistent with a first order model for the reaction. Experimentally measured conversions were then reduced to a common temperature and catalyst activity basis to illustrate that the correlation between conversion and space velocity is an approximately linear first order relationship.
However, the choice of equation form has a significant impact on the prediction of future catalyst performance. The exponential function gave a marginally better fit to the data whereas a log function predicted a significantly longer life. In order to obtain a better indication of the most likely progress of catalyst deactivation, data from commercial operation of a CuCr catalyst in an ester hydrogenation application was reviewed. In this application, catalyst deactivation was primarily the result of the
deposition of heavy organic material on the catalyst surface. These catalyst beds have been successfully regenerated by an oxidative procedure and then returned to process operation. Catalyst activity data collected over approximately 8000 hours operation was monitored and suggested that a longer catalyst life might be expected.
Reactor Design Development
Having collected basic data, chosen and tested catalysts and developed a flowsheet it is time to put the new process to the test. However, there are really no standard designs for multi-phase catalytic reactors, particularly where when mass and heat transfer are critically dependent on each other and impact on the reaction equilibrium.
For the ethyl acetate process development described above, both tubular and adiabatic bed reactor models showed that these reactor configurations give acceptable conversions and selectivity. Catalyst life test indicated that it may be necessary to regenerate the catalyst during normal operation. However, a tubular reactor would need to be taken off- line whilst the regeneration is performed, resulting in a total plant shut-down. But if multiple adiabatic beds were used, each bed could be regenerated separately, allowing the other beds to remain on-line and the plant to continue production. A cost comparison between multiple adiabatic bed reactors with inter bed reheat, and a tubular reactor with hot oil heating, showed that their estimated cost was comparable and so there would be minimal cost penalties in selecting the adiabatic reactor configuration.
Standard design practice is to firstly consider the kinetics, equilibrium and stoichiometry of the particular hydrogenation reaction and the activity of the chosen catalyst to determine the quantity of catalyst required and the number of stages to achieve the desired product specification. With specific reference to physical properties of the components including viscosity, density and heat transfer coefficients it is possible to calculate the flow of product in the reactor for a sensible temperature rise in the presence of excess hydrogen. Once a preliminary mass balance has been struck it is possible to undertake the hydrodynamic design of the distributor to ensure there are sufficient numbers of down-comer holes of chosen diameter for even liquid flow. Then a sufficient area of holes in piccolo risers to distribute hydrogen throughout the catalyst beds may be calculated. The next stage is to construct equations for mass transfer and heat transfer at each inter-phase boundary within a section of the catalyst bed. These boundaries include active catalyst sites/support interstices, catalyst support/liquid film and liquid film/hydrogen. Transfer rates can then be calculated and checked against predicted catalyst performance. Ideally these equations can be simulated in the laboratory and appropriate corrections can be applied. It is then possible to integrate and balance the equations so that a simulation model can be formulated and extended to the physical dimensions of the catalyst bed. Design development conventionally involves combining process, operability, safety and mechanical elements so that engineering line diagrams, control diagrams, safety studies and mechanical specifications are developed in parallel. Process designers consider the interaction of unit operations before and after the reactor and this leads to a control philosophy and definition of both the operating and design limits for the reactor vessel. Operability studies examine the envelope of design conditions and impose further control systems and operating limits. Flow, temperature and pressure excursions are considered and the appropriate corrective control actions are specified. Detail design includes vessel supports and fabrication requirements and the solution of problems such as insertion of parts of trays and their assembly so that the distributors are sufficiently leak-tight and supported to ensure that they are level. This schedule of design activities would seem to be sufficiently rigorous to ensure that when the reactor is delivered it can be filled with catalyst, pre-conditioned, commissioned and then put into service. Experience from many projects has shown this to be the case and accordingly designers proceed with confidence to a robust design of plant that will provide reliable service. However, in some circumstances occasional and unexpected problems with reactor temperature control have been encountered that suggest that some fundamental design aspects have not been fully investigated. These aspects are explored below.
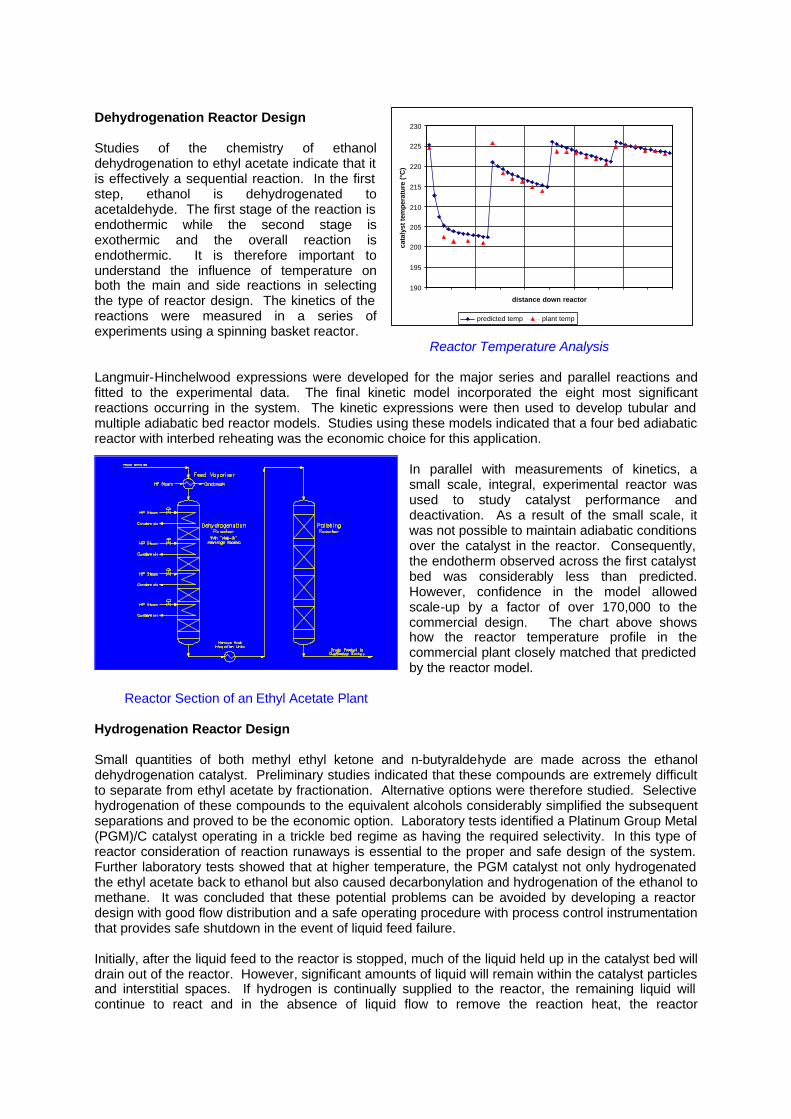
Dehydrogenation Reactor Design Studies of the chemistry of ethanol dehydrogenation to ethyl acetate indicate that it is effectively a sequential reaction. In the first step, ethanol is dehydrogenated to acetaldehyde. The first stage of the reaction is endothermic while the second stage is exothermic and the overall reaction is endothermic. It is therefore important to understand the influence of temperature on both the main and side reactions in selecting the type of reactor design. The kinetics of the reactions were measured in a series of experiments using a spinning basket reactor. Reactor Temperature Analysis Langmuir-Hinchelwood expressions were developed for the major series and parallel reactions and fitted to the experimental data. The final kinetic model incorporated the eight most significant reactions occurring in the system. The kinetic expressions were then used to develop tubular and multiple adiabatic bed reactor models. Studies using these models indicated that a four bed adiabatic reactor with interbed reheating was the economic choice for this application.
In parallel with measurements of kinetics, a small scale, integral, experimental reactor was used to study catalyst performance and deactivation. As a result of the small scale, it was not possible to maintain adiabatic conditions over the catalyst in the reactor. Consequently, the endotherm observed across the first catalyst bed was considerably less than predicted. However, confidence in the model allowed scale-up by a factor of over 170,000 to the commercial design. The chart above shows how the reactor temperature profile in the commercial plant closely matched that predicted by the reactor model.
Reactor Section of an Ethyl Acetate Plant Hydrogenation Reactor Design Small quantities of both methyl ethyl ketone and n-butyraldehyde are made across the ethanol dehydrogenation catalyst. Preliminary studies indicated that these compounds are extremely difficult to separate from ethyl acetate by fractionation. Alternative options were therefore studied. Selective hydrogenation of these compounds to the equivalent alcohols considerably simplified the subsequent separations and proved to be the economic option. Laboratory tests identified a Platinum Group Metal (PGM)/C catalyst operating in a trickle bed regime as having the required selectivity. In this type of reactor consideration of reaction runaways is essential to the proper and safe design of the system. Further laboratory tests showed that at higher temperature, the PGM catalyst not only hydrogenated the ethyl acetate back to ethanol but also caused decarbonylation and hydrogenation of the ethanol to methane. It was concluded that these potential problems can be avoided by developing a reactor design with good flow distribution and a safe operating procedure with process control instrumentation that provides safe shutdown in the event of liquid feed failure. Initially, after the liquid feed to the reactor is stopped, much of the liquid held up in the catalyst bed will drain out of the reactor. However, significant amounts of liquid will remain within the catalyst particles and interstitial spaces. If hydrogen is continually supplied to the reactor, the remaining liquid will continue to react and in the absence of liquid flow to remove the reaction heat, the reactor
190
195
200
205
210
215
220
225
230
distance down reactor
cata
lyst
tem
pera
ture
(°C
)
predicted temp plant temp
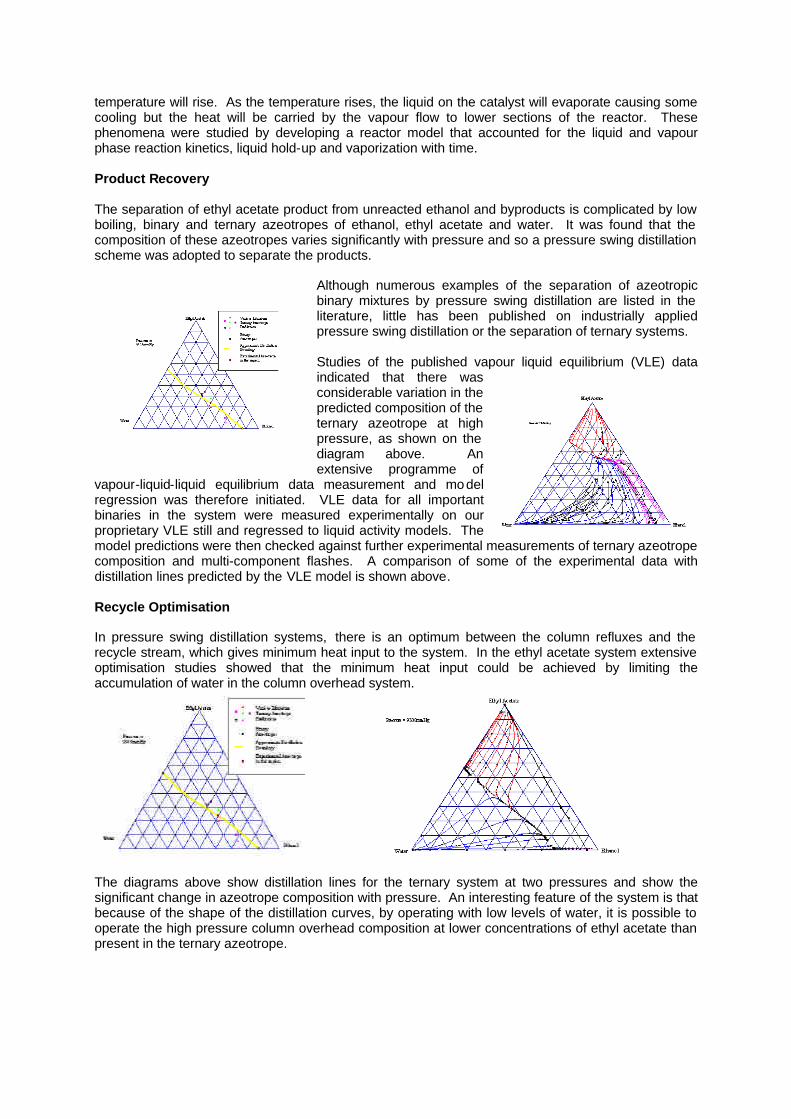
temperature will rise. As the temperature rises, the liquid on the catalyst will evaporate causing some cooling but the heat will be carried by the vapour flow to lower sections of the reactor. These phenomena were studied by developing a reactor model that accounted for the liquid and vapour phase reaction kinetics, liquid hold-up and vaporization with time. Product Recovery The separation of ethyl acetate product from unreacted ethanol and byproducts is complicated by low boiling, binary and ternary azeotropes of ethanol, ethyl acetate and water. It was found that the composition of these azeotropes varies significantly with pressure and so a pressure swing distillation scheme was adopted to separate the products.
Although numerous examples of the separation of azeotropic binary mixtures by pressure swing distillation are listed in the literature, little has been published on industrially applied pressure swing distillation or the separation of ternary systems. Studies of the published vapour liquid equilibrium (VLE) data indicated that there was considerable variation in the predicted composition of the ternary azeotrope at high pressure, as shown on the diagram above. An extensive programme of
vapour-liquid-liquid equilibrium data measurement and model regression was therefore initiated. VLE data for all important binaries in the system were measured experimentally on our proprietary VLE still and regressed to liquid activity models. The model predictions were then checked against further experimental measurements of ternary azeotrope composition and multi-component flashes. A comparison of some of the experimental data with distillation lines predicted by the VLE model is shown above. Recycle Optimisation In pressure swing distillation systems, there is an optimum between the column refluxes and the recycle stream, which gives minimum heat input to the system. In the ethyl acetate system extensive optimisation studies showed that the minimum heat input could be achieved by limiting the accumulation of water in the column overhead system.
The diagrams above show distillation lines for the ternary system at two pressures and show the significant change in azeotrope composition with pressure. An interesting feature of the system is that because of the shape of the distillation curves, by operating with low levels of water, it is possible to operate the high pressure column overhead composition at lower concentrations of ethyl acetate than present in the ternary azeotrope.
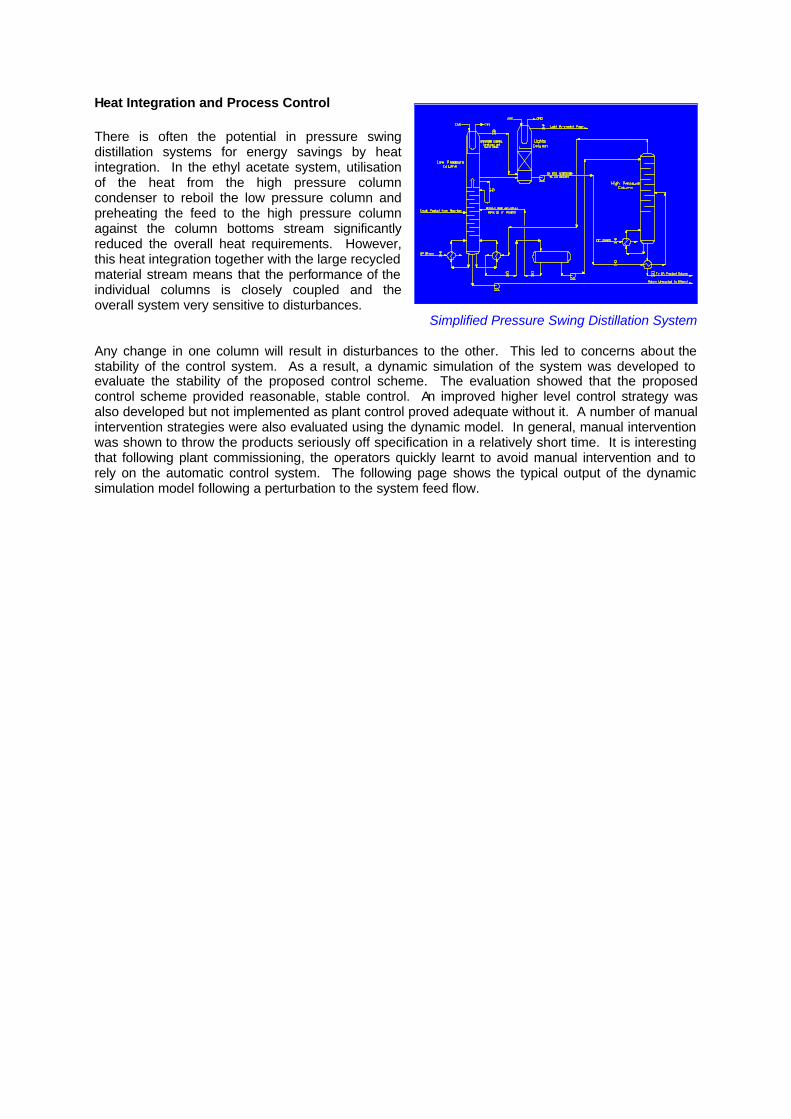
Heat Integration and Process Control There is often the potential in pressure swing distillation systems for energy savings by heat integration. In the ethyl acetate system, utilisation of the heat from the high pressure column condenser to reboil the low pressure column and preheating the feed to the high pressure column against the column bottoms stream significantly reduced the overall heat requirements. However, this heat integration together with the large recycled material stream means that the performance of the individual columns is closely coupled and the overall system very sensitive to disturbances. Simplified Pressure Swing Distillation System Any change in one column will result in disturbances to the other. This led to concerns about the stability of the control system. As a result, a dynamic simulation of the system was developed to evaluate the stability of the proposed control scheme. The evaluation showed that the proposed control scheme provided reasonable, stable control. An improved higher level control strategy was also developed but not implemented as plant control proved adequate without it. A number of manual intervention strategies were also evaluated using the dynamic model. In general, manual intervention was shown to throw the products seriously off specification in a relatively short time. It is interesting that following plant commissioning, the operators quickly learnt to avoid manual intervention and to rely on the automatic control system. The following page shows the typical output of the dynamic simulation model following a perturbation to the system feed flow.
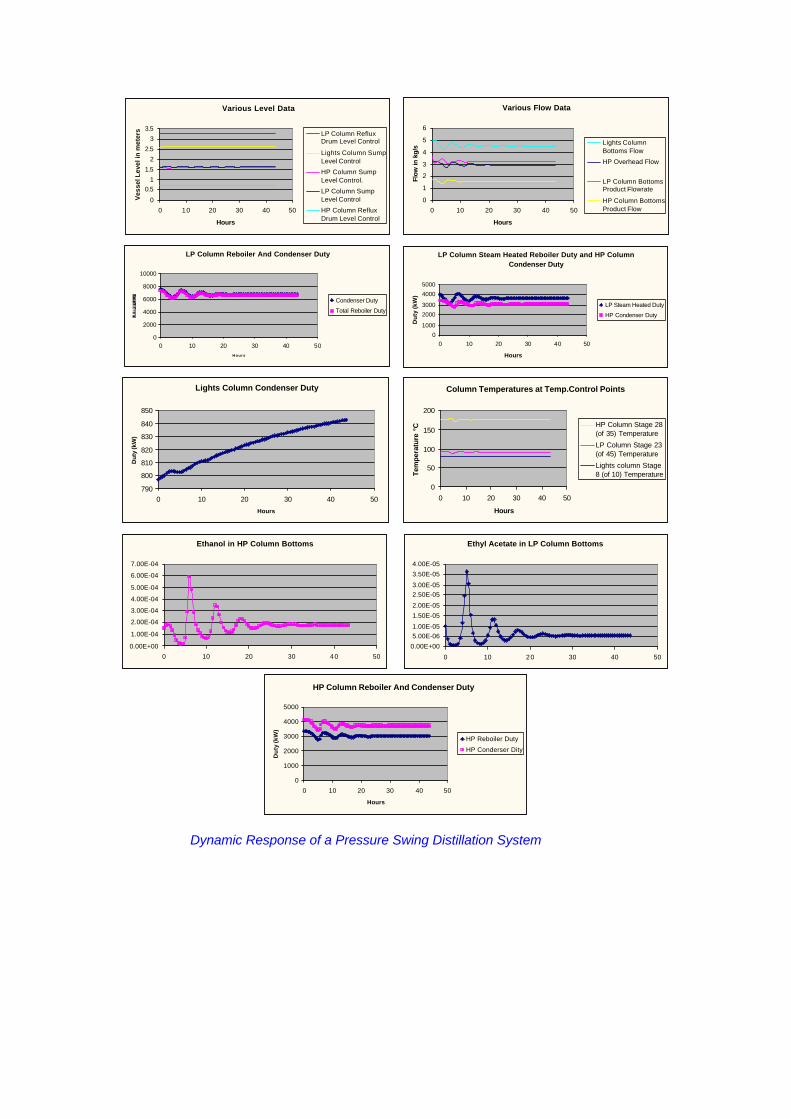
LP Column Reboiler And Condenser Duty
0
2000
4000
6000
8000
10000
0 10 20 30 40 50Hours
Condenser Duty
Total Reboiler Duty
Lights Column Condenser Duty
790
800
810
820
830
840
850
0 10 20 30 40 50
Hours
Dut
y (k
W)
LP Column Steam Heated Reboiler Duty and HP Column Condenser Duty
0
1000
2000
3000
4000
5000
0 10 20 30 40 50
Hours
Du
ty (k
W)
LP Steam Heated Duty
HP Condenser Duty
Ethyl Acetate in LP Column Bottoms
0.00E+00
5.00E-061.00E-05
1.50E-05
2.00E-05
2.50E-053.00E-05
3.50E-05
4.00E-05
0 10 20 30 40 50
Ethanol in HP Column Bottoms
0.00E+00
1.00E-04
2.00E-04
3.00E-04
4.00E-04
5.00E-04
6.00E-04
7.00E-04
0 10 20 30 40 50
Various Level Data
0
0.51
1.5
2
2.5
3
3.5
0 10 20 30 40 50
Hours
Ves
sel L
evel
in m
eter
s LP Column RefluxDrum Level Control
Lights Column SumpLevel Control
HP Column SumpLevel Control.
LP Column SumpLevel Control
HP Column RefluxDrum Level Control
Various Flow Data
0
1
2
3
4
5
6
0 10 20 30 40 50
Hours
Flow
in k
g/s
Lights ColumnBottoms Flow
HP Overhead Flow
LP Column BottomsProduct Flowrate
HP Column BottomsProduct Flow
Column Temperatures at Temp.Control Points
0
50
100
150
200
0 10 20 30 40 50
Hours
Tem
pera
ture
°C HP Column Stage 28
(of 35) Temperature
LP Column Stage 23(of 45) Temperature
Lights column Stage8 (of 10) Temperature
HP Column Reboiler And Condenser Duty
0
1000
2000
3000
4000
5000
0 10 20 30 40 50
Hours
Du
ty (k
W)
HP Reboiler Duty
HP Conderser Dity
Dynamic Response of a Pressure Swing Distillation System
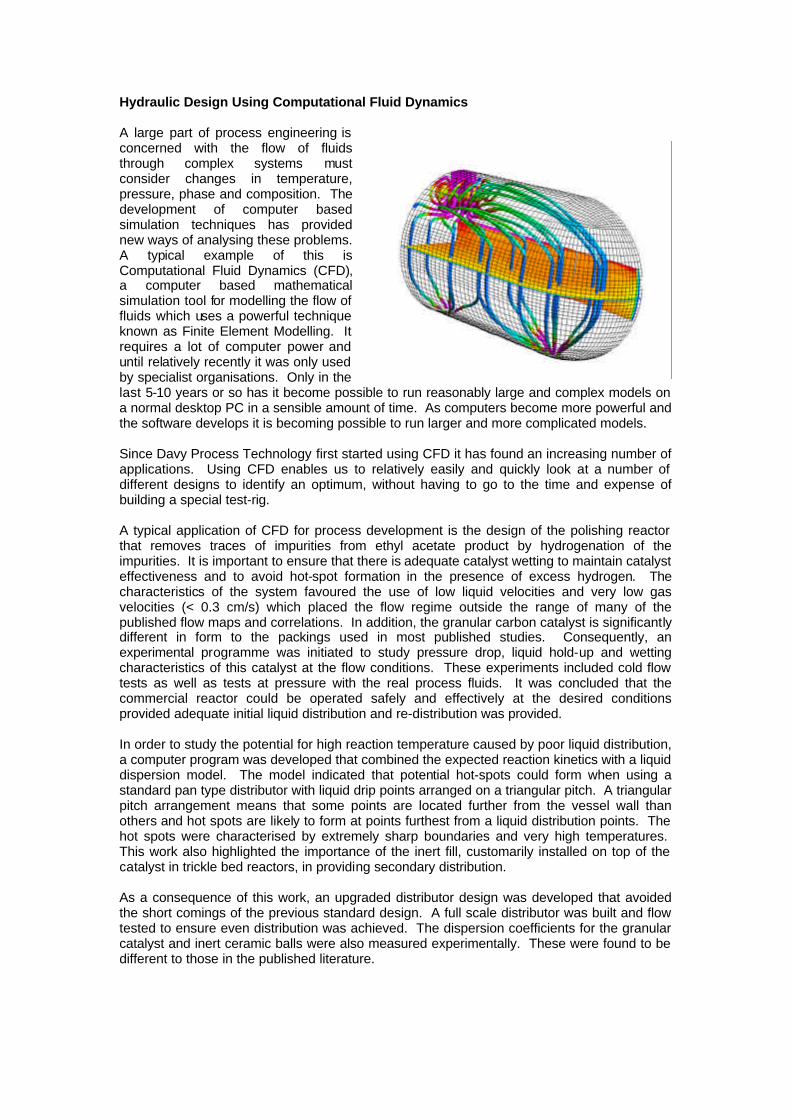
Hydraulic Design Using Computational Fluid Dynamics A large part of process engineering is concerned with the flow of fluids through complex systems must consider changes in temperature, pressure, phase and composition. The development of computer based simulation techniques has provided new ways of analysing these problems. A typical example of this is Computational Fluid Dynamics (CFD), a computer based mathematical simulation tool for modelling the flow of fluids which uses a powerful technique known as Finite Element Modelling. It requires a lot of computer power and until relatively recently it was only used by specialist organisations. Only in the last 5-10 years or so has it become possible to run reasonably large and complex models on a normal desktop PC in a sensible amount of time. As computers become more powerful and the software develops it is becoming possible to run larger and more complicated models. Since Davy Process Technology first started using CFD it has found an increasing number of applications. Using CFD enables us to relatively easily and quickly look at a number of different designs to identify an optimum, without having to go to the time and expense of building a special test-rig. A typical application of CFD for process development is the design of the polishing reactor that removes traces of impurities from ethyl acetate product by hydrogenation of the impurities. It is important to ensure that there is adequate catalyst wetting to maintain catalyst effectiveness and to avoid hot-spot formation in the presence of excess hydrogen. The characteristics of the system favoured the use of low liquid velocities and very low gas velocities (< 0.3 cm/s) which placed the flow regime outside the range of many of the published flow maps and correlations. In addition, the granular carbon catalyst is significantly different in form to the packings used in most published studies. Consequently, an experimental programme was initiated to study pressure drop, liquid hold-up and wetting characteristics of this catalyst at the flow conditions. These experiments included cold flow tests as well as tests at pressure with the real process fluids. It was concluded that the commercial reactor could be operated safely and effectively at the desired conditions provided adequate initial liquid distribution and re-distribution was provided. In order to study the potential for high reaction temperature caused by poor liquid distribution, a computer program was developed that combined the expected reaction kinetics with a liquid dispersion model. The model indicated that potential hot-spots could form when using a standard pan type distributor with liquid drip points arranged on a triangular pitch. A triangular pitch arrangement means that some points are located further from the vessel wall than others and hot spots are likely to form at points furthest from a liquid distribution points. The hot spots were characterised by extremely sharp boundaries and very high temperatures. This work also highlighted the importance of the inert fill, customarily installed on top of the catalyst in trickle bed reactors, in providing secondary distribution. As a consequence of this work, an upgraded distributor design was developed that avoided the short comings of the previous standard design. A full scale distributor was built and flow tested to ensure even distribution was achieved. The dispersion coefficients for the granular catalyst and inert ceramic balls were also measured experimentally. These were found to be different to those in the published literature.
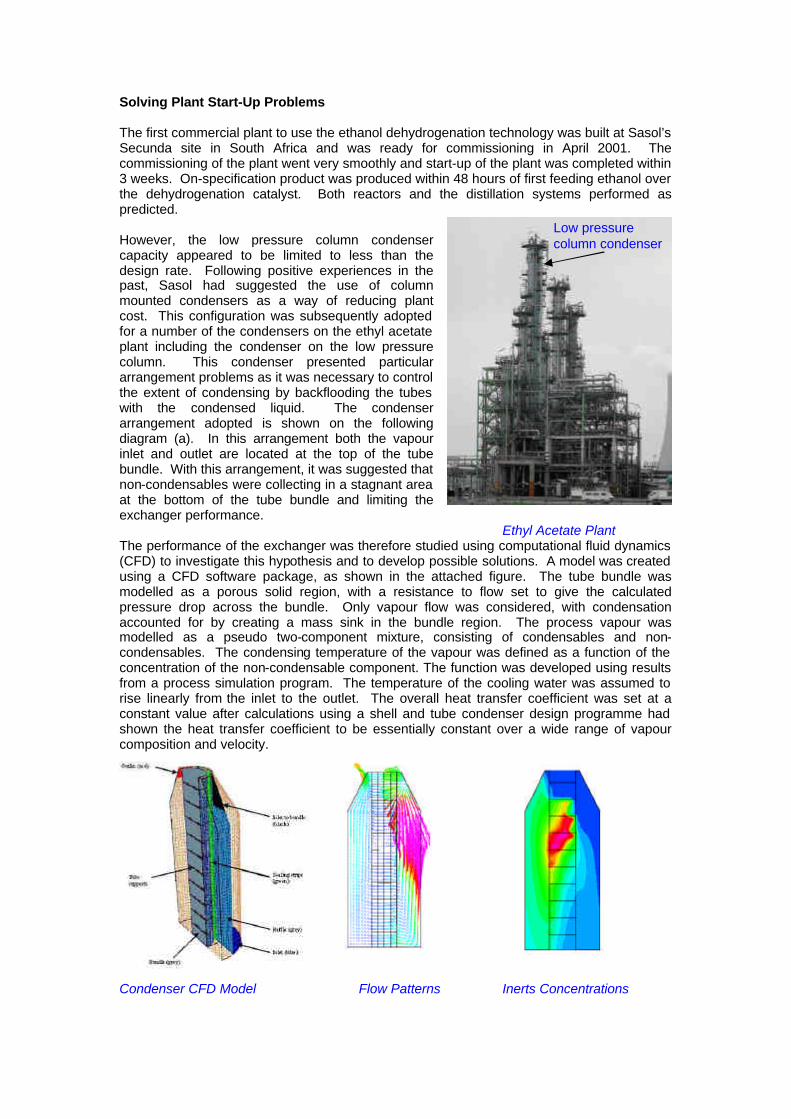
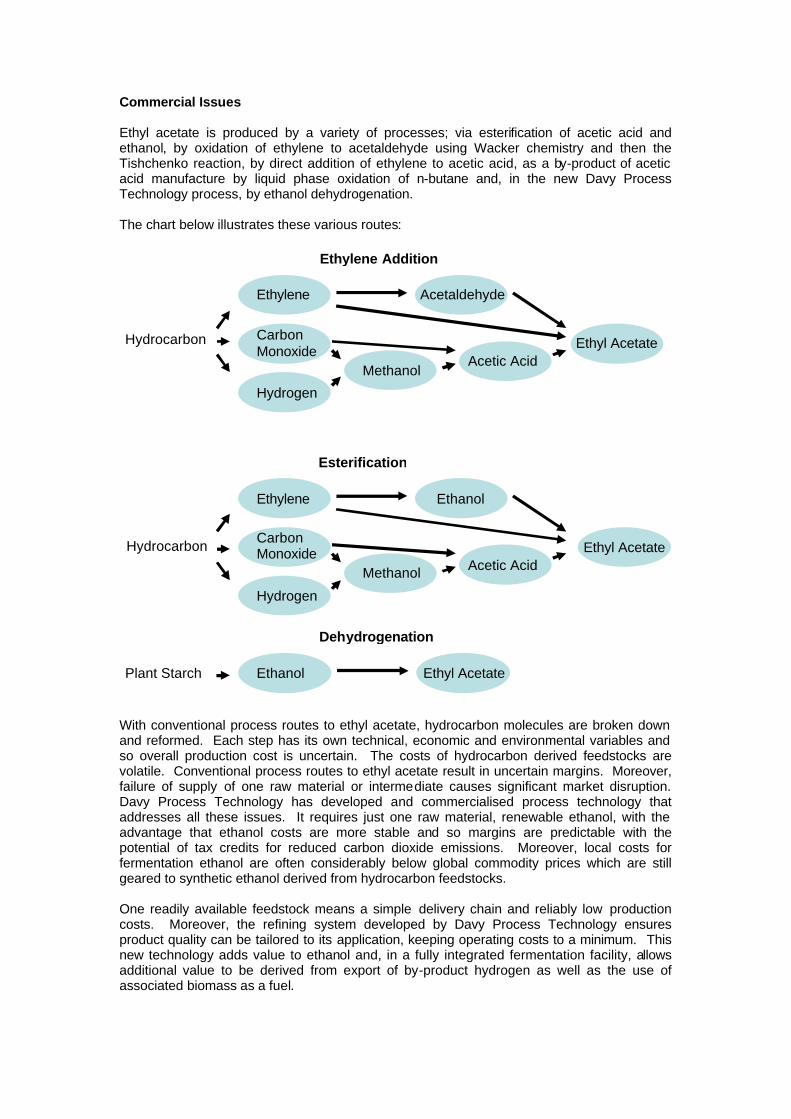
Solving Plant Start-Up Problems The first commercial plant to use the ethanol dehydrogenation technology was built at Sasol’s Secunda site in South Africa and was ready for commissioning in April 2001. The commissioning of the plant went very smoothly and start-up of the plant was completed within 3 weeks. On-specification product was produced within 48 hours of first feeding ethanol over the dehydrogenation catalyst. Both reactors and the distillation systems performed as predicted. However, the low pressure column condenser capacity appeared to be limited to less than the design rate. Following positive experiences in the past, Sasol had suggested the use of column mounted condensers as a way of reducing plant cost. This configuration was subsequently adopted for a number of the condensers on the ethyl acetate plant including the condenser on the low pressure column. This condenser presented particular arrangement problems as it was necessary to control the extent of condensing by backflooding the tubes with the condensed liquid. The condenser arrangement adopted is shown on the following diagram (a). In this arrangement both the vapour inlet and outlet are located at the top of the tube bundle. With this arrangement, it was suggested that non-condensables were collecting in a stagnant area at the bottom of the tube bundle and limiting the exchanger performance. Ethyl Acetate Plant The performance of the exchanger was therefore studied using computational fluid dynamics (CFD) to investigate this hypothesis and to develop possible solutions. A model was created using a CFD software package, as shown in the attached figure. The tube bundle was modelled as a porous solid region, with a resistance to flow set to give the calculated pressure drop across the bundle. Only vapour flow was considered, with condensation accounted for by creating a mass sink in the bundle region. The process vapour was modelled as a pseudo two-component mixture, consisting of condensables and non-condensables. The condensing temperature of the vapour was defined as a function of the concentration of the non-condensable component. The function was developed using results from a process simulation program. The temperature of the cooling water was assumed to rise linearly from the inlet to the outlet. The overall heat transfer coefficient was set at a constant value after calculations using a shell and tube condenser design programme had shown the heat transfer coefficient to be essentially constant over a wide range of vapour composition and velocity.
Condenser CFD Model Flow Patterns Inerts Concentrations
Low pressure column condenser

The results of the analysis confirmed that the original exchanger design should have been capable of the design duty and indicated that a stagnant zone is unlikely to exist at the bottom of the exchanger and the highest concentration of non-condensables (the red area on the diagram) accumulates in the bundle approximately one third of the way down. Although the CFD analysis failed to identify the cause of exchanger underperformance, the cause was immediately identified when the exchanger bundle was pulled at the next convenient shutdown. Due to a construction fault, the exchanger inlet was located on the same side of the exchanger as the outlet and after correction, design capacity was achieved. Interestingly, the CFD model predicted the extent of the exchanger underperformance that was observed on the plant when the original “as constructed” configuration was modelled. Prediction of Fault Conditions At its most basic level, process system fault prediction entails considering all of the possibilities that may occur and ensuring that adequate controls are included to encompass these conditions. In this way the overall system becomes more robust in its ability to withstand operational perturbations. This submission cannot encompass the consideration of the multiplicity of possibilities that can and should be examined during the course of the design of a catalytic reactor. However, in relation to the design of flow distributors for the selective hydrogenation reactor a single but crucial case has been chosen as an illustration. The design sequence for the example purification unit operation described above started with a definition of the chemistry of the ketone hydrogenation reaction: RHO + H = RHOH. The key question to pose at this preliminary stage is “What other reactions can occur?” Presuming that a temperature excursion may happen, the catalyst has the potential, at higher threshold levels, to hydrogenate other species present in the reactor. Firstly, it is possible for the product to be converted to methane as follows: C2H5OH + 2H2 = 2CH4 + H2O. With excess hydrogen for the ketone hydrogenation this second reaction will occur but even with a higher than normal temperature it will take place at a low rate as there is a vast excess of ethanol acting as a heat sink to prevent a run-away reaction. However, if the flow of ethanol is interrupted under these conditions it is possible for the catalyst bed to drain in some places so that the second reaction takes place in a static liquid film. If hydrogen continues to flow into the reactor it will preferentially flow through the drier region of the catalyst bed and so that sufficient heat may be generated to vaporise the ethanol. There is then the real possibility that ethanol vapour and hydrogen can react at the catalyst surface and the heat of reaction will raise the temperature of the catalyst thereby increasing the reaction rate. Once ethanol vapour has been locally exhausted, it is then possible for a second reaction to occur. This is the reduction of the carbon catalyst support to methane and if there is insufficient flow to remove the heat of reaction, the support temperature will rise further. The obvious solution for the prevention of this fault train is to automatically stop the flow of hydrogen to the reactor when the flow of ethanol is interrupted and reduce pressure in the reactor so that some of the ethanol vaporises with latent heat of vaporisation cooling the reactor contents. Again, the question arises, “Is this good enough to provide a robust design?” The following section demonstrates that there is one more technique that enables Davy Process Technology to provide to plant owners assurance of trouble-free operation.
Reverse Logic Fault Elimination This section again uses a catalytic reactor flow distributor as a vehicle to demonstrate how reverse logic consideration of the cause and effect fault train can lead to intrinsically improved design. The reverse logic thesis presumes that it is poor flow distribution that has caused temperature irregularities but these only become apparent when an upset like loss of liquid flow occurs. The next step is to carefully examine design details to assess whether this can occur and how it can be prevented from a first principles design basis.

The riser and down-comer spacing arrangement that is conventionally adopted is a triangular pitch as this ensures each distribution point is equidistant from its neighbours. The basic problem is that it is difficult to fit a triangular pitch into a circular vessel and nearly impossible if the distributor sheet is in sections that are bolted together within the vessel. Fluid dynamic modelling studies have shown that some areas of a catalyst bed near to the wall of the vessel may be starved of liquid and so offer a preferential pathway for gas. A relative lack of liquid heat-sink results in higher temperatures but under normal operating conditions this rise is limited by the low levels of ketone impurity that are available for reaction. These outer areas must be compared to ones at about a third of the radius where distributors tend to overlap thereby providing excess liquid and therefore lower gas flows. Excessive wetting of the catalyst bed provides extra cooling and a lower reaction rate because of the greater film thickness across which mass transfer occurs. The conventional design approach for temperature monitoring and control in catalytic reactors is to position probes in a matrix of wall to centre radii and top to bottom elevations of each catalyst bed. Average temperature is compared to the set value and liquid flow is adjusted accordingly. Deviation of one sensor away from the others indicates either measurement drift or poor distribution and if this is large, a trip condition is initiated. Again, CFD simulation modelling needs to be undertaken to predict normal temperature values and excursion conditions. These take into account the thermal properties of catalyst support, bulk liquid, liquid films, vaporised liquid and hydrogen. The results were surprising; it was possible for a cylinder with a diameter as small as 0.2 metre to sustain a sufficiently poor distribution for low liquid flow at its centre to generate significant temperature differences. Applying reverse logic to this situation, it is appropriate to simulate the unwanted hydrogenation reactions. The results show that within the same cylindrical dimensions and across the entire area of the reactor, it is possible for a high temperature condition to occur and if this happens in the lowest catalytic bed, the heat of reaction would be sufficient to dry out part of the bed above and so on to the top bed. The simulation shown here has peaks in gaseous flow and this means that in areas of low liquid flow very high temperatures can be sustained. If this occurs near to the reactor wall the vessel design reactor wall the vessel design temperature would be exceeded by a substantial margin. In an industrial scale reactor it would be impractical to install sufficient probes to ensure that every section of catalyst bed is free from poor flow conditions. The answer has to be to undertake detailed design of the distributor trays to ensure that there is no flow distribution problem and not to rely on temperature difference to initiate corrective control action.
Predicted flow in a hydrogenation reactor For each design option it is advisable to prepare a simulation model and to graphically display gas and liquid distributions. This does require fairly sophisticated software but the benefits in terms of safe and reliable plant operation are obvious. One approach to provide improved flow distribution is to use a concentric circular array for spacing risers and down-comers on distributor trays. This shows a simulation of gas and liquid flows and this indicates a much more even pattern of distribution than was shown for the
Correct Flow Distribution triangular pitch arrangement. This shows a simulation of gas and liquid flows and this indicates a much more even pattern of distribution than was shown for the triangular pitch arrangement. Further improvement can be gained by

introducing a layer of inert packing above the catalyst beds. Detailed modifications to the design of the distributor tray that are carried out in order meet mechanical strength, vibration resistance and fabrication requirements may exacerbate these effects by introducing leak paths or weirs that hinder free movement of liquid. Davy Process Technology ensured that process engineers check to detail designs for good flow distribution and impose checks on the final specifications of equipment. Product Specification The Davy Process Technology ethyl acetate process produces a high quality ethyl acetate product. Low carbonyl levels are achieved by the inclusion of proprietary selective hydrogenation technology. Furthermore, the use of pressure changes to break the ethyl acetate/ ethanol / water azeotrope leads to an inherently cleaner product than processes such as esterification or direct addition that operate separation systems in water rich regions of the phase diagram. The following table shows ethyl acetate product quality that is routinely achieved in the commercial scale plant in South Africa.
Specifications Typical Commercial Specification
Typical Plant Product
Ethyl Acetate, wt% 99.5 min 99.96
Ethanol, wt% 0.20 max 0.004
Water, wt% 0.05 max 0.02
Colour, APHA 10 10
Residual Odour None None
Specific Gravity, 20/20ºC 0.900 – 0.903 0.900 - 0.901
Environmental Aspects The consumption of ethyl acetate as an industrial solvent has increased in recent years, due in the main to it being preferred to Hazardous Atmospheric Pollutants (HAPs) such as MEK and MIBK. As a growth product, it was a legitimate target for process development. Until the introduction of the ethanol dehydrogenation process, there were a number of available production routes, all of which ultimately relied upon the use of non-renewable feedstocks, primarily natural gas or ethylene. In addition these routes require several steps, each with its own inefficiencies and by-product issues and they are not especially atom efficient. The major benefit of the Davy Process Technology process is that it relies only upon the availability of ethanol, the majority of which is produced by fermentation. As fermentation ethanol is derived from biomass and this relies on atmospheric carbon dioxide there is no depletion of non-renewable feedstocks. The major application of ethyl acetate is as a solvent in coatings and inks and this implies that it is lost by evaporation. In the atmosphere it is oxidised to carbon dioxide and water and if released into water, ethyl acetate is be lost primarily by evaporation (half-life of 10 hours in a typical river) and by biodegradation. Because the Davy Process Technology route is almost 100% carbon efficient there is no net carbon dioxide contribution. Moreover, the only by-product is hydrogen which is the ultimate clean fuel. Logically, plants based upon this process would be located close to sources of low cost ethanol. Additional benefits can be realised by integration of cane sugar, ethanol and ethyl acetate units in one location. Of particular benefit in this respect is the use of waste bagasse as a fuel to support the units. For the cane grower, the use of bagasse as an in-plant fuel often enables a better rate of return than can be obtained from export of surplus power to a local grid.
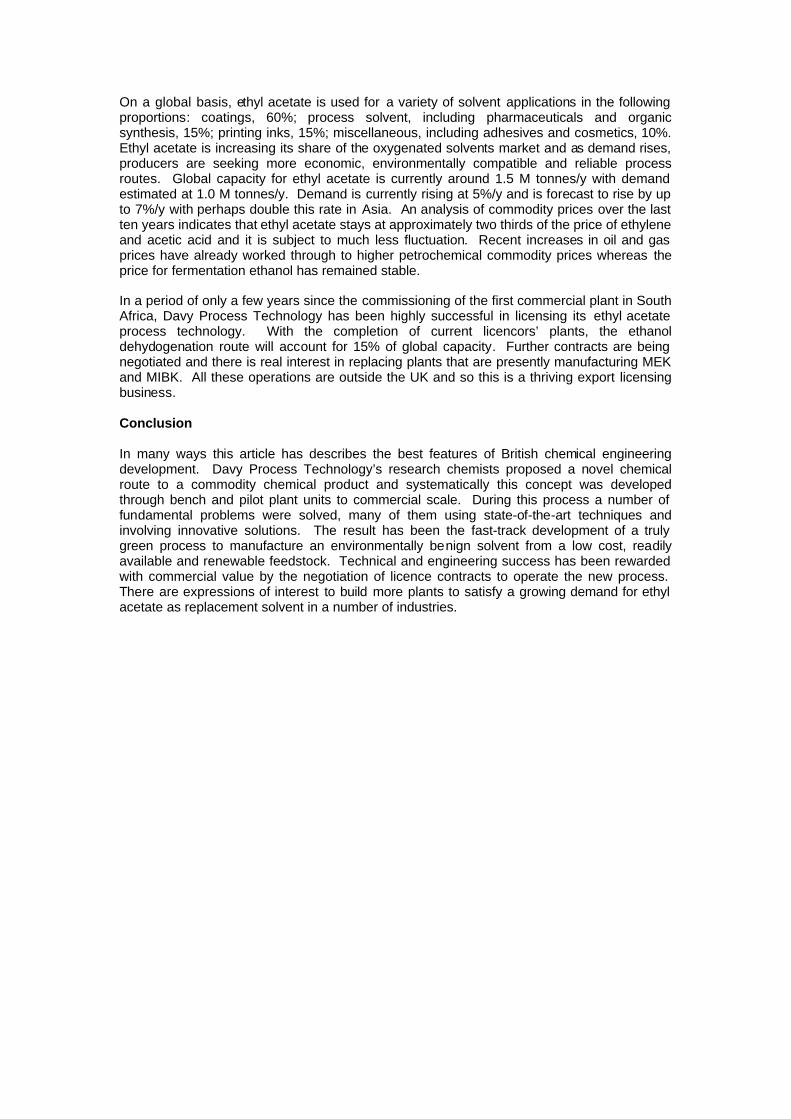
Commercial Issues Ethyl acetate is produced by a variety of processes; via esterification of acetic acid and ethanol, by oxidation of ethylene to acetaldehyde using Wacker chemistry and then the Tishchenko reaction, by direct addition of ethylene to acetic acid, as a by-product of acetic acid manufacture by liquid phase oxidation of n-butane and, in the new Davy Process Technology process, by ethanol dehydrogenation. The chart below illustrates these various routes:
With conventional process routes to ethyl acetate, hydrocarbon molecules are broken down and reformed. Each step has its own technical, economic and environmental variables and so overall production cost is uncertain. The costs of hydrocarbon derived feedstocks are volatile. Conventional process routes to ethyl acetate result in uncertain margins. Moreover, failure of supply of one raw material or intermediate causes significant market disruption. Davy Process Technology has developed and commercialised process technology that addresses all these issues. It requires just one raw material, renewable ethanol, with the advantage that ethanol costs are more stable and so margins are predictable with the potential of tax credits for reduced carbon dioxide emissions. Moreover, local costs for fermentation ethanol are often considerably below global commodity prices which are still geared to synthetic ethanol derived from hydrocarbon feedstocks. One readily available feedstock means a simple delivery chain and reliably low production costs. Moreover, the refining system developed by Davy Process Technology ensures product quality can be tailored to its application, keeping operating costs to a minimum. This new technology adds value to ethanol and, in a fully integrated fermentation facility, allows additional value to be derived from export of by-product hydrogen as well as the use of associated biomass as a fuel.
Ethylene
Carbon Monoxide
Hydrogen
Acetaldehyde
Methanol Acetic Acid
Ethyl Acetate
Ethylene
Carbon Monoxide
Hydrogen
Ethanol
Methanol Acetic Acid Ethyl Acetate
Hydrocarbon
Hydrocarbon
Ethylene Addition
Esterification
Ethanol Ethyl Acetate
Dehydrogenation
Plant Starch
On a global basis, ethyl acetate is used for a variety of solvent applications in the following proportions: coatings, 60%; process solvent, including pharmaceuticals and organic synthesis, 15%; printing inks, 15%; miscellaneous, including adhesives and cosmetics, 10%. Ethyl acetate is increasing its share of the oxygenated solvents market and as demand rises, producers are seeking more economic, environmentally compatible and reliable process routes. Global capacity for ethyl acetate is currently around 1.5 M tonnes/y with demand estimated at 1.0 M tonnes/y. Demand is currently rising at 5%/y and is forecast to rise by up to 7%/y with perhaps double this rate in Asia. An analysis of commodity prices over the last ten years indicates that ethyl acetate stays at approximately two thirds of the price of ethylene and acetic acid and it is subject to much less fluctuation. Recent increases in oil and gas prices have already worked through to higher petrochemical commodity prices whereas the price for fermentation ethanol has remained stable. In a period of only a few years since the commissioning of the first commercial plant in South Africa, Davy Process Technology has been highly successful in licensing its ethyl acetate process technology. With the completion of current licencors’ plants, the ethanol dehydogenation route will account for 15% of global capacity. Further contracts are being negotiated and there is real interest in replacing plants that are presently manufacturing MEK and MIBK. All these operations are outside the UK and so this is a thriving export licensing business. Conclusion In many ways this article has describes the best features of British chemical engineering development. Davy Process Technology’s research chemists proposed a novel chemical route to a commodity chemical product and systematically this concept was developed through bench and pilot plant units to commercial scale. During this process a number of fundamental problems were solved, many of them using state-of-the-art techniques and involving innovative solutions. The result has been the fast-track development of a truly green process to manufacture an environmentally benign solvent from a low cost, readily available and renewable feedstock. Technical and engineering success has been rewarded with commercial value by the negotiation of licence contracts to operate the new process. There are expressions of interest to build more plants to satisfy a growing demand for ethyl acetate as replacement solvent in a number of industries.
For further details please contact:
Davy Process Technology Limited20 Eastbourne terraceLondon W2 6LEUK
Tel: +44 (0)20 7957 4120Fax: +44 (0)20 7957 3922Mail: [email protected]: www.davyprotech.com
Davy Process Technology LimitedTechnology CentrePrinceton DriveStockton-on-TeesTS17 8PYUK
Tel: +44 (0) 1642 853 800Fax: +44 (0) 1642 853 801Mail: [email protected]: www.davyprotech.com
Davy Process Technology is a Johnson Matthey company