development of computational methods for evaluating loose
TRANSCRIPT

Development of Computational Methods for Evaluating
Loose-Fitting Powered Air-Purifying Respirators
Zhipeng Lei, Michael Bergman, George Niezgoda, EvanlyVo, and Ziqing Zhuang
CDC/NIOSH/NPPTL
EXPANDING RESEARCH PARTNERSHIPS: STATE OF THE SCIENCE CONFERENCE
Aurora, Colorado, June 21-23, 2017
Background
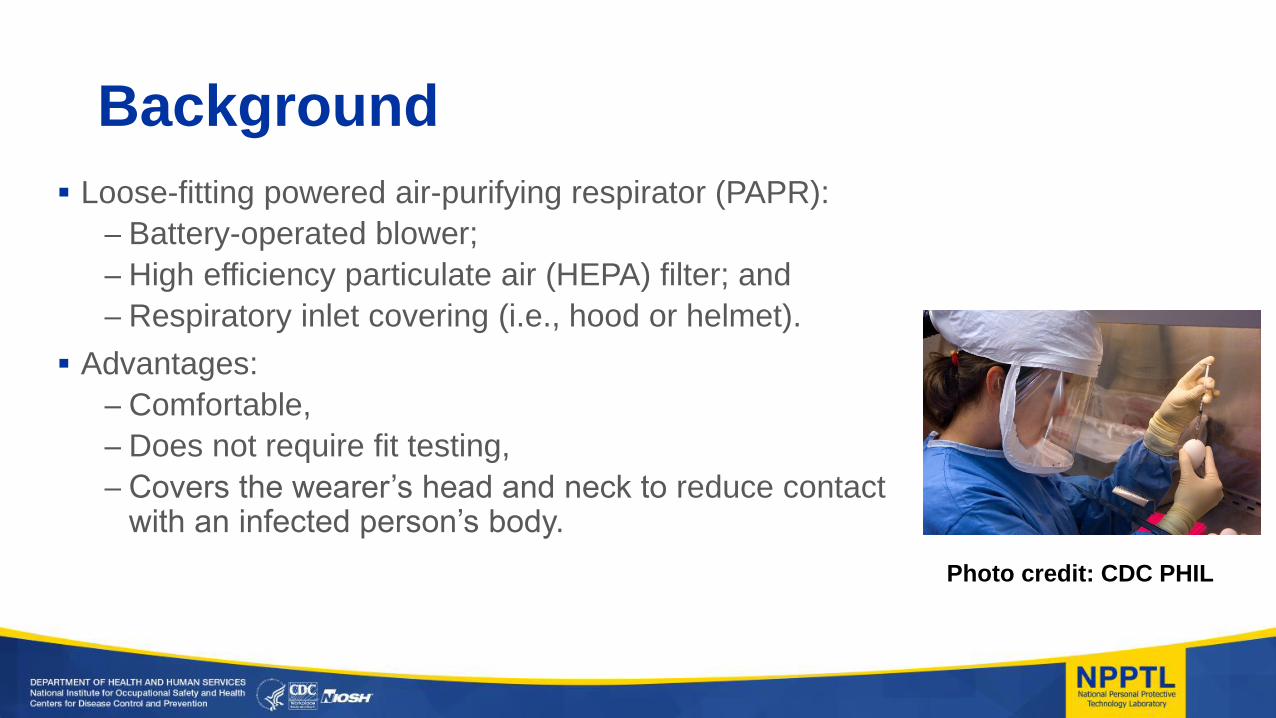
Loose-fitting powered air-purifying respirator (PAPR):
– Battery-operated blower;
– High efficiency particulate air (HEPA) filter; and
– Respiratory inlet covering (i.e., hood or helmet).
Advantages:
– Comfortable,
– Does not require fit testing,
– Covers the wearer’s head and neck to reduce contact with an infected person’s body.
Photo credit: CDC PHIL

Background Disadvantages:
– Heavy;– Noisy; and– Battery needs to be charged.
If supplied-air flow rate can be lower as long as it provides effective protection, this will lead to:
Smaller air blower and battery.
Quieter and lighter PAPR system.
There is a need to investigate factors that determine PAPR performance.
Photo credit: NIOSH NPPTL

CDC Innovation Fund (iFund) Project Title: Development of Advanced Methods for Evaluating and Designing
Loose-fitting Powered Air-purifying Respirators.
Highlight:
Computational Fluid Dynamics (CFD).
Python programming for software designing.

Objectives
The aim of this study was to develop computational methods for estimating
the performance of loose-fitting PAPRs.
– Develop a digital PAPR model and a digital headform model;
– Create CFD simulation for airflows and particles inside PAPR; and
– Explore the effects of breathing and supplied-air on particle leakage.

Headform Model
Medium-size, representing approximately 50% of the current U.S. workforce.
One of NIOSH ISO Digital Headforms*.
Construct a breathing tube for simulating breathing airflows.
Digital headform model
having a breathing tube
* A technical specification standard for ISO TC94 Personal
Protective Equipment, SC15 Respiratory Protective Devices, WG1
General, PG5 Human Factors, titled “ISO 16976-2 Respiratory
Protective Devices — Human Factors — Part 2: Anthropometrics”.
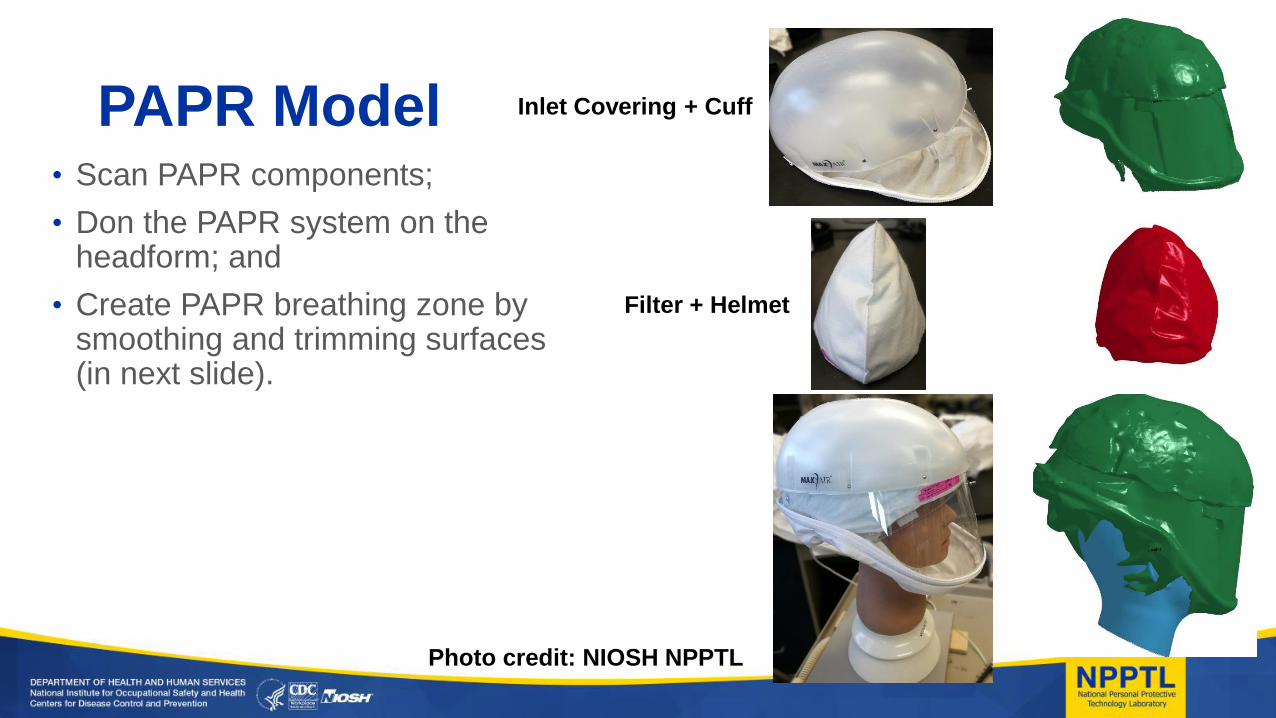
PAPR Model• Scan PAPR components;
• Don the PAPR system on the headform; and
• Create PAPR breathing zone by smoothing and trimming surfaces (in next slide).
Inlet Covering + Cuff
Filter + Helmet
Photo credit: NIOSH NPPTL
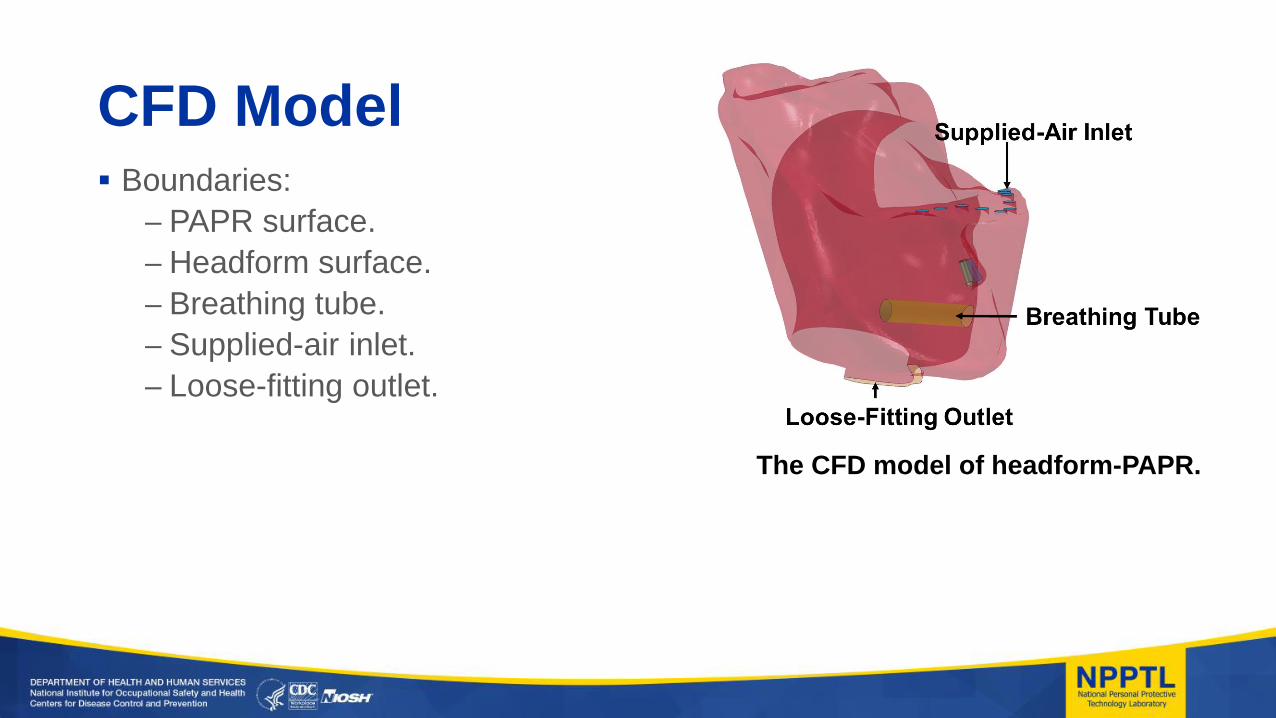
CFD Model Boundaries:
– PAPR surface.
– Headform surface.
– Breathing tube.
– Supplied-air inlet.
– Loose-fitting outlet.
The CFD model of headform-PAPR.

Spatial Discretization
• Used Snappyhexmesh provided by OpenFOAM software;
• Appled Adaptive mesh refinement at the wall, inlet, and outlet; and
• Divided into 913,653 hexahedral cells for the breathing zone.
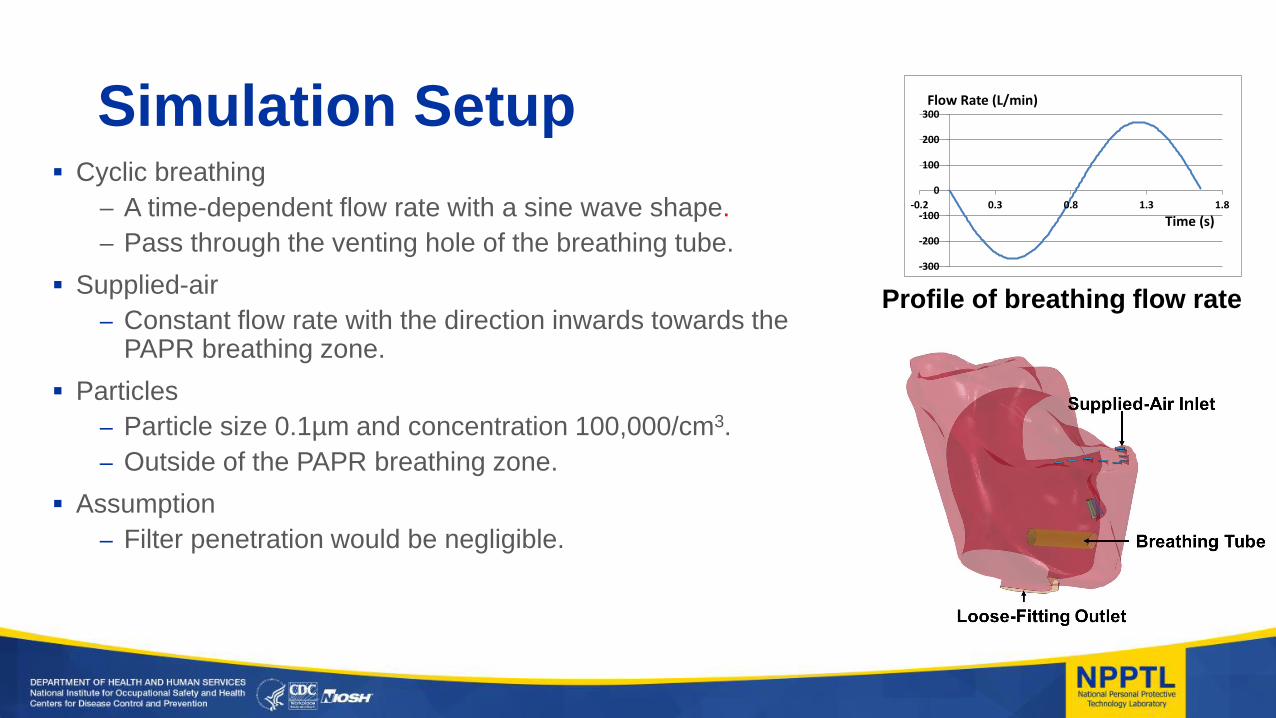
Simulation Setup Cyclic breathing
– A time-dependent flow rate with a sine wave shape.
– Pass through the venting hole of the breathing tube.
Supplied-air
– Constant flow rate with the direction inwards towards the PAPR breathing zone.
Particles
– Particle size 0.1µm and concentration 100,000/cm3.
– Outside of the PAPR breathing zone.
Assumption
– Filter penetration would be negligible.
-300
-200
-100
0
100
200
300
-0.2 0.3 0.8 1.3 1.8
Flow Rate (L/min)
Time (s)
Profile of breathing flow rate

Simulation Conditions• Light, moderate, and heavy breathing workloads (minute
ventilations of 35, 55, and 85 L/min) *.
• Different PAPR supplied-air flow rates (85, 115, 145, 175, and 195 L/min).
• 15 total simulations (3 workloads × 5 flow rates).
* Anderson NJ, Casidy PE, Janssen LL, Dengel DR. (2006) Peak Inspiratory Flows of
Adults Exercising at Light, Moderate and Heavy Work Loads. Journal of the International
Society for Respiratory Protection; Vol. 23.

Manikin Protection Factors (mPF)
𝑚𝑃𝐹 =𝐶𝑜𝐶𝑖
Where Co was the challenge particle concentration outside the PAPR and Ci was
the particle concentration inside the PAPR breathing zone.

ResultsVelocity Contour
(Heavy workload and 85 L/min supplied-air flow rate)
Pressure Contour
Click to play video

CFD Visualization
Visualization of flow
fields at peak inhalation
and exhalation (heavy
workload and 85 L/min
supplied-air flow rate).
Pressure Contour Velocity Contour Air Streamlines
Inhalation
Exhalation

Particle distribution
Particle distribution inside the PAPR inlet covering at different time instances of a
breathing cycle (heavy workload and 85 L/min supplied-air flow rate).

Summary of Estimated mPFs
Breathing
Workload
Supplied-Air Flow Rate
85 L/min 115 L/min 145 L/min 175 L/min 195 L/min
Light (35 L/min) > 10,000 > 10,000 > 10,000 > 10,000 > 10,000
Moderate (55 L/min) 31.8 > 10,000 > 10,000 > 10,000 > 10,000
Heavy (85 L/min) 6.6 10.6 43.1 > 10,000 > 10,000
The smaller estimated mPFs were found at heavier workloads and lowersupplied-air flow rates.

Discussion The CFD method is capable of simulating:
– Different breathing patterns;
– Different supplied-air flows of PAPR; and
– Aerosol particle dynamics.
The simulation results will be validated by
– Experiments; and
– Direct numerical simulation (DNS) using immersed boundary method (IBM).
Experimental setting
Photo credit: NIOSH NPPTL

Next Steps:• Include additional headforms and PAPRs;
• Explore the effects of particle sizes on leakage;
• Simulate heat stress inside PAPR; and
• Create Python program to help PAPR design.
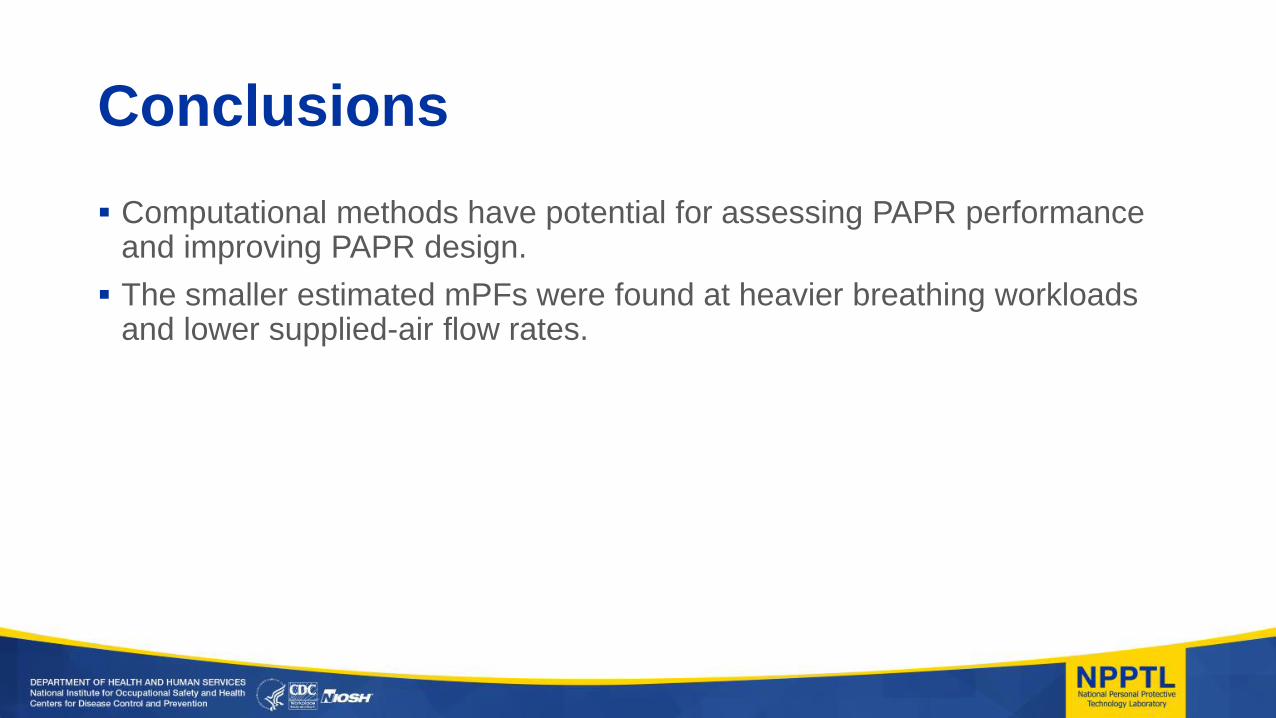
Conclusions
Computational methods have potential for assessing PAPR performance and improving PAPR design.
The smaller estimated mPFs were found at heavier breathing workloads and lower supplied-air flow rates.

Acknowledgments
This study was funded by CDC Innovation Fund (iFund), Office of Technology and Innovation (OTI), Office of the Associate Director for Science (OADS).
This research was supported in part by computational and storage resources managed by the Scientific Computing and Bioinformatics Support (SCBS) team, funded by the Office of Advanced Molecular Detection (OAMD) at the Centers for Disease Control and Prevention (CDC) in Atlanta, GA USA.

Quality Partnerships Enhance Worker Safety and HealthDISCLAIMER: The findings and conclusions in
this report are those of the author(s) and do not
necessarily represent the views of the National
Institute for Occupational Safety and Health.
DISCLAIMER: Mention of a product or use of
a photo does not constitute NIOSH
endorsement.Photos courtesy of NIOSH NPPTL

Evaluating a novel respirator seal integrity monitor
for controlling inhalation exposure of firefighters
Bingbing Wu, Michael Yermakov, Jonathan
Corey, Yan Liu, Sergey A. Grinshpun
Center for Health-Related Aerosol Studies
University of Cincinnati

Outline
• Background: Firefighter Exposure
• Concept: Real-time Respirator Seal Integrity
Monitor (ReSIM)
• Methodology: Laboratory Evaluation
• Results
• Conclusions
2

Background
3

Respirator performance
4
Workplace usage
Fit testing
(29 CFR 1910.134) N95, N99,
P100,…
Filter certification

Fire overhaul
5
• High concentration of toxic
particles from burning– Plastics
– Roofing
– Household chemicals
• Exposure associated with
adverse health outcomes
• Elastomeric respirators instead
of SCBA for overhaul

Combustion particles
• Combustion particles (Baxter et al., 2010)– Ultrafine (< 0.1 µm): > 70% by count
– Submicron (< 1 µm): > 99%
• Large particles (≳ 0.5 µm) are present in these
environments at low, but measureable,
concentration levels
6

Particle penetration into a respirator
• PLeakage >> PFilter
– Half-mask equipped with two P-100
filters challenged with combustion
particles (He et al., 2013)
7
Partially sealed Fully sealed
PLeakage + PFilter = 6 – 8 % PFilter = 0.001 – 0.011 %

Concept
8

Concept
• A new sensor should be able to measure
aerosol inside respirator
• It should be capable of detecting relatively
large particles (≳ 0.5 µm)
• Penetration of these large particles indicates a
performance failure (the respirator seal
integrity is compromised) 9

Respirator Seal Integrity Monitor
(ReSIM) prototype
• Particle detection– PPD60PV-T2 (Shinyei, Kobe, Japan) Particle Sensor Unit
– Utilizes the light scattering method
– Detects particles sizes ≳ 0.5 µm
– Low particle concentration detection threshold
– Inexpensive
• Data acquisition and recording module
• Pump, battery and circuitry
10

Objective
To evaluate the newly-developed ReSIM that
can rapidly detect the respirator performance
failure in real time and alert the wearer
11

Methodology
12

Laboratory evaluation of ReSIM
• Sensitivity and accuracy
– Calibration against a reference optical particle
spectrometer (flow-through set-up)
• Capability to detect respirator failure
– Testing the capability of ReSIM to detect a
faceseal leakage (manikin-based set-up)
13

Experimental set-up:
flow-through design
14
Sampling
ports
Collison
nebulize
rHEPA
filter
Air pump
Optical particle spectrometer (Grimm PAS 1.108)
ReSIM
device
Flow-through tunnel
Air pump

Experimental set-up:
manikin-based design
15
Connection to
the breathing
simulator
Solenoid valve
to control
leakage
Sampling port
P100 filter
To ReSIM

Experimental design (leak detection)
• Test chamber (24.3 m3)
• Challenge aerosols– Combustion
– NaCl
• Respirator seal failure simulation– An orifice (dia = 5 mm) in the faceseal to simulate a leak
– Controlled by a solenoid valve (leak vs. fully sealed mask)
– Leak openings for 5 s, 10 s, 15 s, and 20 s
• Respirator tested under cyclic breathing conditions– Mean inspiratory flow (MIF) rate = 30, 60 and 85 L/min
16

Results
17

Data processing of ReSIM
• ReSIM outputs– Fraction of time (%) during which ReSIM detects particles
– Output is recorded at 30-s intervals
• 3-step leak detection algorithm – Background level (non-leak): concentration inside a fully
sealed operating respirator
– Threshold: based on the rolling average of previous 5
consequtive intervals with no leaks created
– Leak: aerosol concentration > threshold
18

ReSIM calibration against a
Grimm OPC with NaCl aerosol
y = 3.86∙ln(x) + 8.35
R² = 0.936
0
5
10
15
20
25
30
35
0.1 1 10 100 1000Fra
ctio
n o
f ti
me
wh
en R
eSIM
det
ects
pa
rtic
les
(%)
Aerosol concentration (particles/cm3),
measured with a Grimm OPC in a range of 0.5 – 2 µm
Polluted Air
Normal Ambient Air
Very
Clean Air
19

Leak detection (combustion aerosol)
0
1
2
3
4
Fra
ctio
n o
f ti
me
wh
en R
eSIM
det
ects
pa
rtic
les
(%)
ReSIM processing interval
ReSIM measurements inside of the operating
respirator at MIF = 60 L/min
20
Threshold for leak detection

Leak detection (combustion aerosol)
0
1
2
3
4
Fra
ctio
n o
f ti
me
wh
en R
eSIM
det
ects
pa
rtic
les
(%)
ReSIM processing interval
ReSIM measurements inside of the operating
respirator at MIF = 60 L/min
No leak 5-s leak Threshold for leak
21
False
Negative
False
Positive

Leak detection (combustion aerosol)
22
ReSIM output at MIF = 60 L/min
10-cross: a 10-s leak intentionally timed to split the leak time
across two ReSIM processing intervals.

Leak detection vs. false negatives
(combustion aerosol)Flow rate MIF
(L/min)
Leak duration
(s)
Number of intervals with True leaks
correctly
identifiedtrue leaks false negatives
30
5 11 0 100%
10-cross 14 0 100%
10 8 0 100%
15 6 0 100%
20 6 0 100%
60
5 8 2 75%
10-cross 12 0 100%
10 6 0 100%
15 6 0 100%
20 6 0 100%
85
5 9 0 100%
10-cross 14 0 100%
10 8 0 100%
15 6 0 100%
20 6 0 100%
All Tests Overall 126 2 98.4%
Flow rate MIF
(L/min)
Leak duration
(s)
Number of intervals with True leaks
correctly
identifiedtrue leaks false negatives
30
5 11 0 100%
10-cross 14 0 100%
10 8 0 100%
15 6 0 100%
20 6 0 100%
60
5 8 2 75%
10-cross 12 0 100%
10 6 0 100%
15 6 0 100%
20 6 0 100%
85
5 9 0 100%
10-cross 14 0 100%
10 8 0 100%
15 6 0 100%
20 6 0 100%
All Tests Overall 126 2 98.4%
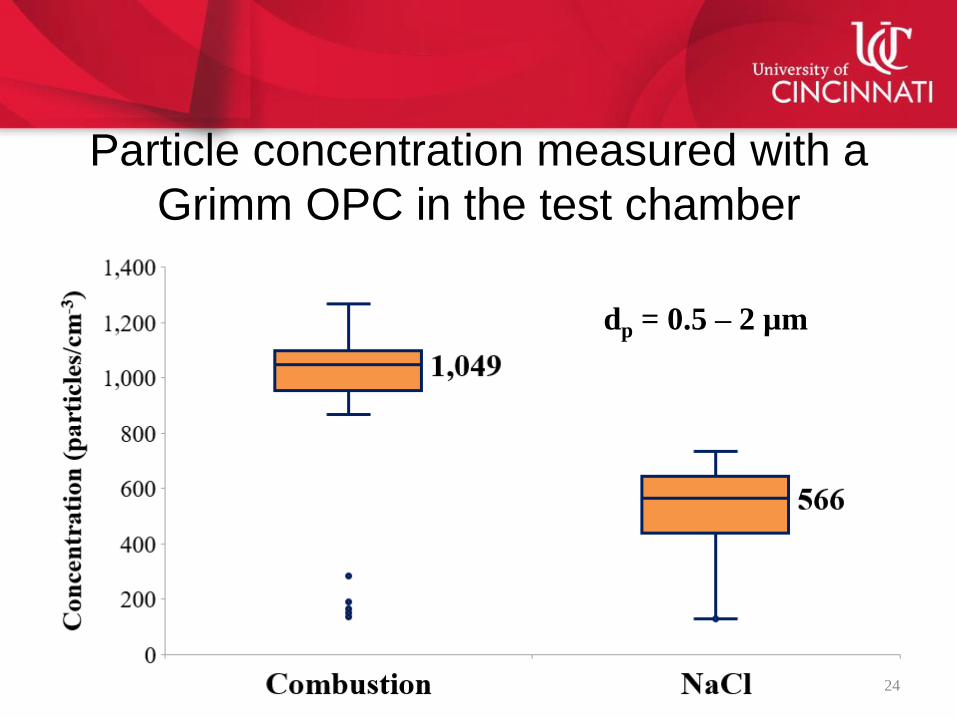
Particle concentration measured with a
Grimm OPC in the test chamber
24
dp = 0.5 – 2 µm

Leak detection vs. false negatives
(NaCl aerosol)Flow rate MIF
(L/min)
Leak duration
(s)
Number of intervals with True leaks
correctly
identifiedtrue leaks false negatives
30
5 8 0 100%
10-cross 14 0 100%
10 8 0 100%
15 5 0 100%
20 6 0 100%
60
5 9 9 0%
10-cross 12 8 33.3%
10 8 0 100%
15 6 0 100%
20 6 0 100%
85
5 8 8 0%
10-cross 12 10 16.7%
10 10 0 100%
15 6 0 100%
20 6 0 100%
All Tests Overall 124 35 71.8%
Flow rate MIF
(L/min)
Leak duration
(s)
Number of intervals with True leaks
correctly
identifiedtrue leaks false negatives
30
5 8 0 100%
10-cross 14 0 100%
10 8 0 100%
15 5 0 100%
20 6 0 100%
60
5 9 9 0%
10-cross 12 8 33.3%
10 8 0 100%
15 6 0 100%
20 6 0 100%
85
5 8 8 0%
10-cross 12 10 16.7%
10 10 0 100%
15 6 0 100%
20 6 0 100%
All Tests Overall 124 35 71.8%

Leak detection vs. false positives
Particle type
Flow rate
MIF
(L/min)
Number of intervals with
Correctly
identifiedno leak false
positives
Combustion
30 200 6 97.0%
60 124 5 96.0%
85 187 5 97.3%
All Tests 511 16 96.9%
NaCl
30 183 14 92.3%
60 142 1 99.3%
85 196 1 99.5%
All tests 521 16 96.9%

Leak detection vs. false positives
Particle type
Flow rate
MIF
(L/min)
Number of intervals withAdjusted
correctly
identifiedno leak false
positives
persistent
false
positives
adjusted
false
positives
Combustion
30 200 6 6 0 100%
60 124 5 5 0 100%
85 187 5 4 1 99.5%
All Tests 511 16 15 1 99.8%
NaCl
30 183 14 14 0 100%
60 142 1 1 0 100%
85 196 1 0 1 99.5%
All tests 521 16 15 1 99.8%
Conclusions
• High sensitivity and specificity
• Capable of rapidly detecting respirator
performance failure in real time and enact alarm
for a firefighter
• With modifications, can be applied to other
particulate filter respirators
28
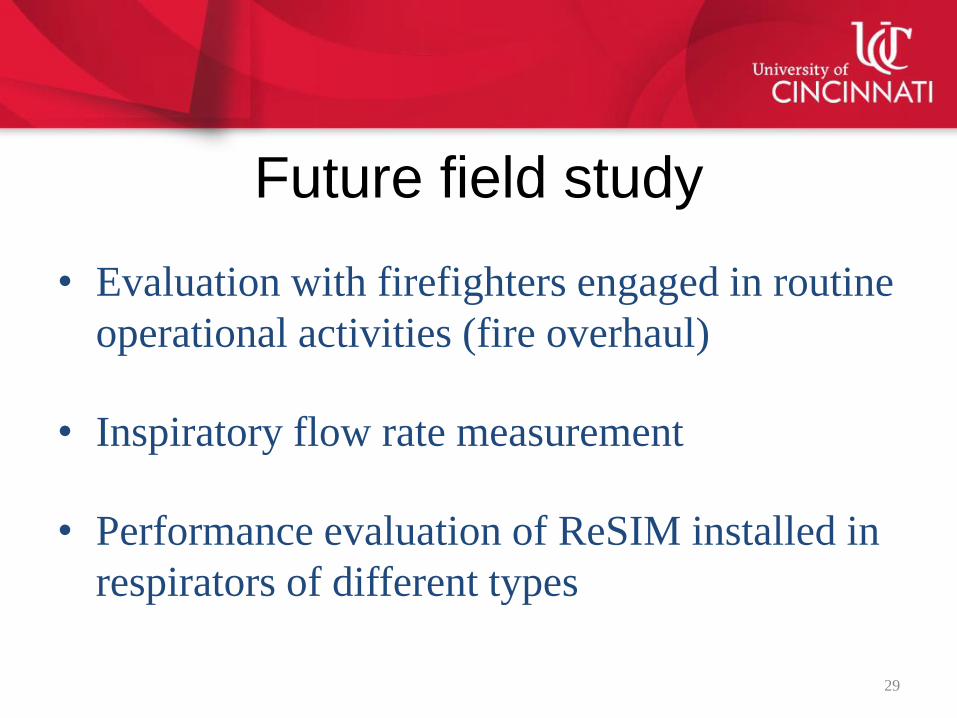
Future field study
• Evaluation with firefighters engaged in routine
operational activities (fire overhaul)
• Inspiratory flow rate measurement
• Performance evaluation of ReSIM installed in
respirators of different types
29

Acknowledgement
• Team– Dr. Sergey A. Grinshpun
– Dr. Michael Yermakov
– Dr. Jonathan Corey
– Yan Liu, PhD Student
– Bingbing Wu, PhD Student
• This work was supported by the Ohio Bureau
of Workers' Compensation30

7/3/2017
page 1
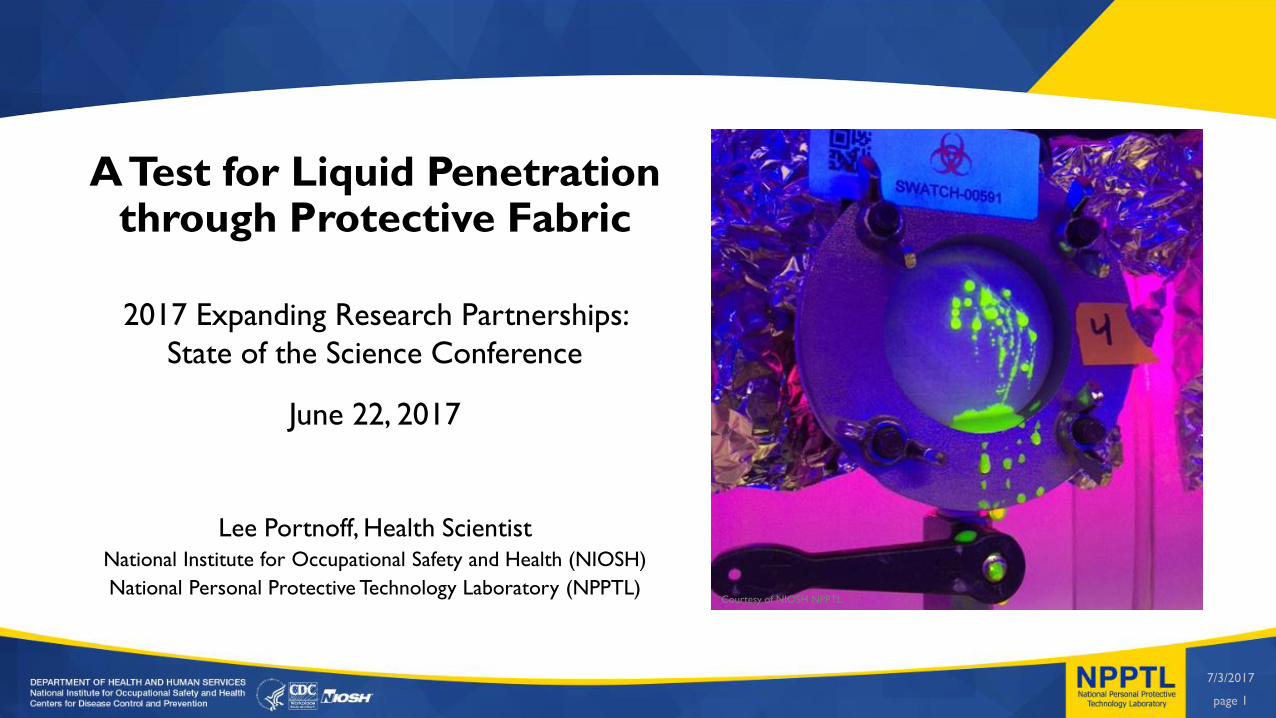
A Test for Liquid Penetration through Protective Fabric
Lee Portnoff, Health ScientistNational Institute for Occupational Safety and Health (NIOSH)
National Personal Protective Technology Laboratory (NPPTL)Courtesy of NIOSH NPPTL
2017 Expanding Research Partnerships:
State of the Science Conference
June 22, 2017

7/3/2017
page 2
National Personal Protective Technology Laboratory (NPPTL)Research Branch (Pittsburgh, PA)
NPPTL prevents work-related injury,
illness and death by advancing the
knowledge and application of
personal protective technologies
(PPT).
Courtesy of MSA and CDC PHIL

7/3/2017
page 3
Exposure
Research
Standards
Improving Standard Test Methods
Ebola VirusCourtesy of CDC PHIL
Courtesy of CDC PHIL

7/3/2017
page 4
Personal Protective Equipment (PPE)
Courtesy of CDC PHIL
Eye Protection
Respiratory Protection
Protective Clothing
Gloves
Foot Coverings

7/3/2017
page 5
Creative Commons
What quality of garment is needed?
A manufacturer may ask
Creative Commons

7/3/2017
page 6
Consumer Need
Creative Commons
Courtesy of CDC PHIL
For the most protective garment (Level 4),
A failure rate of one in 25 is acceptable
4% Acceptable Quality Level (AQL)
Will virus pass through my garment?
A consumer may ask

7/3/2017
page 7
Government Need
Courtesy of CDC PHIL
Do state, county, city, and hospital stockpiles provide viral protection?
An agency may ask
7/3/2017
page 8
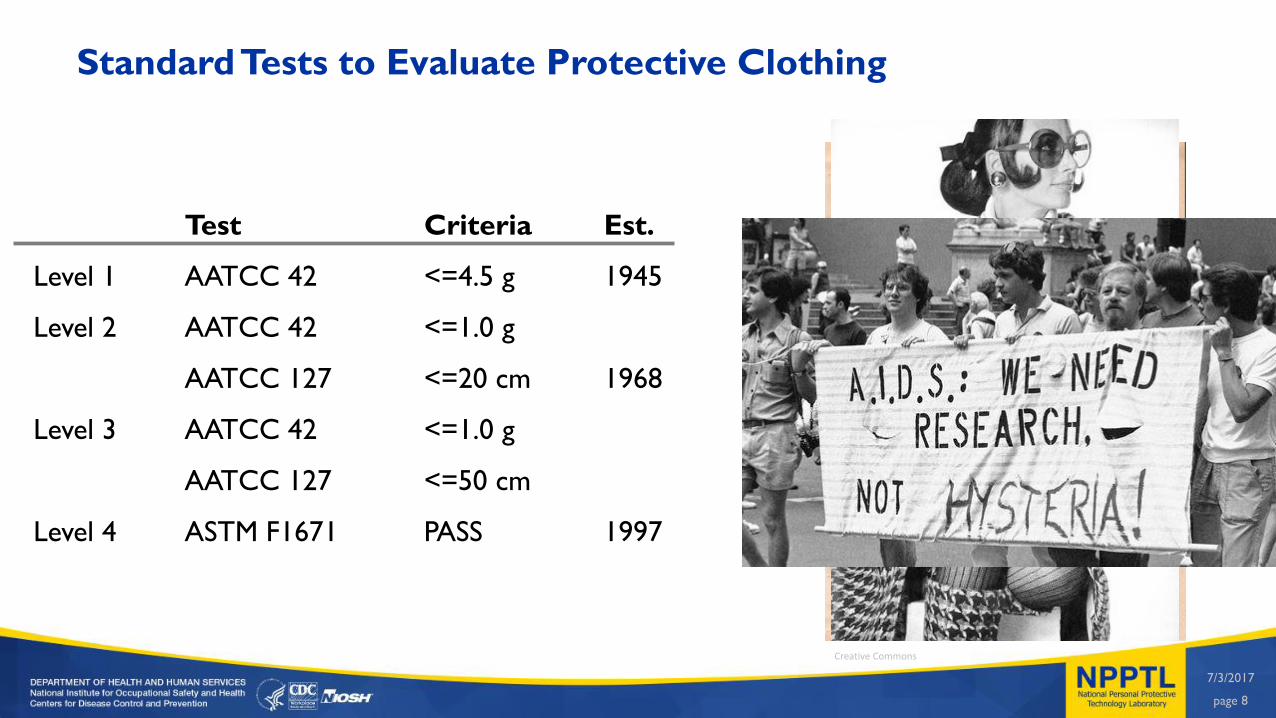
• Test Criteria Est.
•Level 1 AATCC 42 <=4.5 g 1945
•Level 2 AATCC 42 <=1.0 g
AATCC 127 <=20 cm 1968
•Level 3 AATCC 42 <=1.0 g
AATCC 127 <=50 cm
•Level 4 ASTM F1671 PASS 1997
Creative Commons
Standard Tests to Evaluate Protective Clothing

7/3/2017
page 9
http://www.cdc.gov/niosh/npptl/topics/protectiveclothing/default.html
Standard Description
AATCC 42 Water Resistance: Impact Penetration Test
AATCC 127 Water Resistance: Hydrostatic Pressure Test
ASTM F1670Standard Test Method for Resistance of Materials Used in Protective Clothing to Penetration
by Synthetic Blood
ASTM F1671Standard Test Method for Resistance of Materials Used in Protective Clothing to Penetration
by Bloodborne Pathogens Phi-X174 Bacteriophage Penetration as a Test System
ANSI/AAMI PB70Liquid barrier performance and classification of protective apparel and drapes intended for use
in healthcare facilities
ASTM F903Standard Test Method for Resistance of Materials Used in Protective Clothing to Penetration
by Liquids
ASTM F1819Standard Test Method for Resistance of Materials Used in Protective Clothing to Penetration
by Synthetic Blood Using a Mechanical Pressure Technique
ISO 16603
Clothing for Protection Against Contact with Blood and Body Fluids—Determination of the
Resistance of Protective Clothing Materials to Penetration by Blood and Body Fluids —Test
Methods Using Synthetic Blood
ISO 16604
Clothing for Protection Against Contact with Blood and Body Fluids—Determination of the
Resistance of Protective Clothing Materials to Penetration by Bloodborne Pathogens —Test
methods using Phi X-174 Bacteriophage
NFPA 1999 Standard on Protective Clothing for Emergency Medical Operations

7/3/2017
page 10
Courtesy of NIOSH NPPTL

7/3/2017
page 11
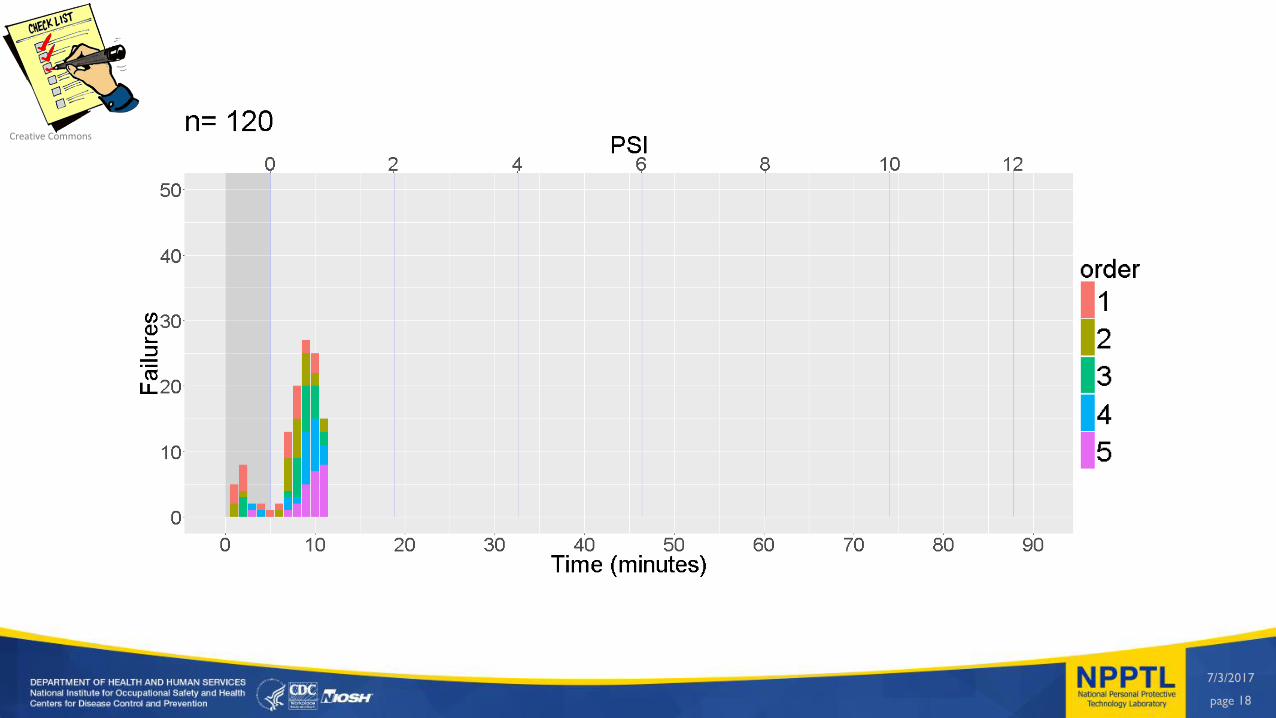
Continuous dataBinary data
Non-parametric vs. parametric data
Courtesy of NIOSH NPPTL
7/3/2017
page 12
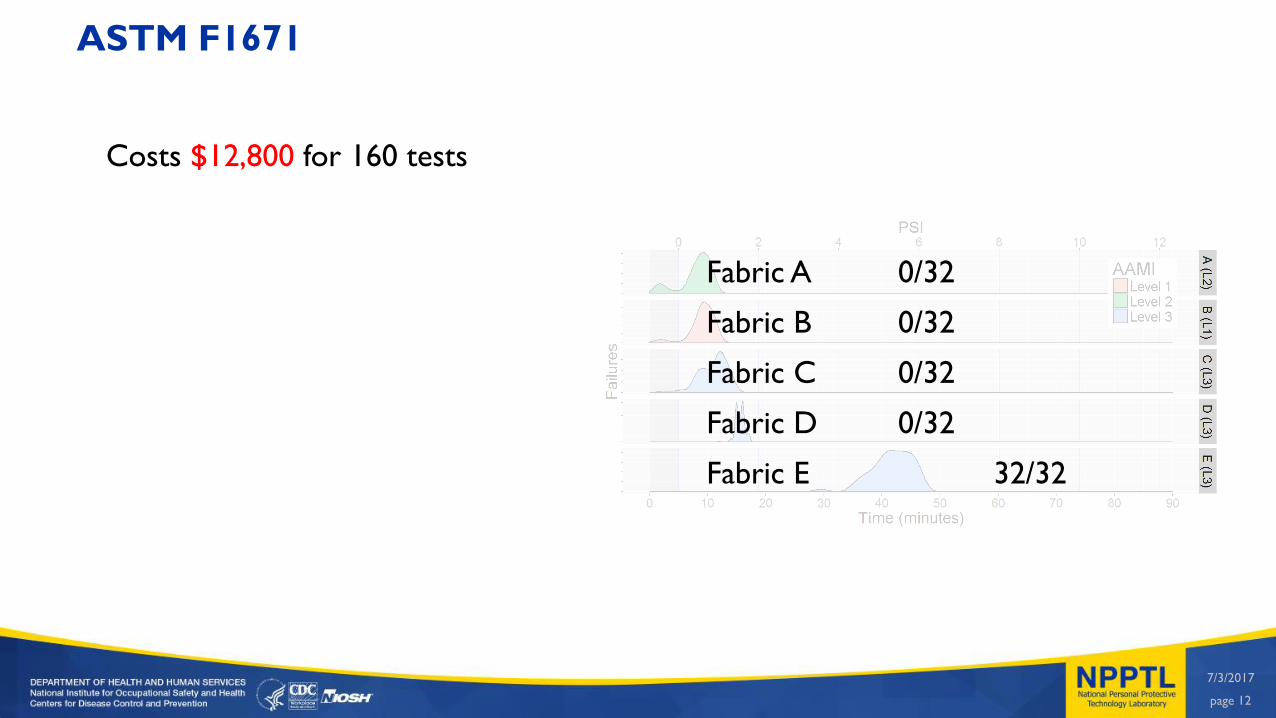
Costs $12,800 for 160 tests
Fabric A 0/32
Fabric B 0/32
Fabric C 0/32
Fabric D 0/32
Fabric E 32/32
ASTM F1671

7/3/2017
page 13
Pas
s
Fai
l
Consider the location of the fabric swatch
Courtesy of NIOSH NPPTLCourtesy of NIOSH NPPTL Courtesy of NIOSH NPPTL

7/3/2017
page 14
Hydrostatic Test (Video)
Courtesy of NIOSH NPPTL

7/3/2017
page 15
Courtesy of NIOSH NPPTL
Courtesy of NIOSH NPPTL

7/3/2017
page 16
Creative Commons

7/3/2017
page 17
Impact for Manufacturer
Creative Commons
7/3/2017
page 18
Creative Commons

7/3/2017
page 19
Creative Commons

7/3/2017
page 20
Impact for Consumer
Creative Commons

7/3/2017
page 21
virus broth
saline
sailine+surfynol
water
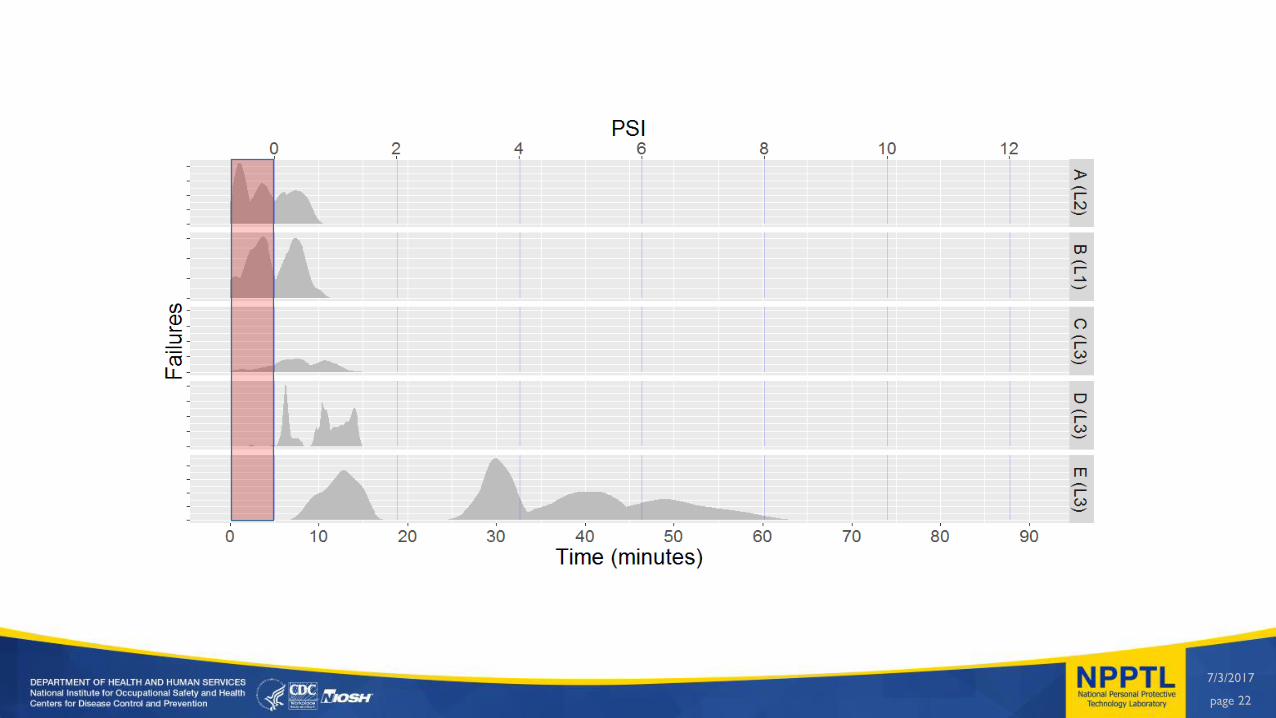
7/3/2017
page 22
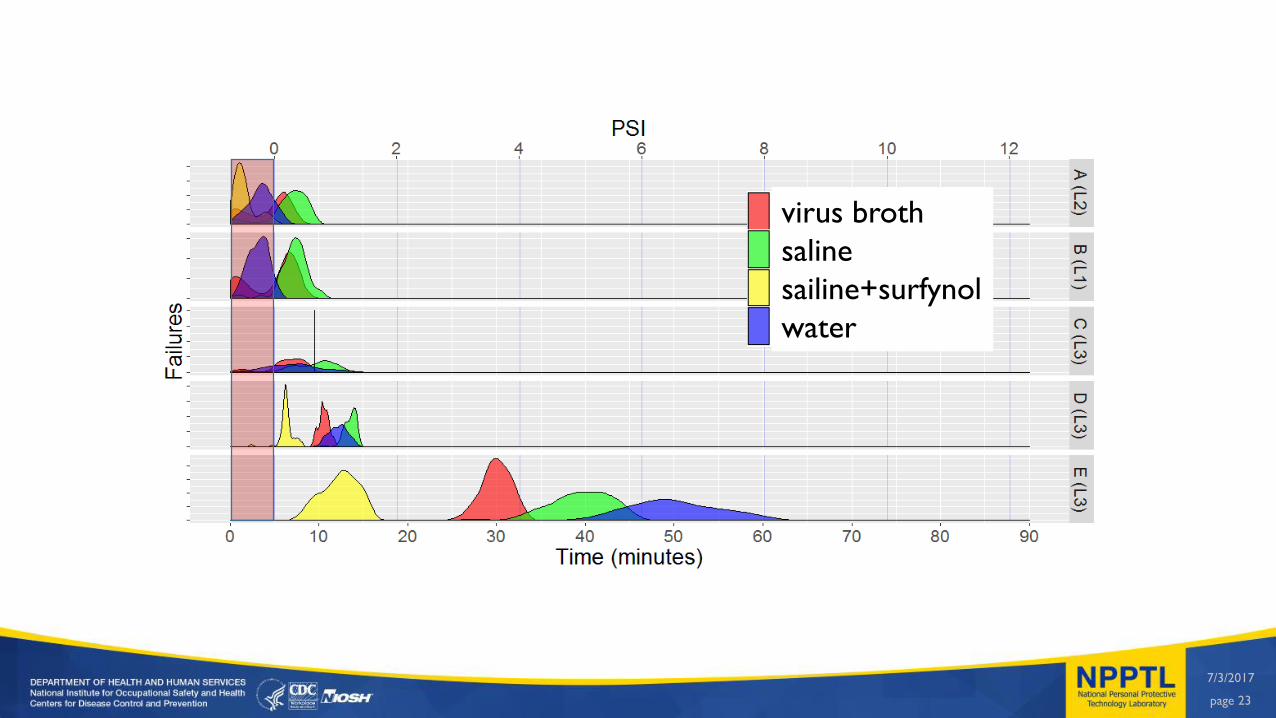
7/3/2017
page 23
virus broth
saline
sailine+surfynol
water
7/3/2017
page 24
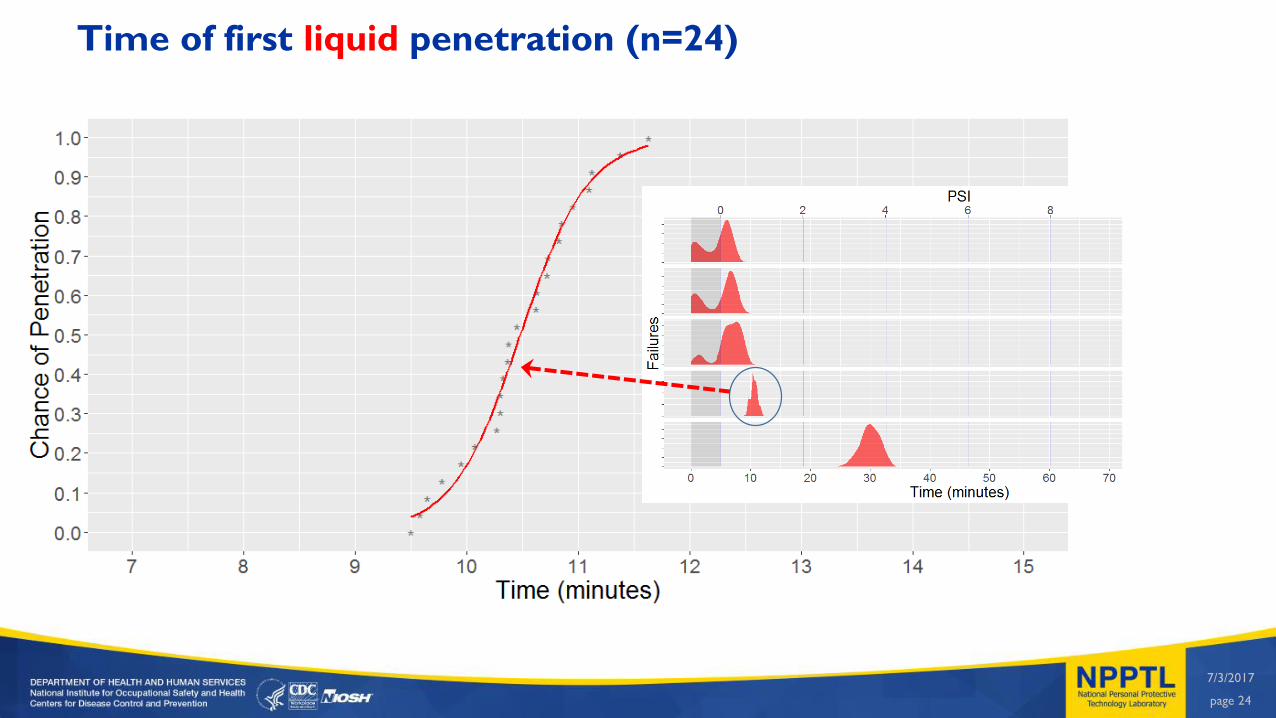
Time of first liquid penetration (n=24)

7/3/2017
page 25
Time of first viral penetration (n=36)
7/3/2017
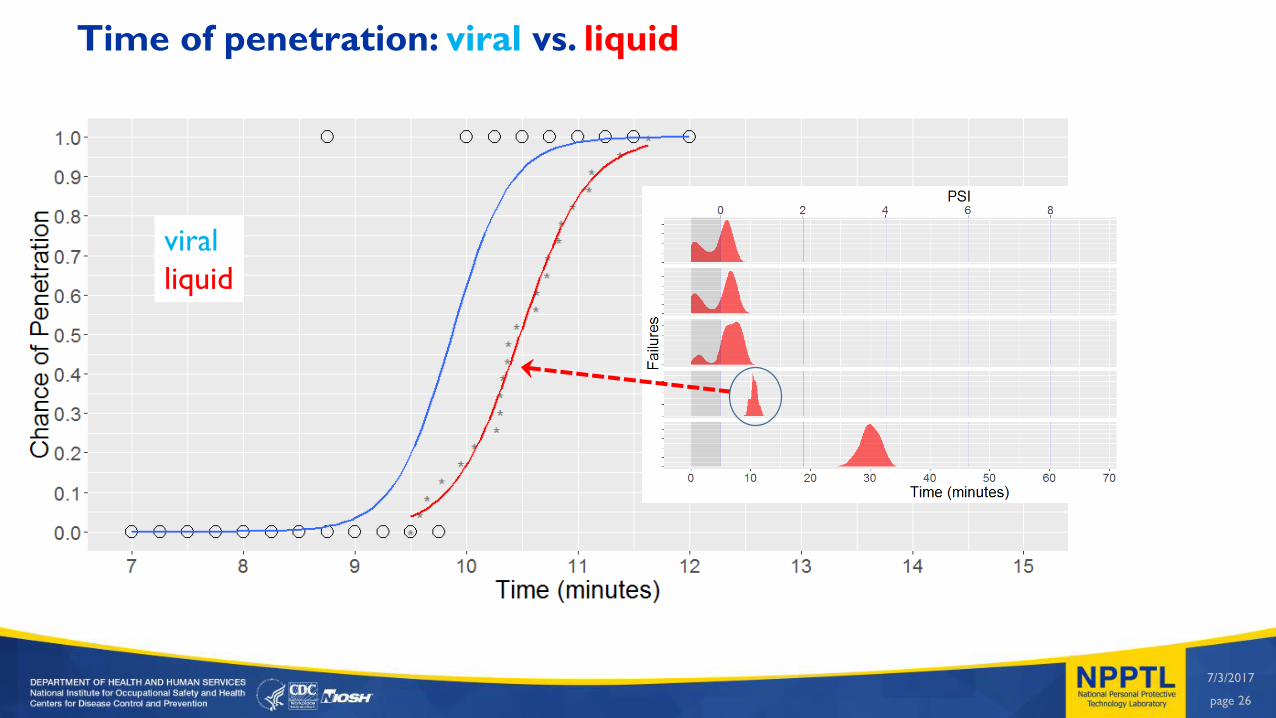
page 26
viral
liquid
Time of penetration: viral vs. liquid

7/3/2017
page 27
virus broth
saline
sailine+surfynol
water
7/3/2017
page 28
Current Work
Evaluating factors contributing to penetration (time, pressure, carrier fluid, virus type, screen/no-screen, pre-wetting, elevated temperature and RH
Writing manuscripts– ranking factors contributing to penetration
– dynamic hydrostatic test protocol
– comparing viral to liquid penetration

7/3/2017
page 29
Next Steps
To develop multi-modal models of liquid and viral penetration
To increase magnification/resolution of camera
To develop AI (Tensorflow open-source library) to record time and location of penetration events
To conduct experiments in dark with UV light
To propose as new ASTM test method

7/3/2017
page 30
Quality Partnerships Enhance Worker Safety and Health
DISCLAIMERS:The findings and conclusions in this presentation are those of the author(s)
and do not necessarily represent the views of the National institute for Occupational Safety and
Health. Mention of a product or use of a photo does not constitute NIOSH endorsement.
Courtesy of Kimberly-Clark and MSA
Lee Portnoff, Health Scientist
NIOSH Pittsburgh
626 Cochran Mill Road
Pittsburgh, PA 15236
Phone: 412-386-5570
Email: [email protected]
THANK YOU
This study was funded in part by CDC’s National Center for Emerging, Zoonotic, and Infectious Diseases (NCEZID)