development of calcium oxide solid reactant for the ut-3...
TRANSCRIPT

DEVELOPMENT OF CALCIUM OXIDE SOLID REACTANT FOR THE UT-3THERMOCHEMICAL CYCLE TO PRODUCE HYDROGEN FROM WATER
By
BENJAMIN GRANT HETTINGER
A THESIS PRESENTED TO THE GRADUATE SCHOOLOF THE UNIVERSITY OF FLORIDA IN PARTIAL FULFILLMENT
OF THE REQUIREMENTS FOR THE DEGREE OFMASTER OF SCIENCE
UNIVERSITY OF FLORIDA
2005

Copyright 2005
by
Benjamin Grant Hettinger

iii
ACKNOWLEDGMENTS
Many people have assisted me in the past year and a half with this thesis project
here at the University of Florida. I could not have completed this task without the help
these people who gave me their time, taught me knowledge, challenged me to think
critically, and supported me throughout the project.
I thank Dr. D. Yogi Goswami for the opportunity to investigate this challenging
research project and his encouragement to investigate all aspects of the project. I thank
my committee members, S. A. Sherif, Dr. H. Ingley, and Dr. H. Hagelin-Weaver, for
their advice and support throughout the project.
I thank Dr. Deshpande for his tireless efforts to aid me in understanding the
subject of my research, for continuing to push me to stay diligent, for helping me write
and edit my thesis, and for being a helpful advisor. He has been there at every step of
this project and helped to impart academic knowledge in many aspects of research. He
has especially helped me to more quickly grasp the chemical engineering and chemistry
which encompass the majority of this project.
I thank Chuck G. for teaching me how to use many of the tools at the shop and
also for imparting on me practical engineering knowledge and critical thinking. I also am
grateful for the members of the lab group that advised me on solutions to problems in
research, challenged me to investigate problems further, and who helped me to find and
to use items in the lab.

iv
I had a lot of help at the different facilities and with the variety of equipment I
used. I thank Dr. Anghai and Tom Carter and those at the nuclear laboratory for the use
of their facilities and friendly and helpful assistance. I also thank Dr. Hahn for the use of
the his aid in understanding Raman spectroscopy and X- Ray diffraction. I thank Gary
Scheiffele for his training on Raman spectroscopy and mercury porosimetry and his
willingness to help me understand their use and limitations. I thank Gill Brubaker for his
training on the NOVA machine for nitrogen adsorption analysis. I would also like to
thank other people at the Particle Science Engineering building who helped to orient me
with use of their equipment. I acknowledge financial support from the US Department of
Energy which allowed me to investigate this project. Without these people I could not
have finished my project.
I thank my parents, Jean and Glenn Hettinger, and the rest of my family in their
constant support of my education. I thank my friends and Kappa Sigma fraternity
brothers for their support and help over the years. Most of all I thank my Lord Jesus
Christ who has sustained me through life thus far especially during the tough times.

v
TABLE OF CONTENTS
page
ACKNOWLEDGMENTS ................................................................................................. iii
LIST OF TABLES............................................................................................................. ix
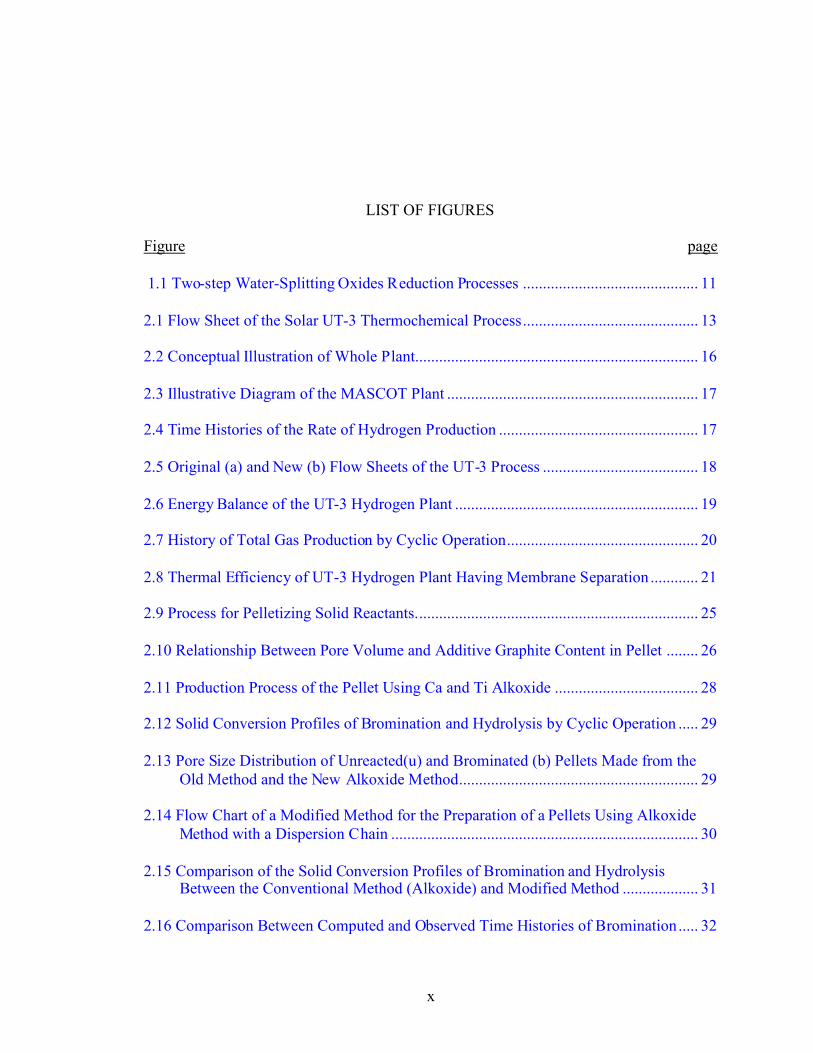
LIST OF FIGURES ............................................................................................................ x
LIST OF SYMBOLS .......................................................................................................xiii
ABSTRACT .................................................................................................................... xvi
CHAPTER
1 INTRODUCTION ...................................................................................................... 1
Current Hydrogen Production Methods...................................................................... 1Fossil Fuels ............................................................................................................. 2
Steam methane reformation ................................................................................ 2Partial oxidation method..................................................................................... 3Coal and biomass gasification ............................................................................ 3
Electrolysis.............................................................................................................. 4Thermal Decomposition of Water .......................................................................... 5Thermochemical Processes..................................................................................... 6Photoelectrical and Photochemical Hydrogen Production ..................................... 6Biological Hydrogen Production ............................................................................ 7
Thermochemical Cycles.............................................................................................. 7Ispra Mark Processes .............................................................................................. 7Sulfur-Iodine or Mark 16 or GA Process................................................................ 9Metal Oxides......................................................................................................... 10Miscellaneous Processes....................................................................................... 12
2 THE UT-3 THERMOCHEMICAL PROCESS ........................................................ 13
History of Research on the UT-3 Thermochemical Process..................................... 14Process and Simulation Studies ............................................................................ 15Membrane, Separation Techniques, and Materials ............................................... 22Solid Reactants...................................................................................................... 24
Iron reactants..................................................................................................... 24Calcium reactants.............................................................................................. 27

vi
Strengths and Weaknesses of the UT-3 Thermochemical Process ....................... 33Calcium Oxide Solid Reactant.................................................................................. 34
Physical Characteristics ........................................................................................ 35Porosity ............................................................................................................. 35Strength ............................................................................................................. 35
Chemical Characteristics ...................................................................................... 36Chemical composition ...................................................................................... 36Reactivity .......................................................................................................... 36Degradation....................................................................................................... 37
Research Objective ................................................................................................... 37Chemistry Formulation ......................................................................................... 38Physical Formation ............................................................................................... 39
3 SOLID REACTANT ................................................................................................ 40
Sol-Gel Chemistry .................................................................................................... 40Hydrolysis ............................................................................................................. 41Condensation......................................................................................................... 42Chemical Formulation .......................................................................................... 44
Qualitative investigation ................................................................................... 44Original procedure ............................................................................................ 45Modified procedure........................................................................................... 48Mixing ratios ..................................................................................................... 52
Physical Procedures .................................................................................................. 52Drying ................................................................................................................... 52Molding................................................................................................................. 53
Hydraulic press ................................................................................................. 53Original mold .................................................................................................... 54Modifications in mold and molding procedure................................................. 57
Sintering................................................................................................................ 58
4 ANALYTICAL TOOLS........................................................................................... 61
Nitrogen Adsorption ................................................................................................. 61BET Isotherm............................................................................................................ 62BJH Pore Size Distribution....................................................................................... 63Mercury Porosimetry ................................................................................................ 65
Theory................................................................................................................... 65Procedure .............................................................................................................. 66
Raman Spectroscopy................................................................................................. 66Theory................................................................................................................... 66Procedure .............................................................................................................. 67
Chemical Testing ...................................................................................................... 68Theory................................................................................................................... 68Procedure .............................................................................................................. 68

vii
5 EVALUATION OF PARAMETERS....................................................................... 69
Correlations from Original Chemistry...................................................................... 69Molding Procedure: Strength ................................................................................ 70Heating Procedure: Strength and Microporosity .................................................. 70Chemistry: Chemical Composition....................................................................... 72
Correlations from Modified Chemistry .................................................................... 73Molding Procedure: Strength and Macroporosity................................................. 73Chemistry: Macroporosity, Microporosity, Composition, and Strength .............. 74Heating Procedures: Composition, Strength, and Porosity................................... 79
Optimum Parameters ................................................................................................ 80
6 RECOMMENDATIONS FOR FUTURE WORK ................................................... 84
Short Term Plan ........................................................................................................ 85Investigation into Reactivity ................................................................................. 85
Reaction rates .................................................................................................... 85Conversion ........................................................................................................ 86
Investigation of Degradation................................................................................. 86Investigation of Cyclic Strength ........................................................................... 87Creative Engineering ............................................................................................ 87
Long Term Plan ........................................................................................................ 87Mass Production of Pellets.................................................................................... 87Pellet Performance in a Fixed Bed Reactor .......................................................... 88
7 SUMMARY AND CONCLUSIONS ....................................................................... 89
APPENDIX
A CHEMICAL PROPERTIES ..................................................................................... 91
B RAMAN SPECTROMETER.................................................................................... 92
C PELLET MAKING PROCEDURES........................................................................ 94
Original Chemistry.................................................................................................... 94Modified Chemistry.................................................................................................. 94Drying and Preheating .............................................................................................. 96Molding..................................................................................................................... 96Heating Procedures ................................................................................................... 97

viii
D PELLET CHARACTERIZATION PROCEDURES................................................ 98
Nitrogen Adsorption ................................................................................................. 98Outgassing Procedure ........................................................................................... 98Full Isotherm Analysis Procedure......................................................................... 99
Quantachrome Mercury Porosimeter...................................................................... 102Filling Apparatus Procedure ............................................................................... 102High Pressure Procedure..................................................................................... 104
E RAMAN SPECTRA........................................................................................... 107
F MERCURY POROSIMETRY DISTRIBUTIONS ............................................ 113
LIST OF REFERENCES.................................................................................................117
BIOGRAPHICAL SKETCH ...........................................................................................122

ix
LIST OF TABLES
Table page
1.1 Reduction Temperatures for Researched Metal Oxides ............................................. 11
2.1 Comparison of Initial Rates of the UT-3 Thermochemical Process .......................... 25
2.2 Properties of Calcined Iron Solid Reactant Pellets .................................................... 27
3.1 Qualitative Reaction Study ......................................................................................... 45
3.2 Original Mixing Ratios for Modified Chemical Formulation Procedure ................... 49
5.1 Parameters in the Main Categories Shown in Figure 5.1............................................ 70
5.2 Results of Quantatative Chemical Composition Testing Procedures ......................... 77
5.3 Optimum Parameters .................................................................................................. 81
A.1 Chemical Properties of Various Solid and Liquids Used in this Project ................... 91
C.1 Chemical Ratios Used in Modified Chemistry .......................................................... 95
x
LIST OF FIGURES
Figure page
1.1 Two-step Water-Splitting Oxides Reduction Processes ............................................ 11
2.1 Flow Sheet of the Solar UT-3 Thermochemical Process............................................ 13
2.2 Conceptual Illustration of Whole Plant....................................................................... 16
2.3 Illustrative Diagram of the MASCOT Plant ............................................................... 17
2.4 Time Histories of the Rate of Hydrogen Production .................................................. 17
2.5 Original (a) and New (b) Flow Sheets of the UT-3 Process ....................................... 18
2.6 Energy Balance of the UT-3 Hydrogen Plant ............................................................. 19
2.7 History of Total Gas Production by Cyclic Operation................................................ 20
2.8 Thermal Efficiency of UT-3 Hydrogen Plant Having Membrane Separation ............ 21
2.9 Process for Pelletizing Solid Reactants....................................................................... 25
2.10 Relationship Between Pore Volume and Additive Graphite Content in Pellet ........ 26
2.11 Production Process of the Pellet Using Ca and Ti Alkoxide .................................... 28
2.12 Solid Conversion Profiles of Bromination and Hydrolysis by Cyclic Operation ..... 29
2.13 Pore Size Distribution of Unreacted(u) and Brominated (b) Pellets Made from theOld Method and the New Alkoxide Method............................................................ 29
2.14 Flow Chart of a Modified Method for the Preparation of a Pellets Using AlkoxideMethod with a Dispersion Chain ............................................................................. 30
2.15 Comparison of the Solid Conversion Profiles of Bromination and HydrolysisBetween the Conventional Method (Alkoxide) and Modified Method ................... 31
2.16 Comparison Between Computed and Observed Time Histories of Bromination..... 32

xi
2.17 Change of Pore Volume in Cyclic Operation ........................................................... 32
2.18 Change of Pore Volume During Bromination. ......................................................... 33
3.1 Production Process of the Pellet Using Ca and Ti Alkoxide ..................................... 45
3.2 Three Mouthed Flask on Stirring Heater .................................................................... 48
3.3 Flow Diagram of Procedure Outlined by Aihara et al. .............................................. 50
3.4 Hand Pumped Uni-axial Hydraulic Press for Pellet Production ................................. 54
3.5 Pellet Mold Assembly................................................................................................. 54
3.6 Pellet Molding Assembly Parts................................................................................... 55
3.7 Furnace Used for Sintering Process ............................................................................ 60
3.8 Heating Schemes for Pellets ...................................................................................... 60
4.1 Typical BET Isotherm................................................................................................. 63
4.2 Schematic Representation of Assumed Desorption Mechanism Showing ThreeDifferent Pores and Demonstating the Thinning of the Physically Adsorbed LayerOver the First Three Decrements ............................................................................. 64
5.1 Flow Diagram Indicating How Characteristics were Used as Feedback to Modify theParameters to Arrive at the Final Procedures .......................................................... 70
5.2 Specific Cumulative Micropore Volume vs. Maximum Sintering Temperature........ 71
5.3 Raman Shift Spectra of Anatase and Rutile TiO2 and Two Representative PelletsMade Using the Original Chemistry........................................................................ 72
5.4 Visual Flow Diagram of How Characteristics were Used as Feedback to Modify theParameters Using the Modified Chemistry.............................................................. 73
5.5 Comparison of Cumulative and Differential Specific Pore Volume Distribution forNew Pellets Compressed at 0.25 and 0.5 Metric Tons. ........................................... 74
5.6 Raman Shift Spectra for CaTiO3 and Two Sample Pellets ........................................ 76
5.7 X-ray Diffraction Data with Peaks Verifying the Presence of Both Calcium Oxideand Calcium Titanate ............................................................................................... 78

xii
5.8 Comparison of Micropore and Macropore Volume of Pellets Made with Ratios ofDifferent Calcium to Titanium Ratios with UT-3 Porosity Results ....................... 79
5.9 Comparison of Cumulative and Differential Specific Pore Volume Distribution forNew Pellets Sintered at Different Temperatures.. ................................................... 81
B.1 Raman Module ........................................................................................................... 92
B.1 Inside of FT Raman Module ...................................................................................... 93
D.1 Quantachrome NOVA 1200 Machine for Nitrogen Adsorption with Small SampleCell and Dewar ...................................................................................................... 101
D.3 Quantachrome Mercury Porosimeter Filling Apparatus ......................................... 105
D.2 Quantachrome Mercury Porosimeter ....................................................................... 105
E.1 Raman Spectra Showing the Pellets Made with Original Chemistry are MostlyComposed of Anatase and Rutile TiO2 .................................................................. 108
E.2 Raman Spectra Showing the Fluorescence Hiding the Characteristic Peaks of aSample Made Using the Modified Chemistry ....................................................... 109
E.3 Raman Spectra Showing the Existence of CaTiO3 in the Two Pellet Samples Via theMatching Peaks to a Standard................................................................................ 110
E.4 Full Raman Spectra Showing the Existence of CaTiO3 in the Two Pellet Samples Viathe Matching Peaks to a Standard.......................................................................... 111
E.5 Full Raman Spectra Showing the Existence of CaTiO3 in the Two Pellet Samples Viathe Matching Peaks to a Standard Taken with the Same Laser Intensity on the SameScale ....................................................................................................................... 112
F.1 Comparison of Cumulative and Differential Specific Pore Volume Distribution forNew Pellets Made with Different Ca to Ti Ratios ................................................. 114
F.2 Comparison of Cumulative and Differential Specific Pore Volume Distribution forNew Pellets Compressed at 0.25 and 0.5 Metric Tons. ......................................... 115
F.3 Comparison of Cumulative and Differential Specific Pore Volume Distribution forNew Pellets Sintered at Different Temperature ..................................................... 116

xiii
LIST OF SYMBOLS
Chemical Elements
Br Bromine
Ca Calcium
C Carbon
Cl Chlorine
Fe Iron
H Hydrogen
I Iodine
Mn Manganese
Na Sodium
O Oxygen
S Sulfur
Si Silicon
Ti Titanium
Zn Zinc
Zr Zirconium
Calcium Compounds
CaBr2 Calcium Bromide
CaCO3 Calcium Carbonate
Ca(OH)2 Calcium Hydroxide

xiv
CaO Calcium Oxide
CaTiO3 Calcium Titanate
Other Chemistry Symbols
+δ Positive partial charge
-δ Negative partial charge
e- Electron
M Metal Atom
m Stoichiometric symbol
n Stoichiometric symbol
R Organic molecule
x Stoichiometric symbol
y Stoichiometric symbol
Other Symbols
γ Mercury surface tension [degrees]
θ Mercury contact angle [dyne/cm]
CV Concentration of vacant sites on reaction surface [mol/L]
CN2-S Concentration of sites with nitrogen adsorbed [mol/L]
Csubscript Concentration [mol/L]
HH2 Power of hydrogen produced based on HHV [MW]
HHe Heat input from helium [MW]
HR Heat recovered [MW]
HX Heat exchanger
Int Relative intensity of light [counts]

xv
kA Adsorption rate coefficient [1/(psia*s)]
KA Equilibrium adsorption constant [1/psia]
MT Metric tons
P Pressure [psia]
Pc Power consumed [MW]
Po Ambient pressure [psia]
PN2 Pressure of nitrogen [psia]
r3s Rate of reaction 3 [mol/(L*s)]
rAD Rate of adsorption [mol/(L*s)]
R Universal gas constant [J/(gmol*K)]
R1-R4 Reactors 1 through 4 respectively
S1-S2 Separators 1 and 2
T Temperature[K or °C]
X Conversion

xvi
Abstract of Thesis Presented to the Graduate Schoolof the University of Florida in Partial Fulfillment of the
Requirements for the Degree of Master of Science
DEVELOPMENT OF CALCIUM OXIDE SOLID REACTANT FOR THE UT-3THERMOCHEMICAL CYCLE TO PRODUCE HYDROGEN FROM WATER
By
Benjamin Grant Hettinger
December 2005
Chair: D. Yogi GoswamiMajor Department: Mechanical and Aerospace Engineering
Hydrogen may be the answer to meeting the world’s energy demand as it
increases and the fossil fuel sources run out. The University of Tokyo #3 (UT-3)
thermochemical cycle is being researched as a means of producing hydrogen from water.
In order to make the UT-3 thermochemical cycle economically feasible, the operating
temperatures for the reactions must be reduced. In order to study this cycle, the solid
reactant must be in a form that will allow the reactions to take place efficiently. A
procedure to make the solid reactant for the UT-3 thermochemical cycle has been
developed using outlines from previous researchers. The procedure includes chemical
procedures to make the precursors, drying and preheating, molding, and sintering
procedures.
Sol-gel chemistry was used to create the particulate precursors for the pellets.
The liquor resultant from the chemistry procedure was dried via evaporation and then
preheated to 430°C to eliminate volatiles. The resultant powder was molded into pellets

xvii
using a compression mold which had been fabricated. The pellets were then sintered to
temperatures above the highest operation temperature of the UT-3 cycle, 760°C in order
to strengthen the pellets.
The characteristics of the fabricated pellets were used to gauge the success of the
process and modify it as necessary to yield better characteristics. The characteristics of
the pellets which were used to evaluate the procedure were the porosity, the composition,
and the strength. The porosity was evaluated by mercury porosimetry and nitrogen
adsorption. The composition was determined qualitatively by Raman spectroscopy and
X-ray diffraction and quantitatively by a chemical procedure. The strength was evaluated
qualitatively.
Based on these characteristics a number of changes were made to the procedure
including a new chemical procedure, a redesigned molding assembly, and the addition of
a preheating step. Correlations were also made between certain characteristics and
procedural parameters. One correlation showed that there was an increase in strength
with sintering temperature but a decrease in both macro and micro porosity. Another
correlation showed that the strength of the pellets decreased with an increase in the ratio
of calcium to titanium used in the pellets.
Though these pellets seem to have acceptable characteristics, more characteristics
including reactivity and degradation need to be studied. These pellets may not hold up
structurally or may not react as well as they must. Further study needs to be done to truly
determine the success of this process. More importantly, the pellets are just the first step
toward studying the UT-3 thermochemical cycle.

1
CHAPTER 1INTRODUCTION
The world energy consumption is rising as more and more countries become
industrialized. Currently the most abundantly used sources of energy are fossil fuels.
These, however, are limited and most projections show that the production of oil will not
meet the need within the next 10 to 25 years. This presents a major problem to energy
consumers around the world but especially for transportation where oil is almost the sole
energy source. Looking ahead the United States is seeking the solution in hydrogen
powered transportation. The U.S. government along with automobile manufacturers is
pushing researchers to investigate hydrogen to meet this upcoming need. Hydrogen has
been shown to be 40 to 50% efficient in fuel cells and is environmentally friendly
producing steam as its only by-product. There are many problems that must be solved in
order to make the “hydrogen economy” feasible. A large amount of research is being
conducted to investigate hydrogen production, fuel cells, storage, safety, and
infrastructure.
This research focuses on a small but important aspect of one of the potential
hydrogen production processes. In this chapter an overview of the present methods for
hydrogen production is presented and discussed.
Current Hydrogen Production Methods
There are a number of methods that can be used to produce hydrogen. These
methods include steam methane reformation (SMR), partial oxidation of fuels (POX)

2
coal and biomass gasification, electrolysis, thermal decomposition, thermochemical
processes, biological, and other processes. Some of these have been found to be
impractical, such as, thermal decomposition. Others are established means of hydrogen
production and still others are currently being investigated and may be viable options in
the future. Ideally a process is sought that is a cost effective and energy efficient means
to produce hydrogen using a renewable energy source. This would allow utilization of all
the benefits of hydrogen as a fuel.
Fossil Fuels
The most cost effective way to produce hydrogen is to use one of the fossil fuel
processes. Though these processes are efficient and cost effective, they also eliminate on
of the major advantages of hydrogen. The green house gas CO2 is still being produced if
hydrogen is produced in this manner. Though, biomass is not considered a fossil fuel it
has been included with coal gasification because of the similarity in the processes. It is
considered a carbon neutral means of hydrogen production. Also the reason hydrogen is
being researched as a fuel source is because of the depleting fossil fuel sources.
Steam methane reformation
Steam methane reformation (SMR) has many benefits and is the most economical
method of producing hydrogen now. It is a process in which steam and methane are
combined at high temperatures (700°C to 925°C) using a catalyst. A sulfur separation
step is needed so that the catalyst will not be destroyed. After the first reaction an
equilibrium shift reaction is added to produce more oxygen in the cycle. The total
process result is 96-98% pure hydrogen with an efficiency of 65-75% (Goswami et al.,
2003). The heat is supplied by burning fossil fuels. There are two drawbacks to this
method. First the method is not “clean” or “green”. It produces the green house gas, CO-

3
2. Second it relies on the limited amount of methane on the earth. As the supply dwindles
the feedstock cost will rise and make SMR less economical than other processes. The
chemical scheme for SMR can be seen below in Equations 1.1 and 1.2 (Cox and
Williamson, 1977-1979).
Cn Hm n H2 O n CO2 n m
2
H2(1.1)
CO H2 O CO2 H2(1.2)
Partial oxidation method
The next most popular method of hydrogen production is partial oxidation of
heavy hydrocarbons (POX). This method is very similar to SMR with the addition of a
step. In this additional step heavy hydrocarbons are partially burned with pure oxygen
and water. Simultaneously, the heavy hydrocarbons are broken down into less complex
hydrocarbons such as methane which is reacted with steam in a similar manner as in
SMR. The resulting products are CO, CO2, H2O, H2. After a desulphurization step the
shift reaction is again used to produce more hydrogen. POX produces hydrogen with a
purity of 96-98% and an efficiency of about 50% (Goswami et al., 2003). The same
problems exist with POX as did with SMR. The additional step of oxygen separation
increases the cost of this process compared to SMR.
Cn Hmn2
O2 n COm2
H2 Heat(1.3)
Cn Hm n H2 O Heat n CO2 n m
2
H2(1.4)
CO H2 O CO2 H2 Heat(1.5)
Coal and biomass gasification
Coal and biomass gasification are very similar to POX with the differences of a
higher temperature range (1100°C -1300°C), higher pressures, and there is very little

4
oxygen present. The high carbon content of coal and biomass is converted to CO2, H2,
and CO. After a desulphurization step the shift reaction is again used to produce more
H2. Purity of hydrogen of up to 97% has been obtained using coal gasification (Goswami
et al., 2003). Coal is the most abundant fuel on earth and supplies will probably not be a
concern for a century from now. Like those mentioned before, this process produces the
greenhouse gas, CO2.
Using biomass as the fuel other benefits and problems exist. Benefits include
valuable byproducts such as ammonia, better pollution control, and lower operating costs.
Biomass is also considered a carbon neutral fuel because the CO2 would be produced
through natural decomposition anyway. The problems lie in transporting the solid fuel
and disposing of the large quantities waste ash that are produced.
2C+O22CO (1.6)
C+H2OCO+H2 (1.7)C+CO22CO (1.8)
All these processes based on fossil fuels produce CO2. Presently they are the
most cost effective ways to produce hydrogen. The main benefit of hydrogen as a fuel is
that it does not produce any harmful by products when used to make energy. If it is
produced in a manner in which CO2 is created this benefit is essentially eliminated.
Alternative methods must be used if this benefit is wanted.
Electrolysis
Electrolysis of water is the next most commonly used means to produce
hydrogen. In electrolysis a voltage is supplied so that electricity flows through a medium
and ions are conducted across a membrane. H2 is produced by combing H+ ions and two
electrons at the cathode as shown in Equation 1.9. Water is split at the anode so that O2

5
is produced along with H+ ions and electrons as seen in Equation 1.10 (Cox and
Williamson, 1977-1979)
H2O.5 O2 +2H++2e- Anode (1.9)
2H++2e-H2 Cathode (1.10)
Electrolysis has been researched extensively and some ideas presently being
considered are the electrolysis of sea water and efficiency increase with temperature
variance. Electrolysis has been seen to be 94% efficient based on the electrical power
input to the system (Goswami et al., 2003). This electricity however comes from another
source. Solar produced electricity is a very good source to use for electrolysis. Almost
all the electricity produced by solar means can be used to make hydrogen. This creates a
clean way to produce hydrogen and can eliminate any fossil fuels from the process.
Thermal Decomposition of Water
When water is heated to very high temperatures some of the steam decomposes to
O2, H2, OH, O, and H. At first glance this process seems very simple, but it has many
problems. A large amount of energy has to be supplied to heat water to the needed
temperatures. The steam does not even fully dissociate until a temperature above 4000K
is reached. The mixture of dissociated gases is also highly explosive which creates a very
serious danger. Finding containers that can withstand the temperatures needed for the
operation also presents a problem. High temperature gas separation is also hard to do.
Quenching can be done but the heat lost during the process can not be recovered and
makes the process too costly to operate. Only 2.1% efficiency has been recorded using
the thermal decomposition of water to produce hydrogen and only a 40% theoretical

6
efficiently has been calculated (Goswami et al., 2003). Obviously, this process is not
feasible unless solutions are found to these problems.
Thermochemical Processes
In thermochemical processes water is input along with heat and oxygen and
hydrogen are produced. The overall result then is the same as that of thermal
decomposition. These processes are much different, however, and much more practical.
The processes have been theoretically modeled to be up to 50% efficient dwarfing the
2.1% efficiency of the thermal decomposition of water (Sakurai et al. 1996). Much lower
temperatures can also be used and hydrogen and oxygen can be produced in different
steps eliminating an explosive mixture of gases. Each thermochemical process however
has its own problems that must be considered to make the process feasible.
Inside this black box system a series of heat driven chemical reactions are used to
produce hydrogen and oxygen. There are thousands of proposed processes but only a
few which have been studied extensively and even fewer that hold promise in large scale
implementation. Some of these processes are discussed later in this chapter.
Photoelectrical and Photochemical Hydrogen Production
Photoelectrical systems couple a solar voltaic cell with electrolysis. A photo
anode absorbs sunlight creating a current to flow and electrolysis to occur. Hybrids of
this system have reported efficiencies of up to 18% (Goswami et al., 2003). In
photochemical systems semiconductors are paired with photosensitive organic particles.
When light hits the photosensitive particles electrons are excited and are directly used to
carry out the reduction and oxidation reactions to create hydrogen. There are problems in
the catalyst and photosensitive material degrading, back reactions, and the separation of
hydrogen and oxygen. Photochemical systems have yet to reach 10% efficiency

7
(Goswami et al., 2003). More investigation must be conducted to evaluate the feasibility
of these hydrogen production methods.
Biological Hydrogen Production
There are two general biological methods that are used to produce hydrogen. The
first is the fermentation of bacteria. In this process organic substances are converted to
oxygen and hydrogen without sunlight or oxygen. The theoretical efficiency for this
process is only 33% (Goswami et al., 2003). Treatment of the polluted process water
may also be a problem which should be addressed when considering this process.
The second method is called biophotolysis. In this process micro-algae-
cynobacteria and green algae are exposed to sunlight and water. Through organic
processes they produce hydrogen and oxygen. There are two types of bacteria,
nitrogenase and hydrogenase. The first of the two uses ATP molecules and coverts them
to ADP molecules releasing H+ ions in the process which form hydrogen. Hydrogenase
produces hydrogen by breaking down carbohydrates in a photosynthesis system. Both
will die in the presence of a small amount of oxygen (Goswami et al., 2003).
Thermochemical Cycles
There are thousands of thermochemical processes. The processes vary widely in
many different aspects though some are very similar. Many of the processes are slight
modifications of a previous cycle, including a substitute reaction or reactions and/or an
imposed voltage. Processes with imposed voltages are known as hybrid thermochemical
cycles.
Ispra Mark Processes
The first thoroughly researched process is the Ispra Mark I process shown below.
As can be seen mercury is used in this process. Mercury is known to be a very toxic

8
element and research on this process was discontinued because on a larger scale use the
process would be too much of a safety risk for consideration. The process was important,
however, as it was a harbinger of the exploration of thermochemical cycles. It was the
first process demonstrated to give reasonable amount of hydrogen at an acceptable
efficiency. Other processes followed the Ispra Mark I and there are now 17 Ispra Mark
processes some of which have different sub-processes. The series of Ispra Mark
processes are some of the most promising thermochemical processes.
Ispra Mark I
CaBr2+2H2OCa(OH)2+2HBr (730°C) (1.12)
2HBr+HgHgBr2+H2 (250°C) (1.13)
HgBr2+Ca(OH)2CaBr2+HgO+H2O (200°C) (1.14)HgOHg+.5O2 (600°C) (1.15)
Much work has been done in exploring the possibility of using iron-chloride in
processes. Ispra Mark processes 7, 7A, 7B, 9, 14, and 15 contain iron-chloride. Problems
in these processes have been found and generally stem from either the thermal
decomposition of FeCl3 (Eq. 1.17) or the hydrolysis of FeCl2 (Eq. 1.18). Much research
has been conducted to eliminate these problems but no viable solution has been found.
The iron-chloride family of reactions was deemed uneconomical and research has been
focused elsewhere. Ispra Mark 7B can be seen below.
Ispra Mark 7B
2Fe2O3+6Cl24FeCl3+3O2 (1000°C) (1.16)
2FeCl3 2FeCl2 +Cl2 (420°C) (1.17)3 FeCl2 + 4H2O Fe3O4 + 6 HCl + H2 (650°C) (1.18)
Fe3O4 + O2 6Fe2O3 (350°C) (1.19)
9
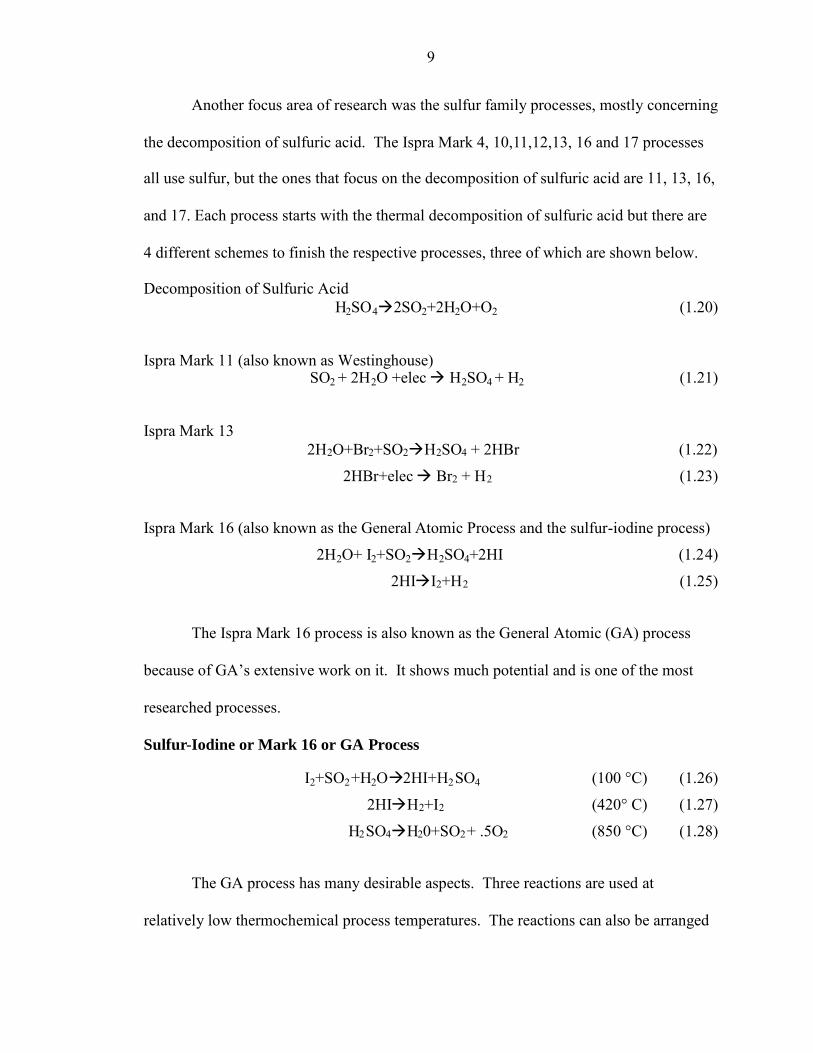
Another focus area of research was the sulfur family processes, mostly concerning
the decomposition of sulfuric acid. The Ispra Mark 4, 10,11,12,13, 16 and 17 processes
all use sulfur, but the ones that focus on the decomposition of sulfuric acid are 11, 13, 16,
and 17. Each process starts with the thermal decomposition of sulfuric acid but there are
4 different schemes to finish the respective processes, three of which are shown below.
Decomposition of Sulfuric AcidH2SO42SO2+2H2O+O2 (1.20)
Ispra Mark 11 (also known as Westinghouse)SO2 + 2H2O +elec H2SO4 + H2 (1.21)
Ispra Mark 132H2O+Br2+SO2H2SO4 + 2HBr (1.22)
2HBr+elec Br2 + H2 (1.23)
Ispra Mark 16 (also known as the General Atomic Process and the sulfur-iodine process)
2H2O+ I2+SO2H2SO4+2HI (1.24)
2HII2+H2 (1.25)
The Ispra Mark 16 process is also known as the General Atomic (GA) process
because of GA’s extensive work on it. It shows much potential and is one of the most
researched processes.
Sulfur-Iodine or Mark 16 or GA Process
I2+SO2+H2O2HI+H2SO4 (100 °C) (1.26)
2HIH2+I2 (420° C) (1.27)
H2SO4H20+SO2+ .5O2 (850 °C) (1.28)
The GA process has many desirable aspects. Three reactions are used at
relatively low thermochemical process temperatures. The reactions can also be arranged

10
to create a continuous process. Many people have studied this reaction and it has been
well researched. Theoretical efficiencies have been predicted to be approximately 50%.
There are expensive separation and purification steps that needed to be considered. This
process also uses highly acidic chemicals. In addition there have been problems with
hydriodic acid decomposition. At 700K there is only a 25% dissociation which cannot be
greatly increased with temperature. This, therefore, makes it necessary for the products
to be recirculated creating thermal losses. Another factor that must be considered is the
possibility of side reactions which can form sulfur and hydrogen sulfide. Despite these
problems, this process is being studied at a number of places and has arguably the most
potential of thermochemical processes to be used to produce hydrogen (Sakurai et al.,
1999, 2000)
Metal Oxides
MxOy = xM + y/2 O2 (High Temperature reduction reaction) (1.29)xM + yH2O = MxOy + yH2 (Low Temperatures oxidation reaction) (1.30)
Another large area of research within thermochemical processes is being
conducted on metal oxide reduction-oxidation (redox) processes. Metals are reduced
with heat creating a pure metal and releasing oxygen. The metal is oxidized with water
to form a metal oxide once again. The metal steals the oxygen from the water so that
hydrogen is released. There are a number of metals and alloys being considered at this
time. The simplicity of the processes seems appealing, having only 2 reactions. Most of
the oxidizing reactions proceed without problem. An undesirable requirement of these
processes is that the reduction reaction occurs at very high temperatures. Much of the

11
work being done is to find an alloy that will significantly lower the temperature of the
reduction reaction.
One of the most promising is the zinc oxide reaction. Reported conversion
efficiencies have been as high as 50% (Weidenkaff et al., 2000). The temperature for the
reduction reaction however is 2300K. The process is depicted below in Figure 1.
Solar Reactor1st Step @ 2300KZnO --> Zn(g) +1
2 O2
Water Splitting Reactor2nd Step @ 700KZn+H2O-->ZnO+H2
ZnO H2
ZnO H212 O2
ConcentratedSolar Radiation
Figure 1.1 Two-Step Water-Splitting Oxides Reduction Processes(Weidenkaff et al., 1999)
Other metals and alloys considered are listed below with their reduction
temperature. Some of the temperatures have been reported over a range of temperatures.
For simplicity, one value was chosen and the actually temperatures will vary somewhat
based on the experimental design. The Table is just to show typical temperature values
for thermochemical metal oxide processes.
Table 1.1: Reduction Temperatures for Researched Metal OxidesMetal or Alloy [K] [°C] References
ZnO 2000 1727 Weidenkaff et al., 2000 & Hauter et al., 1999Mn2O3 1835 1562 Meier et al., 1996 & Sturzenegger and Nuesh, 1998Fe3O4 2300 2027 Steinfeld et al., 1999MnFe2O4 1273 1000 Ehrensberger et al., 1995Na3(MnFe2)O6 1073 800 Kaneko et al., 2001,2002

12
Miscellaneous Processes
There are other processes that have been researched by different groups. Most
groups are found either at universities or scientific labs around the world.
One group at the University of Tokyo developed one of the most promising
processes. They have done extensive research on the process and up-scaled their
laboratory scale model. It is predicted to be the first thermochemical process that will
actually be used for large scale hydrogen production. This process is know as the UT-3
process and will be discussed in more detail in the next chapter.
Another process that might have potential is the Julich Center EOS shown below.
2Fe3O4+6FeSO4 6Fe2O3+6SO2+O2 (800°C) (1.31)
3FeO+H2OFe3O4+H2 (700°C) (1.32)Fe2O3+SO2FeO+FeSO4 (200°C) (1.33)
It is in the beginning stages of research and has many desirable attributes. Reactants in
this cycle are not corrosive. Besides oxygen and hydrogen, the only elements used are
sulfur and iron which are very abundant on the earth. Early testing shows the reactions
go as written. Not much current research is being conducted on this process, however.
This may be due to other significant problems encountered (Brown et al., 2002).

13
CHAPTER 2THE UT-3 THERMOCHEMICAL PROCESS
The University of Tokyo #3 thermochemical (UT-3) process was proposed in
1978 by Kameyama and Yoshida at the 2nd World Energy Conference (Kameyama and
Yoshida, 1978). A UT-3 cycle is composed of a series of four thermochemical reactions
which are shown below. The operating temperatures are relatively lower than those
found in other thermochemical cycles, the highest being 760°C. When the reactions
proceed in the correct order all the solid reactants are regenerated, except water which is
split into hydrogen and oxygen and separated from the system. The flow schematic of
the UT-3 Thermochemical process is shown in Figure 2.1 below and the reactions are
enumerated below:
Figure 2.1 Flow Sheet of the Solar UT-3 Thermochemical Process (Sakarai et al., 1996)
The UT-3 System starts with water being pumped into the system <16>, heated
into steam in HX01, and pumped into the reactor R1 where reaction (2.1) occur with

14
CaBr2 to generate HBr. This reaction is reported to take one hour to reach equilibrium.
Surplus steam along with other gaseous products (primarily HBr) is routed to reactor R4
where reaction (2.4) takes place with the release of H2 and additional HBr.
(Reactor R1, 760°C) CaBr2+H2O(g)CaO +HBr(g) (2.1)
(Reactor R2, 570°C) CaO+Br2(g)CaBr +.5O2 (g) (2.2)
(Reactor R3, 220°C) Fe3O4+8HBr(g)3FeBr2+4H20(g)+Br2(g) (2.3)(Reactor R4, 560°C) FeBr2+4H2O(g)Fe3O4+6HBr(g)+H2(g) (2.4)
Hydrogen is separated from the main process stream at S1. The balance flow
primarily containing HBr reacts with Fe3O4 in reactor R3 to form Br2 as shown in the
reaction (2.3). Br2 then reacts with CaO in reactor R2 to release O2 as shown in the
reaction (2.2). O2 is separated in S2 and the balance of the stream flows with the make-
up water, at <16> , back to reactor 1 completing the cycle.
The prominent features of the process path are listed below.
1. Only water is fed through the stream <16> which is consumed and split into H2 andO2.
2. Reactors R1 and R4 (hydrolysis reactors) produce H2 and Reactors R1 and R2 andR3 (bromination reactors) produce O2.
3. The products of reactors R1 and R4 are reactants in the reactors R2 and R3respectively. As reaction equilibrium is reached in the reactors, the flow direction isreversed, where reactors R2 and R3 now function as the hydrolysis reactors(producing hydrogen) and reactors R1 and R4 serve as the bromination reactors(producing O2). This switch over approach can be repeated multiple times forcontinuous operation.
History of Research on the UT-3 Thermochemical Process
Through the years the reactions and process have been studied extensively by
groups in Japan. The UT-3 process may have potential as a means to commercially
produce hydrogen in a carbon free and energy efficient manner. However, in order to

15
evaluate this potential, a number of different aspects of the UT-3 process have to be
investigated. For discussion these aspects are categorized into process and simulation
studies, membrane and separation techniques, iron solid reactants, and calcium solid
reactants.
Process and Simulation Studies
The first investigation (Kameyama and Yoshida, 1978) examined the Gibbs free
energy of each of the reactions in the UT-3 process. An experimental set up was reported
but no significant system study was made.
In 1981, a conceptual design of a large scale UT-3 thermochemical process
hydrogen production plant to be coupled with a high temperature nuclear power plant
was given (Kameyama and Yoshida, 1981). The facility would include three main
sections (Figure 2.2). The first two consisting of a reaction tower for the calcium
reactants and another for the iron reactants. The third section would be a tower for heat
exchangers to bring high temperature heat to the reactors and recover waste heat from
other reactors. The design includes a provision for using solid reactants in the form of
honeycomb-shaped tubes with inert materials as binders. The honeycomb-shaped solid
reactants would be put into a fixed bed reactor. The reactions can occur along
honeycomb channels isolating the process stream from the reactor walls. Thus this would
eliminate the need for expensive materials of construction such as titanium. In this paper
a simulation was also done to determine the reaction zone as well as investigate heat
exchanger design.
Results from the performance of the MASCOT (Model Apparatus for Studying
Cyclic Operation in Tokyo) bench scale UT-3 plant were reported in 1984 (Nakayama et
al., 1984). Most of the paper focused on the experimental setup for the MASCOT plant

16
(Figure 2.3). The plant was designed to produce 3 normal liters of H2 per hour. It was
run for 2 cycles with a peak performance of 2 normal liters per hour (Figure 2.4).
Figure 2.2 Conceptual Illustration of Whole Plant (Kameyama and Yoshida, 1981)
A change in the process flow was subsequently introduced so that the HBr from
reaction 1 would not have to be separated from surplus H2O before entering reaction 4
(Kameyama et al.,1989). Rather the HBr is carried through reactor 4 and proceeds to
reactor 3. Figure 2.5 shows the original (a) and the modified schemes (b). The modified
scheme reduces the flow complexity found in the original process.

17
Figure 2.3 Illustrative Diagram of the MASCOT Plant (Nakayama et al., 1984)
Figure 2.4 Time Histories of the Rate of Hydrogen Production (Nakayama et al., 1984)

18
Figure 2.5 Original (a) and New (b) Flow Sheets of the UT-3 Process (Kameyama et al.,1989)
In 1989 an in-depth efficiency study was done on the whole cycle (Aochi et al.,
1989). The study projected greater than 40% thermal efficiency if power generation from
waste heat was 25% or greater. An energy balance was also done showing the
breakdown of the energy usage assumed to obtain this efficiency (Figure 2.6).
THH2
HHe HR
Pc 860.6
sp
(2.5)
HH2 is the energy per unit time of the hydrogen produced in the plant, at the
higher heating value in MW. HHe is the Input heat to the chemical process from the high
temperature gas reactor (HTGR) plant by helium gas in MW. HR is the heat recovered in
MW. PC is the power consumed within the plant in MW and 860.6 is a conversion
factor. ηSP is the power generation efficiency, which means the efficiency of the

19
conversion of recovered heat into electricity or for driving steam turbines. ηT is the
overall total efficiency as defined by Aochi et al.
Figure 2.6 Energy Balance of the UT-3 Hydrogen Plant (Aochi, et al. 1989)
The MASCOT was operated with the new flow scheme for 11 cycles
continuously (Sakurai et al., 1992). It was found that there was close to a 2 to 1 ratio
between hydrogen and oxygen produced. The system appeared to operate steadily
though slight fluxuations existed. The yield seems to be lower in this experiment than
that reported in 1984 by Nakayama et al. but the cyclic run time is not given for this
experiment. The run time for the other cycles was approximately 2 hours though, so it
would seem that the run time would be at least 1 hour and that the yield would be around

20
1 to 2 liters per cycle. It is thought that the new flow scheme would not affect the
hydrogen output so drastically. The reason for this discrepancy is unknown, though cycle
times of only about 10 to 20 minutes would reconcile the two sets of data.
Figure 2.7 History of Total Gas Production by Cyclic Operation (Sakurai et al., 1992)
Most of the research from 1996 onward focused on simulations of the UT-3
Process. In 1996 Sakurai, Bilgen et al. published 2 papers. The first discusses the
possibility of using a solar concentrator to supply the heat for the cycle. They conclude
that it will be feasible to operate with a thermal storage unit and 24 hour operation. The
second discusses an adiabatic model of the UT-3 Cycle. A computer simulation is run
and first and second law efficiencies are found to be 48.9% and 53.2% respectively. The
next year a technical evaluation of an industrial scale plant for the UT-3 thermochemical
cycle is reported by Tadokoro et al. (1997). The main focus of the paper was the
improvement in the overall thermal efficiency with membrane separation. Figure 2.8
illustrates their predicted efficiencies. They concluded that the use of a membrane for

21
separation will increase efficiency and therefore improve the economics of hydrogen
production by the UT-3 thermochemical process.
Figure 2.8 Thermal Efficiency of UT-3 Hydrogen Plant Having Membrane Separation(High Heating Value Basis) (Tadokoro et al., 1997)
After 1997 there is not much published on the UT-3 process. Teo et al. (2005)
carried out an analysis on the UT-3 process efficiency. Their analysis included practical
considerations of equipment efficiencies (compressors, heat exchangers), separation
membranes and associated pressure loses, incomplete conversions for the reactions, low
temperature heat, and the impracticality of isothermal operation in the iron reactors.

22
Their value for process efficiency from solar heat was less than 7%. To give more
credibility to this paper, in the postscript the authors tell of feedback from the research
and development community that indicated it is well known that the efficiency of the UT-
3 thermochemical process is much lower than claimed by original researchers. The
authors indicated that this has not been published in a public domain until now. They
also indicated that other thermochemical processes should be evaluated in a similar
manner to weigh the questions: Should work be done on these processes? And if so
which ones?
Membrane, Separation Techniques, and Materials
One of the most important factors affecting the energy efficiency of the process is
the separation of hydrogen and oxygen from the process stream. The hydrogen is
produced in a reaction with a temperature of 570°C. Hydrogen has to be separated from
stream containing hydrogen bromide and nitrogen or steam (used in excess). Separation
can be accomplished (if nitrogen is not used) by condensation of water and hydrogen
bromide. This, however, is highly energy inefficient means of separation since this
condensed stream has to be reheated before it is sent to the bromination reactor R3
(Figure 2.1).
Alternatively, research has focused on developing high temperature corrosion
resistance ceramic membranes to separate hydrogen from the other gases. This has also
proven difficult because of the incompatibility of hydrogen bromide with most membrane
material. The list of hydrogen bromide compatible materials is further shortened due to
the high temperatures at which desired separations should occur. The pressure drop
across the membranes is high and the separated H2 has to be compressed which required
additional energy.

23
To meet these needs a zirconia-silica composite was studied for the separation of
hydrogen (Ohya et al., 1997, 1994). The study found that hydrogen bromide and steam
were able to permeate the membrane much more than the hydrogen. Thus the hydrogen
could be separated in the reject stream and the hydrogen bromide and water could be
separated out through the membrane. Separation factors between 6 and 36 were obtained
using different pressure gradients and temperatures ranging from 423K-773K (250°C-
500°C). The HBr-H2O-H2 separation was also investigated by Morooka et al. in 1996.
The approach used anα-alumina support with a silica membrane and was tested up to
400°C with effective results. The hydrogen bromide could not pass through the
membrane and the separation factor between hydrogen and water was over 100.
Though these membranes still do not function at the reaction temperature of 570°C they
allow for a much more energy efficient separation of hydrogen.
Materials for piping and other parts also need to be considered. Not many
materials can withstand the corrosive components such as Br2 and HBr at such high
temperatures. Titanium would work but the cost is too high to make the system
economical to produce hydrogen. Ceramic materials are also being developed for use
with the UT-3 cycle. Sasaki and Hirai (1994) coated stainless steel with TiC-SiC film
using vapor deposition techniques and tested it in a Br2- O2- Ar environment up to 800°C.
The temperature was cycled between 500°C and 800°C. Corrosion was still present but
greatly reduced.
Another proposed plan to reduce materials of construction cost is to run the
system with excess steam or nitrogen or a mixture of the two. This is what is currently

24
done in the UT-3 process. No reports of corrosion problems appear in the literature,
though it is suspected that corrosion may occur over time.
Solid Reactants
A pellet form has been chosen to meet the strength and reactivity demands of the
cyclic UT-3 process for both the iron and calcium reactants. Even in the first proposal of
the UT-3 process Kameyama and Yoshida (1978) emphasized the importance of
developing durable solid reactants. Their development and improvements are outlined
here.
Iron reactants
In 1978 Kameyama and Yoshida tested three supports for the iron
reactants. These supports included 120 micron glass beads, Bentonite (a type of clay),
and Kaolin (high quality clay used to make china). The pellets were made into 15mm
spheres. The bentonite supported material seemed to have the best conversion to FeBr2
which was about 45%.
In 1981 Kameyama and Yoshida reported on their studies of the iron solid
reactants and their chemistry. The iron oxide pellets were made by mixing Fe3O4 and
silicasol (Cataloid-S-OH), adding a saturated solution of ammonium carbonate, then
drying, molding, and calcination. It was reported that reaction 3 was found to be
composed of two stages represented by
Fe3O4+2HBr Fe2O3+ FeBr2+H2O (2.6)Fe2O3+6HBr2FeBr2+3H2O+Br2 (2.7)
Taking into consideration the mass and heat transfer resistances from the gas film,
product layer and surface chemical reaction these researchers came up with two equations
for reaction rates for different temperature regions. The reaction rates use the shrinking

25
core and assumed to precede topochemically. These reactions are shown here in Eq. 2.8
and Eq. 2.9 where a is the surface area of the reaction in cm2.
r3 s 38.2 a CFe3O4 .00150 CHBr(210C-255C) (2.8)
r3 s 1.7810 8 exp
13.0RT
a CFe3O4 .00150 CHBr .5(255C-300C) (2.9)
A more detailed iron pellet formulation procedure is given by Yoshida et al.
(1990). Figure 2.9 shows an outline of this formulation along with that of the
contemporary calcium pellet formulation procedure of that time. The reaction rates of all
four reactions were also evaluated experimentally. A tabulation of these rates can be
seen in Table 2.1 below.
Figure 2.9 Process for Pelletizing Solid Reactants (Yoshida et al. 1990).Table 2.1 Comparison of Initial Rates of the UT-3 Thermochemical Process Yoshida et
al. (1990).

26
In 1992 another paper was published on the procedure of making the iron
pellets (Amir et al., 1992). The paper highlights the use of graphite to increase porosity
by more than 5 times. Specific pore volume with no graphite was .06 cc/g and was
increased to .35 cc/g when 20% by weight graphite is used. Figure 2.10 shows a linear
relationship between the total cumulative pore volume and the percent of graphite added
Figure 2.10 Relationship Between Pore Volume and Additive Graphite Content in Pellet(Amir et al., 1992)
In 1993 Amir et al. published results comparing 8 different ceramic supports for
the iron reactants. The analysis included the chemical composition, hardness, porosity,
and reactivity of the pellets. A Table of the results can be seen in Table 2.2 below.
Degradation of reactivity occurred over a number of cycles. It was concluded that some
FeBr2 sublimes at the high temperature of the reactions. This reduces the iron content and
also plugs the pores as it leaves. There is also agglomeration of iron oxide particles

27
which reduces surface area and damages the structure of the pores both of which have an
adverse effect on reactivity. This is the last study which focused on the iron reactants.
Table 2.2 Properties of Calcined Iron Solid Reactant Pellets (Amir et al., 1993)
Calcium reactants
The reaction rates of reactions 1 and 2 were reported in 1989 (Kameyama et al.)
and then again in 1990 (Yoshida et al., Table 2.1 on previous page). Kameyama et al.
(1989) used X-ray microanalyzer and found that after the bromination reaction calcium
bromide was equally distributed throughout the pellet confirming their prediction of a
homogenous reaction.
Table 2.1 give the findings of Yoshida et al. (1990). The formulation of the
calcium pellets was first reported by Yoshida et al. (1990). It is thought that this
procedure had been used for a number of years before but only reported in 1990. Figure
2.9 above outlines this procedure. The process uses a mixture of calcium carbonate and
titanium dioxide with some graphite. The mixture is made into pellets and heated to
1100°C so that the calcium carbonate loses CO2 leaving CaO, the needed solid reactant
(Eq. 2.10). At this temperature some of the calcium oxide will also bond with the
titanium dioxide form calcium titanate (Eq. 2.11).
CaCO3CaO +CO2 (2.10)
CaO+TiO2 CaTiO3 (2.11)

28
Metal Ca C2H5OH
Ca(OC2H5)2
Ti(OC3H7)4
Graphite Powder
H2O
Precursors
Refluxing
Hydrolysis
FiltrationMoldingCalcination
CaO CaTiO3 Pellet
Figure 2.11 Production Process of the Pellet Using Ca and Ti Alkoxide(Aihara et al., 1990)
A new method for fabrication of calcium pellets was reported in 1990 by Aihara
et al. This method uses alkoxide chemistry to create calcium titanate and calcium oxide
(Figure 2.11). Pellets were made from both the old and new methods and their
performance in the cycle was compared. The new method had a much higher reaction
rate which reduced the time to maximum conversion. This can bee seen in Figure 2.12
below.

29
Figure 2.12 Solid Conversion Profiles of Bromination (left) and Hydrolysis (right) byCyclic Operation (Aihara et al., 1990)
In the new pellets the calcium oxide was distributed in smaller particles in a more
even arrangement. This reduced pore clogging significantly and therefore decreased the
conversion times. Figure 2.13 illustrates the reduction in pore volume after one run for
the old and new methods respectively.
Figure 2.13 Pore Size Distribution of Unreacted (u) and Brominated (b) Pellets Madefrom the Old Method (Left) and the New Alkoxide Method (Right) (Aihara et al., 1990)
In 1992 Sakurai et al. studied the rates of reaction with the pellets made using
alkoxide chemistry. The reaction rates were proportional to first order of both the
bromide and calcium oxide concentrations. It was also found that bromination (Eq. 2.2)

30
should take place above 590°C to prevent formation of by products, though these by
products are not specified.
In 1995 Sakurai et al. reported another significant improvement in the formation
of the calcium oxide pellets. A very similar approach to Aihara et al. was taken but a
dispersion chain of chemistry was added. The same alkoxide chemistry was used to
create the calcium titanate. Then another formulation was added to make very small
particles of calcium oxide. This separated the synthesis of CaO and CaTiO3 in two
processes and then the mixing of the two form the final product. The CaO particles are
much smaller than those produced from the previous method and better dispersed in the
CaTiO3 matrix. An outline of this procedure is shown below in Figure 2.14. The left part
of the Figure is the calcium oxide dispersion chain.
Figure 2.14 Flow Chart of a Modified Method for the Preparation of a Pellets UsingAlkoxide Method with a Dispersion Chain (Sakurai et al., 1995)

31
Again pellets were made by both methods (conventional and modified) and their
performances were compared. The conventional method refers to the first alkoxide
chemistry method outlined above in Figure 2.11 above and the modified method refers to
the alkoxide chemistry method with the dispersion chain outline in Figure 2.14 above.
The most dramatic improvement can probably be seen in the rates for hydrolysis (Figure
2.15). Though there is improvement in the bromination it is insignificant compared to the
increase in rate of hydrolysis. The production is governed by the slowest reaction
(hydrolysis reaction). The improvement in the hydrolysis rate therefore improved the H2
production rate significantly.
Figure 2.15 Comparison of the Solid Conversion Profiles of Bromination (Left) andHydrolysis (Right) Between the Conventional Method (Alkoxide) and Modified Method
(Alkoxide with Dispersion Chain) (Sakurai et al., 1995)
Sakurai et al. (1995) also experimentally found the effect of the ratio of calcium
oxide to calcium titanate on the conversion. Of the four ratios tested the .76
CaO/CaTiO3 had the highest conversion at about 80% conversion. Figure 2.16 shows
their data.

32
Figure 2.16 Comparison Between Computed and Observed Time Histories ofBromination (CaO/CaTiO3= .45, .76, 1.01, 2.01) (Sakurai et al.,1995)
Sakurai et al. (1996) reported results from an in-depth study on porosity of pellets
made from the alkoxide method (Aihara et al., 1990). These pellets were subjected to a
number of cycles and the porosity was measured after each cycle (Figure 2.17). The
differential porosity from .01μm to 354 μm is shown (Figure 2.18) for sample pellets
before and after bromination. It can be seen that most of the pore volume in concentrated
in the 1 to 5 micron range. This was the latest significant data published on the calcium
pellets.
Figure 2.17 Change of Pore Volume in Cyclic Operation (U; Unreacted, B1 and B2;After 1st and 2nd Bromination, H1, H2, and H3; After 1st, 2nd, and 3rd Hydrolysis,
Respectively) (Sakurai et al., 1996)

33
Figure 2.18 Change of Pore Volume During Bromination (Sakurai et al., 1996)
Throughout these Studies, the Hydrolysis of CaO (Eq. 2.1) is rate limiting. It
determines H2 production rate in the UT-3 process. It is also the highest temperature
reaction. The current study therefore attempts to formulate CaO pellets with more
favorable characteristics.
Strengths and Weaknesses of the UT-3 Thermochemical Process
The UT-3 thermochemical cycle can be a commercially viable process.
Simulation indicates that it is energy efficient and can become cost competitive as the
prices of fossil fuels rise. The process has relatively low temperatures for a
thermochemical process which can be achieved through solar concentrators or through
helium from high temperature nuclear reactors. If the heat for the process is supplied in
this manner no carbon dioxide will be produced. Another advantage of the process is that
the solid reactants remain stationary in the reactors eliminating the need for moving bed
reactor which would otherwise add a great deal of operation complexity.
There are weaknesses of the UT-3 process as well. The process is in batch mode
and is limited by the slowest reaction which is about 1 hour. There are still problems that
34
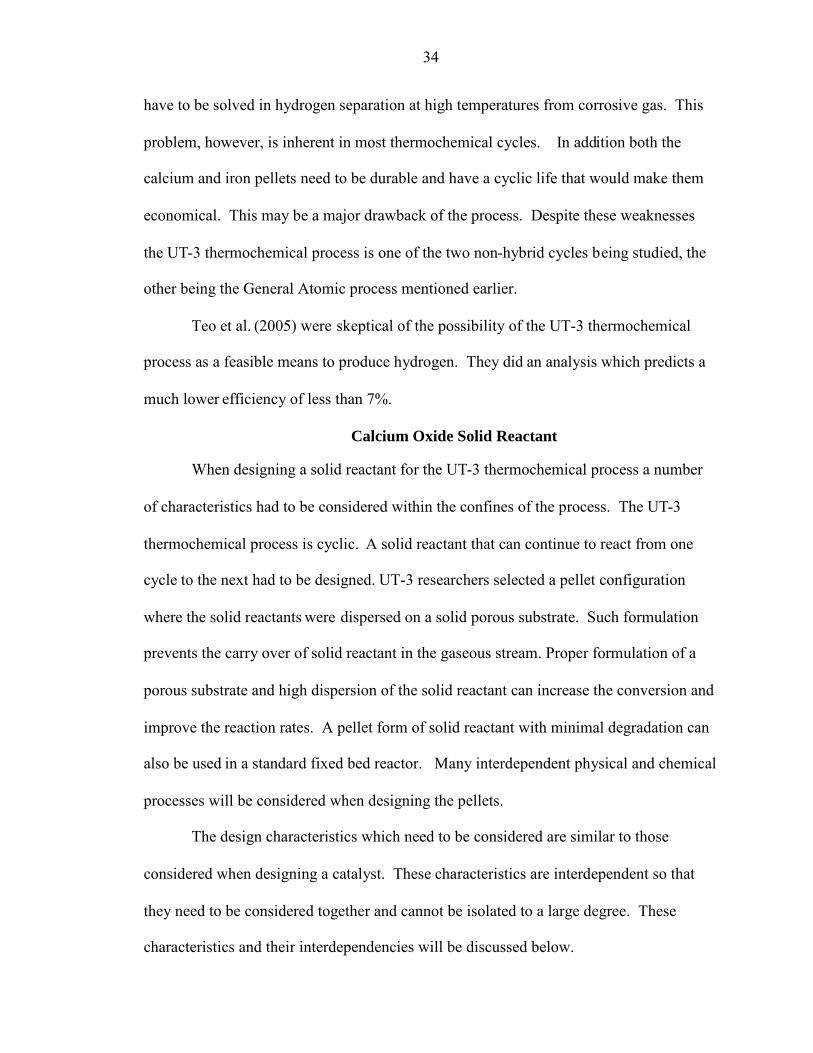
have to be solved in hydrogen separation at high temperatures from corrosive gas. This
problem, however, is inherent in most thermochemical cycles. In addition both the
calcium and iron pellets need to be durable and have a cyclic life that would make them
economical. This may be a major drawback of the process. Despite these weaknesses
the UT-3 thermochemical process is one of the two non-hybrid cycles being studied, the
other being the General Atomic process mentioned earlier.
Teo et al. (2005) were skeptical of the possibility of the UT-3 thermochemical
process as a feasible means to produce hydrogen. They did an analysis which predicts a
much lower efficiency of less than 7%.
Calcium Oxide Solid Reactant
When designing a solid reactant for the UT-3 thermochemical process a number
of characteristics had to be considered within the confines of the process. The UT-3
thermochemical process is cyclic. A solid reactant that can continue to react from one
cycle to the next had to be designed. UT-3 researchers selected a pellet configuration
where the solid reactants were dispersed on a solid porous substrate. Such formulation
prevents the carry over of solid reactant in the gaseous stream. Proper formulation of a
porous substrate and high dispersion of the solid reactant can increase the conversion and
improve the reaction rates. A pellet form of solid reactant with minimal degradation can
also be used in a standard fixed bed reactor. Many interdependent physical and chemical
processes will be considered when designing the pellets.
The design characteristics which need to be considered are similar to those
considered when designing a catalyst. These characteristics are interdependent so that
they need to be considered together and cannot be isolated to a large degree. These
characteristics and their interdependencies will be discussed below.

35
Physical Characteristics
Physical characteristics refer to those properties that have to do with the physical
geometry and mechanics of the material. Porosity and strength are two important
physical characteristics that must be considered when designing the pellets.
Porosity
Porosity is the term for the characterization of the pores of a material. The
porosity of a material is explained using a few different statistics. The first is the total
surface area which is important because it is proportional to the number of available
chemical reaction sites. The second is the pore size which affects the diffusion rates
through a material. All these parameters can be correlated using the BJH equation to
manipulate isotherm data which will be explained in the analytic research tools section in
Chapter 4. Thus a pore size distribution can be created. This allows the researcher to
understand what size pores are in the material. Pore sizes have been split up into two
groups. Microporosity describes pores smaller than 0.5 μm whereas macroporosity refers
to pores larger than 0.5μm. Macropores contribute to diffusion characteristic inside the
pellet while micropores increase the surface area on which the solid reactant can be
dispersed. Macropores are also necessary to prevent plugging of diffusion path due to
volume change of the reactants during the cyclic process.
Strength
The strength obviously refers to the strength of the pellets to resist disintegration.
Strength of the pellets must also be considered with the thermal shock that comes with
the cyclic oscillations of the UT-3 process. Strength also refers to the ability of the
material to keep its porous structure intact on a micro level. The “micro” strength helps to
prevent reduction in pore surface area and pore volume. Further, the pellets must support

36
the weight of other similar pellets. If they are crushed within the fixed bed they will
cause a higher pressure gradient in the reactor leading to a lower flow rates and greatly
reduce reaction surface area leading to lower conversion.
Chemical Characteristics
Chemical composition
Chemical composition refers to the chemical make up of the final pellets. This is
important in this particular application because one of the components, calcium oxide, is
a chemical reactant. Generally, reaction rates are proportional to the concentration of
reactants, thus a greater concentration usually yields a higher reaction rate. The solid
reactant, calcium oxide should be maximized but must be balanced with the characteristic
strength of the pellet, especially on the smaller scale. The calcium titanate forms the
porous substrate on which the calcium oxide is dispersed. If these structures collapse the
surface area is greatly reduced and thus the reaction rates are greatly reduced.
Reactivity
Reactivity refers to the ability of the solid reactant, CaO or CaBr2, to react with
the gaseous reactant, Br2 or H2O respectively. This parameter depends on the surface of
the solid reactant that is dispersed and the diffusion path to the solid reactant and out of
the pellet. The reactivity is highly dependent on the porosity of the material as both
overall surface area and diffusion rates are determined from porosity. Reactivity can also
depend on the concentration of the reactant and so the amount of reactant should be
increased as much as possible without sacrificing the other needed characteristics
especially the strength. The rate of reaction and conversion are the main measure of
reactivity. The reaction rates are generally dependant on concentrations of reactants and
products and temperature. Conversion is a quantity to describe the extent of reaction.

37
Temperature, pressure, reaction rates, type of reactor, and concentrations all have an
effect on the conversion.
Degradation
Degradation refers to the loss of reactivity from cycle to cycle. This can happen
in a number of ways. Degradation is usually due to pore clogging or pore structure
breakdown. Pore clogging occurs when larger particles react and bond to a site formerly
occupied by a smaller particle. The molecules volume of CaBr2 is greater than CaO
which could lead to pore clogging after the bromination reaction. Pore clogging can also
occur do to growth of agglomerates which usually happens at high temperatures through
sintering. Pore structures can breakdown due to external forces (fixed bed weight) and
also small forces from the gases entering and exiting and molecules forming and
reforming break the bonds which maintain the integrity of the pores.
Research Objective
The objective of the research project at the University of Florida is to investigate
the feasibility of the UT-3 thermochemical process and explore the possibility of
lowering the operating temperature. The highest temperature reaction is reaction 1 (Eq.
2.1) at 760°C in which CaBr2 is converted to CaO. Solid reactants with acceptable
characteristics must be developed to evaluate the performance of the UT-3 process. This
research is therefore focused on developing the solid reactant for the calcium reactions
(Eq. 2.1, 2.2).
The objective of the present research is to develop a method of producing the
calcium solid reactant for the UT-3 process. The solid reactant will be made into pellets
for our research. It is a common practice to make catalyst into pellet materials for use in
fixed bed reactors. Pellets provide a good surface area, low degradation, and even

38
transport of gaseous reactants and products through the reactor. Though the solid
reactants are not catalysts in the UT-3 process, pellets are a good choice for the form of
the solid reactant. If designed and fabricated correctly they can provide the same benefits
as in a catalyst system.
There are many steps that need to be taken in order to create pellets for the UT-3
thermochemical process. A summary of the strategy to make the pellets is presented
below for both the chemical formulation and physical procedures. Both will again be
explained in greater detail in the procedural section.
Chemistry Formulation
A chemical procedure will be used to make two different sizes of agglomerates.
The first will be larger particle of CaTiO3 and second will be the smaller will be CaO. In
the final formation the larger agglomerates will have space between them which will
result in macroporosity. These larger agglomerates themselves are not solid though.
They have microporosity as well. In this way the pellets will have the bimodal porosity.
The smaller agglomerates of CaO will be dispersed into the micropores which will give a
good reaction area for the pellets while at the same time maintaining the macroporosity
needed for diffusion.
This chemical procedure is complex. The CaTiO3 agglomerates must be made
big enough to create the macroporosity in the pellet. The agglomerates themselves
should have microporosities for CaO dispersion. The CaO particle must be very small in
order to be dispersed into the micropores of the CaTiO3 and not clog them. Parameters
which will be examined are mixing ratios and heating procedures. The effect of these
parameters will be evaluated by porosity, strength, and chemical composition
measurements.

39
Physical Formation
After the chemical procedure is developed and mixture of CaTiO3 and CaO
obtained, the mixture must be formed into pellets. The precursors must be dried to a
solid powder form. The powder then will be molded in a compression mold to create
pellets. The pellets will then be heated to a temperature to achieve controlled sintering
and adjust the porosity distribution and strength of the pellets. Parameters which will be
examined are mold compression force, drying temperature, sintering temperature and
duration. Porosity and strength will be the dependent variables by which the effect of
these parameters will be evaluated.

40
CHAPTER 3SOLID REACTANT
Presented in this chapter are the procedures to produce the precursors for pellets,
including the original chemical formulation, the modified chemical formulation used by
UT-3 cycle researchers, and the physical method to mold and treat the pellets. There
have been several problems during the course of the work leading to a number of changes
to both the chemical and physical procedures. These problems, their causes, and
procedural changes are also discussed in this chapter.
Sol-Gel Chemistry
The sol-gel process is an approach for preparing thermally, chemically, and
mechanically stable materials with controlled porosities used in the area of gas
separation, catalysis, membrane reactors, sensors, and absorbents. Starting from a
molecular precursor (sol), an oxide network (gel) is obtained via inorganic
polymerization reactions. These reactions occur in solution and hence the term “sol-gel
processing” is used (Brinker and Scherer).
As compared to the conventional “powder” route these processes offer many
advantages:
1. Homogeneous multi-component systems can easily be obtained by mixing themolecular precursor solutions with better kinetics and yields.
2. The scale of mixing is considerably smaller which enables greater dispersion
3. The temperatures required in sol-gel processes are markedly low.

41
4. Careful manipulation of operating parameters (temperature, pH, water content)can yield products suitable for diverse applications.
5. The deformation properties of the sol or gels allow the formation of fibers, filmsor composites by such techniques as spinning, dip-coating or impregnation.
An alkoxide is “an ionic compound formed by the removal of hydrogen ions from
the hydroxyl (OH-) group in an alcohol using reactive metals.” (Frostburg) The alkoxide
used in the current chemical process is calcium ethoxide (Ca(C2H5O)2) . Metal alkoxides
M(OR)n are versatile molecular precursors for the sol-gel synthesis of metal oxides.
There are known alkoxides from many metals including the transition metal elements.
The difference in transition metal sol-gel chemistry compared to the rest of the metal
elements arises from two factors:
The higher electropositivity of transition metals leads to a much higherelectrophilic characters of the metal.
The possibility exists for most transition metals to exhibit several coordinations sothat full coordination is usually not satisfied in the precursors (alkoxides). Thisincreases the probability of adding ligands to the transition metal ion which leadsto diverse physical and chemical properties.
As a result, transition metal alkoxides are much more reactive. They must be
handled with care, in the absence of moisture. They readily form precipitates (particles)
rather than gels (networks) when water is added. The sol-gel process primarily proceeds
in two steps: hydrolysis, then condensation.
Hydrolysis
The electronegative alkoxo groups (OR) make the metal atom relatively
electropositive and therefore highly prone to nucleophillic attack. Metal alkoxides are
therefore extremely reactive with water leading to the formation of hydroxides or hydrous
oxides. The overall reaction can be written as:

42
M(OR)n + nH2OM(OH)n + nROH
The stepwise progress of hydrolysis is shown here (Sanchez et al., 1988).
(a)
1. The first step (a) is a nucleophillic addition of a water molecule to the positivelycharged metal atom M. This leads to a transition state (b) where the coordinationnumber of M has increased by one.
(b)
2. The second step involves a proton transfer with (b) leading to the intermediate (c).A proton from the entering water molecule is transferred to the negatively chargedoxygen of the adjacent OR group.
(c)3. The third step is the departure of the more electropositive group within the
transition state (c).
Condensation
Condensation is a complex process and can occur as soon as hydroxo groups are
generated from hydrolysis. Depending on experiment, three competitive mechanisms
have to be considered, namely: alcoxolation, oxolation, and olation (Livage et al., 1988)
1. Alcoxolation is a reaction by which a bridging oxo group is formed through theelimination of an alcohol molecule.

43
2. Oxolation follows the same mechanism as alcoxolation, but the R group of theleaving species is a proton and the leaving group is water.
3. Olation can occur when the full coordination of the metal atom is not in thealkoxide. In this case bridging hydro groups can be formed through theelimination of a solvent molecule (ROH or water)
The condensation reaction can continue to build larger and larger molecules
through polymerization. A polymer contains hundreds of thousands of units called
monomers which are capable of forming at least two bonds with neighboring molecules.
The polymerization may result into compact particle structure or extended structure
(network). Particles can be easily molded to form pellets. High water/alkoxide molar
ratios, high pH, and high temperatures promote particle formation (Brinker et al., 1994).
Low water/alkoxide molar ratios, moderate acidity, and low temperatures promote
extended structures.
This experiment has the following expected reactions:
1. Formation of Calcium EthoxideCa + 2C2H5OH Ca(C2H5O)2 +H2 (3.1)
2. Hydrolysis of Ca(OC2H5)2 and Ti(OC3H7)4H2O + Ca(OC2H5)2 Ca(OC2H5)(OH) + C2H5OH (3.2)H2O + Ti(OC3H7)4 Ti(OC3H7)3(OH) + C3H7OH (3.3)
3. Condensation by oxalation
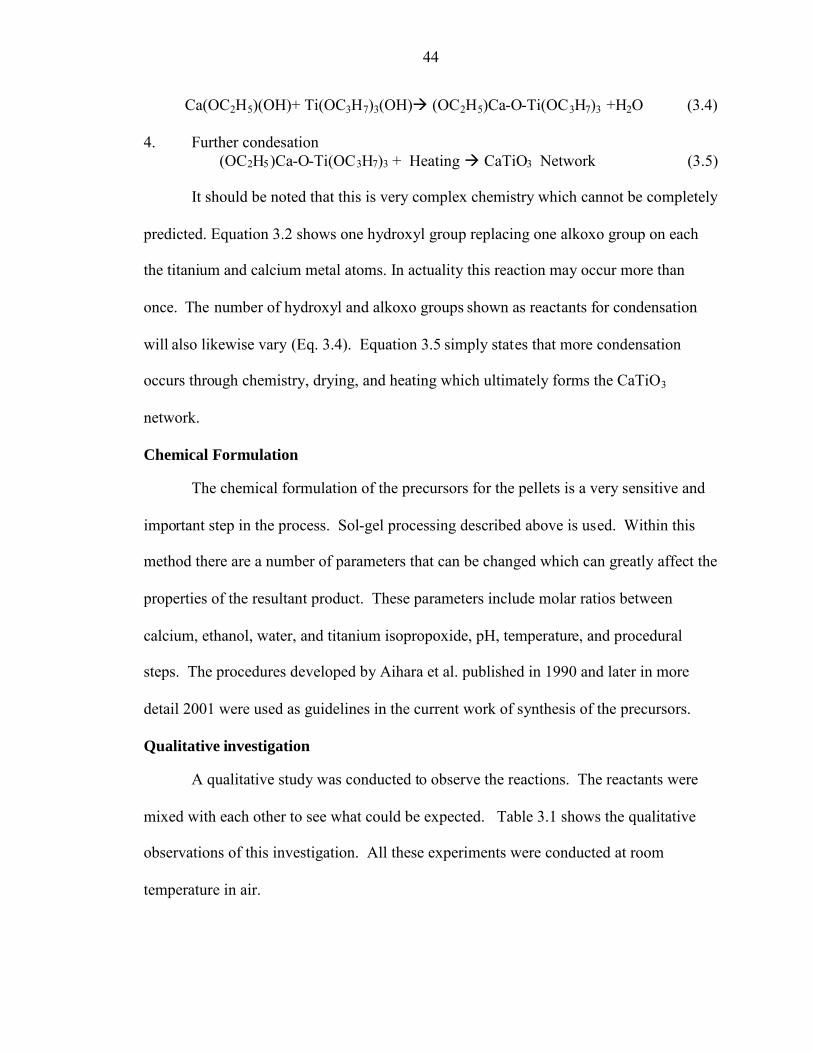
44
Ca(OC2H5)(OH)+ Ti(OC3H7)3(OH) (OC2H5)Ca-O-Ti(OC3H7)3 +H2O (3.4)
4. Further condesation(OC2H5)Ca-O-Ti(OC3H7)3 + Heating CaTiO3 Network (3.5)
It should be noted that this is very complex chemistry which cannot be completely
predicted. Equation 3.2 shows one hydroxyl group replacing one alkoxo group on each
the titanium and calcium metal atoms. In actuality this reaction may occur more than
once. The number of hydroxyl and alkoxo groups shown as reactants for condensation
will also likewise vary (Eq. 3.4). Equation 3.5 simply states that more condensation
occurs through chemistry, drying, and heating which ultimately forms the CaTiO3
network.
Chemical Formulation
The chemical formulation of the precursors for the pellets is a very sensitive and
important step in the process. Sol-gel processing described above is used. Within this
method there are a number of parameters that can be changed which can greatly affect the
properties of the resultant product. These parameters include molar ratios between
calcium, ethanol, water, and titanium isopropoxide, pH, temperature, and procedural
steps. The procedures developed by Aihara et al. published in 1990 and later in more
detail 2001 were used as guidelines in the current work of synthesis of the precursors.
Qualitative investigation
A qualitative study was conducted to observe the reactions. The reactants were
mixed with each other to see what could be expected. Table 3.1 shows the qualitative
observations of this investigation. All these experiments were conducted at room
temperature in air.

45
Table 3.1 Qualitative Reaction StudyCa Eth. Ti. Iso. D.W.
Calcium XXXXXXXXXXXXXXXXXXXXXXXXXXXXXXXGWP NAR VEDEthanol GWP XXXXXXXXXXXXXXXXXXXXXXXXXXXXXXXWFP DFSTitanium Isopropoxide NAR WFP XXXXXXXXXXXXXXXXXXXXXXXXXXXXXXXSFWPDionized Water VED DFS SFWP XXXXX
GWP -Globular white precipitate forms (after stirring)NAR- No apparent reactionVED- Ca violently exothermically dissolves in dionized water producing bubblesWFP- White fibrous precipitate formsSFWP- Spontaneous reaction with white precipitate and gas evolutionDFS- Dissolves forming a solution
Original procedure
The procedure details given in the original publication (Aihara et al., 1990) are far
from complete. Figure 3.1 shows an outline of this procedure. This outline was followed
except graphite powder was not added. Graphite is used as an additive to increase
porosity during calcination. This parameter was eliminated at this time to increase
understanding of the other parameters affecting the porosity.
Figure 3.1 Production Process of the Pellet Using Ca and Ti Alkoxide (Aihara et al.,1990)
46
Though, this procedure looks fairly easy to follow there were many difficulties in
performing the necessary steps. This first step, combining metal calcium and ethanol to
form calcium ethoxide proved to be a major difficulty. Calcium does not react readily
with ethanol. In order to try to remedy this situation two solutions were proposed.
1. Heat the ethanol and calcium mixture to see if the reaction would proceed
quicker at a higher temperature. This was done but no reaction was observed up to
boiling temperatures of ethanol. Because of the loss of ethanol to evaporation and
boiling the mixture would dry out if it was left for long periods of time. No appreciable
reaction was seen in this time frame. Later, it was found that there actually is a
noticeable reaction that occurs between 73°C and the boiling point of ethanol 79°C. The
reaction forms bubbles of hydrogen. This may have been overlooked as a slow boil
because the temperature is so close to boiling of ethanol.
2. Stir the solution covered to see if the reaction would proceed faster while
stirred. Again, there was no appreciable reaction observed. This mixture was left and the
evaporation rate was slower in this set up. Thus, the reaction could be observed over a
longer period of time. A white precipitate could be seen after about two days. The white
precipitate thought to be the calcium ethoxide was finally formed. The precipitate
seemed to be white and globular and settled to the bottom of the beaker after several
hours. This method was adopted as the first step of the original chemical formulation.
The amount of calcium that would react in ethanol was very small. Later through
a 10 day test the reaction limit was found to be about 0.0015g/mL. This was done by
taking 0.38 grams calcium and adding ethanol over a number of days until the calcium
was reacted. After 10 days the volume of ethanol added to react all the calcium was 250

47
mL. To try to increase the concentration of calcium some ethanol could be evaporated
without signs of black calcium reforming. However, other calcium compounds may have
been formed.
Next, 18 mL of titanium isopropoxide was added to 40 mL of this mixture. A
stringing precipitate was spontaneously formed. The beaker became noticeably warmer
indicating that this was an exothermic reaction. This precipitate appeared to be the same
that was found in the qualitative study of reaction between ethanol and titanium
isopropoxide (Table 3.1). The mixture was stirred for 5 minutes and the stringy
precipitate broke apart very easily.
Next the mixture was hydrolyzed using 12 mL of dionized water. The beaker
again became warmer indicating an exothermic reaction. The water seemed to react with
the precipitate forming a powder-like precipitate. The mixture was again stirred for 5
minutes.
Drying procedures described later in this chapter were then followed to eliminate
ethanol and water from the liquor leaving a powder. The powder was molded into
pellets. The feedback from this pelletization study was used to improve the pellet mold
and pelletization technique and to determine affects of sintering temperature. This
procedure was expected to yield CaO dispersed in CaTiO3 matrix. However, since the
ratio of calcium to titanium was small, it is suspected (and later confirmed via Raman
spectroscopy) that not much calcium titanate or calcium oxide was formed. Most of the
solid was anatase or rutile titanium oxide. Another indication that calcium titanate did
not form is that calcium titanate exists in different colors ranging from orange to black
but it cannot be bright white as the resultant powder was. This indicated that the powder

48
was TiO2 which was later confirmed by Raman spectroscopy to be TiO2 (anatase and
rutile). Thus, a new chemical procedure had to be designed. This design needed to
increase the calcium in the precursors.
Modified procedure
A paper by one of the original UT-3 authors (Aihara et al., 2001) gives more
detail into the methods used for the chemical formulation of the calcium titanate
(CaTiO3) precursor. This procedure implied that the reactions within the alkoxide
procedure are very sensitive to water and possibly sensitive to oxygen. A new setup was
constructed to perform the anhydronous formulation. The setup is shown below in
Figure 3.2.
Figure 3.2 Three Mouthed Flask on Stirring Heater

49
A three mouthed flask is used as the vessel to carry out the new procedure. The
first opening has a rubber stopper covered with parafilm with a tube and a mercury
thermometer. The tube is connected to a nitrogen supply and used to purge the flask with
nitrogen. The thermometer is used to monitor the temperature of the fluid inside the
beaker. The second opening has a condenser to condense any vapor that could evaporate
or boil from the system due to heating. The third opening has an adaptor with a silicon
septum. Chemicals are added through the septum by a syringe to insure an anhydronous
and oxygen free environment during the entire process. The flask is placed on a hot plate
which provides the heat for the reflux processes. All of the equipment is properly
supported using metal stands and clamps.
Aihara et al. (2001) used a nitrogen environment and followed the steps shown
below in Figure 3.3. The ratios of the reagents are presented in Table 3.2. The molar
ratios are shown with respect to Ca metal. The * indicates that in step 7 dionized water
and ethanol are added in a solution.
Table 3.2 Original Mixing Ratios for Modified Chemical Formulation ProcedureProcedural Step Substance Amount Units Molar Ratio
Step 1 Calcium Metal 1.00 [g] 1Steps 2, 4, & 7 Anhydronous Ethanol 14.6 [mL] 10
Step 5 Titanium Isopropoxide 7.4 [mL] 1Step 7* Dionized Water 1.8 [mL] 4Step 7* Ethanol 7.2 [mL] 4.9
The refluxing step in Aihara’s, et al. procedure (step 3) was investigated to see
how long the reaction took to fully react. An appreciable reaction occurred from about
73°C to about 78°C. Bubbles are observed forming on the calcium. This is the hydrogen
product from the reaction shown in Eq. 3.1. In the 30 minute time that Aihara et al.
prescribe much of the black calcium powder remained though an appreciable amount of
white powder also could be seen. The reaction was watched for 5 hours without much

50
change. It was concluded that the reaction had reached equilibrium as no noticeable
change was observed between 30 minutes and 5 hours. Therefore, the time of 30 minutes
for step 3 was adopted.
Figure 3.3 Flow Diagram of Procedure Outlined by Aihara et al. (2001)
Step 1: Ca Metal in a
Nitrogen environment
Step 3: Stir for 5 hours @ 75°C
(forms Calcium Ethoxide, Ca(OC2H5)2
Step 4: Add Titanium Isopropoxide
Step 5: Stir for 30 minutes @ 75°C
Step 2: Add Anhydronous Ethanol C2H5OH
Step 7: Stir for 1 hr @ 75°C
Step 6: Add 20% Volume Solution of Waterin Ethanol
Step 8: Pour Into petri dish and dryovernight
Step 9: Heat @ 430°C
Step 10:Make into pellets using
0.25 metric ton compression
Step 11: Sinter in Furnace up to 900°C

51
Stringent steps below were taken to ensure oxygen free and anhydronous
condition.
1. Clean and dry flask, condenser, and other equipment.
2. The calcium sample is measured on the electronic scale and then droppedinto the flask through the opening with the nitrogen and thermometer.
3. The Teflon stir bar is dropped into the flask through the opening with thenitrogen and thermometer
4. The condenser and septum adaptor are coated with a thin layer ofpetroleum jelly to prevent seizing before connecting to the flask.
5. The nitrogen valves are opened to allow a very small flow to the flask.
6. Water to the condenser is turned on.
7. Wait 5 minutes for nitrogen to purge system.
8. Anhydronous ethanol is extracted by syringe from its container anddischarged into the system through the silicon septa.
9. The heater stirrer is turned on to raise the temperature of the mixture tobetween 72°C and 76°C. A noticeable reaction occurs in this temperaturerange forming a white/gray precipitate. The stirrer is set to maintain goodstirring.
10. Heating proceeds for 30 minutes.
11. The mixture is diluted using the same amount of ethanol as in step 9.
12. Titanium isopropoxide is extracted from its container via syringe. Thecorrect proportion is injected into the flask again through the silicon septa.The mixture is heated between 72°C and 76°C for 30 minutes.
13. A solution of 20% by volume of water in ethanol is made in a beaker.
14. A syringe is used to insert the water ethanol solution into the flask inorder to maintain an oxygen free environment. A reaction occursspontaneously turning most of the precipitate a bright white.
15. The mixture is stirred and heated for another hour. In this hour all of theprecipitate becomes white except for a small amount when the calcium totitanium ratios are 3 and 4.

52
A problem encountered with this procedure was the formation of a purple rather
than white/gray precipitate forming in step 9. The problem was thought to be in the
cleaning of the flask from run to run. A new cleaning procedure for step 1 was
considered so that the chemistry would not be affected by residue in the container from
previous runs or residue from the actual cleaning agent. A rigorous cleaning was done
including both an acid bath and base bath. However, the purple precipitate again formed.
It was suggested that the rubber stoppers plugging the flask may be the problem. They
were covered with parafilm and the purple precipitate ceased to form. In the interest of
time a less thorough cleaning procedure can be used which does not affect the chemistry.
Mixing ratios
The initial mixing ratios for the new procedure came from Aihara et al. (2001).
However, that procedure was designed to make calcium titanate and therefore uses a 1 to
1 ratio between calcium and titanium. In order to also make calcium oxide more calcium
had to be used. Ratios of calcium to titanium of 2, 3, and 4 were used. Other parameters
were changed because of the equipment setup and to accommodate for the extra calcium.
These quantities can be seen in Appendix C. The original ratios used by Aihara et al. are
presented in grams, milliliters, and moles in Table 3.2 above.
Physical Procedures
The synthesized precursors were molded into pellets. A procedure was developed
which consists of first drying, then molding, and finally sintering. These three steps will
be described in detail in the following sections.
Drying
The liquor from the precursor synthesis has a significant amount of ethanol and
water left in it. The liquor is stirred to evenly distribute the particles in the container.

53
The liquor is poured into petri dishes. These petri dishes are set under an exhausting
fume hood. Most of the liquid evaporates off after 18-20 hours, though the resultant
powder is still slightly moist. The powder is put into a quartz crucible and heated in a
furnace to 430°C for 1 hour. It was found that pellets molded using the powder
disintegrated when heated between 300°C and 400°C. It was suspected that there were
volatiles in the pellets which contribute to the pellet failure. Therefore, a preheating step
was added. The pellets maintained their integrity at higher temperatures during the
sintering step described later. This step was necessary before molding the pellets. It also
eliminates any water or ethanol which was not evaporated in the overnight drying.
Molding
Hydraulic press
A hand pumped uni-axial hydraulic press (Figure 3.4) is used to supply the
compression force to the mold assembly. It is a Carver hydraulic model # 3912 with a 5-
1/8” maximum ram stroke. The press is located in room 1A of the Nuclear Field
Building. There are two parallel plates on the press. The upper is plate on a screw and
fixed in place using nuts. The bottom plate is connected to a hydraulic cylinder which is
raised to supply the force as the lever arm is pushed down. A force gauge on the press in
units on metric tons is rated up to 11 metric tons.
A 304-SS mold assembly (Figure 3.5) was fabricated and used in the hydraulic
press described above to make pellets of 3/16” D x 4/16”-6/16” H. Compression force on
the press was varied from 0.3 MT (metric tons) to 2 MT. Problems with plastic yielding
and seizing of the plunger with the mold were experienced at axial loads greater than 1.0
MT and so the pellets were cast with forces less than 1 MT. A step by step procedure of
this process can be seen in Appendix C.

54
Figure 3.4 Hand Pumped Uni-Axial Hydraulic Press for Pellet Production
Original mold
Force FromPress
Figure 3.5 Pellet Mold Assembly

55
The mold assembly consisted of 5 parts as shown in Figure 3.6 which are the
plate, plungers, cap, mold, and extraction piece. The plate was the bottom piece on
which the mold was supported and was the surface the pellet was compressed against. It
also helped to move the full assembly in and out of the press.
MoldPlate
Cap ExtractionPiece Plungers
Figure 3.6 Pellet Molding Assembly Parts
The plungers were used in two different manners and so two different length
plungers were fabricated. The shorter plungers were used to compress the pellets.
Generally, the shorter plungers had a greater compression force on them. The shorter
lengths helped to prevent bending from any eccentric forces. The longer plungers could
be used to push the pellets out of the mold and could be pulled out easily because their
extra length allowed room for gripping. The cap was the top piece which held the
plungers vertical which also helped to reduce non-axial forces which would lead to
buckling and bending. It has a hole drilled about 0.5” in depth with a 0.1875” drill bit
and a 0.1895” reamer. The mold has bores where the powder is positioned and

56
compacted. These bores are made slightly larger than those in the cap. The bores were
observed to expand after multiple uses at compression forces close to 1 metric ton. The
bores were made using 0.2031” drill bit and reamer. The extraction piece is only used to
extract the pellet. It is essentially a spacer between the mold and the top surface of the
press. It has is a hollow cylindrical piece which transfers the force to the outer molding
while giving no resistance in the center where the pellet is extracted. The extraction
piece allows the pellet to be pushed out into the hollow space it contains.
As discussed in chapter 2, a low compaction force is expected to yield higher
porosity in the pellet. However, lower compaction force may also reduce the strength of
the pellet. These two factors were considered to arrive at the optimum molding
procedure.
For the original chemical formulation procedure a force close to 1 metric ton gave
the best strength. Whole pellets were formed with forces as low as 0.5 metric tons but a
noticeable depreciation in strength was observed during handling the pellets. It was
found that pellets made from precursors with 0.25-2 percentage of graphite could be
made with a compaction force of only 0.3 metric tons. Also stearic acid and ammonium
carbonate were both tried as binders at 3% by weight. Both actually degraded the
strength of the pellet when compared with pellets made with the same compression
without the binders.
For the modified chemical formulation procedure a force of only 0.25 metric tons
was needed to give approximately the same strength as the pellets compressed at 1 metric
ton using the previous chemistry. No graphite or binders were used with the modified
chemical formulation.

57
Modifications in mold and molding procedure
Many problems were encountered during the fabrication of the mold and the
development of the molding procedure. The most prevalent operational problem was the
seizing of the plungers in the mold. This was attributed to two design aspects. The first
was the length of the mold. The original mold was 1-1/16” This original mold bore also
had a very low radial clearance between it and the plunger so that there would be
minimum flow of the powder into the space between the bore in the mold and the
plunger. The friction from the powder wedging between the mold and the plungers led to
seizing.
To eliminate this problem a procedure which limited the insertion length of the
plunger was used to prevent seizure during the compression process. The compressed
pellets however could not be removed due to the friction forces between the walls of the
mold and the consolidated powder. A slightly larger hole was drilled to see if pellets
could be made. The same problems occurred, though the plunger rarely seized during the
compression phase. When the pellets were extracted they fell apart. It was thought that
an uneven distribution of pressure in the powder along the height of the mold due to
friction led to the failure of these pellets.
A new mold was made that was 11/16” in height. The holes on this mold were
drilled slightly larger than 0.1875” at 0.2031”. A procedure was used with the new mold
so that the powder would be compressed stepwise using multiple compactions. The
plunger was removed after every incremental compaction and more powder was added to
fill the hole to the top. The powder was again compressed. This was repeated until the
desired height of the pellet was reached. This process resulted in some long pellets.
However, most pellets would shear during extraction into small fragile disk shapes or

58
separate into shorter pellets. The seizing between the mold and the extraction plunger
also occurred sometimes.
The procedure was further modified as follows. Only one fill was used. The
powder was compressed by hand as much a possible and filled to the top. The press was
then used to compress the mold assembly with the desired force. Seizing has not
occurred using this procedure during compression or extraction. This procedure is now
used and generally produces whole pellets with the average dimensions ~3/16” D x 5/16”
H though this height varies slightly from run to run. If correctly executed this procedure
yields a usable pellet every time. Seizing probably does not occur because of the
relatively short compression length into the powder at high pressures. Most of the
compression is at low pressures. Thus the powder in the gap between the plunger and the
bore is loosely packed except for the bottom. When the plunger is being extracted it has
some play in the axial direction which can loosen the tightly packed powder near its
lower face. The surface area of the plunger exposed to tightly packed powder was also
small. Similarly, during extraction the surface area of the tightly packed powder causing
the friction was reduced due to the shortened length of the pellets. Thus no seizing
occurred. The pellets hold together better also because they are compressed all together.
The previous method compresses different sections. These sections don’t seem to hold
together well. Thus the current method eliminates seizing and provides a reliable way to
produce pellets.
Sintering
The pellets are sintered in a furnace to increase strength in the structure of the
pellet. An increase in temperature promotes growth of the titanium network. The
particles form intermolecular bonds which help to create a web-like structure increasing

59
the structural strength of the pellets. However, in the process the particles become larger,
which often leads to pore clogging. Therefore, there is an optimum sintering procedure
which will give the needed strength but without forfeiting the desired porosity.
A tubular furnace with a controller is used for sintering. An ATS (Applied Test
Systems) 3310 series furnace is used and is also located in room 1A of the Nuclear Field
Building. It can be seen in Figure 3.7 below. The furnace range is up to 1300°C. The
operation of the furnace can be programmed using a PID controller (Kanthal Super 33,
PC-120/240-20 controller). The controller has an offset error and temperature set points
must be above 95°C. A recalibration was done in order to try to eliminate this offset
error but it still persisted. During the calibration the error range in the temperature was
found to be plus or minus 10°C. A quartz crucible attached to a quartz hanger is used to
lower the pellets and powder into the furnace. It is approximately 18” in length and the
crucible has a diameter of 1.5” and a height of 2”.
There are a number of different heating schemes used to vary the temperature and
the duration of heating. The heating schemes are presented in Figure 3.8. The heating
schemes have been modified based on the behavior of the pellets with respect to strength
and microporosity. The original procedure was a 100°C step every hour up to 700°C.
This was used to first find the volatiles addressed earlier in this chapter between 300°C
and 400°C and to determine if there were any other disintegration temperatures. The
next scheme that was used went to 1000°C over a number of hours. The ramp times were
to allow any reactions to occur slowly so they would not to break the pellets. The slow
ramp increase was also to prevent thermal shock from breaking the pellet. After 1000°C
heating the porosity of the pellet was only about 3% of that of the 700°C pellet. However,

60
the 1000°C heated pellet was stronger than the 700°C pellet. A medium temperature
above the reaction temperature of 760°C was sought that would increase strength yet give
a better porosity. Both 800°C and 900°C heating schemes were then used to investigate
this parameter shown in Figure 3.8 as the medium schemes. The results in chapter 5 show
acceptable characteristics within these temperatures.
Figure 3.7 Furnace Used for Sintering Process
0
200
400
600
800
1000
1200
0 2 4 6 8 10 12 14 16 18 20
Time [hrs]
Tem
per
atu
re[C
]
Step Heating to Discover Volatiles
Reduction in Porosity 1000C
Medium Scheme to 800C
Medium Scheme to 900C
Figure 3.8 Heating Schemes for Pellets

61
CHAPTER 4ANALYTICAL TOOLS
The theory and procedures for the analytical tools used are presented in this
chapter. The theory presented in this chapter is meant to give an understanding of some
of the methods used to characterize the pellets. The procedure is an outline of the steps
taken for each instrument to give a basic understanding of its operation. More detailed
procedures can be seen in Appendix D.
Presented in this chapter are three analytical tools. There are two porosity tests.
The first, Nitrogen Adsorption, measures micropores using theory to predict distribution
of pore sizes between 2 nm and 0.1 μm. The second, called Mercury Porosimetry,
measures macropores using mercury under pressure and theory to predict distribution of
pore sizes between 2 nm and ~100μm. Though mercury porosimetry can intrude into
small pore sizes, BET measurements are generally taken as a better measurement of
micropores smaller than 50nm. The third tool is Raman spectroscopy which is used to
determine the chemical composition of the pellets. In addition to these tools a chemical
procedure was developed to help quantify the chemical composition of the pellets.
Nitrogen Adsorption
Theory
The nitrogen inside the sample tube is able to condense on the pore surface. This
has been modeled by a number of scientists over the years. There are monolayer models
and multi- layer models. Some account for capillary effects in pores and others do not.

62
One of the most widely used models is the BET multilayer adsorption model which
builds upon the Langmuir monolayer model.
The Langmuir model relates the concentration of vacant sites and filled sites in
adsorption process. The model has a form similar to a kinetic rate law. For nitrogen it is:
rAD kA PN2 CvCN2 S
KA
(4.1)
where rAD is the rate of adsorption. kA is rate coefficient for adsorption. PN2 is the pressure
of nitrogen. Cv is the concentration of vacant sites. CN2-S is the concentration of sites
which are filled by a N2 molecule. KA is the equilibrium adsorption constant. Though,
the pressure for nitrogen can be monitored all the other parameters must be known from
earlier experimentation. However, when nitrogen is adsorbing on a surface the rate is
different than if it is forming a multilayer on previously condensed nitrogen. Thus once
the total surface is covered the rate is fairly constant and can be seen as the linear middle
section in the plotted BET isotherm in Figure 4.1. The beginning of this linear region
can be used to estimate the total surface area based on the volume adsorbed.
BET Isotherm
A BET (Brunauer, Emmett, and Teller, 1938) Isotherm describes the multilayer
adsorption case for most surfaces. However, in materials with small pores this equation
becomes less accurate due to capillary forces across the pores. Thus another calculation
scheme has been developed by Barrett, Joyner, and Halenda (BJH).
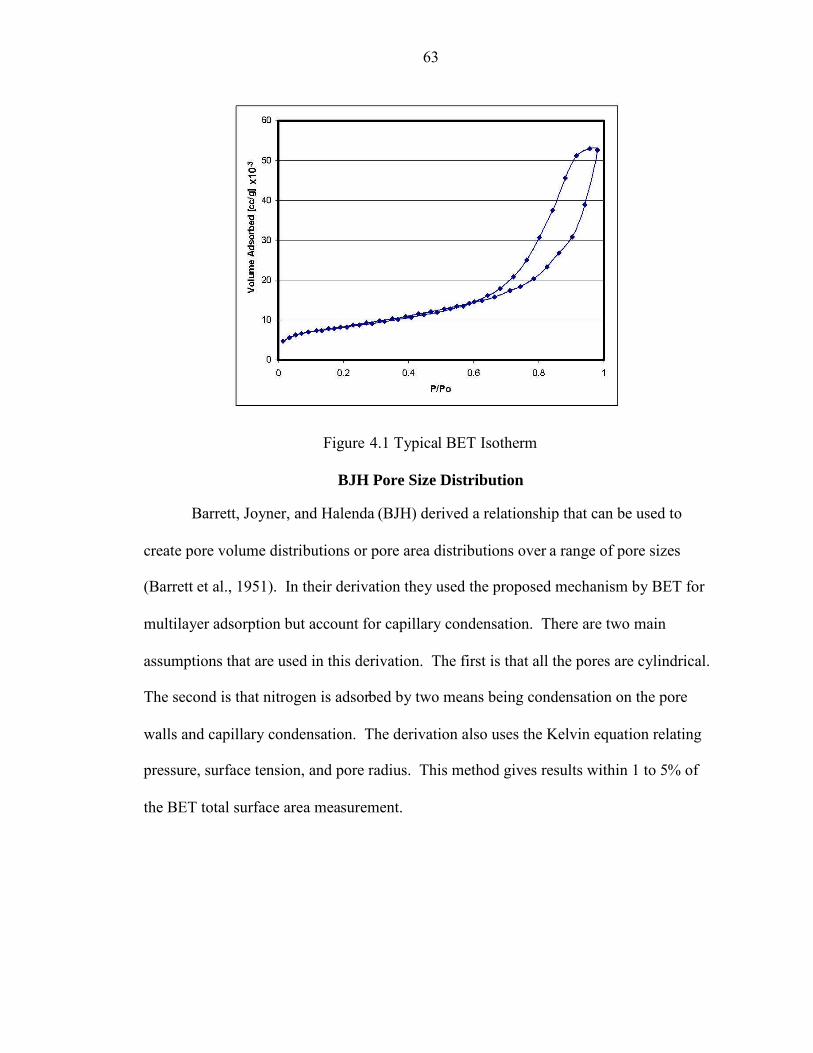
63
Figure 4.1 Typical BET Isotherm
BJH Pore Size Distribution
Barrett, Joyner, and Halenda (BJH) derived a relationship that can be used to
create pore volume distributions or pore area distributions over a range of pore sizes
(Barrett et al., 1951). In their derivation they used the proposed mechanism by BET for
multilayer adsorption but account for capillary condensation. There are two main
assumptions that are used in this derivation. The first is that all the pores are cylindrical.
The second is that nitrogen is adsorbed by two means being condensation on the pore
walls and capillary condensation. The derivation also uses the Kelvin equation relating
pressure, surface tension, and pore radius. This method gives results within 1 to 5% of
the BET total surface area measurement.

64
rp1 rk1t1
dt1dt2dt3
t4rp2
t2rk2
dt2dt3
t4rp3
t3rk3
dt3t4
(P/Po)1 (P/Po)2 (P/Po)3
Vp1=R1*dV1 Vp2=R2*dV2-R2*dT2*Ac1Vpn=Rn*dVn-Rn*dtn SUM[j=1 to n] (Acj)
Figure 4.2 Schematic Representation of Assumed Desorption MechanismShowing Three Different Pores and Demonstrating the Thinning of the Physically
Adsorbed Layer Over the First Three Decrements (Barrett et al., 1951)
The pressure is increased gradually until the sample is saturated or has reached
the preset pressure. The pressure is then reduced stepwise so that a certain volume of
condensate is emptied from a certain pore size range; The condensate layer thickness is
reduced or the capillary condensate is emptied. A volume of gas at a given pressure is
measured. This volume can be converted to condensate volume knowing the liquid and
vapor densities of nitrogen. Thus the pore volume can be found. This is a simplified
explanation of the theory. Detailed treatment of the theory is available by Barrett,
Joyner, and Halenda (1951). Nitrogen adsorption and mercury porosimetry are also
explained clearly and compared by Westermarck. (2000)
Procedure
A Quantachrome NOVA 1200 machine located at the Particle Science
Engineering building was used for nitrogen adsorption tests. Two to three pellets are
placed in a sample cell (similar to a test tube). The cell is placed into an airtight station in
the NOVA machine. It is then vacuum outgassed for a duration which depends on the

65
sample. The sample is heated to 200°C during the outgassing procedure. Outgassing
elutes the moisture from the sample, making the pore surface available for nitrogen
adsorption.
At this point the mass and the density of the sample are entered in the instruments
software. The sample cell is moved to the analysis station. A dewar (container) of liquid
nitrogen is raised so that the cell is surrounded by liquid nitrogen. Starting from very low
pressures, nitrogen is incrementally added into the cell. Some of this nitrogen is adsorbed
into the pores of the sample. The pressure is increased until atmospheric pressure (770
mm Hg) is reached. The pressure is then reduced stepwise. A certain amount of
nitrogen desorbs at each pressure. This is measured through pressure reading and/or air
flow out of the cell. The amount of desorbed nitrogen can be correlated to pore size
using theory.
Mercury Porosimetry
Theory
The theory behind the mercury porosimeter is relatively simple compared to that of
Nitrogen Adsorption. Mercury porosimetry uses the capillary relationship given by
Washburn equation (Eq. 4.2) to calculate pore size based on pressure.
D= -4 γ cos(θ) / P (4.2)
Knowing the contact angle of mercury (θ=140°) and surface tension (γ= 480
dyne/cm), the pore diameter can be correlated to the pressure inside the chamber.
Mercury porosimetry like nitrogen adsorption, assumes that the pores are cylindrical. It
also assumes constant mercury properties.

66
Procedure
The Quantachrome Autoscan 60 Mercury Porosimeter in the Particle Science
Engineering Building was used to measure the porosity of the pellets. A porous sample is
placed in a small glass container with a long thin tube at one end. The air is evacuated
from the system using a vacuum pump. Mercury is then pushed up the long thin tube
until the container and the tube are full. The mercury porosimeter works by measuring
the capacitance of the mercury in the tube. As the pressure is increased in the chamber
more mercury is pushed into the pores of the pellet. As the column of mercury is
decreased, the capacitance changes by a certain amount which is calibrated so that a
volume can be calculated. The pressure in the system is increased slowly so that more
mercury intrudes into smaller pores. Using the pressure and Washburn equation the pore
size can be calculated. Thus, a volume from the measured capacitance can be obtained
and correlated to the pore size calculated from the capacitance. The pore size
distributions are generated in this manner.
Raman Spectroscopy
Theory
Raman spectroscopy is a light scattering technique to determine the composition
of molecules. A laser is focused onto a surface. The light is then inelastically scattered
according to the bonds of the molecule. This is called the Raman effect. The Raman
effect only occurs for about 1 in 10 million incident photons and is therefore a weak
signal. Inelastic scattering occurs when a photon gains or loses energy from the vibration
energy of bonds in a molecule (Eq. 4.3). If the photon loses energy it will have a higher
wavelength than the exciting light. This is called the Stokes line and is generally what is
measured. If a photon gains energy it will have a lower wavelength than the exciting

67
light. This is called the anti-stokes line and is generally very week and hard to detect.
The change in wavelength of the stokes and anti-stokes line is related to the vibrational
energy spacing. Thus these changes can be used to directly measure the vibrational
energies of the molecule. In order to detect these weak signals a high powered
monochromatic light source such as a laser is used.
h/λin + Evib= h/ λout (4.3)
This scattered light is detected over a spectrum of wavelengths. The spectra for
materials are different based on their bonds. This can be seen in the spectra for different
materials. Characteristic peaks will indicate the presence of particular types of
molecules. Raman spectroscopy also has a signal in which the relative intensities of the
characteristic peaks can be correlated to the concentration of a certain substance. In order
to do this, spectrum must be taken from known concentrations of species of interest.
Procedure
A sample of powder is prepared and put into a melting point capillary tube. A
computer is attached to the Raman spectrometer. A program called OMNIC is used to
adjust the laser light so that the best signal is obtained. The laser is focused onto the
sample and the scattered light is reflected to a spectral detector. This signal can be
measured for different lengths of time. OMNIC also averages a number of signals which
can be varied. A number of other parameters affecting strength of the laser and the signal
detection can be changed. A spectrum is then obtained for each sample. Characteristic
peaks at certain wavelengths will indicate the presence of a particular substance.
Sometimes the strength of the signal can also be correlated to the concentration of the
particular substance of interest if calibrated using known concentrations.
68
Chemical Testing
Theory
Chemistry can be used to determine the amount of CaO present in the pellets. The
two main components in the pellets are CaO and CaTiO3 . CaO reacts with HBr to form
CaBr2 yet CaTiO3 does not react with HBr or H2O. The percentage of CaO can be
found using the molecular weights CaO and CaBr2 and the difference is weight after a
reaction with HBr and evaporation of volatiles.
Procedure
Samples were made of powder produced with modified chemistry and heating
procedures. Each sample was placed in a sample container and weighed. An excess
molar amount of hydrobromic acid was added to each container via a 48% by weight
solution of hydrobromic acid in water. The mixtures were then subjected to 80°C heating
for 18 hours. The heating temperature was increased to 100°C for 4 hrs and to 200°C for
an additional 2 hours. All the chemicals were volatile except for the calcium compounds.
The amount of CaO can be quantified by finding the change in weight resulting from the
added HBr solution because CaTiO3 does not react with HBr. The extent of the reaction
was determined by using laboratory grade CaO and performing the same procedure. The
extent of the reaction was found to be 98%. This procedure was used to determine the
amount of CaO in each sample. An error of about 5% is estimated using this procedure.
Though, small amounts of CaCO3 and TiO2 can be present in the pellet most of it is
composed of CaO and CaTiO3. Thus, after the CaO is calculated the amount of CaTiO3
can be approximated as the remainder of the composition.

69
CHAPTER 5EVALUATION OF PARAMETERS
The effect of various parameters on the pellet characteristics—the porosity, the
chemical composition, and the strength—was studied to develop the molding and heating
procedures. The parameters are listed in Table 5.1 and are associated with the chemical
formulation, molding procedure, and pellet heat treatment. Correlations have been made
between procedural parameters and the resultant characteristics of the pellet. The
optimum procedure has been chosen based on these correlations. These correlations and
the optimum procedure parameters are presented in this chapter.
Correlations from Original Chemistry
The original chemistry was helpful for determining a general range of parameters
for the heating procedures and molding procedures. However, this procedure had to be
modified to attain the desired composition in the pellets. Figure 5.1 is a diagram that
illustrates how the parameters were evaluated based on the resulting characteristics.
Within each of these general categories describing the procedure there are parameters
which can be seen in Table 5.1. The parameters with a (1) are ones which were varied to
characterize the pellets using the original chemistry. Likewise, a (2) indicates parameters
for the modified chemistry. An (M) indicates the parameters which were changed as a
direct result of feedback from the characteristics of the resulting pellets. Parameters
without any of these designations were established in the original procedure and not
significantly changed or varied to investigate how the characteristics of the pellet
changed.

70
Table 5.1 Parameters in the Main Categories Shown in Figure 5.1Chemistry (M) Molding Heating ProceduresCa/Ti Ratio (2)(M) Compression Force (1) (M) Drying Time & Temp.pH Binder Additive (1) Preheating Time & Temp (M)Water/Ca (M) Max Sintering Time & Temp.(1) (2)Ethanol/Ca (M) Temp. Ramping Scheme (M)CondensationTime and Temp.
Final MoldingandHeatingProcedures
Pellet HeatingProcedure
Strength
Composition Strength, Microporosity
Strength
Original Chemistry Pellet MoldingProcedure
Figure 5.1 Flow Diagram Indicating How Characteristics Were Used as Feedback toModify the Parameters to Arrive at the Final Procedures
Molding Procedure: Strength
The strength was qualitatively be analyzed. If the extruded pellet fell apart it was
deemed too weak. Most of the pellets formulated using the original chemistry required a
compression of 1.0 metric ton to ensure whole pellets.
Heating Procedure: Strength and Microporosity
The heating procedures were evaluated based on the strength and the microporosity
of the pellet after heat treatment. The preheating step was added to improve strength as
described in chapter 3. The merits of the heating procedures were also evaluated based

71
on the strength of the pellets after heating. The pellets remained intact with no significant
cracking during heating. Higher temperatures led to sintering and created stronger
pellets. This was qualitative comparison as no quantitative strength test has been done.
The maximum temperature of the heating had a direct impact on the microporosity
of the samples. The cumulative pore volume was measured using nitrogen adsorption in
conjunction with a BJH correlation and is plotted against the maximum sintering
temperature in Figure 5.2. The data fit a correlation y=0.0012x2-2.6701x+1433.7 where
x is the maximum sintering temperature and y is the cumulative pore volume. The
microporosity decreased drastically from maximum temperatures between 700°C and
1000°C for pellets with the same chemistry and molding procedures. At 700°C the
porosity is 0.171 cc/g which drops down to 0.006 cc/g when the sintering temperature is
increased to 1000°C. The intermediate temperatures of 800°C and 900°C show the
decreasing trend. A sintering temperature of 800°C was chosen for investigation with the
pellets created using the new chemistry. This temperature gave a reasonable strength to
the pellets without drastic loss in porosity.
Figure 5.2 Specific Cumulative Micropore Volume vs. Maximum Sintering Temperature

72
Chemistry: Chemical Composition
Raman Spectroscopy identified the composition of the first pellets. Two pellets
were tested and found to closely resemble the Raman spectra for rutile and anatase-TiO2.
This confirmed suspicions that the original chemistry did not form the desired network.
Figure 5.3 shows the Raman spectra from two pellets made using the original chemistry
along with the spectra for both anatase and rutile TiO2 where the y-axis is the intensity
(Int) of light for that wavelength. Pellet 1 appears to be mostly anatase TiO2. Four
matching anatase peaks can be seen from left to right. However, there are no rutile
peaks. The spectra for the second pellet has peaks of both anatase and rutile TiO2
indicating the presence of both phases of TiO2 in the pellet. This probably occurred due
to the different heating procedures this pellet underwent. Peaks for CaO and CaTiO3 are
markedly absent in these spectra. Because of the minute amount of CaO the original
chemical procedures had to be modified.
TiO
2A
nat
TiO
2An
atas
e
TiO
2A
nata
se
TiO
2An
atas
e
Pel
let1
Pelle
t2Ti
O2
Rut
ile
TiO
2R
utile
0.2
0.4
0.6
0.8
1.0
1.2
1.4
1.6
1.8
2.0
2.2
2.4
2.6
2.8
Int
200300400500600
Raman shift (cm-1)
Figure 5.3 Raman Shift Spectra of Anatase and Rutile TiO2 and Two RepresentativePellets Made Using the Original Chemistry

73
Correlations from Modified Chemistry
Correlations were made between the characteristics of the new pellets (made
using the modified chemistry) and the procedural parameters. Figure 5.4 illustrates how
the characteristics are used to evaluate the parameters in this modified procedure. Refer
to Table 5.1 for parameters within each main procedural step.
Strength, Macroporosity, Composition
Final Molding,Heating, andChemical Procedures
Pellet Heating Procedure
Strength, Macroporosity
Strength Strength
Pellet Molding ProcedureModified Chemistry
Figure 5.4 Visual Flow Diagram of How Characteristics were Used as Feedback toModify the Parameters Using the Modified Chemistry
Molding Procedure: Strength and Macroporosity
The new pellets required a compression force of only 0.25 metric tons to hold
together as compared to 1 metric ton for the previous pellets. This improvement is
considerable because increased strength at lower compression will result in greater
porosity for these pellets.

74
A comparison between new pellets compressed at 0.5 metric tons and 0.25 metric
tons was conducted. The pellets were made with a 2 to 1 ratio between calcium and
titanium and heated to 800°C using the same heating scheme. The size of the pores
seems to remain in the same range indicated by the differential distribution which peaks
around 100nm. However, the specific cumulative pore volume for the pellets was
approximately 0.15cc/g less at the 0.5 metric ton compression. This is shown in Figure
5.5 by the smooth curves increasing right to left to a maximum at 10 nm. For reference a
larger version of this graph can be found in Appendix F, (Figure F.2).
Cumulative and Differential Pore Volume Distributions
0
0.1
0.2
0.3
0.4
0.5
0.6
0.7
10 100 1000Pore Diameter [nm]
Cum
ula
tive
Sp
ecifi
cP
ore
Vol
um
e[c
c/g
]
0
0.001
0.002
0.003
0.004
0.005
0.006
Dif
fere
ntia
lSpe
cifi
cPo
reV
olu
me
[cc
/g]
0.5MT Cumulative 0.25MT Cumulative 0.5MT Differential
0.25MT Differential 10 per. Mov. Avg. (0.5MT Differential ) 10 per. Mov. Avg. (0.25MT Differential )
Figure 5.5 Comparison of Cumulative and Differential Specific Pore VolumeDistribution for New Pellets Compressed at 0.25 and 0.5 Metric Tons.
Chemistry: Macroporosity, Microporosity, Composition, and strength
Using the modified chemistry a network of CaO and CaTiO3 was synthesized.
An attempt was made to use Raman Spectroscopy to verify the existence of CaTiO3 and

75
CaO. At first the sample spectra obtained were inconclusive as their peaks did not match
either those of the pure CaO spectrum or CaTiO3 spectrum as expected. One possible
reason for this may be electrical interaction that may occur in the samples. Since the scale
of mixing using the alkoxide chemistry is at the molecular level, which may alter the
electronic response. This would affect the Raman spectroscopy as it uses light scattering
that can be affected by slight variations in the electric fields of the samples. Appendix E
(Figure E.2) shows the comparison of a sample made using the modified chemistry, Pure
CaO and Pure CaTiO3. The samples were also compared to spectra from CaCO3,
Ca(OH)2, TiO2-rutile, and TiO2-anatase to identify if any of these substances was present.
There did not appear to be any strong matches in the samples formulated with the new
chemistry and these compounds. One sample did have a small matching peak with
CaCO3 indicating a small percentage of CaCO3 (~2-5%). The florescence of the samples
generate broad peaks which hide the species identifying peaks.
A second attempt to use the Raman spectroscopy revealed strong matching peaks
for CaTiO3 for two different pellet powders. These powders were made using a 2 to 1
ratio between calcium and titanium and heated to 1000°C. The only difference between
the two pellets was the temperature of preheating. Pellet 1 was preheated at 430°C
whereas pellet 2 was preheated at 600°C. Figure 5.6 shows the matching of the peaks.
More Raman shift spectra are presented in appendix E including the full spectra of the
piece shown in Figure 5.6. It should also be noted that for this spectra the intensity value
(Int) is meaningless as the spectra were offset and scaled differently to show matching
peaks. There were no strong peaks in the spectra matching CaO, but a non-fluorescing
spectrum for CaO could not be obtained.

76
Pe
llet1
Ca
TiO
3
CaT
iO3
Pe
llet2
0.5
1.0
1.5
2.0
2.5
3.0
3.5
4.0
4.5
Int
200300400500600
Raman shift (cm-1)
Figure 5.6 Raman Shift Spectra for CaTiO3 and Two Sample Pellets
The existence of CaO and CaTiO3 in a sample made from the modified chemistry
was verified through X-ray diffraction (XRD) because of the inconclusive data from the
first try at Raman Spectroscopy. The signature peaks of CaTiO3 and CaO have been
identified in the XRD taken for this sample (Figure 5.7). In addition to the XRD
verification, the amounts of CaO in the pellets were found using the chemical testing
procedure described at the end of chapter 4. Results from the chemical testing procedure
can be seen in Table 5.2 for many different samples.
In Table 5.2 the values for the %CaO are calculated based on the assumption that
calcium only exists as CaO and neglects the possibility of CaCO3 or Ca(OH)2. The
assumption is poor at low temperatures. The existence of CaCO3 and Ca(OH)2 is evident
in the high percent error in the Modified Chemistry Powder 2 data for the unheated and
430°C heated runs. However, this seems to be a reasonable assumption when the

77
maximum heating temperatures is 1000°C. The temperature drives the dissociation of
any Ca(OH)2 or CaCO3 that may be present. Thus, the results show that the presence of
CaO is close to the expected percentage based on the stoichiometric relationships
between calcium and titanium.
The standard samples of CaO and CaTiO3 justify the validity of the test. CaO and
CaTiO3 are within 2% and 3% of their theoretical values respectively. The CaTiO3 in
the pellet powder can also be seen unreacted at the bottom of the sample container. One
other point of interest is that the samples made with powder from the original chemistry
do not indicate any appreciable reaction. This again confirms the minute amount of Ca in
these pellets.
Table 5.2 Results of Quantitative Chemical Composition Testing Procedures
Sample Description Ca/Ti Max Heating Temp Exp. Theor. %ErrorMod. Chem. Powder 1 1 430°C 9.0% 0.0% 9.0%Mod. Chem. Powder 1 1 430°C 8.7% 0.0% 8.7%Mod. Chem. Powder 2 2 1000C 45.4% 50.0% 9.2%Mod. Chem. Powder 2 2 430C 25.5% 50.0% 49.1%Mod. Chem. Powder 2 2 unheated 30.7% 50.0% 38.6%Mod. Chem. Powder 3 2 1000C 47.1% 50.0% 5.8%Mod. Chem. Powder 4 3 1000C 58.7% 66.7% 12.0%
Original Chem. Powder 1 ~0 900C 0.6% 0.0% 0.6%Original Chem. Powder 2 ~0 1000C 0.3% 0.0% 0.3%
Pure CaO N/A none 98.3% 100.0% 1.7%Pure CaO N/A none 98.0% 100.0% 2.0%
Pure CaTiO3 1 none 3.3% 0.0% 3.3%
Experimental Parameters %CaO
The ratios of calcium to titanium in the chemical formulation were varied to
determine its affect on the strength, composition, macroporosity and microporosity. Both
the macroporosity and microporosity decreased with an increase in the calcium to
titanium ratio. These pore volumes are compared to those reported by Sakurai et al.
(1995) in Figure 5.8. In order to have a direct comparison the pore volume was
normalized by the volume of the respective pellets. Spheres of 5mm diameter were used

78
for Sakurai et al. because that was recorded in their papers and cylinders of 3/16”
diameter and 5/16” length were used for this work. Note that the microporosity in the
new pellets is greater than those reported by Sakurai et al. The macroporosity for the
new pellets however is less. This is a little misleading in that much of the porosity
recorded in the micropores was very close to the transition between micro and macro
pores at 0.1 to 0.2 microns. This can be seen in the differential and cumulative
distributions for these ratios in Appendix F, Figure F.1. These pores can be manipulated
by changing some of the procedural parameters to yield more macropores. Graphite
which was not introduced in our pellets will also help to increase the porosity in the
macropore region and micropore region.
20 30 40 50 60 70 80°2Theta
0
50
100
150
200
250
counts/s
CaTiO3
CaT iO3
CaT iO3
CaO
CaO
CaTiO3
CaO
CaT iO3
CaT iO3 CaT iO3
CaTiO3CaTiO3 CaT iO3 CaT iO3
CaT iO3
CaT iO3CaT iO3
CaO
CaT iO3
Figure 5.7 X-ray Diffraction Data with Peaks Verifying the Presence of Both CalciumOxide and Calcium Titanate

79
0
0.1
0.2
0.3
0.4
0.5
0.6
0.7
0.8
1
Pore
Vol
ume/
Pel
letV
olum
e[c
c/cc
]
<.5um (Ca2/Ti1) <.5um(Ca3/Ti1) <.5um (Ca4/Ti1) <.5um UT-3
>.5um (Ca2/Ti1) >.5um(Ca3/Ti1) >.5um (Ca4/Ti1) >.5um UT-3
Figure 5.8 Comparison of Micropore and Macropore Volume of Pellets Made with Ratiosof Different Calcium to Titanium Ratios with UT-3 (Sakurai et al., 1995) Porosity
Results
The strength of the pellets generally decreased with an increase in the calcium to
titanium ratio. The pellets seemed to be more fragile and had more cracks for a ratio of 3
and 4 (Ca:Ti, molar). This was expected because a greater ratio decreases the percentage
of titanium which is the element which forms the substrate structure. When the percent of
titanium is decreased it is, therefore, expected that the integrity will also decrease.
Heating Procedures: Composition, Strength, and Porosity
The heating procedures were evaluated based on the characteristics of
composition, strength, and macroporosity. A comparison of the porosities can be seen in
Figure 5.9 (Enlarged as Figure F.3). The cumulative and differential specific pore
volumes are shown. The differential distribution seems to be flatter when 900°C and

80
1000°C heating temperature were used. This indicates that the pore volume is distributed
amongst a greater range of pore sizes. The 800°C heated pellets had a much narrower
pore volume distribution. The pore volume was highest in 800°C heated pellet.
However, the maximum difference in the cumulative pore volume, is only about 0.05
cc/g between the 800°C and 900°C heated pellets. These pellets used a 2 to 1 ratio
between calcium and titanium and were compressed into pellets using a 0.25 metric tons
force. All the pellets were also preheated at 430°C.
The 900°C and 1000°C pellets were actually weaker than the 800°C pellet in this
case. The reason for this is believed to be Ca(OH)2 and/or CaCO3 dissociating at their
dissociating temperatures of 580°C and 898°C respectively.. Two slight modifications to
the heating process were made.
1. The preheat temperature was raised to 600°C to eliminate any calcium hydroxidethat might be in the pellet.
2. The ramp time from 700°C to the maximum sintering temperature was extendedto 2 hours to slow the formation and escape of carbon dioxide as calciumcarbonate dissociates.
The pellets made using these modifications seemed to be just as strong if not
stronger than the 800°C heated pellets. The composition of the pellets was quantitatively
measured using chemistry by the procedure outlined at the end of chapter 4. Table 5.2
Shows values for different ratios and heating schemes
Optimum Parameters
There are many parameters which can effect the characteristics of the pellets. The
most important characteristics—reactivity and degradation—have yet to be studied.
What may seem the optimum based on the characteristics of strength, porosity, and
composition may not even last one cycle in a reactor. Even with just the characteristics

81
explored in this work it is difficult to weight each characteristic as they are
interdependent. With these considerations Table 5.3 presents what are thought to be the
optimum of the varied parameters based on the data collected.
0
0.1
0.2
0.3
0.4
0.5
0.6
0.7
10 100 1000 10000
Pore Diameter [nm]
Cu
mul
ativ
eSp
ecif
icP
ore
Vo
lum
e[c
c/g
]
0
0.001
0.002
0.003
0.004
0.005
0.006
0.007
Diff
eren
tial
Spe
cifi
cPo
reV
olum
e[c
c/g]
800C Differential 1000C Cumulative900C Cumulative 800C Cumulative1000C Differential 900C Differential10 per. Mov. Avg. (800C Cumulative) 10 per. Mov. Avg. (1000C Differential)10 per. Mov. Avg. (900C Differential )
Figure 5.9 Comparison of Cumulative and Differential Specific Pore VolumeDistribution for New Pellets Sintered at Different Temperatures.
Table 5.3 Optimum ParametersUse Modified Chemistry Scheme 2Ca:1TiPrecursor Preheating Temp. 600CMolding Compression Force 0.25 MTSintering Temperature 900CSlow Temp. Ramping Scheme 2hrs
The modified chemistry is used to create the pellets. A 2 to1 ratio between
calcium and titanium was chosen. This was in large part to ensure that adequate CaTiO3
network is generated to make the pellets structure strong to endure the reactor
environment. The preheating temperature was to eliminate volatiles that may affect the

82
strength when the pellet is heat treated. The compression force was picked because it is
thought that it would help the porosity and give an acceptable strength. The 900°C
sintering was chosen because it strengthens the pellet but does not decrease the porosity
greatly. It is also thought that this would dissociate any CaCO3 so that the CaO content
would be increased.
This work has focused on cylindrical pellets, though there are many different
shapes and sizes of pellets that are used in industry. The question has been raised, “Can
these characteristics be maintained if a different pellet shape or size is used?” This
question can not be answered simply. Some characteristics will always be maintained
while others will vary slightly depending on the pellet making procedure. The
composition for example will always remain the same if the same chemistry and heating
procedures are used. The strength and porosity, however, may change in different pellet
shapes and sizes. The consolidation force used to compress the pellets will greatly affect
the macroporosity and the strength as shown earlier in this chapter. The shape could also
contribute to the macroporosity. Generally, macropores are found closer to the surface of
the pellets. This means that the shapes with a larger surface area to volume ratio you
would expect to have greater macroporosity per unit volume. The size of the pellet also
makes a difference in the porosity. Pore clogging and sintering occur in the pellets
because of the procedural steps. Because of this less pores are accessible further into the
pellet. Thus, if pellets with the same surface area to volume ratios and different volumes
are compared the one with the smaller volume will yield a higher specific pore volume.
The strength of the pellets obviously can depend on shape. For instance an annular pellet
will probably not be as strong as a cylindrical one. There are many established

83
techniques for creating these pellets and the only true way to see the effect of a new
shape and/or molding procedure on the characteristics is to study them.

84
CHAPTER 6RECOMMENDATIONS FOR FUTURE WORK
Teo et al. (2005) encourage those studying the UT-3 thermochemical cycle and
other thermochemical cycles to examine whether it is worth investigation. Their analysis
suggests a much lower efficiency than reported by the original UT-3 researchers. Based
on this analysis it seems research effort should possibly be focused elsewhere.
Though, this view is held by some in the research community, there may yet be
some potential for the UT-3 thermochemical cycle. The main limiting factor on the
efficiency of the cycle are the high operating temperatures at which the reactions take
place. Improving the chemistry of the system using some sort of catalyst may be a
necessary step to make the UT-3 thermochemical cycle practical. A catalyst that would
lower the activation energy of the reactions should be sought. Assuming such a catalyst
exists, this may improve the thermodynamics of the system enough to warrant a closer
look at the feasibility of the UT-3 thermochemical cycle.
Much work can be done on the UT-3 thermochemical cycle in addition to finding
a catalyst. The scope of the suggested future work will focus on the development of the
CaO pellets and the reactions that occur in them. Much other work can be done in the
areas mentioned in chapter 1 in the history of the UT-3 thermochemical cycle section.
The subsequent work should finish characterizing the calcium oxide pellets. The
reactivity, degradation, and cyclic strength should be investigated through the
bromination reaction. The parameters of the pellet production procedure may have to be
modified in order to obtain desired characteristics. After the pellets have been studied on

85
an individual basis with satisfactory results a procedure to mold the pellets in a more
sophisticated manner should be developed. The procedure and equipment should allow
for mass production of pellets quickly so that enough for a small fixed bed reactor can be
made. A large number of pellets should be made and placed together in a fixed bed
reactor to determine how the pellets will perform.
Short Term Plan
Investigation into Reactivity
One of the most important characteristics is the reactivity. The reaction rates and
conversion of the two calcium based reactions should be determined through
experimentation and compared to those reported in the literature. These should both be
studied and an investigation of methods to increase conversion or reaction rates should be
done. Reactivity should be measured and correlated to different operating parameters
including temperature, pressure, gaseous reactant concentration, and flow rate.
Reaction rates
The limiting reaction rate should be determined. The rate found should be
compared to that in the literature. The pellet production procedure may need to be
modified to increase the reaction rates. Creative strategies to improve the kinetic rates
should be explored. It should be determined if the diffusion to and from the internal
surface of the pellet or the surface reaction itself is the limiting step in the reaction. If it
is, modifications in the pellets should be made that will improve diffusion. The shape
and size of the pellets could be changed to decrease the thickness which the gaseous
reactants and products have to diffuse. Increasing the macroporosity will also help with
diffusion rates. Increasing microporosity to increase the amount of available reaction
sites could also help the reaction kinetics. If the limiting rate is the surface reaction only

86
a few things can be done. Concentration of reactants should be increased in the pellets
even if a slight compromise in porosity is sacrificed. Little modification to the pellet can
be done beyond this.
If there is no limiting step but rather the limit is a combination of surface reaction
and diffusion, the optimum characteristics should be found. It may be beneficial to first
make the pellets porous enough to eliminate the diffusion part of the limit. If successful
the reactant percent should be increased until it starts affecting diffusion significantly. In
this way the reaction rates can be increased.
Conversion
Conversion is also affected by composition and porosity. Porosity allows for
more sites for reactions and more availability to the reactant. This results in a greater
conversion. A higher concentration of the solid reactant can also increase the gas phase
conversion if not the conversion within the pellet.
Investigation of Degradation
The performance of the pellets should be investigated over a number of cycles to
see if the reactivity degrades from one cycle to the next. This is very important due to the
cyclic nature of the UT-3 thermochemical process. If a pellet only has a 1% conversion
after five cycles it will not be practical for the UT-3 cycle. These pellets need to have a
relatively constant cyclic reactivity in order to make the process viable. The two main
causes of degradation are reduction in structural strength with each cycle and sintering of
particles. Both of these processes either clog or collapse pores reducing pore area to
which the gaseous reactants can access. This ultimately reduces reactivity over a number
of cycles.

87
Investigation of Cyclic Strength
Another characteristic that could be quantified is the structural strength of the
pellet. This should be quantified before and after a set of cycles to determine how the
strength varies with the number of cycles. The porosity can be drastically reduced if the
pellets do not maintain their structure.
Creative Engineering
The pellets may be improved upon with some creative engineering. As
mentioned above shape and size of the pellets can be modified. Also different chemistry
can be employed to yield better characteristics. A thin surface coating of titania may be
added to increase structural strength. These are just a few of number of strategies that
can be taken. If the pellets do not have acceptable characteristics other portions of the
research may not be worthwhile.
Long Term Plan
Mass Production of Pellets
In order to study the pellets in a fixed bed reactor a large number of pellets have
to be made. The present procedure is slow and unsophisticated. Once acquainted with
the procedure the process takes approximate 5 minutes per pellet after the powder has
been made. The pellets often are not uniform shape and sometimes break. For a fixed
bed reactor with and inside diameter of 4cm and a desired height of 10 cm, approximately
460 pellets would be needed if the packing order was only 50%. This would take
approximately 39 hours to make the pellets. Obviously, a more sophisticated procedure
is necessary to study the pellets in a reactor.

88
Pellet Performance in a Fixed Bed Reactor
Once the pellets are found to have acceptable characteristics a large number of
pellets should be produced and tested in a small fixed bed reactor to investigate the
system performance. Studies should be done to evaluate the bulk characteristics of the
pellets. Reactivity, conversion and degradation are the characteristics on which analysis
should be based. The ideal operating parameters should be found including temperature,
pressure, gaseous reactant concentration, and flow rate. Correlations should be found
between reactivity and operating parameters.

89
CHAPTER 7SUMMARY AND CONCLUSIONS
A procedure was developed for production of the calcium oxide solid reactants for
the UT-3 thermochemical cycle. The procedure developed includes methods of chemical
formulation, drying, molding, and heat treatment. The chemical procedures have been
changed significantly in order to obtain the correct composition of the precursors.
Preheating procedures were added to the drying procedures to eliminate volatiles
breaking the pellets formed with the precursors. A mold for the molding procedure was
fabricated, tested, and redesigned to produce a dependable tool to produce pellets. A
reliable molding procedure was developed to make the pellets. A heating scheme was
created to strengthen the pellets using temperatures above the maximum operating
temperatures of the reactions of 760°C.
Analytical techniques were used to assess this procedure by measuring the
porosity and composition of the pellets. Porosity measurement tools that were used are
nitrogen adsorption and mercury porosimetry. Composition tools include X-ray
diffraction, Raman Spectroscopy, and chemical tests. Strength was also evaluated
quantitatively. Correlations between the parameters and the characteristics of
composition, porosity, and strength were used to determine the optimum parameters for
the procedure.
The suggested optimum parameters are as follows:
1. Use the modified chemistry with a 2 to 1 calcium to titanium ratio

90
2. Use a preheating temperature of 600°C.
3. Use a molding compression force of 0.25 metric tons
4. Sinter the pellets at 900°C using the slow temperature ramping scheme.
These parameters may change significantly based on further characterization of the
reactivity and degradation of the pellets in the reactor environment.
Further studies are necessary to realize the potential of the UT-3 thermochemical
cycle. These studies should include further characterization of the calcium oxide pellets, a
search for a catalyst for the reactions, mass scale production of pellets, and bulk
characterization of the pellets in a fixed bed reactor.

91
APPENDIX ACHEMICAL PROPERTIES
Table A.1 Chemical Properties of Various Solid and Liquids Used in This ProjectChemical Name Chemical Color BP/MP Density MW
Calcium Metal Ca Black/Gray 840C 1.6 40.08Calcium Bromide CaBr2 White 806C 1.7 199.9Calcium Carbonate CaCO3 White 898C** 2.8 100Calcium Oxide CaO White 4658C 3.3 56Calcium Hydroxide Ca(OH)2 White 580C** 2.24 74Calcium Titanate CaTiO3 Light Brown 1975C 4.1 136Titanium Oxide-anatase α-TiO2 White 1855C 3.8 80Titanium Oxide-rutile TiO2 White 3000C 4.2 80
Ethanol C2H5OH colorless 79C 0.8 46Dionized Water H2O colorless 100C 1 18Titanium Isopropoxide Ti (C3H7O)4 colorless 232C 0.962 284Bromide Br2 dark brown 59C 3.11 160Hydrobromic Acid HBr dark orange -66.8C 80.912
LIQUIDS/VOLATILES
SOLIDS

92
APPENDIX BRAMAN SPECTROMETER
A Nicolet Magna 760 Bench with Spectra Tech Continuum IR Microscrope and
FT Raman module was used. Below is a picture of the module. The Raman Spectra
were taken with a laser intensity of 1.06mW and a gain of 4. Powders of each pellet type
were pushed into melting point capillary tubes and a fastening piece designed to hold
them was used.
Figure B.1 FT Raman Module

93
Figure B.1 Inside of FT Raman Module

94
APPENDIX CPELLET MAKING PROCEDURES
Original Chemistry
1. Weigh X grams of Calcium
2. Measure Y mL of Ethanol
3. Put both ethanol and calcium in large beaker along with a magnetic stir rod.
4. Cover the solution with plastic using rubber bands to securely fasten
5. Put mixture on a magnetic stirrer and stir for 10 days
6. After 10 days the mixture should be a white cloudy mixture (if more time is neededstir longer). If possible let all the Ca metal react (black pieces)
7. Measure Y*18/40 mL of titanium isopropoxide and add to mixture, stir 5 min
8. Measure Y*12/40 mL of dionized water and add to mixture, stir 5 min
9. Pour contents of beaker into a container or containers with large surface area to dryovernight (preferably ~1” in height or less)
10. Leave fume hood fan on overnight
Modified Chemistry
1. Clean and Dry flask, condenser, and other equipment.
a. Wipe petroleum jelly out with a paper towel with acetone on it.
b. Wash with water and brushing out using a brush.
c. Wash out with dionized water after a thorough rinse.
d. About every 10 runs an acid bath cleaning should be done to dissolve and
residue from the side of the flask.

95
2. The calcium sample is measured on the electronic scale and then dropped into theflask through the outlet with the nitrogen and thermometer.
3. Joints to condenser and adaptor are coated with a thin layer of petroleum jelly toprevent seizing. Then the joints and stopper are put in place. (MAKE SURE TOCOVER ALL RUBBER, OR DO NOT US IT AS IT AFFECTS THE CHEMISTRY)
4. The nitrogen valves are opened to allow a very small flow to the flask.
5. Water to the condenser is turned on. (or condenser is filled with water)
6. Wait 5 minutes for nitrogen to purge system.
7. Anhydronous ethanol is extracted by syringe from its container and discharged intothe system through the silicon septa.
8. The heater is turned on to raise the temperature of the mixture to between 72°C and76°C. A noticeable reaction occurs in this temperature range.
9. An equilibrium point is found so that the temperature and the nitrogen settings aresuch that the temperature remains 72°C-76°C.
10. The mixture is diluted using the same amount of anhydronous ethanol as in step 5.
11. Titanium isopropoxide is extracted from its container via syringe. The correctproportion is injected into the flask again through a new hole in the septa.
12. The mixture is heated between 72°C and 76°C for 30 minutes (1hour).
13. A solution of ethanol and dionized water is made in a beaker.
14. A syringe is used to insert the water ethanol solution into the flask in order tomaintain an oxygen free environment. A reaction occurs immediately causing mostof the mixture to turn white in color.
15. The liquor was heated for 1 hour and then poured into a petri dish.
Table C.1 Chemical Ratios Used in Modified ChemistryStep # Chemical Ammount Molar Ratio ( to Ca)
2 Calcium .6 grams 17 Anhydronous ethanol 30mL 3510 Anhydronous ethanol 0-10mL 0-1211 Titanium Isopropoxide 2.2/1.5/1.1 mL 1/2 or 1/3 or 1/414 20% Water in Ethanol Sol. 1.8 in 7.2 mL 6.7 in 6.2

96
Drying and Preheating
16. The liquor was left for 18 to 20 hours under an exhausting fume hood to dry byevaporation. The powder was mostly dry but had noticeable moisture.
17. Place some of the powder into hanging crucible and put it in furnace
18. Set furnace temperature to 430°C for 1 hour (This removes any volatiles that may bepresent)
19. Take hanging crucible out of furnace using clamp (BE CAREFUL VERY HOT)
20. Place hanging crucible on aluminum plate to cool for 5 minutes
21. Dump contents of crucible into a Petri dish
22. (Start other heating procedures if necessary)
23. Molding
24. Take base mold and put it on steel plate on the counter
25. Take a small amount of powder from the petri dish and put it in the base mold hole.
26. Compact the powder using a plunger by hand. (Add cap to plunger and compress)
27. Add more powder
28. Repeat steps 20 and 21 until bottom of plunger with cap just barely penetrates into themold
29. Properly align steel plate, base mold, plunger, and cap and place on the hydraulicpress platform
30. Pump press until resistance is felt.
31. Watch force meter and continue to pump until desired force. (recommend ~.25 MTfor new chemistry)
32. Watch the force meter and hold the force at desired force for 1 minute by slightincrease in force as powder slowly compacts (Be careful not to over load the plungeras it will yield the plunger and the base mold)
33. Take off assembled mold and separate both cap and plunger and mold (may needpliers, but should not be difficult with pliers)
34. Insert longer plunger into cap and assemble with base mold

97
35. Flip the assembly so that the cap is on the bottom.
36. Place the hollow cylinder on top so its hole is concentric with the hole in the basemold.
37. Place the assembly on the hydraulic press so that the hollow cylinder is concentricwith both the hole in the base mold and the rings on the top plate of the hydraulicpress.
38. Slowly pump the press so that the pellet is pushed into the hollow cylinder on the topof the mold.
39. Carefully remove the assembly and take the hollow cylinder off vertically.
40. You should have a solid pellet with a height about half of the base mold
41. Heating Procedures
42. A program for the furnace was made (consult ATS Furnace Controller for procedure)
a. Tune-Last-Yes Tune Mode
b. Parameter Check multiple times until “Ramp and Soak” is selected
c. Yes Program parameters using arrow keys up and down use parametercheck to go to next parameter
d. Select 1 cycle and hit NO when “assured soak” is displayed
e. “End Tune” should appear. Hit TUNE/Return and the program is saved.
f. Press START to start the program
43. Pellets were place in the quartz crucible on the quartz hanger.
44. The quartz hanger was place into the furnace.
45. The furnace program was set to run.
46. The pellets are carefully taken out of the furnace after the run is complete.
47. The pellets were weighed using the electronic scale
48. The pellets were put in petri dishes which were labeled.

98
APPENDIX DPELLET CHARACTERIZATION PROCEDURES
Nitrogen Adsorption
Outgassing Procedure
49. Place the large sample cell on scale and tare scale
50. Put pellets in sample cell and place on scale
51. Record mass of pellets
52. Take sample cell with pellets inside to Quantachrome NOVA 1200 machine
53. Make sure no one is running a sample in the analysis station
54. Use key pad to load outgasser
a. Press 3 for out gas stations
b. Press 1 for load outgasser
c. Press 1 for vacuum outgas
d. The machine will pressurize the system and then you will be instructed to
put sample cell on the outgas station
55. Unscrew and take off the plug and o-ring screw assembly
56. Put plug with the other plugs to the side
57. Put heating mantle on cell and then secure with metal clip
58. Put the o-ring screw assembly on the cell
59. Move the whole unit (sample cell, mantle, screw assembly) to the outgas station.
60. Secure assembly by screwing the o-ring screw assembly into the outgas station.
61. Hit any key on the keypad to continue to outgas

99
62. Turn on the heating mantle and set it to 200°C
63. The sample will be outgased until you manually interrupt it. Generally, the sampleswere outgassed overnight.
64. Go to the keypad
a. Press 3 for outgasser
b. Press 2 for unload outgasser
c. The system will pressurize and will instruct you to remove the sample cell.
65. Remove the sample cell by unscrewing the o-ring screw assembly
66. Replace the plug in place of the sample cell assembly and repeat step 11 and 12
67. Hit any key on the keypad and the NOVA will evacuate the system
Full Isotherm Analysis Procedure
68. Have NOVA 1200 Disk, Outgassed Sample, and mass of sample ready
69. Put Disk into the disk drive of the NOVA 1200
70. Go to key pad
a. Press 2 for analyze sample
b. It will pressurize system and instruct you to place sample on the analysisstation
71. Take off plug and o-ring screw assembly
72. Carefully place spacer in the sample cell
73. Secure the sample cell into the analysis station with the o-ring screw assembly
74. Take out the small plug behind the analysis station. This gives the machine areference for the ambient pressure.
75. Fill the large dewar with liquid nitrogen and rotate the stand do the dewar is under thesample cell
76. Go to key pad
a. Press any key to continue

100
b. Name the sample (Enter Date)
c. Enter User ID (enter 1 or whatever number)
d. Input the sample mass and press enter
e. Press 0 to measure the density of the material
f. Enter Cell number (62 or 50 for large cells)
g. Enter Setup (50)
h. Press Enter until Analysis Start
77. Make sure to use the cover with the hole in to cover the dewar
78. The dewar will raise automatically
79. The process will take anywhere from 5-10 hours to complete
80. The analysis will be complete when the dewar is lowered and the system ispressurized
81. The keypad screen will go back to the main menu.
82. At this point follow instruction for removal of the sample and replacement of the plugoutlined in 17-18 of the outgassing section

101
Figure D.1 Quantachrome NOVA 1200 Machine for Nitrogen Adsorption withSmall Sample Cell and Dewar

102
Quantachrome Mercury Porosimeter
Pore Volumes were recorded from approximately 1 psia to 60000 psia.
Filling Apparatus Procedure
1. Have pellets and measured mass ready
2. Turn on vacuum pump
3. Turn on Mercury Porosimeter
4. Fill the mercury trap with liquid nitrogen
5. Put pellets in small sample cell (different from BET cell)
6. Take vacuum grease and put around the edge of the cell
7. Place metal top on cell gently and twist to ensure a good seal
8. Place rubber O-rings on bottom and top of the cell.
9. Put Teflon casing on the cell to seal the container and tighten the O-ring (Hand Tightis sufficient)
10. Unplug the filling apparatus
11. Put Metal sheath on the sample cell. There is an O-ring at the beginning so you haveto put a little bit to get it through.
12. Put assembly in the filling apparatus
13. There is a piece to secure assembly. Find this and screw it on the assembly to lock itin place.
14. Attach the alligator clip to the lead on the back of securing piece.
15. Turn the valve to vacuum and slowly open the rate control valve to gradually reducethe pressure in the filling apparatus
16. Change the control knob on the volume to FA (filling apparatus). Also adjust thecalibration from 296 to 317.
17. Unplug the cord with to the pressure section. Plug it into the FA.
18. Zero both the pressure and the volume control

103
19. Check the pressure in the filling apparatus. Adjust the valve to allow for a faster flowrate.
20. After the pressure is less then 50mm of Hg close the rate control valve.
21. Adjust the screw stop on the filling apparatus to allow the chamber of the fillingapparatus to angle so that the mercury can be filled up the capillary tube.
22. Switch the flow valve to the vent position
23. Re zero the volume on the mercury porosimeter
24. Slowly open the rate control valve to raise the pressure in the chamber of the fillingapparatus while monitoring the zeroed volume.
25. As soon as the volume starts to change close the rate control valve
26. Adjust the chamber of the filling apparatus so that the capillary tube is horizontal andlock it in place using the screw stop
27. Go to the computer
a. “C:\” Should appear, Type “CD Poro” then hit return
b. “C:\Poro\” should appear, type “poro2pc” then hit return
c. This should open a program, hit return
28. Consult Gary Scheifelle for operation of the program
29. Start Data Acquisition on the computer program
30. Slowly increase the pressure by opening the rate control valve
31. On the monitor there should be a plot of the pore volume vs. pressure
32. When the pressure is approximately 14.7 PSIA close the rate control valve
33. Switch the flow control valve to PRESSURE and open the pressure needle valve
34. Slowly open the rate control valve to increase the pressure in the chamber
35. The maximum pressure is about 23 PSIA close the rate control valve at this time.
36. Switch the flow control valve to VENT

104
37. Slowly open the rate control valve to decrease the pressure in the chamber
38. Once ambient pressure has been reached press the end button on the keyboard tofinish the run
39. At this point the assembly can be taken out of the filling apparatus
a. Hold the end of the filling chamber while unclipping the alligator clip andunscrewing the securing piece.
b. Slide the cell and metal sheath out of the chamber making sure to alwayspoint it up
c. Plug the chamber
40. Take off the metal sheath.
High Pressure Procedure
41. Fill the top half of a centimeter of the capillary with oil via a syringe, be sure toeliminate any bubbles. This may require you to extract some mercury from thecapillary via syringe. Discard this mercury in the clean container if in fact it has notbeen contaminated with oil.
42. Put the Teflon spacer on the assembly.
43. Put the large metal sheath on the assembly.
44. Place assembly so the oil is up into the high pressure chamber
45. Carefully, lower the top of the high pressure chamber into place
46. Screw the top of the high pressure chamber into place
47. Press and hold the oil fill button and watch the excess oil for bubbles. Wait untilthere are no bubbles for 15 seconds
48. Switch the pressure connection cord back to its original position
49. Switch the knob on the volume section to HIGH PRESSURE and adjust thecalibration to 296.
50. Zero both the pressure and the volume
51. Go to the computer to set the program up

105
52. Press the start button when directed to do so by the computer program. The machinewill run automatically. Just incase of accident, be a safe distance away when thepressure on the machine is at high pressures.
53. Press the end button on the keyboard when the run has ended.
54. Save the data files to report files.
55. Exit program by pressing the escape key multiple times.
56. Once in DOS follow the commands
a. “C:\Poro\” should appear, type “CD ..”
b. “C:\” should appear, type “CD porodata”
c. “C:\Porodata” should appear, type “DIR”
d. This will give you a long list, type “copy SA5####*.* A:”
e. This will copy the files with the name SA5#### and any ending to thefloppy disk drive for which you should have a disk
Figure D.3 Quantachrome Mercury Porosimeter Filling Apparatus

106
Figure D.2 Quantachrome Mercury Porosimeter

APPENDIX ERAMAN SPECTRA

108
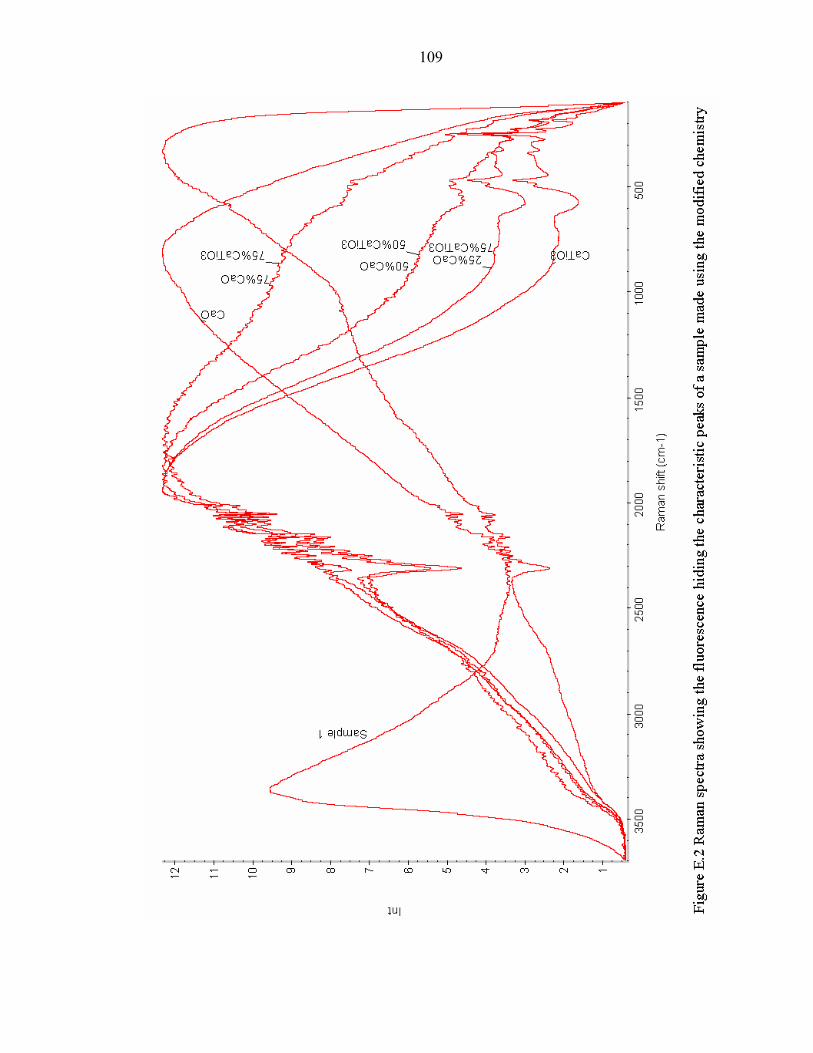
109

110

111

112

APPENDIX FMERCURY POROSIMETRY DISTRIBUTIONS

114

115

116

117
LIST OF REFERENCES
Aihara, M., Nagai, T., Matsushita, J., Negishi, Y., and Ohya, H., 2001, “Development ofPorous Solid Reactant for Thermal Energy Storage and Temperature UpgradeUsing Carbonation/Decarbonation Reaction,” Applied Energy, Vol. 69, pp.225-238.
Aihara, M., Sakurai, M., Tsutsumi, A., and Yoshida, K., 1992, “Reactivity Improvementin the UT-3 Thermochemical Hydrogen Production Process,” InternationalJournal of Hydrogen Energy, Vol. 17, No.9, pp.719-723.
Aihara, M., Umida, H., Tsutsumi, A., and Yoshida, K., 1990, “Kinetic Study of UT-3Thermochemical Hydrogen Production Process,” International Journal ofHydrogen Energy, Vol. 15, No.1, pp.7-11.
Aochi, A., Tadokoro, T., Yoshida, K., Kameyama, H., Nobue, M., and Yamaguchi,T.,1989, “Economical and Technical Evaluation of UT-3 ThermochemicalHydrogen Production Process for an Industrial Scale Plant,” International Journalof Hydrogen Energy, Vol. 14, No. 7, pp.421-429.
Amir, R., Sato, T., Yoko Yamamoto, K., Kabe, T., and Kameyama, H.,1992, “Design ofSolid Reactants and Reaction Kinetics Concerning the Iron Compounds in theUT-3 Thermochemical Cycle,” International Journal of Hydrogen Energy, Vol.17, No.10, pp.783-788.
Amir, R., Shiizaki, S., Yamamoto, K., Kabe, T., and Kameyama, H., 1993, “DesignDevelopment of Iron Solid Reactants in the UT-3 Water Decomposition CycleBased on Ceramic Support Materials,” International Journal of HydrogenEnergy, Vol. 18, No.4, pp.283-286.
Barrett, E.P., Joyner, L.G., and Halenda, P.P.,1951, “ The Determination of Pore Volumeand Area Distributions in Porous Substances. I. Computations from NitrogenIsotherms,” Journal of the American Chemical Society, Vol. 73, pp. 373-380.
Brinker, J.C. and Scherer, G.W., Sol-Gel Science: The Physics and Chemistry of Sol-GelProcessing, New York, Academic Press Inc.
Brinker, J.C., Sehgal, R., Hietala, S.L., Desphande, R., Smith, D.M., Loy, D., andAshley, C.S., 1994, Journal of Membrane Science, Vol. 94, p. 85.

118
Brown, L., Besenbruch, G., Schultz, K., Showalter, S., Marshall, A., Pickard, P., andFunk, J., 2002, “High Efficiency Generation of Hydrogen Fuels UsingThermochemical Cycles and Nuclear Power,” AIChe 2002 Spring NationalMeeting, Topical TH- Nuclear Engineering
Brunauer, S., Emmett, P.H., and Teller, E., 1938, “Adsorption of Gases inMultimolecular Layers,” Journal of American Chem. Soc.,” Vol. 60, pp. 309-319.
Cox and Williamson, 1977-1979, Hydrogen, Its Technology & Implications, Volume 1Cleveland, CRC Press
Ehrensberger, K., Frei, A., Kuhn, P., Oswald, H.R., and Hug, P., 1995, “ComparativeExperimental Investigations of the Water Splitting Reaction with Iron Oxide Fe1-
yO and Iron Manganese Oxides (Fe1-xMnx)1-yO,” Solid State Ionics, Vol. 78, pp.151-160.
Frostburg, A., 1997-2005,General Chemistry Online :Glossary accessed 05 March. 2005.<http://antoine.frostburg.edu/chem/senese/101/glossary/a.shtml>
Funk, J., 2001 “Thermochemical Hydrogen Production: Past and Present,” InternationalJournal of Hydrogen Energy, Vol. 26, No. 1, pp. 185-190.
Goswami D. Y., Ingley H. S., Goel N., Mirabal S. T., 2003, “Hydrogen Production”,Chapter11, Advances in Solar Energy, Vol. 15, D.Y. Goswami, Editor-in-Chief,pp. 405-458.
Haueter, P., Moeller, S., Palumbo, R., and Steinfeld, A., 1999, “The Production of Zincby Thermal Dissociation of Zinc Oxide-Solar Chemical Reactor Design,” SolarEnergy, Vol. 67, Nos.1-3, pp. 161-167.
Kameyama, H., Sato, T., Amir, R., Yoshida, K., Aihara, M., Sakurai, M., Tadokoro, Y.,Kajiyama, T., Yamaguchi, T., and Sakai, N., 1992, “Cycle Simulation of the UT-3Thermochemical Hydrogen Production Process,” International Journal ofHydrogen Energy, Vol. 17, No.10, pp.789-794.
Kameyama, H., Tomino,Y., Sato, T., Amir, R., Orihara, A., Aihara, M., and Yoshida, K.,1989, “Process Simulation of “MASCOT” Plant Using the UT-3 ThermochemicalCycle for Hydrogen Production,” International Journal of Hydrogen Energy, Vol.6, No. 5, pp.567-575.
Kameyama, H., Yoshida, K., 1978, “Br-Ca-Fe Water-Decomposition Cycles forHydrogen Production,” Proceedings of the 2nd World Hydrogen EnergyConference, pp. 829-850.

119
Kameyama, H. and Yoshida, K., 1981, “Reactor Design for the UT-3 ThermochemicalHydrogen Production Process,” International Journal of Hydrogen Energy, Vol.6, No. 6, pp.567-575.
Kaneko, H., Hosokawa, Y., Kojima, N., Gokon, N., Hasegawa, N., Kitamura, M., andTamaura, Y., 2001, “Studies on Metal Oxides Suitable for Enhancement of theO2-Releasing Step in Water Splitting by the MnFe2O4-Na2CO3 System,” Energy,Vol. 26, pp. 919-929.
Kaneko, H., Ochiai,Y., Shimizu, K., Hosokawa, Y., Gokon, N., and Tamaura, Y., 2002,“Thermodynamic study based on the phase diagram of the Na2O-MnO-Fe2O3system for H2 production in three step water splitting with Na2CO3/ MnFe2O4/Fe2O3,” Solar Energy, Vol. 72, No. 4, pp. 377-383.
Livage, J., Henry, M., and Sanchez, “Sol-gel Chemistry of Transition Metal Oxides,” C.,Prog. Solid St. Chem., Vol.18, pp. 259
Meier, A., Ganz, J., Steifield, A., 1996, “Modeling of a Novel High-Temperature SolarChemical Reactor,” Chemical Engineering Science, Vol. 51, No. 11, pp.3181-3186.
Morooka, S., Kim, S.S., Yan, S., Kusakabe, K., and Watanabe, M., 1996, “Separation ofHydrogen from an H2-H2O-HBr System with a SiO2 Membrane Formed inMacropores of an α-Alumina Support Tube,” International Journal of HydrogenEnergy, Vol. 21, No.3, pp.183-188.
Nakayama, T., Yoshioka, H., Furutani, H., Kameyama, H., and Yoshida, K.,1984“MASCOT—A Bench-scale Plant for Producing Hydrogen by the UT-3Thermochemical Decomposition Cycle,” International Journal of HydrogenEnergy, Vol. 9, No. 3, pp.187-190.
Ohya, H., Nakajima, H., Togami, N., Aihara, M., Negishi, Y., 1994, “Separation ofHydrogen from Thermochemical Processes using Zirconia-Silica CompositeMembrane,” Journal of Membrane Science, Vol. 97, pp. 91-98.
Ohya, H., Nakajima, H., Togami, N., Ohashi, H., Aihara, M., Tanisho, S., and Negishi,Y., 1997, “Test of One-Loop Flow Scheme for the UT-3 ThermochemicalHydrogen Production Process,” International Journal of Hydrogen Energy, Vol.22, No.5, pp.509-515.
Sakurai, M., Aihara, M., Miyake, N., Tsutsumi, A., and Yoshida, K., 1992, “Test of One-Loop Flow Scheme for the UT-3 Thermochemical Hydrogen ProductionProcess,” International Journal of Hydrogen Energy, Vol. 17, No.8, pp.587-592.

120
Sakurai, M., Bilgen, E., Tsutsumi, A., and Yoshida, K., 1996a, “Adiabatic UT-3Thermochemical Process for Hydrogen Production,” International Journal ofHydrogen Energy, Vol. 21, No.10, pp.865-870.
Sakurai, M., Bilgen, E., Tsutsumi, A., and Yoshida, K., 1996b, “Solar UT-3Thermochemical Cycle for Hydrogen Production,” Solar Energy, Vol. 57, No.1,pp.51-58.
Sakurai, M., Miyake, N., Tsutsumi, A., and Yoshida, K., 1996c, “Analysis of a ReactionMechanism in the UT-3 Thermochemical Hydrogen Production Cycle,”International Journal of Hydrogen Energy, Vol. 21, No.10, pp.871-875.
Sakurai, M., Nakajima,H., Amir, R., Onuki, K., and Shimizu, S.,1999, “ ExperimentalStudy on Side-Reaction Occurrence Condition in the Iodine –SulfurThermochemical Hydrogen Production Process,” International Journal ofHydrogen Energy, Vol. 24, pp. 603-612.
Sakurai, M., Nakajima,H., Onuki, K., Ikenoya, K., and Shimizu, S., 2000a, “ PreliminaryProcess Analysis for the Closed Cycle Operation of the Iodine-SulfurThermochemical Hydrogen Production Process,” International Journal ofHydrogen Energy, Vol. 25, pp. 613-619.
Sakurai, M., Nakajima, H., Onuki, K., and Shimizu, S., 2000b, “Investigation of 2 LiquidPhase Separation Characteristics on the Iodine-Sulfur Thermochemical HydrogenProduction Process,” International Journal of Hydrogen Energy, Vol. 25, pp.605-611
Sakurai, M., Nakajima,H., Onuki, K., Ikenoya, K., and Shimizu, S., 2000a, “ PreliminaryProcess Analysis for the Closed Cycle Operation of the Iodine-SulfurThermochemical Hydrogen Production Process,” International Journal ofHydrogen Energy, Vol. 25, pp. 613-619.
Sakurai, M., Tsutsumi, A., and Yoshida, K., 1995, “Improvement of the Ca-PelletReactivity in UT-3 Thermochemical Hydrogen Production Cycle,” InternationalJournal of Hydrogen Energy, Vol. 20, No.4, pp.297-301.
Sanchez, C., Livage, J., Henry, M., and Babonneau, 1988, “Chemical Modification ofAlkoxide Precursors,” Journal Non-Cryst. Solids, Vol. 100, pg. 65.
Sasaki, M., and Hirai, T., 1995, “Corrosion Resistance of Ceramic-coated Stainless Steelin a Br2-O2-Ar Atmosphere,” Journal of European Ceramic Society, Vol.15, pp.329-335.
Steinfeld, A., Sanders, S., and Palumbo, R., 1999, “Design aspects of solarthermochemical engineering- a case study: two step water splitting cycle using theFe3O4/FeO redox system,” Solar Energy, Vol. 65, No. 1, pp. 43-53.

121
Sturzenegger M. and Nuesch, P., 1999, “Efficiency Analysis for a Manganese-Oxide-Based Thermochemical Cycle,” Energy, Vol. 24, pp.959-970.
Tadokoro, Y., Kajiyama, T., Yamaguchi, T., Sakai, N., Kameyama, H., and Yoshida, K.,1997, “Technical Evaluation of the UT-3 Thermochemical Hydrogen ProductionProcess for an Industrial Scale Plant,” International Journal of Hydrogen Energy,Vol. 22, No.1, pp.49-56.
Teo, E.D., Brandon, N.P., Vos, E., and Kramer, G.J., 2005, “A Critical Pathway EnergyEfficiency Analysis of the Thermochemical UT-3 Cycle,” International Journalof Hydrogen Energy.” Vol. 30, pp. 559-564.
Weidenkaff, Steinfeld, A.,A., Wokaun, A., Auer, P.O., EICHLER, B.,and A., Reller1999, “Direct Solar Thermal Dissociation of Zinc Oxide Condensation andCrystallization of Zinc in the Presence of Oxygen,” Solar Energy, Vol. 65, No. 1,pp. 59-69.
Weidenkaff, A., Reller, A., Sibieude, F., Wokaun, A., and Steinfeld, A., 2000,“Experimental Investigations on the Crystallization of Xinc by Direct Irradiationof Zinc Oxide in a Solar Furnace,” Chem. Mater., Vol. 12, pp. 2175-2181.
Westermarck, Sari, 2000, “Use of Mercury Porosimetry and Nitrogen Adsorption inCharacterization of the Pore Structure of Mannitol and MicrocrystallineCellulose Powders, Granules and Tablets,” accessed 19 April, 2005.<http://ethesis.helsinki.fi/julkaisut/mat/farma/vk/westermarck/useofmer.pdf >
Yoshida, K., Kameyama, H., Aochi, T., Nobue, M., Aihara, M., Amir, R., Kondo, H.,Sato, T., Tadokoro, Y., Yamaguchi, T., and Sakai, N.,1990, “Reactor Design forthe UT-3 Thermochemical Hydrogen Production Process,” International Journalof Hydrogen Energy, Vol. 15, No. 3, pp.171-178
Zheng, H., Reaney, I.M., Csete de Gyorgyfalva, G.D.C., Ubic, R., Yarwood, J., Seabra,M.P., and Ferreira, V.M., 2004, “Raman Spectroscopy of CaTiO3-basedperovskite solid solutions,” Journal of Mater. Res., Vol. 19, No. 2, pp. 488-495.

122
BIOGRAPHICAL SKETCH
Benjamin Grant Hettinger was born in Madison, Wisconsin, in 1980. He was
raised primarily in Ponte Vedra Beach, Florida. He graduated from Allen D. Nease High
School in 1999 and that fall started classes at the University of Florida. He graduated
magna cum laude with his Bachelor of Science in mechanical engineering from the
University of Florida in December 2003. He then started graduate school at the
University of Florida working on his master’s in Mechanical Engineering in the area of
thermal science. After graduating he plans on working at CDI Aerospace in West Palm
Beach. His purpose in life is to glorify Jesus Christ his Lord and Savior.