development of an efficient planned maintenance …
TRANSCRIPT
DEVELOPMENT OF AN EFFICIENT PLANNED MAINTENANCE FRAMEWORK
FOR MARINE AND OFFSHORE MACHINERY OPERATING UNDER HIGHLY
UNCERTAIN ENVIRONMENT
MAURICE PATRICK ASUQUO
A thesis submitted in partial fulfilment of the requirements of Liverpool John
Moores University for the degree of Doctor of Philosophy
November 2017

Development of an Efficient Planned Maintenance Framework for Marine and Offshore Machinery
i
Declaration
“I hereby declare that this thesis submission is my own work and that, to the best of my
knowledge and belief, it contains no material previously published or written by another
person, nor material which has been accepted for the award of any other degree or diploma
of the university or other institutions of higher learning, except where due acknowledgement
has been made in the text”.
Maurice Asuquo/2017
Signature: ………………………………. Date: ………………………...…...

Development of an Efficient Planned Maintenance Framework for Marine and Offshore Machinery
ii
Dedication
This thesis is dedicated to my beloved wife Mary and my magnificent, blessed and lovely
children Inyeneobong, Edidiong, EkeminiAbasi and Idaraobong for their prayers and
supports throughout the period of my study. I admire their patience, tolerance and
willingness to support me, which gave me encouragement to focus and complete my studies
in parallel to my full-time job.

Development of an Efficient Planned Maintenance Framework for Marine and Offshore Machinery
iii
Acknowledgements
The completion of this study has been made possible by the enormous support and
contributions of many people and organisations that I would like to convey my appreciation
and sincere gratitude to them in my acknowledgement.
Firstly, I am extremely appreciative to the Almighty God my creator for giving me the
profound wisdom, strength, understanding, and opportunity to commence and complete
such a challenging and life-changing project; to my parents, Chief Patrick Umoh and Mrs
Angela Effiong for their prayers and well wishes; and to my house care fellowship members
for their untiring prayers and encouragement.
I would like to thank my principal supervisor Professor Jin Wang, not only for his guidance,
supervision and encouragement while completing this research, but also for believing in me
and deciding to step in as my principal supervisor when Dr. Ramin Riahi who was my
principal supervisor left the University. More importantly, Professor Wang’s strong views on
high quality research and deliverables have greatly encouraged me. It has been an honour
and a pleasure to have worked with him as his sparkling ideas and innovative thinking in
research are instrumental to the development of the methodological frameworks and
structure of this thesis.
My deep admiration and gratitude goes to my co-supervisors Dr Ramin Riahi, Dr Geraint
Phylip-Jones and Dr Lihong Zhang for their constructive comments, stimulating suggestions
and advice, and constant encouragements. Special thanks to Mark Raynes (Shell Global
Lubricants), Mirja Hasan and Damir Blazina (Shell Marine Products), Kevin Davies (IPU
Group), and Francis Raynes (MAINTEC Engineering), for providing data and other
necessary information for my research. I wish to also extend special thanks to all my friends
especially Dr Uwem Udo and Dr Andrew John, and my colleagues in the research group
Liverpool LOgistics Offshore and Marine (LOOM) Research Institute, Dr Ademola Ishola,
Dr Ambisire Usman, Shamsudeen Hassan and Kumudthaa Muniandy for their supports and
friendship.
Finally, my sincere appreciation to my siblings and my House Fellowship Brethren for their
encouragement, supports and constant prayers.
Development of an Efficient Planned Maintenance Framework for Marine and Offshore Machinery
iv
Abstract
The constantly increasing complexity of marine and offshore machinery is a consequence
of a constant improvement in ship powering, automation, specialisation in cargo transport,
new ship types, as well as an effort to make the sea transport more economic. Therefore,
the criteria of reliability, availability and maintainability have become very important factors
in the process of marine machinery design, operation and maintenance.
An important finding from the literature exposed that failure to marine machinery can cause
both direct and indirect economic damage with a long-term financial consequence. Notably,
many cases of machinery failures reported in databases were as a result of near misses
and incidents which are potential accident indicators. Moreover, experience has shown that
modelling of past accident events and scenarios can provide insights into how a machinery
failure can be subsisted even if it is not avoidable, also a basis for risk analysis of the
machinery in order to reveal its vulnerabilities. This research investigates the following
modelling approach in order to improve the efficiency of marine and offshore machinery
operating under highly uncertain environment.
Firstly, this study makes full use of evidential reasoning’s advantage to propose a novel
fuzzy evidential reasoning sensitivity analysis method (FER-SAM) to facilitate the
assessment of operational uncertainties (trend analysis, family analysis, environmental
analysis, design analysis, and human reliability analysis) in ship cranes.
Secondly, a fuzzy rule based sensitivity analysis methodology is proposed as a
maintenance prediction model for oil-wetted gearbox and bearing with emphasis on ship
cranes by formulating a fuzzy logic box (diagnostic table), which provides the ship crane
operators with a means to predict possible impending failure without having to dismantle
the crane.
Thirdly, experience has shown that it is not financially possible to employ all the suggested
maintenance strategies in the literature. Thus, this study proposed a fuzzy TOPSIS
approach that can help the maintenance engineers to select appropriate strategies aimed
at enhancing the performance of the marine and offshore machinery.
Finally, the developed models are integrated in order to facilitate a generic planned
maintenance framework for robust improvement and management, especially in situations
where conventional planned maintenance techniques cannot be implemented with
confidence due to data deficiency.
Development of an Efficient Planned Maintenance Framework for Marine and Offshore Machinery
v
Table of Contents
Declaration ......................................................................................................................................... i
Dedication .......................................................................................................................................... ii
Acknowledgements ......................................................................................................................... iii
Abstract ............................................................................................................................................. iv
List of Figures .................................................................................................................................. xi
List of Tables ................................................................................................................................... xii
Abbreviations ............................................................................................................................... xviii
Chapter 1 ........................................................................................................................................... 1
Introduction ........................................................................................................................................ 1
Summary ........................................................................................................................................... 1
1.1 Research Background ..................................................................................................... 1
1.2 Statement of Problem ...................................................................................................... 4
1.3 Research Aim and Objectives ........................................................................................ 5
1.4 Research Data Mining ..................................................................................................... 6
1.5 Marine and Offshore Machinery Investments .............................................................. 6
1.6 Researcher’s Background ............................................................................................... 7
Chapter 2 ......................................................................................................................................... 11
Literature Review ........................................................................................................................... 11
Summary ......................................................................................................................................... 11
2.1 Introduction ...................................................................................................................... 11
2.2 An Overview of Marine and Offshore Industry ........................................................... 12
2.3 An Overview of Maintenance Concepts and Practices ............................................ 13
2.3.1 Run-To-Failure Maintenance (RTFM) Strategy ................................................. 14
2.3.2 Preventive Maintenance (PM) Strategy .............................................................. 14
2.3.3 Condition-Based Maintenance (CBM) Strategy ................................................. 15
2.3.4 Reliability-Centred Maintenance (RCM) Strategy ............................................. 16
2.4 Current Status of Maintenance Management in the Marine and Offshore Industry
17
2.5 Dealing with Uncertainty in Marine and Offshore Machinery Design and
Operation ..................................................................................................................................... 18
2.6 Machinery Oil/Grease Analysis .................................................................................... 20
2.7 Oil Sampling .................................................................................................................... 21
2.7.1 Oil Sampling Kit ...................................................................................................... 21
2.7.2 General instructions for Correct Oil Sampling ................................................... 22
Development of an Efficient Planned Maintenance Framework for Marine and Offshore Machinery
vi
2.7.3 How to Take a Good Oil Sample ......................................................................... 23
2.7.4 Laboratory Oil/Grease Test Methods and Results ............................................ 23
2.8 Machinery Oil Condition Monitoring ............................................................................ 24
2.9 Faces of Errors in Machinery Operation ..................................................................... 25
2.9.1 Internal (System Design) Error ............................................................................. 26
2.9.2 External (Human) Error ......................................................................................... 26
2.10 Lessons from Major Accidents in the Marine and Offshore Industry ..................... 27
2.10.1 Savannah Express Engine Failure ...................................................................... 27
2.10.2 FPSO Cidade De São Mateus Explosion ........................................................... 28
2.10.3 Maersk Doha Machinery Breakdown .................................................................. 29
2.11 Proposed Risk and Decision-Making Management Model ...................................... 30
2.11.1 Risk Analysis Techniques ..................................................................................... 30
2.11.2 Decision Making Analysis Techniques ................................................................ 35
2.12 Expert System ................................................................................................................. 51
2.12.1 Performance Thresholds ....................................................................................... 52
2.12.2 Fixed Limits ............................................................................................................. 52
2.12.3 Absolute Alarm Limit .............................................................................................. 52
2.12.4. Trend (statistical) Alarm Limit ........................................................................... 53
2.12.5 Combination of Absolute and Statistical Alarm Limits ...................................... 53
2.12.6 Upper and Lower Limits ........................................................................................ 54
2.13 Conclusion ....................................................................................................................... 54
Chapter 3 ......................................................................................................................................... 56
1 Research Methodology ......................................................................................................... 56
Summary ......................................................................................................................................... 56
3.1 The Scope of the Thesis ............................................................................................... 56
3.2 Structure of the Thesis .................................................................................................. 57
3.3 The Research Framework ............................................................................................ 59
3.4 Conclusion ....................................................................................................................... 60
Chapter 4 ......................................................................................................................................... 61
A Proposed Methodology for Condition Monitoring of Marine and Offshore Machinery
using Evidential Reasoning Techniques ..................................................................................... 61
Summary ......................................................................................................................................... 61
4.1 Introduction ...................................................................................................................... 61
4.2 Methodology .................................................................................................................... 62
4.2.1 Identification of Risk Criteria (Step one) ............................................................. 63
4.2.2 Application of Analytic Hierarchy Process (Step two) ....................................... 63

Development of an Efficient Planned Maintenance Framework for Marine and Offshore Machinery
vii
4.2.3 Evaluation of Trend Analysis (TA) (Step three) ................................................. 66
4.2.4 Evaluation of Family Analysis (Step four) ........................................................... 67
4.2.5 Evaluation of Environmental Analysis (Step five) .............................................. 68
4.2.6 Evaluation of Human Reliability Analysis (Step six) ......................................... 69
4.2.7 Evaluation of Design Analysis (Step seven) ...................................................... 69
4.2.8 Aggregation Operations on Criteria Results Using ER (Step eight) ............... 70
4.2.9 Obtaining a Crisp Number for the Goal (Step nine) .......................................... 70
4.2.10 Perform Sensitivity Analysis (Final step) ............................................................ 71
4.3 Test Case ........................................................................................................................ 73
4.3.1 Ship Crane Machinery ........................................................................................... 74
4.3.2 Slewing ring bearings ............................................................................................ 75
4.3.3 Gearboxes ............................................................................................................... 75
4.3.4 Clutches ................................................................................................................... 76
4.3.5 Hydraulic Pump ...................................................................................................... 77
4.3.6 Identification of Risk Criteria (Step one) ............................................................. 78
4.3.7 Application of Analytic Hierarchy Process Results (Step two) ........................ 78
4.3.8 Evaluation of Trend Analysis (Step three) .......................................................... 86
4.3.9 Evaluation of Family Analysis (Step four) ........................................................... 94
4.3.10 Evaluation of Environmental Analysis (Step five) .......................................... 99
4.3.11 Evaluation of Human Reliability Analysis (Step six) ..................................... 99
4.3.12 Evaluation of Design Analysis (Step seven) ................................................ 100
4.3.13 Aggregation Operations on Criteria Results using ER (Step eight).......... 100
4.3.14 Obtaining a Crisp Number for the Goal (Step Nine) ................................... 102
4.3.15 Sensitivity Analysis (Final step) .......................................................................... 103
4.4 Discussions ................................................................................................................... 105
4.5 Conclusion ..................................................................................................................... 107
Chapter 5 ....................................................................................................................................... 108
An Integrated Risk Assessment for Maintenance Prediction of Oil Wetted Gearbox and
Bearing in Marine and Offshore Industries Using a Fuzzy Rule Base Method .................. 108
Summary ....................................................................................................................................... 108
5.1 Introduction .................................................................................................................... 108
5.2. Used Oil Sampling Analysis of Marine Crane Bearing and Gearbox ................... 109
5.3 Methodology .................................................................................................................. 109
5.3.1 Identification of Grease/Oil Sample Test Results (Step one) ........................ 111
5.3.2 Pre-Screening of the Test Results (Step two) ................................................. 111
5.3.3 Development of Fuzzy Membership Function (Step three) ........................... 112
Development of an Efficient Planned Maintenance Framework for Marine and Offshore Machinery
viii
5.3.4 Development of Fuzzy Rule-Based Diagnosis for Risk Prediction (Step four)
112
5.3.5 Determining the Risk Levels of each Component (Step five) ........................ 112
5.3.6 Defuzzification Process (Step six) ..................................................................... 113
5.3.7 Perform Sensitivity Analysis (Final step) .......................................................... 114
5.4 Test Case ...................................................................................................................... 114
5.4.1 Identification of Grease/Oil Sample Test Results (Step one) ........................ 114
5.4.2 Test Results Pre-Screening (Step two)............................................................. 115
5.4.3 Development of Fuzzy Membership Function (Step three) ........................... 118
5.4.4 Development of Fuzzy Rule Base (Step four) ................................................. 119
5.4.5 Determination of Risk Levels for the Sample Test Elements of each Crane
Component and the Acquirement of its Fuzzy Conclusion (Step five) ......................... 121
5.4.6 The Defuzzification Process (Step six) ............................................................. 125
5.4.7 Sensitivity Analysis (Final step) .......................................................................... 125
5.5 Discussions ................................................................................................................... 132
5.6 Conclusion ..................................................................................................................... 133
Chapter 6 ....................................................................................................................................... 135
Application of a Multiple Attribute Group Decision Making (MAGDM) Model for Selection
of the best Maintenance Strategy for Marine and Offshore Machinery based on Fuzzy
Technique for Order Preference by Similarity to Ideal Situation (FTOPSIS) ...................... 135
Summary ....................................................................................................................................... 135
6.1 Introduction .................................................................................................................... 135
6.2 Methodology .................................................................................................................. 136
6.2.1 Identification of Decision-Making Alternatives (Step one) ............................. 137
6.2.2 Identification of Evaluation Criteria (Step two) ................................................. 138
6.2.3 Rating Phase - Determination of Importance Weights (Step three) ............. 140
6.2.4 Selection Phase - Application of FTOPSIS Approach to Obtain Performance
Rating of Decision Alternatives (Step four) ...................................................................... 143
6.2.5 Perform Sensitivity Analysis (Final) ................................................................... 146
6.3 Application of Methodology to a Test Scenario ....................................................... 146
6.3.1 Identification of Decision Making Alternatives (Step one) .............................. 147
6.3.2 Identification of Evaluation of Criteria (Step two) ............................................ 147
6.3.3 Rating Phase - Determination of Importance Weight (Step three) ............... 148
6.3.4 Selection Phase - Application of FTOPSIS Approach to Obtain Performance
Rating of Decision Alternatives (Step four) ...................................................................... 152
6.3.5 Perform Sensitivity Analysis (Final) ....................................................................... 156
6.4 Discussion of Results .................................................................................................. 158
Development of an Efficient Planned Maintenance Framework for Marine and Offshore Machinery
ix
6.5 Conclusion ..................................................................................................................... 159
Chapter 7 ....................................................................................................................................... 160
Conclusions and Recommendations ......................................................................................... 160
Summary ....................................................................................................................................... 160
7.1 Main Conclusions ......................................................................................................... 160
7.2 Advantages and Disadvantages of the Models ....................................................... 161
7.2.1 Advantages ........................................................................................................... 161
7.2.2 Disadvantages ...................................................................................................... 161
7.3 Research Contribution to Knowledge ........................................................................ 162
7.4 Research Findings ....................................................................................................... 162
7.5 Research Novelty ......................................................................................................... 163
7.6 Research Limitations ................................................................................................... 163
7.7 Recommendation for Future Research ..................................................................... 163
References .................................................................................................................................... 165
APPENDICES ............................................................................................................................... 184
Chapter 4 Appendices ................................................................................................................. 185
Appendix 4A - Experts Ratings .............................................................................................. 185
Appendix 4B - Evaluation of Trend Analysis ........................................................................ 201
4B1 – Membership Functions for Crane Bearing Grease Sample Elements.............. 201
4B2 – Membership Functions for Crane Clutch Oil Sample Elements ........................ 203
4B3 – Membership Functions for Crane Gearbox Oil Sample Elements .................... 205
4B4 – Membership Functions for Crane Hydraulic Pump Oil Sample Elements ....... 207
Appendix 4C - Evaluation of Family Analysis ...................................................................... 209
4C1 – Membership Functions for Crane Bearing Grease Sample Elements ............. 209
4C2 – Membership Functions for Crane Clutch Oil Sample Elements ........................ 211
4C3 – Membership Functions for Crane Gearbox Oil Sample Elements .................... 213
4C4 – Membership Functions for Crane Hydraulic Pump Oil Sample Elements ....... 215
Appendix 4D - Aggregation of Sub-Criteria .......................................................................... 217
Appendix 4E - Alteration of Sample 2 Oil Condition Values due to Variation in each Sub-
Criterion by 0.2 ......................................................................................................................... 221
Appendix 4F - Aggregation of the Original Values with the Alteration Values of the Main
Criteria for Sample 2 ................................................................................................................ 223
Chapter 5 Appendices ................................................................................................................. 225
Appendix 5A – Development of Fuzzy Membership Functions ........................................ 225
5A1 Grease Sample Elements in Port Crane bearing ................................................ 225
5A2 Grease Sample Elements in Starboard Crane bearing ...................................... 226
Development of an Efficient Planned Maintenance Framework for Marine and Offshore Machinery
x
5A3 Oil Sample Elements in Port Crane Gearbox ...................................................... 226
5A4 Oil Sample Elements in Starboard Crane Gearbox ............................................ 227
Appendix 5B - Fuzzy Rule-Based Table for Risk Screening of Crane Bearing/Gearbox
.................................................................................................................................................... 229
Appendix 5C - Risk Level Determination for Decrement by 0.1 ....................................... 233
5C1 Risk level for port crane bearing grease sample test elements (Decrement of
0.1) 233
5C2 Risk Level for Starboard Crane Bearing Grease Sample Test Elements ........ 236
5C3 Risk Level for Port Crane Gearbox Oil Sample Test Elements (Decrement of
0.1) 237
5C4 Risk Level for Starboard Crane Gearbox Oil Sample Test Elements (Decrement
of 0.1) ..................................................................................................................................... 238
Appendix 5D - Risk Level Determination for Decrement by 0.2 ....................................... 240
5D1 Risk level for port crane bearing grease sample test elements (0.2 decrement)
240
5D2 Risk Level for Starboard Crane Bearing Grease Sample Test Elements (0.2
decrement). ........................................................................................................................... 243
5D3 Risk Level for Port Crane Gearbox Oil Sample Test Elements (0.2 decrement)
244
5D4 Risk Level for Starboard Crane Gearbox Oil Sample Test Elements (0.2
decrement) ............................................................................................................................ 245
Appendix 5E - Risk Level Determination for Decrement by 0.3 ........................................ 247
5E1 Risk level for port crane bearing grease sample test elements (0.3 decrement)
247
5E2 Risk Level for Starboard Crane Bearing Grease Sample Test Elements (0.3
decrement) ............................................................................................................................ 250
5E3 Risk Level for Port Crane Gearbox Oil Sample Test Elements (0.3 decrement)
251
5E4 Risk Level for Starboard Crane Gearbox Oil Sample Test Elements (0.3
decrement) ............................................................................................................................ 252
Appendix 5F - Risk Values for Decremented Set of Fuzzy Conclusions ......................... 254
Appendix 6 - Research Questionnaires ................................................................................ 256

Development of an Efficient Planned Maintenance Framework for Marine and Offshore Machinery
xi
List of Figures
Figure 1.1: Typical Marine & Offshore Investments...............................................................7
Figure 2.1: Oil Sampling Kit Box.........................................................................................22
Figure 2.2: Steps to Take Good Oil Sample........................................................................23
Figure 2.3: Machinery Oil Condition Monitoring Cycle.........................................................25
Figure 2.4: Membership Function of the Triangular Fuzzy Number.....................................32
Figure 2.5: Membership Functions of Linguistics Variable for Measuring the Performance
Values of Alternatives......................................................................................33
Figure 2.6: Absolute and Statistical Alarms.........................................................................53
Figure 3.1: A Novel Planned Maintenance Framework for Marine and Offshore
Machinery….....................................................................................................59
Figure 4.1: Flow Diagram for Evaluating the Condition of Equipment………………………64
Figure 4.2: A Generic Model for Condition Monitoring of Machinery…………………………65
Figure 4.3: Dongnam Hydraulic Crane on FPSO Main Deck...............................................74
Figure 4.4: Crane Slewing Bearing.....................................................................................75
Figure 4.5: Crane Gearbox.................................................................................................76
Figure 4.6: Crane Clutch.....................................................................................................77
Figure 4.7: Crane Hydraulic Pump......................................................................................77
Figure 4.8: Specific Model for Condition Monitoring of a Ship Crane…...............................80
Figure 4.9: Membership Functions of the Iron (Fe) Element – Trend Analysis……………88
Figure 4.10: Membership Functions of the Iron (Fe) Element – Family Analysis…..............96
Figure 4.11: Sensitivity of the Model Output to the Variation of the Alteration with Original in
each Main Criterion…..................................................................................105
Figure 5.1: Diagnostic Flow Chart….................................................................................110
Figure 6.1: Hierarchical Model of Decision Making Analysis for Equipment………………137
Figure 6.2: Membership Degree for Linguistic Ratings………………………………………140
Figure 6.3: Hierarchical Structure of Maintenance Strategy Selection…………………….147
Figure 6.4: Ranking Order of the Maintenance Strategies………………………………….156
Development of an Efficient Planned Maintenance Framework for Marine and Offshore Machinery
xii
List of Tables
Table 2.1: Value of RI versus Matrix Order…………………………………………………….40
Table 2.2: Comparison Scale……………………………………………………………………40
Table 4.1: Composition of Experts......................................................................................66
Table 4.2: Weighting of Expert Judgements…....................................................................79
Table 4.3: Expert 1 Pair-wise Comparison Matrix for the Five Criteria………………………81
Table 4.4: Developing Expert 1 Rating for each Decision Alternative for the Crane
Bearing…..........................................................................................................82
Table 4.5: Combined Pair-Wise Comparison Matrix for Crane Bearing…………………….84
Table 4.6: Combined Pair-Wise Comparison Matrix for Crane Clutch….............................85
Table 4.7: Combined Pair-Wise Comparison Matrix for Crane Gearbox……………………85
Table 4.8: Combined Pair-Wise Comparison Matrix for Crane Hydraulic Pump……………85
Table 4.9: Weights of the Sub-Criteria….............................................................................86
Table 4.10: Description for Test Elements and General Interpretation………………………86
Table 4.11: Grease Sample Report for Port Crane Bearing…………………………………87
Table 4.12: Absolute Limits for Crane Bearing Used Grease Sample………………………88
Table 4.13: Fuzzy Sets for Crane Bearing Grease Samples – Trend Analysis....................90
Table 4.14: Grease Sample Report for Ship Port Crane Clutch….......................................90
Table 4.15: Absolute Limits for Crane Clutch Oil Tests………………………………………91
Table 4.16: Fuzzy Sets for Crane Clutch Oil Samples – Trend Analysis..............................91
Table 4.17: Oil Sample Report for Ship Port Crane Gearbox…………………………………91
Table 4.18: Absolute Limits for Crane Gearbox Oil Tests……………………………………92
Table 4.19: Fuzzy Sets for Crane Gearbox Oil Samples – Trend Analysis..........................92
Table 4.20: Oil Sample Report for Ship Port Crane Hydraulic Pump……………………….93

Development of an Efficient Planned Maintenance Framework for Marine and Offshore Machinery
xiii
Table 4.21: Absolute Limits for Crane Hydraulic Pump Oil Tests…………………………….93
Table 4.22: Fuzzy Sets for Crane Hydraulic Pump Oil Samples – Trend Analysis...............93
Table 4.23: Standard Deviation for Port and Starboard Cranes Bearing Grease Test
Results………………………………………………………………………………95
Table 4.24: Fuzzy Sets for Crane Bearing Oil Samples – Family Analysis..........................96
Table 4.25: Standard Deviation for Port and Starboard Cranes Clutch Oil Test Results…..97
Table 4.26: Fuzzy Sets for Crane Clutch Oil Samples – Family Analysis.............................97
Table 4.27: Standard Deviation for Port and Starboard Cranes Gearbox Oil Test
Results............................................................................................................98
Table 4.28: Fuzzy Sets for Crane Gearbox Oil Samples – Family Analysis.........................98
Table 4.29: Standard Deviation for Port and Starboard Cranes Hydraulic Pump Test
Results............................................................................................................98
Table 4.30: Fuzzy Sets for Crane Hydraulic Pump Oil Samples – Family Analysis..............99
Table 4.31: Aggregation Results of Sub-Criteria for Sample 1…………………………….100
Table 4.32: Aggregation Results of Sub-Criteria for Sample 2….......................................100
Table 4.33: Aggregation Results of Sub-Criteria for Sample 3….......................................101
Table 4.34: Aggregation of Main Criteria from Fuzzy Sets Output of Sample 1………….101
Table 4.35: Aggregation of Main Criteria from Fuzzy Sets Output of Sample 2………….101
Table 4.36: Aggregation of Main Criteria from Fuzzy Sets Output of Sample 3………….102
Table 4.37: Utility Values……………………………………………………………………….103
Table 4.38: Aggregation Results for Sample 2 Due to Decrement by 0.2…………………104
Table 4.39: Aggregation Results for the Variation of each 0.2 Decrement Values with the
Original Fuzzy Sets in the Main Criteria…......................................................105
Table 5.1: Critical Wear Elements Test Results for Port Crane Bearing Grease Sample...114
Table 5.2: Critical Wear Elements Test Results for Starboard Crane Bearing Grease
Sample….........................................................................................................114

Development of an Efficient Planned Maintenance Framework for Marine and Offshore Machinery
xiv
Table 5.3: Absolute Limits for Crane Bearing Used Grease…...........................................115
Table 5.4: Critical Wear Elements Test Results for Port Crane Gearbox Oil Sample…...115
Table 5.5: Critical Wear Elements Test Results for Starboard Crane Gearbox Oil
Sample............................................................................................................115
Table 5.6: Absolute Limits for Crane Gearbox Used Oil……………………………………115
Table 5.7: Port Crane Bearing…………………………………………………………………116
Table 5.8: Starboard Crane Bearing……………………………………………………….….116
Table 5.9: Port Crane Gearbox………………………………………………………………...117
Table 5.10: Starboard Crane Gearbox....................…………………………………………117
Table 5.11: Description for Test Elements and General Interpretation…………………….118
Table 5.12: Fuzzy Set for Port Crane Bearing Grease Sample Test Elements……………118
Table 5.13: Fuzzy Set for Starboard Crane Bearing Grease Sample Test Elements….....118
Table 5.14: Fuzzy Set for Port Crane Gearbox Oil Sample Test Elements…....................118
Table 5.15: Fuzzy Set for Starboard Crane Gearbox Oil Sample Test Elements…………119
Table 5.16: Linguistic Term Grades & Risk Ranking…………………………………………120
Table 5.17: The Minimum Value of each Combination for Port Crane Bearing……………122
Table 5.18: The Maximum Value Associated with the same Category of Linguistic Priority
Terms for Port Crane Bearing……………………………………………………122
Table 5.19: The Minimum Value of each Combination for Starboard Crane Bearing….....123
Table 5.20: The Minimum Value of each Combination for Port Crane Gearbox….............123
Table 5.21: The Minimum Value of each Combination for Starboard Crane Gearbox…....124
Table 5.22: The Set of Fuzzy Conclusions of the Ship’s Crane……………………………124
Table 5.23: The Ship Crane Components Risk Values…..................................................125
Table 5.24: Decrement of Port Crane Bearing Grease Sample Test Elements by 0.1…...126
Table 5.25: Decrement of Starboard Crane Bearing Grease Sample Test Elements by 0.1....
...................................................................................................................... 125

Development of an Efficient Planned Maintenance Framework for Marine and Offshore Machinery
xv
Table 5.26: Decrement of Port Crane Gearbox Oil Sample Test Elements by 0.1….........126
Table 5.27: Decrement of Starboard Crane Gearbox Oil Sample Test Elements by 0.1…126
Table 5.28: Decrement of Port Crane Bearing Grease Sample Test Elements by 0.2…...127
Table 5.29: Decrement of Starboard Crane Bearing Grease Sample Test Elements by 0.2....
...................................................................................................................... 127
Table 5.30: Decrement of Port Crane Gearbox Oil Sample Test Elements by 0.2….........127
Table 5.31: Decrement of Starboard Crane Gearbox Oil Sample Test Elements by 0.2…127
Table 5.32: Decrement of Port Crane Bearing Grease Sample Test Elements by 0.3…...127
Table 5.33: Decrement of Starboard Crane Bearing Grease Sample Test Elements by 0.3....
.......................................................................................................................128
Table 5.34: Decrement of Port Crane Gearbox Oil Sample Test Elements by 0.3….........128
Table 5.35: Decrement of Starboard Crane Gearbox Oil Sample Test Elements by 0.3…128
Table 5.36: The Maximum Value Associated with the Same Category of Linguistic Priority
Terms for Decrement of Port Crane Bearing Grease Sample Elements….....129
Table 5.37: The Maximum Value Associated with the Same Category of Linguistic Priority
Terms for Decrement of Starboard Crane Bearing Grease Sample Elements....
....................................................................................................................129
Table 5.38: The Maximum Value Associated with the Same Category of Linguistic Priority
Terms for Decrement of Port Crane Gearbox Oil Sample Elements…………129
Table 5.39: The Maximum Value Associated with the Same Category of Linguistic Priority
Terms for Decrement of Starboard Crane Gearbox Oil Sample Elements…129
Table 5.40: The Set of Fuzzy Conclusions of the Ship’s Crane from Decrement values…129
Table 5.41: Risk Values from the Decremented Set of Fuzzy Conclusions………………130
Table 5.42: Using Two Elements for Decrement of Port Crane Bearing by 0.3……………130
Table 5.43: The Minimum Value of each Combination for Port Crane Bearing……………131
Table 5.44: The Maximum Value Associated with the same Category of Linguistic Priority
Development of an Efficient Planned Maintenance Framework for Marine and Offshore Machinery
xvi
Terms for Port Crane Bearing….....................................................................132
Table 6.1: Fuzzy Linguistic Scale for Alternative Rating……………………………………141
Table 6.2: Classification of Experts……………………………………………………………141
Table 6.3: Criteria for Maintenance Strategy Selection…..................................................148
Table 6.4: Linguistic Assessment of the Alternatives with Respect to Criteria by Expert 1.
........................................................................................................................148
Table 6.5: Linguistic Assessment of the Alternatives with Respect to Criteria by Expert 2.
........................................................................................................................149
Table 6.6: Linguistic Assessment of the Alternatives with Respect to Criteria by Expert 3.
........................................................................................................................149
Table 6.7: Selected Experts and their Assigned Degree of Competency………………….149
Table 6.8: Weights of Criteria…........................................................................................150
Table 6.9: Decision Alternatives and Evaluation Criteria...................................................150
Table 6.10: Fuzzy Numbers for Alternatives with Respect to Criteria by Expert 1…..........151
Table 6.11: Fuzzy Numbers for Alternatives with Respect to Criteria by Expert 2…..........151
Table 6.12: Fuzzy Numbers for Alternatives with Respect to Criteria by Expert 3…..........151
Table 6.13: Aggregation Calculation for Reliability with Respect to RTFM…....................151
Table 6.14a: Aggregation Results of Criteria Ratings with Respect to Alternatives...........152
Table 6.14b: Aggregation Results of Criteria Ratings with Respect to Alternatives...........152
Table 6.15: Transformation of the Fuzzy Numbers into Crips Values................................152
Table 6.16: Fuzzy-TOPSIS Decision Matrix…..................................................................153
Table 6.17: Normalised Decision Matrix………………………………………………………153
Table 6.18: Weighted Normalized Decision Matrix………………………………………….154
Table 6.19: Representation of FPIRP and FNIRP Values………………………………….154
Table 6.20: Distance of each Alternative to the FPIRP and FNIRP…………………………154
Table 6.21: CC Results and Ranking Order of the Maintenance Strategies……………….155
Table 6.22: Results of Fuzzy TOPSIS Analysis………………………………………………155
Development of an Efficient Planned Maintenance Framework for Marine and Offshore Machinery
xvii
Table 6.23: Conditions for Changing Input Values by Percentages…...............................157
Table 6.24: Fuzzy-TOPSIS Decision Matrix when Criteria are changed by 10%...............157
Table 6.25: Normalised Decision Matrix when Criteria Values are changed…..................157
Table 6.26: Weighted Normalised Decision Matrix when Criteria are changed….............157
Table 6.27: Sensitivity Analysis Results………………………………………………………157
Development of an Efficient Planned Maintenance Framework for Marine and Offshore Machinery
xviii
Abbreviations
AHP Analytical Hierarchy Process
AIS Automatic Identification System
ASTM American Society for Testing and Materials
BDM Belief Degree Matrix
BN Bayesian Network
BPN Bayesian Probability Network
CBM Condition Based Maintenance
CM Condition Monitoring
CMA Condition Monitoring Approach
COC Certificate of Competency
CR Consistency Ratio
CRS Crane Reliability Survey
DM Decision Maker
DMP Data Mining Process
DRGW Denver, Rio Grande and Western Railway
D-S Dempster-Shafer
ECM Effective Centred Maintenance
ELECTRE Elimination and Choice Expressing Reality
EMM Effective Maintenance Modelling
ER Evidential Reasoning
FAHP Fuzzy Analytical Hierarchy Processing
FER Fuzzy Evidential Reasoning
FER-SAM Fuzzy Evidential Reasoning Sensitivity Analysis Model
FL Fuzzy Logic
FMADM Fuzzy Multiple Attribute Decision Making
FMECA Failure Mode, Effects and Criticality Analysis
FNIS Fuzzy Negative Ideal Solution
FPIS Fuzzy Positive Ideal Solution
FPSO Floating Production Storage and Offloading
FRB Fuzzy Rule Base
FRB-SAM Fuzzy Rule Base Sensitivity Analysis Model
FRA Fuzzy Risk Assessment
FSA Formal Safety Assessment
Development of an Efficient Planned Maintenance Framework for Marine and Offshore Machinery
xix
FSM Fuzzy Set Modelling
FST Fuzzy Set Theory
FTOPSIS Fuzzy Technique for Order Preference by Similarity to Ideal
Solution
GMM Geometric Mean Method
HAZOPs Hazard and Operability Studies
IMO International Maritime Organisation
ISIC International Standard Industrial Classification
ISO International Organisation for Standardization
MADM Multiple Attribute Decision Making
MAGDM Multiple Attribute Group Decision Making
MAIB Marine Accident Investigation Branch
MCDA Multiple Criteria Decision Analysis
MCDM Multiple Criteria Decision Making
MFs Membership Functions
MMIS Maintenance Management Information System
NACE Statistical Classification of Economic Activities in the European
Community
NIRP Negative Ideal Reference Point
PLB Predictive Logic Box
PIRP Positive Ideal Reference Point
PM Preventive Maintenance
PMS Planned Maintenance System
PRA Probabilistic Risk Assessment
PROMETHEE Preference Ranking Organisation Method for Enriching Evaluation
QDT Quantitative Data Transformation
QRA Quantitative Risk Assessment or Qualitative Risk Assessment
QSMS Quality and Safety Management System
RCM Reliability Centred Maintenance
SCR Ship Crane Reliability
STCW Standards of Training, Certifications & Watch-keeping
TFN Triangular Fuzzy Number
TOPSIS Technique for Order Preference by Similarity to Ideal Solution
TPM Total Productive Maintenance
WAM Weighted Arithmetic Mean
ZFN Trapezoidal Fuzzy Number

Development of an Efficient Planned Maintenance Framework for Marine and Offshore Machinery
1
Chapter 1
Introduction
Summary
This chapter introduces the background of the research, and in doing so highlights the
problems faced by monitoring the condition of marine and offshore machinery operating in
an uncertain environment. The research objectives and hypothesis are also highlighted.
They set out a logical platform aimed at addressing the outlined problems. There is an ever-
increasing need for improving efficiency, reducing costs and increasing safety and reliability,
each intrinsically linked with one another. The main research methodology is briefly
described along with the scope and structure of the research.
1.1 Research Background
The marine and offshore industry today exists in a competitive market, which is a complex
entity to examine for several reasons. Firstly, the industry has no nomenclature of economic
activities (NACE) code, which therefore makes it difficult to define the sector (Olesen, 2016).
NACE is the European statistical classification of economic activities which groups
organizations according to their business activities. Statistics produced based on NACE are
comparable at European level and, in general, at world level, in line with the United Nations'
International Standard Industrial Classification (ISIC). Secondly, the industry consists of a
multitude of different markets with different value chains. For example, the turbine
installation company operates in a market that is very different from the market of the pump
manufacturer or the supplier of safety equipment, although they are all part of the marine
and offshore sector. Thirdly, the importance of the marine and offshore sector varies
between the different actors. For instance, the drilling contractor is totally dependent on the
offshore sector, but for the pump manufacturer, however, the offshore sector may only
account for a smaller part of the total turnover.
Marine and offshore machinery are susceptible to diverse failures in their challenging field
of operations due to their interactions and interdependence often associated with a high
level of uncertainty. The alarming increase in cost, maintenance complications, and their
effect on operation has prompted a need for effective maintenance planning, management
and supervision of the maintenance process.

Development of an Efficient Planned Maintenance Framework for Marine and Offshore Machinery
2
The maintenance of marine and offshore machinery increasingly involves a large number
of engineering services and supplier companies. Thus, there is strong competition among
suppliers to provide the best services to the operators. In order for services and supplier
companies to win contracts, they must be able to quickly react to manufacturers’
requirements and provide high quality and innovative solutions in a timely manner. It is also
essential for them to develop and deliver planned maintenance systems as efficiently as
possible.
Maintenance is an integral part of the marine and offshore industry, with a successful
maintenance strategy delivering improvements to a company through increased
productivity and efficiency whilst reducing the associated costs. The main aim of
maintenance is threefold. Firstly, the equipment or system must have the highest possible
reliability. Secondly, the downtime of equipment must be minimal. Thirdly, maintenance
costs should be minimised (Bousdekis et al., 2016). As alluded by Bengtsson and Kurdve
(2016), the total cost of maintenance is extremely difficult to calculate because of the
number of factors which are affected when a machine or a piece of equipment fails. Typical
factors may include: disruption to productivity, loss of productivity, downtime of failed
equipment, quality of a product, inefficient use of personnel, repair time and repair costs. It
is therefore essential to have an effective maintenance strategy in place in order to remain
competitive.
Effective maintenance modelling (EMM) can deliver greater efficiency in the form of
reductions in downtime of equipment, optimisation of inspection intervals, and reduced
downtime for inspections, with each improvement bringing about its own reductions in costs
to the business. EMM provides an informed and cost-effective basis to assist firms in
decision-making and a means to keep system performance at a desired level. As such,
research on maintenance modelling has attracted considerable attention. However, in the
case of a company producing a product which is considered harmful to the environment,
should failure take place, the prevention of failures becomes vital to the company. However,
the inspection interval is often devised through subjective means (i.e. discussions with
maintenance personnel). Andrews and Moss (2002) claim that maintenance is often
performed for years without consideration to costs relating to inspection, breakdowns or
downtime of equipment. Meanwhile, the advanced tools and techniques, which may be
used for streamlining, updating and assessing current methods, are either unknown or
inefficiently applied to a maintenance department. This may be down to a lack of knowledge,
insufficient time allowed to study problems or situations, failure to understand modern
techniques available, or limited knowledge within the company.

Development of an Efficient Planned Maintenance Framework for Marine and Offshore Machinery
3
There are several maintenance concepts and tools that enable equipment, machines or
processes to be maintained in a cost effective manner whilst minimising downtime and
maximising reliability. Such concepts and tools include Reliability Centred Maintenance
(RCM) (Tang et al., 2016), Preventative Maintenance (PM), Condition-Based Maintenance
(CBM) or Predictive Maintenance, and Total Productive Maintenance (TPM) (Borris, 2006).
However, they must be utilised in an effective manner, and often, adopting several of these
methods in combination helps to achieve cost effective results (Pillay and Wang, 2003).
Toms and Toms (2008) claim that the increasing corporate support and improved analytical
procedures have paved the way for condition-based maintenance (CBM) which became
predominant in the railway industry during the 1980s. However, this is not the case in the
maritime industry as CBM is still a subject of debate in certain areas of maritime operations
due to its inability to meet operators' satisfactions. Mills (2012) defines CBM as a
maintenance strategy whereby symptoms and parameters are measured to detect and
monitor potential faults. CBM enables maintenance to be carried out only when it is
indicated to be necessary, rather than at fixed intervals. It is also known as predictive
maintenance or condition monitoring, and it is covered in a range of ISO Standards.
Condition monitoring techniques include:
Vibration Monitoring
Infra-red Thermography
Acoustic Emission
Ultrasonic
Tribology and Lubrication (Oil Condition Monitoring)
Applying modelling techniques such as evidential reasoning (ER) (Liu et al., 2015), (Zhang
et al., 2015), (Dymova and Sevastjanov, 2014), (Liu et al., 2011), (Xu and Yang, 2005) and
rule-base (Ramezani and Memariani, 2011), (Liu et al., 2005) to complex systems can be
valuable. These techniques, given certain parameters, can establish an inspection interval
based on minimising downtime or reducing inspection costs. There are several examples
for applying planned maintenance strategies in machinery components such as bearing in
pumps (Woodard and Wolka, 2011), slewing bearing in ship cranes (Rezmireş et al., 2010),
(LYC, 2006), gearboxes in domestic wastewater pumps (Tiffany, 2014), winches on fishing
vessels (Pillay and Wang, 2003a) and hydraulic systems in rotary drilling machines
(Rahimdel et al., 2013). At present though, no research has been carried out applying such
modelling techniques to an environmentally hazardous industry, taking into account trend
analysis, family analysis, human reliability analysis, design analysis, and environmental
impact analysis should failure occur.

Development of an Efficient Planned Maintenance Framework for Marine and Offshore Machinery
4
1.2 Statement of Problem
Most of the planned maintenance systems available fail to measure the reliability of the
machinery with respect to trend analysis, family analysis, design analysis, environmental
analysis, and the human errors common in marine and offshore operations. The challenge
of this research is to extract the required information, from objective and subjective sources,
in order to produce an effective planned maintenance methodology. The process of
gathering data, the use of existing data or reliance on expert judgement has shown to be a
troublesome process in terms of accuracy (Black et al., 2003), (Pillay and Wang, 2003b).
The gathering of objective data in order to apply a modelling technique can be difficult, as
it generally requires many months or even years to attain sufficient data (Aggarwal, 2015).
The use of subjective data gathered from expert judgement can often come in a form which
requires standardisation with existing data in order to establish consistency of data and
ensure confidence in the modelling results. The combination of both objective and
subjective data requires elicitation in order to establish the data, which is required to apply
advanced modelling techniques to a marine and offshore company’s maintenance
management programme.
The risk of major failures in marine and offshore machinery is an area that is not thoroughly
described in academic literature, and it is clear that complexity of the machinery stems from
the interaction of their dependencies and the high levels of uncertainty in their operations.
Moreover, complexity in the system often results in lack of visibility to monitor the safety
performance of operations, as the analysts may have no detailed knowledge about the other
part of the system. As a result of this, the analyst is unable to understand the optimisation
measures required to enable the machinery to cope with unforeseen extortions and
hazards, and maintain functionality of their operations to an acceptable level of
performance.
Obviously, uncertainty associated with the marine and offshore machinery’s operations
makes it extremely difficult to clearly identify the vulnerability of the machinery in order to
assess their risks. The interactive dependence of the machinery could significantly reduce
the effectiveness of any maintenance strategies. However, in order to achieve reasonable
safety and reliability, maintain cost-effectiveness and stay competitive, risk dependence of
the machinery has to be accounted for when carrying out a collaborative modelling of the
planned maintenance system for machinery management.

Development of an Efficient Planned Maintenance Framework for Marine and Offshore Machinery
5
1.3 Research Aim and Objectives
The primary aim of this research is to propose a risk-based and decision-based planned
maintenance methodology capable of delivering a maintenance strategy in the marine and
offshore industry, to enable operators to move from current maintenance programme to a
more efficient condition-based maintenance platform. This will lead to the enhancement of
safety and sustainability of the marine and offshore machinery and transportation systems.
The modelling of an advanced decision-based framework is a vital part of this thesis as it
sets the foundation of the whole project. The planned maintenance methodology will serve
to establish inspection intervals based on reducing downtime, reducing costs or
understanding the risks relating to trend analysis, family analysis, design analysis, human
reliability analysis and environmental analysis. In order to achieve this aim, this thesis
outlines five objectives:
1. Investigation into the machinery and available planned maintenance programmes in
the marine and offshore industries to identify key machinery system uncertainties
and model failure risks associated with their operations.
2. Development of an integrated condition monitoring methodology to predict the
condition of marine and offshore machinery operating under highly uncertain
environment. This will be achieved in Chapter 4 utilising fuzzy set theory with
evidential reasoning and analytical hierarchy process algorithms.
3. Development of a novel risk assessment model capable of predicting the risk levels
of machinery components based on their laboratory oil sampling reports. This will
achieved in Chapter 5 using the concept of belief degree and fuzzy rule-based
theory.
4. Application of a multiple-attribute, group decision-making (MAGDM) model to select
the best maintenance strategy for marine and offshore machinery. This will be
achieved in Chapter 6 using based on a fuzzy techniques for order preference by
similarity to ideal situation (FTOPSIS).
5. Discussion of the results and provision of partial validations of the risk assessment
and decision-making models through the use of case studies with sensitivity
analysis, in order to demonstrated a reasonable level of confidence in the results.
This will be achieved in Chapters 4, 5 and 6.
The objectives are set out in order to achieve the aim of the research. The hypothesis is
that it is possible to develop a maintenance and inspection strategy capable of tackling a
variety of circumstances found in industry, with special consideration placed on machinery
Development of an Efficient Planned Maintenance Framework for Marine and Offshore Machinery
6
operating under a highly uncertain environment. This hypothesis must utilise historical data,
available data and expert judgement using risk-based tools and techniques.
The test of the hypothesis relies on the application of the widely used uncertainty treatment
methods such as the evidential reasoning, fuzzy logic, fuzzy rule base and TOPSIS. These
methods can serve as the basic building blocks, as well as making a significant contribution
to the development of a novel and advanced expert system, and decision-making models
for condition monitoring of marine and offshore machinery.
1.4 Research Data Mining
Primary data:
- Test results from the industry laboratories
- Historic data from reputable oil companies
- Surveys from industry experts
Secondary data:
- Information from documents
- Published journals/reports
- Conference papers
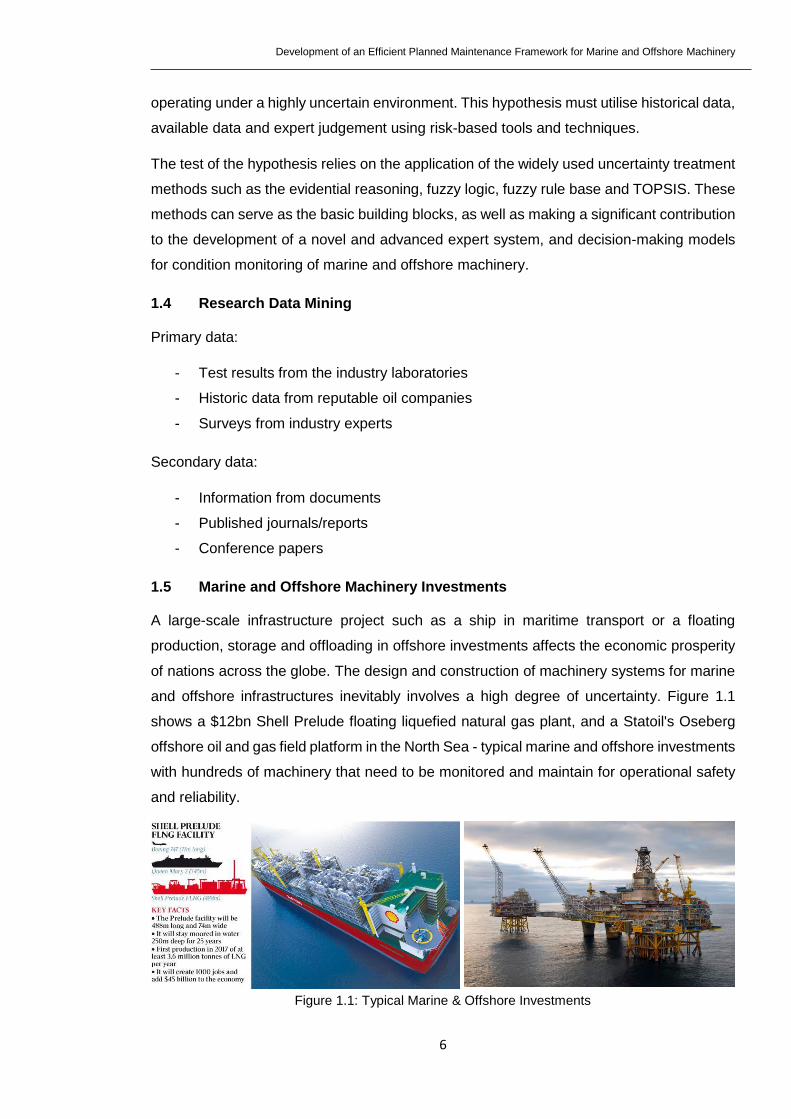
1.5 Marine and Offshore Machinery Investments
A large-scale infrastructure project such as a ship in maritime transport or a floating
production, storage and offloading in offshore investments affects the economic prosperity
of nations across the globe. The design and construction of machinery systems for marine
and offshore infrastructures inevitably involves a high degree of uncertainty. Figure 1.1
shows a $12bn Shell Prelude floating liquefied natural gas plant, and a Statoil's Oseberg
offshore oil and gas field platform in the North Sea - typical marine and offshore investments
with hundreds of machinery that need to be monitored and maintain for operational safety
and reliability.
Figure 1.1: Typical Marine & Offshore Investments
Development of an Efficient Planned Maintenance Framework for Marine and Offshore Machinery
7
Sources:https://www.theaustralian.com.au/news/bn-prelude-floating-plant-has-shell-fired-for-lng/news-
story/ac91ce9c044be11681a5c6da79ddd057?sv=742721929c7b12b4cb3cbf2042fd9dbe
http://www.esa.int/spaceinimages/Images/2013/11/Offshore_platform
1.6 Researcher’s Background
The researcher have sound knowledge in modelling and simulation of marine and offshore
machinery, maintenance and reliability of engineering systems, and with considerable
working experience in both marine and oil & gas industries. He holds National and Higher
diplomas in marine engineering, first and master’s degrees in “mechanical & marine” and
“marine and offshore” engineering respectively. Currently working with Shell as services
development & deployment engineer where he gains extensive insight into design, built,
development and deployment of Shell LubeAnalyst planned maintenance platform based
on oil condition monitoring plus the integration of other Shell customer value proposition,
which are related to his research area. The researcher's education, and work experience
provide a strong evidence of his knowledge in the research area.
Development of an Efficient Planned Maintenance Framework for Marine and Offshore Machinery
11
Chapter 2
Literature Review
Summary
This chapter reviews the relevant literature that has influenced this research. The literature
review reveals the contribution that this research makes to the marine and offshore
industries. By doing this, it provides insights into the structure of the research, articulates
ideas from other authors in a flexible manner as well as ensures that the research is
independent and original in structure and composition. The work focuses on published
studies regarding planned maintenance, condition (predictive) based maintenance,
reliability centred maintenance, oil condition monitoring, and oil analysis. It then generates
a further understanding within the subject area of study. This serves to position the research
into the context of what is already known and what knowledge gaps exist. Finally, a
framework emerges for further research of originality that avoids unnecessary repetition of
existing research (Blaxter et al., 1996).
Relevant journals, magazines, textbooks, and conference papers are extensively reviewed.
A number of studies from other relevant conference and journal articles, books and websites
are sourced to provide a solid background for the proposed research. Collaborations are
also made with experts using existing planned maintenance systems, researchers, lubricant
laboratories and industries in the proposed subject to ensure that relevant data/information
is tracked and monitored for the purpose of this research.
2.1 Introduction
Accidents have underpinned the need for practical and efficient condition monitoring of the
machinery aboard ships. Engine failure, for example, in Savannah Express led to her
subsequent contact with a link-span at Southampton docks in July 2005, and machinery
breakdown and subsequent fire on-board Maersk Doha in October 2006 (MAIB, 2010). Due
to economic needs, high safety, reliability, the need for their efficient operations in the face
of disruption and adverse sea conditions, there is a strong desire for these machinery to be
closely monitored, maintained and operated in such a manner that they can recover from
design and human errors with little losses and less susceptible to breakdown.

Development of an Efficient Planned Maintenance Framework for Marine and Offshore Machinery
12
This and many other reasons highlighted in the literature indicate a key factor that will
ensure and assure the safety and continuity of operations of these machinery in the face of
severe and catastrophic failure. When critical machinery such as cranes, main engines,
etc., do not have the robustness to recover in the face of failure, the entire ship operations
can be disrupted and delayed. Given that approximately 90% of the world’s trade is
transported by sea (IMO, 2006), the global economy is heavily dependent on the effective
operation of marine and offshore machinery. Due to an increasing high level of systemic
complexity, disruptions within their operation can be catastrophic and have long-term
negative consequences.
Building an efficient planned maintenance system for machinery is thus crucial. To fulfil this
requirement there must be a sustained engagement from the stakeholders involved in
marine and offshore operations. Academics and industrialists have long acknowledged that
purposeful maintenance can reduce catastrophic marine failures as it reaches a point of
diminishing returns. Optimising the machinery’s performance capability would require the
establishment/adoption of a culture of a systematic maintenance in order to bring and
maintain its operations to a desired level of functionality. By developing an effective
maintenance framework for marine and offshore machinery operating under a highly
uncertain environment, it provides a flexible and collaborative modelling of efficient planned
maintenance system to address the risks of failure proactively, particularly as new
machinery designs are constantly emerging.
2.2 An Overview of Marine and Offshore Industry
The marine and offshore industry operates in harsh environments, including a varying range
of air and water temperatures, high-pressure conditions, salt water, and sea roughness.
The complexity of marine and offshore machinery can be constructed (theorised) by
components, and interacting functional connections with diverse and specific tasks in
different conditions of operations. This constantly increasing complexity claims a constant
improvement in ship powering, automation, specialisation in cargo transport, and new ship
types. A well-planned effort is paramount to make the sea transport safer and more yielding.
Therefore, the criteria of reliability, availability and maintainability have become very
important factors in the process of marine and offshore machinery design, operation and
maintenance.
Today’s competitive market drives marine and offshore companies to improve quality,
product variety, availability, and productivity whilst constantly reducing operations costs.
Moreover, competition, which is intensified by technological innovations and a continuously
changing market, creates opportunities for marine and offshore operators to examine every

Development of an Efficient Planned Maintenance Framework for Marine and Offshore Machinery
13
function of their business that is connerstoned by the maintenance of their machinery to
achieve a competitive advantage (Pintelon et al., 2006). The integration of the maintenance
function with other operation functions would mean that a management system is needed
to deal with reliability, availability and maintainability issues (Moubray, 2003).
2.3 An Overview of Maintenance Concepts and Practices
Maintenance is defined as ensuring that a facility, equipment or other physical asset
continues to perform its intended functions (ABS, 2016). The ultimate goal of maintenance
is to ensure the reliability of equipment, machines or processes so that they meet the
business needs of the company. When maintenance is correctly developed and managed,
it serves to preserve a company's assets to meet the need for reliability at an optimal cost.
The importance of maintenance lies in its indispensable function in marine and offshore
operations. The total cost of maintenance is extremely difficult to calculate because of the
number of factors affected by the breakdown of a machine. Ashayeri et al. (1996) ascertain
that these factors include:
Disruption to operation.
Downtime of failed equipment.
Downtime due to inspection.
Inefficient use of personnel.
Repair time.
Costs associated with all of the above.
Given these factors, the importance of maintenance should not be underestimated, as it is
one of the areas that contribute heavily to marine and offshore machinery operations. Not
only can effective maintenance extend the life of the machinery, but it can also improve
marine and offshore operations as a whole. Anderson and Neri (1990) believe that
successful maintenance policies help in reducing machinery downtime, improving quality
and increasing productivity. Maintenance may be broken down into two main categories:
reactive and proactive (Fredriksson and Larsson, 2012), which all the four widely known
maintenance strategies (run-to-failure maintenance, preventive maintenance, condition-
based maintenance, and reliability centred maintenance) fall into. Reactive maintenance
responds to an identified need, for example, a breakdown of a machine or equipment. This
maintenance approach (which is also referred to as the run-to-failure maintenance strategy)
relies on the speed of the maintenance department to respond and react to be effective.
The overall goal of reactive maintenance is to reduce response times and reduce equipment
downtime. Proactive maintenance (which covers the preventive maintenance and condition-
based maintenance strategies) according to Fredriksson and Larsson (2012) is primarily
Development of an Efficient Planned Maintenance Framework for Marine and Offshore Machinery
14
concerned with stabilising machines or equipment, and relies on the detailed assessment
of equipment.
2.3.1 Run-To-Failure Maintenance (RTFM) Strategy
Run-to-failure maintenance is basically the “run it till it breaks” maintenance approach. It is
also known as reactive maintenance (Sullivan et al., 2010) or corrective maintenance (Toms
and Toms, 2008). In this type of maintenance approach, no actions or efforts are taken to
maintain the equipment, as the designer originally anticipated the use of the equipment until
the design life is reached. However, Toms and Toms (2008) believe that this type of
maintenance is the action of affecting repairs when some part breaks down or ceases to
function properly.
Advantages
Low equipment capital cost.
Low operational safety issues.
Fewer staff required.
High equipment life cycle reliability.
Disadvantages
Increases costs due to unplanned downtime of equipment.
Increases labour costs, especially if overtime is needed.
Costs involved with repair or replacement of equipment.
Possible secondary equipment or process damage from equipment failure.
Inefficient use of staff resources.
2.3.2 Preventive Maintenance (PM) Strategy
Preventive maintenance can be defined as an action performed on a time or machine-run-
based schedule that detects, prevents, or mitigates degradation of a component or system,
with the aim of sustaining or extending its useful life through controlling degradation to an
acceptable level (Sullivan et al., 2010). It is a periodic component replacement. According
to Pillay and Wang (2003b), preventive maintenance (PM) is a maintenance strategy that
is performed before equipment failure takes place. This method is often used in industry
with routine inspections at set intervals.
Preventive maintenance is not the optimum maintenance program, but it does have several
advantages over that of a purely reactive program. By performing the preventive
maintenance as the equipment designer projected, the life of the equipment can be

Development of an Efficient Planned Maintenance Framework for Marine and Offshore Machinery
15
extended nearer to design. Preventive maintenance that involves lubrication, a filter change,
etc. will generally ensure the efficient running of the equipment and will result in cost
savings. While catastrophic equipment failures cannot be prevented, the number of failures
can be decreased. Thus, minimizing failures can translate into maintenance and capital cost
savings.
Advantages
Increases equipment availability.
Increases operational safety.
Reduces unscheduled downtime.
Improves workload distribution for easy management of maintenance.
Disadvantages
Labour intensive and requirement of sufficient resources.
Includes performance of unneeded maintenance.
Unscheduled downtime not completely eliminated.
High cost of equipment maintenance.
2.3.3 Condition-Based Maintenance (CBM) Strategy
Condition-based maintenance is a type of maintenance used in determining the optimum
time at which to perform specific maintenance by monitoring the operation and condition of
each component in a given application (Toms and Toms, 2008). According to Sullivan et al.
(2010), CBM is also known as “Predictive Maintenance”, and can be described as an
attempt to refine maintenance activities to only those times when they are functionally
necessary, based on data collection, analysis, and (negative) trend determination from an
established “healthy” base level. Condition-based maintenance is best used in situations
where equipment is critical to operations and the appropriate monitoring system is reliable
and economical. Condition-based maintenance uses non-intrusive testing techniques such
as sensors, visual inspections or performance data in order to assess the condition of the
equipment. Continual feedback of the condition of the equipment allows for the planning
and scheduling or repairs before failure occurs (Sullivan et al., 2010). The data collected in
condition-based maintenance can be used in one of several ways in order to identify the
causes of failure or simply the condition of the equipment:
Pattern recognition - this is about understanding the relationship between certain
events and failure.
Development of an Efficient Planned Maintenance Framework for Marine and Offshore Machinery
16
Tests against limits and ranges - alarms could be set at upper or lower limits to
inform when a certain aspect of equipment moves outside the limits (Sherwin and
Al-Najjar, 1999).
Statistical process analysis - if there is published failure data on a component or
system, a comparison of the failure data that has been collected on site with the
published data can be useful to verify or disprove that the published data can be
used for the analysis of a component or system (Arthur, 2005).
Advantages
Increases equipment operational life/availability.
Decreases in equipment or process downtime.
Better product quality.
Improves worker and environmental safety.
Improves worker morale.
Reduces maintenance running hours.
Shortens repair times.
Reduces spare parts requirements; therefore, decrease in costs for parts and
labour.
Disadvantages
Increases investment in diagnostic equipment.
Increases investment in staff training.
Savings potential not readily seen by management.
2.3.4 Reliability-Centred Maintenance (RCM) Strategy
Reliability centred maintenance (RCM) is a systematic approach to evaluate a facility’s
equipment and resources to a high degree of facility reliability and cost-effectiveness
(Sullivan et al., 2010). The philosophy of RCM employs the three maintenance strategies
mentioned above in an integrated manner to increase the probability that a piece of
equipment / component will function as expected over its design life cycle with minimum
maintenance. The goal of this philosophy is to provide the stated function of the facility, with
the required reliability, and at the lowest cost. One of the prerequisites of RCM is that
maintenance decisions be based on maintenance requirements supported by rigorous
technical and economic justification.
Advantages

Development of an Efficient Planned Maintenance Framework for Marine and Offshore Machinery
17
Can be the most efficient maintenance program.
Lowers costs by eliminating unnecessary maintenance or overhauls.
Minimises frequency of overhauls.
Reduces probability of sudden equipment failures.
Able to focus maintenance activities on critical components.
Increases component reliability.
Improves feedback to other organisations.
Disadvantages
Can have significant start-up cost, training, equipment, etc.
Savings potential not readily seen by management.
2.4 Current Status of Maintenance Management in the Marine and Offshore
Industry
The marine and offshore industry by its unique nature and historical regulatory perspective
has developed into an industry that is controlled by compliance. The vast majority of ships
are built and operated to a minimum standard. However, according to Shorten (2012), less
than 17% of world-class ships operate with an approved planned maintenance system, and
the reason for this is not yet clear but may be entrenched by a power shift where control
has moved away from the ship towards the office. Maintenance engineering and
maintenance management are becoming more and more vital to the success of any ship
operator. This is due to the high capital costs of machines and equipment as well as their
high maintenance costs. Maintenance however can often be applied in a haphazard way,
with poor integration of various maintenance techniques.
Often a company will implement one or more of the best known maintenance techniques
such as RCM and CBM without inter-links to maintenance philosophy and even to their own
business. In many companies, PM tasks can be perceived as unnecessary because they
seem to be having little impact on machinery operations. Conversely, PM can also be over
utilised, in the sense that PM activities are performed more frequently than is actually
needed. While each of these will certainly contribute to the success of the maintenance
department, the way in which they are introduced can often lead to future problems
(Coetzee, 1999). As a result, maintenance planning in the marine and offshore industry
today faces many challenges.
With the advancement of data collection techniques available to most marine and offshore
companies, improvements in accuracy of failure data, diagnosis and prediction can be

Development of an Efficient Planned Maintenance Framework for Marine and Offshore Machinery
18
realised. The data collection process is attained using a maintenance management
information system. The MMIS collects, processes, and transmits maintenance information,
to be used by the maintenance personnel, managers, and those who need to make
decisions, which may affect machinery operation and performance. Many organisations,
however, have implemented the MMIS with different levels of success (Labib, 1998).
Successful implementation of such a system depends on both the planning strategy of the
company and the maintenance practice adopted.
Maintenance departments in the marine and offshore industry often utilise a general PM
strategy with the integration of other maintenance philosophies. This maintenance
approach is then fine-tuned to suit each individual company. This method has the potential
to create problems such as establishing a root cause when a problem arises due to the
multiple encrusted maintenance strategy. Implementation of new machines or equipment
may also create problems, as the existing maintenance strategy has to cope with this
change. Thus, Shorten (2012) recommends the use of a more specific and targeted method,
which is to perform a formal consultative review of the current situation based upon a wider
and less process-based analysis using industry experts who have first-hand experience of
the difficulties faced in the application of efficient maintenance management practices.
2.5 Dealing with Uncertainty in Marine and Offshore Machinery Design and
Operation
The main issue discussed in literature when designing machinery for operation in marine
and offshore environment is about how to deal with uncertainties and unpredictable events
that lead to the machinery’s failure. This is because when such machinery does not have
the robustness to recover in the face of failures, it poses a high level of risk to the entire
marine operation. A more realistic way to optimise the machinery’s capability is to
incorporate planned maintenance culture into its operations to adapt to, cope with and
recover to a desired level of functionality. Nevertheless, an emphasis on machinery
maintenance provides a flexible and collaborative modelling of planned maintenance
framework to address many risks of machinery failures proactively, particularly as new
hazards and threats are constantly evolving.
Uncertainties are things that are not known or imprecisely known. Based on expert opinions,
the lack of consideration of uncertainty in the design of marine machinery systems has led
to unclear goals in their development with often no clarity in the short and long-term vision
of the machinery operation, resulting in conflicting performance criteria. According to
Daalhuizen et al. (2009), uncertainty is a fundamental element in machinery design because
designers are often unable to predict the design process, and as a result, they may have to
Development of an Efficient Planned Maintenance Framework for Marine and Offshore Machinery
19
rely on the knowledge of the previous processes that led to the successful designs. Thus,
uncertainties which are associated with complexity, multi-disciplinary issues, and outcomes
that are unforeseeable in the early phase of the marine and offshore machinery operations
are to be dealt with while working on the machinery design.
These and many more reasons necessitate a holistic approach towards marine and offshore
machinery design and operation in order to optimise its efficiency. In response to the
aforementioned challenges and in order to reduce or eliminate the effect of disruptions on
marine and offshore operations, decision-makers are left with the task of implementing risk
management programmes to address various concerns impacting on their operations.
Several methods such as quantitative risk assessment, which has been used in the
process/oil and gas industry (Delvosalle et al., 2006), and formal safety assessment (FSA),
used in the maritime industry to describe a rational and systematic risk-based approach for
safety assessment (Wang and Trbojevic, 2007), (Pillay and Wang, 2003b), have evolved to
address the particular need of stakeholders in a variety of ways.
Although FSA for maritime application is criticized by many researchers, Kontovas and
Psaraftis (2009) affirm that the approach presents a great opportunity for relating safety and
reliability engineering to maritime risk assessment for a better understanding of the
machinery vulnerabilities in a very simplified manner. Risk analysis and strategic
maintenance planning of marine and offshore machinery are treated as independent
activities and implemented in different time frames. Little scope is left to incorporate
flexibility into the front-end operations of the systems to anticipate, cope with and adapt to
the ever-changing and dynamic environment. Patelli et al. (2015) claim that the aspect of
managing the uncertainty in multi-disciplinary design of critical systems requires not only
the availability of a single approach or methodology to deal with uncertainty, but it also
requires a set of different strategies and scalable computational tools. The lack of a coherent
and integrated approach has led to many parallel initiatives being devised by designers,
resulting in overlap or neglect of the core responsibilities with long-term financial
consequences. For critical components in important machinery used in marine and offshore
operations, a factor of safety may not be sufficient to account for uncertainties, thus, it is
imperative to consider reliability.
Risk composes of two elements, frequency and consequence. Risk is defined as the
product of the frequency with which an event is anticipated to occur and the severity of the
consequence of the event’s outcome (ABS, 2016). Risks according to Knight (2014) are
“known unknowns” while uncertainties are “unknown unknowns”. Knight (2014) further
argues that risk will not generate profit, but can be calculated using theoretical models, or
Development of an Efficient Planned Maintenance Framework for Marine and Offshore Machinery
20
by calculating the observed frequency of events to deduce probabilities. Consequently, Zio
and Pedroni (2012) claim that managing and treating uncertainty in risk assessment,
maintenance management of complex systems is a major concern to analysts because the
causes of uncertainty are diverse, and it occurs infrequently.
For example, based on the machinery design knowledge and operational experiences and
data familiarization, analysts can predict the risk of failures of the machinery components
before they occur (i.e. known unknowns), but based on the underlines uncertainty, analysts
are unable to predict the severity of this failure and the cost to the operations (i.e. unknown
unknowns). Besides, Knight (1921) further established that objective probability is the basis
for risk, while subjective probability underlies uncertainty. Therefore, the deficiency of
machinery risk assessment resulting from a lack of data or a high level of uncertainty should
be compensated by the general valuation capacity of humans who are able to comprehend
the essence of the subject matter in an unclear and imprecise situation.
2.6 Machinery Oil/Grease Analysis
In the early 1940s, Denver and Rio Grande Western Railway (DRGW) were the first to
develop work in machinery oil analysis. But after the move from steam to diesel locomotives
in the railway industry (Capasso et al., 2015), oil analysis became firmly established as a
reliable machinery monitoring technique. This programme was then used to determine the
running condition of locomotive diesel engines. Today, most naval shipboard and aviation
equipment is monitored by oil analysis as a pre-emptive measure against unscheduled
equipment malfunction (Toms and Toms, 2008).
In today’s exploding computer and information age, oil analysis has evolved into a
mandatory tool in the predictive maintenance arsenal. Therefore, the goal of an effective oil
analysis programme is to increase the reliability and availability of the machinery while
minimising maintenance costs associated with oil change, labour, repairs, and downtime.
Toms (1998) claims that accomplishing this goal takes time, training, and patience, while
Barrett (2004) ascertains that the results are dramatic and the documentation savings in
cost avoidance are significant.
Lube oil analysis is used extensively to help companies maintain their equipment, especially
on-board ships following cases of accidents originated from machinery failures. While it is
true that some failure mechanisms, such as misalignment, are better detected using
vibration monitoring devices, most experts, including those that specialize in vibration
analysis, recognize that oil analysis will generally detect active machine wear before
vibration occurs for it to be detected by vibration monitoring device. Barnes (2008) is of
Development of an Efficient Planned Maintenance Framework for Marine and Offshore Machinery
21
opinion that the combination of oil analysis for early detection coupled with the advanced
diagnostic capabilities of vibration analysis make the benefits of these two techniques far
greater when treated as teammates rather than opponents.
The analysis of used lubricating grease has become a benchmark procedure as part of the
UK Health and Safety Executive (HSE) guidelines on managing the safety of pedestal
cranes, specifically in the offshore exploration and production industries. Considering the
failure modes and the probability of such failures against the cost of performing the
monitoring, the study found grease analysis to offer the most effective solution (Shorten,
2001).
The issue with grease analysis, however, is the veracity of the sample. The sample must
be as representative as possible. A feature of grease analysis, as opposed to oil analysis,
is that contaminants and wear debris are not uniformly distributed throughout the lubricant.
This can lead to samples with huge variances in debris content.
2.7 Oil Sampling
The first step in any oil analysis program is obtaining oil sample. An oil sample is a major
help in monitoring the quality of oil in a piece of machinery. The objective of sampling is to
obtain a test specimen that is representative of the entire quantity. Thus, lab samples must
be taken in accordance with the instructions in ASTM Practice D 4057. The specific
sampling technique can affect the accuracy of this test method. Most lubricant condition
monitoring services use an oil sample of only 100ml to represent a system that may hold
hundreds or thousands of litres of oil. Regular sampling provides the information needed to
continually maximize asset reliability and increase profits. However, this will only be
achieved if every sample contributes to building an accurate history from which trends in
wear, contamination, and degradation can be determined.
2.7.1 Oil Sampling Kit
Great care must be taken when using sampling kits to drawn off oil samples during transport
at sea to ensure that the test results from the lab represent the state of the machinery.
Figure 2.1 shows a typical oil sample kit that includes the following:
Reinforced tubing with quick coupling connectors.
Tubing with Luer Lock connection for syringes.
Adaptors (screws: G1/2“; G3/8“; G3/4“; G5/8“).
Screwing bottle cap with quick coupling connection.
Multi-functional gripper.
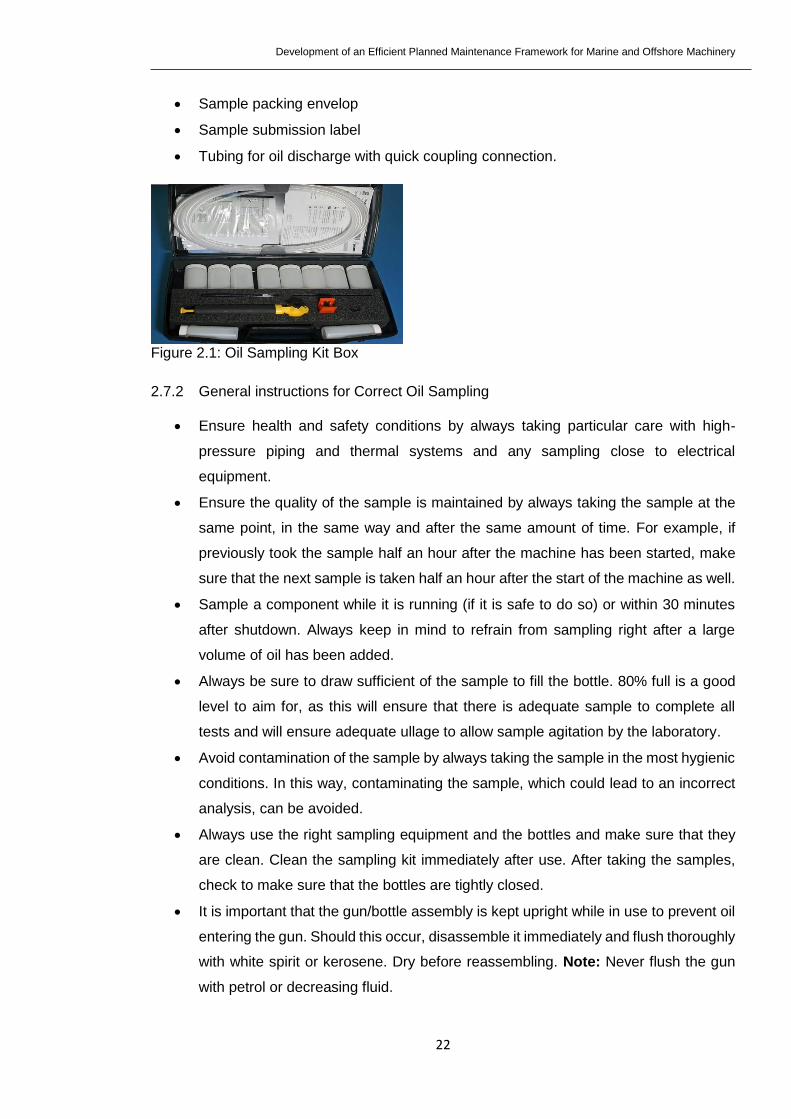
Development of an Efficient Planned Maintenance Framework for Marine and Offshore Machinery
22
Sample packing envelop
Sample submission label
Tubing for oil discharge with quick coupling connection.
Figure 2.1: Oil Sampling Kit Box
2.7.2 General instructions for Correct Oil Sampling
Ensure health and safety conditions by always taking particular care with high-
pressure piping and thermal systems and any sampling close to electrical
equipment.
Ensure the quality of the sample is maintained by always taking the sample at the
same point, in the same way and after the same amount of time. For example, if
previously took the sample half an hour after the machine has been started, make
sure that the next sample is taken half an hour after the start of the machine as well.
Sample a component while it is running (if it is safe to do so) or within 30 minutes
after shutdown. Always keep in mind to refrain from sampling right after a large
volume of oil has been added.
Always be sure to draw sufficient of the sample to fill the bottle. 80% full is a good
level to aim for, as this will ensure that there is adequate sample to complete all
tests and will ensure adequate ullage to allow sample agitation by the laboratory.
Avoid contamination of the sample by always taking the sample in the most hygienic
conditions. In this way, contaminating the sample, which could lead to an incorrect
analysis, can be avoided.
Always use the right sampling equipment and the bottles and make sure that they
are clean. Clean the sampling kit immediately after use. After taking the samples,
check to make sure that the bottles are tightly closed.
It is important that the gun/bottle assembly is kept upright while in use to prevent oil
entering the gun. Should this occur, disassemble it immediately and flush thoroughly
with white spirit or kerosene. Dry before reassembling. Note: Never flush the gun
with petrol or decreasing fluid.

Development of an Efficient Planned Maintenance Framework for Marine and Offshore Machinery
23
2.7.3 How to Take a Good Oil Sample
1. Use a sample bottle; remove the cap and screw into the pump body.
2. Using a new length of tube for each sample, push the tube through the top of the
pump until it appears half way down the sample bottle. Make sure to tighten the
thumbscrew to secure the tube.
3. Place the end of the tube into the sampling point.
4. Ensure that the sample bottle is vertical throughout the sampling operation and that
it is not overfilled.
5. Unscrew the bottle and immediately screw on the cap to avoid any contamination.
6. Complete the sample label, send the sample, and sample label to the laboratory.
Figure 2.2: Steps to Take Good Oil Sample
2.7.4 Laboratory Oil/Grease Test Methods and Results
Most oil analysis requires test methods and these test methods are not straightforward;
thus, necessitate having regulations to be carefully follow (Fitch, 2016). The regulations
from standards provided by ASTM, ISO or other comparable standardization organizations
are commonly used by the laboratories. These test standards define the generally accepted
procedure, the proper application of the test, the method’s repeatability or reproducibility,
calibration requirements and other relevant data (ASTM D445, ASTM D5185, ISO/IEC
17025, ISO 11500). For example, Iron (Fe) element in oil sample with a test result range 2

Development of an Efficient Planned Maintenance Framework for Marine and Offshore Machinery
24
– 140 has a repeatability of 0.13 𝑋0.80 and reproducibility of 0.52 𝑋0.80, where 𝑋 = mean
concentration, µg/g (ASTM D 5185, 2009).
Tests performed during an oil analysis to find the particles floating in oil sample include an
ICP Spectroscopy, Particle Count, Ferrous Density, FT-IR, and Analytical Ferrography.
Elements found in oil sample are measured in parts per million (PPM) - a very small amount.
A single PPM is equivalent to 0.0001%. To put that in perspective, it takes 10,000 PPM to
equate to 1.0%. Concentrations seen in oil analysis reports will be from one to several
hundred PPM. The following elements are commonly the cause of component wear: iron,
chromium, aluminum, copper, lead, tin, nickel, antimony, silver, titanium, and manganese.
2.8 Machinery Oil Condition Monitoring
According to Toms and Toms (2008), oil condition monitoring is the assessment of oil failure
modes through the monitoring of reliable condition indicators. Machinery condition
monitoring based oil analysis is beginning to gain its momentum in the marine industry as
it is now regarded as a vital maintenance practice. It is worth mentioning that an effective
oil analysis programme will keep not only engines, but other important assets such as
gearboxes, hydraulic systems, turbines, compressors, generators and every other oil-
wetted machinery, in operation by reducing unexpected failures and costly unscheduled
down time.
The machinery condition monitoring based on oil analysis has been in use in general
industry for almost two decades, and has proved its effectiveness and sensitivity to faults,
giving plenty of warning to allow for maintenance activities to be planned and carried out
with minimum disruption to operations and limiting the opportunity for costly secondary
damage to occur (Bannister, 2007). The machinery condition monitoring based on oil
analysis is also well suited for routine marine use where it can put the power of condition-
based maintenance into the hands of every ship owner and offshore operator.
Many experts, such as Courrech et al. (2014), Galloway (2014), and many others, have
conducted research in this area. Given that the input data for determining the condition of
the machinery are normally expressed in both quantitative and qualitative terms, decision
makers may often carry out their judgements based on both quantitative data and
experiential subjective assessments of the machinery. Consequently, a proposed
methodology for monitoring the condition of the marine and offshore machinery should be
capable of processing both quantitative and qualitative data. Figure 2.3 shows the generic
machinery oil condition monitoring cycle.

Development of an Efficient Planned Maintenance Framework for Marine and Offshore Machinery
25
Figure: 2.3: Machinery Oil Condition Monitoring Cycle
2.9 Faces of Errors in Machinery Operation
The analysis of error in complex sociotechnical systems’ operations is essential to the
investigation of machinery failures. Errors are situations or events of high uncertainty that
can lead to obstruction or impediment of a system’s normal operations by creating
discontinuity, confusion, disorder or displacement of its functions in a dynamic environment
(Madni, 2007). It is the state or condition of being wrong in conduct or judgement. These
adverse situations can take a variety of forms such as operational contingencies, defects in
design, and human mistakes. According to Whittingham (2004), two types of errors can
occur in machinery:
1) Internal error.
2) External error.
These types of errors must be evaluated in order to ensure that machinery cope with the
adverse effect of disruption that may arise due to these errors. Thus, since disruptions are
uncertain due to the nature of their occurrence, scenarios that lead to their occurrence may
be defined probabilistically.
Machinery (Asset)
Oil Samples
Lab Test Results
Analysis Lab
Maintenance
Management

Development of an Efficient Planned Maintenance Framework for Marine and Offshore Machinery
26
2.9.1 Internal (System Design) Error
The advancement in technology has cause the demand of high accurate parts to become
a conventional need in the marine and offshore industry. With this progress in technology,
errors in machinery design still become the norm in many of the marine and offshore
machinery. The errors in machinery design are often associated with knowledge-based
tasks and it is open to speculation as to exactly what the designer was thinking at the time
the error was made (Whittingham, 2004).
2.9.2 External (Human) Error
External error in machinery operation in this context involves mainly human errors. Human
errors can occur in different forms and can be exhibited in immeasurable manners.
In complex systems, such as vessels and commercial ships, the ability to understand and
influence human behaviour is essential to ensure safety and reliability (Barbarini and de
Andrade, 2010). Thus, as machinery systems are now becoming more complex, the
difficulties of the human operator in managing the new technologies are exacerbated and
the possibilities for machinery failure due to human error are increasing. Due to the growing
imbalance between system reliability and human reliability, the need arose for methods of
assessing the frequency or probability of a human error in the operation of technical
systems. This need was supported by the developing science of ergonomics, which
attempted to overcome the problem of human error by addressing how the design of the
interface between human and machine could take more account of human capabilities and
limitations (Whittingham, 2004). There are two basic approaches to the design of equipment
from a human error point of view (Whittingham, 2004):
1) The system-centred approach. Emphasis is placed upon the system rather than the
human being.
2) The user-centred approach. The system is matched as closely as possible to human
capabilities and limitations.
Regrettably, up until now, many machinery designers have not fully understood the need to
adopt a user-centred approach and there are numerous examples of complex technological
systems on-board ships that have been designed mainly with system functionality in mind,
but ignoring the capabilities and limitations of the user (Whittingham, 2004). Such systems
invariably will result in degraded levels of human performance with severe consequences
for reliability, equipment availability and safety. Systemic sources of error cover human-
related elements, automated design systems and a combination of the two. It is worth
mentioning that both human and design sources of errors can be referred to as agents of a

Development of an Efficient Planned Maintenance Framework for Marine and Offshore Machinery
27
system and can be seen as a source by which to respond to and recover from errors (IAEA,
2007 and 1991).
2.10 Lessons from Major Accidents in the Marine and Offshore Industry
This section describes a selected set of accidents within the marine and offshore industry
where strengths and weaknesses are expressed in terms of either the robust attributes,
personnel training and related concepts, or in terms of specific analytical processes that
may have been neglected, such as design requirements, verification, reliability or interface
management. Based on Jackson (2010), reviewing past accident events and scenarios has
the following advantages:
Provides insights into how a disruption can be survived even if it is not avoidable.
Provides an avenue for system definition.
Provides the basis for risk analysis of the system in order to reveal its vulnerabilities.
Many cases of disruption reported in databases were a result of near misses and other
incidents, which are potential accident indicators. The research conducted by Leveson et
al. (2005) and Reason (1997) acknowledged the importance of the proactive evaluation of
near misses and incidents in order to assess the potential accident occurrence in a
systematic fashion. The literature review revealed a strong correlation between the causes
of near misses and major accidents, which have led to disruption of operations within the
high reliability organisations (Wright and Van der Schaaf, 2004). Based on the report
released by Marine Accident Investigation Branch (MAIB) in 2010, a total of 141 accidents
were recorded for merchant vessels, of which a total of 25 accidents were caused by
machinery failure, amounting to 18% of the total accidents recorded for the merchant
vessels in 2010. However, this figure can be reduced when an effective and efficient
planned maintenance tool is in place to address the most relevant deterioration and failure
mechanisms.
2.10.1 Savannah Express Engine Failure
On July 19, 2005 at 1146 hours, the Savannah Express, one of the largest container ships
in the world, a German flagged, weighing 94,483 gross tonnes was maneuvering prior to
berthing at Southampton Container Terminal, when her main engine failed. The engine was
unable to be started astern to reduce the vessel’s headway, and she made contact with a
linkspan, which was seriously damaged.
The investigation report by MAIB (2006) reveals that the engine control system had suffered
a series of technical problems since the vessel had come into service. The report also
reveals that the Savannah Express was equipped with a slow speed diesel engine of a

Development of an Efficient Planned Maintenance Framework for Marine and Offshore Machinery
28
novel design, with no mechanical timing gear (including camshaft and timing chains or
gears) but, instead, was fitted with a fully integrated, and computer controlled,
electrohydraulic control system. The vessel’s first chief engineer had attended a basic
training course designed by the engine manufacturers. However, the engineer officers
onboard at the time of the accident had not received any type specific training from the
engine manufacturers. Thus, they were unable to correctly diagnose the reason for the
engine fault at the Nab Tower and, later, at the Upper Swinging Ground.
The increasing levels of electrification of engine control and propulsion systems required
more training in the operation, maintenance and fault finding of these technically complex,
and multi-discipline systems. MAIB (2006) claims that the STCW training standards for
ships’ engineers have not been updated to account for modern system engineering
requirements. The accident has also highlighted the essential need for the machinery
manufacturers to develop an adequate type specific training course for the operators, and
for International Maritime Organization (IMO) to improve training requirements for ships’
engineers and electricians.
2.10.2 FPSO Cidade De São Mateus Explosion
On Wednesday February 11th, 2015 at approximately 1130 hours, an explosion occurred
on-board the floating production storage and offloading (FPSO) unit Cidade de São Mateus,
once operated by BW Offshore Brazil Ltd, in the field under concession of Petróleo
Brasileiro S. A (Petrobras). Based on the investigation report by ANP (2015), the explosion
occurred due to the leakage of the condensed material into the pumps room, when the
officers on-board attempt to drain the liquid waste from the central cargo tank, with the
utilization of the alternative pump (stripping pump).
Nine people were reported dead in the explosion while twenty-six others were injured. There
was also damage to the facility. The accident is recorded as the most serious oil and gas
incident that has ever happened in Brazil in the last 14 years. The report reveals that this
deadly incident was caused by series of technical failures, incomplete procedures, poor
managerial decision-making, and improper training of the personnel on-board the vessel. It
cited a failure to follow improper fluid pumping procedures as well as the installation of an
incompatible piece of equipment as the main causes of the explosion.
The investigation report identified 28 root causes, all of which are correlated with the
requirements established by ANP Resolutions No. 43/2007, and 61 recommendations,
setting additional requirements in the report. Some of the recommendations in the report
include:
Development of an Efficient Planned Maintenance Framework for Marine and Offshore Machinery
29
Inclusion of equipment information and critical systems arising from safety studies
in computerized integrity management systems before the operation.
Inclusion of critical procedures related to maintenance, inspection and testing in
computerized integrity management systems.
Updating the previously existing systems in converted ships to platforms at the time
of conversion, considering the same design criteria and safety philosophy of the
processing plant.
2.10.3 Maersk Doha Machinery Breakdown
On October 1st, 2006, the container vessel, Maersk Doha was in Norfolk, Virginia loading
and unloading containers as she was scheduled to depart at 2100hrs but was delayed until
midnight. The engineers took the opportunity to do maintenance work on the main engine
and the auxiliary boiler was kept running with its feed water circulating through the exhaust
gas economizer to keep it warm and ready for sailing. The problems began as one of the
generators proved hard to start and a faulty reversing mechanism on the main engine left
one cylinder stuck in the reverse position restricting her speed to 16 knots.
At about 0200hrs, a rapid rise in the temperature of the EGE was noticed and the Chief
engineer realised that there was a fire inside the EGE casing. According to the MAIB (2007)
report, the most likely cause of the fire was a malfunction of the auxiliary boiler control
mechanism, which allowed the burner to keep firing with too little water in the boiler. This
overheated the furnace, causing the distortion and cracking of the fire tube. As feed water
was lost through the crack, the supply of water to the EGE failed, causing it to overheat.
Soot deposits, which had accumulated within the EGE, then ignited. It is likely that the
temperatures in the EGE rose sufficiently high for hydrogen and iron fires to develop.
Inappropriate techniques were used to fight the fire initially, because either the crew lacked
the understanding of the construction of the EGE or how to deal with the fire effectively.
However, the vessel had an extensive quality and safety management system (QSMS), but
it lacked sufficient detail to assist the crew in dealing with either the machinery breakdown,
or the subsequent fire. Further problems became evident during the emergency when other
equipment did not work correctly. The records of emergency drills and maintenance of
machinery made it difficult for the vessel’s managers to assess the quality of the work being
carried out on-board. Neither these systems, nor the quality and technical audits carried out
on the vessel, had been able to detect the underlying condition of equipment which
subsequently failed during the emergency. Further measures were instigated to change
emergency procedures and improve response of the entire ship.

Development of an Efficient Planned Maintenance Framework for Marine and Offshore Machinery
30
2.11 Proposed Risk and Decision-Making Management Model
Against the background that traditional engineering risk and reliability analyses provide a
general framework for the identification of uncertainties and quantification of risks, the
application of this process to marine and offshore machinery safety management would
facilitate the identification of stochastic variables and quantification of the associated risks
in machinery operations. The techniques applied so far in assessments of the ship’s crane
have been based on assessment end-points that are either component-specific or based
on matching similarities. It is however pertinent to note that the likelihood of component
failure establishment and maintenance strategies in a particular machinery is inarguably a
subject of probability, because the boundaries of machinery operations are notoriously
vague, and risk estimation in the marine and offshore environment can be characterised by
uncertainty and variability.
2.11.1 Risk Analysis Techniques
In this section, the generic risk analysis techniques proposed in this research work will be
discussed. The model utilises fuzzy logic in combination with the fuzzy set technique to
identify hazards associated with a crane of a floating production, storage and offloading
(FPSO) vessel. Fuzzy logic theory has been applied in this model because the risk factors
inherent in FPSO machinery are often incomplete and sometimes ill-defined for which
traditional quantitative risk assessment approaches do not give adequate answers and
solutions.
2.11.1.1 Fuzzy logic theory
Fuzzy logic theory was developed in 1965 by Zadeh as an extension of classical Boolean
logic from crisp sets to fuzzy sets and grew to become the first new method of dealing with
uncertainty and problems that are too complex or ill-defined to be susceptible to analysis
by convectional techniques. Aside from modelling the qualitative aspect of human
knowledge and the reasoning process without employing precise quantitative analysis,
fuzzy logic does not require an expert to provide a precise point at which a risk factor exists
(Liu et al., 2004). Fuzzy logic has been applied in many fields and applications that include:
engineering; research and development projects; business management; information and
control; economics and marketing; education; health and medicine; safety engineering; risk
modelling and management; and decision making analysis (Wang et al., 1995). Various
fuzzy logic techniques have been used in uncertainty treatment. They include fuzzy sets
and fuzzy rule-bases.

Development of an Efficient Planned Maintenance Framework for Marine and Offshore Machinery
31
2.11.1.2 Fuzzy set theory
The use of natural language to express perception or judgement is always subjective,
uncertain, imprecise or vague (Wang and Chang, 2007). Such uncertainty and imprecision
have long been handled with probability and statistics (Dubois and Prade, 1997). Notable
among the methods of representing and reasoning with uncertain knowledge are Bayesian
probability theory (Pearl, 1988); Demspster-Shafer theory of evidence (Shafer, 1978),
(Dempster, 1969), (Dempster, 1968b), and fuzzy set theory (Liu et al., 2003), (Zadeh, 1965).
Fuzzy set theory (FST) was devised by Zadeh to provide an approximate and yet effective
means of describing the behaviour of situations which are too ambiguous to allow
mathematical analysis. It employs human analysis and linguistic variables to represent risks
and model uncertainty inherent in natural language (Zadeh, 1965). It is therefore
complementary to traditional safety analysis methodologies and can be an effective tool in
dealing with ill-defined and imprecise information, especially linguistic information
(Duckstein, 1994).
2.11.1.3 Fuzzy membership functions
A membership function, normally referred to as ‘MF’, describes the degree of membership
of a value in a fuzzy set. Membership function can be express as 𝜇(𝑥) where x is the value
being fuzzified. There are many types of membership function, namely:
Singleton
Rectangular
Triangular
Gaussian
Depending on the problem being considered, any one of the above membership functions
can be used to solve that particular problem.
Fuzzy membership functions and linguistic terms are extensions of numerical variables
which can represent the condition of an attribute at a given interval by taking fuzzy sets as
their values (Wang, 1997). They are generated by utilising the linguistic categories identified
in the knowledge acquisition stage and consist of a set of overlapping curves used to define
the fuzzy input subset from an input variable.
2.11.1.3.1 Degree of membership
Items can belong to a fuzzy set to different degrees: degrees of membership. An item that
is completely within a set has a membership degree of 1, while those completely outside a
set have a membership degree of 0. All degrees of membership must sum to 1. An item can
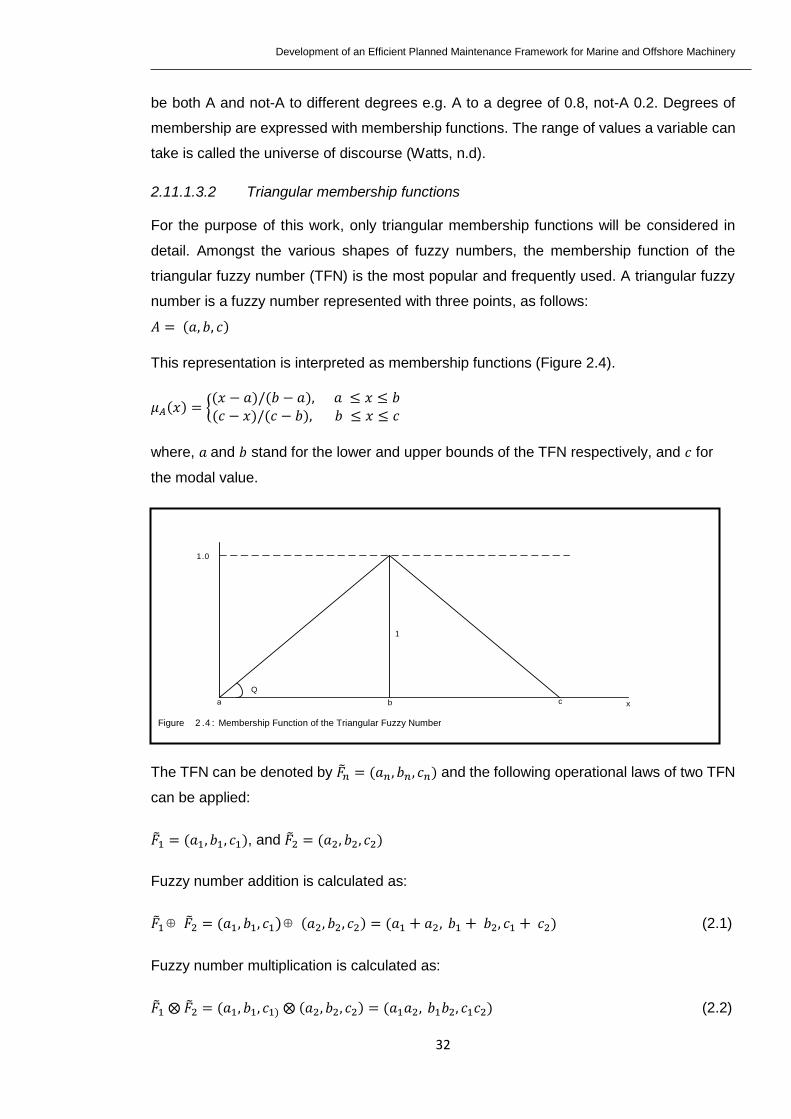
Development of an Efficient Planned Maintenance Framework for Marine and Offshore Machinery
32
be both A and not-A to different degrees e.g. A to a degree of 0.8, not-A 0.2. Degrees of
membership are expressed with membership functions. The range of values a variable can
take is called the universe of discourse (Watts, n.d).
2.11.1.3.2 Triangular membership functions
For the purpose of this work, only triangular membership functions will be considered in
detail. Amongst the various shapes of fuzzy numbers, the membership function of the
triangular fuzzy number (TFN) is the most popular and frequently used. A triangular fuzzy
number is a fuzzy number represented with three points, as follows:
𝐴 = (𝑎, 𝑏, 𝑐)
This representation is interpreted as membership functions (Figure 2.4).
𝜇𝐴(𝑥) = {(𝑥 − 𝑎)/(𝑏 − 𝑎), 𝑎 ≤ 𝑥 ≤ 𝑏(𝑐 − 𝑥)/(𝑐 − 𝑏), 𝑏 ≤ 𝑥 ≤ 𝑐
where, 𝑎 and 𝑏 stand for the lower and upper bounds of the TFN respectively, and 𝑐 for
the modal value.
The TFN can be denoted by �̃�𝑛 = (𝑎𝑛, 𝑏𝑛, 𝑐𝑛) and the following operational laws of two TFN
can be applied:
�̃�1 = (𝑎1, 𝑏1, 𝑐1), and �̃�2 = (𝑎2, 𝑏2, 𝑐2)
Fuzzy number addition is calculated as:
�̃�1 �̃�2 = (𝑎1, 𝑏1, 𝑐1) (𝑎2, 𝑏2, 𝑐2) = (𝑎1 + 𝑎2, 𝑏1 + 𝑏2, 𝑐1 + 𝑐2) (2.1)
Fuzzy number multiplication is calculated as:
�̃�1 ⨂ �̃�2 = (𝑎1, 𝑏1, 𝑐1) ⨂ (𝑎2, 𝑏2, 𝑐2) = (𝑎1𝑎2, 𝑏1𝑏2, 𝑐1𝑐2) (2.2)
a b c x
1 . 0
Figure 2 . 4 : Membership Function of the Triangular Fuzzy Number
Q
1

Development of an Efficient Planned Maintenance Framework for Marine and Offshore Machinery
33
for 𝑎1, 𝑎2 > 0; 𝑏1, 𝑏2 > 0; 𝑐1𝑐2 > 0
Fuzzy number subtraction is calculated as:
�̃�1 ⊖ �̃�2 = (𝑎1, 𝑏1, 𝑐1) ⊖ (𝑎2, 𝑏2, 𝑐2) = (𝑎1 − 𝑐2, 𝑏1−𝑏2, 𝑐1−𝑎2) (2.3)
Fuzzy number division is calculated as:
�̃�1 ⊘ �̃�2 = (𝑎1, 𝑏1, 𝑐1) ⊘ (𝑎2, 𝑏2, 𝑐2) = (𝑎1/𝑐2, 𝑏1/𝑏2, 𝑐1/𝑎2), (2.4)
For 𝑎1, 𝑎2 > 0; 𝑏1, 𝑏2 > 0; 𝑐1𝑐2 > 0
Fuzzy number reciprocal is calculated as:
�̃�1−1
= (𝑎1, 𝑎1, 𝑐1)−1 = (1/𝑐1, 1/𝑏1, 1/𝑎1) (2.5)
For 𝑎1, 𝑎2 > 0; 𝑏1, 𝑏2 > 0; 𝑐1𝑐2 > 0
2.11.1.3.3 Linguistic variables
A linguistic variable is a variable whose values are words or sentences in a natural or
artificial language. According to Zadeh (1975), it is very difficult for conventional
quantification to express reasonably those situations that are clearly complex or hard to
define. Therefore, the concept of a linguistic variable is necessary in such situations.
Linguistic variables are currently being used extensively. The linguistic effect values of the
best metal element alternatives found in this study are primarily used to assess the linguistic
Very poor Poor Fair Good Very good
0 30 60 90 100
1
Figure 2.5: Membership Functions of Linguistics Variables for Measuring the Performance Value of Alternatives
U ( x )
10 20 40 50 70 80 X

Development of an Efficient Planned Maintenance Framework for Marine and Offshore Machinery
34
ratings given by the evaluators. Here each membership function (scale of fuzzy number) is
defined by three parameters of the symmetric triangular fuzzy number: the left point, middle
point, and right point of the range over which the function is defined.
Moreover, linguistic variables are used as a way to measure the performance value of the
best metal element alternative for each criterion as “very good,” “good,” “fair,” “poor” and
“very poor” (Chen et al., 2009). TFN, as shown in Figure 3.2, is used to indicate the
membership functions of the linguistic terms. The horizontal axis indicates the quantitative
number and the vertical axis indicates the degree of belief (membership value). If any
quantitative number (𝑒. 𝑔. ℎ𝑖) is found in the range of ℎ𝑛+1,𝑖 (with a grade 𝐻𝑛+1) and ℎ𝑛,𝑖
(with a grade 𝐻𝑛), its belief degrees can be evaluated as follows:
If ℎ𝑛,𝑖 < ℎ𝑖 < ℎ𝑛+1,𝑖 𝑡ℎ𝑒𝑛 𝛽𝑛,𝑖 = ℎ𝑛+1,𝑖 − ℎ𝑖
ℎ𝑛+1,𝑖 − ℎ𝑛,𝑖 (2.6)
𝛽𝑛+1,𝑖 = 1 − 𝛽𝑛,𝑖 (2.7)
where, 𝛽𝑛,𝑖 is the degree of belief of the concerned quantitative number with the grade 𝐻𝑛,
and 𝛽𝑛 + 1,𝑖 is the degree of belief of the concerned quantitative number with the grade
𝐻𝑛 + 1.
2.11.1.4 Fuzzy rule-base method
A fuzzy rule-base allows more coherent and intuitive simulation for evaluating risk in marine
and offshore operations. There has been a significant increase in the number and variety
of applications using fuzzy rule based approaches. Zadeh (1965) first introduced the fuzzy
set theory as a classical set for grouping together elements that all have at least one
common characteristic (MIT GMBH, 2006), as cited by Ramezani and Memariani (2011).
The fuzzy rule-based method does not require a utility function to define the probability of
occurrence, severity and detectability considered for the analysis (Pilay and Wang, 2003a).
A fuzzy rule base provides a coherent and intuitive model for evaluating faults in marine
machinery.
One realistic way to analyse a risk with incomplete objective data is to employ a fuzzy IF-
THEN rule built from human understanding, where premise and conclusions contain the
linguistic variables used to describe risk parameters (Yang et al., 2009). Such a rule has
been used because probabilistic risk assessment (PRA) is considered inadequate to
address the need of complex systems with high degrees of uncertainty. For example, IF-
THEN rules with a belief structure can be constructed to simulate a maintenance
management scenario. An IF-THEN rule can be developed as follows:

Development of an Efficient Planned Maintenance Framework for Marine and Offshore Machinery
35
If Threat Likelihood is “Medium”, Machinery Vulnerability is “High” and Impact or
Consequent Severity is “Serious”, then Machinery Failure is “High”.
Due to the high degree of uncertainty associated with the expert judgement when forming
or representing a relationship between premise and conclusion, or rather, when the
evidence available is not adequate to support any viable decision, or when the expert is not
100% sure whether to believe in an assumption, but only to a certain degree of credibility,
it is possible to have fuzzy rules with a prudent belief structure as follows:
If Threat Likelihood is “Medium”, Machinery Vulnerability is “High” and Impact or
Consequent Severity is “Serious”, then Machinery Failure is {(Very Low, 0), (Low, 0),
(Medium, 0.6), (High, 0.4), (Very High, 0)}.
In light of the above, {(Very Low, 0), (Low, 0), (Medium, 0.6), (High, 0.4), (Very High, 0)} is
a belief distribution of the machinery evaluation where experts are 60% sure that the
machinery failure level is Medium, and 40% sure that the machinery failure level is High.
2.11.2 Decision Making Analysis Techniques
According to Reichert et al. (2007) as cited in John et al. (2014), decision analysis
techniques were originally developed to support individual decision makers in carefully
considering all aspects of the decision making process. Nonetheless, Ananda and Herath
(2003) and Marttunen and Hamalainen (1995) are of the view that because these
techniques are used to structure the problem under consideration and to make clear the
expectations about outcomes and preferences, they can also be used to support group
decisions as well as communicating decisions.
The significant issues described in literature for the effective application of multiple criteria
decision making (MCDM) revolve around the information and data available to characterize
a piece of equipment, and the related uncertainties that affect the models and parameters
supporting the decision process. Several decision making problems involve uncertainty;
thus, methods that facilitate better and optimum management decisions must account for
variations in decision makers’ preferences for attributes and conflicting interests in a
systematic fashion. As the complexity of decisions increases in complex machinery, it
becomes more challenging for decision makers to identify appropriate alternatives. As a
result, robust but flexible analytical tools that can account for these difficulties are required
to consider the numerous criteria and decision outcomes (John et al., 2014).
Risks, benefits and costs are considered the most important attributes associated in all
decision making problems. This research is an attempt to use quantitative risk assessment
(QRA) to support correct decision-making and improve the condition of marine and offshore

Development of an Efficient Planned Maintenance Framework for Marine and Offshore Machinery
36
machinery operating under highly uncertain environment. Quantitative risk assessment is a
formal and systematic risk analysis approach used in quantifying the risks associated with
the operation of an engineering process. Therefore, it is important to establish the link
between QRA and some decision analysis techniques in a formal, systematic and
transparent manner. A brief description of the MCDA techniques applied in these models is
briefly discussed in the ensuing subsections.
2.11.2.1 Fuzzy analytic hierarchy process
Fuzzy analytical hierarchy processing (FAHP) method is an approach that employs the
structuring of criteria of multiple options into a system and subsystem hierarchy of a complex
engineering product like a ship. This includes relative values for all criteria and comparing
alternatives for each particular criterion and further defining the average importance of
alternatives using the concept of FST in a hierarchical analysis. When considering a group
of attributes for evaluation, the main objective is to provide sufficient judgements on the
relative importance of these attributes to ensure that those judgements are made
appropriately (Pillay and Wang, 2003). FAHP modelling is employed in this work to calculate
the weight of each criterion in a simplified and straightforward manner based on pair-wise
comparisons. Given the differences in weights of the risk elements and their contributions
to the failure of the marine and offshore machinery, FAHP can be utilised to solve the
dynamic risk information loss in the hierarchical level of the model, while ensuring the
progression of a smooth risk assessment from the bottom level of each subsystem’s
hierarchy to the goal’s level (failure level).
One paramount advantage of FAHP is its ability to be integrated with other techniques such
as the ER approach in risk assessment. FAHP offers a unique and effective way of
modelling a system’s uncertainties that is different from the conventional AHP. The initial
work on FAHP was made by Laarhoven and Pedrycz (1983). They described fuzzy ratios
by triangular fuzzy numbers (TFN) and computed weights using the logarithmic least square
method. Buckley (1985), who proposed a geometric means to solving fuzzy weight priorities
and performance scores, identified shortcomings in the initial work. Boender et al. (1989)
modified the initial work on normalisation by integrating a regression equation. Cheng
(1996) introduced a robust approach for handling FAHP using TFNs for pair-wise
comparison and the extent analysis method for the synthetic extent values of the pair-wise
comparisons. Zhu et al. (1999) made improvements on the extent analysis theory.
Deng (1999) presented an improved fuzzy-based approach for tackling multi-criteria
analysis problems in a simplified manner and making them more interesting. Lee et al.
(1999) further proposed a novel method based on the stochastic optimisation to achieve
Development of an Efficient Planned Maintenance Framework for Marine and Offshore Machinery
37
global consistency. Leung and Cao (2000) also discussed the consistency issue and
proposed a concept of fuzzy consistency and tolerant deviation. Chou and Liang (2001)
presented a fuzzy multi-criteria decision-making model by combining FAHP and the entropy
concept for shipping company performance evaluation under uncertainty.
Furthermore, Yu (2002) proposed a robust computational programming goal method for
fuzzy priority vectors, while Kuo et al. (2002) developed a decision support system for
locating a convenience store. Arslan and Khisty (2005) proposed a set of “if-then” rules to
select the cognitive comparison made between each alternative. Other details regarding the
application of this method include: the evaluation of services; generation of weight from
interval comparison matrices using the two-stage logarithmic goal programming method; an
algorithm for evaluating naval tactical missile systems; evaluation of machine tool
alternatives with quantitative variables; new product development processes; quality
function deployment; project risk evaluations; computer integrated manufacturing systems
selection; personnel selection problems; selecting wastewater facilities at prefecture level;
evaluating wafer supplier in the semiconductor industry; and supplier selection in washing
machine companies (Kilincci and Onal, 2011), (Cheng et al., 2009), (Gungor et al., 2009),
(Anagnostopoulos et al., 2007), (Ayag and Ozdemir, 2006), (Tuysuz and Kahraman, 2006),
(Wang et al., 2005), (Mikhailov and Tsvetinov, 2004), (Bozdag et al., 2003) and (Kwong and
Bai, 2003).
The conventional AHP method has been widely used and accepted to solve complex multi-
criteria decision making problems, but its major shortcoming is that it uses a scale of one to
nine (1-9), which, in many circumstances, cannot handle uncertainty in comparison of the
attributes and also does not reflect the experts’ imprecise subjective judgements associated
with uncertainty. FST is incorporated into the main steps of AHP to perform a rigorous
analysis using fuzzy ratios instead of the conventional crisp values in AHP. This is to ensure
that uncertainty is reflected in the process of the entire risk assessment from the bottom
level to the goal level.
2.11.2.1.1 Forms of analytic hierarchy process
Decision makers in a variety of industries use different forms of AHP. The two most
commonly and widely used are:
i. The original version of AHP developed by Dr Thomas L. Saaty (Saaty, 1983).
The original AHP version calculates the nth root of the product of the pair-wise
comparison values in each row of the matrices and then normalizes the

Development of an Efficient Planned Maintenance Framework for Marine and Offshore Machinery
38
aforementioned nth root of products to obtain the corresponding weights and
ratings.
ii. The modified AHP version, which normalizes the pair-wise comparison values
within each of the matrices and then averages the value in each row to obtain
the corresponding weights and ratings.
2.11.2.1.2 The geometric mean method (GMM)
The geometric mean method is commonly employed in the AHP to combine the opinions of
different experts when they have equal weightages in forming the group opinion
(Ramanathan et al., 1994). In this procedure, the geometric mean of the values provided
by the experts is entered into the pairwise comparison matrix and then the eigenvector of
the positive reciprocal matrix are computed.
For example, in computing element 𝑖 with element 𝑗, if 𝑒𝑖𝑗1 , 𝑒𝑖𝑗
2 …… 𝑒𝑖𝑗𝑁 are the individual
judgements made by experts 1, 2 ….., N respectively, then under the geometric mean
method, the combined judgement value to be entered in the group pairwise comparison
matrix, according to Saaty (1989) is:
(𝑒𝑖𝑗1 × 𝑒𝑖𝑗
2 × …× 𝑒𝑖𝑗𝑁)
1𝑁⁄ (2.8)
Aczel and Saaty (1983) proved that the geometric mean is consistent and satisfies the four
axioms underlying the AHP theory. One important property of the geometric mean is its
ability to dampen the effect of very high or low values, where such values might bias the
arithmetic mean. In other words, the geometric mean is less affected by extreme values
than the arithmetic mean.
2.11.2.2 Analytic hierarchy process algorithm
A weight can be assigned to each criterion by using established methods such as simple
rating methods or more elaborate methods based on pairwise comparisons. Using the AHP
to calculate the relative importance of each attribute requires a careful review of its
principles and background (Saaty, 1990). When considering a group of attributes for
evaluation, the main objectives of this technique are to provide judgements on the relative
importance of these attributes and to ensure that the judgements are quantified to an extent
that permits quantitative interpretation of the judgement among these attributes (Pillay et
al., 2003a). The quantified judgements on pairs of attributes 𝐴𝑖 and 𝐴𝑗 are represented by
an n-by-n matrix E. The entries 𝑎𝑖𝑗 are defined by the following entry rules.
Rule 1: If 𝑎𝑖𝑗 = α, then 𝑎𝑗𝑖 = 1 𝛼⁄ , α ≠ 0
Rule 2: If 𝐴𝑖 is judged to be of equal relative importance as 𝐴𝑗, then 𝑎𝑖𝑗 = 𝑎𝑗𝑖 = 1.

Development of an Efficient Planned Maintenance Framework for Marine and Offshore Machinery
39
According to above rules, the matrix E has the form as follows:
E =
[
1 𝑎12 ⋯ 𝑎1𝑛1
𝑎12 1 ⋯ 𝑎2𝑛
⋮ ⋮ ⋮ ⋮ 1
𝑎1𝑛
1
𝑎2𝑛 ⋯ 1 ]
where, 𝑖, 𝑗=1, 2, 3..., n and each 𝑎𝑖𝑗 is the relative importance of attribute 𝐴𝑖 to attribute 𝐴𝑗.
Having recorded the quantified judgements of comparisons on pair (𝐴𝑖 , 𝐴𝑗) as the numerical
entry 𝑎𝑖𝑗 in the matrix E, what is left is to assign to the n contingencies 𝐴1, 𝐴2, …, 𝐴𝑛 a set
of numerical weights 𝑤1, 𝑤2, …, 𝑤𝑛 that should reflect the recorded judgements.
In general, the weights 𝑤1, 𝑤2..., 𝑤𝑛 can be calculated (Pillay et al., 2003a) using the following
equation:
𝑤𝑘 = 1
𝑛∑
𝑎𝑘𝑗
∑ 𝑎𝑖𝑗𝑛𝑖=1
𝑛𝑗=1 (𝑘 = 1, 2, 3, . . . , 𝑛) (2.9)
where, 𝑎𝑖𝑗 represents the entry of row 𝑖 and column 𝑗 in a comparison matrix of order 𝑛.
The weight vector of the comparison matrix provides the priority ordering. However, it
cannot ensure the consistency of the pairwise judgements. Hence the AHP provides a
measure of the consistency for the pairwise comparisons by computing a consistency ratio
(CR). The CR informs the decision makers how consistent they have been when making
the pair-wise comparisons (Kunz, 2010). It is designed in such a way that a value greater
than 0.10 indicates an inconsistency in the pair-wise judgements and according to Andersen
et al. (2008), the decision maker should review the pair-wise judgements before proceeding.
Consequently, if the CR is 0.10 or less, the consistency of the pair-wise comparisons is
considered reasonable, and the AHP can continue with the computations of the weight
vectors. A higher number means the decision maker has been less consistent, whereas a
lower number means the decision maker has been more consistent (Kunz, 2010). If the CR
is > 0.10, the decision maker should seriously consider re-evaluating the pair-wise
comparisons. The source(s) of inconsistency must be identified and resolved and the
analysis re-done. The CR value is computed according to the equations (Andersen et al.,
2008).
CR = 𝐶𝐼
𝑅𝐼 (2.10)
CI = 𝜆𝑚𝑎𝑥 − 𝑛
𝑛−1 (2.11)
𝜆𝑚𝑎𝑥 = ∑ [(∑ 𝑤𝑘𝑎𝑗𝑘)/𝑤𝑗
𝑛𝑘=1 ]𝑛
𝑗=1
𝑛 (2.12)
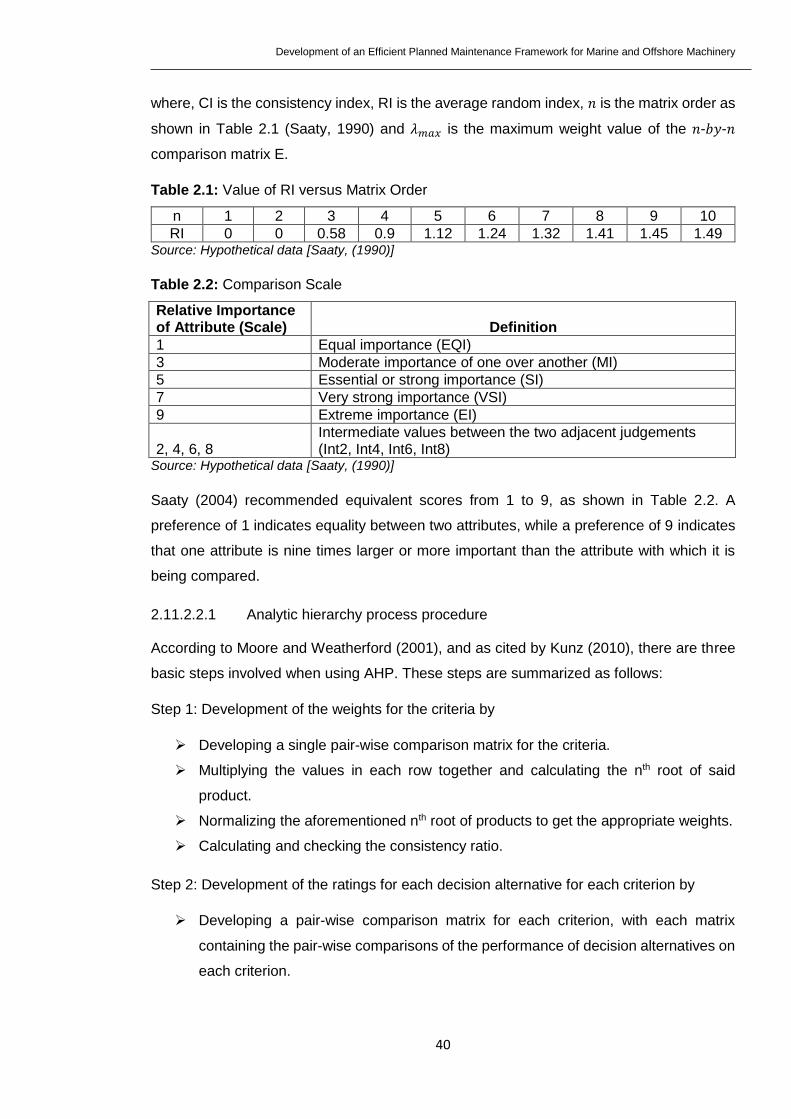
Development of an Efficient Planned Maintenance Framework for Marine and Offshore Machinery
40
where, CI is the consistency index, RI is the average random index, 𝑛 is the matrix order as
shown in Table 2.1 (Saaty, 1990) and 𝜆𝑚𝑎𝑥 is the maximum weight value of the 𝑛-𝑏𝑦-𝑛
comparison matrix E.
Table 2.1: Value of RI versus Matrix Order
n 1 2 3 4 5 6 7 8 9 10
RI 0 0 0.58 0.9 1.12 1.24 1.32 1.41 1.45 1.49 Source: Hypothetical data [Saaty, (1990)]
Table 2.2: Comparison Scale
Relative Importance of Attribute (Scale)
Definition
1 Equal importance (EQI)
3 Moderate importance of one over another (MI)
5 Essential or strong importance (SI)
7 Very strong importance (VSI)
9 Extreme importance (EI)
2, 4, 6, 8
Intermediate values between the two adjacent judgements (Int2, Int4, Int6, Int8)
Source: Hypothetical data [Saaty, (1990)]
Saaty (2004) recommended equivalent scores from 1 to 9, as shown in Table 2.2. A
preference of 1 indicates equality between two attributes, while a preference of 9 indicates
that one attribute is nine times larger or more important than the attribute with which it is
being compared.
2.11.2.2.1 Analytic hierarchy process procedure
According to Moore and Weatherford (2001), and as cited by Kunz (2010), there are three
basic steps involved when using AHP. These steps are summarized as follows:
Step 1: Development of the weights for the criteria by
Developing a single pair-wise comparison matrix for the criteria.
Multiplying the values in each row together and calculating the nth root of said
product.
Normalizing the aforementioned nth root of products to get the appropriate weights.
Calculating and checking the consistency ratio.
Step 2: Development of the ratings for each decision alternative for each criterion by
Developing a pair-wise comparison matrix for each criterion, with each matrix
containing the pair-wise comparisons of the performance of decision alternatives on
each criterion.
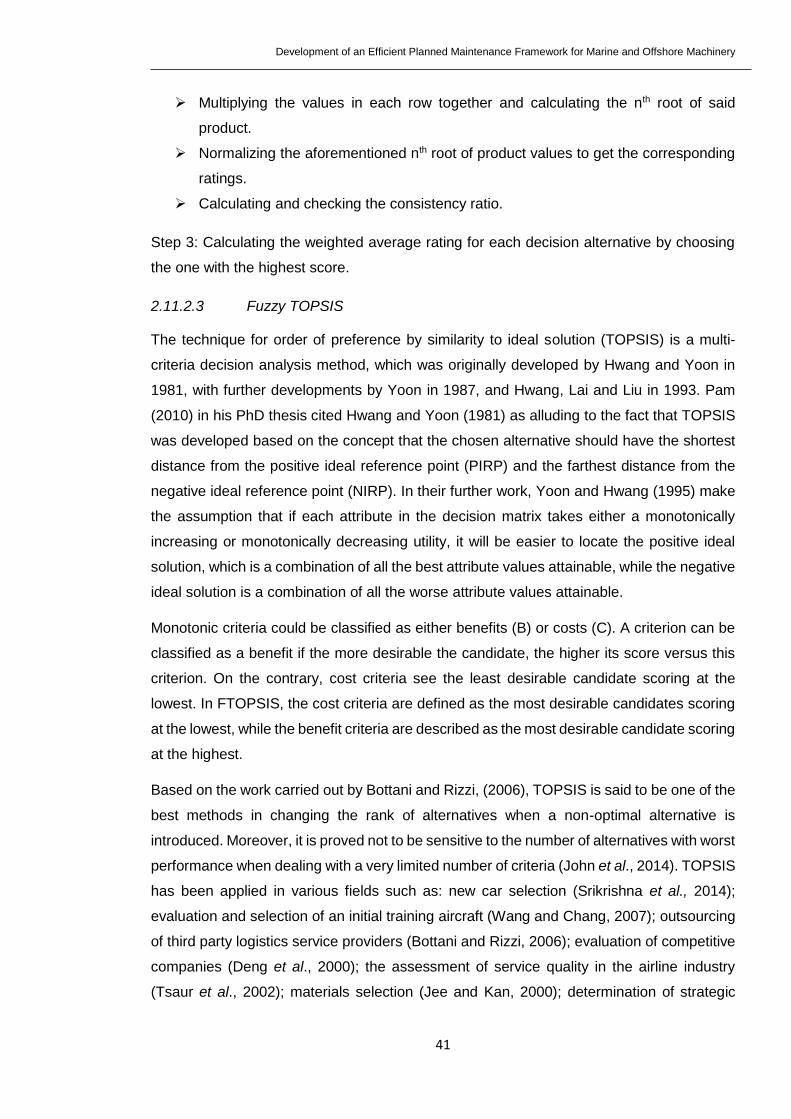
Development of an Efficient Planned Maintenance Framework for Marine and Offshore Machinery
41
Multiplying the values in each row together and calculating the nth root of said
product.
Normalizing the aforementioned nth root of product values to get the corresponding
ratings.
Calculating and checking the consistency ratio.
Step 3: Calculating the weighted average rating for each decision alternative by choosing
the one with the highest score.
2.11.2.3 Fuzzy TOPSIS
The technique for order of preference by similarity to ideal solution (TOPSIS) is a multi-
criteria decision analysis method, which was originally developed by Hwang and Yoon in
1981, with further developments by Yoon in 1987, and Hwang, Lai and Liu in 1993. Pam
(2010) in his PhD thesis cited Hwang and Yoon (1981) as alluding to the fact that TOPSIS
was developed based on the concept that the chosen alternative should have the shortest
distance from the positive ideal reference point (PIRP) and the farthest distance from the
negative ideal reference point (NIRP). In their further work, Yoon and Hwang (1995) make
the assumption that if each attribute in the decision matrix takes either a monotonically
increasing or monotonically decreasing utility, it will be easier to locate the positive ideal
solution, which is a combination of all the best attribute values attainable, while the negative
ideal solution is a combination of all the worse attribute values attainable.
Monotonic criteria could be classified as either benefits (B) or costs (C). A criterion can be
classified as a benefit if the more desirable the candidate, the higher its score versus this
criterion. On the contrary, cost criteria see the least desirable candidate scoring at the
lowest. In FTOPSIS, the cost criteria are defined as the most desirable candidates scoring
at the lowest, while the benefit criteria are described as the most desirable candidate scoring
at the highest.
Based on the work carried out by Bottani and Rizzi, (2006), TOPSIS is said to be one of the
best methods in changing the rank of alternatives when a non-optimal alternative is
introduced. Moreover, it is proved not to be sensitive to the number of alternatives with worst
performance when dealing with a very limited number of criteria (John et al., 2014). TOPSIS
has been applied in various fields such as: new car selection (Srikrishna et al., 2014);
evaluation and selection of an initial training aircraft (Wang and Chang, 2007); outsourcing
of third party logistics service providers (Bottani and Rizzi, 2006); evaluation of competitive
companies (Deng et al., 2000); the assessment of service quality in the airline industry
(Tsaur et al., 2002); materials selection (Jee and Kan, 2000); determination of strategic

Development of an Efficient Planned Maintenance Framework for Marine and Offshore Machinery
42
priorities by SWOT analysis (Ghorbani et al., 2011); and service selection (Lo et al., 2011
and Chao et al., 2010).
According to Sodhi and Prabhakar (2012), the FTOPSIS method can help in objective and
systematic evaluation of alternatives on multiple criteria. It has been demonstrated to be a
robust tool for handling complex and real-life problems for collaborative modelling and
decision-making processes in an uncertain environment. A fuzzy approach to TOPSIS is
useful because it assigns the relative importance of attributes using fuzzy numbers instead
of precise numbers. Linguistic preferences can easily be converted to fuzzy numbers and
TOPSIS allows for the use of these fuzzy numbers in the calculation (Pam, 2013).
Other advantages of the FTOPSIS technique as highlighted in Bottani and Rizzi (2006),
Olson (2004), and Deng et al, (2000) include the fact that:
1. The logic is rational and understandable.
2. Computation processes are straightforward.
3. The concept permits the pursuit of best alternatives for each criterion depicted in a
simple mathematical form.
4. It allows the straight linguistic definition of weights and ratings under each criterion,
without the need of cumbersome pairwise comparisons and the risk of
inconsistencies.
5. The obtained weights of evaluation criteria are incorporated into the comparison
procedures.
The triangular fuzzy numbers are applied in the FTOPSIS used in this study. This is because
it is intuitively easy for the decision-makers to use and calculate (Dagdeviren et al., 2009).
Secondly, modelling using triangular fuzzy numbers has proven to be an effective way to
formulate the decision making problem where the information is subjective and inaccurate
(Dagdeviren et al., 2009).
While the uncertainty issue is tackled by means of fuzzy logic, the application of TOPSIS
makes it possible to appraise the distances of each decision option from the positive ideal
solution and the negative ideal solution. The capability and efficiency of FTOPSIS in
handling complex engineering solutions, simultaneously considering positive and negative
ideal solutions, having flexibility in computational analysis, and providing systematic and
logical results’ evaluation, make it useful for strategic decisions to select the most ideal
maintenance strategy for marine and offshore machinery. Moreover, the way linguistic
ratings and weights are given is very straightforward. A Fuzzy-TOPSIS approach has been
applied in this study in order to support the evaluation of decision-making criteria and
attributes.

Development of an Efficient Planned Maintenance Framework for Marine and Offshore Machinery
43
2.11.2.4 Evidential Reasoning theory
The mathematical theory of evidence was first generated by Dempster in the 1960s and
later extended and refined by Shafer in the 1970s (Dempster, 1968a), (Shafer, 1976). The
evidence theory was initially developed in the early 1990s to deal with multi-attribute
decision making problems under uncertainty and was used to design a novel belief decision
matrix that can create a unique attribute aggregation process based on the Dempster rule
of combination (Fu and Yang, 2012), (Liu and Gong, 2011). The theory is widely referred to
as Dempster-Shafer (D-S) theory.
The D-S evidence theory found a significant sister relationship with the Bayesian probability
network (BPN) theory in the sense that, given new evidence, both can update subjective
beliefs in a rational manner (Yang, et al., 2006), (Shafer, 1976), (Dempster, 1968b).
However, the difference between the two theories lies in the fact that the evidence theory
has the capability of grouping evidence and also of dealing with ignorance in the evidence
grouping process (Liu and Gong, 2011). The D-S theory was originally used for information
aggregation in a complex expert system. For example, a computer system that emulates
the decision-making ability of a human expert as an approximate reasoning tool (Lopez de
Mantaras, 1990), (Buchanan and Shortliffe, 1984). Subsequently, it has been used in
system design and operations to support decision-making under uncertainty (Yager, 1992).
There are a number of studies where ER is used. For example, Riahi (2010) used a fuzzy
evidential reasoning (FER) to evaluate a seafarer’s reliability; Wang and Elhang (2007)
used fuzzy group decision making for bridge risk assessment; Zeng et al. (2006) applied an
aggregative risk assessment model for information technology project development; Yang
et al. (2005) carried out risk analysis of container supply chains using discrete fuzzy sets
and an ER approach using fuzzy set theories and ER specifically on risk assessment and
decision making; and Liu et al. (2003) used the fuzzy rule-based ER approach to analyse
the safety of an engineering system with various types of uncertainties.
While MCDM is described using a decision matrix, the ER approach applies an extended
decision matrix, in which each attribute of an alternative is described by a distributed
assessment using a belief structure (Xu et al., 2001). Each criterion is assigned with belief
degrees on several linguistic evaluation grades to assess the subjective uncertainties and
ambiguities associated with both quantitative and qualitative criteria. Incompleteness (or
ignorance) and vagueness (or fuzziness) are among the most common uncertainties in
decision analysis. Subjective judgments may be used to differentiate one alternative from
another on qualitative attributes. To evaluate the quality of the operation of equipment, for
example, typical judgments may be that “the condition of that equipment is poor, good, or

Development of an Efficient Planned Maintenance Framework for Marine and Offshore Machinery
44
very good to certain degrees.” In such judgments, poor, good, and very good represent
distinctive evaluation grades. In equipment evaluation problems, such as in a ship
propulsion engine, a set of evaluation grades is defined by:
E = {𝑝𝑜𝑜𝑟 (𝛽1) 𝑣𝑒𝑟𝑦 𝑝𝑜𝑜𝑟 (𝛽2) 𝑎𝑣𝑒𝑟𝑎𝑔𝑒 (𝛽3) 𝑔𝑜𝑜𝑑 (𝛽4) 𝑣𝑒𝑟𝑦 𝑔𝑜𝑜𝑑 (𝛽5)}
where, 𝛽1, 𝛽2, 𝛽3, 𝛽4, and 𝛽5 stand for belief degrees.
The operational condition of the engine is a broad technical idea that is not easy to assess
directly. The detailed components of the engine, such as piston, connecting rod, and
crankshaft, etc. need to be considered separately to simply the assessment. If a detailed
component is still too abstract to assess directly, it may be further broken down to more
detailed sub-components. For instance, the piston component (y) may be measured by
examining the condition of rings (B1), pin (B2), and skirt (B3), which can be directly assessed
and therefore referred to as basic attributes. Assessment attributes often constitute a
multilevel hierarchy (Yang and Xu, 2002).
In hierarchical assessment, a high level attribute is assessed through associated lower level
attributes. For example, if the ring, pin, and skirt of the engine piston are all assessed to be
exactly good, then its piston should also be good. According to Yang and Xu (2002), when
evaluating qualitative attributes, uncertain judgments can be used. For example, in
assessment of the engine piston, assessors may be:
1. 30% sure that its ring is at average condition and 60% sure that it is good.
2. Absolutely sure that its pin is good.
3. 50% sure that its skirt is good and 50% sure that it is very good.
In the above assessments, 30%, 50%, 60%, and 100% (absolutely sure) are referred to as
degrees of belief and can be used in decimal format as 0.3, 0.5, 0.6, and 1, respectively.
Assessment (1) is incomplete as the total degree of belief is 0.9 (0.3 + 0.6).
Assessments (2) and (3) are complete.
The missing 0.1 in assessment (1) represents the degree of ignorance or
uncertainty.
Difficulty can be encountered as to how to generate an overall assessment about the engine
piston by aggregating the above three judgments in a rational manner. The ER approach
provides a means for dealing with such an aggregation problem. The basic ER applications
and algorithm are discussed in the next two subsections.
2.11.2.4.1 Evidential reasoning algorithm
ER is one of the many multiple criteria decision analysis (MCDA) methods, such as
analytical hierarchy process (AHP), TOPSIS, elimination and choice expressing reality

Development of an Efficient Planned Maintenance Framework for Marine and Offshore Machinery
45
(ELECTRE), and preference ranking organization method for enrichment evaluation
(PROMETHEE). ER is applied to deal with MCDA problems for aggregating multiple criteria
based on belief degree matrix (BDM) and D-S theory.
A belief degree represents the strength to which an answer is believed to be true. It must
be equal to or less than 100% or it can be described as the degree of expectation that, given
an alternative, it will yield an anticipated outcome on a particular criterion. The use of
individual belief degrees depends on the decision makers’ expertise, knowledge of the
subject matter and level of experience regarding the operations of the system. The
justification for the use of belief degrees is as a result of the fact that human decision making
involves ambiguity, uncertainty, and imprecision where individuals make judgements in
probabilistic terms aided by their knowledge.
For instance, let S represent a set of five condition monitoring expressions that are
synthesized by two subsets, 𝑆1 and 𝑆2 from two different assessors. Then, 𝑆, 𝑆1 and 𝑆2 can
be expressed independently as follows:
𝑆 = {𝛽1 "Very low", β2"Low", β3"𝑀𝑒𝑑𝑖𝑢𝑚", 𝛽4 "High", 𝛽5 "𝑉𝑒𝑟𝑦 ℎ𝑖𝑔ℎ"}
𝑆1 = {𝛽11 "Very low", 𝛽1
2"Low", 𝛽13"𝑀𝑒𝑑𝑖𝑢𝑚", 𝛽1
4 "High", 𝛽15 "𝑉𝑒𝑟𝑦 ℎ𝑖𝑔ℎ"}
𝑆2 = {𝛽21 "Very low", 𝛽2
2"Low", 𝛽23"𝑀𝑒𝑑𝑖𝑢𝑚", 𝛽2
4 "High", 𝛽25 "𝑉𝑒𝑟𝑦 ℎ𝑖𝑔ℎ"}
where “Very low”, “Low”, “Medium”, “High”, and “Very high” (the condition monitoring
expression) are assessed with their respective degrees of belief.
If the normalised relative weights of the two assessors in the evaluation of the condition
monitoring process are given by 𝑤1 and 𝑤2 (𝑤1 + 𝑤2 = 1), then 𝑤1 and 𝑤2 can be estimated
by using established methods such as a simple rating method or based on pair-wise
comparisons (Yang et al., 2001).
Suppose 𝑀1𝑚 and 𝑀2
𝑚 (m = 1, 2, 3, 4 or 5) are individual degrees to which the subsets 𝑆1
and 𝑆2 support the hypothesis that the condition monitoring evaluation is confirmed to the
five evaluation grades and condition monitoring expressions. Then, 𝑀1𝑚 and 𝑀2
𝑚 can be
derived as follows:
𝑀1𝑚=𝑤1𝛽1
𝑚 ; 𝑀2𝑚= 𝑤2𝛽2
𝑚 (2.13)
where m = 1, 2, 3, 4, and 5 respectively.

Development of an Efficient Planned Maintenance Framework for Marine and Offshore Machinery
46
𝑀11=𝑤1𝛽1
1 ; 𝑀2
1=𝑤2𝛽11,
𝑀12=𝑤1𝛽1
2 ; 𝑀22=𝑤2𝛽1
2,
𝑀13=𝑤1𝛽1
3 ; 𝑀23=𝑤2𝛽1
3,
𝑀14=𝑤1𝛽1
4 ; 𝑀24=𝑤2𝛽1
4,
𝑀15=𝑤1𝛽1
5 ; 𝑀25=𝑤2𝛽1
5
Suppose 𝐻1 and 𝐻2 are the individual remaining belief values unassigned, then 𝐻1 and 𝐻2
can be obtained as follows (Yang and Xu, 2002):
H1 = �̅�1 + �̃�1 ; H2 = �̅�2 + �̃�2 (2.14)
where �̅�𝑛(𝑛 = 1 𝑜𝑟 2) represents the degree to which the other assessor can play a
significant role in the assessment.
�̃�𝑛(𝑛 = 1 𝑜𝑟 2), causes the likely incompleteness in subsets 𝑆1 and 𝑆2. 𝐻𝑛 (𝑛 =
1 𝑜𝑟 2) 𝑎𝑛𝑑 �̃�𝑛(𝑛 = 1 𝑜𝑟 2) can be described as follows:
�̅�1 = 1-𝑤1 = 𝑤2 ; �̅�2 = 1-𝑤2 = 𝑤1
�̃�1 = 𝑤1(1 − ∑ 𝛽1𝑚5
𝑚=1 ) = 𝑤1[1 − (𝛽11 + 𝛽1
2 + 𝛽13 + 𝛽1
4 + 𝛽15)] (2.15)
�̃�2 = 𝑤2(1 − ∑ 𝛽2𝑚5
𝑚=1 ) = 𝑤1[1 − (𝛽21 + 𝛽2
2 + 𝛽32 + 𝛽4
2 + 𝛽25)] (2.16)
Suppose 𝛽𝑚′ (𝑚 = 1, 2, 3, 4 𝑜𝑟 5) represents the non-normalised degree to which the five
condition monitoring expressions are confirmed as a result of the synthesis of the
judgements obtained by assessors 1 and 2 respectively. Suppose 𝐻𝑈′ represents the non-
normalised remaining belief unassigned after the commitment of belief to the five condition
monitoring expressions because of the synthesis of the judgements obtained from
assessors 1 and 2. The ER algorithm can be derived as follows (Yang and Xu, 2002):
𝛽𝑚′= 𝐾(𝑀1
𝑚𝑀2𝑚 + 𝑀1
𝑚𝐻2 + 𝐻1𝑀2𝑚) (2.17)
𝐻𝑈′ = 𝐾(𝐻1𝐻2) (2.18)
�̃�𝑈′ = 𝐾(�̃�1�̃�2 + �̃�1�̅�2 + �̅�1�̃�2) (2.19)
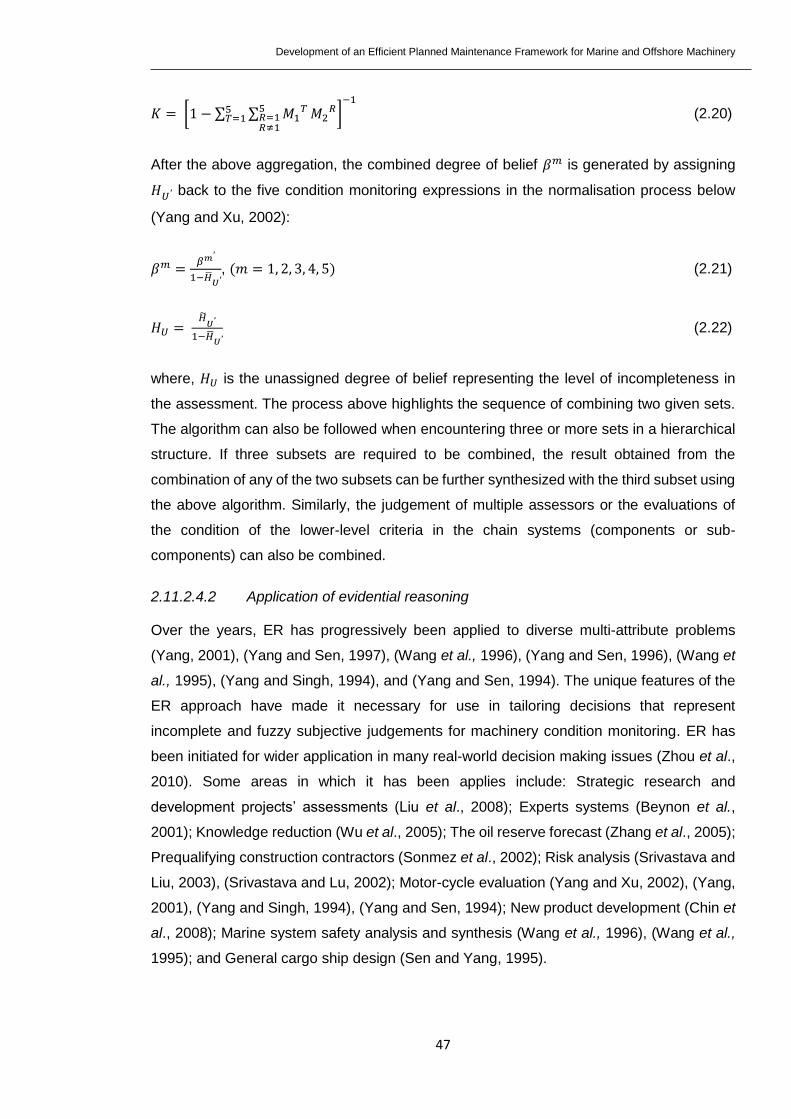
Development of an Efficient Planned Maintenance Framework for Marine and Offshore Machinery
47
𝐾 = [1 − ∑ ∑ 𝑀1𝑇5
𝑅=1𝑅≠1
5𝑇=1 𝑀2
𝑅]−1
(2.20)
After the above aggregation, the combined degree of belief 𝛽𝑚 is generated by assigning
𝐻𝑈′ back to the five condition monitoring expressions in the normalisation process below
(Yang and Xu, 2002):
𝛽𝑚 =𝛽𝑚′
1−�̅�𝑈′
, (𝑚 = 1, 2, 3, 4, 5) (2.21)
𝐻𝑈 = �̃�
𝑈′
1−�̅�𝑈′
(2.22)
where, 𝐻𝑈 is the unassigned degree of belief representing the level of incompleteness in
the assessment. The process above highlights the sequence of combining two given sets.
The algorithm can also be followed when encountering three or more sets in a hierarchical
structure. If three subsets are required to be combined, the result obtained from the
combination of any of the two subsets can be further synthesized with the third subset using
the above algorithm. Similarly, the judgement of multiple assessors or the evaluations of
the condition of the lower-level criteria in the chain systems (components or sub-
components) can also be combined.
2.11.2.4.2 Application of evidential reasoning
Over the years, ER has progressively been applied to diverse multi-attribute problems
(Yang, 2001), (Yang and Sen, 1997), (Wang et al., 1996), (Yang and Sen, 1996), (Wang et
al., 1995), (Yang and Singh, 1994), and (Yang and Sen, 1994). The unique features of the
ER approach have made it necessary for use in tailoring decisions that represent
incomplete and fuzzy subjective judgements for machinery condition monitoring. ER has
been initiated for wider application in many real-world decision making issues (Zhou et al.,
2010). Some areas in which it has been applies include: Strategic research and
development projects’ assessments (Liu et al., 2008); Experts systems (Beynon et al.,
2001); Knowledge reduction (Wu et al., 2005); The oil reserve forecast (Zhang et al., 2005);
Prequalifying construction contractors (Sonmez et al., 2002); Risk analysis (Srivastava and
Liu, 2003), (Srivastava and Lu, 2002); Motor-cycle evaluation (Yang and Xu, 2002), (Yang,
2001), (Yang and Singh, 1994), (Yang and Sen, 1994); New product development (Chin et
al., 2008); Marine system safety analysis and synthesis (Wang et al., 1996), (Wang et al.,
1995); and General cargo ship design (Sen and Yang, 1995).

Development of an Efficient Planned Maintenance Framework for Marine and Offshore Machinery
48
Riahi (2010) believes that in real-world decision making, ER applications have been found
to have the following advantages:
Offers a rational and reproducible methodology to aggregate data in a hierarchical
evaluation process.
Capability to provide its users with greater flexibility by allowing them to express
their judgement in a subjective and quantitative manner.
Capability to accept or represent the uncertainty and risk that is inherent in decision-
making.
Great effectiveness in processing and obtaining assessment outputs using mature
computing software called Intelligent Decision System (IDS).
Capability to handle incomplete, uncertain, and vague data as well as complete and
precise data.
2.11.2.5 Analysis of multiple attribute group decision making methods
MADM methods are designed to evaluate and select the desired alternative from a set of
alternatives, which are characterised by multiple criteria. If more than one person is
interested in the same MADM problem, it then becomes a multiple attribute group decision
making (MAGDM) problem (Yang et al., 2014). For both MADM and MAGDM problems,
consistency among the preference relations is crucial to the result of the final decision. Guo
(2013) perceives MAGDM as one of the most common activities in modern society,
involving the selection of the optimal option, from a finite set of alternatives with respect to
a collection of predefined criteria, by a group of experts with a high collective knowledge
level on these particular criteria.
Moreover, as stated in Bozóki (2008), the determination of attribute weight is also a key
issue to be considered when using the MAGDM approach. In many decision cases, some
attributes are considered to be more important in the experts’ judgment than the others.
However, for these vital attributes, the preference relation provided by experts may be quite
similar for all alternatives. Even for the attribute with the highest weight, the degree of
influence on the final decision could be very small. Consequently, Wang and Fan (2007)
regard this kind of attribute as being unimportant to the final decision. Thus, during the
multiple attribute group decision process, the following five guidelines should be noted:
1. Different assessment types need to be considered concurrently.
2. Experts' preference relations that have been provided need to be consistent.
3. Diverse expert’s opinions need to be taken into consideration.
4. The weight of each attribute needs to be determined.

Development of an Efficient Planned Maintenance Framework for Marine and Offshore Machinery
49
5. All alternatives need to be carefully ranked.
MADM is an algorithm deployed to solve problems involving selection from a list of
alternatives. It specifies how criteria or attribute information can be processed in order to
arrive at a choice suitable for investment. MADM methods generally require comparisons
of criteria with respect to alternatives for efficient trade-offs. In a MADM process, each
decision table (also called decision matrix) has four main parts; these can be summarised
as follows:
Alternatives.
Criteria or Attributes.
Weight of experts or relative importance of each attribute.
Performance measure of alternatives with respect to criteria.
Based on the analysis of MCDA methods, the basic information in a MADM model can be
represented in the matrix as presented in (2.23).
𝐶1 𝐶2 ⋯ 𝐶𝑚 (𝑤1 𝑤2 ⋯ 𝑤𝑚)
𝑍 =
𝐴1
𝐴2
⋮𝐴𝑛 [
𝑦1,1 𝑦1,2
⋯ 𝑦1,𝑚
𝑦2,1 𝑦2,2⋯ 𝑦2,𝑚
⋮𝑦𝑛,1
⋮𝑦𝑛,2
⋮⋯
⋮𝑦𝑛,𝑚
] (2.23)
where 𝐴𝑖 (𝑖 = 1, 2, …𝑛) is the 𝑖𝑡ℎ alternative; 𝐶𝑖 (𝑖 = 1, 2, …𝑚) is the 𝑖𝑡ℎ set of criterion with
which each alternative’s performances can be measured; 𝑦𝑖.𝑗 (𝑖 = 1, 2, …𝑛); (𝑗 = 1, 2, …𝑚)
is the measure of performance of the 𝑖𝑡ℎ alternative with respect to the 𝑚𝑡ℎ criterion; and
𝑤𝑗 (𝑗 = 1, 2, …𝑚) is the 𝑗𝑡ℎ criterion weight. It is important to stress here that all the elements
in the decision matrix must be normalised to the same units, so that all the possible
attributes in the decision problem can be dealt with easily to eliminate any computational
difficulty.
There are four means of normalisation in a MADM problem (Lavasani et al., 2012). The two
most popular methods are summarised as follows:
Linear Normalisation: This method divides the rating of 𝑛 attribute by its maximum
value. Usually, the normalised value of 𝑝𝑖,𝑗 can be obtained using Equation 2.24.
𝑝𝑖,𝑗 = 𝑦𝑖,𝑗
𝑦𝑗∗ , 𝑖 = 1, 2, …𝑚 (2.24)
where 𝑦𝑗∗ is the maximum value of 𝑦𝑖,𝑗 . 𝑝𝑖.𝑗, values range between 0 to 1 (0 ≤ 𝑝𝑖,𝑗 ≤ 1).

Development of an Efficient Planned Maintenance Framework for Marine and Offshore Machinery
50
Vector normalisation: This method divides the ratings of each attribute by its means
square, so that each normalised rating of 𝑦𝑖,𝑗 can be obtained by Equation 2.25.
𝑝𝑖,𝑗 = 𝑦𝑖,𝑗
√∑ 𝑦𝑖,𝑗2𝑛
𝑖=1
, 𝑖 = 1, 2, …𝑛; 𝑗 = 1, 2, …𝑚 (2.25)
Both Equations 2.24 and 2.25 are used for cost and benefit criteria respectively. Normally,
an alternative in a MADM problem is often described using qualitative variables expressed
by decision makers. However, when no criteria evidence or information is available, the
preferred approach is to use fuzzy set theory, which has the capability of handling such a
situation under varying constraints (John et al., 2014).
One of the theoretical approaches to preference relations used for MADM problems is fuzzy
preference relations. The majority of real-life complex problems have fuzzy information
about the alternatives with respect to criteria, and it is usually difficult for crisp numerical
values to be provided by the subjective opinions of decision makers due to their inadequate
knowledge, and the intrinsic complexity and uncertainty within the decision-making
environment. The Fuzzy Multiple Attribute Decision Making (FMADM) technique can then
be used to handle these complex decision making problems, which are incomplete and
unquantifiable. FMADM is an attractive approach, as it is able to actualise decision-making
processes for complex equipment that has uncertainty in its operational procedures.
Hypotheses, approximations and judgments of experts are very often required in studies
involving complex machinery, in order to handle the imprecision and vagueness associated
with making strategic decisions about the operations of these machinery under uncertain
conditions. Obviously, criteria values information is presented in the form of linguistic
variables, which are generally calibrated from fuzzy scales. According to Yang et al. (2011),
the calibration of this information from fuzzy scales is due to the fact that fuzzy logic provides
the needed flexibility to represent vague information that results from a lack of data or
knowledge of the piece of equipment under investigation. Therefore, there is a need for a
user-friendly fuzzy decision support algorithm that can guide effective decisions in a
simplified manner.
A FMCDM problem can be defined as follows:
Let 𝐴 = {𝐴𝑖, for 𝑖 = 1, 2, 3..., m} be a (finite) set of decision alternatives and G = {𝑔𝑗, for j =
1, 2, 3…, n} be a (finite) set of goals according to which the desirability of an action is judged.
Determine the optimal alternative 𝐴+ with the highest degree of desirability with respect to
all relevant goals 𝑔𝑗 (Zimmermann, 1991).
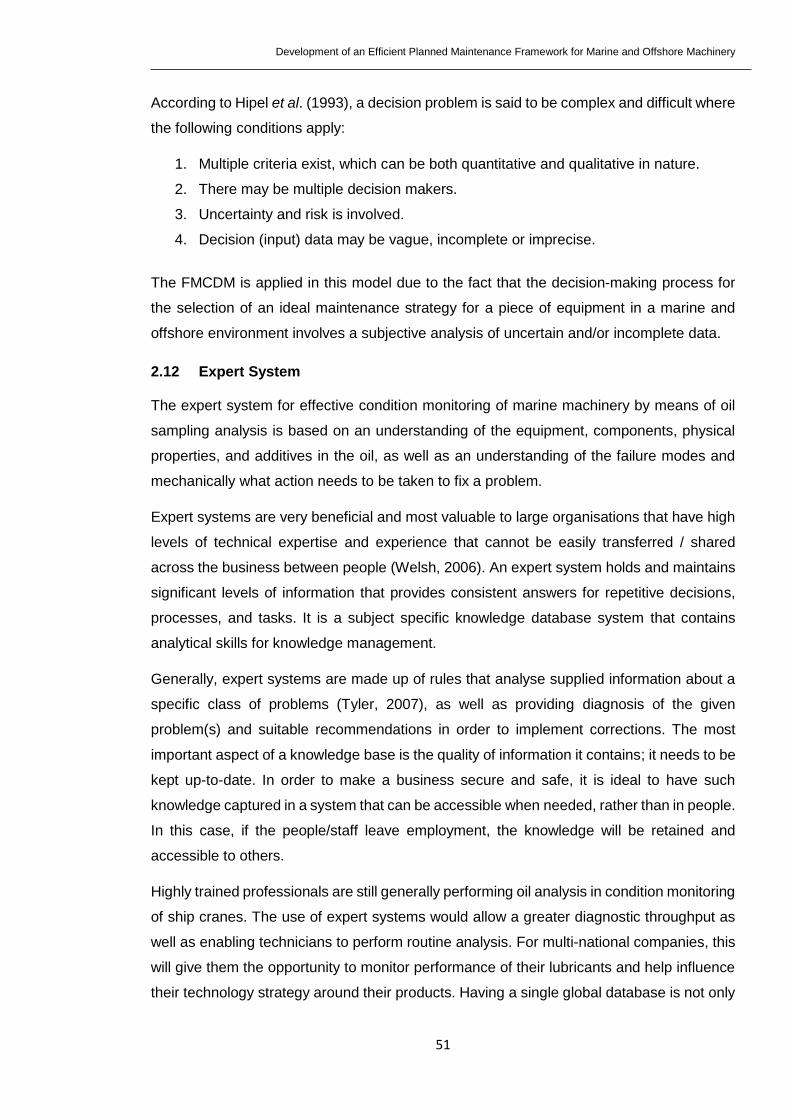
Development of an Efficient Planned Maintenance Framework for Marine and Offshore Machinery
51
According to Hipel et al. (1993), a decision problem is said to be complex and difficult where
the following conditions apply:
1. Multiple criteria exist, which can be both quantitative and qualitative in nature.
2. There may be multiple decision makers.
3. Uncertainty and risk is involved.
4. Decision (input) data may be vague, incomplete or imprecise.
The FMCDM is applied in this model due to the fact that the decision-making process for
the selection of an ideal maintenance strategy for a piece of equipment in a marine and
offshore environment involves a subjective analysis of uncertain and/or incomplete data.
2.12 Expert System
The expert system for effective condition monitoring of marine machinery by means of oil
sampling analysis is based on an understanding of the equipment, components, physical
properties, and additives in the oil, as well as an understanding of the failure modes and
mechanically what action needs to be taken to fix a problem.
Expert systems are very beneficial and most valuable to large organisations that have high
levels of technical expertise and experience that cannot be easily transferred / shared
across the business between people (Welsh, 2006). An expert system holds and maintains
significant levels of information that provides consistent answers for repetitive decisions,
processes, and tasks. It is a subject specific knowledge database system that contains
analytical skills for knowledge management.
Generally, expert systems are made up of rules that analyse supplied information about a
specific class of problems (Tyler, 2007), as well as providing diagnosis of the given
problem(s) and suitable recommendations in order to implement corrections. The most
important aspect of a knowledge base is the quality of information it contains; it needs to be
kept up-to-date. In order to make a business secure and safe, it is ideal to have such
knowledge captured in a system that can be accessible when needed, rather than in people.
In this case, if the people/staff leave employment, the knowledge will be retained and
accessible to others.
Highly trained professionals are still generally performing oil analysis in condition monitoring
of ship cranes. The use of expert systems would allow a greater diagnostic throughput as
well as enabling technicians to perform routine analysis. For multi-national companies, this
will give them the opportunity to monitor performance of their lubricants and help influence
their technology strategy around their products. Having a single global database is not only

Development of an Efficient Planned Maintenance Framework for Marine and Offshore Machinery
52
beneficial to achieve global business objectives but also enables the company to
benchmark performance of products and applications. This therefore puts them in a very
strong position when discussing how good their product is with customers and original
equipment manufacturers (OEM). Furthermore, the expert system possesses great
potential value for business for both laboratory and on-site maintenance operations.
2.12.1 Performance Thresholds
Using manufacturers’ established limits and defining alerts as thresholds for the crane’s
performance can create effectively monitoring of the condition of the ship crane. This
involves the collection and monitoring of data from the crane at each sample interval and
comparing the trend against set thresholds. It is worth noting that ignoring limits or trends
can have a significant impact on business performance and in some cases may invalidate
the crane warranties.
Crucially, the alert limits are there to notify the responsible person that values related to
precursory failure symptoms have changed in a way that is not normal – i.e. that are
statistically remarkable (Noria Corporation, 2003). This does not necessarily mean that a
failure is in progress, nor necessarily imminent, but that there has been unusual change.
The person in charge should be able to understand the root cause of the change and then
perform a risk analysis.
2.12.2 Fixed Limits
A fixed limit evaluates a simple predetermined criterion (pass or fail) for each component.
The drawback to this type of technique is that it does not account for different contributing
factors. For example, there are many differently sized and shaped gearboxes. Some
gearboxes are lightly loaded and at constant speed, which would lend itself to a low wear
rate. Such a gearbox might be in serious trouble if the iron (Fe) level were to reach 200 part
per million (ppm). On the other side, there may be a low speed, reversing, and heavily
loaded gearbox that has not had less than 500 ppm of iron (Fe) in its oil since it was last
tested at the assembly plant.
2.12.3 Absolute Alarm Limit
These are limits based on manufacturers’ recommendation. These alarms generally define
the working ranges or condemnation limits and are most applicable to lubricant and
contamination conditions. Extensive research is normally carried out to arrive at these limits,
thus providing a good starting point for any analysis program. An absolute alarms limit is
vital when warranties on the new equipment are of greater concern (Bots, 2014).

Development of an Efficient Planned Maintenance Framework for Marine and Offshore Machinery
53
2.12.4. Trend (statistical) Alarm Limit
Manufacturers’ guidelines for alarm limits or general standards are extremely poor and
lacking in that they are based on average operational and performance situations, which
may not precisely reflect the definite conditions of a specific machine. This is predominantly
applicable to machine condition. Trend alarm limits are based on gathering a small sampling
of data from equipment, analysing the distribution of that data, and using this trending
characterization to set specific alarm limits (Bots, 2014). Statistical trend analysis allows the
identification of the equipment in greatest need of attention, thus allocating maintenance in
an efficient way. With sufficient historical data, reliable alarm limits can be established and
maintained by statistical analysis.
2.12.5 Combination of Absolute and Statistical Alarm Limits
Effective oil analysis management relies on the combination of both types of alarm limits.
The following illustration is an example of the alarm combination. The condemnation limit is
the absolute alarm. Statistical trending, taking into account variability based on the
sampling, contamination, make-up oil etc. will develop the standard deviations. Departure
from this normal variability signals that real problems are taking place. This is the earliest
possible time to take action. Neglecting this, as the trend approaches its warning limit, action
such as changing or cleaning the oil, or inspection of the unit is required (Bots, 2014).
The idealized graph shown in Figure 2.6 is an example of how absolute and trend line
alarms are used together. The test used could be on iron content, viscosity, or other
parameters. The normal result variability range takes into account minor variations caused
by analytical accuracy, sample homogeneity, etc.
Figure 2.6: Absolute and Statistical Alarms Source: Bently Tribology Services (n.d)

Development of an Efficient Planned Maintenance Framework for Marine and Offshore Machinery
54
2.12.6 Upper and Lower Limits
The upper limit is the value that indicates the highest level of quality acceptable for products
or services, while the lower limit is the value that indicates the lowest level of quality
acceptable for products or services. Both the upper control limit and the lower control limit
are used in conjunction to create the range of variability for quality specifications, thus
enabling experts within an organisation to provide the top level of excellence by adhering
to the established guidelines.
Analysts who are familiar with the lubricants, machines, and historical problems with general
reliability goals (Fitch, 1998) set the upper and the lower limits. A population mean and
associated standard deviation are generated from the available data. The data from a
sample is compared to the mean of the population. If the result exceeds two standard
deviations, the value is considered in critical alarm as it is higher (i.e. upper), or lower as
the case may be, than 95 percent of the population. Should the value exceed three standard
deviations, it is a critical situation indeed, as the value exceeds the 99th percentile of the
population (Fitch, 2011).
2.13 Conclusion
In this chapter, a systematic literature review of marine and offshore machinery operations
has been presented together with relevant aspects of machinery maintenance concepts
and lessons learned from major accidents in marine and offshore industry. These serve as
building blocks for the development of frameworks and methodology to be used in the
subsequent chapters. The current research status in maintenance planning justifies the
need for further research in the field of risk-based techniques. It has convincingly revealed
that a machinery maintenance programme is dependent on a number of factors including
technical, operational, organisational and external issues. All these necessitate the
development of a specifically tailored model that can be used to generate possible or likely
failure scenarios in a straightforward manner to enhance the reliability of marine and
offshore machinery operating under highly uncertain environment.
Hence, building an efficient planned maintenance strategy into these machinery systems is
the next key step to assuring safety, reliability and efficiency of operations. The review of
literature further revealed that collaborations with multiple stakeholders involved in marine
and offshore operations would lead to good maintenance practices, which are currently
much needed. The system can maximize its performance depending on the input of the
correct information, be it quantitative or qualitative. Quantitative information needs to be
assured and complemented by qualitative information in order to provide a convincing view
of the system and propose a maintenance strategy aimed at improving the machinery

Development of an Efficient Planned Maintenance Framework for Marine and Offshore Machinery
55
operations. The literature review also revealed that the cost of maintenance is directly
proportional to the ability of the maintenance system to measure its reliability. Thus, in order
to implement necessary maintenance strategies, key factors need to be built into the
process of group decision-making.

Development of an Efficient Planned Maintenance Framework for Marine and Offshore Machinery
56
Chapter 3
1 Research Methodology
Summary
The methodology of the research carried out outlines a framework for the development of
an efficient planned maintenance model for marine and offshore machinery operating under
highly uncertain environments. The research integrates fuzzy set modelling and ER
modelling into the maintenance model in order to improve the overall model results. The
research will discuss methods of understanding a machinery maintenance process,
identifying the problems encountered and establishing data that is required. This data is
interpreted and parameters are then established for applying planned maintenance
strategies. Further development of the maintenance model is achieved by integrating fuzzy
set modelling into the rule-based model in order to improve the accuracy and level of detail
of the subjective information required. The maintenance model is further expanded by
integrating fuzzy set modelling into the fuzzy-TOPSIS model. This introduction serves to re-
evaluate and improve a key parameter of the fuzzy-TOPSIS model.
3.1 The Scope of the Thesis
The scope of this research is to develop a maintenance methodology, utilising varying
information from both objective and subjective sources. The purpose of the maintenance
methodology is to:
a) Reduce the downtime of equipment due to breakdown and failures.
b) Reduce costs associated with maintenance and inspection activities.
c) Reduce the risks associated with possible environmental damage due to failure.
Based on the literature review in the field of machinery failure and maintenance
management, the lack of research in the subject of condition-based maintenance and its
effects on organisational and machinery in the context of marine and offshore industries is
observed. In order to fill the gap, firstly, wider scopes of machinery failure and maintenance
management that have received little attention and have been partially investigated by the
researchers will be assessed. Secondly, trend, family, environmental-based, design, and
human reliability will be analysed, and the influence of these five elements on the operation
of machinery will be evaluated. Thirdly, a novel condition monitoring model in marine and
Development of an Efficient Planned Maintenance Framework for Marine and Offshore Machinery
57
offshore industries by employing advanced analytical methodologies will be developed.
Finally, based on the evaluated results and to encounter and mitigate the evaluated risk
sources and to enhance the reliability of the marine and offshore machinery, control options
will be suggested.
Following the identification of the research needs and to establish an efficient condition-
based maintenance and management system, a series of uncertainty methodologies such
as fuzzy evidential reasoning, fuzzy analytic hierarchy process, predictive logic box (PLB),
fuzzy rule-based (FRB), and multiple attribute group decision making (MAGDM) will be
deployed. The frameworks of this research, in order to be applicable in marine and offshore
industries, will be developed in a generic sense. To demonstrate the case studies a number
of planned maintenance systems from some global companies will be selected. As a result,
this research will contribute to knowledge of planned maintenance systems for the marine
and offshore industries.
3.2 Structure of the Thesis
This thesis is compiled of seven chapters. Chapter 1 has outlined a brief introduction relating
to the background of the research, an introduction of the research objectives and
hypotheses, a statement highlighting the problems currently encountered.
Chapter 2 will examine the current literature which has influenced this study, giving a brief
overview of current maintenance concepts as well as the marine and offshore industry in
general. Following this overview, a detailed review of the current practices in maintenance
planning and management, dealing with uncertainty in marine and offshore machinery
design and operation, phases of errors in machinery operation, machinery oil analysis, and
lessons from some major incidents in the marine and offshore industry are considered.
These will serve to draw attention to the possible inadequacy and limitations of the current
practices, thus demonstrating the need and justification of this research thesis. This chapter
will close with a brief introduction to each of the risk-based and decision-making modelling
techniques used in the thesis.
Chapter 3 discusses the methodology and scope of this thesis. It also attempts to integrate
conceptual models that will be developed in Chapters 4, 5, and 6 of the research into a
coherent framework that can be used for marine and offshore machinery maintenance
improvement and operational management.
Chapter 4 gives a detailed and exhaustive review of what will be the cornerstone of this
research thesis, fuzzy set theory (FST), analytical hierarchy process (AHP) and an
aggregation algorithm (i.e. Evidential Reasoning), which are utilised to produce quantitative

Development of an Efficient Planned Maintenance Framework for Marine and Offshore Machinery
58
results that can be used by decision-makers for making robust decisions on a machinery
planned maintenance management programme. This evaluation will scrutinise various
applications of this modelling technique, examining some of the quantitative and qualitative
information regarding machinery operations. The information includes trend analysis, family
analysis, human reliability analysis, design analysis and environmental analysis. The
methodology developed has been applied to a case study in order to demonstrate the
process involved.
Chapter 5 looks specifically at the problems relating to the standardisation of information
derived in Chapter 4 when applying fuzzy evidential reasoning sensitivity analysis model
(FER-SAM) to a maintenance management framework. This chapter outlines the inherent
problem of combining subjective judgement and objective data, and presents a powerful
rule-based analysis tool fuzzy rule base sensitivity analysis model that is flexible yet robust
enough to be used in a range of practical applications connected with the machinery
operations.
Based on the results obtained from the analysis performed in Chapter 4, a specific model
of facilitating quantitative risk analysis which integrates FST, rule based diagnosis, belief
degree and mini-max concepts, with the uncertainties especially the unavailability of data
is developed. This methodology has been applied to a case study in order to demonstrate
the process involved. This analysis highlights the advantages of using fuzzy set modelling
to elicit information from differing sources whilst overcoming the uncertainties and
inaccuracies which previously surrounded this problem.
Chapter 6 generates a conceptual methodology, a strategic fuzzy decision support system
for maintenance strategy selection to assist decision makers to select from the appropriate
maintenance strategies suggested in Chapter 2. The methodology utilises the fuzzy multiple
attribute decision-making method, which is suitable for treating group decision-making
problems under a fuzzy environment. The FMADM method provides a management and
engineering decisions aid in evaluating and selecting appropriate maintenance strategies
from a finite number of alternatives, which are characterised by multiple attributes.
Chapter 7 will draw conclusions from the overall study. The chapter will begin by discussing
the main conclusions and whether these conclusions have been addressed in this research
study. This chapter will also ascertain if this research work has contributed to knowledge.
The advantages and disadvantages of the models, the novel and the limitations of this
research will also be given together with possible future research, which can expand and
explore the body of research.

Development of an Efficient Planned Maintenance Framework for Marine and Offshore Machinery
59
3.3 The Research Framework
The developed models discussed in Chapters 4, 5, and 6 using different decision-making
tools, such as FST, ER, and Fuzzy Analytical Hierarchy Process (FAHP), can be integrated
to develop a generic framework for an efficient planned maintenance system for marine and
offshore machinery operational improvement and management. The integrated model is
presented in Figure 3.1 and unveils the logical flow of the developed models in this study.
The method of applying this modelling technique shows an appreciation of many elements
that are generally overlooked when attempting to establish a planned maintenance
schedules for particular machinery. It is this incorporation of several divergent pieces of
information that establishes a cost-effective maintenance schedule, which makes
maintenance analysis a potentially powerful tool for most planned maintenance frameworks.
Figure 3.1: A Novel Planned Maintenance Framework for Marine and Offshore Machinery
Component Failure Identification
Risk Assessment Decision-Making
Robust Literature
Review
Brainstorming Session
with Domain Experts
Risk Condition Fuzzy Set Theory
AHP Belief Degree Concept
ER
Robust Literature
Review
Risk Level Assessment Fuzzy Set Theory
Min-Max Concept Belief Degree Concept
Fuzzy Rule Based
Robust Literature
Review
Decision Analysis Fuzzy Set Theory
FTOPSIS
Mai
nte
nan
ce S
trat
egie
s
Primary Data +
Experts Assessment

Development of an Efficient Planned Maintenance Framework for Marine and Offshore Machinery
60
3.4 Conclusion
The framework offer a transparent and systematic way to monitor the conditions of the
marine and offshore machinery in a logical and straightforward manner. As revealed in this
chapter, the integrated models in the framework supports maintenance management and
improvement of operations more effectively than isolated processes. Moreover, the
approach links maintenance and susceptibility, provides insights from different perspectives
regarding the machinery’s operations, and highlights how both qualitative and quantitative
information can be utilised in a transparent manner, especially in situations where data is
lacking, so that machinery’s uncertainties can be revealed and addressed logically.
Development of an Efficient Planned Maintenance Framework for Marine and Offshore Machinery
61
Chapter 4
A Proposed Methodology for Condition Monitoring of Marine and
Offshore Machinery using Evidential Reasoning Techniques
Summary
This chapter will first assess the operational uncertainties of a particular piece of equipment
in marine and offshore system. Trend analysis, family analysis, environmental analysis,
human reliability analysis and design analysis for each criterion will be aggregated using
ER and AHP algorithms. Data will be collected from reputable oil companies and
supplemented by expert judgement from the related industry. The results that will be
provided by these algorithms in this study will be beneficial to the marine and offshore
industries as indicators for the monitoring and diagnosis of faults in machinery and thus
assisting practitioners to make better decisions in their maintenance management process.
Furthermore, by changing the conditions that affect the operation of ideal machinery, and
through calculating a value for this operation, a benchmark is constructed. The operational
condition of machinery depends on many variables and their dependencies; thus, alteration
of a criterion value will ultimately alter the operational conditions of the machinery. For any
deviation to be corrected in a timely manner, the operational condition of the machinery has
to be monitored properly and frequently.
4.1 Introduction
According to Zhao (2014), machine condition monitoring is the practice of assessing a
machine’s condition by periodically gathering data on key machine-health indicators to
determine when to schedule maintenance. The existence or amount of debris and particles
from wearing parts, erosion and contamination provide insights about the issues affecting
performance and reliability. The increase in failure of marine and offshore machinery, such
as main engines, cranes, pumps, etc., coupled with intense operator concern over their
reliability, has motivated this research and the development of an efficient condition
monitoring methodology and reliability procedures. Furthermore, with the increasing
complexity and cost of equipment, accurate diagnosis is important. As a result,
Classification Societies are putting pressure on marine and offshore companies, urging
them to streamline their machinery condition monitoring operations. The fundamental
element of machinery condition monitoring on-board ship is watch-keeping (Lloyd Register,
Development of an Efficient Planned Maintenance Framework for Marine and Offshore Machinery
62
2013). Watch-keeping involves the ability to recognize changes in performance, as
indicated by alarms, alerts, gauges and readings, as well as responding aptly to these
changes. However, as the industry becomes more dynamic, there is a need to introduce
concepts of flexibility and agility (Bastos et al., 2012), to enable companies to deliver
customized condition monitoring (CM) which can react swiftly to machinery operating in
highly uncertain environments.
In their normal day-to-day schedules, deck and engineering officers do carry out many
condition monitoring activities, such as monitoring the performance of individual
components in a piece of equipment. For example, some of the routine condition monitoring
activities carried out in marine vessels include the installation of temperature sensors in
cylinder liners to monitor piston rings blow-by, and visual inspection of piston rings and
liners through scavenge space (Lloyd Register, 2013).
Thus, within this chapter, the framework of monitoring and diagnosing machinery in marine
and offshore industries will be demonstrated. ER and AHP algorithms will be employed to
synthesise the data gathered from all the components, in what is called a data mining
process (DMP). This will identify the behaviour patterns of each component, thus allowing
more accurate early detection of faults in the equipment.
The structure of this chapter will be as follows. The second section presents the process of
building a generic model of a hierarchical structure for monitoring the condition of the
machinery, in which trend, family, environment, human reliability, and design analysis
information is processed. The methodology is then explained and applied to the monitoring
of the operational conditions of machinery in the third section. This proposed methodology,
along with a previously accepted condition monitoring methodology, is then tested by a case
study, followed by a discussion and conclusion.
4.2 Methodology
The procedures specified in the literature review that were found to be considerable in their
relationships to machinery condition monitoring are used as the basis of the generic model.
The condition of the equipment is evaluated using a combination of different decision
making techniques, such as AHP, ER, and data mining process utilizing expert judgements
and historical data from the relevant industry. The proposed methodology will assess the
operational condition of different components in a piece of equipment to ascertain which
components are prone to failure. The proposed methodology in a stepwise regression is
presented in the following sections. The flow diagram for evaluating the condition of
equipment is shown in Figure 4.1.
Development of an Efficient Planned Maintenance Framework for Marine and Offshore Machinery
63
4.2.1 Identification of Risk Criteria (Step one)
It is very important for the decision makers to fully understand and have a clear picture of
the whole problem before attempting to find a solution, especially when there are many
criteria that need to be considered, which may in turn consist of sub-criteria and sometimes
even sub-sub-criteria. In such situations, the problem can be displayed in the form of a
hierarchical structure. Using hierarchical order, the goal of the problem is indicated at the
first level, while in the second level, there are several criteria, each of which contribute to
measuring and helping to achieve the overall goal. Then some of these criteria can further
be broken down. This process can continue up to the point where the decision makers are
able to make practical evaluation. When constructing a hierarchical structure, it is important
to pay attention to only significant criteria, in order to avoid a superfluously large model size.
Based on the literature review of the condition monitoring of the marine and offshore
machinery, a generic model with a hierarchical structure is constructed, and the main
criteria, sub-criteria, and sub-sub-criteria that contribute to the condition monitoring of the
machinery (goal) are presented in Figure 4.2. The goal (E) of the condition monitoring is
stated in the first level. In the second level, the main criteria (C1, C2, C3 and C4) contributing
to the condition monitoring of the goal (E) are stated. Then in the third level, the sub-criteria
{(C11, C12, C13,), (C21, C22, C23), (C31, C32, C33), (C41, C42, C43)} contributing to the condition
monitoring of the main criteria and the goal are stated. Then finally, in the fourth level, sub-
sub-criteria showing different contributions to measuring and achieving the goal of the
problem are stated. However, this can be further broken down into sub-criteria sub-sub-
sub-criteria until a point where decision makers can make practical and informed decisions
on the lower level criteria.
4.2.2 Application of Analytic Hierarchy Process (Step two)
Analytical Hierarchy Process (AHP) is used to determine the weights of each risk factor by
conducting a pair-wise comparison. Triangular fuzzy numbers (TFNs) are used to calculate
the preference of one criterion over another because of their computational simplicity in
promoting representation of information in an uncertain environment. The comparison is
usually based on an estimation scheme which places intensity of importance using
qualitative variables. Each of the variables has a corresponding TFN that is employed to
transfer experts’ judgement into a corresponding matrix.

Development of an Efficient Planned Maintenance Framework for Marine and Offshore Machinery
64
Identify Risk Criteria and present them in a Hierarchical Structure
Construct a Pairwise Comparison Matrices using AHP
Estimate Weight of each Attribute in the Hierarchy
Check the Consistency of the Matrices
CR ? 0 . 10
Evaluate Trend, Family, Environmental, Human Reliability, Design Analysis using Membership Functions of the Triangular Number
Aggregation Operations on Risk Criteria Results using ER
Obtain a Crips Number for the Risk
Perform Sensitivity Analysis
Validation of Results
No
YES
Figure 4 . 1 : Flow diagram for evaluating the condition of equipment
Decision Making

Development of an Efficient Planned Maintenance Framework for Marine and Offshore Machinery
65
Figure 4.2 - A Generic Model for Condition Monitoring of Machinery
E1
C1
C11
C11TA
C11FA
C11EA
C11HRA
C11DA
C12
C12TA
C12FA
C12EA
C12HRA
C12DA
C13
C13TA
C13FA
C13EA
C13HRA
C13DA
C2
C21
C21TA
C21FA
C21EA
C21HRA
C21DA
C22
C22TA
C22FA
C22EA
C22HRA
C22DA
C23
C23TA
C23FA
C23EA
C23HRA
C23DA
C3
C31
C31TA
C31FA
C31EA
C31HRA
C31DA
C32
C32TA
C32FA
C32EA
C32HRA
C32DA
C33
C33TA
C33FA
C33EA
C33HRA
C33DA
C4
C41
C41TA
C41FA
C41EA
C41HRA
C41DA
C42
C42TA
C42FA
C42EA
C42HRA
C42DA
C43
C43TA
C43HRA
C43EA
C43FA
C43DA

Development of an Efficient Planned Maintenance Framework for Marine and Offshore Machinery
66
4.2.2.1 Experts composition
Table 4.1 indicates the position, service time and the qualifications of the experts used for
the survey.
Table 4.1: Composition of Experts
Composition Classification
Industry Position Senior Manager
Service Time > 30 years
Academic Qualification Master degree
Bachelor degree
HND
Class 1 Certificate of Competency
4.2.3 Evaluation of Trend Analysis (TA) (Step three)
Trend analysis is an aspect of technical analysis that tries to predict the future performance
of machinery based on past data recorded. It is centred on the idea that what has happened
in the past gives an idea of what will happen in the future. Trend analysis allows the
development of a pattern of behaviour for a particular unit. This pattern of behaviour may
develop within a short or long term period. In trend analysis, graphs of a condition-related
parameter versus time can be utilized to determine when the parameter is likely to exceed
a given limit. This time could be dates or running hours.
The goal of a successful condition monitoring program is to predict the time of an expected
breakdown well in advance of its occurrence in order to shut down the machine in ample
time and allow for the ordering of spare parts for repairs, thus minimizing the shutdown time.
According to Courrech and Eshleman (2014), all condition monitoring criteria indicate that
equal changes on a log scale correspond to equal changes in severity; therefore, data for
a trend analysis should be plotted on a logarithmic scale in decibels. A linear trend on a
logarithmic scale is found occasionally, but the actual trend may follow another path; for
example, when the fault feeds back on the rate of deterioration (e.g. gear wear), the trend,
when plotted on a logarithmic scale, may then be exponential. In some cases, the fault
changes suddenly in finite steps, making it very difficult to extrapolate the time of the
shutdown. An example is a spall caused by gradual subsurface fatigue.
The following precautions are very vital in ensuring that accurate trend analysis is being
obtained (Courrech and Eshleman, 2014):
Development of an Efficient Planned Maintenance Framework for Marine and Offshore Machinery
67
1. Determining a trend based on measurements of a parameter directly related to a
specific type of fault, not on measurements of overall levels.
2. Diagnosing faults before attempting to interpret a trend curve in order to:
a) Select the appropriate parameter for the type of fault that is being monitored.
For example, the parameter may be the level of an individual component, or
of a selected frequency range.
b) Observe critically the results of the trend analysis so as to determine if the
linear or exponential interpolation is adequate.
3. Employing a trend of the most recent measurements to obtain the best estimate of
the lead time.
Several techniques can be applied in evaluating trend data, such as standard deviations,
averages, linear regression, etc. All of these techniques are intended to identify a condition
that is not normal in relation to the equipment’s past behaviour. In this research, trend
analysis is evaluated by means of quantitative data transformation (QDT). Each quantitative
criterion (i.e. grease/oil sample element test result) is transformed to a qualitative criterion
(i.e. linguistic variables with the associated belief degree) by using the triangular
membership functions of continuous fuzzy sets.
4.2.4 Evaluation of Family Analysis (Step four)
Family Analysis compares the results (e.g. wear metal levels) of groups of similar or
identical machinery to identify the usual or typical pattern. The extraction of such information
provides the data necessary to characterize operating cycles, maintenance schedules,
periodic breakdowns, and most importantly, to identify and address abnormal failure rates
before critical problems arise. In many cases, systems are grouped together to form a
family. A family may consist of identical equipment located in one or many vessels.
Equipment can also be grouped together based on: load, size, lubrication type, and
operating parameters, such as a group of pumps on-board a vessel. In this way, the wear
metal data can then be evaluated as a whole. The data for each component can then be
compared to the family to evaluate its wear rate to the family (Clarke 2005).
In family analysis, component patterns are classified to obtain component groups, and
machine patterns are also classified to machine groups. The machine component matrix is
arranged by placing components within a component group adjacently and repeating the
same for machines. The resulting matrix can then be inspected for bottleneck machines
and the number of exceptional cells can be minimized. Comparable to the similarity
coefficient in similarity coefficient methods, a degree of similarity between the obtained
pattern and the ideal pattern is used. The similarity is measured to ensure whether the

Development of an Efficient Planned Maintenance Framework for Marine and Offshore Machinery
68
obtained pattern is properly classified or not (Dagli et al., 1995). However, when determining
the family analysis of two similar systems, the similarity is compared with a pre-specified
threshold. A different threshold can be specified for the classification of components and
machines. From there a different degree of clustering is obtained for each threshold (as in
the similarity coefficient method).
Clark (2005) opines that family analysis techniques can have a significant impact on both
large and small companies’ condition monitoring programmes. A large company can use
such a programme to monitor large fleets of similar equipment among their plants, as well
as benchmark the performance of individual plants. Conversely, a company with less
equipment can use family analysis techniques to compare their equipment wear rates with
equipment in many other plants, or taking advantage of the vast laboratory database of
equipment data for comparison.
The family analysis is also evaluated using a quantitative data transformation method.
Unlike the trend analysis, in which only one deck crane was considered, in family analysis,
two deck cranes (Port & Starboard) are being evaluated by calculating the standard
deviations of the test results from the laboratory for each of the criterion (element). Each
quantitative criterion is then transformed to a qualitative criterion by using triangular
membership functions of continuous fuzzy sets. To move from inaction to action required
status, standard deviations are calculated to reveals whether the failure modes under
review are very similar and the standard deviation is low and predictable, using the following
formula:
Standard Deviation = √∑(𝑥− �̅�)2
(𝑛−1) (4.1)
where 𝑥 is the sample mean average and 𝑛 is the sample size.
4.2.5 Evaluation of Environmental Analysis (Step five)
The health and performance of machinery as a whole is vitally important. Rather than
focusing on the performance of one part, analysts look at everything together in order to
obtain a more complete view of what is achievable and what problems might arise along
the way. When machinery operators have comprehensive views of their internal and
external environments, they are often better able to plan an effective growth strategy. At the
same time, early threat identification allows operators to take timely action in developing a
survival plan and setting remediation plans in motion to get the machinery back to good
condition.
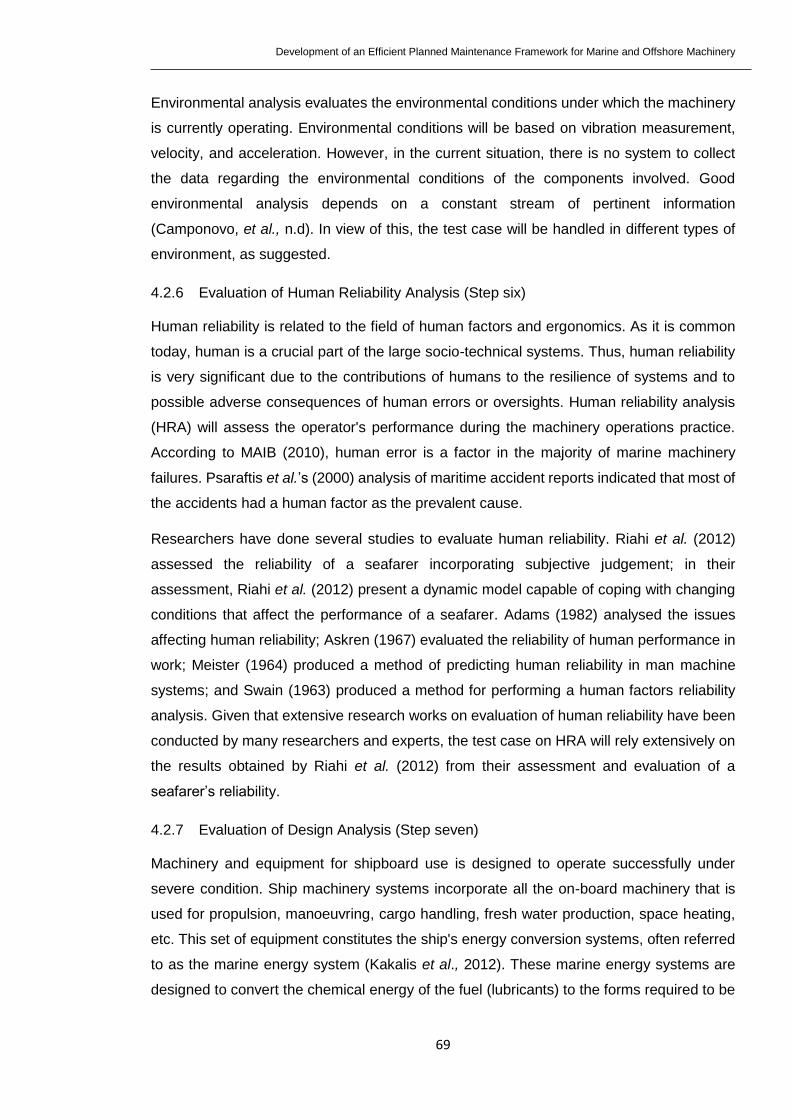
Development of an Efficient Planned Maintenance Framework for Marine and Offshore Machinery
69
Environmental analysis evaluates the environmental conditions under which the machinery
is currently operating. Environmental conditions will be based on vibration measurement,
velocity, and acceleration. However, in the current situation, there is no system to collect
the data regarding the environmental conditions of the components involved. Good
environmental analysis depends on a constant stream of pertinent information
(Camponovo, et al., n.d). In view of this, the test case will be handled in different types of
environment, as suggested.
4.2.6 Evaluation of Human Reliability Analysis (Step six)
Human reliability is related to the field of human factors and ergonomics. As it is common
today, human is a crucial part of the large socio-technical systems. Thus, human reliability
is very significant due to the contributions of humans to the resilience of systems and to
possible adverse consequences of human errors or oversights. Human reliability analysis
(HRA) will assess the operator's performance during the machinery operations practice.
According to MAIB (2010), human error is a factor in the majority of marine machinery
failures. Psaraftis et al.’s (2000) analysis of maritime accident reports indicated that most of
the accidents had a human factor as the prevalent cause.
Researchers have done several studies to evaluate human reliability. Riahi et al. (2012)
assessed the reliability of a seafarer incorporating subjective judgement; in their
assessment, Riahi et al. (2012) present a dynamic model capable of coping with changing
conditions that affect the performance of a seafarer. Adams (1982) analysed the issues
affecting human reliability; Askren (1967) evaluated the reliability of human performance in
work; Meister (1964) produced a method of predicting human reliability in man machine
systems; and Swain (1963) produced a method for performing a human factors reliability
analysis. Given that extensive research works on evaluation of human reliability have been
conducted by many researchers and experts, the test case on HRA will rely extensively on
the results obtained by Riahi et al. (2012) from their assessment and evaluation of a
seafarer’s reliability.
4.2.7 Evaluation of Design Analysis (Step seven)
Machinery and equipment for shipboard use is designed to operate successfully under
severe condition. Ship machinery systems incorporate all the on-board machinery that is
used for propulsion, manoeuvring, cargo handling, fresh water production, space heating,
etc. This set of equipment constitutes the ship's energy conversion systems, often referred
to as the marine energy system (Kakalis et al., 2012). These marine energy systems are
designed to convert the chemical energy of the fuel (lubricants) to the forms required to be

Development of an Efficient Planned Maintenance Framework for Marine and Offshore Machinery
70
used in shipboard, and they tend to be highly complex, having many functions, with variable
mission profiles, as well as requirements for flexibility, redundancy, and safety. In addition,
the systems have to be cost-effective, energy efficient, and environmental friendly. In order
to manage such complexity, it is imperative to adopt a structured and effective approach
during the design phase.
Design Analysis will assess the physical behaviour of the machinery and its component as
specified by the manufacturer (good or bad). It is based on the prediction of the physical
behaviour of just about any part or assembly, under any loading condition. In a safe design,
the load is not excessive, the stress does not exceed the yield point (i.e. the type of material
used operates within its elastic range or limit), and the part deforms elastically (i.e. when
the load is released, the part returns to its original shape). On the other hand, if the load is
such that the yield point is exceeded, the part will become partially plastic and, on removal
of the load, the part will be permanently deformed. Subsequently, greater increase in load
will cause the part to eventually break (fracture). This is normally attributed to bad design.
4.2.8 Aggregation Operations on Criteria Results Using ER (Step eight)
The ER algorithm is used to synthesise the risks in a hierarchical structure. Complex
decision making problems are represented hierarchically in a structured and systematic
manner, as constructed in the generic model shown in Figure 4.2. In order to find how well
an alternative performs across all criteria, the lowest level criteria evaluation is transformed
to the upper level and ultimately to the top level criterion. This complex process requires a
robust and systematic decision making tool and ER is a method that can be tailored towards
such situations where there is high uncertainty and imprecision in information processing.
With the help of ER, the results obtained from the AHP and the criteria are aggregated.
4.2.9 Obtaining a Crisp Number for the Goal (Step nine)
To obtain a single crisp number for the top-level criterion (goal) of each alternative, a utility
approach is used in order to rank them. If the utility of an evaluation grade 𝐻𝑛 is denoted by
𝑢(𝐻𝑛) 𝑎𝑛𝑑 𝑢(𝐻𝑛+1) > 𝑢(𝐻𝑛), where 𝐻𝑛+1 is preferred to 𝐻𝑛, 𝑢(𝐻𝑛) can be estimated using
the decision maker’s preferences. However, in a situation where no preference information
is available, it could be assumed that the utilities of evaluation grades are equidistantly
distributed in a normalised utility space. The utilities of evaluation grades that are
equidistantly distributed in a normalised utility space are calculated as follows:
𝑢(𝐻𝑛) = 𝑉𝑛− 𝑉𝑚𝑖𝑛
𝑉𝑚𝑎𝑥− 𝑉𝑚𝑖𝑛 (4.2)

Development of an Efficient Planned Maintenance Framework for Marine and Offshore Machinery
71
where, 𝑉𝑛 is the ranking value of the linguistic term 𝐻𝑛 that has been considered, 𝑉𝑚𝑎𝑥 is the
ranking value of the most-preferred linguistic term 𝐻𝑁, and 𝑉𝑚𝑖𝑛 is the ranking value of the
least-preferred linguistic term 𝐻1.
The utility of the top-level or general criterion 𝑆(𝐸) is denoted by 𝑢(𝑆(𝐸)). If 𝛽𝐻 ≠ 0 (i.e. the
assessment is incomplete, 𝛽𝐻 = 1 − ∑ 𝛽𝑛)𝑁𝑛=1 there is a belief interval [𝛽𝑛, (𝛽𝑛 + 𝛽𝐻)],
which provides the likelihood that 𝑆(𝐸) is assessed to 𝐻𝑛. Without loss of generality,
suppose that the least-preferred linguistic term having the lowest utility is denoted by 𝑢(𝐻1)
and the most preferred linguistic term having the highest utility is denoted by 𝑢(𝐻𝑁). Then
according to Yang (2001), the minimum, maximum, and average utilities of 𝑆(𝐸) are defined
as:
𝑢𝑚𝑖𝑛(𝑆(𝐸)) = ∑ 𝛽𝑛 𝑢(𝐻𝑛) + (𝛽1 + 𝛽𝐻)𝑢(𝐻1)
𝑁
𝑛=2
𝑢𝑚𝑖𝑛(𝑆(𝐸)) = ∑ 𝛽𝑛 𝑢(𝐻𝑛) + (𝛽𝑁 + 𝛽𝐻)𝑢(𝐻𝑁)
𝑁−1
𝑛=1
𝑢𝑎𝑣𝑒𝑟𝑎𝑔𝑒(𝑆(𝐸)) = 𝑢𝑚𝑖𝑛(𝑆(𝐸))+ 𝑢𝑚𝑎𝑥(𝑆(𝐸))
2 (4.3)
If all the assessments are complete, then 𝛽𝐻 = 0 and the maximum, minimum, and average
utilities of 𝑆(𝐸) will be the same. Therefore, 𝑢(𝑆(𝐸)) can be calculated as:
𝑢(𝑆(𝐸)) = ∑ 𝛽𝑛 𝑢(𝐻𝑛) (4.4)
𝑁
𝑛=1
According to Riahi et al. (2012), an assessment based on a single value is much easier and
more instinctive as a practical tool for a professional decision maker to rank the alternative.
Thus, to obtain a single crisp number for the goal, the utility value associated with each
linguistic term has to be calculated from Equations (4.2) to (4.4).
4.2.10 Perform Sensitivity Analysis (Final step)
It is humanly impossible to define a condition monitoring strategy that has every potential
failure covered and it is equally very challenging to have good statistical data which reveals
that the failure modes under review are very similar and the standard deviation is low and
predictable. As a result, owing to the lack of precise data and the novelty of this model, it
has not been possible to find any proven benchmark results for its full validation. Given such

Development of an Efficient Planned Maintenance Framework for Marine and Offshore Machinery
72
difficulties and challenges, a possible method for fully validating the model can be achieved
only by using an incremental process and through conducting more industrial case studies.
The model that will be developed can then be refined and applied in real-world industrial
applications.
In view of the above, sensitivity analysis will be used to partially validate the model. The
reason for using sensitivity analysis is to test the sensitivity of the proposed model.
Sensitivity analysis refers to analysing how sensitive the model outputs are to a minor
change in the inputs. The change may be a variation in the parameters of the model or may
be changes in the belief degrees assigned to the linguistic variables used to describe the
parameters. Sensitivity analysis is very useful when attempting to determine the impact the
actual outcome of a particular variable will have if it differs from what was previously
assumed. By forming a given set of scenarios, how changes in one variable(s) will impact
the target variable can be determined. If the methodology is sound and its conclusion
reasoning is logical, then the sensitivity analysis must follow the following three axioms
(Riahi et al., 2012):
Axiom 1: A slight increment or decrement in the degree of belief associated with any
linguistic variables of the lowest-level criteria will certainly result in a relative increment or
decrement in the degree of belief of the linguistic variable and the preference degrees of
the model output.
Axiom 2: If the degree of belief associated with the highest-preference linguistic term of the
lowest-level criterion is decreased by 𝑚 and 𝑛, simultaneously the degree of belief
associated with its lowest-preference linguistic term is increased by 𝑚 and 𝑛 (1 > 𝑛 > 𝑚),
and the utility values of the model output are evaluated as 𝑈𝑚 and 𝑈𝑛 respectively, then 𝑈𝑚
should be greater than 𝑈𝑛.
Axiom 3: If 𝑆 and 𝑅 (𝑅 < 𝑆) criteria from all the lowest-level criteria are selected and the
degree of belief associated with the highest-preference linguistic term of each of such 𝑆 and
𝑅 criteria is decreased by the same amount (i.e. simultaneously the degree of belief
associated with the lowest-preference linguistic term of each of such 𝑆 and 𝑅 criteria is
increased by the same amount) and the utility values of the model output are evaluated as
𝑈𝑅 and 𝑈𝑆 respectively, then 𝑈𝑅 should be greater than 𝑈𝑆.
The implementation of the axioms will help to test the certainty of the delivery of the analysis
result. The degrees of belief associated with the highest preference linguistic terms of each
sub-criterion are decreased by 𝑘 and simultaneously, the degrees of belief associated with
the lowest preference linguistic terms of the corresponding sub-criterion are increased by

Development of an Efficient Planned Maintenance Framework for Marine and Offshore Machinery
73
𝑘. Thus, the corresponding results are obtained. It is worth noting that when the belief
degree of the highest preference linguistic term 𝛽𝛼 of a criterion is decreased by 𝑘,
simultaneously, the belief degree of its lowest preference linguistic term has to be increased
by 𝑘. However, if 𝛽𝛼 is less than 𝑘, then the remaining belief degree (i.e. 𝑘 − 𝛽𝛼) can be
taken from the belief degree of the next linguistic term. This process continues until 𝑘 is
consumed (Riahi et al., 2012). The comparative ship crane reliability (SCR) results obtained
from this methodology are used to determine which crane’s components are susceptible to
failure. The component with a low SCR value is identified as the one more prone to failure.
4.3 Test Case
In order to investigate the possibility of failure throughout the lifespan of a ship crane (Figure
4.3) and during its operations, it is essential to monitor the conditions of its components
(main criteria) in terms of their reliability during frequently changing sea conditions, by
evaluating the laboratory oil sample test results for these components based on the given
absolute limits for oil. The operating condition of both port and starboard cranes in an oil
tanker operating within European nautical environments is evaluated based on the following
information. Furthermore, the disparity in their conditions during frequently changing sea
conditions is calculated. The characteristics of the cranes, the intended use, type, and size
of the vessel, and the environment are listed as follows:
1. Crane type: DONG Nam hydraulic crane on main deck – 10 Ton.
2. Offshore crane used in floating production storage and offloading (FPSO).
3. Crane arrangement: Port and Starboard.
4. Degree of rotation: 3500.
5. Environmental operating conditions: extremes temperature -200C to +450C.
6. Personnel allowed to be lifted with the crane.
7. The crane has an operator’s cabin.
8. Lift Height/Depth: 1200m depth double fall.
9. Overload alarm: set to 100% of SWL.
10. The crane has the following main components: slewing rings bearing, clutches,
gearboxes, and hydraulic pumps. Regular oil sample analysis is carried out for these
components, and their laboratory test results are recorded.
11. Using a crane for tasks outside its design intent can significantly increases safety
risks, crane failures, and downtime. Consequently, the manufacturer, taking into
account indication of the design loads, life, and estimated average running time,
evaluated the overall design of the crane as Good.

Development of an Efficient Planned Maintenance Framework for Marine and Offshore Machinery
74
4.3.1 Ship Crane Machinery
Cranes are fitted on board most ships and offshore installations for cargo handling and
lifting of personnel. These cranes appear to be fairly robust units which will continue to work
when only a minimum of maintenance is carried out. They are highly complex pieces of
machinery that incorporate numerous components manufactured to very fine tolerances, all
of which must function correctly throughout a working period of the crane, as a unit, to be
operated as the manufacturers recommended. The machinery of a crane includes all
electrical control equipment and systems, motors, hydraulic oil pumps, filters and coolers,
winches, clutches, brakes and control gear, limit switches, bearings and other pieces of
equipment. Routine maintenance of these various pieces of machinery is essential for their
continuing correct operation.
In accordance with the planned maintenance regime, inspections and testing of the various
parts should be carried out, with renewal of items as necessary. If any component is not in
the appropriate good condition, failures are likely to occur during cargo operations. In this
study, only the four key components (bearing, clutches, gearboxes and hydraulic pump) will
be considered in the maintenance model in order for simplify the model.
Figure 4.3: Dongnam Hydraulic Crane on FPSO Main Deck
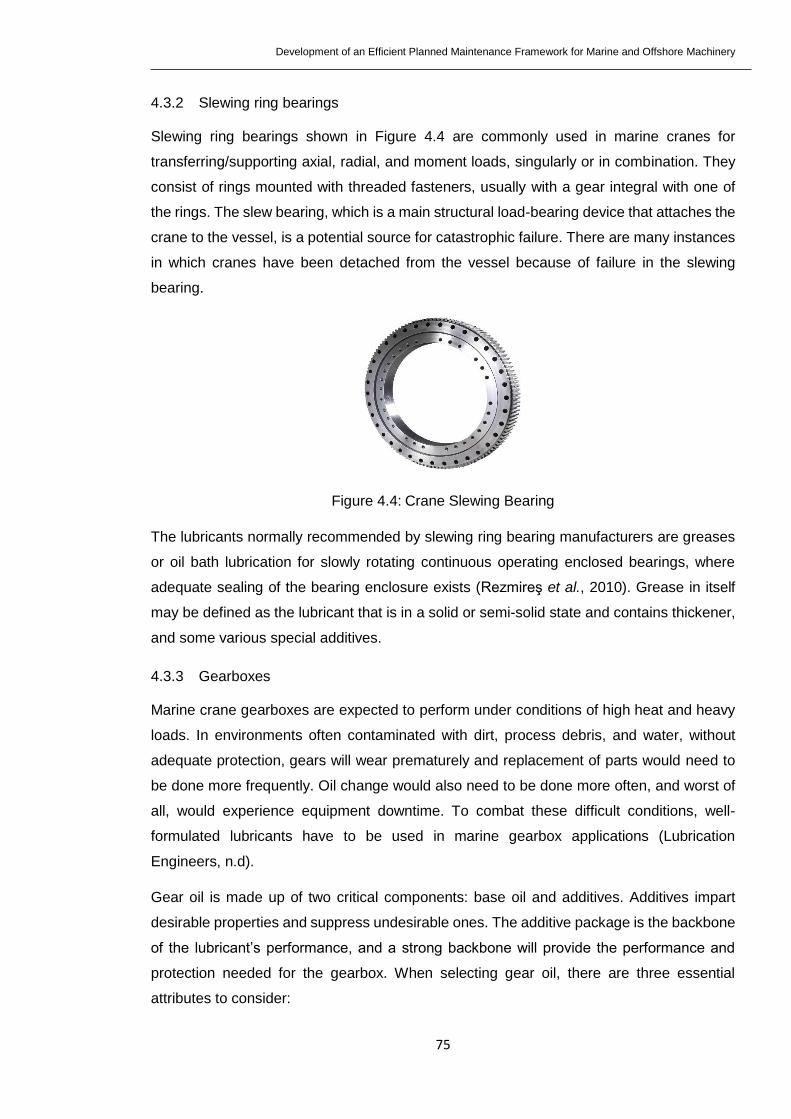
Development of an Efficient Planned Maintenance Framework for Marine and Offshore Machinery
75
4.3.2 Slewing ring bearings
Slewing ring bearings shown in Figure 4.4 are commonly used in marine cranes for
transferring/supporting axial, radial, and moment loads, singularly or in combination. They
consist of rings mounted with threaded fasteners, usually with a gear integral with one of
the rings. The slew bearing, which is a main structural load-bearing device that attaches the
crane to the vessel, is a potential source for catastrophic failure. There are many instances
in which cranes have been detached from the vessel because of failure in the slewing
bearing.
Figure 4.4: Crane Slewing Bearing
The lubricants normally recommended by slewing ring bearing manufacturers are greases
or oil bath lubrication for slowly rotating continuous operating enclosed bearings, where
adequate sealing of the bearing enclosure exists (Rezmireş et al., 2010). Grease in itself
may be defined as the lubricant that is in a solid or semi-solid state and contains thickener,
and some various special additives.
4.3.3 Gearboxes
Marine crane gearboxes are expected to perform under conditions of high heat and heavy
loads. In environments often contaminated with dirt, process debris, and water, without
adequate protection, gears will wear prematurely and replacement of parts would need to
be done more frequently. Oil change would also need to be done more often, and worst of
all, would experience equipment downtime. To combat these difficult conditions, well-
formulated lubricants have to be used in marine gearbox applications (Lubrication
Engineers, n.d).
Gear oil is made up of two critical components: base oil and additives. Additives impart
desirable properties and suppress undesirable ones. The additive package is the backbone
of the lubricant’s performance, and a strong backbone will provide the performance and
protection needed for the gearbox. When selecting gear oil, there are three essential
attributes to consider:
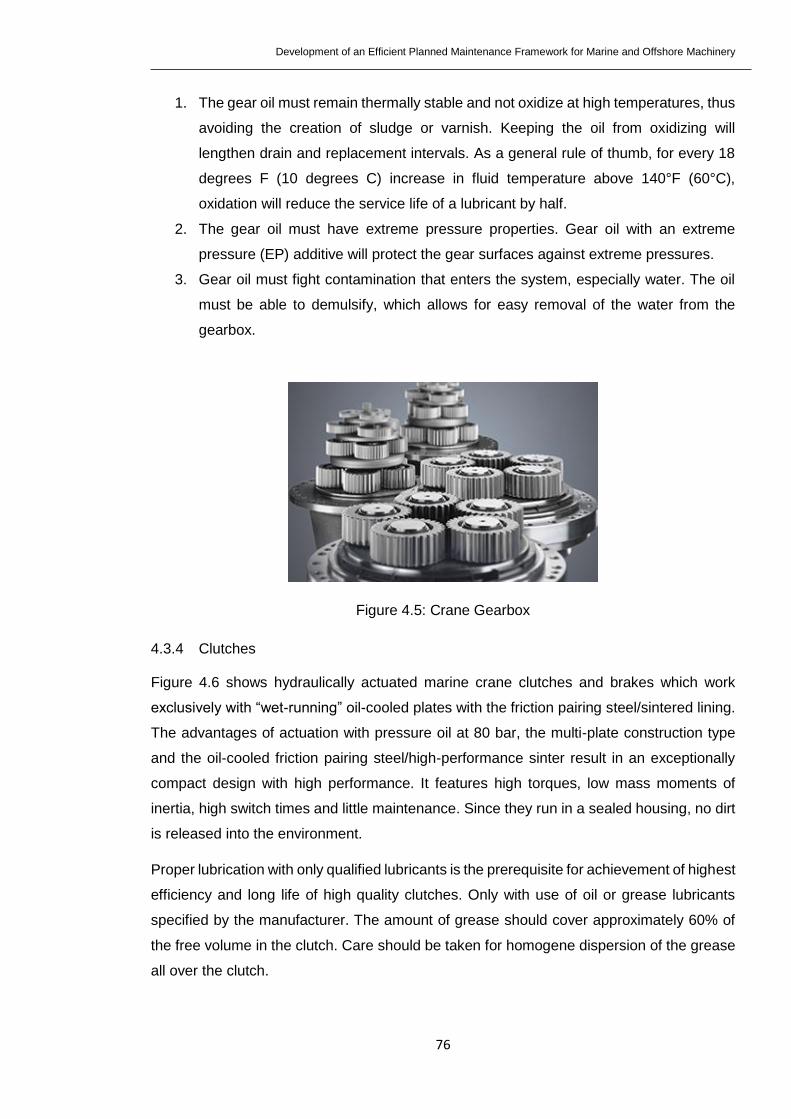
Development of an Efficient Planned Maintenance Framework for Marine and Offshore Machinery
76
1. The gear oil must remain thermally stable and not oxidize at high temperatures, thus
avoiding the creation of sludge or varnish. Keeping the oil from oxidizing will
lengthen drain and replacement intervals. As a general rule of thumb, for every 18
degrees F (10 degrees C) increase in fluid temperature above 140°F (60°C),
oxidation will reduce the service life of a lubricant by half.
2. The gear oil must have extreme pressure properties. Gear oil with an extreme
pressure (EP) additive will protect the gear surfaces against extreme pressures.
3. Gear oil must fight contamination that enters the system, especially water. The oil
must be able to demulsify, which allows for easy removal of the water from the
gearbox.
Figure 4.5: Crane Gearbox
4.3.4 Clutches
Figure 4.6 shows hydraulically actuated marine crane clutches and brakes which work
exclusively with “wet-running” oil-cooled plates with the friction pairing steel/sintered lining.
The advantages of actuation with pressure oil at 80 bar, the multi-plate construction type
and the oil-cooled friction pairing steel/high-performance sinter result in an exceptionally
compact design with high performance. It features high torques, low mass moments of
inertia, high switch times and little maintenance. Since they run in a sealed housing, no dirt
is released into the environment.
Proper lubrication with only qualified lubricants is the prerequisite for achievement of highest
efficiency and long life of high quality clutches. Only with use of oil or grease lubricants
specified by the manufacturer. The amount of grease should cover approximately 60% of
the free volume in the clutch. Care should be taken for homogene dispersion of the grease
all over the clutch.
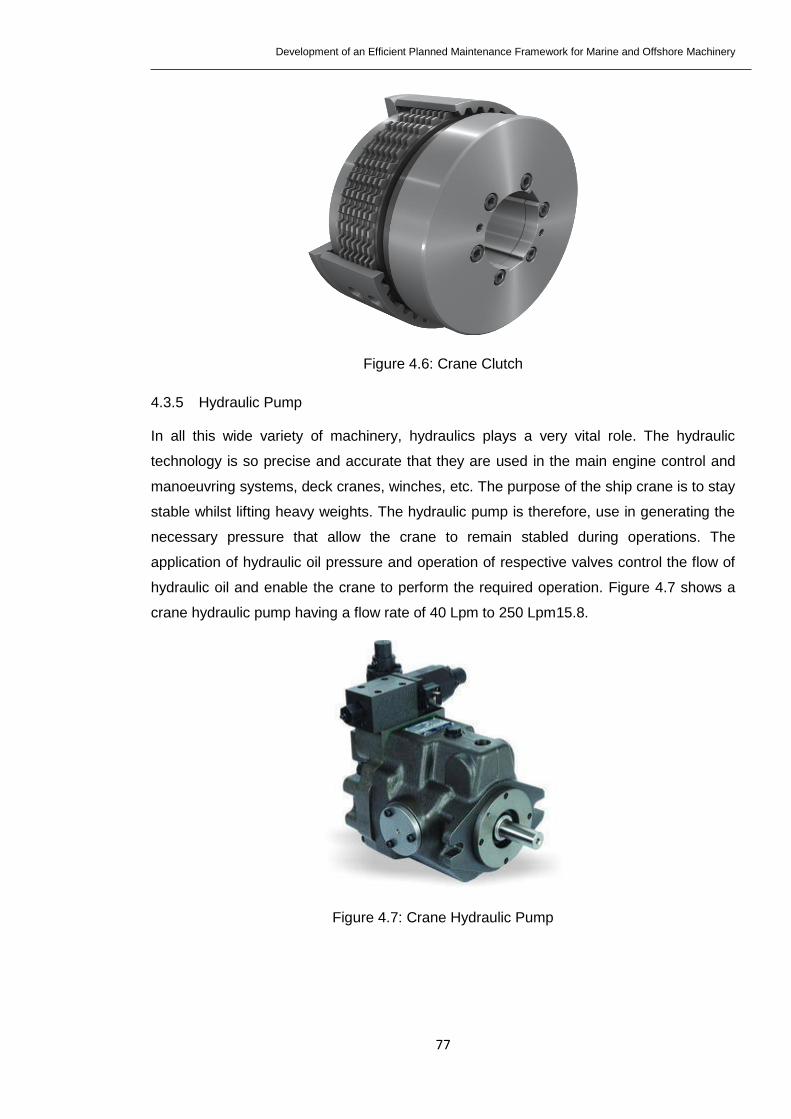
Development of an Efficient Planned Maintenance Framework for Marine and Offshore Machinery
77
Figure 4.6: Crane Clutch
4.3.5 Hydraulic Pump
In all this wide variety of machinery, hydraulics plays a very vital role. The hydraulic
technology is so precise and accurate that they are used in the main engine control and
manoeuvring systems, deck cranes, winches, etc. The purpose of the ship crane is to stay
stable whilst lifting heavy weights. The hydraulic pump is therefore, use in generating the
necessary pressure that allow the crane to remain stabled during operations. The
application of hydraulic oil pressure and operation of respective valves control the flow of
hydraulic oil and enable the crane to perform the required operation. Figure 4.7 shows a
crane hydraulic pump having a flow rate of 40 Lpm to 250 Lpm15.8.
Figure 4.7: Crane Hydraulic Pump

Development of an Efficient Planned Maintenance Framework for Marine and Offshore Machinery
78
4.3.6 Identification of Risk Criteria (Step one)
When a group of similar components contributes to a common goal or function, grouping of
such components facilitates their analysis. Hence, the introduction of a hierarchical model
into the machinery system allows for an effective way to deal with the complexity associated
with its operation in order to reveal its uncertainties. The hierarchical structure highlights the
interaction among the components and determines how they perform together as a whole
to contribute to the goal of the entire piece of machinery.
Considering the generic model for monitoring the condition of the machinery (Figure 4.2)
and the above information, a specific model (Figure 4.8) for monitoring the condition of a
ship crane can be constructed. Analysis grades are assigned to all the criteria in the
hierarchical structure and the qualitative and quantitative criteria are grouped. Four main
criteria (bearing, clutch, gearbox, and hydraulic pump) and five sub-criteria (trend analysis,
family analysis, environmental analysis, human reliability analysis, and design analysis) are
identified for the ship crane.
4.3.7 Application of Analytic Hierarchy Process Results (Step two)
Questionnaires were sent to four experts (listed in Table 4.2) in the industry carefully
selected to participate in the analysis with the aim of comparing the nine criteria (four main
criteria and five sub-criteria) that are perceived in the condition monitoring of marine and
offshore cranes. These nine criteria are set up in order of importance, by employing an
analytic hierarchy process to determine their priority ranking for decision making. The nine
criteria are used in four crane components: bearing, clutch, gearbox, and hydraulic pump.
The decision maker determines the rating for each decision alternative for each criterion.
The ratings for expert 1’s judgements are used as an example to show how the weights
(priority vector) are determined. Then afterward, the ratings for the four experts’ judgement
will be aggregated using the AHP software and the results will be shown. There will be one
pair-wise comparison matrix for each criterion. Then, within each matrix, the pair-wise
comparisons will rate each sub-criterion relative to every other sub-criterion.
4.3.7.1 Selected experts and their assigned weights
The experts’ background in the industry and their assigned weights are as shown in Table
4.2.

Development of an Efficient Planned Maintenance Framework for Marine and Offshore Machinery
79
Table 4.2: Weighting of Expert Judgments
Number of Decision Makers
Industrial Position
Service Period
Academic Qualification
Experts’ Weights
DM1 Senior Manager > 30 years Master 0.25
DM2 Senior Manager > 30 years HND 0.25
DM3 Senior Manager > 30 years Bachelor 0.25
DM4
Senior Manager
> 30 years
Class 1
Certificate of
Competency
0.25
Total = 1
4.3.7.2 Development of the ratings for each decision alternative for each criterion
Based on the five sub-criteria identified, five separate matrices have been developed
accordingly: one matrix for the trend analysis, one matrix for the family analysis, one matrix
for the environmental analysis, one matrix for the human reliability analysis, and one matrix
for the design analysis. Within each of the aforementioned five matrices, there will be pair-
wise comparisons for each component against every other component relative to that
criterion. Since there are five sub-criteria under evaluation, each matrix will be of size 5 x 5.
Table 1-4A in Appendix 4A indicates the Expert 1 judgement in comparing the five criteria
for crane bearing, while Table 4.3 shows the pair-wise comparison matrix for the five criteria
from Expert 1.
From Table 1-4A (Appendix 4A), the Expert 1 determines that for the crane bearing:
1. Trend analysis is strongly important over family analysis (number 5).
2. Trend analysis is strongly to very strongly important over environmental analysis
(number 6).
3. Trend analysis is very strongly important over human reliability analysis (number 7).
4. Trend analysis is strongly to very strongly important over design analysis (number
6).
5. Family analysis is equally to weakly important over environmental analysis (2).
6. Family analysis is strongly important over Human reliability analysis (5).
7. Family analysis is equally important over design analysis (1).
8. Environmental analysis is weakly important over human reliability analysis (3).
9. Design analysis is strongly important over environment analysis (5).
10. Design analysis is strongly important over human reliability analysis (5).
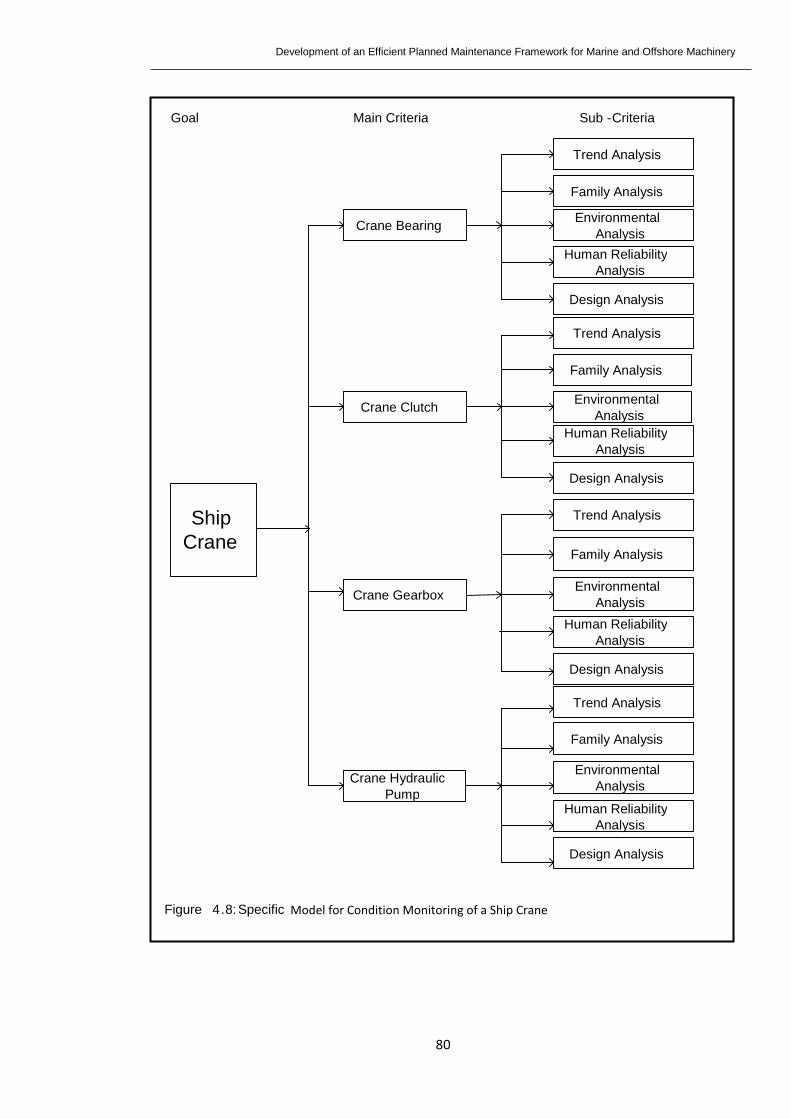
Development of an Efficient Planned Maintenance Framework for Marine and Offshore Machinery
80
Ship
Crane
Trend Analysis
Family Analysis
Environmental Analysis
Crane Clutch
Human Reliability Analysis
Design Analysis
Trend Analysis
Crane Gearbox
Family Analysis
Environmental Analysis
Human Reliability Analysis
Crane Hydraulic Pump
Figure 4 . 8: Specific Model for Condition Monitoring of a Ship Crane
Design Analysis
Trend Analysis
Family Analysis
Environmental Analysis
Human Reliability Analysis
Design Analysis
Trend Analysis
Family Analysis
Environmental Analysis
Human Reliability Analysis
Design Analysis
Crane Bearing
Goal Main Criteria Sub - Criteria
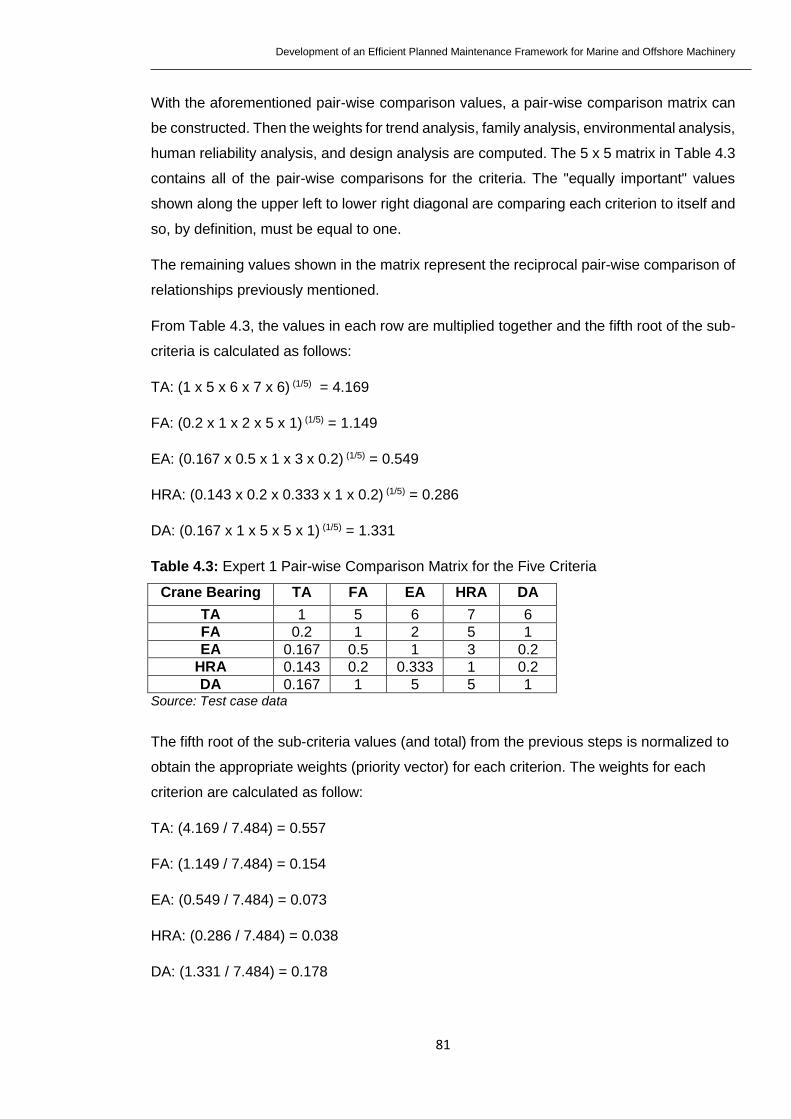
Development of an Efficient Planned Maintenance Framework for Marine and Offshore Machinery
81
With the aforementioned pair-wise comparison values, a pair-wise comparison matrix can
be constructed. Then the weights for trend analysis, family analysis, environmental analysis,
human reliability analysis, and design analysis are computed. The 5 x 5 matrix in Table 4.3
contains all of the pair-wise comparisons for the criteria. The "equally important" values
shown along the upper left to lower right diagonal are comparing each criterion to itself and
so, by definition, must be equal to one.
The remaining values shown in the matrix represent the reciprocal pair-wise comparison of
relationships previously mentioned.
From Table 4.3, the values in each row are multiplied together and the fifth root of the sub-
criteria is calculated as follows:
TA: (1 x 5 x 6 x 7 x 6) (1/5) = 4.169
FA: (0.2 x 1 x 2 x 5 x 1) (1/5) = 1.149
EA: (0.167 x 0.5 x 1 x 3 x 0.2) (1/5) = 0.549
HRA: (0.143 x 0.2 x 0.333 x 1 x 0.2) (1/5) = 0.286
DA: (0.167 x 1 x 5 x 5 x 1) (1/5) = 1.331
Table 4.3: Expert 1 Pair-wise Comparison Matrix for the Five Criteria
Crane Bearing TA FA EA HRA DA
TA 1 5 6 7 6
FA 0.2 1 2 5 1
EA 0.167 0.5 1 3 0.2
HRA 0.143 0.2 0.333 1 0.2
DA 0.167 1 5 5 1 Source: Test case data
The fifth root of the sub-criteria values (and total) from the previous steps is normalized to
obtain the appropriate weights (priority vector) for each criterion. The weights for each
criterion are calculated as follow:
TA: (4.169 / 7.484) = 0.557
FA: (1.149 / 7.484) = 0.154
EA: (0.549 / 7.484) = 0.073
HRA: (0.286 / 7.484) = 0.038
DA: (1.331 / 7.484) = 0.178

Development of an Efficient Planned Maintenance Framework for Marine and Offshore Machinery
82
The priority vector (PV) values are the criteria weights. The weights for each criterion must
sum to one (i.e. the total priority vector), as shown in Table 4.4.
Table 4.4: Developing Expert 1 Rating for each Decision Alternative for the Crane Bearing
Crane Bearing
TA
FA
EA
HRA
DA
5th Root of Component
PV
TA 1 5 6 7 6 4.169 0.557
FA 0.2 1 2 5 1 1.149 0.154
EA 0.167 0.5 1 3 0.2 0.549 0.073
HRA 0.143 0.2 0.333 1 0.2 0.286 0.038
DA 0.167 1 5 5 1 1.331 0.178
SUM 1.677 7.7 14.333 21 8.4 7.484 1.000
SUM * PV 0.934 1.186 1.046 0.798 1.495 5.459
Lambda-max = 5.459
CI = 0.115
CR = 0.103 Source: Test case data
The pair-wise comparison values in each column are added together (as the “sum” values)
and each sum is then multiplied by the respective weight (from the priority vector column)
for those criteria, as follows:
TA: (1 + 0.2 + 0.167 + 0.143 + 0.167) x 0.557 = 0.934
FA: (5 + 1 + 0.5 + 0.2 + 1) x 0.154 = 1.1858
EA: (6 + 2 + 1 + 0.333 + 5) x 0.073 = 1.046
HRA: (7 + 5 + 3 + 1 + 5) x 0.038 = 0.798
DA: (6 + 1 + 0.2 + 0.2 + 1) x 0.178 = 1.495
In the row labelled “Sum*PV” shown in Table 4.4, each value shows the result of multiplying
the respective sum (shown in the row immediately above) by the respective weight for that
criterion (shown in the column labelled “priority vector”).
The aforementioned values (shown in the row labelled “Sum*PV”) are added together to
yield a total of 5.459 (i.e., 0.934 + 1.186 + 1.046 + 0.798 + 1.495 = 5.459). This value is
called Lambda-max. Note that unlike the weights for the criteria, which must sum to one,
Lambda-max will not necessarily be equal to one.
Using Equation (2.11), the consistency index (CI) is calculated as:
CI = (Lambda-max – n) / (n-1); where n = 5
CI = (5.459 – 5) / (5-1) = 0.459 / 4 = 0.115

Development of an Efficient Planned Maintenance Framework for Marine and Offshore Machinery
83
The CR is calculated by dividing the consistency index (CI) by a random index (RI), which
is determined from a lookup table in Table 2.1. The RI is a direct function of the number of
criteria or components being considered. Using Equation (2.10), CR is calculated as:
CR = CI / RI
The number of sub-criteria being considered in this test case is 5, thus, from Table 2.1, RI
for 5 is given as 1.12.
CR = 0.115 / 1.12 = 0.103
If the CR ≤ 0.10, the decision maker's pair-wise comparisons are relatively consistent. In
this case, the CR is 0.10, which indicates that the pair-wise comparisons are consistent and
no correction action is necessary.
Note that the CR for the matrix in Table 4.4 depicting the ratings for each decision alternative
for each criterion is less than or equal to 0.10, meaning that the pair-wise comparisons are
relatively consistent. Therefore, no further actions are necessary.
The ratings for Expert 2, 3 and 4 for crane bearing are as shown in Appendix 4A; Tables 2-
4A, 4-4A, and 6-4A, and their corresponding pair-wise comparisons are shown in Tables 3-
4A, 5-4A, and 7-4A respectively.
Their corresponding CR are found to be less than or equal to 0.10, thus depicting that their
pair-wise comparisons are also consistent. Similarly, the ratings and the pair-wise
comparisons of the individual four experts for the remaining three components (clutch,
gearbox, and hydraulic pump) and their corresponding CR are obtained and shown in
Tables 8-4A to 31-4A in Appendix 4A.
4.3.7.3 Combining the four experts’ judgement to determine the pair-wise comparison
matrix for each decision alternative for each criterion
Considering the ratings from the four experts for the crane bearing, as shown in Appendix
4A, Tables 1-4A, 2-4A, 4-4A and 6-4A, by applying Equation (2.8) and similar techniques
used in Section 4.3.7.2, their value ratings can be combined to determine their pair-wise
comparison values for the crane bearing, as shown in Table 4.5.
Let 𝑒1, 𝑒2, 𝑒3, and 𝑒4 represent Experts 1, 2, 3, and 4 respectively.
TA: FA = (𝑒1 x 𝑒2 x 𝑒3 x 𝑒4)1/4 = (5 x 3 x 5 x 5)1/4 = 4.4
TA: EA = (6 x 1 x 5 x 4)1/4 = 3.31
TA: HRA = (7 x 6 x 5 x 2)1/4 = 4.527
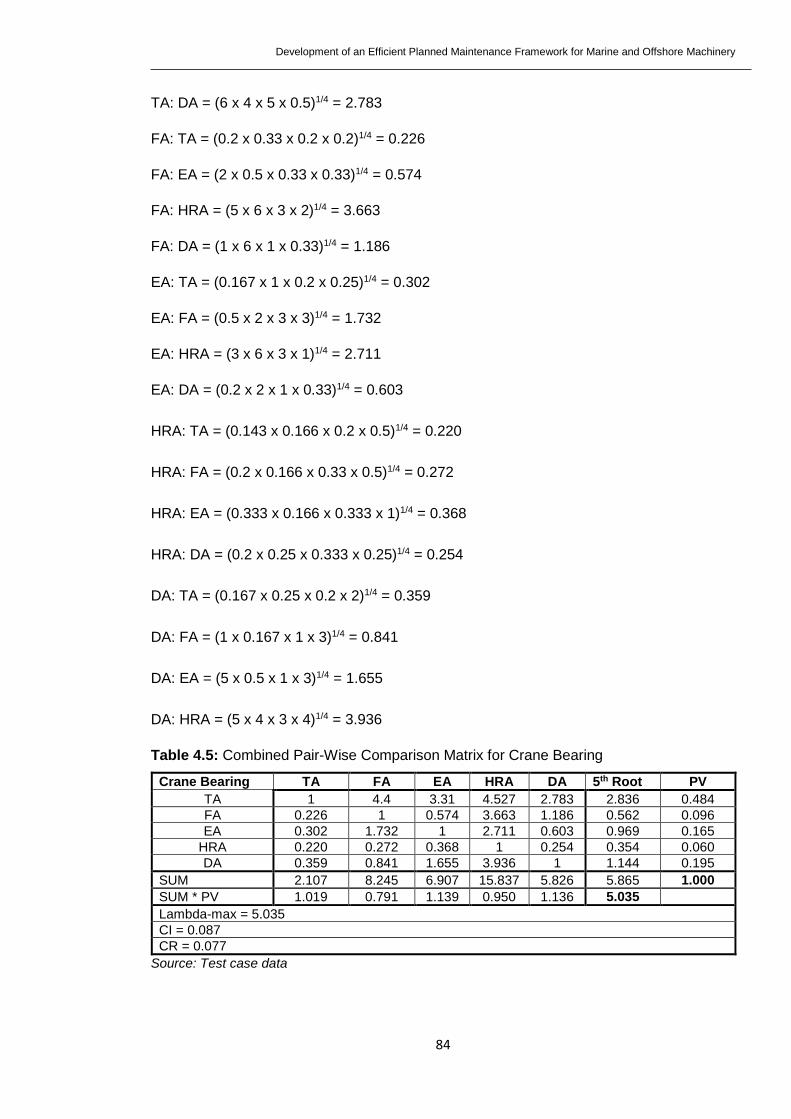
Development of an Efficient Planned Maintenance Framework for Marine and Offshore Machinery
84
TA: DA = (6 x 4 x 5 x 0.5)1/4 = 2.783
FA: TA = (0.2 x 0.33 x 0.2 x 0.2)1/4 = 0.226
FA: EA = (2 x 0.5 x 0.33 x 0.33)1/4 = 0.574
FA: HRA = (5 x 6 x 3 x 2)1/4 = 3.663
FA: DA = (1 x 6 x 1 x 0.33)1/4 = 1.186
EA: TA = (0.167 x 1 x 0.2 x 0.25)1/4 = 0.302
EA: FA = (0.5 x 2 x 3 x 3)1/4 = 1.732
EA: HRA = (3 x 6 x 3 x 1)1/4 = 2.711
EA: DA = (0.2 x 2 x 1 x 0.33)1/4 = 0.603
HRA: TA = (0.143 x 0.166 x 0.2 x 0.5)1/4 = 0.220
HRA: FA = (0.2 x 0.166 x 0.33 x 0.5)1/4 = 0.272
HRA: EA = (0.333 x 0.166 x 0.333 x 1)1/4 = 0.368
HRA: DA = (0.2 x 0.25 x 0.333 x 0.25)1/4 = 0.254
DA: TA = (0.167 x 0.25 x 0.2 x 2)1/4 = 0.359
DA: FA = (1 x 0.167 x 1 x 3)1/4 = 0.841
DA: EA = (5 x 0.5 x 1 x 3)1/4 = 1.655
DA: HRA = (5 x 4 x 3 x 4)1/4 = 3.936
Table 4.5: Combined Pair-Wise Comparison Matrix for Crane Bearing
Crane Bearing TA FA EA HRA DA 5th Root PV
TA 1 4.4 3.31 4.527 2.783 2.836 0.484
FA 0.226 1 0.574 3.663 1.186 0.562 0.096
EA 0.302 1.732 1 2.711 0.603 0.969 0.165
HRA 0.220 0.272 0.368 1 0.254 0.354 0.060
DA 0.359 0.841 1.655 3.936 1 1.144 0.195
SUM 2.107 8.245 6.907 15.837 5.826 5.865 1.000
SUM * PV 1.019 0.791 1.139 0.950 1.136 5.035
Lambda-max = 5.035
CI = 0.087
CR = 0.077
Source: Test case data
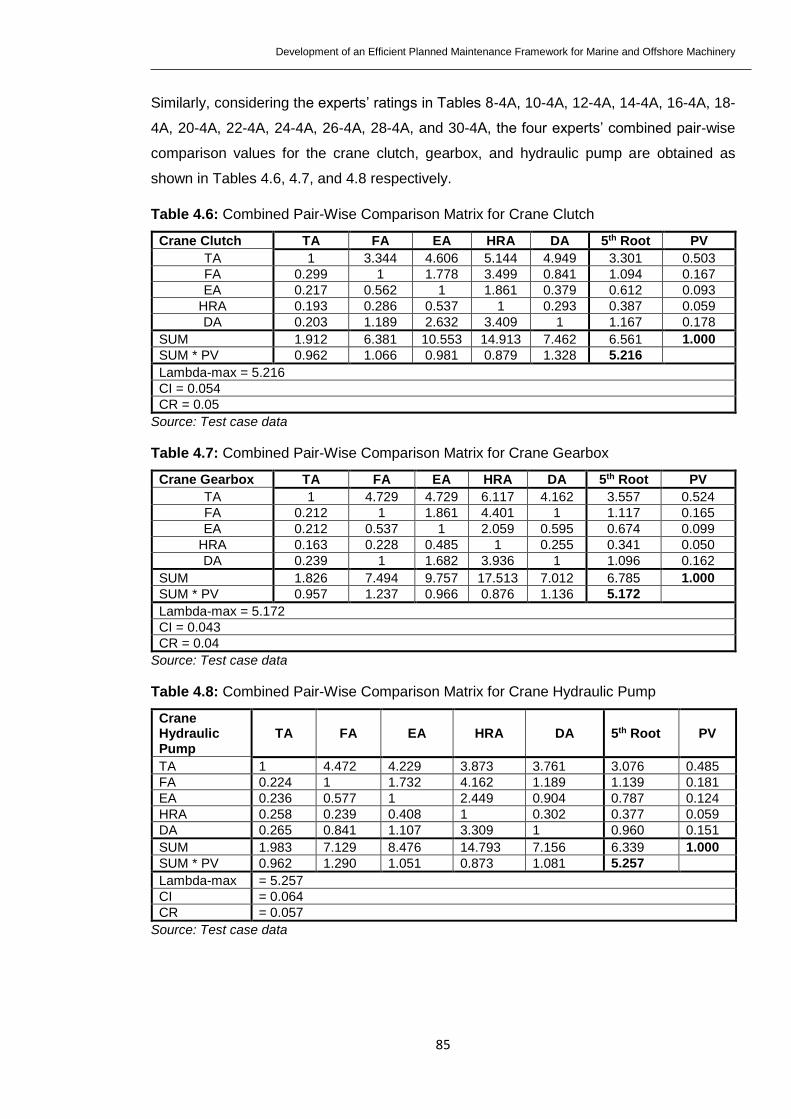
Development of an Efficient Planned Maintenance Framework for Marine and Offshore Machinery
85
Similarly, considering the experts’ ratings in Tables 8-4A, 10-4A, 12-4A, 14-4A, 16-4A, 18-
4A, 20-4A, 22-4A, 24-4A, 26-4A, 28-4A, and 30-4A, the four experts’ combined pair-wise
comparison values for the crane clutch, gearbox, and hydraulic pump are obtained as
shown in Tables 4.6, 4.7, and 4.8 respectively.
Table 4.6: Combined Pair-Wise Comparison Matrix for Crane Clutch
Crane Clutch TA FA EA HRA DA 5th Root PV
TA 1 3.344 4.606 5.144 4.949 3.301 0.503
FA 0.299 1 1.778 3.499 0.841 1.094 0.167
EA 0.217 0.562 1 1.861 0.379 0.612 0.093
HRA 0.193 0.286 0.537 1 0.293 0.387 0.059
DA 0.203 1.189 2.632 3.409 1 1.167 0.178
SUM 1.912 6.381 10.553 14.913 7.462 6.561 1.000
SUM * PV 0.962 1.066 0.981 0.879 1.328 5.216
Lambda-max = 5.216
CI = 0.054
CR = 0.05
Source: Test case data
Table 4.7: Combined Pair-Wise Comparison Matrix for Crane Gearbox
Crane Gearbox TA FA EA HRA DA 5th Root PV
TA 1 4.729 4.729 6.117 4.162 3.557 0.524
FA 0.212 1 1.861 4.401 1 1.117 0.165
EA 0.212 0.537 1 2.059 0.595 0.674 0.099
HRA 0.163 0.228 0.485 1 0.255 0.341 0.050
DA 0.239 1 1.682 3.936 1 1.096 0.162
SUM 1.826 7.494 9.757 17.513 7.012 6.785 1.000
SUM * PV 0.957 1.237 0.966 0.876 1.136 5.172
Lambda-max = 5.172
CI = 0.043
CR = 0.04
Source: Test case data
Table 4.8: Combined Pair-Wise Comparison Matrix for Crane Hydraulic Pump
Crane Hydraulic Pump
TA
FA
EA
HRA
DA
5th Root
PV
TA 1 4.472 4.229 3.873 3.761 3.076 0.485
FA 0.224 1 1.732 4.162 1.189 1.139 0.181
EA 0.236 0.577 1 2.449 0.904 0.787 0.124
HRA 0.258 0.239 0.408 1 0.302 0.377 0.059
DA 0.265 0.841 1.107 3.309 1 0.960 0.151
SUM 1.983 7.129 8.476 14.793 7.156 6.339 1.000
SUM * PV 0.962 1.290 1.051 0.873 1.081 5.257
Lambda-max = 5.257
CI = 0.064
CR = 0.057
Source: Test case data
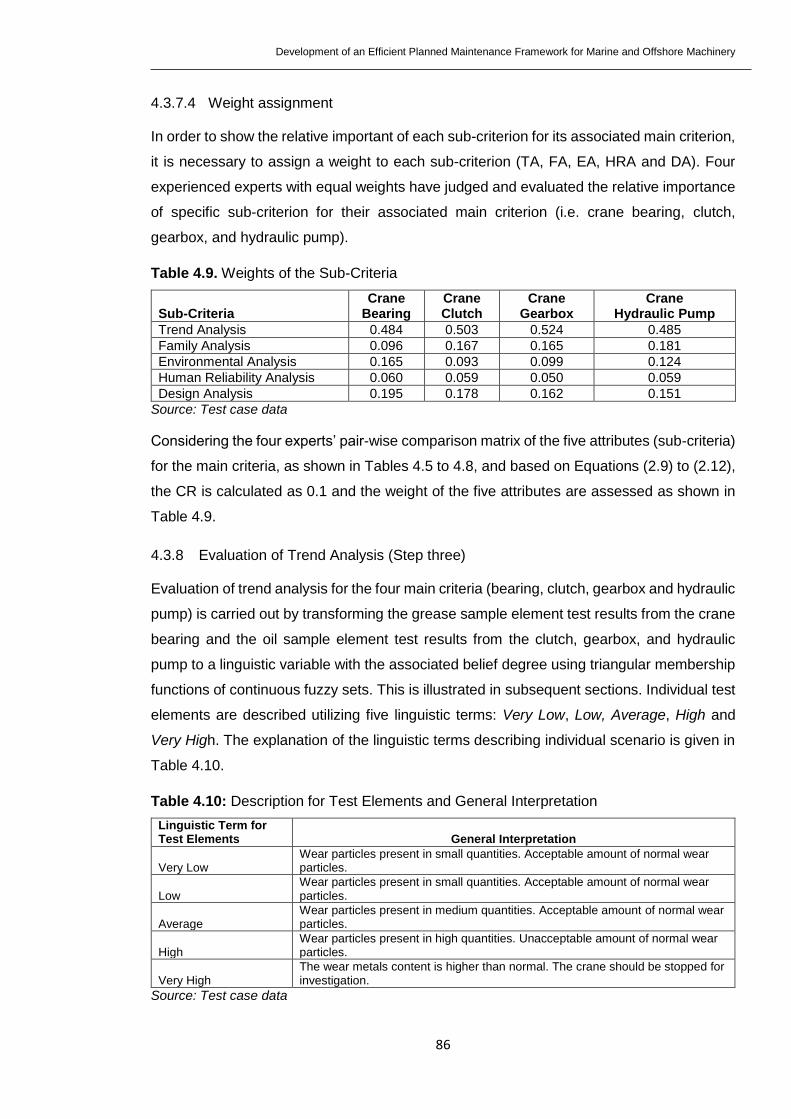
Development of an Efficient Planned Maintenance Framework for Marine and Offshore Machinery
86
4.3.7.4 Weight assignment
In order to show the relative important of each sub-criterion for its associated main criterion,
it is necessary to assign a weight to each sub-criterion (TA, FA, EA, HRA and DA). Four
experienced experts with equal weights have judged and evaluated the relative importance
of specific sub-criterion for their associated main criterion (i.e. crane bearing, clutch,
gearbox, and hydraulic pump).
Table 4.9. Weights of the Sub-Criteria
Sub-Criteria
Crane Bearing
Crane Clutch
Crane Gearbox
Crane Hydraulic Pump
Trend Analysis 0.484 0.503 0.524 0.485
Family Analysis 0.096 0.167 0.165 0.181
Environmental Analysis 0.165 0.093 0.099 0.124
Human Reliability Analysis 0.060 0.059 0.050 0.059
Design Analysis 0.195 0.178 0.162 0.151
Source: Test case data
Considering the four experts’ pair-wise comparison matrix of the five attributes (sub-criteria)
for the main criteria, as shown in Tables 4.5 to 4.8, and based on Equations (2.9) to (2.12),
the CR is calculated as 0.1 and the weight of the five attributes are assessed as shown in
Table 4.9.
4.3.8 Evaluation of Trend Analysis (Step three)
Evaluation of trend analysis for the four main criteria (bearing, clutch, gearbox and hydraulic
pump) is carried out by transforming the grease sample element test results from the crane
bearing and the oil sample element test results from the clutch, gearbox, and hydraulic
pump to a linguistic variable with the associated belief degree using triangular membership
functions of continuous fuzzy sets. This is illustrated in subsequent sections. Individual test
elements are described utilizing five linguistic terms: Very Low, Low, Average, High and
Very High. The explanation of the linguistic terms describing individual scenario is given in
Table 4.10.
Table 4.10: Description for Test Elements and General Interpretation
Linguistic Term for Test Elements
General Interpretation
Very Low
Wear particles present in small quantities. Acceptable amount of normal wear particles.
Low
Wear particles present in small quantities. Acceptable amount of normal wear particles.
Average
Wear particles present in medium quantities. Acceptable amount of normal wear particles.
High
Wear particles present in high quantities. Unacceptable amount of normal wear particles.
Very High
The wear metals content is higher than normal. The crane should be stopped for investigation.
Source: Test case data

Development of an Efficient Planned Maintenance Framework for Marine and Offshore Machinery
87
4.3.8.1 Evaluation of trend analysis for the crane bearing
Table 4.11 shows the laboratory test results obtained for grease samples taken from the
port crane slewing bearing of a FPSO, while Table 4.12 shows the absolute limits for a
crane bearing used grease sample obtained from a reputable oil company. In order to
evaluate the trend analysis for this port crane bearing, each of the grease element test
results listed in Table 4.11, with their corresponding limit in Table 4.12, is transformed to
linguistic variable with associated belief degrees. For example:
Iron (Fe) element in bearing grease samples:
Based on experts’ opinions, the upper limit is found and the rules are written for iron (Fe)
element with equal distributions, demonstrated as follows:
1. If a crane bearing grease sample laboratory test has a result of 100ppm iron (Fe) or
lower, then it can be categorised as 100% Very Low.
2. If a crane bearing grease sample laboratory test has a result of 200ppm iron (Fe),
then it can be categorised as 100% Low.
3. If a crane bearing grease sample laboratory test has a result of 300ppm iron (Fe),
then it can be categorised as 100% Average.
4. If a crane bearing grease sample laboratory test has a result of 400ppm iron (Fe),
then it can be categorised as 100% High.
5. If a crane bearing grease sample laboratory test has a result of 500ppm iron (Fe)
and above, then it can be categorised as 100% Very High.
Based on the above rules, the membership functions of the iron (Fe) can be constructed as
shown in Figure 4.10.
Table 4.11: Grease Sample Report for Ship Port Crane Bearing
Elements Sample 3 Sample 2 Sample 1
Iron (Fe) mg/kg 43 20 27
Chromium (Cr) mg 0 0 5
Molybdenum (Mo) 0 0 0
Tin (Sn) mg/kg 15 0 0
Lead (pb) mg/kg 45 5 14
Copper (Cu) mg/k 122 0 14
Sodium (Na) mg/k 84 59 0
Magnesium (Mn) m 0 24 0
Nickel (Ni) mg/k 5 1 72
Aluminium (Al) m 13 22 174
Silicon (Si) mg/k 8 51 30 Source: Hypothetical data from a reputable oil test laboratory

Development of an Efficient Planned Maintenance Framework for Marine and Offshore Machinery
88
Table 4.12: Absolute Limits for Crane Bearing Used Grease Sample
Test Upper Attention Upper Action
Iron (Fe) 500 750
Chromium (Cr) 8 11
Molybdenum (Mo) 40 50
Tin (Sn) 40 60
Lead (Pb) 15 20
Copper (Cu) 15 20
Sodium (Na) 150 200
Magnesium (Mg) 90 100
Nickel (Ni) 5 8
Aluminium (Al) 90 150
Silicon (Si) 150 250 Source: Hypothetical data from a reputable lubricants manufacturer
Based on the stated rules and by viewing the iron (Fe) contents for the crane bearing grease
test results as an independent criterion, the iron (Fe) contents of 20ppm to 43ppm indicate
that the crane bearing is still in good condition. Thus, 20ppm to 43ppm iron (Fe) contents in
a grease crane bearing can be categorised as 100% Very Low.
Based on the information in Table 4.11, the laboratory test result for grease sample 1
indicates iron (Fe) contents of 27ppm. Based on Figure 4.9 and Equation (2.6), the belief
degrees are calculated as follows:
𝐻𝑛+1 is the Very Low grade; ℎ𝑛+1,𝑖 = 100
ℎ𝑖 = 27, 27 < 100
Very Low Low Average High Very High
100 200 300 400 500
1
Limits
Iron ( Fe )
Figure 4.9: Membership Function of the Iron (Fe) Element – Trend Analysis
Degree of belief

Development of an Efficient Planned Maintenance Framework for Marine and Offshore Machinery
89
Thus, based on rule 1, the iron (Fe) contents in grease sample 1 test result set are assessed
as:
𝑭𝒆�̃� = {(1, Very Low), (0, Low), (0, Average), (0, High), (0, Very High)}
In the similar way, the iron (Fe) contents in grease samples 2 and 3 test result sets are
assessed as:
𝑭𝒆�̃� = {(1, Very Low), (0, Low), (0, Average), (0, High), (0, Very High)}
𝑭𝒆�̃� = {(1, Very Low), (0, Low), (0, Average), (0, High), (0, Very High)}
Using a similar technique, based on expert opinions, the upper limit is found and the rules
for other elements are demonstrated. Based on the given rules, membership functions for
the elements are constructed as shown in Figures 1-4B1 to 11-4B1, Appendix 4B1. Based
on the information in Table 4.11, the laboratory test results set for samples 1, 2, and 3 are
assessed and their corresponding belief degrees are calculated and recorded as shown in
Table 4.13. Thus, with the help of the ER algorithm, the trend analysis for the fuzzy set of
crane bearing grease samples 1, 2 and 3 are conducted and the results shown in Table
4.13.
4.3.8.2 Evaluation of trend analysis for the crane clutch
Table 4.14 shows the laboratory test results obtained for the oil samples taken from the port
crane clutch, while Table 4.15 shows the absolute limits for the crane clutch used oil sample.
Applying the same techniques described in Section 4.3.8.1, and based on the information
in Tables 4.14 and 4.15, the membership functions of the elements in the crane clutch oil
samples 1, 2 and 3 are constructed and shown in Figures 1-4B2 to 9-4B2, Appendix 4B2.
Trend analysis for the fuzzy set of crane clutch oil samples 1, 2 and 3 is conducted and the
results are shown in Table 4.16.
4.3.8.3 Evaluation of trend analysis for the crane gearbox
Table 4.17 shows the laboratory test results obtained for the oil samples taken from the port
crane gearbox, while Table 4.18 shows the absolute limits for the crane used gearbox oil
sample.
In a similar way, and based on the information in Tables 4.17 and 4.18, the membership
functions of the elements in the crane gearbox oil samples are constructed as shown in
Figures 1-4B3 to 12-4B3, Appendix 4B3. Trend analysis for the fuzzy set of crane gearbox
oil samples 1, 2 and 3 is conducted and the results are shown in Table 4.19.
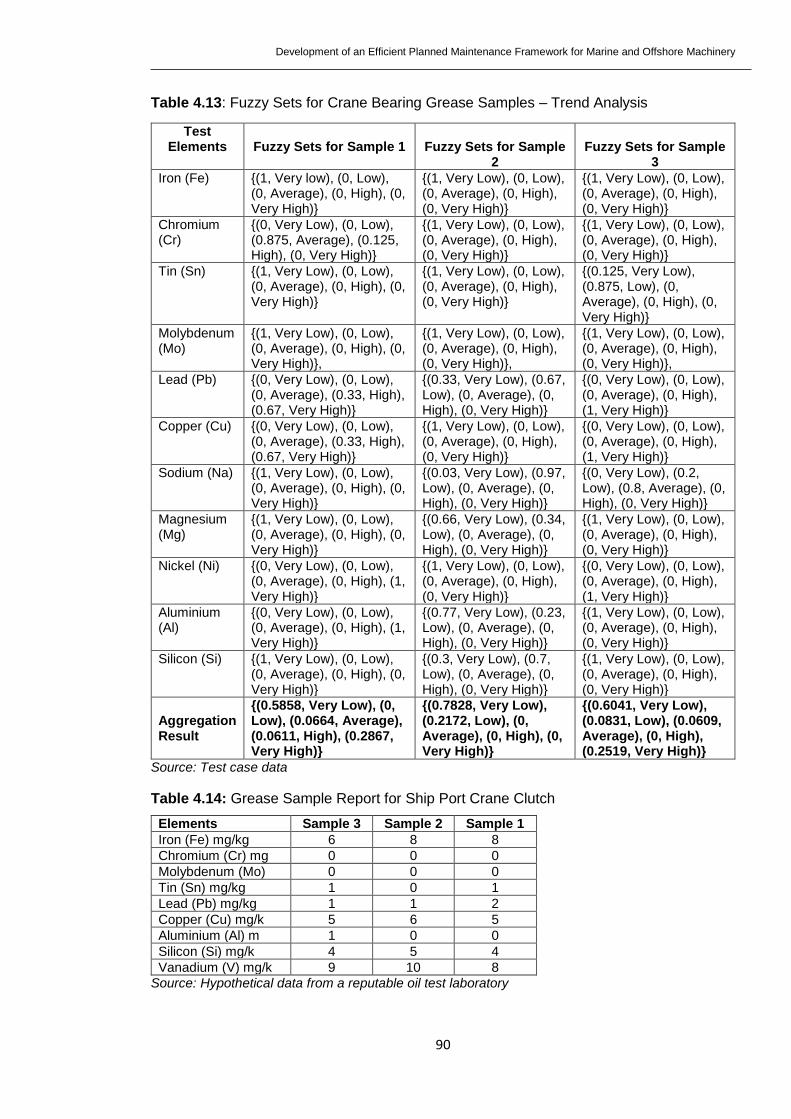
Development of an Efficient Planned Maintenance Framework for Marine and Offshore Machinery
90
Table 4.13: Fuzzy Sets for Crane Bearing Grease Samples – Trend Analysis
Test Elements
Fuzzy Sets for Sample 1
Fuzzy Sets for Sample
2
Fuzzy Sets for Sample
3
Iron (Fe) {(1, Very low), (0, Low), (0, Average), (0, High), (0, Very High)}
{(1, Very Low), (0, Low), (0, Average), (0, High), (0, Very High)}
{(1, Very Low), (0, Low), (0, Average), (0, High), (0, Very High)}
Chromium (Cr)
{(0, Very Low), (0, Low), (0.875, Average), (0.125, High), (0, Very High)}
{(1, Very Low), (0, Low), (0, Average), (0, High), (0, Very High)}
{(1, Very Low), (0, Low), (0, Average), (0, High), (0, Very High)}
Tin (Sn) {(1, Very Low), (0, Low), (0, Average), (0, High), (0, Very High)}
{(1, Very Low), (0, Low), (0, Average), (0, High), (0, Very High)}
{(0.125, Very Low), (0.875, Low), (0, Average), (0, High), (0, Very High)}
Molybdenum (Mo)
{(1, Very Low), (0, Low), (0, Average), (0, High), (0, Very High)},
{(1, Very Low), (0, Low), (0, Average), (0, High), (0, Very High)},
{(1, Very Low), (0, Low), (0, Average), (0, High), (0, Very High)},
Lead (Pb) {(0, Very Low), (0, Low), (0, Average), (0.33, High), (0.67, Very High)}
{(0.33, Very Low), (0.67, Low), (0, Average), (0, High), (0, Very High)}
{(0, Very Low), (0, Low), (0, Average), (0, High), (1, Very High)}
Copper (Cu) {(0, Very Low), (0, Low), (0, Average), (0.33, High), (0.67, Very High)}
{(1, Very Low), (0, Low), (0, Average), (0, High), (0, Very High)}
{(0, Very Low), (0, Low), (0, Average), (0, High), (1, Very High)}
Sodium (Na) {(1, Very Low), (0, Low), (0, Average), (0, High), (0, Very High)}
{(0.03, Very Low), (0.97, Low), (0, Average), (0, High), (0, Very High)}
{(0, Very Low), (0.2, Low), (0.8, Average), (0, High), (0, Very High)}
Magnesium (Mg)
{(1, Very Low), (0, Low), (0, Average), (0, High), (0, Very High)}
{(0.66, Very Low), (0.34, Low), (0, Average), (0, High), (0, Very High)}
{(1, Very Low), (0, Low), (0, Average), (0, High), (0, Very High)}
Nickel (Ni) {(0, Very Low), (0, Low), (0, Average), (0, High), (1, Very High)}
{(1, Very Low), (0, Low), (0, Average), (0, High), (0, Very High)}
{(0, Very Low), (0, Low), (0, Average), (0, High), (1, Very High)}
Aluminium (Al)
{(0, Very Low), (0, Low), (0, Average), (0, High), (1, Very High)}
{(0.77, Very Low), (0.23, Low), (0, Average), (0, High), (0, Very High)}
{(1, Very Low), (0, Low), (0, Average), (0, High), (0, Very High)}
Silicon (Si) {(1, Very Low), (0, Low), (0, Average), (0, High), (0, Very High)}
{(0.3, Very Low), (0.7, Low), (0, Average), (0, High), (0, Very High)}
{(1, Very Low), (0, Low), (0, Average), (0, High), (0, Very High)}
Aggregation Result
{(0.5858, Very Low), (0, Low), (0.0664, Average), (0.0611, High), (0.2867, Very High)}
{(0.7828, Very Low), (0.2172, Low), (0, Average), (0, High), (0, Very High)}
{(0.6041, Very Low), (0.0831, Low), (0.0609, Average), (0, High), (0.2519, Very High)}
Source: Test case data
Table 4.14: Grease Sample Report for Ship Port Crane Clutch
Elements Sample 3 Sample 2 Sample 1
Iron (Fe) mg/kg 6 8 8
Chromium (Cr) mg 0 0 0
Molybdenum (Mo) 0 0 0
Tin (Sn) mg/kg 1 0 1
Lead (Pb) mg/kg 1 1 2
Copper (Cu) mg/k 5 6 5
Aluminium (Al) m 1 0 0
Silicon (Si) mg/k 4 5 4
Vanadium (V) mg/k 9 10 8
Source: Hypothetical data from a reputable oil test laboratory

Development of an Efficient Planned Maintenance Framework for Marine and Offshore Machinery
91
Table 4.15: Absolute Limits for Crane Clutch Oil Tests
Test Upper Attention Upper Action
Iron (Fe) 45 68
Chromium (Cr) 5 8
Molybdenum (Mo) 6 8
Tin (Sn) 10 15
Lead (Pb) 5 11
Copper (Cu) 22 32
Aluminium (Al) 10 15
Silicon (Si) 35 55
Vanadium (V) 40 53
Source: Hypothetical data from a reputable lubricants manufacturer
Table 4.16: Fuzzy Sets for Crane Clutch Oil Samples – Trend Analysis
Test Elements
Fuzzy Sets for Sample 1
Fuzzy Sets for Sample 2
Fuzzy Sets for Sample 3
Iron (Fe) {(1, Very Low), (0, Low), (0, Average), (0, High), (0, Very High)}
{(1, Very low), (0, Low), (0, Average), (0, High), (0, Very High)}
{(1, Very low), (0, Low), (0, Average), (0, High), (0, Very High)}
Chromium (Cr)
{(1, Very low), (0, Low), (0, Average), (0, High), (0, Very High)}
{(1, Very low), (0, Low), (0, Average), (0, High), (0, Very High)}
{(1, Very low), (0, Low), (0, Average), (0, High), (0, Very High)}
Molybdenum (Mo)
{(1, Very low), (0, Low), (0, Average), (0, High), (0, Very High)}
{(1, Very low), (0, Low), (0, Average), (0, High), (0, Very High)}
{(1, Very low), (0, Low), (0, Average), (0, High), (0, Very High)}
Tin (Sn) {(1, Very low), (0, Low), (0, Average), (0, High), (0, Very High)}
{(1, Very low), (0, Low), (0, Average), (0, High), (0, Very High)}
{(1, Very low), (0, Low), (0, Average), (0, High), (0, Very High)}
Lead (Pb) {(0, Very Low), (1, Low), (0, Average), (0, High), (0, Very High)}
{(1, Very Low), (0, Low), (0, Average), (0, High), (0, Very High)}
{(1, Very Low), (0, Low), (0, Average), (0, High), (0, Very High)}
Copper (Cu) {(0.86, Very Low), (0.14, Low), (0, Average), (0, High), (0, Very High)}
{(0.64, Very Low), (0.36, Low), (0, Average), (0, High), (0, Very High)}
{(0.86, Very Low), (0.14, Low), (0, Average), (0, High), (0, Very High)}
Aluminium (Al)
{(1, Very Low), (0, Low), (0, Average), (0, High), (0, Very High)}
{(1, Very Low), (0, Low), (0, Average), (0, High), (0, Very High)}
{(1, Very Low), (0, Low), (0, Average), (0, High), (0, Very High)}
Silicon (Si) {(1, Very Low), (0, Low), (0, Average), (0, High), (0, Very High)}
{(1, Very Low), (0, Low), (0, Average), (0, High), (0, Very High)}
{(1, Very Low), (0, Low), (0, Average), (0, High), (0, Very High)}
Vanadium (V)
{(1, Very Low), (0, Low), (0, Average), (0, High), (0, Very High)}
{(0.75, Very Low), (0.25, Low), (0, Average), (0, High), (0, Very High)}
{(0.875, Very Low), (0.125, Low), (0, Average), (0, High), (0, Very High)}
Aggregation Result
{(0.9134, Very Low), (0.0866, Low), (0, Average), (0, High), (0, Very High)}
{(0.9562, Very Low), (0.0438, Low), (0, Average), (0, High), (0, Very High)}
{(0.9818, Very Low), (0.0182, Low), (0, Average), (0, High), (0, Very High)}
Source: Test case data
Table 4.17: Oil Sample Report for Ship Port Crane Gearbox
Test Elements Sample 3 Sample 2 Sample 1
Water Content %v 0.1 0 0
Total Acid Number (TAN) 0.31 0.42 0.37
Iron (Fe) mg/kg 13 11 15
Chromium (Cr) mg 0 0 0
Molybdenum (Mo) 187 259 513
Tin (Sn) mg/kg 3 0 22
Lead (Pb) mg/kg 0 0 0
Copper (Cu) mg/k 31 29 36
Sodium (Na) mg/k 0 3 0
Aluminium (Al) m 4 3 6
Silicon (Si) mg/ 4 4 9
Vanadium (V) mg/ 0 0 0
Source: Hypothetical data from a reputable oil test laboratory

Development of an Efficient Planned Maintenance Framework for Marine and Offshore Machinery
92
Table 4.18: Absolute Limits for Crane Gearbox Oil Tests
Test Upper Attention Upper Action
Water Content 0.1 0.21
Total Acid No. (TAN) 1.5 2.5
Iron (Fe) 60 98
Chromium (Cr) 4 6
Molybdenum (Mo) 6 9
Tin (Sn) 7 9
Lead (Pb) 28 47
Copper (Cu) 36 60
Aluminium (Al) 7 10
Silicon (Si) 30 40
Sodium (Na) 30 40
Vanadium (V) 5 10
Source: Hypothetical data from a reputable lubricants manufacturer
Table 4.19: Fuzzy Sets for Crane Gearbox Oil Samples – Trend Analysis
Test Elements
Fuzzy Sets for Sample 1
Fuzzy Sets for Sample 2
Fuzzy Sets for Sample 3
Water Content
{(1, Very Low), (0, Low), (0, Average), (0, High), (0, Very High)}
{(1, Very Low), (0, Low), (0, Average), (0, High), (0, Very High)}
{(0, Very Low), (0, Low), (0, Average), (0, High), (1, Very High)}
TAN {(0.76, Very Low), (0.24, Low), (0, Average), (0, High), (0, Very High)}
{(0.6, Very Low), (0.4, Low), (0, Average), (0, High), (0, Very High)}
{(0.96, Very Low), (0.04, Low), (0, Average), (0, High), (0, Very High)}
Iron (Fe) {(0.75, Very Low), (0.25, Low), (0, Average), (0, High), (0, Very High)}
{(1, Very Low), (0, Low), (0, Average), (0, High), (0, Very High)}
{(0.92, Very Low), (0.08, Low), (0, Average), (0, High), (0, Very High)}
Chromium (Cr)
{(1, Very Low), (0, Low), (0, Average), (0, High), (0, Very High)}
{(1, Very Low), (0, Low), (0, Average), (0, High), (0, Very High)}
{(1, Very Low), (0, Low), (0, Average), (0, High), (0, Very High)}
Molybdenum (Mo)
{(0, Very Low), (0, Low), (0, Average), (0, High), (1, Very High)}
{(0, Very Low), (0, Low), (0, Average), (0, High), (1, Very High)}
{(0, Very Low), (0, Low), (0, Average), (0, High), (1, Very High)}
Tin (Sn) {(0, Very Low), (0, Low), (0, Average), (0, High), (1, Very High)}
{(1, Very Low), (0, Low), (0, Average), (0, High), (0, Very High)}
{(0, Very Low), (0.85, Low), (0.15, Average), (0, High), (0, Very High)}
Lead (Pb) {(1, Very Low), (0, Low), (0, Average), (0, High), (0, Very High)}
{(1, Very Low), (0, Low), (0, Average), (0, High), (0, Very High)}
{(1, Very Low), (0, Low), (0, Average), (0, High), (0, Very High)}
Copper (Cu) {(0, Very Low), (0, Low), (0, Average), (0, High), (1, Very High)}
{(0, Very Low), (0, Low), (0, Average), (0.97, High), (0.03, Very High)}
{(0, Very Low), (0, Low), (0, Average), (0.69, High), (0.31, Very High)}
Aluminium (Al)
{(0, Very Low), (0, Low), (0, Average), (0.71, High), (0.29, Very High)}
{(0, Very Low), (0.85, Low), (0.15, Average), (0, High), (0, Very High)}
{(0, Very Low), (0.14, Low), (0.86, Average), (0, High), (0, Very High)}
Silicon (Si) {(0.5, Very Low), (0.5, Low), (0, Average), (0, High), (0, Very High)}
{(1, Very Low), (0, Low), (0, Average), (0, High), (0, Very High)}
{(1, Very Low), (0, Low), (0, Average), (0, High), (0, Very High)}
Sodium (Na) {(1, Very Low), (0, Low), (0, Average), (0, High), (0, Very High)}
{(1, Very Low), (0, Low), (0, Average), (0, High), (0, Very High)}
{(1, Very Low), (0, Low), (0, Average), (0, High), (0, Very High)}
Vanadium (V)
{(1, Very Low), (0, Low), (0, Average), (0, High), (0, Very High)}
{(1, Very Low), (0, Low), (0, Average), (0, High), (0, Very High)}
{(1, Very Low), (0, Low), (0, Average), (0, High), (0, Very High)}
Aggregation Result
{(0.6331, Very Low), (0.0694, Low), (0, Average), (0.0484, High), (0.2491, Very High)}
{(0.7812, Very Low), (0.0816, Low), (0.0096, Average), (0.0618, High), (0.0658, Very High)}
{(0.6298, Very Low), (0.079, Low), (0.0713, Average), (0.0482, High), (0.1717, Very High)}
Source: Test case data
4.3.8.4 Evaluation of trend analysis for the crane hydraulic pump
Table 4.20 shows the laboratory test results obtained for the oil samples taken from the port
crane hydraulic pump, while Table 4.21 shows the absolute limits for the crane used
hydraulic pump oil sample.

Development of an Efficient Planned Maintenance Framework for Marine and Offshore Machinery
93
Table 4.20. Oil Sample Report for Ship Port Crane Hydraulic Pump
Source: Hypothetical data from
a reputable oil test laboratory
Table 4.21. Absolute Limits for Crane Hydraulic Pump Oil Tests
Test Upper Attention Upper Action
Water Content 0.2 0.5
Iron (Fe) 23 36
Chromium (Cr) 6 10
Molybdenum (Mo) 6 10
Tin (Sn) 6 10
Lead (Pb) 8 13
Copper (Cu) 36 55
Sodium (Na) 30 40
Aluminium (Al) 6 10
Silicon (Si) 30 35
Vanadium (V) 5 10
Source: Hypothetical data from a reputable lubricants manufacturer
Table 4.22: Fuzzy Sets for Crane Hydraulic Pump Oil Samples – Trend Analysis
Test Elements
Fuzzy Sets for Sample 1
Fuzzy Sets for Sample 2
Fuzzy Sets for Sample 3
Water Content
{(1, Very Low), (0, Low), (0, Average), (0, High), (0, Very High)}
{(1, Very Low), (0, Low), (0, Average), (0, High), (0, Very High)}
{(1, Very Low), (0, Low), (0, Average), (0, High), (0, Very High)}
Iron (Fe)
{(1, Very Low), (0, Low), (0, Average), (0, High), (0, Very High)}
{(1, Very Low), (0, Low), (0, Average), (0, High), (0, Very High)}
{(1, Very Low), (0, Low), (0, Average), (0, High), (0, Very High)}
Chromium (Cr)
{(1, Very Low), (0, Low), (0, Average), (0, High), (0, Very High)}
{(1, Very Low), (0, Low), (0, Average), (0, High), (0, Very High)}
{(1, Very Low), (0, Low), (0, Average), (0, High), (0, Very High)}
Molybdenum (Mo)
{(1, Very Low), (0, Low), (0, Average), (0, High), (0, Very High)}
{(1, Very Low), (0, Low), (0, Average), (0, High), (0, Very High)}
{(1, Very Low), (0, Low), (0, Average), (0, High), (0, Very High)}
Tin (Sn)
{(1, Very Low), (0, Low), (0, Average), (0, High), (0, Very High)}
{(1, Very Low), (0, Low), (0, Average), (0, High), (0, Very High)}
{(1, Very Low), (0, Low), (0, Average), (0, High), (0, Very High)}
Lead (Pb)
{(1, Very Low), (0, Low), (0, Average), (0, High), (0, Very High)}
{(1, Very Low), (0, Low), (0, Average), (0, High), (0, Very High)}
{(1, Very Low), (0, Low), (0, Average), (0, High), (0, Very High)}
Copper (Cu)
{(1, Very Low), (0, Low), (0, Average), (0, High), (0, Very High)}
{(0.75, Very Low), (0.25, Low), (0, Average), (0, High), (0, Very High)}
{(1, Very Low), (0, Low), (0, Average), (0, High), (0, Very High)}
Aluminium (Al)
{(1, Very Low), (0, Low), (0, Average), (0, High), (0, Very High)}
{(1, Very Low), (0, Low), (0, Average), (0, High), (0, Very High)}
{(1, Very Low), (0, Low), (0, Average), (0, High), (0, Very High)}
Silicon (Si)
{(1, Very Low), (0, Low), (0, Average), (0, High), (0, Very High)}
{(1, Very Low), (0, Low), (0, Average), (0, High), (0, Very High)}
{(1, Very Low), (0, Low), (0, Average), (0, High), (0, Very High)}
Sodium (Na)
{(1, Very Low), (0, Low), (0, Average), (0, High), (0, Very High)}
{(0.5, Very Low), (0.5, Low), (0, Average), (0, High), (0, Very High)}
{(1, Very Low), (0, Low), (0, Average), (0, High), (0, Very High)}
Vanadium (V)
{(1, Very Low), (0, Low), (0, Average), (0, High), (0, Very High)}
{(1, Very Low), (0, Low), (0, Average), (0, High), (0, Very High)}
{(1, Very Low), (0, Low), (0, Average), (0, High), (0, Very High)}
Aggregation Result
{(1, Very Low), (0, Low), (0, Average), (0, High), (0, Very High)}
{(0.9561, Very Low), (0.0439, Low), (0, Average), (0, High), (0, Very High)}
{(1, Very Low), (0, Low), (0, Average), (0, High), (0, Very High)}
Source: Test case data
Test Elements Sample 3 Sample 2 Sample 1
Water Content %v 0 0 0
Iron (Fe) mg/kg 0 0 1
Chromium (Cr) mg 0 0 0
Molybdenum (Mo) 0 0 0
Tin (Sn) mg/kg 0 0 0
Lead (Pb) mg/kg 0 0 0
Copper (Cu) mg/k 0 9 7
Sodium (Na) mg/k 0 9 0
Aluminium (Al) m 0 0 0
Silicon (Si) mg/ 0 0 0
Vanadium (V) mg/ 0 0 0
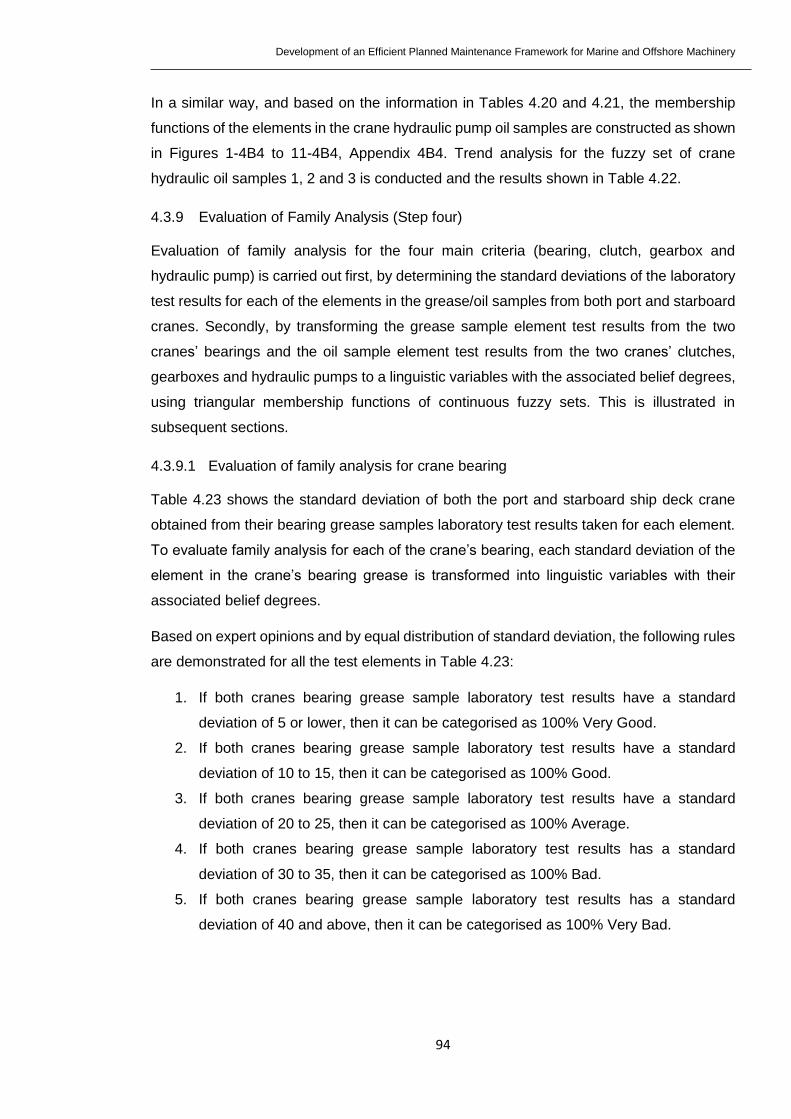
Development of an Efficient Planned Maintenance Framework for Marine and Offshore Machinery
94
In a similar way, and based on the information in Tables 4.20 and 4.21, the membership
functions of the elements in the crane hydraulic pump oil samples are constructed as shown
in Figures 1-4B4 to 11-4B4, Appendix 4B4. Trend analysis for the fuzzy set of crane
hydraulic oil samples 1, 2 and 3 is conducted and the results shown in Table 4.22.
4.3.9 Evaluation of Family Analysis (Step four)
Evaluation of family analysis for the four main criteria (bearing, clutch, gearbox and
hydraulic pump) is carried out first, by determining the standard deviations of the laboratory
test results for each of the elements in the grease/oil samples from both port and starboard
cranes. Secondly, by transforming the grease sample element test results from the two
cranes’ bearings and the oil sample element test results from the two cranes’ clutches,
gearboxes and hydraulic pumps to a linguistic variables with the associated belief degrees,
using triangular membership functions of continuous fuzzy sets. This is illustrated in
subsequent sections.
4.3.9.1 Evaluation of family analysis for crane bearing
Table 4.23 shows the standard deviation of both the port and starboard ship deck crane
obtained from their bearing grease samples laboratory test results taken for each element.
To evaluate family analysis for each of the crane’s bearing, each standard deviation of the
element in the crane’s bearing grease is transformed into linguistic variables with their
associated belief degrees.
Based on expert opinions and by equal distribution of standard deviation, the following rules
are demonstrated for all the test elements in Table 4.23:
1. If both cranes bearing grease sample laboratory test results have a standard
deviation of 5 or lower, then it can be categorised as 100% Very Good.
2. If both cranes bearing grease sample laboratory test results have a standard
deviation of 10 to 15, then it can be categorised as 100% Good.
3. If both cranes bearing grease sample laboratory test results have a standard
deviation of 20 to 25, then it can be categorised as 100% Average.
4. If both cranes bearing grease sample laboratory test results has a standard
deviation of 30 to 35, then it can be categorised as 100% Bad.
5. If both cranes bearing grease sample laboratory test results has a standard
deviation of 40 and above, then it can be categorised as 100% Very Bad.

Development of an Efficient Planned Maintenance Framework for Marine and Offshore Machinery
95
Table 4.23. Standard Deviation for Port and Starboard Cranes Bearing Grease Test Results
PORT CRANE STARBOARD CRANE
Test Elements Sample
3 Sample
2 Sample
1 Sample
3 Sample
2 Sample
1 Average
Value Standard Deviation
Iron (Fe) mg/kg 43 20 27 69 46 20 37.5 19.07
Chromium (Cr) mg
0 0 5 0 0 5 1.667 2.582
Molybdenum (Mo) 0 0 0 0 0 0 0 0
Tin (Sn) mg/kg 15 0 0 7 10 1 5.5 6.221
Lead (Pb) mg/kg 45 5 14 39 14 23 23.33 15.65
Copper (Cu) mg/k 122 0 14 181 0 20 56.17 76.57
Sodium (Na) mg/k 84 59 0 108 56 0 51.17 43.88
Magnesium (Mg) m
0 24 0 0 32 0 9.333 14.68
Nickel (Ni) mg/k 5 1 72 8 3 3 15.33 27.86
Aluminium (Al) m 13 22 174 20 26 15 45 63.37
Silicon (Si) mg 8 51 30 4 66 30 31.5 24.01
Source: Hypothetical data from a reputable oil test laboratory
Iron (Fe) element in bearing grease samples:
Based on the stated rules, the membership functions of iron (Fe) element in crane bearing
grease samples can be constructed as shown in Figure 4.11. Then, by viewing the standard
deviation in iron (Fe) element as an independent criterion, the 19.07 deviations in the grease
samples laboratory test results for the two cranes bearings indicate medium iron (Fe)
contents in the grease samples. Thus, 19.07 deviation in iron (Fe) contents can be
categorised as partially Average and partially Good.
Based on the information in Table 4.23, the standard deviation for iron (Fe) in the two cranes
bearing grease samples test results is 19.07. Based on Figure 4.11 and Equation (2.6), the
belief degrees are calculated as follows:
𝐻𝑛+1 is the Average grade; ℎ𝑛+1,𝑖 = 20
𝐻𝑛 is the Good grade; ℎ𝑛,𝑖 = 15
ℎ𝑖 = 19, 15 < 19 < 20
𝛽𝑛,𝑖 = 20−19
20−15=
1
5= 0.2 = 20% with the Good grade.
𝛽𝑛+1,𝑖 = 1 − 0.2 = 0.8 = 80% with the Average grade.
Therefore, the standard deviation in iron (Fe) for the bearing grease samples set are
assessed as:
𝑭�̃� = {(0, Very Good), (0.2, Good), (0.8, Average), (0, Bad), (0, Very Bad)}
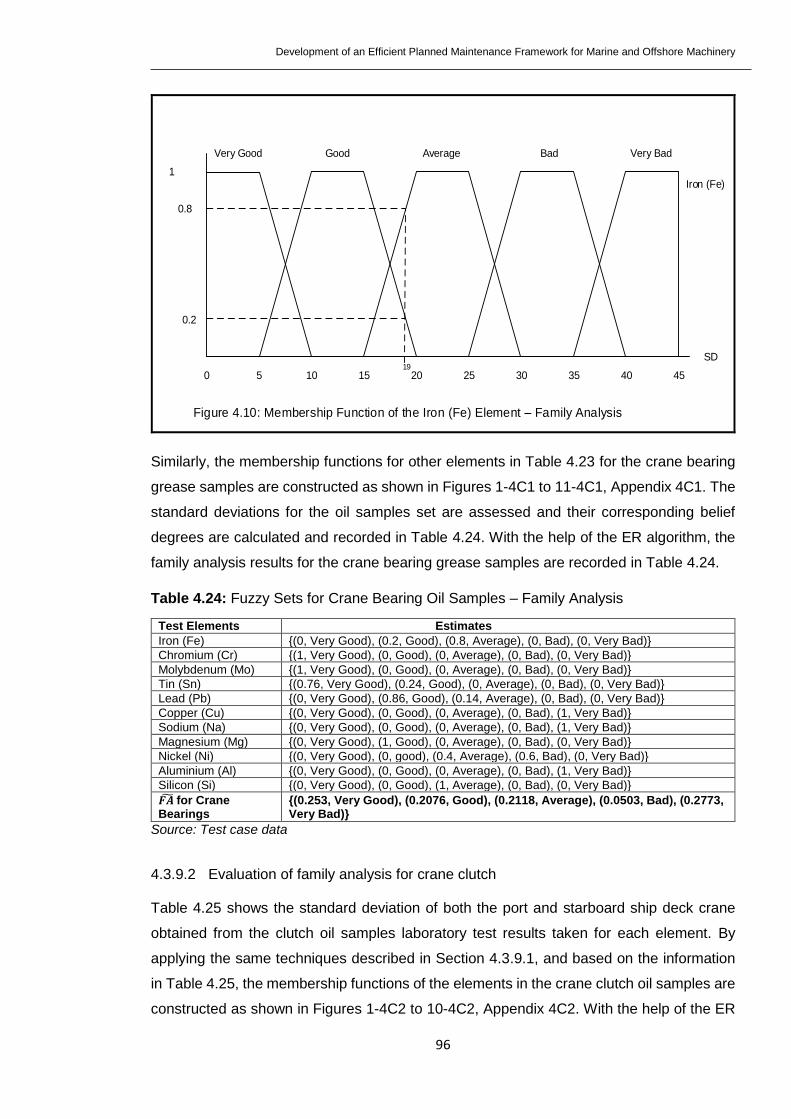
Development of an Efficient Planned Maintenance Framework for Marine and Offshore Machinery
96
Very BadBadAverageGoodVery Good
5 15 25 35 45
1
0
SD
Iron (Fe)
Figure 4.10: Membership Function of the Iron (Fe) Element – Family Analysis
10 20 30 4019
0.8
0.2
Similarly, the membership functions for other elements in Table 4.23 for the crane bearing
grease samples are constructed as shown in Figures 1-4C1 to 11-4C1, Appendix 4C1. The
standard deviations for the oil samples set are assessed and their corresponding belief
degrees are calculated and recorded in Table 4.24. With the help of the ER algorithm, the
family analysis results for the crane bearing grease samples are recorded in Table 4.24.
Table 4.24: Fuzzy Sets for Crane Bearing Oil Samples – Family Analysis
Test Elements Estimates
Iron (Fe) {(0, Very Good), (0.2, Good), (0.8, Average), (0, Bad), (0, Very Bad)}
Chromium (Cr) {(1, Very Good), (0, Good), (0, Average), (0, Bad), (0, Very Bad)}
Molybdenum (Mo) {(1, Very Good), (0, Good), (0, Average), (0, Bad), (0, Very Bad)}
Tin (Sn) {(0.76, Very Good), (0.24, Good), (0, Average), (0, Bad), (0, Very Bad)}
Lead (Pb) {(0, Very Good), (0.86, Good), (0.14, Average), (0, Bad), (0, Very Bad)}
Copper (Cu) {(0, Very Good), (0, Good), (0, Average), (0, Bad), (1, Very Bad)}
Sodium (Na) {(0, Very Good), (0, Good), (0, Average), (0, Bad), (1, Very Bad)}
Magnesium (Mg) {(0, Very Good), (1, Good), (0, Average), (0, Bad), (0, Very Bad)}
Nickel (Ni) {(0, Very Good), (0, good), (0.4, Average), (0.6, Bad), (0, Very Bad)}
Aluminium (Al) {(0, Very Good), (0, Good), (0, Average), (0, Bad), (1, Very Bad)}
Silicon (Si) {(0, Very Good), (0, Good), (1, Average), (0, Bad), (0, Very Bad)}
𝑭𝑨 ̃ for Crane Bearings
{(0.253, Very Good), (0.2076, Good), (0.2118, Average), (0.0503, Bad), (0.2773, Very Bad)}
Source: Test case data
4.3.9.2 Evaluation of family analysis for crane clutch
Table 4.25 shows the standard deviation of both the port and starboard ship deck crane
obtained from the clutch oil samples laboratory test results taken for each element. By
applying the same techniques described in Section 4.3.9.1, and based on the information
in Table 4.25, the membership functions of the elements in the crane clutch oil samples are
constructed as shown in Figures 1-4C2 to 10-4C2, Appendix 4C2. With the help of the ER
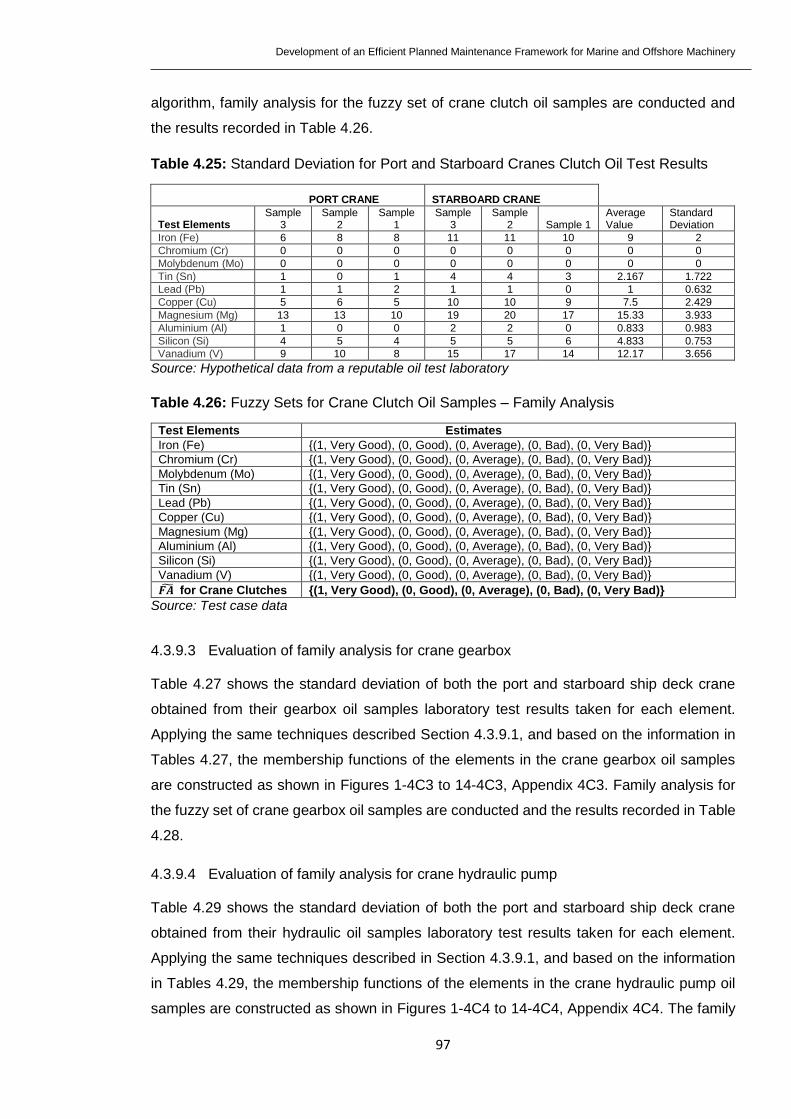
Development of an Efficient Planned Maintenance Framework for Marine and Offshore Machinery
97
algorithm, family analysis for the fuzzy set of crane clutch oil samples are conducted and
the results recorded in Table 4.26.
Table 4.25: Standard Deviation for Port and Starboard Cranes Clutch Oil Test Results
PORT CRANE STARBOARD CRANE
Test Elements Sample
3 Sample
2 Sample
1 Sample
3 Sample
2 Sample 1 Average Value
Standard Deviation
Iron (Fe) 6 8 8 11 11 10 9 2
Chromium (Cr) 0 0 0 0 0 0 0 0
Molybdenum (Mo) 0 0 0 0 0 0 0 0
Tin (Sn) 1 0 1 4 4 3 2.167 1.722
Lead (Pb) 1 1 2 1 1 0 1 0.632
Copper (Cu) 5 6 5 10 10 9 7.5 2.429
Magnesium (Mg) 13 13 10 19 20 17 15.33 3.933
Aluminium (Al) 1 0 0 2 2 0 0.833 0.983
Silicon (Si) 4 5 4 5 5 6 4.833 0.753
Vanadium (V) 9 10 8 15 17 14 12.17 3.656
Source: Hypothetical data from a reputable oil test laboratory
Table 4.26: Fuzzy Sets for Crane Clutch Oil Samples – Family Analysis
Test Elements Estimates
Iron (Fe) {(1, Very Good), (0, Good), (0, Average), (0, Bad), (0, Very Bad)}
Chromium (Cr) {(1, Very Good), (0, Good), (0, Average), (0, Bad), (0, Very Bad)}
Molybdenum (Mo) {(1, Very Good), (0, Good), (0, Average), (0, Bad), (0, Very Bad)}
Tin (Sn) {(1, Very Good), (0, Good), (0, Average), (0, Bad), (0, Very Bad)}
Lead (Pb) {(1, Very Good), (0, Good), (0, Average), (0, Bad), (0, Very Bad)}
Copper (Cu) {(1, Very Good), (0, Good), (0, Average), (0, Bad), (0, Very Bad)}
Magnesium (Mg) {(1, Very Good), (0, Good), (0, Average), (0, Bad), (0, Very Bad)}
Aluminium (Al) {(1, Very Good), (0, Good), (0, Average), (0, Bad), (0, Very Bad)}
Silicon (Si) {(1, Very Good), (0, Good), (0, Average), (0, Bad), (0, Very Bad)}
Vanadium (V) {(1, Very Good), (0, Good), (0, Average), (0, Bad), (0, Very Bad)}
𝑭𝑨 ̃ for Crane Clutches {(1, Very Good), (0, Good), (0, Average), (0, Bad), (0, Very Bad)}
Source: Test case data
4.3.9.3 Evaluation of family analysis for crane gearbox
Table 4.27 shows the standard deviation of both the port and starboard ship deck crane
obtained from their gearbox oil samples laboratory test results taken for each element.
Applying the same techniques described Section 4.3.9.1, and based on the information in
Tables 4.27, the membership functions of the elements in the crane gearbox oil samples
are constructed as shown in Figures 1-4C3 to 14-4C3, Appendix 4C3. Family analysis for
the fuzzy set of crane gearbox oil samples are conducted and the results recorded in Table
4.28.
4.3.9.4 Evaluation of family analysis for crane hydraulic pump
Table 4.29 shows the standard deviation of both the port and starboard ship deck crane
obtained from their hydraulic oil samples laboratory test results taken for each element.
Applying the same techniques described in Section 4.3.9.1, and based on the information
in Tables 4.29, the membership functions of the elements in the crane hydraulic pump oil
samples are constructed as shown in Figures 1-4C4 to 14-4C4, Appendix 4C4. The family
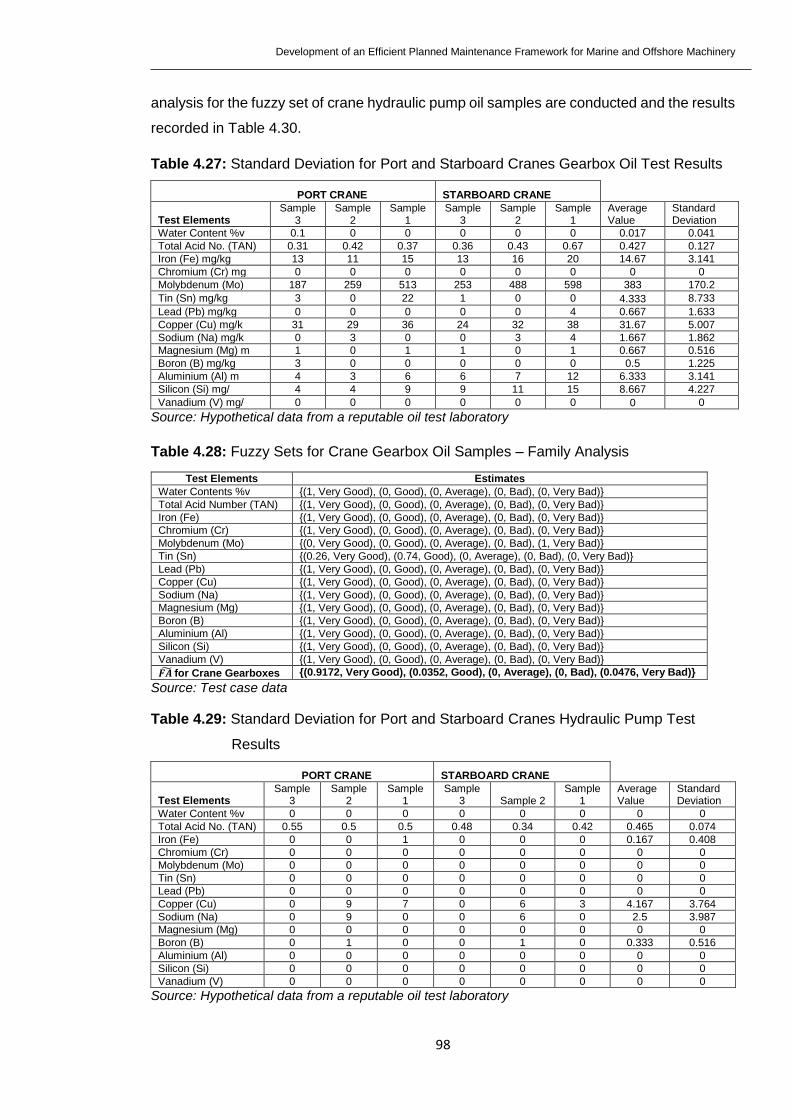
Development of an Efficient Planned Maintenance Framework for Marine and Offshore Machinery
98
analysis for the fuzzy set of crane hydraulic pump oil samples are conducted and the results
recorded in Table 4.30.
Table 4.27: Standard Deviation for Port and Starboard Cranes Gearbox Oil Test Results
PORT CRANE STARBOARD CRANE
Test Elements Sample
3 Sample
2 Sample
1 Sample
3 Sample
2 Sample
1 Average Value
Standard Deviation
Water Content %v 0.1 0 0 0 0 0 0.017 0.041
Total Acid No. (TAN) 0.31 0.42 0.37 0.36 0.43 0.67 0.427 0.127
Iron (Fe) mg/kg 13 11 15 13 16 20 14.67 3.141
Chromium (Cr) mg 0 0 0 0 0 0 0 0
Molybdenum (Mo) 187 259 513 253 488 598 383 170.2
Tin (Sn) mg/kg 3 0 22 1 0 0 4.333 8.733
Lead (Pb) mg/kg 0 0 0 0 0 4 0.667 1.633
Copper (Cu) mg/k 31 29 36 24 32 38 31.67 5.007
Sodium (Na) mg/k 0 3 0 0 3 4 1.667 1.862
Magnesium (Mg) m 1 0 1 1 0 1 0.667 0.516
Boron (B) mg/kg 3 0 0 0 0 0 0.5 1.225
Aluminium (Al) m 4 3 6 6 7 12 6.333 3.141
Silicon (Si) mg/ 4 4 9 9 11 15 8.667 4.227
Vanadium (V) mg/ 0 0 0 0 0 0 0 0
Source: Hypothetical data from a reputable oil test laboratory
Table 4.28: Fuzzy Sets for Crane Gearbox Oil Samples – Family Analysis
Test Elements Estimates
Water Contents %v {(1, Very Good), (0, Good), (0, Average), (0, Bad), (0, Very Bad)}
Total Acid Number (TAN) {(1, Very Good), (0, Good), (0, Average), (0, Bad), (0, Very Bad)}
Iron (Fe) {(1, Very Good), (0, Good), (0, Average), (0, Bad), (0, Very Bad)}
Chromium (Cr) {(1, Very Good), (0, Good), (0, Average), (0, Bad), (0, Very Bad)}
Molybdenum (Mo) {(0, Very Good), (0, Good), (0, Average), (0, Bad), (1, Very Bad)}
Tin (Sn) {(0.26, Very Good), (0.74, Good), (0, Average), (0, Bad), (0, Very Bad)}
Lead (Pb) {(1, Very Good), (0, Good), (0, Average), (0, Bad), (0, Very Bad)}
Copper (Cu) {(1, Very Good), (0, Good), (0, Average), (0, Bad), (0, Very Bad)}
Sodium (Na) {(1, Very Good), (0, Good), (0, Average), (0, Bad), (0, Very Bad)}
Magnesium (Mg) {(1, Very Good), (0, Good), (0, Average), (0, Bad), (0, Very Bad)}
Boron (B) {(1, Very Good), (0, Good), (0, Average), (0, Bad), (0, Very Bad)}
Aluminium (Al) {(1, Very Good), (0, Good), (0, Average), (0, Bad), (0, Very Bad)}
Silicon (Si) {(1, Very Good), (0, Good), (0, Average), (0, Bad), (0, Very Bad)}
Vanadium (V) {(1, Very Good), (0, Good), (0, Average), (0, Bad), (0, Very Bad)}
𝑭𝑨 ̃ for Crane Gearboxes {(0.9172, Very Good), (0.0352, Good), (0, Average), (0, Bad), (0.0476, Very Bad)}
Source: Test case data
Table 4.29: Standard Deviation for Port and Starboard Cranes Hydraulic Pump Test
Results
PORT CRANE STARBOARD CRANE
Test Elements Sample
3 Sample
2 Sample
1 Sample
3 Sample 2 Sample
1 Average Value
Standard Deviation
Water Content %v 0 0 0 0 0 0 0 0
Total Acid No. (TAN) 0.55 0.5 0.5 0.48 0.34 0.42 0.465 0.074
Iron (Fe) 0 0 1 0 0 0 0.167 0.408
Chromium (Cr) 0 0 0 0 0 0 0 0
Molybdenum (Mo) 0 0 0 0 0 0 0 0
Tin (Sn) 0 0 0 0 0 0 0 0
Lead (Pb) 0 0 0 0 0 0 0 0
Copper (Cu) 0 9 7 0 6 3 4.167 3.764
Sodium (Na) 0 9 0 0 6 0 2.5 3.987
Magnesium (Mg) 0 0 0 0 0 0 0 0
Boron (B) 0 1 0 0 1 0 0.333 0.516
Aluminium (Al) 0 0 0 0 0 0 0 0
Silicon (Si) 0 0 0 0 0 0 0 0
Vanadium (V) 0 0 0 0 0 0 0 0
Source: Hypothetical data from a reputable oil test laboratory
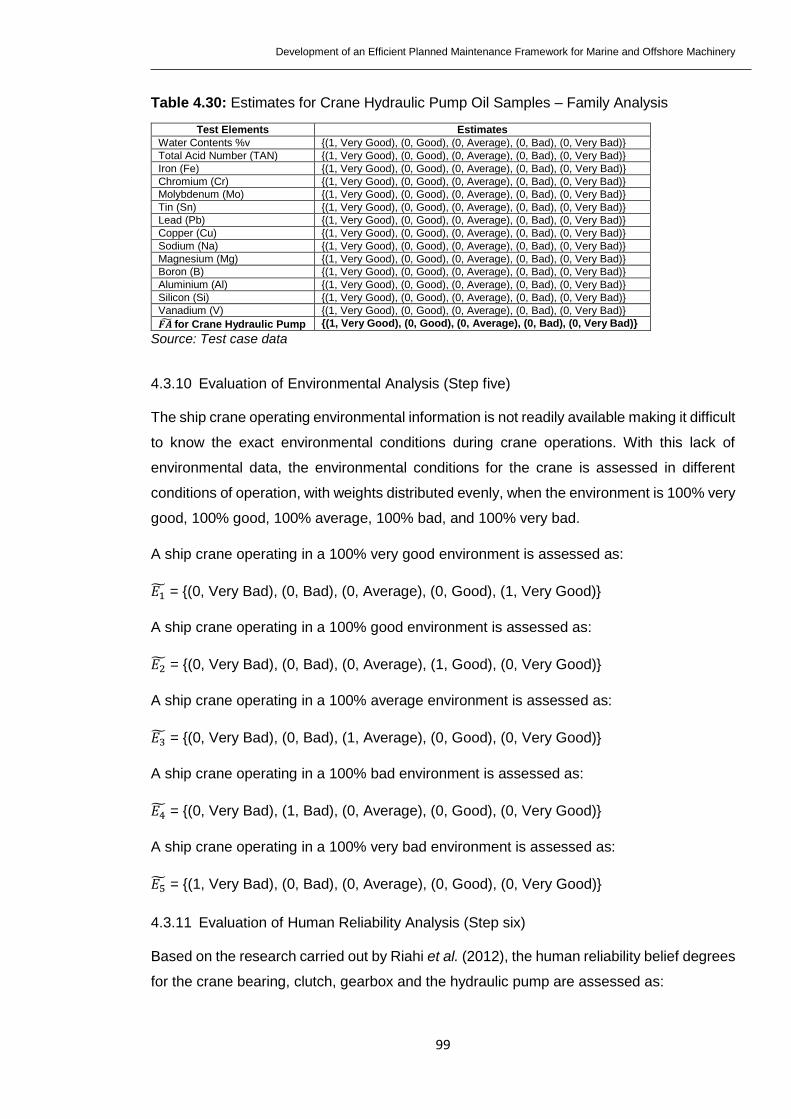
Development of an Efficient Planned Maintenance Framework for Marine and Offshore Machinery
99
Table 4.30: Estimates for Crane Hydraulic Pump Oil Samples – Family Analysis
Test Elements Estimates
Water Contents %v {(1, Very Good), (0, Good), (0, Average), (0, Bad), (0, Very Bad)}
Total Acid Number (TAN) {(1, Very Good), (0, Good), (0, Average), (0, Bad), (0, Very Bad)}
Iron (Fe) {(1, Very Good), (0, Good), (0, Average), (0, Bad), (0, Very Bad)}
Chromium (Cr) {(1, Very Good), (0, Good), (0, Average), (0, Bad), (0, Very Bad)}
Molybdenum (Mo) {(1, Very Good), (0, Good), (0, Average), (0, Bad), (0, Very Bad)}
Tin (Sn) {(1, Very Good), (0, Good), (0, Average), (0, Bad), (0, Very Bad)}
Lead (Pb) {(1, Very Good), (0, Good), (0, Average), (0, Bad), (0, Very Bad)}
Copper (Cu) {(1, Very Good), (0, Good), (0, Average), (0, Bad), (0, Very Bad)}
Sodium (Na) {(1, Very Good), (0, Good), (0, Average), (0, Bad), (0, Very Bad)}
Magnesium (Mg) {(1, Very Good), (0, Good), (0, Average), (0, Bad), (0, Very Bad)}
Boron (B) {(1, Very Good), (0, Good), (0, Average), (0, Bad), (0, Very Bad)}
Aluminium (Al) {(1, Very Good), (0, Good), (0, Average), (0, Bad), (0, Very Bad)}
Silicon (Si) {(1, Very Good), (0, Good), (0, Average), (0, Bad), (0, Very Bad)}
Vanadium (V) {(1, Very Good), (0, Good), (0, Average), (0, Bad), (0, Very Bad)}
𝑭𝑨 ̃ for Crane Hydraulic Pump {(1, Very Good), (0, Good), (0, Average), (0, Bad), (0, Very Bad)}
Source: Test case data
4.3.10 Evaluation of Environmental Analysis (Step five)
The ship crane operating environmental information is not readily available making it difficult
to know the exact environmental conditions during crane operations. With this lack of
environmental data, the environmental conditions for the crane is assessed in different
conditions of operation, with weights distributed evenly, when the environment is 100% very
good, 100% good, 100% average, 100% bad, and 100% very bad.
A ship crane operating in a 100% very good environment is assessed as:
𝐸1̃ = {(0, Very Bad), (0, Bad), (0, Average), (0, Good), (1, Very Good)}
A ship crane operating in a 100% good environment is assessed as:
𝐸2̃ = {(0, Very Bad), (0, Bad), (0, Average), (1, Good), (0, Very Good)}
A ship crane operating in a 100% average environment is assessed as:
𝐸3̃ = {(0, Very Bad), (0, Bad), (1, Average), (0, Good), (0, Very Good)}
A ship crane operating in a 100% bad environment is assessed as:
𝐸4̃ = {(0, Very Bad), (1, Bad), (0, Average), (0, Good), (0, Very Good)}
A ship crane operating in a 100% very bad environment is assessed as:
𝐸5̃ = {(1, Very Bad), (0, Bad), (0, Average), (0, Good), (0, Very Good)}
4.3.11 Evaluation of Human Reliability Analysis (Step six)
Based on the research carried out by Riahi et al. (2012), the human reliability belief degrees
for the crane bearing, clutch, gearbox and the hydraulic pump are assessed as:

Development of an Efficient Planned Maintenance Framework for Marine and Offshore Machinery
100
𝑯𝑹�̃� = {(0.1649, High), (0.1958, Fairly High), (0.4355, Medium), (0.2038, Fairly Low), (0,
Low)}
4.3.12 Evaluation of Design Analysis (Step seven)
In the test case, the machine components specified by the manufacturers as Good are given
an attribute of 1, while the machine components specified as Bad are given an attributed of
0. Considering the four components (main criteria) of the crane, according to the crane
manufacturer, these components are said to be in good condition. Thus, based on the
manufacturer’s recommendation, the design analysis belief degrees for each crane bearing,
clutch, gearbox, and the hydraulic pump, can be assessed as:
𝐷�̃� = {(0, Very Bad), (0, Bad), (0, Average), (1, Good), (0, Very Good)}
4.3.13 Aggregation Operations on Criteria Results using ER (Step eight)
Aggregation operations on the sub-criteria and the main criteria are carried out using the
ER algorithm (Equations (2.13) to (2.22)), and the weights (Table 4.9) obtained with the
help of AHP, as follows:
4.3.13.1 Aggregation of sub-criteria
The sub-criteria (TA, FA, EA, HRA and DA) for the three oil samples (1, 2 and 3) are
aggregated, as shown in Tables 1-4D to 12-4D (Appendix 4D), and the results are
presented in Tables 4.31, 4.32 and 4.33.
Table 4.31: Aggregation Results of Sub-Criteria for Sample 1
Bearing (B1) {(0.2251, Very Bad), (0.0658, Bad), (0.0978, Average), (0.1996, Good), (0.4117, Very Good)}
Clutch (C1) {(0.0121, Very Bad), (0.0129, Bad), (0.0191, Average), (0.1552, Good), (0.8006, Very Good)}
Gearbox (G1) {(0.1602, Very Bad), (0.0403, Bad), (0.0205, Average), (0.1615, Good), (0.6175, Very Good)}
Hydraulic Pump (H1)
{(0.0124, Very Bad), (0.0130, Bad), (0.0182, Average), (0.0132, Good), (0.9432, Very Good)}
Source: Test case data
Table 4.32: Aggregation Results of Sub-Criteria for Sample 2
Bearing (B2) {(0.0460, Very Bad), (0.0275, Bad), (0.0490, Average), (0.1395, Good), (0.7380, Very Good)}
Clutch (C2) {(0.0094, Very Bad), (0.0100, Bad), (0.0148, Average), (0.0254, Good), (0.9404, Very Good)}
Gearbox (G2) {(0.0412, Very Bad), (0.0366, Bad), (0.0198, Average), (0.0478, Good), (0.8545, Very Good)}
Hydraulic Pump (H2)
{(0.0127, Very Bad), (0.0134, Bad), (0.0186, Average), (0.0283, Good), (0.9269, Very Good)}
Source: Test case data

Development of an Efficient Planned Maintenance Framework for Marine and Offshore Machinery
101
Table 4.33: Aggregation Results of Sub-Criteria for Sample 3
Bearing (B3) {(0.1754, Very Bad), (0.0296, Bad), (0.0820, Average), (0.0835, Good), (0.6294, Very Good)}
Clutch (C3) {(0.0092, Very Bad), (0.0098, Bad), (0.0146, Average), (0.0162, Good), (0.9501, Very Good)}
Gearbox (G3) {(0.0962, Very Bad), (0.0341, Bad), (0.0502, Average), (0.0515, Good), (0.7680, Very Good)}
Hydraulic Pump (H3)
{(0.0124, Very Bad), (0.0130, Bad), (0.0182, Average), (0.0132, Good), (0.9432, Very Good)}
Source: Test case data
4.3.13.2 Aggregation of the main criteria
Based on the expert judgements, the main criteria are equally important. Therefore, the
weights for the main criteria are evenly distributed among them. Samples 1, 2 and 3 fuzzy
output sets – (B1, C1, G1, H1), (B2, C2, G2, H2) and (B3, C3, G3, H3) respectively – are
aggregated with the help of the ER algorithm and the results are presented in Tables 4.34,
4.35 and 4.36.
Table 4.34: Aggregation of Main Criteria from Fuzzy Sets Output of Sample 1
Main Criteria
Fuzzy Set
Utility Value
Bearing (B1)
{(0.2251, Very Bad), (0.0658, Bad), (0.0978, Average), (0.1996, Good), (0.4117, Very Good)}
0.6268
Clutch (C1)
{(0.0121, Very Bad), (0.0129, Bad), (0.0191, Average), (0.1552, Good), (0.8006, Very Good)}
0.9299
Gearbox (G1)
{(0.1602, Very Bad), (0.0403, Bad), (0.0205, Average), (0.1615, Good), (0.6175, Very Good)}
0.7590
Hyd. Pump (H1)
{(0.0124, Very Bad), (0.0130, Bad), (0.0182, Average), (0.0132, Good), (0.9432, Very Good)}
0.9655
Aggregation result (S1)
{(0.0829, Very Bad), (0.0261, Bad), (0.0308, Average), (0.1095, Good), (0.7507, Very Good)}
0.8548
Source: Test case data
Table 4.35: Aggregation of Main Criteria from Fuzzy Sets Output of Sample 2
Main Criteria
Fuzzy Set
Utility Value
Bearing (B2)
{(0.0460, Very Bad), (0.0275, Bad), (0.0490, Average), (0.1395, Good), (0.7380, Very Good)}
0.8740
Clutch (C2)
{(0.0094, Very Bad), (0.0100, Bad), (0.0148, Average), (0.0254, Good), (0.9404, Very Good)}
0.9694
Gearbox (G2)
{(0.0412, Very Bad), (0.0366, Bad), (0.0198, Average), (0.0478, Good), (0.8545, Very Good)}
0.9095
Hyd. Pump (H2)
{(0.0127, Very Bad), (0.0134, Bad), (0.0186, Average), (0.0283, Good), (0.9269, Very Good)}
0.9609
Aggregation result (S2)
{(0.0190, Very Bad), (0.0152, Bad), (0.0178, Average), (0.0425, Good), (0.9054, Very Good)}
0.9500
Source: Test case data

Development of an Efficient Planned Maintenance Framework for Marine and Offshore Machinery
102
Table 4.36: Aggregation of Main Criteria from Fuzzy Sets Output of Sample 3
Main Criteria
Fuzzy Set
Utility Value
Bearing (B3)
{(0.1754, Very Bad), (0.0296, Bad), (0.0820, Average), (0.0835, Good), (0.6294, Very Good)}
0.7405
Clutch (C3)
{(0.0092, Very Bad), (0.0098, Bad), (0.0146, Average), (0.0162, Good), (0.9501, Very Good)}
0.9721
Gearbox (G3)
{(0.0962, Very Bad), (0.0341, Bad), (0.0502, Average), (0.0515, Good), (0.7680, Very Good)}
0.8403
Hyd. Pump (H3)
{(0.0124, Very Bad), (0.0130, Bad), (0.0182, Average), (0.0132, Good), (0.9432, Very Good)}
0.9655
Aggregation result (S3)
{(0.0536, Very Bad), (0.0156, Bad), (0.0299, Average), (0.0298, Good), (0.8711, Very Good)}
0.9123
Source: Test case data
4.3.14 Obtaining a Crisp Number for the Goal (Step Nine)
Based on Tables 4.34, 4.35, and 4.36, the sample 1 (S1), sample 2 (S2), and sample 3 (S3)
fuzzy output sets for the crane’s condition (i.e. Goal) are obtained as:
𝑆1̃ = {(0.0829, Very Bad), (0.0261, Bad), (0.0308, Average), (0.1095, Good), (0.7507, Very Good)}
𝑆2̃ = {(0.0190, Very Bad), (0.0152, Bad), (0.0178, Average), (0.0425, Good), (0.9054, Very Good)}
𝑆3̃ = {(0.0536, Very Bad), (0.0156, Bad), (0.0299, Average), (0.0298, Good), (0.8711, Very Good)
To obtain a single crisp value for each of the three samples, the utility value associated with
each linguistic term is calculated using Equations (4.2) to (4.4), as shown in Table 4.37.
Considering the fact that the fuzzy output sets for the crane (Goal) are characterised by five
linguistic terms, the highest preference is given to the Very Good linguistic term, while the
lowest preference is given to the Very Bad linguistic term. Therefore, the ranking value is
apportioned from five (i.e. highest preference) to one (i.e. lowest preference). The crane’s
assessments, as shown in Table 4.37, are complete. The utility values of the crane based
on sample 1 (S1), sample 2 (S2), and sample 3 (S3), as shown in Table 4.37, are calculated
to be:
S1 = 0.8548, S2 = 0.9500, S3 = 0.9123
From the utility values obtained, it can be noted that sample 2 (S2) scores the highest utility
value of 0.950. From these results it can be deduced that the crane’s condition was not very
good when oil sample 1 was being taken from the components and sent for testing, then
the condition was improved when oil sample 2 was taken, but started deteriorating when oil
sample 3 was taken. However, it can be argued that either the oil topping or sampling
intervals can influence the results.

Development of an Efficient Planned Maintenance Framework for Marine and Offshore Machinery
103
Table 4.37: Utility Value
Source: Test case data
Similarly, to assess the condition of the main criteria, the utility values for each main criterion
in samples 1, 2, and 3 are calculated and the results shown in Tables 4.34, 4.35, and 4.36
respectively.
4.3.15 Sensitivity Analysis (Final step)
To test the certainty of the delivery of the analysis results, the three axioms mentioned in
Section 4.2.10 are used in the sample 2 input data in Tables 5-4D to 8-4D (Appendix 4D).
The degrees of belief associated with the highest preference linguistic values of all the
𝐻𝑛 Very Good Good Average Bad Very Bad
𝑉𝑛 5 4 3 2 1
𝑈(𝐻𝑛) 5 − 1
5 − 1= 1
4 − 1
5 − 1= 0.75
3 − 1
5 − 1= 0.5
2 − 1
5 − 1= 0.25
1 − 1
5 − 1= 0
𝛽𝑛(𝑆1) 0.7507 0.1095 0.0308 0.0261 0.0829
∑ 𝛽𝑛
5
𝑛=1
0.7507 + 0.1095 + 0.0308 + 0.0261 + 0.0829 = 1 (complete)
𝛽𝑛𝑈(𝐻𝑛) 0.7507 0.082125 0.0154 0.006525 0
S1 Condition values of the crane =
∑ 𝛽𝑛
5
𝑛=1
𝑈(𝐻𝑛) = 0.85475 ≈ 0.8548
𝛽𝑛(𝑆2) 0.9054 0.0425 0.0178 0.0152 0.0190
∑ 𝛽𝑛
5
𝑛=1
0.9054 + 0.0425 + 0.0178 + 0.0152 + 0.0190 = 1 (complete)
𝛽𝑛𝑈(𝐻𝑛) 0.9054 0.031875 0.0089 0.0038 0
S2 Condition values of the crane =
∑ 𝛽𝑛
5
𝑛=1
𝑈(𝐻𝑛) = 0.949975 ≈ 0.9500
𝛽𝑛(𝑆3) 0.8711 0.0298 0.0299 0.0156 0.0536
∑ 𝛽𝑛
5
𝑛=1
0.8711 + 0.0298 + 0.0299 + 0.0156 + 0.0536 = 1 (complete)
𝛽𝑛𝑈(𝐻𝑛) 0.8711 0.02235 0.01495 0.0039 0
S3 Condition values of the crane =
∑ 𝛽𝑛
5
𝑛=1
𝑈(𝐻𝑛) = 0.9123

Development of an Efficient Planned Maintenance Framework for Marine and Offshore Machinery
104
combined sub-criteria are decreased by 0.2, while simultaneously increasing the degrees
of belief associated with the lowest preference linguistic values of each of the combined
sub-criteria, as shown in Appendix 4E (Tables 1-4E to 4-4E). The aggregation results
obtained are shown in Table 4.38. All the results obtained remain in harmony with axioms
1 and 2. Also, by using a similar technique to that described in Section 4.3.14, the crane’s
utility value from a 0.2 decrement of sample 2 input data is evaluated to be 0.7774, as
shown in Table 4.38.
To examine the alignment of the model with axiom 3, each original fuzzy set results for
sample 2 in Table 4.32 and the 0.2 decrement fuzzy set results for sample 2 in Table 4.38
are varied and aggregated using the ER algorithm, as shown in Tables 1-4F to 4-4F of
Appendix 4F. The results obtained are shown in Table 4.39. The comparative utility values
(ship crane reliability) for the crane bearing (B2), clutch (C2), gearbox (G2), and hydraulic
pump (H2) obtained are also listed in Table 4.39 and shown in Figure 4.12. The lowest utility
value of the ship crane is evaluated as 0.909. In view of the fact that 0.7774 (value of
aggregation result in Table 4.38) is smaller than 0.909, this means the result is aligned with
Axiom 3.
From Figure 4.12, it is obvious that the ship crane is more sensitive to the crane bearing
(B2) and gearbox (G2) than to the other main-criteria. Therefore, the ranking orders in Figure
4.12 are consistent with those given by Lloyd’s Register (2011), Aldridge (2012) and
Konecranes (2012).
Table 4.38: Aggregation Results for Sample 2 Due to Decrement by 0.2
Main Criteria
Fuzzy Set
Utility Value
Bearing (B2)
{(0.2483, Very Bad), (0.0301, Bad), (0.0536, Average), (0.1525, Good), (0.5155, Very Good)}
0.6642
Clutch (C2)
{(0.1797, Very Bad), (0.0115, Bad), (0.0170, Average), (0.0291, Good), (0.7627, Very Good)}
0.7959
Gearbox (G2)
{(0.2330, Very Bad), (0.0410, Bad), (0.0221, Average), (0.0535, Good), (0.6503, Very Good)}
0.7118
Hydraulic Pump (H2)
{(0.1863, Very Bad), (0.0153, Bad), (0.0213, Average), (0.0324, Good), (0.7447, Very Good)}
0.7835
Aggregation Result
{(0.1835, Very Bad), (0.0193, Bad), (0.0225, Average), (0.0536, Good), (0.7211, Very Good)}
0.7774
Source: Test case data

Development of an Efficient Planned Maintenance Framework for Marine and Offshore Machinery
105
Table 4.39: Aggregation Results for the Variation of each 0.2 Decrement Values with the
Original Fuzzy Sets in the Main Criteria
Main Criteria
Sample 2 Fuzzy Set
Utility Value
Bearing (B2)
{(0.0572, Very Bad), (0.0164, Bad), (0.0195, Average), (0.0470, Good), (0.8599, Very Good)}
0.909
Clutch (C2)
{(0.0510, Very Bad), (0.0160, Bad), (0.0188, Average), (0.0446, Good), (0.8695, Very Good)}
0.916
Gearbox (G2)
{(0.0550, Very Bad), (0.0166, Bad), (0.0190, Average), (0.0453, Good), (0.8641, Very Good)}
0.912
Hydraulic Pump (H2)
{(0.0517, Very Bad), (0.0161, Bad), (0.0189, Average), (0.0448, Good), (0.8686, Very Good)}
0.916
Source: Test case data
Figure 4.11: Sensitivity of the Model Output to the Variation of the Alteration with Original
in each Main Criterion
4.4 Discussions
This chapter outlines a novel methodology for evaluating a ship’s crane performance by
means of its conditional reliability. The methodology for evaluating a ship’s crane reliability
and the procedure for applying it in a real life scenario has been illustrated in the case study
in Section 4.3. This model is one of the first to concede that a ship’s crane reliability value
is not fixed and it may change due to certain factors, such as the trend analysis (i.e. pattern
of behaviour developed over a period of time), family analysis (i.e. typical identical pattern
of behaviour), environmental analysis (i.e. changes in the sea state), human reliability
analysis (i.e. operator’s well-being), as well as design analysis (i.e. crane’s physical
behaviour as stated by the manufacturer).
0.904
0.906
0.908
0.91
0.912
0.914
0.916
0.918
B2 C2 G2 H2
Condition Value
Development of an Efficient Planned Maintenance Framework for Marine and Offshore Machinery
106
For example, if the grade of design analysis in a ship’s crane bearing is very bad, and the
grade of the environment (sea condition) is very rough, then owing to the roughness of the
sea and instability of the ship, the engineer on-board would not be able to carry out the
scheduled maintenance work on the crane’s bearing. Thus, the crane grade will decrease
from a good grade to an average grade. As a result, the reliability of the crane will alter. The
oil sample 2 reliability value for the ship’s crane bearing when the environmental condition
was good (E2 value in Table 5-4C, Appendix 4C) is 4.6% lower than that of the same crane’s
bearing with a very good grade of design when operating in a very good environmental
condition (E1 value in Table 5-4C, Appendix 4C). Therefore, during the conceptual stage of
the ship’s crane bearing design, the manufacturer should take into consideration uncertain
environmental conditions throughout the life cycle of the crane bearing.
The gearbox is another component that can significantly influence a ship’s crane reliability.
Based on the analysis, it can be deduced that if the grade in a ship’s crane gearbox is very
high (0.9095 in Table 4.35), then the crane’s reliability value is about 11% more than that
of the same crane with a very low grade (0.7590 in Table 4.34). Furthermore, according to
Figure 4.12, B2, and G2, are recorded low condition values for crane bearing and gearbox
alterations respectively when compared to other crane components.
A survey conducted by Lloyd’s Register (2011) indicates that several slew bearings failures
have occurred in cranes in recent years, with catastrophic results. Moreover, based on an
incident report by Aldridge (2012) and case study by Konecranes (2012), gearbox
malfunction is very common in ship cranes, while the crane reliability survey (CRS) shows
that gearbox failures can result in catastrophic crane failure. Thus, the results of these
analyses confirmed their findings, and gives emphasis to the importance of design,
inspections, and condition monitoring in ship’s crane components.
The evaluation of a ship’s crane performance can be used to develop a preventive measure
against incidents. This can be achieved by correctly measuring the crane’s performance
and regularly taking oil samples from the crane’s components and analysing it as
scheduled. The grade of a ship’s crane performance is significant in identifying and taking
preventive measures against incidents at sea, as well as in ports, and for ensuring the
appropriate performance of operations on-board.
A ship’s crane design is highly dependent on the crane’s manufacturer and the ship owner’s
requirements, whereas, the ship’s crane trend analysis, family analysis, and human
reliability analysis are highly dependent on the ship owner’s strategies. Unfortunately, not
much can be done with regards to the environmental analysis, as this is a natural
phenomenon that is not dependent on either the ship owner or the ship crane manufacturer.

Development of an Efficient Planned Maintenance Framework for Marine and Offshore Machinery
107
However, with proper ship crane design and the implementation of correct condition
monitoring strategies, the environmental impacts can be significantly reduced and well
managed, therefore leading to a reduction in the frequency of ship crane incidents.
Furthermore, a well-structured maintenance regime, in accordance with the manufacturer’s
recommendations, can reduce the chances of unexpected defects occurring and can
ultimately improve the reliability and operational life of the crane.
4.5 Conclusion
This chapter has proposed a FER-SAM to monitor the ship’s crane risk of failure in a
systematic fashion. The usefulness of the FER-SAM is demonstrated for condition-based
decision-making. The approach outlined how a subjective condition-based decision making
process can be achieved during situations of high uncertainties in ship’s crane operations.
The subjective condition monitoring of the investigated system parameters was first carried
out using an AHP approach, then assessment grades were mapped into a common utility
space before synthesizing for robust decision-making. This generic approach has
highlighted a unique feature associated with the performance and unification of input and
output data.
The ER approach employed provides a procedure for aggregation which can preserve the
original features of multiple attributes under high and imprecise situations. The inclusion of
trend analysis, family analysis, environmental analysis, human reliability, and design
analysis to the ship's crane condition monitoring approach (CMA) will help to ensure that
findings are incorporated within the maintenance management process for future reference.
If each of the analyses is applied to each wear metal for each crane component tested in a
programme, the data evaluation process will become too clumsy. Therefore, realistically,
the ideal analysis programme would be a combination of the five analysis techniques
discussed in this research work.
This approach also provides a rational, reliable and transparent method for decision-making
analysis with a group of experts under situations of high uncertainties. It can therefore be
reasonably expected that the application of this approach will facilitate the development of
a robust and enhanced marine and offshore environment for machinery systems operations.
As revealed in the final result, the developed FER-SAM does provide some levels of
confidence in monitoring the condition of ship’s crane components; however, it cannot deal
with the dependencies of the criteria. It is therefore essential to develop an integrated risk
assessment using Fuzzy Rule Base Method that will account for this shortfall in a systematic
manner, and this is provided in the next chapter.
Development of an Efficient Planned Maintenance Framework for Marine and Offshore Machinery
108
Chapter 5
An Integrated Risk Assessment for Maintenance Prediction of Oil
Wetted Gearbox and Bearing in Marine and Offshore Industries
Using a Fuzzy Rule Base Method
Summary
This chapter presents an integrated risk assessment methodology for maintenance
prediction of oil wetted gearbox and bearing in marine and offshore machinery with
emphasis on ship cranes. Predictive maintenance uses important parameters measured in
the equipment to “feel” when breakdown is eminent. This type of maintenance intends to
make interventions on machinery before harmful events may occur (Bastos et al., 2012).
In Chapter 4, the analysis result indicated that both bearing and gearbox are the most
sensitive components of the ship crane. The aim of this chapter is to assess the risk levels
of these components (bearing and gearbox) using fuzzy rule based judgement for common
elements and their sources, which will provide the ship crane operators with a means to
predict possible impending failure without having to dismantle the crane. Furthermore, to
monitor the rate of wear in gearbox and bearing of a ship crane, the ship crane reliability
(SCR), and a trend to provide an operational baseline of data that will help the engineers to
detect abnormal wear rates as they develop, are established.
Within the scope of this research, a risk assessment model will be developed that will be
capable of determining the risk levels of a crane’s components and recommending solutions
using all the diagnostic capability obtainable for effective condition monitoring of the
gearbox and bearing in ship cranes.
5.1 Introduction
In today’s revolutionary computer and information age, oil sampling analysis has developed
into a mandatory tool. It has not only proven to be an effective condition monitoring tool for
equipment failure, but is also a crucial element in a marine crane’s condition monitoring. As
a predictive maintenance tool, oil analysis can be used to uncover, isolate, and offer
solutions for abnormal lubricant and machine conditions. If these abnormalities are left
unchecked, they could have detrimental consequences, including health and safety risks.
Development of an Efficient Planned Maintenance Framework for Marine and Offshore Machinery
109
Oil analysis is performed during routine preventive maintenance to provide meaningful and
accurate information on lubricant and machine condition. By tracking oil analysis sample
results over the life of a particular machine, trends can be established that could help
eliminate costly repairs.
In addition to monitoring oil contamination and wear metals, modern usage of oil analysis
includes the analysis of the additives in oils to determine if an extended drain interval may
be used. Maintenance costs can be reduced using oil analysis to determine the remaining
useful life of additives in the oil. By comparing the oil analysis results of fresh and used oil,
a tribologist can determine when an oil must be replaced. Careful analysis might even allow
the oil to be "sweetened" to its original additive levels by either adding fresh oil or
replenishing additives that were depleted.
The information contained in this research is particularly useful for the effective condition
monitoring of ship crane gearbox and bearing. This risk assessment tool can also be used
as an information technology application to monitor the performance of lubricant products,
as well as a tool that specifies what the problem/remedy is in the event of failure of a piece
of equipment/component.
5.2. Used Oil Sampling Analysis of Marine Crane Bearing and Gearbox
Oil sampling analysis is known to be an effective condition-monitoring tool for marine crane
bearing and gearbox diagnosis. This involves a representative sample being taken, which
ensures that there is as much information per millimetre of oil as possible. This information
relates to such criteria as cleanliness and dryness of the oil, depletion of additives, and the
presence of wear particles being generated by the crane. The second goal is to minimize
data disturbance. The sample should be extracted so that the concentration of information
is uniform, consistent, and representative. The lubricant sample is then assessed by a
suitable analytical method to identify signs of increased wear and evidence of unwanted
contaminants or lubricant degradation. It is important to make sure that the sample does
not become contaminated during the sampling process. This can distort and disturb the
data, making it difficult to distinguish what was originally in the oil, from what came into the
oil during the sampling process (Fitch, 2004).
5.3 Methodology
Investing in maintenance prediction in the operations of marine machinery system requires
networks of robust decision making tailored towards improving the capability of the system
to exhibit required performance. A major modelling assumption in this chapter is that, some
overlaps in the description of all risk attributes can be observed, however, the main issue
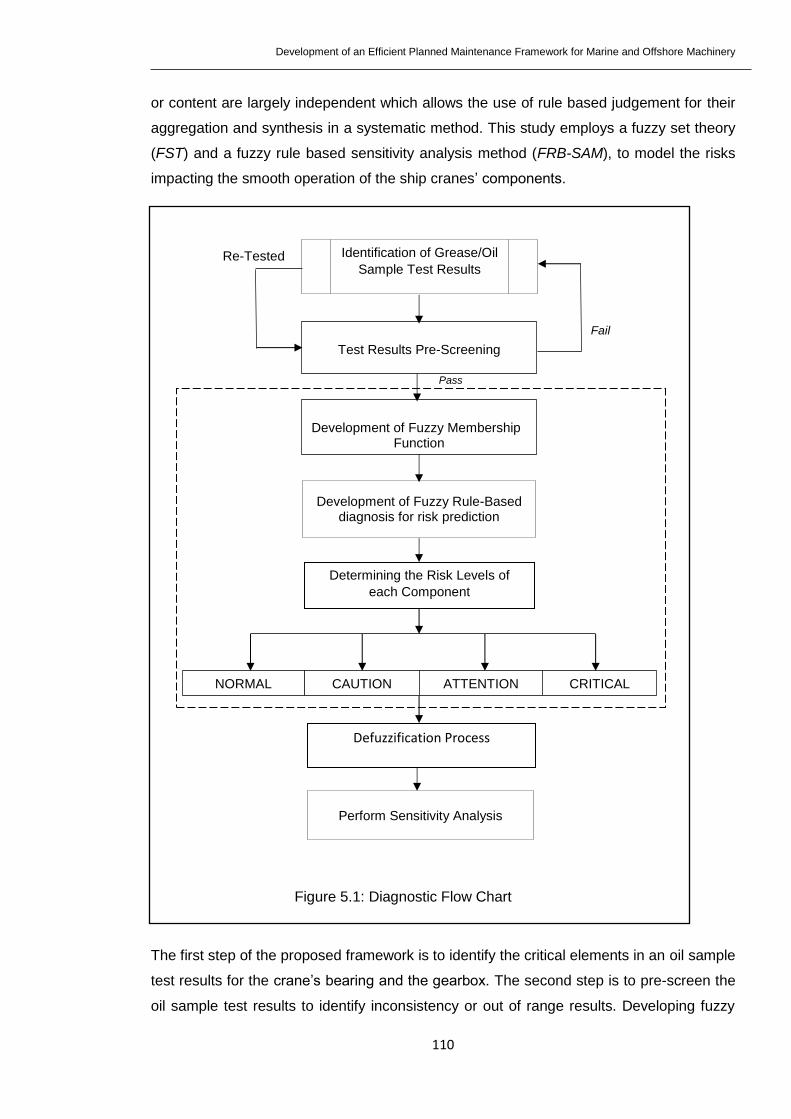
Development of an Efficient Planned Maintenance Framework for Marine and Offshore Machinery
110
or content are largely independent which allows the use of rule based judgement for their
aggregation and synthesis in a systematic method. This study employs a fuzzy set theory
(FST) and a fuzzy rule based sensitivity analysis method (FRB-SAM), to model the risks
impacting the smooth operation of the ship cranes’ components.
Figure 5.1: Diagnostic Flow Chart
The first step of the proposed framework is to identify the critical elements in an oil sample
test results for the crane’s bearing and the gearbox. The second step is to pre-screen the
oil sample test results to identify inconsistency or out of range results. Developing fuzzy
Pass
Re-Tested
Fail Test Results Pre-Screening
Development of Fuzzy Rule-Based diagnosis for risk prediction
CAUTION CRITICAL NORMAL
Development of Fuzzy Membership
Function
Perform Sensitivity Analysis
Identification of Grease/Oil
Sample Test Results
ATTENTION
Determining the Risk Levels of
each Component
Defuzzification Process

Development of an Efficient Planned Maintenance Framework for Marine and Offshore Machinery
111
membership functions for the test elements of each crane’s component that passes the pre-
screening process follows this. The fourth step is to develop a FRB diagnosis for risk
prediction of the crane’s bearing and the gearbox. Lastly, a set of fuzzy conclusions is
achieved using the “min-max” method.
Since the study incorporates FST into a FRB method, a set of linguistic priority terms along
with the membership functions describing the relationship between elements in each
hierarchy of the RB is adopted. Thus, the minimum value comparisons between the
elements in each hierarchy using FST are established.
The proposed model in a stepwise regression is presented in the following sections and the
framework of this methodology for evaluating the diagnostic process of the used oil sample
test results for the crane bearing and gearbox is shown in Figure 5.1.
5.3.1 Identification of Grease/Oil Sample Test Results (Step one)
Under this process, critical elements in the used grease/oil laboratory analysis reports given
in Chapter 4 are identified for both port and starboard deck crane slewing bearing/gearbox
for the pre-screening process.
5.3.2 Pre-Screening of the Test Results (Step two)
The pre-screening process is used to identify inconsistency in the test results, out of range
test results, or mistyping during test result entry as a result of human error. The process
considers only numeric test results. At pre-screening, the sample test results are initially
screened against a specific range (min – max values). The min and max values for an
individual test can differ based on the laboratories and lubricant manufacturers. If the test
element(s) in a sample fail pre-screening, the sample is sent back for retest. Pre-screening
on a sample will then happen again when the re-tested results are entered (i.e. if sample is
sent for retesting, it is considered again for the pre-screening until it passes the pre-
screening process).
The following steps are part of the pre-screening process:
1. The pre-screening process fetches all the tests conducted for a sample, the test
results, and their min/max values.
2. The sample test results are compared against the predefined min/max values.
3. A test fails pre-screening if the results are outside the min and max values. Failed
test samples are sent for retest. During retest, the out of range values are normally
corrected.
4. Retested samples are then sent through the pre-screening process.

Development of an Efficient Planned Maintenance Framework for Marine and Offshore Machinery
112
Rules for pre-screening process:
IF (Test Result ≥ Lower Action) & (Test Result ≤ Upper Action)
THEN, Pre-Screening Passed
ELSE, Pre-screening Failed
Explanation of the Rule:
Each test result is checked to see whether it is within the min and max limits (i.e. Lower
Action and Upper Action) set for that test; if it falls within that range, the test result passes
pre-screening; otherwise, the sample fails pre-screening.
5.3.3 Development of Fuzzy Membership Function (Step three)
According to Wang (1997), fuzzy membership functions can be used to define the fuzzy
input subset from an input variable. The membership functions considered in this study are
based on the criteria for oil sample elements and are generated using triangular shapes to
reduce computational times, unlike trapezoidal shapes which takes a longer time. A fuzzy
membership function is developed for each of the identified critical elements based on their
corresponding limits provided. These limits are obtained from a reputable oil company. The
membership function for each linguistic priority term is evaluated within its limits on an
arbitrary scale from 0 to 1. The fuzzy membership function has already been discussed
extensively in Chapters 2 and 4 of this thesis.
5.3.4 Development of Fuzzy Rule-Based Diagnosis for Risk Prediction (Step four)
In this section, a fuzzy rule-based diagnosis is produced for predicting the condition of crane
bearing and gearbox, utilising the laboratory oil sample test results as the input data. The
linguistic terms used in developing the membership functions described in Section 5.3.3 are
utilized to reflect the priority level of alertness.
5.3.5 Determining the Risk Levels of each Component (Step five)
The priority level (PL) of a specific scenario will be decided based on the fuzzy rule base
developed in Section 5.3.4. Using a ‘min-max’ approach, the set of fuzzy conclusions of the
scenario will be obtained in terms of membership function values associated with linguistic
priority terms. In order to activate the developed rule base, firing rules will be used to obtain
the output grade (i.e. normal, caution, attention, or critical) based on the results obtained
from the min-max method. When applying the ‘min-max’ approach, the following steps are
taken:

Development of an Efficient Planned Maintenance Framework for Marine and Offshore Machinery
113
Identify the possible combinations of the test elements in which the membership
values associated with the corresponding linguistic priority terms are not zero. The
outputs of such combinations can be obtained from the fuzzy rule base developed.
Obtaining the output of the test elements combinations from the fuzzy rule base is
also known as firing rules.
Determine the minimum value of each combination by comparing the values
obtained from each element and the value of the belief degree established in the
priority level (PL).
Determine the highest minimum values obtained from step 2 with respect to each
linguistic priority term.
From the above, each maximum value and its associated linguistic priority term is a fuzzy
conclusion. Each set of fuzzy conclusions of each scenario will be defuzzified using the
method proposed in Section 5.3.6. If there is only one rule that can be applied to the
scenario in question, then the minimum value of the membership function and the linguistic
priority term associated will be the set of fuzzy conclusions.
5.3.6 Defuzzification Process (Step six)
The defuzzification process is used to create a single crisp ranking from the fuzzy
conclusion set (i.e. the priority level of scenarios to express the machinery condition).
According to Runkler and Glesner (1993), several defuzzification algorithms have been
developed and used in creating a single crisp ranking. The one selected for use in this
chapter is the weighted arithmetic mean (WAM) of non-empty set of data. This algorithm
averages the points of maximum possibility of each priority level of scenarios, weighted by
their degree of truth at which the membership functions reach their maximum values
(Andrew and Moss, 2002), (Pillay and Wang, 2002). The formula used for WAM is as
follows:
𝑊𝐴𝑀 = ∑ 𝑤𝑖𝑥𝑖
𝑛𝑖=1
∑ 𝑤𝑖𝑛𝑖=1
(5.1)
For normalized weights, the weighted mean is simply:
𝑊𝐴𝑀 = ∑ 𝑤𝑖𝑥𝑖𝑛𝑖=1 (5.2)
where, 𝑤𝑖 is the degree of truth of the maximum value of the 𝑖𝑡ℎ linguistic priority term, and
𝑥𝑖 is the risk rank of the maximum value of the 𝑖𝑡ℎ linguistic priority term. A lower WAM value
will indicate that the machinery condition is less risky, while a higher WAM value indicates
that the condition of the machinery is at risk, and as such immediate action should be taken.
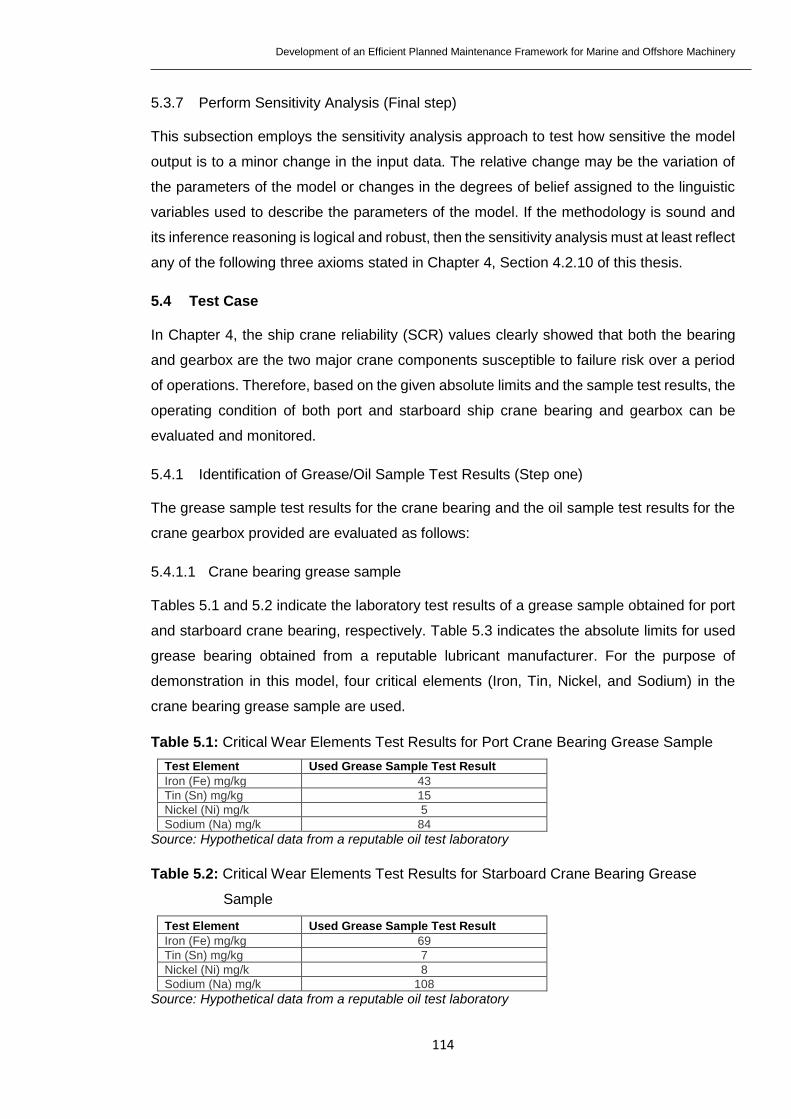
Development of an Efficient Planned Maintenance Framework for Marine and Offshore Machinery
114
5.3.7 Perform Sensitivity Analysis (Final step)
This subsection employs the sensitivity analysis approach to test how sensitive the model
output is to a minor change in the input data. The relative change may be the variation of
the parameters of the model or changes in the degrees of belief assigned to the linguistic
variables used to describe the parameters of the model. If the methodology is sound and
its inference reasoning is logical and robust, then the sensitivity analysis must at least reflect
any of the following three axioms stated in Chapter 4, Section 4.2.10 of this thesis.
5.4 Test Case
In Chapter 4, the ship crane reliability (SCR) values clearly showed that both the bearing
and gearbox are the two major crane components susceptible to failure risk over a period
of operations. Therefore, based on the given absolute limits and the sample test results, the
operating condition of both port and starboard ship crane bearing and gearbox can be
evaluated and monitored.
5.4.1 Identification of Grease/Oil Sample Test Results (Step one)
The grease sample test results for the crane bearing and the oil sample test results for the
crane gearbox provided are evaluated as follows:
5.4.1.1 Crane bearing grease sample
Tables 5.1 and 5.2 indicate the laboratory test results of a grease sample obtained for port
and starboard crane bearing, respectively. Table 5.3 indicates the absolute limits for used
grease bearing obtained from a reputable lubricant manufacturer. For the purpose of
demonstration in this model, four critical elements (Iron, Tin, Nickel, and Sodium) in the
crane bearing grease sample are used.
Table 5.1: Critical Wear Elements Test Results for Port Crane Bearing Grease Sample
Test Element Used Grease Sample Test Result
Iron (Fe) mg/kg 43
Tin (Sn) mg/kg 15
Nickel (Ni) mg/k 5
Sodium (Na) mg/k 84
Source: Hypothetical data from a reputable oil test laboratory
Table 5.2: Critical Wear Elements Test Results for Starboard Crane Bearing Grease
Sample
Test Element Used Grease Sample Test Result
Iron (Fe) mg/kg 69
Tin (Sn) mg/kg 7
Nickel (Ni) mg/k 8
Sodium (Na) mg/k 108
Source: Hypothetical data from a reputable oil test laboratory

Development of an Efficient Planned Maintenance Framework for Marine and Offshore Machinery
115
Table 5.3: Absolute Limits for Crane Bearing Used Grease
Test Lower Action Lower Attention Upper Attention Upper Action
Iron (Fe) 140 375 500 750
Tin (Sn) 10 29 40 60
Nickel (Ni) 1 3 5 8
Sodium (Na) 35 80 150 200
Source: Hypothetical data from a reputable oil company
5.4.1.2 Crane gearbox oil sample
Tables 5.4 and 5.5 indicate the laboratory test results of an oil sample obtained for the port
and starboard crane gearbox, respectively. Table 5.6 indicates the absolute limits for used
oil analysis obtained from a reputable lubricant manufacturer. Only four critical elements
(Iron, Tin, Aluminium, and Silicon) in the crane gearbox oil sample are used.
Table 5.4: Critical Wear Elements Test Results for Port Crane Gearbox Oil Sample
Test Element Used Oil Sample Test Result
Iron (Fe) mg/kg 13
Tin (Sn) mg/kg 3
Aluminium (Al) m 4
Silicon (Si) mg/ 4
Source: Hypothetical data from a reputable oil test laboratory
Table 5.5: Critical Wear Elements Test Results for Starboard Crane Gearbox Oil Sample
Test Element Used Oil Sample Test Result
Iron (Fe) mg/kg 13
Tin (Sn) mg/kg 1
Aluminium (Al) m 6
Silicon (Si) mg/kg 9
Source: Hypothetical data from a reputable oil test laboratory
Table 5.6: Absolute Limits for Crane Gearbox Used Oil
Test Lower Action Lower Attention Upper Attention Upper Action
Iron (Fe) 24 49 60 98
Tin (Sn) 1.5 5 7 9
Aluminium (Al) 2.5 4.5 7 10
Silicon (Si) 7 15 30 40
Source: Hypothetical data from a reputable oil company
5.4.2 Test Results Pre-Screening (Step two)
In order to pre-screen the test results obtained for the samples from both port and starboard
cranes, a set of rules is generated based on the absolute limits provided in Tables 5.3 and
5.6.
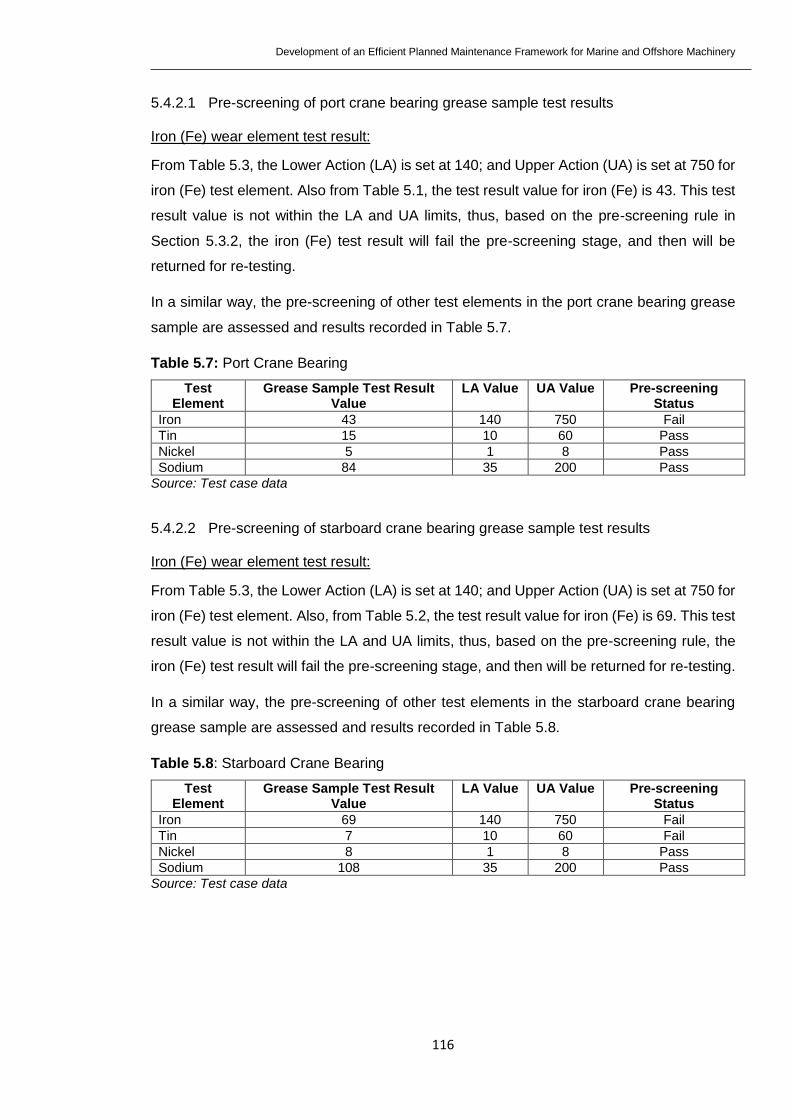
Development of an Efficient Planned Maintenance Framework for Marine and Offshore Machinery
116
5.4.2.1 Pre-screening of port crane bearing grease sample test results
Iron (Fe) wear element test result:
From Table 5.3, the Lower Action (LA) is set at 140; and Upper Action (UA) is set at 750 for
iron (Fe) test element. Also from Table 5.1, the test result value for iron (Fe) is 43. This test
result value is not within the LA and UA limits, thus, based on the pre-screening rule in
Section 5.3.2, the iron (Fe) test result will fail the pre-screening stage, and then will be
returned for re-testing.
In a similar way, the pre-screening of other test elements in the port crane bearing grease
sample are assessed and results recorded in Table 5.7.
Table 5.7: Port Crane Bearing
Test Element
Grease Sample Test Result Value
LA Value UA Value Pre-screening Status
Iron 43 140 750 Fail
Tin 15 10 60 Pass
Nickel 5 1 8 Pass
Sodium 84 35 200 Pass
Source: Test case data
5.4.2.2 Pre-screening of starboard crane bearing grease sample test results
Iron (Fe) wear element test result:
From Table 5.3, the Lower Action (LA) is set at 140; and Upper Action (UA) is set at 750 for
iron (Fe) test element. Also, from Table 5.2, the test result value for iron (Fe) is 69. This test
result value is not within the LA and UA limits, thus, based on the pre-screening rule, the
iron (Fe) test result will fail the pre-screening stage, and then will be returned for re-testing.
In a similar way, the pre-screening of other test elements in the starboard crane bearing
grease sample are assessed and results recorded in Table 5.8.
Table 5.8: Starboard Crane Bearing
Test Element
Grease Sample Test Result Value
LA Value UA Value Pre-screening Status
Iron 69 140 750 Fail
Tin 7 10 60 Fail
Nickel 8 1 8 Pass
Sodium 108 35 200 Pass
Source: Test case data
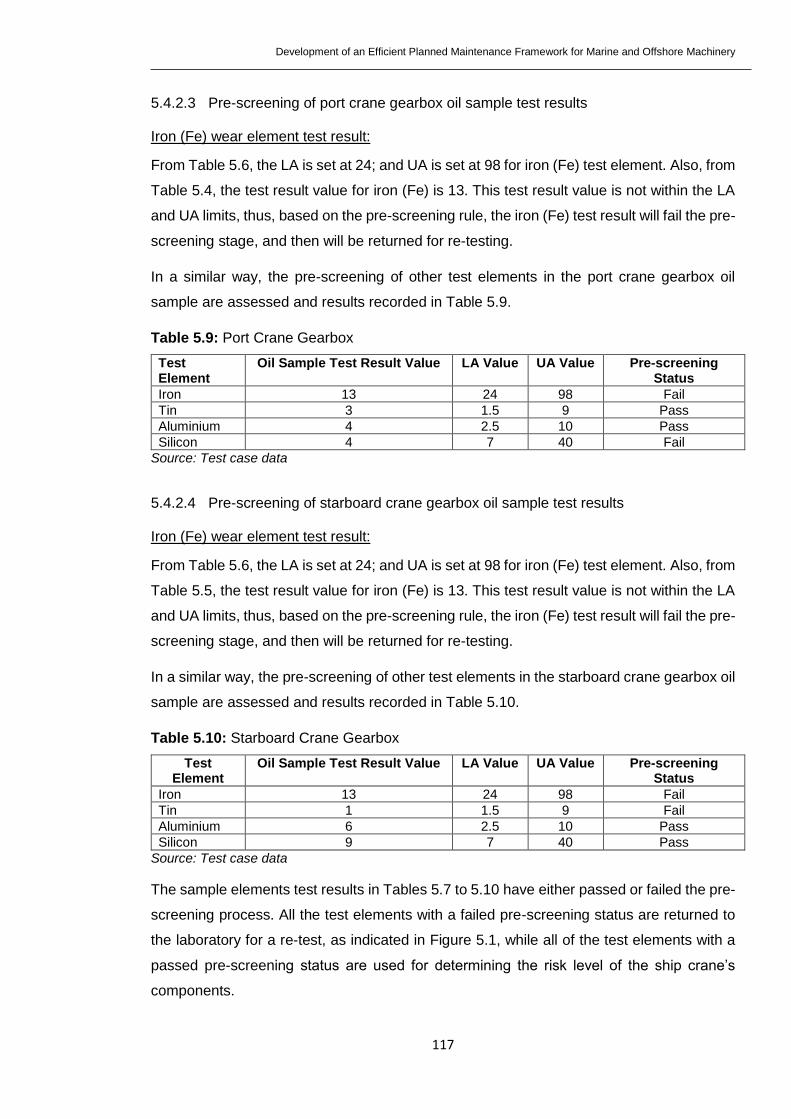
Development of an Efficient Planned Maintenance Framework for Marine and Offshore Machinery
117
5.4.2.3 Pre-screening of port crane gearbox oil sample test results
Iron (Fe) wear element test result:
From Table 5.6, the LA is set at 24; and UA is set at 98 for iron (Fe) test element. Also, from
Table 5.4, the test result value for iron (Fe) is 13. This test result value is not within the LA
and UA limits, thus, based on the pre-screening rule, the iron (Fe) test result will fail the pre-
screening stage, and then will be returned for re-testing.
In a similar way, the pre-screening of other test elements in the port crane gearbox oil
sample are assessed and results recorded in Table 5.9.
Table 5.9: Port Crane Gearbox
Test Element
Oil Sample Test Result Value LA Value UA Value Pre-screening Status
Iron 13 24 98 Fail
Tin 3 1.5 9 Pass
Aluminium 4 2.5 10 Pass
Silicon 4 7 40 Fail
Source: Test case data
5.4.2.4 Pre-screening of starboard crane gearbox oil sample test results
Iron (Fe) wear element test result:
From Table 5.6, the LA is set at 24; and UA is set at 98 for iron (Fe) test element. Also, from
Table 5.5, the test result value for iron (Fe) is 13. This test result value is not within the LA
and UA limits, thus, based on the pre-screening rule, the iron (Fe) test result will fail the pre-
screening stage, and then will be returned for re-testing.
In a similar way, the pre-screening of other test elements in the starboard crane gearbox oil
sample are assessed and results recorded in Table 5.10.
Table 5.10: Starboard Crane Gearbox
Test Element
Oil Sample Test Result Value LA Value UA Value Pre-screening Status
Iron 13 24 98 Fail
Tin 1 1.5 9 Fail
Aluminium 6 2.5 10 Pass
Silicon 9 7 40 Pass
Source: Test case data
The sample elements test results in Tables 5.7 to 5.10 have either passed or failed the pre-
screening process. All the test elements with a failed pre-screening status are returned to
the laboratory for a re-test, as indicated in Figure 5.1, while all of the test elements with a
passed pre-screening status are used for determining the risk level of the ship crane’s
components.
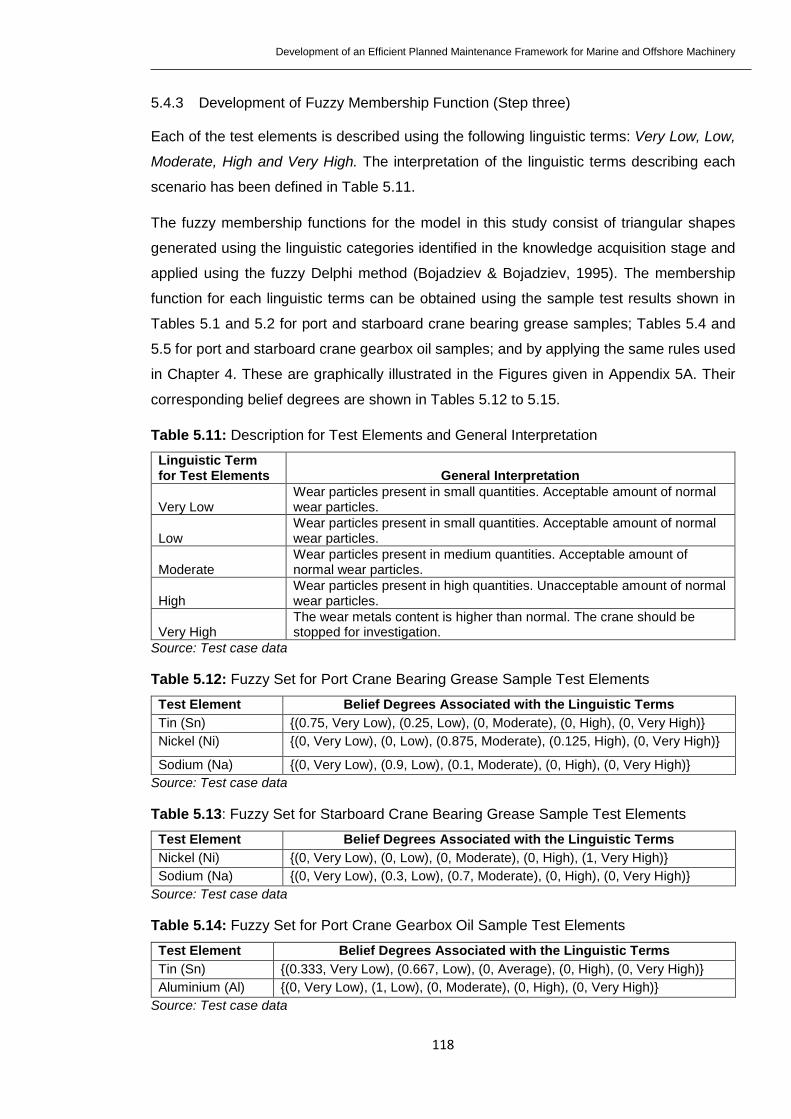
Development of an Efficient Planned Maintenance Framework for Marine and Offshore Machinery
118
5.4.3 Development of Fuzzy Membership Function (Step three)
Each of the test elements is described using the following linguistic terms: Very Low, Low,
Moderate, High and Very High. The interpretation of the linguistic terms describing each
scenario has been defined in Table 5.11.
The fuzzy membership functions for the model in this study consist of triangular shapes
generated using the linguistic categories identified in the knowledge acquisition stage and
applied using the fuzzy Delphi method (Bojadziev & Bojadziev, 1995). The membership
function for each linguistic terms can be obtained using the sample test results shown in
Tables 5.1 and 5.2 for port and starboard crane bearing grease samples; Tables 5.4 and
5.5 for port and starboard crane gearbox oil samples; and by applying the same rules used
in Chapter 4. These are graphically illustrated in the Figures given in Appendix 5A. Their
corresponding belief degrees are shown in Tables 5.12 to 5.15.
Table 5.11: Description for Test Elements and General Interpretation
Linguistic Term for Test Elements
General Interpretation
Very Low
Wear particles present in small quantities. Acceptable amount of normal wear particles.
Low
Wear particles present in small quantities. Acceptable amount of normal wear particles.
Moderate
Wear particles present in medium quantities. Acceptable amount of normal wear particles.
High
Wear particles present in high quantities. Unacceptable amount of normal wear particles.
Very High
The wear metals content is higher than normal. The crane should be stopped for investigation.
Source: Test case data
Table 5.12: Fuzzy Set for Port Crane Bearing Grease Sample Test Elements
Test Element Belief Degrees Associated with the Linguistic Terms
Tin (Sn) {(0.75, Very Low), (0.25, Low), (0, Moderate), (0, High), (0, Very High)}
Nickel (Ni) {(0, Very Low), (0, Low), (0.875, Moderate), (0.125, High), (0, Very High)}
Sodium (Na) {(0, Very Low), (0.9, Low), (0.1, Moderate), (0, High), (0, Very High)}
Source: Test case data
Table 5.13: Fuzzy Set for Starboard Crane Bearing Grease Sample Test Elements
Test Element Belief Degrees Associated with the Linguistic Terms
Nickel (Ni) {(0, Very Low), (0, Low), (0, Moderate), (0, High), (1, Very High)}
Sodium (Na) {(0, Very Low), (0.3, Low), (0.7, Moderate), (0, High), (0, Very High)}
Source: Test case data
Table 5.14: Fuzzy Set for Port Crane Gearbox Oil Sample Test Elements
Test Element Belief Degrees Associated with the Linguistic Terms
Tin (Sn) {(0.333, Very Low), (0.667, Low), (0, Average), (0, High), (0, Very High)}
Aluminium (Al) {(0, Very Low), (1, Low), (0, Moderate), (0, High), (0, Very High)}
Source: Test case data

Development of an Efficient Planned Maintenance Framework for Marine and Offshore Machinery
119
Table 5.15: Fuzzy Set for Starboard Crane Gearbox Oil Sample Test Elements
Test Element Belief Degrees Associated with the Linguistic Terms
Aluminium (Al) {(0, Very Low), (0, Low), (1, Moderate), (0, High), (0, Very High)}
Silicon (Si) {(0.875, Very Low), (0.125, Low), (0, Moderate), (0, High), (0, Very High)}
Source: Test case data
5.4.4 Development of Fuzzy Rule Base (Step four)
To develop the fuzzy rule base, the five linguistic terms (Very Low, Low, Moderate, High
and Very High) are first graded (shown in Table 5.16) using the four output sample grades
(i.e. Normal, Caution, Attention, and Critical). These output grades are identified as priority
levels of alert for each of the linguistic terms associated with the sample elements. The
highest degree of the individual linguistic terms of the sample elements is assigned with the
corresponding grade (Table 5.16) as the priority level of alert.
Consider the following examples in Appendix 5B, Table 1-5B:
Rule number 1 - the linguistic terms for sample elements are ‘Very Low’, ‘Very Low’, and
‘Very Low’. The highest degree of individual linguistic term is ‘Very Low’ and, from Table
5.16, the grade assigned to ‘Very Low’ is Normal. Thus, the priority level of attention is
shown as Normal.
Rule number 2 - the linguistic terms for sample elements are ‘Very Low’, ‘Very Low’, and
‘Low’. The highest degree of individual linguistic term is ‘Low’ and, from Table 5.16, the
grade assigned to ‘Low’ is Normal. Thus, the priority level of attention is shown as Normal.
Rule number 3 - the linguistic terms for sample elements are ‘Very Low’, ‘Very Low’, and
‘Moderate’. The highest degree of individual linguistic term is ‘Moderate’ and, from Table
5.16, the grade assigned to ‘Moderate’ is Caution. Thus, the priority level of attention is
shown as Caution.
Rule number 4 - the linguistic terms for sample elements are ‘Very Low’, ‘Very Low’, and
‘High’. The highest degree of individual linguistic term is ‘High’ and, from Table 5.16, the
grade assigned to ‘High’ is Attention. Thus, the priority level of attention is shown as
Attention.
Rule number 5 - the linguistic terms for sample elements are ‘Very Low’, ‘Very Low’, and
‘Very High’. The highest degree of individual linguistic term is ‘Very High’ and, from Table
5.16, the grade assigned to ‘Very High’ is Critical. Thus, the priority level of attention is
shown as Critical.
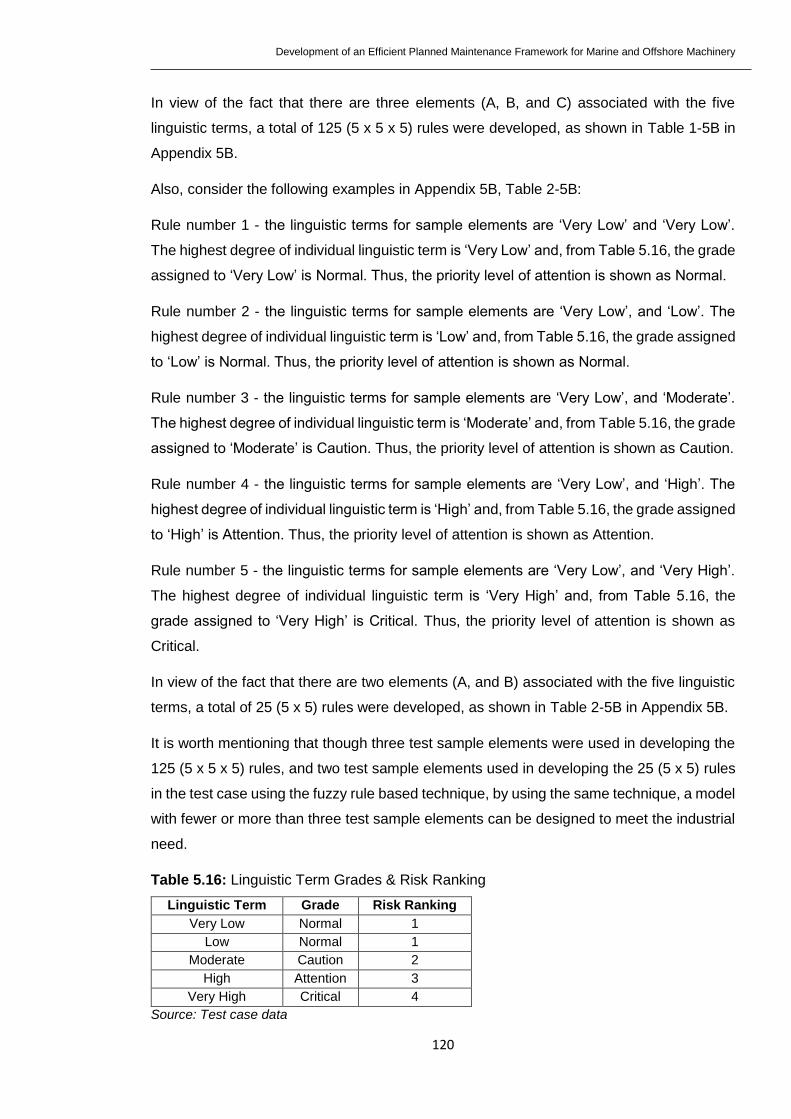
Development of an Efficient Planned Maintenance Framework for Marine and Offshore Machinery
120
In view of the fact that there are three elements (A, B, and C) associated with the five
linguistic terms, a total of 125 (5 x 5 x 5) rules were developed, as shown in Table 1-5B in
Appendix 5B.
Also, consider the following examples in Appendix 5B, Table 2-5B:
Rule number 1 - the linguistic terms for sample elements are ‘Very Low’ and ‘Very Low’.
The highest degree of individual linguistic term is ‘Very Low’ and, from Table 5.16, the grade
assigned to ‘Very Low’ is Normal. Thus, the priority level of attention is shown as Normal.
Rule number 2 - the linguistic terms for sample elements are ‘Very Low’, and ‘Low’. The
highest degree of individual linguistic term is ‘Low’ and, from Table 5.16, the grade assigned
to ‘Low’ is Normal. Thus, the priority level of attention is shown as Normal.
Rule number 3 - the linguistic terms for sample elements are ‘Very Low’, and ‘Moderate’.
The highest degree of individual linguistic term is ‘Moderate’ and, from Table 5.16, the grade
assigned to ‘Moderate’ is Caution. Thus, the priority level of attention is shown as Caution.
Rule number 4 - the linguistic terms for sample elements are ‘Very Low’, and ‘High’. The
highest degree of individual linguistic term is ‘High’ and, from Table 5.16, the grade assigned
to ‘High’ is Attention. Thus, the priority level of attention is shown as Attention.
Rule number 5 - the linguistic terms for sample elements are ‘Very Low’, and ‘Very High’.
The highest degree of individual linguistic term is ‘Very High’ and, from Table 5.16, the
grade assigned to ‘Very High’ is Critical. Thus, the priority level of attention is shown as
Critical.
In view of the fact that there are two elements (A, and B) associated with the five linguistic
terms, a total of 25 (5 x 5) rules were developed, as shown in Table 2-5B in Appendix 5B.
It is worth mentioning that though three test sample elements were used in developing the
125 (5 x 5 x 5) rules, and two test sample elements used in developing the 25 (5 x 5) rules
in the test case using the fuzzy rule based technique, by using the same technique, a model
with fewer or more than three test sample elements can be designed to meet the industrial
need.
Table 5.16: Linguistic Term Grades & Risk Ranking
Linguistic Term Grade Risk Ranking
Very Low Normal 1
Low Normal 1
Moderate Caution 2
High Attention 3
Very High Critical 4
Source: Test case data

Development of an Efficient Planned Maintenance Framework for Marine and Offshore Machinery
121
5.4.5 Determination of Risk Levels for the Sample Test Elements of each Crane
Component and the Acquirement of its Fuzzy Conclusion (Step five)
In order to obtain a risk ranking, two steps are required. Firstly, the linguistic priority terms
and the membership values reflecting the risk levels for the sample test element of each
crane component should be carefully decided. Secondly, the fuzzy set conclusion of each
crane component will be obtained based on the fuzzy rule base using the ‘min-max’
approach. Since this research only considers three sample test elements for each crane
component (bearing and gearbox), for both port and starboard of the ship, the fuzzy set
obtained in Tables 5.12, 5.13, 5.14, and 5.15 will be used to determine its fuzzy conclusion.
5.4.5.1 Risk level for port crane bearing grease sample test elements
By applying the ‘min-max’ approach, the set of fuzzy conclusions of the port crane bearing
grease sample test element in Table 5.12 is obtained as follows:
i. List the membership function values according to the rules developed.
(1) If Sn = Very Low 0.75, Ni = Moderate 0.875, and Na = Low 0.9, then based
on rule 12 in the fuzzy rule based table (Table 1-5B in Appendix 5B), the
priority level is CAUTION.
(2) If Sn = Very Low 0.75, Ni = Moderate 0.875, and Na = Moderate 0.1, then
based on rule 13 in the fuzzy rule based table (Table 1-5B in Appendix 5B),
the priority level is CAUTION.
(3) If Sn = Very Low 0.75, Ni = High 0.125, and Na = Low 0.9, then based on
rule 17 in the fuzzy rule based table (Table 1-5B in Appendix 5B), the priority
level is ATTENTION.
(4) If Sn = Very Low 0.75, Ni = High 0.125, and Na = Moderate 0.1, then based
on rule 18 in the fuzzy rule based table (Table 1-5B in Appendix 5B), the
priority level is ATTENTION.
(5) If Sn = Low 0.25, Ni = Moderate 0.875, and Na = Low 0.9, then based on
rule 37 in the fuzzy rule based table (Table 1-5B in Appendix 5B), the priority
level is CAUTION.
(6) If Sn = Low 0.25, Ni = Moderate 0.875, and Na = Moderate 0.1, then based
on rule 38 in the fuzzy rule based table (Table 1-5B in Appendix 5B), the
priority level is CAUTION.
(7) If Sn = Low 0.25, Ni = High 0.125, and Na = Low 0.9, then based on rule 42
in the fuzzy rule based table (Table 1-5B in Appendix 5B), the priority level
is ATTENTION.

Development of an Efficient Planned Maintenance Framework for Marine and Offshore Machinery
122
(8) If Sn = Low 0.25, Ni = High 0.125, and Na = Moderate 0.1, then based on
rule 43 in the fuzzy rule based table (Table 1-5B in Appendix 5B), the priority
level is ATTENTION.
ii. Determine the minimum value of each combination in terms of comparing the values
obtained from each element and the value of weight established in the priority level.
In the first combination in (i), Sn = Very Low 0.75, Ni = Moderate 0.875, and Na = Low 0.9.
Therefore, the minimum value of Sn, Ni, and Na is 0.75, which is associated with the
linguistic priority term CAUTION, according to the fuzzy rule developed. The minimum
values of the other seven combinations can be determined in a similar way, as shown in
Table 5.17.
Table 5.17: The Minimum Value of each Combination for Port Crane Bearing
1 Caution 0.75 2 Caution 0.1 3 Attention 0.125 4 Attention 0.1
5 Caution 0.25 6 Caution 0.1 7 Attention 0.125 8 Attention 0.1 Source: Test case data
iii. Determine the maximum value of the minimum values obtained from step 2 that has
the same category of linguistic priority term.
In the first scenario, there are eight combinations and two different categories of linguistic
priority terms, CAUTION and ATTENTION. The membership values in the CAUTION
category are 0.75, 0.1, 0.25, and 0.1, respectively. Therefore, the maximum membership
value is 0.75, as shown in Table 5.18. Likewise, the values in the ATTENTION category in
the 3rd, 4th, 7th and 8th combinations are 0.125. Thus, the maximum membership value in
the ATTENTION category is 0.125, also shown in Table 5.18.
Table 5.18: The Maximum Value Associated with the Same Category of Linguistic Priority
Terms for Port Crane Bearing.
Category of linguistic priority terms Maximum values
Caution 0.75
Attention 0.125 Source: Test case data
5.4.5.2 Risk level for starboard crane bearing grease sample test elements
By applying the ‘min-max’ approach, the set of fuzzy conclusions of the starboard crane
bearing grease sample test element in Table 5.13 is obtained as follows:
i. List the membership function values according to the rules developed.
(1) If Ni = Very High 1, and Na = Low 0.3, then based on rule 22 in the fuzzy
rule based table (Table 2-5B in Appendix 5B), the priority level is CRITICAL.

Development of an Efficient Planned Maintenance Framework for Marine and Offshore Machinery
123
(2) If Ni = Very High 1, and Na = Moderate 0.7, then based on rule 23 in the
fuzzy rule based table (Table 2-5B in Appendix 5B), the priority level is
CRITICAL.
ii. Determine the minimum value of each combination in terms of comparing the values
obtained from each element and the value of weight established in the priority level.
In the first combination in (i), Ni = Very High 1 and Na = Low 0.3. Therefore, the minimum
value of Ni and Na is 0.3, which is associated with the linguistic priority term CRITICAL,
according to the fuzzy rule developed. The minimum values of the other combination can
be determined in a similar way, as shown in Table 5.19.
Table 5.19: The Minimum Value of each Combination for Starboard Crane Bearing
1 Critical 0.3 2 Critical 0.7
Source: Test case data
iii. Determine the maximum value of the minimum values obtained from step 2 that has
the same category of linguistic priority terms.
In the first scenario, there are two combinations and one category of linguistic priority terms,
CRITICAL. The membership values in the CRITICAL category are 0.3 and 0.7. Therefore,
the maximum membership value is 0.7.
5.4.5.3 Risk level for port crane gearbox oil sample test elements
By applying the ‘min-max’ approach, the set of fuzzy conclusions of port crane gearbox oil
sample test element in Table 5.14 is obtained as follows:
i. List the membership function values according to the rules developed.
(1) If Sn = Very Low 0.333, and Al = Low 1, then based on rule 2 on the fuzzy
rule based table (Table 2-5B in Appendix 5B), the priority level is NORMAL.
(2) If Sn = Low 0.667, and Al = Low 1, then based on rule 7 on the fuzzy rule
based table (Table 2-5B in Appendix 5B), the priority level is NORMAL.
ii. Determine the minimum value of each combination in terms of comparing the values
obtained from each element and the value of weight established in the priority level.
In the first combination in (i), Sn = Very Low 0.333, and Al = Low 1. Therefore, the minimum
value of Sn and Al is 0.333, which is associated with the linguistic priority term NORMAL,
according to the fuzzy rule developed. The minimum values of the other combination can
be determined in a similar way, as shown in Table 5.20.
Table 5.20: The Minimum Value of each Combination for Port Crane Gearbox
1 Normal 0.333 2 Normal 0.667
Source: Test case data

Development of an Efficient Planned Maintenance Framework for Marine and Offshore Machinery
124
iii. Determine the maximum value of the minimum values obtained from step 2 that has
the same category of linguistic priority term.
In the first scenario, there are two combinations and one category of linguistic priority terms,
NORMAL. The membership values in the NORMAL category are 0.333 and 0.667.
Therefore, the maximum membership value is 0.667.
5.4.5.4 Risk level for starboard crane gearbox oil sample test elements
By applying the ‘min-max’ approach, the set of fuzzy conclusions of starboard crane
gearbox oil sample test element in Table 5.15 is obtained as follows:
i. List the membership function values according to the rules developed.
(1) If Al = Moderate 1, and Si = Very Low 0.875, then based on rule 11 on the
fuzzy rule based table (Table 2-5B in Appendix 5B), the priority level is
CAUTION.
(2) If Al = Moderate 1, and Si = Low 0.125, then based on rule 12 on the fuzzy
rule based table (Table 2-5B in Appendix 5B), the priority level is CAUTION.
ii. Determine the minimum value of each combination in terms of comparing the values
obtained from each element and the value of weight established in the priority level.
In the first combination in (i), Al = Moderate 1, and Si = Very Low 0.875. Therefore, the
minimum value of Al and Si is 0.875, which is associated with the linguistic priority term
CAUTION, according to the fuzzy rule developed. The minimum values of the other
combination can be determined in a similar way, as shown in Table 5.21.
Table 5.21: The Minimum Value of each Combination for Starboard Crane Gearbox
1 Caution 0.875 2 Caution 0.125 Source: Test case data
iii. Determine the maximum value of the minimum values obtained from step 2 that has
the same category of linguistic priority term.
In the first scenario, there are two combinations and one category of linguistic priority terms,
CAUTION. The membership values in the CAUTION category are 0.875 and 0.125.
Therefore, the maximum membership value is 0.875.
Table 5.22: The Set of Fuzzy Conclusions of the Ship’s Crane
Ship Crane Components Set of Fuzzy Conclusions
Port crane bearing Caution 0.75, Attention 0.125
Starboard crane bearing Critical 0.7
Port crane gearbox Normal 0.667
Starboard crane gearbox Caution 0.875
Source: Test case data

Development of an Efficient Planned Maintenance Framework for Marine and Offshore Machinery
125
5.4.6 The Defuzzification Process (Step six)
By applying Equation (5.2) in the defuzzification process and the risk ranking for the
linguistic term grades given in Table 5.16, the risk values (RV) for the set of fuzzy
conclusions in Table 5.22 can be obtained. The components with higher risk values are
considered to be critical.
For example, the risk value for the port crane bearing can be determined as follows:
RV = (2 x 0.75) + (3 x 0.125) = 1.875
In a similar way, the RV for the starboard crane bearing, port and starboard crane gearboxes
are obtained as shown in Table 5.23.
From Table 5.23, it can be noted that the risk value for the starboard crane bearing is 2.8
(higher risk value). Therefore, the ship starboard crane bearing is considered as being
critical. With this information, the maintenance engineer on board the ship can stop the
starboard crane (if it is under operation) for investigation, thus preventing any major damage
to the crane.
Table 5.23: The Ship Crane Components Risk Values
Ship Crane Components Risk Value
Port crane bearing 1.875
Starboard crane bearing 2.8
Port crane gearbox 0.667
Starboard crane gearbox 1.75
Source: Test case data
5.4.7 Sensitivity Analysis (Final step)
Sensitivity analysis is performed to assess the robustness and logicality of the delivery of
the analysis results obtained in Section 5.4.6. This is achieved by utilising the three axioms
introduced in Section 4.2.10. The implementation of the axioms will help to identify the most
important priority level that should be given attention in order to improve the ship’s crane
bearing and gearbox operational uncertainties.
To perform the analysis, the input data in Tables 5.12 to 5.15 associated with the highest
preference linguistic values of all the lower level criteria are decreased by a factor of 10%,
20%, and 30% respectively, whilst simultaneously increasing the input data of the lowest
preference linguistic values of each of the criteria at the lower level. In light of the above,
decreasing the input data of the highest preference linguistic value (𝛽𝐻) of a given criterion
by a factor of (𝑥) means the input data of the lowest preference linguistic value will be
increased by the same factor.

Development of an Efficient Planned Maintenance Framework for Marine and Offshore Machinery
126
If (𝛽𝐻) is less than (𝑥), then the remaining belief degree (i.e. 𝑥 − 𝛽𝐻) can be taken from the
next linguistic value, until (𝑥) is consumed completely in a structured and systematic
process. Accordingly, the decrement values are as shown in Tables 5.24 - 5.35.
5.4.7.1 Decrement by 0.1
Table 5.24: Decrement of Port Crane Bearing Grease Sample Test Elements by 0.1
Test Elements
The degree of belief associated with the highest preference linguistic
variable is decreased and simultaneously the degree of belief associated
with the lowest preference linguistic variable is increased by 0.1
Tin (Sn) {(0.65, Very Low), (0.25, Low), (0, Moderate), (0, High), (0.1, Very High)}
Nickel (Ni) {(0, Very Low), (0, Low), (0.775, Moderate), (0.125, High), (0.1, Very High)}
Sodium (Na) {(0, Very Low), (0.8, Low), (0.1, Moderate), (0, High), (0.1, Very High)}
Source: Test case data
Table 5.25: Decrement of Starboard Crane Bearing Grease Sample Test Elements by 0.1
Test Elements
The degree of belief associated with the highest preference linguistic
variable is decreased and simultaneously the degree of belief associated
with the lowest preference linguistic variable is increased by 0.1
Nickel (Ni) {(0.1, Very Low), (0, Low), (0, Moderate), (0, High), (0.9, Very High)}
Sodium (Na) {(0, Very Low), (0.2, Low), (0.7, Moderate), (0, High), (0.1, Very High)}
Source: Test case data
Table 5.26: Decrement of Port Crane Gearbox Oil Sample Test Elements by 0.1
Test Elements
The degree of belief associated with the highest preference linguistic
variable is decreased and simultaneously the degree of belief associated
with the lowest preference linguistic variable is increased by 0.1
Tin (Sn) {(0.233, Very Low), (0.667, Low), (0, Moderate), (0, High), (0.1, Very High)}
Aluminium (Al) {(0, Very Low), (0.9, Low), (0, Moderate), (0, High), (0.1, Very High)}
Source: Test case data
Table 5.27: Decrement of Starboard Crane Gearbox Oil Sample Test Elements by 0.1
Test Elements
The degree of belief associated with the highest preference linguistic
variable is decreased and simultaneously the degree of belief associated
with the lowest preference linguistic variable is increased by 0.1
Aluminium (Al) {(0, Very Low), (0, Low), (0.9, Moderate), (0, High), (0.1, Very High)}
Silicon (Si) {(0.775, Very Low), (0.125, Low), (0, Moderate), (0, High), (0.1, Very High)}
Source: Test case data
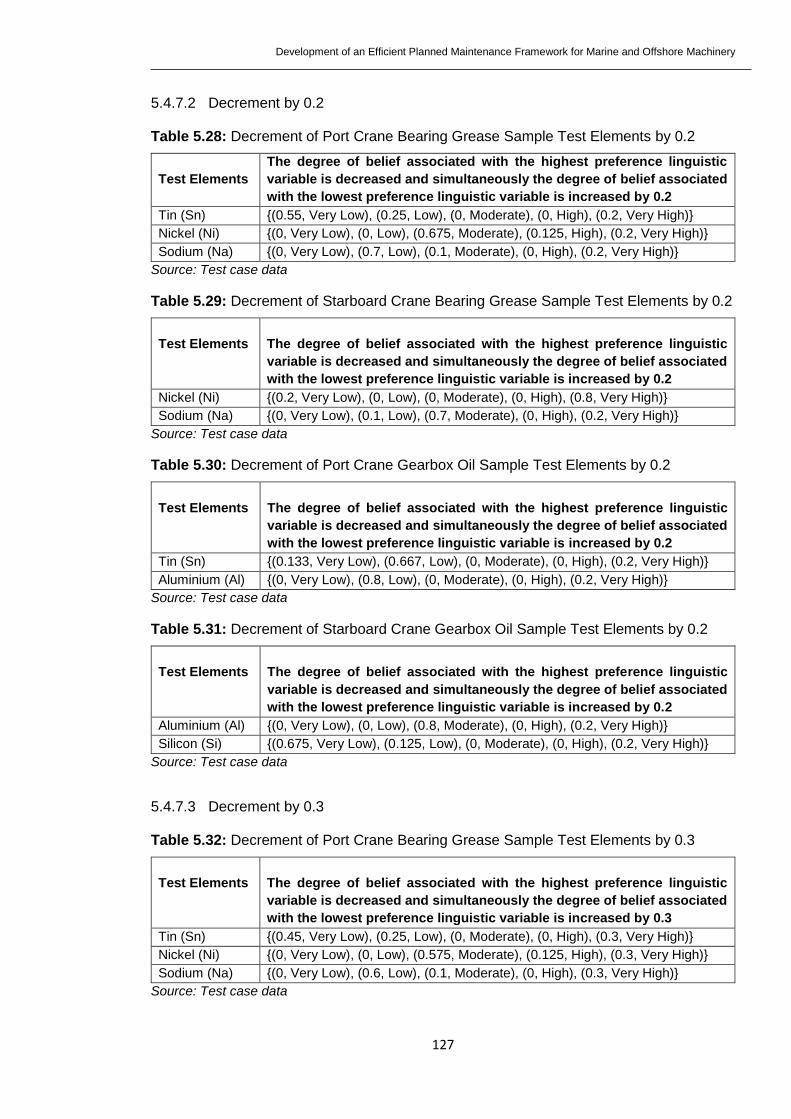
Development of an Efficient Planned Maintenance Framework for Marine and Offshore Machinery
127
5.4.7.2 Decrement by 0.2
Table 5.28: Decrement of Port Crane Bearing Grease Sample Test Elements by 0.2
Test Elements
The degree of belief associated with the highest preference linguistic
variable is decreased and simultaneously the degree of belief associated
with the lowest preference linguistic variable is increased by 0.2
Tin (Sn) {(0.55, Very Low), (0.25, Low), (0, Moderate), (0, High), (0.2, Very High)}
Nickel (Ni) {(0, Very Low), (0, Low), (0.675, Moderate), (0.125, High), (0.2, Very High)}
Sodium (Na) {(0, Very Low), (0.7, Low), (0.1, Moderate), (0, High), (0.2, Very High)}
Source: Test case data
Table 5.29: Decrement of Starboard Crane Bearing Grease Sample Test Elements by 0.2
Test Elements
The degree of belief associated with the highest preference linguistic
variable is decreased and simultaneously the degree of belief associated
with the lowest preference linguistic variable is increased by 0.2
Nickel (Ni) {(0.2, Very Low), (0, Low), (0, Moderate), (0, High), (0.8, Very High)}
Sodium (Na) {(0, Very Low), (0.1, Low), (0.7, Moderate), (0, High), (0.2, Very High)}
Source: Test case data
Table 5.30: Decrement of Port Crane Gearbox Oil Sample Test Elements by 0.2
Test Elements
The degree of belief associated with the highest preference linguistic
variable is decreased and simultaneously the degree of belief associated
with the lowest preference linguistic variable is increased by 0.2
Tin (Sn) {(0.133, Very Low), (0.667, Low), (0, Moderate), (0, High), (0.2, Very High)}
Aluminium (Al) {(0, Very Low), (0.8, Low), (0, Moderate), (0, High), (0.2, Very High)}
Source: Test case data
Table 5.31: Decrement of Starboard Crane Gearbox Oil Sample Test Elements by 0.2
Test Elements
The degree of belief associated with the highest preference linguistic
variable is decreased and simultaneously the degree of belief associated
with the lowest preference linguistic variable is increased by 0.2
Aluminium (Al) {(0, Very Low), (0, Low), (0.8, Moderate), (0, High), (0.2, Very High)}
Silicon (Si) {(0.675, Very Low), (0.125, Low), (0, Moderate), (0, High), (0.2, Very High)}
Source: Test case data
5.4.7.3 Decrement by 0.3
Table 5.32: Decrement of Port Crane Bearing Grease Sample Test Elements by 0.3
Test Elements
The degree of belief associated with the highest preference linguistic
variable is decreased and simultaneously the degree of belief associated
with the lowest preference linguistic variable is increased by 0.3
Tin (Sn) {(0.45, Very Low), (0.25, Low), (0, Moderate), (0, High), (0.3, Very High)}
Nickel (Ni) {(0, Very Low), (0, Low), (0.575, Moderate), (0.125, High), (0.3, Very High)}
Sodium (Na) {(0, Very Low), (0.6, Low), (0.1, Moderate), (0, High), (0.3, Very High)}
Source: Test case data
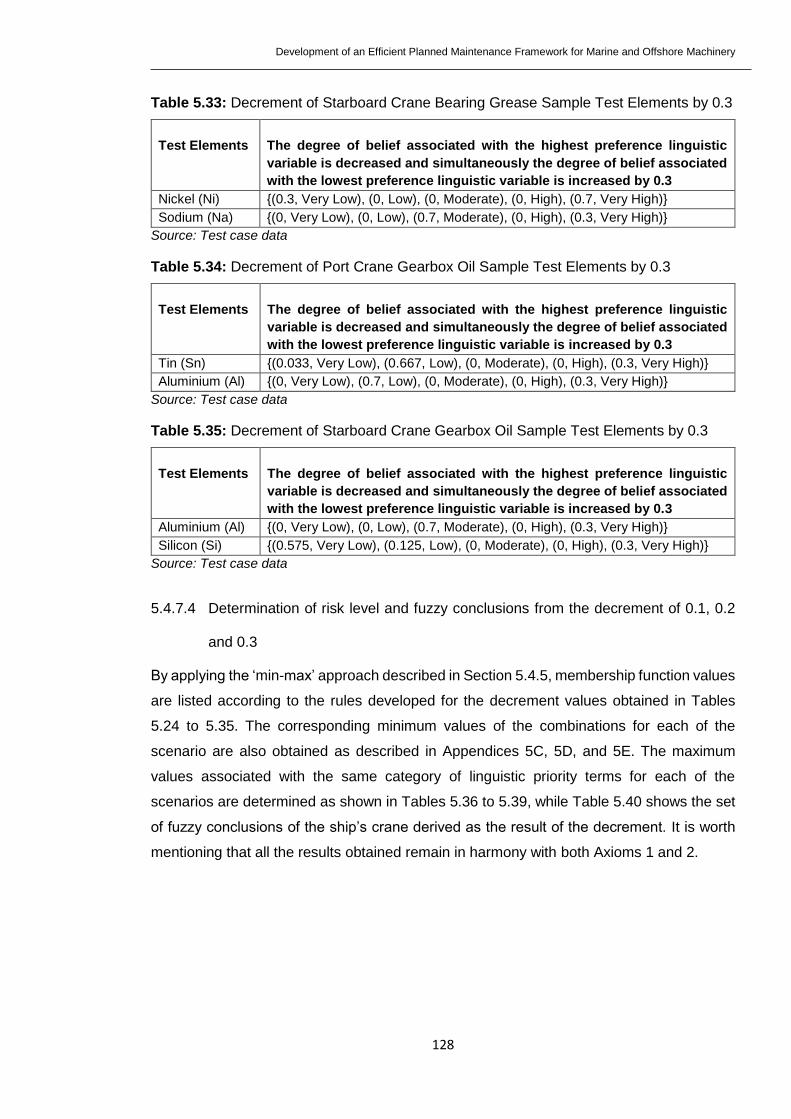
Development of an Efficient Planned Maintenance Framework for Marine and Offshore Machinery
128
Table 5.33: Decrement of Starboard Crane Bearing Grease Sample Test Elements by 0.3
Test Elements
The degree of belief associated with the highest preference linguistic
variable is decreased and simultaneously the degree of belief associated
with the lowest preference linguistic variable is increased by 0.3
Nickel (Ni) {(0.3, Very Low), (0, Low), (0, Moderate), (0, High), (0.7, Very High)}
Sodium (Na) {(0, Very Low), (0, Low), (0.7, Moderate), (0, High), (0.3, Very High)}
Source: Test case data
Table 5.34: Decrement of Port Crane Gearbox Oil Sample Test Elements by 0.3
Test Elements
The degree of belief associated with the highest preference linguistic
variable is decreased and simultaneously the degree of belief associated
with the lowest preference linguistic variable is increased by 0.3
Tin (Sn) {(0.033, Very Low), (0.667, Low), (0, Moderate), (0, High), (0.3, Very High)}
Aluminium (Al) {(0, Very Low), (0.7, Low), (0, Moderate), (0, High), (0.3, Very High)}
Source: Test case data
Table 5.35: Decrement of Starboard Crane Gearbox Oil Sample Test Elements by 0.3
Test Elements
The degree of belief associated with the highest preference linguistic
variable is decreased and simultaneously the degree of belief associated
with the lowest preference linguistic variable is increased by 0.3
Aluminium (Al) {(0, Very Low), (0, Low), (0.7, Moderate), (0, High), (0.3, Very High)}
Silicon (Si) {(0.575, Very Low), (0.125, Low), (0, Moderate), (0, High), (0.3, Very High)}
Source: Test case data
5.4.7.4 Determination of risk level and fuzzy conclusions from the decrement of 0.1, 0.2
and 0.3
By applying the ‘min-max’ approach described in Section 5.4.5, membership function values
are listed according to the rules developed for the decrement values obtained in Tables
5.24 to 5.35. The corresponding minimum values of the combinations for each of the
scenario are also obtained as described in Appendices 5C, 5D, and 5E. The maximum
values associated with the same category of linguistic priority terms for each of the
scenarios are determined as shown in Tables 5.36 to 5.39, while Table 5.40 shows the set
of fuzzy conclusions of the ship’s crane derived as the result of the decrement. It is worth
mentioning that all the results obtained remain in harmony with both Axioms 1 and 2.

Development of an Efficient Planned Maintenance Framework for Marine and Offshore Machinery
129
Table 5.36: The Maximum Value Associated with the Same Category of Linguistic Priority
Terms for Decrement of Port Crane Bearing Grease Sample Elements
Category of linguistic priority terms
Maximum values by decrement of 0.1
Maximum values by decrement of 0.2
Maximum values by decrement of 0.3
Caution 0.65 0.55 0.45
Attention 0.125 0.125 0.125
Critical 0.1 0.2 0.3
Source: Test case data
Table 5.37: The Maximum Value Associated with the Same Category of Linguistic Priority
Terms for Decrement of Starboard Crane Bearing Grease Sample Elements
Category of linguistic priority terms
Maximum values by decrement of 0.1
Maximum values by decrement of 0.2
Maximum values by decrement of 0.3
Normal 0.1 0.1 N/A
Caution 0.1 0.2 0.3
Critical 0.7 0.7 0.7
Source: Test case data
Table 5.38: The Maximum Value Associated with the Same Category of Linguistic Priority
Terms for Decrement of Port Crane Gearbox Oil Sample Elements
Category of linguistic priority terms
Maximum values by decrement of 0.1
Maximum values by decrement of 0.2
Maximum values by decrement of 0.3
Normal 0.667 0.667 0.667
Critical 0.1 0.2 0.3
Source: Test case data
Table 5.39: The Maximum Value Associated with the Same Category of Linguistic Priority
Terms for Decrement of Starboard Crane Gearbox Oil Sample Elements
Category of linguistic priority terms
Maximum values by decrement of 0.1
Maximum values by decrement of 0.2
Maximum values by decrement of 0.3
Caution 0.775 0.675 0.575
Critical 0.1 0.2 0.3
Source: Test case data
Table 5.40: The Set of Fuzzy Conclusions of the Ship’s Crane from Decrement values
Ship Crane
Set of Fuzzy Conclusions
Decrement by 0.1 Decrement by 0.2 Decrement by 0.3
Port crane bearing Caution 0.65, Attention 0.125, Critical 0.1,
Caution 0.55, Attention 0.125, Critical 0.2,
Caution 0.45, Attention 0.125, Critical 0.3,
Starboard crane bearing Normal 0.1, Caution 0.1, Critical 0.7,
Normal 0.1, Caution 0.2, Critical 0.7,
Caution 0.3, Critical 0.7,
Port crane gearbox Normal 0.667, Critical 0.1
Normal 0.667, Critical 0.2
Normal 0.667, Critical 0.3
Starboard crane gearbox
Caution 0.775, Critical 0.1
Caution 0.675, Critical 0.2
Caution 0.575, Critical 0.3
Source: Test case data

Development of an Efficient Planned Maintenance Framework for Marine and Offshore Machinery
130
5.4.7.5 Risk values from the decremented set of fuzzy conclusions (0.1, 0.2, and 0.3)
The risk values for the decremented set of fuzzy conclusions are determined using the
defuzzification process described in Section 5.4.6. For example, the risk value from the port
crane bearing set of fuzzy conclusions is obtained as follows:
10% decrement
𝐶𝑎𝑢𝑡𝑖𝑜𝑛 0.65
0.65+0.125+0.1, 𝐴𝑡𝑡𝑒𝑛𝑡𝑖𝑜𝑛
0.125
0.65+0.125+0.1, 𝐶𝑟𝑖𝑡𝑖𝑐𝑎𝑙
0.1
0.65+0.125+0.1
𝑅𝑉 = 2 × 0.65
0.65+0.125+0.1+ 3 ×
0.125
0.65+0.125+0.1+ 4 ×
0.1
0.65+0.125+0.1 = 2.366
Similarly, the RV for other set of fuzzy conclusions in Table 5.40 is obtained as shown in
Table 5.41. See Appendix 5F for detail calculations.
Table 5.41: Risk Values from the Decremented Set of Fuzzy Conclusions
Ship Crane Component
Risk Values
Decrement by
0.1
Decrement by
0.2
Decrement by
0.3
Port crane bearing 2.366 2.594 2.822
Starboard crane bearing 3.441 3.3 3.4
Port crane gearbox 1.389 1.689 1.929
Starboard crane gearbox 2.226 2.454 2.682
Source: Test case data
From Table 5.41, it can be noted that the starboard crane bearing has the highest risk
values, indicating a similar outcome obtained when the risk value was determined in Section
5.4.6.
Axiom 3 in Section 4.2.10 can be examined by comparing the preference degrees of the
risk attributes for analysis in a transparent manner. In order to determine if the model aligned
with axiom 3, two elements (i.e. Tin and Sodium) out of the three test elements of the
analysis from the port crane bearing oil sample (Table 5.12) are selected and their input
data decreased by 30%, as shown in Table 5.42.
Table 5.42: Using Two Test Elements for Decrement of Port Crane Bearing by 0.3
Test Elements
The degree of belief associated with the highest preference linguistic
variable is decreased and simultaneously the degree of belief associated
with the lowest preference linguistic variable is increased by 0.3
Tin (Sn) {(0.45, Very Low), (0.25, Low), (0, Moderate), (0, High), (0.3, Very High)}
Sodium (Na) {(0, Very Low), (0.6, Low), (0.1, Moderate), (0, High), (0.3, Very High)}
By applying the ‘min-max’ approach, the set of fuzzy conclusions of the two test elements
for decreasing port crane bearing grease sample in Table 5.42 is obtained as follows:
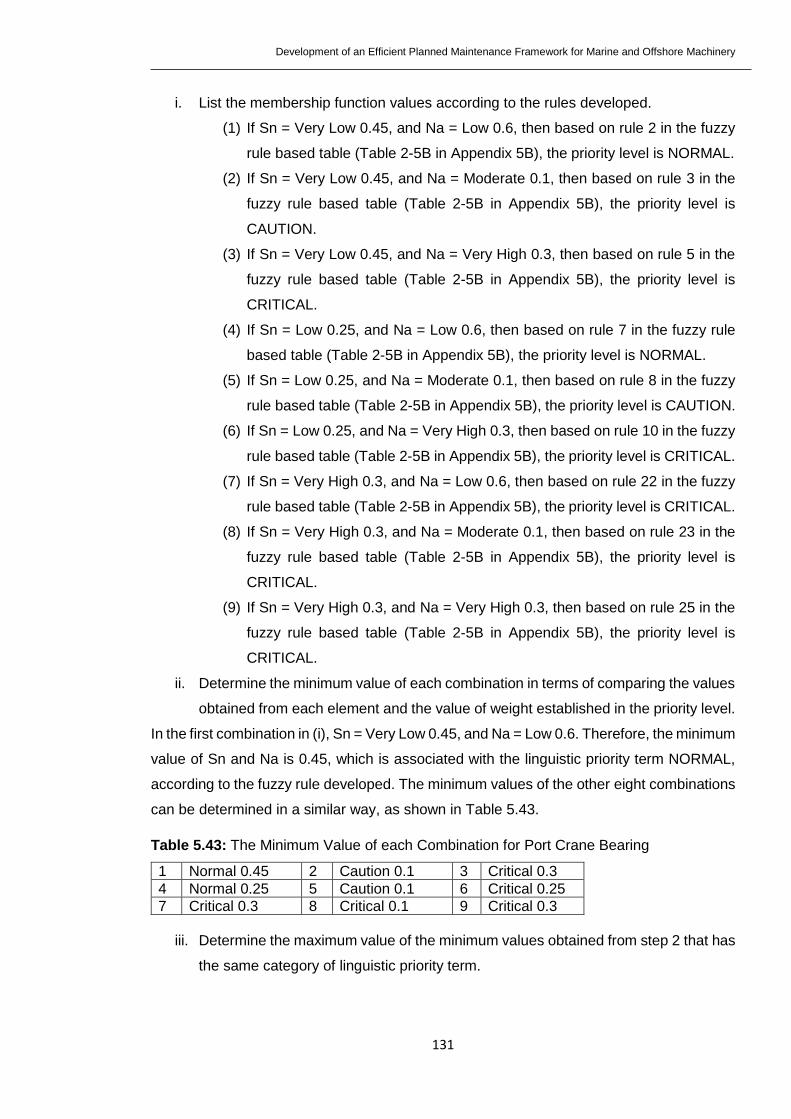
Development of an Efficient Planned Maintenance Framework for Marine and Offshore Machinery
131
i. List the membership function values according to the rules developed.
(1) If Sn = Very Low 0.45, and Na = Low 0.6, then based on rule 2 in the fuzzy
rule based table (Table 2-5B in Appendix 5B), the priority level is NORMAL.
(2) If Sn = Very Low 0.45, and Na = Moderate 0.1, then based on rule 3 in the
fuzzy rule based table (Table 2-5B in Appendix 5B), the priority level is
CAUTION.
(3) If Sn = Very Low 0.45, and Na = Very High 0.3, then based on rule 5 in the
fuzzy rule based table (Table 2-5B in Appendix 5B), the priority level is
CRITICAL.
(4) If Sn = Low 0.25, and Na = Low 0.6, then based on rule 7 in the fuzzy rule
based table (Table 2-5B in Appendix 5B), the priority level is NORMAL.
(5) If Sn = Low 0.25, and Na = Moderate 0.1, then based on rule 8 in the fuzzy
rule based table (Table 2-5B in Appendix 5B), the priority level is CAUTION.
(6) If Sn = Low 0.25, and Na = Very High 0.3, then based on rule 10 in the fuzzy
rule based table (Table 2-5B in Appendix 5B), the priority level is CRITICAL.
(7) If Sn = Very High 0.3, and Na = Low 0.6, then based on rule 22 in the fuzzy
rule based table (Table 2-5B in Appendix 5B), the priority level is CRITICAL.
(8) If Sn = Very High 0.3, and Na = Moderate 0.1, then based on rule 23 in the
fuzzy rule based table (Table 2-5B in Appendix 5B), the priority level is
CRITICAL.
(9) If Sn = Very High 0.3, and Na = Very High 0.3, then based on rule 25 in the
fuzzy rule based table (Table 2-5B in Appendix 5B), the priority level is
CRITICAL.
ii. Determine the minimum value of each combination in terms of comparing the values
obtained from each element and the value of weight established in the priority level.
In the first combination in (i), Sn = Very Low 0.45, and Na = Low 0.6. Therefore, the minimum
value of Sn and Na is 0.45, which is associated with the linguistic priority term NORMAL,
according to the fuzzy rule developed. The minimum values of the other eight combinations
can be determined in a similar way, as shown in Table 5.43.
Table 5.43: The Minimum Value of each Combination for Port Crane Bearing
1 Normal 0.45 2 Caution 0.1 3 Critical 0.3
4 Normal 0.25 5 Caution 0.1 6 Critical 0.25
7 Critical 0.3 8 Critical 0.1 9 Critical 0.3
iii. Determine the maximum value of the minimum values obtained from step 2 that has
the same category of linguistic priority term.

Development of an Efficient Planned Maintenance Framework for Marine and Offshore Machinery
132
In the first scenario, there are nine combinations and three different categories of linguistic
priority terms, NORMAL, CAUTION, and CRITICAL. The membership values in the
NORMAL category are 0.45 and 0.25, respectively. Therefore, the maximum membership
value is 0.45, as shown in Table 5.44. Likewise, the maximum membership values in the
CAUTION and CRITICAL categories are determined, as shown in Table 5.44.
Table 5.44: The Maximum Value Associated with the Same Category of Linguistic Priority
Terms for Port Crane Bearing.
Category of linguistic priority terms Maximum values
Normal 0.45
Caution 0.1
Critical 0.3 Source: Test case data
5.4.7.6 Risk values from the decremented set of fuzzy conclusions of the Port Bearing
The risk values for the decremented set of fuzzy conclusions from the two elements of the
port crane bearing is obtained as follows:
𝑁𝑜𝑟𝑚𝑎𝑙 0.45
0.45+0.1+0.3, 𝐶𝑎𝑢𝑡𝑖𝑜𝑛
0.1
0.45+0.1+0.3, 𝐶𝑟𝑖𝑡𝑖𝑐𝑎𝑙
0.3
0.45+0.1+0.3
𝑅𝑉 = 1 × 0.45
0.45+0.1+0.3+ 2 ×
0.1
0.45+0.1+0.3+ 4 ×
0.3
0.45+0.1+0.3 = 2.171
Notice that when the input data associated with the highest preference linguistic values of
the ship port crane bearing fuzzy sets of the three test elements was decreased by 30%,
the risk value of the crane component (i.e. failure risk) was evaluated as 2.822, as indicated
in Table 5.41. However, by selecting two elements (i.e. Tin and Sodium) out of the three
test elements of the analysis from the port crane bearing oil sample (Table 5.12) and
decreasing the input data by the same amount of 30%, the risk value obtained is 2.171.
Given that 2.171 is less than 2.822, it can be claimed that the investigation of the model is
validated to be sound and aligned with Axiom 3.
5.5 Discussions
This research has demonstrated how to start with a simple dynamic model and generate a
rule-based diagnostic model. Grease / oil analysis has proven to be a useful tool to evaluate
grease and bearing, as well as oil and gearbox condition, respectively. Different situations
and influencing factors for wear, contamination, and grease condition have shown complex
lucidities between the grease analysis results and their practical meaning. This leads to the
deduction that observing and interpreting these factors with expert knowledge can allow
proactive maintenance strategies to be applied in a reasonable approach for grease-
lubricated components. Understanding the oil sample data and realizing how to properly
Development of an Efficient Planned Maintenance Framework for Marine and Offshore Machinery
133
apply alarm limits can significantly reduce the downtime of marine crane bearing and
gearbox failure.
The approach utilised in this research is non-traditional and, according to Ramezani and
Memariani (2011), non-traditional modelling approaches may have the following benefits:
1. Rule-based knowledge representation, together with the extraction of rule, offers a
means of integrating data-driven modelling with physics-based modelling.
2. A rule-based model is complementary with human investigative reasoning as well
as human errors, thereby allowing industrial experts to contribute directly to the
model building.
3. A rule-base is transparent to the user. The way the decision is made can be plainly
elucidated so that users can quickly gain trust in the system. This is vital in safety-
critical machinery like ship cranes where human lives are at risk.
The approach here involves first identifying through literature review the key system
variables that affect ship cranes, and then developing a set of decision rules relating to
these key variables. This provides a powerful tool for knowledge specification and effective
condition monitoring of ship cranes.
From the diagnostic risk assessment tool, a NORMAL sample status indicates that the
physical properties of the lubricant are within acceptable limits and no signs of excessive
contamination/wear are present. ATTENTION indicates that results are outside acceptable
ranges but not critical, although caution, re-sampling, and increased monitoring is advised.
The CRITICAL status requires immediate corrective action to prevent significant major
damage/failure in service.
Failure to detect potential lube oil/equipment failure and wear may lead to poor performance
and even cause expensive damage and, in some cases, loss of business. On the other
hand, inaccurate diagnosis of equipment failure may cause unnecessary interruption to an
entire business. Either case can result in significant monetary loss. Oil analysis is an
increasingly popular condition-monitoring tool, meaning this developed diagnostic risk
assessment tool is needed and, if adopted, will improve operating efficiency and reduce
failures of ship cranes.
5.6 Conclusion
The main aim of this chapter is to develop an expert system that will diagnose early signs
of problems in ship cranes by utilising oil-sampling analysis. This has been achieved by the
design concept of a logic rule-based system that provides risk levels diagnosis to enable

Development of an Efficient Planned Maintenance Framework for Marine and Offshore Machinery
134
grease/oil samples test results to be processed for the diagnosis of the ship cranes, using
grease/oil-sampling analysis. A fuzzy modelling approach utilizing IF-THEN rules and its
usefulness in condition monitoring of applications was illustrated in this chapter. The model
showed how to build a bridge between the qualitative reliability analysis of the design phase
and the diagnosis in the usage phase. The goal of producing a diagnosis model for a ship
crane was satisfied. The outcome of this methodology is a rule-based model, which is a
diagnosis tool that helps the maintenance crew prevent a ship crane failure with a reduced
number of investigations. The tool allows the maintenance crew to make decisions that are
more efficient when trying to diagnose fault in a crane, thus augmenting their competences.
The generated alert risk levels in the tool helps in addressing some of the concerns raised
in the introduction. It provides the maintenance crew with a map that allows recognition of
the failing components, and informs them of which ones’ need replacing.
This methodology shows how, with several systematic steps, a rule based diagnostic tool
can be generated. This leads to the conclusion that this process can be automated and
undeniably, that is the goal of this research. The diagnostic tool accuracy can be improved
if a comprehensive data is available for a specific crane, as well as all the properties of the
lubricant being used by the specified crane, in addition to monitoring trends. Such data can
then be incorporated into this rule-based tool. A broader accurate diagnosis can be
achieved if a wider range of data is available. These can be achieved if original equipment
manufacturers and oil sampling laboratories are willing to supply this information, which is
often very difficult to obtain.
Development of an Efficient Planned Maintenance Framework for Marine and Offshore Machinery
135
Chapter 6
Application of a Multiple Attribute Group Decision Making
(MAGDM) Model for Selection of the best Maintenance Strategy
for Marine and Offshore Machinery based on Fuzzy Technique for
Order Preference by Similarity to Ideal Situation (FTOPSIS)
Summary
This chapter proposes a strategic fuzzy multi-attribute decision making methodology for the
concise and straightforward selection of an appropriate maintenance strategy. The decision
support structure allows the use of multiple decision makers to incorporate and aggregate
their subjective opinions transparently. In the analysis, a Fuzzy Technique for Order
Preference by Similarity to Ideal Situation is employed to rank the maintenance strategies
with respect to costs and benefits for their subsequent implementation.
6.1 Introduction
In 1979, the Massachusetts Institute of Technology (MIT) carried out an extraordinary
milestone study in which it estimated that over $200 billion was spent annually on
maintenance in North America. Moreover, approximately one third of this expenditure was
determined to be unnecessary. Maintenance, and in particular the effect of mal-lubrication,
is still one of the few remaining areas of a company’s expenditure that can be significantly
improved upon. Many modern engines contain a number of complex systems and thus
require a variety of maintenance procedures for reliable, cost effective operation. The
increasing cost, complexity of maintenance, other uncertainties, and their effect on
production has initiated a need for adequate and proper planning, management, and
omission of the maintenance process (Toms and Toms, 2008). Almost all modern
maintenance programs include a variation of one or more of the following general
maintenance procedures: Run-to-Failure Maintenance, Preventive Maintenance, Condition-
Based Maintenance, and Reliability Centred Maintenance.
Therefore, the assessment of the cost of the planned maintenance (PM) strategies may
require an advanced cost benefit analysis and a powerful tool for risk management
methodology to aid in decision making. Decision making can be characterised as a process
of selecting a highly sufficient alternative from a set of alternatives to attain a goal. Many
Development of an Efficient Planned Maintenance Framework for Marine and Offshore Machinery
136
decisions involve uncertainty. In order to overcome the uncertainty and risk that threatens
the maintenance, it is important to design a robust expert system that will cater for all the
above maintenance procedures, which is one of the strategies developed in Chapter 4 and
Chapter 5.
In this chapter, decision makers’ opinions will be expressed through a process of fuzzy
multi-attribute group decision making and aggregated to obtain the performance rating with
respect to all of the attributes for each maintenance procedure alternative. Decision makers’
fuzzy decision matrixes are used and converted into an aggregated decision matrix to
determine the most preferable choice among all possible alternatives. Fuzzy multi-attribute
decision making is a tool that is suitable for group decision making under a fuzzy
environment (Li, 2007). As a result, the purpose of using FMADM in this chapter is to
aggregate and synthesise opinions of experts, thus, guiding them in decision making when
they are planning to implement a cost effective maintenance investment.
There are a number of Multiple Criteria Decision Making methods in literature, such as
Fuzzy Technique for Order Preference by Similarity to Ideal Situation (Chen, 2000). A novel
method for the MAGDM will be proposed in this chapter. In this method, the linguistic terms
will be used during the evaluation process, and then FTOPSIS is used to rank the
alternatives. This novel MAGDM technique can efficiently resolve the fuzzy information by
decreasing its uncertainty level, is capable of reducing the computation time, and can
provide reasonable and robust ranking results.
6.2 Methodology
The proposed methodology and hierarchical structure describing the decision making
process of selecting an ideal maintenance strategy for marine and offshore machinery is
graphically illustrated in Figure 6.1. The first stage is the identification of decision making
alternatives for marine equipment maintenance. The decision alternatives and evaluation
criteria are literature-based and have been derived from various literature reviews. The
evaluation process is conducted by decision analysts based on their subjective knowledge
and judgment on marine equipment maintenance practice.
The second stage in the methodology is the identification of the evaluation criteria for the
identified proto-type maintenance strategies. In the third stage, the AHP methodology is
applied to obtain the importance weights of the evaluation criteria. In the fourth stage,
FTOPSIS is applied to obtain performance ratings of the various decision alternatives. The
importance weights obtained through the AHP are incorporated into the FTOPSIS analysis
to obtain performance ratings of the decision alternatives.

Development of an Efficient Planned Maintenance Framework for Marine and Offshore Machinery
137
A spreadsheet is used to compute the performance ratings of these alternatives. Results of
the decision analysis are ranked in their order of preference by the analysts for a final
selection and adaptation by the decision-makers (e.g. Maintenance Engineer on-board) or
end-users within the marine and offshore industry.
6.2.1 Identification of Decision-Making Alternatives (Step one)
The four decision making alternatives (Run-to-failure, preventive maintenance, condition-
based maintenance, and reliability centred maintenance) described below have been
identified and applied in this model. The maintenance strategies have been selected from
the operations and maintenance best practices, as well as the machinery oil analysis,
(1) Identification of Decision-Making Alternatives for
Crane Bearing/Gearbox Maintenance
Run-to-Failure Maintenance
Preventive Maintenance
Condition Based Maintenance
Reliability-Centred Maintenance
(2) Identification of Evaluation Criteria
Reliability Cost Safety Availability Downtime
(3) Rating Phase - Determination of Importance Weights of
Evaluation Criteria
(4) Selection Phase - Application of FTOPSIS Approach to
obtain Performance Rating of Decision Alternatives
(5) Perform Sensitivity Analysis
Figure 6.1 Hierarchical Model of Decision Making Analysis for Equipment
Maintenance

Development of an Efficient Planned Maintenance Framework for Marine and Offshore Machinery
138
methods, automation, and benefits recommended by Sullivan et al. (2010) and Toms and
Toms (2008), respectively.
6.2.2 Identification of Evaluation Criteria (Step two)
ABB (2016) and Toms and Toms (2008) identify reliability, cost effectiveness, operational
safety, availability, and equipment downtime as the main attributes critical to enhancing the
selection of an ideal maintenance strategy in an uncertain environment. These five
attributes, described below, have been applied in this model as evaluation criteria to reduce
the elicitation process and to serve as a check for completeness and transparency.
6.2.2.1 Reliability
The study of component and process reliability is the basis of many efficiency evaluations
in operation management (Carlo, 2015). Reliability has long been considered to be one of
the three related attributes that must be taken into consideration when making, buying, or
using a piece of equipment or component. It describes the ability of a system or component
to function under stated conditions for a specified period of time. However, Toms and Toms
(2008) identify reliability as the probability that an equipment system will operate at a
specified performance level for a specific period. ABS (2016) also perceives reliability as
the probability that an item will perform its intended function for a specified interval under
stated conditions.
In a broader way, Carlo (2015) identifies reliability as science to predict, analyze, prevent
and mitigate failures over time. It is a science, with its theoretical basis and principles. It
also has sub-disciplines, all related in some way to the study and knowledge of faults.
Reliability also has to do with psychology and psychiatry (Carlo (2015) given that the human
element is almost always part of the systems.
6.2.2.2 Cost
This cost includes equipment capital cost, cost due to unplanned downtime of equipment,
labour cost, and cost involved with repair or replacement of equipment. An independent
study conducted by Forrester Consulting on behalf of ABB Turbocharging reveals that
organisations are under pressure to reduce cost, and that the three quarterly reports always
consider the cost implications of parts and services (ABB, 2016). History, however, reveals
that not all equipment operators utilize maintenance strategy in the most cost effective
manner (Taylor, 1995). Decreasing unplanned downtime, and costs of maintenance,
availability, and reliability are therefore significant considerations for investing in capital-
intensive machinery.
Development of an Efficient Planned Maintenance Framework for Marine and Offshore Machinery
139
6.2.2.3 Safety
There are numerous definitions of safety among professionals and researchers in the safety
and risk fields. For example, Leveson (1995, 2004) cited in Aven (2013) defines safety as
“the absence of accidents, where an accident is defined as an event involving an unplanned
and unacceptable loss”. Safety is also linked to risk and uncertainty as Moller et al. (2006)
views safety as the opposite of risk, while, Aven (2013) considers epistemological
uncertainty of great importance when discussing safety and safety matters, but argues that
this uncertainty aspect is not reflected in many perceptions of risk.
Safety can also refer to the control of recognized hazards in order to achieve an acceptable
level of risk. Safe operation of marine and offshore equipment is very important, thus, the
general safety guidance for equipment is to be adhered to at all times. Potential hazards of
operating machines and equipment are numerous, and thus, machine and equipment
operators are encouraged to become familiar with the standards for safe machine and
equipment operations relevant to their work (Toms and Toms, 2008). With this, it is
envisaged that risks associated with the machines / equipment can be reduced to a feasible
and acceptable level.
6.2.2.4 Equipment availability
Availability, according to Carlo (2015) may be defined as the percentage of time that a
repairable system is in an operating condition. Toms and Toms (2008) view equipment
availability as the degree to which the machine / equipment in context is in a specified
operable and committable state at the start of operation, when the operation is called for at
an unknown (i.e. a random) time. This basically means that the machine / equipment is
suitable and ready for use when needed. However, in literature, equipment availability
depends on the reliability and maintainability of that equipment, and availability itself
therefore, depends on the time between two consecutive failures, and how long it will takes
to restore the system. The ability to measure and control costs of equipment deterioration
has an obvious direct impact on equipment availability and operational costs (Toms and
Toms, 2008).
6.2.2.5 Equipment downtime
A period during which an equipment or machine is not functional or cannot work is referred
to as downtime. Downtime can occur due to technical failure, machine adjustment,
maintenance, or non-availability of inputs such as materials, labour, and power (ABB, 2016),
(Toms and Toms, 2008). An independent study for ABB Turbocharging found that 87
percent of organizations work only or mostly with Original Equipment Manufacturers
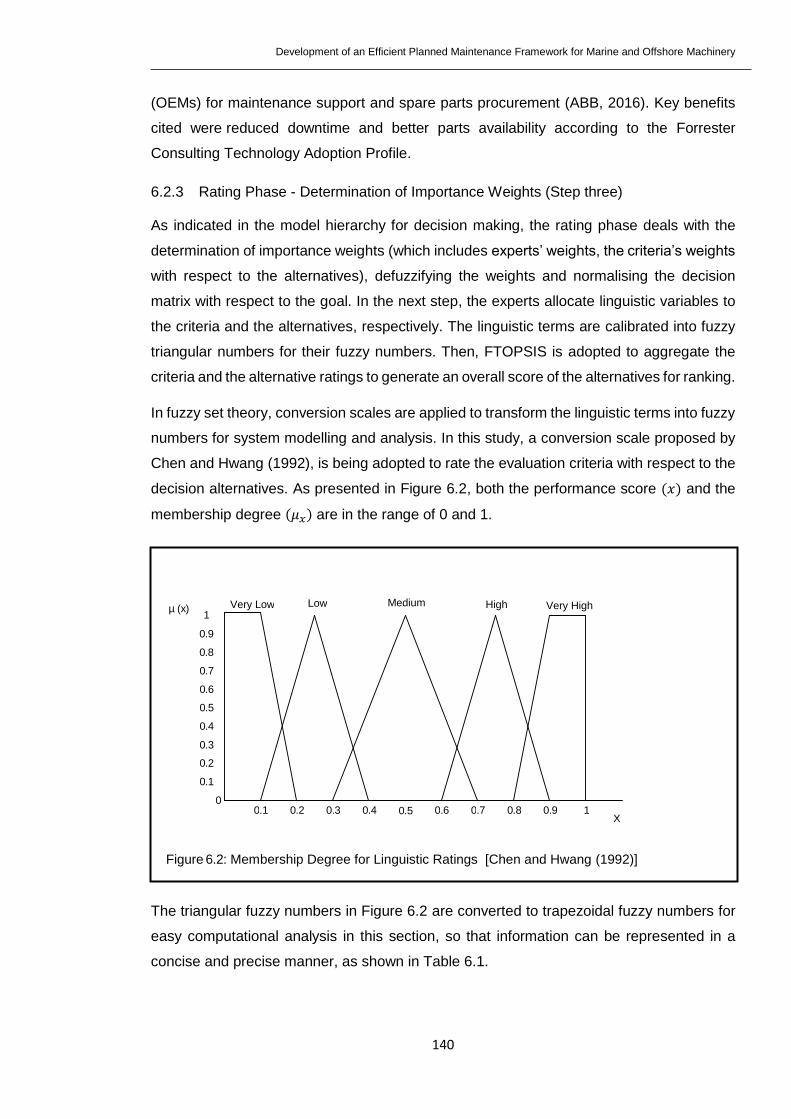
Development of an Efficient Planned Maintenance Framework for Marine and Offshore Machinery
140
(OEMs) for maintenance support and spare parts procurement (ABB, 2016). Key benefits
cited were reduced downtime and better parts availability according to the Forrester
Consulting Technology Adoption Profile.
6.2.3 Rating Phase - Determination of Importance Weights (Step three)
As indicated in the model hierarchy for decision making, the rating phase deals with the
determination of importance weights (which includes experts’ weights, the criteria’s weights
with respect to the alternatives), defuzzifying the weights and normalising the decision
matrix with respect to the goal. In the next step, the experts allocate linguistic variables to
the criteria and the alternatives, respectively. The linguistic terms are calibrated into fuzzy
triangular numbers for their fuzzy numbers. Then, FTOPSIS is adopted to aggregate the
criteria and the alternative ratings to generate an overall score of the alternatives for ranking.
In fuzzy set theory, conversion scales are applied to transform the linguistic terms into fuzzy
numbers for system modelling and analysis. In this study, a conversion scale proposed by
Chen and Hwang (1992), is being adopted to rate the evaluation criteria with respect to the
decision alternatives. As presented in Figure 6.2, both the performance score (𝑥) and the
membership degree (𝜇𝑥) are in the range of 0 and 1.
The triangular fuzzy numbers in Figure 6.2 are converted to trapezoidal fuzzy numbers for
easy computational analysis in this section, so that information can be represented in a
concise and precise manner, as shown in Table 6.1.
Very High High Medium Low Very Low
0 . 1 0 . 3 0 . 6 0 . 8 1
1
0
Figure 6 . 2 : Membership Degree for Linguistic Ratings [Chen and Hwang (1992)]
0 . 2 0 . 4 0 . 7 0 . 9
µ ( x )
X 0 . 5
0 . 1
0 . 2 0 . 3
0 . 4
0 . 5 0 . 6
0 . 7
0 . 8
0 . 9
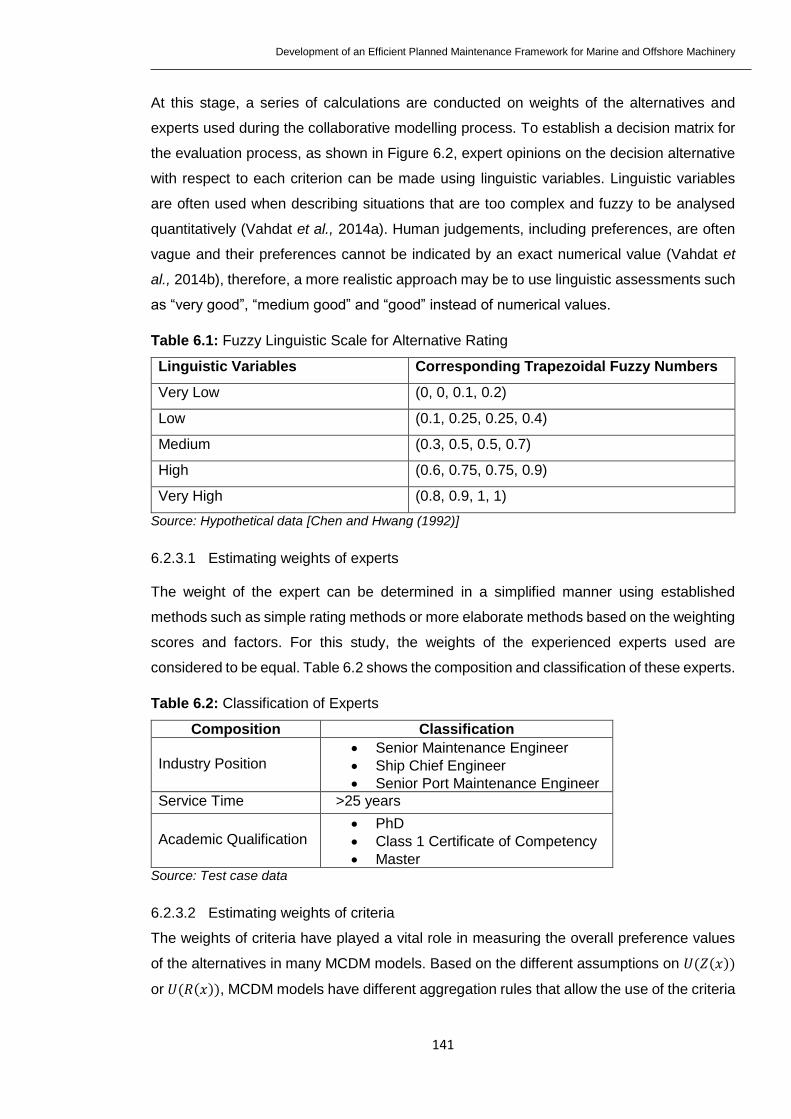
Development of an Efficient Planned Maintenance Framework for Marine and Offshore Machinery
141
At this stage, a series of calculations are conducted on weights of the alternatives and
experts used during the collaborative modelling process. To establish a decision matrix for
the evaluation process, as shown in Figure 6.2, expert opinions on the decision alternative
with respect to each criterion can be made using linguistic variables. Linguistic variables
are often used when describing situations that are too complex and fuzzy to be analysed
quantitatively (Vahdat et al., 2014a). Human judgements, including preferences, are often
vague and their preferences cannot be indicated by an exact numerical value (Vahdat et
al., 2014b), therefore, a more realistic approach may be to use linguistic assessments such
as “very good”, “medium good” and “good” instead of numerical values.
Table 6.1: Fuzzy Linguistic Scale for Alternative Rating
Linguistic Variables Corresponding Trapezoidal Fuzzy Numbers
Very Low (0, 0, 0.1, 0.2)
Low (0.1, 0.25, 0.25, 0.4)
Medium (0.3, 0.5, 0.5, 0.7)
High (0.6, 0.75, 0.75, 0.9)
Very High (0.8, 0.9, 1, 1)
Source: Hypothetical data [Chen and Hwang (1992)]
6.2.3.1 Estimating weights of experts
The weight of the expert can be determined in a simplified manner using established
methods such as simple rating methods or more elaborate methods based on the weighting
scores and factors. For this study, the weights of the experienced experts used are
considered to be equal. Table 6.2 shows the composition and classification of these experts.
Table 6.2: Classification of Experts
Composition Classification
Industry Position
Senior Maintenance Engineer
Ship Chief Engineer
Senior Port Maintenance Engineer
Service Time >25 years
Academic Qualification
PhD
Class 1 Certificate of Competency
Master Source: Test case data
6.2.3.2 Estimating weights of criteria
The weights of criteria have played a vital role in measuring the overall preference values
of the alternatives in many MCDM models. Based on the different assumptions on 𝑈(𝑍(𝑥))
or 𝑈(𝑅(𝑥)), MCDM models have different aggregation rules that allow the use of the criteria

Development of an Efficient Planned Maintenance Framework for Marine and Offshore Machinery
142
weights in different ways. Moreover, distinct methods for assessing criteria weights are
designed for different aggregation rules (Choo et al., 1999). In this study, the weights of the
five criteria proposed are considered to be equal.
6.2.3.3 Aggregation of experts’ opinions
Based on the literature review presented in Chapter 2, when carrying out collaborative
modelling of large and sophisticated engineering machinery, experts may have different
opinions; thus, it is essential to aggregate these opinions in a logical, systematic, and
simplified manner. In line with the modelling approach presented in Hsu and Chen (1994),
consider that each expert 𝐸𝑢 (𝑢 = 1, 2, 3,…𝑀) expresses their opinions on a particular
criterion based on their expertise by a set of linguistic variables that are described by fuzzy
numbers. The aggregation of the experts’ judgement can be obtained as follows:
1. Calculate the degree of agreement (degree of similarity) 𝑆𝑢𝑣(�̌�𝑢�̌�𝑣) of the opinions
𝛿𝑈 and 𝛿𝑣 of a pair of experts 𝐸𝑢 and 𝐸𝑣 where 𝑆𝑢𝑣(�̌�𝑢�̌�𝑣) ∈ (0, 1). Based on this
approach, �̃� = (𝑎1, 𝑎2, 𝑎3, 𝑎4) and �̃� = (𝑏1, 𝑏2, 𝑏3, 𝑏4) are trapezoidal fuzzy numbers.
The degree of similarity between these two fuzzy numbers can be evaluated by the
similarity function S defined as follows (Hsu and Chen, 1994):
𝑆(�̌�, �̌�) = 1 − 1
4 ∑ |𝑎𝑖 − 𝑏𝑖|
4𝑖=1 (6.1)
where 𝑆(𝑋,̌ �̌�) ∈ (0, 1). It is important to mention that the larger the value of 𝑆(�̌�, �̌�), the
greater the similarity between two fuzzy numbers of �̌� and �̌� respectively.
2. Calculate the degree of average agreement (AA) of expert 𝐸𝑢; this can be obtained
using Equation (6.2).
𝐴𝐴(𝐸𝑢) = 1
𝑁−1∑ 𝑆(𝛿𝑢, 𝛿𝑣)
𝑁𝑢≠𝑣𝑣=1
(6.2)
3. Calculate the relative agreement (RA) degree 𝑅𝐴(𝐸𝑢) of experts 𝐸𝑢; this can be
obtained as follows:
𝑅𝐴(𝐸𝑢) = 𝐴𝐴(𝐸𝑢)
∑ 𝐴𝐴(𝐸𝑢)𝑁𝑢=1
(6.3)
4. Calculate the consensus coefficient degree 𝐶𝐶 of experts 𝐸𝑢 (𝑢 = 1, 2, …𝑀); this can
be analysed as follows:
𝐶𝐶(𝐸𝑢) = 𝛽. 𝑤(𝐸𝑢) + (1 − 𝛽). 𝑅𝐴(𝐸𝑢) (6.4)
where 𝛽(0 ≤ 𝛽 ≤ 1) is a relaxation factor of the proposed approach. It highlights the
important of 𝑤(𝐸𝑢) over 𝑅𝐴(𝐸𝑢). It is important to note that when 𝛽 = 0, no importance has
been given to the weight of experts and, thus, a homogeneous group of experts is used.
When 𝛽 = 1, then the consensus degree of an expert is the same as its importance weight.

Development of an Efficient Planned Maintenance Framework for Marine and Offshore Machinery
143
The consensus coefficient degree of each expert is a good measure for evaluating the
relative worthiness of judgement of all experts participating in the decision making process.
John et al., (2014) believe that it is the responsibility of the decision maker to assign an
appropriate value of 𝛽, and considered 𝛽 to be 0.75.
5. The expert aggregation judgement �̌�𝐴𝐺 can be obtained as follows:
�̌�𝐴𝐺 = 𝐶𝐶(𝐸1) × �̃�1 + 𝐶𝐶(𝐸2) × �̃�2 + ⋯+ ⋯𝐶𝐶(𝐸𝑚) × �̃�𝑛 (6.5)
where �̃�𝑖(𝑖 = 1, 2, …𝑛) is the subjective rating of a given criterion with respect to alternative
by expert 𝐸𝑢(𝑢 = 1, 2, …𝑚).
6.2.3.4 Defuzzification of the aggregated fuzzy results
In order to rank the alternatives of the decision problem, all aggregated fuzzy numbers must
be defuzzified. Each element of matrix �̃�𝑖 = (𝑎1, 𝑎2, 𝑎3, 𝑎4) can be converted to a crisp value
using Equation 6.3 proposed by Sugeno (1999) using the centre of area defuzzification
technique. Equation 6.3 is adapted within this study because of the ease in the computation
process compared to other techniques in the literature, such as Chen (2000).
𝑋∗ = ∫
𝑥−𝑎
𝑎2−𝑎1𝑥𝑑𝑥+∫ 𝑥𝑑𝑥+∫
𝑎4−𝑥
𝑎4−𝑎3𝑥𝑑𝑥
𝑎4𝑎3
𝑎3𝑎2
𝑎2𝑎1
∫𝑥−𝑎
𝑎2−𝑎1𝑑𝑥+∫ 𝑑𝑥+∫
𝑎4−𝑥
𝑎4−𝑎3
𝑎4𝑎3
𝑑𝑥𝑎3𝑎2
𝑎2𝑎1
= 1
3
(𝑎4+𝑎3)2−𝑎4𝑎3−(𝑎1+𝑎2)2+𝑎1𝑎2
𝑎4+𝑎3−𝑎1−𝑎2 (6.6)
6.2.4 Selection Phase - Application of FTOPSIS Approach to Obtain Performance Rating
of Decision Alternatives (Step four)
Selection of best maintenance strategies often requires analysts to provide both quantitative
and qualitative assessments for determining the performance of each alternative with
respect to each criterion. A modelling approach that will handle uncertain, imprecise,
indefinite, and subjective data that often result from such assessments in a flexible manner
is required. As a consequence of that, this study utilises a FTOPSIS algorithm (Yang et al.,
2009), (Jahanshahloo et al., 2006), and (Chen, 2000) due to the fact that fuzzy sets might
provide the needed flexibility to represent the vague information resulting from the lack of
data or knowledge. TOPSIS can reasonably deal with the multiplicity of the criteria in order
to rank the alternatives based on the aggregated decision matrix and weight vector analysis.
To carry out the assessment, consider 𝑥 possible alternatives 𝐴1, 𝐴2, 𝐴3 … 𝐴𝑥 from which 𝐸𝑢
decision-makers 𝐸𝑢 = (1, 2, 3,…𝑚) have to make a credible decision on an appropriate
maintenance strategy on the basis of 𝑛 sets of criteria 𝐶1, 𝐶2, 𝐶3, … 𝐶𝑛. The decision support
procedure is achieved through the following steps:

Development of an Efficient Planned Maintenance Framework for Marine and Offshore Machinery
144
6.2.4.1 Fuzzy decision matrix construction
This step involves choosing appropriate linguistic variables for the alternatives with respect
to criteria. Suppose the aggregation rate of alternative 𝐴1(𝑖 = 1, 2, …𝑥) for criteria 𝐶1(𝑗 =
1, 2, …𝑛) is (𝑡𝑖𝑗). Therefore, TOPSIS can be expressed in a matrix format as follows:
𝐶1 𝐶2 ⋯ 𝐶𝑛
𝑍 = (𝑡𝑖𝑗)𝑦×𝑛 =
𝐴1
𝐴2
⋮𝐴𝑛
[
𝑡11 𝑡12 ⋯ 𝑡1𝑛
𝑡21 𝑡22 ⋯ 𝑡2𝑛
⋮𝑡𝑥1
⋮𝑡𝑥2
⋮⋯
⋮𝑡𝑥𝑛
] 𝑖 = 1, 2, … . , 𝑥; 𝑗 = 1, 2, … . , 𝑛 (6.7)
where, matrix 𝑍 is composed of 𝑥 alternatives and 𝑛 criteria.
In the proposed model, the process for the estimation of the values for the best maintenance
strategy for marine and offshore machinery will depend on expert knowledge and judgement
of the decision analysts.
6.2.4.2 Fuzzy decision matrix normalisation
After producing the decision matrix for the alternatives, the fuzzy data obtained in the matrix
are normalised in order to eliminate the units of criteria scores, so that numerical
comparisons often associated with MCDM problems can be brought to the same perception.
The process involves dividing the score within each criterion by the root-sum-of-squares for
all the decision-making criteria. Normalisation has two main aims:
1. For the comparison of heterogeneous criteria.
2. To ensure that all triangular fuzzy numbers are ranged within the interval, 0 and 1
(Wang and Chang, 2007).
Since 𝑛 criteria may be measured in different ways, the decision matrix 𝑍 needs to be
normalised. This step transforms various criteria dimensions into non-dimensional units,
which allows for comparisons across the criteria. The normalised decision matrix can be
obtained by using the matrix given in 6.8.
𝐶1 𝐶2 ⋯ 𝐶𝑛
𝑅 = (𝑟𝑖𝑗)𝑦×𝑛 =
𝐴1
𝐴2
⋮𝐴𝑛
[
𝑟11 𝑟12 ⋯ 𝑟1𝑛
𝑟21 𝑟22 ⋯ 𝑟2𝑛
⋮𝑟𝑥1
⋮𝑟𝑥2
⋮⋯
⋮𝑟𝑥𝑛
] (6.8)
6.2.4.3 Construction of weighted normalisation fuzzy decision matrix
The weighting factors are a set of percentages that add up to 100%, with the most important
alternative receiving the highest weighting factor. The process involves multiplying the

Development of an Efficient Planned Maintenance Framework for Marine and Offshore Machinery
145
importance weights of the alternative by the values in the normalised fuzzy decision matrix.
Considering the different importance of each criterion, the weighted normalized fuzzy-
decision matrix �̃� can be constructed using Equations 6.9 and 6.10.
�̃� = ⌊�̃�𝑖𝑗⌋𝑚𝑥𝑛, 𝑖 = 1, 2,… ,𝑚; 𝑗 = 1, 2, … , 𝑛 (6.9)
�̃�𝑖𝑗 = �̃�𝑖𝑗 𝑥 �̃�𝑗 (6.10)
where, �̃�𝑗 denotes the importance weight of criterion 𝐶𝑗 .
6.2.4.4 Determination of the fuzzy positive ideal reference point (FPIRP) and fuzzy
negative ideal reference point (FNIRP)
The FPIRP is obtained by identifying the best score in a criterion. Similarly, the worst score
of a criterion is identified and recorded as the FNIRP. The FPIRP (𝐴+) [the benefit criterion]
and FNIRP (𝐴−) [the cost criterion) are defined as follows:
𝐴+ = (𝑣1+, 𝑣2
+ , … , 𝑣𝑛+), (6.11)
𝐴− = (𝑣1−, 𝑣2
− , … , 𝑣𝑛−), (6.12)
where,
�̃�𝑗+ = {𝑀𝑎𝑥 𝑣𝑖𝑗 , 𝑖 ∈ 𝑗1;𝑀𝑖𝑛 𝑣𝑖𝑗, 𝑖 ∈ 𝑗2} (6.13)
�̃�𝑗− = {𝑀𝑎𝑥 𝑣𝑖𝑗 , 𝑖 ∈ 𝑗1;𝑀𝑖𝑛 𝑣𝑖𝑗 , 𝑖 ∈ 𝑗2} (6.14)
where 𝑗1 and 𝑗2 are associated with the sets of benefit and cost criteria respectively.
The distance of each alternative (maintenance strategy) from the FPIRP (𝐷𝑖+) and FNIRP
(𝐷𝑖−) with respect to each criterion can be obtained by utilising Equations 6.15 and 6.16
respectively.
𝐷𝑖+ = √∑ (𝑣𝑖𝑗 − 𝑣𝑖
+)2,𝑥𝑖=1 𝑗 − 1, 2, … , 𝑛 (6.15)
𝐷𝑖− = √∑ (𝑣𝑖𝑗 − 𝑣𝑖
−)2,𝑥𝑖=1 𝑗 − 1, 2, … , 𝑛 (6.16)
The obtained 𝐷𝑖+ and 𝐷𝑖
− values can then be used in obtaining the Closeness Coefficient
(𝐶𝐶𝑖) of each alternative for ranking purposes.

Development of an Efficient Planned Maintenance Framework for Marine and Offshore Machinery
146
6.2.4.5 Obtaining the closeness coefficient of each alternative
The ranking of the alternative can be determined after the obtaining 𝐶𝐶𝑖. This allows the
decision making experts to choose the most rational and appropriate alternative. To
calculate the 𝐶𝐶𝑖 Equation 6.17 is used.
𝐶𝐶𝑖 = 𝐷𝑖
−
𝐷𝑖++ 𝐷𝑖
− 𝑖 = 1, 2, … ,𝑚 (6.17)
6.2.4.6 Ranking the alternatives
The different alternatives are ranked according to the closeness coefficient 𝐶𝐶𝑖 in
decreasing order. It is important to note that the best alternative is closest to the FPIRP and
farthest from the FNIRP. This means that the larger the 𝐶𝐶𝑖, the better the associated
alternative.
6.2.5 Perform Sensitivity Analysis (Final)
Conducting a sensitivity analysis (SA) is an important aspect of the novel hybrid
methodology presented in Section 6.2, as it is meant to provide a reasonable amount of
confidence in the overall result of the study. Given that the final output result is dependent
on the subjective judgements of the decision makers, it is essential to perform SA based on
a set of scenarios that reflect different views on the relative importance of the attributes, in
order to observe the stability and ranking order of the model’s output. Then, managerial
attention is focused during implementation of the maintenance strategies for the decision
making process.
6.3 Application of Methodology to a Test Scenario
The proposed model will be demonstrated in a decision making analysis of the selection of
an on-board machinery (crane) maintenance strategy for ships operating under an uncertain
environment, as presented in Section 6.2. The hierarchical model of this decision-making
analysis process is as illustrated in Figure 6.3, with the goal of the decision problem in level
0, decision alternatives in level 1, and evaluation criteria in level 2. It is important to note
that the proposed model is applied for decision making in the selection of appropriate
maintenance strategies for marine and offshore machinery.
This representation is made to simplify the computational complexity associated with the
analysis and to provide managerial insight to decision makers in a reasonable manner prior
to their subjective evaluation of criteria with respect to alternatives. The analysis will be
conducted through a robust literature review and brainstorming session with the experts.
The positions of the experts and their degree of competency in the industry are as shown
in Table 6.7. The primary objective of the decision-making analysis is to identify the best,

Development of an Efficient Planned Maintenance Framework for Marine and Offshore Machinery
147
most appropriate and acceptable maintenance strategy to be adopted by the engineer on-
board ships and offshore installations.
Figure 6.3: Hierarchical Structure of Maintenance Strategy Selection
Note: RTFM, PM, CBM, and RCM stand for Run-to-Failure Maintenance, Preventive Maintenance, Condition
Based Maintenance, and Reliability Centred Maintenance, respectively.
6.3.1 Identification of Decision Making Alternatives (Step one)
This involves the identification of the decision making alternatives through a literature review
of the machinery maintenance strategies on-board ships. As presented in section 6.2.1, four
(4) alternatives were established for this analysis.
6.3.2 Identification of Evaluation of Criteria (Step two)
Based on the expert opinions, the criteria or attributes that are critical to enhancing the
selection of the best maintenance strategy in uncertain situations are stated in section 6.2.2.
It is evident that the criteria used for the selection procedure consist of two main categories:
cost (C) (the lower the value, the more effective the alternative) and benefit (B) (the higher
the value, the more robust or effective the alternative). As a consequence, the cost type
criteria include the cost (equipment capital cost, labour cost, repair/replacement cost),
downtime, and availability, while the benefit type criteria consist of safety (operational
safety, environmental safety) and reliability. The assigned criteria are described in Table
6.3. Based on this, it is worth mentioning that maintenance strategy selection can be carried
out with respect to three cost and two benefit criteria.
Maintenance
Strategy Selection
RTFM
PM
CBM
RCM
Reliability
Cost
Safety
Availability
Downtime
Level 0: Objective Level 1: Decision Alternatives Level 2: Evaluation Criteria
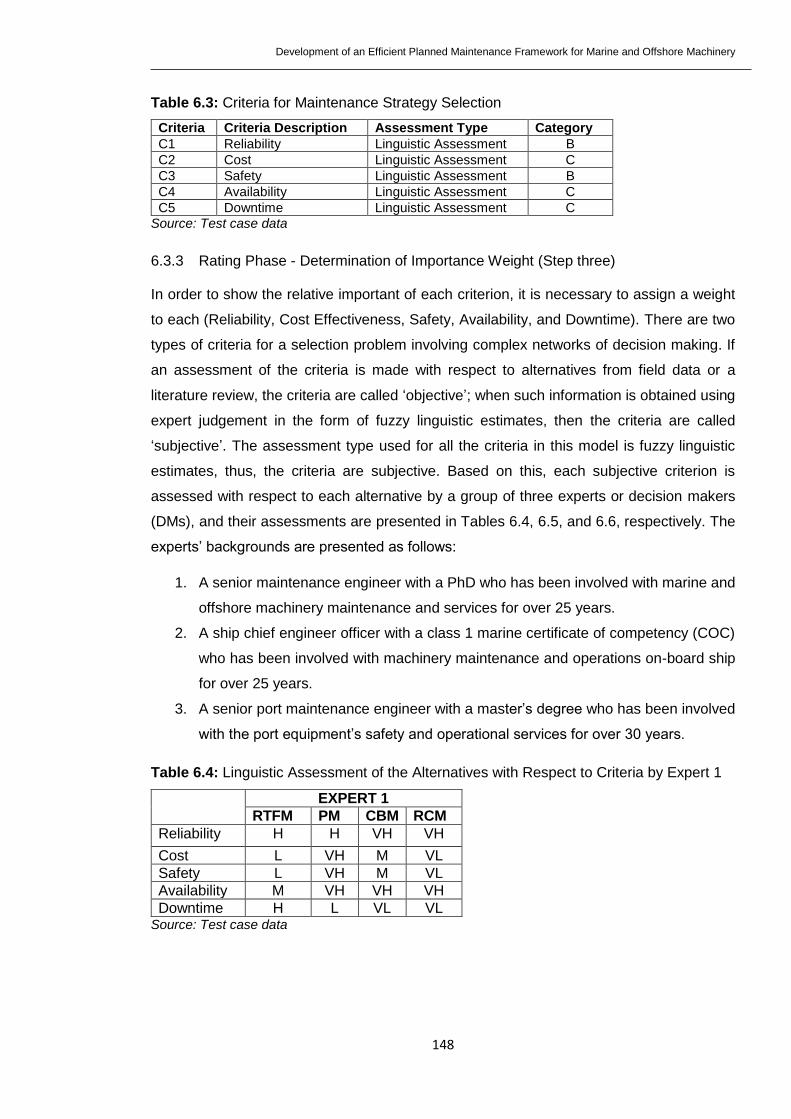
Development of an Efficient Planned Maintenance Framework for Marine and Offshore Machinery
148
Table 6.3: Criteria for Maintenance Strategy Selection
Criteria Criteria Description Assessment Type Category
C1 Reliability Linguistic Assessment B
C2 Cost Linguistic Assessment C
C3 Safety Linguistic Assessment B
C4 Availability Linguistic Assessment C
C5 Downtime Linguistic Assessment C
Source: Test case data
6.3.3 Rating Phase - Determination of Importance Weight (Step three)
In order to show the relative important of each criterion, it is necessary to assign a weight
to each (Reliability, Cost Effectiveness, Safety, Availability, and Downtime). There are two
types of criteria for a selection problem involving complex networks of decision making. If
an assessment of the criteria is made with respect to alternatives from field data or a
literature review, the criteria are called ‘objective’; when such information is obtained using
expert judgement in the form of fuzzy linguistic estimates, then the criteria are called
‘subjective’. The assessment type used for all the criteria in this model is fuzzy linguistic
estimates, thus, the criteria are subjective. Based on this, each subjective criterion is
assessed with respect to each alternative by a group of three experts or decision makers
(DMs), and their assessments are presented in Tables 6.4, 6.5, and 6.6, respectively. The
experts’ backgrounds are presented as follows:
1. A senior maintenance engineer with a PhD who has been involved with marine and
offshore machinery maintenance and services for over 25 years.
2. A ship chief engineer officer with a class 1 marine certificate of competency (COC)
who has been involved with machinery maintenance and operations on-board ship
for over 25 years.
3. A senior port maintenance engineer with a master’s degree who has been involved
with the port equipment’s safety and operational services for over 30 years.
Table 6.4: Linguistic Assessment of the Alternatives with Respect to Criteria by Expert 1
EXPERT 1
RTFM PM CBM RCM
Reliability H H VH VH
Cost L VH M VL
Safety L VH M VL
Availability M VH VH VH
Downtime H L VL VL Source: Test case data

Development of an Efficient Planned Maintenance Framework for Marine and Offshore Machinery
149
Table 6.5: Linguistic Assessment of the Alternatives with Respect to Criteria by Expert 2
EXPERT 2
RTFM PM CBM RCM
Reliability H H VH VH
Cost VL H L VL
Safety L VH M VL
Availability M H VH VH
Downtime H VL VL VL Source: Test case data
Table 6.6: Linguistic Assessment of the Alternatives with Respect to Criteria by Expert 3
EXPERT 3
RTFM PM CBM RCM
Reliability M H VH VH
Cost L H M L
Safety L H M VL
Availability M M VH H
Downtime M VL VL L Source: Test case data
Note: VL, L, M, H and VH stand for Very Low, Low, Medium, High, and Very High, respectively.
6.3.3.1 Estimating weights of experts
The weights of the experts are determined based on the available information in Section
6.2.3.1. The industrial positions, service times, and academic qualifications of the experts
or decision-makers are extracted from Table 6.2 and utilised. As shown in Table 6.7, the
weights of these three experts are considered to be equal and this is indicated as degree
of competency (0.333).
Table 6.7: Selected Experts and their Assigned Degree of Competency
Decision Makers
Industrial Position
Service Period
Academic Qualification
Degree of Competency
DM1 Senior Maintenance Engineer
>25 years PhD 0.333
DM2
Ship Chief Engineer
>25 years
Class 1 Certificate of Competency
0.333
DM3
Senior Port Maintenance Engineer
>25 years
Master
0.333
Source: Test case data
6.3.3.2 Estimating weights of criteria
For this model, equal weight values are assigned to the five identified evaluation criteria, as
shown in Table 6.8. These weight values will then be applied in the assessment process to
establish the fuzzy performance ratings of the model’s evaluation alternatives.

Development of an Efficient Planned Maintenance Framework for Marine and Offshore Machinery
150
Table 6.8: Weights of Criteria
Criteria Assigned Weights
Reliability 0.2
Cost 0.2
Safety 0.2
Availability 0.2
Downtime 0.2
Source: Test case data
6.3.3.3 Aggregation of experts’ opinions
This stage of the analysis involves a series of aggregation calculations of criteria ratings
with respect to alternatives. Since decision making on maintenance strategies involves
complex networks of group decision making in a fuzzy environment, it is important to
emphasise that three experts are employed for this strategic evaluation; for this study, their
weights are considered to be equal. When conducting the Fuzzy-TOPSIS process as
applied in this model, the knowledge and judgement of analysts involved are to be
considered. The four decision alternatives and five evaluation criteria shown in Table 6.9
will be used to develop the fuzzy TOPSIS decision matrix.
Tables 6.10, 6.11, and 6.12 show the corresponding fuzzy numbers of the alternatives with
respect to the criteria by the three experts. The figures obtained are based on the
membership functions of the linguistic variables developed in Figure 6.2 and the scale for
the measurement of the evaluation criteria, as shown in Table 6.1.
Aggregation calculations are conducted using Equations 6.1, 6.2, 6.3, 6.4, and 6.5 for the
experts’ judgement on reliability with respect to run-to-failure maintenance, as seen in Table
6.13. Similar, calculations were conducted on the other attributes and their fuzzy estimates
are presented in Tables 6.14a and 6.14b.
Table 6.9: Decision Alternatives and Evaluation Criteria
Decision Alternatives Evaluation Criteria
A1 Run-to-Failure Maintenance C1 Reliability
A2 Preventive Maintenance C2 Cost
A3 Condition Based Maintenance C3 Safety
A4 Reliability-Centred Maintenance C4 Availability
C5 Downtime
Source: Test case data
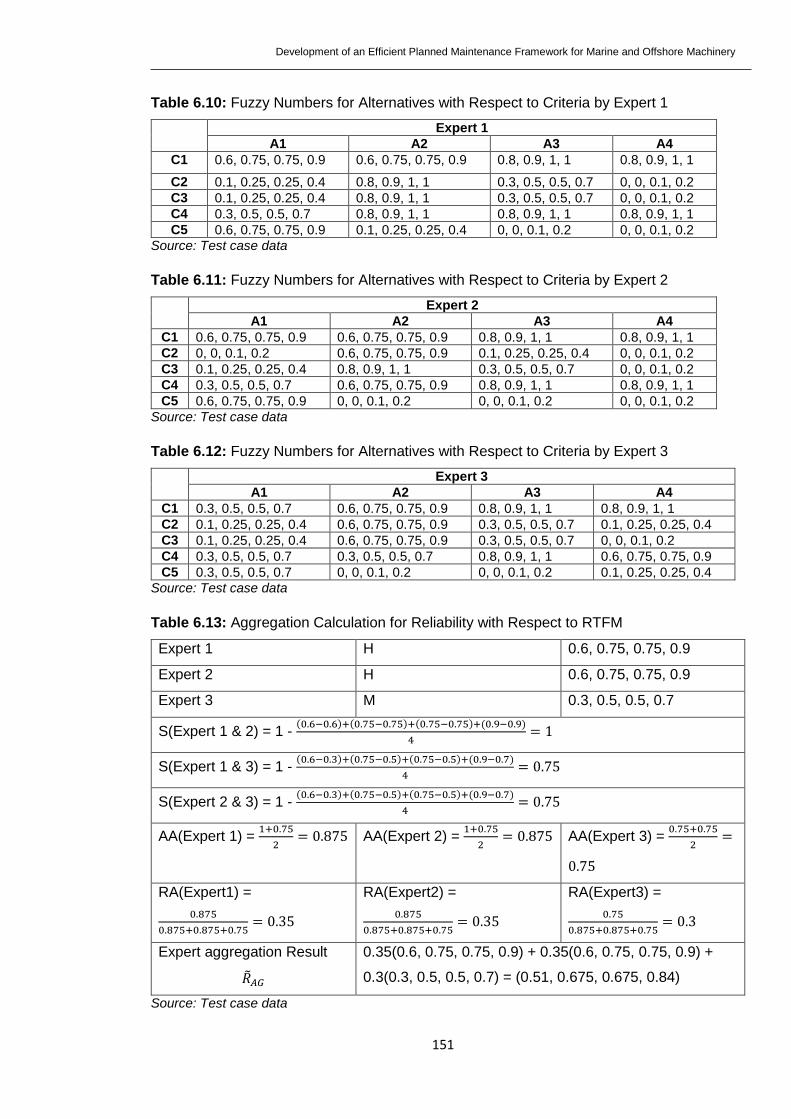
Development of an Efficient Planned Maintenance Framework for Marine and Offshore Machinery
151
Table 6.10: Fuzzy Numbers for Alternatives with Respect to Criteria by Expert 1
Expert 1
A1 A2 A3 A4
C1 0.6, 0.75, 0.75, 0.9 0.6, 0.75, 0.75, 0.9 0.8, 0.9, 1, 1 0.8, 0.9, 1, 1
C2 0.1, 0.25, 0.25, 0.4 0.8, 0.9, 1, 1 0.3, 0.5, 0.5, 0.7 0, 0, 0.1, 0.2
C3 0.1, 0.25, 0.25, 0.4 0.8, 0.9, 1, 1 0.3, 0.5, 0.5, 0.7 0, 0, 0.1, 0.2
C4 0.3, 0.5, 0.5, 0.7 0.8, 0.9, 1, 1 0.8, 0.9, 1, 1 0.8, 0.9, 1, 1
C5 0.6, 0.75, 0.75, 0.9 0.1, 0.25, 0.25, 0.4 0, 0, 0.1, 0.2 0, 0, 0.1, 0.2
Source: Test case data
Table 6.11: Fuzzy Numbers for Alternatives with Respect to Criteria by Expert 2
Expert 2
A1 A2 A3 A4
C1 0.6, 0.75, 0.75, 0.9 0.6, 0.75, 0.75, 0.9 0.8, 0.9, 1, 1 0.8, 0.9, 1, 1
C2 0, 0, 0.1, 0.2 0.6, 0.75, 0.75, 0.9 0.1, 0.25, 0.25, 0.4 0, 0, 0.1, 0.2
C3 0.1, 0.25, 0.25, 0.4 0.8, 0.9, 1, 1 0.3, 0.5, 0.5, 0.7 0, 0, 0.1, 0.2
C4 0.3, 0.5, 0.5, 0.7 0.6, 0.75, 0.75, 0.9 0.8, 0.9, 1, 1 0.8, 0.9, 1, 1
C5 0.6, 0.75, 0.75, 0.9 0, 0, 0.1, 0.2 0, 0, 0.1, 0.2 0, 0, 0.1, 0.2
Source: Test case data
Table 6.12: Fuzzy Numbers for Alternatives with Respect to Criteria by Expert 3
Expert 3
A1 A2 A3 A4
C1 0.3, 0.5, 0.5, 0.7 0.6, 0.75, 0.75, 0.9 0.8, 0.9, 1, 1 0.8, 0.9, 1, 1
C2 0.1, 0.25, 0.25, 0.4 0.6, 0.75, 0.75, 0.9 0.3, 0.5, 0.5, 0.7 0.1, 0.25, 0.25, 0.4
C3 0.1, 0.25, 0.25, 0.4 0.6, 0.75, 0.75, 0.9 0.3, 0.5, 0.5, 0.7 0, 0, 0.1, 0.2
C4 0.3, 0.5, 0.5, 0.7 0.3, 0.5, 0.5, 0.7 0.8, 0.9, 1, 1 0.6, 0.75, 0.75, 0.9
C5 0.3, 0.5, 0.5, 0.7 0, 0, 0.1, 0.2 0, 0, 0.1, 0.2 0.1, 0.25, 0.25, 0.4
Source: Test case data
Table 6.13: Aggregation Calculation for Reliability with Respect to RTFM
Expert 1 H 0.6, 0.75, 0.75, 0.9
Expert 2 H 0.6, 0.75, 0.75, 0.9
Expert 3 M 0.3, 0.5, 0.5, 0.7
S(Expert 1 & 2) = 1 - (0.6−0.6)+(0.75−0.75)+(0.75−0.75)+(0.9−0.9)
4= 1
S(Expert 1 & 3) = 1 - (0.6−0.3)+(0.75−0.5)+(0.75−0.5)+(0.9−0.7)
4= 0.75
S(Expert 2 & 3) = 1 - (0.6−0.3)+(0.75−0.5)+(0.75−0.5)+(0.9−0.7)
4= 0.75
AA(Expert 1) = 1+0.75
2= 0.875 AA(Expert 2) =
1+0.75
2= 0.875 AA(Expert 3) =
0.75+0.75
2=
0.75
RA(Expert1) =
0.875
0.875+0.875+0.75= 0.35
RA(Expert2) =
0.875
0.875+0.875+0.75= 0.35
RA(Expert3) =
0.75
0.875+0.875+0.75= 0.3
Expert aggregation Result
�̃�𝐴𝐺
0.35(0.6, 0.75, 0.75, 0.9) + 0.35(0.6, 0.75, 0.75, 0.9) +
0.3(0.3, 0.5, 0.5, 0.7) = (0.51, 0.675, 0.675, 0.84)
Source: Test case data

Development of an Efficient Planned Maintenance Framework for Marine and Offshore Machinery
152
Table 6.14a: Aggregation Results of Criteria Ratings with Respect to Alternatives
C1 C2 C3
A1 0.51, 0.675, 0.675, 0.84 0.067, 0.167, 0.2, 0.333 0.1, 0.25, 0.25, 0.4
A2 0.6, 0.75, 0.75, 0.9 0.662, 0.797, 0.828, 0.931 0.738, 0.853, 0.922, 0.969
A3 0.8, 0.9, 1, 1 0.233, 0.417, 0.417, 0.6 0.3, 0.5, 0.5, 0.7
A4 0.8, 0.9, 1, 1 0.035, 0.088, 0.153, 0.270 0, 0, 0.1, 0.2 Source: Test case data
Table 6.14b: Aggregation Results of Criteria Ratings with Respect to Alternatives
C4 C5
A1 0.3, 0.5, 0.5, 0.7 0.51, 0.675, 0.675, 0.84
A2 0.573, 0.722, 0.754, 0.871 0.031, 0.078, 0.147, 0.262
A3 0.8, 0.9, 1, 1 0, 0, 0.1, 0.2
A4 0.738, 0.853, 0.922, 0.969 0.035, 0.088, 0.153, 0.270 Source: Test case data
6.3.3.4 Defuzzification of the aggregated fuzzy results
Based on the aggregation results presented in Tables 6.14a and 6.14b, the fuzzy numbers
are converted into crisp values using Equation 6.6 and the results are presented in Table
6.15.
Table 6.15: Transformation of the Fuzzy Numbers into Crisp Values
C1 C2 C3 C4 C5
A1
(0.51+ 0.675 +
0.675 + 0.84) /
4 = 0.675
(0.067 + 0.167 +
0.2 + 0.333) / 4 =
0.192
(0.1 + 0.25 + 0.25
+ 0.4) / 4 = 0.25
(0.3 + 0.5 + 0.5
+ 0.7) / 4 = 0.5
(0.51+ 0.675 +
0.675 + 0.84) /
4 = 0.675
A2
(0.6 + 0.75 +
0.75 + 0.9) / 4 =
0.75
(0.662 + 0.797 +
0.828 + 0.931) / 4
= 0.805
(0.738 + 0.853 +
0.922 + 0.969) / 4
= 0.871
(0.573 + 0.722 +
0.754 + 0.871) /
4 = 0.730
(0.031 + 0.078
+ 0.147 +
0.262) / 4 =
0.130
A3 (0.8 + 0.9 + 1 +
1) / 4 = 0.925
(0.233 + 0.417 +
0.417 + 0.6) / 4 =
0.417
(0.3 + 0.5 + 0.5 +
0.7) / 4 = 0.5
(0.8 + 0.9 + 1 +
1) / 4 = 0.925
(0 + 0 + 0.1 +
0.2) / 4 =
0.075
A4 (0.8 + 0.9 + 1 +
1) / 4 = 0.925
(0.035 + 0.088 +
0.153 + 0.270) / 4
= 0.136
(0 + 0 + 0.1 + 0.2)
/ 4 = 0.075
(0.738 + 0.853 +
0.922 + 0.969) /
4 = 0.871
(0.035 + 0.088
+ 0.153 +
0.270) / 4 =
0.136
Source: Test case data
6.3.4 Selection Phase - Application of FTOPSIS Approach to Obtain Performance Rating
of Decision Alternatives (Step four)
In order to obtain the performance rating for the decision alternatives, the FTOPSIS
algorithm is applied in this section, as follows:

Development of an Efficient Planned Maintenance Framework for Marine and Offshore Machinery
153
6.3.4.1 FTOPSIS decision matrix construction
Based on crisp values obtained for the four decision-making alternatives (A1 – A4) and five
evaluation criteria (C1 – C5) obtained in Table 6.15, a Fuzzy-TOPSIS decision matrix,
shown in Tables 6.16, is constructed.
Table 6.16: Fuzzy-TOPSIS Decision Matrix
C1 C2 C3 C4 C5
A1 0.675 0.192 0.25 0.5 0.675
A2 0.75 0.805 0.871 0.730 0.130
A3 0.925 0.417 0.5 0.925 0.075
A4 0.925 0.136 0.075 0.871 0.136 Source: Test case data
6.3.4.2 Fuzzy decision matrix normalisation
Based on Equation 2.26, the fuzzy decision matrix presented in Table 6.16 is normalised.
The results are presented in Table 6.17.
As an example, the normalised reliability (C1) with respect run-to-failure maintenance (A1)
is presented as follows:
0.675
[(0.6752+0.752+0.9252+0.9252)]12
= 0.409
Table 6.17: Normalised Decision Matrix
C1 C2 C3 C4 C5
A1 0.409 0.205 0.241 0.323 0.958
A2 0.454 0.859 0.839 0.471 0.184
A3 0.560 0.445 0.482 0.597 0.106
A4 0.560 0.145 0.072 0.563 0.193 Source: Test case data
6.3.4.3 Construction of weighted normalisation fuzzy decision matrix
The weighted normalized decision matrix is achieved by applying Equation 6.9. The
normalized fuzzy numbers obtained in Table 6.17 are multiplied by the important weight
values of the evaluation criteria given in Table 6.8.
For example, the weighted normalized fuzzy number for A1 of C1 is given as follows:
𝑣1,1 = 0.409 x 0.2 = 0.082
Similarly, the weighted normalized fuzzy numbers for other alternatives are calculated and
presented in Table 6.18.

Development of an Efficient Planned Maintenance Framework for Marine and Offshore Machinery
154
Table 6.18: Weighted Normalized Decision Matrix
C1 C2 C3 C4 C5
A1 0.082 0.041 0.048 0.065 0.192
A2 0.091 0.172 0.168 0.094 0.037
A3 0.112 0.089 0.096 0.119 0.021
A4 0.112 0.029 0.014 0.113 0.039
Source: Test case data
6.3.4.4 Determination of the fuzzy positive ideal reference point (FPIRP) and fuzzy
negative ideal reference point (FNIRP)
Determination of the FPIRP can be made by taking the largest element of each benefit
criterion and the smallest element of each cost criterion. Ultimately, FNIRP is the reverse
of the FPIRP in relation to this representation, as presented in Table 6.19. The distances of
each maintenance strategy from FPIRP and FNIRP values with respect to each criterion
are calculated using Equations 6.13 and 6.14.
As an example, the distance of alternative A1 to 𝐴+ is calculated as follows:
𝐷+ = [(0.112 − 0.082)2 + (0.029 − 0.041)2 + (0.168 − 0.048)2 + (0.065 − 0.065)2 +
(0.021 − 0.192)2]1
2⁄ = 0.211
𝐷− = [(0.082 − 0.082)2 + (0.172 − 0.041)2 + (0.014 − 0.048)2 + (0.119 − 0.065)2 +
(0.192 − 0.192)2]1
2⁄ = 0.146
Similarly, and by applying Equations 6.13 and 6.14, the distances of other decision
alternatives to FPIRP and FNIRP were determined and the results are presented in Table
6.20.
Table 6.19: Representation of FPIRP and FNIRP Values
Positive Ideal Solution Negative Ideal Solution
Reliability (C1) 0.112 0.082
Cost (C2) 0.029 0.172
Safety (C3) 0.168 0.014
Availability (C4) 0.065 0.119
Downtime (C5) 0.021 0.192 Source: Test case data
Table 6.20: Distance of each Alternative to the FPIRP and FNIRP
A1 A2 A3 A4
D+ 0.211 0.148 0.108 0.162
D- 0.146 0.220 0.209 0.212 Source: Test case data

Development of an Efficient Planned Maintenance Framework for Marine and Offshore Machinery
155
6.3.4.5 Obtaining the closeness coefficient and ranking of alternatives
Based on the results obtained in Section 6.3.4.4, the closeness coefficient of each
alternative can be calculated using Equation 6.17. The calculation of the CC value for
alternative A1 is described as follows:
𝐷1+ = 0.211, and 𝐷1
− = 0.146
𝐶𝐶1 =0.146
0.211+0.146= 0.408
Similarly, the CC values for alternatives A2 to A4 can be calculated and the results are
presented in Table 6.21.
Table 6.21: CC Results and Ranking Order of the Maintenance Strategies
A1 A2 A3 A4
CC 0.408 0.597 0.659 0.566
Ranking 4 2 1 3 Source: Test case data
It can be observed in Table 6.21 that each instance of the hybrid approach produces
different values for each maintenance strategy that correspond to the strategic decisions of
experts. Obviously, the result of the calculations revealed that A3 and A2 scored the highest
CC values compared to the remaining alternatives or strategies. The detailed results of the
fuzzy TOPSIS analysis are presented in Table 6.22.
Table 6.22: Results of Fuzzy TOPSIS Analysis
Decision-Making Attributes 𝑫+ 𝑫− CC Values Ranking
A1 Run-to-Failure Maintenance 0.211 0.146 0.408 4
A2 Preventive Maintenance 0.148 0.220 0.597 2
A3 Condition Based Maintenance 0.108 0.209 0.659 1
A4 Reliability-Centred Maintenance 0.162 0.212 0.566 3 Source: Test case data
6.3.4.6 Ranking the alternatives
Based on the evaluation of closeness coefficient above, by comparing the values of the four
alternatives, as shown in Table 6.22, the ranking order of the maintenance strategies is
given as A3 > A2 > A4 > A1. Additionally, Figure 6.4 is obtained based on the analysis result
presented in Table 6.22. The graph depicts the sensitivity of the analytical result as being
non-linear. It is noteworthy that the procedure outlined in the proposed framework revealed
that A3 and A2 seem reasonable and appropriate choices for investment in the ship crane
under investigation, in order to improve the performance of the crane’s operations. These
maintenance strategies have closeness coefficient values of 0.659 and 0.597 respectively.
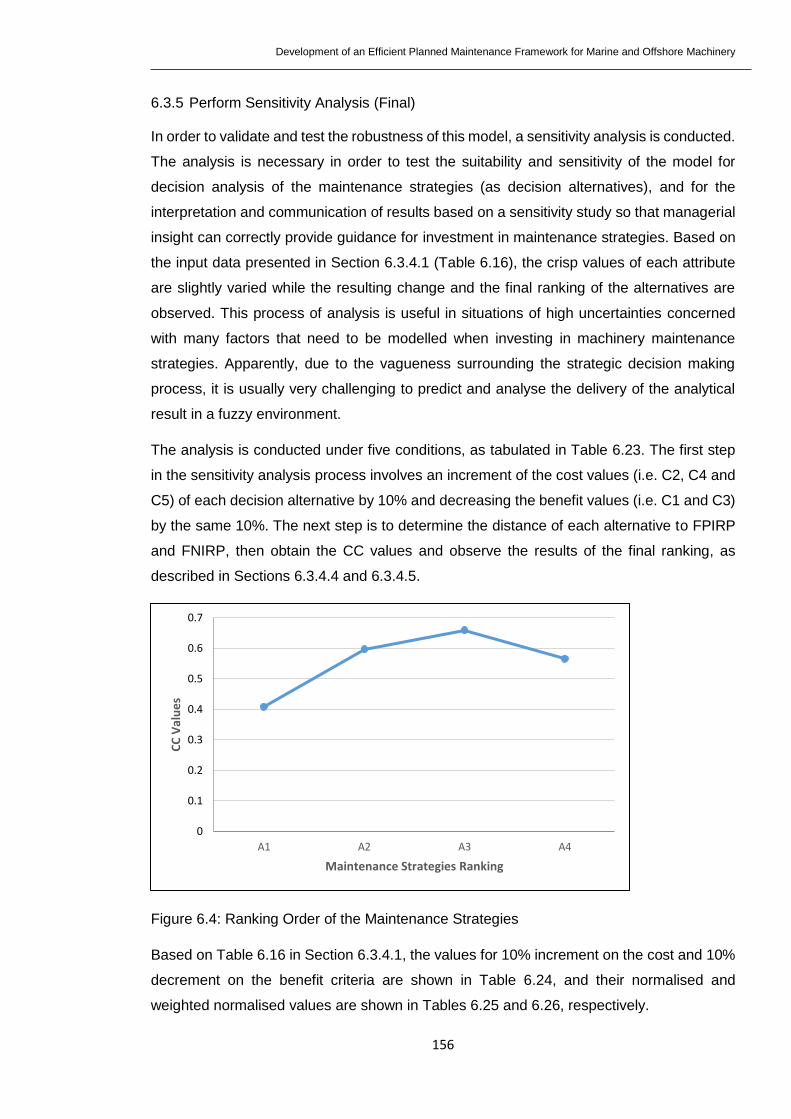
Development of an Efficient Planned Maintenance Framework for Marine and Offshore Machinery
156
6.3.5 Perform Sensitivity Analysis (Final)
In order to validate and test the robustness of this model, a sensitivity analysis is conducted.
The analysis is necessary in order to test the suitability and sensitivity of the model for
decision analysis of the maintenance strategies (as decision alternatives), and for the
interpretation and communication of results based on a sensitivity study so that managerial
insight can correctly provide guidance for investment in maintenance strategies. Based on
the input data presented in Section 6.3.4.1 (Table 6.16), the crisp values of each attribute
are slightly varied while the resulting change and the final ranking of the alternatives are
observed. This process of analysis is useful in situations of high uncertainties concerned
with many factors that need to be modelled when investing in machinery maintenance
strategies. Apparently, due to the vagueness surrounding the strategic decision making
process, it is usually very challenging to predict and analyse the delivery of the analytical
result in a fuzzy environment.
The analysis is conducted under five conditions, as tabulated in Table 6.23. The first step
in the sensitivity analysis process involves an increment of the cost values (i.e. C2, C4 and
C5) of each decision alternative by 10% and decreasing the benefit values (i.e. C1 and C3)
by the same 10%. The next step is to determine the distance of each alternative to FPIRP
and FNIRP, then obtain the CC values and observe the results of the final ranking, as
described in Sections 6.3.4.4 and 6.3.4.5.
Figure 6.4: Ranking Order of the Maintenance Strategies
Based on Table 6.16 in Section 6.3.4.1, the values for 10% increment on the cost and 10%
decrement on the benefit criteria are shown in Table 6.24, and their normalised and
weighted normalised values are shown in Tables 6.25 and 6.26, respectively.
0
0.1
0.2
0.3
0.4
0.5
0.6
0.7
A1 A2 A3 A4
CC
Val
ue
s
Maintenance Strategies Ranking

Development of an Efficient Planned Maintenance Framework for Marine and Offshore Machinery
157
Table 6.23: Conditions for Changing Input Values by Percentages
Condition Percentage
1 Decrease C1 by 10%
2 Increase C2 by 10%
3 Decrease C3 by 10%
4 Increase C4 by 10%
5 Increase C5 by 10% Source: Test case data
Table 6.24: Fuzzy-TOPSIS Decision Matrix when Criteria are changed by 10%
10%
Decrement 10%
Increment 10%
Decrement 10%
Increment 10%
Increment
C1 C2 C3 C4 C5
A1 0.575 0.292 0.15 0.6 0.775
A2 0.65 0.905 0.771 0.83 0.23
A3 0.825 0.517 0.4 1.025 0.175
A4 0.825 0.236 -0.025 0.971 0.236
Source: Test case data
From Table 6.26, the distances of each alternative to the FPIRP (i.e. 𝐷+) and FNIRP (i.e.
𝐷−), and their corresponding CC values are obtained. The results of the sensitivity analysis
(i.e. when the input values of the criteria are changed by 10%) are presented in Table 6.27.
Table 6.25: Normalised Decision Matrix when Criteria Values are changed
C1 C2 C3 C4 C5
A1 0.395 0.264 0.17 0.344 0.901
A2 0.447 0.817 0.874 0.476 0.267
A3 0.567 0.467 0.454 0.588 0.203
A4 0.567 0.213 -0.028 0.557 0.274
Source: Test case data
Table 6.26: Weighted Normalised Decision Matrix when Criteria Values are changed
C1 C2 C3 C4 C5
A1 0.079 0.053 0.034 0.069 0.180
A2 0.089 0.163 0.175 0.095 0.053
A3 0.113 0.093 0.091 0.118 0.041
A4 0.113 0.043 -0.006 0.111 0.055
Source: Test case data
Table 6.27: Sensitivity Analysis Results
Decision-Making Attributes 𝑫+ 𝑫− CC Values Ranking
A1 Run-to-Failure Maintenance 0.212 0.131 0.383 4
A2 Preventive Maintenance 0.143 0.214 0.599 2
A3 Condition Based Maintenance 0.115 0.189 0.622 1
A4 Reliability-Centred Maintenance 0.183 0.192 0.512 3
Source: Test case data

Development of an Efficient Planned Maintenance Framework for Marine and Offshore Machinery
158
6.4 Discussion of Results
In this study, sensitivity analysis is implemented to see the effect in the output data given a
slight change in the input data. From the results of the sensitivity analysis (Table 6.25), it
can be observed that the ranking order of the four decision alternatives maintained a
consistency when the cost category of the criteria (C2, C4, C5) was increased by 10%, and
the benefit category (C1, C3) decreased by the same 10%. The analysis reveals that almost
all the changes in the criteria input data do not change the final ranking of the maintenance
strategies. For this model to be validated, this pattern in the results is to be expected. It can
therefore be deduced that the model is reasonable and capable of being applied to the
analysis of machinery maintenance strategy decision-making alternatives.
Based on the result obtained from this analysis, the marine machinery (crane) under
investigation can be enhanced by implementing A3 (i.e. condition based maintenance)
strategy. However, implementing A2 (i.e. preventive maintenance), especially during follow-
up analysis (when improving maintenance process), can promote continuous improvement
and enhance the crane’s performance under high uncertainty. Experience has shown that
investing in maintenance selection strategies seems to be an important strategy to mitigate
cost issues under a fuzzy environment. Therefore, the result of the analysis would help
improve the decision-making process, thus allowing for a flexible response to operational
uncertainties through a systematic approach.
The analysis result reflecting on A3 (condition based maintenance) as the recommended
strategy certainly shows that expert judgement was based on increase in machinery
operational life/availability, increase in machinery reliability, increase in cost for parts and
labour, and decrease in machinery downtime. Minimizing maintenance costs seems to be
an effective way to build up efficient maintenance, especially when one is required to work
within a limited budget. When investments in maintenance have to be made to reduce the
overall costs (i.e., operations costs), it seems logical to consider the minimization of total
cost of ownership or the life-cycle costs instead. However, Goossens (2015) ascertained
that the ultimate goal of maintenance cannot be cost reduction only and must be maintaining
functionality (at the lowest cost). Nevertheless, how costs can best be interpreted in relation
to the selection process of the best maintenance strategy remains to be further explored.
The role of safety within the maintenance strategy selection can also be misinterpreted
since, according to Goossens (2015), by definition, absolute safety is impossible. As such,
safety is considered to act as a pre-condition for maintenance strategy selection.
Nevertheless, a balance between safety and availability or reliability can be desirable (or
even possible). The exact role that safety currently has within machinery maintenance

Development of an Efficient Planned Maintenance Framework for Marine and Offshore Machinery
159
strategy selection, as well as the role it should have, is worth further investigation. The
model developed in this study is by no means conclusive. It is subject to further modification,
given the acquisition of new data or before its utilization by end-users in the industry. A
sensitivity analysis was conducted to partially validate the developed model and establish
its ability to respond to changes in input variables.
6.5 Conclusion
This chapter presented a collaborative modelling and strategic FMADM method that can be
adopted for the selection of appropriate machinery maintenance strategies in a concise,
logical, and transparent manner against multiple scenarios where the data available is
subjective and imprecise. The strength of this strategic decision making approach is in the
fact that both heterogeneous and homogeneous groups of experts can be utilised and their
subjective opinions can be aggregated simply, with partial or incomplete information
available.
In the evaluation process, a fuzzy TOPSIS algorithm is implemented to rank the machinery
maintenance strategies or alternatives in a way that is flexible and straightforward. To
support a strategic decision on machinery maintenance strategy selection, fuzzy AHP and
fuzzy TOPSIS need to be utilised to handle multiple organisational objectives, complex
decision making, and long term condition of machinery in an uncertain environment. The
proposed approach can be applied to situations where both qualitative and quantitative data
has to be integrated and synthesized for evaluation processes during complex and multiple
decision making involving marine and offshore machinery operations. Since the result of
the calculations is sensitive to criteria and the number of experts engaged, these should be
carefully chosen by maritime maintenance and safety analysts to avoid misrepresentation
and information loss during the interpretation process.
During this study, five factors – reliability, cost, safety, availability, and downtime – have
converged to create a succinct and effective meaning. However, in practice, the
interpretation and relations of these factors differ depending on which experts are involved.
The research described in this chapter can serve as a basis to further explore the roles of
these factors for selection of an appropriate maintenance strategy. The relation between
availability and reliability needs elaboration. Although clear definitions for both are
presented in the literature, practitioners seem to have varying interpretations and views of
what these two terms mean to their specific situation, and how they are related. To gain a
better understanding of the interpretation differences and origin, and how these influence
maintenance strategy selection, a structured experimental investigation needs to be
considered.

Development of an Efficient Planned Maintenance Framework for Marine and Offshore Machinery
160
Chapter 7
Conclusions and Recommendations
Summary
This chapter summarises the conceptual frameworks that serve as the basis for the
identification of new research needs within the marine and offshore industry, in line with the
vision for efficient planned maintenance system for machinery operations. It also highlights
the limitations and avenues for future research into areas where traditional maintenance
tools cannot be used with confidence, which may require further work to improve the
frameworks and methodologies that are systematically developed in this study.
The detailed literature review of machinery operations and maintenance concepts carried
out in Chapter 2 provides a deep understanding of the current problematical situation that
exists in the marine and offshore industry. The review revealed that although there are a
multitude of different machinery planned maintenance programmes employed throughout
the industry, there is an equally diverse variety of maintenance strategies utilised in order
to ensure successful performance and reliability of the machinery. This thesis draws
attention to the problems relating to establishing an optimal planned maintenance
framework in the marine and offshore industry, and in doing so, demonstrates a plausible
and feasible solution that utilises a risk and decision-based maintenance methodology.
7.1 Main Conclusions
An important aspect of this research study is the revelation that a lack of or poor investment
in machinery planned maintenance programmes leads to a failing strategy that contributes
to the machinery’s vulnerabilities and, ultimately, breakdowns. Given the dynamic nature of
marine and offshore operations, one feasible way to analyse machinery application in such
operations is to use different decision-making tools, which include fuzzy set theory (FST),
rule-base (RB), and evidential reasoning (ER), in order to optimize the operational efficiency
of the machinery. This research has produced an efficient planned maintenance
methodology that leads to the establishment of a platform for improvement of marine and
offshore machinery systems that operate under high uncertainties.
This thesis has developed a number of analytical approaches that use qualitative data to
measure the multi-dimensional machinery performance. The modelling solutions developed

Development of an Efficient Planned Maintenance Framework for Marine and Offshore Machinery
161
in this study are capable of dealing with both operational and managerial problems. Thus,
it can serve as a platform for sustained and enhanced decision-making in a socio-technical
system. The use of decision-making analysis to establish efficient maintenance regimes
through the evaluation of downtime and costs enables managers to make informed
decisions based either on reducing downtime, on reducing costs, or both.
The introduction of trend analysis, family analysis, environmental analysis, human reliability
analysis, and design analysis, has highlighted another facet to consider when developing a
planned maintenance strategy. The models can not only be applied to the marine and
offshore industry, but also to other industries, such as nuclear, aviation, manufacturing, etc.
The utilisation of multiple tools and approaches in this thesis, to deal with uncertainties in
the marine and offshore machinery operations, enables cross validation of the results and
increases the confidence in the performed analysis, as ascertained by Patelli et al. (2015).
7.2 Advantages and Disadvantages of the Models
7.2.1 Advantages
The model accommodates multiple analysis (e.g. trend analysis, family analysis,
design analysis, environmental analysis, and human reliability analysis) which can
provides each marine and offshore operator with correct information relating to
equipment inspections, maintenance and repair activities for their maintenance
management programme.
Using calculated baseline in this research is useful for determining of each oil
element for all types of machinery.
The decision-making procedure will be faster and more robust, thus, helps experts
to find a suitable solution.
It is possible to diagnose and predict the final machinery situation for any related
database, thus, reduces maintenance-running hours.
It will be practical to create a database for fault situations and wear behaviours.
Modelled specifically to address the most relevant deterioration and failure
mechanisms, which significantly reduce the number of accident caused by
machinery failure in the marine and offshore industry.
7.2.2 Disadvantages
Requires implementation of a sophisticated monitoring system to continuously
assess condition and reliability factors

Development of an Efficient Planned Maintenance Framework for Marine and Offshore Machinery
162
7.3 Research Contribution to Knowledge
Machinery systems are increasingly susceptible to malfunctioning caused by unforeseen
events that range from new design to man-made errors. As revealed in the literature review
(Chapter 2), most sources show that these malfunctions may severely impact on the
machinery and result in disruption of their operations with long term consequences.
Therefore, through asking the right questions and doing thorough data analysis using
existing theories but in a different approach, this research can significantly contribute to
knowledge in the following ways:
• The research provides a framework and methodology for machinery condition
monitoring that can be applied to marine and offshore as well as other industries
(Railway (Fumeo et al., 2015), Nuclear, etc.).
• Applies ER methodology for decision-based making to enrich the insufficient
literature of uncertainty treatment within the domain of risk assessment of marine
and offshore machinery systems.
• Demonstrates the use of RB theory as a viable risk assessment tool with application
to maintenance prediction of machinery operating under highly uncertain
environment.
• The generated RB can be applied to a series of real world scenarios to demonstrate
the models validity.
• Applies a decision-making algorithm to determine the most suitable maintenance
strategy for use within marine and offshore industry.
• The results provided by these algorithms in this study will be beneficial to the marine
and offshore industries as an indicator to monitor and diagnose faults in machinery,
thus, helping in making a better decision in maintenance management process.
Finally, this research has been justified as well as adding to existing knowledge by way of
contributing solutions to the current machinery oil condition monitoring difficulties in the
marine and offshore industry from the findings of the study as well as good
recommendations for future research listed in Section 7.7.
7.4 Research Findings
Bearings and gearboxes are found to be the most critical components in ship cranes.

Development of an Efficient Planned Maintenance Framework for Marine and Offshore Machinery
163
The reliability of the ship crane will alter if the crane grade decreases from a good
grade to an average grade due to inability of the crew on board to carry out
maintenance work during bad weather condition.
Condition based maintenance strategy is the preferred maintenance option for the
developed models.
7.5 Research Novelty
This research outlines a novel framework shown in Figure 3.1 for evaluating a ship’s
crane performance by means of its conditional reliability and the procedure of
applying it in a real life scenario.
The flow diagram (Figure 4.1), the hierarchical structures (Figures 4.2 and 4.9) for
evaluating the conditions of the ship cranes; the diagnostic flow chart (Figure 5.1)
for evaluating the diagnostic process of the used oil sample test results; and the
hierarchical structures (Figures 6.1 and 6.2) for maintenance strategy selection, are
all unique and only applicable to this research work.
7.6 Research Limitations
The research conducted attempts to highlight a comprehensive and practical analysis of
marine and offshore machinery planned maintenance system in relation to risk assessment
and improvement of the machinery operations. Due to time constraints, the current study
does not investigate a large number of problems and incident scenarios in all the vital
components that can lead to machinery breakdown, even though experience has shown
that such analysis gives insights into how machinery breakdown can be managed or
avoided.
The experience and knowledge proficiencies of experts are vital when the generic
frameworks are applied to real industrial case studies, as described in this research, and
thus, careful selection of these experts is necessary in order to achieve good outcomes. In
other words, if experts who do not have the requisite knowledge or experience are selected
and used for the analysis, the frameworks may produce poor outcomes, which may defeat
the purpose of improvement and management in the machinery planned maintenance
system and render the methodology ineffective.
7.7 Recommendation for Future Research
Although this research has provided a structure that links risk assessment and efficient
maintenance of offshore marine machinery operating under highly uncertain environments,
it has also formulated conceptual frameworks for their efficient planned maintenance

Development of an Efficient Planned Maintenance Framework for Marine and Offshore Machinery
164
systems. The following avenues to further enhance the implementation of the models that
can be applied in a different context have been identified:
Application of the frameworks and models developed to other high reliability
industries: it is believed that, if applied to other complex and high reliability industries
(e.g. nuclear, aviation, health care, etc.) this could give rise to interesting results that
may further enrich the deficient literature of planned maintenance modelling for
critical machinery.
Due to the complexity of the analytical results obtained under the conditions of big
data, application of computer related software is recommended to facilitate the
process of data compilation and processing.
Within this thesis, four experts were employed to conduct the assessment. However,
it is recommended that the number of experts be increased for a collaborative
modelling of the system, from a range of different marine and offshore industries, to
include chief engineers, 2nd engineers, ship captains, chief officers, maintenance
engineers, researchers, marine superintendents, and machinery operators. This will
further enhance the collaborative design and effectiveness of the result obtained for
use in its wider perspective.
Combination of diverse but powerful intelligent tools and algorithms from other fields
and concepts will open promising new pathways for developing and optimising
planned maintenance systems for machinery operations under uncertainty.
Application of the real-time analysis tool to evaluate the condition of the machinery
using the developed models and methodology: such an analysis would enhance the
performance and reliability of marine and offshore machinery through early detection
of unforeseen events.
This study provides a conceptual platform on which further research on planned
maintenance of complex interdependent machinery systems can be modelled and by which
the risk of breakdown can be assessed and managed. The traditional ways of looking at
such risks are not always suitable for use in assessing the maintenance of complex
machinery systems, but a shift towards uncertainty treatment of probability of risk for
improvement of the machinery systems can ultimately optimize their operations. Moreover,
the methodology demonstrated in this research has been successfully applied to a ship
crane operating in the marine and offshore industry. In order to gain greater confidence and
insight into the uses and limitations of this methodology, application to other machinery in
several industries from differing sectors will need to be attempted.

Development of an Efficient Planned Maintenance Framework for Marine and Offshore Machinery
165
References
ABB (2016), The Total Economic Impact of ABB Preventive Maintenance, a commissioned
study conducted by Forrester Consulting on behalf of ABB. [Online] [Viewed: 21st March
2017, 21:19]. Available at: www.abb.com/turbocharging.
ABS (2016), Guide for surveys based on machinery reliability and maintenance techniques.
American Bureau of Shipping.
Adams, J. A. (1982), Issues in human reliability. Hum Factors; 24(1); 1–10.
Aggarwal, C. C. (2015), Data Mining: the textbook. ISBN: 978-3-319-14141-1. [Online]
[Viewed: 17th March 2017, 20:09]. Available at: http://rd.springer.com/book/10.1007/978-3-
319-14142-8
Aldridge, J. (2012). Cranes Malfunction at Bay Port. Bay of Plenty Times. 7.52am Thursday
September 27. New Zealand Herald.
Anagnostopoulos, K. P.; Gratziou, M. and Vavatsikos, A. P. (2007), Using the Fuzzy
Analytical Hierarchy Process for Selecting Water Facilities at Prefecture Level. European
Water Resource Association, Issue 19/20, pp. 15-24.
Ananda, J. and Herath, G. (2003), Incorporating Stakeholder Values into Regional Forest
Planning: A Value Function Approach. Journal of Ecological Economics, No. 45, pp. 75-90.
Andersen, D. R.; Sweeney D. J.; Williams T. A and Martin K (2008), An Introduction to
Management Science: quantitative approaches to decision making. 12th edition. Mason,
OH: Thomson South Western, pp. 706-718.
Andrews, J. D. and Moss, T. R. (2002), Reliability and risk assessment. IMechE. 2nd edition;
Professional Engineering Publishing Limited, Pp. 107, 301-340, ISBN: 1 86058 290 7.
Arslan, T. and Khisty, C. J. (2005), A Rational Reasoning Method from Fuzzy Perceptions
in Route Choice. Journal of Fuzzy Sets and Systems, Vol. 150, No. 3, pp. 419-435.
Arthur, N. (2005), Optimization of vibration analysis inspection intervals for an offshore oil
and gas water injection pumping system. Journal of Process Mechanical Engineering. Vol.
219. Part E. pp 251-259.
Ashayeri, J.; Teelan, A. and Selen, W. (1996), A production and maintenance model for the
process industry. International Journal of Production Research. Vol. 34. No. 12. pp 3311-
3326.
Development of an Efficient Planned Maintenance Framework for Marine and Offshore Machinery
166
Askren, W. B. E. (1967), Symposium on reliability of human performance in work. Technical
Report AMRL-TR-67-88, Aerospace Medical Research Laboratories, Wright–Patterson Air
Force Base, Dayton, OH, USA.
ASTM D4057 (2012), Standard Practice for Manual Sampling of Petroleum and Petroleum
Products. Manual of Petroleum Measurement Standards (MPMS), Chapter 8.1.
ASTM D445 (2012), Standard Test Method for Kinematic Viscosity of Transparent and
Opaque Liquids (and Calculation of Dynamic Viscosity). ASTM International. British
Standard 2000: Part 71:1990.
ASTM D 5185 (2009), Standard Test Method for Determination of Additive Elements, Wear
Metals, and Contaminants in Used Lubricating Oils and Determination of Selected Elements
in Base Oils by Inductively Coupled Plasma Atomic Emission Spectrometry (ICP-AES).
ASTM International. An American National Standard.
Aven, T. (2013), What is Safety Science? Safety Science 67 (2014) 15–20. Science Direct,
http://dx.doi.org/10.1016/j.ssci.2013.07.026.
Ayag, Z. and OZdemir, R. G. O. (2006), A Fuzzy AHP Approach to Evaluating Machine Tool
Alternatives. Journal of Intelligent Manufacturing, Vol. 17, pp. 179–190.
Bannister, K. E. (2007), Lubrication for Industry. Second Edition, pg. 7.
Barbarini, L. H. M. and Rodrigues de Andrade, B. L. (2010), Considerations About Human
Factors in Risk Analysis for Ships with Alarm System. ASME 2010 International Mechanical
Engineering Congress and Exposition. IMECE2010-38128, pp. 475-484, DOI:
10.1115/IMECE2010-38128.
Barnes, M. (2008), Oil analysis: 5 things you didn’t know. Reliable Plant Magazine, 3/200.
Barrett, M. P. (2007), The New Practical Guide to Oil Analysis. Ezine Articles.
Barrett, M. P. (2004), Getting the Most from Lube Oil Analysis: Basics of common oil
analysis tests and their significance. Insight Services. Lubricants and Fluid Power.
Bastos, P.; Lopes, L. and Pires, L. (2012), A Maintenance Prediction System using Data
Mining Techniques. Proceedings of the World Congress on Engineering 2012 Vol III WCE,
July 4 - 6, London, U.K. ISBN: 978-988-19252-2-0; ISSN: 2078-0958 (Print); ISSN: 2078-
0966 (Online).
Bengtsson, M. and Kurdve, M. (2016), Machining Equipment Life Cycle Costing Model with
Dynamic Maintenance Cost. 23rd CIRP Conference on Life Cycle Engineering. DOI:
10.1016/j.procir.2016.03.110. Procedia CIRP 48 (2016) 102 – 107.
Development of an Efficient Planned Maintenance Framework for Marine and Offshore Machinery
167
Bently Tribology Services (n.d), Setting oil analysis alarms: General Considerations.
Application Note. [Online] [Viewed: 23rd October 2015, 00:00] Available at:
http://www.bentlytribology.com/publications/appnotes/app23.php
Beynon, M.; Cosker, D. and Marshall, D. (2001), An Expert System for Multi-Criteria
Decision Making Using Dempster–Shafer Theory. Journal of Expert Systems with
Applications, Vol. 20, pp. 357–367.
Black, M.; Brint, A. and Brailsford, J. (2003), Comparing probabilistic methods for the asset
management of distributed items. Working paper. University of Salford.
Blaxter, L.; Hughes, C. and Tight, M. (1996), How to research. Buckingham: Open
University Press.
Boender, C. G. E.; de Grann, J. G. and Lootsma, F. A. (1989), Multi-Criteria Decision
Analysis with Fuzzy Pairwise Comparison. Journal of Fuzzy Sets and Systems, Vol. 29, pp.
33–143.
Bojadziev, G. and Bojadziev, M. (1995), Fuzzy Sets, Fuzzy Logic, Applications. World
Scientific, Singapore. ISBN 9810226063.
Borris, S. (2006), Total Productive Maintenance: Proven Strategies and Techniques to Keep
Equipment Running at Maximum Efficiency. McGraw-Hill, ISBN: 978-0-070158926-0, ISBN:
978-0-070146733-9, MHID: 0-07-158926-0, MHID: 0-07-146733-5.
Bots, S. (2014), A Practical Approach for Evaluating Oil Analysis Results with Limit Values.
Machinery Lubrication, Noria publication. [Online] [Viewed: 23rd October 2015, 00:00]
Available at: http://www.machinerylubrication.com/Read/29829/a-practical-approach-for-
evaluating-oil-analysis-results-with-limit-values-
Bottani, E. & Rizzi, A. (2006), A Fuzzy TOPSIS Methodology to Support Outsourcing of
Logistic Services. International Journal of Supply Chain Management, Vol. 11, No. 4, pp.
294 – 308.
Bousdekis, A.; Papageorgiou, N.; Magoutas, B.; Apostolou, D. and Mentzas, G. (2016), A
proactive event-driven decision model for joint equipment predictive maintenance and spare
parts inventory optimization. The 5th International Conference on Through-life Engineering
Services (TESConf 2016). DOI: 10.1016/j.procir.2016.09.015. Procedia CIRP, Volume 59,
2017, Pages 184-189.

Development of an Efficient Planned Maintenance Framework for Marine and Offshore Machinery
168
Bozdag, C. H.; Kahraman, C.; Cebeci, U. and Ruan, D. (2003), Fuzzy Group Decision
Making for Selection of Computer Integrated Manufacturing Systems. Journal of Computers
in Industry, Vol. 51, No. 1, pp. 13–29.
Bozóki, S. (2008), Solution of the Least Squares Method problem of pairwise comparison
matrices. Central European Journal of Operations Research 16, Pp. 345 – 358. DOI:
10.1007/s10100 – 008 – 0063 – 1.
Brazilian National Agency of Petroleum, Natural Gas and Biofuels (ANP) (2015),
Investigation Report of the Explosion Incident Occurred on 11/02/2015 in the FPSO Cidade
De São Mateus. Superintendence of operational safety and the environment (SSM).
Buchanan, B. G. and Shortliffe, E. H. (1984), Rule-Based Expert Systems: The MYCIN
Experiments of the Stanford Heuristic Programming Project. The Addison-Wesley Series in
Artificial Intelligence. ISBN: 0-201-10172-6.
Buckley, J. J. (1985), Fuzzy Hierarchical Analysis. Journal of Fuzzy Sets and Systems, Vol.
17, No.3, pp. 233–247.
Camponovo, G.; Ondrus, J. and Pigneur Y. (n.d), Environmental Context Significance in
Strategic Decision Support Systems. HEC School of Business, University of Lausanne
BFSH1 Dorigny, 1015 Lausanne, Switzerland.
Capasso, M.; Savio, S.; Firpo, P. and Parisi, G. (2015), Railway transportation efficiency
improvement: loco health assessment by time domain data analysis to support Condition
Based Maintenance implementation. Transportation Research Procedia, Volume 6, 2015,
Pages 424-433. 4th International Symposium of Transport Simulation-ISTS’14, 1-4 June
2014, Corsica, France. DOI: 10.1016/j.trpro.2015.03.032.
Carlo, F. D. (2015), Reliability and Maintainability in Operation Management. InTechOpen.
Books of operations management, Web of Science. Download from:
http://www.intechopen.com/books/operations-management
Chao, K. M.; Lo, C. C.; Chen, D. Y. and Tsai, C. F. (2010), Service Selection Based on
Fuzzy TOPSIS Method. Volume 00, No. pp. 367-372, 2010,
DOI:10.1109/WAINA.2010.117.
Chen, C. T. (2000), Extension of the TOPSIS for group decision making under fuzzy
environment. Fuzzy Sets and Systems 114: 1-9.
Chen, S. J. and Hwang, C. L. (1992), Fuzzy Multiple Attribute Decision Making: Methods
and Applications. Springer-Verlag Berlin, ISBN: 3540549986.

Development of an Efficient Planned Maintenance Framework for Marine and Offshore Machinery
169
Chen, V. Y. C.; Lien, H. P.; Lui, C. H.; Liou, J. J. H.; Tzeng, G. H. and Yang, L. S. (2009),
Fuzzy MCDM Approach for Selecting the Best Environment-watershed Plan. Applied Soft
Computing 11 (2011) 265-275 Elsevier Journal.
Cheng, J.; Lee, C. and Tang, C. (2009), An Application of Fuzzy Delphi and Fuzzy AHP on
Evaluating Wafer Supplier in Semiconductor Industry. World Science Engineering
Academic and Society on Information and Applications, Vol. 6, No. 5.
Cheng, C. H. (1996), Evaluating Naval Tactical Missile Systems by Fuzzy AHP Based on
the Grade Value of Membership Functions. European Journal of Operational Research, Vol.
96, No. 2, pp. 423–443.
Chin, K. S., Xu, D. L., Yang, J. B. and James Ping-Kit, L. (2008), Group-based ER–AHP
System for Product Project Screening, Expert Systems with Applications, Vol. 35, No. 4, pp.
1909–1929.
Choo, E. U.; Schoner, B. and Wedley, W. C. (1999), Interpretation of Criteria Weights in
Multi-Criteria Decision Making. Computers & Industrial Engineering 37, pp. 527-541.
Chou, T. and Liang, G. (2001), Application of a Fuzzy Multi-Criteria Decision Making Model
for Shipping Company Performance Evaluation. Journal of Maritime Policy and
Management, Vol. 28, No. 4, pp. 375-392.
Clarke, R. A. (2005), Liquefied Natural Gas Facilities in Urban Areas. A Security Risk
Management Analysis for Attorney General. Patrick Lynch, Rhode Island.
Coetzee, J. L. (1999), A holistic approach to the maintenance problem. Journal of Quality
in Maintenance Engineering. Vol. 5. No. 3. pp 276-280.
Courrech, J. and Eshleman, R. L. (2014), Condition Monitoring of Machinery, Chapter 16.
Daalhuizen, J.; Badke-Schaub, P. and Batill, S. (2009), Dealing with Uncertainty in Design
Practice: issues for designer-centred methodology. International Conference on
Engineering Design, ICED’09. Stanford University, Stanford, CA, USA.
Dagdeviren, M.; Yavuz, S. and Kilinc, N. (2009), Weapon selection using the AHP and
TOPSIS methods under fuzzy environment. Expert Systems with Applications, 36(4),
8143–8151.
Dagli, C. and Huggahalli, R. (1995), Machine-part family formation with the adaptive
resonance theory paradigm. INT. J. PROD. RES., VOL. 33, No.4, 893-913.

Development of an Efficient Planned Maintenance Framework for Marine and Offshore Machinery
170
Delvosalle, C.; Fievez, C.; Pipart, A. and Debray, B. (2006), ARAMIS project: A
comprehensive methodology for the identification of reference accident scenarios in
process industries. Journal of Hazardous Materials 130, 200-219.
Dempster, A. P. (1969), Upper and lower probability inferences for families of hypotheses
with monotone density ratios. Annals of Mathematical Statistics 40 953-969.
Dempster, A. P. (1968a), Upper and Lower Probabilities Generated by a Random Closed
Interval. Annals Math. Stat., 39, 957-966.
Dempster, A. P. (1968b), A Generalization of Bayesian Inference. Journal of Royal
Statistical Society, Series B, Vol. 30, pp. 205 – 247.
Deng, H.; Yeh, C. H. and Willis, R. (2000), Inter-Company Comparison using Modified
TOPSIS with Objective Weights. Computers & Operations Research, Vol. 27, pp. 963 –
973.
Deng, H. (1999), Multi-criteria analysis with fuzzy pair-wise comparison. International
Journal of Approximate Reasoning 21: 215–231.
Dubois, D. and Prade, H. (1997), Recent Models of Uncertainty and Imprecision as a basis
for Decision Theory: Toward Less Normative Frameworks. Intelligent Decision Support in
Process Environment New York: Springer-Verlag.
Duckstein, L. (1994), Elements of Fuzzy Set Analysis and Fuzzy Risk. Published in,
“Decision Support Systems in Water Resources Management”. (H.P. Nachtnebel, ed.),
UNESCO Press, Paris, pp. 410-430.
Dymova, L. and Sevastjanov, P. (2014), A new approach to the rule-base evidential
reasoning in the intuitionistic fuzzy setting. Knowledge-Based Systems, Volume 61, May
2014, Pages 109-117. [Online] [Viewed: 21st March 2017, 21:36]. Available at:
http://dx.doi.org/10.1016/j.knosys.2014.02.016
Fredriksson, G. and Larsson, H. (2012), An analysis of maintenance strategies and
development of a model for strategy formulation – A case study. Department of Product and
Production Development, Division of Production Systems, Chalmers University of
Technology, Goteborg, Sweden.
Fitch, B. (2016), Selecting the Right Oil Analysis Lab. Machinery Lubrication, Noria
Publication.
Fitch, J. C. and Troyer, D. (2011), Setting Limits and Targets for Effective Oil Analysis.
Machinery Lubrication, Noria Publication.

Development of an Efficient Planned Maintenance Framework for Marine and Offshore Machinery
171
Fitch, J. C. (2004), The Basics of Used Oil Sampling. Machinery Lubrication, Noria
Publication.
Fitch, J. C. (1998), Proactive and Predictive Strategies for setting Oil Analysis Alarms and
Limits. Machinery Lubrication, Noria Publication.
Fu, C. and Yang, Y. (2012), The combination of dependence-based interval-valued
evidential reasoning approach with balanced scorecard for performance assessment.
Expert Systems with Applications, 39, 3717–3730.
Fumeo, E.; Oneto, L. and Anguita, D. (2015), Condition Based Maintenance in Railway
Transportation Systems Based on Big Data Streaming Analysis. Procedia Computer
Science, Volume 53, 2015, Pages 437-446. 2015 INNS Conference on Big Data.
Galloway, J. (2014), Condition Monitoring in RCCL.
Ghorbani, M.; Velayati, R. and Ghorbani, M. M. (2011), Using fuzzy TOPSIS to determine
strategy priorities by SWOT analysis. In International Conference on Financial Management
and Economics (Vol. 11, pp. 135-139).
Goossens, A. (2015), Maintenance policy selection for ships: An investigation using the
Analytic Hierarchy Process. Ph.D. thesis, University of Twente, Enschede, the Netherlands.
ISBN: 978-90-365-3927-2x, DOI: 10.3990/1.9789036539272.
Gungor, Z.; Serhadlioglu, G. and Kesen, S. E. (2009), A fuzzy AHP Approach to Personnel
Selection Problem. Journal of Applied Soft Computing, Vol. 9, pp. 641–646.
Guo, J. (2013), Hybrid Multiattribute Group Decision Making Based on Intuitionistic Fuzzy
Information and GRA Method. ISRN Applied Mathematics, Vol. 2013, Article ID 146026, 10
pages. http://dx.doi.org/10.1155/2013/146026
Hipel, K. W.; Radford, K. J. and Fang, L. (1993), Multiple Participant Multiple Criteria
Decision Making. IEEE Transactions on Systems, Man, and Cybernetics, Vol. 23, pp. 1184
– 1189.
Hsu, H. M. and Chen, T. C. (1994), Aggregation of Fuzzy Opinion under Group Decision
Making. Fuzzy Sets and Systems, Vol. 79, pp. 279–285.
Hwang, C. L.; Lai, Y. J. and Liu, T. Y. (1993), A new approach for multiple objective decision
making. Computers & operations research, 20(8), pp.889-899.
Hwang, C. L. and Yoon, K. (1981), Multi Attribute Decision Making: Methods and
Applications: A State of the Art Survey. Springer-Verlag, New York. ISBN: 0-387-10558-1.

Development of an Efficient Planned Maintenance Framework for Marine and Offshore Machinery
172
IAEA (2007), Implementation Strategies and Tools for Condition Based Maintenance at
Nuclear Power Plants. International Atomic Energy Agency. IAEA-TECDOC-1551. ISBN
92–0–103907–7, ISSN 1011–4289.
IAEA (1991). Safety culture. International Atomic Energy Agency, INSAG 4.
IMO (2006), Contribution to sustainable maritime development: Capacity-building for safe,
secure and efficient shipping on clean oceans through the Integrated Technical Co-
operation Programme. International Maritime Organisation. [Online] [Viewed: 21st
November 2016, 23:14]. Available at:
http://www.imo.org/en/OurWork/TechnicalCooperation/Documents/Brochure/English.pdf
ISO/IEC (2017), General requirements for the competence of testing and calibration
laboratories. International Organization for Standardization.
Jackson, S. (2010), Architecting Resilient Systems, Accident Avoidance and Survival and
Recovery from Disruptions. Wiley Series in Systems Engineering and Management,
ISBN: 978-0-470-40503-1.
Jahanshahloo, G. R.; Lotfi, F. H. and Izadikhah, M. (2006), Extension of the TOPSIS Method
for Decision-making Problems with Fuzzy Data. Applied Mathematics and Computation,
Vol. 181, pp. 1544–1551.
Jee, D. and Kang, K. (2000), A Method for Optimal Material Selection aided with Decision
Making Theory. Materials and Design”, Vol. 21, pp. 199 – 206.
John, A.; Yang, Z.; Riahi, R. and Wang, J. (2014), Application of a collaborative modelling
and strategic fuzzy decision support system for selecting appropriate resilience strategies
for seaport operations. Journal of Traffic and Transportation Engineering (English Edition),
2014, 1 (3): 159 – 179.
Kakalis, N. and Dimopoulos, G. (2012), Managing the Complexity of Ship Machinery
Systems. DNV COSSMOS: Complex Ship Systems Modelling & Simulation. DNV Research
and Innovation, Position Paper 11.
Kilincci, O. and Onal, S. A. (2011), Fuzzy AHP approach for supplier selection in a washing
machine company. Expert Systems with Applications 38: 9656–9664, Elsevier, DOI:
10.1016/j.eswa.2011.01.159.
Knight, F. H. (2014), Risk Uncertainty and Profit. Library of Congress Catalogue, Card
Number 64- I7623. [Online] [Viewed: 11th March 2017, 20:30]. Available at:
https://mises.org/sites/default/files/Risk,%20Uncertainty,%20and%20Profit_4.pdf

Development of an Efficient Planned Maintenance Framework for Marine and Offshore Machinery
173
Knight, F. H. (1921), Risk, Uncertainty and Profit. Boston: Houghton Mifflin.
Konecranes (2012), Reliable Information about Crane Performance and Reliability. Case
Study, Hydro, Karmoy, Norway.
Kontovas, C. A. and Psaraftis, H. N. (2009), Formal Safety Assessment: A Critical Review.
Marine Technology, Vol. 1, pp. 45-59.
Kunz, J. (2010), The Analytic Hierarchy Process (AHP). Presentation to Eagle City Hall
Location Options Task Force, February/March 2010.
Kuo, R. J.; Chi, S. C. and Kao, S. S. (2002), A Decision Support System for Selecting
Convenience Store Location through Integration of Fuzzy AHP and Artificial Neural
Network. Computers in Industry 47 (2): 199 – 214.
Kwong, C. K., and Bai, H. (2003), Determining the Important Weights for the Customer
Requirements in QFD using a FAHP with an Extent Analysis Approach. Institute of Industrial
Engineers Transactions, Vol. 35, No. 7, pp. 619–626.
Laarhoven, P. J. M. and Pedrycz, W. (1983), A Fuzzy Extension of Saaty’s Priority Theory.
Journal of Fuzzy Sets and Systems, Vol. 11, pp. 229–241.
Labib, A. W. (1998), World-class maintenance using computerised maintenance
management system. Journal of Quality in Maintenance Engineering. Vol. 4. No. 1. pp 66-
75.
Lavasani, S. M. M.; Wang, J.; Yang, Z. and Finlay, J. (2012), Application of MADM in a
Fuzzy Environment for Selecting the Best Barrier for Offshore Wells. Expert Systems with
Applications, Vol. 39, pp. 2466–2478.
Lee, M. H.; Han, C. and Chang, K. S. (1999), Dynamic optimization of continuous polymer
reactor using modified differential evolution algorithm. Industrial and Engineering Chemistry
Research, 38, pp.4825 – 4831.
Leung, L. C. and Cao, D. (2000), On consistency and ranking of alternatives in fuzzy AHP.
European Journal of Operational Research, Vol. 124, PP. 102-113.
Leveson, N. G.; Dulac, N.; Cutcher-Gershenfeld, J.; Barrett, B.; Carroll, J.; Zipkin, D. and
Friedenthal, S. (2005), Modelling, Analysing, and Engineering Safety Culture. 1st
International Conference of the International Association for the Advancement of Space
Safety, Nice, October.
Leveson, N. G. (2004), A new accident model for engineering safer systems. Safety Science
42 (4), 237–270.
Development of an Efficient Planned Maintenance Framework for Marine and Offshore Machinery
174
Leveson, N. G. (1995), Software. Addison-Wesley, Reading, MA.
Li, D. F. (2007), A fuzzy closeness approach to fuzzy multi-attribute decision making. Fuzzy
Optimization and Decision Making 6 (3): 237-254.
Liu, J.; Liao, X. and Yang, J. (2015), A group decision-making approach based on evidential
reasoning for multiple criteria sorting problem with uncertainty. European Journal of
Operational Research, Volume 246, Issue 3, Pages 858-873.
Liu, H. C.; Liu, L.; Bian, Q. H.; Lin, Q. L.; Dong, N. and Xu, P. C. (2011), Failure mode and
effects analysis using fuzzy evidential reasoning approach and grey theory. Expert Systems
with Applications, Volume 38, Issue 4, Pages 4403-4415. doi:10.1016/j.eswa.2010.09.110.
Liu, J and Gong, B. (2011), Analysis of Uncertainty Multi-attribute Group Decision-making
Process Based on D-S Evidence Theory. Journal of Computers, Vol. 6, No. 4, pp. 711-717.
Liu, X. B.; Zhou, M.; Yang, J. B. and Yang, S. L. (2008), Assessment of Strategic R&D
Projects for Car Manufacturers Based on the Evidential Reasoning Approach, Journal of
Computer Intelligent System, Vol. 1, pp. 24–49.
Liu, J.; Yang, J. B.; Wang, J. and Sii, H. S. (2005), Engineering System Safety Analysis and
Synthesis Using the Fuzzy Rule-Based Evidential Reasoning Approach. Quality and
Reliability Engineering International, Vol. 21, No. 4, Pp. 387 – 411.
Liu, J.; Yang, J. B.; Wang, J.; Sii, H. S. and Wang, Y. M. (2004), Fuzzy Rule-Based
Evidential Reasoning Approach for Safety Analysis. International Journal of General
Systems, Vol. 33 (2-3), pp. 183 – 204.
Liu, J.; Yang, J. B.; Wang, J. and Sii, H. S. (2003), Review of Uncertainty Reasoning
Approaches as Guidance for Maritime and Offshore Safety-Based Assessment. Journal of
United Kingdom (UK) Safety and Reliability Society, Vol. 23, No. 1, pp.63 – 80.
Lloyd's Register (LR) (2013), Ship Right, Design and Construction: Annexes to Machinery
Planned Maintenance and Condition Monitoring.
Lloyd’s Register (LR) (2011), Survey and Examination of Ships’ Lifting Appliances. In
conjunction with UK P&I Club, Maggregor and Liebherr.
Lopez de Mantaras, R. (1990), Approximate Reasoning Models. Ellis Horwood.
LYC (2006), Slewing Bearing Catalog. Luoyang Bearing Corporation (GROUP).
Lubrication Engineers (n.d). Industrial Gear Oils, Asset Reliability Solutions. [Online]
[Viewed: 18th February 2016, 00:23] Available at: http://www.lelubricants.com/gear-oils.html

Development of an Efficient Planned Maintenance Framework for Marine and Offshore Machinery
175
Madni, A. M. (2007), Designing for Resilience. ISTI Lecture Notes on Advanced Topics in
Systems Engineering, Department of Industrial and System Engineering, University of
Southern Califonia.US.
MAIB (2010), Marine Accident Investigation Branch: Annual Report. Extract from the
Merchant Shipping (Accident Reporting and Investigation) Regulations 2005.
MAIB (2007), Report on the investigation of machinery breakdown and subsequence fire
onboard Maersk Doha in Chesapeake Bay. Marine Accident Investigation Branch. Extract
from the United Kingdom Merchant Shipping (Accident Reporting and Investigation)
Regulations 2005 – Regulations 5. Report No. 15/2007.
MAIB (2006), Report on the investigation of engine failure of Savannah Express and her
subsequent contact with a linkspan at Southampton Docks. Marine Accident Investigation
Branch. Extract from the United Kingdom Merchant Shipping (Accident Reporting and
Investigation) Regulations 2005 – Regulations 5. Report No. 8/2006.
Marttunen, M. and Hamalainen, R. P. (1995), Decision Analysis Interviews in Environmental
Impact Assessment. European Journal of Operational Research, Vol. 87, pp. 551-563.
Meister, D. (1964), Methods of predicting human reliability in man–machine systems. Hum
Factors; 6(1): 621–646.
Mikhailov, L. and Tsvetinov, P. (2004), Evaluation of services using a fuzzy analytic
hierarchy process. Applied Soft Computing Journal, Vol 5, no. 1, pp. 23-33. DOI:
10.1016/j.asoc.2004.04.001.
Mills, S. (2012), Condition-Based Maintenance a Route Map to Success. V1.0 IMarEST
09.2012 AV Technology Ltd.
MIT GMBH (2006). Data Engine Manual.
Moore, J. H. and Weatherford, L. R. (2001), Decision Modelling with Microsoft Excel. 6th
edition. Prentice-Hall, Inc.: Upper Saddle River, NJ.
Moubray, J. (2003), 21st Century maintenance organization: Part I- The asset management.
Noria Corporation (2003), Fundamental Principles in Setting Alarms and Limits in Wear
Debris Analysis. Machinery Lubrication, Noria Publication.
Olesen, T. R. (2016), Offshore Supply Industry Dynamics: Business Strategies in the
Offshore Supply Industry. CBS Maritime, Cross-diciplinary and problem-focused research
and education in the maritime industry context. ISBN: 978-87-93262-05-8.

Development of an Efficient Planned Maintenance Framework for Marine and Offshore Machinery
176
Olson, D. L. (2004), Comparison of Weights in TOPSIS Models. Journal of Mathematical
and Computer Modelling, Vol. 40, No 7-8, pp. 721–727.
Pam, E. D.; Li, K. X.; Wall, A.; Yang, Z. and Wang, J. (2013), A Subjective Approach for
Ballast Water Risk Estimation. Ocean Engineering, Vol. 61, pp. 66–76.
Pam, E. D. (2010), Risk-Based Framework for Ballast Water Safety Management. PhD
Thesis, department of Maritime and Mechanical Engineering, Liverpool John Moores
University.
Patelli, E.; Alvarez, D. A.; Broggi, M. and Angelis, M. (2015), Uncertainty Management in
Multidisciplinary Design of Critical Safety Systems. Journal of Aerospace Information
Systems, Vol. 12, Special Section on Uncertainty Quantification (2015), pp. 140-169.
[Online] [Viewed: 3rd December 2016, 00:27]. Available at:
http://dx.doi.org/10.2514/1.I010273
Pearl, J. (1988), Probabilistic Reasoning in Intelligence Systems: Networks of Plausible
Inference. Morgan Kaufmann, San Mateo, CA.
Pillay, A. and Wang J. (2003a), A risk ranking approach incorporating fuzzy set theory and
grey theory. Reliability Engineering System Safety; 79(1): 61-67.
Pillay, A. and Wang, J. (2003b), Technology and safety of marine systems. Elsevier Science
Publishers Ltd. Essex, UK. ISBN: O 08 044148 3. Pp. 117-134.
Pillay, A. and Wang, J. (2002), Risk assessment of fishing vessels using fuzzy set approach.
International Journal of Reliability, Quality and Safety Engineering, Vol. 9, No. 2, pp. 163-
181. ISSN: 0218-5393.
Pintelon, L.; Pinjala S. K. and Vereecke, A. (2006). Evaluating the effectiveness of
maintenance strategies. Journal of Quality in Maintenance Engineering. Vol. 12. No. 1. pp
7 20.
Psaraftis, H. N.; Panagakos, G.; Desypris, N. and Ventikos, N. (2000). An Analysis of
Maritime Transportation Risk Factors. Paper ISOPE-98-HKP-02. [Online] [Viewed: 3rd May
2013]. Available at: http://www.martrans.org/documents/2000/safeco/Isopepaperfinal.doc
Rahimdel, M. J.; Ataei, M.; Khalokakaei, R. and Hoseinie, S. H. (2013), Reliability-based
maintenance scheduling of hydraulic system of rotary drilling machines. International
Journal of Mining Science and Technology, Volume 23, Issue 5, Pages 771-775.
http://dx.doi.org/10.1016/j.ijmst.2013.08.023
Development of an Efficient Planned Maintenance Framework for Marine and Offshore Machinery
177
Ramanathan, R. and Ganesh, L. S. (1994), Group preference aggregation methods
employed in AHP: An evaluation and an intrinsic process for deriving members’ weightages.
European Journal of operational Research 79 (1994) 249 – 265.
Ramezani, S. and Memariani, A. (2011), A Fuzzy Based System for Fault Diagnosis, Using
Oil Analysis Results. International Journal of Industrial Engineering & Productions
Research, Volume 22 Number 2, Pp. 91-98. ISSN: 2008-4889.
Reason, J. (1997), Managing the Risks of Organisational Accidents. Aldershot, UK:
Ashgate.
Reichert, P.; Borsuk, M.; Hostmann, M.; Schweizer, S.; Sporri, C.; Tockner, K. and Truffer,
B. (2007), Concepts of Decision Support for River Rehabilitation. Environmental Modelling
& Software, Vol. 22: 188 – 201.
Rezmireş, D.; Bocăneţ, V.; Monfardini, A.; Racocea, C. and Racocea C. (2010), Slewing
Bearing Lubrication & Maintenance. Buletinul Institutului Politehnic Din Iaşi Publicat de
Universitatea Tehnică, Gheorghe Asachi“ din Iaşi, Tomul LVI (LX), Fasc. 4A, Secţia
Construcţii De Maşini.
Riahi, R.; Bonsall, S.; Jekinson, I. and Wang, J. (2012), A seafarer’s reliability assessment
incorporating subjective judgements. Proc IMechE Part M: J Engineering for the Maritime
Environment 226(4) 313-334.
Riahi, R. (2010), Enabling security and risk-based operation of container line supply chains
under high uncertainties. PhD Dissertation, Engineering Department, Liverpool John
Moores University, Liverpool, UK.
Runkler, T. A. and Glesner, M. A. (1993), A set of axioms for defuzzification strategies
toward a theory of rational deffuzzification operators. Proceedings of the Second IEEE
International Conference on Fuzzy Set System, New York, pp. 1161-1166. ISSN: 07803-
06147.
Saaty, T. L. (1990), How to make decisions: The Analytical Hierarchy Process. Eur J Opl
Res 1990; 48(1): 9-26.
Saaty, T. L. (1983), Priority Setting in Completing Problems. IEEE Transactions on
Engineering Management. Volume 30. Number 3. August 1983. Pages 140-155.
Saaty, T. L. (1989), Group decision making and the AHP. in: B. L. Golden, E.A. Wasil and
P. T. Harker (eds.), The Analytic Hierarchy Process: Applications and Studies, Springer-
Verlag, New York, 59-67.
Development of an Efficient Planned Maintenance Framework for Marine and Offshore Machinery
178
Sen, P. and Yang, J. B. (1998), Multiple Criteria Decision Support in Engineering Design.
Springer, New York.
Shafer, G. A. (1978), A Mathematical Theory of Evidence. Princeton University Press,
Princeton, New Jersey, USA. ISBN: 0-471-99892-3.
Sherwin, J. D. and Al-Najjar, B. (1999), Practical Models for Conditions-Based Monitoring
Inspection Intervals. Journal of Quality in Maintenance Engineering, Vol. 5, No. 3, 1999, pp.
203-209. DOI: 10.1108/13552519910282665.
Shorten, D. C. (2012), Marine Machinery Condition Monitoring: Why has the shipping
industry been slow to adopt? Technical Investigation Department, Lloyd’s Register EMEA,
UK. ImarEST Condition Based Maintenance Conference Paper. [Online] [Viewed: 10th
December 2016, 16:40]. Available at:
https://dannyshorten.files.wordpress.com/2012/09/marine-machinery-condition-
monitoring-sunderland-2012-final.pdf
Shorten, D. C. (2001). Used Grease Analysis Integrated into Critical Equipment Inspection
Deferral Programs. Machinery Lubrication, Noria Publication. [Online] [Viewed: 22nd
October 2015, 22:22]. Available at:
http://www.machinerylubrication.com/Read/160/used-grease-analysis
Sodhi, B. and Prabhakar, T. V. (2012), A Simplified Description of Fuzzy TOPSIS.
Arxiv:1205.5098v1 [cs.AI]23.
Sonmez, M.; Holt, G. D.; Yang, J. B. and Graham, G. (2002), Applying Evidential Reasoning
to Pre-qualifying Construction Contractors. Journal of Management Engineering, Vol. 18,
No. 3, pp. 111–119.
Srikrishan, S.; Reddy, A. S. and Vani, S. (2014), A New Car Selection in the Market using
TOPSIS Technique. International Journal of Engineering Research and General Science,
2(4), pp.177-181.
Srivastava, R. P. and Liu, L. (2003), Applications of Belief Functions in Business Decisions,
a Review. Journal of Information Systems Frontiers, Vol. 5, No.4, pp. 359–378.
Srivastava, R. P. and Lu, H. (2002), Structural analysis of audit evidence using belief
functions. Journal of Fuzzy Sets Systems, Vol. 131, pp. 107–120.
Sugeno, M. (1999), Fuzzy Modelling and Control. Florida, USA: CRC Press.
Sullivan, G. P.; Pugh, R.; Melendez, A. P. and Hunt, W. D. (2010), Operations and
Maintenance Best Practices: A Guide to Achieving Operational Efficiency. US Department

Development of an Efficient Planned Maintenance Framework for Marine and Offshore Machinery
179
of Energy. Energy Efficiency & Renewal Energy, Federal Energy Management Programme,
Release 3.0.
Swain, A. D. (1963), A method for performing a human-factors reliability analysis. Sandia
Corporation Monograph SCR-685. Albuquerque, NM: Sandia Corporation.
Tang, Y.; Liu, Q.; Jing, J.; Yang, Y. and Zou, Z. (2016), A framework for identification of
maintenance significant items in reliability centred maintenance. Energy 118 (2017) 1295-
1303. [Online] [Viewed: 18th January 2017, 18:40]. Available at:
http://dx.doi.org/10.1016/j.energy.2016.11.011
Taylor, J. W. (1995), Can a Planned Maintenance System Reduce Your Cost To Produce
Your Product? Machinery Management Solutions. Healthcare for Production Machinery,
Published in Controllers Cost Report, July 1995.
Tiffany, D. (2014), Gearbox Condition Monitoring through Used Oil Analysis: Demonstration
in Proven Reliability and Continued Cost Savings. Reliable Plant 2014 Conference
Proceedings. [Online] [Viewed: 9th March 2017, 00:52]. Available at:
https://www.pioneer-
engineering.com/sites/default/files/dave_tiffany__gearbox_condition_monitoring_paper_fo
r_reliable_plant_2014.pdf
Toms, L. A. and Toms, A. M. (2008), Machinery Oil Analysis – Methods, Automation &
Benefits. “A Guide for Maintenance Managers, Supervisors & Technician”. 3rd edition, Page
29.
Toms, L. A. (1998), Machinery Oil Analysis, Methods, Automation & Benefits: A Guide for
Maintenance Managers, Supervisors & Technicians. Second Edition.
Tsaur, S. H.; Chang, T. Y. and Yen, C. (2002), The Evaluation of Airline Service Quality by
Fuzzy MCDM. Tourism Management, Vol. 23, pp. 107 – 15.
Tüysüz, F. and Kahraman, C. (2006), Project Risk Evaluation Using a Fuzzy Analytic
Hierarchy Process: An Application to Information Technology Projects. INTERNATIONAL
JOURNAL OF INTELLIGENT SYSTEMS, VOL. 21, 559–584. Wiley InterScience, DOI
10.1002/int.20148.
Tyler, A. R. (2007), Expert Systems Research Trends. Nova Science Publishers, Inc. Pp. 1
– 84. ISBN: 978-1-60021-688-6.

Development of an Efficient Planned Maintenance Framework for Marine and Offshore Machinery
180
Vahdat, K. and Smith, N. J. (2014a), A risk-based system for managing the retrofitting of
school buildings in seismic prone areas: A case study from Iran. International Journal of
Risk Assessment and Management 17 (4): 311–331.
Vahdat, K.; Smith, N. J. and Amiri, G. G. (2014b), Developing a Knowledge Based Expert
System (KBES) for Seismic Risk Management. Proceedings of the Second International
Conference on Vulnerability and Risk Analysis and Management (ICVRAM), Liverpool,
UK: ASCE (American Society of Civil Engineer), pp. 1746–1755.
Wang, L.; Chu, J. and Wu, J. (2007), Selection of optimum maintenance strategies based
on a fuzzy analytic hierarchy process. International Journal Production Economics, Volume
107, pp 151–163. DOI:10.1016/j.ijpe.2006.08.005.
Wang, T. C. and Chang, T. H. (2007), Application of TOPSIS in Evaluating Initial Training
Aircraft under a Fuzzy Environment. Journal of Expert Systems with Applications, Vol. 33,
pp. 870 – 880.
Wang, Y. M. and Elhag, T. M. S. (2007), A fuzzy group decision making approach for bridge
risk assessment. Computers & Industrial Engineering 53, 137–148.
doi:10.1016/j.cie.2007.04.009.
Wang, J. and Trbojevic, V. M. (2007), Design for Safety of Large Marine and Offshore
Engineering Products. Institute of Marine Engineering, Science and Technology (IMarEST),
London, UK, ISBN: 1-902536-58-4.
Wang, Y. M. and Fan, Z. P. (2007), Fuzzy preference relations: Aggregation and weight
determination. Computer & Industrial Engineering, Vol. 53, Pp. 163 – 172.
Wang, Y. M., Yang, J. B., and Xu, D. L. (2005), A two-stage logarithmic goal programming
method for generating weights from interval comparison matrices. Fuzzy Sets and Systems
152: 475–498. Elsevier, DOI: 10.1016/j.fss.2004.10.020. [Online] [Viewed: 11th December
2016, 01:14]. Available at:
http://citeseerx.ist.psu.edu/viewdoc/download?doi=10.1.1.96.3972&rep=rep1&type=pdf
Wang, J. (1997), A Subjective Methodology for Safety Analysis of Safety Requirements
Specifications. IEEE Transactions on Fuzzy Systems, Vol. 5, No. 3, pp. 418 – 430.
Wang, J.; Yang, J. B. and Sen, P. (1996), Multi-Person and Multi-Attribute Design
Evaluations Using Evidential Reasoning Based on Subjective Safety and Cost Analyses.
Reliability Engineering & System Safety, Vol. 52, No. 2, pp. 113-128.
Development of an Efficient Planned Maintenance Framework for Marine and Offshore Machinery
181
Wang, J.; Yang, J. B. and Sen, P. (1995), Safety Analysis and Synthesis using Fuzzy Sets
and Evidential Reasoning based on Subjective Safety and Cost Analysis. Reliability
Engineering and System Safety, Vol. 47, No. 2, pp. 103-118.
Watts, M. J. (n. d), Fuzzy Sets and Fuzzification. [Online] [Viewed: 13th June 2014, 22:11].
Available at: http://mike.watts.net.nz/Teaching/IIS/Lecture4.pdf
Welsh, C. (2006), Rule-Based/Expert Systems. CSE 435 – IDSS.
Whittingham, R. B. (2004), The blame machine: why human error causes accidents.
Elsevier Butterworth-Heinemann. Library of Congress Cataloguing in Publication Data.
ISBN 0 7506 5510 0.
Woodard, M. and Wolka, M. (2011), Bearing Maintenance Practices to Ensure Maximum
Life. Proceedings of the Twenty-seventh International Pump Users Symposium, September
12 – 15, Houston, Texas.
Wright, L. and Van der Schaaf, T. (2004), Accident versus Near Miss Causation: A Critical
Review of the Literature, An Empirical Test in the UK Railway domain, and their Implications
for other Sectors. Journal of Hazardous Materials, Vol. 111, pp. 105- 110.
Wu, W. Z.; Zhang, M.; Li, H. Z. and Mi, J. S. (2005), Knowledge Reduction in Random
Information Systems via Dempster–Shafer Theory of Evidence. Journal of Information
Science, Vol. 174, No. 34, pp. 143–164.
Xu, D. L. and Yang, J. B. (2005), Intelligent decision system based on the evidential
reasoning approach and its applications. Journal of Telecommunications and Information
Technology, pg. 73 – 80.
Xu, D. L.; Yang, J. B. and Wang, Y. M. (2001) in press, The ER approach for multi-attribute
decision analysis under interval uncertainties. European Journal of Operational Research.
Yager, Y. Y. (1992), On the specificity of a possibility distribution, Fuzzy Sets and Systems.
Vol. 50, No. 3, pp. 279-292.
Yang, T.; Kuo, Y.; Parker, D. and Chen, K. H. (2014), A Multiple Attribute Group Decision
Making Approach for Solving Problems with the Assessment of Preference Relations.
Mathematical Problems in Engineering, Volume 2015, Article ID 849897. [Online] [Viewed:
18th March 2017, 19:03] Available at: http://dx.doi.org/10.1155/2015/849897
Yang, T.; Chang, Y. C. and Yang, Y. H. (2011), Fuzzy multiple attribute decision-making
method for a large 300-mm fab layout design. International Journal of Production Research,
Vol. 50, Issue 12012. http://dx.doi.org/10.1080/00207543.2011.571449.

Development of an Efficient Planned Maintenance Framework for Marine and Offshore Machinery
182
Yang, Z. L.; Wang, J.; Bonsall, S. and Fang, Q. G. (2009), Use of Fuzzy Evidential
Reasoning in Maritime Security Assessment. Risk Analysis, Vol. 29, No. 1, pp. 95-120.
Yang, J. B.; Wang, Y. M.; Xu, D. L. (2006), The Evidential reasoning approach for MADA
under both probabilistic and fuzzy uncertainties. European Journal of Operational Research
171(1), 309–343.
Yang, Z. L., Wang, J., Bonsall, S. and Fang, Q. G. (2005), Reliable Container Supply Chain,
a New Risk Assessment Framework for Improving Safety Performance. Journal of World
Marine University, Vol. 4, No. 1, pp. 105-120.
Yang, J. B. and Xu, D. L. (2002), On the Evidential Reasoning Algorithm for Multiple
Attribute Decision Analysis under Uncertainty. IEEE Transactions on Systems, Man and
Cybernetics Part A: Systems and Human, Vol. 32, No. 3, pp. 289–304.
Yang, J. B. (2001), Rule and Utility Based Evidential Reasoning Approach for Multi-Attribute
Decision Analysis under Uncertainties. European Journal of Operational Research; 131(1):
31-61.
Yang, J. B.; Deng, M. and Xu, D. L. (2001), Nonlinear Regression to Estimate Both Weights
and Utilities via Evidential Reasoning for MADM, Processing. 51th International Conference,
Optimization: Techniques and Applications, Dec. 15-17, Hong Kong.
Yang, J. B. and Sen, P. (1997), Multiple attribute design evaluation of large engineering
products using the evidential reasoning approach. Journal of engineering design, Vol. 8,
No. 3, pp. 211-230.
Yang, J. B. and Sen, P. (1996), Preference Modelling by Estimating Local Utility Functions
for Multi objective Optimisation. European Journal of Operational Research, Vol. 95, pp.
115-138.
Yang, J. B. and Sen, P. (1994), A General Multi-Level Evaluation Process for Hybrid MADM
with Uncertainty. IEEE Transaction on Systems, Man and Cybernetics, Vol. 34, No. 10, pp.
1458-1473
Yang, J. B. and Singh, M. G. (1994), An Evidential Reasoning Approach for Multiple
Attribute Decision Making with Uncertainty. IEEE Transactions on Systems, Man and
Cybernetics, Vol. 24, No. 1, pp. 1–18.
Yoon, K. and Hwang, C. (1995), Multi-Attribute Decision Making: An Introduction. Sage
Publications, London.

Development of an Efficient Planned Maintenance Framework for Marine and Offshore Machinery
183
Yoon, K. (1987), A reconciliation among discrete compromise solutions. Journal of the
Operational Research Society, 38(3), pp.277-286.
Yu, C. S. (2002), AGP-A HP Method for Solving Group Decision Making Fuzzy AHP
Problems. Journal of Computers & Operational Research, Vol. 29, pp. 1969–2001.
Zadeh, L. A. (1975), The Concept of a Linguistic Variable and its Application to Approximate
Reasoning. Information Sciences, 8 (2), pp. 199–249.
Zadeh, L. A. (1965), Fuzzy Sets. Journal of Information and Control, Vol. 8, pp. 338 – 353.
Zeng, Y.; Wang, L. and Zheng, J. (2006), Arregative Risk Assessment Model for
International Technology and Project Development. Fifth Wuhan International Conference
on E-Business, Integration on Innovation through Measurement and Management, Vol. 1,
No. 3, pp. 1139-1144.
Zhang, D.; Yan, X.; Zhang, J.; Yang, Z. and Wang, J. (2015), Use of fuzzy rule-based
evidential reasoning approach in the navigational risk assessment of inland waterway
transportation systems. Safety Science, Volume 82, Pages 352-360. [Online] [Viewed: 18th
March 2017, 22:40] Available at: http://dx.doi.org/10.1016/j.ssci.2015.10.004
Zhang, X. D.; Zhao, H. and Wei, S. Z. (2005), Research on Subjective and Objective
Evidence Fusion Method in Oil Reserve Forecast. Journal of System Simulation, No.17,
Vol. 10, pp. 2537–2540.
Zhao, Y. (2014), The Importance of Lubricant and fluid Analysis in Predictive Maintenance.
SPECTRO, INC. OIL_WPv2_2014-03-26.
Zhou, M., Liu, X.B. and Yang, J.B. (2010), “Evidential Reasoning Based Nonlinear
Programming Model for MCDA under Fuzzy Weights and Utilities”, Journal of Intelligent
Systems, Vol. 25, pp. 31-58.
Zhu, K. J., Jing, Y. and Chang, D. Y. (1999), A Discussion on Extent Analysis Method and
Applications of Fuzzy AHP. European Journal of Operational Research, Vol. 116, No. 2, pp.
450–456.
Zimmermann, H. J. (1991), Fuzzy set theory – And its application (2nd ed.). Boston: Kluwer.
Zio, E. and Pedroni, N. (2012), Risk Analysis: Uncertainty Characterization in Risk Analysis
for Decision-Making Practice. Les Cahiers de la Securite Industrielle, Foundation for an
Industrial Safety Culture, A public-interest research foundation. FONCSI Foundation pour
une culture de Securite Industrielle.

Development of an Efficient Planned Maintenance Framework for Marine and Offshore Machinery
184
APPENDICES

Development of an Efficient Planned Maintenance Framework for Marine and Offshore Machinery
185
Chapter 4 Appendices
Appendix 4A - Experts Ratings
Table 1-4A: Expert 1 Rating for Cranes Bearing
Scale of relative importance
Criterion
Ab
solu
te (9
)
Inte
rmed
iate
(8
)
Ver
y s
tro
ng
(7
)
Inte
rmed
iate
(6
)
Str
ong
(5
)
Inte
rmed
iate
(4
)
Wea
k
(3)
Inte
rmed
iate
(2
)
Eq
ual
(1
)
Inte
rmed
iate
(2
)
Wea
k
(3)
Inte
rmed
iate
(4
)
Str
ong
(5
)
Inte
rmed
iate
(6
)
Ver
y s
tro
ng
(7
)
Inte
rmed
iate
(8
)
Ab
solu
te (9
)
Criterion
Trend Analysis X Family Analysis
Trend Analysis
X
Environmental
Analysis
Trend Analysis
X
Human Reliability
Analysis
Trend Analysis X Design Analysis
Family Analysis
X
Environmental
Analysis
Family Analysis
X
Human Reliability
Analysis
Family Analysis X
Design Analysis
Environmental
Analysis
X
Human Reliability
Analysis
Environmental
Analysis
X
Design Analysis
Human Reliability
Analysis
X
Design Analysis

Development of an Efficient Planned Maintenance Framework for Marine and Offshore Machinery
186
Table 2-4A: Expert 2 Ratings for Crane Bearing
Scale of relative importance
Criterion
Ab
solu
te (9
)
Inte
rmed
iate
(8
)
Ver
y s
tro
ng
(7
)
Inte
rmed
iate
(6
)
Str
ong
(5
)
Inte
rmed
iate
(4
)
Wea
k
(3)
Inte
rmed
iate
(2
)
Eq
ual
(1
)
Inte
rmed
iate
(2
)
Wea
k
(3)
Inte
rmed
iate
(4
)
Str
ong
(5
)
Inte
rmed
iate
(6
)
Ver
y s
tro
ng
(7
)
Inte
rmed
iate
(8
)
Ab
solu
te (9
)
Criterion
Trend Analysis X
Family Analysis
Trend Analysis
X
Environmental
Analysis
Trend Analysis
X
Human Reliability
Analysis
Trend Analysis X Design Analysis
Family Analysis
X
Environmental
Analysis
Family Analysis
X
Human Reliability
Analysis
Family Analysis X
Design Analysis
Environmental
Analysis
X
Human Reliability
Analysis
Environmental
Analysis
X
Design Analysis
Human Reliability
Analysis
X
Design Analysis
Table 3-4A: Expert 2 Pair-wise Comparison Matrix and Developing the Rating for each
Decision Alternative for the Crane Bearing
Crane Bearing
TA
FA
EA
HRA
DA
5th Root of Component
Priority Vector
(PV)
TA 1 2 1 6 4 2.1689 0.3328
FA 0.5 1 2 6 6 2.0477 0.3142
EA 1 0.5 1 6 2 1.431 0.2196
HRA 0.1666 0.1666 0.1666 1 0.25 0.2605 0.03998
DA 0.25 0.1666 0.5 4 1 0.6083 0.0933
SUM 2.9166 3.8332 4.6666 23 13.25 6.5164 1.0000
SUM * PV 0.9706 1.2044 1.0248 0.9195 1.2362 5.3555
Lambda-max = 5.3555
CI = 0.0889
CR = 0.08

Development of an Efficient Planned Maintenance Framework for Marine and Offshore Machinery
187
Table 4-4A: Expert 3 Ratings for Crane Bearing
Table 5-4A: Expert 3 Pair-wise Comparison Matrix and Developing the Rating for each
Decision Alternative for the Crane Bearing
Crane Bearing
TA
FA
EA
HRA
DA
5th Root of Component
Priority Vector
(PV)
TA 1 5 5 5 5 3.6239 0.5368
FA 0.2 1 0.3333 3 1 0.7247 0.1073
EA 0.2 3 1 3 1 1.1247 0.1666
HRA 0.2 0.3333 0.3333 1 0.3333 0.3748 0.0555
DA 0.2 1 1 3 1 0.9029 0.1337
SUM 1.8 10.3333 7.6666 15 8.3333 6.751 1.000
SUM * PV 0.9662 1.1088 1.2773 0.8325 1.1142 5.299
Lambda-max =
5.299
CI = 0.0748
CR = 0.07
Scale of relative importance
Criterion
Ab
solu
te (9
)
Inte
rmed
iate
(8
)
Ver
y s
tro
ng
(7
)
Inte
rmed
iate
(6
)
Str
ong
(5
)
Inte
rmed
iate
(4
)
Wea
k
(3)
Inte
rmed
iate
(2
)
Eq
ual
(1
)
Inte
rmed
iate
(2
)
Wea
k
(3)
Inte
rmed
iate
(4
)
Str
ong
(5
)
Inte
rmed
iate
(6
)
Ver
y s
tro
ng
(7
)
Inte
rmed
iate
(8
)
Ab
solu
te (9
)
Criterion
Trend Analysis X Family Analysis
Trend Analysis
X
Environmental
Analysis
Trend Analysis
X
Human Reliability
Analysis
Trend Analysis X
Design Analysis
Family Analysis
X
Environmental
Analysis
Family Analysis
X
Human Reliability
Analysis
Family Analysis X
Design Analysis
Environmental
Analysis
X
Human Reliability
Analysis
Environmental
Analysis
X
Design Analysis
Human Reliability
Analysis
X
Design Analysis

Development of an Efficient Planned Maintenance Framework for Marine and Offshore Machinery
188
Table 6-4A: Expert 4 Ratings for Crane Bearing
Table 7-4A: Expert 4 Pair-wise Comparison Matrix and Developing the Rating for each
Decision Alternative for the Crane Bearing
Crane Bearing
TA
FA
EA
HRA
DA
5th Root of Component
Priority Vector (PV)
TA 1 5 4 2 0.5 1.8206 0.3014
FA 0.2 1 0.3333 2 0.3333 0.5364 0.0888
EA 0.25 3 1 1 0.3333 0.7579 0.1255
HRA 0.5 0.5 1 1 0.25 0.5743 0.0951
DA 2 3 3 4 1 2.3522 0.3893
SUM 3.95 12.5 9.3333 10 2.4166 6.0414 1.000
SUM * PV 1.1905 1.11 1.1713 0.951 0.9408 5.3636
Lambda-max =
5.3636
CI = 0.0909
CR = 0.08
Scale of relative importance
Criterion
Ab
solu
te (9
)
Inte
rmed
iate
(8
)
Ver
y s
tro
ng
(7
)
Inte
rmed
iate
(6
)
Str
ong
(5
)
Inte
rmed
iate
(4
)
Wea
k
(3)
Inte
rmed
iate
(2
)
Eq
ual
(1
)
Inte
rmed
iate
(2
)
Wea
k
(3)
Inte
rmed
iate
(4
)
Str
ong
(5
)
Inte
rmed
iate
(6
)
Ver
y s
tro
ng
(7
)
Inte
rmed
iate
(8
)
Ab
solu
te (9
)
Criterion
Trend Analysis X Family Analysis
Trend Analysis
X
Environmental
Analysis
Trend Analysis
X
Human Reliability
Analysis
Trend Analysis X
Design Analysis
Family Analysis
X
Environmental
Analysis
Family Analysis
X
Human Reliability
Analysis
Family Analysis X
Design Analysis
Environmental
Analysis
X
Human Reliability
Analysis
Environmental
Analysis
X
Design Analysis
Human Reliability
Analysis
X
Design Analysis
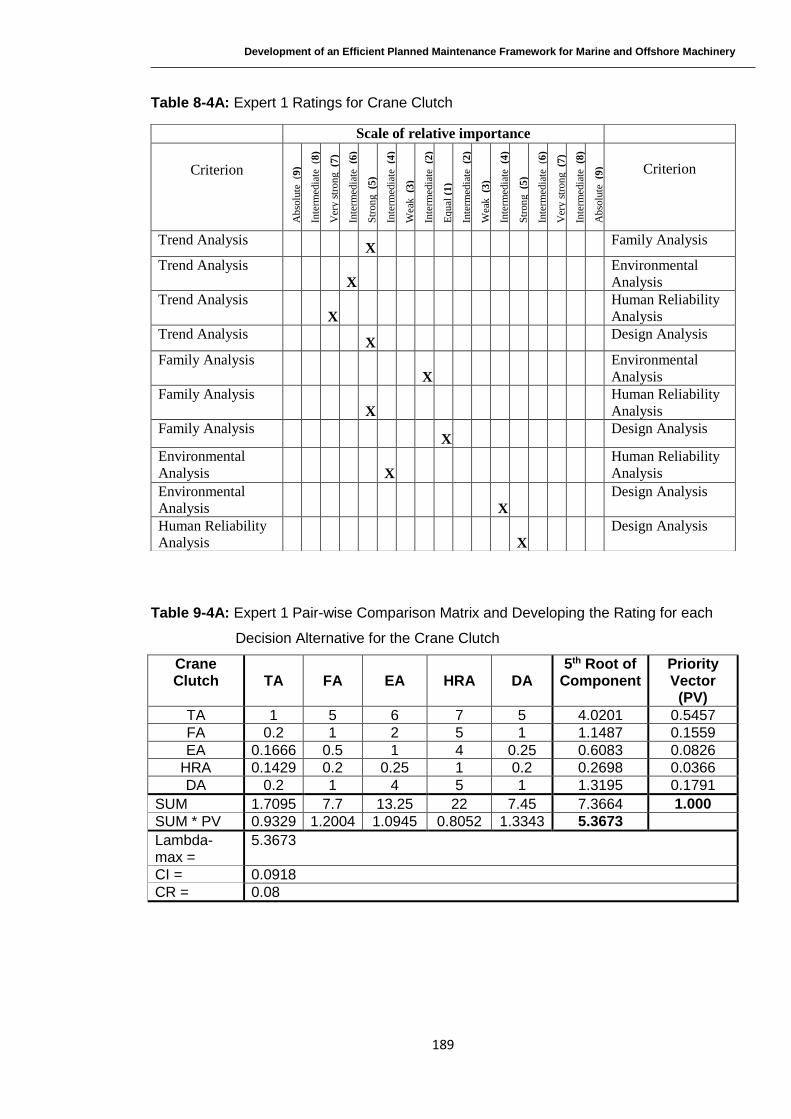
Development of an Efficient Planned Maintenance Framework for Marine and Offshore Machinery
189
Table 8-4A: Expert 1 Ratings for Crane Clutch
Table 9-4A: Expert 1 Pair-wise Comparison Matrix and Developing the Rating for each
Decision Alternative for the Crane Clutch
Crane Clutch
TA
FA
EA
HRA
DA
5th Root of Component
Priority Vector (PV)
TA 1 5 6 7 5 4.0201 0.5457
FA 0.2 1 2 5 1 1.1487 0.1559
EA 0.1666 0.5 1 4 0.25 0.6083 0.0826
HRA 0.1429 0.2 0.25 1 0.2 0.2698 0.0366
DA 0.2 1 4 5 1 1.3195 0.1791
SUM 1.7095 7.7 13.25 22 7.45 7.3664 1.000
SUM * PV 0.9329 1.2004 1.0945 0.8052 1.3343 5.3673
Lambda-max =
5.3673
CI = 0.0918
CR = 0.08
Scale of relative importance
Criterion
Ab
solu
te
(9)
Inte
rmed
iate
(8
)
Ver
y s
tron
g
(7)
Inte
rmed
iate
(6
)
Str
on
g
(5)
Inte
rmed
iate
(4
)
Wea
k
(3)
Inte
rmed
iate
(2
)
Equ
al (
1)
Inte
rmed
iate
(2
)
Wea
k
(3)
Inte
rmed
iate
(4
)
Str
on
g
(5)
Inte
rmed
iate
(6
)
Ver
y s
tron
g
(7)
Inte
rmed
iate
(8
)
Ab
solu
te
(9)
Criterion
Trend Analysis X
Family Analysis
Trend Analysis
X
Environmental
Analysis
Trend Analysis
X
Human Reliability
Analysis
Trend Analysis X
Design Analysis
Family Analysis
X
Environmental
Analysis
Family Analysis
X
Human Reliability
Analysis
Family Analysis X
Design Analysis
Environmental
Analysis
X
Human Reliability
Analysis
Environmental
Analysis
X
Design Analysis
Human Reliability
Analysis
X
Design Analysis
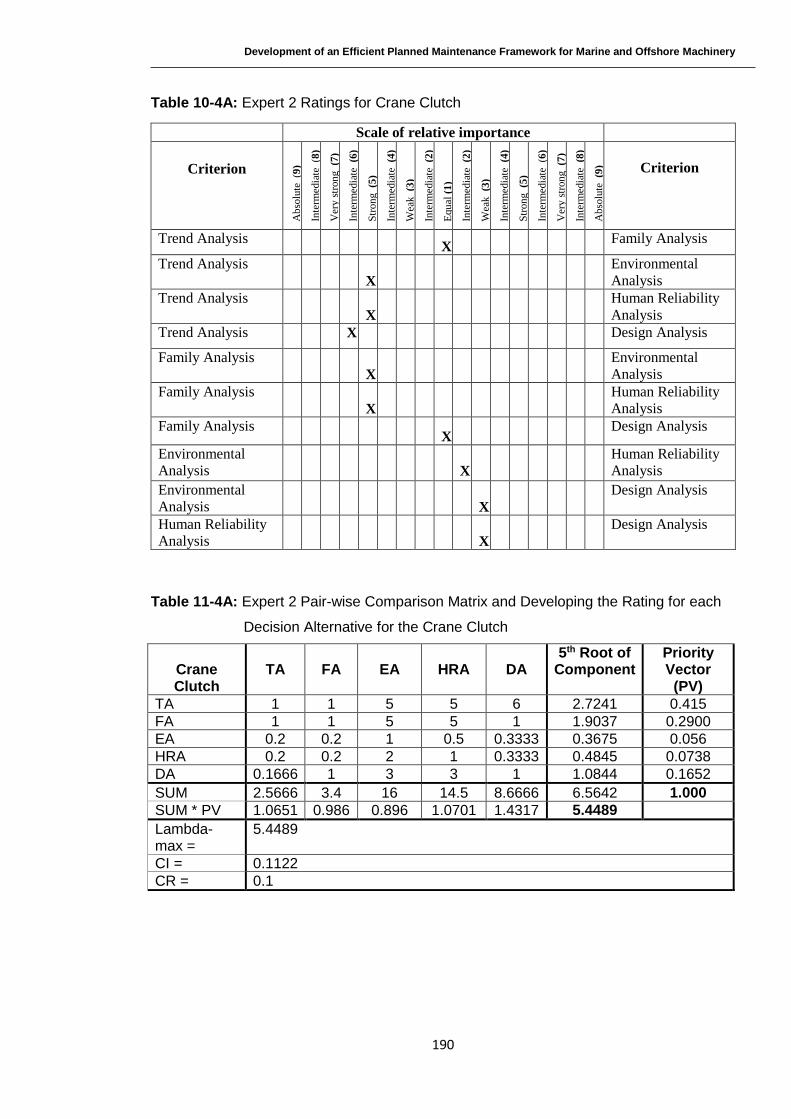
Development of an Efficient Planned Maintenance Framework for Marine and Offshore Machinery
190
Table 10-4A: Expert 2 Ratings for Crane Clutch
Scale of relative importance
Criterion
Ab
solu
te
(9)
Inte
rmed
iate
(8
)
Ver
y s
tron
g
(7)
Inte
rmed
iate
(6
)
Str
on
g
(5)
Inte
rmed
iate
(4
)
Wea
k
(3)
Inte
rmed
iate
(2
)
Equ
al (
1)
Inte
rmed
iate
(2
)
Wea
k
(3)
Inte
rmed
iate
(4
)
Str
on
g
(5)
Inte
rmed
iate
(6
)
Ver
y s
tron
g
(7)
Inte
rmed
iate
(8
)
Ab
solu
te
(9)
Criterion
Trend Analysis X
Family Analysis
Trend Analysis
X
Environmental
Analysis
Trend Analysis
X
Human Reliability
Analysis
Trend Analysis X Design Analysis
Family Analysis
X
Environmental
Analysis
Family Analysis
X
Human Reliability
Analysis
Family Analysis X
Design Analysis
Environmental
Analysis
X
Human Reliability
Analysis
Environmental
Analysis
X
Design Analysis
Human Reliability
Analysis
X
Design Analysis
Table 11-4A: Expert 2 Pair-wise Comparison Matrix and Developing the Rating for each
Decision Alternative for the Crane Clutch
Crane Clutch
TA
FA
EA
HRA
DA
5th Root of Component
Priority Vector (PV)
TA 1 1 5 5 6 2.7241 0.415
FA 1 1 5 5 1 1.9037 0.2900
EA 0.2 0.2 1 0.5 0.3333 0.3675 0.056
HRA 0.2 0.2 2 1 0.3333 0.4845 0.0738
DA 0.1666 1 3 3 1 1.0844 0.1652
SUM 2.5666 3.4 16 14.5 8.6666 6.5642 1.000
SUM * PV 1.0651 0.986 0.896 1.0701 1.4317 5.4489
Lambda-max =
5.4489
CI = 0.1122
CR = 0.1

Development of an Efficient Planned Maintenance Framework for Marine and Offshore Machinery
191
Table 12-4A: Expert 3 Ratings for Crane Clutch
Scale of relative importance
Criterion
Ab
solu
te
(9)
Inte
rmed
iate
(8
)
Ver
y s
tron
g
(7)
Inte
rmed
iate
(6
)
Str
on
g
(5)
Inte
rmed
iate
(4
)
Wea
k
(3)
Inte
rmed
iate
(2
)
Equ
al (
1)
Inte
rmed
iate
(2
)
Wea
k
(3)
Inte
rmed
iate
(4
)
Str
on
g
(5)
Inte
rmed
iate
(6
)
Ver
y s
tron
g
(7)
Inte
rmed
iate
(8
)
Ab
solu
te
(9)
Criterion
Trend Analysis X Family Analysis
Trend Analysis
X
Environmental
Analysis
Trend Analysis
X
Human Reliability
Analysis
Trend Analysis X
Design Analysis
Family Analysis
X
Environmental
Analysis
Family Analysis
X
Human Reliability
Analysis
Family Analysis X
Design Analysis
Environmental
Analysis
X
Human Reliability
Analysis
Environmental
Analysis
X
Design Analysis
Human Reliability
Analysis
X
Design Analysis
Table 13-4A: Expert 3 Pair-wise Comparison Matrix and Developing the Rating for each
Decision Alternative for the Crane Clutch
Crane Clutch
TA
FA
EA
HRA
DA
5th Root of Component
Priority Vector (PV)
TA 1 5 5 5 5 3.6239 0.5403
FA 0.2 1 1 3 1 0.9029 0.1346
EA 0.2 1 1 3 1 0.9029 0.1346
HRA 0.2 0.3333 0.3333 1 0.3333 0.3748 0.0559
DA 0.2 1 1 3 1 0.9029 0.1346
SUM 1.8 8.3333 8.3333 15 8.3333 6.7074 1.000
SUM * PV 0.9725 1.1217 1.1217 0.8385 1.1217 5.1761
Lambda-max =
5.1761
CI = 0.044
CR = 0.04

Development of an Efficient Planned Maintenance Framework for Marine and Offshore Machinery
192
Table 14-4A: Expert 4 Ratings for Crane Clutch
Scale of relative importance
Criterion
Ab
solu
te
(9)
Inte
rmed
iate
(8
)
Ver
y s
tron
g
(7)
Inte
rmed
iate
(6
)
Str
on
g
(5)
Inte
rmed
iate
(4
)
Wea
k
(3)
Inte
rmed
iate
(2
)
Equ
al (
1)
Inte
rmed
iate
(2
)
Wea
k
(3)
Inte
rmed
iate
(4
)
Str
on
g
(5)
Inte
rmed
iate
(6
)
Ver
y s
tron
g
(7)
Inte
rmed
iate
(8
)
Ab
solu
te
(9)
Criterion
Trend Analysis X Family Analysis
Trend Analysis
X
Environmental
Analysis
Trend Analysis
X
Human Reliability
Analysis
Trend Analysis X
Design Analysis
Family Analysis
X
Environmental
Analysis
Family Analysis
X
Human Reliability
Analysis
Family Analysis X
Design Analysis
Environmental
Analysis
X
Human Reliability
Analysis
Environmental
Analysis
X
Design Analysis
Human Reliability
Analysis
X
Design Analysis
Table 15-4A: Expert 4 Pair-wise Comparison Matrix and Developing the Rating for each
Decision Alternative for the Crane Clutch
Crane Clutch
TA
FA
EA
HRA
DA
5th Root of Component
Priority Vector (PV)
TA 1 5 3 4 4 2.9926 0.4744
FA 0.2 1 1 2 0.5 0.7248 0.1149
EA 0.3333 1 1 2 0.25 0.6989 0.1108
HRA 0.25 0.5 0.5 1 0.3333 0.4609 0.0731
DA 0.25 2 4 3 1 1.431 0.2268
SUM 2.0333 9.5 9.5 12 6.0833 6.3082 1.000
SUM * PV 0.9646 1.0916 1.0526 0.8772 1.3797 5.3657
Lambda-max =
5.3657
CI = 0.0914
CR = 0.08

Development of an Efficient Planned Maintenance Framework for Marine and Offshore Machinery
193
Table 16-4A: Expert 1 Ratings for Crane Gearbox
Scale of relative importance
Criterion
Ab
solu
te
(9)
Inte
rmed
iate
(8
)
Ver
y s
tron
g
(7)
Inte
rmed
iate
(6
)
Str
on
g
(5)
Inte
rmed
iate
(4
)
Wea
k
(3)
Inte
rmed
iate
(2
)
Equ
al (
1)
Inte
rmed
iate
(2
)
Wea
k
(3)
Inte
rmed
iate
(4
)
Str
on
g
(5)
Inte
rmed
iate
(6
)
Ver
y s
tron
g
(7)
Inte
rmed
iate
(8
)
Ab
solu
te
(9)
Criterion
Trend Analysis X
Family Analysis
Trend Analysis
X
Environmental
Analysis
Trend Analysis
X
Human Reliability
Analysis
Trend Analysis X
Design Analysis
Family Analysis
X
Environmental
Analysis
Family Analysis
X
Human Reliability
Analysis
Family Analysis X
Design Analysis
Environmental
Analysis
X
Human Reliability
Analysis
Environmental
Analysis
X
Design Analysis
Human Reliability
Analysis
X
Design Analysis
Table 17-4A: Expert 1 Pair-wise Comparison Matrix and Developing the Rating for each
Decision Alternative for the Crane Gearbox
Crane Gearbox
TA
FA
EA
HRA
DA
5th Root of Component
Priority Vector (PV)
TA 1 5 5 8 5 3.9811 0.5493
FA 0.2 1 3 5 1 1.2457 0.1719
EA 0.2 0.3333 1 3 0.5 0.6308 0.087
HRA 0.125 0.2 0.3333 1 0.25 0.2914 0.0402
DA 0.2 1 2 4 1 1.0986 0.1516
SUM 1.725 7.5333 11.3333 21 7.75 7.2476 1.000
SUM * PV 0.9475 1.295 0.986 0.8442 1.1749 5.2476
Lambda-max =
5.2476
CI = 0.0619
CR = 0.05

Development of an Efficient Planned Maintenance Framework for Marine and Offshore Machinery
194
Table 18-4A: Expert 2 Ratings for Crane Gearbox
Scale of relative importance
Criterion
Ab
solu
te
(9)
Inte
rmed
iate
(8
)
Ver
y s
tron
g
(7)
Inte
rmed
iate
(6
)
Str
on
g
(5)
Inte
rmed
iate
(4
)
Wea
k
(3)
Inte
rmed
iate
(2
)
Equ
al (
1)
Inte
rmed
iate
(2
)
Wea
k
(3)
Inte
rmed
iate
(4
)
Str
on
g
(5)
Inte
rmed
iate
(6
)
Ver
y s
tron
g
(7)
Inte
rmed
iate
(8
)
Ab
solu
te
(9)
Criterion
Trend Analysis X Family Analysis
Trend Analysis
X
Environmental
Analysis
Trend Analysis
X
Human Reliability
Analysis
Trend Analysis X Design Analysis
Family Analysis
X
Environmental
Analysis
Family Analysis
X
Human Reliability
Analysis
Family Analysis X Design Analysis
Environmental
Analysis
X
Human Reliability
Analysis
Environmental
Analysis
X
Design Analysis
Human Reliability
Analysis
X
Design Analysis
Table 19-4A: Expert 2 Pair-wise Comparison Matrix and Developing the Rating for each
Decision Alternative for the Crane Gearbox
Crane Gearbox
TA
FA
EA
HRA
DA
5th Root of Component
Priority Vector
(PV)
TA 1 5 4 7 4 3.5452 0.5288
FA 0.2 1 1 5 1 1 0.1492
EA 0.25 1 1 2 1 0.8706 0.1299
HRA 0.1429 0.2 0.5 1 0.3333 0.3438 0.0513
DA 0.25 1 1 3 1 0.9441 0.1408
SUM 1.8429 8.2 7.5 18 7.3333 6.7037 1.000
SUM * PV 0.9745 1.2234 0.9743 0.923 1.0325 5.1277
Lambda-max =
5.1277
CI = 0.0319
CR = 0.03

Development of an Efficient Planned Maintenance Framework for Marine and Offshore Machinery
195
Table 20-4A: Expert 3 Ratings for Crane Gearbox
Scale of relative importance
Criterion
Ab
solu
te
(9)
Inte
rmed
iate
(8
)
Ver
y s
tron
g
(7)
Inte
rmed
iate
(6
)
Str
on
g
(5)
Inte
rmed
iate
(4
)
Wea
k
(3)
Inte
rmed
iate
(2
)
Equ
al (
1)
Inte
rmed
iate
(2
)
Wea
k
(3)
Inte
rmed
iate
(4
)
Str
on
g
(5)
Inte
rmed
iate
(6
)
Ver
y s
tron
g
(7)
Inte
rmed
iate
(8
)
Ab
solu
te
(9)
Criterion
Trend Analysis X Family Analysis
Trend Analysis
X
Environmental
Analysis
Trend Analysis
X
Human Reliability
Analysis
Trend Analysis X Design Analysis
Family Analysis
X
Environmental
Analysis
Family Analysis
X
Human Reliability
Analysis
Family Analysis X Design Analysis
Environmental
Analysis
X
Human Reliability
Analysis
Environmental
Analysis
X
Design Analysis
Human Reliability
Analysis
X
Design Analysis
Table 21-4A: Expert 3 Pair-wise Comparison Matrix and Developing the Rating for each
Decision Alternative for the Crane Gearbox
Crane Gearbox
TA
FA
EA
HRA
DA
5th Root of Component
Priority Vector
(PV)
TA 1 5 5 5 5 3.6239 0.5376
FA 0.2 1 1 3 1 0.9029 0.1339
EA 0.2 1 1 3 1 0.9029 0.1339
HRA 0.2 0.3333 0.3333 1 0.25 0.3545 0.0526
DA 0.2 1 1 4 1 0.9564 0.1419
SUM 1.8 8.3333 8.3333 16 8.25 6.7406 1.000
SUM * PV 0.9677 1.1158 1.1158 0.8416 1.1707 5.2116
Lambda-max =
5.2116
CI = 0.0529
CR = 0.05

Development of an Efficient Planned Maintenance Framework for Marine and Offshore Machinery
196
Table 22-4A: Expert 4 Ratings for Crane Gearbox
Scale of relative importance
Criterion
Ab
solu
te
(9)
Inte
rmed
iate
(8
)
Ver
y s
tron
g
(7)
Inte
rmed
iate
(6
)
Str
on
g
(5)
Inte
rmed
iate
(4
)
Wea
k
(3)
Inte
rmed
iate
(2
)
Equ
al (
1)
Inte
rmed
iate
(2
)
Wea
k
(3)
Inte
rmed
iate
(4
)
Str
on
g
(5)
Inte
rmed
iate
(6
)
Ver
y s
tron
g
(7)
Inte
rmed
iate
(8
)
Ab
solu
te
(9)
Criterion
Trend Analysis X
Family Analysis
Trend Analysis
X
Environmental
Analysis
Trend Analysis
X
Human Reliability
Analysis
Trend Analysis X Design Analysis
Family Analysis
X
Environmental
Analysis
Family Analysis
X
Human Reliability
Analysis
Family Analysis X Design Analysis
Environmental
Analysis
X
Human Reliability
Analysis
Environmental
Analysis
X
Design Analysis
Human Reliability
Analysis
X
Design Analysis
Table 23-4A: Expert 4 Pair-wise Comparison Matrix and Developing the Rating for each
Decision Alternative for the Crane Gearbox
Crane Gearbox
TA
FA
EA
HRA
DA
5th Root of Component
Priority Vector
(PV)
TA 1 4 5 5 3 3.1291 0.4624
FA 0.25 1 4 5 1 1.3797 0.2039
EA 0.2 0.25 1 1 0.25 0.4163 0.0615
HRA 0.2 0.2 1 1 0.2 0.3807 0.0563
DA 0.3333 1 4 5 1 1.4614 0.2160
SUM 1.9833 6.45 15 17 5.45 6.7672 1.000
SUM * PV 0.9171 1.3152 0.9225 0.9571 1.1772 5.2891
Lambda-max =
5.2891
CI = 0.0723
CR = 0.06
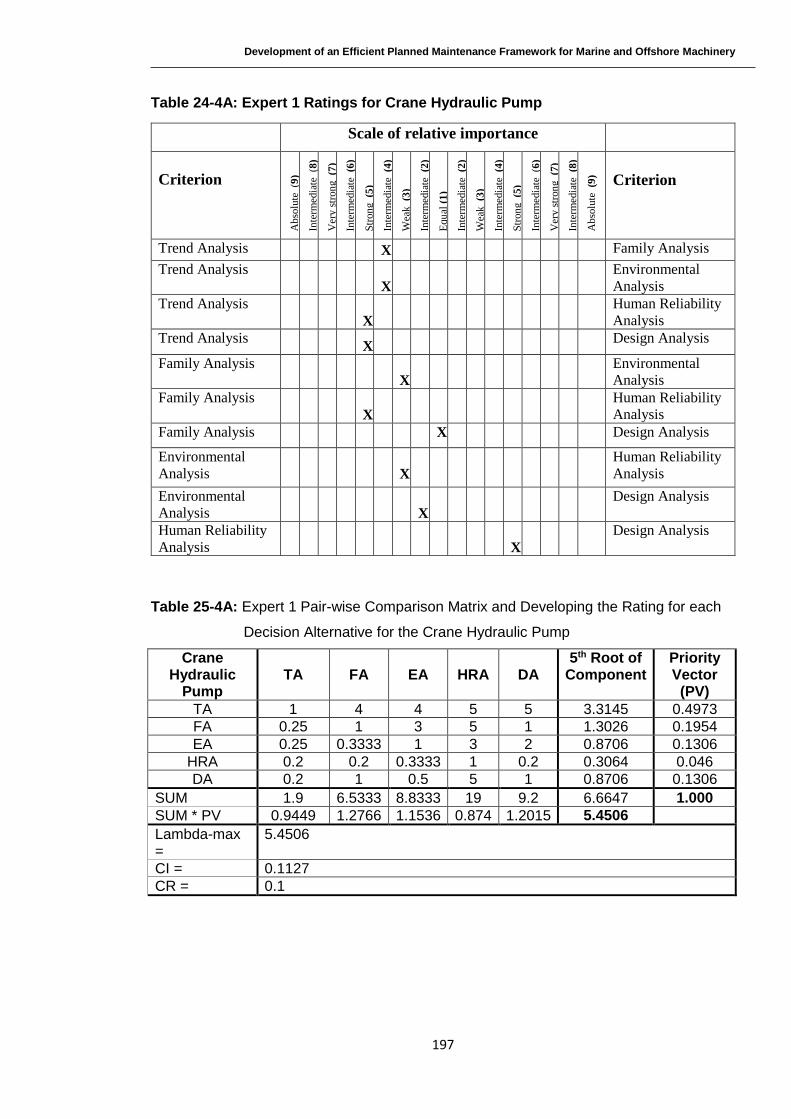
Development of an Efficient Planned Maintenance Framework for Marine and Offshore Machinery
197
Table 24-4A: Expert 1 Ratings for Crane Hydraulic Pump
Scale of relative importance
Criterion
Ab
solu
te
(9)
Inte
rmed
iate
(8
)
Ver
y s
tron
g
(7)
Inte
rmed
iate
(6
)
Str
on
g
(5)
Inte
rmed
iate
(4
)
Wea
k
(3)
Inte
rmed
iate
(2
)
Equ
al (
1)
Inte
rmed
iate
(2
)
Wea
k
(3)
Inte
rmed
iate
(4
)
Str
on
g
(5)
Inte
rmed
iate
(6
)
Ver
y s
tron
g
(7)
Inte
rmed
iate
(8
)
Ab
solu
te
(9)
Criterion
Trend Analysis X Family Analysis
Trend Analysis
X
Environmental
Analysis
Trend Analysis
X
Human Reliability
Analysis
Trend Analysis X
Design Analysis
Family Analysis
X
Environmental
Analysis
Family Analysis
X
Human Reliability
Analysis
Family Analysis X Design Analysis
Environmental
Analysis
X
Human Reliability
Analysis
Environmental
Analysis
X
Design Analysis
Human Reliability
Analysis
X
Design Analysis
Table 25-4A: Expert 1 Pair-wise Comparison Matrix and Developing the Rating for each
Decision Alternative for the Crane Hydraulic Pump
Crane Hydraulic
Pump
TA
FA
EA
HRA
DA
5th Root of Component
Priority Vector (PV)
TA 1 4 4 5 5 3.3145 0.4973
FA 0.25 1 3 5 1 1.3026 0.1954
EA 0.25 0.3333 1 3 2 0.8706 0.1306
HRA 0.2 0.2 0.3333 1 0.2 0.3064 0.046
DA 0.2 1 0.5 5 1 0.8706 0.1306
SUM 1.9 6.5333 8.8333 19 9.2 6.6647 1.000
SUM * PV 0.9449 1.2766 1.1536 0.874 1.2015 5.4506
Lambda-max =
5.4506
CI = 0.1127
CR = 0.1

Development of an Efficient Planned Maintenance Framework for Marine and Offshore Machinery
198
TABLE 26-4A: Expert 2 Ratings for Crane Hydraulic Pump
Scale of relative importance
Criterion
Ab
solu
te
(9)
Inte
rmed
iate
(8
)
Ver
y s
tron
g
(7)
Inte
rmed
iate
(6
)
Str
on
g
(5)
Inte
rmed
iate
(4
)
Wea
k
(3)
Inte
rmed
iate
(2
)
Equ
al (
1)
Inte
rmed
iate
(2
)
Wea
k
(3)
Inte
rmed
iate
(4
)
Str
on
g
(5)
Inte
rmed
iate
(6
)
Ver
y s
tron
g
(7)
Inte
rmed
iate
(8
)
Ab
solu
te
(9)
Criterion
Trend Analysis X
Family Analysis
Trend Analysis
X
Environmental
Analysis
Trend Analysis
X
Human Reliability
Analysis
Trend Analysis X Design Analysis
Family Analysis
X
Environmental
Analysis
Family Analysis
X
Human Reliability
Analysis
Family Analysis X
Design Analysis
Environmental
Analysis
X
Human Reliability
Analysis
Environmental
Analysis
X
Design Analysis
Human Reliability
Analysis
X
Design Analysis
Table 27-4A: Expert 2 Pair-wise Comparison Matrix and Developing the Rating for each
Decision Alternative for the Crane Hydraulic Pump
Crane Hydraulic
Pump
TA
FA
EA
HRA
DA
5th Root of Component
Priority Vector
(PV)
TA 1 5 4 3 4 2.9926 0.473
FA 0.2 1 1 5 1 1 0.1580
EA 0.25 1 1 4 1 1 0.1580
HRA 0.3333 0.2 0.25 1 0.25 0.3347 0.0529
DA 0.25 1 1 4 1 1 0.1580
SUM 2.0333 8.2 7.25 17 7.25 6.3273 1.000
SUM * PV 0.9618 1.2956 1.1455 0.8993 1.1455 5.4477
Lambda-max = 5.4477
CI = 0.1119
CR = 0.1

Development of an Efficient Planned Maintenance Framework for Marine and Offshore Machinery
199
Table 28-4A: Expert 3 Ratings for Crane Hydraulic Pump
Scale of relative importance
Criterion
Ab
solu
te
(9)
Inte
rmed
iate
(8
)
Ver
y s
tron
g
(7)
Inte
rmed
iate
(6
)
Str
on
g
(5)
Inte
rmed
iate
(4
)
Wea
k
(3)
Inte
rmed
iate
(2
)
Equ
al (
1)
Inte
rmed
iate
(2
)
Wea
k
(3)
Inte
rmed
iate
(4
)
Str
on
g
(5)
Inte
rmed
iate
(6
)
Ver
y s
tron
g
(7)
Inte
rmed
iate
(8
)
Ab
solu
te
(9)
Criterion
Trend Analysis X
Family Analysis
Trend Analysis
X
Environmental
Analysis
Trend Analysis
X
Human Reliability
Analysis
Trend Analysis X
Design Analysis
Family Analysis
X
Environmental
Analysis
Family Analysis
X
Human Reliability
Analysis
Family Analysis X
Design Analysis
Environmental
Analysis
X
Human Reliability
Analysis
Environmental
Analysis
X
Design Analysis
Human Reliability
Analysis
X
Design Analysis
Table 29-4A: Expert 3 Pair-wise Comparison Matrix and Developing the Rating for each
Decision Alternative for the Crane Hydraulic Pump
Crane Hydraulic
Pump
TA
FA
EA
HRA
DA
5th Root of Component
Priority Vector
(PV)
TA 1 5 5 5 5 3.6239 0.5403
FA 0.2 1 1 3 1 0.9029 0.1346
EA 0.2 1 1 3 1 0.9029 0.1346
HRA 0.2 0.3333 0.3333 1 0.3333 0.3748 0.0559
DA 0.2 1 1 3 1 0.9029 0.1346
SUM 1.8 8.3333 8.3333 15 8.3333 6.7074 1.000
SUM * PV 0.9725 1.1217 1.1217 0.8385 1.1217 5.1761
Lambda-max =
5.1751
CI = 0.044
CR = 0.04

Development of an Efficient Planned Maintenance Framework for Marine and Offshore Machinery
200
Table 30-4A: Expert 4 Ratings for Crane Hydraulic Pump
Scale of relative importance
Criterion
Ab
solu
te
(9)
Inte
rmed
iate
(8
)
Ver
y s
tron
g
(7)
Inte
rmed
iate
(6
)
Str
on
g
(5)
Inte
rmed
iate
(4
)
Wea
k
(3)
Inte
rmed
iate
(2
)
Equ
al (
1)
Inte
rmed
iate
(2
)
Wea
k
(3)
Inte
rmed
iate
(4
)
Str
on
g
(5)
Inte
rmed
iate
(6
)
Ver
y s
tron
g
(7)
Inte
rmed
iate
(8
)
Ab
solu
te
(9)
Criterion
Trend Analysis X
Family Analysis
Trend Analysis
X
Environmental
Analysis
Trend Analysis
X
Human Reliability
Analysis
Trend Analysis X
Design Analysis
Family Analysis
X
Environmental
Analysis
Family Analysis
X
Human Reliability
Analysis
Family Analysis X
Design Analysis
Environmental
Analysis
X
Human Reliability
Analysis
Environmental
Analysis
X
Design Analysis
Human Reliability
Analysis
X
Design Analysis
Table 31-4A: Expert 4 Pair-wise Comparison Matrix and Developing the Rating for each
Decision Alternative for the Crane Hydraulic Pump
Crane Hydraulic
Pump
TA
FA
EA
HRA
DA
5th Root of Component
Priority Vector (PV)
TA 1 4 4 3 2 2.4915 0.4135
FA 0.25 1 3 4 2 1.431 0.2375
EA 0.25 0.3333 1 1 0.3333 0.4884 0.0811
HRA 0.3333 0.25 1 1 0.5 0.5297 0.0879
DA 0.5 0.5 3 2 1 1.0845 0.180
SUM 2.3333 6.0833 12 11 5.8333 6.0251 1.000
SUM * PV 0.9648 1.4448 0.9732 0.9669 1.05 5.3997
Lambda-max =
5.3997
CI = 0.0999
CR = 0.09

Development of an Efficient Planned Maintenance Framework for Marine and Offshore Machinery
201
Appendix 4B - Evaluation of Trend Analysis
4B1 – Membership Functions for Crane Bearing Grease Sample Elements
Very Low Low Average High Very High
100
200 300 400 500
1
Limits
Iron (Fe)
Figure 1-4B1: Membership Function of the Iron (Fe) Element
Degree of belief
Very Low Low
Average High Very High
8 16 24 32 40
1
Limits
Molybdenum (Mo)
Figure 3-4B1: Membership Function of the Molybdenum (Mo) Element
Degree of belief
Very low low Average High Very High
1 . 6 3 . 2 4 . 8 6 . 4 8
1
Limits
Chromium (Cr)
Figure 2-4B1: Membership Function of the Chromium (Cr) Element
Degree of belief
0 . 875
0 . 125 5
Very Low Low Average High Very High
8 16 24 32 40
1
Limits
Tin ( Sn )
Figure 4-4B1: Membership Function of the Tin (Sn) Element
Degree of belief
0 . 875
0 . 125 15
Very Low Low Average High Very High
3 6 9 12 15
1
Limits
Lead ( Pb )
Figure 5-4B1: Membership Function of the Lead (Pb) Element
Degree of belief
14
0 . 67
0 . 33
5
Very Low Low Average High Very High
3 6 9 12 15
1
Limits
Copper (Cu)
Figure 6-4B1: Membership Function of the Copper (Cu) Element
Degree of belief
14
0 . 67
0 . 33
Very Low Low Average
High Very High
30 60 90 120 150
1
Limits
Sodium (Na)
Figure 7-4B1: Membership Function of the Sodium (Na) Element
Degree of belief
0 . 97
0 . 03 59
0 . 8
0 . 2
84
Very Low Low Average High Very High
18 36 54 72 90
1
Limits
Magnesium (Mg)
Figure 8-4B1: Membership Function of the Magnesium (Mg) Element
Degree of belief
0 . 66
0 . 34
24

Development of an Efficient Planned Maintenance Framework for Marine and Offshore Machinery
202
Very Low Low Average High Very High
1 2 3 4 5
1
Limits
Nickel (Ni)
Figure 9-4B1: Membership Function of the Nickel (Ni) Element
Degree of belief
Very low Low Average High Very High
18 36 54 72 90
1
Limits
Aluminium (Al)
Figure 10-4B1: Membership Function of the Aluminium (Al) Element
Degree of belief
0 . 77
0 . 23
22
Very Low Low Average High Very High
30 60 90 120 150
1
Limits
Silicon (Si)
Figure 11-4B1: Membership Function of the Silicon (Si) Element
Degree of belief
0 . 7
0 . 3
51

Development of an Efficient Planned Maintenance Framework for Marine and Offshore Machinery
203
4B2 – Membership Functions for Crane Clutch Oil Sample Elements
Very LowLow
AverageHigh Very High
9 18 27 36 45
1
Limits
Iron (Fe)
Figure 1-4B2: Membership Function of the Iron (Fe) Element
Degree of belief
Very LowLow
AverageHigh Very High
1 2 3 4 5
1
Limits
Chromium (Cr)
Figure 2-4B2: Membership Function of the Chromium (Cr) Element
Degree of belief
Very LowLow
AverageHigh Very High
1.2 2.4 3.6 4.8 6
1
Limits
Molybdenum (Mo)
Figure 3-4B2: Membership Function of the Molybdenum (Mo) Element
Degree of belief
Very LowLow
AverageHigh Very High
2 4 6 8 10
1
Limits
Tin (Sn)
Figure 4-4B2: Membership Function of the Tin (Sn) Element
Degree of belief
Very LowLow
AverageHigh Very High
1 2 3 4 5
1
Limits
Lead (Pb)
Figure 5-4B2: Membership Function of the Lead (Pb) Element
Degree of belief
Very LowLow
AverageHigh Very High
4.4 8.8 13.2 17.6 22
1
Limits
Copper (Cu)
Figure 6-4B2: Membership Function of the Copper (Cu) Element
Degree of belief
0.86
0.14
0.64
0.36
65
Very LowLow
AverageHigh Very High
2 4 6 8 10
1
Limits
Aluminium (Al)
Figure 7-4B2: Membership Function of the Aluminium (Al) Element
Degree of belief
Very LowLow
AverageHigh Very High
7 14 21 28 35
1
Limits
Silicon (Si)
Figure 8-4B2: Membership Function of the Silicon (Si) Element
Degree of belief

Development of an Efficient Planned Maintenance Framework for Marine and Offshore Machinery
204
Very LowLow
AverageHigh Very High
8 16 24 32 40
1
Limits
Vanadium (V)
Figure 9-4B2: Membership Function of the Vanadium (V) Element
Degree of belief
0.75
0.25
0.875
0.125
9 10
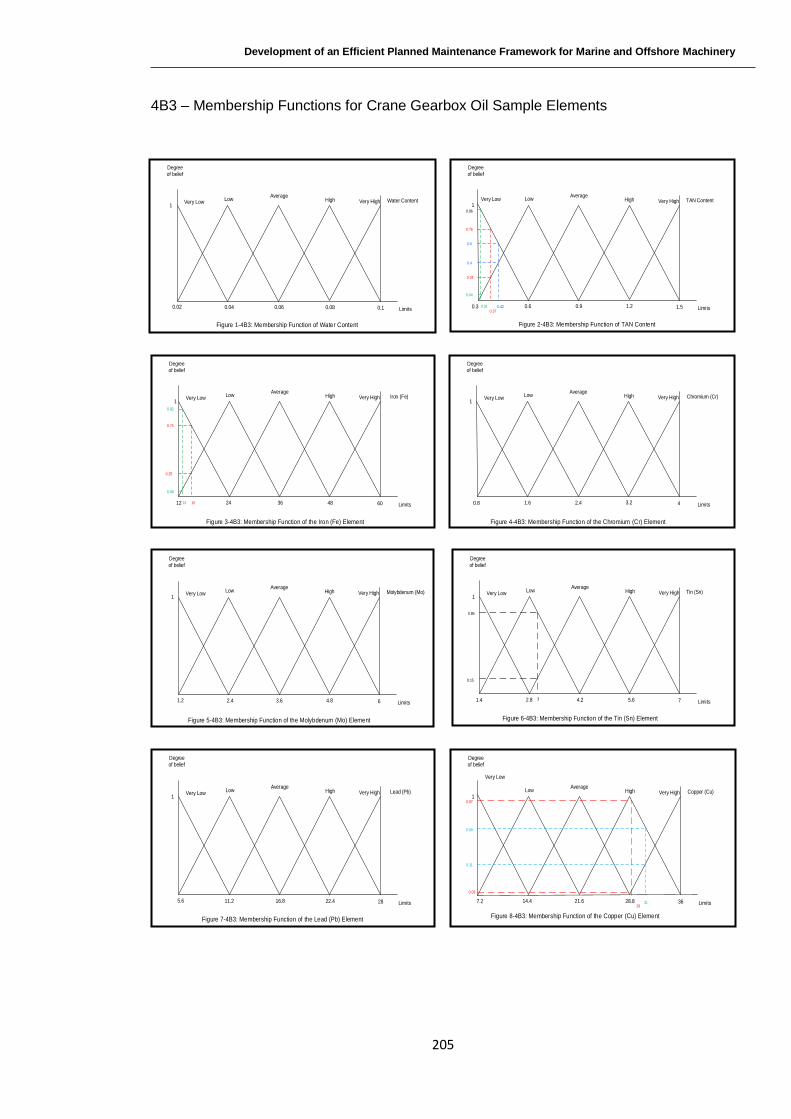
Development of an Efficient Planned Maintenance Framework for Marine and Offshore Machinery
205
4B3 – Membership Functions for Crane Gearbox Oil Sample Elements
Very LowLow
AverageHigh Very High
0.02 0.04 0.06 0.08 0.1
1
Limits
Water Content
Figure 1-4B3: Membership Function of Water Content
Degree of belief
Very Low LowAverage
High Very High
0.3 0.6 0.9 1.2 1.5
1
Limits
TAN Content
Figure 2-4B3: Membership Function of TAN Content
Degree of belief
0.76
0.24
0.37
0.6
0.4
0.420.31
0.96
0.04
Very LowLow
AverageHigh Very High
12 24 36 48 60
1
Limits
Iron (Fe)
Figure 3-4B3: Membership Function of the Iron (Fe) Element
Degree of belief
0.75
0.25
15
0.92
0.08
13
Very LowLow
AverageHigh Very High
0.8 1.6 2.4 3.2 4
1
Limits
Chromium (Cr)
Figure 4-4B3: Membership Function of the Chromium (Cr) Element
Degree of belief
Very LowLow
AverageHigh Very High
1.2 2.4 3.6 4.8 6
1
Limits
Molybdenum (Mo)
Figure 5-4B3: Membership Function of the Molybdenum (Mo) Element
Degree of belief
Very LowLow
AverageHigh Very High
1.4 2.8 4.2 5.6 7
1
Limits
Tin (Sn)
Figure 6-4B3: Membership Function of the Tin (Sn) Element
Degree of belief
0.85
0.15
3
Very LowLow
AverageHigh Very High
5.6 11.2 16.8 22.4 28
1
Limits
Lead (Pb)
Figure 7-4B3: Membership Function of the Lead (Pb) Element
Degree of belief
Very Low
LowAverage
High Very High
7.2 14.4 21.6 28.8 36
1
Limits
Copper (Cu)
Figure 8-4B3: Membership Function of the Copper (Cu) Element
Degree of belief
0.97
0.03
0.69
0.31
3129

Development of an Efficient Planned Maintenance Framework for Marine and Offshore Machinery
206
Very LowLow
AverageHigh Very High
6 12 18 24 30
1
Limits
Sodium (Na)
Figure 9-4B3: Membership Function of the Sodium (Na) Element
Degree of belief
Very LowLow
AverageHigh Very High
1.4 2.8 4.2 5.6 7
1
Limits
Aluminium (Al)
Figure 10-4B3: Membership Function of the Aluminium (Al) Element
Degree of belief
0.860.85
0.71
0.150.14
0.29
3 4 6
Very LowLow
AverageHigh Very High
6 12 18 24 30
1
Limits
Silicon (Si)
Figure 11-4B3: Membership Function of the Silicon (Si) Element
Degree of belief
9
0.5
Very LowLow
AverageHigh Very High
1 2 3 4 5
1
Limits
Vanadium (V)
Figure 12-4B3: Membership Function of the Vanadium (V) Element
Degree of belief
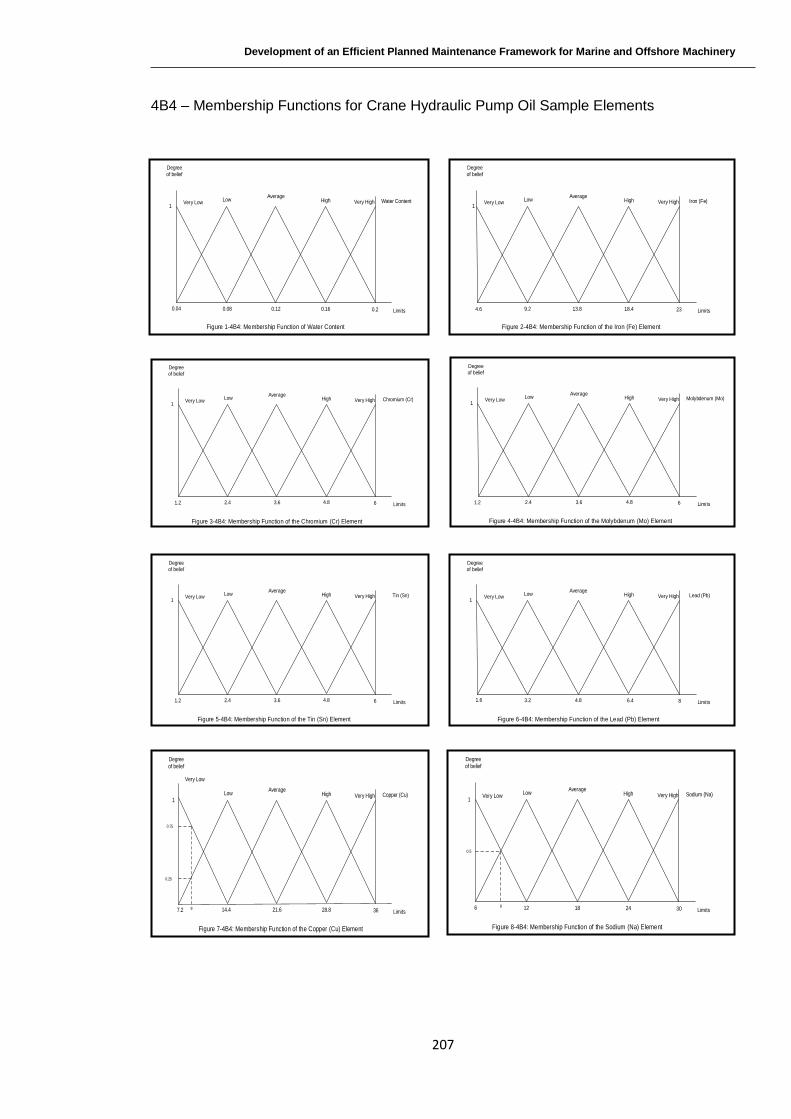
Development of an Efficient Planned Maintenance Framework for Marine and Offshore Machinery
207
4B4 – Membership Functions for Crane Hydraulic Pump Oil Sample Elements
Very LowLow
AverageHigh Very High
0.04 0.08 0.12 0.16 0.2
1
Limits
Water Content
Figure 1-4B4: Membership Function of Water Content
Degree of belief
Very LowLow
AverageHigh Very High
4.6 9.2 13.8 18.4 23
1
Limits
Iron (Fe)
Figure 2-4B4: Membership Function of the Iron (Fe) Element
Degree of belief
Very LowLow
AverageHigh Very High
1.2 2.4 3.6 4.8 6
1
Limits
Chromium (Cr)
Figure 3-4B4: Membership Function of the Chromium (Cr) Element
Degree of belief
Very LowLow
AverageHigh Very High
1.2 2.4 3.6 4.8 6
1
Limits
Molybdenum (Mo)
Figure 4-4B4: Membership Function of the Molybdenum (Mo) Element
Degree of belief
Very LowLow
AverageHigh Very High
1.2 2.4 3.6 4.8 6
1
Limits
Tin (Sn)
Figure 5-4B4: Membership Function of the Tin (Sn) Element
Degree of belief
Very LowLow
AverageHigh Very High
1.6 3.2 4.8 6.4 8
1
Limits
Lead (Pb)
Figure 6-4B4: Membership Function of the Lead (Pb) Element
Degree of belief
Very Low
LowAverage
High Very High
7.2 14.4 21.6 28.8 36
1
Limits
Copper (Cu)
Figure 7-4B4: Membership Function of the Copper (Cu) Element
Degree of belief
0.75
0.25
9
Very LowLow
AverageHigh Very High
6 12 18 24 30
1
Limits
Sodium (Na)
Figure 8-4B4: Membership Function of the Sodium (Na) Element
Degree of belief
9
0.5

Development of an Efficient Planned Maintenance Framework for Marine and Offshore Machinery
208
Very LowLow
AverageHigh Very High
1 2 3 4 5
1
Limits
Vanadium (V)
Figure 11-4B4: Membership Function of the Vanadium (V) Element
Degree of belief
Very LowLow
AverageHigh Very High
1.2 2.4 3.6 4.8 6
1
Limits
Aluminium (Al)
Figure 9-4B4: Membership Function of the Aluminium (Al) Element
Degree of belief
Very LowLow
AverageHigh Very High
6 12 18 24 30
1
Limits
Silicon (Si)
Figure 10-4B4: Membership Function of the Silicon (Si) Element
Degree of belief
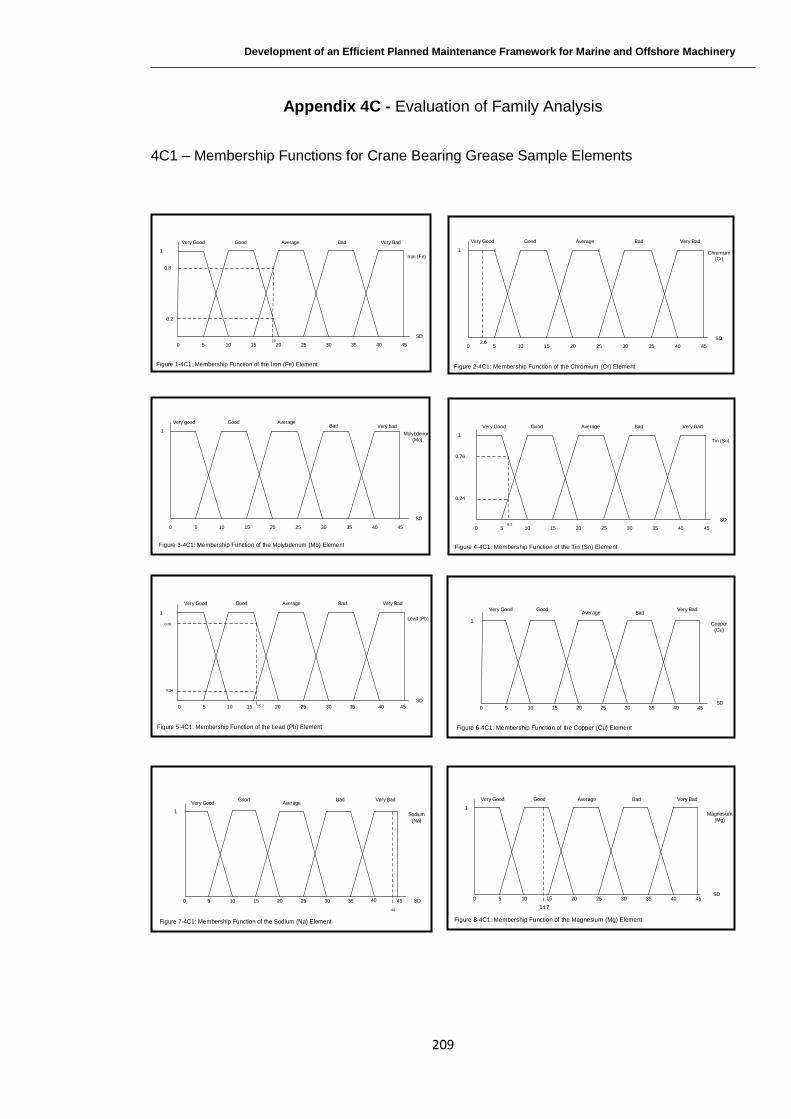
Development of an Efficient Planned Maintenance Framework for Marine and Offshore Machinery
209
Appendix 4C - Evaluation of Family Analysis
4C1 – Membership Functions for Crane Bearing Grease Sample Elements
Very badBadAverageGoodVery good
5 15 25 35 45
1
0
SD
Molybdenum (Mo)
Figure 3-4C1: Membership Function of the Molybdenum (Mo) Element
10 20 30 40
Very BadBadAverageGoodVery Good
5 15 25 35 45
1
0
SD
Lead (Pb)
Figure 5-4C1: Membership Function of the Lead (Pb) Element
10 20 30 40
0.86
0.14
15.7
Very BadBadAverage
GoodVery Good
5 15 25 35 45
1
0 SD
Sodium (Na)
Figure 7-4C1: Membership Function of the Sodium (Na) Element
10 20 30 40
44
Very BadBadAverageGoodVery Good
5 15 25 35 45
1
0
SD
Iron (Fe)
Figure 1-4C1: Membership Function of the Iron (Fe) Element
10 20 30 4019
0.8
0.2
Very BadBadAverageGoodVery Good
5 15 25 35 45
1
0
SD
Chromium (Cr)
Figure 2-4C1: Membership Function of the Chromium (Cr) Element
10 20 30 402.6
Very BadBadAverageGoodVery Good
5 15 25 35 45
1
0
SD
Tin (Sn)
Figure 4-4C1: Membership Function of the Tin (Sn) Element
10 20 30 406.2
0.76
0.24
Very BadBadAverage
GoodVery Good
5 15 25 35 45
1
0SD
Copper (Cu)
Figure 6-4C1: Membership Function of the Copper (Cu) Element
10 20 30 40
Very BadBadAverageGoodVery Good
5 15 25 35 45
1
0SD
Magnesium (Mg)
Figure 8-4C1: Membership Function of the Magnesium (Mg) Element
10 20 30 40
14.7

Development of an Efficient Planned Maintenance Framework for Marine and Offshore Machinery
210
Very BadBadAverageGoodVery Good
5 15 25 35 45
1
0SD
Nickel (Ni)
Figure 9-4C1: Membership Function of the Nickel (Ni) Element
10 20 30 40
28
0.6
0.4
Very Bad Bad Average Good Very Good
5 15 25 35 45
1
0 SD
Silicon ( Si )
Figure 11-4C1: Membership Function of the Silicon (Si) Element
10 20 30 40 24
Very BadBadAverageGoodVery Good
5 15 25 35 45
1
0SD
Aluminium (Al)
Figure 10-4C1: Membership Function of the Aluminium (Al) Element
10 20 30 40

Development of an Efficient Planned Maintenance Framework for Marine and Offshore Machinery
211
4C2 – Membership Functions for Crane Clutch Oil Sample Elements
Very BadBadAverageGood
Very Good
5 15 25 35 45
1
0SD
Iron (Fe)
Figure 1-4C2: Membership Function of the Iron (Fe) Element
10 20 30 402
Very BadBadAverageGoodVery Good
5 15 25 35 45
1
0SD
Figure 2-4C2: Membership Function of Chromium (Cr)Element
10 20 30 40
Chromium (Cr)
Very BadBadAverageGoodVery Good
5 15 25 35 45
1
0SD
Molybdenum (Mo)
Figure 3-4C2: Membership Function of the Molybdenum (Mo) Element
10 20 30 40
Very BadBadAverageGoodVery Good
5 15 25 35 45
1
0SD
Tin (Sn)
Figure 4-4C2: Membership Function of Tin (Sn) Element
10 20 30 401.7
Very BadBadAverageGoodVery Good
5 15 25 35 45
1
0SD
Figure 5-4C2: Membership Function of Lead (Pb) Element
10 20 30 400.6
Lead (Pb)
Very badBadAverageGoodVery good
5 15 25 35 45
1
0
SD
Figure 6-4C2: Membership Function of the Copper (Cu) Element
10 20 30 402.4
Copper (Cu)
Very BadBadAverageGoodVery Good
5 15 25 35 45
1
0 SD
Figure 7-4C2: Membership Function of Magnesium (Mg) Element
10 20 30 403.9
Magnesium (Mg)
Very BadBadAverage
GoodVery Good
5 15 25 35 45
1
0SD
Figure 8-4C2: Membership Function of Aluminium (Al) Element
10 20 30 401
Aluminium
(Al)

Development of an Efficient Planned Maintenance Framework for Marine and Offshore Machinery
212
Very BadBadAverageGoodVery Good
5 15 25 35 45
1
0SD
Silicon (Si)
Figure 9-4C2: Membership Function of Silicon (Si) Element
10 20 30 40
0.8
Very BadBadAverageGoodVery Good
5 15 25 35 45
1
0 SD
Figure 10-4C2: Membership Function of Vanadium and (V) Element
10 20 30 403.7
Vanadium
(V)
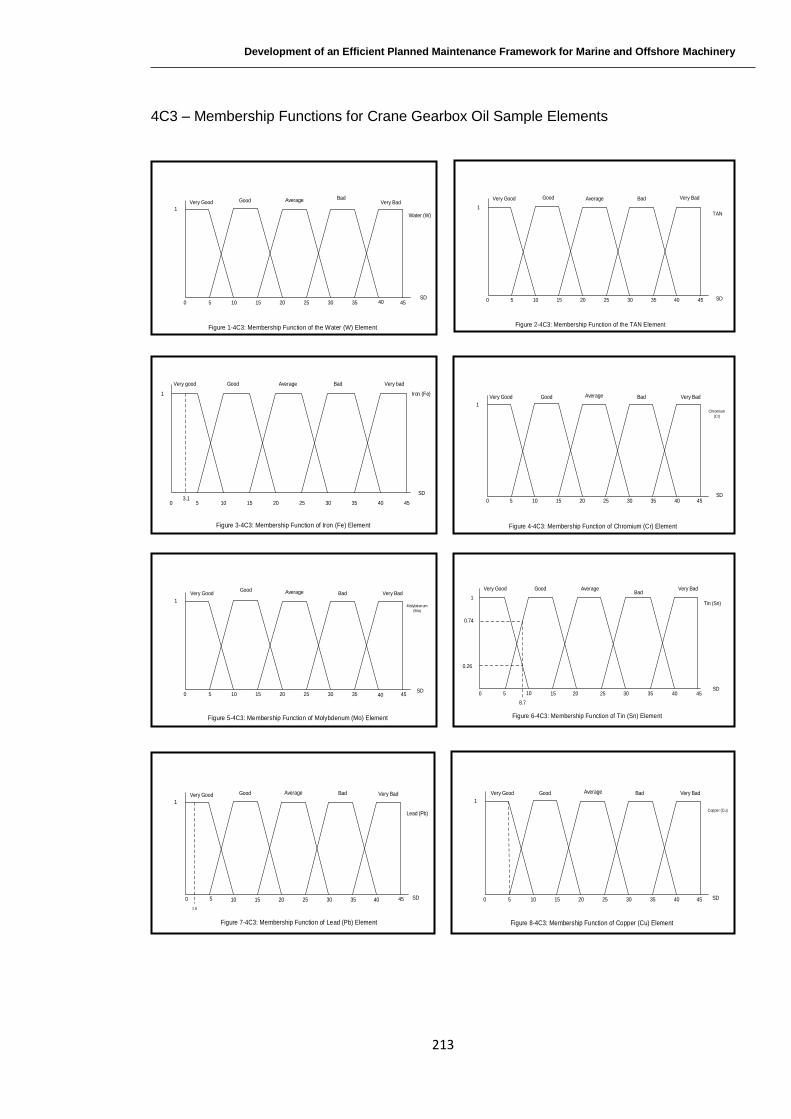
Development of an Efficient Planned Maintenance Framework for Marine and Offshore Machinery
213
4C3 – Membership Functions for Crane Gearbox Oil Sample Elements
Very BadBadAverageGoodVery Good
5 15 25 35 45
1
0 SD
Figure 7-4C3: Membership Function of Lead (Pb) Element
10 20 30 40
1.6
Lead (Pb)
Very BadBadAverageGoodVery Good
5 15 25 35 45
1
0SD
Water (W)
Figure 1-4C3: Membership Function of the Water (W) Element
10 20 30 40
Very BadBadAverageGoodVery Good
5 15 25 35 45
1
0 SD
TAN
Figure 2-4C3: Membership Function of the TAN Element
10 20 30 40
Very badBadAverageGoodVery good
5 15 25 35 45
1
0
SD
Figure 3-4C3: Membership Function of Iron (Fe) Element
10 20 30 403.1
Iron (Fe)Very BadBadAverageGoodVery Good
5 15 25 35 45
1
0SD
Figure 4-4C3: Membership Function of Chromium (Cr) Element
10 20 30 40
Chromium
(Cr)
Very BadBadAverageGoodVery Good
5 15 25 35 45
1
0SD
Figure 5-4C3: Membership Function of Molybdenum (Mo) Element
10 20 30 40
Molybdenum
(Mo)
Very BadBad
AverageGoodVery Good
5 15 25 35 45
1
0SD
Figure 6-4C3: Membership Function of Tin (Sn) Element
10 20 30 40
8.7
0.74
0.26
Tin (Sn)
Very BadBadAverageGoodVery Good
5 15 25 35 45
1
0 SD
Figure 8-4C3: Membership Function of Copper (Cu) Element
10 20 30 40
Copper (Cu)

Development of an Efficient Planned Maintenance Framework for Marine and Offshore Machinery
214
Very BadBadAverageGoodVery Good
5 15 25 35 45
1
0 SD
Figure 9-4C3: Membership Function of Sodium (Na) Element
10 20 30 40
1.9
Sodium (Na)
Very BadBadAverageGoodVery Good
5 15 25 35 45
1
0SD
Figure 10-4C3: Membership Function of Magnesium (Mg) Element
10 20 30 400.5
Magnesium
(Mg)
Very BadBadAverageGood
Very Good
5 15 25 35 45
1
0 SD
Figure 11-4C3: Membership Function of Boron (B) Element
10 20 30 40
1.2
Boron (B)
Very BadBadAverageGood
Very Good
5 15 25 35 45
1
0SD
Figure 12-4C3: Membership Function of Aluminium (Al) Element
10 20 30 403.1
Aluminium
(Al)
Very BadBadAverageGoodVery Good
5 15 25 35 45
1
0SD
Silicon (Si)
Figure 13-4C3: Membership Function of Silicon (Si) Element
10 20 30 40
4.2
Very BadBadAverageGoodVery Good
5 15 25 35 45
1
0SD
Figure 14-4C3: Membership Function of Vanadium (V) Element
10 20 30 40
Vanadium (V)

Development of an Efficient Planned Maintenance Framework for Marine and Offshore Machinery
215
4C4 – Membership Functions for Crane Hydraulic Pump Oil Sample Elements
Very BadBadAverageGoodVery Good
5 15 25 35 45
1
0 SD
Figure 1-4C4: Membership Function of Water (W) Element
10 20 30 40
Water (W)
Very BadBadAverageGoodVery Good
5 15 25 35 45
1
0 SD
Figure 2-4C4: Membership Function of TAN Element
10 20 30 40
TAN
Very BadBadAverageGoodVery Good
5 15 25 35 45
1
0SD
Figure 3-4C4: Membership Function of Iron (Fe) Element
10 20 30 40
0.4
Iron (Fe)
Very BadBadAverageGoodVery Good
5 15 25 35 45
1
0 SD
Figure 4-4C4: Membership Function of Chromium (Cr) Element
10 20 30 40
Chromium
(Cr)
Very BadBadAverageGoodVery Good
5 15 25 35 45
1
0 SD
Figure 5-4C4: Membership Function of Molybdenum (Mo) Element
10 20 30 40
Molybdenum
(Mo)
Very BadBadAverageGoodVery Good
5 15 25 35 45
1
0 SD
Figure 6-4C4: Membership Function of Tin (Sn) Element
10 20 30 40
Tin (Sn)
Very BadBadAverageGoodVery Good
5 15 25 35 45
1
0 SD
Figure 7-4C4: Membership Function of Lead (Pb) Element
10 20 30 40
Lead (Pb)
Very badBadAverageGoodVery good
5 15 25 35 45
1
0
SD
Copper (Cu)
Figure 8-4C4: Membership Function of the Copper (Cu) Element
10 20 30 403.8

Development of an Efficient Planned Maintenance Framework for Marine and Offshore Machinery
216
Very BadBadAverageGoodVery Good
5 15 25 35 45
1
0SD
Figure 9-4C4: Membership Function of Sodium (Na) Element
10 20 30 40
4
Sodium (Na)
Very BadBadAverageGoodVery Good
5 15 25 35 45
1
0 SD
Figure 10-4C4: Membership Function of Magnesium (Mg) Element
10 20 30 40
Magnesium
(Mg)
Very BadBadAverageGoodVery Good
5 15 25 35 45
1
0SD
Figure 11-4C4: Membership Function of Boron (B) Element
10 20 30 400.5
Boron (B)
Very BadBadAverageGoodVery Good
5 15 25 35 45
1
0 SD
Figure 12-4C4: Membership Function of Aluminium (Al) Element
10 20 30 40
Aluminium
(Al)
Very BadBadAverageGoodVery Good
5 15 25 35 45
1
0 SD
Figure 13-4C4: Membership Function of Silicon (Si) Element
10 20 30 40
Silicon (Si)
Very BadBadAverageGoodVery Good
5 15 25 35 45
1
0 SD
Figure 14-4C4: Membership Function of Vanadium (V) Element
10 20 30 40
Vanadium
(V)

Development of an Efficient Planned Maintenance Framework for Marine and Offshore Machinery
217
Appendix 4D - Aggregation of Sub-Criteria
Table 1 – 4D: Aggregation of Sub-Criteria for Crane Bearing Sample 1
Sub-Criteria Fuzzy Set
E1 , TA1, FAB, HR, DA {(0.1914, Very Bad), (0.0449, Bad), (0.0761, Average), (0.1693, Good), (0.5183, Very Good)}
E2 , TA1, FAB, HR, DA {(0.1977, Very Bad), (0.0463, Bad), (0.0787, Average), (0.3266, Good), (0.3507, Very Good)}
E3 , TA1, FAB, HR, DA {(0.2014, Very Bad), (0.0472, Bad), (0.2162, Average), (0.1781, Good), (0.3572, Very Good)}
E4 , TA1, FAB, HR, DA {(0.2026, Very Bad), (0.1782, Bad), (0.0806, Average), (0.1792, Good), (0.3594, Very Good)}
E5 , TA1, FAB, HR, DA {(0.3522, Very Bad), (0.0461, Bad), (0.0783, Average), (0.1742, Good), (0.3492, Very Good)}
Aggregation result (main criteria) B1
{(0.2251, Very Bad), (0.0658, Bad), (0.0978, Average), (0.1996, Good), (0.4117, Very Good)}
Table 2 – 4D: Aggregation of Sub-Criteria for Crane Clutch Sample 1
Sub-Criteria Fuzzy Set
E1 , TA1, FAC, HR, DA {(0.0053, Very Bad), (0.0063, Bad), (0.0140, Average), (0.1685, Good), (0.8060, Very Good)}
E2 , TA1, FAC, HR, DA {(0.0056, Very Bad), (0.0066, Bad), (0.0147, Average), (0.2476, Good), (0.7255, Very Good)}
E3 , TA1, FAC, HR, DA {(0.0057, Very Bad), (0.0067, Bad), (0.0697, Average), (0.1805, Good), (0.7373, Very Good)}
E4 , TA1, FAC, HR, DA {(0.0057, Very Bad), (0.0607, Bad), (0.0150, Average), (0.1806, Good), (0.7379, Very Good)}
E5 , TA1, FAC, HR, DA {(0.0596, Very Bad), (0.0067, Bad), (0.0150, Average), (0.1807, Good), (0.7380, Very Good)}
Aggregation result (main criteria) C1
{(0.0121, Very Bad), (0.0129, Bad), (0.0191, Average), (0.1552, Good), (0.8006, Very Good)}
Table 3 – 4D: Aggregation of Sub-Criteria for Crane Gearbox Sample 1
Sub-Criteria Fuzzy Set
E1 , TA1, FAG, HR, DA {(0.1569, Very Bad), (0.0338, Bad), (0.0118, Average), (0.1582, Good), (0.6392, Very Good)}
E2 , TA1, FAG, HR, DA {(0.1636, Very Bad), (0.0352, Bad), (0.0123, Average), (0.2430, Good), (0.5458, Very Good)}
E3 , TA1, FAG, HR, DA {(0.1664, Very Bad), (0.0359, Bad), (0.0748, Average), (0.1677, Good), (0.5552, Very Good)}
E4 , TA1, FAG, HR, DA {(0.1660, Very Bad), (0.1005, Bad), (0.0125, Average), (0.1673, Good), (0.5538, Very Good)}
E5 , TA1, FAG, HR, DA {(0.2416, Very Bad), (0.0353, Bad), (0.0123, Average), (0.1649, Good), (0.5459, Very Good)}
Aggregation result (main criteria) G1
{(0.1602, Very Bad), (0.0403, Bad), (0.0205, Average), (0.1615, Good), (0.6175, Very Good)}
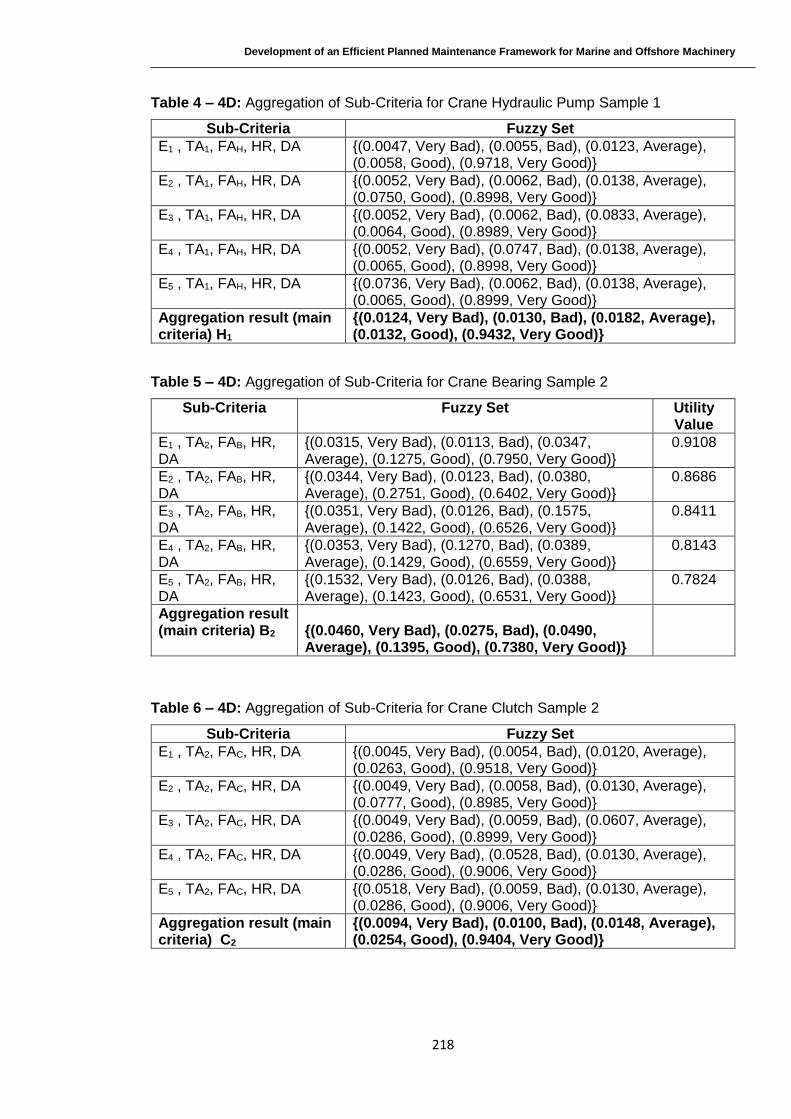
Development of an Efficient Planned Maintenance Framework for Marine and Offshore Machinery
218
Table 4 – 4D: Aggregation of Sub-Criteria for Crane Hydraulic Pump Sample 1
Sub-Criteria Fuzzy Set
E1 , TA1, FAH, HR, DA {(0.0047, Very Bad), (0.0055, Bad), (0.0123, Average), (0.0058, Good), (0.9718, Very Good)}
E2 , TA1, FAH, HR, DA {(0.0052, Very Bad), (0.0062, Bad), (0.0138, Average), (0.0750, Good), (0.8998, Very Good)}
E3 , TA1, FAH, HR, DA {(0.0052, Very Bad), (0.0062, Bad), (0.0833, Average), (0.0064, Good), (0.8989, Very Good)}
E4 , TA1, FAH, HR, DA {(0.0052, Very Bad), (0.0747, Bad), (0.0138, Average), (0.0065, Good), (0.8998, Very Good)}
E5 , TA1, FAH, HR, DA {(0.0736, Very Bad), (0.0062, Bad), (0.0138, Average), (0.0065, Good), (0.8999, Very Good)}
Aggregation result (main criteria) H1
{(0.0124, Very Bad), (0.0130, Bad), (0.0182, Average), (0.0132, Good), (0.9432, Very Good)}
Table 5 – 4D: Aggregation of Sub-Criteria for Crane Bearing Sample 2
Sub-Criteria Fuzzy Set Utility Value
E1 , TA2, FAB, HR, DA
{(0.0315, Very Bad), (0.0113, Bad), (0.0347, Average), (0.1275, Good), (0.7950, Very Good)}
0.9108
E2 , TA2, FAB, HR, DA
{(0.0344, Very Bad), (0.0123, Bad), (0.0380, Average), (0.2751, Good), (0.6402, Very Good)}
0.8686
E3 , TA2, FAB, HR, DA
{(0.0351, Very Bad), (0.0126, Bad), (0.1575, Average), (0.1422, Good), (0.6526, Very Good)}
0.8411
E4 , TA2, FAB, HR, DA
{(0.0353, Very Bad), (0.1270, Bad), (0.0389, Average), (0.1429, Good), (0.6559, Very Good)}
0.8143
E5 , TA2, FAB, HR, DA
{(0.1532, Very Bad), (0.0126, Bad), (0.0388, Average), (0.1423, Good), (0.6531, Very Good)}
0.7824
Aggregation result (main criteria) B2
{(0.0460, Very Bad), (0.0275, Bad), (0.0490, Average), (0.1395, Good), (0.7380, Very Good)}
Table 6 – 4D: Aggregation of Sub-Criteria for Crane Clutch Sample 2
Sub-Criteria Fuzzy Set
E1 , TA2, FAC, HR, DA {(0.0045, Very Bad), (0.0054, Bad), (0.0120, Average), (0.0263, Good), (0.9518, Very Good)}
E2 , TA2, FAC, HR, DA {(0.0049, Very Bad), (0.0058, Bad), (0.0130, Average), (0.0777, Good), (0.8985, Very Good)}
E3 , TA2, FAC, HR, DA {(0.0049, Very Bad), (0.0059, Bad), (0.0607, Average), (0.0286, Good), (0.8999, Very Good)}
E4 , TA2, FAC, HR, DA {(0.0049, Very Bad), (0.0528, Bad), (0.0130, Average), (0.0286, Good), (0.9006, Very Good)}
E5 , TA2, FAC, HR, DA {(0.0518, Very Bad), (0.0059, Bad), (0.0130, Average), (0.0286, Good), (0.9006, Very Good)}
Aggregation result (main criteria) C2
{(0.0094, Very Bad), (0.0100, Bad), (0.0148, Average), (0.0254, Good), (0.9404, Very Good)}
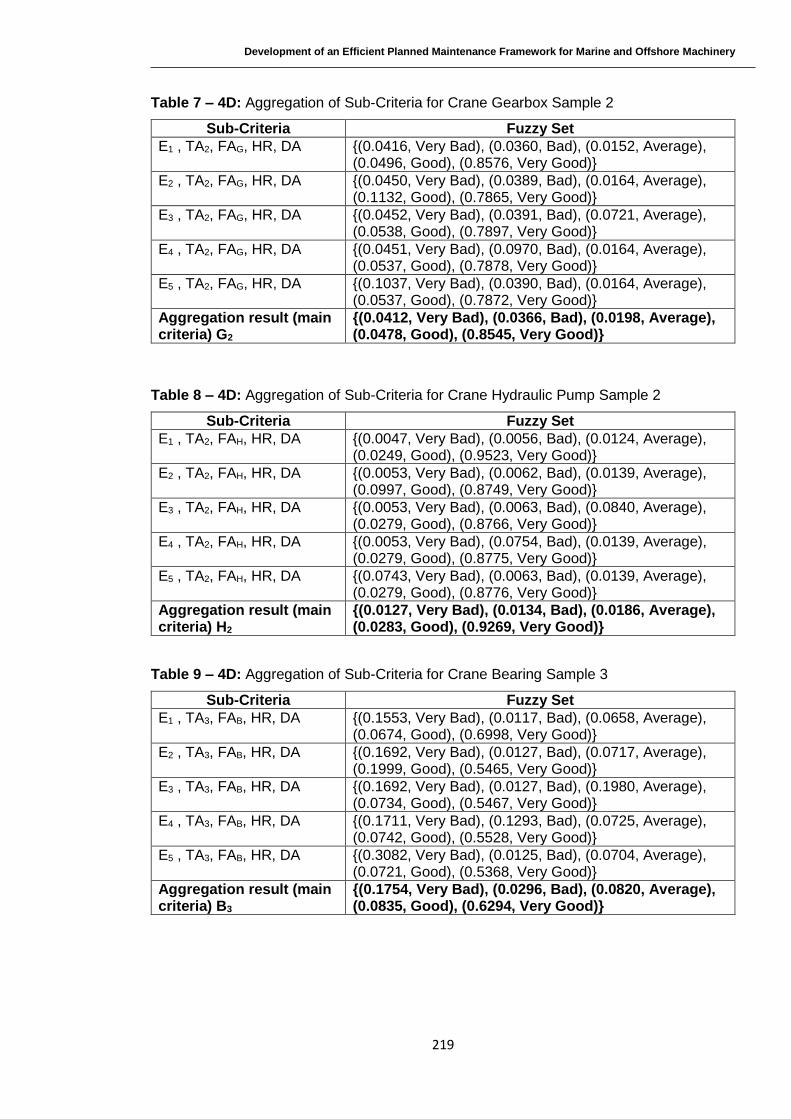
Development of an Efficient Planned Maintenance Framework for Marine and Offshore Machinery
219
Table 7 – 4D: Aggregation of Sub-Criteria for Crane Gearbox Sample 2
Sub-Criteria Fuzzy Set
E1 , TA2, FAG, HR, DA {(0.0416, Very Bad), (0.0360, Bad), (0.0152, Average), (0.0496, Good), (0.8576, Very Good)}
E2 , TA2, FAG, HR, DA {(0.0450, Very Bad), (0.0389, Bad), (0.0164, Average), (0.1132, Good), (0.7865, Very Good)}
E3 , TA2, FAG, HR, DA {(0.0452, Very Bad), (0.0391, Bad), (0.0721, Average), (0.0538, Good), (0.7897, Very Good)}
E4 , TA2, FAG, HR, DA {(0.0451, Very Bad), (0.0970, Bad), (0.0164, Average), (0.0537, Good), (0.7878, Very Good)}
E5 , TA2, FAG, HR, DA {(0.1037, Very Bad), (0.0390, Bad), (0.0164, Average), (0.0537, Good), (0.7872, Very Good)}
Aggregation result (main criteria) G2
{(0.0412, Very Bad), (0.0366, Bad), (0.0198, Average), (0.0478, Good), (0.8545, Very Good)}
Table 8 – 4D: Aggregation of Sub-Criteria for Crane Hydraulic Pump Sample 2
Sub-Criteria Fuzzy Set
E1 , TA2, FAH, HR, DA {(0.0047, Very Bad), (0.0056, Bad), (0.0124, Average), (0.0249, Good), (0.9523, Very Good)}
E2 , TA2, FAH, HR, DA {(0.0053, Very Bad), (0.0062, Bad), (0.0139, Average), (0.0997, Good), (0.8749, Very Good)}
E3 , TA2, FAH, HR, DA {(0.0053, Very Bad), (0.0063, Bad), (0.0840, Average), (0.0279, Good), (0.8766, Very Good)}
E4 , TA2, FAH, HR, DA {(0.0053, Very Bad), (0.0754, Bad), (0.0139, Average), (0.0279, Good), (0.8775, Very Good)}
E5 , TA2, FAH, HR, DA {(0.0743, Very Bad), (0.0063, Bad), (0.0139, Average), (0.0279, Good), (0.8776, Very Good)}
Aggregation result (main criteria) H2
{(0.0127, Very Bad), (0.0134, Bad), (0.0186, Average), (0.0283, Good), (0.9269, Very Good)}
Table 9 – 4D: Aggregation of Sub-Criteria for Crane Bearing Sample 3
Sub-Criteria Fuzzy Set
E1 , TA3, FAB, HR, DA {(0.1553, Very Bad), (0.0117, Bad), (0.0658, Average), (0.0674, Good), (0.6998, Very Good)}
E2 , TA3, FAB, HR, DA {(0.1692, Very Bad), (0.0127, Bad), (0.0717, Average), (0.1999, Good), (0.5465, Very Good)}
E3 , TA3, FAB, HR, DA {(0.1692, Very Bad), (0.0127, Bad), (0.1980, Average), (0.0734, Good), (0.5467, Very Good)}
E4 , TA3, FAB, HR, DA {(0.1711, Very Bad), (0.1293, Bad), (0.0725, Average), (0.0742, Good), (0.5528, Very Good)}
E5 , TA3, FAB, HR, DA {(0.3082, Very Bad), (0.0125, Bad), (0.0704, Average), (0.0721, Good), (0.5368, Very Good)}
Aggregation result (main criteria) B3
{(0.1754, Very Bad), (0.0296, Bad), (0.0820, Average), (0.0835, Good), (0.6294, Very Good)}
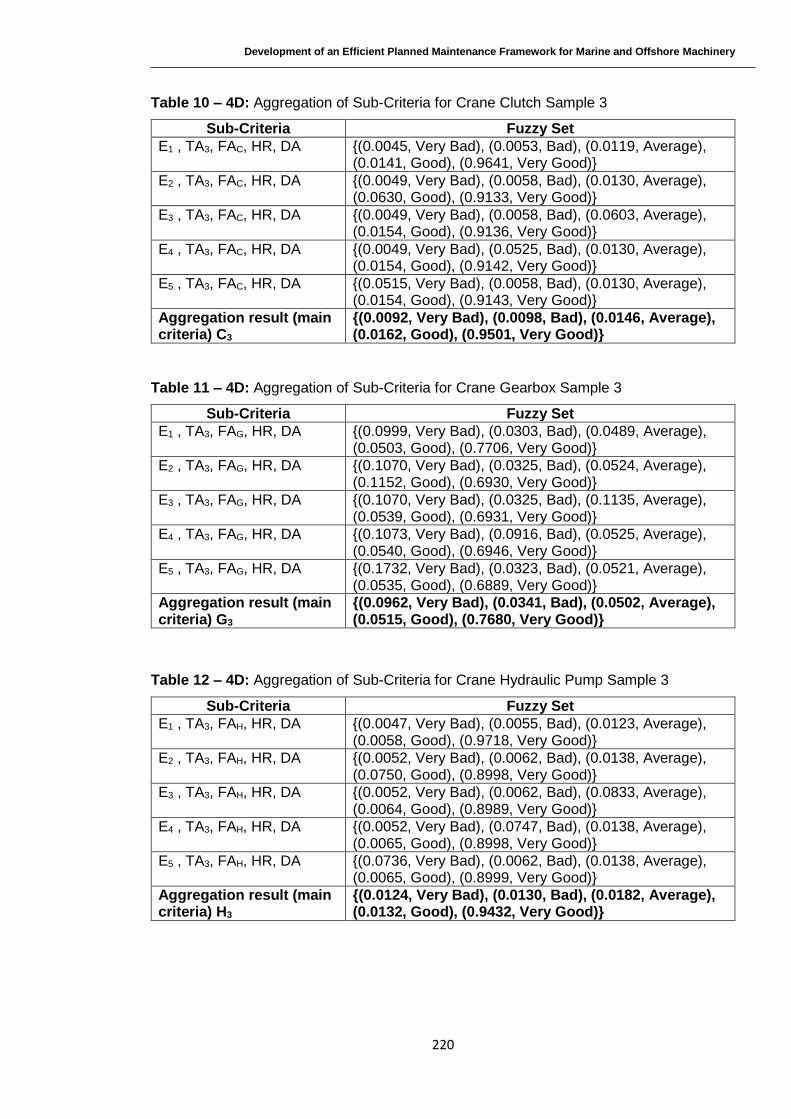
Development of an Efficient Planned Maintenance Framework for Marine and Offshore Machinery
220
Table 10 – 4D: Aggregation of Sub-Criteria for Crane Clutch Sample 3
Sub-Criteria Fuzzy Set
E1 , TA3, FAC, HR, DA {(0.0045, Very Bad), (0.0053, Bad), (0.0119, Average), (0.0141, Good), (0.9641, Very Good)}
E2 , TA3, FAC, HR, DA {(0.0049, Very Bad), (0.0058, Bad), (0.0130, Average), (0.0630, Good), (0.9133, Very Good)}
E3 , TA3, FAC, HR, DA {(0.0049, Very Bad), (0.0058, Bad), (0.0603, Average), (0.0154, Good), (0.9136, Very Good)}
E4 , TA3, FAC, HR, DA {(0.0049, Very Bad), (0.0525, Bad), (0.0130, Average), (0.0154, Good), (0.9142, Very Good)}
E5 , TA3, FAC, HR, DA {(0.0515, Very Bad), (0.0058, Bad), (0.0130, Average), (0.0154, Good), (0.9143, Very Good)}
Aggregation result (main criteria) C3
{(0.0092, Very Bad), (0.0098, Bad), (0.0146, Average), (0.0162, Good), (0.9501, Very Good)}
Table 11 – 4D: Aggregation of Sub-Criteria for Crane Gearbox Sample 3
Sub-Criteria Fuzzy Set
E1 , TA3, FAG, HR, DA {(0.0999, Very Bad), (0.0303, Bad), (0.0489, Average), (0.0503, Good), (0.7706, Very Good)}
E2 , TA3, FAG, HR, DA {(0.1070, Very Bad), (0.0325, Bad), (0.0524, Average), (0.1152, Good), (0.6930, Very Good)}
E3 , TA3, FAG, HR, DA {(0.1070, Very Bad), (0.0325, Bad), (0.1135, Average), (0.0539, Good), (0.6931, Very Good)}
E4 , TA3, FAG, HR, DA {(0.1073, Very Bad), (0.0916, Bad), (0.0525, Average), (0.0540, Good), (0.6946, Very Good)}
E5 , TA3, FAG, HR, DA {(0.1732, Very Bad), (0.0323, Bad), (0.0521, Average), (0.0535, Good), (0.6889, Very Good)}
Aggregation result (main criteria) G3
{(0.0962, Very Bad), (0.0341, Bad), (0.0502, Average), (0.0515, Good), (0.7680, Very Good)}
Table 12 – 4D: Aggregation of Sub-Criteria for Crane Hydraulic Pump Sample 3
Sub-Criteria Fuzzy Set
E1 , TA3, FAH, HR, DA {(0.0047, Very Bad), (0.0055, Bad), (0.0123, Average), (0.0058, Good), (0.9718, Very Good)}
E2 , TA3, FAH, HR, DA {(0.0052, Very Bad), (0.0062, Bad), (0.0138, Average), (0.0750, Good), (0.8998, Very Good)}
E3 , TA3, FAH, HR, DA {(0.0052, Very Bad), (0.0062, Bad), (0.0833, Average), (0.0064, Good), (0.8989, Very Good)}
E4 , TA3, FAH, HR, DA {(0.0052, Very Bad), (0.0747, Bad), (0.0138, Average), (0.0065, Good), (0.8998, Very Good)}
E5 , TA3, FAH, HR, DA {(0.0736, Very Bad), (0.0062, Bad), (0.0138, Average), (0.0065, Good), (0.8999, Very Good)}
Aggregation result (main criteria) H3
{(0.0124, Very Bad), (0.0130, Bad), (0.0182, Average), (0.0132, Good), (0.9432, Very Good)}
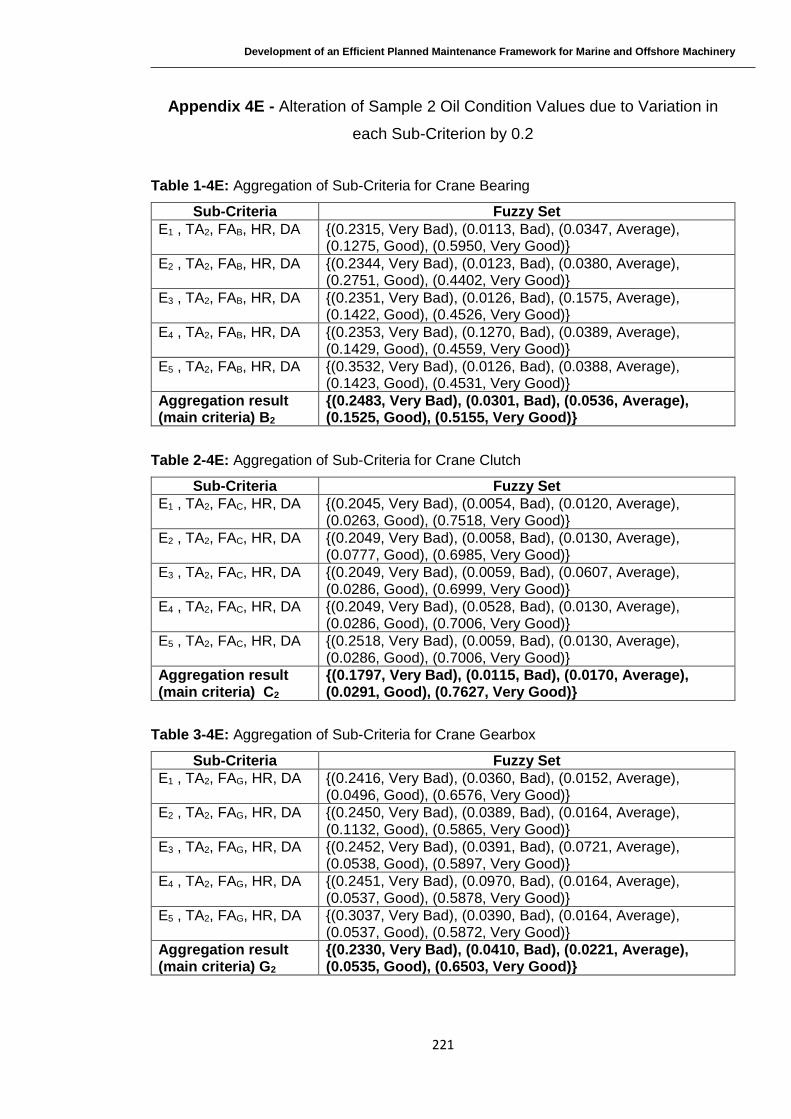
Development of an Efficient Planned Maintenance Framework for Marine and Offshore Machinery
221
Appendix 4E - Alteration of Sample 2 Oil Condition Values due to Variation in
each Sub-Criterion by 0.2
Table 1-4E: Aggregation of Sub-Criteria for Crane Bearing
Sub-Criteria Fuzzy Set
E1 , TA2, FAB, HR, DA {(0.2315, Very Bad), (0.0113, Bad), (0.0347, Average), (0.1275, Good), (0.5950, Very Good)}
E2 , TA2, FAB, HR, DA {(0.2344, Very Bad), (0.0123, Bad), (0.0380, Average), (0.2751, Good), (0.4402, Very Good)}
E3 , TA2, FAB, HR, DA {(0.2351, Very Bad), (0.0126, Bad), (0.1575, Average), (0.1422, Good), (0.4526, Very Good)}
E4 , TA2, FAB, HR, DA {(0.2353, Very Bad), (0.1270, Bad), (0.0389, Average), (0.1429, Good), (0.4559, Very Good)}
E5 , TA2, FAB, HR, DA {(0.3532, Very Bad), (0.0126, Bad), (0.0388, Average), (0.1423, Good), (0.4531, Very Good)}
Aggregation result (main criteria) B2
{(0.2483, Very Bad), (0.0301, Bad), (0.0536, Average), (0.1525, Good), (0.5155, Very Good)}
Table 2-4E: Aggregation of Sub-Criteria for Crane Clutch
Sub-Criteria Fuzzy Set
E1 , TA2, FAC, HR, DA {(0.2045, Very Bad), (0.0054, Bad), (0.0120, Average), (0.0263, Good), (0.7518, Very Good)}
E2 , TA2, FAC, HR, DA {(0.2049, Very Bad), (0.0058, Bad), (0.0130, Average), (0.0777, Good), (0.6985, Very Good)}
E3 , TA2, FAC, HR, DA {(0.2049, Very Bad), (0.0059, Bad), (0.0607, Average), (0.0286, Good), (0.6999, Very Good)}
E4 , TA2, FAC, HR, DA {(0.2049, Very Bad), (0.0528, Bad), (0.0130, Average), (0.0286, Good), (0.7006, Very Good)}
E5 , TA2, FAC, HR, DA {(0.2518, Very Bad), (0.0059, Bad), (0.0130, Average), (0.0286, Good), (0.7006, Very Good)}
Aggregation result (main criteria) C2
{(0.1797, Very Bad), (0.0115, Bad), (0.0170, Average), (0.0291, Good), (0.7627, Very Good)}
Table 3-4E: Aggregation of Sub-Criteria for Crane Gearbox
Sub-Criteria Fuzzy Set
E1 , TA2, FAG, HR, DA {(0.2416, Very Bad), (0.0360, Bad), (0.0152, Average), (0.0496, Good), (0.6576, Very Good)}
E2 , TA2, FAG, HR, DA {(0.2450, Very Bad), (0.0389, Bad), (0.0164, Average), (0.1132, Good), (0.5865, Very Good)}
E3 , TA2, FAG, HR, DA {(0.2452, Very Bad), (0.0391, Bad), (0.0721, Average), (0.0538, Good), (0.5897, Very Good)}
E4 , TA2, FAG, HR, DA {(0.2451, Very Bad), (0.0970, Bad), (0.0164, Average), (0.0537, Good), (0.5878, Very Good)}
E5 , TA2, FAG, HR, DA {(0.3037, Very Bad), (0.0390, Bad), (0.0164, Average), (0.0537, Good), (0.5872, Very Good)}
Aggregation result (main criteria) G2
{(0.2330, Very Bad), (0.0410, Bad), (0.0221, Average), (0.0535, Good), (0.6503, Very Good)}

Development of an Efficient Planned Maintenance Framework for Marine and Offshore Machinery
222
Table 4-4E: Aggregation of Sub-Criteria for Crane Hydraulic Pump
Sub-Criteria Fuzzy Set
E1 , TA2, FAH, HR, DA {(0.2047, Very Bad), (0.0056, Bad), (0.0124, Average), (0.0249, Good), (0.7523, Very Good)}
E2 , TA2, FAH, HR, DA {(0.2053, Very Bad), (0.0062, Bad), (0.0139, Average), (0.0997, Good), (0.6749, Very Good)}
E3 , TA2, FAH, HR, DA {(0.2053, Very Bad), (0.0063, Bad), (0.0840, Average), (0.0279, Good), (0.6766, Very Good)}
E4 , TA2, FAH, HR, DA {(0.2053, Very Bad), (0.0754, Bad), (0.0139, Average), (0.0279, Good), (0.6775, Very Good)}
E5 , TA2, FAH, HR, DA {(0.2743, Very Bad), (0.0063, Bad), (0.0139, Average), (0.0279, Good), (0.6776, Very Good)}
Aggregation result (main criteria) H2
{(0.1863, Very Bad), (0.0153, Bad), (0.0213, Average), (0.0324, Good), (0.7447, Very Good)}
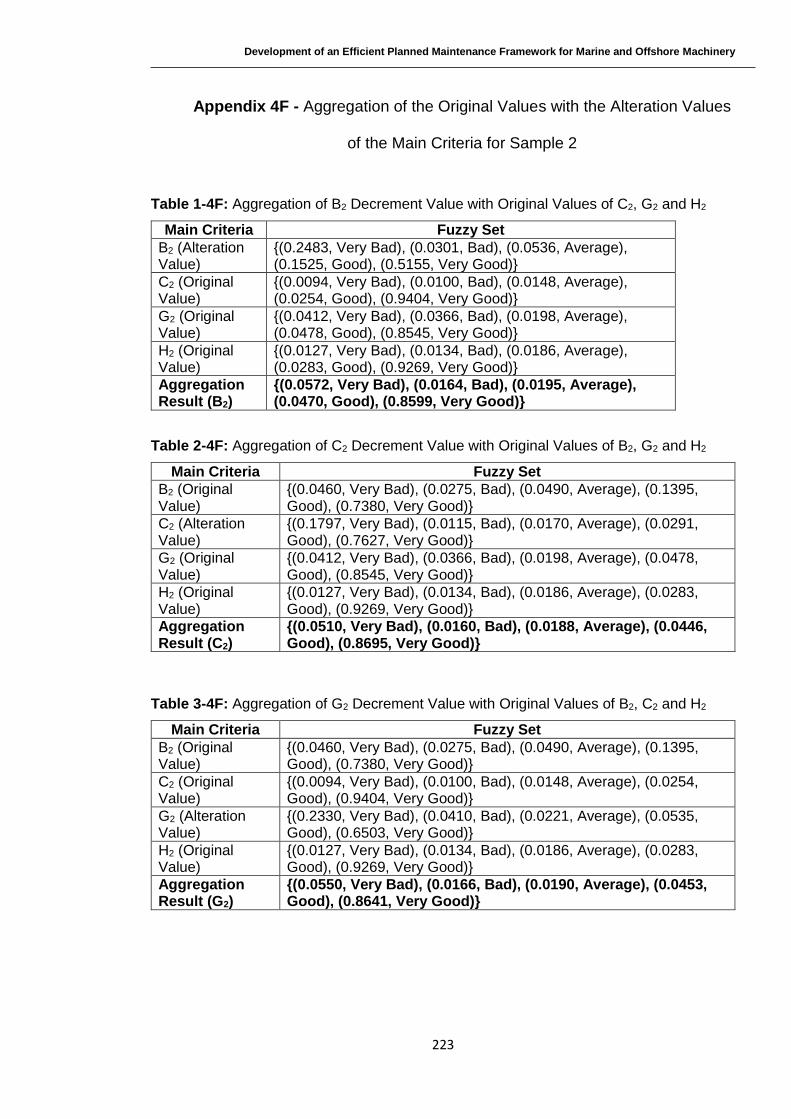
Development of an Efficient Planned Maintenance Framework for Marine and Offshore Machinery
223
Appendix 4F - Aggregation of the Original Values with the Alteration Values
of the Main Criteria for Sample 2
Table 1-4F: Aggregation of B2 Decrement Value with Original Values of C2, G2 and H2
Main Criteria Fuzzy Set
B2 (Alteration Value)
{(0.2483, Very Bad), (0.0301, Bad), (0.0536, Average), (0.1525, Good), (0.5155, Very Good)}
C2 (Original Value)
{(0.0094, Very Bad), (0.0100, Bad), (0.0148, Average), (0.0254, Good), (0.9404, Very Good)}
G2 (Original Value)
{(0.0412, Very Bad), (0.0366, Bad), (0.0198, Average), (0.0478, Good), (0.8545, Very Good)}
H2 (Original Value)
{(0.0127, Very Bad), (0.0134, Bad), (0.0186, Average), (0.0283, Good), (0.9269, Very Good)}
Aggregation Result (B2)
{(0.0572, Very Bad), (0.0164, Bad), (0.0195, Average), (0.0470, Good), (0.8599, Very Good)}
Table 2-4F: Aggregation of C2 Decrement Value with Original Values of B2, G2 and H2
Main Criteria Fuzzy Set
B2 (Original Value)
{(0.0460, Very Bad), (0.0275, Bad), (0.0490, Average), (0.1395, Good), (0.7380, Very Good)}
C2 (Alteration Value)
{(0.1797, Very Bad), (0.0115, Bad), (0.0170, Average), (0.0291, Good), (0.7627, Very Good)}
G2 (Original Value)
{(0.0412, Very Bad), (0.0366, Bad), (0.0198, Average), (0.0478, Good), (0.8545, Very Good)}
H2 (Original Value)
{(0.0127, Very Bad), (0.0134, Bad), (0.0186, Average), (0.0283, Good), (0.9269, Very Good)}
Aggregation Result (C2)
{(0.0510, Very Bad), (0.0160, Bad), (0.0188, Average), (0.0446, Good), (0.8695, Very Good)}
Table 3-4F: Aggregation of G2 Decrement Value with Original Values of B2, C2 and H2
Main Criteria Fuzzy Set
B2 (Original Value)
{(0.0460, Very Bad), (0.0275, Bad), (0.0490, Average), (0.1395, Good), (0.7380, Very Good)}
C2 (Original Value)
{(0.0094, Very Bad), (0.0100, Bad), (0.0148, Average), (0.0254, Good), (0.9404, Very Good)}
G2 (Alteration Value)
{(0.2330, Very Bad), (0.0410, Bad), (0.0221, Average), (0.0535, Good), (0.6503, Very Good)}
H2 (Original Value)
{(0.0127, Very Bad), (0.0134, Bad), (0.0186, Average), (0.0283, Good), (0.9269, Very Good)}
Aggregation Result (G2)
{(0.0550, Very Bad), (0.0166, Bad), (0.0190, Average), (0.0453, Good), (0.8641, Very Good)}

Development of an Efficient Planned Maintenance Framework for Marine and Offshore Machinery
224
Table 4-4F: Aggregation of H2 Decrement Value with Original Values of B2, C2 and G2
Main Criteria Fuzzy Set
B2 (Original Value)
{(0.0460, Very Bad), (0.0275, Bad), (0.0490, Average), (0.1395, Good), (0.7380, Very Good)}
C2 (Original Value)
{(0.0094, Very Bad), (0.0100, Bad), (0.0148, Average), (0.0254, Good), (0.9404, Very Good)}
G2 (Original Value)
{(0.0412, Very Bad), (0.0366, Bad), (0.0198, Average), (0.0478, Good), (0.8545, Very Good)}
H2 (Alteration Value)
{(0.1863, Very Bad), (0.0153, Bad), (0.0213, Average), (0.0324, Good), (0.7447, Very Good)}
Aggregation result (H2)
{(0.0517, Very Bad), (0.0161, Bad), (0.0189, Average), (0.0448, Good), (0.8686, Very Good)}
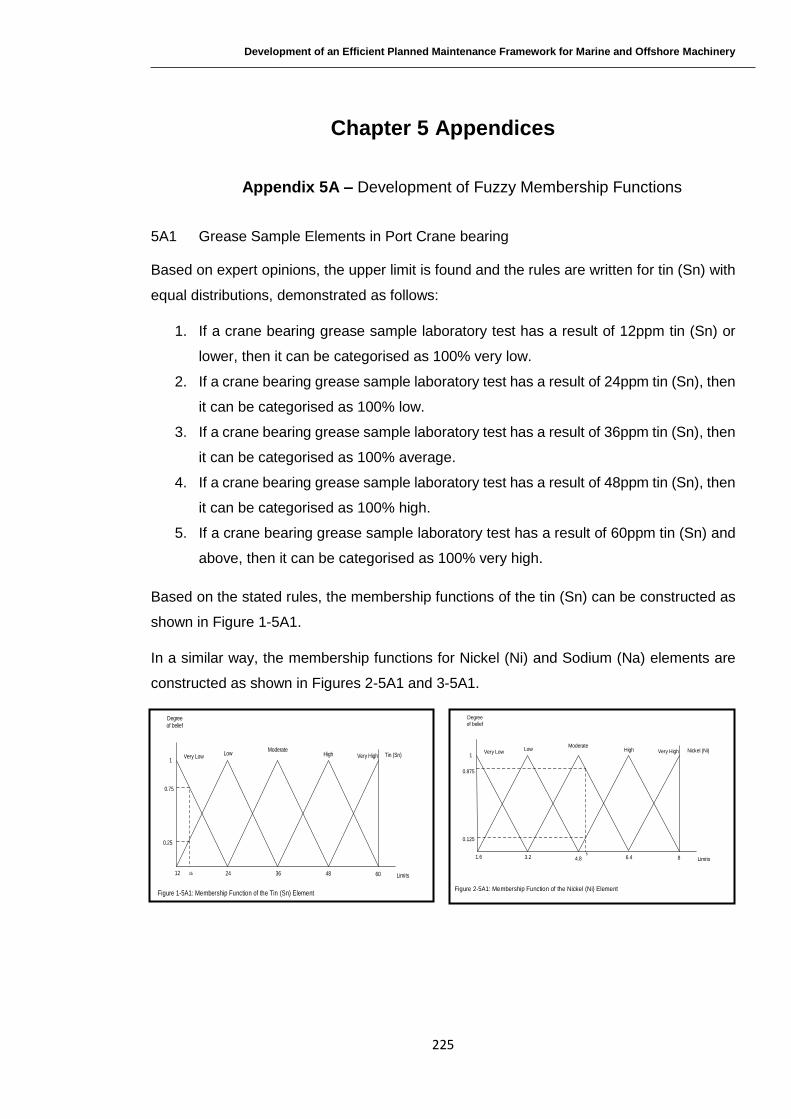
Development of an Efficient Planned Maintenance Framework for Marine and Offshore Machinery
225
Chapter 5 Appendices
Appendix 5A – Development of Fuzzy Membership Functions
5A1 Grease Sample Elements in Port Crane bearing
Based on expert opinions, the upper limit is found and the rules are written for tin (Sn) with
equal distributions, demonstrated as follows:
1. If a crane bearing grease sample laboratory test has a result of 12ppm tin (Sn) or
lower, then it can be categorised as 100% very low.
2. If a crane bearing grease sample laboratory test has a result of 24ppm tin (Sn), then
it can be categorised as 100% low.
3. If a crane bearing grease sample laboratory test has a result of 36ppm tin (Sn), then
it can be categorised as 100% average.
4. If a crane bearing grease sample laboratory test has a result of 48ppm tin (Sn), then
it can be categorised as 100% high.
5. If a crane bearing grease sample laboratory test has a result of 60ppm tin (Sn) and
above, then it can be categorised as 100% very high.
Based on the stated rules, the membership functions of the tin (Sn) can be constructed as
shown in Figure 1-5A1.
In a similar way, the membership functions for Nickel (Ni) and Sodium (Na) elements are
constructed as shown in Figures 2-5A1 and 3-5A1.
Very LowLow
ModerateHigh Very High
12 24 36 48 60
1
Limits
Tin (Sn)
Figure 1-5A1: Membership Function of the Tin (Sn) Element
Degree of belief
0.75
0.25
15
Very LowLow
ModerateHigh Very High
1.6 3.2 4.8 6.4 8
1
Limits
Nickel (Ni)
Figure 2-5A1: Membership Function of the Nickel (Ni) Element
Degree of belief
5
0.875
0.125

Development of an Efficient Planned Maintenance Framework for Marine and Offshore Machinery
226
5A2 Grease Sample Elements in Starboard Crane bearing
Based on the same rules given in 5A1, the membership functions of the Nickel (Ni) and
Sodium (Na) in the grease sample for starboard crane bearing can be constructed as shown
in Figures 2-5A1 and 3-5A1.
5A3 Oil Sample Elements in Port Crane Gearbox
Based on expert opinions, the upper limit is found and the rules are written for tin (Sn) with
equal distributions, and demonstrated as follows:
1. If a crane gearbox oil sample has a laboratory test result of 1.8ppm tin (Sn) or lower,
then it can be categorised as 100% Very Low.
2. If a crane gearbox oil sample has a laboratory test result of 3.6ppm tin (Sn), then it
can be categorised as 100% Low.
3. If a crane gearbox oil sample has a laboratory test result of 5.4ppm tin (Sn), then it
can be categorised as 100% Average.
4. If a crane gearbox oil sample has a laboratory test result of 7.2ppm tin (Sn), then it
can be categorised as 100% High.
5. If a crane gearbox oil sample has a laboratory test result of 9ppm tin (Sn) and above,
then it can be categorised as 100% Very High.
Based on the stated rules, the membership functions of the tin (Sn) can be constructed as
shown in Figure 1-5A3.
Based on expert opinions, the upper limit is found and the rules are written for aluminium
(Al) with equal distributions, demonstrated as follows:
1. If a crane gearbox oil sample has a laboratory test result of 2ppm aluminium (Al) or
lower, then it can be categorised as 100% Very Low.
2. If a crane gearbox oil sample has a laboratory test result of 4ppm aluminium (Al),
then it can be categorised as 100% Low.
Very LowLow
ModerateHigh Very High
40 80 120 160 200
1
Limits
Sodium (Na)
Figure 3-5A1: Membership Function of the Sodium (Na) Element
Degree of belief
0.9
0.1
84
0.7
0.3
108

Development of an Efficient Planned Maintenance Framework for Marine and Offshore Machinery
227
3. If a crane gearbox oil sample has a laboratory test result of 6ppm aluminium (Al),
then it can be categorised as 100% Moderate.
4. If a crane gearbox oil sample has a laboratory test result of 8ppm aluminium (Al),
then it can be categorised as 100% High.
5. If a crane gearbox oil sample has a laboratory test result of 10ppm aluminium (Al)
and above, then it can be categorised as 100% Very High.
Based on the stated rules, the membership functions of the aluminium (Al) can be
constructed as shown in Figure 2-5A3.
5A4 Oil Sample Elements in Starboard Crane Gearbox
Based on the similar rules given for aluminium (Al) in 5A3, the membership functions of
the aluminium (Al) for the oil sample in starboard crane gearbox can also be constructed
as shown in Figure 2-5A3.
Based on expert opinions, the upper limit is found and the rules are written for silicon (Si)
with equal distributions, demonstrated as follows:
1. If a crane gearbox oil sample has a laboratory test result of 8ppm silicon (Si) or
lower, then it can be categorised as 100% Very Low.
2. If a crane gearbox oil sample has a laboratory test result of 16ppm silicon (Si), then
it can be categorised as 100% Low.
3. If a crane gearbox oil sample has a laboratory test result of 24ppm silicon (Si), then
it can be categorised as 100% Average.
4. If a crane gearbox oil sample has a laboratory test result of 32ppm silicon (Si), then
it can be categorised as 100% High.
5. If a crane gearbox oil sample has a laboratory test result of 40ppm silicon (Si) and
above, then it can be categorised as 100% Very High.
Very LowLow
ModerateHigh Very High
1.8 3.6 5.4 7.2 9
1
Limits
Tin (Sn)
Figure 1-5A3: Membership Function of the Tin (Sn) Element
Degree of belief
0.67
0.33
3
Very LowLow
ModerateHigh Very High
2 4 6 8 10
1
Limits
Aluminium (Al)
Figure 2-5A3: Membership Function of the Aluminium (Al) Element
Degree of belief
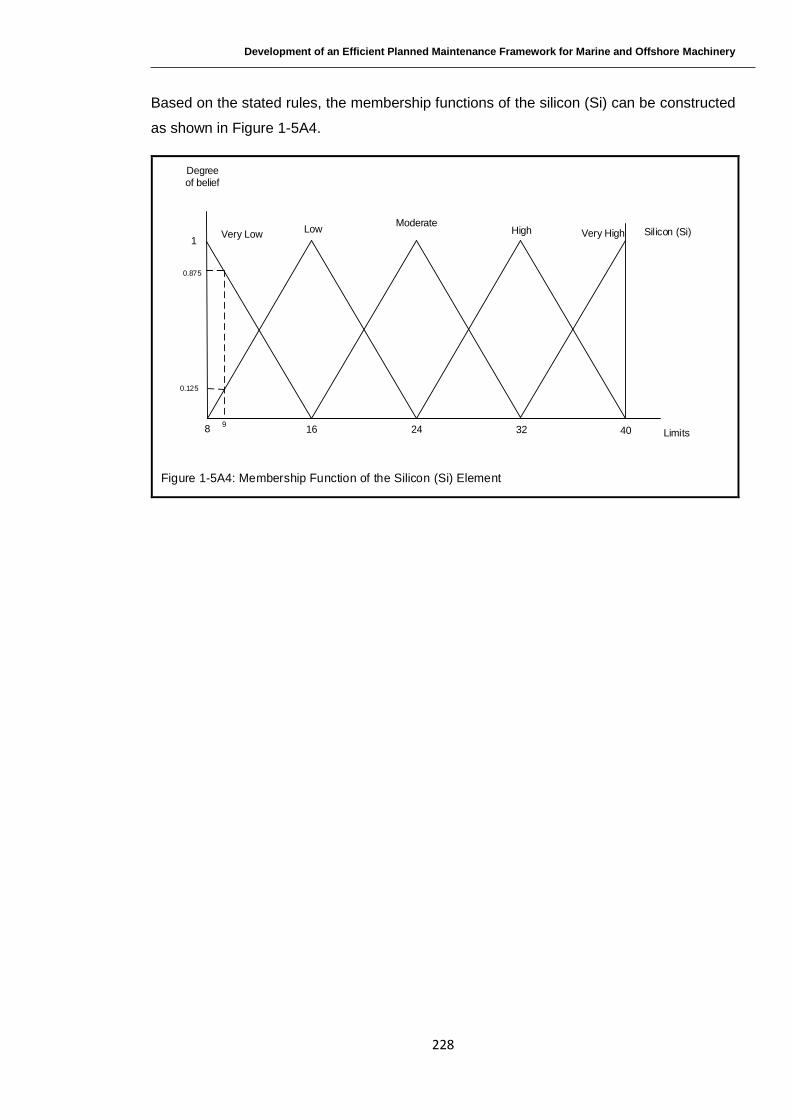
Development of an Efficient Planned Maintenance Framework for Marine and Offshore Machinery
228
Based on the stated rules, the membership functions of the silicon (Si) can be constructed
as shown in Figure 1-5A4.
Very LowLow
ModerateHigh Very High
8 16 24 32 40
1
Limits
Silicon (Si)
Figure 1-5A4: Membership Function of the Silicon (Si) Element
Degree of belief
0.875
0.125
9

Development of an Efficient Planned Maintenance Framework for Marine and Offshore Machinery
229
Appendix 5B - Fuzzy Rule-Based Table for Risk Screening of Crane
Bearing/Gearbox
Table 1-5AB
Rule No.
Element A Sample Test Result
Element B Sample Test Result
Element C Sample Test Result
Priority Level of Attention
1 Very Low Very Low Very Low NORMAL
2 Very Low Very Low Low NORMAL
3 Very Low Very Low Moderate CAUTION
4 Very Low Very Low High ATTENTION
5 Very Low Very Low Very High CRITICAL
6 Very Low Low Very Low NORMAL
7 Very Low Low Low NORMAL
8 Very Low Low Moderate CAUTION
9 Very Low Low High ATTENTION
10 Very Low Low Very High CRITICAL
11 Very Low Moderate Very Low CAUTION
12 Very Low Moderate Low CAUTION
13 Very Low Moderate Moderate CAUTION
14 Very Low Moderate High ATTENTION
15 Very Low Moderate Very High CRITICAL
16 Very Low High Very Low ATTENTION
17 Very Low High Low ATTENTION
18 Very Low High Moderate ATTENTION
19 Very Low High High ATTENTION
20 Very Low High Very High CRITICAL
21 Very Low Very High Very Low CRITICAL
22 Very Low Very High Low CRITICAL
23 Very Low Very High Moderate CRITICAL
24 Very Low Very High High CRITICAL
25 Very Low Very High Very High CRITICAL
26 Low Very Low Very Low NORMAL
27 Low Very Low Low NORMAL
28 Low Very Low Moderate CAUTION
29 Low Very Low High ATTENTION
30 Low Very Low Very High CRITICAL
31 Low Low Very Low NORMAL
32 Low Low Low NORMAL
33 Low Low Moderate CAUTION
34 Low Low High ATTENTION
35 Low Low Very High CRITICAL
36 Low Moderate Very Low CAUTION
37 Low Moderate Low CAUTION
38 Low Moderate Moderate CAUTION
39 Low Moderate High ATTENTION
40 Low Moderate Very High CRITICAL
41 Low High Very Low ATTENTION

Development of an Efficient Planned Maintenance Framework for Marine and Offshore Machinery
230
42 Low High Low ATTENTION
43 Low High Moderate ATTENTION
44 Low High High ATTENTION
45 Low High Very High CRITICAL
46 Low Very High Very Low CRITICAL
47 Low Very High Low CRITICAL
48 Low Very High Moderate CRITICAL
49 Low Very High High CRITICAL
50 Low Very High Very High CRITICAL
51 Moderate Very Low Very Low CAUTION
52 Moderate Very Low Low CAUTION
53 Moderate Very Low Moderate CAUTION
54 Moderate Very Low High ATTENTION
55 Moderate Very Low Very High CRITICAL
56 Moderate Low Very Low ATTENTION
57 Moderate Low Low ATTENTION
58 Moderate Low Moderate ATTENTION
59 Moderate Low High CAUTION
60 Moderate Low Very High CRITICAL
61 Moderate Moderate Very Low CAUTION
62 Moderate Moderate Low CAUTION
63 Moderate Moderate Moderate CAUTION
64 Moderate Moderate High ATTENTION
65 Moderate Moderate Very High CRITICAL
66 Moderate High Very Low ATTENTION
67 Moderate High Low ATTENTION
68 Moderate High Moderate ATTENTION
69 Moderate High High ATTENTION
70 Moderate High Very High CRITICAL
71 Moderate Very High Very Low CRITICAL
72 Moderate Very High Low CRITICAL
73 Moderate Very High Moderate CRITICAL
74 Moderate Very High High CRITICAL
75 Moderate Very High Very High CRITICAL
76 High Very Low Very Low ATTENTION
77 High Very Low Low ATTENTION
78 High Very Low Moderate ATTENTION
79 High Very Low High ATTENTION
80 High Very Low Very High CRITICAL
81 High Low Very Low ATTENTION
82 High Low Low ATTENTION
83 High Low Moderate ATTENTION
84 High Low High ATTENTION
85 High Low Very High CRITICAL
86 High Moderate Very Low ATTENTION
87 High Moderate Low ATTENTION
88 High Moderate Moderate ATTENTION
89 High Moderate High ATTENTION
90 High Moderate Very High CRITICAL
91 High High Very Low ATTENTION
92 High High Low ATTENTION
93 High High Moderate ATTENTION
94 High High High ATTENTION
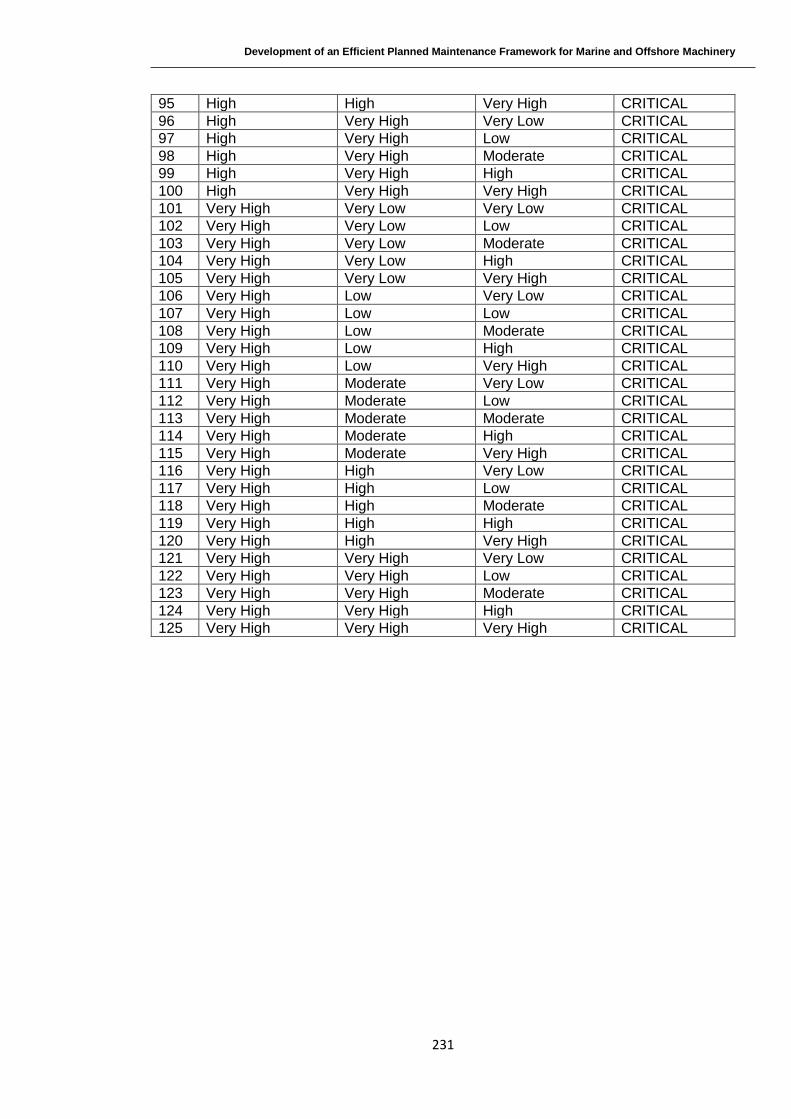
Development of an Efficient Planned Maintenance Framework for Marine and Offshore Machinery
231
95 High High Very High CRITICAL
96 High Very High Very Low CRITICAL
97 High Very High Low CRITICAL
98 High Very High Moderate CRITICAL
99 High Very High High CRITICAL
100 High Very High Very High CRITICAL
101 Very High Very Low Very Low CRITICAL
102 Very High Very Low Low CRITICAL
103 Very High Very Low Moderate CRITICAL
104 Very High Very Low High CRITICAL
105 Very High Very Low Very High CRITICAL
106 Very High Low Very Low CRITICAL
107 Very High Low Low CRITICAL
108 Very High Low Moderate CRITICAL
109 Very High Low High CRITICAL
110 Very High Low Very High CRITICAL
111 Very High Moderate Very Low CRITICAL
112 Very High Moderate Low CRITICAL
113 Very High Moderate Moderate CRITICAL
114 Very High Moderate High CRITICAL
115 Very High Moderate Very High CRITICAL
116 Very High High Very Low CRITICAL
117 Very High High Low CRITICAL
118 Very High High Moderate CRITICAL
119 Very High High High CRITICAL
120 Very High High Very High CRITICAL
121 Very High Very High Very Low CRITICAL
122 Very High Very High Low CRITICAL
123 Very High Very High Moderate CRITICAL
124 Very High Very High High CRITICAL
125 Very High Very High Very High CRITICAL

Development of an Efficient Planned Maintenance Framework for Marine and Offshore Machinery
232
Table 2-5B
Rule No.
Element A Sample Test Result
Element B Sample Test Result
Priority Level of Attention
1 Very Low Very Low NORMAL
2 Very Low Low NORMAL
3 Very Low Moderate CAUTION
4 Very Low High ATTENTION
5 Very Low Very High CRITICAL
6 Low Very Low NORMAL
7 Low Low NORMAL
8 Low Moderate CAUTION
9 Low High ATTENTION
10 Low Very High CRITICAL
11 Moderate Very Low CAUTION
12 Moderate Low CAUTION
13 Moderate Moderate CAUTION
14 Moderate High ATTENTION
15 Moderate Very High CRITICAL
16 High Very Low ATTENTION
17 High Low ATTENTION
18 High Moderate ATTENTION
19 High High ATTENTION
20 High Very High CRITICAL
21 Very High Very Low CRITICAL
22 Very High Low CRITICAL
23 Very High Moderate CRITICAL
24 Very High High CRITICAL
25 Very High Very High CRITICAL

Development of an Efficient Planned Maintenance Framework for Marine and Offshore Machinery
233
Appendix 5C - Risk Level Determination for Decrement by 0.1
5C1 Risk level for port crane bearing grease sample test elements (Decrement of 0.1)
By applying the ‘min-max’ approach, the set of fuzzy conclusions of the port crane bearing
grease sample test element in Table 5.24 of Chapter 5 is obtained as follows:
i. List the membership function values according to the rules developed.
(1) If Sn = Very Low 0.65, Ni = Moderate 0.775, and Na = Low 0.8, then based
on rule 12 in the fuzzy rule based table (Table 1-5B in Appendix 5B), the
priority level is CAUTION.
(2) If Sn = Very Low 0.65, Ni = Moderate 0.775, and Na = Moderate 0.1, then
based on rule 13 in the fuzzy rule based table (Table 1-5B in Appendix 5B),
the priority level is CAUTION.
(3) If Sn = Very Low 0.65, Ni = Moderate 0.775, and Na = Very High 0.1, then
based on rule 15 in the fuzzy rule based table (Table 1-5B in Appendix 5B),
the priority level is CRITICAL.
(4) If Sn = Very Low 0.65, Ni = High 0.125, and Na = Low 0.8, then based on
rule 17 in the fuzzy rule based table (Table 1-5B in Appendix 5B), the priority
level is ATTENTION.
(5) If Sn = Very Low 0.65, Ni = High 0.125, and Na = Moderate 0.1, then based
on rule 18 in the fuzzy rule based table (Table 1-5B in Appendix 5B), the
priority level is ATTENTION.
(6) If Sn = Very Low 0.65, Ni = High 0.125, and Na = Very High 0.1, then based
on rule 20 in the fuzzy rule based table (Table 1-5B in Appendix 5B), the
priority level is CRITICAL.
(7) If Sn = Very Low 0.65, Ni = Very High 0.1, and Na = Low 0.8, then based on
rule 22 in the fuzzy rule based table (Table 1-5B in Appendix 5B), the priority
level is CRITICAL.
(8) If Sn = Very Low 0.65, Ni = Very High 0.1, and Na = Moderate 0.1, then
based on rule 23 in the fuzzy rule based table (Table 1-5B in Appendix 5B),
the priority level is CRITICAL.
(9) If Sn = Very Low 0.65, Ni = Very High 0.1, and Na = Very High 0.1, then
based on rule 25 in the fuzzy rule based table (Table 1-5B in Appendix 5B),
the priority level is CRITICAL.
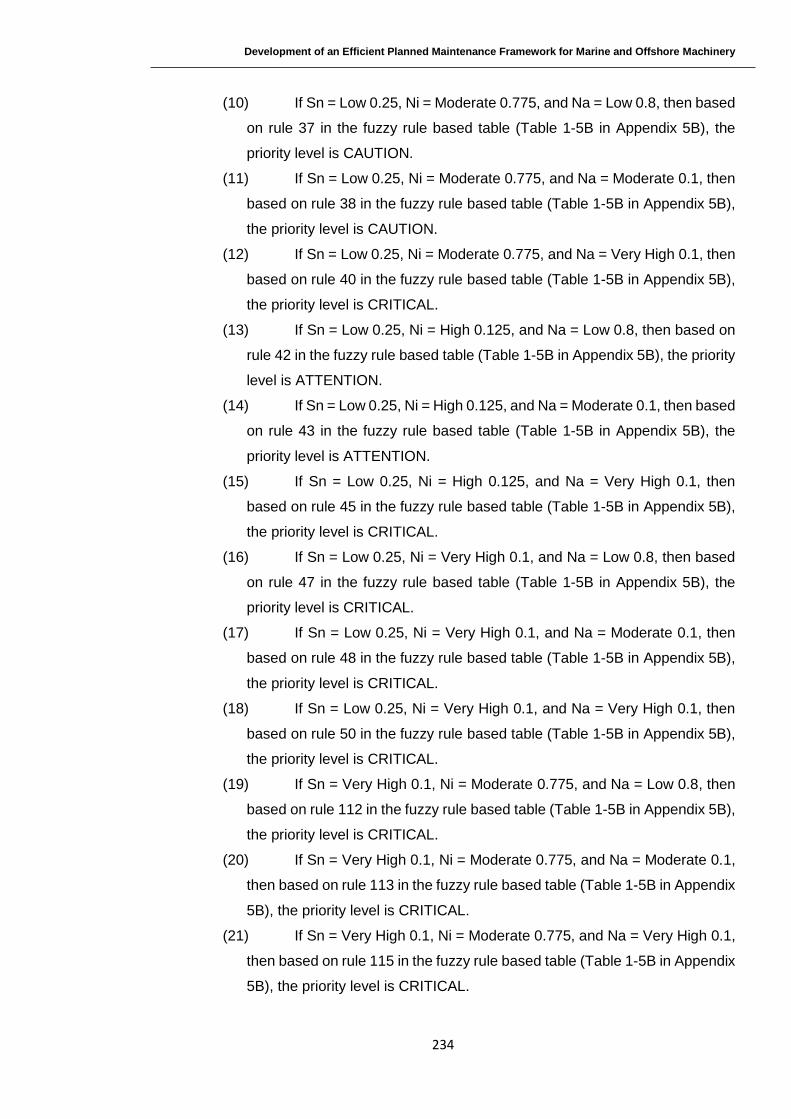
Development of an Efficient Planned Maintenance Framework for Marine and Offshore Machinery
234
(10) If Sn = Low 0.25, Ni = Moderate 0.775, and Na = Low 0.8, then based
on rule 37 in the fuzzy rule based table (Table 1-5B in Appendix 5B), the
priority level is CAUTION.
(11) If Sn = Low 0.25, Ni = Moderate 0.775, and Na = Moderate 0.1, then
based on rule 38 in the fuzzy rule based table (Table 1-5B in Appendix 5B),
the priority level is CAUTION.
(12) If Sn = Low 0.25, Ni = Moderate 0.775, and Na = Very High 0.1, then
based on rule 40 in the fuzzy rule based table (Table 1-5B in Appendix 5B),
the priority level is CRITICAL.
(13) If Sn = Low 0.25, Ni = High 0.125, and Na = Low 0.8, then based on
rule 42 in the fuzzy rule based table (Table 1-5B in Appendix 5B), the priority
level is ATTENTION.
(14) If Sn = Low 0.25, Ni = High 0.125, and Na = Moderate 0.1, then based
on rule 43 in the fuzzy rule based table (Table 1-5B in Appendix 5B), the
priority level is ATTENTION.
(15) If Sn = Low 0.25, Ni = High 0.125, and Na = Very High 0.1, then
based on rule 45 in the fuzzy rule based table (Table 1-5B in Appendix 5B),
the priority level is CRITICAL.
(16) If Sn = Low 0.25, Ni = Very High 0.1, and Na = Low 0.8, then based
on rule 47 in the fuzzy rule based table (Table 1-5B in Appendix 5B), the
priority level is CRITICAL.
(17) If Sn = Low 0.25, Ni = Very High 0.1, and Na = Moderate 0.1, then
based on rule 48 in the fuzzy rule based table (Table 1-5B in Appendix 5B),
the priority level is CRITICAL.
(18) If Sn = Low 0.25, Ni = Very High 0.1, and Na = Very High 0.1, then
based on rule 50 in the fuzzy rule based table (Table 1-5B in Appendix 5B),
the priority level is CRITICAL.
(19) If Sn = Very High 0.1, Ni = Moderate 0.775, and Na = Low 0.8, then
based on rule 112 in the fuzzy rule based table (Table 1-5B in Appendix 5B),
the priority level is CRITICAL.
(20) If Sn = Very High 0.1, Ni = Moderate 0.775, and Na = Moderate 0.1,
then based on rule 113 in the fuzzy rule based table (Table 1-5B in Appendix
5B), the priority level is CRITICAL.
(21) If Sn = Very High 0.1, Ni = Moderate 0.775, and Na = Very High 0.1,
then based on rule 115 in the fuzzy rule based table (Table 1-5B in Appendix
5B), the priority level is CRITICAL.
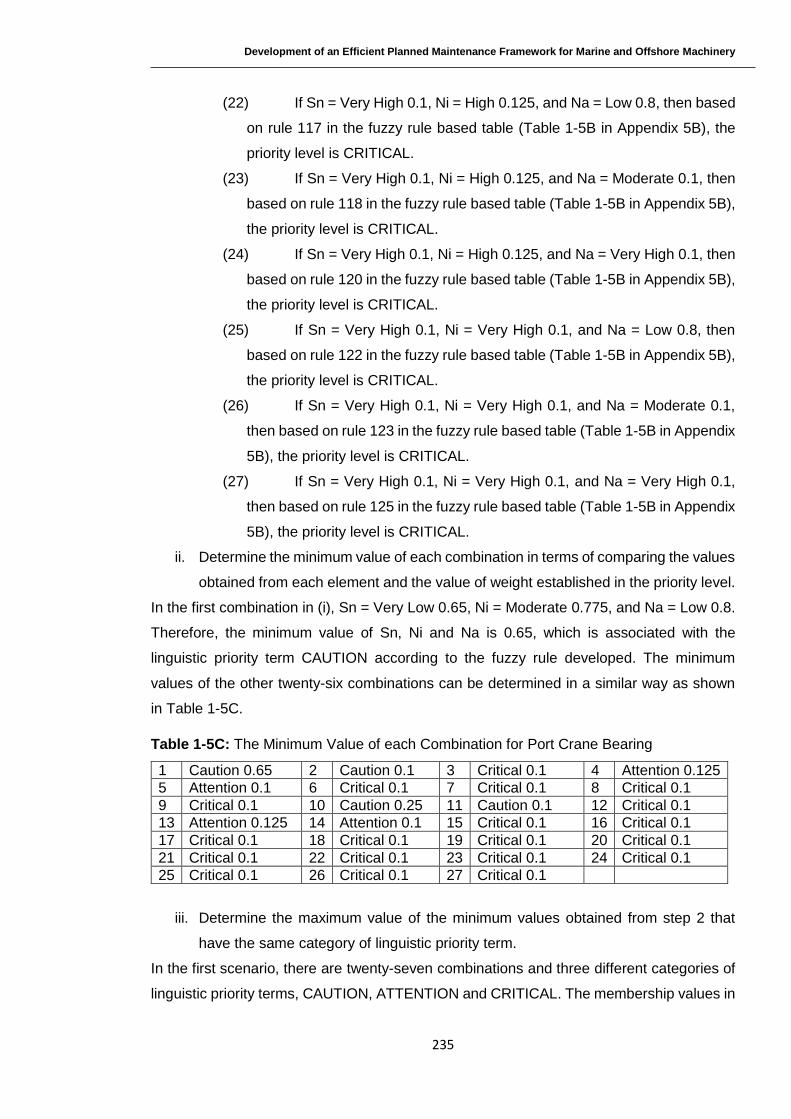
Development of an Efficient Planned Maintenance Framework for Marine and Offshore Machinery
235
(22) If Sn = Very High 0.1, Ni = High 0.125, and Na = Low 0.8, then based
on rule 117 in the fuzzy rule based table (Table 1-5B in Appendix 5B), the
priority level is CRITICAL.
(23) If Sn = Very High 0.1, Ni = High 0.125, and Na = Moderate 0.1, then
based on rule 118 in the fuzzy rule based table (Table 1-5B in Appendix 5B),
the priority level is CRITICAL.
(24) If Sn = Very High 0.1, Ni = High 0.125, and Na = Very High 0.1, then
based on rule 120 in the fuzzy rule based table (Table 1-5B in Appendix 5B),
the priority level is CRITICAL.
(25) If Sn = Very High 0.1, Ni = Very High 0.1, and Na = Low 0.8, then
based on rule 122 in the fuzzy rule based table (Table 1-5B in Appendix 5B),
the priority level is CRITICAL.
(26) If Sn = Very High 0.1, Ni = Very High 0.1, and Na = Moderate 0.1,
then based on rule 123 in the fuzzy rule based table (Table 1-5B in Appendix
5B), the priority level is CRITICAL.
(27) If Sn = Very High 0.1, Ni = Very High 0.1, and Na = Very High 0.1,
then based on rule 125 in the fuzzy rule based table (Table 1-5B in Appendix
5B), the priority level is CRITICAL.
ii. Determine the minimum value of each combination in terms of comparing the values
obtained from each element and the value of weight established in the priority level.
In the first combination in (i), Sn = Very Low 0.65, Ni = Moderate 0.775, and Na = Low 0.8.
Therefore, the minimum value of Sn, Ni and Na is 0.65, which is associated with the
linguistic priority term CAUTION according to the fuzzy rule developed. The minimum
values of the other twenty-six combinations can be determined in a similar way as shown
in Table 1-5C.
Table 1-5C: The Minimum Value of each Combination for Port Crane Bearing
1 Caution 0.65 2 Caution 0.1 3 Critical 0.1 4 Attention 0.125
5 Attention 0.1 6 Critical 0.1 7 Critical 0.1 8 Critical 0.1
9 Critical 0.1 10 Caution 0.25 11 Caution 0.1 12 Critical 0.1
13 Attention 0.125 14 Attention 0.1 15 Critical 0.1 16 Critical 0.1
17 Critical 0.1 18 Critical 0.1 19 Critical 0.1 20 Critical 0.1
21 Critical 0.1 22 Critical 0.1 23 Critical 0.1 24 Critical 0.1
25 Critical 0.1 26 Critical 0.1 27 Critical 0.1
iii. Determine the maximum value of the minimum values obtained from step 2 that
have the same category of linguistic priority term.
In the first scenario, there are twenty-seven combinations and three different categories of
linguistic priority terms, CAUTION, ATTENTION and CRITICAL. The membership values in
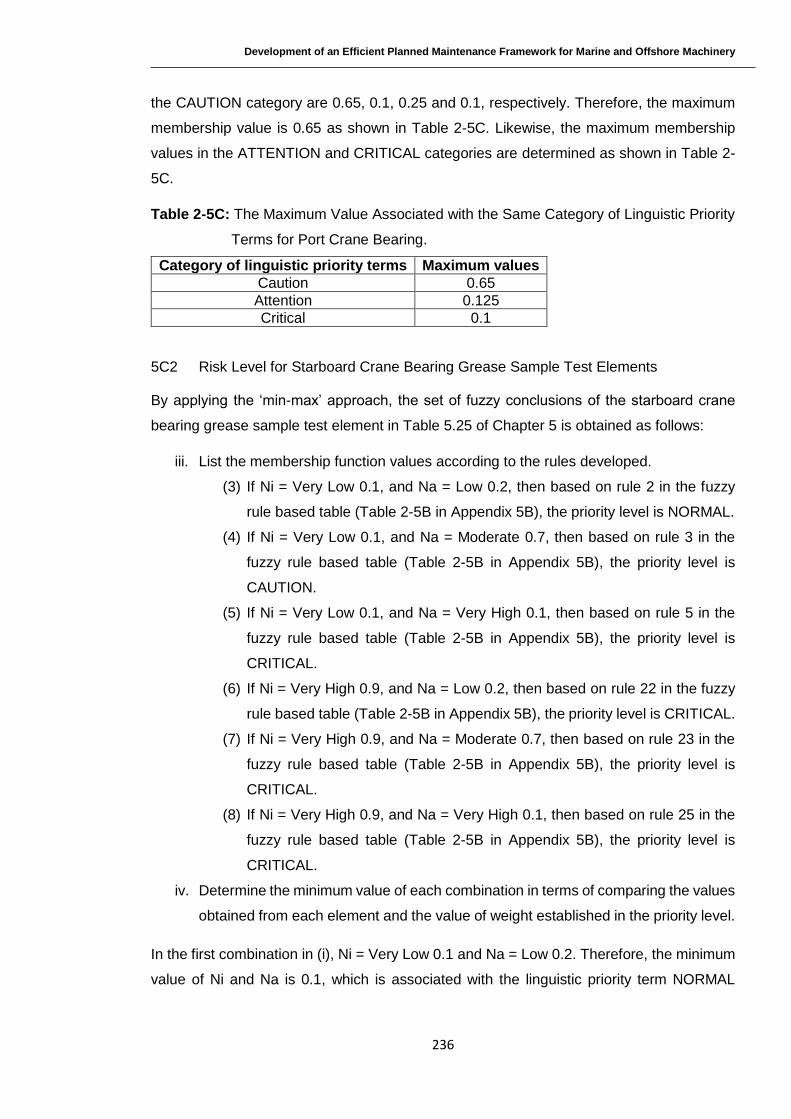
Development of an Efficient Planned Maintenance Framework for Marine and Offshore Machinery
236
the CAUTION category are 0.65, 0.1, 0.25 and 0.1, respectively. Therefore, the maximum
membership value is 0.65 as shown in Table 2-5C. Likewise, the maximum membership
values in the ATTENTION and CRITICAL categories are determined as shown in Table 2-
5C.
Table 2-5C: The Maximum Value Associated with the Same Category of Linguistic Priority
Terms for Port Crane Bearing.
Category of linguistic priority terms Maximum values
Caution 0.65
Attention 0.125
Critical 0.1
5C2 Risk Level for Starboard Crane Bearing Grease Sample Test Elements
By applying the ‘min-max’ approach, the set of fuzzy conclusions of the starboard crane
bearing grease sample test element in Table 5.25 of Chapter 5 is obtained as follows:
iii. List the membership function values according to the rules developed.
(3) If Ni = Very Low 0.1, and Na = Low 0.2, then based on rule 2 in the fuzzy
rule based table (Table 2-5B in Appendix 5B), the priority level is NORMAL.
(4) If Ni = Very Low 0.1, and Na = Moderate 0.7, then based on rule 3 in the
fuzzy rule based table (Table 2-5B in Appendix 5B), the priority level is
CAUTION.
(5) If Ni = Very Low 0.1, and Na = Very High 0.1, then based on rule 5 in the
fuzzy rule based table (Table 2-5B in Appendix 5B), the priority level is
CRITICAL.
(6) If Ni = Very High 0.9, and Na = Low 0.2, then based on rule 22 in the fuzzy
rule based table (Table 2-5B in Appendix 5B), the priority level is CRITICAL.
(7) If Ni = Very High 0.9, and Na = Moderate 0.7, then based on rule 23 in the
fuzzy rule based table (Table 2-5B in Appendix 5B), the priority level is
CRITICAL.
(8) If Ni = Very High 0.9, and Na = Very High 0.1, then based on rule 25 in the
fuzzy rule based table (Table 2-5B in Appendix 5B), the priority level is
CRITICAL.
iv. Determine the minimum value of each combination in terms of comparing the values
obtained from each element and the value of weight established in the priority level.
In the first combination in (i), Ni = Very Low 0.1 and Na = Low 0.2. Therefore, the minimum
value of Ni and Na is 0.1, which is associated with the linguistic priority term NORMAL
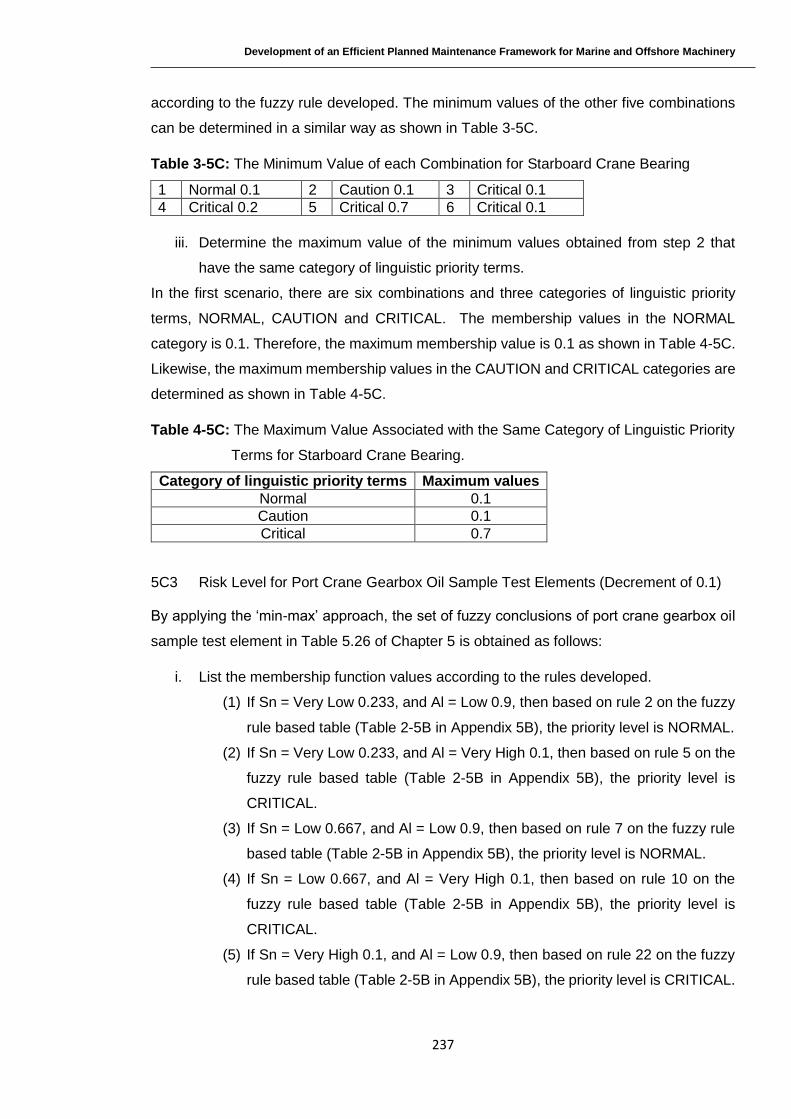
Development of an Efficient Planned Maintenance Framework for Marine and Offshore Machinery
237
according to the fuzzy rule developed. The minimum values of the other five combinations
can be determined in a similar way as shown in Table 3-5C.
Table 3-5C: The Minimum Value of each Combination for Starboard Crane Bearing
1 Normal 0.1 2 Caution 0.1 3 Critical 0.1
4 Critical 0.2 5 Critical 0.7 6 Critical 0.1
iii. Determine the maximum value of the minimum values obtained from step 2 that
have the same category of linguistic priority terms.
In the first scenario, there are six combinations and three categories of linguistic priority
terms, NORMAL, CAUTION and CRITICAL. The membership values in the NORMAL
category is 0.1. Therefore, the maximum membership value is 0.1 as shown in Table 4-5C.
Likewise, the maximum membership values in the CAUTION and CRITICAL categories are
determined as shown in Table 4-5C.
Table 4-5C: The Maximum Value Associated with the Same Category of Linguistic Priority
Terms for Starboard Crane Bearing.
Category of linguistic priority terms Maximum values
Normal 0.1
Caution 0.1
Critical 0.7
5C3 Risk Level for Port Crane Gearbox Oil Sample Test Elements (Decrement of 0.1)
By applying the ‘min-max’ approach, the set of fuzzy conclusions of port crane gearbox oil
sample test element in Table 5.26 of Chapter 5 is obtained as follows:
i. List the membership function values according to the rules developed.
(1) If Sn = Very Low 0.233, and Al = Low 0.9, then based on rule 2 on the fuzzy
rule based table (Table 2-5B in Appendix 5B), the priority level is NORMAL.
(2) If Sn = Very Low 0.233, and Al = Very High 0.1, then based on rule 5 on the
fuzzy rule based table (Table 2-5B in Appendix 5B), the priority level is
CRITICAL.
(3) If Sn = Low 0.667, and Al = Low 0.9, then based on rule 7 on the fuzzy rule
based table (Table 2-5B in Appendix 5B), the priority level is NORMAL.
(4) If Sn = Low 0.667, and Al = Very High 0.1, then based on rule 10 on the
fuzzy rule based table (Table 2-5B in Appendix 5B), the priority level is
CRITICAL.
(5) If Sn = Very High 0.1, and Al = Low 0.9, then based on rule 22 on the fuzzy
rule based table (Table 2-5B in Appendix 5B), the priority level is CRITICAL.

Development of an Efficient Planned Maintenance Framework for Marine and Offshore Machinery
238
(6) If Sn = Very High 0.1, and Al = Very High 0.1, then based on rule 25 on the
fuzzy rule based table (Table 2-5B in Appendix 5B), the priority level is
CRITICAL.
ii. Determine the minimum value of each combination in terms of comparing the values
obtained from each element and the value of weight established in the priority level.
In the first combination in (i), Sn = Very Low 0.233, and Al = Low 0.9. Therefore, the
minimum value of Sn and Al is 0.233, which is associated with the linguistic priority term
NORMAL according to the fuzzy rule developed. The minimum values of the other five
combinations can be determined in a similar way as shown in Table 5-5C.
Table 5-5C: The Minimum Value of each Combination for Port Crane Gearbox
1 Normal 0.233 2 Critical 0.1 3 Normal 0.667
4 Critical 0.1 5 Critical 0.1 6 Critical 0.1
iii. Determine the maximum value of the minimum values obtained from step 2 that
have the same category of linguistic priority term.
In the first scenario, there are six combinations and two categories of linguistic priority terms,
NORMAL and CRITICAL. The membership values in the NORMAL category are 0.233 and
0.667. Therefore, the maximum membership value is 0.667. Likewise, the maximum
membership value in the CRITICAL category is determined as shown in Table 6-5C.
Table 6-5C: The Maximum Value Associated with the Same Category of Linguistic Priority
Terms for Port Crane Gearbox.
Category of linguistic priority terms Maximum values
Normal 0.667
Critical 0.1
5C4 Risk Level for Starboard Crane Gearbox Oil Sample Test Elements (Decrement of 0.1)
By applying the ‘min-max’ approach, the set of fuzzy conclusions of starboard crane
gearbox oil sample test element in Table 5.27 is obtained as follows:
i. List the membership function values according to the rules developed.
(1) If Al = Moderate 0.9, and Si = Very Low 0.775, then based on rule 11 on the
fuzzy rule based table (Table 2-5B in Appendix 5B), the priority level is
CAUTION.
(2) If Al = Moderate 0.9, and Si = Low 0.125, then based on rule 12 on the fuzzy
rule based table (Table 2-5B in Appendix 5B), the priority level is CAUTION.
(3) If Al = Moderate 0.9, and Si = Very High 0.1, then based on rule 15 on the
fuzzy rule based table (Table 2-4A in Appendix 4A), the priority level is
CRITICAL.

Development of an Efficient Planned Maintenance Framework for Marine and Offshore Machinery
239
(4) If Al = Very High 0.1, and Si = Very Low 0.775, then based on rule 21 on the
fuzzy rule based table (Table 2-5B in Appendix 5B), the priority level is
CRITICAL.
(5) If Al = Very High 0.1, and Si = Low 0.125, then based on rule 22 on the fuzzy
rule based table (Table 2-5B in Appendix 5B), the priority level is CRITICAL.
(6) If Al = Very High 0.1, and Si = Very High 0.1, then based on rule 25 on the
fuzzy rule based table (Table 2-5B in Appendix 5B), the priority level is
CRITICAL.
ii. Determine the minimum value of each combination in terms of comparing the values
obtained from each element and the value of weight established in the priority level.
In the first combination in (i), Al = Moderate 0.9, and Si = Very Low 0.775. Therefore, the
minimum value of Al and Si is 0.775, which is associated with the linguistic priority term
CAUTION according to the fuzzy rule developed. The minimum values of the other five
combinations can be determined in a similar way as shown in Table 7-5C.
Table 7-5C: The Minimum Value of each Combination for Starboard Crane Gearbox
1 Caution 0.775 2 Caution 0.125 3 Critical 0.1
4 Critical 0.1 5 Critical 0.1 6 Critical 0.1
iii. Determine the maximum value of the minimum values obtained from step 2 that
have the same category of linguistic priority term.
In the first scenario, there are six combinations and two categories of linguistic priority terms,
CAUTION and CRITICAL. The membership values in the CAUTION category are 0.775 and
0.125. Therefore, the maximum membership value is 0.775. Likewise, the maximum
membership value in the CRITICAL category is determined as shown in Table 8-5C.
Table 8-5C: The Maximum Value Associated with the Same Category of Linguistic Priority
Terms for Starboard Crane Gearbox.
Category of linguistic priority terms Maximum values
Caution 0.775
Critical 0.1

Development of an Efficient Planned Maintenance Framework for Marine and Offshore Machinery
240
Appendix 5D - Risk Level Determination for Decrement by 0.2
5D1 Risk level for port crane bearing grease sample test elements (0.2 decrement)
By applying the ‘min-max’ approach, the set of fuzzy conclusions of the port crane bearing
grease sample test element in Table 5.28 of Chapter 5 is obtained as follows:
i. List the membership function values according to the rules developed.
(1) If Sn = Very Low 0.55, Ni = Moderate 0.675, and Na = Low 0.7, then based
on rule 12 in the fuzzy rule based table (Table 1-5B in Appendix 5B), the
priority level is CAUTION.
(2) If Sn = Very Low 0.55, Ni = Moderate 0.675, and Na = Moderate 0.1, then
based on rule 13 in the fuzzy rule based table (Table 1-5B in Appendix 5B),
the priority level is CAUTION.
(3) If Sn = Very Low 0.55, Ni = Moderate 0.675, and Na = Very High 0.2, then
based on rule 15 in the fuzzy rule based table (Table 1-5B in Appendix 5B),
the priority level is CRITICAL.
(4) If Sn = Very Low 0.55, Ni = High 0.125, and Na = Low 0.7, then based on
rule 17 in the fuzzy rule based table (Table 1-5B in Appendix 5B), the priority
level is ATTENTION.
(5) If Sn = Very Low 0.55, Ni = High 0.125, and Na = Moderate 0.1, then based
on rule 18 in the fuzzy rule based table (Table 1-5B in Appendix 5B), the
priority level is ATTENTION.
(6) If Sn = Very Low 0.55, Ni = High 0.125, and Na = Very High 0.2, then based
on rule 20 in the fuzzy rule based table (Table 1-5B in Appendix 5B), the
priority level is CRITICAL.
(7) If Sn = Very Low 0.55, Ni = Very High 0.2, and Na = Low 0.7, then based on
rule 22 in the fuzzy rule based table (Table 1-5B in Appendix 5B), the priority
level is CRITICAL.
(8) If Sn = Very Low 0.55, Ni = Very High 0.2, and Na = Moderate 0.1, then
based on rule 23 in the fuzzy rule based table (Table 1-5B in Appendix 5B),
the priority level is CRITICAL.
(9) If Sn = Very Low 0.55, Ni = Very High 0.2, and Na = Very High 0.2, then
based on rule 25 in the fuzzy rule based table (Table 1-5B in Appendix 5B),
the priority level is CRITICAL.
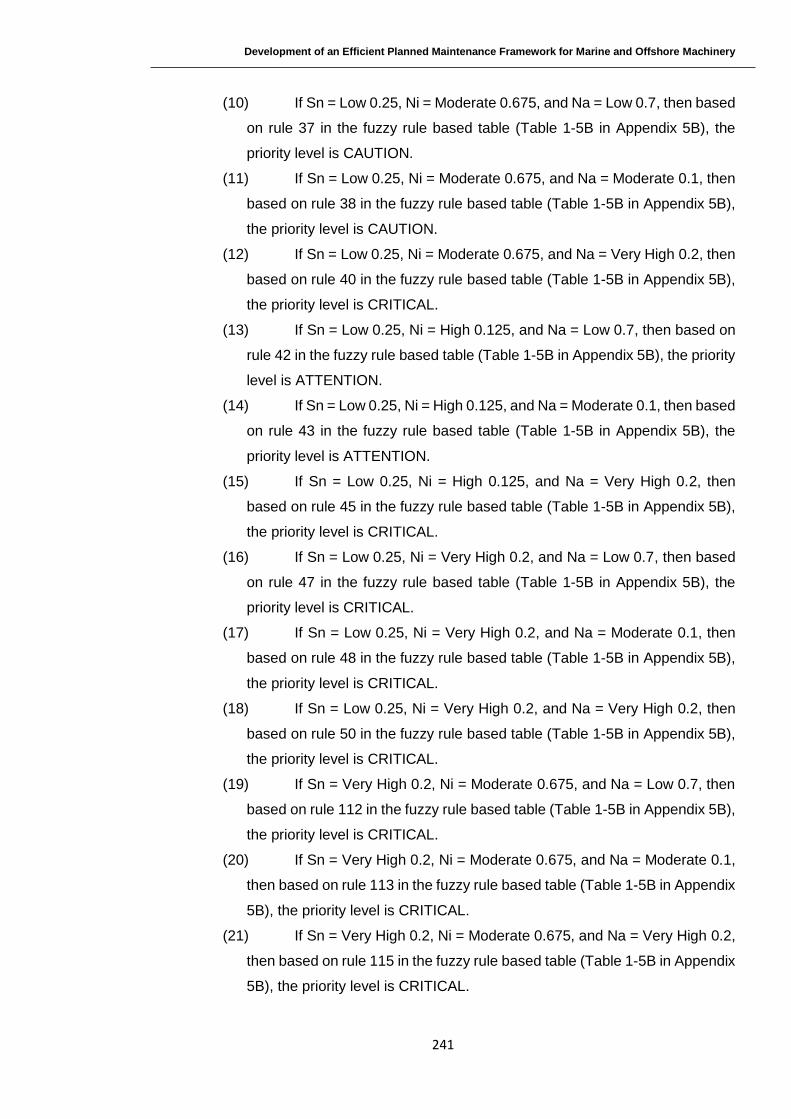
Development of an Efficient Planned Maintenance Framework for Marine and Offshore Machinery
241
(10) If Sn = Low 0.25, Ni = Moderate 0.675, and Na = Low 0.7, then based
on rule 37 in the fuzzy rule based table (Table 1-5B in Appendix 5B), the
priority level is CAUTION.
(11) If Sn = Low 0.25, Ni = Moderate 0.675, and Na = Moderate 0.1, then
based on rule 38 in the fuzzy rule based table (Table 1-5B in Appendix 5B),
the priority level is CAUTION.
(12) If Sn = Low 0.25, Ni = Moderate 0.675, and Na = Very High 0.2, then
based on rule 40 in the fuzzy rule based table (Table 1-5B in Appendix 5B),
the priority level is CRITICAL.
(13) If Sn = Low 0.25, Ni = High 0.125, and Na = Low 0.7, then based on
rule 42 in the fuzzy rule based table (Table 1-5B in Appendix 5B), the priority
level is ATTENTION.
(14) If Sn = Low 0.25, Ni = High 0.125, and Na = Moderate 0.1, then based
on rule 43 in the fuzzy rule based table (Table 1-5B in Appendix 5B), the
priority level is ATTENTION.
(15) If Sn = Low 0.25, Ni = High 0.125, and Na = Very High 0.2, then
based on rule 45 in the fuzzy rule based table (Table 1-5B in Appendix 5B),
the priority level is CRITICAL.
(16) If Sn = Low 0.25, Ni = Very High 0.2, and Na = Low 0.7, then based
on rule 47 in the fuzzy rule based table (Table 1-5B in Appendix 5B), the
priority level is CRITICAL.
(17) If Sn = Low 0.25, Ni = Very High 0.2, and Na = Moderate 0.1, then
based on rule 48 in the fuzzy rule based table (Table 1-5B in Appendix 5B),
the priority level is CRITICAL.
(18) If Sn = Low 0.25, Ni = Very High 0.2, and Na = Very High 0.2, then
based on rule 50 in the fuzzy rule based table (Table 1-5B in Appendix 5B),
the priority level is CRITICAL.
(19) If Sn = Very High 0.2, Ni = Moderate 0.675, and Na = Low 0.7, then
based on rule 112 in the fuzzy rule based table (Table 1-5B in Appendix 5B),
the priority level is CRITICAL.
(20) If Sn = Very High 0.2, Ni = Moderate 0.675, and Na = Moderate 0.1,
then based on rule 113 in the fuzzy rule based table (Table 1-5B in Appendix
5B), the priority level is CRITICAL.
(21) If Sn = Very High 0.2, Ni = Moderate 0.675, and Na = Very High 0.2,
then based on rule 115 in the fuzzy rule based table (Table 1-5B in Appendix
5B), the priority level is CRITICAL.
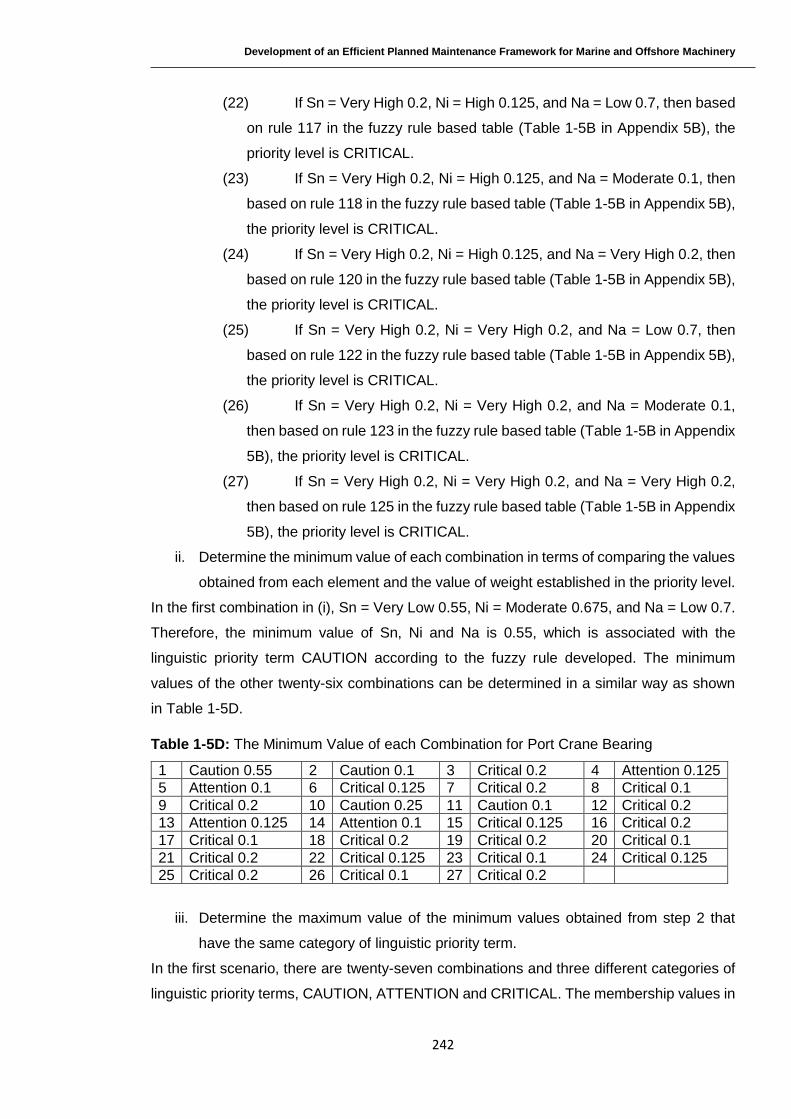
Development of an Efficient Planned Maintenance Framework for Marine and Offshore Machinery
242
(22) If Sn = Very High 0.2, Ni = High 0.125, and Na = Low 0.7, then based
on rule 117 in the fuzzy rule based table (Table 1-5B in Appendix 5B), the
priority level is CRITICAL.
(23) If Sn = Very High 0.2, Ni = High 0.125, and Na = Moderate 0.1, then
based on rule 118 in the fuzzy rule based table (Table 1-5B in Appendix 5B),
the priority level is CRITICAL.
(24) If Sn = Very High 0.2, Ni = High 0.125, and Na = Very High 0.2, then
based on rule 120 in the fuzzy rule based table (Table 1-5B in Appendix 5B),
the priority level is CRITICAL.
(25) If Sn = Very High 0.2, Ni = Very High 0.2, and Na = Low 0.7, then
based on rule 122 in the fuzzy rule based table (Table 1-5B in Appendix 5B),
the priority level is CRITICAL.
(26) If Sn = Very High 0.2, Ni = Very High 0.2, and Na = Moderate 0.1,
then based on rule 123 in the fuzzy rule based table (Table 1-5B in Appendix
5B), the priority level is CRITICAL.
(27) If Sn = Very High 0.2, Ni = Very High 0.2, and Na = Very High 0.2,
then based on rule 125 in the fuzzy rule based table (Table 1-5B in Appendix
5B), the priority level is CRITICAL.
ii. Determine the minimum value of each combination in terms of comparing the values
obtained from each element and the value of weight established in the priority level.
In the first combination in (i), Sn = Very Low 0.55, Ni = Moderate 0.675, and Na = Low 0.7.
Therefore, the minimum value of Sn, Ni and Na is 0.55, which is associated with the
linguistic priority term CAUTION according to the fuzzy rule developed. The minimum
values of the other twenty-six combinations can be determined in a similar way as shown
in Table 1-5D.
Table 1-5D: The Minimum Value of each Combination for Port Crane Bearing
1 Caution 0.55 2 Caution 0.1 3 Critical 0.2 4 Attention 0.125
5 Attention 0.1 6 Critical 0.125 7 Critical 0.2 8 Critical 0.1
9 Critical 0.2 10 Caution 0.25 11 Caution 0.1 12 Critical 0.2
13 Attention 0.125 14 Attention 0.1 15 Critical 0.125 16 Critical 0.2
17 Critical 0.1 18 Critical 0.2 19 Critical 0.2 20 Critical 0.1
21 Critical 0.2 22 Critical 0.125 23 Critical 0.1 24 Critical 0.125
25 Critical 0.2 26 Critical 0.1 27 Critical 0.2
iii. Determine the maximum value of the minimum values obtained from step 2 that
have the same category of linguistic priority term.
In the first scenario, there are twenty-seven combinations and three different categories of
linguistic priority terms, CAUTION, ATTENTION and CRITICAL. The membership values in
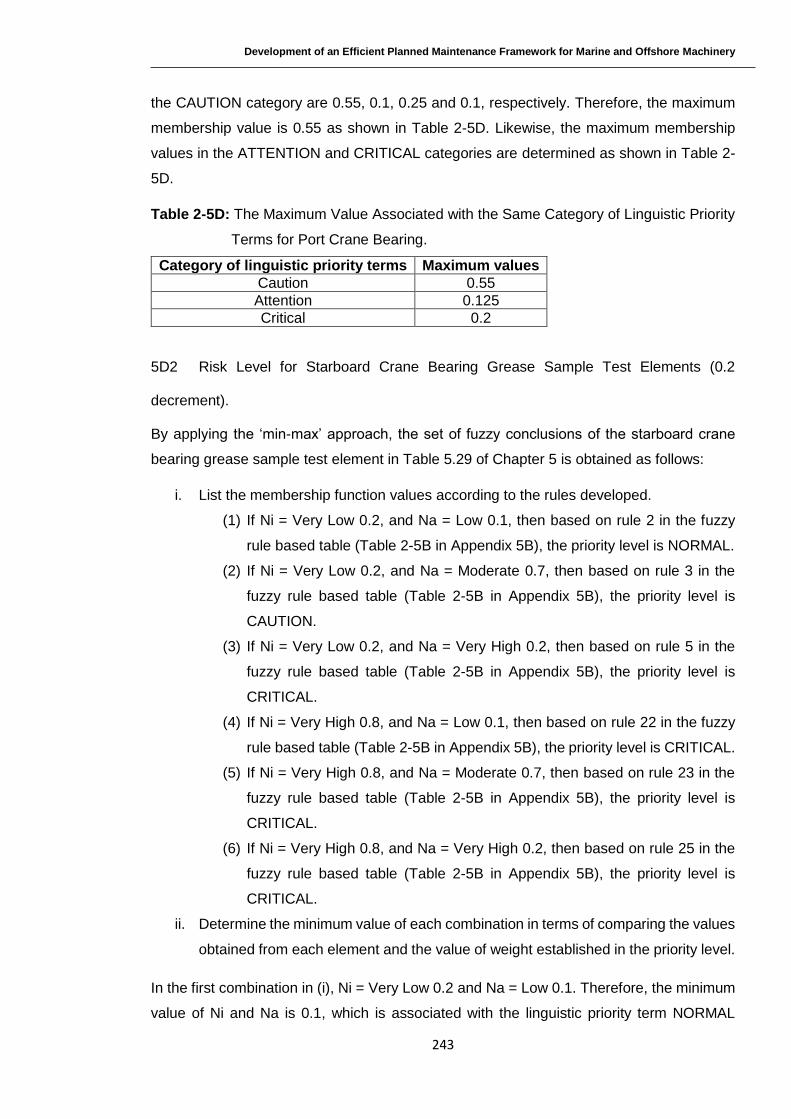
Development of an Efficient Planned Maintenance Framework for Marine and Offshore Machinery
243
the CAUTION category are 0.55, 0.1, 0.25 and 0.1, respectively. Therefore, the maximum
membership value is 0.55 as shown in Table 2-5D. Likewise, the maximum membership
values in the ATTENTION and CRITICAL categories are determined as shown in Table 2-
5D.
Table 2-5D: The Maximum Value Associated with the Same Category of Linguistic Priority
Terms for Port Crane Bearing.
Category of linguistic priority terms Maximum values
Caution 0.55
Attention 0.125
Critical 0.2
5D2 Risk Level for Starboard Crane Bearing Grease Sample Test Elements (0.2
decrement).
By applying the ‘min-max’ approach, the set of fuzzy conclusions of the starboard crane
bearing grease sample test element in Table 5.29 of Chapter 5 is obtained as follows:
i. List the membership function values according to the rules developed.
(1) If Ni = Very Low 0.2, and Na = Low 0.1, then based on rule 2 in the fuzzy
rule based table (Table 2-5B in Appendix 5B), the priority level is NORMAL.
(2) If Ni = Very Low 0.2, and Na = Moderate 0.7, then based on rule 3 in the
fuzzy rule based table (Table 2-5B in Appendix 5B), the priority level is
CAUTION.
(3) If Ni = Very Low 0.2, and Na = Very High 0.2, then based on rule 5 in the
fuzzy rule based table (Table 2-5B in Appendix 5B), the priority level is
CRITICAL.
(4) If Ni = Very High 0.8, and Na = Low 0.1, then based on rule 22 in the fuzzy
rule based table (Table 2-5B in Appendix 5B), the priority level is CRITICAL.
(5) If Ni = Very High 0.8, and Na = Moderate 0.7, then based on rule 23 in the
fuzzy rule based table (Table 2-5B in Appendix 5B), the priority level is
CRITICAL.
(6) If Ni = Very High 0.8, and Na = Very High 0.2, then based on rule 25 in the
fuzzy rule based table (Table 2-5B in Appendix 5B), the priority level is
CRITICAL.
ii. Determine the minimum value of each combination in terms of comparing the values
obtained from each element and the value of weight established in the priority level.
In the first combination in (i), Ni = Very Low 0.2 and Na = Low 0.1. Therefore, the minimum
value of Ni and Na is 0.1, which is associated with the linguistic priority term NORMAL
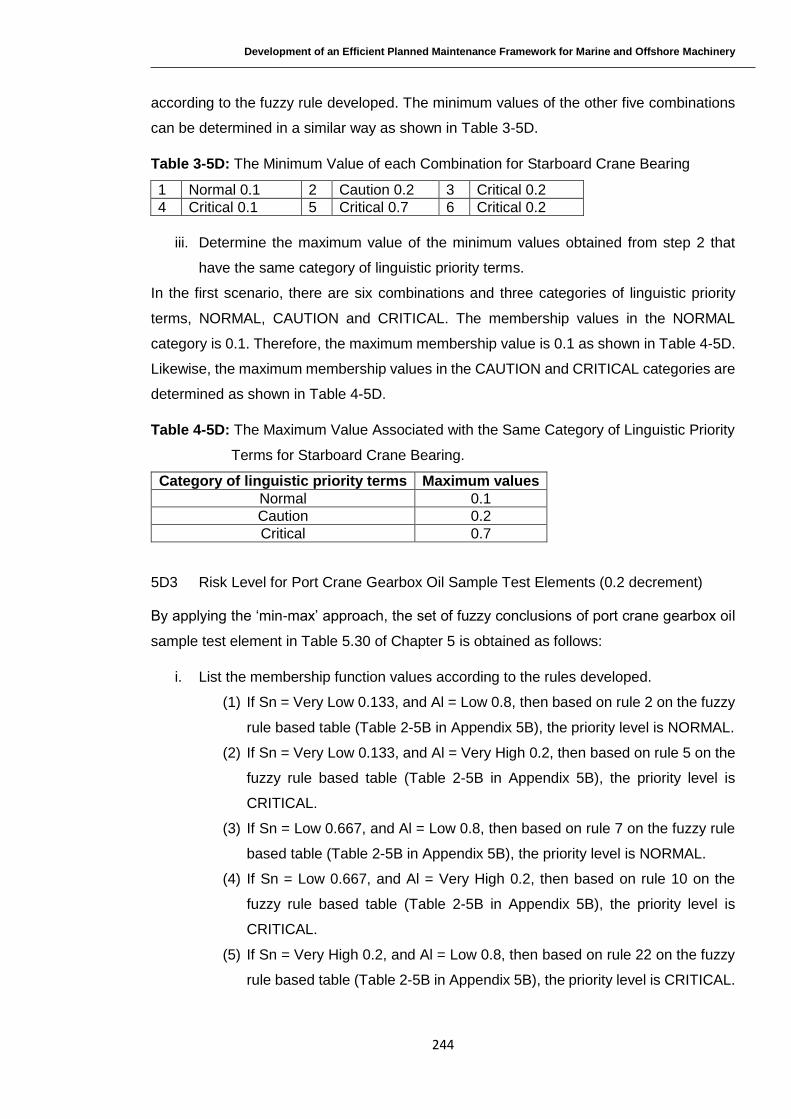
Development of an Efficient Planned Maintenance Framework for Marine and Offshore Machinery
244
according to the fuzzy rule developed. The minimum values of the other five combinations
can be determined in a similar way as shown in Table 3-5D.
Table 3-5D: The Minimum Value of each Combination for Starboard Crane Bearing
1 Normal 0.1 2 Caution 0.2 3 Critical 0.2
4 Critical 0.1 5 Critical 0.7 6 Critical 0.2
iii. Determine the maximum value of the minimum values obtained from step 2 that
have the same category of linguistic priority terms.
In the first scenario, there are six combinations and three categories of linguistic priority
terms, NORMAL, CAUTION and CRITICAL. The membership values in the NORMAL
category is 0.1. Therefore, the maximum membership value is 0.1 as shown in Table 4-5D.
Likewise, the maximum membership values in the CAUTION and CRITICAL categories are
determined as shown in Table 4-5D.
Table 4-5D: The Maximum Value Associated with the Same Category of Linguistic Priority
Terms for Starboard Crane Bearing.
Category of linguistic priority terms Maximum values
Normal 0.1
Caution 0.2
Critical 0.7
5D3 Risk Level for Port Crane Gearbox Oil Sample Test Elements (0.2 decrement)
By applying the ‘min-max’ approach, the set of fuzzy conclusions of port crane gearbox oil
sample test element in Table 5.30 of Chapter 5 is obtained as follows:
i. List the membership function values according to the rules developed.
(1) If Sn = Very Low 0.133, and Al = Low 0.8, then based on rule 2 on the fuzzy
rule based table (Table 2-5B in Appendix 5B), the priority level is NORMAL.
(2) If Sn = Very Low 0.133, and Al = Very High 0.2, then based on rule 5 on the
fuzzy rule based table (Table 2-5B in Appendix 5B), the priority level is
CRITICAL.
(3) If Sn = Low 0.667, and Al = Low 0.8, then based on rule 7 on the fuzzy rule
based table (Table 2-5B in Appendix 5B), the priority level is NORMAL.
(4) If Sn = Low 0.667, and Al = Very High 0.2, then based on rule 10 on the
fuzzy rule based table (Table 2-5B in Appendix 5B), the priority level is
CRITICAL.
(5) If Sn = Very High 0.2, and Al = Low 0.8, then based on rule 22 on the fuzzy
rule based table (Table 2-5B in Appendix 5B), the priority level is CRITICAL.

Development of an Efficient Planned Maintenance Framework for Marine and Offshore Machinery
245
(6) If Sn = Very High 0.2, and Al = Very High 0.2, then based on rule 25 on the
fuzzy rule based table (Table 2-5B in Appendix 5B), the priority level is
CRITICAL.
ii. Determine the minimum value of each combination in terms of comparing the values
obtained from each element and the value of weight established in the priority level.
In the first combination in (i), Sn = Very Low 0.133, and Al = Low 0.8. Therefore, the
minimum value of Sn and Al is 0.133, which is associated with the linguistic priority term
NORMAL according to the fuzzy rule developed. The minimum values of the other five
combinations can be determined in a similar way as shown in Table 5-5D.
Table 5-5D: The Minimum Value of each Combination for Port Crane Gearbox
1 Normal 0.133 2 Critical 0.133 3 Normal 0.667
4 Critical 0.2 5 Critical 0.2 6 Critical 0.2
iii. Determine the maximum value of the minimum values obtained from step 2 that
have the same category of linguistic priority term.
In the first scenario, there are six combinations and two categories of linguistic priority terms,
NORMAL and CRITICAL. The membership values in the NORMAL category are 0.133 and
0.667. Therefore, the maximum membership value is 0.667. Likewise, the maximum
membership value in the CRITICAL category is determined as shown in Table 6-5D.
Table 6-5D: The Maximum Value Associated with the Same Category of Linguistic Priority
Terms for Port Crane Gearbox.
Category of linguistic priority terms Maximum values
Normal 0.667
Critical 0.2
5D4 Risk Level for Starboard Crane Gearbox Oil Sample Test Elements (0.2 decrement)
By applying the ‘min-max’ approach, the set of fuzzy conclusions of starboard crane
gearbox oil sample test element in Table 5.31 of Chapter 5 is obtained as follows:
i. List the membership function values according to the rules developed.
(1) If Al = Moderate 0.8, and Si = Very Low 0.675, then based on rule 11 on the
fuzzy rule based table (Table 2-5B in Appendix 5B), the priority level is
CAUTION.
(2) If Al = Moderate 0.8, and Si = Low 0.125, then based on rule 12 on the fuzzy
rule based table (Table 2-5B in Appendix 5B), the priority level is CAUTION.
(3) If Al = Moderate 0.8, and Si = Very High 0.2, then based on rule 15 on the
fuzzy rule based table (Table 2-5B in Appendix 5B), the priority level is
CRITICAL.

Development of an Efficient Planned Maintenance Framework for Marine and Offshore Machinery
246
(4) If Al = Very High 0.2, and Si = Very Low 0.675, then based on rule 21 on the
fuzzy rule based table (Table 2-5B in Appendix 5B), the priority level is
CRITICAL.
(5) If Al = Very High 0.2, and Si = Low 0.125, then based on rule 22 on the fuzzy
rule based table (Table 2-5B in Appendix 5B), the priority level is CRITICAL.
(6) If Al = Very High 0.2, and Si = Very High 0.2, then based on rule 25 on the
fuzzy rule based table (Table 2-5B in Appendix 5B), the priority level is
CRITICAL.
ii. Determine the minimum value of each combination in terms of comparing the values
obtained from each element and the value of weight established in the priority level.
In the first combination in (i), Al = Moderate 0.8, and Si = Very Low 0.675. Therefore, the
minimum value of Al and Si is 0.675, which is associated with the linguistic priority term
CAUTION according to the fuzzy rule developed. The minimum values of the other five
combinations can be determined in a similar way as shown in Table 7-5D.
Table 7-5D: The Minimum Value of each Combination for Starboard Crane Gearbox
1 Caution 0.675 2 Caution 0.125 3 Critical 0.2
4 Critical 0.2 5 Critical 0.125 6 Critical 0.2
iii. Determine the maximum value of the minimum values obtained from step 2 that
have the same category of linguistic priority term.
In the first scenario, there are six combinations and two categories of linguistic priority terms,
CAUTION and CRITICAL. The membership values in the CAUTION category are 0.675 and
0.125. Therefore, the maximum membership value is 0.675. Likewise, the maximum
membership value in the CRITICAL category is determined as shown in Table 8-5D.
Table 8-5D: The Maximum Value Associated with the Same Category of Linguistic Priority
Terms for Starboard Crane Gearbox.
Category of linguistic priority terms Maximum values
Caution 0.675
Critical 0.2

Development of an Efficient Planned Maintenance Framework for Marine and Offshore Machinery
247
Appendix 5E - Risk Level Determination for Decrement by 0.3
5E1 Risk level for port crane bearing grease sample test elements (0.3 decrement)
By applying the ‘min-max’ approach, the set of fuzzy conclusions of the port crane bearing
grease sample test element in Table 5.32 of Chapter 5 is obtained as follows:
i. List the membership function values according to the rules developed.
(1) If Sn = Very Low 0.45, Ni = Moderate 0.575, and Na = Low 0.6, then based
on rule 12 in the fuzzy rule based table (Table 1-5B in Appendix 5B), the
priority level is CAUTION.
(2) If Sn = Very Low 0.45, Ni = Moderate 0.575, and Na = Moderate 0.1, then
based on rule 13 in the fuzzy rule based table (Table 1-5B in Appendix 5B),
the priority level is CAUTION.
(3) If Sn = Very Low 0.45, Ni = Moderate 0.575, and Na = Very High 0.3, then
based on rule 15 in the fuzzy rule based table (Table 1-5B in Appendix 5B),
the priority level is CRITICAL.
(4) If Sn = Very Low 0.45, Ni = High 0.125, and Na = Low 0.6, then based on
rule 17 in the fuzzy rule based table (Table 1-5B in Appendix 5B), the priority
level is ATTENTION.
(5) If Sn = Very Low 0.45, Ni = High 0.125, and Na = Moderate 0.1, then based
on rule 18 in the fuzzy rule based table (Table 1-5B in Appendix 5B), the
priority level is ATTENTION.
(6) If Sn = Very Low 0.45, Ni = High 0.125, and Na = Very High 0.3, then based
on rule 20 in the fuzzy rule based table (Table 1-5B in Appendix 5B), the
priority level is CRITICAL.
(7) If Sn = Very Low 0.45, Ni = Very High 0.3, and Na = Low 0.6, then based on
rule 22 in the fuzzy rule based table (Table 1-5B in Appendix 5B), the priority
level is CRITICAL.
(8) If Sn = Very Low 0.45, Ni = Very High 0.3, and Na = Moderate 0.1, then
based on rule 23 in the fuzzy rule based table (Table 1-5B in Appendix 5B),
the priority level is CRITICAL.
(9) If Sn = Very Low 0.45, Ni = Very High 0.3, and Na = Very High 0.3, then
based on rule 25 in the fuzzy rule based table (Table 1-5B in Appendix 5B),
the priority level is CRITICAL.

Development of an Efficient Planned Maintenance Framework for Marine and Offshore Machinery
248
(10) If Sn = Low 0.25, Ni = Moderate 0.575, and Na = Low 0.6, then based
on rule 37 in the fuzzy rule based table (Table 1-5B in Appendix 5B), the
priority level is CAUTION.
(11) If Sn = Low 0.25, Ni = Moderate 0.575, and Na = Moderate 0.1, then
based on rule 38 in the fuzzy rule based table (Table 1-5B in Appendix 5B),
the priority level is CAUTION.
(12) If Sn = Low 0.25, Ni = Moderate 0.575, and Na = Very High 0.3, then
based on rule 40 in the fuzzy rule based table (Table 1-5B in Appendix 5B),
the priority level is CRITICAL.
(13) If Sn = Low 0.25, Ni = High 0.125, and Na = Low 0.6, then based on
rule 42 in the fuzzy rule based table (Table 1-5B in Appendix 5B), the priority
level is ATTENTION.
(14) If Sn = Low 0.25, Ni = High 0.125, and Na = Moderate 0.1, then based
on rule 43 in the fuzzy rule based table (Table 1-5B in Appendix 5B), the
priority level is ATTENTION.
(15) If Sn = Low 0.25, Ni = High 0.125, and Na = Very High 0.3, then
based on rule 45 in the fuzzy rule based table (Table 1-5B in Appendix 5B),
the priority level is CRITICAL.
(16) If Sn = Low 0.25, Ni = Very High 0.3, and Na = Low 0.6, then based
on rule 47 in the fuzzy rule based table (Table 1-5B in Appendix 5B), the
priority level is CRITICAL.
(17) If Sn = Low 0.25, Ni = Very High 0.3, and Na = Moderate 0.1, then
based on rule 48 in the fuzzy rule based table (Table 1-5B in Appendix 5B),
the priority level is CRITICAL.
(18) If Sn = Low 0.25, Ni = Very High 0.3, and Na = Very High 0.3, then
based on rule 50 in the fuzzy rule based table (Table 1-5B in Appendix 5B),
the priority level is CRITICAL.
(19) If Sn = Very High 0.3, Ni = Moderate 0.575, and Na = Low 0.6, then
based on rule 112 in the fuzzy rule based table (Table 1-5B in Appendix 5B),
the priority level is CRITICAL.
(20) If Sn = Very High 0.3, Ni = Moderate 0.575, and Na = Moderate 0.1,
then based on rule 113 in the fuzzy rule based table (Table 1-5B in Appendix
5B), the priority level is CRITICAL.
(21) If Sn = Very High 0.3, Ni = Moderate 0.575, and Na = Very High 0.3,
then based on rule 115 in the fuzzy rule based table (Table 1-5B in Appendix
5B), the priority level is CRITICAL.

Development of an Efficient Planned Maintenance Framework for Marine and Offshore Machinery
249
(22) If Sn = Very High 0.3, Ni = High 0.125, and Na = Low 0.6, then based
on rule 117 in the fuzzy rule based table (Table 1-5B in Appendix 5B), the
priority level is CRITICAL.
(23) If Sn = Very High 0.3, Ni = High 0.125, and Na = Moderate 0.1, then
based on rule 118 in the fuzzy rule based table (Table 1-5B in Appendix 5B),
the priority level is CRITICAL.
(24) If Sn = Very High 0.3, Ni = High 0.125, and Na = Very High 0.3, then
based on rule 120 in the fuzzy rule based table (Table 1-5B in Appendix 5B),
the priority level is CRITICAL.
(25) If Sn = Very High 0.3, Ni = Very High 0.3, and Na = Low 0.6, then
based on rule 122 in the fuzzy rule based table (Table 1-5B in Appendix 5B),
the priority level is CRITICAL.
(26) If Sn = Very High 0.3, Ni = Very High 0.3, and Na = Moderate 0.1,
then based on rule 123 in the fuzzy rule based table (Table 1-5B in Appendix
5B), the priority level is CRITICAL.
(27) If Sn = Very High 0.3, Ni = Very High 0.3, and Na = Very High 0.3,
then based on rule 125 in the fuzzy rule based table (Table 1-5B in Appendix
5B), the priority level is CRITICAL.
ii. Determine the minimum value of each combination in terms of comparing the values
obtained from each element and the value of weight established in the priority level.
In the first combination in (i), Sn = Very Low 0.45, Ni = Moderate 0.575, and Na = Low 0.6.
Therefore, the minimum value of Sn, Ni and Na is 0.45, which is associated with the
linguistic priority term CAUTION according to the fuzzy rule developed. The minimum
values of the other twenty-six combinations can be determined in a similar way as shown
in Table 1-5E.
Table 1-5E: The Minimum Value of each Combination for Port Crane Bearing
1 Caution 0.45 2 Caution 0.1 3 Critical 0.3 4 Attention 0.125
5 Attention 0.1 6 Critical 0.125 7 Critical 0.3 8 Critical 0.1
9 Critical 0.3 10 Caution 0.25 11 Caution 0.1 12 Critical 0.25
13 Attention 0.125 14 Attention 0.1 15 Critical 0.125 16 Critical 0.25
17 Critical 0.1 18 Critical 0.25 19 Critical 0.3 20 Critical 0.1
21 Critical 0.3 22 Critical 0.125 23 Critical 0.1 24 Critical 0.125
25 Critical 0.3 26 Critical 0.1 27 Critical 0.3
iii. Determine the maximum value of the minimum values obtained from step 2 that
have the same category of linguistic priority term.
In the first scenario, there are twenty-seven combinations and three different categories of
linguistic priority terms, CAUTION, ATTENTION and CRITICAL. The membership values in
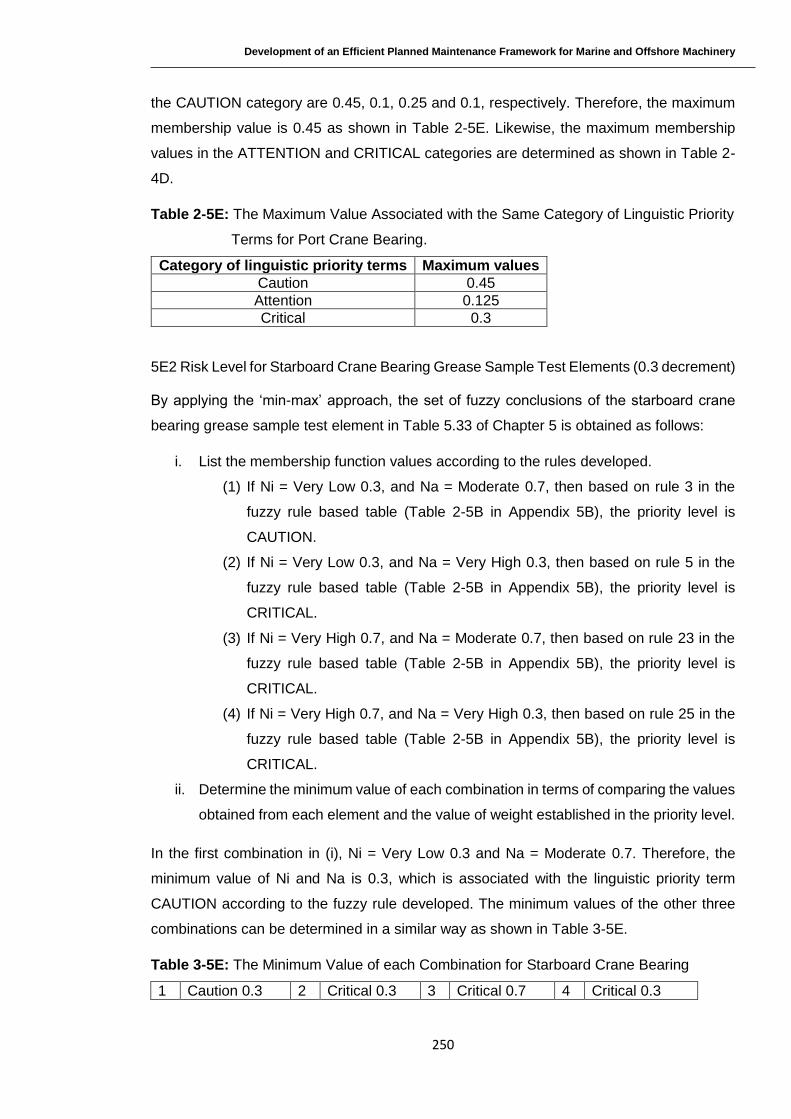
Development of an Efficient Planned Maintenance Framework for Marine and Offshore Machinery
250
the CAUTION category are 0.45, 0.1, 0.25 and 0.1, respectively. Therefore, the maximum
membership value is 0.45 as shown in Table 2-5E. Likewise, the maximum membership
values in the ATTENTION and CRITICAL categories are determined as shown in Table 2-
4D.
Table 2-5E: The Maximum Value Associated with the Same Category of Linguistic Priority
Terms for Port Crane Bearing.
Category of linguistic priority terms Maximum values
Caution 0.45
Attention 0.125
Critical 0.3
5E2 Risk Level for Starboard Crane Bearing Grease Sample Test Elements (0.3 decrement)
By applying the ‘min-max’ approach, the set of fuzzy conclusions of the starboard crane
bearing grease sample test element in Table 5.33 of Chapter 5 is obtained as follows:
i. List the membership function values according to the rules developed.
(1) If Ni = Very Low 0.3, and Na = Moderate 0.7, then based on rule 3 in the
fuzzy rule based table (Table 2-5B in Appendix 5B), the priority level is
CAUTION.
(2) If Ni = Very Low 0.3, and Na = Very High 0.3, then based on rule 5 in the
fuzzy rule based table (Table 2-5B in Appendix 5B), the priority level is
CRITICAL.
(3) If Ni = Very High 0.7, and Na = Moderate 0.7, then based on rule 23 in the
fuzzy rule based table (Table 2-5B in Appendix 5B), the priority level is
CRITICAL.
(4) If Ni = Very High 0.7, and Na = Very High 0.3, then based on rule 25 in the
fuzzy rule based table (Table 2-5B in Appendix 5B), the priority level is
CRITICAL.
ii. Determine the minimum value of each combination in terms of comparing the values
obtained from each element and the value of weight established in the priority level.
In the first combination in (i), Ni = Very Low 0.3 and Na = Moderate 0.7. Therefore, the
minimum value of Ni and Na is 0.3, which is associated with the linguistic priority term
CAUTION according to the fuzzy rule developed. The minimum values of the other three
combinations can be determined in a similar way as shown in Table 3-5E.
Table 3-5E: The Minimum Value of each Combination for Starboard Crane Bearing
1 Caution 0.3 2 Critical 0.3 3 Critical 0.7 4 Critical 0.3
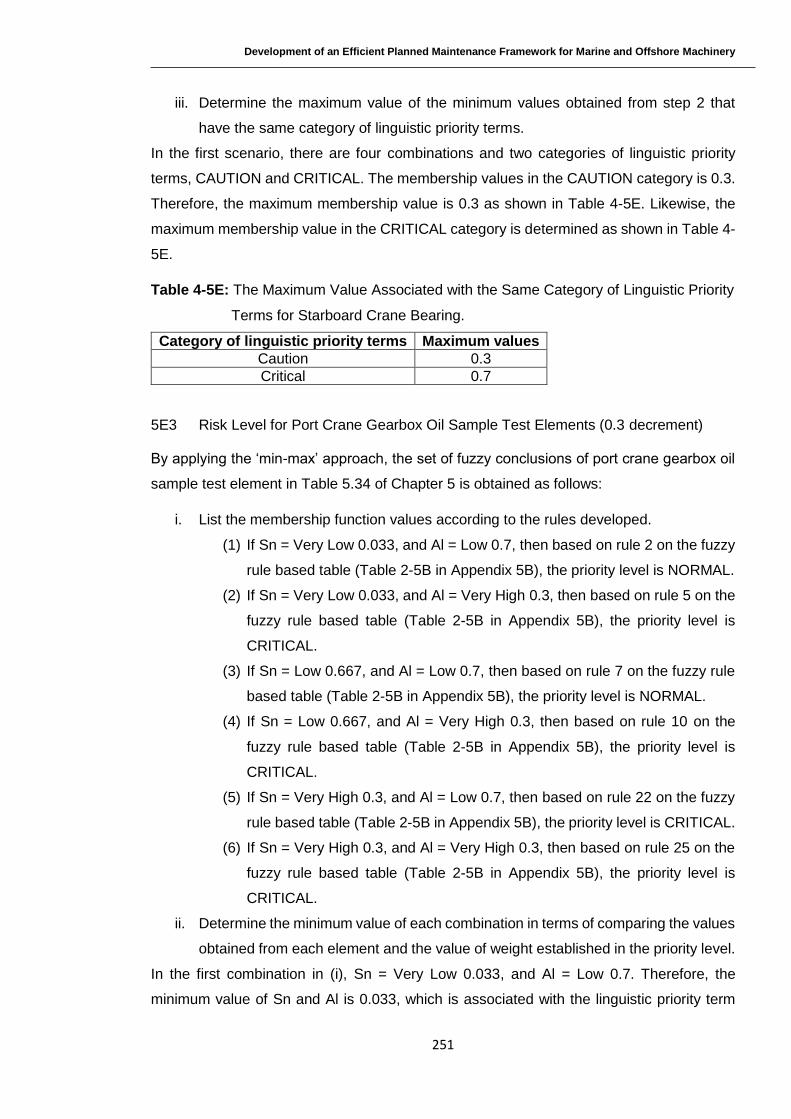
Development of an Efficient Planned Maintenance Framework for Marine and Offshore Machinery
251
iii. Determine the maximum value of the minimum values obtained from step 2 that
have the same category of linguistic priority terms.
In the first scenario, there are four combinations and two categories of linguistic priority
terms, CAUTION and CRITICAL. The membership values in the CAUTION category is 0.3.
Therefore, the maximum membership value is 0.3 as shown in Table 4-5E. Likewise, the
maximum membership value in the CRITICAL category is determined as shown in Table 4-
5E.
Table 4-5E: The Maximum Value Associated with the Same Category of Linguistic Priority
Terms for Starboard Crane Bearing.
Category of linguistic priority terms Maximum values
Caution 0.3
Critical 0.7
5E3 Risk Level for Port Crane Gearbox Oil Sample Test Elements (0.3 decrement)
By applying the ‘min-max’ approach, the set of fuzzy conclusions of port crane gearbox oil
sample test element in Table 5.34 of Chapter 5 is obtained as follows:
i. List the membership function values according to the rules developed.
(1) If Sn = Very Low 0.033, and Al = Low 0.7, then based on rule 2 on the fuzzy
rule based table (Table 2-5B in Appendix 5B), the priority level is NORMAL.
(2) If Sn = Very Low 0.033, and Al = Very High 0.3, then based on rule 5 on the
fuzzy rule based table (Table 2-5B in Appendix 5B), the priority level is
CRITICAL.
(3) If Sn = Low 0.667, and Al = Low 0.7, then based on rule 7 on the fuzzy rule
based table (Table 2-5B in Appendix 5B), the priority level is NORMAL.
(4) If Sn = Low 0.667, and Al = Very High 0.3, then based on rule 10 on the
fuzzy rule based table (Table 2-5B in Appendix 5B), the priority level is
CRITICAL.
(5) If Sn = Very High 0.3, and Al = Low 0.7, then based on rule 22 on the fuzzy
rule based table (Table 2-5B in Appendix 5B), the priority level is CRITICAL.
(6) If Sn = Very High 0.3, and Al = Very High 0.3, then based on rule 25 on the
fuzzy rule based table (Table 2-5B in Appendix 5B), the priority level is
CRITICAL.
ii. Determine the minimum value of each combination in terms of comparing the values
obtained from each element and the value of weight established in the priority level.
In the first combination in (i), Sn = Very Low 0.033, and Al = Low 0.7. Therefore, the
minimum value of Sn and Al is 0.033, which is associated with the linguistic priority term

Development of an Efficient Planned Maintenance Framework for Marine and Offshore Machinery
252
NORMAL according to the fuzzy rule developed. The minimum values of the other five
combinations can be determined in a similar way as shown in Table 5-5E.
Table 5-5E: The Minimum Value of each Combination for Port Crane Gearbox
1 Normal 0.033 2 Critical 0.033 3 Normal 0.667
4 Critical 0.3 5 Critical 0.3 6 Critical 0.3
iii. Determine the maximum value of the minimum values obtained from step 2 that
have the same category of linguistic priority term.
In the first scenario, there are six combinations and two categories of linguistic priority terms,
NORMAL and CRITICAL. The membership values in the NORMAL category are 0.033 and
0.667. Therefore, the maximum membership value is 0.667. Likewise, the maximum
membership value in the CRITICAL category is determined as shown in Table 6-5E.
Table 6-5E: The Maximum Value Associated with the Same Category of Linguistic Priority
Terms for Port Crane Gearbox.
Category of linguistic priority terms Maximum values
Normal 0.667
Critical 0.3
5E4 Risk Level for Starboard Crane Gearbox Oil Sample Test Elements (0.3 decrement)
By applying the ‘min-max’ approach, the set of fuzzy conclusions of starboard crane
gearbox oil sample test element in Table 5.35 is obtained as follows:
i. List the membership function values according to the rules developed.
(1) If Al = Moderate 0.7, and Si = Very Low 0.575, then based on rule 11 on the
fuzzy rule based table (Table 2-5B in Appendix 5B), the priority level is
CAUTION.
(2) If Al = Moderate 0.7, and Si = Low 0.125, then based on rule 12 on the fuzzy
rule based table (Table 2-5B in Appendix 5B), the priority level is CAUTION.
(3) If Al = Moderate 0.7, and Si = Very High 0.3, then based on rule 15 on the
fuzzy rule based table (Table 2-5B in Appendix 5B), the priority level is
CRITICAL.
(4) If Al = Very High 0.3, and Si = Very Low 0.575, then based on rule 21 on the
fuzzy rule based table (Table 2-5B in Appendix 5B), the priority level is
CRITICAL.
(5) If Al = Very High 0.3, and Si = Low 0.125, then based on rule 22 on the fuzzy
rule based table (Table 2-5B in Appendix 5B), the priority level is CRITICAL.
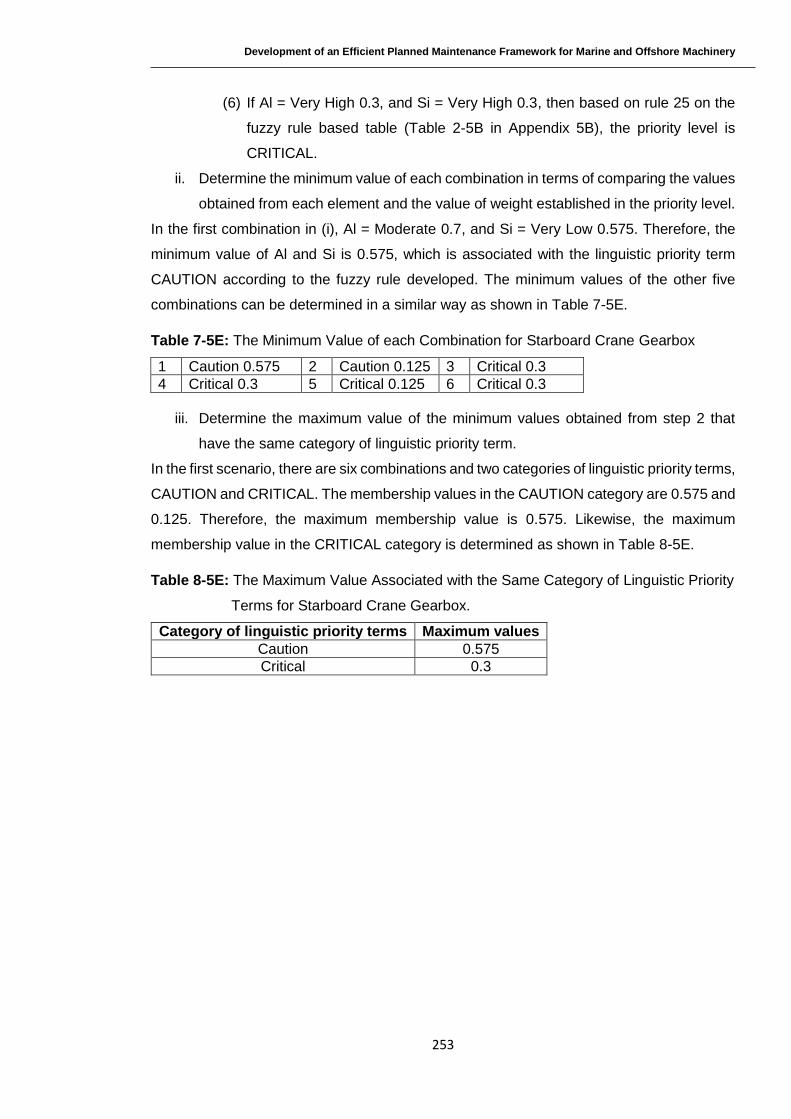
Development of an Efficient Planned Maintenance Framework for Marine and Offshore Machinery
253
(6) If Al = Very High 0.3, and Si = Very High 0.3, then based on rule 25 on the
fuzzy rule based table (Table 2-5B in Appendix 5B), the priority level is
CRITICAL.
ii. Determine the minimum value of each combination in terms of comparing the values
obtained from each element and the value of weight established in the priority level.
In the first combination in (i), Al = Moderate 0.7, and Si = Very Low 0.575. Therefore, the
minimum value of Al and Si is 0.575, which is associated with the linguistic priority term
CAUTION according to the fuzzy rule developed. The minimum values of the other five
combinations can be determined in a similar way as shown in Table 7-5E.
Table 7-5E: The Minimum Value of each Combination for Starboard Crane Gearbox
1 Caution 0.575 2 Caution 0.125 3 Critical 0.3
4 Critical 0.3 5 Critical 0.125 6 Critical 0.3
iii. Determine the maximum value of the minimum values obtained from step 2 that
have the same category of linguistic priority term.
In the first scenario, there are six combinations and two categories of linguistic priority terms,
CAUTION and CRITICAL. The membership values in the CAUTION category are 0.575 and
0.125. Therefore, the maximum membership value is 0.575. Likewise, the maximum
membership value in the CRITICAL category is determined as shown in Table 8-5E.
Table 8-5E: The Maximum Value Associated with the Same Category of Linguistic Priority
Terms for Starboard Crane Gearbox.
Category of linguistic priority terms Maximum values
Caution 0.575
Critical 0.3

Development of an Efficient Planned Maintenance Framework for Marine and Offshore Machinery
254
Appendix 5F - Risk Values for Decremented Set of Fuzzy Conclusions
Using the defuzzification process described in Section 5.46, and the decrement set of
fuzzy conclusions shown in Table 5.40 in Chapter 5, the risk (utility) values can be
calculated as follows:
Port Crane Bearing
10% decrement:
𝐶𝑎𝑢𝑡𝑖𝑜𝑛 0.65
0.65+0.125+0.1, 𝐴𝑡𝑡𝑒𝑛𝑡𝑖𝑜𝑛
0.125
0.65+0.125+0.1, 𝐶𝑟𝑖𝑡𝑖𝑐𝑎𝑙
0.1
0.65+0.125+0.1
𝑅𝑉 = 2 × 0.65
0.65+0.125+0.1+ 3 ×
0.125
0.65+0.125+0.1+ 4 ×
0.1
0.65+0.125+0.1 = 2.366
20% decrement:
𝐶𝑎𝑢𝑡𝑖𝑜𝑛 0.55
0.55+0.125+0.2, 𝐴𝑡𝑡𝑒𝑛𝑡𝑖𝑜𝑛
0.125
0.55+0.125+0.2, 𝐶𝑟𝑖𝑡𝑖𝑐𝑎𝑙
0.2
0.55+0.125+0.2
𝑅𝑉 = 2 × 0.55
0.55+0.125+0.2+ 3 ×
0.125
0.55+0.125+0.2+ 4 ×
0.2
0.55+0.125+0.2 = 2.594
30% decrement:
𝐶𝑎𝑢𝑡𝑖𝑜𝑛 0.45
0.45+0.125+0.3, 𝐴𝑡𝑡𝑒𝑛𝑡𝑖𝑜𝑛
0.125
0.45+0.125+0.3, 𝐶𝑟𝑖𝑡𝑖𝑐𝑎𝑙
0.3
0.45+0.125+0.3
𝑅𝑉 = 2 × 0.45
0.45+0.125+0.3+ 3 ×
0.125
0.45+0.125+0.3+ 4 ×
0.3
0.45+0.125+0.3 = 2.822
Starboard Crane Bearing
10% decrement:
𝑁𝑜𝑟𝑚𝑎𝑙 0.1
0.1+0.1+0.7, 𝐶𝑎𝑢𝑡𝑖𝑜𝑛
0.1
0.1+0.1+0.7, 𝐶𝑟𝑖𝑡𝑖𝑐𝑎𝑙
0.7
0.1+0.1+0.7
𝑅𝑉 = 1 × 0.1
0.1+0.1+0.7+ 2 ×
0.1
0.1+0.1+0.7+ 4 ×
0.7
0.1+0.1+0.7 = 3.441
20% decrement:
RV = (1 x 0.1) + (2 x 0.2) + (4 x 0.7) = 3.3 30% decrement:
RV = (2 x 0.3) + (4 x 0.7) = 3.4

Development of an Efficient Planned Maintenance Framework for Marine and Offshore Machinery
255
Port Crane Gearbox
10% decrement:
𝑁𝑜𝑟𝑚𝑎𝑙 0.667
0.667+0.1, 𝐶𝑟𝑖𝑡𝑖𝑐𝑎𝑙
0.1
0.667+0.1
𝑅𝑉 = 1 × 0.667
0.667+0.1+ 4 ×
0.1
0.667+0.1 = 1.389
20% decrement:
𝑁𝑜𝑟𝑚𝑎𝑙 0.667
0.667+0.2, 𝐶𝑟𝑖𝑡𝑖𝑐𝑎𝑙
0.2
0.667+0.2
𝑅𝑉 = 1 × 0.667
0.667+0.2+ 4 ×
0.2
0.667+0.2 = 1.689
30% decrement:
𝑁𝑜𝑟𝑚𝑎𝑙 0.667
0.667+0.3, 𝐶𝑟𝑖𝑡𝑖𝑐𝑎𝑙
0.3
0.667+0.3
𝑅𝑉 = 1 × 0.667
0.667+0.3+ 4 ×
0.3
0.667+0.3 = 1.929
Starboard Crane Gearbox
10% decrement:
𝐶𝑎𝑢𝑡𝑖𝑜𝑛 0.775
0.775+0.1, 𝐶𝑟𝑖𝑡𝑖𝑐𝑎𝑙
0.1
0.775+0.1
𝑅𝑉 = 2 × 0.775
0.775+0.1+ 4 ×
0.1
0.775+0.1 = 2.226
20% decrement:
𝐶𝑎𝑢𝑡𝑖𝑜𝑛 0.675
0.675+0.2, 𝐶𝑟𝑖𝑡𝑖𝑐𝑎𝑙
0.2
0.675+0.2
𝑅𝑉 = 2 × 0.675
0.675+0.2+ 4 ×
0.2
0.675+0.2 = 2.454
30% decrement:
𝐶𝑎𝑢𝑡𝑖𝑜𝑛 0.575
0.575+0.3, 𝐶𝑟𝑖𝑡𝑖𝑐𝑎𝑙
0.3
0.575+0.3
𝑅𝑉 = 2 × 0.575
0.575+0.3+ 4 ×
0.3
0.575+0.3 = 2.682

Development of an Efficient Planned Maintenance Framework for Marine and Offshore Machinery
256
Appendix 6 - Research Questionnaires
Dear Sir/Madam,
A PhD research at Liverpool Logistics, Offshore and Marine (LOOM) Research Institute is currently
being carried out on “Development of an efficient planned maintenance framework for marine and
offshore machinery operating under highly uncertain environment”. Recently, this subject has
become a hot topic in the marine and offshore community due to a sudden shift in perception and
thinking about maintenance of machinery used in marine and offshore operations.
The aim of the above research title is to generate a risk-based and decision-based methodology
capable of delivering a maintenance framework for improvement and management of marine and
offshore machinery systems’ operation under highly uncertainty. In light of the above, a specific
model is developed in order to achieve the aforementioned aim. A requirement for this study is to
employ experts’ judgement in determining the weights of each parameter of the model in order to
prioritise them for an advanced computational analysis.
Thus, this study set out to provide an organised method for collecting experts’ opinions in order to
design a flexible yet robust planned maintenance system that can lead to the enhancement of safety
and sustainability of the marine and offshore machinery and transportation systems.
In order to improve the quality and relevance of the research, the researcher would greatly appreciate
your views by completing the following questionnaire and return using the email address given below.
Please note that the completion of this questionnaire is voluntary and it will takes about 10 to 15
minutes of your time; however, your feedback will greatly enhance the research development and
contribute to the industry wise opinion. Finally, the information provided and your identity will be
treated with confidentiality. For further questions or enquiries about the study, please do not hesitate
to contact the researcher.
Thank you.
Yours sincerely,
Maurice Asuquo
Liverpool Logistics Offshore and Marine Research Institute (LOOM)
Tel: +44 (0) 79 5621 6920, +44 (0) 151 231 2028
Email: [email protected]
Room 121, James Parsons Building
Liverpool John Moores University, Byrom Street, Liverpool, L3 3AF, UK

Development of an Efficient Planned Maintenance Framework for Marine and Offshore Machinery
257
Questionnaire for Chapter 3
Introduction
The primary goal of this study is to select the most significant events that contribute to the
disruption of machinery operations in marine and offshore. The criteria and sub-criteria
listed in Table 1 are the parameters that need to be investigated and evaluated using “pair-
wise comparison” techniques.
Table 1: List of Criteria and sub-criteria
Criteria Sub-Criteria
Crane bearing Crane clutch Crane gearbox Crane pump
Trend Analysis Family Analysis Environmental Analysis Human Reliability Analysis Design Analysis
Trend analysis is an aspect of technical analysis that tries to predict the future performance
of machinery based on past data recorded. It is based on the idea that what has happened
in the past gives an idea of what will happen in the future.
Family Analysis compares the uncertainties levels of group of similar or identical machinery
to identify what is a usual or typical pattern.
Environmental Analysis evaluates the environmental conditions under which the machinery
is currently operating.
Human Reliability Analysis will assess the operator's performance and competency during
the machinery operations practice.
Design Analysis will assess the physical behaviour of the machinery or its component as
specified by the manufacturer. It is used to predict the physical behaviour of just about any
part or assembly under any loading conditions.
To proceed with the “pair-wise comparison” technique, an expert needs to have a good
knowledge of the qualitative descriptors or linguistic scales used for measurement in this
study as represented in Tables 2(a) and (b). The tables describe the numerical assessment
together with the linguistic meaning of each number. 2(a) explains the “Important” while the
2 (b) describes “Unimportant”

Development of an Efficient Planned Maintenance Framework for Marine and Offshore Machinery
258
Table 2(a): Ratio scale for pair-wise comparison - Important
Numbers Strength of importance in Linguistic scales or qualitative
descriptors
1
3 5 7 9
2,4,6,8
Equally Important
Weakly Important
Strongly Important
Very strongly important
Absolutely Important
Intermediate value of Important
Table 2(a): Ratio scale for pair-wise comparison - Unimportant
Numbers Strength of importance in Linguistic scales or qualitative descriptors
1 1
3⁄
1
5⁄
1
7⁄
19⁄
1
2⁄1
4⁄1
6⁄1
8⁄
Equally Unimportant
Weakly Unimportant
Strongly Unimportant
Very strongly Unimportant
Absolutely Unimportant
Intermediate value of Unimportant
with reference to Table 2, an expert is required to give a possible judgement to all question
based on his/her experience and expertise in the machinery operations. The judgement
process has to be focus on how to achieve the goal of each section. To do so, please you
are required to tick ( ∕ ) as the rate of importance or priority of each criteria and sub-criteria
in the given column. For instance:
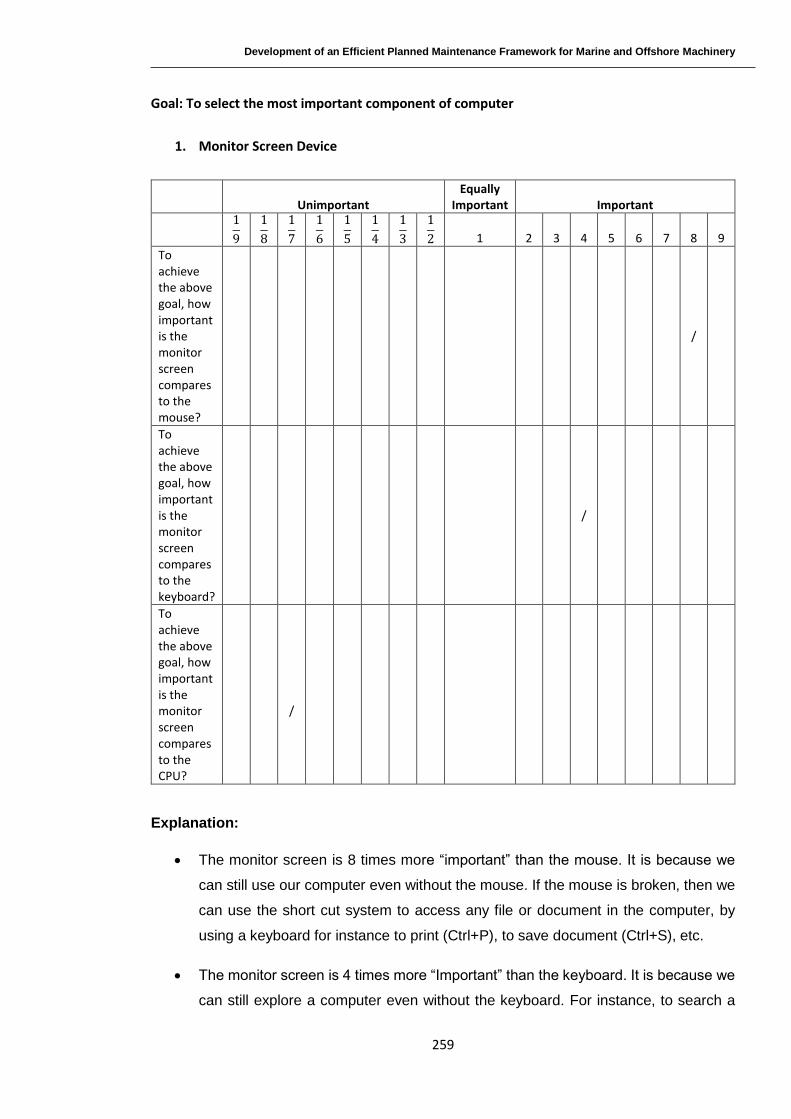
Development of an Efficient Planned Maintenance Framework for Marine and Offshore Machinery
259
Goal: To select the most important component of computer
1. Monitor Screen Device
Unimportant
Equally Important
Important
1
9
1
8
1
7
1
6
1
5
1
4
1
3
1
2
1
2
3
4
5
6
7
8
9
To achieve the above goal, how important is the monitor screen compares to the mouse?
/
To achieve the above goal, how important is the monitor screen compares to the keyboard?
/
To achieve the above goal, how important is the monitor screen compares to the CPU?
/
Explanation:
The monitor screen is 8 times more “important” than the mouse. It is because we
can still use our computer even without the mouse. If the mouse is broken, then we
can use the short cut system to access any file or document in the computer, by
using a keyboard for instance to print (Ctrl+P), to save document (Ctrl+S), etc.
The monitor screen is 4 times more “Important” than the keyboard. It is because we
can still explore a computer even without the keyboard. For instance, to search a

Development of an Efficient Planned Maintenance Framework for Marine and Offshore Machinery
260
document in a file, we can use our mouse. We can also read journals or article
papers on the monitor screen even without the keyboard. The only thing we cannot
do without the keyboard is typing.
The monitor screen is 1/7 times less “Important” than the CPU. The monitor is
useless without the CPU.
How to complete the questionnaire
This questionnaire aims to compare nine criteria that are perceived in the condition
monitoring of marine and offshore machinery in order of importance by employing Analytic
Hierarchy Process (AHP) to determine their priority ranking for decision-making.
The questionnaire is divided into two parts 1 and 2. Part 1 has the nine criteria which consist
of group A (Ship crane’s components), and group B (Ship crane’s component/criteria). An
example is given illustrating how the questionnaires should be filled. Part 2 consist of two
questions; one on expert’s experiences and the second on academic qualifications.
Example
Part 1: Group A: If you think the first criterion Crane Bearing is strongly important in
condition monitoring of the ship crane than the second criterion Crane Clutch, then please
tick as follows:
Scale of relative importance
Criterion
Ab
solu
te (
9)
Inte
rmed
iate
(8
)
Ver
y st
ron
g (
7)
Inte
rmed
iate
(6
)
Stro
ng
(5
)
Inte
rmed
iate
(4
)
Wea
k (
3)
Inte
rmed
iate
(2
)
Equ
al (
1)
Inte
rmed
iate
(2
)
Wea
k (
3)
Inte
rmed
iate
(4
)
Stro
ng
(5
)
Inte
rmed
iate
(6
)
Ver
y st
ron
g (
7)
Inte
rmed
iate
(8
)
Ab
solu
te (
9)
Criterion
Crane bearing
X
Crane clutch
Alternatively, if the second criterion Crane clutch is strongly important in condition
monitoring of the ship crane than the first criterion Crane bearing, then please tick as
follows:

Development of an Efficient Planned Maintenance Framework for Marine and Offshore Machinery
261
Scale of relative importance
Criterion
Ab
solu
te (
9)
Inte
rmed
iate
(8
)
Ver
y st
ron
g (
7)
Inte
rmed
iate
(6
)
Stro
ng
(5
)
Inte
rmed
iate
(4
)
Wea
k (
3)
Inte
rmed
iate
(2
)
Equ
al (
1)
Inte
rmed
iate
(2
)
Wea
k (
3)
Inte
rmed
iate
(4
)
Stro
ng
(5
)
Inte
rmed
iate
(6
)
Ver
y st
ron
g (
7)
Inte
rmed
iate
(8
)
Ab
solu
te (
9)
Criterion
Crane bearing
X
Crane clutch
NB: Please remember to mark only one number on either the left or right side of the
scale of importance or just the middle of the scale, which is equal importance.
Questionnaire
“I have read the information sheet provided and I am happy to participate. I
understand that by completing and returning this questionnaire I am consenting to
be part of this research study and for my data to be used as described in the
information sheet provided”
PART 1
Group A: Crane Components
Scale of relative importance
Criterion
Ab
solu
te (
9)
Inte
rmed
iate
(8
)
Ver
y st
ron
g (
7)
Inte
rmed
iate
(6
)
Stro
ng
(5
)
Inte
rmed
iate
(4
)
Wea
k (
3)
Inte
rmed
iate
(2
)
Equ
al (
1)
Inte
rmed
iate
(2
)
Wea
k (
3)
Inte
rmed
iate
(4
)
Stro
ng
(5
)
Inte
rmed
iate
(6
)
Ver
y st
ron
g (
7)
Inte
rmed
iate
(8
)
Ab
solu
te (
9)
Criterion
bearing clutch
bearing gear
bearing pump
clutch gear
clutch pump
gear pump

Development of an Efficient Planned Maintenance Framework for Marine and Offshore Machinery
262
Group B: Crane Bearing
Scale of relative importance
Criterion
Ab
solu
te (
9)
Inte
rmed
iate
(8
)
Ver
y st
ron
g (
7)
Inte
rmed
iate
(6
)
Stro
ng
(5
)
Inte
rmed
iate
(4
)
Wea
k (
3)
Inte
rmed
iate
(2
)
Equ
al (
1)
Inte
rmed
iate
(2
)
Wea
k (
3)
Inte
rmed
iate
(4
)
Stro
ng
(5
)
Inte
rmed
iate
(6
)
Ver
y st
ron
g (
7)
Inte
rmed
iate
(8
)
Ab
solu
te (
9)
Criterion
Trend Analysis
Family Analysis
Trend Analysis
Environmental Analysis
Trend Analysis
Human Reliability Analysis
Trend Analysis
Design Analysis
Family Analysis
Environmental Analysis
Family Analysis
Human Reliability Analysis
Family Analysis
Design Analysis
Environmental Analysis
Human Reliability Analysis
Environmental Analysis
Design Analysis
Human Reliability Analysis
Design Analysis

Development of an Efficient Planned Maintenance Framework for Marine and Offshore Machinery
263
Group B: Crane Clutch
Scale of relative importance
Criterion A
bso
lute
(9
)
Inte
rmed
iate
(8
)
Ver
y st
ron
g (
7)
Inte
rmed
iate
(6
)
Stro
ng
(5
)
Inte
rmed
iate
(4
)
Wea
k (
3)
Inte
rmed
iate
(2
)
Equ
al (
1)
Inte
rmed
iate
(2
)
Wea
k (
3)
Inte
rmed
iate
(4
)
Stro
ng
(5
)
Inte
rmed
iate
(6
)
Ver
y st
ron
g (
7)
Inte
rmed
iate
(8
)
Ab
solu
te (
9)
Criterion
Trend Analysis
Family Analysis
Trend Analysis
Environmental Analysis
Trend Analysis
Human Reliability Analysis
Trend Analysis
Design Analysis
Family Analysis
Environmental Analysis
Family Analysis
Human Reliability Analysis
Family Analysis
Design Analysis
Environmental Analysis
Human Reliability Analysis
Environmental Analysis
Design Analysis
Human Reliability Analysis
Design Analysis

Development of an Efficient Planned Maintenance Framework for Marine and Offshore Machinery
264
Group B: Crane Gearbox
Scale of relative importance
Criterion
Ab
solu
te (
9)
Inte
rmed
iate
(8
) V
ery
stro
ng
(7
)
Inte
rmed
iate
(6
) St
ron
g (
5)
Inte
rmed
iate
(4
) W
eak
(3
)
Inte
rmed
iate
(2
) Eq
ual
(1
)
Inte
rmed
iate
(2
) W
eak
(3
)
Inte
rmed
iate
(4
) St
ron
g (
5)
Inte
rmed
iate
(6
) V
ery
stro
ng
(7
)
Inte
rmed
iate
(8
) A
bso
lute
(9
)
Criterion
Trend Analysis
Family Analysis
Trend Analysis
Environmental Analysis
Trend Analysis
Human Reliability Analysis
Trend Analysis
Design Analysis
Family Analysis
Environmental Analysis
Family Analysis
Human Reliability Analysis
Family Analysis
Design Analysis
Environmental Analysis
Human Reliability Analysis
Environmental Analysis
Design Analysis
Human Reliability Analysis
Design Analysis

Development of an Efficient Planned Maintenance Framework for Marine and Offshore Machinery
265
Group B: Crane Hydraulic Pump
Scale of relative importance
Criterion
Ab
solu
te (
9)
Inte
rmed
iate
(8
) V
ery
stro
ng
(7
)
Inte
rmed
iate
(6
) St
ron
g (
5)
Inte
rmed
iate
(4
) W
eak
(3
)
Inte
rmed
iate
(2
) Eq
ual
(1
)
Inte
rmed
iate
(2
) W
eak
(3
)
Inte
rmed
iate
(4
) St
ron
g (
5)
Inte
rmed
iate
(6
) V
ery
stro
ng
(7
)
Inte
rmed
iate
(8
) A
bso
lute
(9
)
Criterion
Trend Analysis
Family Analysis
Trend Analysis
Environmental Analysis
Trend Analysis
Human Reliability Analysis
Trend Analysis
Design Analysis
Family Analysis
Environmental Analysis
Family Analysis
Human Reliability Analysis
Family Analysis
Design Analysis
Environmental Analysis
Human Reliability Analysis
Environmental Analysis
Design Analysis
Human Reliability Analysis
Design Analysis

Development of an Efficient Planned Maintenance Framework for Marine and Offshore Machinery
266
PART 2
Question 1
Choose from letter A-E, one that best describe your experience in the field of expertise
(please tick the appropriate box).
(A) □ 1-5 years
(B) □ 6-10 years
(C) □ 11-30 years
(D) □ Over 30 years
(E) □ None of the above
Question 2
Please give your industry position and highest academic qualification in the appropriate box.
Industry position
Highest academic qualification

Development of an Efficient Planned Maintenance Framework for Marine and Offshore Machinery
267
Questionnaire for Chapter 5
Introduction
The primary goal of this study is to select the most appropriate maintenance strategy to
optimise the operational efficiency of marine and offshore machinery under an uncertain
environment. The decision alternatives and evaluation criteria listed in Table 1 are the
parameters that need to be considered and evaluated using “fuzzy Linguistic variables
scale” techniques.
Table 1: List of Decision Alternatives and Evaluation Criteria
Decision Alternatives Evaluation Criteria
Run-to-failure maintenance Preventive maintenance Condition based maintenance Reliability centred maintenance
Equipment reliability Equipment cost Equipment safety Equipment availability Equipment downtime
Equipment reliability is perceived as the probability that an equipment system will operate
at a specified performance level for a specific period.
Equipment cost includes equipment capital cost, cost due to unplanned downtime of
equipment, labour cost, and cost involved with repair or replacement of equipment
Equipment safety is the condition of equipment being protected from or being unlikely to
cause danger, risk, or injury during operation.
Equipment availability can be defined as the degree to which the machine / equipment in
context is in a specified operable and committable state at the start of operation, when the
operation is called for at an unknown (i.e. a random) time.
A period during which an equipment or machine is not functional or cannot work is referred
to as the equipment downtime.
To proceed with the “fuzzy Linguistic variables scale” technique, an expert needs to have a
good knowledge of the linguistic variables and their corresponding trapezoidal fuzzy scales
used for measurement in this study as represented in Tables 2. The tables describe the
numerical assessment together with the linguistic meaning of each variable.
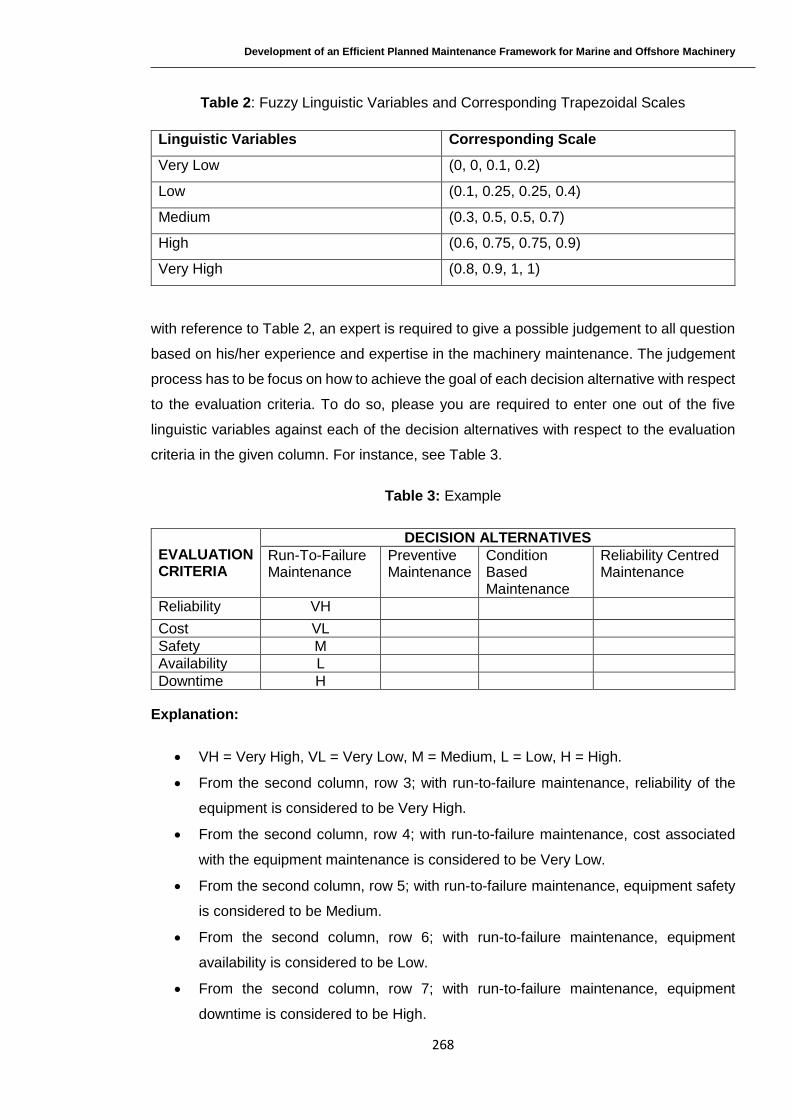
Development of an Efficient Planned Maintenance Framework for Marine and Offshore Machinery
268
Table 2: Fuzzy Linguistic Variables and Corresponding Trapezoidal Scales
Linguistic Variables Corresponding Scale
Very Low (0, 0, 0.1, 0.2)
Low (0.1, 0.25, 0.25, 0.4)
Medium (0.3, 0.5, 0.5, 0.7)
High (0.6, 0.75, 0.75, 0.9)
Very High (0.8, 0.9, 1, 1)
with reference to Table 2, an expert is required to give a possible judgement to all question
based on his/her experience and expertise in the machinery maintenance. The judgement
process has to be focus on how to achieve the goal of each decision alternative with respect
to the evaluation criteria. To do so, please you are required to enter one out of the five
linguistic variables against each of the decision alternatives with respect to the evaluation
criteria in the given column. For instance, see Table 3.
Table 3: Example
EVALUATION CRITERIA
DECISION ALTERNATIVES
Run-To-Failure Maintenance
Preventive Maintenance
Condition Based Maintenance
Reliability Centred Maintenance
Reliability VH
Cost VL
Safety M
Availability L
Downtime H
Explanation:
VH = Very High, VL = Very Low, M = Medium, L = Low, H = High.
From the second column, row 3; with run-to-failure maintenance, reliability of the
equipment is considered to be Very High.
From the second column, row 4; with run-to-failure maintenance, cost associated
with the equipment maintenance is considered to be Very Low.
From the second column, row 5; with run-to-failure maintenance, equipment safety
is considered to be Medium.
From the second column, row 6; with run-to-failure maintenance, equipment
availability is considered to be Low.
From the second column, row 7; with run-to-failure maintenance, equipment
downtime is considered to be High.

Development of an Efficient Planned Maintenance Framework for Marine and Offshore Machinery
269
Questionnaire
“I have read the information sheet provided and I am happy to participate. I
understand that by completing and returning this questionnaire I am consenting to
be part of this research study and for my data to be used as described in the
information sheet provided”
How to complete the questionnaire
This questionnaire is divided into two sections A and B. Section A is using the fuzzy
linguistic variables to determine decision alternation based on the evaluation criteria.
While Section B is about the expert’s experiences and academic qualifications.
Now, please complete the two sections of the questionnaire as instructed.
Section A
Use the five linguistics variables VL, L, M, H, and VH to fill in the empty cells
corresponding to each of the decision alternative and the evaluation criteria.
EVALUATION CRITERIA
DECISION ALTERNATIVES
Run-To-Failure Maintenance
Preventive Maintenance
Condition Based Maintenance
Reliability Centred Maintenance
Reliability
Cost
Safety
Availability
Downtime
Section B
Question 1
Choose from letter A-E, one that best describe your experience in the field of expertise
(please tick the appropriate box).
(F) □ 1-5 years
(G) □ 6-10 years
(H) □ 11-25 years
(I) □ Over 25 years
(J) □ None of the above

Development of an Efficient Planned Maintenance Framework for Marine and Offshore Machinery
270
Question 2
Please give your industry position and highest academic qualification in the appropriate box.
Industry position
Highest academic qualification