development of activated carbon derived from banana peel
TRANSCRIPT
0
Development of Activated Carbon Derived from Banana Peel for Carbon
Dioxide Removal
by
Subhashini Thangamuthu
15155
Dissertation submitted in partial fulfilment of the requirements for the
Bachelor of Chemical Engineering (Hons)
May 2014
Universiti Teknologi PETRONAS
Bandar Seri Iskandar
31750 Tronoh
Perak Darul Ridzuan

i
Development of Activated Carbon Derived from Banana Peel for Carbon
Dioxide Removal
By
Subhashini Thangamuthu
15155
Dissertation submitted in partial fulfilment of the requirements for the
Bachelor of Chemical Engineering (Hons)
May 2014
Universiti Teknologi PETRONAS
Bandar Seri Iskandar
31750 Tronoh
Perak Darul Ridzuan
ii
CERTIFICATION OF APPROVAL
Development of Activated Carbon Derived from Banana Peel for Carbon
Dioxide Removal
By
Subhashini Thangamuthu
15155
A project dissertation submitted to the
Chemical Engineering Programme
Universiti Teknologi PETRONAS
In partial fulfilment of the requirement for the
BACHELOR OF CHEMICAL ENGINEERING (HONS)
Approved by,
_________________________
(Mr.Azry Borhan)
UNIVERSITI TEKNOLOGI PETRONAS
TRONOH, PERAK
May 2014

iii
CERTIFICATION OF ORIGINALITY
This is to certify that I am responsible for the work submitted in this project, that the
original work is my own except as specified in the references and
acknowledgements, and that the original work contained herein have not been
undertaken or done by unspecified sources or persons.
_____________________________
SUBHASHINI THANGAMUTHU
iv
ABSTRACT
The focal point of this research is to study the prospective of using banana peel as
potential adsorbent for eliminating carbon dioxide from polluted air in the
atmosphere. This project work highlights on the constraints involved in the
preparation of the banana peel bio-sorbent, such as activating agent, impregnation
ratio, activation temperature and period of activation. Initially, the withered banana
peel is grinded into powder form, then chemically activated using potassium
hydroxide and activated at altered ranges of temperature and duration. This
carbonization process allows the formation of activated carbon, one of a common
type of adsorbent used globally especially in industries‟ effluent treating.
Micromeritics ASAP 2020 and Field Emission Scanning Electron Microscope were
used in identifying the best sample preparation method with the largest surface area
which directly contributes to the effectiveness of adsorbent in removing carbon
dioxide (CO2). In addition, the activated carbons developed from banana peel are
also verified for their adsorption capacity with harmful greenhouse gas such as
carbon dioxide using HPVA II analyzer. The samples were also analysed for its
elemental composition before and after carbonization which results in 60.87 wt% and
58.18 wt% of carbon content respectively. Sample A10 was identified to yield
activated carbon with largest surface area, SBET of 260.3941 m2/g and pore diameter,
0.2508 nm which falls in sub-microporous category. Sample A10 with particle size
0.25 mm was prepared using potassium hydroxide as activating agent with
impregnation ratio of 1:1 and carbonized at 400°C for two hours. This sample of A10
is then further tested for the carbon dioxide adsorption test at 25°C which proved to
adsorb carbon dioxide gas.

v
ACKNOWLEDGEMENTS
I would like to express my deepest gratitude to the Chemical Engineering
Department of Universiti Teknologi PETRONAS (UTP) for providing me the chance
to undertake this remarkable Final Year Project (FYP) course. My knowledge on
Chemical Engineering that I have already learnt throughout these four years will be
tested by solving the problem given for this project.
A very special note of thanks to my supervisor, Mr.Azry Borhan, who was
always willing to assist me and provided good support throughout the project
completion. His excellent support, patience and effective guidance brought a great
impact to my project as well as me.
Nevertheless, I would like to thank the FYP committee for arranging various
seminars as support and knowledge to assist the students in the project. The seminars
were indeed very helpful and insightful to me. I would also like to thank all lecturers
from Universiti Teknologi PETRONAS who had given me guidance throughout the
period of the project.
Besides that, I would also like to take this opportunity to express my deepest
thanks to all relative third party members who had given me guidance indirectly to
complete this final year project report. Last but not least, my heartfelt gratitude goes
to my family and friends for providing me continuous support throughout this
project.

vi
TABLE OF CONTENTS
CERTIFICATION ii - iii
ABSTRACT iv
ACKNOWLEDGEMENT v
CHAPTER 1: INTRODUCTION 1 - 6
1.1 Background of Study 1 - 2
1.2 Problem Statement 3 - 4
1.3 Objectives 5
1.4 Scope of Study 5 - 6
1.5 Relevancy of Project 6
1.6 Feasibility of Project 6
CHAPTER 2: THEORY 7 - 14
2.1 Activated Carbon 7
2.2 Adsorption 7 - 8
2.3 Banana Peel 8 - 9
2.4 Activation of Carbon from Various Precursors 9 - 13
2.4.1 Activated Carbon from Sugar Cane to Eliminate 9 - 11
Rhodamine-B
2.4.2 Activated Carbon from Coconut Shell for Carbon 11 - 12
Dioxide Removal
2.4.3 Activated Carbon from Petroleum Residue to Eliminate 12
CO2
2.4.4 Comparison between Chemical Activation and Physical 13
Activation
2.5 Factors Contributing to Development of Pores 13
2.6 Adsorption Capacity of Activated Carbon for Heavy Metals 14
vii
CHAPTER 3: METHODOLOGY 15 - 25
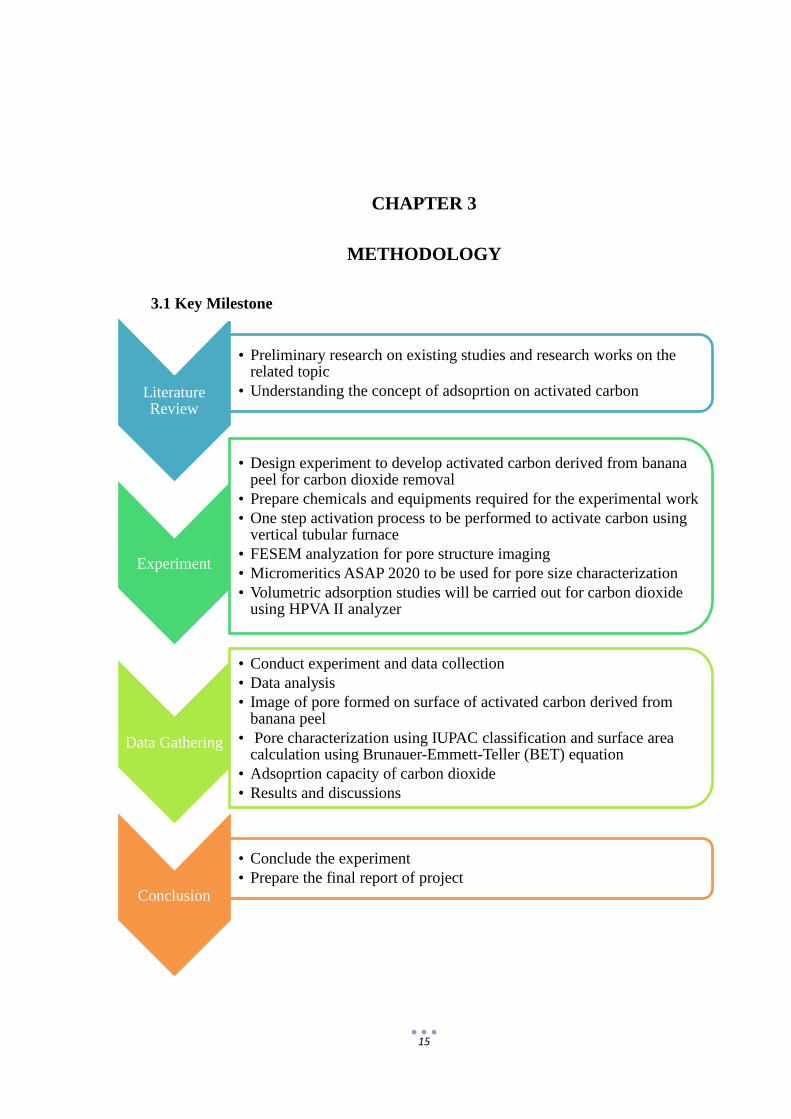
3.1 Key Milestone 15
3.2 Experiment Methodology 16 - 19
3.2.1 Banana Peel Sample Preparation 16
3.2.2 Activation of Carbon in Banana Peel 16 – 19
3.3 Characterization of Sample 19 - 23
3.4 Gantt Chart 24 - 25
CHAPTER 4: RESULTS AND DISCUSSION 26 - 36
4.1 FESEM Imaging and Elemental Composition Analysis 26 - 28
4.2 Surface Area and Porosity Analysis 29 - 30
4.3 Nitrogen Adsorption-Desorption Isotherm 31 - 32
4.4 Carbon Dioxide Adsorption Analysis 33 - 36
CHAPTER 5: CONCLUSION AND RECOMMENDATION 37 - 38
5.1 Conclusion 37
5.2 Recommendation 38
REFERENCES x – xiv
APPENDICES xv - xix

viii
LIST OF FIGURES
Figure 1 Hurricane 4
Figure 2 Earthquake 4
Figure 3 Tornado 4
Figure 4 Flood 4
Figure 5 Melting of Poles 4
Figure 6 Adsorption of Contaminated Particles 8
Figure 7 Banana Peel Wastes 9
Figure 8 Nitrogen Adsorption/Desorption Isotherm on Bagasse 10
Pith, H3PO4 Activated Carbon
Figure 9 Powdered Banana Peel 0.25 mm 16
Figure 10 Powdered Banana Peel 3.00 mm 16
Figure 11 Banana Peel Powder Soaked in KOH 17
Figure 12 Filtration of Soaked Banana Peel 18
Figure 13 Banana Peel before Carbonization 18
Figure 14 Banana Peel after Carbonization 18
Figure 15 Steps in Preparing Activated Carbon 19
Figure 16 Field Emission Scanning Electron Microscope (FESEM) 20
Figure 17 Micromeritics ASAP 2020 21
Figure 18 HPVA-II for Carbon Dioxide Adsorption Analysis 22
Figure 19 HPVA System Schematic Diagram 22
Figure 20 Raw Sample FESEM Image 27
Figure 21 Sample A10 FESEM Image 27
Figure 22 Sample A6 FESEM Image 28

ix
Figure 23 Sample A18 FESEM Image 28
Figure 24 Nitrogen Adsorption-Desorption Isotherm for Selected 31
Samples
Figure 25 Weight Percentage of Carbon Dioxide Adsorbed 33
Figure 26 Adsorption Capacity of Carbon Dioxide on Activated 34
Carbon Derived from Banana Peel
Figure 27 Adsorption Isotherm of Activated Carbon Derived from 35
Petroleum Pitch
Figure 28 Adsorption Isotherm of Activated Carbon Derived from 35
Carbon
Figure 29 Adsorption Isotherm of Activated Carbon Derived from 35
Coconut
Figure 30 Adsorption Isotherm of Activated Carbon Derived from 36
Coal, Extruded Carbon
Figure 31 Adsorption Capacity of Carbon Dioxide on Activated 36
Carbon Derived from Eucalyptus camaldulensis wood
at different temperature
LIST OF TABLES
Table 1 IUPAC Classification of Pore Sizes 11
Table 2 Lists of Tools and Equipment 23
Table 3 Lists of Substances and Chemicals Used 23
Table 4 Elemental Composition for RAW Sample and A10 Sample 26
Table 5 Surface Area and Porosity Results for Selected Samples 29

1
CHAPTER 1
INTRODUCTION
1.1 Background
This project is related to the removal of carbon dioxide from gas/air streams
focusing in adsorption by activated carbon extracted from banana peel wastes.
Globally, fossil fuel is supplied worldwide with more than 98% of the energy
necessities. Nevertheless, the burning of fossil fuels is one of the major contributors
to the greenhouse gas, carbon dioxide, CO2. It is essential to develop technologies
that will diminish greenhouse gas emissions in line with utilization of fossil fuel.
Unfortunately, the current technology to eliminate or reduce the carbon dioxide
concentration in air is costly and energy intensive. Therefore, enriched technologies
for CO2 capture are obligatory to achieve low energy drawbacks. Hence, adsorption
has been identified as one of the potential methods for removal of CO2 from gas
streams. There are several ways in removing carbon dioxide such as chemical
separation, membrane separation, and cryogenic separation as well as by adsorption.
There has been plenty of research done on viability of transforming cultivated wastes
into useful product such as activated carbon (Djilani, et.al, 2012). The ultimate aim
of this research is to develop activated carbon from banana peel and eventually
provide a suitable platform for adsorption of carbon dioxide to take place. This study
also incorporates the effectiveness of the activated carbon in removing carbon
dioxide. Remarkable adsorption effectiveness can be observed from activation of raw
materials with porous structure. Basically, there are two methods used in carbon
activation, namely the physical activation and the chemical activation (Djilani, et.al,
2012). The parameters that will be studied in this experiment are the pore

2
characteristics of activated carbon, adsorption isotherm and carbon dioxide
adsorption capacity. Generally, banana plants are part of the Musaceae family
whereas the scientific name for banana fruit is Musa × paradisiaca. The primary
purpose of the plant is to produce healthy fruits besides contributing to the
manufacturing of fibre and being ornamental plants. The physical characteristics of
banana plants are usually tall and sturdy. The stem of banana plant is capable of
producing a bunch of green banana fruits which turn yellow in colour when mature.
Commonly, banana fruits nurture in hanging bunches, with approximately 20 fruits
to a hand and 3–20 hands to a cluster. One fruit of banana weighs 125g in average
with 25% dry mass and the remaining 75% is water. Banana has been identified as
the most common fruit with largest consumption worldwide, whereby the useless
peels directly contributes to major agricultural waste. In order to overcome this
environmental issue, banana peels have been tested and verified as effective
adsorbents especially for heavy metals from industrial wastewaters as well as
gaseous pollutants. Hence, it is significant to explore agricultural by-products that
could be transformed to essential and resourceful products such as adsorbents.

3
1.2 Problem Statement
Since the 18th
century, the industrial revolution began and there has been a
rapid development in trades which directly contribute to the worldwide economy
inclination as well as human development. Discharging of the pollutants is becoming
the most provoking hazard to environment safety and even human beings‟ lives.
In this era of globalisation, as we are busy chasing after economic
development, we neglect our mother nature and ignore its consequence despite
instilling monetary values. As the individual living cost grows, we can see more cars
and buildings all around but unfortunately less trees and plants. This definitely
contributes to the greenhouse gases such as carbon dioxide which slowly depletes the
ozone layer. Carbon dioxide is a gas primarily released from combustion processes
and industrial plants, is the main contributor to global warming.
In recent years, the effects of greenhouse gases, especially carbon dioxide
were often discussed as a vital environmental issue. Carbon dioxide is an essential
and destructive greenhouse gas that is produced from increased burning of
hydrocarbons due to the industrial rebellion contributing to global warming. It was
reported that, since 1751 approximately 337 billion metric tonnes of carbon have
been released to the atmosphere due to the fossil fuels ingestion and cement
production (Boden, Marland & Andres, 2010). According to statistical survey, in the
year 2008, China holds the first place in emitting CO2 with annual emission of
7,031,916, 000 tonnes followed by United Stated with 18.27% of world emission,
that is 5,461,014, 000 tonnes. The world annual emission in 2008 is 29,888,121, 000
tonnes.
Global climate change will affect people and the environment in many ways.
Some of these impacts, like stronger hurricanes and severe heat waves, could be life
threatening. Others, like spreading weeds, will be less serious. However, as the Earth
keeps getting warmer, the negative effects are expected to outweigh the positive
ones. Humans and other living bio-organisms may face serious consequences due to
global warming which include malaria, mental illness, loss of habitat, loss of healthy
crops for food consumptions and more. Extreme heat can cause illnesses such as heat
cramps, heat stroke, and even death. Certain kinds of air pollutants, like ozone, can
make asthma and other lung conditions worse.

4
In conjunction with developing eco-friendly technology to reduce the carbon
dioxide emissions, many researches have been done with different experimental
methodology. One of the most economically and environmentally preferred
technology is adsorption by agriculture wastes. Activated carbon was significantly
plays a great role of adsorbent due to its large surface area and porosity which
benefits it to be widely used for carbon dioxide removal (Jang & Park, 2014).
Figure 1: Hurricane
Figure 3: Tornado
Figure 2: Earthquake
Figure 4: Flood
Figure 5: Melting of Poles

5
1.3 Objective
The key objective of this project is to assess the prospective of using banana
peel as a potential adsorbent in removing carbon dioxide from the industrial effluent.
Apart from that, the relationship between different preparation condition of the
banana peel and the resulting adsorption capabilities of the adsorbent is studied to
determine the pre-eminent preparation condition of converting banana peel to
activated carbon. The adsorption capacity of activated carbon as an adsorbent,
derived from banana peel in the removal carbon dioxide could also be examined
from this project.
In short, the objectives of this project are:-
1. Preparation of activated carbon derived from banana peel by chemical
activation
2. Characterization of pores of activated carbon by studying their pore size and
adsorption isotherms accordingly
3. Utilization of banana peel for carbon dioxide adsorption
1.4 Scope of Study
This project emphases on defining the optimum preparation condition to derive
activated carbon from banana peel which is used as adsorbent in removing carbon
dioxide in the air. Biosorbent adsorption is believed to carry a significant value in
removing pollutants or rather greenhouse gases such as carbon dioxide from the air.
Therefore, activated carbon derived from agricultural waste such as banana peel is
believed to perform as an efficient adsorbent to eliminate carbon dioxide. Hence, this
project is relevant as development of activated carbon derived from banana peel for
carbon dioxide removal has not been widely addressed yet. The experiment will use
potassium hydroxide (KOH) as activation agent to activate carbon content in banana
peel. The pores of activated carbon are then tested for their characteristics with
nitrogen (N2) gas. The experiment is repeated for different operating parameters:

6
1. Impregnation ratio
2. Activation temperature
3. Activation time
The scope of the activation temperature is limited between 400°C to 600°C and
the activation time is limited to 1 hour and 2 hours respectively. The impregnation
ratio and the particle size are also among the parameters that are deliberate in order
to determine adsorption effectiveness of banana peel based adsorbent. On the other
hand, this project also discovers the effectiveness of the banana peel based adsorbent
in terms of removing harmful greenhouse gas, that is, carbon dioxide.
1.5 Relevancy of Project
This project emphases on defining the optimum preparation condition to
derive activated carbon from banana peel which is used as adsorbent in removing
carbon dioxide in the air. Biosorbent adsorption is believed to carry a significant
value in removing pollutants or rather greenhouse gases such as carbon dioxide from
the air. Therefore, agricultural waste, activated carbon derived from banana peel is
believed to perform as an efficient adsorbent to eliminate carbon dioxide. Hence, this
project is relevant as development of activated carbon derived from banana peel for
carbon dioxide removal has not been widely addressed yet.
1.6 Feasibility of Project
This project is feasible as it deals with narrowed scope of experiment
whereby only three parameters are tested. It is within capability to be executed with
helps and guidance from the supervisor and the coordinator. It is positive that this
project can be completed within the time allocated with the acquiring of equipment
and materials needed. The time frame for this project work is about 28 weeks.

7
CHAPTER 2
LITERATURE REVIEW
2.1 Activated Carbon
Activated carbon is known as charcoal that was preserved with oxygen to
expose millions of tiny pores between the carbon atoms. Activated carbon possesses
remarkable adsorptive capacity is vital for numerous dissolved organics and chlorine
as well as the capability to adapt for precise application. Thermal decomposition
method is used to convert carbon-based materials into activated carbon using furnace
at controlled temperature and pressure. Adsorption takes place on the resulting huge
surface with web of sub-microscopic pores. Amazingly, one pound of carbon
provides a surface area equivalent to six football fields (Jang & Park, 2014).
2.2 Adsorption
Adhesion of particles of any form of matter to a surface is known as
adsorption. A film of adsorbate on the surface of the adsorbent is formed due to
adsorption. Comparatively, absorption includes the entire volume matter while
adsorption takes place at surface of the material. Similar to surface tension,
adsorption is a consequence of surface energy whereby, atoms fill in the bonding
requirement of bulk material atoms. Nevertheless, atoms on the surface of the
adsorbent are not completely enclosed by other adsorbent atoms and hence can invite
adsorbates. Generally, the adsorption process is classified as physisorption or
chemisorption. Activated carbon works by means of physical adsorption in removing
water contaminants. Simply, physical adsorption occurs due to exertion of

8
attractive forces by all molecules, especially molecules at the surface of a solid (pore
walls of carbon). Eventually, these surface molecules hunt for other molecules to
adhere to. Adsorption of water contaminants is due to the stronger attraction of the
carbon surface compared to the attractive forces in solution. Neutral or non-polar
organic compounds with lower water solubility and higher molecular weight are
more adsorbable onto activated carbon.
Figure 6: Adsorption of contaminated particles
2.3 Banana Peel
A banana peel is the outer skin layer which covers the soft yellowish banana
fruit. Bananas gained its popularity globally with yearly making approximately 145
million tonnes, whereby, with regard to its consumption, there is a contribution to
enormous amount of banana peel waste as well. According to the Survey Report on
the Distribution and Waste Disposal of Bananas by the Association of Australian
Banana Wholesalers 2006, 68.6 tonnes of bananas collected as raw material waste
annually. The banana waste disposed at municipal tip or collected as organic waste
was 87%. On average, banana peels contain 6-9% dry matter of protein and 20-30%
fibre. On the other hand, in Malaysia, there is 29,270 hectare of banana planted in the
year 2012 producing 294,530 metric ton of fresh banana. The total value of banana
production was estimated about RM 294.5 million in the same year. In addition, the
most common type of banana cultivated in Malaysia is the Cavendish type. Banana
peels are also used for water purification, and ethanol, cellulose as well as laccase
production. This agricultural waste material is composed mainly of lignin and
cellulose (Deithorn & Mazzoni, 2014). Cellulose can be used as an adsorbent for the
carboxyl and hydroxyl functional group which becomes the active binding site of the

9
metal (Deithorn & Mazzoni, 2014). Besides that, elements such as extractives, lipids,
proteins, simple sugars, starches, water, hydrocarbons, ash, and other components
with numerous functional groups are also comprised. Besides that, these components
contained in banana peel facilitate the metal complexations which directly aid the
sequestering of heavy metals as well as exhibit metal biosorption capacity (Deithorn
& Mazzoni, 2014).
Figure 7: Banana peel wastes (Deithorn & Mazzoni, 2014)
2.4 Activation of Carbon from Various Precursors
2.4.1 Activated Carbon from Sugar Cane to Eliminate Rhodamine-B
The primary objective of the study is to investigate the feasibility of
developing an efficient adsorbent from agricultural waste through chemical
activation using phosphoric acid (H3PO4) and potassium hydroxide (KOH) as
activating agent. In addition, this study also comprises the adsorption capacity of
activated carbon produced from bagasse pith by removal of dye from aqueous
solutions, especially in wastewater treatment systems. The bagasse pith collected
from sugar cane is used as precursor for carbon activation using one-step activation
method which requires activation agent such as phosphoric acid (H3PO4) or
potassium hydroxide (KOH). Once the bagasse pith is completely soaked, they are
dried in oven at 80°C overnight and then carbonized in tubular electric furnace which
is open at both ends. The carbonization was done at 500°C for 80 minutes in limited
air condition. The pore characteristics and surface area of the activated carbon was
studied using nitrogen adsorption-desorption in a gas sorption analyser at -196°C.
Batch adsorption experiments were done for sorption studies using Rhodamine-B
10
(RhB) as adsorbate and activated carbon derived from bagasse pith as adsorbent
(Gad & El-Sayed, 2009).
The factors determining the adsorption capacity was identified which include:
i. Physical nature of adsorbent (activated carbon) pore characteristics
ii. Features of adsorbate (dye)
iii. Solution circumstances
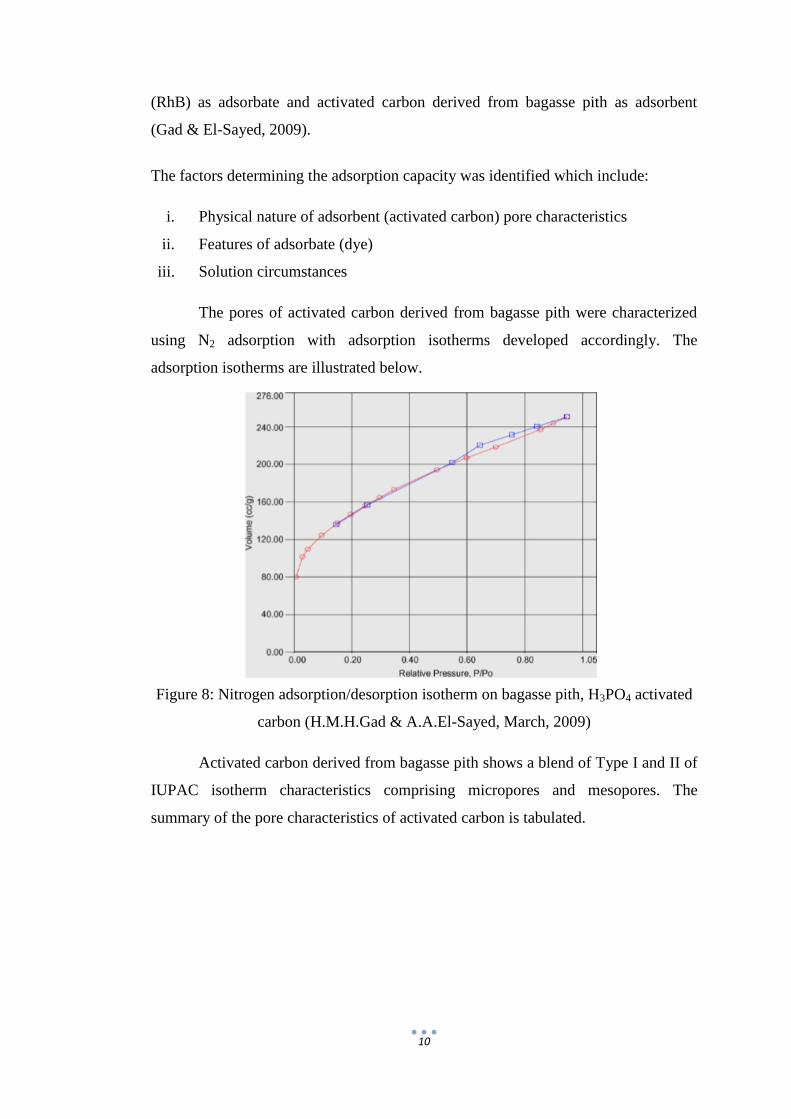
The pores of activated carbon derived from bagasse pith were characterized
using N2 adsorption with adsorption isotherms developed accordingly. The
adsorption isotherms are illustrated below.
Figure 8: Nitrogen adsorption/desorption isotherm on bagasse pith, H3PO4 activated
carbon (H.M.H.Gad & A.A.El-Sayed, March, 2009)
Activated carbon derived from bagasse pith shows a blend of Type I and II of
IUPAC isotherm characteristics comprising micropores and mesopores. The
summary of the pore characteristics of activated carbon is tabulated.
11
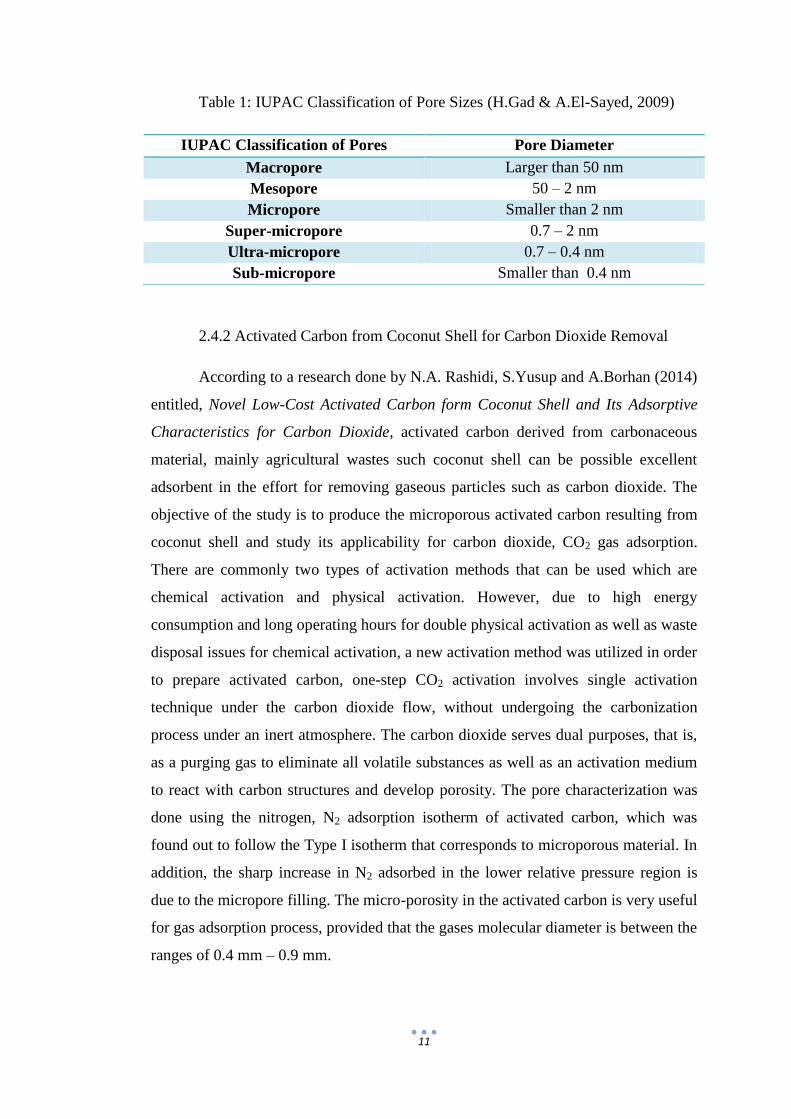
Table 1: IUPAC Classification of Pore Sizes (H.Gad & A.El-Sayed, 2009)
2.4.2 Activated Carbon from Coconut Shell for Carbon Dioxide Removal
According to a research done by N.A. Rashidi, S.Yusup and A.Borhan (2014)
entitled, Novel Low-Cost Activated Carbon form Coconut Shell and Its Adsorptive
Characteristics for Carbon Dioxide, activated carbon derived from carbonaceous
material, mainly agricultural wastes such coconut shell can be possible excellent
adsorbent in the effort for removing gaseous particles such as carbon dioxide. The
objective of the study is to produce the microporous activated carbon resulting from
coconut shell and study its applicability for carbon dioxide, CO2 gas adsorption.
There are commonly two types of activation methods that can be used which are
chemical activation and physical activation. However, due to high energy
consumption and long operating hours for double physical activation as well as waste
disposal issues for chemical activation, a new activation method was utilized in order
to prepare activated carbon, one-step CO2 activation involves single activation
technique under the carbon dioxide flow, without undergoing the carbonization
process under an inert atmosphere. The carbon dioxide serves dual purposes, that is,
as a purging gas to eliminate all volatile substances as well as an activation medium
to react with carbon structures and develop porosity. The pore characterization was
done using the nitrogen, N2 adsorption isotherm of activated carbon, which was
found out to follow the Type I isotherm that corresponds to microporous material. In
addition, the sharp increase in N2 adsorbed in the lower relative pressure region is
due to the micropore filling. The micro-porosity in the activated carbon is very useful
for gas adsorption process, provided that the gases molecular diameter is between the
ranges of 0.4 mm – 0.9 mm.
IUPAC Classification of Pores Pore Diameter
Macropore Larger than 50 nm
Mesopore 50 – 2 nm
Micropore Smaller than 2 nm
Super-micropore 0.7 – 2 nm
Ultra-micropore 0.7 – 0.4 nm
Sub-micropore Smaller than 0.4 nm

12
At raised temperature, the adsorbed molecules on the carbons‟ surface
achieve sufficient energy to overcome the van der Waals bonding and interchange to
the gas phase over again. It was also observed that nitrogen adsorption capacity is
lower compared to carbon dioxide regardless of the temperature. Carbon dioxide
possesses smaller molecular diameter which is approximately 0.33 nm. This enables
better diffusivity into the porous network in the samples compared to nitrogen which
has a molecular dimension of 0.364 nm. Besides that, commercial activated carbon
reports higher adsorption capacity compared to the synthesized activated carbon due
to its bigger surface area which provides larger site for adsorption to take place
(Rashidi, Yusup & Borhan, 2014).
2.4.3 Activated Carbon from Petroleum Residue to Eliminate CO2
A sorbent is certified to be industrially keen when it is porous, comprises of
high adsorptive capacity as well as selectivity towards carbon dioxide (CO2). High
pressure working unit, Pressure-Swing Adsorption (PSA) is used to give a better
understanding on critical porous structure of activated carbon under extreme
conditions. Activated carbon based on petroleum residue correlate a vastly developed
micro- and meso-porous structure which offers great adsorption capacity,
extraordinary selectivity towards CO2 with an easy regeneration under trivial
surroundings (Casco et.al, 2014).
Manometric equipment that is totally automated was used to study high-
pressure analysis. Type I isotherm was exhibited by low ratio samples, thus
demonstrating the existence of a fine micropore size network. Increase in
concentration of activating agent results in progress of novel micropores as well as
broadening of existing pores. Sample activated with lowest ratio of potassium
hydroxide (KOH) signifies highest amount of carbon dioxide adsorbed. Conversely,
this inclination is totally inverted beyond 4.5 MPa (Casco et.al, 2014). Consequently,
CO2 adsorption at atmospheric and high-pressure restores tiny micropores to enhance
the adsorption capacity especially at atmospheric pressure whereas larger micropores
and also small mesopores manage the adsorption at higher pressures (Casco et.al,
2014).

13
2.4.4 Comparison between Chemical Activation and Physical Activation
Chemical activation is preferred compared to physical activation with regard
to low temperatures and short time for activation (Gad & El-Sayed, 2009). Physical
activation takes place with hot gases as activating agents like carbon dioxide and
steam. On the other hand, carbon yield is increased by using chemical agents which
act as dehydrating agents contributing to pyrolytic disintegration and hinder tar
production (Gad & El-Sayed, 2009). In addition, oxygenated surfaces of activated
carbon are formed due to chemical activation method. Therefore, there are significant
advantages of chemical activation compared to physical activation with respect to
greater yield with enhanced surface area as well as improved porous formation (Gad
& El-Sayed, 2009).
2.5 Factors Contributing to Development of Pores
In a study by Y. Örküna et.al entitled Influence of Temperature and
Impregnation Ratio of H3PO4 on the Production of Activated Carbon from Hazelnut
Shell, chemical activation of carbon is utilized with the usage of phosphoric acid
(H3PO4). Operating parameters that were studied are concentration of activating
agents used, activating temperature and activation time in interest to study the effects
of operating circumstances on evolutions of pore volume and pore size of activated
carbons derived from hazelnut shell (Örkün, Karatepe, & Yavuz, 2012). The particle
sizes of hazelnut that were impregnated are between 0.85 mm and 1.0 mm. Three
impregnation ratios that were prepared are 35wt%, 50wt% and 60wt%. The BET
surface areas (SBET), micropore volumes (Vmi) and mesopore volumes (Vme) of the
activated carbon samples were calculated from the N2 adsorption isotherms using the
BET equation. The result shows Type I isotherm which suits the Brunauer, Deming,
and Teller (BDT) classification, representing unimolecular adsorption (Örkün,
Karatepe, & Yavuz, 2012). It was stated that this type of isotherm applies in
adsorbent with small pore sizes of micropores range. The pore size and pore volume
enhance until 450°C and shows reduction in pores due to an rise in temperature.
Longer activation time up to 3 hours increases and widens the pores which prove that
prolonged carbonization is desired to ensure complete development of porosity at
given temperature (Örkün, Karatepe, & Yavuz, 2012).

14
2.6 Adsorption Capacity of Activated Carbon for Heavy Metals
According to Biosorption of Heavy Metal Ions from Industrial Waste Water
by Banana Peel Based Biosorbent written by P.K. Hoong, it was proven that the
optimum activation temperature would be at 400°C as any temperature higher than
that yields poor results of activated carbon with low yield of SBET. In addition,
samples with larger particle size also demonstrate lower SBET compared to smaller
particles due to smaller surface area available for activation during impregnation.
Furthermore, high impregnation ratio is deduced not to be desirable for zinc chloride
unless high activation temperature used.
Sample A20 has the largest SBET among all the other sample analysed. Its
adsorption isotherm evidently follows Type III which is related to the physical
adsorption of gases whereby the adsorbent-adsorbate interaction is weak compared to
the adsorbate-adsorbate interaction.
In the adsorption capacity test, sample A20, which the banana peel is
impregnated with phosphoric acid, ratio 1:1 and carbonized at 400° for 2 hours is
selected to be used in the batch adsorption of crude oil and heavy metals, which are
Zn, Pb and Cu. The result of the test shows that the samples are effective in
removing oil & grease particles and the selected heavy metals from their respective
solution, which could be attributed to the high value of SBET.
15
Literature Review
• Preliminary research on existing studies and research works on the related topic
• Understanding the concept of adsoprtion on activated carbon
Experiment
• Design experiment to develop activated carbon derived from banana peel for carbon dioxide removal
• Prepare chemicals and equipments required for the experimental work
• One step activation process to be performed to activate carbon using vertical tubular furnace
• FESEM analyzation for pore structure imaging
• Micromeritics ASAP 2020 to be used for pore size characterization
• Volumetric adsorption studies will be carried out for carbon dioxide using HPVA II analyzer
Data Gathering
• Conduct experiment and data collection
• Data analysis
• Image of pore formed on surface of activated carbon derived from banana peel
• Pore characterization using IUPAC classification and surface area calculation using Brunauer-Emmett-Teller (BET) equation
• Adsoprtion capacity of carbon dioxide
• Results and discussions
Conclusion
• Conclude the experiment
• Prepare the final report of project
CHAPTER 3
METHODOLOGY
3.1 Key Milestone

16
3.2 Experiment Methodology
3.2.1 Banana peel sample preparation
Banana peel wastes of weight approximately 6 kg were collected from fried
banana stalls nearby in use of this project work. They are thoroughly washed in order
to remove muck and cut into smaller pieces. The washed banana peels are kept in
open atmosphere to evaporate dampness from its surface and dried in microwave
oven at 80°C for two nights to remove excess moisture. Once the banana peels are
completely dry, they are grinded into smaller pieces until become powder form.
After grinding, the banana peels are sieved to separate particles of different size and
kept in air tight container for activation (Rashidi, Yusup, & Borhan, 2014).
Figure 9: Powdered banana peel 0.25 mm Figure 10: Powdered banana peel 3.00mm
3.2.2 Activation of carbon in banana peel
The parameters which are manipulated in the activation phase of the activated
carbon derived from banana peel are the impregnation ratio, carbonizing temperature
as well as duration of carbon activation. The activation agent used in this study is
potassium hydroxide (KOH). Potassium hydroxide is chosen in this study based on
the previous researches conducted on similar lignocelluloic precursor and the results
of using the above mentioned chemical shows better pore formation in the activated
carbon compared to available chemicals (Ademiluyi & David-West, 2012), (Borhan
& Kamil, 2012), (Diao, Walawender, & Fan, 2002), (Toles, Marshall, Johns,
Wartelle, & McAloon, 2000). The impregnation ratio studied in this project is 1:1,
1:2, and 1:3. Impregnation ratio is the dry weight of powdered banana peel, WBP
divided by the dry weight of activation agent used, WKOH.
17
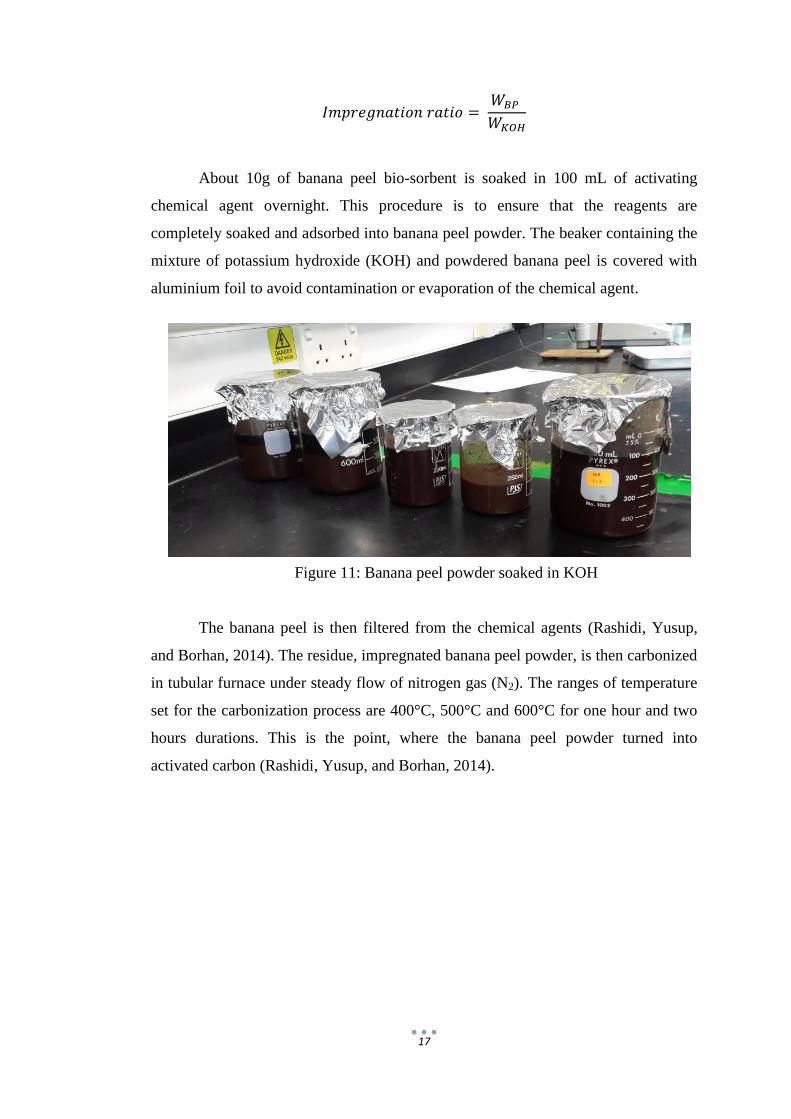
About 10g of banana peel bio-sorbent is soaked in 100 mL of activating
chemical agent overnight. This procedure is to ensure that the reagents are
completely soaked and adsorbed into banana peel powder. The beaker containing the
mixture of potassium hydroxide (KOH) and powdered banana peel is covered with
aluminium foil to avoid contamination or evaporation of the chemical agent.
Figure 11: Banana peel powder soaked in KOH
The banana peel is then filtered from the chemical agents (Rashidi, Yusup,
and Borhan, 2014). The residue, impregnated banana peel powder, is then carbonized
in tubular furnace under steady flow of nitrogen gas (N2). The ranges of temperature
set for the carbonization process are 400°C, 500°C and 600°C for one hour and two
hours durations. This is the point, where the banana peel powder turned into
activated carbon (Rashidi, Yusup, and Borhan, 2014).

18
Figure 13: Banana peel before
carbonization
Figure 14: Banana peel after
carbonization
Figure 12: Filtration of soaked banana peel
Once the samples burned in furnace have cooled down to room temperature,
they are washed repetitively to ensure the samples are free from chemical traces.
This measure is to ensure there are no traces amounts of impurities which may trap in
the pores of activated carbon and eventually, interrupt the adsorption activity of
carbon dioxide later.
Lastly, the samples are placed in respective tubes with correct labelling and
stored in an impenetrable container to prevent humidity contaminating the samples.
Each set of parameters is used for two particle sizes of banana peel powder, which
are 0.25mm and 3.00mm. In total, there are 36 samples to be prepared for all the
combination of parameters under study.

19
The preparation condition and the status of each sample can be found in
APPENDIX while the breakdown of sample preparation is illustrated in the figure
below:
Figure 15: Steps in Preparing Activated Carbon
3.3 Characterization of Sample
In order to analyse and characterize the samples accordingly, several
analysing equipment have been utilized. First and foremost, Field Emission Scanning
Electron Microscope (FESEM) was used to give magnified images of the surface of
activated carbon derived from banana peel. This is to ensure the formation of
adsorption sites, also known as pores. FESEM with ultra-high-resolution imaging is
designed to fulfil the requirements of analysing up to nano scale surface structure and
morphology of solids. The characteristic X-rays generated are used for identification
of different elements present in the specimen by energy dispersive spectrometer
(EDS). This EDS technology is used to detect the element composition in the
samples before and after activation in order to study whether the carbon content in
activated carbon of banana peel is adequate for commercial production of activated
carbon.
BANANA PEEL
0.25 mm 3.00 mm
KOH KOH
1:1 1:2 1:3 1:1 1:2 1:3
400°C 500°C 600°C 400°C 500°C 600°C
1 hour 2 hours 1 hour 2 hours

20
Figure 16: Field Emission Scanning Electron Microscope (FESEM)
In addition, the pore size distribution, specific surface area as well as the
porosity of the samples is determined by the nitrogen adsorption-desorption
isotherms characterized by the Micromeritics ASAP 2020. This equipment operates
using nitrogen gas as adsorbate while being degassed at 350°C for 4 hours. The
specific surface area of the bio-sorbent samples is estimated by the Brunauer-
Emmett-Teller (BET) method using the N2 adsorption isotherm data while for the
pore size distribution, the Barett-Joyner-Halenda (BJH) adsorption model is used
(Borhan & Kamil, 2012). The formation of mesopores or smaller is strongly desired
in the sample to be qualified as activated carbon (Borhan & Kamil, 2012).

21
Figure 17: Micromeritics ASAP 2020
Last but not least, High Pressure Volumetric Analyser (HPVA-II) was used to
study the carbon dioxide adsorption capacity on activated carbon derived from
banana peel. The HPVA Series of gas adsorption analysers from Particulate Systems
is designed to obtain high-pressure adsorption isotherms using gases such as
hydrogen, methane, and carbon dioxide using the static volumetric method. The
volumetric technique consists of introducing (dosing) a known amount of gas, carbon
dioxide in this case (adsorptive), into the chamber containing the sample to be
analysed. When the sample (activated carbon) reaches equilibrium with the adsorbate
gas, the final equilibrium pressure is recorded. These data are then used to calculate
the quantity of gas adsorbed by the sample. This process is repeated at given pressure
intervals until the maximum preselected pressure is reached. Each of the resulting
equilibrium points (volume adsorbed and equilibrium pressure) is then plotted to
provide an isotherm. Excellent reproducibility and accuracy are obtained by using
separate transducers for dosing the sample and for monitoring the pressure in the
sample chamber.

22
Figure 18: HPVA-II for Carbon Dioxide Adsorption Analysis
Figure 19: HPVA System Schematic Diagram

23
1. Tools and Equipment
Table 2: Lists of tools and equipment
No Equipment Uses
1 Field Emission Scanning
Electron Microscope
(FESEM)
To provide magnified view of the
activated carbon structure derived from
banana peel
2 Surface Area Analyzer and
Porosimetry Systems
(MICROMERITICS ASAP
2020)
To determine the pore size distribution,
specific surface area and porosity of the
banana peel activated carbon through
nitrogen adsorption-desorption isotherms
3 Drying Oven To remove moisture from banana peel
4 Tubular Furnace To carbonize banana peel into activated
carbon
5 HPVA II Analyzer To test the adsorption capacity of carbon
dioxide on prepared activated carbon
2. Substance and Chemicals
Table 3: Lists of substances and chemicals used
No Materials Purpose
1 Banana Peel To be used as raw material to develop
activated carbon in removal of carbon
dioxide
2 Potassium Hydroxide (KOH) To impregnate powdered banana peel
by means of chemical activation to
increase pore volume for adsorption
24
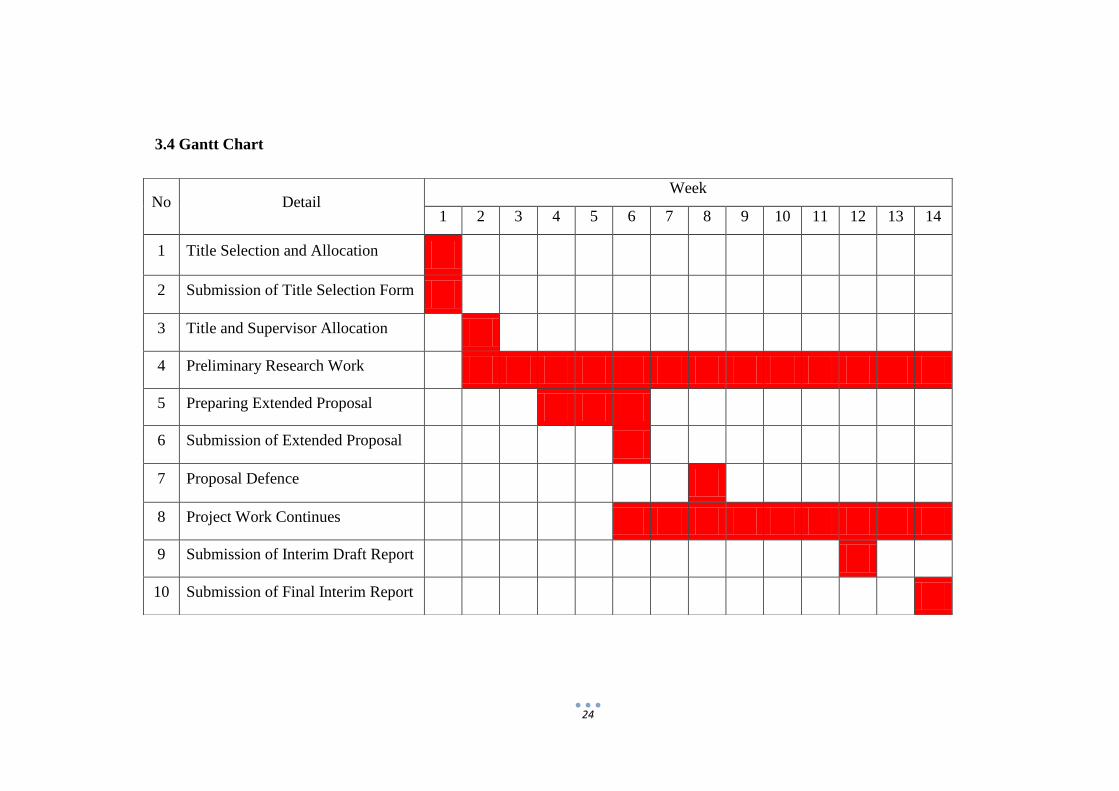
3.4 Gantt Chart
No Detail Week
1 2 3 4 5 6 7 8 9 10 11 12 13 14
1 Title Selection and Allocation
2 Submission of Title Selection Form
3 Title and Supervisor Allocation
4 Preliminary Research Work
5 Preparing Extended Proposal
6 Submission of Extended Proposal
7 Proposal Defence
8 Project Work Continues
9 Submission of Interim Draft Report
10 Submission of Final Interim Report

25
No Detail Week
15 16 17 18 19 20 21 22 23 24 25 26 27 28
11
Project Work Continues
Samples sent for characterization
Test adsorption capacity with HPVA II analyser
Collect results and discuss the result obtained
12 Submission of Progress Report
13 Pre-SEDEX Presentation
14 Submission of Technical Paper
15 Submission of Dissertation
16 Oral Presentation
17 Submission of Final Project Report

26
CHAPTER 4
RESULTS AND DISCUSSION
4.1 FESEM Imaging and Elemental Composition Analysis
The production of activated carbon is defined as the fraction of dry weight of
activated carbon yielded to that of the powdered banana peel. The formula for the
calculation of yield (Diao, Walawender, & Fan, 2002) is as below:
Whereby:
MAC = dry mass of the activated carbon after washing (g)
MBP = original mass of the banana peel powder before carbonization (g)
Table 4: Elemental Composition for RAW Sample and Sample A10
Element Before Carbonization (RAW) After Carbonization (A10)
Weight % Atomic % Weight % Atomic %
Carbon, C 60.87 67.85 58.18 72.55
Oxygen, O 23.74 25.35 25.19 23.57
Silicon, Si 0.43 0.26 0.63 0.34
Potassium, K 14.96 6.54 15.37 3.27
Chlorine - - 0.63 0.27
Total 100 100 100 100
27
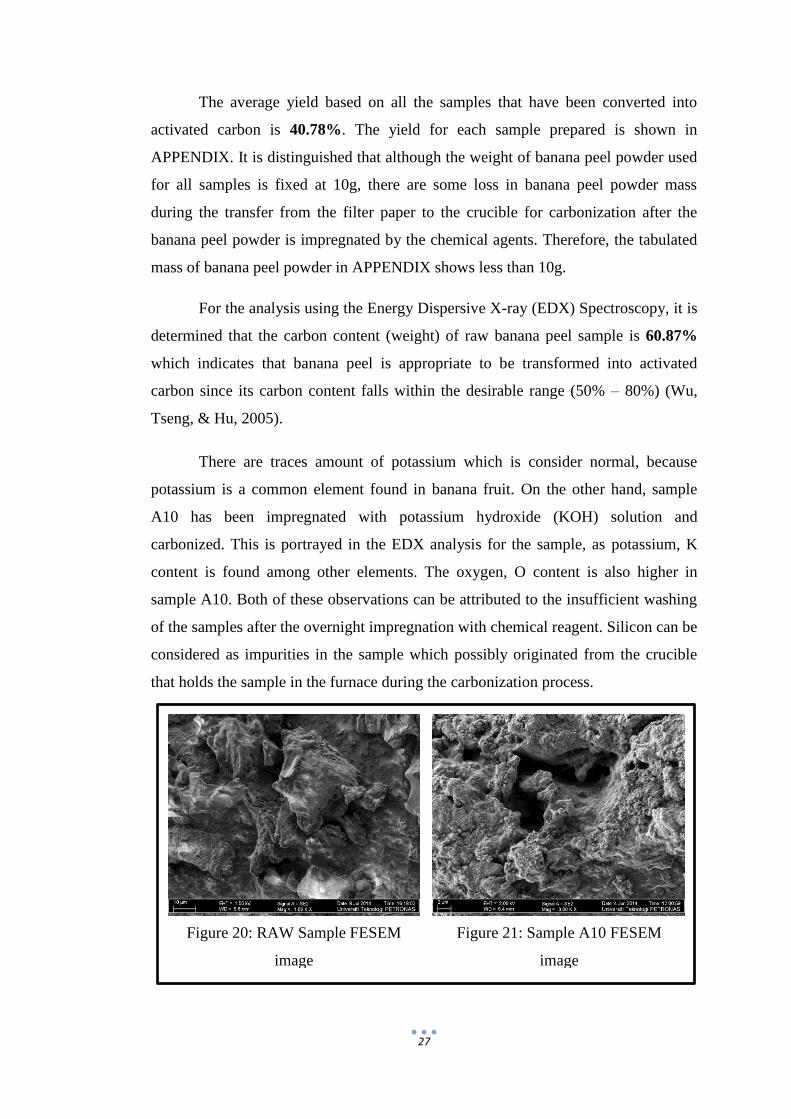
Figure 20: RAW Sample FESEM
image
Figure 21: Sample A10 FESEM
image
The average yield based on all the samples that have been converted into
activated carbon is 40.78%. The yield for each sample prepared is shown in
APPENDIX. It is distinguished that although the weight of banana peel powder used
for all samples is fixed at 10g, there are some loss in banana peel powder mass
during the transfer from the filter paper to the crucible for carbonization after the
banana peel powder is impregnated by the chemical agents. Therefore, the tabulated
mass of banana peel powder in APPENDIX shows less than 10g.
For the analysis using the Energy Dispersive X-ray (EDX) Spectroscopy, it is
determined that the carbon content (weight) of raw banana peel sample is 60.87%
which indicates that banana peel is appropriate to be transformed into activated
carbon since its carbon content falls within the desirable range (50% – 80%) (Wu,
Tseng, & Hu, 2005).
There are traces amount of potassium which is consider normal, because
potassium is a common element found in banana fruit. On the other hand, sample
A10 has been impregnated with potassium hydroxide (KOH) solution and
carbonized. This is portrayed in the EDX analysis for the sample, as potassium, K
content is found among other elements. The oxygen, O content is also higher in
sample A10. Both of these observations can be attributed to the insufficient washing
of the samples after the overnight impregnation with chemical reagent. Silicon can be
considered as impurities in the sample which possibly originated from the crucible
that holds the sample in the furnace during the carbonization process.

28
Based on the FESEM imaging, Figure 20 displays the passage construction in
raw banana peel sample, which is essential in production of activated carbon. The
canal permits the banana peel powder to absorb the chemical activation agent to
activate pore development. On the other hand, Figure 21 is the 3000 times
magnification on sample A10. The image clearly shows that pores have already been
formed on the sample at 400°C and two hours of carbonization. More well-structured
pores are observed on the surface morphology of sample A6 as shown in Figure 22,
but at 500°C of carbonization temperature for one hour, the porous wall are broken
slightly. However, Figure 23 shows the effect of implying excessive heat during
carbonization, which is 600°C for two hours. This indicates that at 600°C of
temperature, the heat is excessive for the sample which results in the knocking and
breaking of the porous formation in the sample (Borhan & Kamil, 2012). In addition,
the carbonization period is also too long which deteriorates the formation of
activated carbon.
Figure 22: Sample A6 FESEM
image
Figure 23: Sample A18 FESEM
image

29
4.2 Surface Area and Porosity Analysis
Table 5: Surface area and porosity results for selected samples
Sample
Label IR
A.Temperature
(°C)
A.Period
(hours)
SBET
(m2/g)
VT
(cm3/g)
D (nm)
A1 1:1 400 1 31.4678 0.01593 4.5137
A10 1:1 400 2 260.3841 0.01436 0.2508
A19 1:1 300 2 258.2218 0.01297 0.2078
A6 1:3 500 1 3.7594 0.00472 1.9763
A8 1:2 600 1 2.5643 0.00294 0.7908
B11 1:2 400 2 40.0171 0.00705 2.8672
B15 1:3 500 2 1.6729 0.00397 1.0927
B18 1:3 600 2 10.5239 0.00206 0.2746
B2 1:2 400 1 7.8026 0.01273 6.0024
The table above shows the resulting surface area of the pore formed on
activated carbon derived from banana peel at different preparation conditions. Based
on the results, it shows that 400°C is the maximum carbonization temperature for
banana peel based activated carbon and any higher activation temperature than
400°C produces deprived results.
Samples B2, B11, B15, and B18 are all carbonized at 400°C, 500°C and
600°C respectively, yield low SBET with the exception of sample A10, which is
carbonized at 400°C for 2 hours, but yields comparatively higher SBET. In addition,
group B samples which are of bigger particle size (3.00mm) during grinding, yields
smaller surface area, SBET compared to that group A samples with smaller particle
size (0.25mm). This phenomenon occurs because larger particle size exposes less
surface area for activation during impregnation phase, thus resulting in smaller SBET.
Commonly, pore broadening will occur due to the rise in activation
temperature and the impregnation ratio of KOH. Due to carbon gasification

30
enhancement with elevated KOH ratio, the pore size in activated carbon is enlarged
together with the porosity. Raising the activation temperature directly increases the
reaction rate of C-KOH reaction, causing increased carbon burn-off. Since KOH
reagent is a strong base, it enables the interface with carbon atoms to increase the
rate of dehydrogenation and oxidation, inviting the rise in tar formation and
development of porosity (Mopoung, 2008). Samples containing large compositions
of potassium element explain that high impregnation ratio yields potassium
carbonate, K2CO3 and potassium oxide, K2O during pyrolysis. Therefore, we can
conclude that higher impregnation ratio forms insulating layer which covers the
particles and reduces the interaction of pores and surrounding environment, thus
resulting in lower activation rate (Mopoung, 2008).
Besides, by comparing between samples A6 and A8, results show that high
impregnation ratio is not desired for KOH activation as it reduces the efficiency of
pore formation with smaller surface area compared to those which are impregnated at
smaller ratio. The highly microporous activated carbon shifts to a different form,
where the mesopores become governing in whole pore size distribution, especially
exceeding the certain limit of activating agent (Örkün, Karatepe, and Yavuz, 2011).
It is also noticeable that as the concentration of activating agent crosses its limit,
there will be a significant change in pore size developments due to high composition
of phosphorous which will react with lignocellulosic contents during activation as
well as impregnation phases (Örkün, Karatepe, and Yavuz, 2011). In addition, the
higher the impregnation ratio, the higher the amount of dehydrating agent which
further promotes pore formation. Unfortunately, when the limit is exceeded, again it
reduces the pore formation (Cao, .Xie, Liv, & Bao, 2006). Hence, the excessive
activating chemical decomposes into water resulting in gasification under high
temperature (Hoong & Borhan, 2013).
Lastly, it is also been proved that all the samples analysed are at most to
contain pores of class mesoporosity. The results also shows that sample A10 yields
the biggest surface area, SBET with area 260.3841 m2/g with pore diameter 0.2508 nm
of sub-microporous group. Since sample A10 exhibits the best result among others,
thus, this sample was utilized to study the adsorption capacity of carbon dioxide.
31
0
5
10
15
20
25
30
0 0.2 0.4 0.6 0.8 1
Qu
anti
ty A
dso
rbe
d (
cm3 /
g ST
P)
Relative Pressure (P/Po)
N2 Adsorption-Desorption Isotherm
A10
A6
A8
A19
B11
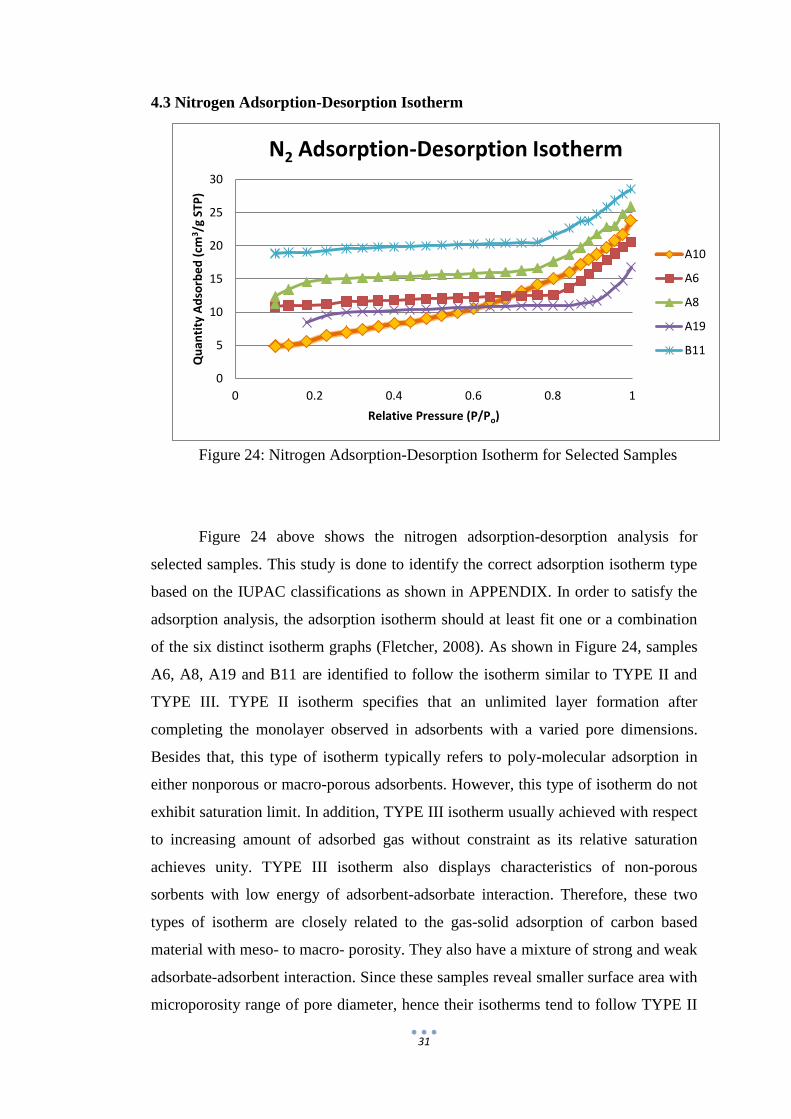
4.3 Nitrogen Adsorption-Desorption Isotherm
Figure 24: Nitrogen Adsorption-Desorption Isotherm for Selected Samples
Figure 24 above shows the nitrogen adsorption-desorption analysis for
selected samples. This study is done to identify the correct adsorption isotherm type
based on the IUPAC classifications as shown in APPENDIX. In order to satisfy the
adsorption analysis, the adsorption isotherm should at least fit one or a combination
of the six distinct isotherm graphs (Fletcher, 2008). As shown in Figure 24, samples
A6, A8, A19 and B11 are identified to follow the isotherm similar to TYPE II and
TYPE III. TYPE II isotherm specifies that an unlimited layer formation after
completing the monolayer observed in adsorbents with a varied pore dimensions.
Besides that, this type of isotherm typically refers to poly-molecular adsorption in
either nonporous or macro-porous adsorbents. However, this type of isotherm do not
exhibit saturation limit. In addition, TYPE III isotherm usually achieved with respect
to increasing amount of adsorbed gas without constraint as its relative saturation
achieves unity. TYPE III isotherm also displays characteristics of non-porous
sorbents with low energy of adsorbent-adsorbate interaction. Therefore, these two
types of isotherm are closely related to the gas-solid adsorption of carbon based
material with meso- to macro- porosity. They also have a mixture of strong and weak
adsorbate-adsorbent interaction. Since these samples reveal smaller surface area with
microporosity range of pore diameter, hence their isotherms tend to follow TYPE II

32
and TYPE III isotherms which supposing describes the isotherm of larger porosity.
Figure 24 also illustrates the adsorption isotherm for the largest surface area yielding
sample, that is, sample A10. Adsorption isotherm of A10 clearly follows TYPE III
isotherm which is related to weak interaction of adsorbent-adsorbate, commonly
found in physical adsorption of gases of microporous adsorbent. This result is
evident with BET surface area analysis proving that the pores are in sub-
microporosity group with pore diameter, 0.2508 nm.
33
0.00
0.02
0.04
0.06
0.08
0.10
0.12
0.0 0.2 0.4 0.6 0.8 1.0 1.2 1.4
We
igh
t %
Ps (bar)
Weight Percentage Plot
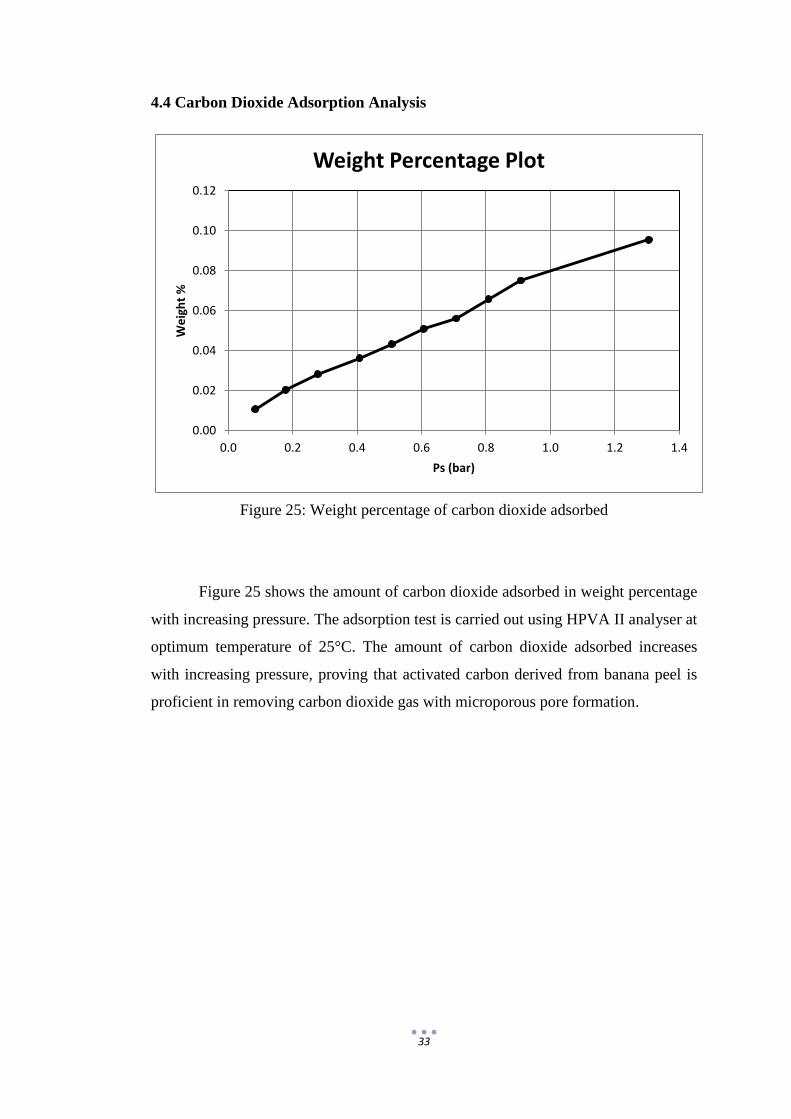
4.4 Carbon Dioxide Adsorption Analysis
Figure 25: Weight percentage of carbon dioxide adsorbed
Figure 25 shows the amount of carbon dioxide adsorbed in weight percentage
with increasing pressure. The adsorption test is carried out using HPVA II analyser at
optimum temperature of 25°C. The amount of carbon dioxide adsorbed increases
with increasing pressure, proving that activated carbon derived from banana peel is
proficient in removing carbon dioxide gas with microporous pore formation.
34
0
0.01
0.02
0.03
0.04
0.05
0.06
0.07
0.08
0.09
0 0.2 0.4 0.6 0.8 1 1.2 1.4
Qu
anti
ty a
dso
rbe
d (
wt%
)
Pressure (bar)
Percentage of carbon dioxide adsorbed
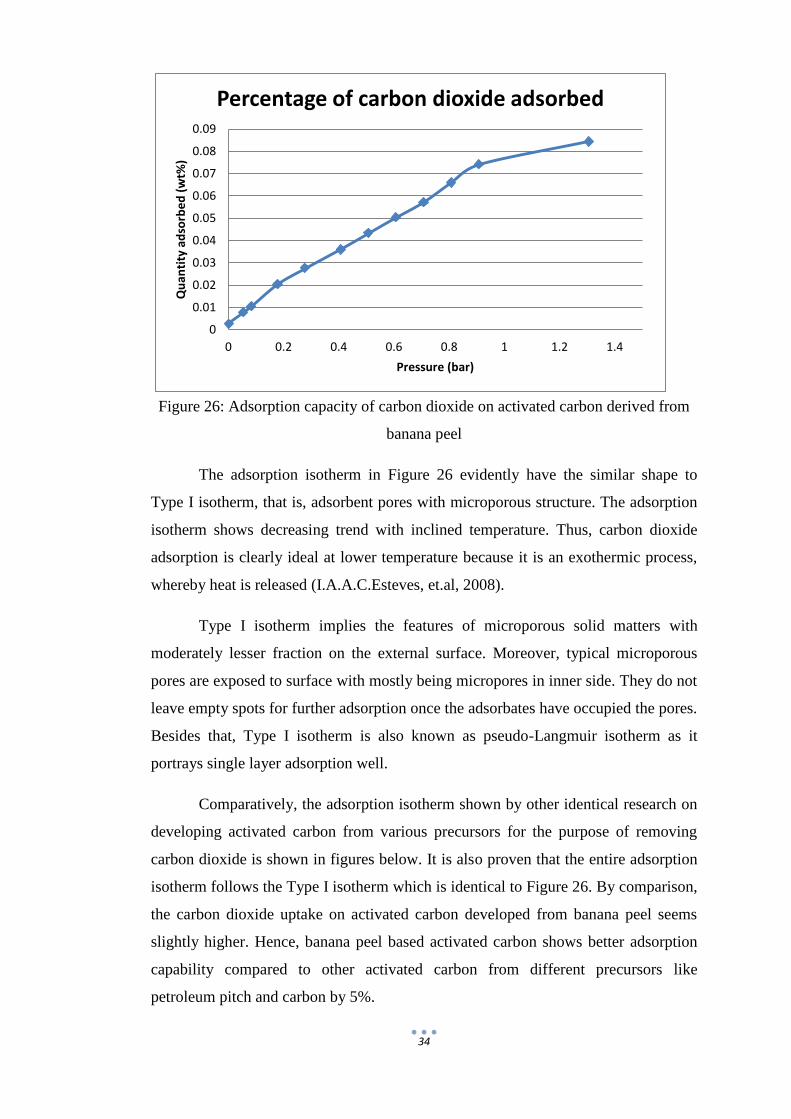
Figure 26: Adsorption capacity of carbon dioxide on activated carbon derived from
banana peel
The adsorption isotherm in Figure 26 evidently have the similar shape to
Type I isotherm, that is, adsorbent pores with microporous structure. The adsorption
isotherm shows decreasing trend with inclined temperature. Thus, carbon dioxide
adsorption is clearly ideal at lower temperature because it is an exothermic process,
whereby heat is released (I.A.A.C.Esteves, et.al, 2008).
Type I isotherm implies the features of microporous solid matters with
moderately lesser fraction on the external surface. Moreover, typical microporous
pores are exposed to surface with mostly being micropores in inner side. They do not
leave empty spots for further adsorption once the adsorbates have occupied the pores.
Besides that, Type I isotherm is also known as pseudo-Langmuir isotherm as it
portrays single layer adsorption well.
Comparatively, the adsorption isotherm shown by other identical research on
developing activated carbon from various precursors for the purpose of removing
carbon dioxide is shown in figures below. It is also proven that the entire adsorption
isotherm follows the Type I isotherm which is identical to Figure 26. By comparison,
the carbon dioxide uptake on activated carbon developed from banana peel seems
slightly higher. Hence, banana peel based activated carbon shows better adsorption
capability compared to other activated carbon from different precursors like
petroleum pitch and carbon by 5%.

35
Figure 27: Adsorption isotherm of activated carbon derived from petroleum pitch
(M.E.Casco, et al., 2013)
Figure 28: Adsorption isotherm of activated carbon derived from carbon
(B.Guo, et.al., 2006)
Figure 29: Adsorption isotherm of activated carbon derived from coconut
(L.I.Fenrong, et.al., 2010)

36
Figure 30: Adsorption isotherm of activated carbon derived from coal,
extruded carbon (I.A.A.C.Esteves, et.al., 2008)
Figure 31: Adsorption capacity of carbon dioxide on activated carbon derived
from Eucalyptus camaldulensis wood at different temperatures (A.Heidari, et.al,
2013)
The effect of temperature on the amount of carbon dioxide, CO2 adsorbed
onto the activated carbon prepared with potassium hydroxide, KOH, decreases with
increasing temperatures as shown in Figure 31. In other words, the result clearly
illustrates that CO2 adsorption was most significant at lower temperature with bigger
adsorption capacity proving that physical adsorption has taken place (A.Heidari,
et.al, 2013). Therefore, it is reasonable that adsorption test for carbon dioxide on
banana peel based activated carbon is studied at low temperature of 25°C.

37
CHAPTER 5
CONCLUSION AND RECOMMENDATION
5.1 Conclusion
As a conclusion, this project is important as it deals with alternative ways of
removing carbon dioxide emissions in atmosphere. Adsorption using activated
carbon is established to be one of the effective ways to deal with the current issue of
using banana peel in conventional ways especially in eliminating carbon dioxide.
Thus, the investigation in this project shows that the banana peel is an appropriate
precursor to be adapted into activated carbon due to its high carbon content.
Chemical activation method is preferred in this study with the usage of common
chemical activation agents such as potassium hydroxide. In conjunction with that,
various preparation parameters have been studied thoroughly to study the effects on
surface area and pore formation of the derived activated carbon from banana peel.
Therefore, referring to the results, it is proven that smaller particle size is better to be
utilized as chemically activated carbon as it exposes larger surface area during
impregnation and activation. In addition, the impregnation ratio should be fairly low
to inhibit good pore formation. Furthermore, the carbonization temperature for using
banana peel as precursor should not be higher than 400°C as any higher will bring
about the breakdown of the porous formation in the activated carbon and cause the
reduction of effective surface area for the adsorption process. Sample A10 proved to
be the best sample among others with its outstanding BET surface area as well as
nitrogen adsorption-desorption isotherm indicating meso- and micro-porosity. Lastly,
activated carbon derived from banana peel also proved to remove carbon dioxide
through adsorption.

38
5.2 Recommendation
The project can be improved to the next level of research, that is, to study the
adsorption as well as desorption process using the banana peel based activated
carbon as adsorbent. In terms of adsorption, there are ample of parameters that can
be considered such as the amount of the adsorbent present, the pH of the solution, the
temperature and contact period of the adsorption process. The sample with the
highest SBET from this project (sample A10) will be produced in bulk quantity to
conduct this study. The study on the adsorption process is significant in determining
the most conducive environment for the greenhouse gas to be adsorbed on the
reactive sites of the banana peel based activated carbon which will highly increase
the adsorption capacity of the adsorbent. The time desired to reach the adsorption
equilibrium can be determined through this study. Adsorption equilibrium is
achieved when the rate of adsorption is equal to the rate of desorption, thus making
any further adsorption highly unlikely (maximum amount of adsorbate bind on the
reactive sites of the adsorbent). On the other hand, study on desorption process also
will be helpful in discovering conservational way of removing harmful gases such
carbon dioxide. This research would be significant in the effort to reduce air
pollution as well as eliminating greenhouse gases in a safe manner.
In addition, different types of biomass or agriculture wastes can also be
examined on the feasibility as precursor to be converted into activated carbon.
Activated carbon made from different precursor will have different preference or
adsorption capacity, depending on its respective preparation conditions. Additional
information can be obtained through similar research with different raw materials in
order to identify better bio-sorbent to remove pollutants. Hence, the study of
developing adsorbent derived from agricultural waste would be a great exploration to
deal with as it gives a better alternative economically as well as environmentally to
preserve pollution-free environment.

x
REFERENCES
[1] Djilani.C., Zaghdoudi.R., Modarressi.A., Rogalski.M., Djazi.F., and
Lallam.A., 2012, “Elimination of organic micropollutants by adsorption on
activated carbon prepared from agricultural waste”, Chemical Engineering
Journal 189-190: 203-212.
[2] Boden.T.A., Marland.G., and Andres.R.J., 2010, “Global, Regional, and
National Fossil-Fuel CO2 Emissions”, Carbon Dioxide Information Analysis
Center, Oak Ridge National Laboratory, U.S. Department of Energy, Oak
Ridge, Tenn., U.S.A. doi 10.3334/CDIAC/00001_V2010. Available at:
http://cdiac.ornl.gov/trends/emis/tre_glob.html
[3] Jang.D. and Park.S.J., 2014, “ACS clean coal,” Fuel, 102: 439-444.
[4] What is activated charcoal and why is it used in filters?. (2000, April).
HowStuffWorks.com. Available at:
http://science.howstuffworks.com/environmental/energy/question209.htm
[5] Deithorn.R.T. and Mazzoni.A.F., 2014, “The story of activated carbon”.
Available at: http://www.tigg.com/what-is-activated-carbon.html
[6] Gad.H.M.H. and El-Sayed.A.A., 2009, “Activated carbon from agricultural
by-products for the removal of rhodamine-B from aqueous solution”, Journal
of Hazardous Material, 168: 1070-1081.
[7] White,A.J., 2010, “Development of an activated carbon from anaerobic
digestion by-product to remove hydrogen sulphide from biogas”, Master of
Applied Science. Thesis, University of Toronto, Canada.
[8] Örkün.Y., Karatepe.N., and Yavuz.R., 2012, “Influence of temperature and
impregnation ratio of H3PO4 on the production of activated carbon from
hazelnut shell”, Acta Physica Polonica A, 121: 277-280.
[9] Rashidi.N.A., Yusup.S., and Borhan.A., 2014, “Novel low-cost activated
carbon from coconut shell and its adsorptive characteristics for carbon
dioxide”, UTP Institutional Repository, 594-595: 240-244
[10] Dietzel.P.D.C., Besikioties.V., and Blom.R., 2009, “Application of metal-
organic frameworks with coordinatively unsaturated metal sites in storage and
separation of methane and carbon dioxide”, Journal of Materials Chemistry,
19:7362-7370.
xi
[11] Siriwardane.R.V., Shen.M.S., Fisher.E.P., and Poston.J.A., 2000,
“Adsorption of CO2 on molecular sieves and activated carbon”, Energy &
Fuels, 15: 279-284.
[12] Mopoung.S., 2008, “Surface image of charcoal and activated charcoal from
banana peel”, Journal of Microscopy Society of Thailand, 22: 15-19.
[13] Survey Report on the Distribution and Waste Disposal of Bananas by the
Association of Australian Banana Wholesalers. (2006). Available:
http://www.daff.gov.au/__data/assets/pdf_file/0008/158642/aabw-final-
survey-report.pdf
[14] Ekpete.O.A. and Horsfall.M.JNR., 2011, “Preparation and characterization of
activated carbon derived from fluted pumpkin stem waste (Telfairia
occidentalis Hook F)”, Research Journal of Chemical Sciences, 1: 10-17.
[15] Casco.M.E., Martínez-Escandell.M., Silvestre-Albero.J., and Rodríguez-
Reinoso.F., 2013, “Effect of the porous structure in carbon materials for CO2
capture at atmospheric and high-pressure”, Carbon, 67: 230-235.
[16] Somy.A., Mehrnia.M.R., Amrei.H.D., Ghanizadeh.A., and Safari.M., 2008,
“Adsorption of carbon dioxide using impregnated activated carbon promoted
by zinc”, International Journal of Greenhouse Gas Control, 3: 249-254.
[17] Shafeeyan.M.S., Daud.W.M.A.W., Houshmand.A., and Shamiri.A., 2010, “A
review on surface modification of activated carbon for carbon dioxide
adsorption”, Journal of Analytical and Applied Pyrolysis, 89: 143-151.
[18] Siriwardane.R.V., Shen.M.S., Fisher.E.P., and Poston.J.A., 2000,
“Adsorption of CO2 on molecular sieves and activated carbon”, Energy &
Fuels, 15: 279-284.
[19] Guo.B., Chang.L., and Xie.K., 2006, “Adsorption of carbon dioxide on
activated carbon”, Journal of Natural Gas Chemistry, 15: 223-229.
[20] Abbasi.Z., Alikarami.M., Nezhad.E.R., Moradi.F., and Moradi.V., 2013,
“Adsorptive removal of Co2+
and Ni2+
by peels of banana from aqueous
solution”, University Journal of Chemistry, 3: 90-95.
[21] Sud.D., Mahajan.G., and Kaur.M.P., 2008, “Agricultural waste material as
potential adsorbent for sequestering heavy metal ions from aqueous solutions
– a review”, Bio resource Technology, 99: 6017-6027.

xii
[22] Tock.J.Y., Lai.C.L., Lee.K.T., Tan.K.T., and Bhatia.S., 2009, “Banana
biomass as potential renewable energy resource: a Malaysian case study”,
Renewable and Sustainable Energy Reviews, 14: 798-805.
[23] Cobb.A., Warms.M., Maurer.E.P., and Chiesa.S., 2012, “Low-tech coconut
shell activated charcoal production”, International Journal for Service
Learning in Engineering, 7: 93-104.
[24] Achak.M., Hafidi.A., Ouazzani.N., Sayadi.S., and Mandi.L., 2008, “Low cost
biosorbent „banana peel‟ for the removal of phenolic compounds from olive
mill wastewater: kinetic and equilibrium studies”, Journal of Hazardous
Materials, 166: 117-125.
[25] Viswanathan.B., Neel.P.I., and Varadarajan.T.K., 2009, “Methods of
activation and specific applications of carbon materials”. Available:
http://nccr.iitm.ac.in/e%20book-Carbon%20Materials%20final.pdf
[26] Hoong.P.K., Borhan.A., and Taha.M.F., 2013, “Biosorption of heavy metal
ions, oil and grease from industrial waste water by banana peel”, Available:
http://utpedia.utp.edu.my/8484/
[27] Kim.M.J., and Chea.G.H., 2012, “Study on the PV driven dehumidifying
system with oyster shell and thermoelectric device”, Thesis, Kunsan National
University, Korea.
[28] Geankoplis, C. J. (2003). Liquid-Liquid and Fluid-Solid Separation
Processes. In Transport Processes and Separation Process Principles 4th
Edition (p. 760). New Jersey: Pearson Prentice Hall.
[29] Marsh, H., & Rodriguez-Reinoso, F. (2006). Activated Carbon. Oxford, UK:
Elsevier.
[30] Mokhtarud-din, H., & William, R. (2010). STATUS OF BANANA
CULTIVATION AND DISEASE INCIDENCES IN MALAYSIA. Crop
Protection & Plant Quarantine Division, Department of Agriculture, Malaysia.
[31] Memon, J. R., Memon, S. Q., Bhangar, M. I., Memon, G. Z., El-Turki, A., &
Allen, G. C., 2008, “Characterization of Banana Peel by Scanning Electron
Microscopy and FT-IR and its use for cadmium removal”, Colloids Surfaces
B: Biointerfaces, 66: 260-265.
[32] Ademiluyi, F. T., & David-West, E. O., 2012, “Effect of Chemical Activation
on the Adsorption of Heavy Metals Using Activated Carbons from Waste
Materials”, International Scholarly Research Network, 2012: 1-5.

xiii
[33] Diao, Y., Walawender, W. P., & Fan, L. T., 2002, “Activated Carbon
Prepared From Phosphoric Acid Activation of Grain Sorghum”, Bioresource
Technology, 81: 45-52.
[34] Lim, W., Srinivasakannan, C., & Balasubramanian, N., 2010, “Activation of
palm shells by phosphoric acid impregnation for high yielding activated
carbon”, Journal of Analytical and Applied Pyrolysis, 88: 181-186.
[35] Molina-Sabio, M., Rodriguez-Reinoso, F., Caturla, F., & Selles, M. J., 1996,
“Development of porosity in combined phosphoric acid- carbon dioxide
activation”, Carbon, 34: 457-462.
[36] Laine, J., Calafat, A., & Labady, M., 1994, “Pore size distribution analysis
and networking: studies of microporous sorbents”, Characterization of Porous
Solid III, Proceedings of the IUPAC Symposium (COPS III), Elsevier,
Amsterdam.
[37] Borhan, A., & Kamil, A. F., 2012, “Preparation and Characterization of
Activated Carbon from Rubber Seed Shell by Chemical Activation”, Journal
of Applied Science, 1-6.
[38] Cao, Q., Xie, K. C., Liv, Y. K., & Bao, W. R., 2006, “Process effects of
activated carbon with large specific surface area from Corncob”, Bioresource.
Technol., 97: 110-115.
[39] Wu, F. C., Tseng, C. C., & Hu, C. C., 2005, “Comparisons of pore properties
and adsorption performance of KOH-activated and steam-activated carbons”,
Micropore. Mesopore. Mater 80: 95-106.
[40] Sudaryanto, Y., Hartono, S. B., Irawaty, W., Hindarso, H., & Ismadji, S.,
2006, “High surface area activated carbon prepared from Cassava Peel by
chemical activation”, Bioresource. Technol. 97: 734-739.
[41] Ozdemir.I., Sahir.M., Orhan.R., and Erdem.M., 2014, “Preparation and
characterization of activated carbon from grape stalk by zinc chloride
activation”, Fuel Processing Technology, 125: 200 – 206.
[42] Liou.T.H., 2009, “Development of mesoporous structure and high adsorption
capacity of biomass-based activated carbon by phosphoric acid and zinc
chloride activation”, Chemical Engineering Journal, 158: 129 - 142.
[43] Esteves.I.A.A.C., Lopes.M.S.S., Nunes.P.M.C., and Mota.J.P.B., 2008,
“Adsorption of natural gas and biogas components on activated carbon”,
Separation and Purification Technology, 62: 281 – 296.
xiv
[44] Fenrong.L.I., Honghong.Y.I., Xiaolong.T., Ping.N., Qiongfen.Y.U., and
Dongjuan.K., 2010, “Adsorption of carbon dioxide by coconut activated
carbon modified with Cu/Ce”, Journal of Rare Earths, 28: 334-337.
[45] Guo.B., Chang.L., and Xie.K., 2006, “Adsorption of carbon dioxide on
activated carbon”, Journal on Natural Gas Chemistry, 15: 223 – 229.
[46] Dantas.T.L.P., Luna.F.M.T., Silva Jr.I.J., Torres.A.E.B., de Azevedo.D.C.S.,
Rodrigues.A.E., and Moreira.R.F.P.M., 2011, “Carbon dioxide-nitrogen
separation through pressure swing adsorption”, Chemical Engineering
Journal, 172: 698 – 704.
[47] Heidari.A., Younesi.H., Rashidi.A., Ghoreyshi.A., 2013, “Adsorptive
removal of CO2 on highly microporous activated carbons prepared from
Eucalyptus camaldulensis wood: Effect of chemical activation”, Journal of the
Taiwan Institute of Chemical Engineers, 45: 579 – 588.

xv
APPENDICES
Figure 32: BET Adsorption Isotherms (M.J.Kim & G.H.Chea, 2012)

xvi
Table 6: List of samples Group A (particle size = 0.25mm) with respective preparation conditions
No Activating
Agent Impregnation
Ratio
Activating Temperature
(°C)
Activation Time (hour)
Impregnation Carbonization Weight before
carbonization (g)
Weight after carbonization
(g)
Yield (%)
1 KOH 1:1 400 1 Yes Yes 8.72 3.81 43.7
2 KOH 1:2 400 1 Yes Yes 9.46 2.98 31.5
3 KOH 1:3 400 1 Yes No 7.74 - -
4 KOH 1:1 500 1 Yes No 9.05 - -
5 KOH 1:2 500 1 Yes No 7.34 - -
6 KOH 1:3 500 1 Yes Yes 7.80 2.25 28.8
7 KOH 1:1 600 1 Yes No 7.45 - -
8 KOH 1:2 600 1 Yes Yes 6.32 4.87 77.1
9 KOH 1:3 600 1 Yes Yes 9.50 2.73 28.7
10 KOH 1:1 400 2 Yes Yes 9.00 4.65 51.7
11 KOH 1:2 400 2 Yes No 7.58 - -
12 KOH 1:3 400 2 Yes Yes 9.70 5.90 60.8
13 KOH 1:1 500 2 Yes Yes 7.56 2.25 29.8
14 KOH 1:2 500 2 Yes Yes 6.92 1.14 16.5
15 KOH 1:3 500 2 Yes No 8.76 - -
16 KOH 1:1 600 2 Yes No 8.90 - -
17 KOH 1:2 600 2 Yes Yes 8.50 2.95 34.7
18 KOH 1:3 600 2 Yes Yes 7.21 2.25 31.2
xvii
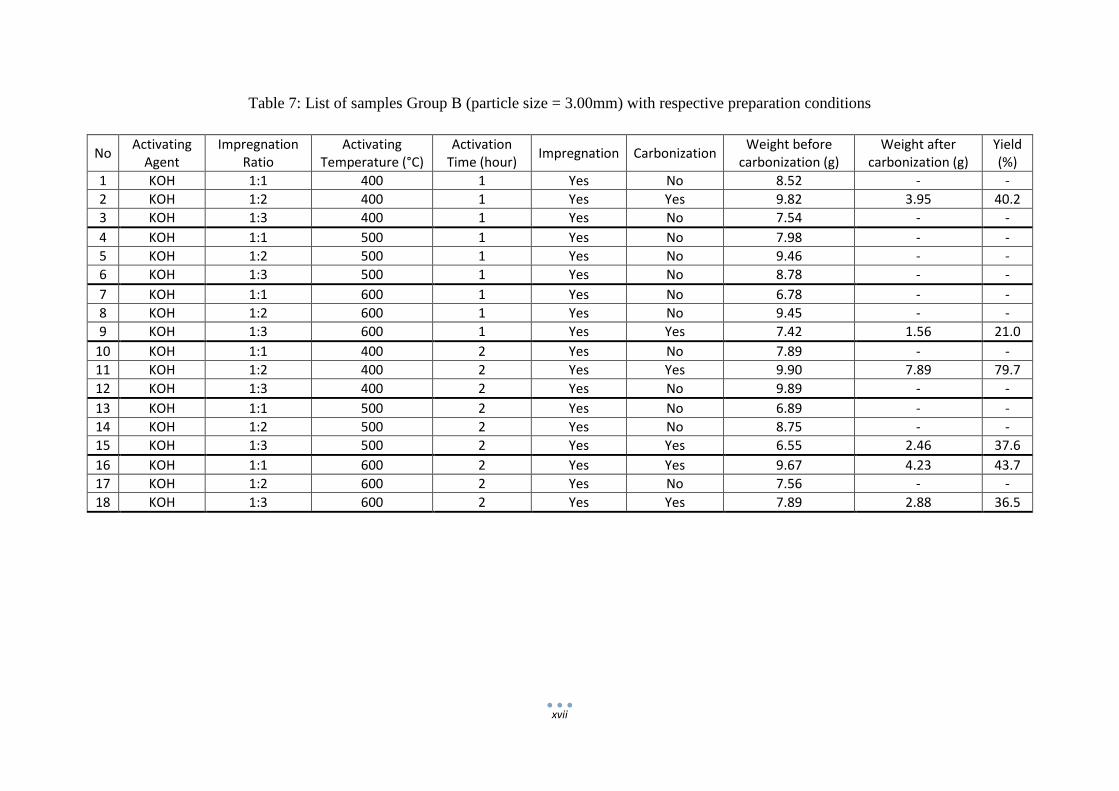
Table 7: List of samples Group B (particle size = 3.00mm) with respective preparation conditions
No Activating
Agent Impregnation
Ratio Activating
Temperature (°C) Activation
Time (hour) Impregnation Carbonization
Weight before carbonization (g)
Weight after carbonization (g)
Yield (%)
1 KOH 1:1 400 1 Yes No 8.52 - -
2 KOH 1:2 400 1 Yes Yes 9.82 3.95 40.2
3 KOH 1:3 400 1 Yes No 7.54 - -
4 KOH 1:1 500 1 Yes No 7.98 - -
5 KOH 1:2 500 1 Yes No 9.46 - -
6 KOH 1:3 500 1 Yes No 8.78 - -
7 KOH 1:1 600 1 Yes No 6.78 - -
8 KOH 1:2 600 1 Yes No 9.45 - -
9 KOH 1:3 600 1 Yes Yes 7.42 1.56 21.0
10 KOH 1:1 400 2 Yes No 7.89 - -
11 KOH 1:2 400 2 Yes Yes 9.90 7.89 79.7
12 KOH 1:3 400 2 Yes No 9.89 - -
13 KOH 1:1 500 2 Yes No 6.89 - -
14 KOH 1:2 500 2 Yes No 8.75 - -
15 KOH 1:3 500 2 Yes Yes 6.55 2.46 37.6
16 KOH 1:1 600 2 Yes Yes 9.67 4.23 43.7
17 KOH 1:2 600 2 Yes No 7.56 - -
18 KOH 1:3 600 2 Yes Yes 7.89 2.88 36.5

xviii
RAW 04/06/2014 12:25:14
Spectrum processing :
No peaks omitted
Processing option : All elements analyzed (Normalised)
Number of iterations = 4
Standard :
C CaCO3 1-Jun-1999 12:00 AM
O SiO2 1-Jun-1999 12:00 AM
Si SiO2 1-Jun-1999 12:00 AM
K MAD-10 Feldspar 1-Jun-1999 12:00 AM
Element Weight% Atomic%
C K 60.87 67.85
O K 23.74 25.35
Si K 0.43 0.26
K K 14.96 6.54
Totals 100.00

xix
08/07/2014 16:37:10
A10
Spectrum processing :
No peaks omitted
Processing option : All elements analyzed (Normalised)
Number of iterations = 4
Standard :
C CaCO3 1-Jun-1999 12:00 AM
O SiO2 1-Jun-1999 12:00 AM
Si SiO2 1-Jun-1999 12:00 AM
Cl KCl 1-Jun-1999 12:00 AM
K MAD-10 Feldspar 1-Jun-1999 12:00 AM
Element Weight% Atomic%
C K 58.18 72.55
O K 25.19 23.57
Si K 0.63 0.34
Cl K 0.63 0.27
K K 15.37 3.27
Totals 100.00

xx