development of a tissue oxygen saturation detection system ... · development of a tissue oxygen...
TRANSCRIPT

Development of a Tissue Oxygen Saturation Detection System for Improving Surgical Training
by
Kunj Bhaveshkumar Upadhyaya
A thesis submitted in conformity with the requirements for the degree of Master of Health Science in Clinical Engineering
Institute of Biomaterials and Biomedical Engineering (IBBME) University of Toronto
© Copyright by Kunj Bhaveshkumar Upadhyaya 2016

ii
Development of a Tissue Oxygen Saturation Detection System for Improving Surgical Training
Kunj Upadhyaya
Master of Health Science in Clinical Engineering
Institute of Biomaterials and Biomedical Engineering (IBBME)
University of Toronto
2016
Abstract
Delicate tissue encountered in surgery is prone to ischemic damage from grasping and retracting
especially by novice surgeons. Currently, there are no existing techniques to quantitatively assess
tissue health during surgical maneuver. A transmission and reflectance mode tissue oxygenation
(StO2) sensor was developed and integrated into a standard laparoscopic tool and custom forceps
to continuously measure tissue oxygenation during surgery. Numerous wavelengths including
470nm, 500nm, 510nm, 560nm, 570nm, 586nm, 660nm and 940nm were tested in reflection
mode while 660nm and 940nm were tested in transmission mode. StO2 sensor successfully
detected oxygenation changes on the finger and during ex vivo experiment conducted on arterial
and venous blood samples. StO2 sensor was unable to monitor changes when grasping small
intestine and liver using surgical instruments. Various factors including lack of hemoglobin at
the site of measurement, tissue thickness changes during grasps, and motion artifacts limited the
use of this technology.

iii
Acknowledgments
First and foremost, I would like to thank my supervisors Dr.Farhat and Dr.Drake for giving me
an opportunity to work on this project. I would like to thank my committee members Dr.Koyle,
Dr.Finelli, Dr.Genov and Dr.Naguib for their guidance. Thank you Thomas for letting me
bounce ideas off you when I needed to. Thank you Rob for patiently showing me how to use lab
equipment. Justin thank you for helping me with FPCB. I appreciated all the feedback and
motivation I received from the lab members.

iv
Table of Contents
Acknowledgments.......................................................................................................................... iii
Table of Contents ........................................................................................................................... iv
List of Tables ................................................................................................................................ vii
List of Figures .............................................................................................................................. viii
List of Abbreviations ................................................................................................................... xiii
Introduction .................................................................................................................................1
1.1 Surgical Techniques .............................................................................................................1
1.1.1 Open Surgery ...........................................................................................................1
1.1.2 Conventional Laparoscopy ......................................................................................2
1.1.3 Robotic Surgery using da Vinci® Surgical System ..................................................3
1.2 Research Motivation ............................................................................................................4
Background .................................................................................................................................5
2.1 Tissue Oxygen Saturation ....................................................................................................5
2.2 Optical Properties of Tissue .................................................................................................6
2.3 Beer-Lambert Law ...............................................................................................................7
2.4 Existing Techniques to Monitor StO2 ..................................................................................9
2.4.1 Blood Gas Analyzers ...............................................................................................9
2.4.2 Transcutaneous Oximetry ........................................................................................9
2.4.3 Near-Infrared Spectroscopy ...................................................................................10
2.4.4 Visible Light Spectroscopy ....................................................................................12
2.4.5 Pulse-Oximetry like Technique for measuring StO2 .............................................13
2.4.6 Three Charged-Coupled Device (CCD) Camera ...................................................14
2.5 Comparing Techniques ......................................................................................................14

v
2.6 Research Goal ....................................................................................................................16
2.7 Research Objectives ...........................................................................................................16
2.8 Constraints .........................................................................................................................16
Transmission Mode Sensor Design ...........................................................................................17
3.1 StO2 Sensor Design ............................................................................................................17
3.1.1 Optoelectronic Selection (LEDs and Photodiode) .................................................17
3.1.2 Integrating Sensor with Laparoscopic Tools .........................................................18
3.1.3 Circuit Design ........................................................................................................20
3.1.4 Algorithm ...............................................................................................................22
3.2 660nm and 940nm in Transmission Mode Testing............................................................22
3.2.1 In vivo Experiment 1 - Proof of Concept ...............................................................22
3.2.2 In vivo Experiment 2 – Grasping Bowel ................................................................24
3.2.3 In vivo Experiment 3– Measuring Beside Tissue ..................................................27
3.2.4 In vivo Experiment 4 – Occluding Arterial Supply ...............................................28
3.2.5 In vivo Experiment 5 – Grasped Finger .................................................................30
3.3 660nm and 940nm in Transmission Mode - Discussion ....................................................31
Exploring Visible Spectrum ......................................................................................................33
4.1 Visible Light Advantages ..................................................................................................33
4.2 Wavelength Selection for Reflectance Measurement ........................................................33
4.3 Design of Reflectance StO2 Sensor Design .......................................................................35
4.4 In vivo Experiment 6 – Reflection Mode Test protocol .....................................................37
4.5 Theoretically Expected Results..........................................................................................37
4.6 In vivo Experiment 6 – Reflection Mode Results ..............................................................43
4.7 In vivo Experiment 6 – Reflection Mode Discussion ........................................................48
Controlled Volume Experiments...............................................................................................49
5.1 Ex vivo Experiment 1 - Controlled Volume Method .........................................................49

vi
5.2 Ex vivo Experiment 1 – Controlled Volume Results .........................................................51
5.3 Ex vivo Experiment 1 – Discussion ...................................................................................57
Conclusion ................................................................................................................................59
Future Direction ........................................................................................................................60
7.1 Determining Resolution .....................................................................................................60
7.2 Alternatives to Measuring Hemoglobin with Graspers .....................................................60
References ......................................................................................................................................62

vii
List of Tables
Table 1: Area under relative output intensity versus wavelength curve for HbO2, Hb and
expected changes in signal with decrease in oxygenation ............................................................ 42
Table 2: Comparing theoretical and experimental results for reflection mode experiment ......... 47
Table 3: Comparing theoretical versus experimental results for controlled volume experiment . 56
Table 4: Comparing percentage differences in between reflection mode testing and controlled
volume testing ............................................................................................................................... 57

viii
List of Figures
Figure 1: Open surgery showing a large incision. Surgeon is able to interact with tissues with
their hand ........................................................................................................................................ 1
Figure 2: Conventional laparoscopic schematic showing three ports for surgical instrument and
one port for laparoscope [6] ............................................................................................................ 2
Figure 3: da Vinci Surgical System. The three main components of the system: surgeon’s
console, patient side cart and vision cart. Surgeon sits at the surgical console, has 3D view of the
surgical environment and operates on the patient [12]. .................................................................. 3
Figure 4: Schematic of oxygenated and deoxygenated hemoglobin. ............................................. 5
Figure 5: Absorption coefficient spectra of tissue chromophores. HbO2 - red line, Hb – blue line,
water (80% by tissue volume) – black line, lipid (20% by tissue volume) – brown line, lipid –
pink line, melanin – black dashed line, collagen – green line and elastin – yellow line [31] ......... 7
Figure 6: Molar extinction coefficient of oxygenated and deoxygenated hemoglobin within 350-
1000nm. Figure recreated using data compiled by Scott Prahl [33] ............................................... 9
Figure 7: Depth of penetration of oxygenated and deoxygenated hemoglobin within 350-1000nm
assuming 150g/L hemoglobin concentration and 64 000g/mol molar mass of hemoglobin ........ 11
Figure 8: Schematic of NIRS where light source and detector are typically placed 4-8cm apart to
ensure the light penetrates through the skull. Light travels through “banana-shaped” region. .... 12
Figure 9: Comparing junction size of different LEDs .................................................................. 18
Figure 10: LEDs and photodiodes will be integrated in the cut-out to ensure the tool-functionality
is not compromised. ...................................................................................................................... 18
Figure 11: LEDs and photodiode integrated with FPCB. ............................................................. 19
Figure 12: Tissue oxygen sensor (comprised of LEDs, photodiode, FPCB, and microcontroller)
integrated with standard bowel grasper ........................................................................................ 20
Figure 13: Custom forceps with tissue oxygenation sensor integrated ......................................... 20

ix
Figure 14: Voltage follower circuit to drive LED ........................................................................ 21
Figure 15: Trans-impedance amplifier with 11x gain ................................................................... 21
Figure 16: Blood pressure cuff placed on the forearm and custom tool placed on index finger to
measure oxygenation changes on the finger as forearm is occluded ............................................ 23
Figure 17: Monitoring response of red and near-IR signal at index finger after placing blood
pressure cuff on the forearm and slowly increasing cuff pressure. Forearm was occluded at 15
seconds and released at 105 seconds. ........................................................................................... 24
Figure 18: Grasping small intestine with sensorized laparoscopic grasper .................................. 25
Figure 19: Monitoring red and near-IR signal after grasping with low forces. Tissue was grasped
at 30 seconds and release at 90 seconds........................................................................................ 26
Figure 20: Monitoring red and near-IR signal after grasping with high forces. Tissue was grasped
at 15 seconds and released at 75 seconds...................................................................................... 26
Figure 21: Blood displacement after grasping bowel (left) and liver (right) with low forces ...... 27
Figure 22: Monitoring tissue oxygenation changes beside the site of grasping. Liver is clamped
with ratcheted forceps and tissue oxygenation is measured with custom forceps ........................ 27
Figure 23: Monitoring response of red and near-IR light beside the site of grasping. Tissue was
grasped at 20 seconds and released at 120 seconds. ..................................................................... 28
Figure 24: Clamping mesenteric arteries with bulldog clamp to cut-off blood supply to the bowel
....................................................................................................................................................... 29
Figure 25: Measuring red and near-IR signal with custom forceps after cutting off mesenteric
artery. Arteries were clamped at 30 seconds ................................................................................ 29
Figure 26: Grasping finger with custom forceps and measuring changes at the site of grasping. 30
Figure 27: Monitoring response of red and near-IR light after grasping finger with custom
forceps ........................................................................................................................................... 31

x
Figure 28: Molar Extinction Coefficient of oxygenated and deoxygenated hemoglobin within
visible light range. Black lines indicate wavelengths with the largest difference between molar
extinction coefficient of oxygenated and deoxygenated hemoglobin. Yellow lines indicated
wavelengths with identical coefficients of oxygenated and deoxygenated hemoglobin .............. 34
Figure 29: Illustration of transmittance (left) and reflectance (right). In transmission mode,
source and detector are placed across each other. In reflection mode, source and detector are
placed beside each other. .............................................................................................................. 35
Figure 30: Reflectance set-up showing LEDs and photodiodes placed beside each other. .......... 35
Figure 31: Reflectance set-up showing LED and photodiode with the jig to reduce unnecessary
photodiode and LED interference. ................................................................................................ 36
Figure 32: Comparison of baseline reading with and without jig ................................................. 36
Figure 33: Relative intensity versus wavelength for peak wavelength of 500nm approximated . 38
Figure 34: Overlaying 500nm peak LED spectral distribution with molar extinction coefficient of
hemoglobin curve.......................................................................................................................... 39
Figure 35: Relative output intensity versus wavelength ............................................................... 40
Figure 36: Photodiode spectral sensitivity as function of wavelength ......................................... 41
Figure 37: Relative output intensity versus wavelength adjusted for LED and photodiode
intensity ......................................................................................................................................... 41
Figure 38: Monitoring response of LED with peak intensity at 470nm. Pressure in the cuff is
increased at 30 seconds and released at 120 seconds. .................................................................. 43
Figure 39: Monitoring response of LED with peak intensity at 500nm. Pressure in the cuff is
increased at 30 seconds and released at 120 seconds. .................................................................. 44
Figure 40: Monitoring response of LED with peak intensity at 510nm. Pressure in the cuff is
increased at 30 seconds and released at 120 seconds. .................................................................. 44
xi
Figure 41: Monitoring response of LED with peak intensity at 560nm. Pressure in the cuff is
increased at 30 seconds and released at 120 seconds. .................................................................. 45
Figure 42: Monitoring response of LED with peak intensity at 570nm. Pressure in the cuff is
increased at 30 seconds and released at 120 seconds. .................................................................. 45
Figure 43: Monitoring response of LED with peak intensity at 586nm. Pressure in the cuff is
increased at 30 seconds and released at 120 seconds. .................................................................. 46
Figure 44: Monitoring response of LED with peak intensity at 660nm. Pressure in the cuff is
increased at 30 seconds and released at 120 seconds. .................................................................. 46
Figure 45: Monitoring response of LED with peak intensity at 940nm. Pressure in the cuff is
increased at 30 seconds and released at 120 seconds. .................................................................. 47
Figure 46: Molar extinction coefficient versus wavelength data from Takatani et al. overlaid onto
best data available [45] ................................................................................................................. 49
Figure 47: Arterial blood (75-95% oxygenation) and venous blood (5-15% oxygenation) in a 1
mL syringe .................................................................................................................................... 50
Figure 48: Syringe holder set-up................................................................................................... 51
Figure 49: Comparing photodiode response from arterial blood and venous blood with 470nm
peak LED ...................................................................................................................................... 52
Figure 50: Comparing photodiode response from arterial blood and venous blood with 500nm
peak LED ...................................................................................................................................... 52
Figure 51: Comparing photodiode response from arterial blood and venous blood with 510nm
peak LED ...................................................................................................................................... 53
Figure 52: Comparing photodiode response from arterial blood and venous blood with 560nm
peak LED ...................................................................................................................................... 53
Figure 53: Comparing photodiode response from arterial blood and venous blood with 570nm
peak LED ...................................................................................................................................... 54

xii
Figure 54: Comparing photodiode response from arterial blood and venous blood with 586nm
peak LED ...................................................................................................................................... 54
Figure 55: Comparing photodiode response from arterial blood and venous blood with 660nm
peak LED ...................................................................................................................................... 55
Figure 56: Comparing photodiode response from arterial blood and venous blood with 940nm
peak LED ...................................................................................................................................... 55

xiii
List of Abbreviations
3D – Three-dimensional
CCD – Charged-Coupled Device
CL – Conventional Laparoscopy
DOF – Degrees of Freedom
FPCB – Flexible Printed Circuit Board
HbO2 – Oxygenated Hemoglobin
Hb – Deoxygenated Hemoglobin
LED – Light Emitting Diode
MIS – Minimally Invasive Surgery
NADH – Nicotinamide Adenine Dinucleotide
NIRS – Near Infrared Spectroscopy
Near-IR – Near-Infrared
OR – Operating Room
PaO2 – Partial Pressure of Oxygen in Arterial Blood
RAL – Robotic Assisted Laparoscopy
SNR – Signal-to-Noise Ratio
StO2 – Tissue Oxygenation Saturation
SaO2 – Arterial Tissue Oxygenation
SpO2 – Peripheral Oxygenation Saturation

xiv
UV – Ultra-Violet
VLS – Visible Light Spectroscopy

1
Introduction
1.1 Surgical Techniques
1.1.1 Open Surgery
Traditionally, surgeries have been performed within large open incisions where hand-held
surgical instruments are used to complete various surgical tasks. In open surgery, the anatomy of
interest is directly under the surgeon’s view. In addition, surgeons are able to touch and feel the
tissues of interest with their hands [1]. Due to the immediate tactile feedback they receive when
interacting with tissues and organs, surgeons are able to apply proper forces and are less likely to
damage tissues. Direct view of the surgical environment also allows tissue health to be easily
assessed [2].
Figure 1: Open surgery showing a large incision. Surgeon is able to interact with tissues
with their hand
Despite these advantages, open surgery has many shortcomings. Open surgery is associated with
increased hospital stay, increased post-operative pain, and increased risk of infection due to the
larger incision [3]. Due to the invasive nature of open surgery, patients lose more blood and take
a longer time to return to daily activities. In addition, patients will have aesthetically displeasing
scarring for the remainder of their lives [4] .
2
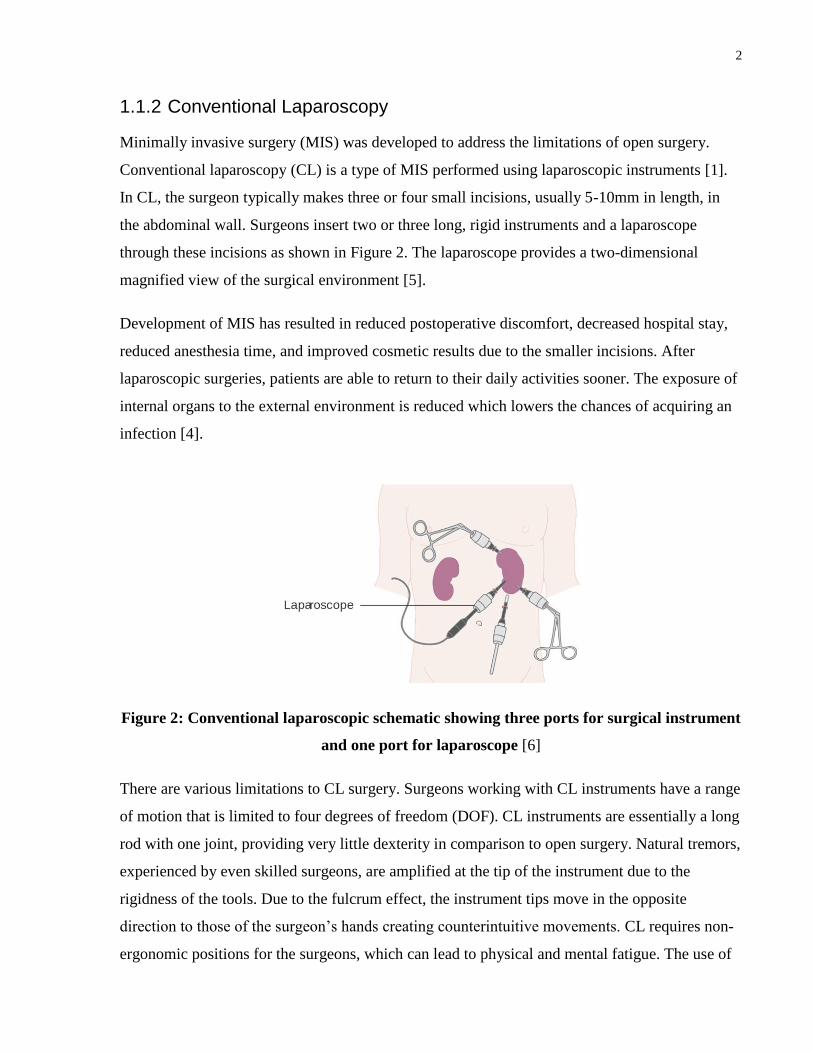
1.1.2 Conventional Laparoscopy
Minimally invasive surgery (MIS) was developed to address the limitations of open surgery.
Conventional laparoscopy (CL) is a type of MIS performed using laparoscopic instruments [1].
In CL, the surgeon typically makes three or four small incisions, usually 5-10mm in length, in
the abdominal wall. Surgeons insert two or three long, rigid instruments and a laparoscope
through these incisions as shown in Figure 2. The laparoscope provides a two-dimensional
magnified view of the surgical environment [5].
Development of MIS has resulted in reduced postoperative discomfort, decreased hospital stay,
reduced anesthesia time, and improved cosmetic results due to the smaller incisions. After
laparoscopic surgeries, patients are able to return to their daily activities sooner. The exposure of
internal organs to the external environment is reduced which lowers the chances of acquiring an
infection [4].
Figure 2: Conventional laparoscopic schematic showing three ports for surgical instrument
and one port for laparoscope [6]
There are various limitations to CL surgery. Surgeons working with CL instruments have a range
of motion that is limited to four degrees of freedom (DOF). CL instruments are essentially a long
rod with one joint, providing very little dexterity in comparison to open surgery. Natural tremors,
experienced by even skilled surgeons, are amplified at the tip of the instrument due to the
rigidness of the tools. Due to the fulcrum effect, the instrument tips move in the opposite
direction to those of the surgeon’s hands creating counterintuitive movements. CL requires non-
ergonomic positions for the surgeons, which can lead to physical and mental fatigue. The use of

3
laparoscopic instruments has also been associated with nerve injuries for the surgeons. Loss of
three-dimensional (3D) vision results in the loss of hand-eye coordination and depth perception
as the surgeon must rely solely on the 2D image on the screen [7].
1.1.3 Robotic Surgery using da Vinci® Surgical System
Minimally invasive surgeries performed using surgical robots are known as robotic assisted
laparoscopy (RAL). The da Vinci® Surgical System integrates 3D endoscopy, robotic
technology, and intuitive motion control allowing the surgeons to perform surgeries while sitting
at an ergonomically designed workstation [8]. In RAL, the surgeon controls three robotic arms:
two arms hold surgical instruments and one arm holds an endoscopic camera offering 3D view of
the surgical field. The motions of the surgeon’s hands on the master controller are translated to
the motion of the robotic tools inside the patients [9]. Endo-wrist instruments provide seven
degrees of freedom (DOF), which greatly improves tip dexterity and range of motion, offering
movement comparable to that of the human wrist [10].
MIS performed using robotic surgical systems overcome the challenges of CL by offering 3D
visualization, increased DOF, intuitive movements, tremor filtering, motion scaling, optical
magnification, and ergonomic positioning for the surgeon [11].
Figure 3: da Vinci Surgical System. The three main components of the system: surgeon’s
console, patient side cart and vision cart. Surgeon sits at the surgical console, has 3D view
of the surgical environment and operates on the patient [12].

4
1.2 Research Motivation
MIS performed with CL or RAL offer many advantages over open surgery; however, surgeons
lose the ability to accurately judge forces increasing their chances of applying excessive forces.
This lack of feedback has been shown to increase errors causing tissue damage by a factor of
three [13]. It has been shown that even experienced surgeons training with robot assisted surgery
often damage delicate tissues [9]. The grasper can potentially damage abdominal organs such as
the liver, bowels, and ureter. Moreover, stress injuries from the grasper may not be detected until
the patient has been discharged from the operating room (OR) since surgeons lose their ability to
assess tissue health through palpation when performing MIS. These injuries may result in
pathological scar tissue formation, bleeding, adhesions, the loss of bowel mobility, and increased
risk of infection [7]. Pediatric tissues are more likely to be delicate; hence they are at a greater
risk of being damaged during surgery.
Many researchers have developed force feedback and haptic perception systems to assist with
force measurement [13]–[21] . Monitoring forces applied to tissue is not an ideal assessment tool
for tissue health as it is an indirect assessment; measuring tissue oxygenation provides a much
better alternative. Surgeons may damage tissue not only due to the application of excessive
forces but also from grasping the tissues for long durations or in a manner that would impact
normal blood circulation to the surrounding tissue. Heijnsdijk et al. performed an analysis of
colectomies and cholecystectomies performed laparoscopically by experienced surgeons and
residents with less than one year of experience. In colectomies, the colon was clamped for longer
than three minutes on three occasions per surgery with maximum grasping duration of seven
minutes. In cholecystectomy, the gall bladder was clamped for longer than three minutes on three
occasions per surgery with maximum grasping duration of 55 minutes. Residents with less than
one year of experience used significantly more actions with a grasping time of more than three
minutes compared to expert surgeons (4.8 versus 2.7; p = 0.010) [22]. Reduction in blood flow
due to long duration of grasps may increase the chances of tissue ischemia, which results from an
imbalance of oxygen supply and demand at the cellular level. This can ultimately lead to cellular
or organ damage if it is maintained overtime [23], [24].

5
Assessing tissue health qualitatively requires years of practice and cannot easily be taught to an
inexperienced surgeon. By measuring tissue health in real-time, it may be possible to limit tissue
damage by alerting the surgeon in time.
Background
2.1 Tissue Oxygen Saturation
Red blood cells contain a protein called hemoglobin which binds to oxygen in the lungs to form
oxygenated hemoglobin (HbO2), as shown in Figure 4 [25]. Oxygenated hemoglobin is
responsible for supplying the cells with adequate oxygen required for survival. After the cells use
HbO2 for metabolism, it is converted into deoxygenated hemoglobin (Hb). Proper circulation of
blood is required throughout the body to ensure adequate oxygen is supplied to cells for survival;
when the body is deprived of oxygen, it can lead to cell death, organ failure, or even death.
Figure 4: Schematic of oxygenated and deoxygenated hemoglobin.
Tissue oxygen saturation provides an indication of tissue health; low StO2 maintained overtime
can lead ischemic damage. StO2 measures the local oxygen saturation in the microcirculation
where oxygen is exchanged, wherein microcirculation consists of arterioles, capillaries and
venules. StO2 measurement provides a weighted average of oxygen saturation in the micro-
vessels. For example, in the brain cortex, 60-80% of the blood is from venules, 15-20% from
arterioles and the remaining blood is from capillaries. StO2 is defined as the ratio between HbO2
to total hemoglobin, where total hemoglobin is comprised of HbO2 and Hb [26].
(1) 𝐓𝐢𝐬𝐬𝐮𝐞 𝐎𝐱𝐲𝐠𝐞𝐧 𝐒𝐚𝐭𝐮𝐫𝐚𝐭𝐢𝐨𝐧 (𝐒𝐭𝐎𝟐) =𝐇𝐛𝐎𝟐
𝐇𝐛𝐎𝟐+𝐇𝐛
StO2 differs from the peripheral oxygenation saturation (SpO2) measurement, which is an
estimate of arterial oxygen saturation (SaO2) and is measured by a pulse oximeter [27]. SpO2
provides a good indication of lung function, but fails to indicate the oxygen uptake at the level of
Deoxygenated Hemoglobin Oxygenated Hemoglobin

6
tissue or organs. Local changes in StO2 are unlikely to affect systemic circulation measurements
provided by pulse oximeters. In surgery, it is important to assess tissue health at the site where
surgical maneuvers are being performed. Even with normal pulse oximeter readings, there is
possibility of local damage that can impact patient health and lead to adverse outcomes. For
example, pulse oximeter reading may be normal despite drastic local changes in the oxygenation
of the small intestine. Furthermore, SpO2 measurements require pulsatile arterial flow for reliable
measurements [28]. This condition becomes difficult to maintain as many surgical maneuvers
require the tissue to be grasped, thus potentially compromising pulsatile blood flow or,
conversely, the site of grasping may only have non-pulsatile venous or capillary blood. SpO2
measurement is not a feasible mode of assessing tissue health intra-operatively. By measuring
local StO2, it is possible to quantitatively assess tissue health at the site of surgical maneuvers.
2.2 Optical Properties of Tissue
Optical properties of biological tissue can be exploited to determine tissue composition. Applied
light beam interacts with multiple tissue components which include water, lipids, melanin, HbO2,
Hb, collagen and elastin. Absorption of light depends on chromophores because each
chromophore has an absorption spectrum in which the extinction coefficient is dependent on the
wavelength. Figure 5 shows the wavelength dependent absorption coefficient for absorbers
including water, lipids, melanin, HbO2, Hb, collagen and elastin [29]. Water, lipids, elastin,
collagen and melanin will show constant absorption effects for a given tissue, while absorption
effects due to concentration of HbO2 and Hb will change with changes in oxygen. Contributions
from water, lipids, elastin and collagen on total attenuation in the region of interest (400-
1000nm) can be considered to be negligible because these chromophores have significantly
lower extinction coefficients compared to HbO2 and Hb. Melanin is typically found in skin;
hence it is unlikely to affect measurement taken in other soft-tissues. Therefore, changes in
absorbance will only be due to changes in concentration of HbO2 and Hb. HbO2 and Hb have
distinct optical properties because HbO2 differs in parts of its absorption pattern from Hb [30].

7
Figure 5: Absorption coefficient spectra of tissue chromophores. HbO2 - red line, Hb – blue
line, water (80% by tissue volume) – black line, lipid (20% by tissue volume) – brown line,
lipid – pink line, melanin – black dashed line, collagen – green line and elastin – yellow line
[31]
2.3 Beer-Lambert Law
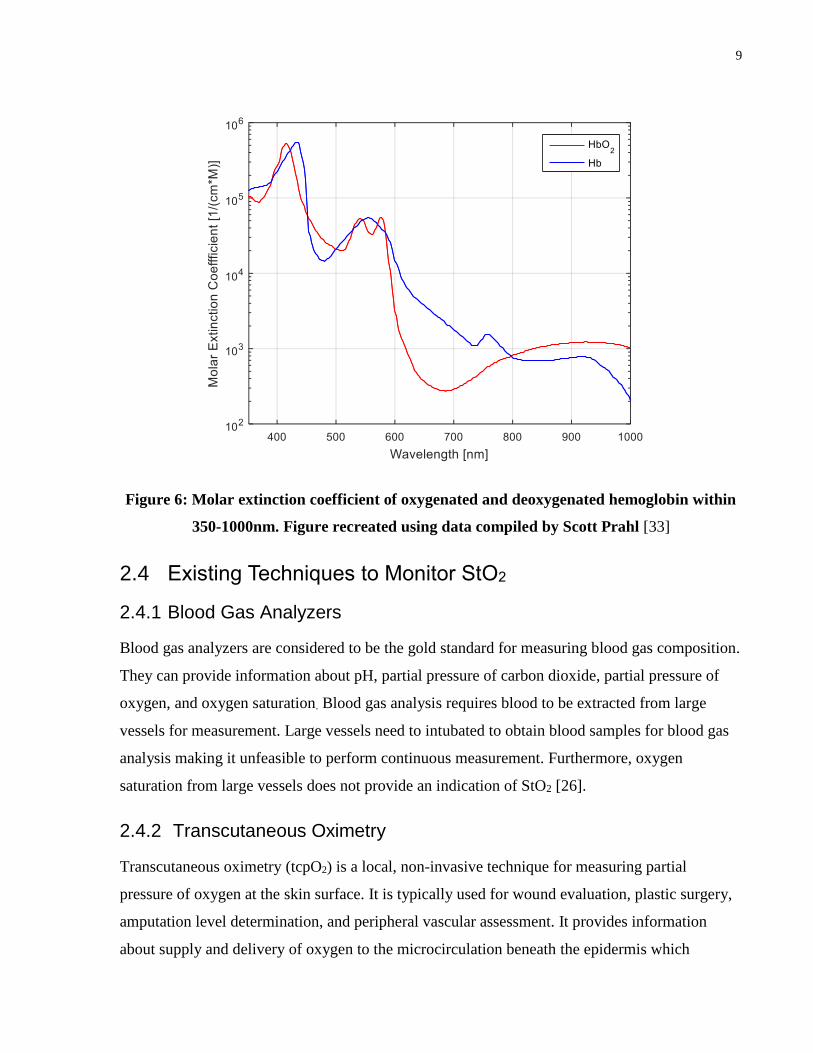
To determine StO2 the concentrations of HbO2 and Hb need to be known. Optical properties of
tissues are exploited to calculate concentration of Hb and HbO2. As seen in Figure 6, the molar
extinction coefficient of HbO2 and Hb is significantly dependent on the wavelength. Light
attenuation is dependent on the molar absorption coefficient according to the Beer-Lambert Law.
Beer-Lambert law states that the intensity of transmitted light (I) through a solution can be
determined given that the intensity of incident light (Io), optical path length (d), concentration of
substance (c), and wavelength dependent extinction coefficient (ϵ(λ)) of the substance are known
[32].
(2) 𝐈 = 𝐈𝐨 ∗ 𝟏𝟎−𝛜(𝛌)𝐜𝐝
The absorbance (A) of the light is given as
(3) 𝐀 = − 𝐥𝐨𝐠 (𝐈
𝐈𝐨) = 𝛜(𝛌)𝐜𝐝

8
In the presence of multiple absorbers, the total absorption is given by the superposition of
absorption from each specie [31]. To determine StO2, the concentrations of HbO2 and Hb are of
interest. By measuring the light transmitted through the tissue of interest at two different
wavelengths, StO2 can be determined using Equation 4 and Equation 5.
(4) 𝐀𝛌𝟏 = − 𝐥𝐨𝐠 (
𝐈
𝐈𝐨)
𝛌𝟏
= 𝛜𝐇𝐛𝐎𝟐(𝛌𝟏)𝐜𝐇𝐛𝐎𝟐
𝐝 + 𝛜𝐇𝐛(𝛌𝟏)𝐜𝐇𝐛𝐝
(5) 𝐀𝛌𝟐 = − 𝐥𝐨𝐠 (
𝐈
𝐈𝐨)
𝛌𝟐
= 𝛜𝐇𝐛𝐎𝟐(𝛌𝟐)𝐜𝐇𝐛𝐎𝟐
𝐝 + 𝛜𝐇𝐛(𝛌𝟐)𝐜𝐇𝐛𝐝
By selecting two unique wavelengths where extinction coefficient of HbO2 is higher than
extinction coefficient of Hb and another where the relationship is vice versa (e.g. 660nm and
940nm or 435nm and 470nm), it is possible to monitor changes in tissue oxygenation using the
Beer-Lambert law. Additional wavelengths can be selected for determining concentrations of
additional species. It is important to select wavelengths on either side of the isosbestic point
(crossover point where HbO2 and Hb have identical extinction coefficient) to ensure changes are
due to changes in concentration of HbO2 and Hb rather than factors such as lose connection or
changes in blood volume.
Concentration of Hb and HbO2 (cHband cHbO2) can be determined since the wavelegnth
dependent molar extinction coefficients (ϵHbO2(λ1), ϵHb(λ1), ϵHbO2
(λ2) and ϵHb(λ2)) are
known, intensity of incident light (Ioλ1and Ioλ2
) can be obtained from datasheet for the light
source and incident of trasnmitted light can be measured using photodiode (Iλ1and Iλ2
). For this
equation, it has to be assumed the optical distance travelled by two different wavlegnths is
identical. Beer-Lambert law does not take scattering into account hence it cannot be used strictly
to determine StO2. A calibration technique needs to be developed to determine absolute tissue
oxygen saturation.
9
Figure 6: Molar extinction coefficient of oxygenated and deoxygenated hemoglobin within
350-1000nm. Figure recreated using data compiled by Scott Prahl [33]
2.4 Existing Techniques to Monitor StO2
2.4.1 Blood Gas Analyzers
Blood gas analyzers are considered to be the gold standard for measuring blood gas composition.
They can provide information about pH, partial pressure of carbon dioxide, partial pressure of
oxygen, and oxygen saturation. Blood gas analysis requires blood to be extracted from large
vessels for measurement. Large vessels need to intubated to obtain blood samples for blood gas
analysis making it unfeasible to perform continuous measurement. Furthermore, oxygen
saturation from large vessels does not provide an indication of StO2 [26].
2.4.2 Transcutaneous Oximetry
Transcutaneous oximetry (tcpO2) is a local, non-invasive technique for measuring partial
pressure of oxygen at the skin surface. It is typically used for wound evaluation, plastic surgery,
amputation level determination, and peripheral vascular assessment. It provides information
about supply and delivery of oxygen to the microcirculation beneath the epidermis which

10
directly affects tissue perfusion. It is able to provide continuous information about the body’s
ability to deliver oxygen to the tissue [34],[35].
Normally, the measured pO2 is close to zero on the skin surface. When an electrode heats the
underlying tissue to approximately 42-52 degree Celsius, vasodilation intensifies the blood
perfusion and increasing the local oxygen pressure close to that of partial pressure of oxygen in
arterial blood (PaO2). When blood flow is adequate, tcpO2 measurements follow the arterial
oxygen level. When blood flow is inadequate, but the PaO2 is normal, the tcpO2 measurements
follow blood flow. When PaO2 and blood flow are affected, tcpO2 measurements follow tissue
oxygen consumption [35].
TcpO2 measurements requires skin surface preparation which include skin to be shaved and
removal of top layer of epidermis to remove cornified cells to reduce the diffusion resistance. It
also requires an electrode to be placed on the chest to provide as a central reference point, while
additional electrodes are placed the site to be monitored. It takes about 10 to 20 minutes for the
skin to warm to the required temperature. Furthermore, it is not recommended to monitor using
this technique to longer than 6 hours [35].
2.4.3 Near-Infrared Spectroscopy
Near infrared spectroscopy (NIRS) is a non-invasive light based technique to measure StO2.
NIRS is typically used to measure StO2 of the brain because near-IR beam is able to penetrate
bones which is required for transcranial cerebral oximetry [30]. NIRS uses a wavelength of
approximately 700nm to 1000nm which penetrate deeply due to transparency of biologic tissue
to near-IR spectrum. From Figure 7, it can be seen that light between 650-1000nm has high
penetration depth; penetration depth is defined as depth at which light intensity is reduced to
about 37% of the original intensity. The propagation of light through tissue depends on
reflection, absorption and scattering; reflection is determined by angle of the light beam
relatively to tissue surface and scattering is deviation of light beam from straight trajectory due
to particulate matter in the sample. Accordingly, NIRS measurements can be made in two ways:
1) Transmission mode - light source and light detector are placed across each other. 2) Reflection
mode - where light source and detector are placed in an angular arrangement on the same side.
Use of transmission mode is limited to infants where it is feasible to place light source and

11
detector across each other without losing signal intensity; reflection mode can be applied more
generally on any individual [29].
Figure 7: Depth of penetration of oxygenated and deoxygenated hemoglobin within 350-
1000nm assuming 150g/L hemoglobin concentration and 64 000g/mol molar mass of
hemoglobin
Due to the low extinction coefficient, near-IR light travels a few centimeters through tissue [36].
If the source-detector are placed too close to each other, the detector will not detect enough light
since NIRS requires the long tissue paths to generate a reliable and measureable absorption [37].
Also, it is important to place the source and detector at an adequate distance to achieve desired
depth of penetration. For example, if the source and detector are placed too close together in
cerebral oximetry, extra-cerebral tissue will contribute to light attenuation rather than cerebral
tissue which is of interest. There exists a proportional relationship between source-detector
distance and depth from which majority of light is received: depth of penetration is
approximately 1/3 of the distance between source and detector (e.g. if the source and detector are

12
3 cm apart, the penetration depth from which majority of signal is received is 1 cm); the region
that light passes through is assumed to be “banana shaped” [38].
There are various types of NIRS monitors available including continuous wave, frequency
domain, time resolved and spatially-resolved spectroscopy. Most research and clinical systems
use continuous wave NIRS instruments to calculate changes in chromophore concentration.
Commercial systems typically use four wavelengths to resolve for concentration of four
chromophores to improve the accuracy of StO2 measurements. Most systems use semiconductor
laser diodes as light source and photomultipliers or silicon photodiodes for light detection with
typical distance of greater than 2.5cm between source and detector [29].
Figure 8: Schematic of NIRS where light source and detector are typically placed 4-8cm
apart to ensure the light penetrates through the skull. Light travels through “banana-
shaped” region.
2.4.4 Visible Light Spectroscopy
Visible light spectroscopy (VLS) uses visible light between 400-625nm to monitor
microvascular StO2 in thin and small tissue volumes. Light within 400-625nm has shallow
penetration depth due to high extinction coefficient of HbO2 and Hb in this range. This limits the
usage of VLS oximeters to measurements few millimeters from the surface to sites such as
buccal mucosa, gastrointestinal mucosa, esophagus, and skin surface monitoring. VLS tissue
oximeters measure oxygen saturation in volumes that are typically 125μL or less compared to
30mL or more measured by NIRS [37], [39]. Due to the shallow penetration depth, VLS usage is
limited to reflection mode (i.e. it is not feasible to measure in transmission mode). In reflection
mode using VLS, light source and detector need to be placed within few millimeters of each
other for obtaining measurements.

13
White light source is used for illuminating the tissue and a fiber optic bundle transmits
information back to the monitor for real-time results. Two types of light sources are typically
used for VLS: 1) High-intensity fiber-coupled halogen light source or 2) White light LED source
for integration directly into probe for low transmission losses. Custom charged-coupled device
(CCD) spectrophotometers, sensitive to visible light, are used for detecting the light;
spectrophotometers are capable of measuring light intensities as a function of wavelength.
Sensing components for VLS have been integrated into 6x200nm hand-held wand, 2mm
endoscopic catheter, clip-on buccal probe, 27-Gauge needle probe, 5 mm diameter esophageal
monitoring catheter, and 12mm diameter flexible colonic probe for monitoring tissue
oxygenation at various sites [37].
2.4.5 Pulse-Oximetry like Technique for measuring StO2
Pulse oximeters are commonly used to non-invasively measure peripheral oxygenation (SpO2).
Two wavelengths of light, typically in the red and near-IR region are passed through the tissue.
This allows measurements in tissue thicknesses ranging from 8-25mm [40]. HbO2 absorbs more
infrared and allows more red light to pass through, and Hb absorbs more red light and allows
more infrared light to pass through making it possible to detect changes in oxygenation
saturation by monitoring the trends. Most commonly, pulse oximeter works on transmission
based technique where the light source and detector are located opposite of each other.
Transmitted light from the source is detected at the photodiode after being attenuated by the
tissue. Pulse oximeters apply signal processing algorithms to filter out DC component of the
signal from capillaries, veins and tissues measuring only the pulsating arterial contribution.
It has been shown that pulse-oximeter like technique can be used to measure tissue oxygenation
by exploiting the non-pulsating signal. Bipolar/bicolor LED (red and near-IR) and photodiode
were integrated onto distal tip of surgical retractors including Deaver and Babcock retractor.
Using two different wavelengths of light and monitoring their attenuation relative to each other
gives a value proportional to the oxygen saturation. The algorithm used is similar to that of
pulse-oximeters; however, rather than detecting only the arterial component, the measurements
are based on attenuation of light through the arteries, arterioles, vein, venules and capillaries. The
device was designed in transmission mode and reflection mode for the different types of
retractors. The signal-to-noise ratio (SNR) is much better when transmission mode is used. When

14
reflection mode is used, light source and detector need to be slightly angle towards each other;
but significant angles can impact the normal function of the tool [23], [41].
2.4.6 Three Charged-Coupled Device (CCD) Camera
A method to assess kidney health has been proposed using 3-CCD camera used in laparoscopic
surgery. White light (~400-700nm) source is used in all laparoscopy cases to illuminate the
working area; this light is essential to obtaining view of the surgical field because it is used to
produce the image seen by the surgeon on the monitor. 3-CCD camera is used to capture images
seen by the surgeon; three separate CCDs are used to take separate measurements from red,
green, or blue light forming an image. Individual frames of the video can be converted into an
image that can be processed. Using image processing algorithms, the intensity of red, green and
blue light can be determined for each pixel of the image. The blue CCD response is subtracted
from the red CCD response, and the difference can be correlated with oxygenation. HbO2 is
expected to absorb more blue light, while Hb is absorbs more red light. With changes in
oxygenation, intensity of the red, blue and green light change [42]. This technique could be
expanded to measure tissue oxygenation during laparoscopic surgery in a more general area.
Using this technique, tissue oxygenation can only be measured few millimeters below the
surface.
2.5 Comparing Techniques
As described in the previous section, various techniques can be used to monitor StO2. Each
technique has its advantages and limitations that need to be considered prior to selecting a
technique to integrate with surgical tools.
Blood gas analyzers: Even though blood gas analyzers are considered as the gold standard, they
are very invasive. They require blood to be drawn from large vessels to obtain a reading which
may not be feasible and justified during surgery. In addition, blood gas analyzers are not suitable
for continuous reading
Transcutaneous oximetry: Although transcutaneous oximeters provide continuous
measurements, it takes approximately 10-20 minutes to heat the tissue to obtain measurement. In
addition, tcpO2 is only suitable for measurements on the skin which limits its application for
other soft tissue.

15
NIRS: When using NIRS, light source and detector need to be few centimeters apart for reliable
measurements. Due to the restrictions in available workspace at the tip of a laparoscopic
instruments, it is not practical to keep the source and detector a few centimeters apart. In
addition, the cost of the NIRS box is approximately $16000 with $150 for the sensor [43].
VLS: Existing VLS systems have various probe designs that maybe suitable for monitoring
tissue oxygenation in laparoscopic surgery; however, these probes would interfere with the
surgical workflow as the surgeon would need to remove the tool and insert the sensor through the
trocar for reliable measurement. This would add time to the surgical procedure, and continuous
monitoring would not be possible. Available VLS oximeters use fiber optics for guiding the
light source which makes the integration with laparoscopic instruments significantly more
complex. Finally, VLS monitoring systems cost approximately $21,500 for the monitoring box
and $400 for a disposable sensor [43].
3-CCD camera: For the purpose of this application, the interest is in monitoring oxygenation
changes at the site of grasping. This is not feasible with the 3-CCD camera technique because
surgical instruments would not permit grasped tissue to be imaged.
Pulse-oximeter like technique: Pulse-oximeter like technique uses LEDs as light source and
photodiodes as a light detector. This technique is transmission based; hence the source and
detector can be placed opposite to each other making it simpler to integrate with the laparoscopic
instrument. Pulse oximeters are effective for finger thickness of 8mm to 26mm [40]; it can be
assumed that transmission based pulse-oximeter like technique would be effective for similar
tissue thicknesses. Furthermore, the pulse-oximeter technique is simpler and offers a cost-
effective solution in comparison to NIRS and VLS. LEDs and photodiodes are compact, easily
available, low cost, and provide the possibility of a disposable sensor compared to a laser, fiber
optics or narrow-band optical filters which are much more difficult to integrate and cost
significantly more [23].
Existing tools are too bulky to be inserted through standard trocars because they have wires
running along the shaft of the instrument. In addition, the tool tip needs to be drastically
modified to integrate the large sensing components. Also, existing tools have only tested LEDs
with peak wavelength of 660nm and 940nm. Furthermore, the tool’s ability to sense StO2 with
grasped tissue has not been tested.

16
2.6 Research Goal
To identify suitable wavelengths for continuously measuring tissue oxygen saturation (StO2)
while performing surgical maneuvers using laparoscopic instruments.
2.7 Research Objectives
1) Design, build, and test a StO2 sensor for continuous monitoring by testing various
wavelengths in reflectance and transmittance mode using light emitting diodes (LEDs) as
light source and photodiodes as light detector.
2) Miniaturize and integrate the StO2 sensor onto laparoscopy tools without compromising the
tool functionality.
2.8 Constraints
The following requirements should be satisfied by the sensor:
Sensor needs to be integrated with surgical tools without compromising the tool
functionality,
Sensor provides continuous reading for the tissue being manipulated by the surgeon,
Sensor needs to fit through a standard 5mm trocar,
Sensing components of the sensor should be at the distal end of the instruments where the
tissue is being grasped, and
Sensor should not interfere with normal surgical workflow.
17
Transmission Mode Sensor Design
3.1 StO2 Sensor Design
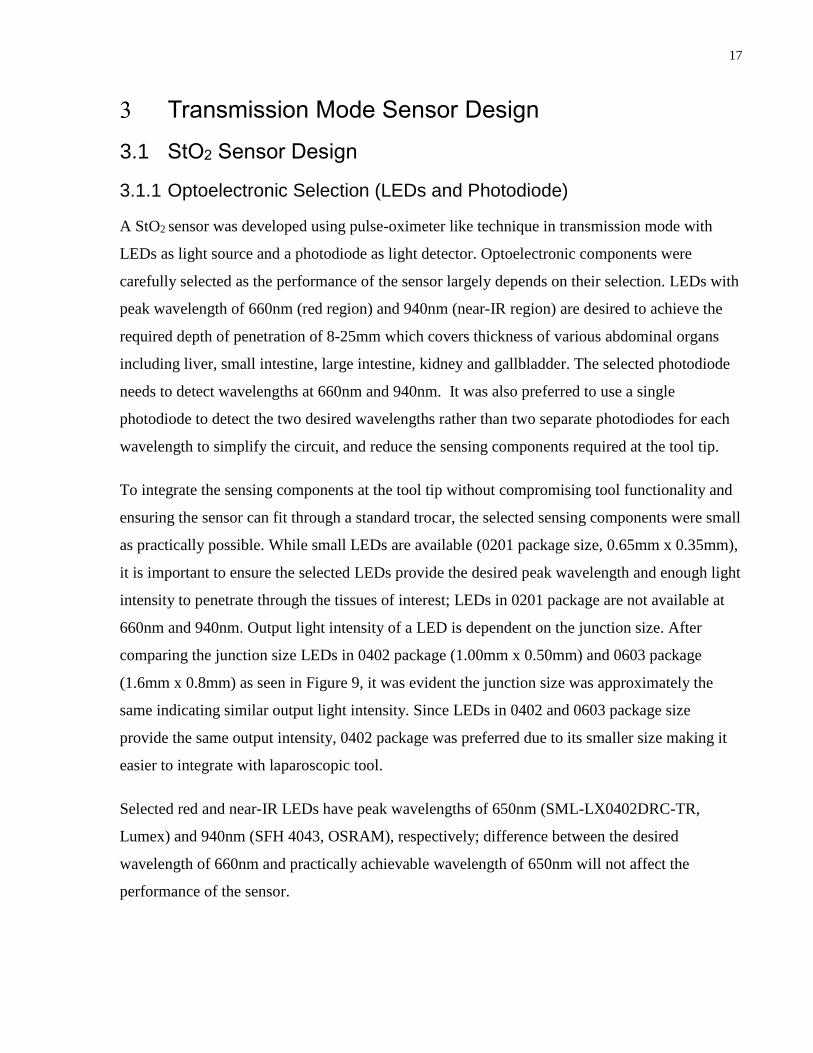
3.1.1 Optoelectronic Selection (LEDs and Photodiode)
A StO2 sensor was developed using pulse-oximeter like technique in transmission mode with
LEDs as light source and a photodiode as light detector. Optoelectronic components were
carefully selected as the performance of the sensor largely depends on their selection. LEDs with
peak wavelength of 660nm (red region) and 940nm (near-IR region) are desired to achieve the
required depth of penetration of 8-25mm which covers thickness of various abdominal organs
including liver, small intestine, large intestine, kidney and gallbladder. The selected photodiode
needs to detect wavelengths at 660nm and 940nm. It was also preferred to use a single
photodiode to detect the two desired wavelengths rather than two separate photodiodes for each
wavelength to simplify the circuit, and reduce the sensing components required at the tool tip.
To integrate the sensing components at the tool tip without compromising tool functionality and
ensuring the sensor can fit through a standard trocar, the selected sensing components were small
as practically possible. While small LEDs are available (0201 package size, 0.65mm x 0.35mm),
it is important to ensure the selected LEDs provide the desired peak wavelength and enough light
intensity to penetrate through the tissues of interest; LEDs in 0201 package are not available at
660nm and 940nm. Output light intensity of a LED is dependent on the junction size. After
comparing the junction size LEDs in 0402 package (1.00mm x 0.50mm) and 0603 package
(1.6mm x 0.8mm) as seen in Figure 9, it was evident the junction size was approximately the
same indicating similar output light intensity. Since LEDs in 0402 and 0603 package size
provide the same output intensity, 0402 package was preferred due to its smaller size making it
easier to integrate with laparoscopic tool.
Selected red and near-IR LEDs have peak wavelengths of 650nm (SML-LX0402DRC-TR,
Lumex) and 940nm (SFH 4043, OSRAM), respectively; difference between the desired
wavelength of 660nm and practically achievable wavelength of 650nm will not affect the
performance of the sensor.

18
The smallest available photodiode has package size of 0805 (2.0mm x 1.25mm); hence
photodiode with this package size was selected. Selected photodiode (TEMD7000X01, Vishay)
has working range from 400nm-1100nm; 660nm and 940nm are within this range.
Figure 9: Comparing junction size of different LEDs
3.1.2 Integrating Sensor with Laparoscopic Tools
StO2 sensor’s sensing components were integrated within the tool tip for continuous monitoring.
This allows tissue health to be monitored while the tissue is maneuvered by the surgeon.
Optoelectronic components were integrated within the cut-out present (Figure 10) in many
graspers such that they do not interfere the tool’s performance or the surgical workflow. The
available workspace within the cut-out is approximately 20.00mm x 2.00mm x 1.40mm; the
selected optoelectronic components can be fitted into this space.
Figure 10: LEDs and photodiodes will be integrated in the cut-out to ensure the tool-
functionality is not compromised.

19
Flexible printed circuit boards (FPCBs) were used to integrate the optoelectronic components
within the laparoscopic tool. FPCB provides a reliable alternative to running wires along the
instruments because FPCBs are less likely to be damaged due to friction with the trocar and
provide a stronger signal. FPCB have the added benefit of being waterproof, moisture proof and
corrosion resistant, while adding negligible weight to the surgical instrument. Furthermore,
FPCB can be customized to meet the required application due to the elastic nature of the FPCB
which makes it possible to place them around edges and folds. In addition, they add minimal
thickness of 0.1mm to the tool allowing the tool to fit through standard trocars.
As shown in Figure 11, the red and near-IR LEDs were placed adjacent to each other on a FPCB,
while the photodiode is placed on another FPCB. FPCB with LEDs was placed on one side of the
grasper and FPCB with photodiode was placed on the opposite side allowing the sensor to work
in transmission mode. Transmission mode provides better signal, as well as allowing the StO2 to
be measured for the entire tissue thickness. FPCBs were custom designed such that the LED
junctions can be placed directly across the sensing junction of the photodiode to maximize the
light received by the photodiode.
Figure 11: LEDs and photodiode integrated with FPCB.
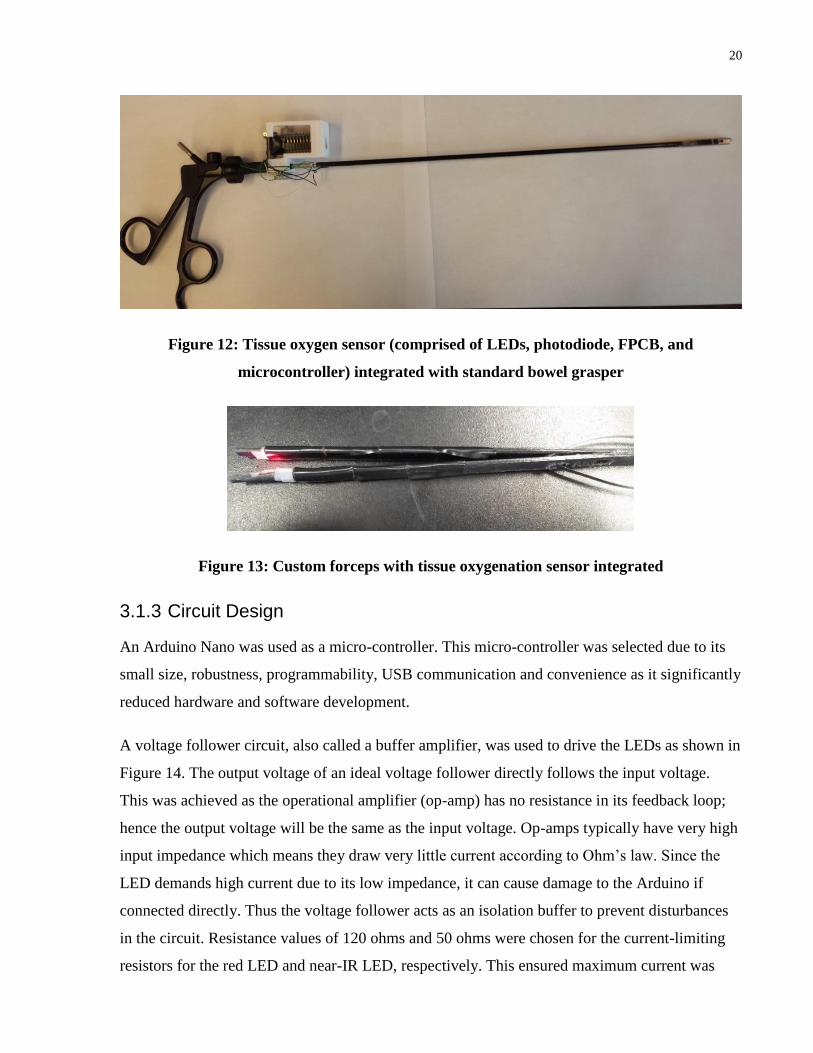
The integration of tissue oxygenation sensor with standard bowel grasper is shown in Figure 12.
The FPCB runs along the shaft of the instrument; the LEDs and photodiodes were placed at the
tip of the instrument. Microcontroller was placed near the handle and remains outside the trocar.
The microcontroller is very light and does not interfere with the normal usage of the tool. StO2
sensor was also integrated with custom 3D-printed forceps shown in Figure 13 for ease of
testing.
20
Figure 12: Tissue oxygen sensor (comprised of LEDs, photodiode, FPCB, and
microcontroller) integrated with standard bowel grasper
Figure 13: Custom forceps with tissue oxygenation sensor integrated
3.1.3 Circuit Design
An Arduino Nano was used as a micro-controller. This micro-controller was selected due to its
small size, robustness, programmability, USB communication and convenience as it significantly
reduced hardware and software development.
A voltage follower circuit, also called a buffer amplifier, was used to drive the LEDs as shown in
Figure 14. The output voltage of an ideal voltage follower directly follows the input voltage.
This was achieved as the operational amplifier (op-amp) has no resistance in its feedback loop;
hence the output voltage will be the same as the input voltage. Op-amps typically have very high
input impedance which means they draw very little current according to Ohm’s law. Since the
LED demands high current due to its low impedance, it can cause damage to the Arduino if
connected directly. Thus the voltage follower acts as an isolation buffer to prevent disturbances
in the circuit. Resistance values of 120 ohms and 50 ohms were chosen for the current-limiting
resistors for the red LED and near-IR LED, respectively. This ensured maximum current was

21
supplied to each LED. A low-voltage rail-to-rail output op-amp (TLV 341, Texas Instruments)
was used.
Figure 14: Voltage follower circuit to drive LED
A trans-impedance amplifier was used to convert current to voltage. A photodiode converts light
into current when photons are absorbed by the photodiode; the current needs to be converted to
voltage for measurement. When the current output of the photodiode was tested on a multi-meter
with 660nm and 940nm LEDs, the photodiode typically produced current in the order of a few
hundred nano-amps. As seen in
Figure 15, a 2MΩ resistor was used to convert this current into a voltage in the order of
magnitude of a few hundred micro-volts. This voltage was amplified by a factor of eleven using
10 kΩ and 1kΩ resistors to maximize voltage range.
Figure 15: Trans-impedance amplifier with 11x gain

22
3.1.4 Algorithm
The following algorithm was used for measuring changes in StO2:
1) Red LED was turned on for 20 milliseconds.
2) Photodiode reading was taken.
3) Red LED was turned off.
4) Near-IR LED was turned on 20 milliseconds.
5) Photodiode reading was taken.
6) Near-IR LED was turned off.
7) Both LEDs were off for 20 milliseconds. Ambient light reading was measured.
8) Ambient signal was subtracted from red and near-IR LED reading.
LEDs were pulsed at constant intensity and amplitude, and changes were measured for each light
intensity individually. Due to the pulsing, single photodiode could be used for measuring
response of both LEDs. Changes in light intensity can be related to changes in concentration of
hemoglobin. Other alternatives such as frequency and amplitude modulations exist; however,
they significantly complicated the circuit. Ambient light was subtracted from red and near-IR
reading to improve the signal reliability.
3.2 660nm and 940nm in Transmission Mode Testing
3.2.1 In vivo Experiment 1 - Proof of Concept
In vivo proof of concept experiments were conducted to prove the effectiveness of 660nm and
940nm wavelengths in detecting changes in StO2 using transmission mode. For ease of testing,
the StO2 sensor was integrated with custom forceps as shown in Figure 13. A standard blood
pressure cuff was placed on the forearm, and the index finger was gently grasped with custom
forceps to monitor changes in StO2 as shown in Figure 16. A baseline reading was collected for
15 seconds. Pressure was increased from 0 to 260mmHg and maintained for 90 seconds. Pressure
was reduced to 0mmHg and changes were monitored for 30 seconds after the release.
23
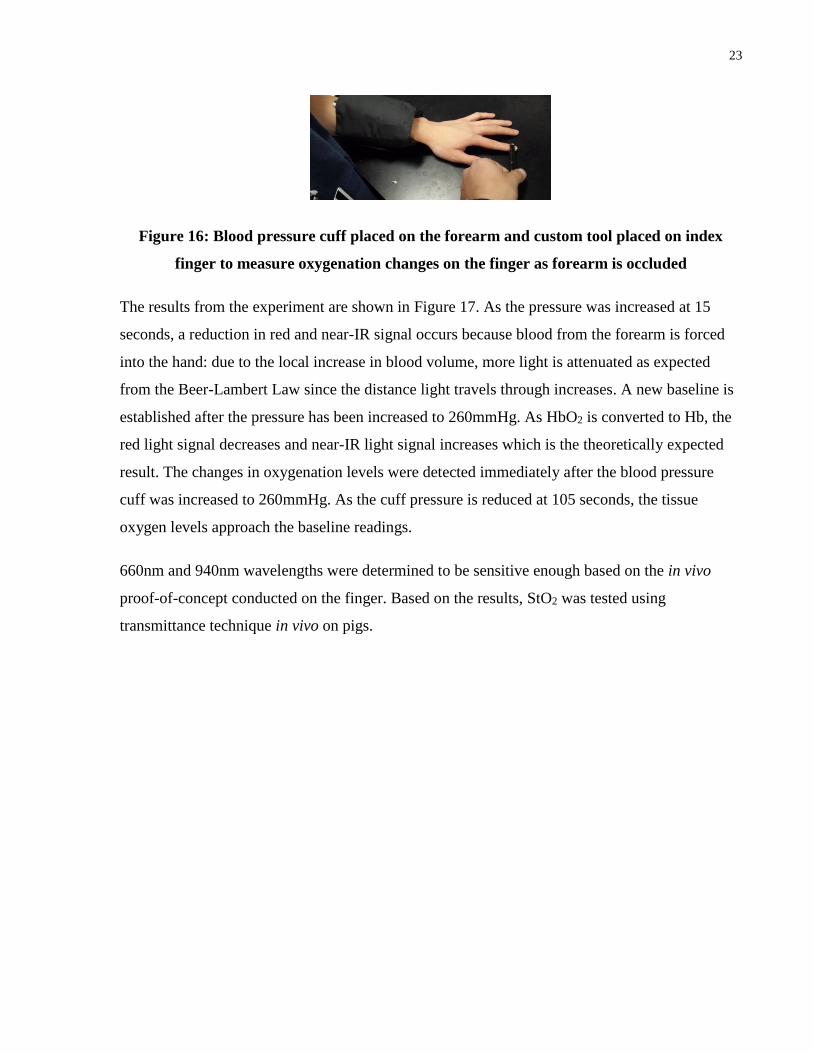
Figure 16: Blood pressure cuff placed on the forearm and custom tool placed on index
finger to measure oxygenation changes on the finger as forearm is occluded
The results from the experiment are shown in Figure 17. As the pressure was increased at 15
seconds, a reduction in red and near-IR signal occurs because blood from the forearm is forced
into the hand: due to the local increase in blood volume, more light is attenuated as expected
from the Beer-Lambert Law since the distance light travels through increases. A new baseline is
established after the pressure has been increased to 260mmHg. As HbO2 is converted to Hb, the
red light signal decreases and near-IR light signal increases which is the theoretically expected
result. The changes in oxygenation levels were detected immediately after the blood pressure
cuff was increased to 260mmHg. As the cuff pressure is reduced at 105 seconds, the tissue
oxygen levels approach the baseline readings.
660nm and 940nm wavelengths were determined to be sensitive enough based on the in vivo
proof-of-concept conducted on the finger. Based on the results, StO2 was tested using
transmittance technique in vivo on pigs.

24
Figure 17: Monitoring response of red and near-IR signal at index finger after placing
blood pressure cuff on the forearm and slowly increasing cuff pressure. Forearm was
occluded at 15 seconds and released at 105 seconds.
3.2.2 In vivo Experiment 2 – Grasping Bowel
In this experiment, the goal was to test the StO2 sensor’s ability to detect changes in oxygenation
in vivo while grasping a tissue. Small intestine was grasped with relatively low and high force
using laparoscopic tool as shown in Figure 18. A baseline reading was obtained for 15 seconds.
After the baseline reading, the small intestine was grasped with relatively low force for 60
seconds; elastic bands were used to control the forces applied by the grasper. This was repeated
at a higher force.
20 40 60 80 100 120 1400
0.1
0.2
0.3
0.4
0.5
Red R
esponse (
V)
20 40 60 80 100 120 1402.2
2.4
2.6
2.8
3
Time (s)
IR R
esponse (
V)

25
Figure 18: Grasping small intestine with sensorized laparoscopic grasper
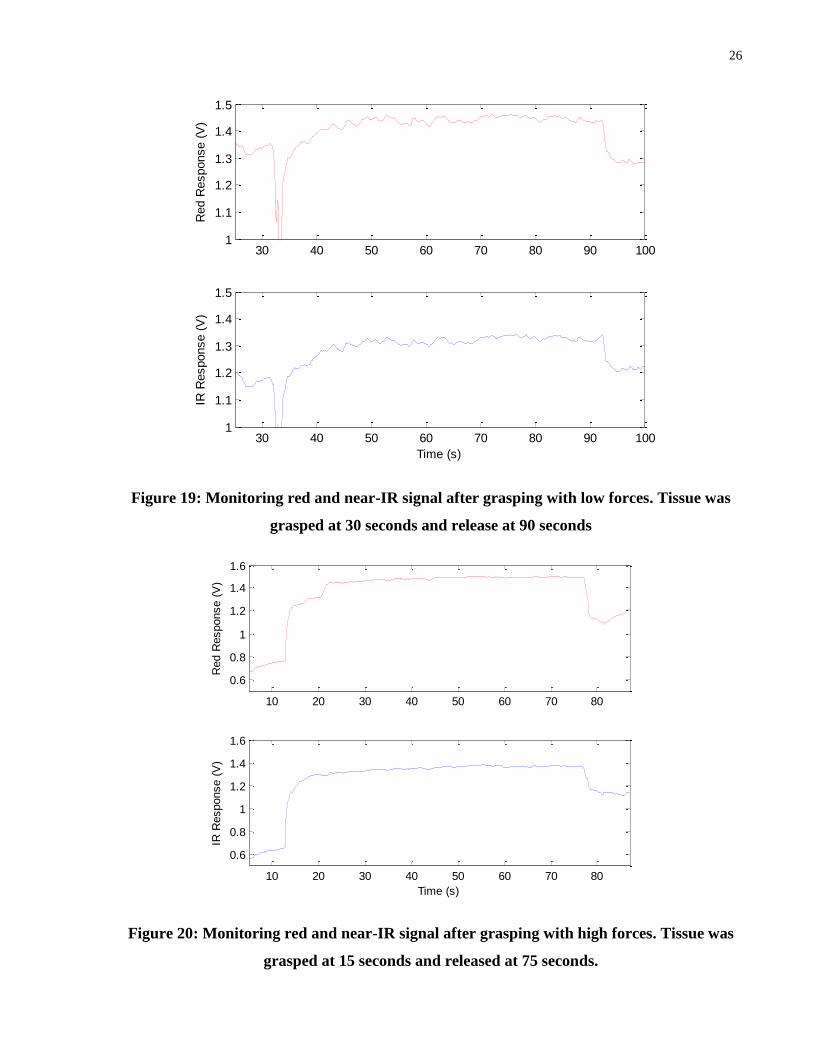
When tissue was grasped with relatively low forces, there is an initial increase in red and near-IR
signal as shown in Figure 19. The initial increase in the photodiode response is due to the
reduction in distance between LED and photodiode, and the local reduction of blood volume
from squeezing the tissue. This increase in the signal is expected based on the Beer-Lambert Law
because the distance light travels before reaching the photodiode is reduced. From the proof of
concept conducted on the finger, the intensity of the red light was expected to decrease and the
intensity of the near-IR light was expected to increase as HbO2 gets converted to Hb during the
grasp. Based on Figure 19, no changes in tissue oxygenation were detected after grasping for 60
seconds. Similarly, when high grasping force was used, no changes were observed in the LED
intensity as shown in Figure 20. The only difference between low and high grasping force was
the initial increase in the signal at the time of grasping. The signal rises to a higher value when
higher forces are applied because the LEDs and photodiodes are closer together, as well a larger
volume of blood is forced out of the tissue compared to when lower forces are applied.
26
Figure 19: Monitoring red and near-IR signal after grasping with low forces. Tissue was
grasped at 30 seconds and release at 90 seconds
Figure 20: Monitoring red and near-IR signal after grasping with high forces. Tissue was
grasped at 15 seconds and released at 75 seconds.
30 40 50 60 70 80 90 1001
1.1
1.2
1.3
1.4
1.5
Red R
esponse (
V)
30 40 50 60 70 80 90 1001
1.1
1.2
1.3
1.4
1.5
Time (s)
IR R
esponse (
V)
10 20 30 40 50 60 70 80
0.6
0.8
1
1.2
1.4
1.6
Red R
esponse (
V)
10 20 30 40 50 60 70 80
0.6
0.8
1
1.2
1.4
1.6
Time (s)
IR R
esponse (
V)

27
3.2.3 In vivo Experiment 3– Measuring Beside Tissue
During in vivo experiment 2, it was evident that relatively low forces are required to displace the
blood from the site of grasping as shown in Figure 21. A pale region is clearly evident beside the
grasper indicating blood displacement even when the liver and small intestine were grasped with
relatively low forces.
Figure 21: Blood displacement after grasping bowel (left) and liver (right) with low forces
Based on the observations and results from the previous in vivo experiment, the StO2 was
measured beside the site of grasping rather than at the site of grasping as shown in Figure 22.
The goal was to indirectly show how different grasping forces affect tissue oxygenation: if the
tissue is grasped with different forces, different changes in tissue oxygenation should be
expected beside the site of grasping.
Figure 22: Monitoring tissue oxygenation changes beside the site of grasping. Liver is
clamped with ratcheted forceps and tissue oxygenation is measured with custom forceps

28
The results from this experiment are shown in Figure 23. Liver was grasped with custom forceps
and baseline reading was obtained for 20 seconds. Ratcheted forceps were used to grasp the liver
beside the sensor with high forces. The trends in red and near-IR signal between 20-120 seconds
are identical indicating no changes in oxygenation. These affects are most likely due to changes
in blood volume beside the grasped site; with reduction in StO2, intensity of red signal would
decrease and intensity of near-IR signal would increase. Forceps compressing the liver was
released at 120 seconds.
Figure 23: Monitoring response of red and near-IR light beside the site of grasping. Tissue
was grasped at 20 seconds and released at 120 seconds.
3.2.4 In vivo Experiment 4 – Occluding Arterial Supply
During in vivo experiment 2 and 3, no changes were observed in the StO2 levels when StO2 was
measured at or beside the grasped location. A potential reason for not observing any changes
maybe that the tool is not be sensitive enough to detect in vivo changes. To determine the in vivo
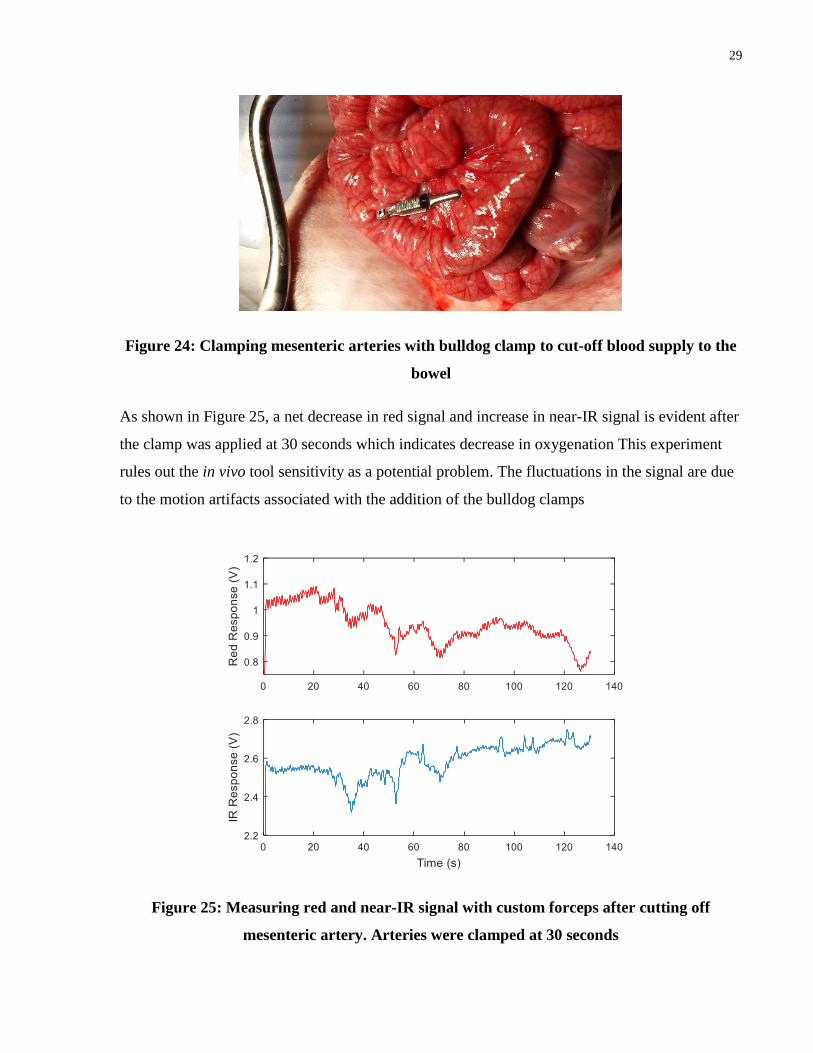
tool sensitivity, the mesenteric artery was occluded to induce large changes in StO2. A baseline
reading was obtained for 20 seconds. The mesenteric arteries supplying the small intestine were
clamped to cut-off oxygenated blood as shown in Figure 24 using a bulldog clamp at 20 seconds.
The changes in oxygenation levels were measured using the custom forceps.
29
Figure 24: Clamping mesenteric arteries with bulldog clamp to cut-off blood supply to the
bowel
As shown in Figure 25, a net decrease in red signal and increase in near-IR signal is evident after
the clamp was applied at 30 seconds which indicates decrease in oxygenation This experiment
rules out the in vivo tool sensitivity as a potential problem. The fluctuations in the signal are due
to the motion artifacts associated with the addition of the bulldog clamps
Figure 25: Measuring red and near-IR signal with custom forceps after cutting off
mesenteric artery. Arteries were clamped at 30 seconds
30
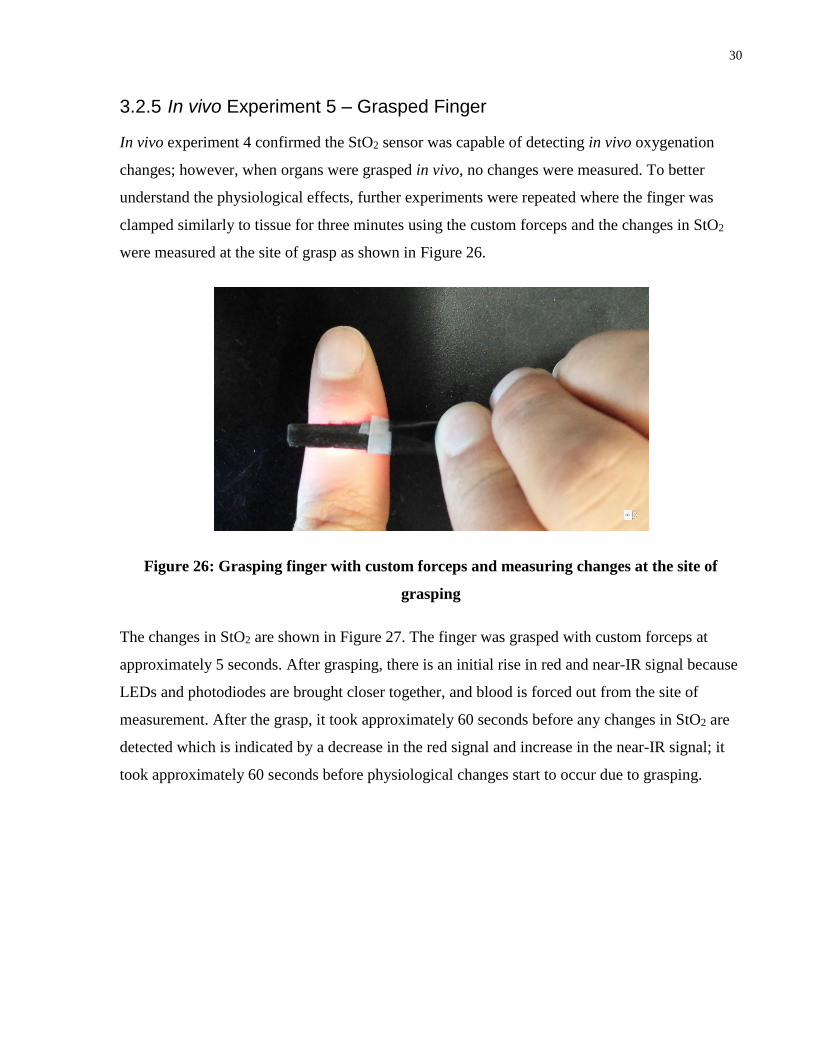
3.2.5 In vivo Experiment 5 – Grasped Finger
In vivo experiment 4 confirmed the StO2 sensor was capable of detecting in vivo oxygenation
changes; however, when organs were grasped in vivo, no changes were measured. To better
understand the physiological effects, further experiments were repeated where the finger was
clamped similarly to tissue for three minutes using the custom forceps and the changes in StO2
were measured at the site of grasp as shown in Figure 26.
Figure 26: Grasping finger with custom forceps and measuring changes at the site of
grasping
The changes in StO2 are shown in Figure 27. The finger was grasped with custom forceps at
approximately 5 seconds. After grasping, there is an initial rise in red and near-IR signal because
LEDs and photodiodes are brought closer together, and blood is forced out from the site of
measurement. After the grasp, it took approximately 60 seconds before any changes in StO2 are
detected which is indicated by a decrease in the red signal and increase in the near-IR signal; it
took approximately 60 seconds before physiological changes start to occur due to grasping.

31
Figure 27: Monitoring response of red and near-IR light after grasping finger with custom
forceps
3.3 660nm and 940nm in Transmission Mode - Discussion
There are two major differences in the results between the two in vivo experiments conducted on
the finger (In vivo experiment 1 and 5). In the proof of concept experiment, the drop in StO2 was
seen immediately after increasing the pressure to 260mmHg, whereas it took approximately 60
seconds before changes were detected in the grasped finger experiment. In the proof of concept
experiment, the changes in signal from tissue oxygenation are approximately a magnitude higher
than changes detected in the grasped finger experiment. Smaller changes occur in StO2 when the
finger is grasped rather than occluding the blood flow to the finger. This could be due to lower
blood volume at the site of measurement which results in less light attenuation. Furthermore,
when the forearm is occluded, HbO2 is almost completely blocked off from reaching the hand;
however, when finger is grasped, there is possibility of some blood flow to the grasped site.
When StO2 changes were monitored by grasping the bowel, StO2 sensor did not detect changes in
oxygenation. In this experiment, tissue was grasped reducing the thickness to few millimeters
and pushing away the blood from site of measurement. Approximate hydrostatic capillary
pressure (P) is approximately 25mmHg (3.3kPa). If we assume an area (A) of 1 cm x 1cm, it

32
would take approximately 0.33N of force (F) to displace the blood from capillaries; 0.33N of
force equates to 36 grams assuming 9.81m/s2 gravitational constant (g).
(6) 𝑭 = 𝑷 ∗ 𝑨
(7) 𝑭 = 𝒎 ∗ 𝒈
(8) 𝒎 =𝑷∗𝑨
𝒈
Typical grasping force used during surgical grasps is about 8.52 ± 2.77 N [46]. This is over an
order of magnitude higher than the force required to displace the blood from capillaries. The type
of grasper used can greatly influence the pressure applied to the tissue. Smaller grasping tips
magnify the pressure at the tip; too much pressure is likely to cause tissue damage. Larger jaws
provide better grip due to more friction, as well for a given force larger jaws reduce the pressure
applied to the tissue. Unfenestrated jaw designs rely solely on friction to hold the tissue in place
which increases the chances of applying excessive pressure. Fenestrated design which
incorporate open area provide safer grip because they enclose portion of tissue within the
window preventing it from slipping [47]. The use of StO2 sensor while grasping tissue may be
limited to graspers that apply minimal pressure to the tissue. Furthermore, thinner tissues are
likely to be more delicate in comparison to thicker tissue as thicker tissue is likely to have
redundant blood supply making it less prone to ischemic damage. This may put restrictions on
the tissue thickness the sensor can provide reliable readings from.
StO2 sensor successfully detected changes in StO2 where the arterial supply was occluded. In this
experiment, tissue was genteelly grasped without reducing the thickness (approximate small
intestine thickness was ~1cm) and blood was not forced out. From these results, it is evident that
660nm and 940nm wavelengths are unable to detect oxygenation changes in thin tissue or areas
with low hemoglobin. Wavelengths in the red and near-IR region need long path lengths for
reliable measurements due to their relatively low extinction coefficient limiting its use to only
monitoring large, homogenous volume of tissue. During normal surgical maneuvers, soft tissue
thickness is likely to be reduced to few millimeters during grasps and hemoglobin is likely to be
forced out; hence 660nm and 940nm cannot be used in transmission mode to detect StO2 changes
while tissue is maneuvered.

33
Exploring Visible Spectrum
4.1 Visible Light Advantages
From the previous in vivo experiments, it is apparent that additional wavelengths need to be
explored for reliable measurements in thin tissues or areas with low hemoglobin. Ideally, larger
and more noticeable changes in signal intensity should be expected. Based on Figure 6, focus
should be on visible light in the wavelength range from 400-625nm which have very high
extinction coefficient. Wavelengths within 400-625nm have shorter path lengths because they
have higher frequency. High extinction coefficient and shorter optical path lengths make it
possible to perform reliable measurement in small tissue volume using visible light due to its
shallow penetration depth.
4.2 Wavelength Selection for Reflectance Measurement
Specific wavelengths within 400-600nm were selected for determining changes in tissue
oxygenation. To robustly detect changes in tissue oxygenation, wavelengths where the difference
between molar extinction coefficient of oxygenated and deoxygenated hemoglobin is the largest
were used. Based on Figure 28, LEDs with peak wavelength of 435nm (QTLP600CBTR,
Everlight), 475nm (APTD1608VBC/D, Kingbright), 510nm (SM1204UPGC, Bivar) and 560nm
(LP T655-Q1R2-25-Z, OSRAM) were desired due to the large difference in the molar extinction
coefficient between HbO2 and Hb. In addition, wavelengths at isosbestic points were selected
where oxygenated and deoxygenated hemoglobin have identical extinction coefficient.
Theoretically, these wavelengths can provide estimation of total hemoglobin content because
signal at isosbestic wavelength is not expected to vary with changes in oxygenation; rather, the
signal would only be impacted by an overall increase or decrease in the total hemoglobin
content. Based on Figure 28 LEDs with peak wavelength of 500nm (SM1204PGC, Bivar),
570nm (HSME-C150, Avago Technologies) and 588nm (LTST-C930KSKT, Lite-On) were
selected. LEDs at 660nm (AA3528SRS, Kingbright) and 940nm (SFH 4243-Z, OSRAM) were
also tested in the reflectance mode; these wavelengths should provide reliable results on the
finger which is relatively thick.
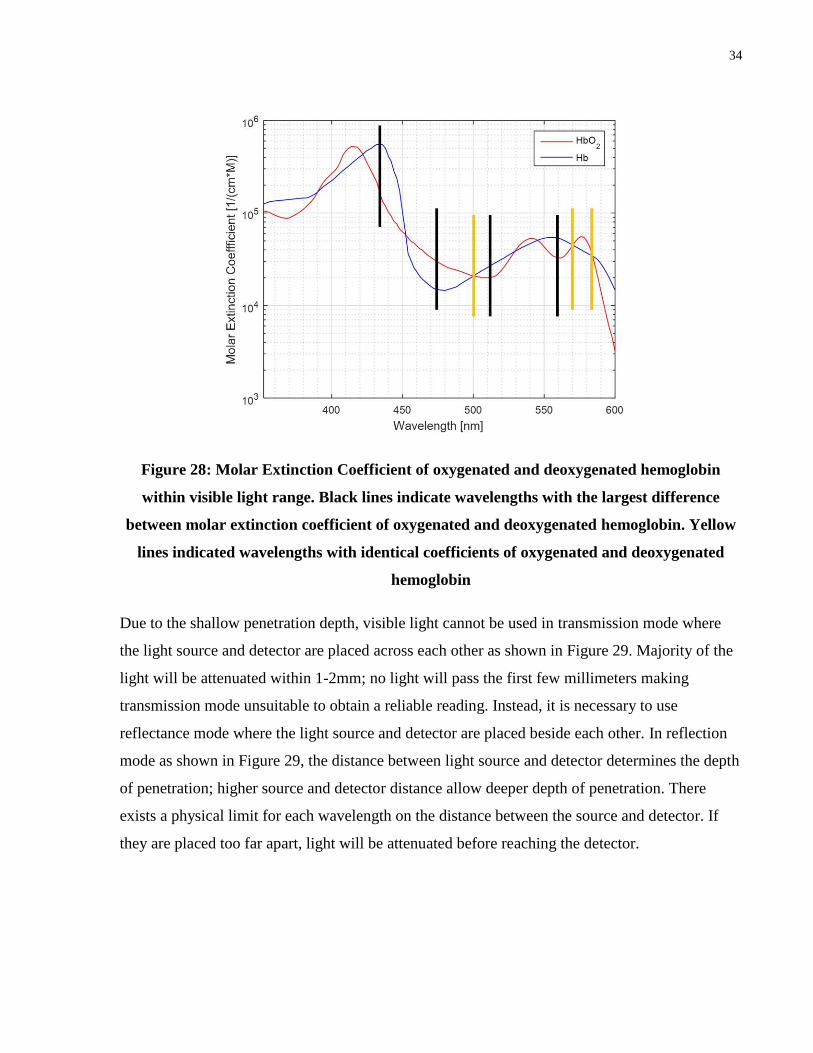
34
Figure 28: Molar Extinction Coefficient of oxygenated and deoxygenated hemoglobin
within visible light range. Black lines indicate wavelengths with the largest difference
between molar extinction coefficient of oxygenated and deoxygenated hemoglobin. Yellow
lines indicated wavelengths with identical coefficients of oxygenated and deoxygenated
hemoglobin
Due to the shallow penetration depth, visible light cannot be used in transmission mode where
the light source and detector are placed across each other as shown in Figure 29. Majority of the
light will be attenuated within 1-2mm; no light will pass the first few millimeters making
transmission mode unsuitable to obtain a reliable reading. Instead, it is necessary to use
reflectance mode where the light source and detector are placed beside each other. In reflection
mode as shown in Figure 29, the distance between light source and detector determines the depth
of penetration; higher source and detector distance allow deeper depth of penetration. There
exists a physical limit for each wavelength on the distance between the source and detector. If
they are placed too far apart, light will be attenuated before reaching the detector.
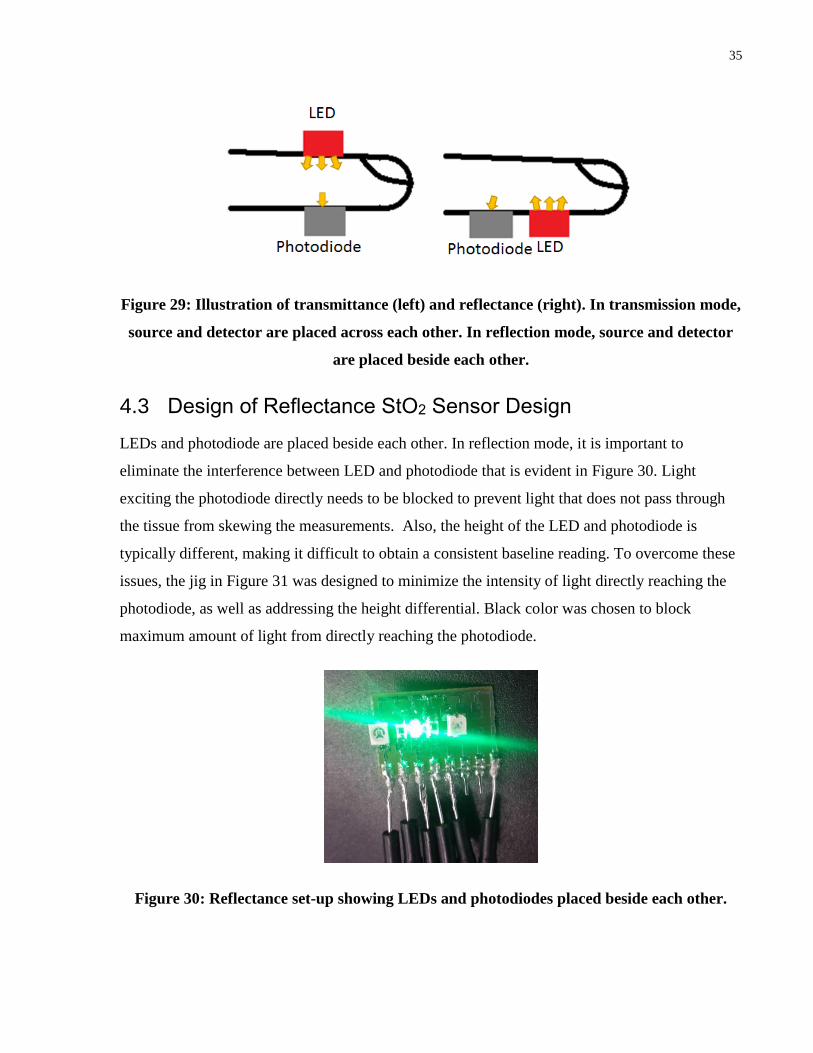
35
Figure 29: Illustration of transmittance (left) and reflectance (right). In transmission mode,
source and detector are placed across each other. In reflection mode, source and detector
are placed beside each other.
4.3 Design of Reflectance StO2 Sensor Design
LEDs and photodiode are placed beside each other. In reflection mode, it is important to
eliminate the interference between LED and photodiode that is evident in Figure 30. Light
exciting the photodiode directly needs to be blocked to prevent light that does not pass through
the tissue from skewing the measurements. Also, the height of the LED and photodiode is
typically different, making it difficult to obtain a consistent baseline reading. To overcome these
issues, the jig in Figure 31 was designed to minimize the intensity of light directly reaching the
photodiode, as well as addressing the height differential. Black color was chosen to block
maximum amount of light from directly reaching the photodiode.
Figure 30: Reflectance set-up showing LEDs and photodiodes placed beside each other.

36
Figure 31: Reflectance set-up showing LED and photodiode with the jig to reduce
unnecessary photodiode and LED interference.
Finger was placed on the set-up seen in Figure 30 and Figure 31 to obtain a baseline reading for
100 seconds. Consistent contact with the sensor was ensured using custom forceps to maintain
the pressure. By comparing the two trends in Figure 32, it is clear the jig eliminates the jump in
readings that are present at 15 seconds and 82 seconds in the blue trend. When the jig is not used,
the sensor is much more sensitive to motion. Use of the jig provides a much more consistent
baseline.
Figure 32: Comparison of baseline reading with and without jig

37
In the current design, center to center distance between LED and photodiode is approximately
2.7mm; this distance was constrained by the size of the LED and photodiode. In order to vary the
distance, different size LEDs and photodiode are required and custom mounting board needs to
be fabricated. The distance between LED and photodiode specifies the depth of penetration as.
According to a study performed by Liu et al., spacing of 0.7-2.7mm between light source and
detector did not have an impact on StO2 readings [44].
For ease of integration into tool, same photodiode (SFH 2701, OSRAM) was used with all the
LEDs. Photodiode was selected to provide largest possible sensitivity for the selected LEDs.
Photodiode used in this application has a working range from 400nm-1100nm; 435nm, 470nm,
500nm, 510nm, 560nm, 570nm, 586nm, 660nm and 940nm are within this range. Surface mount
LEDs were preferred due to their compact size. It was attempted to use similar sized LEDs in
order to maintain the set 2.7mm distance between the LED and photodiode. The circuit design
and algorithm used were identical to transmission mode.
4.4 In vivo Experiment 6 – Reflection Mode Test protocol
StO2 sensor was tested in reflection mode in vivo. A standard blood pressure cuff was placed on
the upper arm, and the index finger was gently grasped with custom forceps to monitor changes
in StO2. A baseline reading was collected for 30 seconds. Pressure was increased from 0 to
260mmHg and maintained for 90 seconds. Pressure was released and changes were monitored
for 60 seconds.
4.5 Theoretically Expected Results
Theoretically expected increase or decrease in signal intensity with changes in StO2 needs to be
determined to compare experimental results with theoretically expected results. For a
monochromatic light source, which produces light of a single wavelength, this relationship is
determined by comparing the molar extinction coefficient of HbO2 and Hb. According to the
Beer-Lambert Law, if the molar extinction coefficient of HbO2 is high, relative to Hb, output
light intensity will decrease with decreasing oxygenation. Conversely, if the molar extinction
coefficient of Hb is higher than HbO2, the output light intensity will increase with decreasing
oxygenation. The molar extinction coefficient versus wavelength curve shown in Figure 6 can
be subdivided into ten segments using the crossover points to divide the regions (352-390nm,

38
390-422nm, 422-455nm, 455-500nm, 500-528nm, 528-545nm, 545-570nm, 570-586nm, 586-
805nm and 805-1000nm). At the crossover points oxygenated and deoxygenated hemoglobin
have identical extinction coefficients. Within 352-390nm, 422-455nm, 500-528nm, 545-570nm,
and 586-805nm molar extinction coefficient of deoxygenated hemoglobin is higher than the
molar extinction coefficient of oxygenated hemoglobin. With decrease in oxygenation, the
output intensity will also decrease. Within 390-422nm, 455-500nm, 528-545nm, 570-586nm and
805-1000nm molar extinction coefficient of deoxygenated hemoglobin is lower than the molar
extinction coefficient of oxygenated hemoglobin. With decrease in oxygenation, the output
intensity will increase.
In practice, imperfect light sources which are not monochromatic, such as LEDs, are often
implemented to measure tissue oxygenation. These sources produce light with wavelengths
distributed over a small region of the spectrum. For example, consider the relative intensity
versus wavelength distribution plot depicted in Figure 33. This data was approximated using the
datasheet for a 500 nm LED (SM1204PGC, BIVAR). The 500 nm LED has its peak intensity at
500 nm; however, it emits over a range of approximately 450-550nm.
Figure 33: Relative intensity versus wavelength for peak wavelength of 500nm
approximated
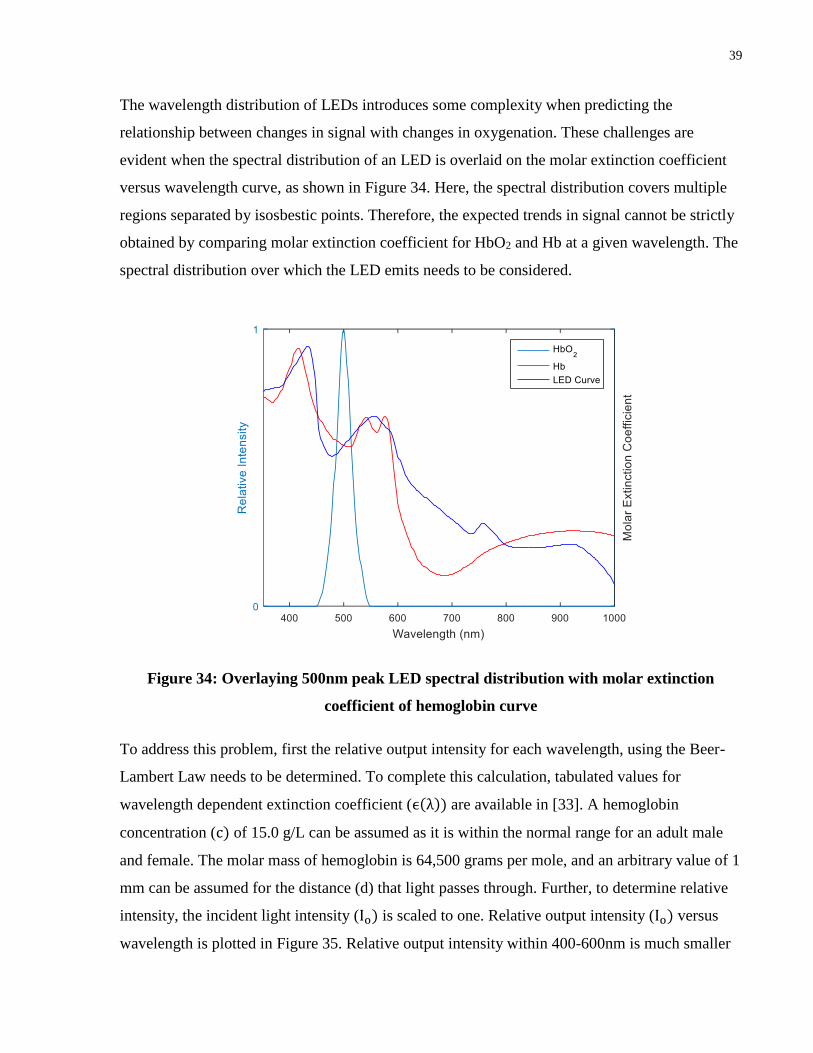
39
The wavelength distribution of LEDs introduces some complexity when predicting the
relationship between changes in signal with changes in oxygenation. These challenges are
evident when the spectral distribution of an LED is overlaid on the molar extinction coefficient
versus wavelength curve, as shown in Figure 34. Here, the spectral distribution covers multiple
regions separated by isosbestic points. Therefore, the expected trends in signal cannot be strictly
obtained by comparing molar extinction coefficient for HbO2 and Hb at a given wavelength. The
spectral distribution over which the LED emits needs to be considered.
Figure 34: Overlaying 500nm peak LED spectral distribution with molar extinction
coefficient of hemoglobin curve
To address this problem, first the relative output intensity for each wavelength, using the Beer-
Lambert Law needs to be determined. To complete this calculation, tabulated values for
wavelength dependent extinction coefficient (ϵ(λ)) are available in [33]. A hemoglobin
concentration (c) of 15.0 g/L can be assumed as it is within the normal range for an adult male
and female. The molar mass of hemoglobin is 64,500 grams per mole, and an arbitrary value of 1
mm can be assumed for the distance (d) that light passes through. Further, to determine relative
intensity, the incident light intensity (Io) is scaled to one. Relative output intensity (Io) versus
wavelength is plotted in Figure 35. Relative output intensity within 400-600nm is much smaller

40
compared to relative output intensity between 600-1000nm as a result of the much higher
extinction coefficient between 400-600nm.
Figure 35: Relative output intensity versus wavelength
The LED has a different intensity output for each wavelength (Figure 33), and also because the
photodiode has a different spectral sensitivity for each wavelength (Figure 36). The wavelength
dependent relative intensity and spectral sensitivity are used to adjust the output intensity by
multiplying output intensity with relative intensity and spectral sensitivity for a given
wavelength. The results for the adjusted output of a 500 nm LED is plotted in Figure 37.

41
Figure 36: Photodiode spectral sensitivity as function of wavelength
Figure 37: Relative output intensity versus wavelength adjusted for LED and photodiode
intensity

42
From Figure 37, the relative output contribution for each wavelength is known. The area under
the relative intensity versus wavelength curve is used to determine the expected results. If the
area under the HbO2 curve (100% oxygenation) is greater than the area under the Hb curve (0%
oxygenation), signal intensity is expected to decrease with a relative decrease in oxygenation for
the specific LED. If the area under the HbO2 curve is less than the area under the Hb curve,
signal intensity will increase with a decrease in oxygenation for the specific LED. Areas under
the curve for HbO2, Hb, and the expected trends with a decrease in oxygen are depicted in Table
1 for each LED.
Table 1: Area under relative output intensity versus wavelength curve for HbO2, Hb and
expected changes in signal with decrease in oxygenation
Peak
Wavelength
(nm)
Area under HbO2
curve
Area Under
Hb Curve
Increase/Decrease in
Signal Intensity with
Decrease in
Oxygenation
435 2.21E-05 5.90E-04 Increase
470 4.30E-06 8.74E-04 Increase
500 9.79E-05 7.52E-04 Increase
510 1.06E-04 3.59E-04 Increase
560 4.18E-04 2.43E-07 Decrease
570 1.65E-02 4.10E-05 Decrease
586 6.03E-02 1.14E-04 Decrease
660 7.92E+00 1.70E+00 Decrease
950 9.33E+00 1.24E+01 Increase

43
4.6 In vivo Experiment 6 – Reflection Mode Results
A 30 seconds baseline reading was collected for each LED. Average signal intensity was
calculated for 25 seconds; this value was used to normalize the data such that baseline reading
was approximately 1. According Figure 38, Figure 39, Figure 40, Figure 43 and Figure 45 there
is an upward trend in the signal after the pressure in the cuff is increased to 260mmHg; LEDs
with peak wavelength of 470nm, 500nm, 510nm, 586nm and 940nm saw an increase in signal
with decrease in oxygenation. The increase was followed by a decrease when the pressure was
released. From Figure 44, there is a downward trend in signal after the pressure in the cuff is
increased to 260mmg; LED with peak wavelength of 660nm saw a decrease in signal with
decrease in oxygenation. The decrease was followed by an increase when the pressure was
released. Figure 41 and Figure 42 drift upwards for the duration of the experiment; hence the
results for LEDs with peak wavelength of 560nm and 570nm are inconclusive.
Figure 38: Monitoring response of LED with peak intensity at 470nm. Pressure in the cuff
is increased at 30 seconds and released at 120 seconds.
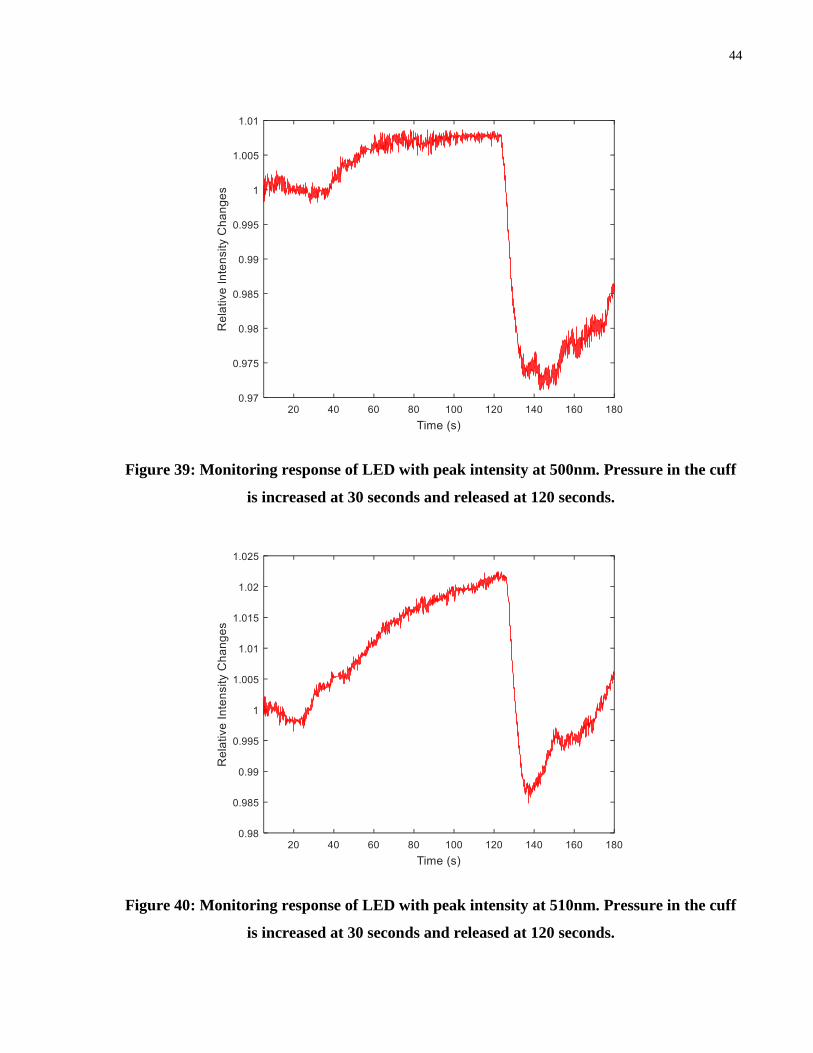
44
Figure 39: Monitoring response of LED with peak intensity at 500nm. Pressure in the cuff
is increased at 30 seconds and released at 120 seconds.
Figure 40: Monitoring response of LED with peak intensity at 510nm. Pressure in the cuff
is increased at 30 seconds and released at 120 seconds.

45
Figure 41: Monitoring response of LED with peak intensity at 560nm. Pressure in the cuff
is increased at 30 seconds and released at 120 seconds.
Figure 42: Monitoring response of LED with peak intensity at 570nm. Pressure in the cuff
is increased at 30 seconds and released at 120 seconds.

46
Figure 43: Monitoring response of LED with peak intensity at 586nm. Pressure in the cuff
is increased at 30 seconds and released at 120 seconds.
Figure 44: Monitoring response of LED with peak intensity at 660nm. Pressure in the cuff
is increased at 30 seconds and released at 120 seconds.

47
Figure 45: Monitoring response of LED with peak intensity at 940nm. Pressure in the cuff
is increased at 30 seconds and released at 120 seconds.
Table 2 summarizes the experimental results and compares them with theoretical results.
According to Table 2, LEDs with peak wavelengths of 470nm, 500nm, 510nm, 660nm and
940nm behave as predicted. LEDs with peak wavelength of 560nm, 570nm and 586nm do not
behave as predicted. LED with peak wavelength of 435nm was not tested due to the large
spectral distribution ranging from 350-575nm.
Table 2: Comparing theoretical and experimental results for reflection mode experiment
Peak Wavelength
(nm) Theoretical Results Experimental Results
Agreement
(Yes/No)
435 Increase Not Tested N/A
470 Increase Increase Yes
500 Increase Increase Yes
510 Increase Increase Yes

48
560 Decrease Inconclusive N/A
570 Decrease Inconclusive N/A
586 Decrease Increase No
660 Decrease Decrease Yes
950 Increase Increase Yes
4.7 In vivo Experiment 6 – Reflection Mode Discussion
There are several reasons that could explain the unexpected results. LEDs distributions are
typically given at a specific temperature and current because the wavelength an LED emits varies
slightly at different currents and temperatures. Junction temperature cannot be easily measured
making it difficult to control. There are likely to be fluctuations in the current supplied to LED
due to noise in the electrical system. LEDs also have variation in peak intensity from the
manufacturing processes; a spectrophotometer would be required to characterize the output
intensity of a specific LED. For the LEDs in this project, values given in the datasheet were
assumed to be correct.
The molar extinction coefficient versus wavelength curve for HbO2 and Hb is an average taken
from multiple studies. As seen in Figure 46, there are large variations between the two datasets
from difference sources especially between 500-540nm. In addition, the curve is likely to differ
slightly for each individual. Within 525-586nm, the difference between extinction coefficient of
HbO2 and Hb is small. LEDs may not be suitable light source and photodiodes may not be
suitable detector to measuring changes within this region. Monochromatic light sources such as
lasers and better detectors such as spectrophotometers might be required to adequately measure
changes in this region.
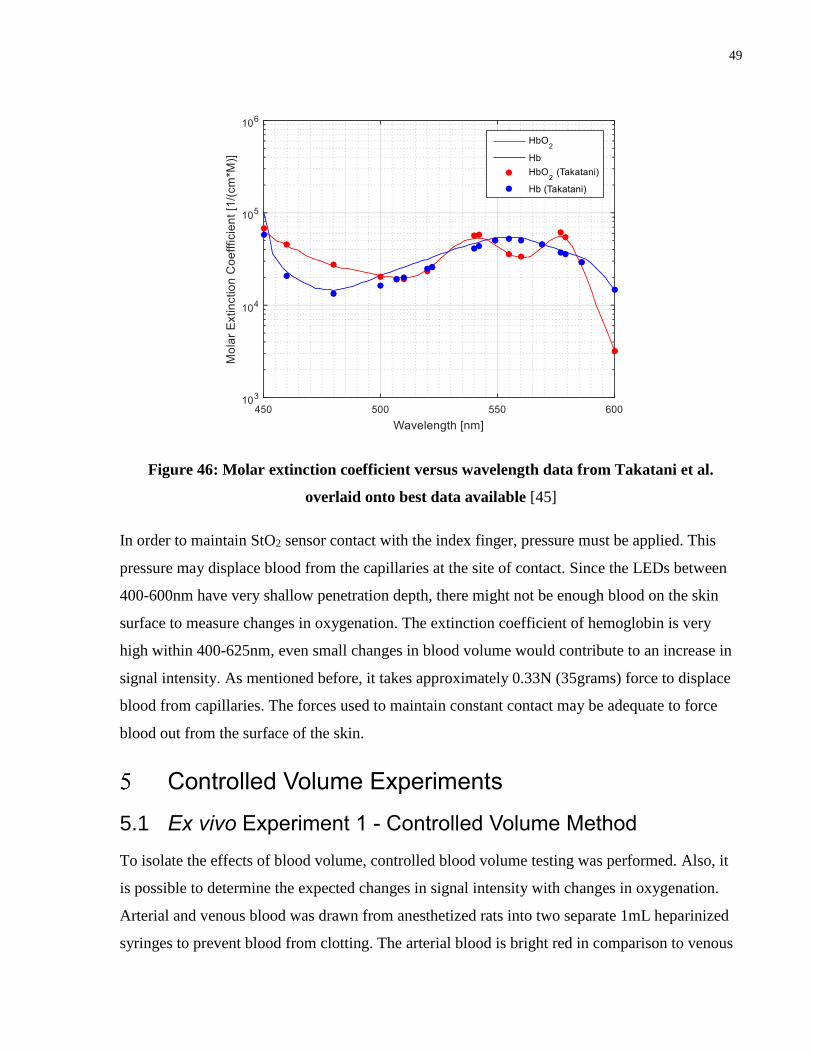
49
Figure 46: Molar extinction coefficient versus wavelength data from Takatani et al.
overlaid onto best data available [45]
In order to maintain StO2 sensor contact with the index finger, pressure must be applied. This
pressure may displace blood from the capillaries at the site of contact. Since the LEDs between
400-600nm have very shallow penetration depth, there might not be enough blood on the skin
surface to measure changes in oxygenation. The extinction coefficient of hemoglobin is very
high within 400-625nm, even small changes in blood volume would contribute to an increase in
signal intensity. As mentioned before, it takes approximately 0.33N (35grams) force to displace
blood from capillaries. The forces used to maintain constant contact may be adequate to force
blood out from the surface of the skin.
Controlled Volume Experiments
5.1 Ex vivo Experiment 1 - Controlled Volume Method
To isolate the effects of blood volume, controlled blood volume testing was performed. Also, it
is possible to determine the expected changes in signal intensity with changes in oxygenation.
Arterial and venous blood was drawn from anesthetized rats into two separate 1mL heparinized
syringes to prevent blood from clotting. The arterial blood is bright red in comparison to venous

50
blood which is much darker as seen in Figure 47. Typical oxygenation of arterial blood ranged
from 75-95%, while the typical oxygenation of venous blood ranged from 5-15%; oxygen
saturation values of arterial and venous blood were measured using a blood gas analyzer (ABL
800 Flex, Radiometer). Oxygen saturation readings of arterial and venous blood were taken
before and after experiments to ensure the oxygen saturation did not vary more than 5% over the
course of the experiment. Approximate difference between arterial and venous oxygen saturation
is 70-85%.
Figure 47: Arterial blood (75-95% oxygenation) and venous blood (5-15% oxygenation) in
a 1 mL syringe
Syringe holder in Figure 48 was designed to consistently position the syringe, as well as block
ambient light to ensure reliable measurements. The syringe with arterial blood was placed in the
syringe holder and a reading was taken for 10 seconds. After 10 seconds, the syringe with arterial
blood was removed. The syringe with venous blood was placed in the syringe holder and a
reading was taken for 10 seconds The average and standard deviation for each trial were
calculated based on this 10 seconds reading. Seven trials were completed for each LED. Syringes
were positioned to ensure the markings on each syringe did not affect the measurements. Trials
1-3 have higher standard deviation compared to trials 4-7 due to noise in the power supply. This
was rectified using a DC power supply for the remainder of trials. It was not feasible to take
multiple readings with each LED due to time constraints: blood would clot or change
oxygenation due to long term air exposure.

51
Figure 48: Syringe holder set-up
5.2 Ex vivo Experiment 1 – Controlled Volume Results
For each trial, the intensities of arterial and venous blood were normalized by the intensity of
arterial blood (i.e. arterial intensity was set to 1 for each trial) for easier relative comparison
between LEDs as each LED has a different output intensity. Table 3 summarizes the
experimental results and compares theoretical versus experimental results.
470nm and 940nm: As seen in Figure 49 and Figure 56 for wavelengths 470nm and 940nm
respectively, arterial blood has lower mean photodiode response compared to venous blood for
each trial. This result is expected based on theoretical predictions.
500nm and 510nm: As seen in Figure 51 and Figure 52 for wavelengths 500nm and 510nm
respectively, arterial blood has lower mean photodiode response compared to venous blood for
trials 1,2,4,5, and 6. In trials 3 and 7, arterial blood has higher mean photodiode response
compared to venous blood for each trial. Based on theoretical predictions, arterial blood is
expected to have lower mean photodiode response compared to venous blood.
560nm and 570nm: The results are shown in Figure 53 and Figure 54 for wavelengths 560nm
and 570nm, respectively. Intensities of these lights were not enough for reliable measurements.
586nm and 660nm: As seen in Figure 55 and Figure 56 for wavelengths 586nm and 660nm
respectively, arterial blood has higher mean photodiode response compared to venous blood for
each trial. This result is expected based on theoretical predictions.

52
Figure 49: Comparing photodiode response from arterial blood and venous blood with
470nm peak LED
Figure 50: Comparing photodiode response from arterial blood and venous blood with
500nm peak LED
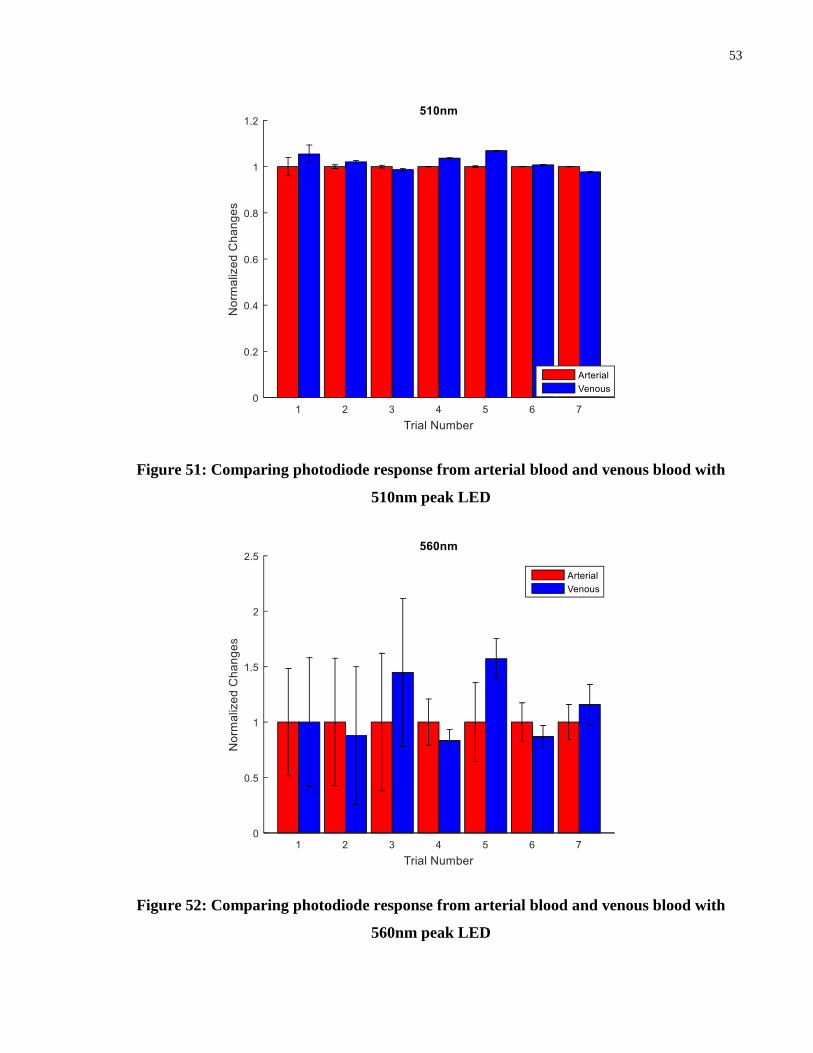
53
Figure 51: Comparing photodiode response from arterial blood and venous blood with
510nm peak LED
Figure 52: Comparing photodiode response from arterial blood and venous blood with
560nm peak LED

54
Figure 53: Comparing photodiode response from arterial blood and venous blood with
570nm peak LED
Figure 54: Comparing photodiode response from arterial blood and venous blood with
586nm peak LED
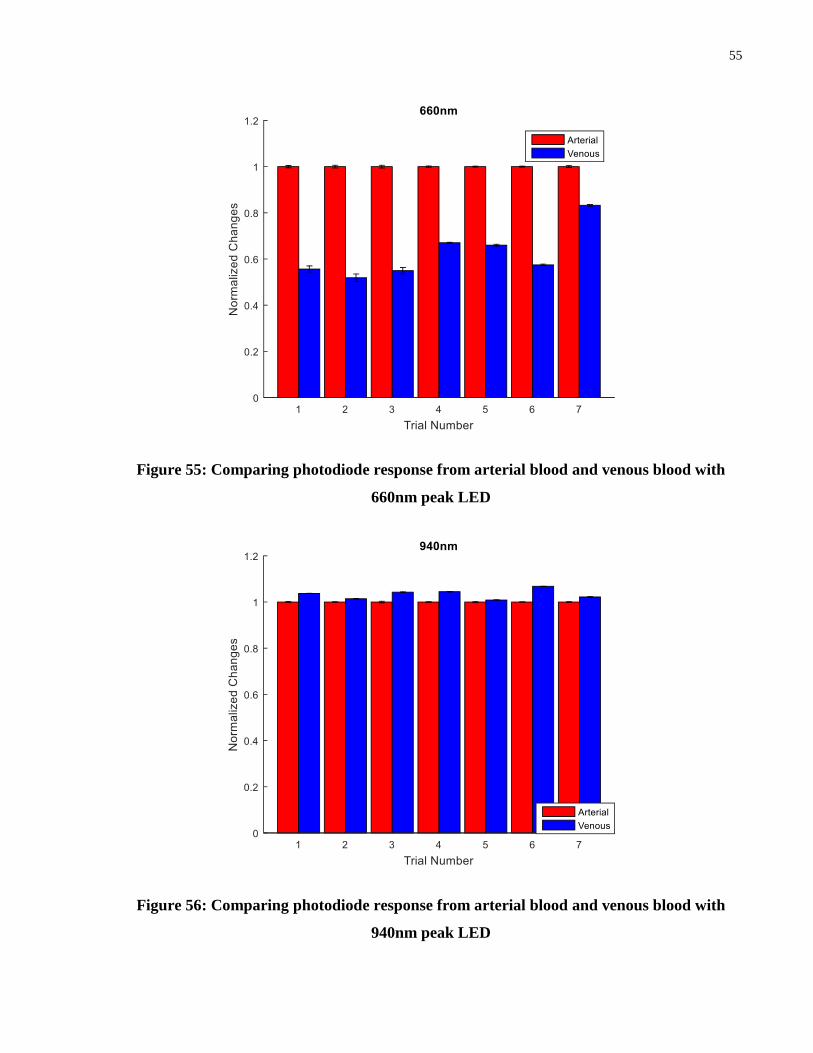
55
Figure 55: Comparing photodiode response from arterial blood and venous blood with
660nm peak LED
Figure 56: Comparing photodiode response from arterial blood and venous blood with
940nm peak LED

56
Table 3: Comparing theoretical versus experimental results for controlled volume
experiment
Peak Wavelength
(nm) Theoretical Results Experimental Results
Agreement
(Yes/No)
435 Increase Not Tested N/A
470 Increase Increase Yes
500 Increase
Increase (5/7 trials)
Decrease (2/7 trials)
Yes
510 Increase
Increase (5/7 trials)
Decrease (5/7 trials)
Yes
560 Decrease Inconclusive N/A
570 Decrease Inconclusive N/A
586 Decrease Decrease Yes
660 Decrease Decrease Yes
940 Increase Increase Yes
The goal of the controlled volume experiment was to gain an indication of the expected relative
changes in the signal, and compare these values to the signal intensity change from the in vivo
reflectance mode experiment. For in vivo reflectance testing, the signal intensity rises with
decrease in StO2 for 470nm, 500nm, 510nm, 586nm and 940nm; percent difference was
calculated between maximum normalized intensity and baseline normalized intensity. The signal
intensity drops with decrease in StO2 for 660nm; percent difference was calculated between
minimum normalized intensity and baseline normalized intensity. In vivo reflectance mode
experiment was repeated two times with similar trends in both trials; Table 4 summarizes the

57
average difference between baseline intensity and maximum/minimum intensity along with the
standard deviation.
For controlled volume experiment, the signal intensity rises with decrease in StO2 for 470nm,
500nm, 510nm and 940nm. For 586nm and 660nm, the signal intensity drops with decrease in
StO2. Percent difference was calculated between average venous blood intensity and arterial
blood intensity. Trials 3 and 7 were omitted for average calculation for 500nm and 510nm as
they did not agree with the predicted results. Negative sign indicates drop in signal intensity with
reduction in StO2. The results are summarized in Table 4.
Table 4: Comparing percentage differences in between reflection mode testing and
controlled volume testing
Peak Wavelength (nm) Reflection Mode
Difference (%) (n=2)
Controlled Volume
Difference (%) (n=7)
470 5.1 ± 0.1 10.5 ± 3.4
500 1.3 ± 0.5 1.6 ± 1.2
510 2.2 ± 0.1 3.8 ± 2.2
560 - -
570 - -
586 8.8 ± 3.4 -5.5 ± 1.7
660 -3.6 ± 0.7 -37.6 ± 10.8
940 0.9 ± 0.2 3.4 ± 2.1
5.3 Ex vivo Experiment 1 – Discussion
When the percentage difference in signal between arterial and venous blood is compared to the
difference between baseline reading and maximum change for reflection mode testing, 470nm,
500nm, 510nm, 660nm and 940nm have higher percentage difference for controlled volume
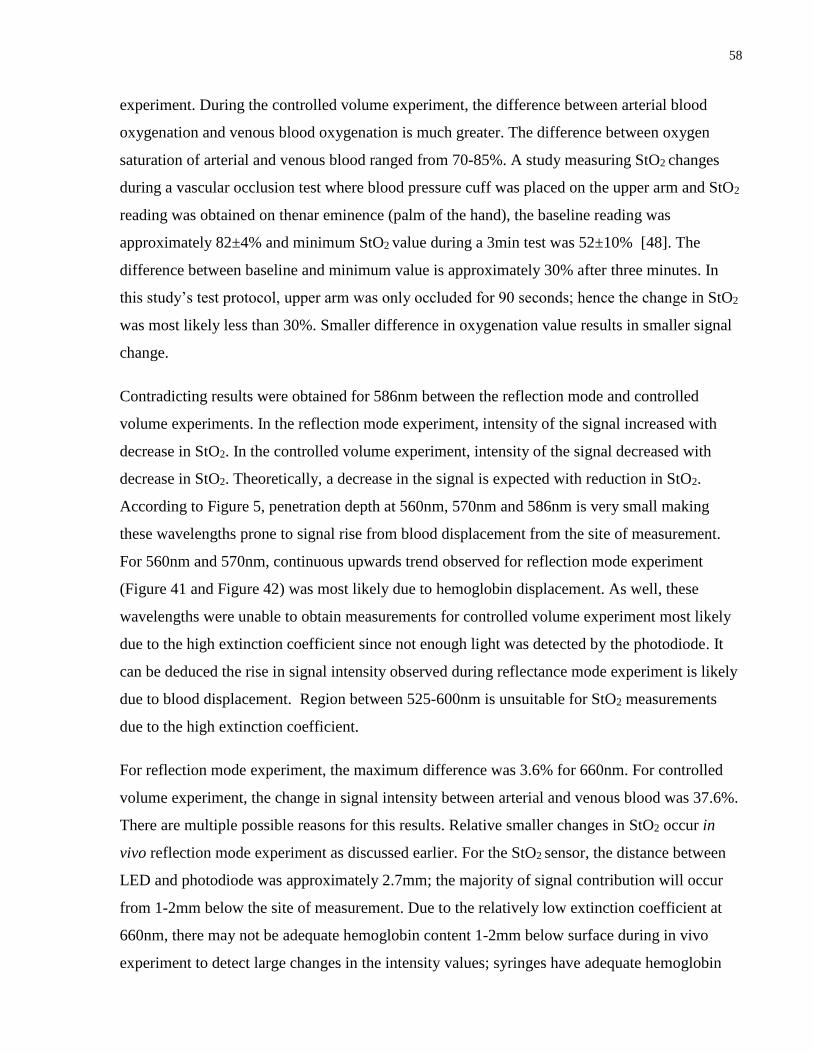
58
experiment. During the controlled volume experiment, the difference between arterial blood
oxygenation and venous blood oxygenation is much greater. The difference between oxygen
saturation of arterial and venous blood ranged from 70-85%. A study measuring StO2 changes
during a vascular occlusion test where blood pressure cuff was placed on the upper arm and StO2
reading was obtained on thenar eminence (palm of the hand), the baseline reading was
approximately 82±4% and minimum StO2 value during a 3min test was 52±10% [48]. The
difference between baseline and minimum value is approximately 30% after three minutes. In
this study’s test protocol, upper arm was only occluded for 90 seconds; hence the change in StO2
was most likely less than 30%. Smaller difference in oxygenation value results in smaller signal
change.
Contradicting results were obtained for 586nm between the reflection mode and controlled
volume experiments. In the reflection mode experiment, intensity of the signal increased with
decrease in StO2. In the controlled volume experiment, intensity of the signal decreased with
decrease in StO2. Theoretically, a decrease in the signal is expected with reduction in StO2.
According to Figure 5, penetration depth at 560nm, 570nm and 586nm is very small making
these wavelengths prone to signal rise from blood displacement from the site of measurement.
For 560nm and 570nm, continuous upwards trend observed for reflection mode experiment
(Figure 41 and Figure 42) was most likely due to hemoglobin displacement. As well, these
wavelengths were unable to obtain measurements for controlled volume experiment most likely
due to the high extinction coefficient since not enough light was detected by the photodiode. It
can be deduced the rise in signal intensity observed during reflectance mode experiment is likely
due to blood displacement. Region between 525-600nm is unsuitable for StO2 measurements
due to the high extinction coefficient.
For reflection mode experiment, the maximum difference was 3.6% for 660nm. For controlled
volume experiment, the change in signal intensity between arterial and venous blood was 37.6%.
There are multiple possible reasons for this results. Relative smaller changes in StO2 occur in
vivo reflection mode experiment as discussed earlier. For the StO2 sensor, the distance between
LED and photodiode was approximately 2.7mm; the majority of signal contribution will occur
from 1-2mm below the site of measurement. Due to the relatively low extinction coefficient at
660nm, there may not be adequate hemoglobin content 1-2mm below surface during in vivo
experiment to detect large changes in the intensity values; syringes have adequate hemoglobin
59
present at all times for adequate absorption. This also explains the lowest relative percent
difference of 0.9% observed for reflection mode experiment using 940nm LED.
Conclusion
A StO2 sensor was designed in transmission mode using wavelength of 660nm and 940nm to
monitor changes in oxygenation using LEDs and a photodiode. The sensing components were
integrated with FPCB and placed at the distal end of the laparoscopic grasper into the cutout.
Proof of concept experiment conducted on the finger successfully monitored changes in
oxygenation. When the small intestine and bowel were grasped to measure changes in tissue
oxygenation, it was not possible to detect changes. 660nm and 940nm are unable to determine
changes in StO2 using transmission mode in thin tissue due to its low extinction coefficient.
Additional wavelengths within 400-600nm were tested as they are better suited for thin tissues.
Specific wavelengths were selected where the difference between the molar extinction
coefficient of HbO2 and Hb is the largest. Reflection mode experiment, ex vivo experiment and
theoretically expected results were compared. LEDs at 500nm and 510nm produced expected
results in five of seven trials during ex vivo experiments. Due to its inconsistency, wavelength at
500nm and 510nm cannot be used for StO2 measurements. LEDs at 560nm, 570nm and 586nm
cannot be used for StO2 monitoring due to the high extinction coefficient. LEDs at 660nm and
940nm have low extinction coefficient making it challenging to detect StO2 changes in thin
tissue.
The StO2 sensor successfully detected changes in oxygenation when tested on the finger and ex
vivo experiment on arterial and venous blood. When oxygenation was measured on the small
intestine by occluding the mesenteric arteries, the StO2 sensor successfully measured changes;
however, it failed to measure changes when small intestine and liver were grasped and their
thickness was reduced to a few millimeters. There are various limitations to measuring StO2 in
grasped tissue. When tissues are grasped, blood is forced away from the site of measurement;
there is usually not enough hemoglobin for reliable measurement. Furthermore, StO2
measurements are very sensitive to motion, especially when using reflection mode. Motion
artifacts could suppress signal changes making it challenging to measure changes when grasping
a tissue. Motion artifacts could be caused by tremors from surgeons when using laparoscopic
instruments. Moreover, to reliably monitor StO2 changes, tissue needs to be grasped with

60
consistent pressure as changes in pressure would impact the tissue thickness which would affect
the signal intensity. These limitations add significant complexities in measuring StO2 in grasped
tissue using surgical instruments. It may not be feasible to develop StO2 to monitor oxygenation
changes in grasped tissue. Other techniques to assess tissue health should be explored.
Future Direction
7.1 Determining Resolution
Intensity measurements were obtained for arterial and venous blood during the ex vivo
experiments. As measured by the blood gas analyzers, the typical oxygen saturation of arterial
blood ranged from 75-95% and the oxygen saturation of venous blood ranged from 5-15%.
LEDs at 470nm, 660nm and 940nm were consistently able to distinguish between the arterial and
venous blood during ex vivo controlled volume experiment which represent the extremes in
oxygen saturation values; in practice the intermediate oxygenation saturation values are
clinically important. It would be important to correlate oxygen saturation with intensity values.
This can be achieved by building a system that circulates blood without forming blood clots. The
system would be connected to oxygen and nitrogen gas tank with the ability to add different
mixture of gases to achieve the desired oxygenation value. Oxygen saturation can be varied at
known increments and signal intensity at different wavelengths can be measured. This would
make it possible to determine the resolution of the technology and identify the most suitable
wavelength.
7.2 Alternatives to Measuring Hemoglobin with Graspers
StO2 sensing while grasping tissue is challenging especially due to small tissue volumes and low
hemoglobin content. Other ways to assess tissue health need to explored. Research groups have
looked at measuring nicotinamide adenine dinucleotide (NADH) in tissue after cutting off blood
supply. During cellular respiration, NAD+ is reduced to NADH to serve as an electron
transporter. Without proper oxygenated blood flow, NADH accumulates in tissues and results in
the increase of auto-fluorescence. NADH has been shown to change during ischemia because it
is directly related to cell metabolism. UV light at 335nm is used to excite the molecules.
Molecules that absorb the light will release this energy in the form of visible light at 470nm
when the excitation source is taken away [49]. This could potentially be integrated with normal
61
laparoscopic tools using LEDs as light source and photodiodes as detectors; significant work
would need to be done to implement the circuit. It can also be integrated with a laparoscopic
camera system.
Another important parameter determining tissue health is blood flow. Blood flow in vessels can
be monitored using a technique called laser speckle contrast imaging. When coherent laser light
illuminates a surface, light produces a random interference effect from reflected and scattered
light called speckle [50]. Movement of scattering particles causes changes to the random
interference pattern producing temporal fluctuations appearing as intensity variations on a
photodetector. A camera was proposed as a tool to obtain an image of time-integrated speckle
pattern from which blood flow can be estimated; temporal and spatial statics of the speckle
pattern can provide information about motion of the particle [51].
Another potential solution is to monitor StO2 using a laparoscope camera. Although it does not
provide information at the site of grasping, information around the grasped site can be used to
indirectly assess tissue health where the tissue is grasped; further investigation needs to be
performed to relate changes at the grasped site to changes beside the clamped site. A major
advantage of this technique is that no additional hardware is required. Further research needs to
be done to overcome issues associated with glare from the light source.
All these techniques use a CCD camera for image capture and processing. Success of each
technology has been shown individually; these technologies can be combined to develop a
powerful tool for assessing tissue health. Through further research, it may be possible to use a
laparoscope camera already available to monitor cell metabolism by monitoring NADH, tissue
oxygenation and blood flow together using laser speckle imaging.

62
References
[1] H. Xin, J. S. Zelek, and H. Carnahan, “Laparoscopic surgery, perceptual limitations and
force: A review.” .
[2] E. B. Vander Poorten, E. Demeester, and P. Lammertse, “Haptic feedback for medical
applications, a survey.”
[3] F. ATUG, “Robotic Assisted Laparoscopic Pyeloplasty in Children,” J. Urol., vol. 174,
no. 4, pp. 1440–1442, 2005.
[4] R. Agha and G. Muir, “Does laparoscopic surgery spell the end of the open surgeon?,” J.
R. Soc. Med., vol. 96, no. 11, pp. 544–6, Nov. 2003.
[5] W. R. Peters, “Minimally Invasive Surgery Expanded Version.” [Online]. Available:
https://www.fascrs.org/patients/disease-condition/minimally-invasive-surgery-expanded-
version. [Accessed: 12-Jun-2016].
[6] “File:Macintosh Blades.jpg - Wikipedia, the free encyclopedia.” [Online]. Available:
http://en.wikipedia.org/wiki/File:Macintosh_Blades.jpg. [Accessed: 08-Feb-2015].
[7] A. Khajuria, “Robotics and surgery: A sustainable relationship?,” World J. Clin. cases,
vol. 3, no. 3, pp. 265–9, Mar. 2015.
[8] E. Santoro and V. Pansadoro, “Robotic surgery in Italy national survey (2011).,” Updates
Surg., vol. 65, no. 1, pp. 1–9, Mar. 2013.
[9] B. T. Bethea, A. M. Okamura, M. Kitagawa, T. P. Fitton, S. M. Cattaneo, V. L. Gott, W.
A. Baumgartner, and D. D. Yuh, “Application of haptic feedback to robotic surgery.,” J.
Laparoendosc. Adv. Surg. Tech. A, vol. 14, no. 3, pp. 191–5, Jun. 2004.
[10] “Intuitive Surgical - EndoWrist Instruments,” 2015. [Online]. Available:
http://www.intuitivesurgical.com/products/instruments/. [Accessed: 12-Jun-2016].
[11] Y. Chaussy, F. Becmeur, H. Lardy, and D. Aubert, “Robot-assisted surgery: current status
evaluation in abdominal and urological pediatric surgery.,” J. Laparoendosc. Adv. Surg.
Tech. A, vol. 23, no. 6, pp. 530–8, Jun. 2013.
[12] A. Guitarte, “No Title,” 2009. [Online]. Available:
https://www.flickr.com/photos/somosmedicina/3428885864/in/photostream/. [Accessed:
19-Jul-2016].
[13] C. R. Wagner, N. Stylopoulos, and R. D. Howe, “The role of force feedback in surgery:
analysis of blunt dissection,” in Proceedings 10th Symposium on Haptic Interfaces for
Virtual Environment and Teleoperator Systems. HAPTICS 2002, 2002, pp. 68–74.
[14] L. N. Verner and A. M. Okamura, “Force & torque feedback vs force only feedback,”
in World Haptics 2009 - Third Joint EuroHaptics conference and Symposium on Haptic

63
Interfaces for Virtual Environment and Teleoperator Systems, 2009, pp. 406–410.
[15] P. Valdastri, K. Harada, A. Menciassi, L. Beccai, C. Stefanini, M. Fujie, and P. Dario,
“Integration of a miniaturised triaxial force sensor in a minimally invasive surgical tool.,”
IEEE Trans. Biomed. Eng., vol. 53, no. 11, pp. 2397–400, Nov. 2006.
[16] G. Tholey and J. P. Desai, “A Modular, Automated Laparoscopic Grasper with Three-
Dimensional Force Measurement Capability,” in Proceedings 2007 IEEE International
Conference on Robotics and Automation, 2007, pp. 250–255.
[17] U. Seibold, B. Kubler, and G. Hirzinger, “Prototype of Instrument for Minimally Invasive
Surgery with 6-Axis Force Sensing Capability,” in Proceedings of the 2005 IEEE
International Conference on Robotics and Automation, 2005, pp. 496–501.
[18] C. E. Reiley, T. Akinbiyi, D. Burschka, D. C. Chang, A. M. Okamura, and D. D. Yuh,
“Effects of visual force feedback on robot-assisted surgical task performance.,” J. Thorac.
Cardiovasc. Surg., vol. 135, no. 1, pp. 196–202, Jan. 2008.
[19] P. Puangmali, K. Althoefer, L. D. Seneviratne, D. Murphy, and P. Dasgupta, “State-of-
the-Art in Force and Tactile Sensing for Minimally Invasive Surgery,” IEEE Sens. J., vol.
8, no. 4, pp. 371–381, Apr. 2008.
[20] M. Mahvash, J. Gwilliam, R. Agarwal, B. Vagvolgyi, L.-M. Su, D. D. Yuh, and A. M.
Okamura, “Force-Feedback Surgical Teleoperator: Controller Design and Palpation
Experiments,” in 2008 Symposium on Haptic Interfaces for Virtual Environment and
Teleoperator Systems, 2008, pp. 465–471.
[21] T. Hansen, C. T. Henningsen, J. J. M. Nielsen, R. Pedersen, J. Schwensen, S. Sivabalan, J.
A. Larsen, and J. Leth, “Implementing force-feedback in a telesurgery environment, using
parameter estimation,” in 2012 IEEE International Conference on Control Applications,
2012, pp. 859–864.
[22] E. A. M. Heijnsdijk, J. Dankelman, and D. J. Gouma, “Effectiveness of grasping and
duration of clamping using laparoscopic graspers.,” Surg. Endosc., vol. 16, no. 9, pp.
1329–31, Sep. 2002.
[23] G. S. Fischer, T. Akinbiyi, S. Saha, J. Zand, M. Talamini, M. Marohn, and R. Taylor,
“Ischemia and Force Sensing Surgical Instruments for Augmenting Available Surgeon
Information,” in The First IEEE/RAS-EMBS International Conference on Biomedical
Robotics and Biomechatronics, 2006. BioRob 2006., pp. 1030–1035.
[24] J. Mesquida, G. Gruartmoner, C. Espinal, J. Mesquida, G. Gruartmoner, and C. Espinal,
“Skeletal Muscle Oxygen Saturation (StO2) Measured by Near-Infrared Spectroscopy in
the Critically Ill Patients,” Biomed Res. Int., vol. 2013, pp. 1–8, 2013.
[25] A. Mozzarelli, L. Ronda, S. Faggiano, S. Bettati, and S. Bruno, “Haemoglobin-based
oxygen carriers: research and reality towards an alternative to blood transfusions.,” Blood
Transfus., vol. 8 Suppl 3, no. Suppl 3, pp. s59-68, Jun. 2010.

64
[26] Y. Teng, H. Ding, L. Huang, Y. Li, Q. Shan, D. Ye, H. Ding, J. Chien, and B. Hwang,
“Non-invasive measurement and validation of tissue oxygen saturation covered with
overlying tissues,” Prog. Nat. Sci., vol. 18, no. 9, pp. 1083–1088, 2008.
[27] “Hutchinson Technology BioMeasurement Division - StO2: Tissue Oxygen Saturation.”
[Online]. Available:
http://www.htibiomeasurement.com/technology/sto2_tissue_oxygen_saturation/.
[Accessed: 16-May-2015].
[28] Moor Instruments, “Superficial Tissue Oxygenation Monitor Faq’s. Non-invasive, real
time tissue oxygenation monitoring.” [Online]. Available:
http://ca.moor.co.uk/product/moorvms-oxy-tissue-oxygenation-monitoring/202/o/6/faq-s.
[Accessed: 15-Jun-2016].
[29] A. Pellicer and M. del C. Bravo, “Near-infrared spectroscopy: A methodology-focused
review,” Semin. Fetal Neonatal Med., vol. 16, no. 1, pp. 42–49, 2011.
[30] T. W. L. Scheeren, P. Schober, and L. A. Schwarte, “Monitoring tissue oxygenation by
near infrared spectroscopy (NIRS): background and current applications.,” J. Clin. Monit.
Comput., vol. 26, no. 4, pp. 279–87, Aug. 2012.
[31] P. Beard, “Biomedical photoacoustic imaging.,” Interface Focus, vol. 1, no. 4, pp. 602–
31, Aug. 2011.
[32] K. N. Glaros, “Low-power pulse oximetry and transimpedance amplifiers,” Imperial
College London, 2011.
[33] “Tabulated Molar Extinction Coefficient for Hemoglobin in Water,” 1998. [Online].
Available: http://omlc.org/spectra/hemoglobin/summary.html. [Accessed: 21-Jun-2016].
[34] PERIMED, “Transcutaneous oximetry - TCOM - Perimed AB.” [Online]. Available:
https://www.perimed-instruments.com/transcutaneous-oxygen---tcom-tcposub2sub.
[Accessed: 17-Jun-2016].
[35] K. Rich, “Transcutaneous oxygen measurements: Implications for nursing,” J. Vasc.
Nurs., vol. 19, no. 2, pp. 55–60, 2001.
[36] B. S. P. A. and K. S. Akke Bakker, Applied Aspects of Ultrasonography in Humans.
InTech, 2012.
[37] D. A. Benaron, I. H. Parachikov, W.-F. Cheong, S. Friedland, B. E. Rubinsky, D. M.
Otten, F. W. H. Liu, C. J. Levinson, A. L. Murphy, J. W. Price, Y. Talmi, J. P. Weersing,
J. L. Duckworth, U. B. Hörchner, and E. L. Kermit, “Design of a visible-light
spectroscopy clinical tissue oximeter.,” J. Biomed. Opt., vol. 10, no. 4, p. 44005, Jan. .
[38] W. Cui, C. Kumar, and B. Chance, “<title>Experimental study of migration depth for the
photons measured at sample surface</title>,” in Optics, Electro-Optics, and Laser
Applications in Science and Engineering, 1991, pp. 180–191.

65
[39] D. A. Benaron, I. H. Parachikov, S. Friedland, R. Soetikno, J. Brock-Utne, P. J. A. van der
Starre, C. Nezhat, M. K. Terris, P. G. Maxim, J. J. L. Carson, M. K. Razavi, H. B.
Gladstone, E. F. Fincher, C. P. Hsu, F. L. Clark, W.-F. Cheong, J. L. Duckworth, and D.
K. Stevenson, “Continuous, noninvasive, and localized microvascular tissue oximetry
using visible light spectroscopy.,” Anesthesiology, vol. 100, no. 6, pp. 1469–75, Jun. 2004.
[40] “Nonin Medical Inc. - Onyx® 9550 Military Model Finger Pulse Oximeter.” [Online].
Available: http://www.nonin.com/Onyx9550. [Accessed: 20-May-2015].
[41] G. Fischer, J. Zand, M. Talamini, M. Marohn, T. Akinbiyi, K. Kanev, J. Kuo, P.
Kazanzides, and R. Taylor, “Intraoperative ischemia sensing surgical instruments,” in
Internation Conference on Complex Medical Engineering, 2005.
[42] N. J. Crane, B. McHone, J. Hawksworth, J. P. Pearl, J. Denobile, D. Tadaki, P. A. Pinto, I.
W. Levin, and E. A. Elster, “Enhanced surgical imaging: laparoscopic vessel identification
and assessment of tissue oxygenation.,” J. Am. Coll. Surg., vol. 206, no. 6, pp. 1159–66,
Jun. 2008.
[43] A. Cornejo, T. Rodriguez, M. Steigelman, S. Stephenson, D. Sahar, S. M. Cohn, J. E.
Michalek, and H. T. Wang, “The use of visible light spectroscopy to measure tissue
oxygenation in free flap reconstruction.,” J. Reconstr. Microsurg., vol. 27, no. 7, pp. 397–
402, Sep. 2011.
[44] H. Liu, M. Kohl-Bareis, and X. Huang, “Design of a tissue oxygenation monitor and
verification on human skin,” in Clinical and Biomedical Spectroscopy and Imaging II,
2011, p. 80871Y.
[45] S. Takatani and M. D. Graham, “Theoretical Analysis of Diffuse Reflectance from a Two-
Layer Tissue Model,” IEEE Trans. Biomed. Eng., vol. BME-26, no. 12, pp. 656–664, Dec.
1979.
[46] S. De, J. Rosen, A. Dagan, P. Swanson, M. Sinanan, and B. Hannaford, “Assessment of
Tissue Damage due to Mechanical Stresses,” in The First IEEE/RAS-EMBS International
Conference on Biomedical Robotics and Biomechatronics, 2006. BioRob 2006., pp. 823–
828.
[47] “Laparoscopic Graspers Must Grip without Trauma | Laparoscopic.MD.” [Online].
Available: http://www.laparoscopic.md/instruments/grasper. [Accessed: 13-Sep-2016].
[48] C. Mayeur, S. Campard, C. Richard, and J.-L. Teboul, “Comparison of four different
vascular occlusion tests for assessing reactive hyperemia using near-infrared
spectroscopy,” Crit. Care Med., vol. 39, no. 4, pp. 695–701, Apr. 2011.
[49] J. T. Fitzgerald, A. Michalopoulou, C. D. Pivetti, R. N. Raman, C. Troppmann, and S. G.
Demos, “Real-time assessment of in vivo renal ischemia using laser autofluorescence
imaging.,” J. Biomed. Opt., vol. 10, no. 4, p. 44018.
[50] J. D. Briers, “Laser Speckle Contrast Imaging for Measuring Blood Flow,” Opt. Appl.,
vol. 37, no. 1, 2007.

66
[51] D. A. Boas and A. K. Dunn, “Laser speckle contrast imaging in biomedical optics.,” J.
Biomed. Opt., vol. 15, no. 1, p. 11109, 2010.