development of a solar controller with mli control regulator is controlled by a microcontroller ......
TRANSCRIPT
Circuits and Systems, 2018, 9, 22-40 http://www.scirp.org/journal/cs
ISSN Online: 2153-1293 ISSN Print: 2153-1285
DOI: 10.4236/cs.2018.92003 Feb. 12, 2018 22 Circuits and Systems
Development of a Solar Controller with MLI Control
Mamadou Wade1, Moussa Gueye1, Ousmane Sow2, Daouda Sow1, Babou Dione3, Gregoire Sissoko3
1Laboratory of Sciences and Techniques of Water and Environment, Polytechnic School of Thiès, Thiès, Senegal 2University Institute of Technology, University of Thiès, Thiès, Sénégal 3Laboratory of Semiconductors and Solar Energy, Physics Department, Faculty of Science and Technology, University Cheikh Anta Diop, Dakar, Senegal
Abstract This work presents the development of a solar regulator which manages the charge and discharge of a (lead) battery installed in a photovoltaic system in order to extend its lifetime. The regulator is controlled by a microcontroller (PIC16F877A) and protects the battery against overcharging, deep discharge, but also against temperature drifts. The operating principle is based on the control of a DC-DC converter by a rectangular signal MLI generated by the microcontroller. In addition to the protection function of the regulator, there is included a control and monitoring panel consisting of a visualization inter-face on which the system quantities can be observed. Thus, it will be given to the user to be able to act on the system. This display interface uses as a display an LCD screen and LEDs. Simulation results are presented to illustrate the operation of the proposed solar controller.
Keywords Solar Controller, Three-State Charge Algorithm, Battery, DC/DC Converter, Microcontroller, Monitoring
1. Introduction
In stand-alone photovoltaic systems, rechargeable batteries are widely used to store excess energy and to supply low and medium power loads. However, these batteries are so fragile in the face of overcharging, deep discharge and tempera-ture and current drifts that particular attention must be paid to the management of the charge and discharge in order to increase the duration life of the installa-tion. It is therefore necessary to associate them with an appropriate load regula-
How to cite this paper: Wade, M., Gueye, M., Sow, O., Sow, D., Dione, B. and Sissoko, G. (2018) Development of a Solar Control-ler with MLI Control. Circuits and Systems, 9, 22-40. https://doi.org/10.4236/cs.2018.92003 Received: November 10, 2017 Accepted: February 9, 2018 Published: February 12, 2018 Copyright © 2018 by authors and Scientific Research Publishing Inc. This work is licensed under the Creative Commons Attribution International License (CC BY 4.0). http://creativecommons.org/licenses/by/4.0/
Open Access
M. Wade et al.
DOI: 10.4236/cs.2018.92003 23 Circuits and Systems
tor to ensure their protection. In practice, there are several methods for charging solar batteries. The most common is Constant voltage charge and Constant cur-rent load [1] [2]. Battery users have noticed that there is a big difference between the two charging methods: constant current and constant voltage, where each has its advantages and disadvantages [3]. In order to obtain better performances, it is imperative to combine these two load methods into a single algorithm called “three-state charge algorithm”. The aim of this work is to develop a PWM regu-lator for the regulation of the charge and discharge of solar batteries, using a three-state charge algorithm and adaptable to 12 V and 24 V batteries. A pro-grammed digital microchip microcontroller (PIC16F877A) is used. We also in-clude in the study a monitoring and monitoring component. To do this, we will use an LCD screen that will display useful information related to the system. Additional constraints imposed on the load controller, such as the ability to vary the parameters of the control algorithm and digitally display the useful quanti-ties of the system, favor microcontroller-based solutions. The parameters to be displayed are, among other things, the voltage across the photovoltaic panel, the current delivered by the photovoltaic panel, the voltage across the battery, the battery charging or discharging current, the current drawn by the load and the duty cycle.
2. Materials and Methods
Before charging a battery, it is necessary to specify the type, discharge mode, time required for charging, nominal voltage and extreme operating temperature. In this study, we use a sealed battery which characteristics are listed in Table 1. In this study, the battery is modeled by a voltage source in series with a resis-tance that represents its internal resistance. The photovoltaic panel is modeled by a voltage source with its internal resistance in series and all in parallel with a diode, so as to have at the output a voltage of 5 V and a current of 5 A. The load is modeled by a resistance. Table 1. Characteristics of the used battery.
Battery Model: 6-GFM-150
Nominal voltage 12 V Maximum discharge
current (25˚C) 1000 A (5 s)
Number of Cells 6 Maximum load current 60 A
Nominal Capacity 77 F (25˚C)
C20 = 150 Ah Short circuit current 3300 A
C10 = 136 Ah Charging temperature −10˚C - 60˚C
C5 = 130.5 Ah Discharge temperature −20˚C - 60˚C
C1 = 105 Ah Storage temperature −20˚C - 60˚C
Self-discharge (20˚C) 3% per month Compensation
temperature −30 Mv/˚C
Internal battery resistor fully charged (25˚C)
3.5 mΩ Load at constant voltage (25˚C)
14.5 - 14.9 V

M. Wade et al.
DOI: 10.4236/cs.2018.92003 24 Circuits and Systems
2.1. Three-Step Charging Algorithm for Lead-Acid Batteries
In practice, the most common methods for charging solar batteries are constant voltage charging and constant current charging. There is a great difference be-tween the two methods [4]. In order to achieve better performance, it is impera-tive to combine these two charging methods in a single algorithm known as a “three-step charging algorithm” which incorporates the advantages of constant current charging (equalizing and rapid charging of the battery) and the advan-tages of constant voltage charging (high performance overload control) [4] [5]. A first charge phase, with a constant current (Bulk load or normal load), is fol-lowed by two constant voltage charging phases: absorption charge or equaliza-tion and floating charge or retention charge [4].
2.1.1. Bulk Charging or Normal Charging It is a constant current charging mode that ensures a quick recovery of the bat-tery capacity but with a difficulty to fully charge the battery. During this phase, the panel provides the maximum power to the battery. When the battery voltage reaches the threshold defined by the absorption voltage Equation (1) [6], the controller automatically switches to this phase.
( )25 0.03 25R batV V T= − × − (1)
with: V25 the battery voltage at 25˚C, VR the battery voltage at temperature Tbat in ˚C.
2.1.2. Absorption or Equalization Charging This phase is switched on once the battery voltage reaches the threshold defined by the absorption voltage. During this equalization phase, the microcontroller will act, via the driver, on the MOSFET to chop the charging current and keep the battery voltage accordingly below the absorption voltage. This operation al-lows the regulator to supplement the battery charge but also to protect it against overload phenomena [4] [5] [6] [7]. The end of this phase takes place when the capacity of the battery approaches its totality and the charging current de-creases to the value Imin. This value is set at C/100, where C is the capacity of the battery [5].
2.1.3. Floating Charging or Holding Charging When the charging current reaches the low value Imin, the charging process en-ters the third and final phase of the charging algorithm which is the “float charge”. This is a maintenance step where the battery voltage is reduced to a just sufficient Vfloat level to compensate for self-discharge of the cells. The load cur-rent becomes very low and almost constant; it is the state of full load [4]. In or-der to compensate for the self-discharge phenomenon, a permanent load is ap-plied and the set point voltage is lowered to 13.6 V at 25˚C. For another value of the temperature, the float voltage is obtained from Equation (2) [6]:
( )float float_25 0.03 25batV V T= − × − (2)
with float_25 float à 25 C 13.6 VV V= = , batT : temperature of battery in ˚C.
M. Wade et al.
DOI: 10.4236/cs.2018.92003 25 Circuits and Systems
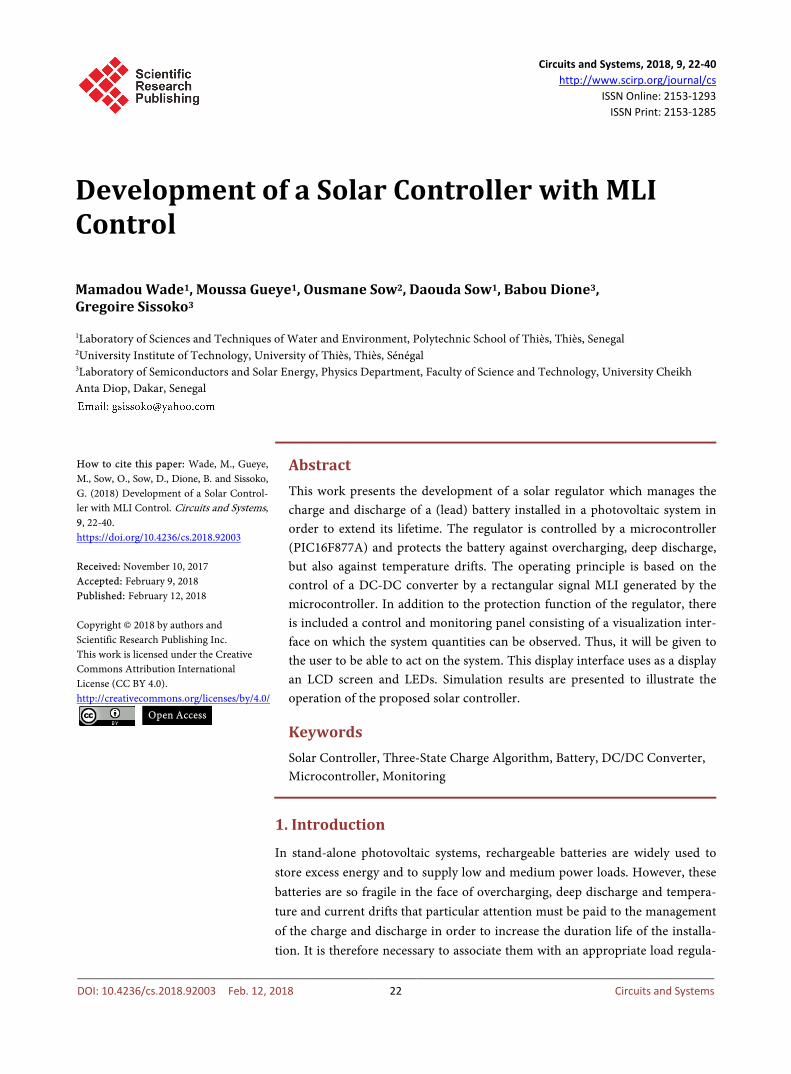
2.2. Charging Flowchart
Figure 1 shows the charging diagram of the lead battery, developed during this study, according to the three preceding charging phases.
3. Technology of the Regulator
The new PWM technology of the regulators is a very fast and efficient method which allows reaching the state of full charge of a solar battery, necessary to prolong its lifetime [4]. In this section, we develop the electronic scheme of the MLI regulator which allows to manage the energy produced by the photovoltaic panel and to transmit it to the battery and to the load according to the defined algorithm. This algorithm will be implemented in its digital version on a micro-controller, the PIC16F877A.
3.1. PWM Battery Regulator
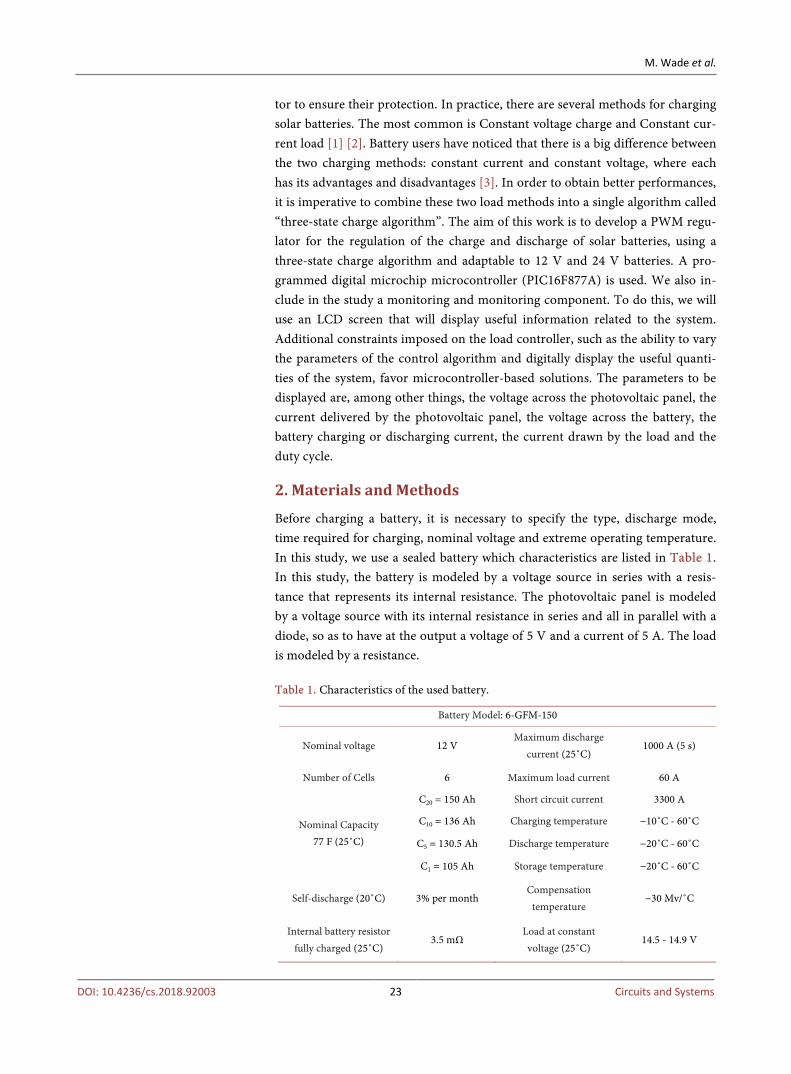
The system diagram of the charging system is shown in Figure 2. This system consists mainly of four entities which are the photovoltaic generator, the DC-DC converter, the lead-acid battery and the control and monitoring system.
Figure 1. Three-step charging flow chart.
M. Wade et al.
DOI: 10.4236/cs.2018.92003 26 Circuits and Systems
Figure 2. Block diagram of the load system.
3.1.1. Power Supply Voltage regulators
For the operation of the sensors and the power supply of the microcontroller, a voltage of 5 V is required from a stabilized power supply +5 V/−5 V. We use the “integrated” regulators LM7805 and LM7905, simple to implement [8].
The LM317 regulator, which can be used as a constant current source, is chosen because it is very suitable for producing voltage-stabilized and/or current-limited power supplies. It is adjustable and programmable and capable of supplying 1.5 A at an output voltage ranging from 1.25 V to 37 V, thus adaptable to the other stabilized power supply of the system, which must deliver a voltage of 1.25 V to 35 V.
3.1.2. Power Section This Buck DC/DC converter block transfers and converts power and controls the battery voltage and vary the charging current.
Non-return and freewheel diodes The Schottky type UF5406 non-return diode is chosen to protect the solar
panel from the reverse current that can enter the photovoltaic module and as a freewheel diode.
MOSFET Transistors and Driver The MOSFET, controlled by the microcontroller via the driver, is the compo-
nent that will act as a chopper and will control the charging current. The MOSFET driver we use is the IR2112 which allows adapting the signal from the PIC to the MOSFET. The microcontroller delivers a PWM voltage (0 - 5 V) to the driver, which returns it as a slave control voltage (0 - 20 V) to the MOSFET. It must con-trol two MOSFET transistors: the first (panel side) for chopping the charging cur-rent and the second (charging side) for disconnecting/reconnecting the load.
Smoothing inductance The value of the current smoothing inductance is determined from Equation (3) [9]:
max4e
ss
UL
F I=
∆ (3)
M. Wade et al.
DOI: 10.4236/cs.2018.92003 27 Circuits and Systems
eU : output voltage of the PV generator (V); F : frequency (Hz);
maxsI∆ : maximum current ripple (A). We take a maximum ripple of 1% for an intensity of 5 A, corresponding to a
current max 0.05 AsI∆ = . For a frequency of the transistor 50 kHzF = and a voltage 20 VeU = , the normalized value chosen is 2700 HsL = µ .
Filter Capacitor The circuit requiring a very steady voltage, we intercalate at the output, capa-
citors of filtering which capacity is given by [9]:
2_ max32
es
s so
UC
L U F=
⋅ ⋅∆ ⋅ (4)
eU : output voltage of the PV generator (V); C : capacity of the capacitor (F);
_ maxsoU∆ : amplitude of the variations between the maximum and the mini-mum of the voltage or the maximum permissible ripple (V);
F : frequency (Hz);
sL : smoothing inductance (H). We impose a permissible ripple corresponding to _ max 1 VsoU∆ = , with
20 VeU = , 2700 HsL = µ and a frequency of 50 kHz, which gives a norma-lized value 100 nFsC = .
3.2. Acquisition of Parameters 3.2.1. Voltage Measurement The PIC16F877A has a voltage of the order of 5 V on its input pins. But since the voltage and battery voltage ranges greatly exceed the capabilities of the PIC16F877A, we use a voltage divider with standard resistors to bring the meas-ured voltages back to reduced voltages that do not destroy the microcontroller and which can be read and interpreted. The output voltage of the source varies between 0 V and 20 V while the battery can operate between the deep discharge vol-tage of 24 V (respectively 12 V) and the absorption voltage of 29 V (respectively 14.5 V) for a 24 V battery (respectively 12 V). These two different voltage ranges must be converted into a range from 0 V to 5 V so that the PIC can read them, hence:
5 0 1maximum ratio source voltage divider20 0 4−
= =−
For the battery, the voltage of 30 V cannot be reached; we use a ratio divider of 6 to not exceed the 5 V admissible by the microcontroller PIC.
3.2.2. Current Measurement We use two ACS712 current sensors. One is used to measure the current deli-vered by the photovoltaic panel to the battery and/or to the load and the other is used to measure the charging and discharging current of the battery. Since the panel and battery currents are known, the current drawn by the load at any in-stant can be deduced.
M. Wade et al.
DOI: 10.4236/cs.2018.92003 28 Circuits and Systems
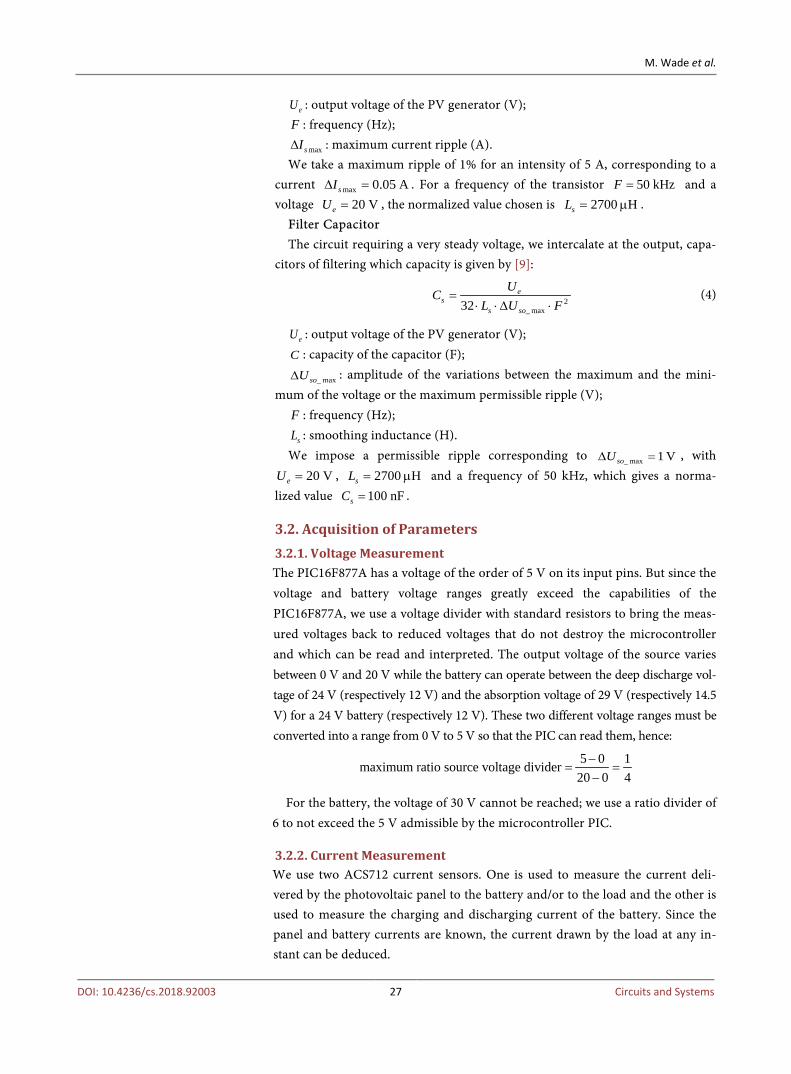
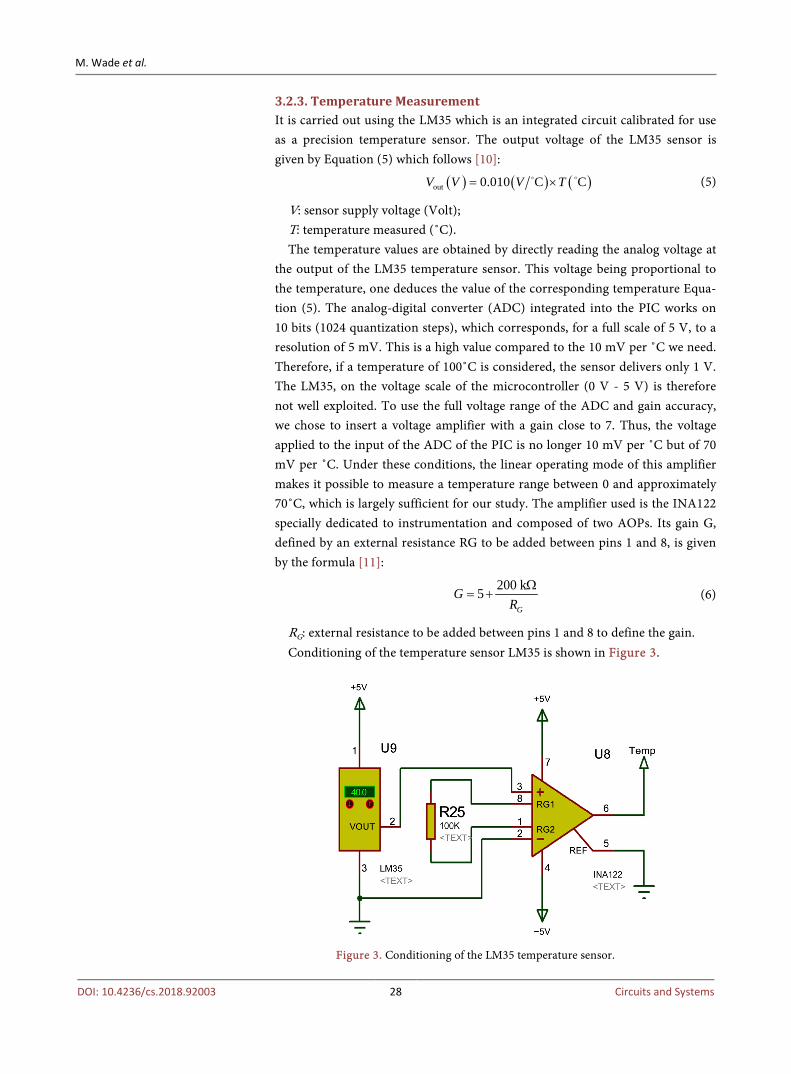
3.2.3. Temperature Measurement It is carried out using the LM35 which is an integrated circuit calibrated for use as a precision temperature sensor. The output voltage of the LM35 sensor is given by Equation (5) which follows [10]:
( ) ( ) ( )out 0.010 C CV V V T= × (5)
V: sensor supply voltage (Volt); T: temperature measured (˚C). The temperature values are obtained by directly reading the analog voltage at
the output of the LM35 temperature sensor. This voltage being proportional to the temperature, one deduces the value of the corresponding temperature Equa-tion (5). The analog-digital converter (ADC) integrated into the PIC works on 10 bits (1024 quantization steps), which corresponds, for a full scale of 5 V, to a resolution of 5 mV. This is a high value compared to the 10 mV per ˚C we need. Therefore, if a temperature of 100˚C is considered, the sensor delivers only 1 V. The LM35, on the voltage scale of the microcontroller (0 V - 5 V) is therefore not well exploited. To use the full voltage range of the ADC and gain accuracy, we chose to insert a voltage amplifier with a gain close to 7. Thus, the voltage applied to the input of the ADC of the PIC is no longer 10 mV per ˚C but of 70 mV per ˚C. Under these conditions, the linear operating mode of this amplifier makes it possible to measure a temperature range between 0 and approximately 70˚C, which is largely sufficient for our study. The amplifier used is the INA122 specially dedicated to instrumentation and composed of two AOPs. Its gain G, defined by an external resistance RG to be added between pins 1 and 8, is given by the formula [11]:
200 k5G
GR
Ω= + (6)
RG: external resistance to be added between pins 1 and 8 to define the gain. Conditioning of the temperature sensor LM35 is shown in Figure 3.
Figure 3. Conditioning of the LM35 temperature sensor.
M. Wade et al.
DOI: 10.4236/cs.2018.92003 29 Circuits and Systems
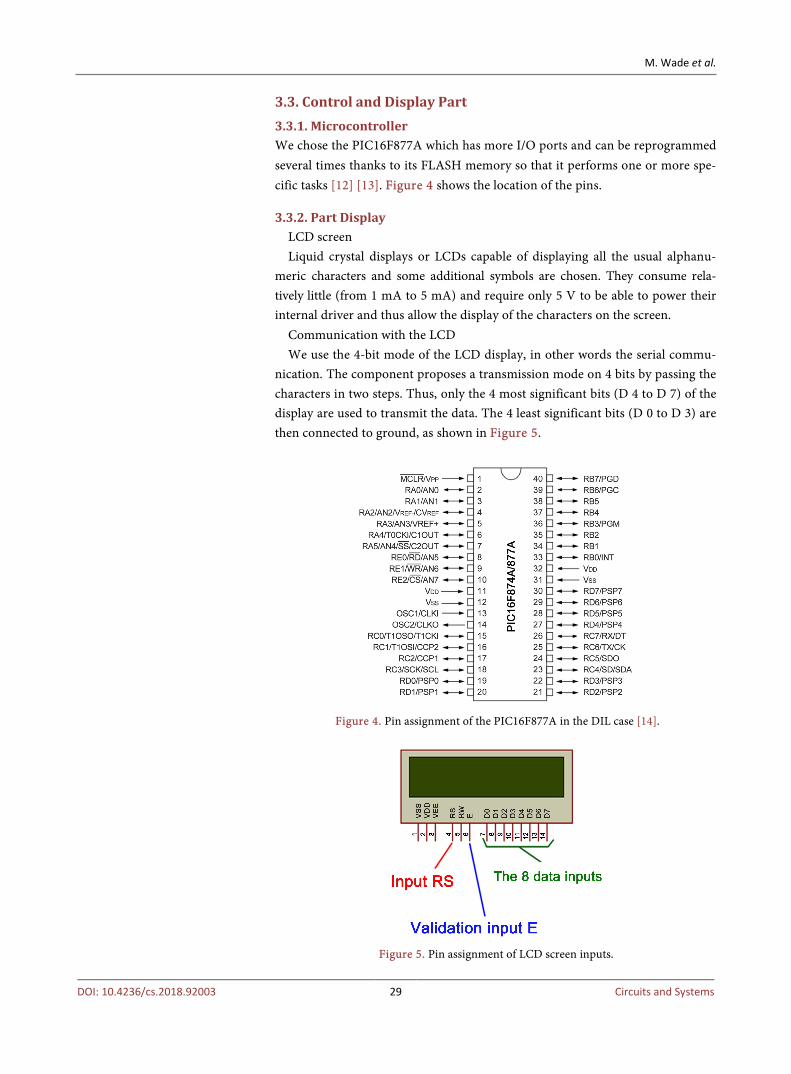
3.3. Control and Display Part 3.3.1. Microcontroller We chose the PIC16F877A which has more I/O ports and can be reprogrammed several times thanks to its FLASH memory so that it performs one or more spe-cific tasks [12] [13]. Figure 4 shows the location of the pins.
3.3.2. Part Display LCD screen Liquid crystal displays or LCDs capable of displaying all the usual alphanu-
meric characters and some additional symbols are chosen. They consume rela-tively little (from 1 mA to 5 mA) and require only 5 V to be able to power their internal driver and thus allow the display of the characters on the screen.
Communication with the LCD We use the 4-bit mode of the LCD display, in other words the serial commu-
nication. The component proposes a transmission mode on 4 bits by passing the characters in two steps. Thus, only the 4 most significant bits (D 4 to D 7) of the display are used to transmit the data. The 4 least significant bits (D 0 to D 3) are then connected to ground, as shown in Figure 5.
Figure 4. Pin assignment of the PIC16F877A in the DIL case [14].
Figure 5. Pin assignment of LCD screen inputs.
M. Wade et al.
DOI: 10.4236/cs.2018.92003 30 Circuits and Systems
LEDs Signal In addition to displaying parameters on LCD, we have integrated three LEDs
(red, yellow, green) on the board circuit. Their function is to indicate the charge phase but also give an idea of the charge state of the battery.
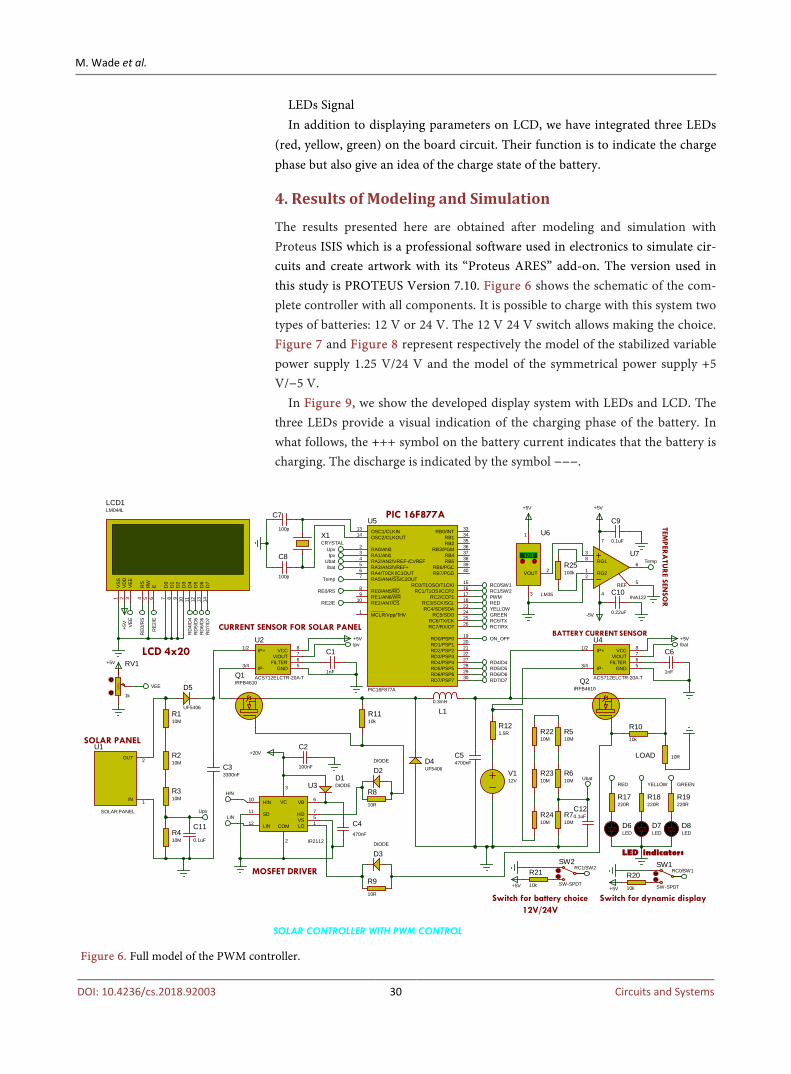
4. Results of Modeling and Simulation
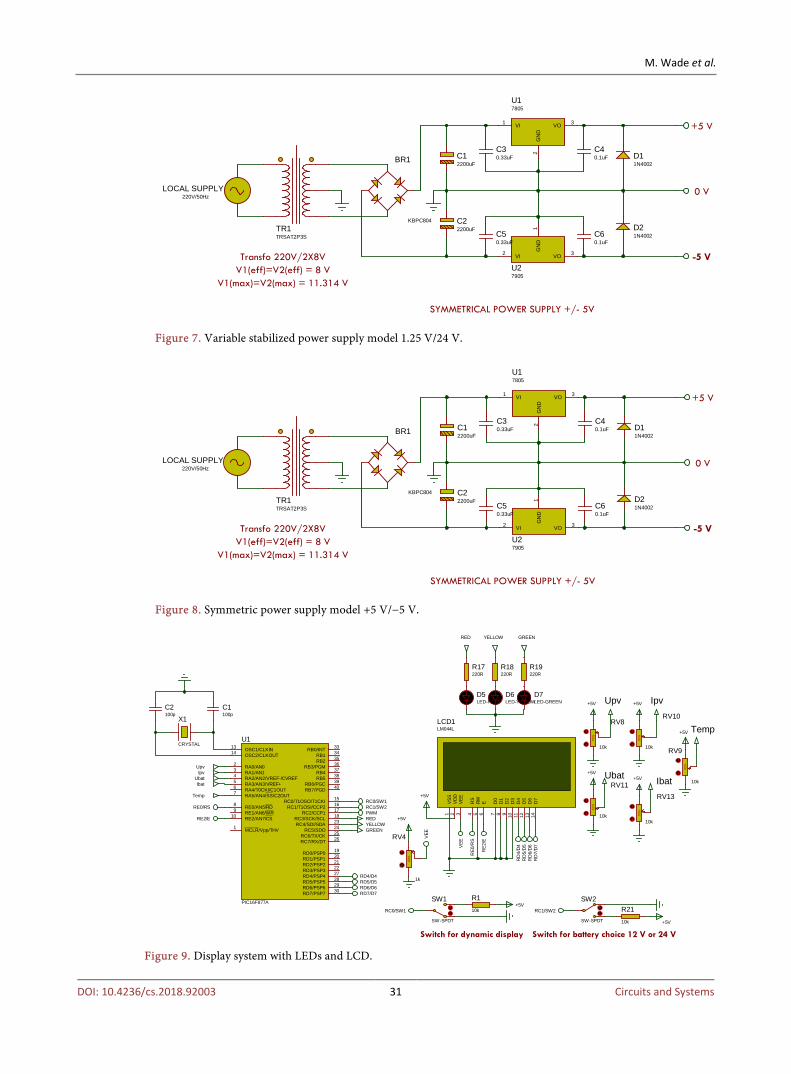
The results presented here are obtained after modeling and simulation with Proteus ISIS which is a professional software used in electronics to simulate cir-cuits and create artwork with its “Proteus ARES” add-on. The version used in this study is PROTEUS Version 7.10. Figure 6 shows the schematic of the com-plete controller with all components. It is possible to charge with this system two types of batteries: 12 V or 24 V. The 12 V 24 V switch allows making the choice. Figure 7 and Figure 8 represent respectively the model of the stabilized variable power supply 1.25 V/24 V and the model of the symmetrical power supply +5 V/−5 V.
In Figure 9, we show the developed display system with LEDs and LCD. The three LEDs provide a visual indication of the charging phase of the battery. In what follows, the +++ symbol on the battery current indicates that the battery is charging. The discharge is indicated by the symbol −−−.
Figure 6. Full model of the PWM controller.
R210M
R310M
R410M
C33300nF
IP+1/2
IP-3/4
VIOUT 7VCC 8
GND 5FILTER 6
U2
ACS712ELCTR-20A-T
+5V
C1
1nFQ1IRFB4610
D4UF5406
C54700nF
L10.3mH
Q2IRFB4610
LOAD 10R
R510M
R610M
R710M
IP+1/2
IP-3/4
VIOUT 7VCC 8
GND 5FILTER 6
U4
ACS712ELCTR-20A-T
+5V
C6
1nF
HIN10
LIN12
VB 6
HO 7
VS 5
LO 1COM
2
SD11
VC
3 U3
IR2112
+20V
C4470nF
C2
100nF
D1DIODE
D2DIODE
R810R
D3DIODE
R910R
R1010k
R1110k
V112V
R121.5R
IN 1
OUT 2
U1
SOLAR PANEL
RA0/AN02
RA1/AN13
RA2/AN2/VREF-/CVREF4
RA4/T0CKI/C1OUT6
RA5/AN4/SS/C2OUT7
RE0/AN5/RD8
RE1/AN6/WR9
RE2/AN7/CS10
OSC1/CLKIN13
OSC2/CLKOUT14
RC1/T1OSI/CCP2 16
RC2/CCP1 17
RC3/SCK/SCL 18
RD0/PSP0 19
RD1/PSP1 20
RB7/PGD 40RB6/PGC 39RB5 38RB4 37RB3/PGM 36RB2 35RB1 34RB0/INT 33
RD7/PSP7 30RD6/PSP6 29RD5/PSP5 28RD4/PSP4 27RD3/PSP3 22RD2/PSP2 21
RC7/RX/DT 26RC6/TX/CK 25RC5/SDO 24RC4/SDI/SDA 23
RA3/AN3/VREF+5
RC0/T1OSO/T1CKI 15
MCLR/Vpp/THV1
U5
PIC16F877A
D7
14D
613
D5
12D
411
D3
10D
29
D1
8D
07
E6
RW5
RS
4
VSS
1
VD
D2
VEE
3
LCD1LM044L
C7
100p
C8
100p
X1CRYSTAL
+5V
+5V
TEMPER
ATU
RE SEN
SOR
CURRENT SENSOR FOR SOLAR PANELBATTERY CURRENT SENSOR
SOLAR PANEL
LCD 4x20
PIC 16F877A
MOSFET DRIVER
D5
UF5406R110M
R17220R
R18220R
R19220R
D7LED
D8LED
SW1
SW-SPDT+5V
R2010k
SW2
SW-SPDT+5V
R2110k
Switch for battery choice
R2210M
R2310M
R2410M D6
LED
3
2
RG18
RG21
4
7
6
REF 5
U7
INA122
42.0
3
1
VOUT 2
U6
LM35
R25100k
+5V
-5V
+5V
C9
0.1uF
C10
0.22uF
RD4/D4
RD
4/D
4R
D5/
D5
RD
6/D
6R
D7/
D7
RD5/D5RD6/D6RD7/D7
RE0/RS
RE0
/RS
RE2/E
RE2
/E
56%
RV1
1k
VEE
VEE
RC0/SW1
RC0/SW1
RC1/SW2
RC1/SW2
PWMREDYELLOWGREEN
ON_OFF
HIN
RED YELLOW GREEN
LIN
UpvIpv
UbatIbat
Temp
Upv
Ipv
Ubat
Ibat
Temp
SOLAR CONTROLLER WITH PWM CONTROL
LED indicators
C11
0.1uF
C120.1uF
RC6/TXRC7/RX
12V/24VSwitch for dynamic display
M. Wade et al.
DOI: 10.4236/cs.2018.92003 31 Circuits and Systems
Figure 7. Variable stabilized power supply model 1.25 V/24 V.
Figure 8. Symmetric power supply model +5 V/−5 V.
Figure 9. Display system with LEDs and LCD.
LOCAL SUPPLY220V/50Hz
C12200uF
BR1
KBPC804
VI2 VO 3GN
D1
U27905
C22200uF
C30.33uF
C40.1uF
C50.33uF
C60.1uF
D11N4002
D21N4002
VI1 VO 3
GN
D2
U17805
Transfo 220V/2X8VV1(eff)=V2(eff) = 8 V
V1(max)=V2(max) = 11.314 V
TR1TRSAT2P3S
0 V
+5 V
-5 V
SYMMETRICAL POWER SUPPLY +/- 5V
LOCAL SUPPLY220V/50Hz
C12200uF
BR1
KBPC804
VI2 VO 3GN
D1
U27905
C22200uF
C30.33uF
C40.1uF
C50.33uF
C60.1uF
D11N4002
D21N4002
VI1 VO 3
GN
D2
U17805
Transfo 220V/2X8VV1(eff)=V2(eff) = 8 V
V1(max)=V2(max) = 11.314 V
TR1TRSAT2P3S
0 V
+5 V
-5 V
SYMMETRICAL POWER SUPPLY +/- 5V
RA0/AN02
RA1/AN13
RA2/AN2/VREF-/CVREF4
RA4/T0CKI/C1OUT6
RA5/AN4/SS/C2OUT7
RE0/AN5/RD8
RE1/AN6/WR9
RE2/AN7/CS10
OSC1/CLKIN13
OSC2/CLKOUT14
RC1/T1OSI/CCP2 16
RC2/CCP1 17
RC3/SCK/SCL 18
RD0/PSP0 19
RD1/PSP1 20
RB7/PGD 40RB6/PGC 39RB5 38RB4 37RB3/PGM 36RB2 35RB1 34RB0/INT 33
RD7/PSP7 30RD6/PSP6 29RD5/PSP5 28RD4/PSP4 27RD3/PSP3 22RD2/PSP2 21
RC7/RX/DT 26RC6/TX/CK 25RC5/SDO 24RC4/SDI/SDA 23
RA3/AN3/VREF+5
RC0/T1OSO/T1CKI 15
MCLR/Vpp/THV1
U1
PIC16F877A
C1100p
C2100p
X1
CRYSTAL
+5V
+5V
89%
RV4
1k
75%
RV8
10k
+5V
40%
RV9
10k
+5V
55%
RV10
10k
+5V
41%
RV11
10k
+5V
55%
RV13
10k
+5V
Upv
Temp
Ipv
Ubat Ibat
UpvIpv
UbatIbat
Temp
D7
14D
613
D5
12D
41 1
D3
10D
29
D1
8D
07
E6
RW5
RS
4
VSS
1
VD
D2
VEE
3
LCD1LM044L
R17220R
R18220R
R19220R
RED YELLOW GREEN
D6LED-YELLOW
D7LED-GREEN
GREENYELLOWRED
SW1
SW-SPDT
+5VR110k
SW2
SW-SPDT +5V
R2110k
D5LED-RED
Switch for battery choice 12 V or 24 VSwitch for dynamic display
RD7/D7
RD4/D4RD5/D5RD6/D6
RD
7/D
7
RD
4/D
4R
D5/
D5
RD
6 /D
6VE E
VEE
PWM
RE2
/E
RE0
/RS
RE0/RS
RE2/E
RC0/SW1
RC0/SW1 RC1/SW2
RC1/SW2
M. Wade et al.
DOI: 10.4236/cs.2018.92003 32 Circuits and Systems
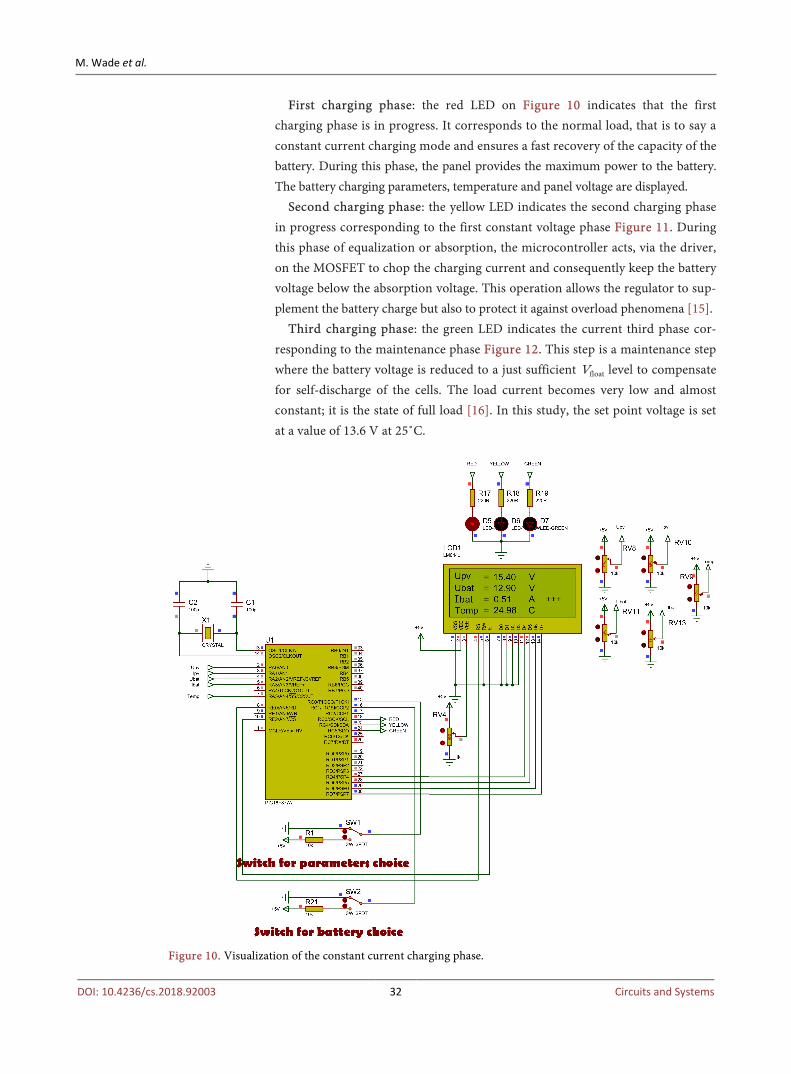
First charging phase: the red LED on Figure 10 indicates that the first charging phase is in progress. It corresponds to the normal load, that is to say a constant current charging mode and ensures a fast recovery of the capacity of the battery. During this phase, the panel provides the maximum power to the battery. The battery charging parameters, temperature and panel voltage are displayed.
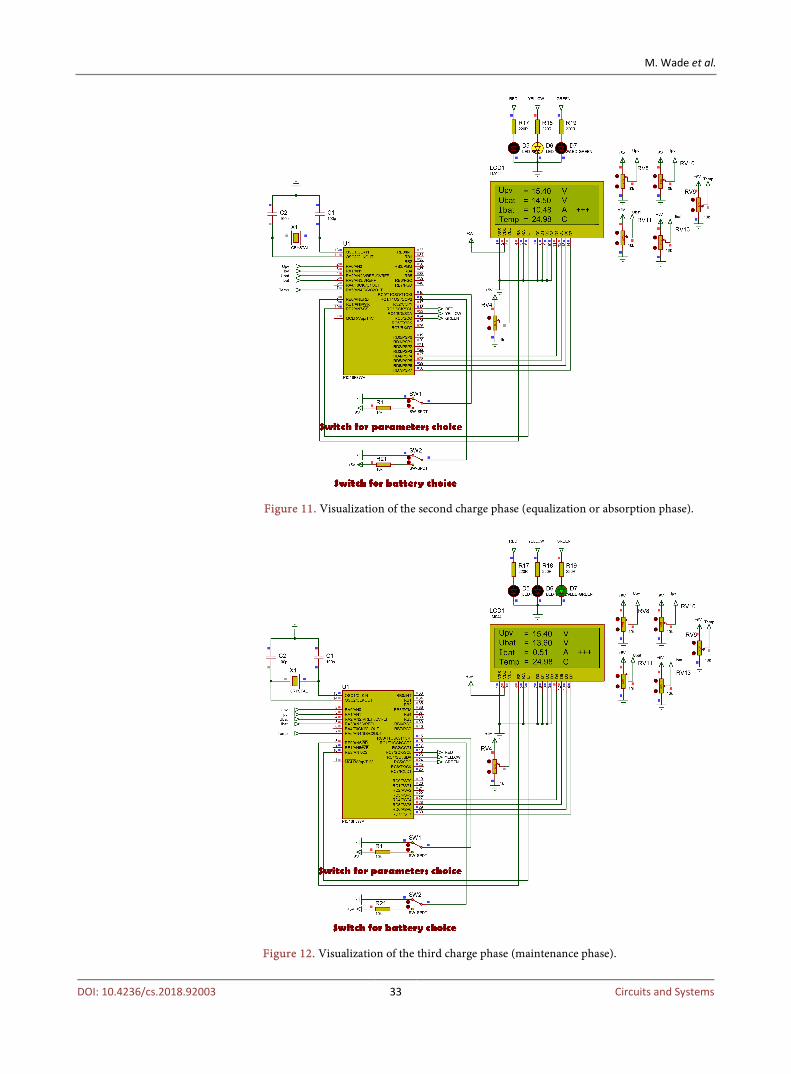
Second charging phase: the yellow LED indicates the second charging phase in progress corresponding to the first constant voltage phase Figure 11. During this phase of equalization or absorption, the microcontroller acts, via the driver, on the MOSFET to chop the charging current and consequently keep the battery voltage below the absorption voltage. This operation allows the regulator to sup-plement the battery charge but also to protect it against overload phenomena [15].
Third charging phase: the green LED indicates the current third phase cor-responding to the maintenance phase Figure 12. This step is a maintenance step where the battery voltage is reduced to a just sufficient Vfloat level to compensate for self-discharge of the cells. The load current becomes very low and almost constant; it is the state of full load [16]. In this study, the set point voltage is set at a value of 13.6 V at 25˚C.
Figure 10. Visualization of the constant current charging phase.
M. Wade et al.
DOI: 10.4236/cs.2018.92003 33 Circuits and Systems
Figure 11. Visualization of the second charge phase (equalization or absorption phase).
Figure 12. Visualization of the third charge phase (maintenance phase).
M. Wade et al.
DOI: 10.4236/cs.2018.92003 34 Circuits and Systems
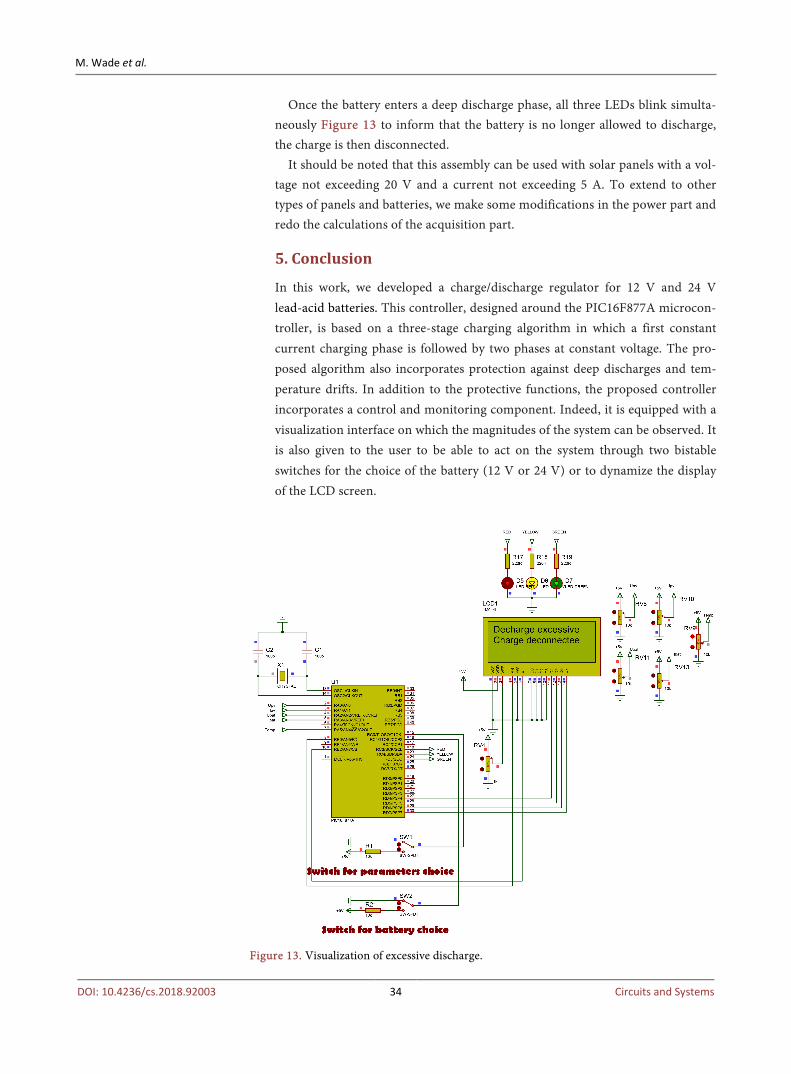
Once the battery enters a deep discharge phase, all three LEDs blink simulta-neously Figure 13 to inform that the battery is no longer allowed to discharge, the charge is then disconnected.
It should be noted that this assembly can be used with solar panels with a vol-tage not exceeding 20 V and a current not exceeding 5 A. To extend to other types of panels and batteries, we make some modifications in the power part and redo the calculations of the acquisition part.
5. Conclusion
In this work, we developed a charge/discharge regulator for 12 V and 24 V lead-acid batteries. This controller, designed around the PIC16F877A microcon-troller, is based on a three-stage charging algorithm in which a first constant current charging phase is followed by two phases at constant voltage. The pro-posed algorithm also incorporates protection against deep discharges and tem-perature drifts. In addition to the protective functions, the proposed controller incorporates a control and monitoring component. Indeed, it is equipped with a visualization interface on which the magnitudes of the system can be observed. It is also given to the user to be able to act on the system through two bistable switches for the choice of the battery (12 V or 24 V) or to dynamize the display of the LCD screen.
Figure 13. Visualization of excessive discharge.
M. Wade et al.
DOI: 10.4236/cs.2018.92003 35 Circuits and Systems
References [1] Usher, E.P. and Ross, M.M.D. (1998) Recommended Practices for Charge Control-
lers. Report IEA PVPS T3-05.
[2] Koutroulis, E. and Kalaitzakis, K. (2004) Novel Battery Charging Regulation System for Photovoltaic Applications. Proceedings—Electric Power Applications, 151, 191- 197. https://doi.org/10.1049/ip-epa:20040219
[3] Belarbi, M. (2015) Contribution à l’étude d’un générateur solaire pour site autonome, Université des Sciences et de la Technologie d’oran Mohamed Boudiaf, Algérie.
[4] Merrouche, W., Tebibel, H. and Malek, A. (2012) Développement sous Proteus d’un régulateur basé sur un algorithme de charge efficace et sécurisée pour batteries au plomb dans un système photovoltaïque. The 2nd International Seminar on New and Renewable Energies, Ghardaïa, 15-17 Octobre 2012, 175-186.
[5] Gold, S. (1997) A Pspice Macromodel for Lithium-Ion Batteries. Proceedings of the 12th Battery Conference, 9-15.
[6] Houée, P. (2011) Une installation photovoltaïque en site isolé, forum des technologies, Technologie 175.
[7] Messikh, L., Chikhi, S., Chikhi, F. and Chergui, T. (2008) Mise au point d’un régulateur de charge/décharge de batterie avec seuils adaptatifs de tension pour les applications photovoltaïques. Revue des Energies Renouvelables, 11, 281-290.
[8] Dione, B., Sow, O., Wade, M., Ly, I., Mbodji, S. and Sissoko, G. (2016) Experimental Process Us for Acquisition Automatic Features of I-V Properties and Temperature of the Solar Panel by Changing the Operating Point. Circuits and Systems, 7, 3984- 4000. https://doi.org/10.4236/cs.2016.711330
[9] Rufer, A. (2016) Conversion DC/DC, Ecole Polytechnique Fédérale de Lausanne (EPFL).
[10] Texas Instruments (2016) LM35 Precision Centigrade Temperature Sensors.
[11] Burr-Brown (1997) INA122 Single Supply, MicroPower Instrumentation Amplifier. Burr-Brown Corporation.
[12] Sow, O., Diarisso, D., Mbodji, N.Z.A., Diallo, M.S., Diao, A., Gaye, I., Barro, F.I. and Sissoko, G. (2013) Experimental Device for Acquisition of Properties I-V and V (T) of the Solar by Automatic Change Operating Point. International Journal of Innova- tive Technology and Exploring Engineering, 2, 330-334.
[13] Diarisso, D., Diallo, M.S., Diao, A., Sow, O., Gaye, I., Barro, F.I. and Sissoko, G. (2013) Development of Battery Charge/Discharge Regulator for Photovoltaic Sys-tems. International Journal of Innovative Technology and Exploring Engineering, 2, 231-234.
[14] Microchip Datasheet (1999) PIC 16F87x: 28/40 pin CMOS Flash Microcontrollers. Microchip Technology Inc., DS30292B.
[15] Dunlop, J.P. (1997) Batteries and Charge Control in Stand-Alone Photovoltaic Sys-tems: Fundamentals and Application. Sandia National Laboratories and Florida So-lar Energy Center.
[16] Aït Cheikh, M.S., Chirk Belhadj, M., Bassaid, M., Becherif, M. and Larbes, C. (2012) Simulation et réalisation d’un contrôleur de batterie solaire à base de PIC16F876. Revue des Energies Renouvelables.
M. Wade et al.
DOI: 10.4236/cs.2018.92003 36 Circuits and Systems
Appendix
In this part, we present the program executed and compiled with CCS Compiler, software specialized in the programming of PICs. // PROGRAM UNDER CSS #include <regulator_ccs.h> #include <LCD420.c> // ConnectionsModuleLCD #define LCD_RS_PIN PIN_D1 #define LCD_ENABLE_PIN PIN_D3 #define LCD_DATA4 PIN_D4 #define LCD_DATA5 PIN_D5 #define LCD_DATA6 PIN_D6 #define LCD_DATA7 PIN_D7 //End ConnectionsModuleLCD #define ON_OFF PIN_C7 #define BOUTON PIN_C0 #define BOUTON_ON input_state(PIN_C0)==0 #define Choice_bat_ON input_state(PIN_C1)==0 #define LED_RED PIN_C3 #define LED_YELLOW PIN_C4 #define LED_GREEN PIN_C5 #USE PWM(OUTPUT=PIN_C2, FREQUENCY=50kHz, DUTY=100) float Voltage_pv; float Voltage_bat; float Current_pv; float Current_bat; float Current_ch; float Temperature; float Voltage_absorption; float Voltage_float; float alpha; int duty; char choice_bat; const int8 Imin = 1; void DisplayFormat(void) if(BOUTON_ON) lcd_putc('\f'); //Clear LCD Screen printf(lcd_putc,"Upv = %f V",Voltage_pv); lcd_gotoxy(1,2); printf(lcd_putc,"Ubat = %f V",Voltage_bat); lcd_gotoxy(1,3); if(Current_bat>=0) printf(lcd_putc,"Ibat = %f A +++",Current_bat);
M. Wade et al.
DOI: 10.4236/cs.2018.92003 37 Circuits and Systems
if(Current_bat<0) Current_bat = - Current_bat; printf(lcd_putc,"Ibat = %f A ---",Current_bat); lcd_gotoxy(1,4); printf(lcd_putc,"Temp = %f C",Temperature); Delay_ms(2000); else lcd_putc('\f'); //Clear LCD Screen printf(lcd_putc,"Ipv = %f A",Current_pv); lcd_gotoxy(1,2); printf(lcd_putc,"Icharge = %f A",Current_ch); lcd_gotoxy(1,3); printf(lcd_putc,"alpha = %f%%",alpha*100); lcd_gotoxy(1,4); lcd_putc("Frequency = 50kHz"); Delay_ms(2000); void Mesure(void) set_adc_channel(2); Delay_ms(10); Voltage_bat = read_adc(); Delay_ms(10); Vomtage_bat = (Voltage_bat/1023)*5*6; set_adc_channel(0); Delay_ms(10); Voltage_pv = read_adc(); Delay_ms(10); Voltage_pv = (Voltage_pv/1023)*5*4; set_adc_channel(3); Delay_ms(10); Voltage_bat = read_adc(); Delay_ms(10); Currentt_bat = (Currentt_bat/1023)*5; Currentt_bat = 10*Currentt_bat-25; set_adc_channel(1); Delay_ms(10); Current_pv = read_adc(); Delay_ms(10); Currentt_pv = (Currentt_pv/1023)*5; Currentt_pv = 10*Currentt_pv-25; set_adc_channel(4); Delay_ms(10); Temperature = read_adc(); Delay_ms(10);
M. Wade et al.
DOI: 10.4236/cs.2018.92003 38 Circuits and Systems
Temperature = (Temperature/1023)*5; Temperature = Temperature*12.5; Voltage_absorption = (14.5-0.03*(Temperature-25))*choice_bat; Voltage_float = (13.6-0.03*(Temperature-25))*choice_bat; Current_ch = Current_pv - Current_bat; void main() setup_adc(ADC_CLOCK_INTERNAL); setup_adc_ports(AN0_AN1_AN2_AN3_AN4); set_tris_a(0xFF); set_tris_c(0b00000011); lcd_init(); Delay_ms(100); while(TRUE) if (Choice_bat_ON) choice_bat=1; else choice_bat=2; lcd_putc('\f'); Mesure(); Delay_ms(500); while(Voltage_bat <= (Voltage_absorption) &&Voltage_bat>= (12.6*choice_bat) ) lcd_putc('\f'); Mesure(); output_high(ON_OFF); output_low(LED_YELLOW); output_low(LED_GREEN); output_high(LED_RED); alpha=1; pwm_on(); duty = 1000*alpha; pwm_set_duty_percent(duty); //Viewing DisplayFormat(); lcd_putc('\f'); //Mesure(); while(Current_bat >= Imin &&Voltage_bat>= (12.6*choice_bat)) lcd_putc('\f');

M. Wade et al.
DOI: 10.4236/cs.2018.92003 39 Circuits and Systems
Mesure(); Voltage_bat = Voltage_absorption; alpha = Voltage_bat/Voltage_pv; output_low(LED_RED); output_low(LED_GREEN); output_high(LED_YELLOW); pwm_on(); duty = 1000*alpha; pwm_set_duty_percent(duty); DisplayFormat(); Mesure(); Mesure(); Delay_ms(500); lcd_putc('\f'); while(Voltage_bat >= (12.6*choice_bat)) lcd_putc('\f'); Mesure(); Voltage_bat = Voltage_float; alpha = Voltage_bat/Voltage_pv; output_low(LED_YELLOW); output_low(LED_RED); output_high(LED_GREEN); pwm_on(); duty = 1000*alpha; pwm_set_duty_percent(duty); //Viewing DisplayFormat(); Mesure(); lcd_putc('\f'); if(Voltage_bat < (12.6*choice_bat)) output_low(ON_OFF); alpha=1; pwm_on(); duty = 1000*alpha; pwm_set_duty_percent(duty); lcd_putc('\f'); //Clear LCD Screen lcd_putc("Excessive discharge"); lcd_gotoxy(1,2); lcd_putc("Load disconnected"); Mesure(); output_high(LED_YELLOW);
M. Wade et al.
DOI: 10.4236/cs.2018.92003 40 Circuits and Systems
output_high(LED_GREEN); output_high(LED_RED); Delay_ms(250); output_low(LED_YELLOW); output_low(LED_GREEN); output_low(LED_RED); Delay_ms(250);