development of a highly sensitive optically pumped atomic magnetometer for biomagnetic field...
TRANSCRIPT

IEEE TRANSACTIONS ON MAGNETICS, VOL. 46, NO. 9, SEPTEMBER 2010 3635
Development of a Highly Sensitive Optically Pumped Atomic Magnetometerfor Biomagnetic Field Measurements: A Phantom Study
Shuji Taue�, Yasuyuki Sugihara�, Tetsuo Kobayashi�, Sunao Ichihara�, Kiyoshi Ishikawa���, andNatsuhiko Mizutani�
Department of Electrical Engineering, Kyoto University, Kyoto 615-8510, JapanFrontier Research Center, Canon Inc., Tokyo 146-8501, Japan
Department of Material Science, University of Hyogo, Hyogo 678-1297, Japan
We developed a highly sensitive optically pumped atomic magnetometer for measuring biomagnetic fields from the human body non-invasively. The sensor head was a cubic Pyrex glass cell containing potassium metal and buffer gases. A pump laser beam for spin-polar-izing potassium atoms and a probe laser beam for detecting magneto-optical rotation crossed at right angles in the cell, which was heatedin an oven to vaporize potassium atoms. The sensitivity of the magnetometer reached to 10–100 fT/Hz� � at frequencies below severalhundred hertz. To test system performance, we made a phantom which models the human brain, taking into account the contribution ofdistributed electric currents. First, we tested the phantom by a 306-channel whole-head MEG system and confirmed good agreement ofthe measured field distributions with theoretical calculations. Subsequently, we measured magnetic field distribution with the phantomscanning two-dimensionally above the oven. The signal source location was estimated by least squares fitting to the measured distribu-tion. The goodness of fit value between the measured and the theoretical distributions was 97.9%.
Index Terms—Atomic magnetometer, biomagnetic field, optical pumping, phantom measurement.
I. INTRODUCTION
M EASUREMENT of biomagnetic fields, such as magne-toencephalography (MEG) and magnetocardiography
(MCG), is a useful noninvasive method for investigating humanhigher brain functions and clinical applications. In MEG, veryweak cerebral magnetic fields generated by ionic currentsflowing inside dendrites of the cortical neurons have beendetected by a superconducting quantum interference device(SQUID) system [1]. In recent years, several optically pumpedatomic magnetometers operating under spin-exchange relax-ation-free (SERF) conditions have reached sensitivities in thefemtotesla range [2]–[5]. The most sensitive atomic magne-tometer has sensitivity comparable to SQUIDs [5]. In addition,cryogenic cooling is not required with atomic magnetometers.These magnetometers are based on the detection of Larmorspin precession in alkali atoms contained in glass cells. Fig. 1illustrates the principle of an atomic magnetometer with twolaser beams for pumping and probing arranged orthogonally.Vaporized alkali-metal electron spins are polarized in the direc-tion of the pump beam. The spin evolving in a magnetic field ismeasured by the probe beam.
Recent works have demonstrated that atomic magnetometersare really applicable to biomagnetic field measurements [6]–[8].The next step to implementation is mapping of the field distri-butions. One of the ideal techniques is the multichannel mea-surement using grid-aligned alkali-cells. It is, however, easy to
Manuscript received August 19, 2009; revised November 16, 2009 and Feb-ruary 25, 2010; accepted April 11, 2010. Date of publication May 03, 2010;date of current version August 20, 2010. Corresponding author: S. Taue (e-mail:[email protected]).
Color versions of one or more of the figures in this paper are available onlineat http://ieeexplore.ieee.org.
Digital Object Identifier 10.1109/TMAG.2010.2048576
Fig. 1. Basic principle of atomic magnetometry. A pump beam polarizes alkali-metal electron spin. Spin polarization evolves in the magnetic field, and the stateof spin polarization is measured by polarization rotation of the probe beam.
imagine the difficulty to align a number of cells of identical sen-sitivity together with optical components, and to produce the ex-ternal field uniformly in an area occupied by a set of cells.
Before such a technical challenge, we studied the funda-mental potential of atomic magnetometers for field mappingin this work. Therefore, in the measurements, we scanned thespatial position of target objects. While sacrificing a wholemeasurement time, the mechanical scanning makes it possibleto obtain the field distribution with a single sensor placed in alocally uniform external field.
In the present study, we developed a SERF optically pumpedatomic magnetometer having a mechanical scanning systemfor biological objects. In addition, we made a phantom whichmodels the human head taking into account of the distributedelectric currents to evaluate the atomic magnetometer. First,the magnetic signature of the phantom was checked by awhole-head MEG system. Subsequently, we scanned thephantom on a plane and measured field distributions gener-ated from a dipole electrode in the phantom by the atomicmagnetometer.
0018-9464/$26.00 © 2010 IEEE

3636 IEEE TRANSACTIONS ON MAGNETICS, VOL. 46, NO. 9, SEPTEMBER 2010
Fig. 2. Phantom (left) and dipole electrode (right) used in this experiment.The radius of the spherical glass was 100 mm. Dipole electrode was held byan acrylic stick and immersed in normal saline. Thermoplastic resin was usedto stop the glass from opening and to secure the acrylic stick in place.
Fig. 3. Setup of a phantom in a whole-head MEG system. The phantom wasplaced on the back face above the sensor plane with a dipole electrode in the� direction (left). The location of the phantom and dipole electrode are shownwith the sensor (pickup coil) array of the MEG system (right).
II. METHODS
A. Biological Phantom
We reproduced the biomagnetic fields with the distributedelectric currents inside the human head by manufacturing aspherical glass phantom containing normal saline and a smalldipole electrode fixed inside, as shown in Fig. 2. The diameterof the phantom was 100 mm. The length of the dipole electrodewas 6 mm. The dipole electrode was positioned 5 mm from thebottom.
B. Test Measurement With a Whole-Head MEG System
To check the magnetic signature of the phantom, the mag-netic field from the phantom was measured by a 306-channelwhole-head MEG system (VECTORVIEW, Neuromag). In thisstudy, 102 magnetometers were used for the measurement. Thephantom was placed on the back face above the sensor planewith the dipole electrode in the direction as shown in Fig. 3.A 50 Hz sinusoidal magnetic field generated from the dipoleelectrode was measured with the sampling rate of 1001.6 Hz.The amplitude of the current to the dipole electrode was 55 .
Fig. 4. Schematic of the experimental setup for the optically pumped atomicmagnetometer. Electron spins of potassium atoms were polarized in the � di-rection by the circularly polarized pump beam. The polarized spin evolving ina magnetic field in the � direction rotates the polarization direction of the probebeam. The polarization rotation was measured as a change of intensity differ-ence between the vertical and horizontal polarization components split by thepolarized beam splitter.
To verify the accuracy of the measurements, the measuredmagnetic field distribution was compared with the theoreticaldistribution. The theoretical magnetic field at the measure-ment point was obtained by using the following Sarvas’s (1)considering the contribution of distributed electric currents inthe phantom [1], [9]
(1)
where , , ,, was the location of the dipole electrode
estimated from the measured result, was the current dipole at, was the current value flowing to dipole electrode, was
the directional vector of the dipole electrode, and was thevacuum permeability.
To evaluate the percentage of agreement between measuredand theoretical fields, we used a goodness of fit value ( -value)obtained by
(2)
(3)
where and were measured and theoretical magnetic fluxdensities at the sensor position .
C. Optically Pumped Atomic Magnetometer
The experimental setup for the magnetometer is shown inFig. 4. The magnetometer’s sensor head was a cubic Pyrex glasscell 30 mm on each side. The cell contained potassium metaland buffer gases He and at a ratio of 10 to 1 for slowing dif-fusion of potassium atoms to the cell walls and for quenching.Total pressure of buffer gases was 1.6 atm at room temperature.
TAUE et al.: DEVELOPMENT OF A HIGHLY SENSITIVE OPTICALLY PUMPED ATOMIC MAGNETOMETER FOR BIOMAGNETIC FIELD MEASUREMENTS 3637
Fig. 5. Experimental setup for phantom measurements with optically pumpedatomic magnetometer. The phantom was placed in a basket above the oven andscanned on a plane by the gearing mechanism.
Potassium atoms were spin-polarized by a circularly polar-ized pump laser beam supplied by a laser diode with an ex-ternal cavity (Tiger, Sacher Lasertechnik) tuned to the centerof pressure-broadened D1 line of potassium atoms (770.1 nm).A linearly polarized probe laser beam supplied by the otherlaser diode (Lion, Sacher Lasertechnik) was slightly blue-de-tuned from the D1 resonance (769.9 nm) and crossed the pumpbeam at right angles in the cell. Diameters of both pump andprobe laser beams were 30 mm. To maximize detected signals,intensities of pump and probe laser beams were adjusted to 150mW and 35 mW, respectively.
The polarization rotation of the probe beam was measuredas a change in intensity differences between the vertical andhorizontal polarization components split by the polarized beamsplitter. The change in intensity differences was detected by abalanced amplified detector (model 2007 Nirvana, New Focus)and stored to a personal computer via A/D converter. The de-tected change was proportional to the rotation angle and corre-sponded to the magnetic field perpendicular to both pump andprobe beams. The cell in an oven was heated to approximately450 K by hot flowing air so as to increase atomic density andplaced at the center of three-layer -metal magnetic shields witha shielding factor of at 30 Hz. Weak external dc magneticfields passing through the shields were canceled by three-axesHelmholtz coils set up around the cell. In addition, a pair of testcoils was placed to generate ac magnetic fields in the directionperpendicular to both pump and probe beams for calibration.The sensitivity of the magnetometer was 10–100 atfrequencies below several hundred hertz.
D. Measurements With Atomic Magnetometer
As shown in Fig. 5, the phantom was placed in a basket abovethe oven and scanned two-dimensionally on an plane bya gearing mechanism composed of plastic components by oper-ating wires leading out from the shields. The distance from thecenter of the cell to the dipole electrode was 60 mm. The scan-ning range was 45 mm in and 40 mm in with a resolutionof 5 mm, then the number of measurement points was 90. Thetotal measurement took about 1 h.
Sinusoidal currents of 40 and 45 Hz were applied to the testcoils and the dipole electrode, respectively. The amplitude of
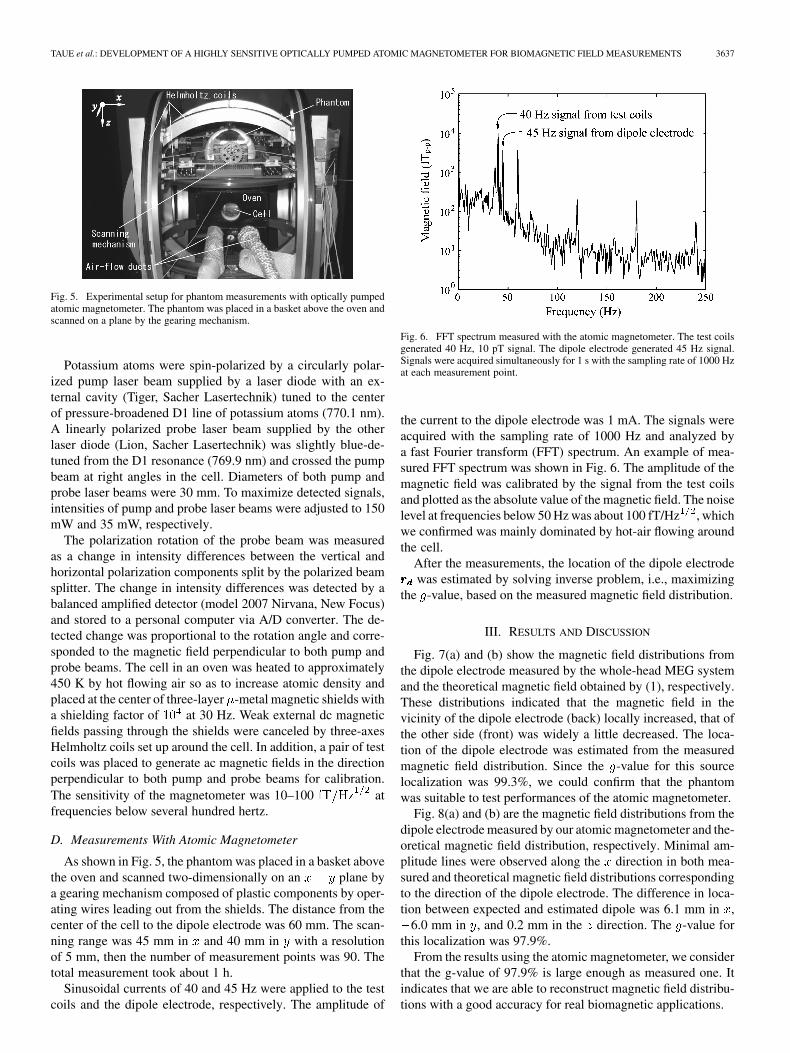
Fig. 6. FFT spectrum measured with the atomic magnetometer. The test coilsgenerated 40 Hz, 10 pT signal. The dipole electrode generated 45 Hz signal.Signals were acquired simultaneously for 1 s with the sampling rate of 1000 Hzat each measurement point.
the current to the dipole electrode was 1 mA. The signals wereacquired with the sampling rate of 1000 Hz and analyzed bya fast Fourier transform (FFT) spectrum. An example of mea-sured FFT spectrum was shown in Fig. 6. The amplitude of themagnetic field was calibrated by the signal from the test coilsand plotted as the absolute value of the magnetic field. The noiselevel at frequencies below 50 Hz was about 100 fT/Hz , whichwe confirmed was mainly dominated by hot-air flowing aroundthe cell.
After the measurements, the location of the dipole electrodewas estimated by solving inverse problem, i.e., maximizing
the -value, based on the measured magnetic field distribution.
III. RESULTS AND DISCUSSION
Fig. 7(a) and (b) show the magnetic field distributions fromthe dipole electrode measured by the whole-head MEG systemand the theoretical magnetic field obtained by (1), respectively.These distributions indicated that the magnetic field in thevicinity of the dipole electrode (back) locally increased, that ofthe other side (front) was widely a little decreased. The loca-tion of the dipole electrode was estimated from the measuredmagnetic field distribution. Since the -value for this sourcelocalization was 99.3%, we could confirm that the phantomwas suitable to test performances of the atomic magnetometer.
Fig. 8(a) and (b) are the magnetic field distributions from thedipole electrode measured by our atomic magnetometer and the-oretical magnetic field distribution, respectively. Minimal am-plitude lines were observed along the direction in both mea-sured and theoretical magnetic field distributions correspondingto the direction of the dipole electrode. The difference in loca-tion between expected and estimated dipole was 6.1 mm in ,
6.0 mm in , and 0.2 mm in the direction. The -value forthis localization was 97.9%.
From the results using the atomic magnetometer, we considerthat the g-value of 97.9% is large enough as measured one. Itindicates that we are able to reconstruct magnetic field distribu-tions with a good accuracy for real biomagnetic applications.

3638 IEEE TRANSACTIONS ON MAGNETICS, VOL. 46, NO. 9, SEPTEMBER 2010
Fig. 7. (a) Measured and (b) theoretical magnetic field distributions on a sensorplane generated from the phantom. Upper and lower show views from backsideand backside left, respectively. The data were obtained by 102 magnetometers.
Fig. 8. (a) Measured and (b) theoretical magnetic field distributions generatedfrom the phantom. The phantom was scanned with a grid interval of 5 mm. Theamplitude is calibrated by the signal from a pair of test coils and plotted as theabsolute value.
Next, we tried to examine the vector nature of our atomicmagnetometer under the current alignment of the phantom. Theatomic magnetometer was sensitive to magnetic signals alongboth and axes, whereas the phantom produced the magneticsignals mainly along and axis. As expected, we could con-firm that the measured field distributions reflected the signalsonly along axis.
The present noise level at low-frequency range was limitedmainly by hot-air flowing along the optical path and/or laserfluctuation in our magnetometer system. After reducing thesenoises including noise by using spin-modulation techniques[10] or by improving heating method in the near future, weneed to consider next how to eliminate the magnetic noise fromthermal electrons in -metal magnetic shields placed around themagnetometer [11]. One of solutions is to increase an electroresistivity of shielding materials [12]. Ferrite magnetic shieldsmay be a possible choice to reduce the thermal noise [13]. An-other is to increase distance between the magnetometer andthe shielding materials. For biomagnetic measurements such as
MEG and MCG in human subjects, a large-scale shielding boxor room would be required and may reduce the thermal noisefrom the shielding materials.
IV. CONCLUSION
We developed a SERF optically pumped potassium atomicmagnetometer with the sensitivity of 10–100 fT/Hz . Byscanning a phantom modeling the human head, the magneticfield distributions could be successfully measured with asingle sensor. The measured field distributions by the phantomshowed good agreement with theoretical calculations. Theseresults demonstrate suitability of our newly developed atomicmagnetometer for biomagnetic field measurements.
ACKNOWLEDGMENT
This work was supported in part by the InnovativeTechno-Hub for Integrated Medical Bio-imaging Projectof the Special Coordination Funds for Promoting Science andTechnology, from the Ministry of Education, Culture, Sports,Science and Technology (MEXT), Japan.
REFERENCES
[1] M. Hämäläinen, R. Hari, R. J. Ilmoniemi, J. Knuutila, and O. V.Lounasmaa, “Magnetoencephalography—Theory, instrumentation,and applications to noninvasive studies of the working human brain,”Rev. Mod. Phys., vol. 65, no. 2, pp. 413–497, 1993.
[2] D. Budker, D. F. Kimball, S. M. Rochester, V. V. Yashchuk, and M.Zolotore, “Sensitive magnetometry based on nonlinear magneto-op-tical rotation,” Phys. Rev. A, vol. 62, p. 043403, 2000.
[3] S. Groeger, G. Bison, J.-L. Schenker, R. Wynands, and A. Weis, “Ahigh-sensitivity laser-pumped Mx magnetometer,” Eur. Phys. J. D, vol.38, pp. 239–247, 2006.
[4] D. Budker and M. V. Romalis, “Optical magnetometry,” Nature Phys.,vol. 3, pp. 227–234, 2007.
[5] I. K. Kominis, T. W. Kornack, J. C. Allred, and M. V. Romalis, “Asubfemtotesla multichannel atomic magnetometer,” Nature, vol. 422,pp. 596–599, 2003.
[6] H. Xia, A. B. A. Baranga, D. Hoffman, and M. V. Romalis, “Magne-toencephalography with an atomic magnetometer,” Appl. Phys. Lett.,vol. 89, p. 211104, 2006.
[7] G. Bison, R. Wynands, and A. Weis, “Dynamical mapping of thehuman cardiomagnetic field with a room-temperature, laser-opticalsensor,” Opt. Exp., vol. 11, no. 8, pp. 904–909, 2003.
[8] B. Lindseth, P. Schwindt, J. Kitching, D. Fischer, and V. Shusterman,“Non-contact measurement of cardiac electromagnetic field in mice byuse of a microfabricated atomic magnetometer,” Comput. Cardiol., vol.34, pp. 443–446, 2007.
[9] J. Sarvas, “Basic mathematical and electromagnetic concepts of thebiomagnetic inverse problem,” Phys. Med. Biol., vol. 32, no. 1, pp.11–22, 1987.
[10] Z. Li, R. T. Wakai, and T. G. Walker, “Parametric modulation of anatomic magnetometer,” Appl. Phys. Lett., vol. 89, p. 134105, 2006.
[11] J. Nenonen, J. Montenen, and T. Katila, “Thermal noise in biomagneticmeasurements,” Rev. Sci. Instrum., vol. 67, no. 6, pp. 2397–2405, 1996.
[12] M. Romalis, T. Kornack, J. Allred, and R. Lyman, “High sensitivityatomic magnetometer and methods for using same,” U.S. Patent7 145 333 B2, Dec. 5, 2006.
[13] T. W. Kornack, S. J. Smullin, S.-K. Lee, and M. V. Romalis, “A low-noise ferrite magnetic shield,” Appl. Phys. Lett., vol. 90, p. 223501,2007.