development of a graduation prediction...
TRANSCRIPT

DEVELOPMENTOFA GRADUATIONPREDICTIONSCALEFORU .S ARMY
CANDIDATESATTENDINGEODSCHOOL
PREPAREDBYDR. EDWINA . BUNDYANDDR. BRANTONSHEARER
APRIL 2012

2
TABLEOFCONTENTS
ListofTables..............................................................................................................................................................................3
DevelopmentofaGraduationPredictionScaleforU.SArmyCandidatesAttendingEODSchool.........4
ExecutiveSummary...........................................................................................................................................................4
EODCandidatesDescription..........................................................................................................................................5
Assessments..........................................................................................................................................................................5
DataAnalysis........................................................................................................................................................................5
InitialFindings.....................................................................................................................................................................6
PhaseOne:ComparingGraduatesandNon‐Graduates......................................................................................6
LSIScales...........................................................................................................................................................................6
MIDASScales....................................................................................................................................................................6
GPSScaleDevelopment...............................................................................................................................................8
PhaseTwo:TestingtheValidityoftheGPSScore.................................................................................................9
Results........................................................................................................................................................................................10
Discussion.................................................................................................................................................................................13
InterpretingtheGPSScoreforEODSelectionDecisionMaking...................................................................13
GPS76%astheVeryHighPotentialcut‐point…22%reducedattrition...............................................14
GPS65%astheHighPotentialcut‐point…12%reducedattrition.........................................................14
GPS60%astheGoodPotentialcut‐point…8%reducedattrition...........................................................14
CandidateSelection:AProcessofTriangulation......................................................................................................15
Nextsteps.............................................................................................................................................................................15
LimitationsandRecommendations..........................................................................................................................15
References................................................................................................................................................................................17
Appendix1: TheMIDAS:MainScales,IntellectualStyleandSubscales....................................................18
IntellectualStyle....................................................................................................................................................................20
Appendix2:TotalSampleCandidatesDescriptiveStatistics,N=983..............................................................21
Appendix3: LogisticRegression................................................................................................................................23
Appendix4: GPSInterpretationbyEducationLevel.........................................................................................24

3
LISTOFTABLES
Table1. MIDASScales:Graduatesvs.Non‐Graduates,T‐tests.........................................................................7 Table2. EducationLevels:Graduatesvs.Non‐Graduates..................................................................................7 Table3. FiveMIDASScalesandEducationLevelComprisingGPSEquation.............................................8 Table4. GPSvalues:Graduatesvs.Non‐Graduates..............................................................................................8 Table5. Phase1:BinaryLogisticalRegressionClassificationTable.............................................................9 Table6. MIDASMainScalesComparisonsAmongCandidates......................................................................10 Table7. GroupComparisonAmongIntellectualStyleScale...........................................................................11 Table8. GroupComparisonsAmongSubscaleswithSignificantDifferences.........................................11 Table9. GPSScore.Graduatesvs.Non‐Graduates,FinalSample..................................................................12 Table10. AllGraduationData:BinaryLogisticalRegressionClassification............................................12 Table11. MIDASMainScaleMeanScores..............................................................................................................21 Table12. IntellectualStyleMeanScaleScores.....................................................................................................21 Table13. SubscalesMeanScores...............................................................................................................................22 Table14. OmnibusTestsofModelCoefficients...................................................................................................23 Table15. ModelSummary............................................................................................................................................23 Table16. ClassificationTable......................................................................................................................................23 Table17. LogisticRegressionEquationVariables..............................................................................................23 Table18. AllEducationLevels....................................................................................................................................24 Table19. HighSchoolEducation................................................................................................................................24 Table20. ACT–Associates–Certification–TechnicalEducation,N=117..............................................24 Table21. AdvancedEducation:BSandabove......................................................................................................25

4
DEVELOPMENTOFAGRADUATIONPREDICTIONSCALEFORU.SARMYCANDIDATESATTENDINGEODSCHOOL
EXECUTIVESUMMARY
ThispaperdescribestheresultsofaseriesofstudiesinthedevelopmentandvalidationofascaletopredictsuccessfulgraduationofArmycandidatesfromtheU.S.NavyExplosiveOrdnanceDisposal(EOD)trainingprogram.PreviousresearchfoundthatEODpractitionershaveauniqueprofileofabilitiesnotassessedbystandardcognitiveandaptitudetests.UseofthesetestsaloneresultsinasubstantialnumberofEODcandidatesintrainingwhofailtograduate(20%–45%).TheMultipleIntelligencesDevelopmentalAssessmentScales(MIDAS™)isauniqueself‐reportthatdescribesaperson’sskillsandabilitiesineightdistinctintelligencesthathaveadirectrelationshiptotheEODprofession.TheMIDASwasadministeredto983EODcandidatesandthescaleswerecorrelatedwithgraduationstatus.Fivescaleswerefoundtohavesignificantcorrelationtograduationstatus.ThesescaleswerecombinedintoaGraduationPredictionScale(GPS)thatwasabletopredictwithinanacceptablelevelofaccuracythegraduationstatusofnearly42%‐80% (m=66%)oftrainingcandidates.ThenextstepistoconductfieldstudiesoftheMIDAS‐GPStodeterminehowwelladmissionspersonnelareabletointegratetheGPSscoreintotheiradmissionsdecision‐makingprocedures.
TheneedforqualifiedEODtechnicianshasrisendramaticallysincetheuseofimprovisedexplosivedevices(IEDs)hasbecomethefavoredweaponofterroristsandinsurgents.Inturn,thishasincreasedthenumberofcandidatesbeingadmittedtoEODtrainingprogramsacrosstheServices.EventhoughattritionratesfromtheEODtrainingprogramhashistoricallybeenhighduetothenatureofthetraining,theneedtoincreasethethroughputofstudentsinthetrainingpipelinehasalsoresultedinanincreaseinpercentageofEODcandidateswhofailtograduate.Thisresultsinseveralundesirableconsequences,toinclude1)alessthanefficientuseofthesponsoringorganizationsfinancialresources;2)alossoftrainingseatsthatcouldbefilledbysuccessfulcandidates;and3)disappointmentandamisuseoftheEODcandidate’stimeandtalentsthatcouldbedevotedtoacareerpathbettermatchedwithhisorherskillsandabilities.
AllapplicantstoEODtrainingprogramsareadministeredtheASVABasascreeninginstrumentofcognitiveabilityandskills,butrecentdatashowsthatdespiteitsuse,thereisbetweena20%to45%attritionrateinEODprograms.Previousresearch(BundyandSims,2007)demonstratedthatpracticingEODtechnicianspossessauniqueprofileofabilitiesnotassessedbystandardcognitiveandskillstests,specifically,intrapersonalintelligence,visual‐spatialintelligence,leadershipskillsandgenerallogic.Theresearchdescribedherehasinvestigatedwhetherornottheseuniqueabilitiescanbesuccessfullymeasuredtopredictwithinanacceptablemarginoferroranapplicant’slikelihoodofgraduationfromEODtraining.
ToinvestigatethisquestionwiththegoalofimprovingthenumberofEODcandidateswhosuccessfullygraduate,twoself‐reportassessmentswereadministeredto983candidatesadmittedtotheArmyEODtrainingprogramsattwositesfromawidevarietyofstates,includingPuertoRico.Attheendofthetraining,programadministratorsreportedbacktotheresearcherswhich

5
candidatessuccessfullygraduated,andwhichdidnot.Graduationstatusdatawasreportedbythevarioussitesoverthecourseofayear.
EODCANDIDATESDESCRIPTION
Ofthe983totalCandidates,5%(N=44)arefemaleandtheremaining95%(N=937)aremale.Themeanageofthesampleis24.3yearswithaminimumof18andamaximumof47.Themeanageformaleswas23.6and24.6forfemales.Sixty‐fourpercent(634)areinitialMOSand28%(272)arecurrentservicepersonnelrequestingReclassificationand7%(N=67)havepriormilitaryservice.Sixty‐fivepercent(N=629)haveahighschooldegreeorGEDand10%(N=95)aTechnicalCertification,9%(N=92)haveanAssociatesdegreeand16%(N=161)haveaBSorotheradvanceddegree.
ASSESSMENTS
TwoinstrumentswereadministeredtoallEODCandidatesattheonsetoftheirtraining,TheMultipleIntelligencesDevelopmentalAssessmentScales(MIDAS™)andtheCanfieldLearningStyleInventory(LSI).TheMIDASconsistsofeightmainscales,threeintellectualstylescalesand29subscales.TheLSIconsistsof17scalesthatdescribeaperson’slearningpreferencesandattitudesuchasExpectationforSuccess,WorkingwithPeers/Independently,ReadingandWorkingLogically.SeeAppendix1fordetails.
DATAANALYSIS
TrainingsitesprovideddataonCandidates’graduationstatusduringthecourseoftheyearandtheseresultswereconsolidatedintothreedata‐setsofgraduatesandnon‐graduates.Non‐graduategroupswerecomprisedofcandidateswhowereterminatedfromtrainingduetoacademicdeficiencies,andthefinalsampleof671studentsconsistedof422Graduatesand249Non‐Graduates.Three‐hundredandtwelvecandidatesweredismissedforotherreasonsortheprogramfailedtoreporttheirfinalstatusduringthetimeframeforthisstudy.
Fourquestionswereinvestigatedinsequence:
1) DoesthepopulationsampledhavecharacteristicsassociatedwithsuccessfulEODpractitioners?
2) DosuccessfulEODSchoolgraduateshavesignificantlydifferentintellectualprofilesfromnon‐graduates?
3) CanaGraduationPredictionScale(GPS)scorebederivedfromtheidentifiedscalesthatdifferentiatesuccessfulgraduatesfromnon‐graduates?
4) CanGPSvaluesbecalibratedsoastodifferentiatebetweenseveraltypesofEODapplicantswithinacceptablemarginsoferror,e.g.,High‐Potential,Good‐Potential,At‐Risk,andLow‐Potential.

6
INITIALFINDINGS
InitialdatadeterminedthatthehighestMIDASscalesforbothexperiencedEODpractitionersandEODtrainingcandidateswereverywellalignedwiththeskillsandabilitiesmostassociatedwithsuccessfulEODtechnicians(Appendix2).Theirfourhighestmainscalesareallinthehighrange:Intrapersonal(64%),Spatial(62%),Interpersonal(60%)andLogical‐mathematical(60%).FiveofthetoptensubscalesarethesameforbothEODpractitionersandcandidates:spatialawareness,self‐knowledge,problem‐solving,athletics,workingwithobjectsandmanagement.
TheLSIresultsindicatethatalargenumberoftheEODcandidateshavealearning‐stylepersonalitytypeofConceptual(N=399),Neutral(N=266)orIndependent(N=117).TheirtoplearningpreferencesareReading,Qualitative,Competitive,Listening,Independence,PeopleandAuthority.
DuringPhaseOnedataanalysis,thefirstbatchofGraduatesandNon‐GraduateswerecomparedtodetermineiftheirMIscalesdifferinanysignificantwaythatmightbeusefultoidentifyapplicantstoEODtrainingwithahighpotentialforsuccess.PhaseTworepeatedtheseanalyseswiththefinaltotalsampleprovidedbytrainingprogrammanagers.
PHASEONE:COMPARINGGRADUATESANDNON‐GRADUATES
PhaseOnesampleiscomprisedof190Graduatesand134Non‐Graduates.Thereare11females(3%)and313males(97%).ThemeanageforGraduateswas25.3and23.7yearsforNon‐Graduates(p<.00).Sixty‐sixpercent(N=214)haveahighschooldegree,while20%(N=65)haveanAssociates,CertificateorTechnicaldegreeand13%(N=41)haveaBSdegreeorhigher.
LSISCALES
OnlytwooftheLSIscalesdifferentiatedbetweenGraduatesandNon‐Graduatesatlevelsapproachingsignificance,Qualitative(18vs.19,p<.00)andReading(17vs.18,p<.09).BecausethesedifferencesaresosmallandnotdirectlypertinenttothetasksofEODprofessionals,itwasdecidedtofocusresearchattentionontheMIDASscalesaspotentiallyviableindicatorsforpredictinggraduationsuccess.
MIDASSCALES
TheMIDASmain,styleandsubscaleswereexaminedinsequence. MeanmainscaledifferencesbetweenGraduatesandNon‐Graduatesweresmall,rangingfrom1–2%pointsforsixoftheeightscales.TheonlytwoscalesthataresignificantlydifferentareMusicalwhichhasthelargestdifferenceof6%(p<.01)andIntrapersonal3%(p<.01).Thesesmalldifferencesindicatethatthetwogroupsarecloselymatched,exceptthatGraduateshavehigheroverallself‐understanding(64%vs.61%)andNon‐GraduateshavemorehighlydevelopedMusicalabilities(49%vs.43%).
Giventhesesmallmainscaledifferences,itisnecessarytoexaminetheintellectualstylescalesandsubscales.Graduatesscoresignificantlyhigherat65%versus62%forNon‐Graduates(p<.058)ontheGeneralLogicintellectualstylescale. TheGeneralLogicscaleisaequatedwithcommonsenseproblemsolvingformechanical‐typeandsocialproblemsineverydaylife(Shearer,2007)

7
MIDASsubscalesareindicatorsofspecificskillswithineachofthemaineightareas.Forexample,CalculationsandEverydayProblemSolvingaresubscalesfortheLogical‐mathematicalmainscale.ThereareeightsubscaleswithdifferencesbetweenGraduatesandNon‐Graduatesthataretheoreticallymeaningfulandstatisticallysignificantorapproachingsignificance.Graduatesarehigheronsixscales(PersonalKnowledge,Persuasion,Writing,SpatialAwarenessandProblem‐SolvingandScience).Non‐GraduatesarehigherontheMusicalAppreciationandComposingsubscales.SeeTable1below.
TABLE1. MIDASSCALES:GRADUATESVS.NON‐GRADUATES,T‐TESTS
Scale Graduates Non‐Grads sig.Musical 43% 49% .01MusicalAppreciation
57% 64% .00
ComposingMusic
29% 36% .02
Intrapersonal 64% 61% .01GeneralLogic 65% 62% .05PersonalKnowledge
70% 64% .00
Persuasion 66% 61% .02SpatialProblemSolving
70% 66% .02
SpatialAwareness
69% 65% .10
Writing/Reading 57% 54% .13
Science 60% 56% .13Note: Graduates,n=190;Non‐Graduates,n=134
ItwasalsofoundthattheEducationlevelofthecandidatewassignificantlycorrelatedwithgraduationstatus(p<.03)asdeterminedbyPearsonChi‐Square,PhiandCramer’sVtests.Thereisanincreasedgraduationrateforcandidateswithhigherlevelsofeducation.SeeTable2.
TABLE2. EDUCATIONLEVELS:GRADUATESVS.NON‐GRADUATES
EducationLevel NonGrad Graduated Total %Grad HS/GED 99 115 214 54% Tech‐Cert 14 17 31 41% Associates 11 23 34 68% BSorAdv 10 31 41 76%
Total 134 186 320 58%Note: Graduates,n=190;Non‐Graduates,n=134;missingdata,n=4.

8
ThenextseveralstepsinPhaseOneanalysesinvolvedthecreationofaGraduationPredictionScale(GPS)usingthescalesthatbestdifferentiatedGraduatesfromNon‐Graduates.
GPSSCALEDEVELOPMENT
Basedontheaboveresults,twodifferentversionsofaGPSscaleforMIDASwerecreated;alongandshortversion.ThelongversionconsistedofeightMIDASscales,pluseducationlevel.Theshortversionincludedonlyfivescales,plusEducationlevel.SeeTable3.
BothversionsweretestedusingBinaryLogisticRegression.ThelongGPScorrectlypredicted68%ofgraduateswhiletheshortGPSpredicted67%.Giventhesesmalldifferencesincorrectpredictionsandeaseofuseinpractice,itwasdecidedtoproceedwithdevelopmentandvalidationoftheshortversionoftheGPSscale.
Usinganequationderivedfromtheregressionanalyses,thefivesubscalesandeducationwereweightedandcalculatedtoproduceaGPSscalescorewithameanof60%,withaStandardDeviation(SD)of15%.SuccessfulGraduates’meanscorewas62%,SD14,whileNon‐Graduates’meanwas52%,SD14(p<.00).SeeTable4.
TABLE3. FIVEMIDASSCALESANDEDUCATIONLEVELCOMPRISINGGPSEQUATION
Scale Education Level Music Appreciation Writing/Reading Spatial Problem Solving Personal Knowledge General Logic Constant
B S.E. Wald Df Sig. Exp(B) .206 .114 3.251 1 .071 1.229
-.018 .006 9.732 1 .002 .982.009 .007 1.858 1 .173 1.009.019 .009 4.726 1 .030 1.019.031 .011 7.742 1 .005 1.031
-.022 .016 2.057 1 .151 .978-1.142 .669 2.909 1 .088 .319
TABLE4. GPSVALUES:GRADUATESVS.NON‐GRADUATES
Graduation Potential Score Mean Std. Deviation Std. Error Mean NonGrad 52.25 15.212 1.314 Graduated 62.04 14.428 1.058 All 60% 14.
Note: Graduates, n= 186; Non-Graduates, n= 134 Usingacutvalue(orcutoffscore)of.50,theGPSscorecorrectlypredictedgraduationstatusof67%ofallCandidates.Eightypercent(80%)ofsuccessfulgraduateswerecorrectlypredicted,while49%ofNon‐Graduateswerecorrectlyclassified.Inotherwords,ofthe134Non‐Graduatestherewere64FalsePositives(51%)wheretheGPSincorrectlypredictedthattheywouldgraduate.Ofthe186successfulGraduates,therewere37(20%)FalseNegativeswheretheGPSincorrectlypredictedthattheywouldnotgraduate.SeeTable5.

9
TABLE5. PHASE1:BINARYLOGISTICALREGRESSIONCLASSIFICATIONTABLE
Observed
Predicted
Graduation Status Percentage Correct NonGrad Graduated
Graduation Status
Non-Grads 64 70 49.0
Grads 37 149 80.0
Overall Percentage 67.2 Note: Cut value .50 Next,theGPSscaledevelopmentwastestedforaccuracyinpredictingsuccessfulgraduationusingthefinaltotalsampleofsuccessfulGraduatesandNon‐Graduates.
PHASETWO:TESTINGTHEVALIDITYOFTHEGPSSCORE
ArmyPhaseIIEODSchooltrainingstaffprovidedadditionaldataonCandidates’graduationstatusapproximatelyninemonthsaftertheprojectwasinitiated.Anadditional450candidatesalreadyinthedatabasewereidentifiedaseitherGraduatedorNon‐Graduatedforafinaltotalsampleof671(424Graduatesand247Non‐Graduates);30females(5%)and639males.Themeanageis24years(females,25;males,24).ThemeanageofGraduatesis24.6andNon‐Graduatesis23.6(p<.00).Sixty‐sixpercent(N=442)haveaGEDorhighschooldegreewhile19%haveanAssociate’sdegreeorTechnicalCertification.Fourteenpercent(N=95)haveaBSorotheradvanceddegree.Sixty‐fourpercentareinitialMOScandidates,while35%havepreviousmilitaryservice.Thereare312othercandidateswithmissinginformationorwhoweredismissedforreasonsotherthanacademicperformance.
10
RESULTS
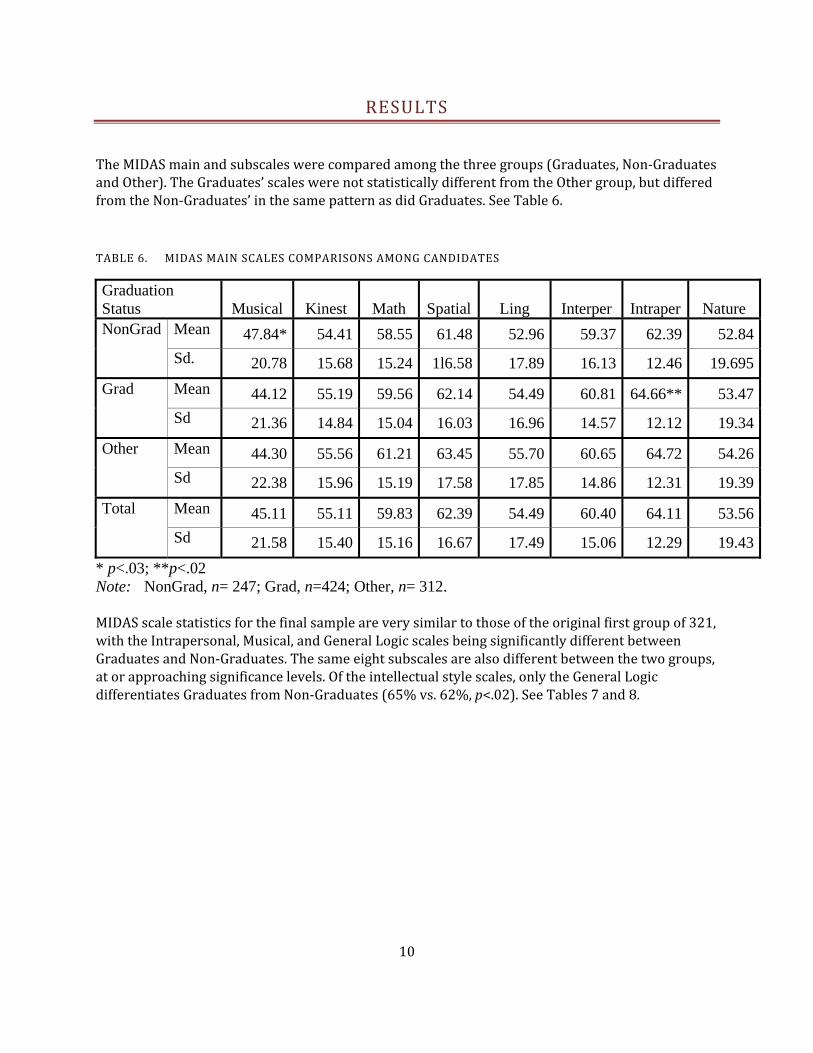
TheMIDASmainandsubscaleswerecomparedamongthethreegroups(Graduates,Non‐GraduatesandOther).TheGraduates’scaleswerenotstatisticallydifferentfromtheOthergroup,butdifferedfromtheNon‐Graduates’inthesamepatternasdidGraduates.SeeTable6.
TABLE6. MIDASMAINSCALESCOMPARISONSAMONGCANDIDATES
Graduation Status Musical Kinest Math Spatial Ling Interper Intraper Nature NonGrad
Mean 47.84* 54.41 58.55 61.48 52.96 59.37 62.39 52.84
Sd. 20.78 15.68 15.24 1l6.58 17.89 16.13 12.46 19.695
Grad
Mean 44.12 55.19 59.56 62.14 54.49 60.81 64.66** 53.47
Sd 21.36 14.84 15.04 16.03 16.96 14.57 12.12 19.34
Other
Mean 44.30 55.56 61.21 63.45 55.70 60.65 64.72 54.26
Sd 22.38 15.96 15.19 17.58 17.85 14.86 12.31 19.39
Total
Mean 45.11 55.11 59.83 62.39 54.49 60.40 64.11 53.56
Sd 21.58 15.40 15.16 16.67 17.49 15.06 12.29 19.43
* p<.03; **p<.02 Note: NonGrad, n= 247; Grad, n=424; Other, n= 312. MIDASscalestatisticsforthefinalsampleareverysimilartothoseoftheoriginalfirstgroupof321,withtheIntrapersonal,Musical,andGeneralLogicscalesbeingsignificantlydifferentbetweenGraduatesandNon‐Graduates.Thesameeightsubscalesarealsodifferentbetweenthetwogroups,atorapproachingsignificancelevels.Oftheintellectualstylescales,onlytheGeneralLogicdifferentiatesGraduatesfromNon‐Graduates(65%vs.62%,p<.02).SeeTables7and8.

11
TABLE7. GROUPCOMPARISONAMONGINTELLECTUALSTYLESCALE
Graduation Status Leadership General Logic Innovation
Non-Grads Mean 57.67 62.90 50.50 Sd 15.08 13.86 15.55
Grads Mean 59.04 65.41** 49.79 Sd 14.38 13.44 14.90
Other Mean 58.91 65.45 51.80 Sd 14.97 13.20 16.39
Total Mean 58.66 64.79 50.61 Sd 14.74 13.51 15.56
**p<.02 Note: Non-Graduate, n= 247; Graduates, n=424; Other, n= 312
TABLE8. GROUPCOMPARISONSAMONGSUBSCALESWITHSIGNIFICANTDIFFERENCES
Graduation Status
Scales
Music Appreciation Composing Persuasive
Personal Knowledge
Writing/ Reading
Working with
People NonGrad
Mean 62.24* 35.12* 62.69 64.47 53.42 55.50 Sd 22.85 26.67 20.14 16.71 22.45 22.18
Grad
Mean 58.11 29.92 66.58* 70.17* 57.18* 59.02* Sd 23.53 26.23 18.70 15.43 22.13 18.84
Other
Mean 56.89 32.89 67.34 67.80 55.84 56.12 Sd 25.12 27.60 18.43 15.83 22.23 20.83
Total
Mean 58.76 32.17 65.84 67.99 55.81 57.21 Sd 23.95 26.84 19.06 16.03 22.27 20.40
*p<.05 Note: Non-Graduates, n= 247; Graduates, n=424; Other, n= 312. ThemeanGPSscorefortheGradandNon‐Gradgroupscombinedwas61.5%.Graduates’meanscorewas62.7%andNon‐Graduateswas53.9%. This9%differencewassignificantatthe.00level.ThesestatisticsforthecombinedgroupsofGraduatesandNon‐GraduatesareverysimilartothoseobtainedwiththePhase1groupindependently.ThemaindifferencebeingthatNon‐GraduatesforthefinalsamplehaveasomewhathighermeanGPSscore(54%vs.52%)thanthefirstgroupofNon‐Graduates.SeeTable9.

12
TABLE9. GPSSCORE.GRADUATESVS.NON‐GRADUATES,FINALSAMPLE
Graduation GPS Mean
Std. Deviation Std. Error Mean
Non-Grad 53.93 15.45 1.104 Graduates 62.75* 15.33 .839
* p<.00 Note: Phase 2: Non-Graduates, n= 247; Graduates, n= 424. Usingthecutvalueof.55,theGPSscorecorrectlypredictedgraduationstatusof66.5%ofallcandidates.Eighty‐onepercent(81%)ofsuccessfulgraduateswerecorrectlypredicted,while42.2%ofNon‐Graduateswerecorrectlypredicted.SeeAppendix3fordetails.
TABLE10. ALLGRADUATIONDATA:BINARYLOGISTICALREGRESSIONCLASSIFICATION
Observed Predicted
Non-Grads Grads Percentage
Correct Non-Grads 105 144 42.2
Grads 79 338 81.1 Overall Percentage 66.5
Note: Cut value = .55

13
DISCUSSION
ThisresearchdeterminedthatsuccessfulgraduatesfromEODtraininghaveuniqueandmeasurabledifferencesintheirmultipleintelligencesskillsandabilities.Thesedifferencesarebothstatisticallysignificantandmeaningful.ThescalesthatarehigherforsuccessfulgraduatesareconsistentwiththeskillsneededtoperformeffectivelyasanEODpractitioner:self‐understanding,visual‐spatialproblem‐solving,generallogic(commonsense),reading/writingandleadershipskills.Anunexpectedfindingwasthatnon‐graduatesdisplayedhighermusicalappreciationandexpectationsforsuccess.
ThesecondfindingofthisresearchsuccessfullytestedaprototypeofaGraduationPredictionScale(GPS)derivedfromacombinationofMIDASsubscales.TheGPSscalewasabletodifferentiatebetweenGraduatesandNon‐Graduatesatlevelsofsignificance.Dependingonthecutscoresemployed,theGPScansuccessfullypredictGraduationstatusonaverage66%ofthetime.Ofcourse,thisisforasampleofadmittedEODCandidatesalreadypre‐selectedfromamonganarrayofapplicants.AtpresentitisnotpossibletoknowhowwelltheGPSscorewillpredictsuccessfulgraduationofunscreenedapplicants,andfieldtests,orpilotprogramswillbenecessarytodetermineeffectivenesswithrespecttounscreenedapplicants.
However,theMIDAS‐GPShasgreatpotentialtoaddincrementalvaliditytotheexistingsystemofselectingcandidatesforEODtraining.ThegoaloftheMIDAS‐GPSisnottoserveasa“standalone”measuretodetermineanapplicant’sselection,rathertoaddinsightintotheapplicant’sinnateskillsandabilitiesthatarenotreadilyapparentormadeotherwiseevidentbyexistingassessmentandselectionprocesses.ThepurposeoftheMIDAS‐GPSistoenhancetherecruitmentdecision‐makingprocessandsupportitwithinformationabouttheapplicant’s“fit”forEODtrainingascomparedtothecharacteristicsofsuccessfulEODpractitioners.Apotentialsecondarybenefitistoprovideanapplicantwithinformationabouthisorherownskillsandabilities,whichwillultimatelyguidehimorherintoatrainingprogramabletomaximizehisorherchancesforoverallsuccess.TheeffectiveemploymentofthesetwostrategiesshouldincreasethegraduationratefromEODtrainingwithoutadiminutionofqualitybyfittingtheCandidate’sskillswithjobrequirementsandthensupportingthetraineetomaximizehisorherchancesforsuccess.
INTERPRETINGTHEGPSSCOREFOREODSELECTIONDECISIONMAKING
Ofoursample's671EODcandidates,37%(N=247)failedtograduatewhile63%(N=424)graduated.TheseCandidateswereselectedusingtheASVABandinsomecasesaninterviewprocesswithacurrentEODpractitioner.WhentheGPSscoreisaddedtothedecisionmakingprocess,thenumberofcandidateswhowouldfailtograduateisreduced;theamountofreductiondependsuponthecutoffscoreusedtoguidedecisionmaking.Inshort,thehigherthecutscoreused,thegreaterthechancethatacandidatewill,indeed,graduate.Thedownsidehowever,isthatfewercandidates,ascomparedtonumbersofthoseselectedusingcurrentapproaches,willbeselectedfortrainingbecausemoreapplicantswillbe“screenedout.”Inotherwords,ifyouonlyacceptapplicantswithVeryHighPotentialtograduate,youwouldloseasignificantnumberofcandidateswhowouldhavepotentiallygraduated,despitehavingbeenidentifiedasbeingintheHighorGoodPotentialranges.Severalexamplesillustratehowthiswouldworkforourexistingdata.

14
GPS76%ASTHEVERYHIGHPOTENTIALCUT‐POINT…22%REDUCEDATTRITION
Forthepopulationstudied,additionoftheMIDAS‐GPStothedecisionmakingprocesscouldhavereducedattritionto15%byselectingonlythosecandidateswhoscoredintheVeryHighPotentialrange(above76%)oftheGPS.However,onlyninety‐eight(98)candidateswouldhavebeenadmittedascomparedtothe334whoactuallygraduated.
GPS65%ASTHEHIGHPOTENTIALCUT‐POINT…12%REDUCEDATTRITION
IftheGPSscorewereloweredto65%,theattritionratewouldbe25%.Atthiscutoffscore,greaternumbersofEODcandidateswouldbeadmittedtotraining(202vs.334),andinevitably,withmorecandidatesinthetrainingpipeline,moregraduate.
GPS60%ASTHEGOODPOTENTIALCUT‐POINT…8%REDUCEDATTRITION
IfaGPSscoreof60%wereusedtoselectCandidates,attritionwouldbereducedto29%.Again,evenmorecandidateswouldbeexpectedtograduatebecauseanevengreaternumberwouldbeadmitted(269vs.334).
Itshouldbereiteratedthatsimplylookingatnumbersofgraduatescanbedeceptive.Asstatedearlier,thelargerthenumberofcandidatesadmittedtotraining,regardlessofselectionprocess,thelargerthenumberofcandidateslikelytograduate.Graduatenumbersalonehowever,doesnotaddressotherareasofinterestforrecruitmentandretentionsuchasoverallsuitabilityfor,orpotentialforlongevityintheEODcareerfield.ByunderstandingtheintelligencecharacteristicsofthosealreadyintheEODcareerfield,andadmittingpotentialcandidateswhomostcloselymatchthosecharacteristics,younotonlyincreaseprobabilityofgraduationfromEODSchool,butyouincreasethelikelihoodofcontentmentwith,andretentioninthecareer.
Thatbeingsaid,theoverallefficacyofanyinstrumentforscreeningorassessmentandselectiondependsonanumberoffactorsbeyondtheaccuracyorprecisionoftheinstrumentbeingused.First,thereareindividualfactorsandcircumstancesinfluencingattritionthatcannotbepredictedaheadoftime,e.g.,illness,familialissues,orahostofothernon‐academicsituationsthataffectthestudent’sabilitytoretaininformationandfocusonacademicsuccess.Second,theneedfor,andpoolofavailableapplicantsatthetimeofselectionwillguidehowmuchtolerancethereisforhigherattritionrates,andultimatelywhichcutvaluewillbefeasibletoemploy.Forexample,ifdemandforgraduatesislow,butthepoolofapplicantsislarge,ahighercut‐valuemightbedesirableinanefforttograduateonlythemosthighlyqualifiedcandidates.Conversely,iftheapplicantpoolislowandthedemandforgraduatesishigh,alowercutvaluemightbejustifiableinordertoincreaseyield.Ultimately,anydecisionregardingwhatconstitutesanypoolofapplicants’suitabilityfortrainingisamatterofprofessionaljudgmentbypractitionersinthatdiscipline.Testsandassessmentsonlyservetoinformjudgment,andaremerely“tools”whoseefficacycanonlybemaximizedwhenusedbythoseknowledgeableandexperiencedintheiruse;simplypossessingasawandhammerdoesnotmakeoneacarpenter.

15
CANDIDATESELECTION:APROCESSOFTRIANGULATION
ThethreepointsthatcanbecalibratedtoselectEODCandidates:Academicskills–readingandmathscores,etc.,whichcanbedeterminedfromtheAFSVABorsimilartests;theMIDAS‐GPSwhichquantifiesIntrapersonal,GeneralLogic,Leadership,andVisual/Spatialproblem‐solving;andmotivation,whichisoftenexpressedasenthusiasm,willingnesstolearn,commitment,andeffort.Ofcoursethisinformationisbestidentifiedthroughperson‐to‐personinteractionwiththeindividual,whichisdonebyusingappropriatelycraftedquestionsduringastructuredinterviewformat.Thisprovidesamechanismtoensureconsistencyinassessinganapplicants’potential,andallowstheinterviewertoidentifyqualitativeindicatorsthatcanbeincludedintheinterviewer’snotesandannotatedintheapplicants’suitabilityreport.
Appendix4providesfourtablesthatillustratehowtheMIDAS‐GPSmaybeemployedtoinformthedecisionmakingprocess,andshowsthegraduationrateforagivenrangeofGPSscores. Thefirsttabledescribesthegraduationrateofallcandidatesatanunspecifiededucationlevel.Toincreasepredictiveaccuracyhowever,subsequenttablesandtheirdataarebrokenintothreeeducationlevelswhichcanbematchedtothecandidatesowneducationlevel.Theyareasfollow:HighSchool/GED;ACT(Associates,CertificationorTechnicaldegree);andAdvanced(BSandabove).
Forexample,ifanapplicanthasaGPSscoreof50%,andhiseducationlevelisunknown,thenthedatashowsanaveragepredictedgraduationrateof66%.IfthissameindividualhasaHighSchooleducation,theadjustedpredictivegraduationratedropsto53%.IftheapplicanthasanAssociate’sdegreetheadjustedpredictivegraduationrateincreasesto67%. Ifhehasabachelor’sdegreetheadjustedpredictivegraduationratedropsbackdownto57%.Itshouldbenotedthatthesepercentagesarebasedonrelativelysmallnumbersofcandidatesateacheducationlevel.Therefore,additionaldatawillbeneededtoensurethattheGPSiscalibratedproperlytoeducationlevelandaccuratelyreflectsacandidate’sgraduationpotential.
NEXTSTEPS
1) DevelopinstructionsforadministrationandinterpretationoftheMIDAS‐GPSforuseduringtherecruitment,interviewing,andselectionprocessesforEODcandidates
2) PilottheMIDAS‐GPSatoneortworecruitingstations,aswellasseveralIn‐Servicerecruitingoperations
3) InvestigatethepotentialneedfortwodifferentmethodsofcalculatingtheGPSscore;onefornewrecruitsandoneforthoserequestingreclassificationfromanotherMilitaryOccupationalSpecialty
4) DevelopguidelinesforthoseadministeringMIDASandinterpretingtheGPS,onimplicationsoftheGPSscoreandthefiveconstituentMIscales
LIMITATIONSANDRECOMMENDATIONS
TheMIDAS‐GPSshouldbeconsideredasonlyonepieceofinformationinthedecision‐makingprocess,anditmustbeunderstoodthatscoresmustbeviewedincombinationwithothersourcesofinformationifatruepictureoftheapplicant’ssuitabilityforEODtrainingistobeestablished.Tobeeffective,theMIDAS‐GPSneedstobecarefullyinsertedinthedecision‐makingprocessatapoint

16
whereitwillprovide“valueadded”informationalongwithothersourcesofdatasuchaseducation,ASVABscores,workhistory/priortraining,interviews,andmotivation/attitude.
TheMIDAS‐GPSalsoneedstobeadministeredtoapplicantsfromavarietyofculturalbackgroundsinordertoensureeliminationofanypotentialculturalbias.Inaddition,becausetheMIDAS‐GPSisaself‐reportinstrument,theresultsneedtobecarefullyreviewedandthevalidityoftheresultsestimatedthroughdialogwiththeapplicant.Ideally,theapplicantshouldbeprovidedanopportunitytoreviewandverifyhisorherprofilepriortoanydecisionismaderegardingacceptanceintotheEODtrainingprogram.
Finally,itwouldbebeneficialtocross‐validate,orcompareandcontrasttheresultsofthisstudy,whichfocusesonEODSchoolcandidates,withavarietyofindividualsfromothertrainingprograms.ItislikelythatifthisassessmentapproachisvalidforEODSchoolcandidates,thatitcouldbeusedforotherspecializedtrainingprogramsthatrequireindividualswithuniqueprofiles.

17
REFERENCES
Bundy, E. and Sims, R. (2007). Commonalities in an uncommon profession: Bomb disposal. In ICT: Providing choices for learners and learning. Proceedings ascilite, Singapore, 2007. http://www.ascilite.org.au/conferences/singapore07/procs/bundy.pdf Gardner, H. (1983 / 1999). Frames of mind: the theory of multiple intelligences. Basic Books, NY. Shearer, C. B. (2007). The MIDAS: Professional manual. (Rev. ed.). Kent, Ohio: MI Research and Consulting, Inc.

18
APPENDIX1: THEMIDAS:MAINSCALES,INTELLECTUALSTYLEANDSUBSCALES
Musical: To think in sounds, rhythms, melodies and rhymes. To be sensitive to pitch, rhythm, timbre and tone. To recognize, create and reproduce music by using an instrument or voice. Active listening and a strong connection between music and emotions.
Vocal Ability: a good voice for singing in tune and in harmony Instrumental Skill: skill and experience in playing a musical instrument Composer: makes up songs or poetry and has tunes on her mind Appreciation: actively enjoys listening to music of some kind
Kinesthetic: To think in movements and to use the body in skilled and complicated ways for expressive and goal directed activities. A sense of timing, coordination for whole body movement and the use of hands for manipulating objects.
Athletics: ability to move the whole body for physical activities such as balancing, coordination and sports Dexterity: to use the hands with dexterity and skill for detailed activities and expressive moment
Logical-Mathematical: To think of cause and effect connections and to understand relationships among actions, objects or ideas. To calculate, quantify or consider propositions and perform complex mathematical or logical operations. It involves inductive and deductive reasoning skills as well as critical and creative problem-solving.
Everyday Math: to use math effectively in everyday life School Math: to perform well in math at school Everyday Problem Solving: able to use logical reasoning to solve everyday problems, curiosity Strategy Games: good at games of skill and strategy
Spatial: To think in pictures and to perceive the visual world accurately. To think in three-dimensions and to transform one's perceptions and re-create aspects of one's visual experience via imagination. To work with objects effectively.

19
Space Awareness: to solve problems of spatial orientation and moving objects through space such as driving a car Artistic Design: to create artistic designs, drawings, paintings or other crafts Working with Objects: to make, build, fix, or assemble things
Linguistic: To think in words and to use language to express and understand complex meanings. Sensitivity to the meaning of words and order among words, sounds, rhythms, inflections. To reflect on the use of language in everyday life.
Expressive Sensitivity: skill in the use of words for expressive and practical purposes Rhetorical Skill: to use language effectively for interpersonal negotiation and persuasion Written-academic: to use words well in writing reports, letters, stories, verbal memory, reading / writing
Interpersonal: To think about and understand another person. To have empathy and recognize distinctions among people and to appreciate their perspectives with sensitivity to their motives, moods and intentions. It involves interacting effectively with one or more people in familiar, casual or working circumstances.
Social Sensitivity: sensitivity to and understanding of other people's moods, feelings and point of view Social Persuasion: ability for influencing other people Interpersonal Work: interest and skill for jobs involving working with people
Intrapersonal: To think about and understand one's self. To be aware of one's strengths and weaknesses and to plan effectively to achieve personal goals. Reflecting on and monitoring one's thoughts and feelings and regulating them effectively. The ability to monitor one's self in interpersonal relationships and to act with personal efficacy.
Personal Knowledge / Efficacy: awareness of one's own ideas, abilities; able to achieve personal goals Calculations: meta-cognition "thinking about thinking' involving numerical operations Spatial Problem Solving: self awareness to problem solve while moving self or objects through space Effectiveness: ability to relate oneself well to others and manage personal relationships

20
Naturalist: To understand the natural world including plants, animals and scientific studies. To recognize, name and classify individuals, species and ecological relationships. To interact effectively with living creatures/ discern patterns of life and natural forces.
Animal Care: skill for understanding animal behavior, needs, characteristics Plant Care: ability to work with plants, i.e., gardening, farming and horticulture Science: knowledge of natural living energy forces including cooking, weather and physics
INTELLECTUALSTYLE
LEADER- Leadership: To use language effectively to organize and solve interpersonal problems & goals. ____Communication ____Managerial skill ____Social adeptness Innovative: To work in artistic, divergent, imaginative ways. To improvise and create unique answers, arguments or solutions. General Logic: To deal with problems in an intuitive, rapid and perhaps unexpectedly accurate manner. To bring together a wide amount of information and to make it part of a general and effective plan of action. Canfield Learning Style Inventory: 17 scales Reading Qualitative Competitive Listening Independence Authority People Peer Goal setting
Numeric Instructor Iconic Detail Organization Inanimate Direct Experience Expectation for Success

21
APPENDIX2:TOTALSAMPLECANDIDATESDESCRIPTIVESTATISTICS,N=983
TABLE11. MIDASMAINSCALEMEANSCORES
MainScales Mean Sd
Intrapersonal 64.12 12.29
Spatial 62.40 16.67
Interpersonal 60.41 15.06
Logic‐Math 59.85 15.16
Kinesthetic 55.12 15.40
Linguistic 54.50 17.49
Naturalist 53.57 19.42
Musical 45.13 21.58
TABLE12. INTELLECTUALSTYLEMEANSCALESCORES
Style Mean Std.Deviation
GeneralLogic 64.81 13.55
Leadership 58.67 14.74
Innovative 50.61 15.55

22
TABLE13. SUBSCALESMEANSCORES
Subscale Mean Std. Deviation
Spatial Problem Solving 70.99 17.926
Spatial Awareness 70.30 19.206
Personal Knowledge 68.00 16.032
Problem Solving 67.39 20.072
Working with Objects 67.30 17.181
Athletics 66.88 20.596
Persuasion 65.85 19.058
School Math 63.25 25.806
Self Effectiveness 63.08 17.115
Management 62.69 18.247
Sensitivity to Others 59.56 18.340
Science 59.53 22.458
Rhetoric 59.49 18.580
Social Management 58.90 20.354
Musical Appreciation 58.77 23.942
Logic Games 57.70 18.082
Working with People 57.21 20.392
Animal Care 56.98 23.485
Calculations 56.48 21.511
Writing / Reading 55.83 22.271
Everyday Math 54.79 20.992
Art Design 53.60 23.402
Communication 52.05 19.180
Expressive Sensitivity 48.07 20.228
Dexterity 43.10 17.249
Plant Care 40.87 23.526
Vocal Music 35.18 27.519
Instrumental Music 34.07 29.835
Composing Music 32.19 26.835

23
APPENDIX3: LOGISTICREGRESSION
Logistic regression, also called a logit model, is used to model dichotomous outcome variables. In the logit model the log odds of the outcome is modeled as a linear combination of the predictor variables. For all calculations in our model, N=671 TABLE14. OMNIBUSTESTSOFMODELCOEFFICIENTS
Chi-square df Sig. Step 1 Step 51.222 7 .000 Block 51.222 7 .000 Model 51.222 7 .000
TABLE15. MODELSUMMARY
Step -2 Log
likelihood Cox & Snell R Square
Nagelkerke R Square
1 829.211(a) .074 .101
Note: Estimation terminated at iteration number 4 because parameter estimates changed by less than .001.
TABLE16. CLASSIFICATIONTABLE
Observed
Predicted
Non-Grads Grads Percentage
Correct Non-Grads 105 144 42.2 Grads 79 338 81.1
Overall Percentage 66.5
Note: Cut value = .550 TABLE17. LOGISTICREGRESSIONEQUATIONVARIABLES
B S.E. Wald df Sig. Exp(B)
General Logic Music Appreciate Composing Writing/Reading Persuasive Person Knowledge Education Constant
-.016 .010 2.592 1 .107 .984 -.005 .004 1.351 1 .245 .995
-.010 .004 7.098 1 .008 .990
.009 .005 4.073 1 .044 1.009
.006 .005 1.132 1 .287 1.006
.027 .008 11.977 1 .001 1.028
.232 .076 9.213 1 .002 1.261
-.700 .436 2.573 1 .109 .497

24
APPENDIX4: GPSINTERPRETATIONBYEDUCATIONLEVEL
TABLE18. ALLEDUCATIONLEVELS
GPS Range by Category
Graduation Rate
Graduation Status
NonGrad Grad Total Low 0 – 46% 44% 79 62 141
Moderate 47 – 60%
66%
62
118 180
High 61 – 74% 67% 61 124 185 Very High 75 – 100% 82% 22 99 121 36% 64% 100%
Note: N=627
TABLE19. HIGHSCHOOLEDUCATION
GPS Range by Category
Graduation Rate
Grad Status
NonGrad Grad Total Low 0 – 41% 43% 40 30 70
Moderate 42 – 54%
53%
70
79
149
High 55 – 74% 64% 61 107 168 Very High 75 – 100% 77% 7 24 31
43% 57% 100% Note: N=418
TABLE20. ACT–ASSOCIATES–CERTIFICATION–TECHNICALEDUCATION,N=117
GPS Range by Category
Graduation Rate
Grad_Status
NonGrad Grad Total Low 0 – 47% 38% 5 3 8
Moderate 48 – 66%
67%
16
33
49
High 67 – 74% 80% 5 20 25 Very High 75 – 100% 77% 8 27 35
29% 71% 100% Note: N=117

25
TABLE21. ADVANCEDEDUCATION:BSANDABOVE
GPS Range by Category
Graduation Rate
Grad_Status
NonGrad Grad Total Low 0 – 56% 57% 3 4 7
Moderate 57 – 69%
78%
4
14
18
High 70 – 79% 69% 11 24 35 Very High 80 – 100% 91% 2 21 23 24% 76% 100%
Note: N=83