development of a comprehensive, multimodal travel
TRANSCRIPT

Development of a Comprehensive, Multimodal Travel
Accessibility Index System at the Tax Parcel Level
David P. Racca
Center for Applied Demography and Survey
Research (CADSR)
University of Delaware
Graham Hall, Rm 284, Newark, Delaware 19716
Phone: (302) 831-1698
E-mail: [email protected]

Accessibility measures the ease of reaching
valued destinations
• Ease of reaching destinations here primarily means that
destinations are available in a proximity to a particular
location of interest on the map
• Proximity is evaluated by estimates of travel times by mode
from origins to the destinations.
• Ease of use also depends on features of available paths. The
paths between origins and destinations are the roads,
sidewalks, trails, bikeways and other paths provided by the
existing or proposed transportation or land use facilities.

Motivation For Determining a Accessibility
MeasureT
• Trip generation modeling - accessibility factors that can be
used with household based travel demand and behavior
data developed in trip surveys
• Prediction of travel mode split
• Estimating and predicting usage of pedestrian and bicycle
facilities. If trips performed by walking or biking are being
considered, one naturally expects that available
destinations in the locale will factor into an estimation of
expected trips.
• Understanding the effects of various land use
configurations

Victoria Transport Policy Institute, Todd Litman
“Evaluating Accessibilty for Transportation Planning”
Accessibility is defined as peoples’ ability to reach
desired goods, services, activities, and
destinations. Litman argues that improving
accessibility and reducing accessibility costs can
help achieve many economic, social and
environmental objectives and is the ultimate goal
of most transportation activity. Therefore
transportation planning and evaluation should be
based on accessibility rather than traffic-based
(vehicle movement) or mobility–based (people
and goods movement) which tend to favor
automobile transportation over other modes.
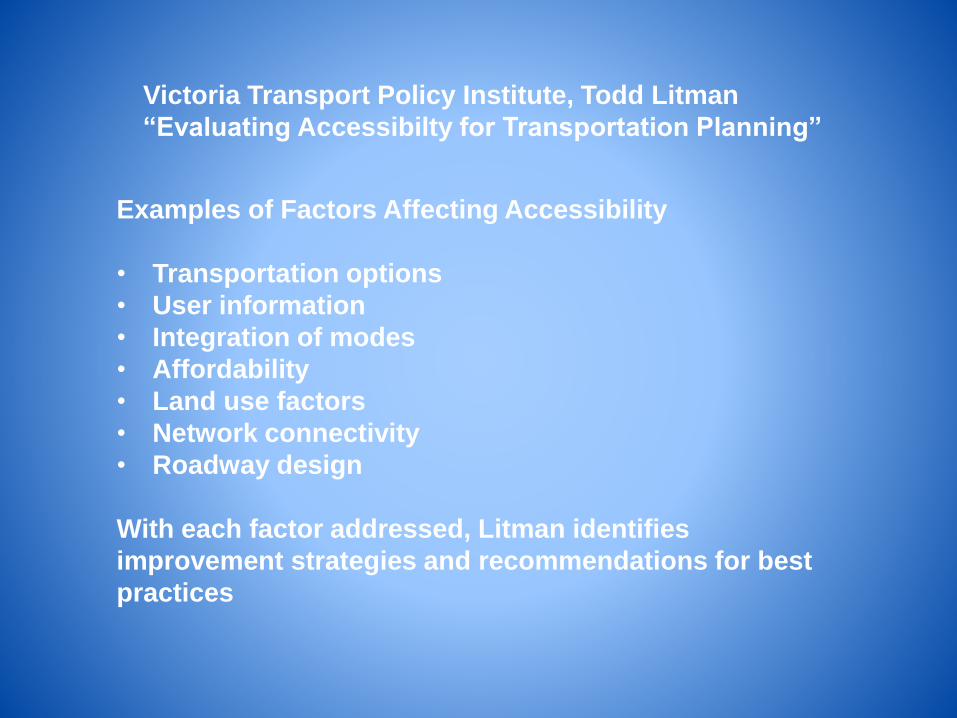
Victoria Transport Policy Institute, Todd Litman
“Evaluating Accessibilty for Transportation Planning”
Examples of Factors Affecting Accessibility
• Transportation options
• User information
• Integration of modes
• Affordability
• Land use factors
• Network connectivity
• Roadway design
With each factor addressed, Litman identifies
improvement strategies and recommendations for best
practices

“Low-Stress Bicycling and Network Connectivity” ,
Mineta Transportation InstituteReport 11-19, Maaza C. Mekuria, Peter G. Furth, Hilary Nixon, May 2012
When considering the suitability of an area
for bicycling or walking, any measure or
rating to account for that suitability needs
to include a way of examining and
classifying the types of access provided by
the path between origins and destinations.
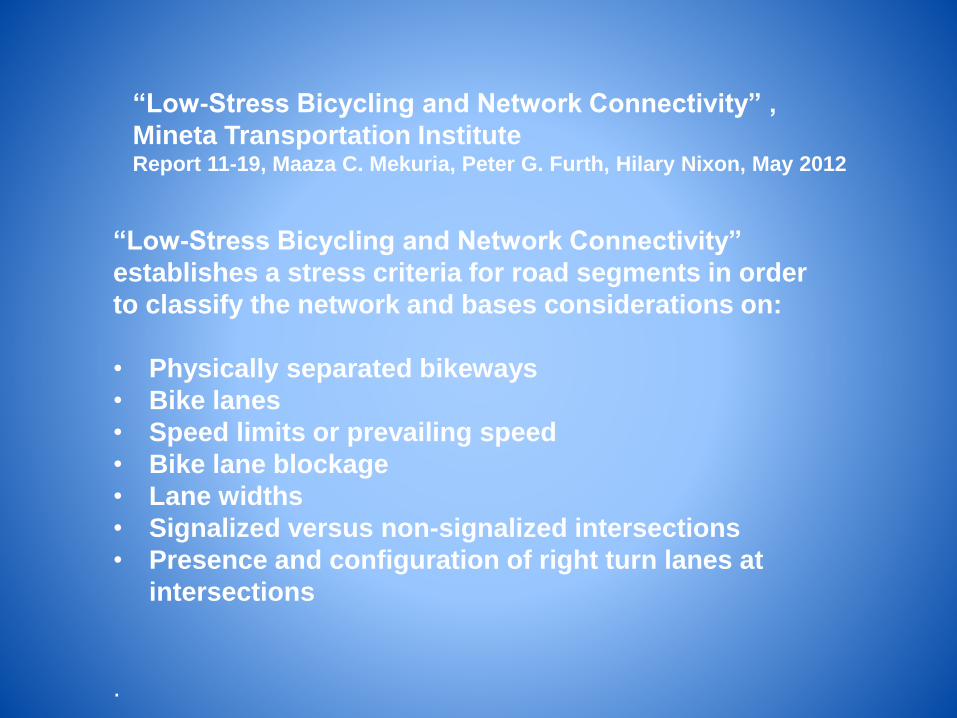
“Low-Stress Bicycling and Network Connectivity” ,
Mineta Transportation InstituteReport 11-19, Maaza C. Mekuria, Peter G. Furth, Hilary Nixon, May 2012
“Low-Stress Bicycling and Network Connectivity”
establishes a stress criteria for road segments in order
to classify the network and bases considerations on:
• Physically separated bikeways
• Bike lanes
• Speed limits or prevailing speed
• Bike lane blockage
• Lane widths
• Signalized versus non-signalized intersections
• Presence and configuration of right turn lanes at
intersections
.

“Low-Stress Bicycling and Network Connectivity” ,
Mineta Transportation InstituteReport 11-19, Maaza C. Mekuria, Peter G. Furth, Hilary Nixon, May 2012
“Low-Stress Bicycling and Network Connectivity”
proposes classifying road segments by one of four
levels of traffic stress.
• Level of traffic stress (LTS) 1 - is meant to be a
level that most children can tolerate
• LTS 2 - the level that will be tolerated by the
mainstream adult population
• LTS 3 - the level tolerated by American cyclists
who are “enthused and confident” but still prefer
having their own dedicated space for riding
• LTS 4 - a level tolerated only by those
characterized as “strong and fearless.”

“Access to Destinations Study”
University of Minnesota Center for Transportation
The Access to Destinations Study encompassed a set of carefully
designed research projects (11), The projects were organized
according to three research components:
• understanding travel dimensions and reliability
• measuring accessibility
• and exploring implications of alternative transportation and land-
use systems.
For accessibility, rather than on simple congestion measures the
study changed the question from “How fast is traffic moving”? to
“How easily are people reaching places they need or want to go?”.
(El-Geneidy 2004 ) Findings of the ongoing study noted that while
until this last decade congestion had been steadily worsening, the
actual ease of reaching destinations in the Twin Cities areas has
been getting better-all over the region.
.

“Access to Destinations Study”
University of Minnesota Center for Transportation
The University of Minnesota study addressed different ways to
measure access and reports include detailed examples of the
following methods:
• Cumulative Opportunity is an approach that calculates the number
of opportunities that can be reached in a specific period of travel
time
• Gravity- Gravity measures evaluate access in terms of the “cost”
of getting there (travel time) , and like Newton’s law of gravity,
nearby things exert stronger attraction than those far away
• Place Rank- This measure accounts for the number of
opportunities that an individual foregoes in a zone to reach an
opportunity in another zone
. .
•

WALKSCORE.COM
At this site, users can enter an address, and a
“walkability” rating of the area is provided with
references and maps of destinations in the area.
The score is based on a patent pending algorithm that
classifies types of destinations and their proximity, and
awards points based on the proximity of those
destinations to produce a rating in the range of 1 to 100.

WALKSCORE.COM

WALKSCORE.COM

Construction of accessibility measures in my
projects began with origins and destinations.
Place Files for destinations, examples include
• GIS layers for places such as schools, day cares, parks, bus stops
• Major Employer point files and traffic zone based employment
• Google places
• Address files
• Tax parcel based maps and databases

Place File Categories, examples include
• Home – housing, apartments, mobile homes….
• Child Care
• Work
• Social – Recreation - parks, recreation, bars, museums..
• Transportation facilities – airports, bus stops, parking
• Store (basic needs) – pharmacy, grocery, convenience stores…
• Store (general) – books, electronics, florists, clothing, hardware..
• Community – library, police, fire, government …
• Bank or Post Office
• Place of worship
• Barber – Hair dresser
• Utilities
• Medical – hospitals, doctors offices, dentist, clinics….

Tax Parcel Approach
• Suitable scale for examining walking and biking
• Statewide tax parcel point file available
• Due to increasing demands to evaluate small scale
developments, travel demand forecasting is being done
at the tax parcel level in Delaware
• Availability of tax parcel based land use
• Places by address can be referenced
• Parcel based housing unit allocations


Paths- Participants in a Multimodal Network Dataset
• Roads, large and small, including driveways
• Paths offset from roadway, bike paths, walking paths
• Driveways
• Transit stops and routes
• Intersections modeled as turning movements with
attributes (crosswalks, signals, crossing lanes, etc)

ESRI Network Dataset Attributes
• Cost – impedances/travel times
apportioned along the edge
• Descriptors – presence of a sidewalk
presence of a shoulder
speed limit
• Restrictions – prohibited, avoided, preferred
• Hierarchy – order or rank of network elements
Most information can be associated with the network
in terms of a cost.

Attributes of Path Segments
• Travel time by mode
• Functional class and speed
• Presence of a sidewalk
• Presence of a shoulder
• Presence of a bike lane
• Safety rating
• Lighting
• Level of service rating

The Network Analyst OD Cost Matrix function can
establish a path between every origin and destination and
for every path between each particular origin and
destination can accumulate across network attributes. For
instance if travel time by each mode is associated with
each segment in a path then the travel time for segments
in the path is aggregated. Any cost or descriptive attribute
can be accumulated in this way.
Therefore for any given point in space statistics can be
generated such as:
• number of destinations within a 10 minute walk
• Number of grocery stores within a 20 minute drive
• The distance to the closest grocery store by walking
• The total number of jobs within a 45 minute trip by bus
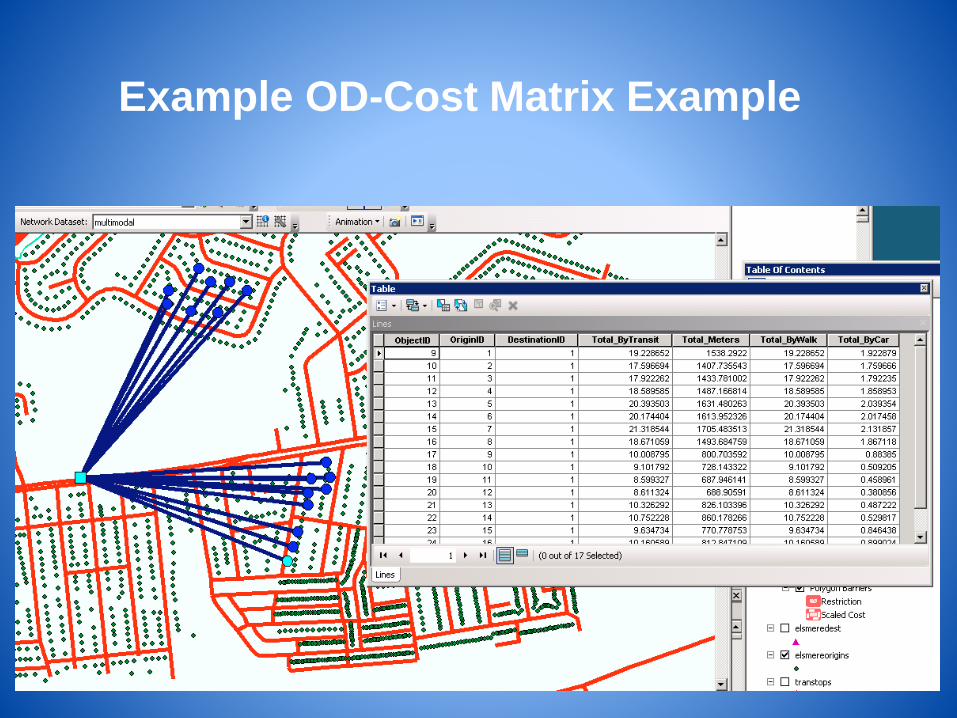
Example OD-Cost Matrix Example
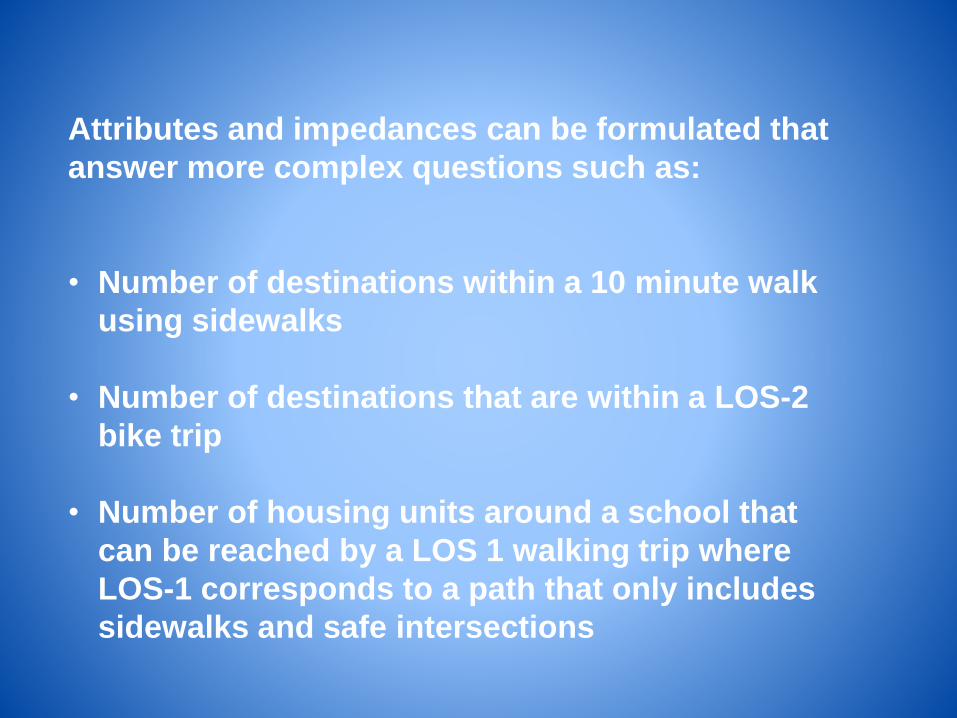
Attributes and impedances can be formulated that
answer more complex questions such as:
• Number of destinations within a 10 minute walk
using sidewalks
• Number of destinations that are within a LOS-2
bike trip
• Number of housing units around a school that
can be reached by a LOS 1 walking trip where
LOS-1 corresponds to a path that only includes
sidewalks and safe intersections

Examples of Level of Service Definitions:
Walking LOS C – Walk anywhere along roadway or other path, 3 miles
per hour, no walking on expressways or interstates
Walking LOS B - Walk only if there’s a sidewalk on either side, or trail,
or local street or shoulder ( > 2 feet) and no walking on expressway or
interstates.
Walking LOS A - Walk only if there’s a sidewalk or dedicated path
Bike LOS C – 12 mph, bike most anywhere on roadway or paths, no
biking on one way streets, no biking on interstate or expressways
Bike LOS B - There must be a shoulder (>2feet) or sidewalk if not a
local street, or designated bike way or dedicated trail
Bike LOS A - Designated Bikeway or trail, or sidewalk or a
subdivision local road.
A similar LOS could be developed for transit trips.

For each housing unit, number of destinations within a 10 minute walk
(LOS C)

Effect of adding a path
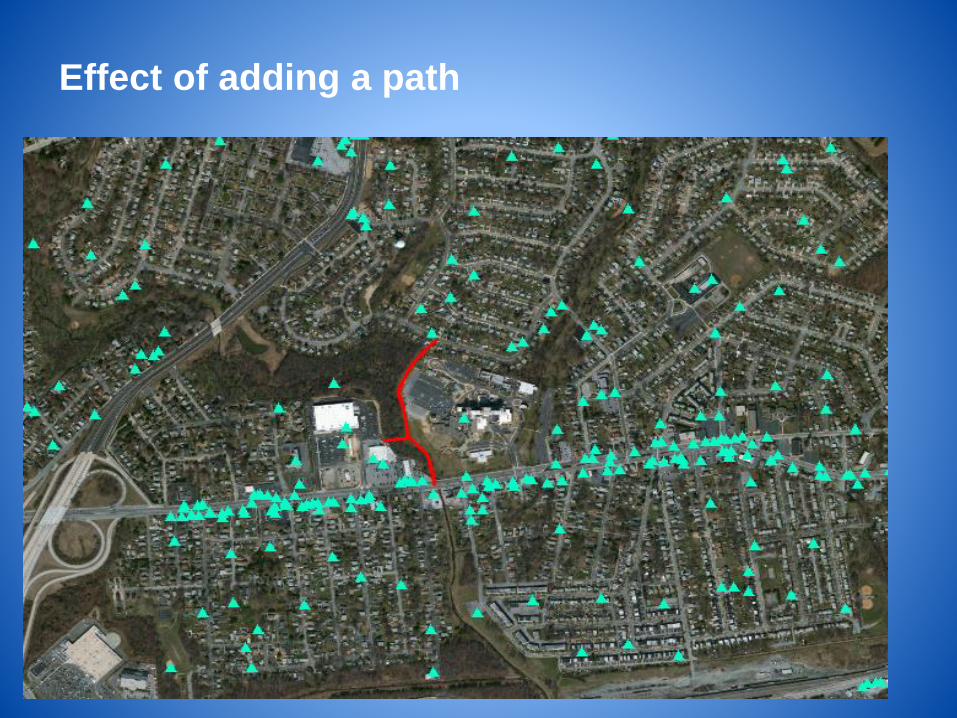
Effect of adding a path

Number of destinations within a 10 minute walk(LOS C) Dark Green 1-7, Light Green 8-16, Yellow 17-35, Orange 36-104, Red 105 and greater

Number of destinations within a 10 minute walk
with sidewalks(LOS A) Dark Green 1-7, Light Green 8-16, Yellow 17-35, Orange 36-104, Red 105 and greater

Number of jobs within a 20 minute car ride
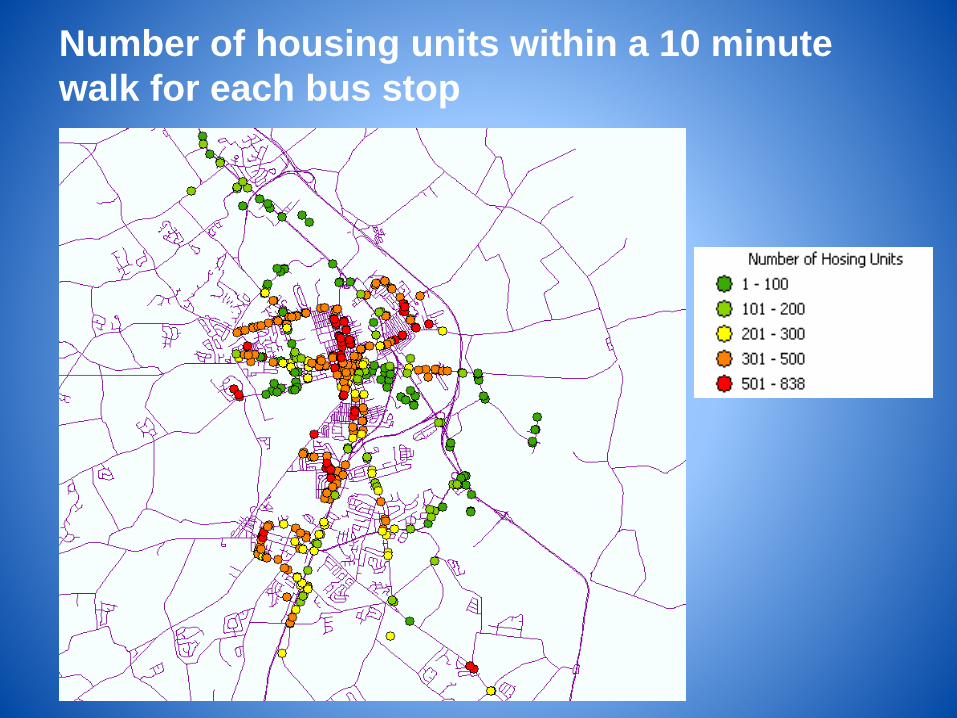
Number of housing units within a 10 minute
walk for each bus stop

Applications
• Trip generation and mode split modeling
• Safe routes to school
• Predicting and modeling usage of new facilities
• Greenway and bikeway development
• Examining transit markets
• Developing statistics that describe benefits
of mixed use housing
• Optimum location of facilities
• Others?

Summary
• Network Analyst and the network dataset model allows for
a very detailed study of accessibility and generation of
accessibility measures. Capabilities included in ESRI
products are very extensive
• Significant advances are possible in comparison to
previous studies that focus on methods such “as the bird
flies” buffering type studies
• Detailed path and origin and destination data is more
available in recent years. In some areas detailed data may
not be available for wide areas but for many small area
studies the data could be generated.
Summary
• How places are categorized has a great deal to do
with the usefulness of any measure of
accessibility and additional study is needed in
this area. Accessibility to medical facilities,
community services, or basic needs businesses
like grocery stores would be of more interest than
general commercial for instance.
• Accessibility in regards to level of service
provides a much more meaningful measure in
some cases.

Summary
• Addition of new pedestrian and bicycle facilities could achieve
better focus and support when measures of their effects are
available.
• This study employed mostly Cumulative Opportunity measures
but certainly gravity and place rank approaches can be more
appropriate in some circumstances
• David Racca, [email protected]
Study paper available at www.cadsr.udel.edu
www.cadsr.udel.edu/projects/DOCUMENTS/statewideaccessibility.pdf