development neural network model … · effects of flow augmentation and near-term ... • neural...

1
ABSTRACT Many of the processes that affect dissolved oxygen concen- trations in the Tualatin River — solubility, sediment oxygen demand, photosynthesis, respiration, biochemical oxygen demand, and reaeration — are controlled to some extent by physical and meteorological factors such as streamflow, air temperature, and solar radiation. To test the extent of that control, an artificial neural network model was constructed to predict dissolved oxygen concentrations in the Tualatin River at the Oswego Dam using only air temperature, solar radia- tion, and streamflow as inputs. Hourly dissolved oxygen con- centrations have been collected at the Oswego Dam since 1991; the available dataset spans more than 10 years. Feedforward neural network modeling techniques, the most widely used type, were applied to this dataset. Data were segregated into calibration, verification, and test subsets. Two neural network models were constructed in series: the first model simulated daily mean dissolved oxygen concen- trations, while the second superimposed the daily periodic signals. The final calibrated neural network models predicted the dissolved oxygen concentration with acceptable accu- racy, producing high correlations between measured and pre- dicted values (r=0.83, mean absolute error < 0.9 mg/L). By some measures, neural network model performance was better than that of a calibrated, mechanistic model of dis- solved oxygen in the Tualatin River. As expected, however, dissolved oxygen concentrations affected by factors other than the physical and meteorological factors used as model inputs, such as large point-source ammonia releases, were not predicted well by the neural network model. Neverthe- less, the neural network model demonstrated potential for use as a river management and forecasting tool to predict the effects of flow augmentation and near-term weather condi- tions on Tualatin River dissolved oxygen concentrations. FACTORS AFFECTING DISSOLVED OXYGEN Dissolved oxygen concentrations in the Tualatin River (fig. 1) are affected by many physical factors and biological pro- cesses: • Solubility Residence time • Reaeration Algal respiration • Photosynthesis Oxygen consuming reactions (BOD, SOD) In addition, physical and meteorological factors such as tem- perature and residence time influence the effects of the bio- logical processes. Photosynthesis and respiration affect DO only when sufficient light energy is available and when streamflow is low enough (< 8.5 m 3 /s) to allow sufficient time for the phytoplankton to grow while in the backwater reach (fig. 2). DEVELOPMENT OF A NEURAL NETWORK MODEL FOR DISSOLVED OXYGEN IN THE T UALATIN RIVER , OREGON BY S TEWART A. ROUNDS, U.S. GEOLOGICAL SURVEY , OREGON W ATER SCIENCE CENTER , PORTLAND, OREGON The Tualatin River at Oswego Dam, river mile (RM) 3.4. Input #1 Input #2 Input #3 Input #4 Output Hidden Layer Output Layer Input Layer Figure 1. Map of Tualatin River Basin. CONCLUSIONS Artificial neural network models were developed to simulate daily mean and hourly DO concentrations in the Tualatin River at the Oswego Dam. The DO at that site is affected by its solubility as well as biological processes such as algal photosynthesis and respira- tion, sediment oxygen demand, biochemical oxygen demand, and ammonia nitrification. The effects of these biological processes on DO, however, are constrained by physical and meteorological fac- tors such as streamflow, air temperature, and solar radiation. Neural network and regression models were built to predict DO based on these factors, using data from May-October of 1991-2000. Multiple linear regression models failed to capture the long-term patterns in the DO data, producing poor results. Neural network models were successful in predicting patterns in the DO data on daily, weekly, and seasonal time scales. Separate models were used to simulate the low- and high-frequency pat- terns in the data. • ANN model performance was good, with mean absolute errors less than 0.9 mg/L. Approximately 70% of the variation in the DO data was captured by the final ANN model. ANN predictions often were better than those from a USGS pro- cess-based model of the Tualatin River (not shown). As applied to the Tualatin River, however, ANN and process-based models have different purposes. The process-based model is most useful for providing insight into how the river works, identifying important processes, and testing the effects of point-sources and manage- ment strategies. The ANN model has tremendous potential as a forecasting tool, but yields less insight into the specifics of riverine processes. Future work will focus on incorporating these and other ANN models into real-time water-quality forecasting tools. Such tools will provide important information to river managers, particularly as they make decisions regarding the proper level of flow augmentation. May Jun Jul Aug Sep Oct 1995 5 7 9 11 13 15 17 Dissolved Oxygen (mg/L) Measured Simulated 4 6 8 10 12 14 16 18 20 1991 1993 1995 1997 1999 2000 1998 1996 1994 1992 Measured Simulated 4 6 8 10 12 14 4 6 8 10 12 14 Daily Mean Dissolved Oxygen Concentration (mg/L) 4 6 8 10 12 14 May Jun Jul Aug Sep Oct 4 6 8 10 12 14 May Jun Jul Aug Sep Oct 0 5 10 15 20 25 30 Time Lag (days) -0.2 -0.1 0.0 0.1 0.2 0.3 0.4 0.5 0.6 Correlation Coefficient (r) Solar Radiation Streamflow at West Linn Air Temperature Rainfall Signal Magnitude Dissolved Oxygen Signal Magnitude Streamflow Signal Magnitude Air Temperature Signal Magnitude Solar Radiation 0.0 0.5 1.0 1.5 2.0 2.5 3.0 3.5 Frequency (1/day) Signal Magnitude Rainfall The Tualatin River’s reservoir-like reach at Stafford, RM 5.5. Lee Falls on the Tualatin River in the Coast Range Mountains. Tualatin River at Farmington Bridge, RM 33.3. OBJECTIVES AND APPROACH The purpose of this study was to determine the extent to which the DO con- centration in the Tualatin River at the Oswego Dam could be predicted solely from physical and meteorological measurements such as streamflow, air temperature, solar radiation, and rainfall, using multiple linear regression and artificial neural network modeling techniques. If successful, these models would be used to create a real-time DO forecasting tool. ARTIFICIAL NEURAL NETWORKS An artificial neural network (ANN) is a mathematical structure designed to mimic the information processing functions of a network of neurons in the brain. ANNs are highly parallel systems that process information through many interconnected units that respond to inputs through modifiable weights, thresh- olds, and mathematical transfer functions. Each unit processes the pattern of activity it receives from other units, then broadcasts its response to still other units. ANNs are particularly well suited for: large datasets complex, nonlinear relations pattern recognition ANNs are able to find and identify complex patterns in datasets that may not be well described by a set of known processes or simple mathematical formulae. They are not constrained by any preconceived algo- rithms or relations among inputs. Training an ANN is a mathematical exercise that optimizes all of the ANN’s weights and threshold values, using some fraction of the available data. Opti- mization routines can be used to determine the ideal number of units in the hidden layer and the nature of their transfer functions. ANNs “learn” by example; as long as the input dataset contains a wide range of the types of patterns that the ANN will be asked to predict, the model is likely to find those patterns and successfully use them in its predictions. Figure 8. Measured and simulated hourly DO concentrations for the summer of 1995 in the Tualatin River at Oswego Dam. Simulated values were calculated by the final hourly ANN model (9 inputs, 1 hidden layer with 10 processing units, 1 output). Figure 5. Correlations and time-lags between low-pass filtered DO and other low-pass filtered inputs Figure 4. Typical power spectrums for DO, stream- flow, air temperature, solar, and rainfall data. Figure 7. Measured and simulated daily-mean (low-pass) DO con- centrations for the Tualatin River at Oswego Dam. Simulated values were calculated by the low-frequency ANN model (8 inputs, 1 hidden layer with 7 processing units, 1 output). Figure 3. A representation of a 3-layer feedforward artificial neural network with four inputs, 5 hidden nodes, and one output. LOW-FREQUENCY (DAILY MEAN) MODELS Long- and short-term patterns were simulated with separate models (fig. 6). After optimization, the low-frequency ANN model required only 8 inputs: low-pass (lp) filtered data: lp-Q, lp-S, lp-AT low-pass filtered data from 12 days ago: lp-Q-12, lp-AT-12 low-pass filtered & lagged data: lp-S-lag (1.75 days) day-of-year, year where Q, S, and AT stand for streamflow, solar radiation, and air tem- perature. Time-lagged inputs were calculated as differences. MULTIPLE LINEAR REGRESSION Multiple linear regression is a special case ANN model that uses linear transfer functions and no hidden layers. Patterns in the data, however, were highly nonlinear and the regression did not perform well (table 1). ARTIFICIAL NEURAL NETWORK Optimization yielded an ANN with one hidden layer containing seven nodes. ANN predictions were markedly better than the linear model and in many cases better than a USGS process-based model, with a mean absolute error of only 0.83 mg/L and a correlation coefficient of 0.837 (fig. 7, table 1). The ANN model captured the most important patterns in the data, pro- ducing remarkable fits to the measured DO considering that the pre- dictions were based only on streamflow, air temperature, solar radiation, year, and day-of-year. The most important predictor vari- ables were lp-Q, day-of-year, lp-S, and lp-S-lag, respectively. FINAL HOURLY MODEL High-frequency signals in the data were separated from low-frequency signals by subtracting the low- pass filtered data from the original data. High-pass AT and S inputs were included at several time lags to capture their 12- and 24-hour signals; the streamflow data had no useful high-frequency signals (fig. 4). Final training and optimization yielded a high-fre- quency ANN model with nine inputs: output from the low-frequency ANN, high-pass (hp) filtered AT & S (3 time lags each), day-of-year, and year. The high-frequency ANN used one hidden layer with 10 nodes. The final model captured both the long-term and daily patterns in the measured DO data, producing a mean absolute error of 0.86 mg/L and a correlation coeffi- cient of 0.831 (table 1). Figure 8 illustrates the typical daily variations that the model produced in the final hourly DO. These predic- tions are accurate enough to be useful and can form the basis for a real-time DO forecasting tool. 0 50 100 150 200 250 300 350 Solar Radiation (W/m 2 ) 0 5 10 15 20 25 30 35 Streamflow (m 3 /s) May Jun Jul Aug Sep Oct 1993 0 10 20 30 40 50 60 70 Chlorophyll-a (µg/L) Figure 2. Favorable streamflow and light conditions are necessary before sizable algal blooms can occur in the Tualatin River. Shaded periods are unfavorable for algal growth due to high flow (red) or low light (blue) condi- tions. DATA PREPARATION AND DECORRELATION To maximize the signals in the input data that will help to predict the output, it is critical to examine the data for peri- odicity, cross-correlations, and important time lags. PERIODICITY Each parameter’s data were analyzed by Fourier transform to determine the presence of periodic signals. Solar radia- tion, air temperature, and DO all had strong periodic signals at daily time scales; periods of 24 and 12 hours character- ized the most important signals. Streamflow appeared to have useful signals at time scales longer than a day or two, but only weak patterns at shorter time scales. Figure 4 illus- trates typical power spectrums from these data. Strong signals at daily time scales can obscure important correlations and time lags in the data; therefore, the short and long time scale signals in the data were separated. A low-pass filter was used to remove the 24-hour and shorter periodic signals from each time series, preserving any peri- odic signals at time scales longer than one day. Long-term patterns and short-term periodicity in the data were simulated with separate models. CROSS-CORRELATIONS AND TIME LAGS Multiple linear regression and ANN techniques work best with independent inputs. To test for interdependence, the data were correlated against one another using linear regression techniques with an imposed time lag (fig. 5). DO has its highest correlation with the solar insolation rate that occurred about 2 days previous. That time lag has a physical basis because the available solar energy affects the amount of DO produced by photosynthesis, and the effects of very sunny or very cloudy days on algal growth are not immediate. Many of the DO cross-correlations are minimized at a time lag on the order of 12 days, which is the typical summer residence time in the backwater reach of the Tualatin River. Table 1. Goodness-of-fit statistics for models predicting DO at the Oswego Dam. Model Type Time Scale Number of Data Points Mean Absolute Error (mg/L) Root Mean Square Error (mg/L) Correlation Coefficient (r) Multiple Linear Regression low-frequency 40,388 1.29 1.69 0.589 Artificial Neural Network (ANN) low-frequency 40,388 0.83 1.14 0.837 final hourly 40,372 0.86 1.21 0.831 8:7:1 Low-Frequency ANN 9:10:1 High-Frequency ANN Daily Mean DO Final Hourly DO Low-Frequency filtered & lagged Q, AT, & S inputs, day-of-year, year High-Frequency AT & S signals, day-of-year, year outputs inputs hidden nodes Step 1: Step 2: Nyberg Cr C O L U M B I A R I V E R R I V E R W I L L A M E T T E Lake Oswego Tigard Beaverton Tualatin Sherwood Scholls Farmington Hillsboro Banks Cornelius Dilley Forest Grove North Plains Cherry Grove 5 205 Basin bou ndary CLACKAMAS COLUMBIA WASHINGTON TILLAMOOK YAMHILL S c o g g i n Creek Henry Hagg Lake Gales C r eek W es t East Fork Fo r k Dairy Creek Mc K a y Cr ee k F an no Cr e ek B e a v e rto n C re ek Cr e ek Ro ck Bronson B u t t e r n u t C r Chri s t e n s e n Cre e Burris Creek McFee Creek H e a t o n C r C r Bak er C h i c k e n Creek Creek Creek C edar Mill C a n a l O s w e g o R I V E R OREGON WASHINGTON 123°00' 122°37'30'' 122°45' 123°15' 123°22'30'' 45°45' 45°30' 45°15' Base modified from U.S. Geological Survey 0 0 5 10 KILOMETERS 5 10 MILES Portland OREGON Study area C O A S T R A N G E T U A L A T I N M O U N T A I N S P AR RET T M O U N T AI N C H E H A L E M M O U N T A I N S RM 60 RM 70 RM 30 RM 40 RM 50 RM 10 RM 20 RM 0 s k T U A LA T I N 26 26 5 West Linn 1:100,000 topographic quadrangles, 1978–84 Designated urban growth area from Metro, 1998 RM 10 River mile MULTNOMAH Tualatin River at Oswego Dam, river mile 3.4 (station 14207200) Site Name and Location Symbol strong daily signals information at time scales longer than one day Figure 6. The two-step ANN model flow chart.

Upload: doankhanh

Post on 27-Jul-2018

218 views

Category:

Documents


0 download

TRANSCRIPT

ABSTRACT

Many of the processes that affect dissolved oxygen concen-trations in the Tualatin River — solubility, sediment oxygendemand, photosynthesis, respiration, biochemical oxygendemand, and reaeration — are controlled to some extent byphysical and meteorological factors such as streamflow, airtemperature, and solar radiation. To test the extent of thatcontrol, an artificial neural network model was constructed topredict dissolved oxygen concentrations in the Tualatin Riverat the Oswego Dam using only air temperature, solar radia-tion, and streamflow as inputs. Hourly dissolved oxygen con-centrations have been collected at the Oswego Dam since1991; the available dataset spans more than 10 years.

Feedforward neural network modeling techniques, the mostwidely used type, were applied to this dataset. Data weresegregated into calibration, verification, and test subsets.Two neural network models were constructed in series: thefirst model simulated daily mean dissolved oxygen concen-trations, while the second superimposed the daily periodicsignals. The final calibrated neural network models predictedthe dissolved oxygen concentration with acceptable accu-racy, producing high correlations between measured and pre-dicted values (r=0.83, mean absolute error < 0.9 mg/L).

By some measures, neural network model performance wasbetter than that of a calibrated, mechanistic model of dis-solved oxygen in the Tualatin River. As expected, however,dissolved oxygen concentrations affected by factors otherthan the physical and meteorological factors used as modelinputs, such as large point-source ammonia releases, werenot predicted well by the neural network model. Neverthe-less, the neural network model demonstrated potential foruse as a river management and forecasting tool to predict theeffects of flow augmentation and near-term weather condi-tions on Tualatin River dissolved oxygen concentrations.

FACTORS AFFECTING DISSOLVED OXYGEN

Dissolved oxygen concentrations in the Tualatin River (fig. 1)are affected by many physical factors and biological pro-cesses:

• Solubility• Residence time• Reaeration• Algal respiration• Photosynthesis• Oxygen consuming reactions (BOD, SOD)

In addition, physical and meteorological factors such as tem-perature and residence time influence the effects of the bio-logical processes.

Photosynthesis and respiration affect DO only when sufficientlight energy is available and when streamflow is low enough(< 8.5 m3/s) to allow sufficient time for the phytoplankton togrow while in the backwater reach (fig. 2).

DEVELOPMENT OF A NEURAL NETWORK MODEL FOR DISSOLVED OXYGEN IN THE TUALATIN RIVER, OREGONBY STEWART A. ROUNDS, U.S. GEOLOGICAL SURVEY, OREGON WATER SCIENCE CENTER, PORTLAND, OREGON

The Tualatin River at Oswego Dam, river mile (RM) 3.4.

Input #1

Input #2

Input #3

Input #4

Output

Hidden Layer OutputLayer

InputLayer

Figure 1. Map of Tualatin River Basin.

CONCLUSIONS

Artificial neural network models were developed to simulate dailymean and hourly DO concentrations in the Tualatin River at theOswego Dam. The DO at that site is affected by its solubility as wellas biological processes such as algal photosynthesis and respira-tion, sediment oxygen demand, biochemical oxygen demand, andammonia nitrification. The effects of these biological processes onDO, however, are constrained by physical and meteorological fac-tors such as streamflow, air temperature, and solar radiation. Neuralnetwork and regression models were built to predict DO based onthese factors, using data from May-October of 1991-2000.

• Multiple linear regression models failed to capture the long-termpatterns in the DO data, producing poor results.

• Neural network models were successful in predicting patterns inthe DO data on daily, weekly, and seasonal time scales. Separatemodels were used to simulate the low- and high-frequency pat-terns in the data.

• ANN model performance was good, with mean absolute errorsless than 0.9 mg/L. Approximately 70% of the variation in the DOdata was captured by the final ANN model.

• ANN predictions often were better than those from a USGS pro-cess-based model of the Tualatin River (not shown). As applied tothe Tualatin River, however, ANN and process-based models havedifferent purposes. The process-based model is most useful forproviding insight into how the river works, identifying importantprocesses, and testing the effects of point-sources and manage-ment strategies. The ANN model has tremendous potential as aforecasting tool, but yields less insight into the specifics of riverineprocesses.

Future work will focus on incorporating these and other ANN modelsinto real-time water-quality forecasting tools. Such tools will provideimportant information to river managers, particularly as they makedecisions regarding the proper level of flow augmentation.

May Jun Jul Aug Sep Oct1995

5

7

9

11

13

15

17

Dis

solv

ed O

xyge

n (m

g/L)

MeasuredSimulated

468

101214161820

1991

1993

1995

1997

1999 2000

1998

1996

1994

1992MeasuredSimulated

468

101214

468

101214

Dai

ly M

ean

Dis

solv

ed O

xyge

n C

once

ntra

tion

(mg/

L)

468

101214

May Jun Jul Aug Sep Oct468

101214

May Jun Jul Aug Sep Oct

0 5 10 15 20 25 30Time Lag (days)

-0.2

-0.1

0.0

0.1

0.2

0.3

0.4

0.5

0.6

Cor

rela

tion

Coe

ffici

ent (

r)

Solar RadiationStreamflow at West LinnAir TemperatureRainfall

Sig

nal M

agni

tude

Dissolved Oxygen

Sig

nal M

agni

tude

Streamflow

Sig

nal M

agni

tude Air Temperature

Sig

nal M

agni

tude Solar Radiation

0.0 0.5 1.0 1.5 2.0 2.5 3.0 3.5

Frequency (1/day)

Sig

nal M

agni

tude Rainfall

The Tualatin River’s reservoir-like reach at Stafford, RM 5.5. Lee Falls on the Tualatin River in the Coast Range Mountains.

Tualatin River at Farmington Bridge, RM 33.3.

OBJECTIVES AND APPROACH

The purpose of this study was to determine the extent to which the DO con-centration in the Tualatin River at the Oswego Dam could be predicted solelyfrom physical and meteorological measurements such as streamflow, airtemperature, solar radiation, and rainfall, using multiple linear regression andartificial neural network modeling techniques. If successful, these modelswould be used to create a real-time DO forecasting tool.

ARTIFICIAL NEURAL NETWORKS

An artificial neural network (ANN) is a mathematical structure designed tomimic the information processing functions of a network of neurons in thebrain. ANNs are highly parallel systems that processinformation through many interconnected units thatrespond to inputs through modifiable weights, thresh-olds, and mathematical transfer functions. Each unitprocesses the pattern of activity it receives from otherunits, then broadcasts its response to still other units.

ANNs are particularly well suited for:

• large datasets• complex, nonlinear relations• pattern recognition

ANNs are able to find and identify complex patterns indatasets that may not be well described by a set ofknown processes or simple mathematical formulae.They are not constrained by any preconceived algo-rithms or relations among inputs.

Training an ANN is a mathematical exercise that optimizes all of the ANN’sweights and threshold values, using some fraction of the available data. Opti-mization routines can be used to determine the ideal number of units in thehidden layer and the nature of their transfer functions. ANNs “learn” byexample; as long as the input dataset contains a wide range of the types ofpatterns that the ANN will be asked to predict, the model is likely to find thosepatterns and successfully use them in its predictions.

Figure 8. Measured and simulated hourly DO concentrations for the summer of 1995 inthe Tualatin River at Oswego Dam. Simulated values were calculated by the final hourlyANN model (9 inputs, 1 hidden layer with 10 processing units, 1 output).

Figure 5. Correlations and time-lags between low-passfiltered DO and other low-pass filtered inputs

Figure 4. Typical power spectrums for DO, stream-flow, air temperature, solar, and rainfall data.

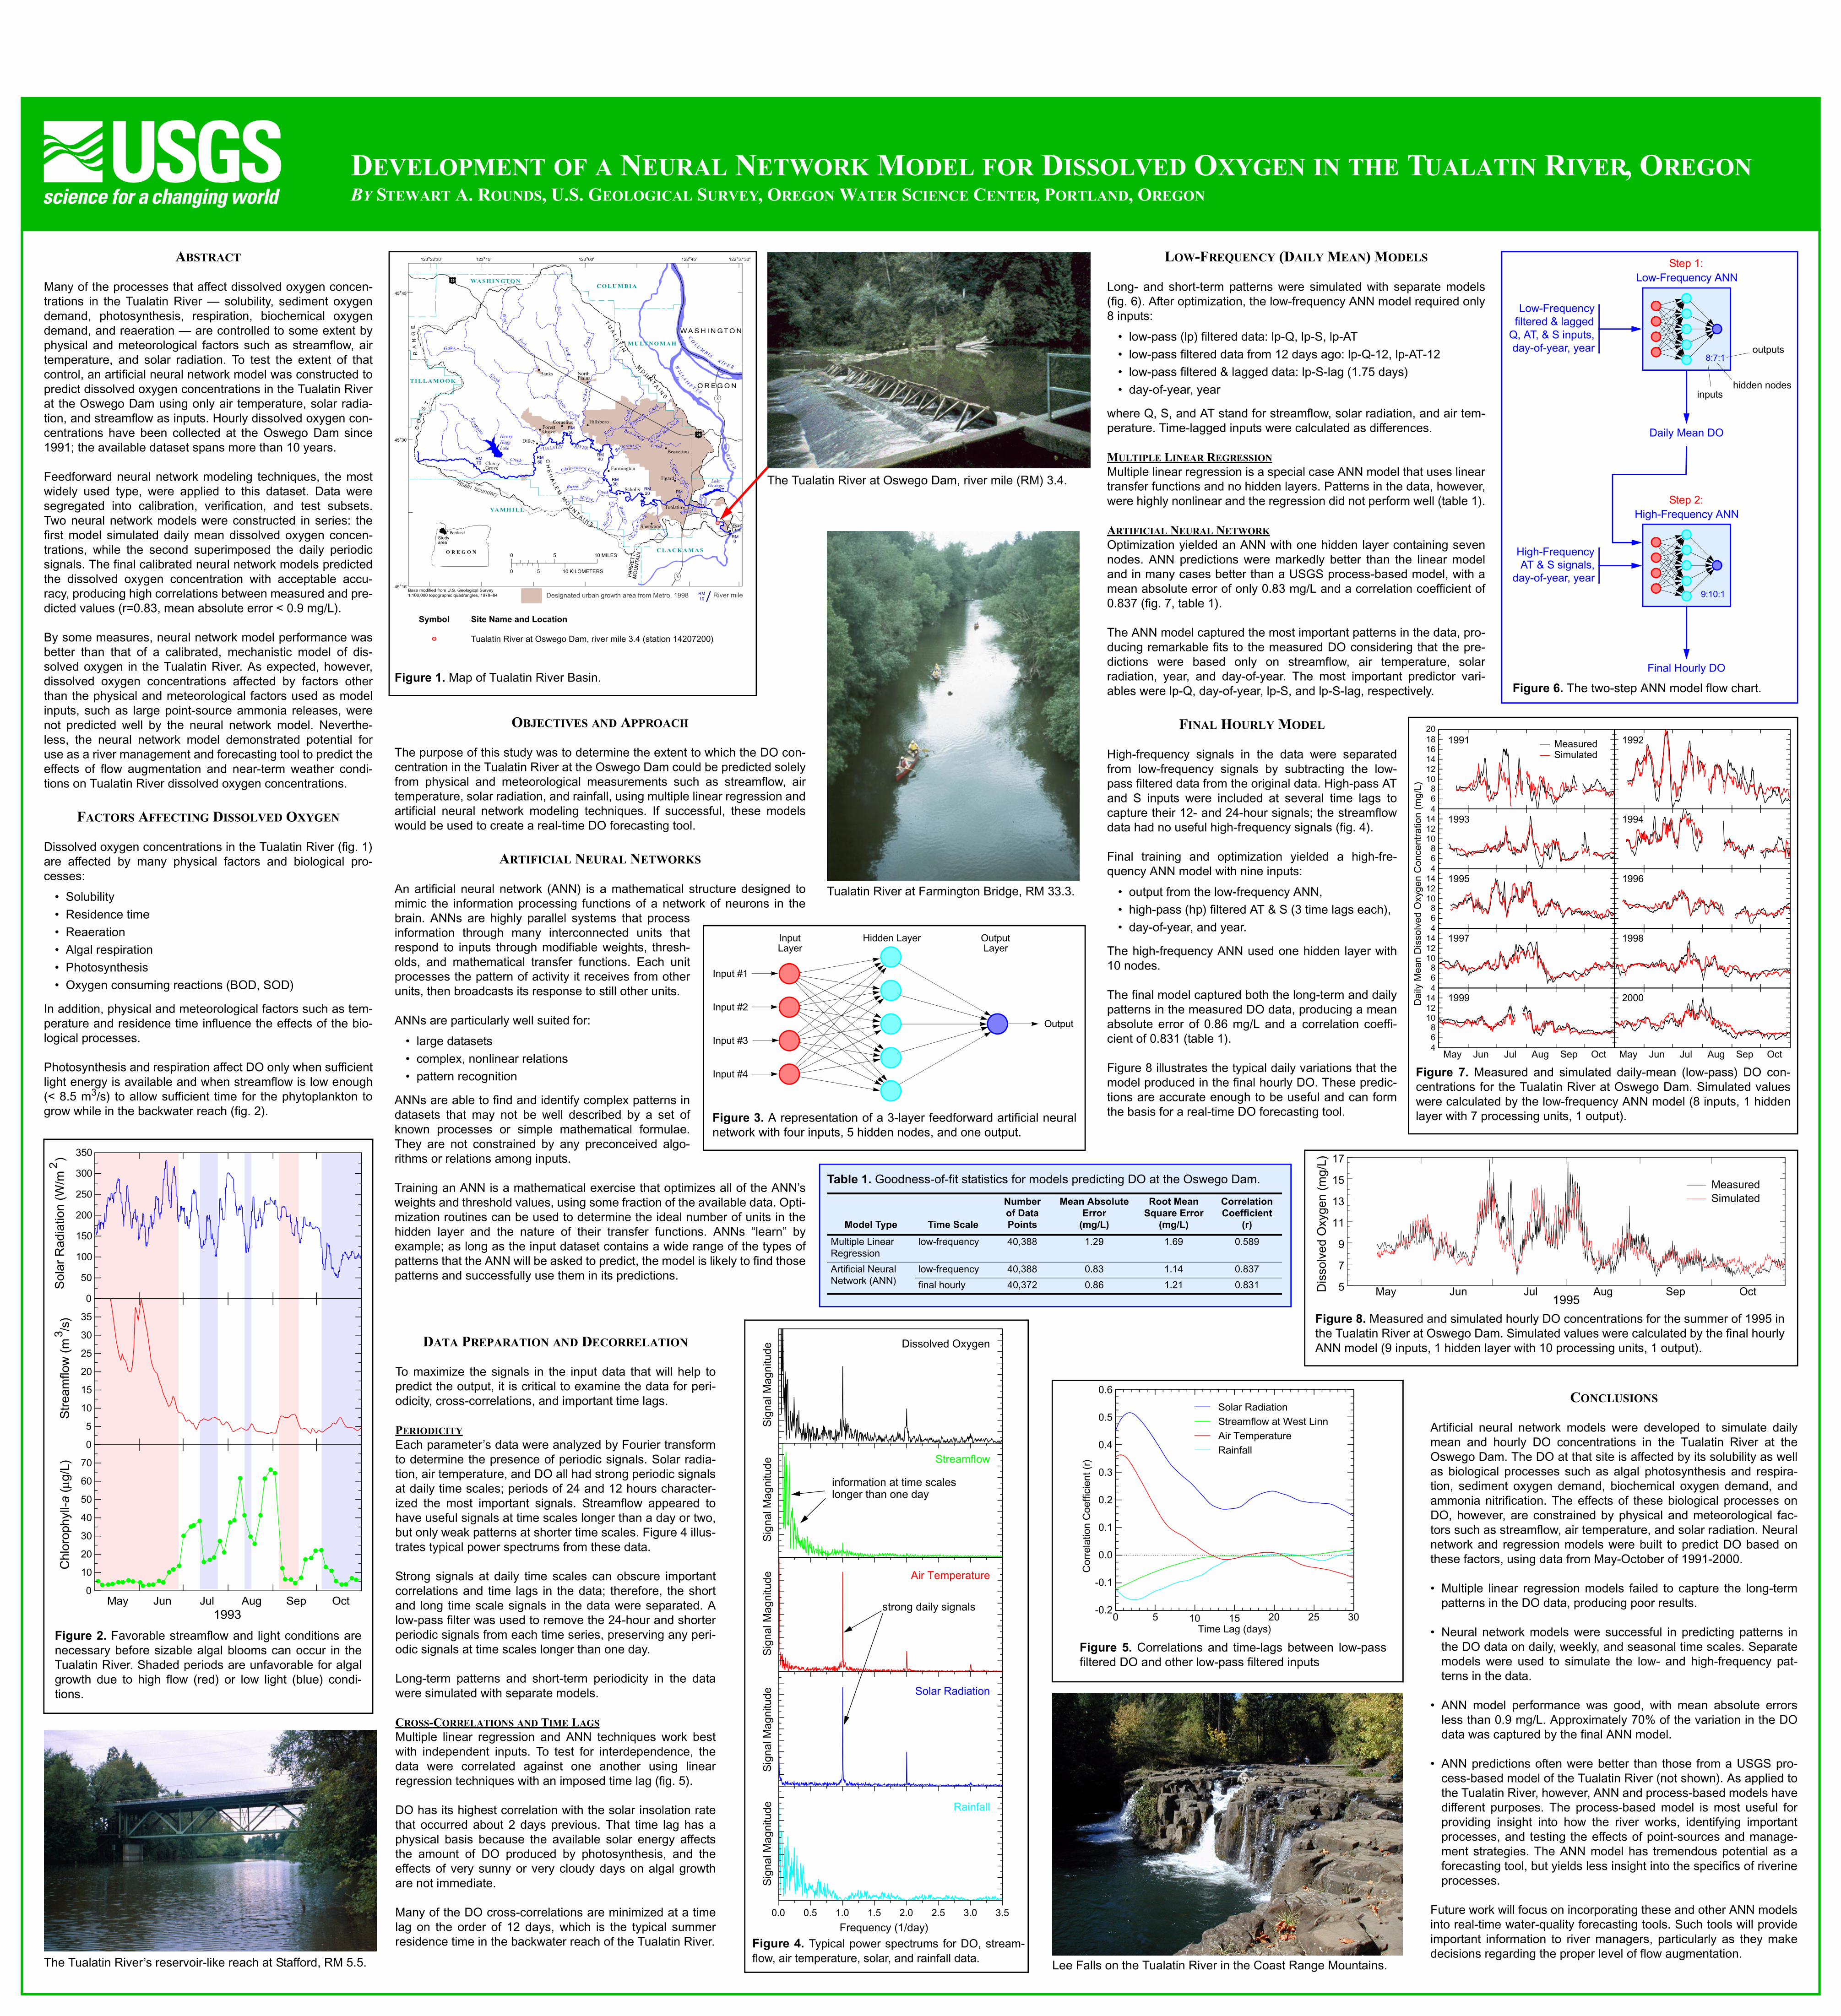
Figure 7. Measured and simulated daily-mean (low-pass) DO con-centrations for the Tualatin River at Oswego Dam. Simulated valueswere calculated by the low-frequency ANN model (8 inputs, 1 hiddenlayer with 7 processing units, 1 output).Figure 3. A representation of a 3-layer feedforward artificial neural

network with four inputs, 5 hidden nodes, and one output.

LOW-FREQUENCY (DAILY MEAN) MODELS

Long- and short-term patterns were simulated with separate models(fig. 6). After optimization, the low-frequency ANN model required only8 inputs:

• low-pass (lp) filtered data: lp-Q, lp-S, lp-AT• low-pass filtered data from 12 days ago: lp-Q-12, lp-AT-12• low-pass filtered & lagged data: lp-S-lag (1.75 days)• day-of-year, year

where Q, S, and AT stand for streamflow, solar radiation, and air tem-perature. Time-lagged inputs were calculated as differences.

MULTIPLE LINEAR REGRESSION

Multiple linear regression is a special case ANN model that uses lineartransfer functions and no hidden layers. Patterns in the data, however,were highly nonlinear and the regression did not perform well (table 1).

ARTIFICIAL NEURAL NETWORK

Optimization yielded an ANN with one hidden layer containing sevennodes. ANN predictions were markedly better than the linear modeland in many cases better than a USGS process-based model, with amean absolute error of only 0.83 mg/L and a correlation coefficient of0.837 (fig. 7, table 1).

The ANN model captured the most important patterns in the data, pro-ducing remarkable fits to the measured DO considering that the pre-dictions were based only on streamflow, air temperature, solarradiation, year, and day-of-year. The most important predictor vari-ables were lp-Q, day-of-year, lp-S, and lp-S-lag, respectively.

FINAL HOURLY MODEL

High-frequency signals in the data were separatedfrom low-frequency signals by subtracting the low-pass filtered data from the original data. High-pass ATand S inputs were included at several time lags tocapture their 12- and 24-hour signals; the streamflowdata had no useful high-frequency signals (fig. 4).

Final training and optimization yielded a high-fre-quency ANN model with nine inputs:

• output from the low-frequency ANN,• high-pass (hp) filtered AT & S (3 time lags each),• day-of-year, and year.

The high-frequency ANN used one hidden layer with10 nodes.

The final model captured both the long-term and dailypatterns in the measured DO data, producing a meanabsolute error of 0.86 mg/L and a correlation coeffi-cient of 0.831 (table 1).

Figure 8 illustrates the typical daily variations that themodel produced in the final hourly DO. These predic-tions are accurate enough to be useful and can formthe basis for a real-time DO forecasting tool.

0

50

100

150

200

250

300

350

Sol

ar R

adia

tion

(W/m

2)

0

5

10

15

20

25

30

35

Str

eam

flow

(m

3 /s)

May Jun Jul Aug Sep Oct1993

0

10

20

30

40

50

60

70

Chl

orop

hyll-

a (µ

g/L)

Figure 2. Favorable streamflow and light conditions arenecessary before sizable algal blooms can occur in theTualatin River. Shaded periods are unfavorable for algalgrowth due to high flow (red) or low light (blue) condi-tions.

DATA PREPARATION AND DECORRELATION

To maximize the signals in the input data that will help topredict the output, it is critical to examine the data for peri-odicity, cross-correlations, and important time lags.

PERIODICITY

Each parameter’s data were analyzed by Fourier transformto determine the presence of periodic signals. Solar radia-tion, air temperature, and DO all had strong periodic signalsat daily time scales; periods of 24 and 12 hours character-ized the most important signals. Streamflow appeared tohave useful signals at time scales longer than a day or two,but only weak patterns at shorter time scales. Figure 4 illus-trates typical power spectrums from these data.

Strong signals at daily time scales can obscure importantcorrelations and time lags in the data; therefore, the shortand long time scale signals in the data were separated. Alow-pass filter was used to remove the 24-hour and shorterperiodic signals from each time series, preserving any peri-odic signals at time scales longer than one day.

Long-term patterns and short-term periodicity in the datawere simulated with separate models.

CROSS-CORRELATIONS AND TIME LAGS

Multiple linear regression and ANN techniques work bestwith independent inputs. To test for interdependence, thedata were correlated against one another using linearregression techniques with an imposed time lag (fig. 5).

DO has its highest correlation with the solar insolation ratethat occurred about 2 days previous. That time lag has aphysical basis because the available solar energy affectsthe amount of DO produced by photosynthesis, and theeffects of very sunny or very cloudy days on algal growthare not immediate.

Many of the DO cross-correlations are minimized at a timelag on the order of 12 days, which is the typical summerresidence time in the backwater reach of the Tualatin River.

Table 1. Goodness-of-fit statistics for models predicting DO at the Oswego Dam.

Model Type Time Scale

Numberof DataPoints

Mean Absolute Error

(mg/L)

Root Mean Square Error

(mg/L)

CorrelationCoefficient

(r)

Multiple LinearRegression

low-frequency 40,388 1.29 1.69 0.589

Artificial NeuralNetwork (ANN)

low-frequency 40,388 0.83 1.14 0.837

final hourly 40,372 0.86 1.21 0.831

8:7:1

Low-Frequency ANN

9:10:1

High-Frequency ANN

Daily Mean DO

Final Hourly DO

Low-Frequencyfiltered & lagged

Q, AT, & S inputs,day-of-year, year

High-FrequencyAT & S signals,

day-of-year, year

outputs

inputshidden nodes

Step 1:

Step 2:Nyberg Cr

CO

LUM

B IAR IV E R

RI V

ER

WIL

LA

M

E T T E

LakeOswego

Tigard

Beaverton

Tualatin

Sherwood

Scholls

Farmington

Hillsboro

Banks

Cornelius

Dilley

ForestGrove

NorthPlains

CherryGrove

5

205

Basin boundary

C L A C KA MA S

C OL U MB I A WA S HI N GTON

T I L L A M O O K

YA MHI L L

Scoggin

Creek

He nryHaggLake

Gales

Creek

Wes

t

Eas t

Fork Fork

Dairy

Creek

McK

ay

Cre

ek

Fanno

Cre

ek

Beaverton

Creek

Creek

RockBronso

n

Butternut Cr

Chris tensen Cree

Burris Creek

McFee

Creek

He

ato

n

Cr

Cr

Bake

r

C h icke

n

Creek

Creek

Creek

Cedar Mill

Can

al

Osw

ego

RIVER

O R E G O N

W A S H I N GT O N

123°00' 122°37'30''122°45'123°15'123°22'30''

45°45'

45°30'

45°15'Base modified from U.S. Geological Survey

0

0 5 10 KILOMETERS

5 10 MILES

Portland

O R E G O N

Studyarea

CO

AS

T

RA

NG

E

TU

AL

AT

I N

MO

UN

TA

I NS

PA

RR

ET

TM

OU

NTA

IN

CH

EH

AL

EM

MO

U

NT

A I N S

RM60

RM70

RM30

RM40

RM50

RM10

RM20

RM0

s

k

TUALATIN

26

26

5

WestLinn

1:100,000 topographic quadrangles, 1978–84 Designated urban growth area from Metro, 1998 RM10

River mile

MU LT N O MA H

Tualatin River at Oswego Dam, river mile 3.4 (station 14207200)

Site Name and LocationSymbol

strong daily signals

information at time scaleslonger than one day

Figure 6. The two-step ANN model flow chart.