development, improvements and validation of a pv...
TRANSCRIPT

BULETINUL ŞTIINŢIFIC al Universităţii “POLITEHNICA” din Timişoara, România,
Seria AUTOMATICĂ ŞI CALCULATOARE
SCIENTIFIC BULLETIN of The “POLITEHNICA” University of Timişoara, Romania,
Transactions on AUTOMATIC CONTROL and COMPUTER SCIENCE, Vol. 57 (71), No. 3, September, 2012, ISSN 1224-600X
125
Development, Improvements and Validation of a
PV System Simulation Model in a Micro-Grid
Lucian Mihet-Popa*, **
, C. Koch-Ciobotaru**
, F. Isleifsson* and H. Bindner
*
* Department of Electrical Engineering, Technical University of Denmark, 4000 Roskilde, Frederiksborgvej 399, Denmark
Phone: (45) 2365 2984, E-Mail: [email protected], WWW: http://www.elektro.dtu.dk
** Department of Electrical Engineering, POLITEHNICA University of Timisoara, 300223 Timisoara, V. Parvan 2, Romania
Phone: (40) 256-403464, E-Mail: [email protected], WWW: http://www.et.upt.ro
Abstract – The increasing amount of Distributed Energy
Resources (DER) components into distribution networks
involves the development of accurate simulation models
that take into account an increasing number of factors
that influence the output power from the Distributed
Generators (DG) systems. The modeling of DER
components in power systems and the relative control
architecture are an important part for the introduction of
relevant quantity of renewable energy in the future smart
grid. Therefore it is a strong necessity to have proper
validated models to help operators to perform better
studies and to be more confident with the results. This
paper presents two simulation models developed and
implemented in MATLAB/Simulink and DIgSILENT
Power Factory of a PV system using the single-diode
four-parameter model based on data sheet values. The
component models were implemented first in
MATLAB/Simulink and the simulation results have been
compared with the data sheet values and with the
characteristics of the units. To point out the strong
dependency on ambient conditions and to validate the
simulation models a complex data processing subsystem
model has also been developed. A PV inverter model have
also been developed and implemented in PowerFactory to
study load flow, steady-state voltage stability and dynamic
behavior of a distribution system. Validation of
simulation models have been carried out using RISO
experimental facility SYSLAB which include a PV System
as well as a Vanadium Redox Flow Battery-VRB and
various loads including an office building-FlexHouse in
a LV network which can be operated in different
configurations.
Keywords: Distributed Energy Resources, Distributed
Generators, incident and tilt angle, Micro-
Grid, PV panels, solar radiation.
I. INTRODUCTION
Renewable energy systems are expanding due to not only
environmental aspect but also due to social, economical
and political interest. The European Union is aiming at a
specific CO2 reduction in the electricity sector in the near
future (20 % reduction by 2020). This will involve a
significant growth of PV installation all over Europe
resulting in a few hundred Giga watts of capacity [1-3].
The increased PV capacity will influence power system
operation and design. Power supplied from a PV array
depends mostly on present ambient conditions such as:
irradiation and temperature [3-7].
The distributed generation is taking importance pointing
out that the future utility line will be formed by distributed
energy resources and micro-grids. The flexible micro-grid
has to be able to import/export energy from/to the grid,
control the active and reactive power flows and manage of
the storage energy [3, 8].
PV output voltage changes mainly with temperature while
PV output current changes mainly with irradiation.
Therefore in order to develop a very precise simulation
model the local wind speed and the solar radiation
incidence angle, in terms of the slope and surface azimuth,
should be considered [4-7, 9-11].
In order to determine the hourly incident radiation on a
surface of any orientation it is necessary to evaluate the
ratio of incident radiation on the tilted surface to that on a
horizontal surface considering beam, sky diffuse and
ground reflected radiation separately [4], [6], [9].
Increased distributed generation is becoming more
important in the current power system and in the future it
will rely more on distributed energy resources and micro-
grids. The flexible micro-grid has to be able to
import/export energy from/to the grid, control the active
and reactive power flows and manage of the storage energy
[12-13].
This paper focuses on the simulation models of a small-
scale PV System connected to a distributed network and on
improvements and validating it using experimental facility
of an active and distributed power systems laboratory. In
order to find out the differences between DER components
in power systems and to study the impact on bus voltage
and frequency the system has been implemented in
MATLAB/Simulink and PowerFactory.

133
II. DISTRIBUTED ENERGY SYSTEM
ARCHITECTURE. EXPERIMENTAL FACILITY
SYSLAB is a laboratory for research in distributed control
and smart grids with a high share of renewable energy
production. Its experimental facility is a Wind/PV/Diesel
Hybrid Mini-Grid with local storage and a novel control
infrastructure [14]. The facility is spread across three sites
located several hundred meters apart, as can be seen in Fig.
1a).
It includes two wind turbines (11kW and 55kW), a PV-
plant (7.8 kW), a diesel gen-set (48kW/60kVA), an
intelligent office building with controllable loads (20kW), a
number of loads (75kW, 3*36kW) and a Vanadium Battery
of 15 kW/190 kWh. At each of the three sites there is a
switchboard that allows the components installed at the site
to be connected to either of two bus bars. The two bus bars
at each site are connected to a crossbar switchboard
allowing the flexible setup of the system(s) to be studied.
The bus bars can be either connected to the national grid or
can be part of an isolated system. It allows components and
systems to be in grid connected operation, island operation,
or operation in parallel with wind turbine or PV-plant, as it
is shown in Fig. 1b).
The components are all connected in one distributed
control and measurement system that enables very flexible
setup with respect to experimental configuration.
A. PV Panels
The PV panels are mounted in three strings: two strings
having 18 panels of 165 W each, and another one
containing 12 panels of 100 W [15-18]. The strings are
connected to the SYSLAB grid through a three-phase PV
inverter (SMA Sunny Tripower [19]).
a)
b)
Fig. 1. a) SYSLAB Risø’s new laboratory for intelligent, active and
distributed power systems and b) details about SYSLAB Micro-Grid
architecture.
From PV system two sets of data are provided. The first set
consists of the ambient measurements from the weather
station: solar irradiance on the horizontal, ambient
temperature, and wind speed. The second set represents the
electric measurements taken from the inverter: the AC
output power to the grid, and on each PV string the DC
power, voltage, and current. The two sets of data are read at
different sampling frequencies: 1 Hz for the electrical and
0.1 Hz for the ambient. These large sets of data are used to
develop an accurate model of the existing PV setup and to
validate it.
B. Data Acquisition and Control System
The data acquisition and control system (hardware and
software) is responsible for the supervision and control of
the research platform for distributed intelligent energy
systems with a high penetration of renewable energy. The
supervisory software code was written in Java and is able
to manage the data acquisition, processes the data and
executes the control loop and outputs the control variables.
The sensors outputs are connected to a signal conditioning
board, which in turn is connected to the data acquisition
(DAQ) board based on a PC (SCADA System).
III. PV PANELS and ARRAY MODELING
A. Modeling of the PV Panels
This paper uses a single diode equivalent circuit for the PV
model, described by a simple exponential function [15-18]:
1/)(
0 Tss VnRiv
sc eIIi (1)
In which Isc and I0 are the short-circuit and open-circuit
currents, Rs is the cell series resistance, ns is the number of
cells in the panel connected in series and VT represents the
junction thermal voltage which includes the diode quality
factor, the Boltzmann’s constant, the temperature at
standard test conditions (STC) and the charge of the
electron.
Manufacturers typically provide limited operational data
for photovoltaic panels. These data are available only at
standard rating conditions, for which the irradiance Ga is
1000 W/m2 and the cell temperature Tcell is 25 °C, except
for the nominal operation conditions (NOCT) which is
determined at 800 W/m2 and an ambient temperature Ta of
20 °C.
Equations for the short circuit current Isc and the open
circuit voltage Voc as a function of absolute temperature ΔT
include temperature coefficients that provide the rate of
change with respect to temperature of the PV performance
parameters, can be express as [20-22]:
acell
ococ
Iscsc
TTT
TVV
TII
1
1
25
25
(2)

133
To complete the model it is also necessary to take into
account the variation of the parameters with respect to
irradiance [20-22]:
)1000/(25 ascsc GII (3)
The model used to obtain the static characteristics of the
PV panels has been developed in MATLAB using the
equations presented above. The model was developed for
one panel, as a function of irradiance and temperature. The
model has as inputs Ga and Tcell on the panel and it sweeps
the voltage range of the PV panel in order to calculate the
output current and power. PV cells have nonlinear i-v and
p-v characteristics. Its output voltage and power change
according to temperature and irradiation [15-17].
Fig. 2 shows the typical characteristics for a PV model and
also a comparison between PV technical characteristics of
the Schuko S165-SP panel from datasheet (on the left)
versus simulation results for the panel.
B. Modeling and Implementation of the PV Array
Using a four parameters model of a single diode equivalent
circuit, the v-i characteristics for a solar panel string
depending on irradiance and temperature has the following
expressions:
)1000//(1ln 25 ascspTspsocps GIniVnnVnv (4)
a)
b)
c)
Fig. 2. Comparison between PV technical characteristics from datasheet (on the left) and simulation results for one panel.
)/()(1
vnniRVnv
scspspssocpseIni
(5)
The equations (4) and (5) were obtained replacing (2) and
(3) in (1) and also introducing the number of panels in
series (nps) for each string and the number of strings in
parallel (nsp) and can be used to calculate the voltage and
current over a string of panels [20-22].
For obtaining the maximum power of the panel strings, the
condition (dp/dv=0) should be fulfilled.
The block diagram implemented in Simulink that was
developed to implement this model is depicted in Fig. 3.
IV. IMPROVEMENTS and VALIDATION of the PV
ARRAY MODEL
A. Parameters dependence on operating conditions
Two types of measurements are taken from the
experimental facility: ambient measurements from the
weather station and electrical measurements taken from the
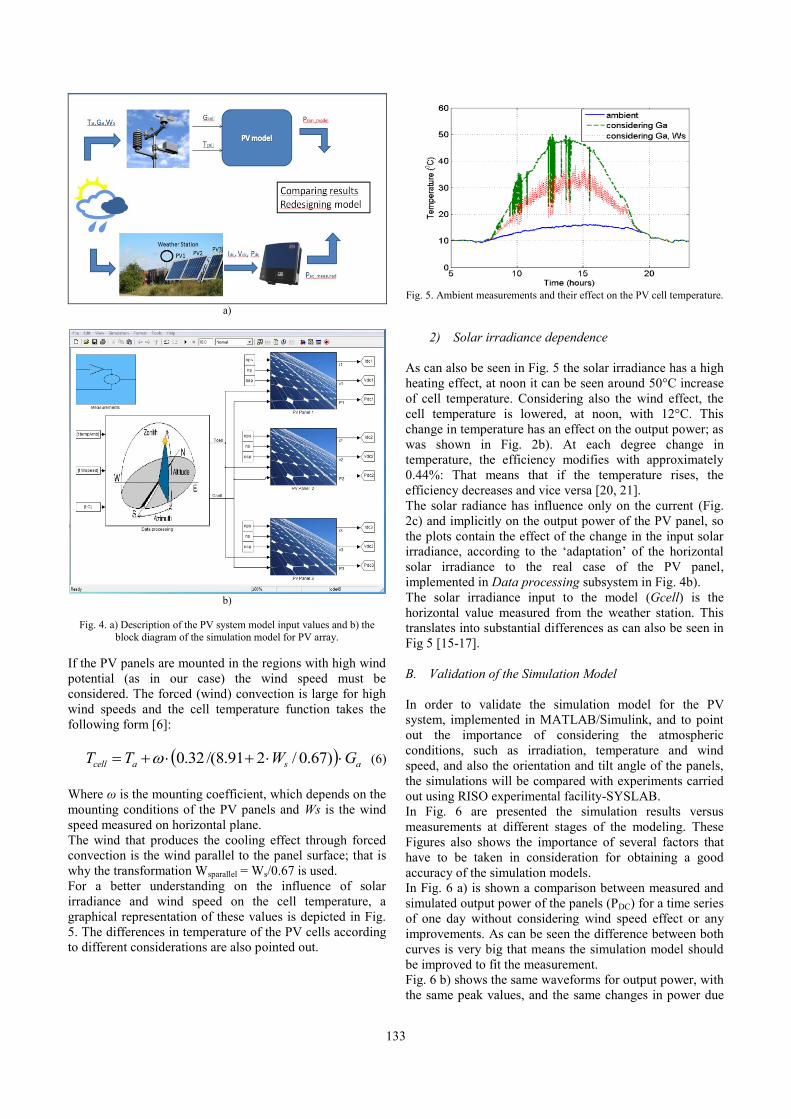
inverter as can be seen in Fig. 4a). All these measurements
are implemented into our model using a subsystem called
Measurements, as it is shown in Fig. 4b).
The three ambient measurements: ambient temperature,
horizontal solar radiation, and wind speed are fed to a
module that calculates the cell temperature of the PV
panels and the solar radiation on them.
The simulation model implemented in MATLAB/Simulink
for a PV array with three strings is depicted in Fig. 4b). The
irradiation, ambient temperature and wind speed are
reading from a real data file measured by SCADA system
as a function of time and then converted by Data
processing subsystem in cell temperature and irradiation,
parameters used as inputs to PV panels, as can also be seen
in Fig. 4b).
1) Cell Temperature dependence
The cell temperature Tcell can be very different from the
ambient temperature Ta and it depends on the solar
irradiation Ga, Ta and also on the wind speed Ws. Solar
irradiation acts on increasing Tcell and the wind speed has a
cooling effect and lowers Tcell [4], [15-17].
Fig. 3. PV string model implemented in Simulink
133
a)
b)
Fig. 4. a) Description of the PV system model input values and b) the
block diagram of the simulation model for PV array.
If the PV panels are mounted in the regions with high wind
potential (as in our case) the wind speed must be
considered. The forced (wind) convection is large for high
wind speeds and the cell temperature function takes the
following form [6]:
asacell GWTT )67.0/291.8/(32.0 (6)
Where ω is the mounting coefficient, which depends on the
mounting conditions of the PV panels and Ws is the wind
speed measured on horizontal plane.
The wind that produces the cooling effect through forced
convection is the wind parallel to the panel surface; that is
why the transformation Wsparallel = Ws/0.67 is used.
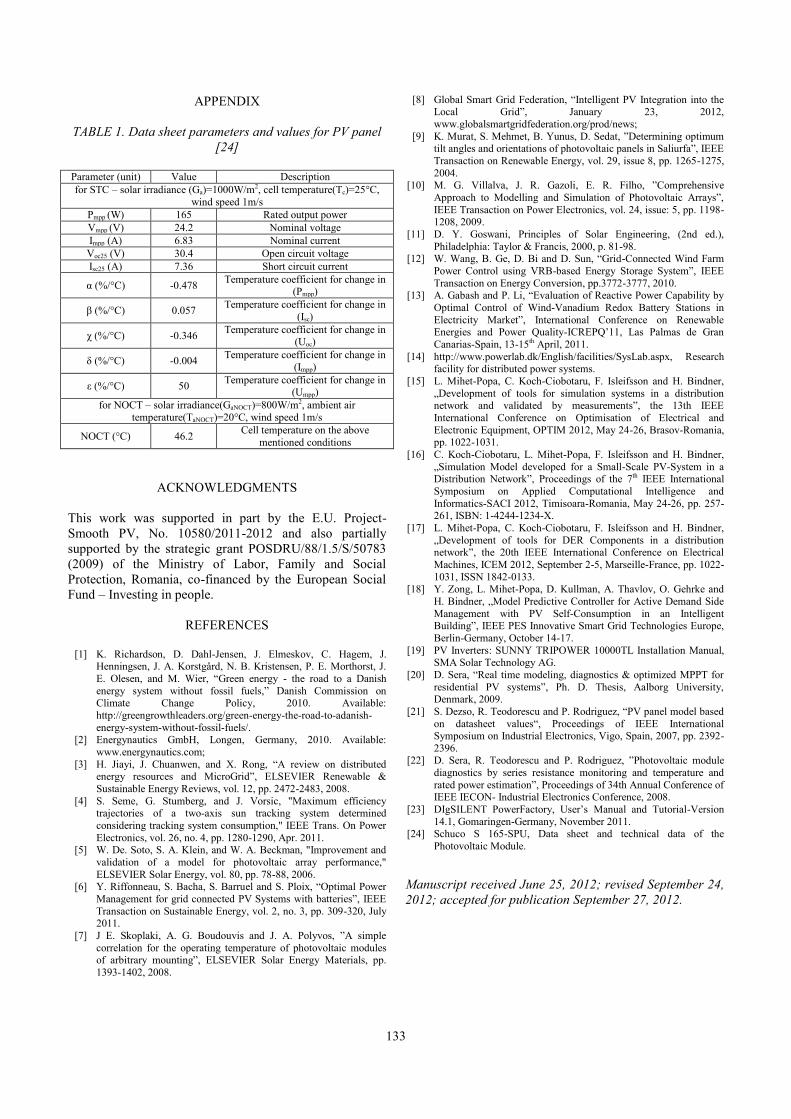
For a better understanding on the influence of solar
irradiance and wind speed on the cell temperature, a
graphical representation of these values is depicted in Fig.
5. The differences in temperature of the PV cells according
to different considerations are also pointed out.
Fig. 5. Ambient measurements and their effect on the PV cell temperature.
2) Solar irradiance dependence
As can also be seen in Fig. 5 the solar irradiance has a high
heating effect, at noon it can be seen around 50°C increase
of cell temperature. Considering also the wind effect, the
cell temperature is lowered, at noon, with 12°C. This
change in temperature has an effect on the output power; as
was shown in Fig. 2b). At each degree change in
temperature, the efficiency modifies with approximately
0.44%: That means that if the temperature rises, the
efficiency decreases and vice versa [20, 21].
The solar radiance has influence only on the current (Fig.
2c) and implicitly on the output power of the PV panel, so
the plots contain the effect of the change in the input solar
irradiance, according to the ‘adaptation’ of the horizontal
solar irradiance to the real case of the PV panel,
implemented in Data processing subsystem in Fig. 4b).
The solar irradiance input to the model (Gcell) is the
horizontal value measured from the weather station. This
translates into substantial differences as can also be seen in
Fig 5 [15-17].
B. Validation of the Simulation Model
In order to validate the simulation model for the PV
system, implemented in MATLAB/Simulink, and to point
out the importance of considering the atmospheric
conditions, such as irradiation, temperature and wind
speed, and also the orientation and tilt angle of the panels,
the simulations will be compared with experiments carried
out using RISO experimental facility-SYSLAB.
In Fig. 6 are presented the simulation results versus
measurements at different stages of the modeling. These
Figures also shows the importance of several factors that
have to be taken in consideration for obtaining a good
accuracy of the simulation models.
In Fig. 6 a) is shown a comparison between measured and
simulated output power of the panels (PDC) for a time series
of one day without considering wind speed effect or any
improvements. As can be seen the difference between both
curves is very big that means the simulation model should
be improved to fit the measurement.
Fig. 6 b) shows the same waveforms for output power, with
the same peak values, and the same changes in power due

133
to shading effect in a synchronous manner. The simulation
has a delay of around 50 minutes. This is the effect of the
PV panels’ orientation, which have a 13° deviation from
the E-W axis.
Considering the tilt angle and the orientation of the panels,
the influence of solar irradiance and wind speed on the cell
temperature the measurements and simulations are almost
identically, as can be seen in Fig. 6 c).
In Fig. 7 are presented some simulation results versus
measurements for Schuko165 PV panel installed at RISO
campus. A good alignment between simulations and
measurements was found, as can also be seen in Fig. 7.
a)
b)
c)
Fig. 6. Simulation results versus measurements at different stages of the
modeling.
Fig. 7. DC Current, Voltage and Power for Schuko165 PV panel and the
output power of the inverter (Pac) as a function of time for 24 hours.
V. SIMULATION MODEL of the PV SYSTEM
DEVELOPED and IMPLEMENTED in
POWERFACTORY for DISTRIBUTION NETWORKS
Computer models of power systems are widely used by
power system utilities to study load flow, steady-state
voltage stability and dynamic and transient behavior.
DIgSILENT PowerFactory has been chosen because
provides the ability to simulate load flow, RMS
fluctuations in the same software environment. It provides
a comprehensive library of models for electrical
components in the power system [23].
The dynamic model of the PV System implemented in
PowerFactory has been built with standard components
library and is based on the same equations used for
MATLAB/Simulink model presented before.
The blocks of the PV model, DC-Link and controller of the
Static Generator are implemented in the dynamic
simulation language DSL of DIgSILENT. DSL allows the
user to implement specific models that are not standard in
the DIgSILENT library and thus to create own developed
blocks either as modifications of existing models or as
completely new models. The internal simulation language
DSL has also been used to define the PV characteristics
and to initialize the parameters and variables of the model.
Fig. 8 a) shows a single line diagram of the SYSLAB
laboratory architecture implemented in PowerFactory [15-
17].
Fig. 8 b) shows the schematic structure of the PV System
model, developed for time-domain simulations where a
DSL model is required, including Photovoltaic Model, DC-
Link Model, PLL block and Static Generator with its
Controller. The Static Generator is an easy to use model of
any kind of static (non rotating) generators. The common
characteristic of these generators is that they are all
connected to the grid through a static converter.
Applications are PV Generators, Storage devices, wind
generators etc.

133
On the basic date tab of the single line diagram it is
possible to set up the number of parallel generators and the
power ratings of one PV panel.
For load flow analysis, also shown in Fig. 9, the local
voltage controller could be set to three different modes:
cosφ, V and droop [23].
For RMS and EMT simulations the static generator
supports two different models: controlled current and
voltage source models. In our case we use a controlled
current source model which has as inputs d-q axis reference
current coming from the controller and d-q reference angles
(cosref and sinref) from a PLL built-in model.
Photovoltaic Model has as inputs irradiation G and cell
temperature tempCell, obtained from MATLAB-Simulink
model considering the tilt angle, orientation and the
influence of solar irradiation and wind speed on the cell
temperature (Fig. 4), implemented as a look-up table in our
model. Also the MPP of current, power and voltage as a
function of time for one module are shown.
In Fig. 10 is presented a comparison between
measurements and simulations of the inverter output power
for both PV modules (Schuko165 and SOLEL100)
installed at RISO campus in three strings, two strings of 18
Schuko165 panels each and one string of 12 SOLEL panels
a)
Frame PV System:
Static GeneratorElmGenstat
0
1
2
Solar RadiationElmFile*
0
1DC Busbar and Capacitor Model
ElmDsl
0
1
Photov oltaic ModelElmDsl
0
1
2
0
1
Activ ePowerReductionElmDsl
AC VoltageStaVmea
PowerMeasurementStaPQmea*
ControllerElmDsl
0
1
0
1
2
3Frequency Measurement
ElmPhi*
PhaseMeasurement(PLL)ElmPhi*
Frame PV System:
id_ref
tem
pC
ell
Uarray
Iarray
Fmeas pred
uac
G
iq_ref
pis
t
v dcref
sinref ;cosref
DIgSILENT
b)
Fig. 8. a) Single line diagram of SYSLAB configuration implemented in PowerFactory and b) schematic block diagram of the PV system model.

133
8.64E+46.91E+45.18E+43.46E+41.73E+4-1.00E-1 [s]
200,00
150,00
100,00
50,00
0,00
-50,00
PV Array: Power of Module at MPP in W
8.64E+46.91E+45.18E+43.46E+41.73E+4-1.00E-1 [s]
40,00
30,00
20,00
10,00
0,00
-10,00
PV Array: MPP Voltage of Module in V
8.64E+46.91E+45.18E+43.46E+41.73E+4-1.00E-1 [s]
8,00
6,00
4,00
2,00
0,00
-2,00
PV Array: MPP Current of Module in A
8.64E+46.91E+45.18E+43.46E+41.73E+4-1.00E-1 [s]
1200,00
900,00
600,00
300,00
0,00
-300,00
1,00
0,80
0,60
0,40
0,20
0,00
PV Array: tempCell in p.u. (base: 0,10 )
PV Array: G
SubPlot
Date: 1/5/2012
Annex: /1
DIgSILENT
Fig. 9. Simulation results of the PV system model implemented in PowerFactory.
2.4E+11.9E+11.4E+19.6E+04.8E+0-2.8E-5 [h]
8.0E+3
6.0E+3
4.0E+3
2.0E+3
0.0E+0
-2.0E+3
PV_Inverter_block: P_str3 in [W]
PV_Inverter_block: P_str1_2 in [W]
Load_f ile_meas: Measurement value 1
Load_f ile_meas: Measurement value 2
Subplot/Diagramm(1)
Date: 5/2/2012
Annex: /2
DIgSILENT
Fig. 10. Comparison between simulations and measurements of the PV
inverter output power for both types of panels (Sucho and Solel).
VI. CONCLUSIONS
This paper proposes a four-parameter model of a PV panel
and a PV system, implemented in MATLAB/Simulink,
using data provided by the manufacturer with semi-
empirical equations to predict the PV characteristics for
any condition. PV characteristics are modeled according to
a single diode four parameter equivalent circuit and PV
parameters values taken from the manufacturer technical
data.
The paper also proposes a model that relies on ambient data
from a local weather station, like most common in a real
situation, not from sensors mounted on the PV panels. The
model calculates the cell temperature and the solar
irradiance on the PV panels considering, among others, the
tilt angle, the orientation of the panels, and the wind
cooling effect. The paper shows that these factors
significantly influence the power output from the PV
panels.
Comparison with experimental data, acquired by SCADA
system and processed by MATLAB, and with the
characteristics of the PV panels, provided by
manufacturers, has shown that the model implemented in
MATLAB/Simulink can be an accurate tool for the
prediction of energy production.
A PV system model, using the same equations and
parameters as in MATLAB/Simulink to define the PV
module and characteristics, has also been developed and
implemented in PowerFactory to study load flow, steady-
state voltage stability and dynamic behavior of a distributed
power system.
A comparison between both simulation models,
implemented in MATLAB/Simulink and PowerFactory,
has shown a good similarity. The models have also been
validated against measurements using SYSLAB
experimental facilities. That means that this work can be
used for further development of tools for DER components
in a distributed network.
133
APPENDIX
TABLE 1. Data sheet parameters and values for PV panel
[24]
Parameter (unit) Value Description
for STC – solar irradiance (Ga)=1000W/m2, cell temperature(Tc)=25°C,
wind speed 1m/s
Pmpp (W) 165 Rated output power
Vmpp (V) 24.2 Nominal voltage
Impp (A) 6.83 Nominal current
Voc25 (V) 30.4 Open circuit voltage
Isc25 (A) 7.36 Short circuit current
α (%/°C) -0.478 Temperature coefficient for change in
(Pmpp)
β (%/°C) 0.057 Temperature coefficient for change in
(Isc)
χ (%/°C) -0.346 Temperature coefficient for change in
(Uoc)
δ (%/°C) -0.004 Temperature coefficient for change in
(Impp)
ε (%/°C) 50 Temperature coefficient for change in
(Umpp)
for NOCT – solar irradiance(GaNOCT)=800W/m2, ambient air
temperature(TaNOCT)=20°C, wind speed 1m/s
NOCT (°C) 46.2 Cell temperature on the above
mentioned conditions
ACKNOWLEDGMENTS
This work was supported in part by the E.U. Project-
Smooth PV, No. 10580/2011-2012 and also partially
supported by the strategic grant POSDRU/88/1.5/S/50783
(2009) of the Ministry of Labor, Family and Social
Protection, Romania, co-financed by the European Social
Fund – Investing in people.
REFERENCES
[1] K. Richardson, D. Dahl-Jensen, J. Elmeskov, C. Hagem, J.
Henningsen, J. A. Korstgård, N. B. Kristensen, P. E. Morthorst, J.
E. Olesen, and M. Wier, “Green energy - the road to a Danish
energy system without fossil fuels,” Danish Commission on Climate Change Policy, 2010. Available:
http://greengrowthleaders.org/green-energy-the-road-to-adanish-
energy-system-without-fossil-fuels/. [2] Energynautics GmbH, Longen, Germany, 2010. Available:
www.energynautics.com;
[3] H. Jiayi, J. Chuanwen, and X. Rong, “A review on distributed energy resources and MicroGrid”, ELSEVIER Renewable &
Sustainable Energy Reviews, vol. 12, pp. 2472-2483, 2008.
[4] S. Seme, G. Stumberg, and J. Vorsic, "Maximum efficiency trajectories of a two-axis sun tracking system determined
considering tracking system consumption," IEEE Trans. On Power
Electronics, vol. 26, no. 4, pp. 1280-1290, Apr. 2011. [5] W. De. Soto, S. A. Klein, and W. A. Beckman, "Improvement and
validation of a model for photovoltaic array performance,"
ELSEVIER Solar Energy, vol. 80, pp. 78-88, 2006. [6] Y. Riffonneau, S. Bacha, S. Barruel and S. Ploix, “Optimal Power
Management for grid connected PV Systems with batteries”, IEEE
Transaction on Sustainable Energy, vol. 2, no. 3, pp. 309-320, July 2011.
[7] J E. Skoplaki, A. G. Boudouvis and J. A. Polyvos, ”A simple
correlation for the operating temperature of photovoltaic modules of arbitrary mounting”, ELSEVIER Solar Energy Materials, pp.
1393-1402, 2008.
[8] Global Smart Grid Federation, “Intelligent PV Integration into the Local Grid”, January 23, 2012,
www.globalsmartgridfederation.org/prod/news;
[9] K. Murat, S. Mehmet, B. Yunus, D. Sedat, ”Determining optimum tilt angles and orientations of photovoltaic panels in Saliurfa”, IEEE
Transaction on Renewable Energy, vol. 29, issue 8, pp. 1265-1275,
2004. [10] M. G. Villalva, J. R. Gazoli, E. R. Filho, ”Comprehensive
Approach to Modelling and Simulation of Photovoltaic Arrays”,
IEEE Transaction on Power Electronics, vol. 24, issue: 5, pp. 1198-1208, 2009.
[11] D. Y. Goswani, Principles of Solar Engineering, (2nd ed.),
Philadelphia: Taylor & Francis, 2000, p. 81-98. [12] W. Wang, B. Ge, D. Bi and D. Sun, “Grid-Connected Wind Farm
Power Control using VRB-based Energy Storage System”, IEEE
Transaction on Energy Conversion, pp.3772-3777, 2010. [13] A. Gabash and P. Li, “Evaluation of Reactive Power Capability by
Optimal Control of Wind-Vanadium Redox Battery Stations in
Electricity Market”, International Conference on Renewable Energies and Power Quality-ICREPQ’11, Las Palmas de Gran
Canarias-Spain, 13-15th April, 2011.
[14] http://www.powerlab.dk/English/facilities/SysLab.aspx, Research facility for distributed power systems.
[15] L. Mihet-Popa, C. Koch-Ciobotaru, F. Isleifsson and H. Bindner,
„Development of tools for simulation systems in a distribution network and validated by measurements”, the 13th IEEE
International Conference on Optimisation of Electrical and
Electronic Equipment, OPTIM 2012, May 24-26, Brasov-Romania, pp. 1022-1031.
[16] C. Koch-Ciobotaru, L. Mihet-Popa, F. Isleifsson and H. Bindner,
„Simulation Model developed for a Small-Scale PV-System in a Distribution Network”, Proceedings of the 7th IEEE International
Symposium on Applied Computational Intelligence and
Informatics-SACI 2012, Timisoara-Romania, May 24-26, pp. 257-261, ISBN: 1-4244-1234-X.
[17] L. Mihet-Popa, C. Koch-Ciobotaru, F. Isleifsson and H. Bindner,
„Development of tools for DER Components in a distribution network”, the 20th IEEE International Conference on Electrical
Machines, ICEM 2012, September 2-5, Marseille-France, pp. 1022-
1031, ISSN 1842-0133.
[18] Y. Zong, L. Mihet-Popa, D. Kullman, A. Thavlov, O. Gehrke and
H. Bindner, „Model Predictive Controller for Active Demand Side
Management with PV Self-Consumption in an Intelligent Building”, IEEE PES Innovative Smart Grid Technologies Europe,
Berlin-Germany, October 14-17.
[19] PV Inverters: SUNNY TRIPOWER 10000TL Installation Manual, SMA Solar Technology AG.
[20] D. Sera, “Real time modeling, diagnostics & optimized MPPT for
residential PV systems”, Ph. D. Thesis, Aalborg University, Denmark, 2009.
[21] S. Dezso, R. Teodorescu and P. Rodriguez, “PV panel model based
on datasheet values“, Proceedings of IEEE International Symposium on Industrial Electronics, Vigo, Spain, 2007, pp. 2392-
2396. [22] D. Sera, R. Teodorescu and P. Rodriguez, ”Photovoltaic module
diagnostics by series resistance monitoring and temperature and
rated power estimation”, Proceedings of 34th Annual Conference of IEEE IECON- Industrial Electronics Conference, 2008.
[23] DIgSILENT PowerFactory, User’s Manual and Tutorial-Version
14.1, Gomaringen-Germany, November 2011.
[24] Schuco S 165-SPU, Data sheet and technical data of the
Photovoltaic Module.
Manuscript received June 25, 2012; revised September 24,
2012; accepted for publication September 27, 2012.