development bank of japan research report no. 34...in maturing domestic home appliances markets and...
TRANSCRIPT

Development Bank of Japan Research Report No. 34 Prospects and Challenges Surrounding Japan’s Electrical Equipment Industry: General Electrical Equipment Manufacturers’ Restructuring of Operations and Future Prospects
November 2002 Economic and Industrial Research Department Development Bank of Japan

Contents
Summary ............................................................................................................................................... iii Introduction ............................................................................................................................................ 1 I Profitability Comparison between Major American and Japanese Manufacturers ............... 2
1. Entities Used for Analysis ......................................................................................................... 2 2. Comparison of Companies in Terms of Profitability Since the 1980s.......................................... 2 3. Time Series Changes in Japanese Manufacturers’ Profitability by Business Area........................ 8 4. Profitability Characteristics of Japanese Manufacturers............................................................ 11
II Industry Trends by Segment....................................................................................................... 13
1. Semiconductors ....................................................................................................................... 13 2. Home Appliances .................................................................................................................... 22 3. Information and Communications Equipment .......................................................................... 27
III Characteristics of the Business Models Being Used by the Major American and
Japanese Electrical Equipment Manufacturers........................................................................ 31 1. Development and Current Status of the Major American and
Japanese Electrical Equipment Manufacturers’ Business Areas ................................................ 31 2. Impacts of Increasing Modularization and Outsourcing............................................................ 34 3. Increasing Awareness of the Importance of the “Smile Curve” ................................................. 36
IV General Electrical Equipment Manufacturers’ Restructuring of
Operations and Future Prospects............................................................................................... 39 1. Recent Instances of Restructuring ............................................................................................ 39 2. Shifting of Production Activities, etc. to Other Countries ......................................................... 41 3. Increasing Business Partnerships ............................................................................................. 44 4. Japanese General Electrical Equipment Manufacturers’ Restructuring of
Operations and Future Prospects.............................................................................................. 49 5. Conclusions............................................................................................................................. 50
Appendix .............................................................................................................................................. 51 References ............................................................................................................................................ 53
Development Bank of Japan Research Report/ No. 34 i

Prospects and Challenges Surrounding Japan’s Electrical Equipment Industry: General Electrical Equipment Manufacturers’ Restructuring of Operations and Future Prospects Summary 1. The revenues of major companies in the Japanese electrical equipment industry, which is one of the key manufacturing industries in Japan, have been declining sharply since 2001 and most of them are being forced to restructure their op-erations drastically. This report reviews the cur-rent competitiveness of Japanese electrical equipment manufacturers and investigates the industry’s future prospects in view of the re-structuring efforts being undertaken by the manufacturers, focusing on the differences be-tween the major American and Japanese electri-cal equipment manufacturers in terms of profit-ability and business models adopted. 2. A comparison of the major American and Japanese electrical equipment manufacturers in terms of profitability shows that there were dis-tinct changes in the 1980s and 1990s. Both the return on assets (ROA) and operating profit on sales of Japanese electrical equipment manufac-turers were not significantly different from those of their American counterparts in the early 1980s, but the differences gradually grew and became significant in the 1990s. By segment, the operat-ing profit on sales for American semiconductor manufacturers and Japanese component & device manufacturers has been high, while there have been marked declines in the operating profit among Japanese general electrical equipment manufacturers. In terms of total assets turnover, the figures for American manufacturers have been consistently higher than those for Japanese manufacturers. The widening gap in ROA is the result of the widening gap in operating profit on sales. Regarding the contribution of each segment to the declines in profitability of Japanese gen-eral electrical equipment manufacturers, the overall profitability was reduced structurally by the semiconductor segment and over the time
series by the home appliances and heavy electric apparatus segments. In particular, the profitabil-ity of the Japanese semiconductor segment is low (even though it has the top five companies in terms of sales) in contrast with its American counterpart (that has five specialized manufac-turers), which is the most profitable segment in the United States. 3. With regard to the semiconductor segment, investigation of changes in semiconductor ship-ment share by nationality of manufacturer re-vealed that the share of Japanese manufacturers has been declining since peaking at the end of the 1980s and the gap with the share of Ameri-can manufacturers has been widening. The Japa-nese manufacturers have been producing a full range of semiconductor products, but have been unable to maintain their market shares for prod-ucts that dominate the overall semiconductor market such as memory devices, and so their to-tal shares have also been decreasing. On the other hand, American manufacturers are more specialized in the semiconductor busi-ness, and manufacturers with the highest sales have strong areas where they hold large market shares. In addition, their use of foundry manu-facturers in other countries such as Taiwan has helped increase their market shares. Although capital spending on semiconduc-tor production facilities has been vast worldwide and continues to increase, that of Japanese manufacturers was exceeded in 1990s by American manufacturers and then by Asian countries, and the gaps are widening. The Japa-nese manufacturers’ ratios of R&D expenditure to sales are higher than those of American manufacturers, but this has not improved their revenues. The Japanese manufacturers are now facing difficult choices as to the positioning of their semiconductor divisions. One area in which Japanese manufacturers have a dominant market share is home appli-
Development Bank of Japan Research Report/ No. 34 iii

ances and in particular audio-visual equipment, as the domestic user base expanded significantly in the late 1980s. The decreased profitability in the home appliances segment is partly due to re-cent drops in unit prices of these products. 4. The profitability gap between American and Japanese electrical equipment manufacturers is partly due to the differences in business model. Specifically, the top Japanese manufacturers by sales are general manufacturers, whereas the top American ones are specialized manufacturers. There are also differences in business policies. American manufacturers have been radically re-structuring their businesses (i.e. eliminating un-profitable divisions and concentrating resources in core businesses), such as General Electric (GE) in the 1980s and IBM in the early 1990s, while Japanese manufacturers have been ex-panding. Recent instances of M&A also illustrate that American manufacturers are reinforcing their business base by focusing on existing strengths. The increasing modularization and other developments in the electrical equipment indus-try have led to an emphasis on reducing produc-tion costs rather than using more sophisticated production technologies, and this has accelerated outsourcing such as the use of EMS companies by American PC manufacturers and the use of foundry companies by semiconductor manufac-turers. Manufacturers have begun to recognize the existence of an added value curve called the “smile curve”, a notable characteristic of PC production processes, which has been affecting Japanese manufacturers’ restructuring efforts. The difference between American and Japanese manufacturers in terms of business model as well as the increasing modularization and digitization have caused the profitability gap to widen be-tween American and Japanese manufacturers. 5. Over the past several years, Japanese gen-eral electrical manufacturers have made various efforts to restructure their operations. In particu-lar, there were marked increases in employee cutbacks and withdrawals from markets in 2001 as the IT recession worsened. On the other hand, there have also been new efforts such as general electrical manufacturers have entered the EMS
market and restructured their organizations to speed up decision-making by introducing a company-in-company system. Production bases have been increasingly shifted to overseas coun-tries in the long term, and efforts to strengthen software and service divisions to capitalize on the ongoing expansion of PC and Internet users have also been increasing. Japanese general electrical manufacturers have been forming partnerships with each other in maturing domestic home appliances markets and with Chinese manufacturers in Chinese markets that are expected to expand in the future. In the information and communications technol-ogy (IT) equipment segment, they have been forming partnerships with American and Euro-pean manufacturers with a view to becoming a top manufacturer that dominates competitors in industry standards. In the semiconductor and other electronic component & device segments in which capital spending on facilities and R&D expenditure are huge and increasing, Japanese general electrical manufacturers have been ac-tively building partnerships with domestic and foreign manufacturers to reduce the burden. These moves reflect the fact that there are now fewer profitable fields as new manufacturers have entered the field and increased the competi-tion. Business partnerships in the electrical equipment industry are different from those in other industries such as between manufacturers of materials, etc. as they are formed on a seg-ment-by-segment basis rather than as partner-ships between companies or through acquisition. Because Japanese general electrical manu-facturers, unlike American manufacturers, have grown to their current sizes by entering new business areas, they are unlikely to shed many unprofitable divisions rapidly and transform themselves into an American-style specialized manufacturer. Instead, they will tend to slowly reinforce operations in their strong areas while gradually shedding unprofitable divisions through forming partnerships with domestic and overseas manufacturers.
[Shiro Kan (e-mail: [email protected])] [Mikimasa Kobayashi
(e-mail: [email protected])]
iv Development Bank of Japan Research Report/ No. 34

Introduction The ten-year period between 1990 and 2000 is seen as a decade of decline in the international competitiveness of Japanese industry. Japanese companies suffered falling sales and many ma-jor firms, in both manufacturing and non- manufacturing industries, were acquired by American and European companies during this period as the domestic economy slumped. In contrast with the 1970s and 1980s when major Japanese companies enjoyed rising revenues and profit as their products, especially home appliances and automobiles, sold well through-out the world, the 1990s was a major turning point. The electrical equipment industry, which is one of the key manufacturing industries in Ja-pan, also suffered a loss in competitiveness in the 1990s: both the sales of major manufactur-ers and the share of Japanese firms in the inter-national semiconductor market declined. The decline in the competitiveness of Japa-nese electrical equipment manufacturers is partly attributable to the recent rise of emerging manufacturers from South Korea, Taiwan, and other countries that have become increasingly competitive in various aspects including tech-nology and brand power. In particular, the re-cent dramatic rise of Chinese manufacturers has been viewed in some quarters as a threat to Japanese manufacturers. The shifting of pro-duction bases, especially for assembly proc-esses, to developing countries to take advantage of lower costs including labor, and the rise of developing countries’ manufacturers by acquir-
ing technological competitiveness and the re-sultant expansion of their market shares, are inevitable. Indeed, Japanese companies devel-oped in the same way. However, American electrical equipment manufacturers, which seemed to have been surpassed by their Japa-nese counterparts’ growth up until the 1980s, regained their competitiveness in the 1990s and are now central players in the global IT indus-try; they have overtaken Japanese electrical equipment manufacturers and widened their lead in market shares in the semiconductor and other markets and boosted profitability. Thus, it is not an inevitable one-way process that de-veloping countries’ manufacturers will overtake industrialized countries’ manufacturers as the competitiveness gap narrows. Major Japanese manufacturers have been drastically restructuring since the global IT re-cession in 2001. Although there are some pes-simistic forecasts about the future of the Japa-nese manufacturing industry as a whole, a sim-plistic extrapolation from current trends cannot accurately forecast future prospects, as evi-denced by the fact that most forecasts published in the 1990s were pessimistic about the future of American manufacturers. This report identifies, taking into account the above-mentioned considerations and mainly by comparing the major American and Japanese manufacturers in terms of profitability and busi-ness models, the factors that contributed to the decline in the competitiveness of Japanese electrical equipment manufacturers and pro-poses measures for regaining competitiveness.
Development Bank of Japan Research Report/ No. 34 1

I Profitability Comparison between Major American and Japanese Manufacturers
1. Entities Used for Analysis Perspectives To analyze the international competitiveness of an industry, it is necessary to define the entities (country, company, etc.) used for the analysis. This report analyzes the competitiveness of the top manufacturers by sales in the American electrical equipment industry and their coun-terparts in Japan, in terms of profitability, dominance in the market, etc. In this report, the nationality of a company is based on the loca-tion of the headquarters of the consolidated company group, as manufacturers often have production and sales bases internationally. With this background, the analysis considers the various restructuring efforts of Japanese manu-facturers. Entities Used for Analysis Chapter I uses the closing data of major Ameri-can and Japanese electrical equipment manufac-turers (consolidated closing data; the same applies hereafter unless noted otherwise), because these data cover many years and thus allow a sound statistical analysis. The entities used for analysis are the top sales companies which are headquartered in Japan or America1 and operating mainly in the electrical equip-ment industry.2
1 North America: Hereafter in this report, “America(n)” refers to the United States and Canada unless otherwise specified. 2 The range of the electrical equipment industry is wide, and has partly overlapped the general machinery, precision machinery and auto parts industries in recent years. This report uses a definition of the term “Japanese electrical equipment companies” that roughly corresponds with but is slightly different from that used in the new industrial classification of the Tokyo Stock Exchange, and defines the term “American manufacturers” based on the standard industrial classification (i.e. companies falling under SIC Code 3570 to 3577 and 3600 to 3699). In terms of com-pany size, this report uses the companies that were listed as the top consolidated sales companies on the basis of 2000 sales (17 Japanese companies and 25 American companies), which are considered to occupy important positions in American and Japanese industry. For a list of
the companies used for the statistical calculations, refer to the attached table. IBM is not included in the statistics, because it was classified as a service industry company as of 2000.
The analysis makes comparisons between American and Japanese companies, as well as between companies operating in different busi-ness areas, in terms of long-term profitability (from the 1980s to 1990s) based on return on assets (ROA), and total assets turnover and op-erating profit on sales obtained by decomposing the ROA figures. 2. Comparison of Companies in Terms of
Profitability Since the 1980s
2.1 Return on Assets (ROA) Figure 1-1 compares major American and Japanese electrical equipment manufacturers in terms of the time series changes in ROA, which is a main indicator of corporate profitability. Although simplistic comparisons must be avoided because companies use varying ac-counting standards, the ROA figure for 25 American manufacturers3 was roughly steady throughout the 1980s and rose slightly in the mid 1990s, whereas that for 17 Japanese manu-facturers dropped between the late 1980s and early 1990s and remained low at about 4% for the remainder of the 1990s, hence the gap with American manufacturers gradually widened. In addition to this widening, American manufac-turers maintained their profitability, and the gap was already widening even in the 1980s when Japanese manufacturers were expanding their market shares with various products and in-creasing revenues.
3 Only 15 of the 25 manufacturers existed in 1983.
2 Development Bank of Japan Research Report/ No. 34

In entered figures ffacturersAmericathe gap bfacturersbubble bspendingber 11 afocuses o1980s anerage ye Figuchanges different
4 In thisJapanese mAmerican (1) 5 ma
and/or(2) 3 EMS(3) 17 ma
commmanuf
Japanese m(1) 10 gen(2) 4 elect(3) 3 othe
-4%
0%
4%
8%
12%
16%
20%
83 84 85 86 87 88 89 90 91 92 93 94 95 96 97 98 99 00 01 Year
RO
A
25 American manufacturers17 Japanese manufacturers
Fig. 1-1 Comparison of Time Series Changes in ROA of Major American and Japanese Electrical Equipment Manufacturers
Notes: 1. For a list of the companies used for the statistical calculations, refer to the attached table.
2. Settlement terms differ between companies, especially between American and Japanese companies.
Sources: Development Bank of Japan “Financial Data Bank”; Standard & Poor’s “Compustat”
2001, the world, including America, a serious IT recession and the ROA or both American and Japanese manu- plunged. Because the ROA figure for n manufacturers dropped more sharply, etween American and Japanese manu-
narrowed. The year 2001, when the IT urst, was an aberration, with consumer falling dramatically after the Septem-ttacks in the United States. This report n long-term trends such as those in the d 1990s and treats 2001 as a non-av-
ar. re 1-2 compares the time series in ROA of manufacturers operating in business areas.4 The ROA figure for
the five American semiconductor manufactur-ers rose dramatically in the 1990s as Intel and other companies increased their sales, and the ROA figure for the 17 American companies that manufacture information and communica-tions equipment, PCs, etc. remained steady at around 10%. Both the ROA figures for the 10 Japanese general electrical equipment manu-facturers and four Japanese electronic compo-nent & device manufacturers fell between the late 1980s and early 1990s, but the latter rose toward the late 1990s and reached 13.0% in 2000. On the other hand, the ROA figure for the 10 Japanese general electrical equipment manufacturers remained low throughout the 1990s. Although the figure improved slightly toward 2000, the profitability of Japanese gen-eral electrical equipment manufacturers was low relative to that of American manufacturers and Japanese electronic component & device manufacturers, and they have not regained prof-itability even over the long term.
report, the 25 American manufacturers and 17 anufacturers were classified as follows:
manufacturers: nufacturers that manufacture semiconductors related products s (see Note 6) nufacturers that manufacture information and
unications equipment, PCs, etc. including 5 PC acturers anufacturers:
eral electrical equipment manufacturers ronic component & device manufacturers r manufacturers
Development Bank of Japan Research Report/ No. 34 3

-5%
0%
5%
10%
15%
20%
25%
30%
35%
83 84 85 86 87 88 89 90 91 92 93 94 95 96 97 98 99 00 01 Year
RO
A
5 American semiconductor manufacturers17 American manufacturers that manufacture IT equipment, PCs, etc.10 Japanese general electrical equipment manufacturers4 Japanese electronic component & device manufacturers
Fig. 1-2 Comparison of Time Series Changes in ROA of Manufacturers
Operating in Different Business Areas
Sources: Development Bank of Japan “Financial Data Bank”; Standard & Poor’s “Compustat”
2.2 Total Assets Turnover and Operating Profit on Sales
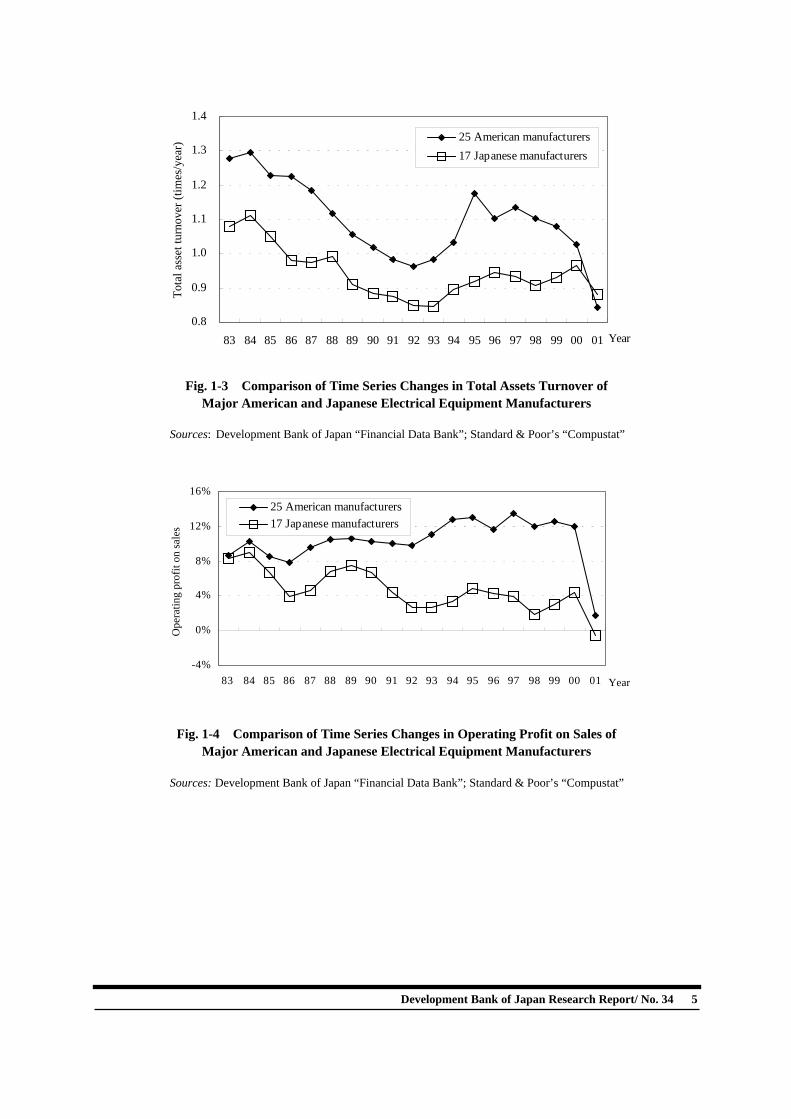
This section analyzes the profitability of the manufacturers selected for this research by making comparisons between American and Japanese manufacturers and between manufac-turers operating in different business areas, in terms of total assets turnover and operating profit on sales (which are indicators obtained by decomposing ROA).5 Figure 1-3 shows that the total assets turn-over figure for American manufacturers was consistently higher than that for Japanese manufacturers by a certain margin throughout the 1980s and 1990s, although there are some variations. This means that American manufac-turers used their assets more efficiently than
Japanese manufacturers.
5 From the relationship (Operating profit and loss / Av-erage total assets (start and end of settlement term)) = (Operating profit and loss / sales) x (Sales / Average total assets (start and end of settlement term)), the following relationship is derived: ROA = Operating profit on sales x Total assets turnover.
In 2001, the total assets turnover figure for American manufacturers dropped sharply and became lower than the total assets turnover fig-ure of Japanese manufacturers for the first time since 1980s. On the other hand, the operating profit on sales for American manufacturers had been similar to that for Japanese manufacturers at around 8% in 1983, but rose consistently thereafter while that for Japanese manufacturers continued to fell, resulting in a wide gap be-tween American (12.0%) and Japanese manu-facturers (4.4%) by the year 2000. Thus, the widened gap in ROA is largely due to the wid-ening differential in operating profit on sales.
4 Development Bank of Japan Research Report/ No. 34
0.8
0.9
1.0
1.1
1.2
1.3
1.4
83 84 85 86 87 88 89 90 91 92 93 94 95 96 97 98 99 00 01 Year
Tota
l ass
et tu
rnov
er (t
imes
/yea
r)
25 American manufacturers17 Japanese manufacturers
Fig. 1-3 Comparison of Time Series Changes in Total Assets Turnover of Major American and Japanese Electrical Equipment Manufacturers
Sources: Development Bank of Japan “Financial Data Bank”; Standard & Poor’s “Compustat”
-4%
0%
4%
8%
12%
16%
83 84 85 86 87 88 89 90 91 92 93 94 95 96 97 98 99 00 01 Year
Ope
ratin
g pr
ofit
on sa
les
25 American manufacturers17 Japanese manufacturers
Fig. 1-4 Comparison of Time Series Changes in Operating Profit on Sales of
Major American and Japanese Electrical Equipment Manufacturers
Sources: Development Bank of Japan “Financial Data Bank”; Standard & Poor’s “Compustat”
Development Bank of Japan Research Report/ No. 34 5

6
0.0
0.5
1.0
1.5
2.0
2.5
3.0
3.5
83 84 85 86 87 88 89 90 91 92 93 94 95 96 97 98 99 00 01 Year
Tota
l Ass
ets T
urno
ver (
times
/yea
r)
5 American semiconductor manufacturers3 American EMSs5 American PC manufacturers10 Japanese general electrical equipment manufacturers4 Japanese electronic component & device manufacturers
Fig. 1-5 Comparison of Time Series Changes in Total Assets Turnover of Manufacturers Operating in Different Business Areas
-5%
0%
5%
10%
15%
20%
25%
30%
83 84 85 86 87 88 89 90 91 92 93 94 95 96 97 98 99 00 01 Year
Ope
ratin
g pr
ofit
on sa
les
5 American semiconductor manufacturers17 American manufacturers that manufacture IT equipment, PCs, etc.10 Japanese general electrical equipment manufacturers4 Japanese electronic component & device manufacturers
Fig. 1-6 Comparison of Time Series Changes in Operating Profit on Sales of Manufacturers Operating in Different Business Areas
Development Bank of Japan Research Report/ No. 34

A comparison of manufacturers operating in different business areas in terms of total as-sets turnover and operating profit on sales shows that the total assets turnover figures for the three American EMSs6 and the five Ameri-can PC manufacturers rose in the 1990s while the total assets turnover figure for the five American semiconductor manufacturers fell. There were no significant fluctuations in the total assets turnover figures for the other groups (both American and Japanese). With regard to operating profit on sales, the figure for the five American semiconductor manufacturers rose dramatically in the 1990s. The operating profit on sales for Japanese elec-tronic component & device manufacturers also rose in the 1990s. On the other hand, the oper-ating profit on sales for Japanese general elec-trical equipment manufacturers fell in the early 1990s and remained low, and so the gap with American manufacturers and other Japanese company groups widened. Figure 1-7 shows the tangible fixed assets
turnover for American and Japanese manufac-turers. Although the turnover of Japanese manufacturers had been higher than that of American manufacturers in the 1980s, they were surpassed by American manufacturers in the 1990s, which means that American manu-facturers improved the efficiency of using their facilities in the 1990s while the efficiency of Japanese manufacturers decreased. Figure 1-8 compares manufacturers operating in different business areas in terms of tangible fixed assets turnover. The turnover for American EMSs and PC manufacturers rose sharply in the 1990s, reflecting increased sales of EMSs which do not have their own factories7 and active outsourcing of work to EMSs, etc. by PC manufacturers. In contrast, no Japanese manufacturer significantly improved its tangible fixed assets turnover dur-ing this period, due to differences between American and Japanese manufacturers in man-agement policies including Japanese manufac-turers’ adherence to a policy of not outsourcing.
6 EMS (Electronics Manufacturing Services) are con-tractors that manufacture and/or assemble electronics equipment (PCs, cellular phones, etc.) without branding. In this report, the term EMSs means EMSs as business entities (e.g. Solectron in the United States).
3
4
5
6
7
83 84 85 86 87 88 89 90 91 92 93 94 95 96 97 98 99 00 01 Year
25 American manufacturers17 Japanese manufacturers
Tang
ible
Fix
ed A
sset
s Tur
nove
r (tim
es/y
ear)
Fig. 1-7 Comparison of Time Series Changes in Tangible Fixed Assets Turnover of Major American and Japanese Electrical Equipment Manufacturers
Sources: Development Bank of Japan “Financial Data Bank”; Standard & Poor’s “Compustat”
Development Bank of Japan Research Report/ No. 34 7
7 They are reducing their apparent tangible fixed assets by using leased factories and production facilities.

3Ma
3.1
Ma
The pand Jabilityprofitequipthrouelectra broble towhicheven Althoto graeas (sincreation s
8 D
0
4
8
12
16
20
83 84 85 86 87 88 89 90 91 92 93 94 95 96 97 98 99 00 01 Year
Tang
ible
fixe
d as
sets
turn
over
(tim
es/y
ear)
5 American PC manufacturers3 American EMSs5 American semiconductor manufacturers10 Japanese general electrical equipment manufacturers4 Japanese electronic component & device manufacturers
Fig. 1-8 Comparison of Time Series Changes in Tangible Fixed Assets Turnover of
Manufacturers Operating in Different Business Areas
Sources: Development Bank of Japan “Financial Data Bank”; Standard & Poor’s “Compustat”
. Time Series Changes in Japanese nufacturers’ Profitability by Business
Area
Method Used to Statistically Calculate Time Series Changes in Japanese nufacturers’ Profitability by Business
Area
revious comparison of major American apanese manufacturers in terms of profit- showed that the ROA and operating
on sales of Japanese general electrical ment manufacturers remained low ghout the 1990s. As each of the general ical equipment manufacturers operates in ad range of business areas, it is not possi- accurately determine from published data business areas are the unprofitable ones though total profitability is clearly low. ugh it has become possible in recent years sp profitability in individual business ar-egments) to a certain extent as a result of sed corporate disclosure, the segmenta-tructure used varies among companies and
the existing published data do not cover a long period. This section deduces the causes of the low profitability of Japanese general electrical equipment manufacturers by segment by ana-lyzing time series data on specialized manufac-turers’ profits and other data. The time series changes in Japanese gen-eral electrical equipment manufacturers’ prof-itability were statistically calculated by segment by using, as samples, the audio-visual home appliances, communications equipment, and heavy electric apparatus segments for which published settlement data are available on spe-cialized and semi-specialized manufacturers, including the part of the general electrical equipment manufacturers’ consolidated settle-ment data that corresponds to these segments. Separate statistical calculations were made for the semiconductor segment, which occupies an important position in all general electrical equipment manufacturers with respect to prof-itability. The objective was to identify which segments of the general electrical equipment manufacturers are unprofitable.
evelopment Bank of Japan Research Report/ No. 34

3.2 Summary of the Results
Figure 1-9 shows the time series changes in the total ROA of Japanese general electrical equipment manufacturers and the ROA of each segment. The total ROA as well as the seg-ment-specific ROA figures fell consistently from the end of the 1980s to the early 1990s, and the decreases in the ROA of the au-dio-visual home appliances segment were most
pronounced. In addition, the ROA of the heavy electric apparatus segment fell below the total ROA of the general electrical equipment manu-facturers in 1994 when capital spending on facilities by the domestic electric utility companies passed the peak8 and remained so for the remainder of the 1990s, dragging down the total ROA. On the other hand, the ROA of the communications equipment segment rose in the late 1990s. This is attributable to the rapid
-8%
-4%
0%
4%
8%
12%
16%
88 89 90 91 92 93 94 95 96 97 98 99 00 01Fiscal year
RO
A
General electrical equipment manufacturersAudio-visual home appliances segmentCommunications equipment segmentHeavy electric apparatus segment
Fig. 1-9 Changes in the Total ROA of Japanese General Electrical Equipment
Manufacturers and the ROA of Each Segment
Note: 10 general electrical equipment manufacturers, 4 audio-visual home appliances manu-facturers, 5 communications equipment manufacturers and 4 heavy electric apparatus manufacturers
4 audio-visual home appliances manufacturers = Pioneer, Victor Company of Japan, Columbia Japan, Aiwa
5 communications equipment manufacturers = Iwatsu Electric, NEC Infrontia, Toyo Communication Equipment, Anritsu, Matsushita Communication Industrial
4 heavy electric apparatus manufacturers = Fuji Electric, Meidensha, Takaoka Electric Mfg., Nissin Electric
Source: Development Bank of Japan “Financial Data Bank”
Development Bank of Japan Research Report/ No. 34 9
8 From “Research on Facility Investment Plans” pub-lished by the Development Bank of Japan. The total capi-tal spending on facilities made by the 9 electric utilities peaked at 4.9 trillion yen in FY 1993 and fell to 2.9 trillion yen in FY 2000.

expansion of the cellular phone market and the resultant increases in capital spending on facili-ties by communications equipment companies. Figure 1-10 shows the time series changes in the total operating profit on sales of Japanese general electrical equipment manufacturers and the operating profit on sales of each segment. The operating profit on sales of the semicon-ductor segment9 fluctuated widely, making both positive and negative contributions. These wide fluctuations are attributable to the replacing of
old products with new products due to the de-creasing circuit line width and increasing de-gree of integration, the market climate changes caused by the fluctuations in supply and de-mand, and other factors.
ofit on sales =
9 The operating profit on sales of the semiconductor segment of the major Japanese general electrical equip-ment manufacturers (Hitachi, Toshiba, Mitsubishi Electric, NEC and Fujitsu) was statistically derived through calcu-lations using data from “DBJ Research Report No.259” for fiscal years 1988 to 1998 and intermediate values taken from the Nikkan Kogyo Shimbun (Daily Industrial Journal) and reports from securities analysts (Nikko Salomon Smith Barney, Mizuho Securities, Nomura Secu-rities Financial Research Center) for fiscal 1999 and suc-ceeding years.
Even though the profitability of the semiconductor segment is essentially unstable due to the silicon cycle, the profitability remained approximately the same as that of the four Japanese electronic component & device manufacturers even in 1994 and 1995 when revenues were high (operating pr
-20%
-10%
0%
10%
20%
88 89 90 91 92 93 94 95 96 97 98 99 00 01Fiscal year
Ope
ratin
g pr
ofit
on sa
les
General electrical equipment manufacturersAudio-visual home appliances segmentCommunications equipment segmentSemiconductor segmentHeavy electric apparatus segment
Fig. 1-10 Changes in the Total Operating Profit on Sales of Japanese General Electrical
Equipment Manufacturers and the Operating Profit on Sales of Each Segment
Note: For the names of the companies used for the calculations for the semiconductor segment and the statistical calculation method used, refer to footnote 9.
Source: Development Bank of Japan “Financial Data Bank”
10 Development Bank of Japan Research Report/ No. 34

were high (operating profit on sales = slightly less than 15%). There is a large gap with the figure (more than 20%) achieved by American semiconductor manufacturers during the same period, and the operating profit on sales in 1988 and 1989 when Japanese manufacturers had more than half of the world market was not so high (statistically calculated value = ap-proximately 3%). There thus appears to be the structural problem among Japanese semicon-ductor manufacturers (segment) that their prof-itability is low even during a boom period or when they have strong market dominance. This point will be discussed further in the following chapters. In this section, the profitability of Japanese general electrical equipment manufacturers was estimated by segment using published settle-ment information of some manufacturers. The analysis revealed that declines in the operating profit on sales of the audio-visual home appli-ances segment, which was one of the most
profitable segments up until 1980s, as well as declines in the operating profit on sales of the heavy electric apparatus segment, which en-joyed stable profitability in the 1980s, contrib-uted to the declines in profitability during the 1990s. In addition, a comparison of the profit-ability of major American and Japanese semi-conductor manufacturers showed a wide gap in profitability between the two, even though they have comparatively dominated the global semiconductor market. 4. Profitability Characteristics of Japanese
Manufacturers In the 1990s, there were significant declines in operating profit on sales for Japanese manufac-turers and especially in those for Japanese gen-eral electrical equipment manufacturers, in con-trast with American manufacturers that main-tained high operating profit on sales. Although the effects of the prolonged recession in the
0.4
0.8
1.2
1.6
2.0
2.4
2.8
88 89 90 91 92 93 94 95 96 97 98 99 00 01Fiscal year
Tota
l ass
ets t
urno
ver (
times
/yea
r)
General electrical equipment manufacturersAudio-visual home appliances segmentCommunications equipment segmentHeavy electric apparatus segment
Fig. 1-11 Changes in the Total Assets Turnover of Japanese General Electrical Equipment
Manufacturers and the Total Assets Turnover of Each Segment
Source: Development Bank of Japan “Financial Data Bank”
Development Bank of Japan Research Report/ No. 34 11

Japanese economy in the 1990s (a macroeco-nomic factor) on the profitability of Japanese manufacturers cannot be ignored10, a compari-son with the figures for Japanese electronic component & device manufacturers clearly shows that the declines in the profitability of Japanese general electrical equipment manu-facturers are serious, and may have causes unique to the general electrical equipment in-dustry. Sales in the Japanese markets, which are a major outlet for the products of Japanese manu-facturers, fell in the 1990s because of the recession. All Japanese general electrical equip-
10 Sales in the Japanese markets which are a major outlet for the products of Japanese manufacturers fell in the 1990s because of the recession. All Japanese general elec-trical equipment manufacturers (except Sony) depended on these markets for more than half of total sales in fiscal 2000.
ment manufacturers (except Sony) depended on these markets for more than half of total sales in fiscal 2000. The following chapters examine the seg-ments that have been dragging down profitabil-ity in time series or relative to the American counterparts for reasons of low profitability, and then examine the differences between the business models used by American and Japa-nese manufacturers, which are considered to be correlated with the profitability gap between the two groups, focusing on general electrical equipment manufacturers.
12 Development Bank of Japan Research Report/ No. 34

II Industry Trends by Segment The previous chapter showed that one of the reasons for the low profitability of Japanese general electrical equipment manufacturers relative to that of American manufacturers was a wide gap between the two groups in the oper-ating profit on sales of the semiconductor seg-ment. In addition, in terms of seg-ment-by-segment contribution to the sharp de-clines in the profitability of Japanese manufac-turers in 2001, the semiconductor segment, which suffered the sharpest declines in sales, was the highest contributor. This chapter identi-fies the factors that have been dragging down profitability by segment using relevant indica-tors.
1. Semiconductors
1.1 Market Trends
An examination of the time series changes in the market share of Japanese manufacturers in
the world semiconductor market (by area clas-sification based on the nationalities of the ship-ping manufacturers) shows that Japanese manufacturers increased their market share in the 1980s and surpassed American manufactur-ers to acquire the top share, with more than half the world market. However, the Japanese manufacturers’ market share peaked in 1988 to 1989 and then continued to fall, allowing American manufacturers to catch up and even-tually surpass Japanese manufacturers in the early 1990s. The gap in market share continued to widen throughout the 1990s, with the market share of Japanese manufacturers at the end of the 1990s falling to less than 30%, roughly the same as that in 1980. In addition, there were only three Japanese manufacturers among the top 10 companies in 2001, as opposed to six in 1991.
0%
10%
20%
30%
40%
50%
60%
70%
80 81 82 83 84 85 86 87 88 89 90 91 92 93 94 95 96 97 98 99 00 01
Share
American manufacturers Japanese manufacturersEuropean manufacturers Asia and Pacific manufacturers
Fig. 2-1 Changes in the Market Shares of the American, European, Asia and Pacific and Japanese Manufacturers in the Global Semiconductor Market
Source: Gartner Dataquest (April 2002) GJ02225
Development Bank of Japan Research Report/ No. 34 13

1981 World total = 14,668 million dollars ������������������
������������������������������������������������������������������������������������������
������������������������������������������������������������������������������������������������������������������������������������������������������������������������������������������������������������������������������������������������������������
��������������������������������������������������������������������������������������������������������������������������������
������������������������������������������������������������������������������������������������������������������������������������������������������������������������
��������������������������������������������������������������������������������������������������������������������������������������������
8.8%
8.1%
6.8%
5.6%
5.5%
5.3%
5.1%3.6%3.1%
Others44.8%
���TI���MotorolaNEC���Philips���Hitachi���Toshiba���National SemiconductorIntelMatsushita ElectronicsFairchild Semiconductor
1991 World total = 59,695 million dollars
�����������������������������������������������������������������������������������������������������������������������
������������������������������������������������������������������������������������������������������������������������������������������������������������������������������������������������������������������������������������������������������������������������������������������������������������������������������������������������������������������������������������������������������������������
���������������������������������������������������������������������������������������������������������������������������������������
������������������������������������������������������������������������������������������������������������������������������
8.0%
7.7%
6.7%
6.4%
6.3%
4.6%
4.5%
3.9%3.4%3.4%
Others45.1%
���NEC���ToshibaIntel
��� Motorola������ Hitachi������ TI������ Fujitsu
Mitsubishi ElectricMatsushita ElectronicsPhilips
2001 World total = 154,909 million dollars ����������������������������
��������������������������������������������������������������������������������������������������������������������������������������������
�����������������������������������������������������������������������������������������������������������������������������������������������������������������
���������������������������������������������������������������������������������������������������������������������������������
�������������������������������������������������������������������������������������������������������������������������������������������������
����������������������������������������������������������������������������������������������������������������������������������
16.1%
4.1%
4.1%
3.9%
3.1%
2.9%2.8%
Others52.0%
Toshiba4.4%
NEC3.5%
Hitachi3.0%
������ Intel������ Toshiba
ST Microelectronics������ Samsung Electronics������ TI������ NEC���
MotorolaHitachiInfineon TPhilips
Fig. 2-2 Changes in the Shares of Manufacturers in Semiconductor Sales
Source: Gartner Dataquest (April 2002) GJ02226
14 Development Bank of Japan Research Report/ No. 34

Figure 2-3 shows the business areas cov-ered by American and Japanese manufacturers. Japanese manufacturers are producing the full spectrum of semiconductor products, while American manufacturers are more highly spe-cialized. In terms of market share, Japanese manufacturers in the segments surveyed are not among the top companies in the MOS type in-tegrated circuit1 segment that accounts for a high percentage of the overall semiconductor market, but hold large market shares for semi-conductors as a whole as they produce a broad range of semiconductor products. In other words, there is no area in which a Japanese manufacturer is particularly strong. On the other hand, American manufacturers hold lead-ing market shares in the large MOS type inte-grated circuit segment and other segments. Fig-ure 2-5 shows the shares (by sales) of the top-share manufacturers in 1991 and 2001 for DRAM products2, which are typical MOS type memory products. Major Japanese manufactur-
ers altogether held more than half the market in 1991, but their market share fell as South Ko-rean and American manufacturers increased their market shares through specialization, cost reductions, etc. In 2001, the share of Japanese manufacturers was about 20%.
1 MOS stands for Metal Oxide Semiconductor. MOS
type integrated circuits are integrated circuits with a 3-layer structure that comprises the semiconductor (silicon substrate, etc.), oxide and metal layers. 2 DRAM: Dynamic Random Access Memory.
Manufacturers from South Korea, Taiwan and other Asian countries as well as Japanese companies from other industries (such as steel manufacturers) entered the semiconductor market in the 1980s, when the semiconductor businesses of Japanese manufacturers were booming. The South Korean manufacturers have expanded mainly in the DRAM segment, and the Taiwanese manufacturers have ex-panded based on the foundry business model. Meanwhile, some of the Japanese entrants from other industries have sold their semiconductor businesses to specialized foreign semiconductor manufacturers and have withdrawn from the semiconductor market as industry conditions have worsened.3
Hita
chi
Tosh
iba
Mits
ubis
hi E
lect
ric
Fujit
su
NEC
Sony
Mat
sush
ita E
lect
ric In
dust
rial
Shar
p
Sany
o El
ectri
c
Inte
l
Mic
ron TI
IBM
Mot
orol
a
MOS memories ○ ○ ○ ○ ○ ○ ○ ○ ○ ○ ◎ ○ ○ ○
MOS micro ○ ○ ○ ○ ○ ○ ○ ○ ○ ◎ ◎ ○ ◎
MOS logic ○ ◎ ○ ○ ○ ○ ○ ○ ○ ◎ ○ ◎ ○
Linear (analog) ○ ○ ○ ○ ○ ○ ○ ○ ○ ◎ ○ ○
Digital Bipolar ◎ ○ ○ ◎ ○ ○ ○ ◎ ○
CCDs (sensors) ○ ○ ○ ◎ ◎ ○ ○ ◎
Opto ○ ○ ○ ○ ○ ○ ◎ ◎ ○
Discrete ○ ◎ ○ ○ ○ ○ ○ ○ ○
�����������������������������������������������������������������������������������������������������������������������������������������������������������
Fig. 2-3 Sub-segments within the Semiconductor Segment
Note: ◎ indicates that the manufacturer is among the top-three companies in the world in terms of market share and ○ indicates a rank of fourth or lower (based on figures sta-tistically calculated for 2000).
Source: Prepared by the Development Bank of Japan from publications of the Semiconductor Industry Research Institute of Japan
Development Bank of Japan Research Report/ No. 34 15
3 Nippon Steel sold Nippon Steel Semiconductors to UMC (Taiwan) in 1998, and Kobe Steel sold KMT Semi-conductors to Micron Technologies (United States) in 2001.

��������������������������������������������������������������������������������������������������������������������������������������������������������������������������������������������������������������������������������������������������������������������������������������������������������������������������������������������������������������
������������������������������������������������������������������������������������������������������������������������������������������������������������������������������������������������������������������������������������������������
���� ��������������������������������������������������������������������������������������������������������������������������������������������
������������������������������������������������������������������������������������������������������������������������������������������������������������������������������������������������������
��������������������������������������������������������������������������������������������������������������������������������������������
24%
30%17%
15%
8%
1%
5%0%
���MOS memories���MOS microMOS logicAnalogDigital BipolarSensors���Opto���Discrete
������������
�� ����������������������������������������������������������������������������������������
����� ���
Fig. 2-4 Composition of the Global Semiconductor Market (2000)
Source: WSTS statistics
1991 World total = 6,982 million dollars �����������������������������������������������������������������������������������������������������������������������������������������������������������������������������������������������������������
����������������������������������������������������������������������������������������������������������������������������������������������������������������������������������������������������������������������������������������������������������������������������������������������������������������������������������������������������������������������������������������������������������������������������������������
��������������������������������������������������������������������������������������������������������������������������������������������
13.7%
12.7%
10.6%
9.5%8.2%
Others45.3%
������ Toshiba������ Samsung Electronics
NEC���Hitachi���TI
���������������������������������������������������������������������������������������������������������������������������������������������������������������������������������������������������������������������������������������������������������������������������������������������������������������������������������������������������������������������������������������������������������������������������������������������������������������������������������������������������������������������������������������������������������������������������������������������������������
������������������������������������������������������������������������������������������������������������������������������������������������������������������������������������������������������������������������
����������������������������������������������������������������������������������������������������������������������������������������������������������������������������������������������
27.0%
19.1%
14.5%
9.7%
Others21.2%
8.5%
������ Samsung Electronics������ Micron
Hynics��� Infineon T���
Elpida Memory
2001 World total = 11,856 million dollars
Fig. 2-5 Shares (by Sales) of the Top-share Manufacturers in 1991 and 2001 in the DRAM market
Source: Gartner Dataquest (April 2002) GJ02227
16 Development Bank of Japan Research Report/ No. 34

The loss of market share of Japanese manufacturers to American manufacturers is partly attributable to the foundry manufactur-ers4 based in Taiwan and other countries, which specialize in contract-based production of semiconductors. These foundry manufacturers have grown for the following reasons: 1) as know-how, profits and added value associated with semiconductor production shifted from semiconductor manufacturers to production equipment manufacturers and as market com-petition intensified partly due to new entries, cost competition became a more important management issue than competition in quality which is harder to differentiate, and 2) differen-tiation in design (what to produce) also became more important for management than differen-tiation in quality, leading to the separation of design and production (i.e. pursuing product differentiation and cost competitiveness sepa-rately), thus favoring firms that specialized in design or production. Against this background, American manufacturers, helped by the national
government (SEMATEC5) and improvements in the competitiveness of American semicon-ductor production equipment manufacturers, regained and increased their market shares by utilizing foundry manufacturers for production. In contrast, Japanese manufacturers, which ad-hered to the policy of doing everything in-house from design to production, experienced loss of market share to American manufacturers.
4 Foundry manufacturers are manufacturers that spe-cialize in contract-based production of semiconductor integrated circuits without developing products in-house. TSMC (Taiwan Semiconductor Manufacturing) and UMC (United Microelectronics) in Taiwan are typical foundry manufacturers.
1.2 Trends in Capital Spending on
Facilities and R&D
Figure 2-7 shows the time series changes in the capital spending on facilities by manufacturers surveyed by nationality. Japanese manufactur-ers’ capital spending was the highest in the world in the early 1990s but was surpassed by that of American manufacturers and then by Asian manufacturers around the mid 1990s as the Japanese manufacturers’ market share fell. The gap continues to widen.
���������������������������������������
���������������������������������������
������������������������������������������������������������������������
�����������������������������������������������������������������0
20
40
60
80
100
98 99 00 01 Year
100 million USdollars
0
1
2
3
4
5%
���������������������� TSMC UMC Share of global market (total of the 2 companies)
Fig. 2-6 Changes in the Sales of Major Taiwanese Semiconductor
Foundry Companies
Note: Both companies depend on American manufacturers for 50 to 60% of their sales.
Sources: Prepared by the Development Bank of Japan from annual reports of the 2 companies and WSTS data
Development Bank of Japan Research Report/ No. 34 17
5 SEMATECH (Semiconductor Manufacturing Tech-nology Institute) is a semiconductor production research institute established jointly by the national government and the private sector in the United States in 1987.

Considering the low level of capital spending on facilities by Japanese manufactur-ers relative to those of capital spending on fa-cilities by American and Asian manufacturers in the semiconductor industry, which is a typi-cal facility-intensive industry, it will be difficult for Japanese manufacturers to regain their mar-ket share (sales). Many domestic and overseas manufactur-ers in the semiconductor industry have experi-
enced periodic large deficits due to the silicon cycle and other reasons while facing the need to continuously increase capital spending on fa-cilities in line with the decreasing circuit line width and increasing degree of integration. Specialized overseas semiconductor manufac-turers are convincing their investors, who fi-nance their operations, of the need to consider this risk of temporary deficits as part of the necessary investment in facilities (according to
0
50
100
150
200
250
300
91 92 93 94 95 96 97 98 99 00 Year
100 million dollars
American manufacturers Japanese manufacturersEuropean manufacturers Asia and Pacific manufacturers
Fig. 2-7 Changes in Capital Spending on Semiconductor Production Facilities by Company Nationality
Source: Gartner Dataquest (August 2001) GJ02228
��������������������������������������������������������������������������������������������������������������������������������������������������������������������������������������������������������
������������������������������������������������������������������������������������������������������������������������������������������������������������������������������������������������������������������������
10.4%
7.3%
6.6%
4.8%
4.4%
Others66.5%
����Intel����
Samsung Electronics
ST Microelectronics
UMC groupOthers
Fig. 2-8 Shares of Manufacturers in Capital Spending on
Semiconductor Production Facilities (2000)
Source: Gartner Dataquest (August 2001) GJ02229
TSMC group
18 Development Bank of Japan Research Report/ No. 34

0
4
8
12
16
20
94 95 96 97 98 99 Year
%
Japanese electrical equipment companiesJapanese semiconductor segment794 American electrical equipment companiesIntel
Fig. 2-9 Changes in the Share of Total R&D Expenditure as a Percentage of
Sales by Company Group
Sources: Ministry of Public Management, Home Affairs, Posts and Telecommunications “Sur-vey of Research and Development”; publications of the Ministry of International Trade and Industry; Standard & Poor’s “Compustat”
a Japanese general electrical equipment manu-facturer). Because of the current recession in the global semiconductor market that is forcing other semiconductor companies worldwide to limit their capital spending on facilities, since 2001 most Japanese manufacturers have been increasingly resorting to concentrating capital spending on facilities in high-priority areas or deferring facility investments while looking for new business models including those based on partnerships. Figure 2-9 shows the time series changes in total R&D expenditure by different company groups. The share of total R&D expenditure made by the 12 major Japanese semiconductor manufacturers (including semiconductor divi-sions of general electrical equipment manufac-turers) as a percentage of their total sales was around 16 to 18% between 1994 and 1999. This is much higher than the electrical equipment industry average of 6% and is also higher than the figures for specialized American semicon-ductor manufacturers. The fact that the market share of Japanese semiconductor manufacturers
has been shrinking and their profitability has also been low as compared to the major American manufacturers and other groups, de-spite their vast R&D expenditure, is partly due to their over-diversification which has lowered their R&D efficiency.6 Figure 2-10 compares companies in terms of the time series changes in operating profit on sales. Rohm, which is a mid-sized,
6 ”Challenges for the Japanese Semiconductor Industry and Solutions” (May 2002) published by the Semiconduc-tor Industry Strategy Promotion Committee points out that although Japanese general electrical equipment manufac-turers have been producing a wide range of electrical equipment and electronic components and devices, their final products (in particular information and communica-tions equipment) have not been very competitive, as a result of which their diversification in product range has not brought the intended results. In addition, the apparent edge that Japanese manufac-turers have over American manufacturers in terms of their share of R&D expenditure as a percentage of sales is at-tributable to American manufacturers’ strategy of acquir-ing new experts and expertise and venture companies’ R&D results through M&As compared with Japanese manufacturers.
Development Bank of Japan Research Report/ No. 34 19

-30%
-20%
-10%
0%
10%
20%
30%
40%
50%
88 89 90 91 92 93 94 95 96 97 98 99 00 01 Year
5 general electrical equipment manufacturersRohmIntelMicronTI
Fig. 2-10 Comparison of Time Series Changes in Operating Profit on Sales of American and Japanese Companies
Note: The figures for the 5 general electrical equipment manufacturers are statistically cal-
culated values (see footnote 9 to Chapter I). The operating profit on sales figures for Rohm are consolidated figures for the entire company.
Sources: Development Bank of Japan “Financial Data Bank”, Standard & Poor’s “Compustat”
semi-specialized semiconductor manufacturer, consistently increased its profitability (operat-ing profit on sales) throughout the 1990s by specializing in producing custom LSIs and di-odes7 while the profitability of the semicon-ductor manufacturers producing the full range of semiconductor products remained low. The profitability gap between American and Japa-nese manufacturers has been steadily growing for many years now, due mainly to the differ-ences in the business models used (specializa-tion/diversification), and the rapid changes in business climate as well as the wide demand fluctuations in the memory segment (particu-larly DRAM) have heavily impacted semicon-ductor manufacturers’ profitability. Although Japanese manufacturers have recognized the need to concentrate in core businesses and have been trying to restructure under a “selection and concentration” policy, they have been slow in selecting their core businesses and have not yet
completed the selection phase. Japanese manu-facturers are thus unlikely to close the gap with American manufacturers.
7 Diodes are (discrete) semiconductor devices that have a junction structure which allows them to conduct electric current only in one direction.
1.3 Trade Trends
20 Development Bank of Japan Research Report/ No. 34
Figure 2-11 shows the time series changes in the trade balance between the United States and Japan with respect to integrated circuits and other types of products. Japan had export sur-pluses almost every year between 1988 and 2000. On the other hand, companies headquar-tered in America consistently surpassed those headquartered in Japan in terms of profitability (operating profit on sales) over the same period. These facts suggest that American semicon-ductor manufacturers have been 1) producing products with high added value, 2) successfully devising measures to achieve good profits in relation to costs and/or sales prices and 3) shifting production bases to developing coun-tries and outsourcing (including utilization of foundry manufacturers).

-2,000
0
2,000
4,000
6,000
8,000
10,000
88 89 90 91 92 93 94 95 96 97 98 99 00 Year
100 million yen
Audio-visual equipment Communications equipment Integrated circuits
Fig. 2-11 Changes in the Trade Balance between the United States and Japan
with Respect to Integrated Circuits and Other Types of Products
Sources: Ministry of Finance “Overview of Japan’s Foreign Trade”; Press Journal Inc. “Japan Semiconductor Almanac”
������������������
���������������������
���������������������
������������������
���������������������
����������������������������
�����������������������������������
������������������������������
������������������������������������
�����������������������������������
������������������������
������������������������������������
������������������
����������������������������
�����������������������������������
������������������������������
�����������������������������������
�����������������������������������
������������������������������������������
������������������������������������
������������������������������������
������������������������������������������
������������������������������������
������������������������������������
-2,500
-2,000
-1,500
-1,000
-500
0
500
1,000
1,500
2,000
89 90 91 92 93 94 95 96 97 98 99 00Fiscal year
(←
Impo
rts/
Expo
rts→)
100
mill
ion
yen
���������������������� Exports
������������������������ Trade balance
Fig. 2-12 Changes in the Trade Balance between Japan and the Rest of the World with
Respect to Technology-related Trade in the Electrical Equipment Industry
Note: The industries covered are the communications, electronics and electrical measuring instrument industries.
Source: Statistics Bureau of the Ministry of Public Management, Home Affairs, Posts and Telecommuni-cations “Survey of Research and Development”
Figure 2-12 shows the time series changes in the trade balance between Japan and the rest of the world with respect to technology-related trade in the electrical equipment industry (in-cluding semiconductors). Japan consistently im-
ported more than it exported between 1989 and 2000, in marked contrast to the large export sur-pluses of electrical equipment and compo-nents/devices. Although this suggests that Japa-nese manufacturers have no technological supe-
Imports
Development Bank of Japan Research Report/ No. 34 21

riority over other countries’ manufacturers, it does not prove they are technologically inferior, because the technology trade balance is deter-mined not only by technological superiority or inferiority (R&D capability) but also by other factors including individual manufacturers’ pat-ent application strategies (applying for a patent means disclosing technological expertise and know-how). As the number of patent applica-tions made by Japanese manufacturers has been increasing in recent years (indicating greater willingness to fully utilize their intellectual properties to improve profitability), the technol-ogy trade balance may improve in the future.
1.4 Challenges As manufacturers (including general electrical equipment manufacturers) having a semicon-ductor business are significantly affected by it in terms of profitability, such companies are struggling to formulate semiconductor business strategies and make good use of their semicon-ductor divisions and operations. To strengthen their market power by regaining market share and reducing facility investment and R&D costs which are rising year by year, they will need to merge operations and take other drastic action based on partnerships, as well as improve the efficiency of R&D and concentrate resources in strategic businesses. They will also need to re-vise their business models in order to increase market share by utilizing foundry manufactur-ers and outsourcing production processes, while strengthening their design divisions and reduc-ing the burden of facility investment.
2. Home Appliances
2.1 Declines in Unit Selling Prices The Japanese general electrical equipment manufacturers enjoy higher market shares in the home appliances segment than in any other. In particular, they hold large market shares rang-ing from 40 to 80% in audio-visual home ap-pliances markets, including those for video cassette recorders and CD players, whose user bases expanded rapidly both in Japan and over-seas in the late 1980s. Given the large market
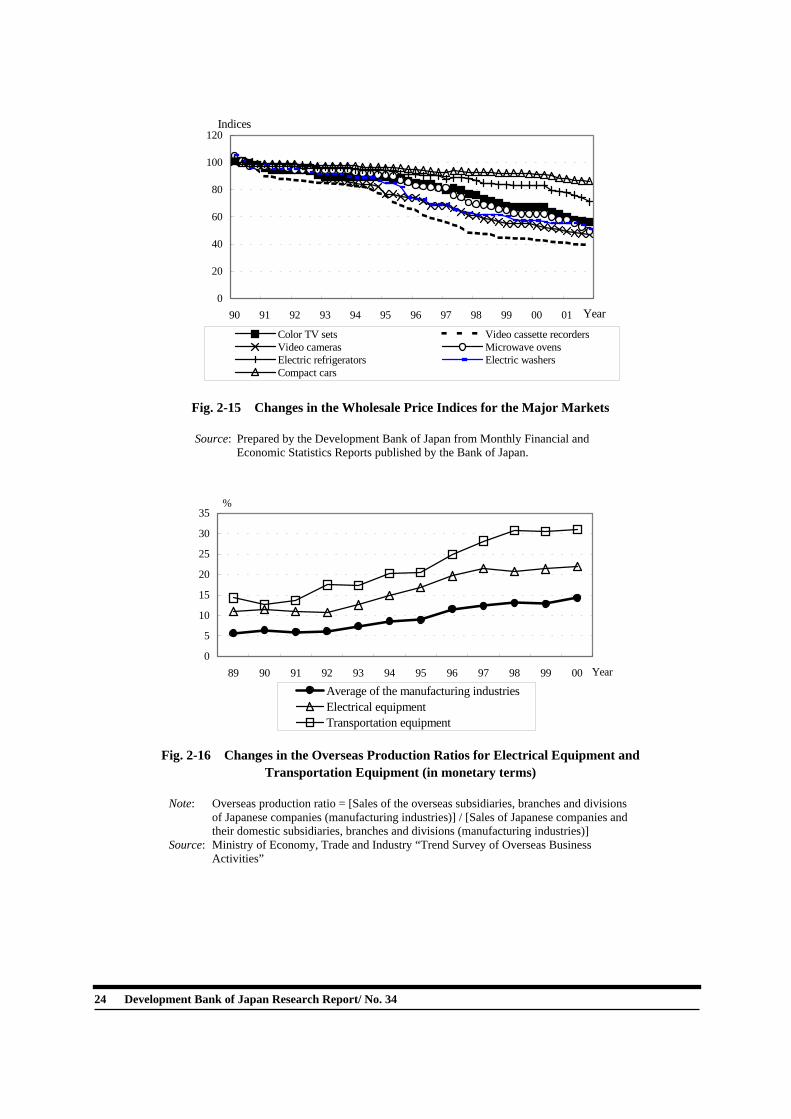
shares and dominance of Japanese general elec-trical equipment manufacturers in the home appliances segment, this should have been one of the most profitable segments for Japanese electrical equipment manufacturers, but in fact their sales in this segment decreased from the 1980s to the 1990s, hence this segment has not necessarily improved their profitability, as mentioned above. The direct reason for the inability of Japa-nese electrical equipment manufacturers to achieve high profit levels in the home appli-ances segment is the recent declines in the unit selling prices of products. An examination of the changes in the wholesale price indices for the major markets over the past 10 years reveals that the unit selling prices of home appliances have declined much more sharply than those of automobiles. These sharp declines have squeezed the margins of Japanese electrical equipment manufacturers and offset the cost reductions achieved through improvements in productivity and the expansion of markets achieved through increases in ownership rates. The sharp declines in the unit selling prices of home appliances are largely due to the shift-ing of manufacturing to countries where pro-duction costs are lower such as Asian countries. The overseas production ratios are now more than 90% for such items as color TV sets, and about 80% of Japanese-brand products sold in Japan are imported after being manufactured in other countries (on the basis of figures sta-tistically calculated (by number of units) for 2000). As a result of the recent increases in re-verse import ratios, the domestic unit shipping prices of home appliances have been falling year by year and Japanese electrical equipment manufacturers have been forced to limit domes-tic production to products with high added value such as wide-screen TV sets and to adapt to this trend. The shifting of production bases to countries with lower production costs, the original main purpose of which was to develop overseas outlets for Japanese products, has now caused harsh competition in the domestic mar-ket, as evidenced by sharp rises in the overseas production and reverse import ratios for color TV sets, video cassette recorders, etc. over the past 10 years.
22 Development Bank of Japan Research Report/ No. 34

0
10
20
30
40
50
60
70
80
90
100
81.3 83.3 85.3 87.3 89.3 91.3 93.3 95.3 97.3 99.3 01.3Year and month
%
Room air-conditioners Video cassette recordersVideo cameras CD playersPCs Cellular phones
Fig. 2-13 Changes in the Rates of Ownership of Major Electrical and
Electronic Equipment (in Japan)
Note: The figures for cellular phones are ownership rates as a percentage of the total population. The figures for other products are ownership rates as a percentage of the total number of households.
Sources: Cabinet Office “Consumption Confidence Survey”; publications of the Telecommunications Carriers Association (cellular phones)
0%
20%
40%
60%
80%
100%
120%
90 91 92 93 94 95 96 97 98 99 00 Year
Microwave ovens Color TV setsVideo cassette recorders StereosCD players
Fig. 2-14 Changes in the Market Share of Japanese Electrical Equipment Manufacturers in the
Markets for Major Home Appliances Products (by number of units)
Note: Share of Japanese manufacturers = [Number of units produced by Japanese manufacturers] / [Total world demand]
Sources: Prepared by the Development Bank of Japan from publications of the Japan Electrical Manufacturers' Association (JEMA), the Japan Electronics and Information Technology Industries Association (JEITA), and the Association for Electric Home Appliances.
Development Bank of Japan Research Report/ No. 34 23
24 Dev
0
20
40
60
80
100
120
90 91 92 93 94 95 96 97 98 99 00 01 Year
Indices
Color TV sets Video cassette recordersVideo cameras Microwave ovensElectric refrigerators Electric washersCompact cars
Fig. 2-15 Changes in the Wholesale Price Indices for the Major Markets
Source: Prepared by the Development Bank of Japan from Monthly Financial and Economic Statistics Reports published by the Bank of Japan.
0
5
10
15
20
25
30
35
89 90 91 92 93 94 95 96 97 98 99 00 Year
%
Average of the manufacturing industriesElectrical equipmentTransportation equipment
Fig. 2-16 Changes in the Overseas Production Ratios for Electrical Equipment and
Transportation Equipment (in monetary terms)
Note: Overseas production ratio = [Sales of the overseas subsidiaries, branches and divisions of Japanese companies (manufacturing industries)] / [Sales of Japanese companies and their domestic subsidiaries, branches and divisions (manufacturing industries)]
Source: Ministry of Economy, Trade and Industry “Trend Survey of Overseas Business Activities”
elopment Bank of Japan Research Report/ No. 34

90
0%
20%
40%
60%
80%
100%
89 91 92 93 94 95 96 97 98 99 00 Year
Electric refrigerators Electric washersColor TV sets Video cassette recordersStereos
Fig. 2-17 Changes in the Overseas Production Ratios for the Major Product Categories
(by number of units)
Note: Overseas production ratio = [Number of units produced overseas] / [Number of units produced domestically + Number of units produced overseas]
Sources: Prepared by the Development Bank of Japan from publications of JEMA and JEITA
0
20
40
60
80
100
120
91 92 93 94 95 96 97 98 99 00 01 Year
Uni
t pric
e (1
,000
yen
/uni
t)
0
20
40
60
80
100
120
ProductionShipmentImportsDegree of dependency on imports (by number of units)
Deg
ree
of d
epen
denc
y on
impo
rts (%
)
Fig. 2-18 Changes in the Unit Shipment, Import, and Domestic Production Prices of
Color TV Sets (excluding Liquid Crystal TV sets)
Note: Degree of dependency on imports = [Imports] / [Domestic production – Exports + Imports]. The unit production prices were calculated by [Total production cost / Number of units pro-duced]. The unit shipment/import prices were also calculated in a similar manner.
Source: Prepared by the Development Bank of Japan from publications of JEITA
Development Bank of Japan Research Report/ No. 34 25

0
5
10
15
20
25
30
35
40
91 92 93 94 95 96 97 98 99 00 01 Year
Uni
t pric
e (1
,000
yen
/uni
t)
0
10
20
30
40
50
60
70
80
90
ProductionShipmentImportsDegree of dependency on imports (by number of units)
Deg
ree
of d
epen
denc
y on
impo
rts (%
)
Fig. 2-19 Changes in the Unit Shipment, Import, and Domestic Production Prices of
Video Cassette Recorders
Note: Degree of dependency on imports = [Imports] / [Domestic production – Exports + Imports]. The unit production prices were calculated by [Total production cost / Number of units pro-duced]. The unit shipment/import prices were also calculated in a similar manner.
Source: Prepared by the Development Bank of Japan from publications of JEITA
Although declines in wholesale price indi-ces (unit prices) do not directly squeeze manu-facturers’ margins as long as they are due to reductions in production costs achieved by shifting production bases to other countries or through other efforts by manufacturers, the de-clines in unit prices mentioned above are largely due to the recent shift from selling products mainly through manufacturers’ affili-ated distributors to sales through mass mer-chandisers.8 This has usurped the manufactur-ers’ power to determine selling prices (as seen in the recent increase in the use of “open price” for home appliances instead of “manufacturer’s recommended retail price” or “standard retail price”)9 and thus accelerated declines in unit
prices.
8 According to “Home Appliances Distribution Data Pandect” (Ricks Inc.) and other data. 9 Although declines in retail prices do not necessarily directly cause declines in wholesale prices, the total profits of the manufacturers (including their affiliated distributors (local home appliances stores)) have decreased or have not increased as they should have because of the recent in-crease in mass merchandisers’ share of total number of products shipped.
From the above analysis, excessive dis-count competition among Japanese electrical equipment manufacturers for market share may have been a major cause of the recent declines in unit prices and thus the recent declines in the profitability of Japanese electrical equipment manufacturers in the home appliances segment. Japanese manufacturers, which have a strong tendency to follow each other’s moves, have reduced their own profitability by competing with each other for a bigger piece of the pie. This emerging industry structure makes it very difficult for Japanese general electrical equip-ment manufacturers to enjoy good profits in the home appliances segment. Furthermore, the emergence of home appliances manufacturers from other countries including China, which has curbed the expansion of market share by Japanese general electrical equipment manu-facturers, as well as Japanese general electrical equipment manufacturers’ recent losses in prof-itability in other segments such as the semi-conductor segment, have further reduced prof-itability.
26 Development Bank of Japan Research Report/ No. 34

In the future, new segments, including the digital (information) home appliances segment, are likely to grow significantly as the user bases for products in such segments expand, but in view of the recent declines in the unit selling prices of DVD players, which are hit products in this segment at present, the increase in own-ership rates for digital home appliances will not directly translate into improved profitability in the near future. Without strong competitors from other industries or countries as in the past, Japanese electrical equipment manufacturers could have entered new segments or launched new products following each other, competed with each other for larger market share, and still managed to secure profits. However, they must now recognize the fact that increasing digitali-zation makes it difficult for them to differenti-ate their products in terms of quality or func-tions, and that they are no longer able to com-pete easily with emerging manufacturers in price (costs). These conditions were absent during the period when Japanese electrical equipment manufacturers had a competitive edge over companies from other countries or industries and maintained large shares of the market for video cassette recorders (which are analog products) where they had a head-start over companies from other countries and indus-tries. The major challenges to be addressed by Japanese electrical equipment manufacturers are 1) formulating better patent and technology policies, 2) concentrating resources in the seg-ments where they are strong, 3) making proper decisions as to whether and when to withdraw from maturing markets and 4) adding profitable operations and businesses and shedding unprof-itable ones through partnerships, etc. with other companies.
3. Information and Communications Equipment
3.1 Ownership Rates and Market Shares
The typical sub-segments of the information and communications segment of the electrical equipment industry that experienced sharp in-creases in ownership rate in the late 1990s are the PC and cellular phone sub-segments. Both
PCs (especially notebook PCs) and cellular phones involve high-density technologies for production, and are one of the strongest areas of Japanese electrical equipment manufacturers (which have manufactured most of the “world’s smallest” and “worlds’ lightest” products), but in fact the market shares of the major Japanese electrical equipment manufacturers in the global PC and cellular phone markets decreased during the period between the emergence of PCs and cellular phones and 2001. In the PC and cellular phone sub-segments, the Japanese electrical equipment manufacturers’ success in monopolizing industry standards in the home appliances segment, including the video cas-sette recorder sub-segment, was not repeated. The superiority of American and European manufacturers in these sub-segments during this period was largely because the mother market user bases for these products in America and Europe expanded faster than those in Japan. As a result, Japanese electrical equipment manu-facturers could not significantly improve prof-itability and the profitability gap with American manufacturers widened. The fact that Japanese electrical equipment manufacturers, which are considered to excel in production technologies such as high-density technologies, lost or could not increase market share is mainly attributable to the dominance of a few companies over industry standards and the increasing modularization. In the PC sub-segment, for example, important functions and high added value have concentrated in Mi-crosoft’s OS products and Intel’s MPU prod-ucts10, which have become de-facto industry standards. The Japanese electrical equipment manufacturers are good at producing thinner “products” (in terms of size), but have not been able to decisively differentiate their products from those of foreign manufacturers. In addi-tion, Japanese electrical equipment manufac-turers have lagged behind American manufac-turers in the rate of spread of the Internet and have totally relied on imports from other coun-tries including the United States for software products, which drive the expansion of the user 10 MPUs (Micro Processing Units) are integrated circuits that have all the functions of a CPU (Central Processing Unit) in one chip.
Development Bank of Japan Research Report/ No. 34 27

1996 20011 Compaq 1 Dell2 IBM 2 Compaq3 Apple 3 HP4 NEC 4 IBM5 HP 5 NEC
Total number of units shipped in the global PC market (1,000 units)
71,334 128,932
Fig. 2-20 Top 5 Manufacturers in the Global PC Market in 1996 and 2001 by Number of Units Shipped
Note: The numbers include the numbers of PC servers. Source: Gartner Dataquest (February 2002) GJ02230
1996 2001
Company Share (%) Company Share (%)1 Motorola 26.9 1 Nokia 35.02 Nokia 20.2 2 Motorola 14.83 Ericsson 12.1 3 Siemens 7.44 Matsushita 8.0 4 Samsung Electronics 7.15 NEC 6.8 5 Ericsson 6.7
Others 26.0 Others 29.0Total number of units shipped in the global cellular phone market (1,000 units)
66,539 399,583
Fig. 2-21 Top 5 Manufacturers in the Global Cellular Phone Market in 1996 and 2001 by Number of Units Shipped
Source: Gartner Dataquest (March 2002) GJ02231
base of PCs, except for game software products. In the cellular phone sub-segment, the adoption by Japanese home appliances manu-facturers, during the transition period from analog to digital, of a transmission method (PDC method) which was not used in major overseas markets resulted in a very low rate of ownership of foreign-made terminals in Japan and conversely a low rate of ownership of Japa-nese terminals overseas. This occurred due to Japan’s unique situation where carriers rather than manufacturers dominate in technological development and market power. In the future, international differences in transmission methods will probably vanish and Japanese electrical equipment manufacturers will then once again be able to compete equally
with foreign manufacturers as the Japanese manufacturers shift to third-generation trans-mission methods (W-CDMA, cdma2000). The Japanese manufacturers will therefore need to formulate business strategies that appropriately address the changing business environment. In the future, international differences in transmission methods will probably vanish and Japanese electrical equipment manufacturers will then once again be able to compete equally with foreign manufacturers as the Japanese manufacturers shift to third-generation trans-mission methods (W-CDMA, cdma2000). The Japanese manufacturers will therefore need to formulate business strategies that appropriately address the changing business environment.
28 Development Bank of Japan Research Report/ No. 34

����������������������������������������
����������������������������������������
������������������������������������
���������������������������������������������
������������������������������������������������������������
��������������������������������������������������
��������������������
���������� ��������������������������� ����������
��������������������������������������������������
-8000
-7000
-6000
-5000
-4000
-3000
-2000
-1000
0
1000
94 95 96 97 98 99Fiscal year
(←
Impo
rts/
Expo
rts→)
100
mill
ion
yen
Exports (total)������
Imports (application software)���
Fig. 2-22 Changes in Computer Software Imports and Exports
Note: Game software products are not included. Sources: “Software Foreign Trade Statistics Research” published by the Japan Personal Computer
Software Association, Japan Information Technology Services Industry Association and JEITA
3.2 Background
As mentioned above, a major reason for the failure of Japanese electrical equipment manu-facturers to dominate the information and communications equipment sub-segment in the 1990s in the same way they succeeded in the home appliances segment in the 1980s is the increasing modularization. This point will be discussed in detail in the next chapter. One recent noteworthy development in the cellular phone sub-segment is that Japanese general electrical equipment manufacturers, which are producing cellular phones under their own brands, are now supplying major compo-nents for cellular phones to Nokia in Finland, a competitor that is one of the world’s top manu-facturers of cellular phones. This reflects the fact the Japanese general electrical equipment manufacturers have been forced, due to in-creasing modularization, to secure profits by resorting to component production and a “peaceful coexistence” approach. It also con-firms that the production of state-of-the-art cel-lular phones requires Japanese electrical equipment manufacturers’ high-quality com-
ponents with sophisticated functions, and that these manufacturers are focusing on this sub-segment by taking advantage of the critical importance of their components. The numbers of domestically produced PCs and cellular phones increased sharply each year until 2000, but have been falling since the second half of 2001 reflecting the IT recession as in the semiconductor segment. In particular, Japanese electrical equipment manufacturers are finding it difficult to make profits in the PC sub-segment partly due to the recent declines in unit production and selling prices. As profits tend to concentrate in a small number of non-final product manufacturers, some final product manufacturers are attempting to use more “open source” software such as Linux11 on database servers. In addition, the 2001 settlement figures for American and Japanese manufacturers show that both suffered significant declines in profit-ability in the communications equipment seg-ment in 2001, as in the semiconductor segment.
11 A Unix-based operating system (OS) that is available on the Internet, can be freely reproduced and redistributed, and is popular for business servers, etc.
Imports (basic software)Imports (custom software)
Development Bank of Japan Research Report/ No. 34 29

They are now being forced to modify their business models, which worked when produc-tion was expanding, to adapt to the current
downward trend in production, as seen in recent partnerships among them to increase market shares and reduce development costs.
30
-60%
-40%
-20%
0%
20%
40%
60%
80%
89 92 95 98 01 01.2 01.5 01.8 01.11Year and month
0
50
100
150
200
250
300
350
Increase in the number of units produced Unit production price
Yea
r-on
-yea
r inc
reas
e in
the
num
ber o
fun
its p
rodu
ced
Uni
t pro
duct
ion
pric
e (1
,000
yen
/uni
t)
Fig. 2-23 Changes in the Production and Average Unit Production Price of PCs
Note: The unit production price was calculated by dividing the total production cost by the total number of units produced.
Source: Ministry of Economy, Trade and Industry “Preliminary Report on Machinery Statistics”
-60%-40%-20%
0%20%40%60%80%
100%120%140%
93 96 99 01.3 01.6 01.9 01.12Year and month
Yea
r-on
-yea
r inc
reas
e in
the
num
ber o
fun
its p
rodu
ced
Fig. 2-24 Changes in the Production of Cellular Phones
Source: Ministry of Economy, Trade and Industry “Preliminary Report on Machinery Statistics”
Development Bank of Japan Research Report/ No. 34

III Characteristics of the Business Models Being Used by the Major American and Japanese Electrical Equipment Manufacturers This chapter examines the characteristics of business models being used by the major American and Japanese electrical equipment manufacturers, which may have further wid-ened the profitability gap between American and Japanese electrical equipment manufactur-ers, as well as the background of the widening of the profitability gap in the 1980s and 1990s. 1. Development and Current Status of the
Major American and Japanese Electrical Equipment Manufacturers’ Business Areas
A comparison of the main business areas of American and Japanese top sales electrical
equipment manufacturers in 2000 shows that all top Japanese electrical equipment manufactur-ers by sales are general manufacturers covering a wide range of segments, whereas the top American counterparts are mostly specialized manufacturers although the degree of speciali-zation varies. This means that the distinguishing difference (i.e. “department store” type manu-facturers versus “specialized store” type manu-facturers) between American and Japanese manufacturers that was observed in the semi-conductor segment is also present in the elec-trical equipment production industry as a whole. Thus from an outsider’s perspective, American electrical equipment manufacturers have dis-tinct areas of strength, whereas Japanese elec-trical equipment manufacturers produce a wide range of products but do not have a particularly strong area. The major American and Japanese electri-cal equipment manufacturers have developed their portfolios of businesses up to 2000 along
Hita
chi
Tosh
iba
Mits
ubis
hi E
lect
ric
Fujit
su
NEC
Sony
Mat
sush
ita E
lect
ric In
dust
rial
Shar
p
Sany
o El
ectri
c
IBM
GE* HP
Com
paq
Mot
orol
a
Luce
nt T
Nor
tel N Inte
l
Del
l
Electrical home appliances ○ ○ ○ ○ ○ ○ ○ ○
Electronic home appliances ○ ○ ○ ○ ○ ○ ○
Industrial electronic equipmentInformation equipment (PCs, etc.) ○ ○ ○ ○ ○ ○ ○ ○ ○ ○ ○ ○ ○
Communications equipment (cellular phones, etc.) ○ ○ ○ ○ ○ ○ ○ ○ ○ ○ ○ ○
Electronic components and devicesSemiconductors ○ ○ ○ ○ ○ ○ ○ ○ ○ ○ ○ ○ ○
Liquid crystals ○ ○ ○ ○ ○ ○ ○ ○ ○ ○ ○
Heavy electric apparatus ○ ○ ○ ○
Fig. 3-1 Main Business Areas of Major American and Japanese Electrical Equipment Manufacturers
(excluding non-manufacturing segments such as service segments) Notes: 1. The business areas shown are the major electrical equipment businesses of the companies shown in terms
of their shares as a percentage of total sales. Businesses in the non-manufacturing segments such as service segments and non-electrical equipment segments are not included.
2. Components and devices other than semiconductors and liquid crystals are excluded. 3. GE has a wide range of production departments other than electrical equipment including industrial equip-
ment, medical equipment, aircraft engines and plastics. Sources: Prepared by the Development Bank of Japan from various publications and data of the companies listed
Development Bank of Japan Research Report/ No. 34 31

������������
���
���������������������
���������
��������� ���
���������
��������� ���� ���
���������������������
���������������������
���������
���������
������
��������� ���
���������
���������
������
-30%
-20%
-10%
0%
10%
20%
30%
82 84 86 88 90 92 94 96 98 00 (Year)�����������
Change in tangible fixed assets relative to those at the end of the previous business yearChange in number of employees relative to that at the end of the previous business yearOperating profit on salesChange in total sales relative to those at the end of the previous business year
Fig. 3-2 Changes in IBM’s Sales, etc.
Source: Standard & Poor’s “Compustat”
rather different paths. The major Japanese manufacturers started out producing heavy electric apparatus, information and communica-tions equipment or home appliances and gradu-ally increased their scope of business by adding new areas. But because they did not make any large-scale restructuring or withdrawal from a major market while adding new businesses, their portfolios became similar to one another. This is another reason why Japanese general electrical equipment manufacturers are consid-ered to follow each other. On the other hand, American manufactur-ers tend to buy and sell their businesses like commodities, as seen in GE’s business restruc-turing1 in the 1980s and IBM’s shift2 in the
early 1990s from computer businesses to ser-vice businesses. This is a characteristic of American corporate culture.3 Recent instances of M&A, such as those made by IBM to strengthen their computer service businesses and the acquisition by Intel of a communica-tions equipment-related semiconductor business with high growth potential, also show the typi-cal American approach of strengthening the management base around the core of existing
1 General Electric sold businesses totaling about 10 billion dollars and acquired businesses totaling about 19 billion dollars in the 1980s. The company has generally withdrawn from those businesses where it does not rank 1st or 2nd in the global market. 2 The total number of employees of IBM peaked at the end of the 1986 business year at 406,000. The company made large employee cutbacks from the end of the 1991
business year (374,000 people) to the end of the 1994 business year (220,000 people).
3 This report does not discuss in detail whether the terms “Japanese management practices” and “American corporate culture” can be used in the same meaning as individual companies’ management policies and corporate cultures, but it is considered that the differences between the United States and Japan in employment environments, including 1) employment practices (i.e. inter-company mobility is lower and the average duration of employment is longer in Japan) and 2) employer-employee relation-ships (i.e. the average number of working days lost due to strikes is smaller in Japan), contribute to the differences between American and Japanese companies in manage-ment policies and practices.
32 Development Bank of Japan Research Report/ No. 34
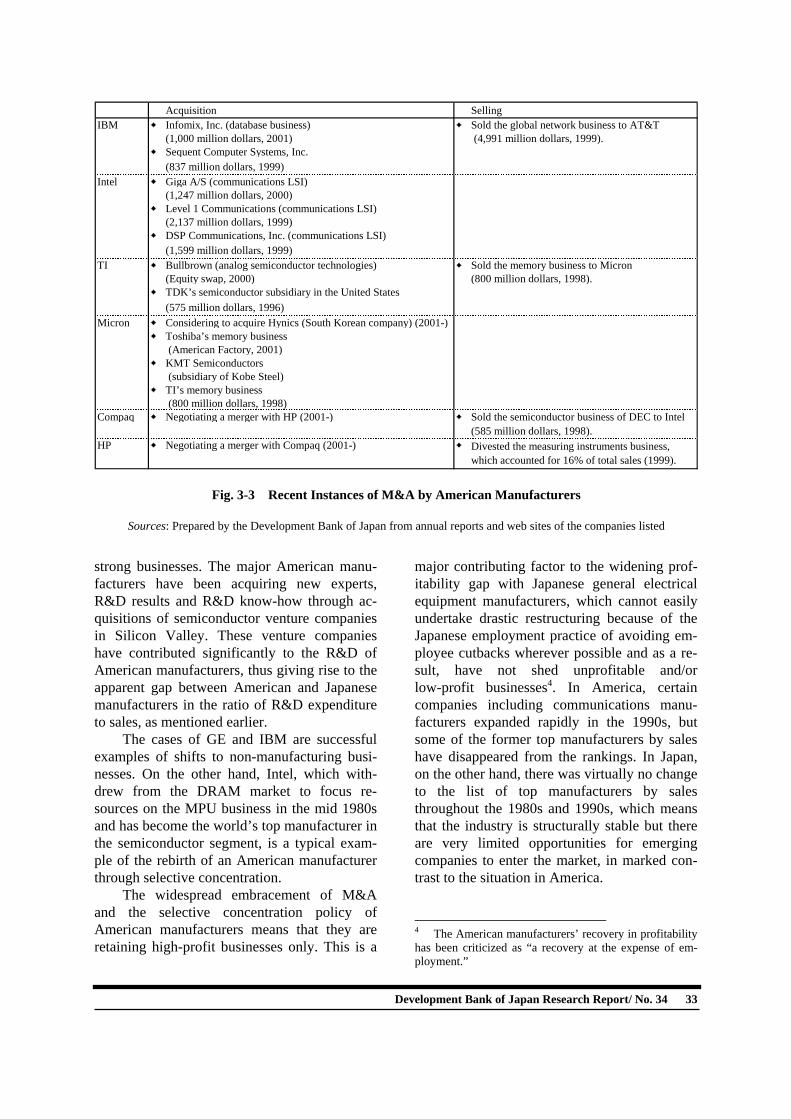
Acquisition SellingIBM ◆ Infomix, Inc. (database business) ◆ Sold the global network business to AT&T
(1,000 million dollars, 2001) (4,991 million dollars, 1999).◆ Sequent Computer Systems, Inc.
(837 million dollars, 1999)Intel ◆ Giga A/S (communications LSI)
(1,247 million dollars, 2000)◆ Level 1 Communications (communications LSI)
(2,137 million dollars, 1999)◆ DSP Communications, Inc. (communications LSI)
(1,599 million dollars, 1999)TI ◆ Bullbrown (analog semiconductor technologies) ◆ Sold the memory business to Micron
(Equity swap, 2000) (800 million dollars, 1998).◆ TDK’s semiconductor subsidiary in the United States
(575 million dollars, 1996)Micron ◆ Considering to acquire Hynics (South Korean company) (2001-)
◆ Toshiba’s memory business (American Factory, 2001)
◆ KMT Semiconductors (subsidiary of Kobe Steel)
◆ TI’s memory business (800 million dollars, 1998)
Compaq ◆ Negotiating a merger with HP (2001-) ◆ Sold the semiconductor business of DEC to Intel(585 million dollars, 1998).
HP ◆ Negotiating a merger with Compaq (2001-) ◆ Divested the measuring instruments business,which accounted for 16% of total sales (1999).
���������������������������������������������������������������������������������������������������������������������������������������������
���������������������������������������������������������������������������������������������������������������������������������������������
���������������������������������������������������������������������������������������������������������������������������������������������
���������������������������������������������������������������������������������������������������������������������������������������������
���������������������������������������������������������������������������������������������������������������������������������������������
������������������������������������������������������������������������������������������������
������������������������������������������������������������������������������������������������
������������������������������������������������������������������������������������������������
������������������������������������������������������������������������������������������������
������������������������������������������������������������������������������������������������
Fig. 3-3 Recent Instances of M&A by American Manufacturers
Sources: Prepared by the Development Bank of Japan from annual reports and web sites of the companies listed
strong businesses. The major American manu-facturers have been acquiring new experts, R&D results and R&D know-how through ac-quisitions of semiconductor venture companies in Silicon Valley. These venture companies have contributed significantly to the R&D of American manufacturers, thus giving rise to the apparent gap between American and Japanese manufacturers in the ratio of R&D expenditure to sales, as mentioned earlier.
The cases of GE and IBM are successful examples of shifts to non-manufacturing busi-nesses. On the other hand, Intel, which with-drew from the DRAM market to focus re-sources on the MPU business in the mid 1980s and has become the world’s top manufacturer in the semiconductor segment, is a typical exam-ple of the rebirth of an American manufacturer through selective concentration. The widespread embracement of M&A and the selective concentration policy of American manufacturers means that they are retaining high-profit businesses only. This is a
major contributing factor to the widening prof-itability gap with Japanese general electrical equipment manufacturers, which cannot easily undertake drastic restructuring because of the Japanese employment practice of avoiding em-ployee cutbacks wherever possible and as a re-sult, have not shed unprofitable and/or low-profit businesses4. In America, certain companies including communications manu-facturers expanded rapidly in the 1990s, but some of the former top manufacturers by sales have disappeared from the rankings. In Japan, on the other hand, there was virtually no change to the list of top manufacturers by sales throughout the 1980s and 1990s, which means that the industry is structurally stable but there are very limited opportunities for emerging companies to enter the market, in marked con-trast to the situation in America.
Development Bank of Japan Research Report/ No. 34 33
4 The American manufacturers’ recovery in profitability has been criticized as “a recovery at the expense of em-ployment.”

2. Impacts of Increasing Modularization and Outsourcing
As mentioned above, whereas Japanese general electrical equipment manufacturers pursued ex-pansion, their American counterparts pursued specialization-oriented business models and racked up high profits in the 1990s. The Japanese manufacturers were more profitable than they are now and increased their market shares in such segments as semiconductors and audio-visual home appliances and successfully developed various new products such as CD players up to the 1980s, but the declines and/or near-zero growth in their profits and market shares in the 1990s suggest that the expansionary business model gradually lost its superiority. To clarify this change, it is necessary to understand the impacts of the recent progress of modularization and the associated increased awareness of the importance of the “smile curve.” In this report, the term “modularization” re-fers to unification and standardization of stan-dards for components and component groups (modules) that comprise electrical equipment. The trend toward increased modularization began when IBM started promoting unification of stan-dards for modules to ensure compatibility be-tween computers. Modularization is beneficial in
that it facilitates design, fabrication and assembly by dividing a complex device containing many components into a number of components which are independent of each other. In the case of PCs, for example, development, design, fabrication and assembly are made easier by unifying the stan-dards for individual modules such as CPUs (MPU), memories, disk drives, keyboards and displays. That is, modularization allows more ef-ficient new product development centered around core module development and enables anyone with the design drawing to procure the necessary modules and components and fabricate or assem-ble the equipment. Highly modularizing a final product makes fabrication and assembly tech-nologies much less important, because the quality and performance of the product are largely deter-mined by those of the constituent modules. The acceleration of modularization in the 1990s is partly attributable to the acceleration of the digitalization of electronic equipment during the same period. Standardization of modules (i.e. unification of standards) for digital electronic equipment (such as CD players and DVD players) was eas-ier than that for analog electronic equipment (such as record players and video cassette re-corders5) because digital electronic equipment is more uniform in quality, require fewer components than analog electronic equipment
A B A B
C D C D
Low degree of modularization High degree of modularization
Fig. 3-4 Conceptual Diagram of Modularization
Note: Changes to the design of each of modules A to D are more likely to affect the designs of the other modules when the degree of modularization is low, and less likely to affect the designs of the other modules when the degree of modularization is high.
Source: Prepared by the Development Bank of Japan 5 In this report, tape-based video cassette recorders are classified as analog equipment.
34 Development Bank of Japan Research Report/ No. 34

���������������������������������������������
������������������������������������������������
������������������������������������������������������������
���������������������������������������������������������������������������
������������������������������
������������������������������������������������
������������������������������������������������������������
������������������������������������������������������������
0
100
200
300
400
500
600
98 99 00 01 Year
100 milliondollars
20
25
30
35
40Trillion yen
Jabil Circuit, Inc.SCI Systems, Inc.Celestica, Inc.�����������
�����������
Reference data (electrical equipment production in Japan (right-hand scale, trillion yen)
Fig. 3-5 Changes in Sales of Major EMSs
Note: Many companies including IBM, Dell, Compaq and Nokia are outsourcing work to EMSs.
Sources: Annual reports of the companies listed and publications of JEMA and JEITA
ponents than analog electronic equipment and use components that are more versatile than those for analog electronic equipment. A high degree of modularization makes cost competition strategically more important than technological competition for management (for example, as a means of increasing market share) because it reduces the technological gap in terms of fabrication and assembly, and makes it easier for emerging manufacturers to enter the market. Cost reduction entails a shift in production from doing everything in-house to utilizing out-side sources, including the outsourcing of fab-rication and assembly processes, the division of work between EMSs and fabless manufacturers based on a clear definition of roles, the shifting of production bases to countries where labor costs are lower, and optimization of component procurement (the shifting from “procurement from group companies and affiliated compa-nies” to “procurement from outside sources”).
In the case of PCs, the concentration of impor-tant functions and high added value in Micro-soft’s basic OS products and Intel’s MPU products reduced the added value of the com-ponents and fabrication and assembly processes other than these key devices and this increased outsourcing (division of work based on a clear definition of roles) in the industry to reduce costs. In the outsourcing of work to EMSs by IBM, etc. that was accompanied by the selling of full factories to the former6, the efficiency and advantages of outsourcing were enhanced by transferring fabrication and assembly know-how to the EMSs. As outsourcing accel-
6 IBM sold the entire facilities of its North Carolina and Bordeaux factories to Solectron in 1992. This model has been the mainstream approach to date in production out-sourcing to EMSs by final product manufacturers. Some investment banks are acting as intermediaries by holding factories sold by final product manufacturers and leasing them to EMSs, and this has been encouraging final prod-uct manufacturers and EMSs to enter into factory sale contracts.
Flectronics (Singapore)Solectron
Development Bank of Japan Research Report/ No. 34 35

erated and EMSs expanded, final product manufacturers gradually shifted their focus to high added value areas such as design, devel-opment and services.7 As mentioned above, the recent rapid ex-pansion of the user bases for digital equipment, which reduced the quality differences among products, is another factor behind the shift from quality competition to cost competition. In the case of video cassette recorders, which were originally analog equipment, Japanese general electrical equipment manufacturers dominated the market and then gradually moved produc-tion bases to other countries, but in the case of DVD players, which originated as digital equipment, production bases were moved to other countries at an early stage. This difference is attributable to the progress of digitalization and modularization that made it easier to fabri-cate and assemble the products while making it more important to reduce the assembly cost (to reduce the selling price) as a means of differen-tiating products. The recent progress of digitalization and modularization gradually made outsourcing the production processes more advantageous for production efficiency than doing everything in-house, enabling the specialized American manufacturers to overtake Japanese general electrical equipment manufacturers in profit-ability and market share. 3. Increasing Awareness of the Importance
of the “Smile Curve” The semiconductor segment also experienced shifts in business models, including increased use of outsourcing, as the vast capital spending on facilities and R&D expenditure continued to soar and production know-how was gradually transferred from semiconductor manufacturers to equipment manufacturers. In the markets for multi-purpose products that had become com-modities such as DRAMs, the emphasis shifted from technology to cost reduction. In the
multi-purpose DRAM market, for example, specialized DRAM manufacturers offering low-cost products such as Samsung Electronics (South Korea) and Micron Technologies (United States) increased their market shares while Japanese general electrical equipment manufacturers, which had once forced Ameri-can manufacturers out of the market, gradually lost market share (in fact, some of them with-drew from the market in the late 1990s).8 The 1990s also saw the emergence and widespread embracement of a new business model based on the separation of design and production whereby fabless manufacturers pursue product development and foundry manufacturers pursue production cost reduction. The separation of design and production that was started by and spread among American fabless semiconductor manufacturers and Taiwanese foundry manu-facturers has now been adopted by major semi-conductor manufacturers. The declines in the competitiveness of Japanese general electrical equipment manufacturers in product develop-ment as well as cost competitiveness in the markets for multi-purpose products, which ac-count for a large proportion of the overall semiconductor market, occurred because they were slow to review their business models and adapt to the changing environment in the semi-conductor business.
7 The increasing modularization is attracting attention from researchers as a phenomenon that has been strongly affecting not only manufacturers’ ways of doing business but also their organizational structures (e.g. by increasing modularization of organizations).
The increasing use of outsourcing ex-plained above has led to increased awareness of the importance of the so-called “smile curve” that defines the relationship between the supply chain and added value, and nowadays Japanese general electrical equipment manufacturers are also taking the smile curve into consideration in restructuring their operations and businesses.
8 Oki Electric Industry has withdrawn from the market for multi-purpose DRAMs for PCs. Fujitsu has been shift-ing entirely from multi-purpose DRAMs to flash memo-ries since April 2000, and Toshiba decided in December 2001 to withdraw from the DRAM market.
36 Development Bank of Japan Research Report/ No. 34

Des
ign
and
deve
lopm
ent
(Low
) Add
ed v
alue
(Hig
h)
Semiconductorsand devices
Equipment fabricationand assembly
Software
Services
Entry is difficult(oligopoly by a small
number of companies)
Entry is easy(competition by
many companies)
Upstrea DownstreFlow of equipment
Mass-productionproducts
Test productionSmall-volume
production
Pursuing differentiation(quality, functions, etc.)
Pursuing economy of scaleShifting production bases
to other countries
Man
agem
ent
stra
tegi
es/p
rosp
ectsCore software
products
Individual(application-
specific)softwareproducts
EMSs (4 to 5%)Chinese plants
IBM
Microsoft(40 to 50%)
Micron (▲20 to +50%)
Foundrymanufacturers(30 to 40%)
Intel (30 to 35%)
Largest manufacturers of the segmentFabless manufacturers
Mod
ulesPr
oduc
tion
equi
pmen
t/mat
eria
ls
Selli
ng
Fig. 3-6 Modularization and the Smile Curve
Note: The company names are used only as examples. The bracketed figures are the (approximate) average oper-
ating profit on sales over the past 4 to 5 years. Sources: Prepared by the Development Bank of Japan from various materials and publications
Figure 3-7 compares major American manufacturers and major Japanese general electrical equipment manufacturers in terms of the time series changes in sales per employee. The sales per employee (index) of American manufacturers has been increasing faster than that of Japanese general electrical equipment manufacturers, which means that American manufacturers enjoy higher labor productivity than their Japanese counterparts. The gap with Japanese manufacturers started widening in the early 1990s, which is attributable to the Ameri-cans’ adoption of business models based on selective concentration and utilization of out-sourcing that enabled them to adapt to the pro-gress of modularization.
This chapter examined 1) the differences between American and Japanese electrical
Equipment manufacturers in terms of the busi-ness models used, and 2) the increasing modu-larization and digitization in recent years, which have greatly contributed to the widening of the profitability gap between American and Japa-nese electrical equipment manufacturers. Al-though these two factors alone do not fully ac-count for it, they are strongly correlated with the widening of the profitability gap. Japanese electrical equipment manufacturers have been actively restructuring their operations and businesses since 2001 not only in response to the sharp declines in profitability in 2001 but also in recognition of the importance of the above-mentioned developments that contributed to the widening of the profitability gap between American and Japanese electrical equipment manufacturers in the 1990s.
Development Bank of Japan Research Report/ No. 34 37

0
50
100
150
200
250
300
350
400
450
83 84 85 86 87 88 89 90 91 92 93 94 95 96 97 98 99 00 Year
Inde
x (1
983
= 10
0)
Sales per employee (American manufacturers)Sales per employee (Japanese manufacturers)Number of employees (American manufacturers)Number of employees (Japanese manufacturers)
Fig. 3-7 Comparison of Time Series Changes in Sales per Employee of Major American and Japanese Electrical Equipment Manufacturers
Notes: 1. The figures for American manufacturers are the averages of the 12 companies that have been pub-
lishing their financial data (consolidated basis) since before 1982. 2. The figures for Japanese manufacturers are the averages of 17 major companies (individual basis). Sources: Development Bank of Japan “Financial Data Bank”; Standard & Poor’s “Compustat”
38 Development Bank of Japan Research Report/ No. 34

IV General Electrical Equipment Manufacturers’ Restructuring of Operations and Future Prospects The analyses in the preceding chapters con-firmed that 1) the profitability of Japanese elec-trical equipment manufacturers is lower than that of their American counterparts, 2) the semiconductor and home appliances businesses of Japanese electrical equipment manufacturers are dragging down their profitability structur-ally and over the time series, respectively and 3) the different business models of American and Japanese electrical equipment manufactur-ers as well as the quicker response by American manufacturers to important developments in-cluding the increasing modularization contrib-uted significantly to the widening of the profit-ability gap between American and Japanese manufacturers in the 1990s. Against this back-ground, this chapter identifies the objectives of restructuring currently being undertaken by Japanese general electrical equipment manu-facturers and discusses the expected improve-ments.
1. Recent Instances of Restructuring The Japanese general electrical equipment manufacturers were constantly restructuring their operations even before 2001. Their re-structuring efforts in the past were mostly ex-pansion-oriented such as entering new electrical equipment segments, upstream electronic com-ponent/device/material segments and down-stream software and service segments, but their emphasis has been gradually shifting to con-sider the importance of management efficiency. In particular, there was a surge of seemingly negative restructuring efforts such as withdraw-als from markets and closure of factories in 2001 when sales slumped as the IT recession took hold. In terms of type of restructuring, employee cutbacks is the most common type among Japanese general electrical equipment manu-facturers. The purpose of these cutbacks, many of which were started in 2001, is to reduce fixed costs of administrative divisions and pro-
duction costs. In addition, although these em-ployee cutbacks were large-scale and intended to be completed quickly, Japanese general elec-trical equipment manufacturers have been try-ing to accelerate and expand them, such as by expanding the scale of cutbacks before the planned end of cutbacks and starting cutbacks earlier than planned. There have also been many instances of reorganization of operations and withdrawals from markets (segments) due to declines in de-mand and worsening of the business climate. In the semiconductor segment, in particular, Japa-nese general electrical equipment manufactur-ers have been undertaking large-scale restruc-turing such as withdrawal from markets and closure of factories in multi-purpose memory sub-segments (such as DRAM) and integration of production processes and facilities. These restructuring efforts show that Japanese general electrical equipment manufacturers are formally embracing the approach of shedding money-losing businesses and concentrating re-sources on profitable areas and businesses with high growth potential (selective concentration approach). It is becoming increasingly difficult to pursue the traditional approaches of expan-sion by adding new business areas and covering the full product range. Japanese general electrical equipment manufacturers are also increasingly selling factories to EMSs and outsourcing the production processes of the factories to them. The first Japanese manufacturer to do this was Mitsubishi Electric, which sold its cellular phone production factory in Georgia (United States) to Solectron in 1998, but since 2001 there have been several instances of this even in Japan. These are positive efforts to modify the business model to utilize outsourcing in response to the increasing modularization and digitization. Although in the past many Japanese general electrical equipment manu-facturers outsourced production through an OEM arrangement, the selling of factories to EMSs shows that they now formally accept out-ourcing. s
Development Bank of Japan Research Report/ No. 34 39

Type of restructuring Companies that acted Background/objective(s) Employee cutbacks (announced in and after 2001)
Mitsubishi Electric (semiconductor segment, 2,000 people cut by 2002), To-shiba (18,800 cut in total for Toshiba Group), Matsushita Electric Industrial (8,000 cut in total for domestic Matsushita Group), Hitachi (15,900 cut in total for Hitachi Group), Oki Electric Industry (2,200 cut by 2004), NEC (semiconductor segment, 4,000), Fujitsu (16,400 cut in total for domestic and overseas companies, factories, divisions)
Fixed/production cost re-duction
Withdrawals Fujitsu (DRAM), Toshiba (DRAM), Hitachi (com-ponents/devices for PCs and CRTs)
Transfers Fujitsu (color laser printers), NEC (sale of a printer factory), Oki Electric Industry (photomask produc-tion)
Factory closures
Matsushita Electric Industrial (cellular phone fac-tory in the U.K.), Hitachi (home appliances factory in Singapore), NEC (hard-disk factory in the Phil-ippines, Fujitsu (flash memory factory in the United States), Mitsubishi Electric (cellular phone factory in France), etc.
Reorganiza-tion of op-erations
Integration of semi-conductor production processes/facilities
Mitsubishi Electric, Fujitsu, Hitachi, NEC, Toshiba
Deficit reduction, concen-tration of corporate re-sources in high-growth business areas, strengthen-ing of operations in strong areas (those where the company has a leading market share), production efficiency improvement, timely adaptation to changes in market envi-ronments
Outsourcing
Production outsourc-ing to EMS (Solec-tron, etc.) with sale of factory
Mitsubishi Electric (cellular phones), Sony (vehi-cle-mounted audio-visual equipment, etc.), NEC (servers), etc.
Fixed/production cost re-duction
Introduction of com-pany-in-company systems, executive officer systems, etc.
Sony, NEC, Oki Electric Industry, Sanyo Electric, Hitachi (transformation of divisions into virtual companies-in-company), Fujitsu, etc.
To speed up the deci-sion-making process, to clarify executive responsi-bilities
Reorganization of subsidiaries
Matsushita Electric Industrial (domestic listed sub-sidiaries), Mitsubishi Electric (American subsidiar-ies), Fujitsu (network service-related subsidiaries), Sony (semiconductor production subsidiaries), NEC (software development subsidiaries, divestiture of the semiconductor division), Hitachi (divestiture of the display division), etc.
To improve management efficiency by eliminating redundant operations, to speed up the deci-sion-making process
Organiza-tional re-forms
Divestiture of produc-tion divisions and entries into the EMS market
Sony (Sony EMSC), Matsushita Electric Industrial (Factory Center), NEC (DMS), Oki Electric Indus-try (reinforcement of EMS businesses), etc.
To increase business op-portunities, to promote profitability awareness
Shifting of production bases to other coun-tries
All major Japanese general electrical equipment manufacturers → [4-2, 4-3]
Market expansion, produc-tion cost reduction Shifting of
manufactur-ing and other activi-ties to other countries
Recruiting of SEs in other countries, de-ployment of software development bases in China, reinforcement of service divisions
NEC, Fujitsu, Hitachi, Oki Electric Industry, etc. “Reinforcement of solution businesses”, etc.
To improve added value profitability, to strengthen software development ca-pability (especially in weak areas)
Integration Business partnerships All major Japanese general electrical equipment manufacturers → [4-5]
To address increases in the numbers of competitors, to minimize increases in R&D expenditure
Fig. 4-1 Recent Instances of Restructuring Efforts by Major Japanese General Electrical Equipment
Manufacturers
Sources: Prepared by the Development Bank of Japan from publications, etc. of the companies listed and interviews
40 Development Bank of Japan Research Report/ No. 34

In the semiconductor segment, too, some companies are moving away from the tradi-tional approach of doing everything in-house and instead actively utilizing foundry manufac-turers. Some Japanese general electrical equip-ment manufacturers are introducing com-pany-in-company systems to speed up the deci-sion-making process, as well as executive offi-cer systems to clarify business responsibilities. These are crucial tasks for Japanese general electrical equipment manufacturers to enable them to adapt to fluctuations in their markets such as sharp fluctuations in the DRAM market as well as dramatic changes in the business climate. Some of the major Japanese general trading companies have also adopted these ap-proaches, but whether the attempts by Japanese general electrical equipment manufacturers, which are designed to address problems inher-ent in general manufacturers covering broad business areas and in large companies, are ef-fective remains to be seen. On the other hand, some Japanese general electrical equipment manufacturers are inte-grating or reorganizing subsidiaries rather than divesting or spinning-off subsidiaries (by in-troducing a company-in-company system, for example), to improve the efficiency of the group as a whole and speed up the deci-sion-making process. Thus, Japanese general electrical equipment manufacturers are now searching for the right combination of company scale and degree of delegation of authority to maximize management efficiency and deci-sion-making speed. Some Japanese general electrical equip-ment manufacturers are selling their factories to EMSs and attempting to enter the EMS market themselves to boost profits by utilizing their advanced production technologies and know- how more fully, by manufacturing products for other companies on a contract basis. However, many questions remain to be answered, such as
whether there is a lack of production facilities in Japan in the first place, whether their domes-tic plants with high production and labor costs can compete with the incumbent EMSs, and whether they can win orders from other compa-nies in a country where most companies are still reluctant to outsource work to companies out-side their groups, even though such moves will improve the efficiency of production divisions by making them organizationally more inde-pendent and thus more conscious of profitabil-ity. These moves reflect their recognition of the effectiveness of American manufacturers’ business models. 2. Shifting of Production Activities, etc. to
Other Countries In the process of expanding their overseas sales, Japanese general electrical equipment manu-facturers have used the following main ap-proaches: (1) Exporting domestically manufactured
products; (2) Manufacturing and selling products in the
consumer country; (3) Manufacturing products in a country with
lower production costs and exporting the products to a third country or importing them back to Japan.
Figure 4-2 shows, by area, the time series changes in the number of overseas production companies established by Japanese general electrical equipment manufacturers. In the 1970s, the share of the overseas production companies established in NIES countries as a percentage of the total was largest while in the late 1980s, the number of overseas production companies increased sharply, especially in ASEAN countries, as the appreciation of the yen accelerated. In the early 1990s, on the other hand, the number of overseas production com-panies in China increased dramatically.
Development Bank of Japan Research Report/ No. 34 41

0
50
100
150
200
250
-70 71-75 76-80 81-85 86-90 91-95 96-00 Period
R&D companies (overseas total) ChinaASEAN NIESEurope America
Number of companies
Fig. 4-2 Changes in the Number of Overseas Production Companies Established by
Japanese General Electrical Equipment Manufacturers by Area
Source: Prepared by the Development Bank of Japan from the “Overseas Subsidiaries of Japanese Companies 2000” published by Electronic Industries Association of Japan (presently JEITA)
������������������������������
������������������������
������������������������������
����������������������������
����������������������������
��������������������������������
��������������������������������
����������������������������������������
����������������������������
�����������������������������������
����������������������������������������
��������������������������������
����������������������������������������
��������������������������������
��������������������������������
��������������������������������
���������� ����
����������
��������
��������
��������
�������� ����� ����
��������������
����������
��������
���������������
��������
��������
������������
05
1015202530354045
85 86 87 88 89 90 91 92 93 94 95 96 97 98 99 00 Year
Trillion yen
0
5
10
15
20
25%
�����������Overseas production (estimated)�����������
Overseas production ratio (in %, on the right-hand scale)
Fig. 4-3 Changes in the Electrical Equipment Industry’s Domestic Production vs.
Overseas Production
Note: The overseas production was estimated by the Development Bank of Japan from the “Over-seas Business Basic Research” published by the Ministry of Economy, Trade and Industry.
Sources: Ministry of Economy, Trade and Industry “Preliminary Report on Machinery Statistics” and publications of JEMA and JEITA
Domestic production
42 Development Bank of Japan Research Report/ No. 34

0
1000
2000
3000
4000
5000
6000
97 98 99 00 01As of the end of calendar year
10,000 people
0
20
40
60
80
100
120%
Number of Internet users in JapanNumber of Internet user companies as a percentage of the total number of companies in Japan (scale on the right)Number of Internet users as a percentage of Japan’s total population (scale on the right)
Fig. 4-4 Changes in the Number of Internet Users
Source: Ministry of Economy, Trade and Industry “Communications Usage Trend Survey”
As the number of overseas production companies of Japanese general electrical equipment manufacturers increased, their over-seas production ratio increased steadily.1 In 2001, however, Japanese manufacturers closed many of their overseas plants or liquidated overseas production companies, as they shifted from the traditional expansionary approach to a focused approach that emphasizes efficiency. There were also sharp increases in the number of overseas R&D companies estab-lished by Japanese general electrical equipment manufacturers during the 1986-2000 period in line with the sharp increases in the number of their overseas production bases. These overseas R&D companies were mainly set up to develop products and services that met the needs of the local markets and to reduce R&D costs. In re-
cent years, many companies are setting up software development bases in China, which is attractive not only because of the low costs but also because of the high skill levels of Chinese workers and engineers.
Development Bank of Japan Research Report/ No. 34 43
1 A high overseas production ratio may reduce that country’s domestic employment and opportunities for adding value (i.e. deindustrialization). The overseas pro-duction ratios for the manufacturing industries of the United States and Germany (27.7% (1997) and 32.1% (1997), respectively) are higher than the 13.4% (FY 2000) for the manufacturing industries of Japan.
Japanese general electrical equipment manufacturers are also strengthening their software and service businesses. This trend is attributable to 1) the increasing profit opportu-nities as demand for after-sales service grows alongside the expansion of PC and Internet user bases, 2) the recent declines in profitability in all production segments except the “key de-vice” segments and 3) the increasing awareness, among both users and suppliers, of the value of software and services that have traditionally been built into the selling prices of hardware products. Although many Japanese general electrical equipment manufacturers have al-ready launched audio-visual software content provider businesses and Internet service pro-vider businesses, the growing number of Inter-net users, the increasing diversification in uses of the Internet, the potential growth of the Internet, as well as the expectation that demand

for outsourcing will continue to increase as in-formation equipment becomes more complex, thus increasing operation and maintenance work (in companies, for example), have been encouraging Japanese general electrical equip-ment manufacturers to focus on service busi-nesses. In addition, the success of IBM in shifting to service businesses in the United States has also affected the business strategies of Japanese general electrical equipment manufacturers. The development of “solution businesses,” which provide everything from hardware to services as a package, to maintain and increase hardware market shares and make up for the shrinking added value (profitability) in hard-ware businesses, has now become a key task for Japanese general electrical equipment manu-facturers.
3. Increasing Business Partnerships One of the restructuring modes increasingly being used by Japanese general electrical equip-
ment manufacturers is business partnerships among themselves or with manufacturers in other countries. Although Japanese manufac-turers have been using business partnerships for many years in the form of collaborative R&D, technology transfers, mutual supply agreements, etc., the integration of the DRAM businesses of NEC and Hitachi in 1999 was the first of the recent attempts to strengthen, through integra-tion, existing main businesses which have been losing competitiveness, profitability, market share, etc. Various partnerships are being formed in many segments including semicon-ductors, but the analysis that follows only cov-ers those in the important areas of: - home appliances - information and communications equipment - semiconductors and other electronic com-
ponents and devices
44 Development Bank of Japan Research Report/ No. 34

H
T
MitsE
NEC
F
Home appliances
Partner(s) Description of partnership Partner(s) Description of partnership Partner(s) Description of partnership
itachi Electric washers, etc. (joint venture) IBM (United States) Collaborative development ofservers
NEC DRAMs (joint venture)
IBM (United States) Integration of hard-disk businesses(joint venture)
Fujitsu PDP (joint venture)
Matsushita ElectricIndustrial
Refrigerators, electric washers, vacuumcleaners, air-conditioners, etc.(development, environmentalobligation-related activities, etc.)
ST Microelectronics (Italy,France)
Development of Super H(Microcomputer)
Mitsubishi Electric System LSIs (integration ofbusinesses)
oshiba Carrier (United States) Air conditioners (joint venture) Siemens (Germany) Collaborative development of 3Gcellular phone terminals
IBM (United States), Sony Collaborative development ofsemiconductors
Electrolux (Sweden) Refrigerators, electric washers, vacuumcleaners, air-conditioners, etc.(development, mutual supply ofproducts)
Mitsubishi Electric Collaborative development of 3Gcellular phone terminals
Matsushita ElectricIndustrial
Liquid crystals (joint venture), CRTs
Midea Group (China) Refrigerators (technological exchanges,mutual sale)
[Dissolved] IBM (UnitedStates)
Liquid crystals
Fujitsu Development of system LSIs
ubishilectric
SharpDevelopment ofsystem LSIs
Collaborative development of PDAsfor European markets
Matsushita ElectricIndustrial
Development of system LSIs
Toshiba Collaborative development of 3Gcellular phone terminals
Toppan Printing Semiconductor photomasks
Chunghwa Picture Tubes(Taiwan)
Collaborative development of PDP
Hitachi System LSIs (integration ofbusinesses)
Packard Bell (UnitedStates)
PCs (subsidiarization) Hitachi DRAMs (joint venture)
Matsushita ElectricIndustrial
Collaborative development ofsoftware programs for cellularphones
Samsung SD (South Korea) Organic EL (joint venture)
SVA Electron (China) TFT liquid crystals (joint venture)
Toppan Printing Circuit substrates (joint venture)
ujitsu Siemens (Germany) PCs (joint venture) AMD (United States) Flash memories (joint venture)
Alcatel (France) Cellular phone base stations(collaborative development)
Hitachi PDP (joint venture)
IBM (United States, undernegotiation)
(Collaborative development ofcomputer software programs)
Amkor Technology (UnitedStates)
Semiconductor post-processes
Toshiba Development of system LSIs
Oki ElectricIndustry
Fujitsu Development of mobilecommunication systems (jointventure)
Casio Collaborative development of LSIpackages
GSMC (China) Semiconductors (technologytransfer, production outsourcing)
Hoya Semiconductor photomasks(outsourcing)
MatsushitaElectricIndustrial
Hitachi Refrigerators, electric washers, vacuumcleaners, air-conditioners, etc.(development, environmentalobligation-related activities, etc.)
NEC Collaborative development ofsoftware programs for cellularphones
Mitsubishi Electric Development of system LSIs
Daikin Industries Air conditioners (development, etc.) CRTs (mutual supply)
TCL Group (China) Home appliances (development,marketing)
Toshiba Liquid crystals (joint venture), CRTs
Sharp Sanyo Electric Refrigerators, electric washers, vacuum Quanta (Taiwan) Liquid crystals (OEM procurement)Pioneer Audio-visual equipment (collaborative Tohoku Pioneer, etc. Organic EL (joint venture)
Sony Ericsson (Sweden) Integration of cellular phonebusinesses (joint venture)
IBM (United States),Toshiba
Collaborative development ofsemiconductors
Toyota Industries LCD panels (joint venture)
Sanyo Electric Maytag (United States) Refrigerators, electric washers, vacuumcleaners, air-conditioners, etc.(development, mutual supply)
Kodak (United States) Digital cameras (comprehensivepartnership)
Kodak (United States) Organic EL (joint venture)
Sharp Refrigerators, electric washers, vacuumcleaners, air-conditioners, etc.(development, mutual OEM supply)
Samsung G (South Korea) Fuel cells (technologicalcooperation)
Haier Group (China) Home appliance marketing, technologytransfer, etc.
(Referenceinformation)Partnershipsformedoutside Japan
PCs (Under negotiation) DRAMs
Micron (United States) – Hynics (South Korea)Compaq (United States) – HP (United States)
BHS Bosch & Siemens(Germany)
Thomson Multimedia(France)
Information and communications equipment Semiconductors and electronic components/devices�������������������������������������������������������������������������������������������������������������������������������������������������������
��
���
�����
������
�������
������
�������
��������
����
�����
������
�����
������
�������
����
�����
������
����
�����
������
�����
������
�������
��
���
����
��
���
���
�����
�����
������
���
���
���
�������������������������������������������������������������������������
Fig. 4-5 Partnerships between Major Electrical Equipment Manufacturers (joint ventures, collaborative development, etc.)
Note: The companies shown in bold letters are non-Japanese companies. Sources: Prepared by the Development Bank of Japan from various publications
Development Bank of Japan Research Report/ No. 34 45

In the home appliances segment, Japanese electrical equipment manufacturers have re-cently started forming partnerships among themselves in the maturing domestic markets, in order to strengthen their recycling and envi-ronmental obligation-related activities to com-ply with regulations including the newly-introduced Home Appliances Recycling Law (that took effect in April 2001), strengthen divisions and departments responsible for de-veloping IT home appliances for which demand is expected to increase, and avoid excessive competition in domestic markets. Japanese electrical equipment manufacturers have also started forming partnerships with local manu-facturers in China, reflecting Japanese electrical equipment manufacturers’ strategy of main-taining and increasing market share by taking advantage of the sales channels and cost com-petitiveness of Chinese manufacturers, which have been increasing their selling power in mainland China as well as in Asian countries.
In the information and communications equipment segment, Japanese electrical equip-ment manufacturers are forming partnerships with American and European manufacturers as well as among themselves. Meanwhile, the PC sub-segment is characterized by concentration of profits in a small number of non-final prod-uct manufacturers that dominate competitors over industry standards such as Intel and Mi-crosoft, partnerships aimed at strengthening market dominance such as the merger of HP (United States), which is one of largest manu-facturers in the world, and Compaq (United States), as well as partnerships between Japa-nese electrical equipment manufacturers and IBM that reflect the Japanese parties’ desire to strengthen their software development and ser-vice businesses. In the cellular phone sub-segment, Japanese electrical equipment manufacturers, which are commercializing (and shifting to) third-generation cellular phones ahead of the rest of the world, have been ac-
Establishment of joint venture companyPartnerships through collaborative development, etc.
Hitachi
Sharp
BHS Bosch &Siemens
Pioneer
Carrier
Electrolux
Refrigerators, electricwashers, vacuumcleaners, air-conditioners, etc
Development,marketing, etc.
Refrigerator business
Electricwashers, etc.
Air conditioners
Marketingpartnerships, etc.
Airconditioners
Audio-visual equipmentdevelopment
American andEuropean
manufacturers
Japanesemanufacturers
Asianmanufacturers
Daikin Industries
Refrigerators,electric washers,vacuum cleaners,air-conditioners,etc.
Refrigerators, electricwashers, vacuumcleaners,air-conditioners, etc
Refrigerators, electricwashers, vacuum cleaners,air-conditioners, etc
Toshiba Midea Group
Sanyo Electric Haier GroupMaytag
MatsushitaElectric TCL Group
Fig. 4-6 Major Partnerships in the Home Appliances Segment
Sources: Prepared by the Development Bank of Japan from various publications
46 Development Bank of Japan Research Report/ No. 34

Establishment of joint venture companyCollaborative development and other partnerships
Collaborativedevelopment of
software programs
Collaborative develop-ment of 3G cellular
phone terminals
Joint ventures,integration of
businesses
Collaborative develop-ment of 3G cellular
phone terminals
American andEuropean
manufacturers
Japanesemanufacturers
Siemens
SonyEricsson
MitsubishiElectric
NECMatsushita Electric Industrial
Matsushita Communication Industrial
Toshiba
Fig. 4-7 Major Partnerships in the Cellular Phone Sub-segment
Sources: Prepared by the Development Bank of Japan from various publications
tively forming partnerships with major Euro-pean manufacturers to strengthen their competi-tiveness against Nokia, which has dominated the global cellular phone terminal market, as well as partnerships among themselves to speed up the software development process and reduce development costs. In the area of semiconductors and other electronic components and devices, Japanese electrical equipment manufacturers have been actively forming partnerships to reduce their capital spending on facilities and R&D expen-diture that have become vast and continue to rise. As a result of the continuous shrinking of market share in the 1990s and the sharp decline in sales in 2001, the relationships among play-ers in the Japanese semiconductor industry are changing dramatically as can be seen in the in-tegration of the DRAM businesses of Hitachi and NEC, the collaborative development part-nership agreement reached between Toshiba and Fujitsu and the (planned) integration of businesses of Hitachi and Mitsubishi in the
system LSI2 sub-segment, in which Japanese electrical equipment manufacturers have been more actively pursuing development, marketing and other activities than in any other sub-segment. In addition, Japanese electrical equipment manufacturers have been actively forming partnerships in other segments as well, including advanced device segments (such as the organic EL and PDP3 segments) which are expected to expand, and the liquid crystal de-vice segment. In these electronic component and device segments, Japanese electrical equipment manufacturers have been forming partnerships with material manufacturers (such as the PDP partnership between Matsushita
2 System LSIs are large-scale integrated circuits that have memory, logic, analog and other functions in one chip and are also referred to as “system-on-chip” ICs. A system LSI allows a system that traditionally had to be constructed on a board to be fabricated on a single semi-conductor. 3 Organic EL and PDP have already been commercial-ized (mainly for small- and large-sized screens, respec-tively) and their use is expected to increase.
Development Bank of Japan Research Report/ No. 34 47

Eptti tpprspmJatf
4
Establishment of joint venture companyCollaborative development and other partnerships
NEC Hitachi
MitsubishiElectric
MatsushitaElectric
UMC
Sony SCEI
DRAM productionjoint venture
Collaborative developmentof system LSIs
System LSI businessintegration planned
Joint venture forthe CPU for PS2
Flash memoryproduction
joint venture
Collaborativedevelopment of
productiontechnologies
Collaborative development of next-generation memory devicesAgreed to develop system LSIs in collaboration
Partnership dissolved
American andEuropean
Japanesemanufacturers
Asianmanufacturers
CPU core development
IBM
AMD
STMicroelectronics
Toshiba
Fujitsu
Fig. 4-8 Major Partnerships in the Semiconductor Segment
Sources: Prepared by the Development Bank of Japan from various publications
lectric Industrial and Toray Industries) and roduction equipment manufacturers (such as he semiconductor photomask partnership be-ween Oki Electric Industry and Hoya) as well, n addition to partnerships among themselves.
The partnerships in all segments share cer-ain common objectives, such as to enhance rofitability by gaining dominant power over rices and increasing market share, as well as to educe fixed costs through reduction of capital pending on facilities. Although the only com-etitors that Japanese electrical equipment anufacturers had to take seriously were other
apanese electrical equipment manufacturers nd certain American and European manufac-urers in the 1980s when the Japanese manu-acturers had large market shares in the home
appliances and semiconductor segments, for example, and were technologically superior to other countries’ manufacturers, as emerging manufacturers from South Korea, Taiwan, China, etc. entered the market one after another in the 1990s while improving their technologi-cal expertise and increasing their market share, the areas in which Japanese electrical equip-ment manufacturers could continue to operate profitably by themselves were gradually squeezed out. The partnerships being pursued by Japa-nese general electrical equipment manufactur-ers are unique in that they are formed on a segment-by-segment basis, whereas partner-ships being formed (and mergers being made) in the material manufacturing industries (such
8 Development Bank of Japan Research Report/ No. 34

as the paper and pulp industry and other chemical industries) are between companies. Because they cooperate as partners in some ar-eas and compete in others (such as the cellular phone partnerships between Matsushita and NEC and between Toshiba and Mitsubishi and the liquid crystal partnership between Matsu-shita and Toshiba), the current partnership rela-tionships between Japanese general electrical equipment manufacturers do not necessarily reflect their competitive relations as companies.
4. Japanese General Electrical Equipment Manufacturers’ Restructuring of Operations
and Future Prospects Currently the strength of Japanese general elec-trical equipment manufacturers is their ability to provide a wide range of electrical equipment including peripherals and to develop compo-nents and devices taking into consideration the customer needs for final products, as well as their superiority in solution businesses (provi-sion of products and services as a single pack-age), where they have been actively strength-ening their competitiveness. It is also possible that Japanese general electrical equipment manufacturers, which have been manufacturing PCs and cellular phones as well as a wide range of home appliances within their groups, may be successful in the growing IT home appliances
segment and outperform competitors by using their expertise in integrated design and devel-opment, etc. Another advantage of Japanese general electrical equipment manufacturers is that they have spread business risks widely by becoming general manufacturers. Their heavy electric ap-paratus and communications equipment busi-nesses originally were stable profit sources sup-ported by large and loyal customers (such as electric utilities and large telecommunications companies), enabling them to aggressively en-ter new segments. In addition, these stable profit sources have helped them hold onto the several money-losing businesses yet post profits for the group as a whole. However, Japanese general electrical equipment manufacturers, which performed outstandingly in the 1980s, have been overtaken in profitability by specialized American manu-facturers partly as a result of changes in the business climate such as the progress of modu-larization and have been losing market share to American and European final product manu-facturers that have been actively utilizing out-sourcing. As a result, they must now review and change their business models which were effec-tive in the 1980s. It would be both difficult and unrealistic for Japanese general electrical equipment manufacturers to try to regain their market
Before
Com
pany
A
Com
pany
B
Com
pany
C
Com
pany
D
Com
pany
E
Com
pany
F
Com
pany
G
Com
pany
H
Com
pany
I
After
Com
pany
A
Com
pany
B
Com
pany
C
Com
pany
D
Com
pany
E
Com
pany
F
Com
pany
G
Com
pany
H
Com
pany
I
Business 1 ○ ○ ○ ◎ ○ ○ ○ ○ ○ Business 1 ◎
Business 2 ○ ○ ○ ○ ○ ○ △ ○ ○ Business 2 ×
Business 3 ○ ○ ○ ○ ◎ ○ ○ ○ ○ Business 3 ◎
Business 4 ◎ △ ○ ○ ○ ○ ○ ○ △ Business 4 ◎ × ×
Fig. 4-9 Strengthening of Businesses through Partnerships
Note: ○ indicates that the company is operating
without a partnership. ◎ indicates that the company has one of the
leading market shares, and △ indicates that the company has a low mar-
ket share. Source: Prepared by the Development Bank of Japan
Note: 〇 denotes a business partnership, and × indicates that the company has with-
drawn from the business.
Development Bank of Japan Research Report/ No. 34 49

shares and improve their profitability by copy-ing the specialized American manufacturers, that is, by drastically reducing or integrating their wide range of businesses. Business part-nerships, which are currently being pursued by Japanese general electrical equipment manu-facturers, are the most effective and realistic means of simultaneously achieving 1) selective concentration in segments where they can be profitable, 2) sufficient market share to gain reasonable market dominance and 3) reductions in financial burdens including facility invest-ment based on their current business models. Japanese general electrical equipment manu-facturers are likely to gradually build their strong areas while shedding unprofitable busi-nesses through partnerships with domestic and overseas manufacturers.
5. Conclusions Dissolving partnerships, such as the liquid crystal partnership between Toshiba and IBM, the semiconductor partnership between Hitachi and UMC and the partnership between NEC and Thomson Multimedia for displays, suggest that not all partnerships go smoothly. The key factor in a partnership is whether decisions can be made fast enough, because there is a close correlation between deci-sion-making speed and the effectiveness of the partnership. Recognizing the slowness of their decision making, Japanese general electrical equipment manufacturers have been attempting to speed up the process through organizational reforms including the introduction of com-pany-in-company systems. The effectiveness of these organizational reforms remains to be seen, but fast decision-making, which is difficult even for a single company, may well become more difficult in a partnership between two or
more companies. The higher frequency of part-nership breakups between Japanese and over-seas manufacturers than between Japanese manufacturers is partly because Japanese and overseas manufacturers place different impor-tance on decision-making speed. In particular, for semiconductor businesses, which are subject to wide market fluctuations as in the DRAM market, it is necessary to develop mechanisms for 1) making quick decisions on the timing of investments and production adjustments in re-sponse to changes in business climate, etc., and 2) planning and implementing sound businesses from a long-term perspective. Although the competition-driven dyna-mism of the industry as a whole may decrease as a result of business partnerships which re-duces the number of business entities (com-petitors) in the industry, the increasing diffi-culty of differentiating products as new manu-facturers emerge in Asia and other countries, as well as the increasing modularization and dig-itization, leave Japanese general electrical equipment manufacturers with no choice but to raise profitability by integrating businesses to achieve economies of scale. Japanese general electrical equipment manufacturers have recog-nized for some time the importance of the “se-lection and concentration” approach, but have in fact continued to expand into new areas with-out focus. A realistic and effective path for Japanese general electrical equipment manu-facturers is to strengthen their core businesses by focusing corporate resources while partner-ing with other companies for their non-core businesses.
50 Development Bank of Japan Research Report/ No. 34

Appendix
Companies and Company Classification Used for Statistical Calculations for Figs. 1-1 to 1-8
(1) 17 Japanese manufacturers Sales (by fiscal year, consolidated, 100 million yen)
10 General electrical equipment manufacturers Remark Notation used in the text
(abbreviated notation) 1999 2000 2001
Hitachi, Ltd.
Toshiba Corporation
Mitsubishi Electric Corporation
NEC Corporation
Fujitsu
Oki Electric Industry Co., Ltd.
Matsushita Electric Industrial Co., Ltd
Sharp Corporation
Sony Corporation
Sanyo Electric Co., Ltd.
(Hitachi)
NEC
(Oki Electric Industry)
(Matsushita Electric Industrial or Matsushita)
80,0125
57,494
37,742
49,914
52,551
6,698
72,994
18,548
66,867
20,143
84,170
59,514
41,295
54,097
54,844
7,403
76,816
20,129
73,148
22,410
79,938
53,940
36,490
51,010
50,070
6,046
68,767
18,038
75,783
21,121
Other (3) electrical equipment manufacturers
Fuji Electric Co., Ltd.
Pioneer Corporation
Omron Corporation
8,518
6,159
5,554
8,911
6,471
5,943
8,391
6,689
5,340
4 Electronic component & device manufacturers
TDK Corporation
Kyocera Corporation
Murata Manufacturing Co., Ltd.
Alps Electric Co., Ltd.
TDK 6,745
8,126
4,591
5,469
6,899
12,851
5,840
5,731
5,750
10,346
3,948
5,403
Development Bank of Japan Research Report/ No. 34 51

(2) 25 American manufacturers Sales (by fiscal year, consolidated, 100 million yen)
Remark Notation used in the text (abbreviated notation) 1999 2000 2001
5 American semiconductor manufacturers
INTEL
TEXAS INSTRUMENTS INC.
MICRON TECHNOLOGY INC
AGERE SYSTEMS INC
ADVANCED MICRO DEVICES
Intel
Texas Instruments (TI)
Micron Technology (Micron)
(AMD)
29,389
9,468
3,764
3,714
2,858
33,726
11,860
7,336
4,708
4,644
26,539
8,201
3,936
4,080
3,892
3 American EMSs
SOLECTRON CORP
CELESTICA INC
SCI SYSTEMS INC
Canada Solectron
Celestica
8,391
5,297
6,711
14,138
9,752
8,343
18,692
10,004
8,714
Other (17) electrical equipment manufacturers
Com
mun
ica-
tions
equ
ipm
ent MOTOROLA INC
LUCENT TECHNOLOGIES INC
NORTEL NETWORKS CORP
AVAYA INC
Canada Motorola
(Lucent T)
(Nortel N)
30,931
38,303
22,277
8,268
37,580
33,813
30,293
7,680
30,004
21,294
17,531
6,793
Hom
e ap
pli-
ance
s, et
c. GENERAL ELECTRIC CO
EMERSON ELECTRIC CO
WHIRLPOOL CORP
ROCKWELL INTL CORP
Individual GE 55,712
14,270
10,511
7,043
63,872
15,545
10,325
7,151
68,093
15,480
10,343
7,099
PCs a
nd p
erip
hera
l equ
ipm
ent
HEWLETT-PAKARD CO
COMPAQ COMPUTER CORP
DELL COMPUTER CORP
GATEWAY INC
APPLE COMPUTER INC
CISCO SYSTEMS INC
XEROX CORP
SUN MICROSYSTEMS INC
EMC CORP/MA
(HP)
(Compaq)
(Dell)
(Apple)
42,370
38,525
25,265
8,646
6,134
12,154
19,228
11,726
6,716
48,782
42,383
31,888
9,601
7,983
18,928
18,701
15,721
8,873
45,226
33,554
31,168
6,080
5,363
22,293
16,502
18,250
7,091
Reference information (not included in the statistics)
INTERNATIONAL BUSINESS MACHINES CORP IBM
87,548
88,396
85,866 Sources: Prepared by the Development Bank of Japan from “Financial Data Bank”; Standard & Poor’s “Compustat”; secu-
rities reports and annual reports of the companies shown
52 Development Bank of Japan Research Report/ No. 34

References Aoki, Masahiko and Haruhiko Ando. 2002.
“Module-ka Atarashii Sangyo Architecture no Honshitsu (Modularization – The Essence of the New Industry Architecture),” Toyo Kei-zai Inc. (March)
Association for Electric Home Appliances. 2001.
“Kaden Sangyo Handbook (Home Appliances Industry Handbook).”
Dempa Shimbun, Inc. “Denshi Kogyo Nenkan
(Electronic Industries Yearbook)” (editions for the years covered).
Economic Research Center, Fujitsu Research
Institute. 2001. “Nihon no Electronics Sangyo no Kyosoryoku Kojo ni mukete – EMS kara Nani wo Manabuka (A Plan for Improving the Competitiveness of the Japanese Electronics Industry – Lessons from the Success of EMSs)” (October).
Electronic Industries Association of Japan. 2000.
“2000 Kaigai Hojin List (Overseas Subsidiaries of Japanese Companies 2000)” (October).
Electronic Industries Association of Japan. 2000.
“IC Guide Book 2000” (March). Electronic Journal, Inc. “Semiconductor Data-
book” (editions for the years covered). Japan Bank for International Cooperation. 2001.
“2002 nendo Kaigai Chokusetsu Toshi Enquête Chosa Kekka (Dai 13 kai) (Results of the 2001 (13th) Questionnaire Survey on Direct Over-seas Investments)” (November).
Japan Electronics and Information Technology
Industries Association. 2001. “2001 nen Chugoku Denshi Kogyo no Doko Chosa Hou-kokusho (Research on Trends in Chinese Elec-tronic Industries 2001)” (September).
Japan Electronics and Information Technology
Industries Association. 2001. “Minseiyo Denshikiki Data shu (Data on Electronic Home Appliances)” (June).
Inagaki, Kimio. 2001. “EMS Senryaku Kigyoka-
chi wo Takameru Seizo Outsourcing (EMS Strategy – Outsourcing Heightens the Value of Companies),” Diamond, Inc. (January).
Ministry of Economy, Trade and Industry. “Trend
Survey of Overseas Business Activities” (edi-tions for the years covered).
Ministry of Economy, Trade and Industry. “Pre-
liminary Report on Machinery Statistics” (edi-tions for the years covered).
Ministry of Public Management, Home Affairs,
Posts and Telecommunications, Statistics Bureau. “Survey of Research and Develop-ment” (editions for the years covered).
Ricks Inc. “Kaden Ryutsu Data Soran (Home Ap-
pliances Distribution Data Pandect)” (editions for the years covered).
Sakura General Research Institute. 2001.
“2000/2001 Asia Shuyo Sangyo no Kaiko to Tenbo (Review of Major Industries in Asian Countries and Future Outlook 2000/2001)” (March).
Sangyo Times, Inc. “Handotai Jigyo Keikaku Soran
(Overview of Business Plans in the Semicon-ductor Industry)” (editions for the years cov-ered).
Sangyo Times, Inc. “Ekisho・PDP・EL Maker
Keikaku Soran (Overview of Liquid Crys-tal/PDP/EL Manufacturers’ Business Plans)” (editions for the years covered).
Science and Technology Agency, Science and
Technology Policy Research Institute. “Ka-gaku Gijutu Shihyo (Science and Technology Indices).”
Semiconductor Equipment Association of Japan.
“SEAJ Pocket Book Handotai・Ekisho Sochi Gyokai Benri cho (SEAJ Pocket Book – A Guide to the Semiconductor/Liquid Crystal Equipment Industries).”
Development Bank of Japan Research Report/ No. 34 53
Semiconductor Industry Research Institute of Japan. 1999. Research on “Market Structure Changes and High Added Value Semiconduc-tor Companies’ Business Strategies” (August).
Semiconductor Industry Strategy Promotion
Committee. 2002. “Wagakuni Handotai San-gyo no Kadai to Taiou (Challenges for the Japanese Semiconductor Industry and Solu-tions)” (May).
Teshima, Shigeki. 2001. “Kaigai Chokusetsu Toshi to Globalization (Foreign Direct Investments and Globalization),” Chuo University Press (April)
54 Development Bank of Japan Research Report/ No. 34

List of Back Numbers (Including JDB Research Report)
No. 34 Prospects and Challenges Surrounding Japan’s Electrical Equipment Industry: General Electrical Equipment Manufacturers’ Restructuring of Operations and Future Prospects (this issue)
No. 33 Survey on Planned Capital Spending for Fiscal Years 2001, 2002 and 2003, November 2002
No. 32 Behavior Trends of Japanese Banks toward the Corporate Sector and Their Impact on the Econ-omy, October 2002
No. 31 Microstructure of Investment and Employment Dynamics: Stylized Facts of Factor Adjustment Based on Listed Company Data, October 2002
No. 30 Recent Trends in the Japanese Economy: Globalization and the Japanese Economy, August 2002
No. 29 Corporate Financing Trends in Recent Years: Fund Shortages and Repayment Burden, August 2002
No. 28 Urban Renewal and Resource Recycling: For the Creation of a Resource Recycling Society, July 2002
No. 27 Labor’s Share and the Adjustment of Wages and Employment, June 2002
No. 26 Survey on Planned Capital Spending for Fiscal Years 2001 and 2002, May 2002
No. 25 Environmental Information Policy and Utilization of Information Technology: Toward a Shift in Environmental Policy Paradigm, March 2002
No. 24 The Changing Structure of Trade in Japan and Its Impact: With the Focus on Trade in Informa-tion Technology (IT) Goods, March 2002
No. 23 Microstructure of Persistent ROA Decline in the Japanese Corporate Sector: Inter-company Disparties and Investment Strategies, March 2002
No. 22 Recent Trends in the Japanese Economy: The Japanese Economy under Deflation and Prospects of Evolution, February 2002
No. 21 Survey on Planned Capital Spending for Fiscal Years 2000, 2001 and 2002, December 2001
No. 20 Current Situation and Challenges for Cable Television in the Broadband Era, October 2001
No. 19 Recent Trends in the Japanese Economy: The Japanese Economy under Deflation, August 2001
No. 18 Introduction of a Home Appliance Recycling System: Effects & Prospects: Progress towards Utilisation of Recycling Infrastructure, June 2001
No. 17 Survey on Planned Capital Spending for Fiscal Years 2000 and 2001, June 2001
No. 16 Revitalization of Middle-aged and Elderly Workers in Japan’s Labor Markets: Requiring the Expansion of the Vocational Training Functions, March 2001
No. 15 Risk-Averting Portfolio Trends of Japanese Households, March 2001
No. 14 Consumption Demand Trends and the Structure of Supply: Focus on Retail Industry Supply Be-havior, March 2001
No. 13 Recent Trends in the Japanese Economy: Weakness of Current Economic Recovery and Its Background, March 2001
No. 12 Empirical Reassessment of Japanese Corporate Investment Behavior: Features and Changes since the 1980s, based on Micro-level Panel Data, March 2001
No. 11 Survey on Planned Capital Spending for Fiscal Years 1999, 2000 and 2001, October 2000
No. 10 Job Creation and Job Destruction in Japan, 1978-1998: An Empirical Analysis Based on Enter-prise Data, September 2000
No. 9 Recent Trends in the Japanese Economy: Information Technology and the Economy, September 2000

No. 8 Trend of International Reorganization Affecting the Japanese Automobile and Auto Parts Indus-tries, June 2000
No. 7 Survey on Planned Capital Spending for Fiscal Years 1999 and 2000, June 2000
No. 6 Current Status and Future Perspective of the Japanese Remediation Industry: Technology and Market for Underground Remediation, May 2000
No. 5 Recent Trends in the Japanese Economy: The 1990s in Retrospect, March 2000
No. 4 Destabilized Consumption and the Post-bubble Consumer Environment, February 2000
No. 3 The Slump in Plant and Equipment Investment in the 1990s: Focusing on Lowered Expectations, the Debt Burden and Other Structural Factors, January 2000
No. 2 Survey on Planned Capital Spending for Fiscal Years 1998, 1999 and 2000, November 1999
No. 1 Corporate Strategies in Japan’s Semiconductor Industry: Implications of Development in Other Asian Countries, November 1999
JDB Research Report
No. 96 Recent Trends in the Japanese Economy: Focused on Fixed Investment and Capital Stock, Au-gust 1999
No. 95 Efforts to Protect the Natural Environment in the United States and Germany: Environmental Mitigation and Biotope Conservation, July 1999
No. 94 Survey on Planned Capital Spending for Fiscal Years 1998 and 1999, June 1999
No. 93 Towards the realization of ‘environmental partnership’: A survey of Japan’s environmental NPO sector through comparison with Germany, June 1999
No. 92 The Impact of Demographic Changes on Consumption and Savings, March 1999
No. 91 Recent Research and Development Trends in Japanese Enterprises: Technology Fusion, March 1999
No. 90 Recent Trends in the Japanese Economy: Prolonged Balance Sheet Adjustment, January 1999
No. 89 Impact of Asset Price Fluctuations on Household and Corporate Behavior: A Comparison be-tween Japan and the U.S., December 1998
No. 88 Survey on Planned Capital Spending for Fiscal Years 1997, 1998, and 1999, December 1998
No. 87 Foreign Exchange Rate Fluctuations and Changes in the Input-Output Structure, November 1998
No. 86 Structural Changes in Unemployment of Japan: An Approach from Labor Flow, November 1998
No. 85 Recent Trends in the Japanese Economy: Characteristics of the Current Recession, August 1998
No. 84 R&D Stock and Trade Structure in Japan, August 1998
No. 83 Survey on Planned Capital Spending for Fiscal Years 1997 and 1998, August 1998
No. 82 The Significance, Potential, and Problems of DNA Analysis Research: Establishing Public Acceptance is Essential, May 1998
No. 81 The Japan Development Bank Reports on Capital Spending: Survey for Fiscal Years 1996, 1997 and 1998 Conducted in August 1997, March 1998
No. 80 Recent Trends in the Japanese Economy: Growth Base of the Japanese Economy, January 1998
No. 79 Information Appliances: The Strength of Japanese Companies and Tasks for the Future, January 1998
No. 78 Challenges and Outlook for the Japanese Machinery Industries: Impact of ISO14000 Series and Environmental Cost, January 1998

No. 77 Current Conditions and Issues of Computerization in the Health Care Industry: For the Con-struction of a Health Care Information Network, January 1998
No. 76 Household Consumption and Saving in Japan, December 1997
No. 75 The Direction of Japanese Distribution System Reforms: Strengthening the Infrastructure to Support Diverse Consumer Choices, November 1997
No. 74 Foreign Direct Investments by Japanese Manufacturing Industries and Their Effects on Interna-tional Trade, October 1997
No. 73 The Impact of the Changing Trade Structure on the Japanese Economy: With Special Focus on the Effects on Productivity and Employment, October 1997
No. 72 An Analysis of Foreign Direct Investment and Foreign Affiliates in Japan, August 1997
No. 71 Recent Trends in the Japanese Economy: Stock Replacement and New Demand as Aspects of Economic Recovery, August 1997
No. 70 Corporate Fundraising: An International Comparison, June 1997
No. 69 The Japan Development Bank Reports on Capital Spending: Survey for Fiscal Years 1996 and 1997 Conducted in February 1997, May 1997
No. 68 The Japan Development Bank Reports on Capital Spending: Survey for Fiscal Years 1996 and 1997 Conducted in August 1996, August 1997
No. 67 An International Comparison of Corporate Investment Behavior: Empirical Analysis Using Firm Data from Japan, France and the US, April 1997
No. 66 Housing in the National Capital: Analysis of the Market for Housing using Micro Data, March 1997
No. 65 The Environment for Locating Business Operations in Major East Asian Cities, January 1997
No. 64 Direction of Reconstruction of Business Strategy in the Chemical Industry, January 1997
No. 63 Reflection on Discussions Concerning Regulation of the Electric Power Industry: Deregulation of the Electric Power Industry in Japan and Implication of Experiences in the United States, Dcember 1996
e-
No. 62 Current Status and Future Perspective of the Japanese Semiconductor Industry, November 1996
No. 61 A Breakthrough for the Japanese Software Industry?: Responsiveness to Users’ Needs is the key, October 1996
No. 60 Recent Trends in the Japanese Economy Focusing on the Characteristics and Sustainability of the Current Economic Recovery, September 1996
No. 59 Analysis of the Primary Causes and Economic Effects of Information: Related investment in the United States and Trends in Japan, August 1996
No. 58 Selected Summaries of Research Reports: Published in FY1995, June 1996
No. 57 The Japan Development Bank Reports on Capital Spending: Survey for Fiscal Years 1995 and 1996 Conducted in February 1996, May 1996
No. 56 Recent Trends in the Japanese Economy, May 1996
No. 55 Issues Concerning the Competitiveness of the Japanese Steel Industry, February 1996
No. 54 Changes in the Financial Environment and the Real Economy, January 1996
No. 53 The Japan Development Bank Reports on Capital Spending: Survey for Fiscal Years 1994, 1995 and 1996 Conducted in August 1995, October 1995
No. 52 Current Economic Trends: Focusing on the Appreciation of the Yen and its Effects, October 1995

No. 51 Problems Concerning the International Competitiveness of the Petrochemical Industry, October 1995
No. 50 An Economic Approach to International Competitiveness, October 1995
No. 49 Selected Summaries of Research Reports Published in FY1994, July 1995
No. 48 Strategies for Improving the Efficiency of the Japanese Physical Distribution System: Part 2, July 1995
No. 47 Issues on International Competitive Strength of the Auto Industry, June 1995
No. 46 Problems Concerning the International Competitiveness of the Electronics and Electric Machin-ery Industry, June 1995
No. 45 The Japan Development Bank Reports on Capital Spending: Survey for Fiscal Years 1994 and 1995 Conducted in March 1995, June 1995
No. 44 Strategies for Improving the Efficiency of the Japanese Physical Distribution System, March 1995
No. 43 Capital Spending Recovery Scenario Cycle and Structure, August 1994
No. 42 Progress of International Joint Development between Industrialized Countries on the Private Level, May 1994
No. 41 The Japan Development Bank Reports on Capital Spending: Survey for Fiscal Years 1993, 1994 and 1995 Conducted in August 1994 , November 1994
No. 40 Selected Summaries of Research Reports Published in FY1993, June 1994
No. 39 Recent Trends in Japan’s Foreign Accounts, April 1994
No. 38 The Japan Development Bank Reports on Capital Spending: Survey for Fiscal Years 1993 and 1994 Conducted in March 1994, April 1994
No. 37 Economic Zones and East Asia Prospect for Economic Activity Oriented Market Integration, December 1993
No. 36 Japanese Corporate Responses to Global Environmental Issues, December 1993
No. 35 The Japan Development Bank Reports on Capital Spending: Survey for Fiscal Years 1992, 1993 and 1994 Conducted in August 1993, September 1993
No. 34 Structure of Profit to Capital in the Manufacturing Industry, September 1993
No. 33 Comparison of the Japanese and The U.S. Labor Markets, October 1992
No. 32 The Relative Competitiveness of U.S., German, and Japanese Manufacturing, March 1993
No. 31 The Japan Development Bank Reports on Capital Spending: Survey for Fiscal Years 1992 and 1993 Conducted in March 1993, April 1993
No. 30 The Japan Development Bank Reports on Capital Spending: Survey for Fiscal Years 1991, 1992 and 1993 Conducted in August 1992, December 1992
No. 29 Flow of Funds in the 80s and Future Corporate Finance in Japan, November 1992
No. 28 The Japan Development Bank Reports on Capital Spending: Survey for Fiscal Years 1991 and 1992 Conducted in February 1992, April 1992
No. 27 An Analysis of Foreign Direct Investment in Japan, March 1992
No. 26 Projection of Japan's Trade Surplus in 1995: Analysis of Japan's Trade Structure in the 80s, February 1992
No. 25 Intra-Industry Trade and Dynamic Development of The World Economy, November 1991
No. 24 The Japan Development Bank Reports on Capital Spending: Survey for Fiscal Years 1990, 1991 and 1992 Conducted in August 1991, September 1991

No. 23 The Japan Development Bank Reports on Capital Spending: Survey for Fiscal Years 1990 and 1991 Conducted in February 1991, March 1991
No. 22 Trends of the Petrochemical Industry and its Marketplace in East Asia, March 1991
No. 21 The Japan Development Bank Reports on Capital Spending: Survey for Fiscal Years 1989, 1990 and 1991 Conducted in August 1990, September 1990
No. 20 Deepening Economic Linkages in The Pacific Basin Region: Trade, Foreign Direct Investment and Technology, September 1990
No. 19 The Japan Development Bank Reports on Capital Spending: Survey for Fiscal Years 1989 and 1990 Conducted in February 1990, March 1990
No. 18 Petrochemicals In Japan, The US, and Korea an Assessment of Economic Efficiency, February 1990
No. 17 The Japan Development Bank Reports on Capital Spending: Survey for Fiscal Years 1988, 1989 and 1990 Conducted in August 1989, October 1989
No. 16 Impact of the EC Unification on Japan’s Automobile and Electronics Industries, August 1989
No. 15 Industrial and Trade Structures and the International Competitiveness of Asia’s Newly Inalizing Economies, August 1989
dustri-
No. 14 The Japan Development Bank Reports on Capital Investment Spending: Survey for Fiscal Years 1988 and 1989 Conducted in February 1989, March 1989
No. 13 The Japan Development Bank Reports on Capital Spending: Survey for Fiscal Years 1987, 1988 and 1989 Conducted in August 1988, September 1988
No. 12 Growing Foreign Investors’ Activities and the Future of Internationalization, September 1988
No. 11 Futures Tasks and Prospects for the Japanese Machine-Tool Industry, July 1988
No. 10 International Division of Labor in the Machine Industries Among Japan, Asia’s NICs and ASEAN Countries, June 1988
No. 9 Trends of the Petrochemical Industry and its Marketplace in East Asia around Japan, May 1988
No. 8 The International Competitiveness of Japan and U.S. in High Technology Industries, April 1988
No. 7 The Japan Development Bank Reports on Private Fixed Investment in Japan, March 1988
No. 6 Economic Projections of the Japan’s Economy to the Year 2000, February 1988
No. 5 The Japan Development Bank Reports on Private Fixed Investment in Japan, September 1987
No. 4 Current Trends in the Japanese Auto Parts Industry in Overseas Production, July 1987
No. 3 Current Moves for Foreign Direct Investment into Japan, May 1987
No. 2 Overseas Direct Investments by Japanese Corporations, May 1987
No. 1 Current U.S. Consumption Trends, May 1987