development and validation of a teacher success questionnaire using … · · 2018-04-04and...
TRANSCRIPT

International Journal of Instruction April 2018 ● Vol.11, No.2
e-ISSN: 1308-1470 ● www.e-iji.net p-ISSN: 1694-609X pp. 129-144
Citation: Tabatabaee-Yazdi, M., Motallebzadeh, K., Ashraf, H., & Baghaei, P. (2018). Development
and Validation of a Teacher Success Questionnaire Using the Rasch Model. International Journal of
Instruction, 11(2), 129-144. https://doi.org/10.12973/iji.2018.11210a
Received: 04/08/2017 Revision: 08/11/2017 Accepted: 13/11/2017
Development and Validation of a Teacher Success Questionnaire Using the
Rasch Model
Mona Tabatabaee-Yazdi
Department of English, Islamic Azad University, Torbat-e-Heydarieh Branch, Iran,
Khalil Motallebzadeh
Department of English, Islamic Azad University, Torbat-e-Heydarieh Branch, Iran,
[email protected]; [email protected]
Hamid Ashraf
Department of English, Islamic Azad University, Torbat-e-Heydarieh Branch, Iran,
[email protected]; [email protected]
Purya Baghaei
Department of English, Islamic Azad University, Mashhad Branch, Iran,
[email protected]; [email protected]
An increased enthusiasm on teacher accountability, in recent times, has led policy makers and teachers to a significant care over evaluating teachers’ success. To this aim, a 40-item Teacher Success questionnaire was developed and validated by the application of the Rasch model. The Rasch model is used to decide whether the scores of an instrument are meaningful, significant, and purposive. The test was developed in Persian to be used for Iranian teachers. The Rasch rating scale model for polytomous data was used to examine the psychometric qualities of the scale in terms of dimensionality, use of response category, sample appropriateness, and reliability. The test was administrated to 828 Iranian EFL students. The results revealed that the Rasch model fits the test after deleting 8 items from the scale. Moreover, it is confirmed that the scale enjoyed suitable reliability. This proposes that the questionnaire is potentially valid and can be used as a measure of teachers’ success in the Persian language settings.
Keywords: teachers’ success, validity, Rasch Model, scale adaption, teache
INTRODUCTION
Nowadays, in most institutions and language schools, language teachers are expected to regularly review and assess their teaching knowledge according to the changing needs of
130 Development and Validation of a Teacher Success …
International Journal of Instruction, April 2018 ● Vol.11, No.2
the schools. Besides, throughout these recent eras, evaluating teachers’ success has become a crucial issue due to the increased motivation on teacher accountability (Kane & Cantrell, 2010) and variability in the quality of teaching (Duta & Rafaila, 2014). Consequently, researchers constantly look for more reliable measures of teachers’ success.
Teachers’ success is defined as whatever leads a teacher to move toward accomplishment (Malik Omar, 2016; Seyf, 2008). A number of studies have pointed to the need to create criteria for the content of language teacher education with the aim of developing new possibilities and successful teacher (Guntermann, 1993), which has always been of much concern among educators, teachers, and trainers. However, what type of data measures the teachers’ success in one classroom versus that of another?
The majority of teachers, in the area of teacher education, define their perception of success in terms of their learners' behaviors and performance, (Harootunian & Yargar, 1980; Fullan, 1999; Fullan & Hargreaves, 1996). To them becoming a successful teacher means improving learner learning outcomes. Therefore, practices and activities that seem to be useful in helping learners get desired learning outcomes, might be the key to their success. Moreover, beliefs about success are also reported to be in accordance with teachers’ classroom experience and the way they use new instructional strategies (Harootunian & Yargar, 1980). Accordingly, Glickman (2007), referred to “involvement in planning, implementing, and evaluating programs “as one of the common characteristics of successful professional development programs which leads to teacher and learners’ success. The success of teachers highly depends on teachers’ ability to improve both basic knowledge and advanced thinking and problem solving among their students, and such efficient practices entail teachers to have a profound understanding of the content they teach (Loucks-Horsley, Hewson, Love, & Stile, 1998). Moreover, teachers need to learn how to personalize instruction, generate and apply significant learning resources, and offer success-based tasks (Conley, 1992).
According to Seyf (2008) being a successful and an effective teacher requires having the ability to keep students interested in learning, managing the class, helping the students and having the necessary knowledge on manipulating the appropriate teaching methodologies. He also states that a good teacher must be able to promote the feeling of success and enjoy among students. Regarding characteristics of a successful teacher, Shoari Nejhad (1996) adds that there are qualities such as security, admiration, self-assurance, trustworthiness, authenticity, sympathy, understanding, resourcefulness, and cleverness. Akrofy (1982) believes that accepting the criticisms from students' side, talking about one's feelings to students and having pleasant relationship with both students and their parents, along with having control over the content of material being taught are all other characteristics of a successful teacher. Furthermore, Cohen, McCabe, Michelli, and Pickeral (2009) reported that "positive school climate is associated with and predictive of academic achievement, and teacher success”.
Markley (2004, cited in Ghasemi & Hashemi, 2011) noted the important role of English language teachers in their academic success and learners' learning that highly depends on teachers and their methodologies in their classes. It is stated that, teachers'

Tabatabaee-Yazdi, Motallebzadeh, Ashraf, Baghaei 131
International Journal of Instruction, April 2018 ● Vol.11, No.2
methodologies and their actions in the class and the way they recognize and arrange instruction extremely depend on teachers' ideologies of effective teaching and their ideas about teacher success (Ghaith & Shaaban, 1999; Chacón, 2005). Similarly, in the case of teaching in private language institutes, teachers who feel more successful in their job are more likely to handle different source of stresses (e.g., job insecurity, work overload, student’ slow motivation).
In addition, numerous studies point out that students emphasize on teachers’ rapport, enthusiasm and sociability as features that can differentiate successful teachers from unsuccessful ones (Basow, 2000; Basow & Silberg, 1987; Best & Addison, 2000; Bousfield, 1940; Cravens, 1996; Feldman, 1986; Guerrero & Miller, 1998; Marsh & Roche, 1997; Radmacher & Martin, 2001).
Owen and Skinner (2004) stated that professional development (PD) programs, which are defined as activities and programs offered to teachers in order to develop their knowledge, and skills are critical for maintaining the knowledge, skills, and attitudes to be a successful teacher. Collaboration can be considered as one of the important programs in the area of PD which highly influence on teachers’ success. This means that teachers should be provided with the knowledge and skills to collaborate. Professional learning must be aimed at improving the quality of collaborative work since some of the most important forms of professional learning occur in group settings (Tanghe & Pask, 2016; Dooly & Sadler, 2013).
Moreover, Marinescu, et al. (2017) made an interesting example of teachers’ characteristics and responsibilities in postmodern eras. She considered a school short trip or camp and discussed different probable responsibilities of a teacher which clearly highlights this fact that a teacher, to be successful, has to play a role of teacher, parent, doctor, counselor and most importantly, a true friend of the student. She stated that:
“teacher performs multiple roles: designed to support students: submit the significance of various visited tourist attractions, supports students in passing a certain path, or to choose adequate clothing or food, plan events and organize their program, first aid in case of medical emergencies, consulting pupils in difficulty, managing conflict situations etc.” (Marinescu, et al., 2017)
As a result, since teachers have a key role in our society and the success of learners' future highly depends on teachers' success and developing a domain-specific teachers’ success scales is of utmost important because teachers feeling of success in their teaching practices values their future performances as well, the researchers in this study aimed to develop and validate a 40- item Teachers’ Success questionnaire by the application of the Rasch model using Winsteps 3.73.
Rasch model, which is named after the Danish mathematician and statistician Georg Rasch, is a prescriptive probabilistic mathematical concept. It is known for its two incredible properties of invariance and interval scaling, which are achieved when the basic assumption of unidimensionality underlying the model is met, i.e. when the data fit the model.

132 Development and Validation of a Teacher Success …
International Journal of Instruction, April 2018 ● Vol.11, No.2
METHOD
Measures1
A 40-item questionnaire which consisted of different items for evaluating teachers' success was used to investigate students' perspectives on a successful teacher. The questionnaire was developed according to the underlying theories, research, and available literature (Bhardwaj, 2009; Malik Omar, 2016; Richard, 1998). Factor analysis was used to classify each construct’s items.
Generally, items were classified into seven different constructs, namely 1. ELT competencies (including 6 items such as “the teacher communicates the subject matter clearly in front of the students”), 2. Teachers’ Delivery of instruction/Goals and Accountability (consists of 11 items such as” The teacher selects proper teaching aids beforehand”), 3. Interpersonal relationships with Students and Colleagues (includes 3 items such as “The teacher creates a positive environment for student learning and involvement”), 4. Examination/ Evaluation (includes 5 items such as “The teacher uses the scores as one of the major sources to check students’ understanding”), 5. Class attendance, Management and Commitment (consists of 4 items such as “She/he always tries to be punctual”), 6. Attitude, Motivation, and Confidence (consists of 8 items such as “She/he controls the class confidently and has enough self-confidence and autonomy”), 7. Teacher’s Self-awareness (consists of 3 items such as “The teacher has complete knowledge of individual differences”).
Each item of the questionnaire was rated on a five-point Likert scale from (Never) to (Always). It took about 5 minutes to be completed. Table 1 showed the Cronbach’s α internal consistency reliability coefficient of the scales.
Table 1 Internal Reliability of the Scales, Cronbach Alpha coefficients (α)
Scales Subscale Items Cronbach’s α
Teachers’ success
ELT competencies 1-2-3-4-5-6 0.80
Teachers’ Delivery of instruction/Goals and Accountability
7-8-9-10-11-12-13-14-15-16-17
0.88
Interpersonal relationships with Students and Colleagues
18-19-20 0.78
Examination/ Evaluation 21-22-23-24-25 0.80
Class attendance, Management and
Commitment
26-27-28-29 0.89
Attitude, Motivation, and Confidence 30-31-32-33-34-35-36-37
0.91
Teacher’s Self-awareness 38-39-40 0.80
1 The teacher success questionnaire validated in this study is available from the author on email
request.

Tabatabaee-Yazdi, Motallebzadeh, Ashraf, Baghaei 133
International Journal of Instruction, April 2018 ● Vol.11, No.2
Participants
A total number of 828 Iranian students studied English in different language institutions of Iran participated in this study to provide us with their perspectives on their teachers’ success. They were 375 males (45%) and 453 females (55%) and from different age groups ranged below 20 to above 40, the mean age was 19 (SD= 0.9). (Table 2)
Participants’ native language was Persian with English as a foreign language. The research was approved by the ethics committees of the language schools.
At the time of the administration of the survey, participants were told that their participation was voluntary, and they were reminded not to put their name or any identifying information on the survey, and that all data would remain anonymous and confidential. About 90 percent of the survey was done in a paper-based format (and less than 10 percent through Google Drive) because generally, a 30 percent response rate for Web-based surveys is expected (Saunders, Lewis & Thornhill, 1997).
Table 2 Demographic profile of respondents
Category Frequency Percentage
Gender Male Female
375 453
45 55
Age -20 21-30 31-40 +40
412 363 50 3
50 44 4 2
Educational status
Under Diploma Diploma A.A. B.A. M.A. PhD
125 379 218 93 10 3
15 46 26.6 11 1 0.4
Proficiency Average Good Very Good
226 337 181
27 41 22
Excellent 84 10
FINDINGS
The data were analyzed using Winsteps Rasch software version 3.73 (Linacre, 2009) to confirm the construct validity of the “teachers’ success” questionnaire. In the area of research and social sciences, the Rasch model (Rasch 1960/1980) has been used widely for analyzing questionnaires and construct validity (Baghaei, 2008). A test is said to be valid when the data fitted the model, which indicates that a construct is underlying the covariance among the items and causes the item responses (Baghaei & Tabatabaee Yazi, 2016; Borsboom, 2008). Therefore, the data consisting of 40 items and 828 participants were subjected to the Rasch analysis to estimate the fit of data to the model. Item response theory (IRT) models and Rasch models require observing for two assumptions of local independence and unidimensionality (Baghaei, 2009).

134 Development and Validation of a Teacher Success …
International Journal of Instruction, April 2018 ● Vol.11, No.2
Unidimensionality means that the items of a test are expected to share a single dimension that the test is proposed to measure. This single dimension is expected to overcome the other dimensions measured by the items. And these “other dimensions” are supposed to not be shared by many items of the test and behave like random noise (Linacre, 2009b).
Local independence also explains unidimensionality more specifically. It suggests that the correlation between the test’ items should be caused by the single dominant dimension which effects on answering the test. After removing this effect, the correlation should decrease to zero (Baghaei, 2010; Linacre, 2009b).
Individual Item Characteristics
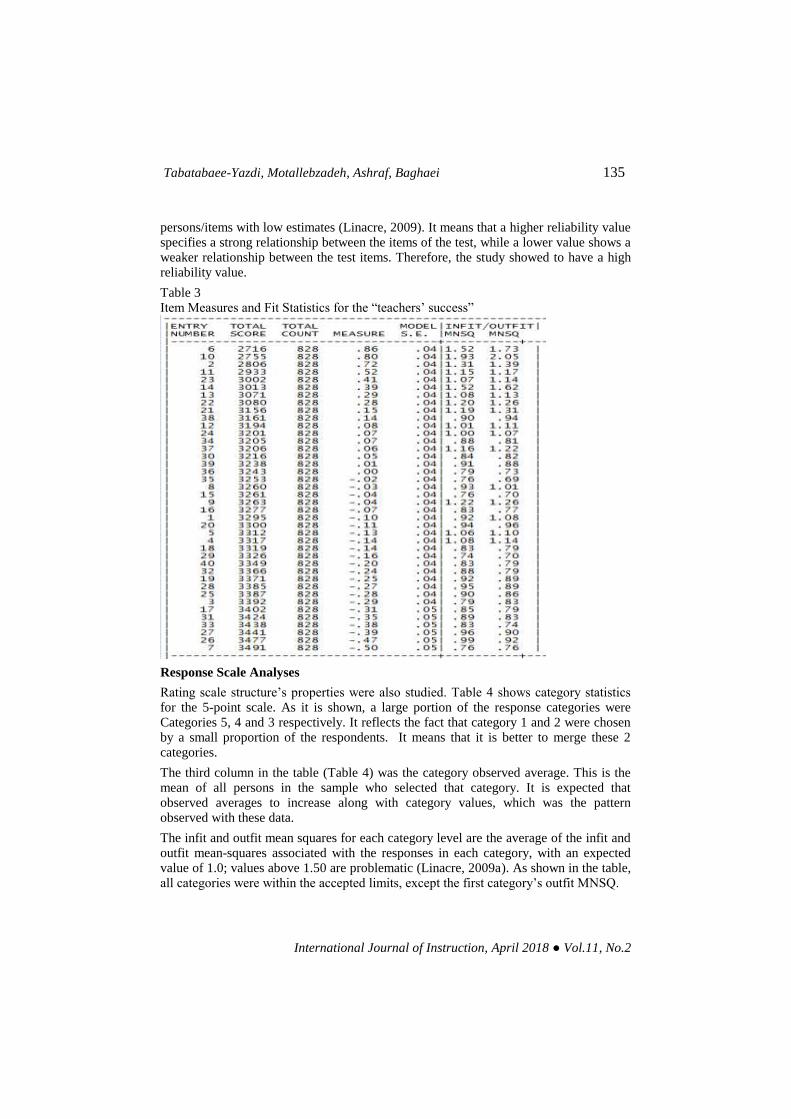
As the first step in the Rasch analysis, the fit indices were studied closely. (Table 3)
The column labeled as "MEASURE" shows the difficulty estimates for the items. "MODEL S. E.", shows the standard error of the item difficulty measures. Mean square "MNSQ" is provided for "OUTFIT" and "INFIT" columns. Outfit and infit mean-square values in the range of 0.60 to 1.40 (Linacre, 1999; Wright & Linacre, 1994) are considered productive for measurement in rating scales.
Following the criteria recommended by Bond and Fox (2007) the results indicated that all items fit the Rasch model, except eight Items (Items 2, 6, 9, 10, 12, 14, 20 and 32) which have outfit and infit mean square (MNSQ) indices outside the acceptable range of 0.60-1.40. Misfitting items are signs of multidimensionality and model deviance.
Values larger than 1.4 designate unusual response patterns that mislead the measurement and are instances of construct-irrelevant variance (Baghaei, 2008); values smaller than 0.60 specify deterministic response patterns, and are benign. They show redundancy of information; they do not mislead measurement but can lead to false high reliabilities.
Table 3 shows the fit indices for the items. The items are set from difficult to easy. As it is shown the easiest item is item 7 and the most difficult item is item 6. It means that the difficulty of item 6 (the most difficult item) is estimated to be 0.86 logits with the standard error (SE) of 0.04, which means one can be 95% sure that the true value for the difficulty of this item lies somewhere between 0.78 to 0.94 logits, i.e., two SE's below and above the observed measure.
As Table 3, Infit and Outfit MNSQ columns, signify items 2, 6, 10 and 14 are not within the acceptable range of 0.60 to 1.40, moreover, Outfit ZSTD show items 9, 12, 20 and 32 as misfit items, so these items should be either deleted or modified because of lack of fit to the model.
The analyses of the items yielded an item difficulty range of -0.50 to 0.86 logits with a separation reliability of .98. Person estimates ranged from - 6.23 to 6.23, with a separation reliability of .91.
In Rasch analysis, the person separation index is used instead of reliability indices. Separation reliability indicates how well the person parameters are discriminated on the measured variable. A high separation reliability index shows that there is a strong possibility that persons with high ability estimates have higher ability estimates than
Tabatabaee-Yazdi, Motallebzadeh, Ashraf, Baghaei 135
International Journal of Instruction, April 2018 ● Vol.11, No.2
persons/items with low estimates (Linacre, 2009). It means that a higher reliability value specifies a strong relationship between the items of the test, while a lower value shows a weaker relationship between the test items. Therefore, the study showed to have a high reliability value.
Table 3 Item Measures and Fit Statistics for the “teachers’ success”
Response Scale Analyses
Rating scale structure’s properties were also studied. Table 4 shows category statistics for the 5-point scale. As it is shown, a large portion of the response categories were Categories 5, 4 and 3 respectively. It reflects the fact that category 1 and 2 were chosen by a small proportion of the respondents. It means that it is better to merge these 2 categories.
The third column in the table (Table 4) was the category observed average. This is the mean of all persons in the sample who selected that category. It is expected that observed averages to increase along with category values, which was the pattern observed with these data.
The infit and outfit mean squares for each category level are the average of the infit and outfit mean-squares associated with the responses in each category, with an expected value of 1.0; values above 1.50 are problematic (Linacre, 2009a). As shown in the table, all categories were within the accepted limits, except the first category’s outfit MNSQ.

136 Development and Validation of a Teacher Success …
International Journal of Instruction, April 2018 ● Vol.11, No.2
Lastly, the thresholds column illustrated the points on the rating scale where the probability of being observed in either of two adjacent categories is equal. The first category has no earlier category; therefore there is no measure for the first category. It is assumed by the rating scale model that step difficulties do not differ across the items and thresholds for all the items should be as one set of the category. In evaluating rating scales, the order of the thresholds for items should be studied. It is expected that threshold estimates increase with category values. Disordered thresholds show that the category is not defined clearly for respondents (Linacre, 1999). It means that respondents cannot clearly differentiate the options (Bond & Fox, 2007). To solve this problem, it is recommended to reduce the number of response options by eliminating the neighbouring categories (Bond & Fox, 2007; Linacre, 1999). The threshold estimates of the “teachers success” was shown to be in order (-1.29, -0.41, 0.42, 1.27).
Table 4 Category Statistics
Category Count (%) Observed average Infit MNSQ Outfit MNSQ Threshold
1 Never 1272 (4) -0.19 1.49 1.75 None
2 Rarely 3130 (9) -0.09 0.94 0.98 -1.29
3 Usually 6218 (19)
0.47 0.86 0.85 -0.41
4 Often 9384 (28)
1.13 0.87 0.82 0.42
5 Always 13116 (40)
1.99 1.02 1.01 1.27
Figure 1 represents a graphic representation of the probability curves for each response category. Each category should consist a peak on the curve, shows that each category is most likely for respondents falling on certain sections of the trait continuum, which means that each category characterizes a single section of the measured construct. “The plot should look like a range of hills. Categories which never emerge as peaks correspond to disordered Rasch-Andrich thresholds. These contradict the usual interpretation of categories as being a sequence of most likely outcomes” (Linacre, 2009, p. 304).
Figure 1 Category Probabilities curve for Teachers’ success.

Tabatabaee-Yazdi, Motallebzadeh, Ashraf, Baghaei 137
International Journal of Instruction, April 2018 ● Vol.11, No.2
In this study, as it is illustrated by Figure 1, all the categories consisted a peak on the curve, showing a range of hills, therefore, each category symbolizes a single unit of the measured construct.
Figure 2 represents the Item-person map of the data (a section of the map is shown because of its long length). Numbers on the right indicate items and # on the left signify persons. Items and persons located on top of the scale are more difficult and more proficient, respectively. On the other hand, items down the scale are easier and less proficient. The map shows that the item categories cover an operational range wider than the overall item estimates in Table 3. The lowest threshold is – 2.45 logits (item 7) and the highest is 2.65 logits (item 11), which show a range of 5.10 logits covering a wide-ranging of the trait continuum, that is, the questionnaire covers a wide range of ability. It means that the component of teachers ‘success are proven to be appropriate indicators for teachers’ success.
Figure 2 Items-person map

138 Development and Validation of a Teacher Success …
International Journal of Instruction, April 2018 ● Vol.11, No.2
Examination of Unidimensionality
To check the unidimensionality of the scale, global fit statistics were studied by examining patterns in the residuals. The smaller the residuals, the better the data have a tendency to fit the model. Residuals are not explained by the model, thus it is expected that they are randomly distributed and not correlated (Linacre, 2009a). By subjecting residuals to principal components analysis (PCA), which is a method of overall fit and unidimensionality (Baghaei & Cassady, 2014; Linacre, 2009), it is expected that the residuals are not interrelated and no factor can be taken out from them. It is important to note that PCA is performed on the standardized residuals and not the original data. That is, the target dimension—or latent trait—has already been removed when PCA is applied (Linacre, 2009a). Any factor extracted from the residuals is not an original target dimension, or latent trait because PCA is not performed on the original data, but the standardized residuals.
The data fit the Rasch model if the latent trait describes all information in the data and the residuals characterize random noise. Therefore, residuals will be distributed independently of each other, as a result, residuals’ matrix of correlations would be 0 (Smith, 2002). On the other hand, if a factor is extracted from the residuals, the test is shown to be not unidimensional (Baghaei & Cassady, 2014).
To decide whether the factor extracted from the residuals is ignorable or not, the size of its eigenvalue should be considered. The size of the eigenvalue in the first factor is a degree of unidimensionality or overall fit of data to the Rasch model (Smith, 2002). However, as Linacre (2009a) stated eigenvalues above 2 propose that the dimension extracted from the residuals is a secondary dimension that threatens the unidimensionality of the scale.
PCA of the standardized residuals (Table 5) showed that the Rasch dimension (the proposed dimension) is as big as 32.5 items which explains 44.8% of the variance; 22.7% are explained by item measures and 22.1% are explained by person measures. In all, 52.2% of the variance remains unexplained.
Unidimensionality of the data can be examined through the row “unexplained variance in the 1
st contrast” in Table 5. Raiche (2005) has suggested that secondary dimensions
which have the strength of at least two items (eigenvalue=2) are the sign of concern, therefore, the eigenvalue of 2.8 for the first contrast in the present study shows that the test is possibly multidimensional.
Table 5 Dimensionality output
Empirical -- Modeled
Total raw variance in observations 72.5 100.0 % 100.0 %
Raw variance explained by measures 32.5 44.8 % 45.7 %
Raw variance explained by persons 16.0 22.1 % 22.5 %
Raw Variance explained by items 16.5 22.7 % 23.2 %
Raw unexplained variance (total) 40.0 55.2 % 100.0 % 54.3 %
Unexplained variance in 1st contrast 2.8 4.4 % 8.1 %

Tabatabaee-Yazdi, Motallebzadeh, Ashraf, Baghaei 139
International Journal of Instruction, April 2018 ● Vol.11, No.2
Follow-up Analysis
In a follow-up analysis, Items 2, 6, 9, 10, 12, 14, 20 and 32 were deleted, and the first 2 categories in response scale (never and rarely) were merged to one category, then the scale was reanalyzed. The result showed that the 32 remaining items had the acceptable outfit and infit mean-square fit. PCA of standardized residuals, after deleting the eight items, showed that measures explain 45.5 % of the variance and the size of the eigenvalue in the first factor reduced to 1.9, which indicates unidimensionality.
Threshold estimates after deleting the eight items and combining the first 2 response scales (never and rarely) were -0.88, 0.05, and 0.93, and the infit and outfit mean squares for each category level were within accepted limits.
DISCUSSION
Since teachers’ success and their teaching abilities have an important role in their career and their students’ future success, the present study aimed to validate a Persian “teachers’ success” questionnaire using the Rasch rating scale model (Andrich, 1978).
The analyses were addressed the identification of evidence for a unidimensional structure for the questionnaire, and confirmation of the efficacy of a 5-point response scale.
Findings of the study and examination of item characteristics and response scale quality confirmed that the Rasch model fits the “teachers’ success” questionnaire after deleting eight items from the original 40-item Persian questionnaire, which confirms the internal validity of the test.
An explanation for the misfit of the items could be negative wording of the items, such as item 14 which was negatively worded, and the complex structure of the items such as item 6 and 12. The other reason might be that the entire scale with 40 items is multidimensional and, therefore, a multidimensional Rasch model should be used to analyze the different subscales of the instrument (Baghaei, 2012; Baghaei, 2013).
Examining rating scale statistics, also showed that mixing the first two scales of the questionnaire makes the scale more effective than the 5-point scale, as by merging them, the category intervals became wider which means a better distinction among categories. Besides, the person-item map (Figure 2) demonstrates a wide range of the trait continuum.
The thirty-two teachers’ success questionnaire had an acceptable person separation reliability of .91 and item separation reliability of .98. Moreover, threshold estimates after deleting the eight items and merging the first two response scales (never and rarely) were shown to be within accepted range.
Moreover, studying the hierarchy of item difficulties provides important information regarding the subscales of the questionnaire and more specifically about teachers’ success.
Items that are easily endorsed and received higher scores showed indicators with a greater importance to respondents about “teachers’ success” and highlighted qualities that teachers succeeded in them more than other indicators. Whereas, those that received
140 Development and Validation of a Teacher Success …
International Journal of Instruction, April 2018 ● Vol.11, No.2
lower scores demonstrated indicators that were less prominent for respondents, or were not fully observed by respondents about their teachers.
In view of that, the person-item evaluation showed that items 7, 27, and 33 were the items most likely to be endorsed (i.e., “My teacher has full mastery over the subject she/he is teaching.”, “She/he always tries to be punctual.” and “She/he is respectful in students’ point of view.”). Alternatively, the least likely to be endorsed items and so those that required being cared more by the teachers were Items 11, 23, 13 and 22 (i.e., “Students receive frequent feedback about their performance.”, “The teacher tries to relate language forms, functions and vocabulary to contexts relevant to students’ interest.”, “The teacher reviews with the students the homework they have prepared.”, and “Throughout the course, the teacher uses/develops appropriate quizzes and tests to evaluate students’ progress and increase motivation.”
These finding revealed that “Examination/ Evaluation” is the construct which its indicators less likely to be endorsed. The reason may be behind the fact that, in Iran, all the syllabi, resources and sometimes the evaluation methods are suggested by the Ministry of Education and teachers do not have much choice except working with the prescribed materials. Accordingly, Ahmady et al. (2009) endorse that these curricula usually suffer from great implications for teachers and students because they don’t involve teachers in active empirical learning through reflection, discussion, practical evaluation and action research.
However, “Class attendance, Management, and Commitment” is one of the scale’s constructs which is easily endorsed. This means that teachers are really successful regarding indicators related to their management and commitment, which is in accordance with Zareie, et al. (2016) who reported that class management and settling problem in the class were considered as important factors in teacher’ development, while identifying parents’ and societies’ expectations as well as interacting with them were ranked as the lowest importance.
Generally, the researcher believes that post-method pedagogy in Iran put really heavy responsibilities to teachers without providing them with enough supportive real life contextualized and practical programs. The reason is the fact that teacher education programs in Iran heavily depend on a method based pedagogy following pre-planned syllabi which in turn provide little room for teachers to build their own teaching identity, ideology and ways of teaching.
To sum up, the study’s overall findings confirm that the thirty-two teachers’ success questionnaire is an effective unidimensional representation for evaluating teachers’ success.
LIMITATION AND FUTURE DIRECTIONS
One of the limitations of this study is that the researchers consider only Iranian institutional EFL teachers, thus, other studies could work on teachers working at universities, different cities and different culture to expand on the validation of the questionnaire with a broader examination in order to generalize the findings. Moreover,

Tabatabaee-Yazdi, Motallebzadeh, Ashraf, Baghaei 141
International Journal of Instruction, April 2018 ● Vol.11, No.2
examining the scale using multidimensional Rasch model could be a significant future direction to study different constructs of the scale separately.
REFERENCES
Ahmady, S., Changiz, T., Brommels, M., Gaffney, A. F., & Masiello, I. (2009). The Status of Faculty Development Programmes in Iran after the Medical Education Reform: A Systematic and Comprehensive Approach. International Journal for Academic Development, 14 (2), 99-110.
Akrofy, A. (1982). A living classroom, George Allen &Unwin, London.
Baghaei, P. (2008). The Rasch model as a construct validation tool. Rasch Measurement Transactions, 22, 1145-1146.
Baghaei, P. (2009). Understanding the Rasch model. Mashhad: Mashhad Islamic Azad University Press.
Baghaei, P. (2010). A comparison of three polychotomous Rasch models for super-item analysis. Psychological Test and Assessment Modeling, 52, 313-323.
Baghaei, P. (2012). The application of multidimensional Rasch models in large-scale assessment and validation: An empirical example. Electronic Journal of Research in Educational Psychology, 10, 233–252.
Baghaei, P. (2013). Development and psychometric evaluation of a multidimensional scale of willingness to communicate in a foreign language. European Journal of Psychology of Education, 28, 1087-1103.
Baghaei, P., & Aryadoust, V. (2015). Modeling local item dependence due to common test format with a multidimensional Rasch model. International Journal of Testing, 15, 71–87.
Baghaei, P., & Cassady, J. (2014). Validation of the Persian translation of the Cognitive Test Anxiety Scale. Sage Open, 4, 1-11.
Baghaei, P., Hohensinn, C., & Kubinger, K. D. (2014). The Persian adaptation of the foreign language reading anxiety scale: A psychometric analysis. Psychological Reports, 114, 315–325.
Baghaei, P., & Ravand, H. (2016). Modeling local item dependence in cloze and reading comprehension test items using testlet response theory. Psicológica, 37, 85-104.
Baghaei, P., & Tabatabaee Yazdi, M. (2016). The logic of latent variable analysis as validity evidence in psychological measurement. The Open Psychology Journal. 9, 168-175.
Basow, S. A. (2000). Best and worst professors: Gender patterns in students' choices. Sex Roles, 34, 407-417.

142 Development and Validation of a Teacher Success …
International Journal of Instruction, April 2018 ● Vol.11, No.2
Basow, S. A., & Silberg, N. T. (1987). Student evaluations of college professors: Are female and male professors rated differently? Journal of Educational Psychology, 79, 308314.
Best, J. B., & Addison, W. E. (2000). A preliminary study of perceived warmth of professor and student evaluations. Teaching of Psychology, 27, 60-62.
Bhardwaj, A. (2009). Role of personality factors for teaching effectiveness. Pacific Business Review: A Quarterly Journal of Management, 2, 75-80.
Bond, T. G., & Fox, C. M. (2007). Applying the Rasch model: Fundamental measurement in the human sciences. Mahwah, NJ: Lawrence Erlbaum.
Borsboom, D. (2008). Latent variable theory. Measurement, 6, 25-53.
Bousfield, W. A. (1940). Students' ratings of qualities considered desirable in college professors. School and Society, 51, 253-256.
Chacón, C. T. (2005). Teachers' perceived efficacy among English as a foreign language teachers in middle schools in Venezuela. Teaching and Teacher Education, 21(3), 257–272.
Chacón, C. T. (2005). Teachers' perceived efficacy among English as a foreign language teachers in middle schools in Venezuela. Teaching and Teacher Education, 21(3), 257–272.
Cohen, J., McCabe, L., Michelli, N., & Pickeral, T. (2009). School climate: Research, policy, practice, and teacher education. Teachers College Record, 111(1), 180-213.
Conley, D. (1992a). Five key issues in restructuring. Eugene, OR: ERIC Clearinghouse on Educational Management. ED344329.
Cravens, T. F. (1996, March). Students' perceptions of the characteristics of teaching excellence. Paper presented at the National Social Science Conference, Reno, NV.
Dooly, M., & Sadler, R. (2013). Filling in the gaps: linking theory and practice through telecollaboration in teacher education. ReCALL, 25(1), 4-29.
Feldman, K. A. (1986). The perceived instructional effectiveness of college teachers as related to their personality and attitudinal characteristics: A review and synthesis. Research in Higher Education, 24, 139-213.
Fullan, M. G. (1999). Change Forces: the sequel (Bristol, PA, Falmer Press).
Fullan, M. G., & Hargreaves, A. (1996). What’s Worth Fighting for in Your School (New York, Teachers College Press).
Guerrero, L. K., & Miller, T. (1998). Associations between nonverbal behaviors and initial impressions of instructor competence and course content in videotaped distance education courses. Communication Education, 47(1), 30-42.

Tabatabaee-Yazdi, Motallebzadeh, Ashraf, Baghaei 143
International Journal of Instruction, April 2018 ● Vol.11, No.2
Ghaith, G., & Shaaban, K. (1999). The relationship between perceptions of teaching concerns, teacher efficacy, and selected teacher characteristics. Teaching and Teacher Education 15(5), 487-496.
Ghasemi, B., Hashemi, M. (2011). The study of the characteristics of successful English language teachers from the viewpoint of the English language students of Islamic Azad University, Hamedan Branch. Journal of Social and Behavioral Sciences, 28, 411-415.
Harootunian, B., & Yargar, G. P. (1980). Teachers’ conceptions of their own success. Paper presented at the Annual Meeting of the American Educational Research Association, Boston, MA, April.
Linacre, J. M. (2009a). A user’s guide to WINSTEPS. Chicago, IL: Winsteps.
Linacre, J. M. (2009b). Local independence and residual covariance: A study of Olympic figure skating ratings. Journal of applied measurement, 11, 157-169.
Linacre, J. M. (1999). Investigating rating scale category utility. Journal of Outcome Measurement, 3, 103-122.
Loucks-Horsley, Hewson, Love & Stiles. (1998). Designing professional development for teachers of science and mathematics. Thousand Oaks, CA: Corwin Press
Malik Omar, A. (2016). Characteristic Features of a Successful English Language Teacher (A Students’ Perspective). Retrieve from http://hdl.handle.net/123456789/913
Marinescu, M., Blândul, V. C., Orţan, F., Bradea, A., & Lăzuran, A. L. (2017). Some Characteristics of Teachers’ From Non-Formal Education Perspective. International Journal on Lifelong Education and Leadership, 2(1), 42-46.
Marsh, H. W., & Roche, L. A. (1997). Making students' evaluations of teaching effectiveness effective: The critical issues of validity, bias, and utility. American Psychologist, 52, 1187-1197.
Owen, J., & Skinner, S. (2004). Professional development initiative: Proposal for action. Professional Development Initiative Implementation Work Group: Duke University
Radmacher, S. A., & Martin, D. J. (2001). Identifying significant predictors of student evaluations of faculty through hierarchical regression analysis. Journal of Psychology, 135, 259-268.
Raiche, G. (2005). Critical eigenvalue size in standardized residual Principal Component Analysis. Rasch Measurement Transactions, 19(1), 1012.
Richard, H., "Moral Purposes of Successful Teachers" (1998). Electronic Theses and Dissertations. Paper 2879.http://dc.etsu.edu/etd/2879
Seyf, A. (2008). Educational psychology, Agah publisher, Tehran, Iran.
Shoari Nejhat, A. (1996). Foundation of Education, Roshe publisher, Tehran, Iran.

144 Development and Validation of a Teacher Success …
International Journal of Instruction, April 2018 ● Vol.11, No.2
Smith, E. V., Jr. (2002). Detecting and evaluating the impact of multidimensionality using item fit statistics and principal component analysis of residuals. Journal of Applied Measurement, 3, 205-231.
Tanghe, Sh., & Park G. (2016). “Build[ing] something which alone we could not have done”: International collaborative teaching and learning in language teacher education. System 57, 1-13.
Wright, B. D., & Linacre, J. M. (1994). Reasonable mean-square fit values. Rasch Measurement Transactions, 8, 370.
Zareie, M. H., Nasr, M. R., Mirshahjafari, E., & Liaghatdar, M. J. (2016). Elaborating the purpose and content of professional development plan for preschool teachers. Educational Research and Review. 11(16), 1463-1472.