validation of an enhanced questionnaire designed to assess · pdf file ·...
TRANSCRIPT
Validation of an Enhanced Questionnaire Designed to Assess Stress and Social Support in Patients with Chronic
Periodontitis
By
Jill Levine
M.Sc Candidate
A thesis submitted in conformity with the requirements for the degree of Masters of Science
Graduate Department of Periodontology Faculty of Dentistry
University of Toronto
© Copyright by Jill Levine (2009)

ii
ABSTRACT Validation of an Enhanced Questionnaire Designed to Assess Stress and Social Support in Patients with Chronic Periodontitis Jill Levine Masters of Science, March 2009. Department of Periodontics, Faculty of Dentistry – University of Toronto Background: In this study, we enhanced a diagnostic questionnaire which had been previously developed to measure stress and social support. Methods: 101 patients with chronic periodontitis and 50 healthy control subjects completed our questionnaire package after which we analyzed the data for trends and associations. Results: Our enhanced questionnaire provided a valid and reliable measure of stress and social support in patients with chronic periodontitis. Conclusion: Our enhanced questionnaire provided both a valid and a reliable measure of stress and social support in patients with chronic periodontitis however requires further refinement to predict periodontal disease experience and severity.

iii
Acknowledgements This thesis would not have been possible without the support of and efforts of many
people. I first would like to thank my supervisor, Dr. Michael Glogauer, for his insight
and guidance. As well, I would like to thank my committee members Dr. Michael
Goldberg, Dr. David Locker, and Dr. Cameron Norman for all of their help and advice.
Thank you to Eshetu Atenafu and Dr. Herenia Lawrence for all of their help with the
statistics and to Dr. Howard Tenenbaum who went out of his way to help me with the
organization of the paper.
Thank you to my parents for their support and for all of their help with babysitting
Sephora so that I could work on my thesis.
Finally, thank you to my husband David Stastny for not only his help with the layout and
the figures for this paper, but also for all of his love, support, and encouragement. This
thesis is dedicated to him and to our daughter Sephora, who made this process a lot more
difficult, but at the same time, a lot more fun!

iv
TABLE OF CONTENTS Abstract …………………………………………………………………………….…..ii Acknowledgements ……………………………………………………………………iii List of Tables ……………………..………………………………………………....…vi List of Figures……………………………………………………………………….....vii Abbreviations ………………………………………………………………………….viii Introduction and Statement of the Problem …………………………………………..1 Review of the Literature ……………………………………………………………..…2
I) Etiology of Chronic Periodontitis…………..………………………………...2
II) Brief Description of Various Psychosocial Conditions of Interest…….….3 A) Stress ……………………………………………………………………….…3 B) Depression………………………………………………………………..……4 C) Social Support…………………………………………………………………4 D) Coping…………………………………………………………………………5
III) Questionnaires Used for Validation of Psychosocial Measures...………..5
IV) Impact of Psychosocial Health on Inflammatory Diseases…….………....6 A) Stress ……………………………………………………………………….…6 B) Depression………………………………………………………………..……7 C) Social Support…………………………………………………………………7
V) Impact of Psychosocial Health on Chronic Periodontitis………...………..9 A) Stress ………………………………………………………………………….9
i) Animal Studies …………………………..…….…………………..…..9 i) Human Studies ……….…………………..…………………..……….11
B) Depression………………………………………………………………....…13 C) Social Support………………………………………………………………..13 D) Coping………………………………………………………………………..14
VI) Putative Mechanisms Underlying the Impact of Psychosocial Factors on
Chronic Periodontitis…………………………………………………...………15
Objectives of the Study ………………………………………………………………...20 Hypotheses………………………………………………………………………………20

v
Materials and Methods ………………………………………………………………...21 I) Study Population and Clinical Protocol………..…………………………...21
II) Overall Study …………………..…………………………………………...21 III) Statistical Analysis …………………..…..………………………………...22 Results …………………………………………………………………………………..24
I) Validation of the Enhanced Questionnaire…………………..…………...25 II) Test-Retest Reliability of the Enhanced Questionnaire...……………..…26 III) Preliminary Testing of the Relationship Between Stress, Social Support and Chronic Periodontitis……………………...………..31
(i) Bivariate Analysis ……………………………………………………32 (ii) Multivariate Analysis …………..…………………………………...41 Discussion ………………………………………………………………………………44 I) Questionnaire ……………………………………….……………………….44
II) Limitations of the Study …………….……………………………………..46 Summary and Future Direction ………………………………………………………48 Conclusions ……………………………………………………………………………..49 Appendix 1 – Questionnaire Package……………………………………...………….50 2 – Calibration……………………………………………………….……...58 3 – Percent of Total Responses for Enhanced Questionnaire……………64
4 – Interpretation of Intraclass Correlation Statistic…….……….……...68 5 – Test-Retest Reliability Tables……………….………………….……...69 References ………………………………………………………………………………71

vi
LIST OF TABLES Table 1: Demographics of Controls vs. Cases…………………………………………...24
Table 2: Demographics of Healthy Controls vs. Mild/Moderate vs. Severe Disease...….25
Table 3: Pearson’s Correlation …………………………..………………………………25
Table 4: Spearman’s Correlation …………………………..……………………………26
Table 5: Number of Participants for Test-retest Reliability Component of Study.……...26
Table 6: Intraclass Correlation Coefficient for Case and Control Groups……….……...27
Table 7: Mean Scores, Standard Deviations, and P-values for Case and Control
Groups……………………………………………………………………………………31
Table 8: Mean Scores, Standard Deviations, and P-values for Healthy Controls,
Mild/Moderate, and Severe Groups………………………………………………….….32
Table 9: Stress and Social Support for Cases vs. Controls
– based on data driven means ………………………………………………...…33
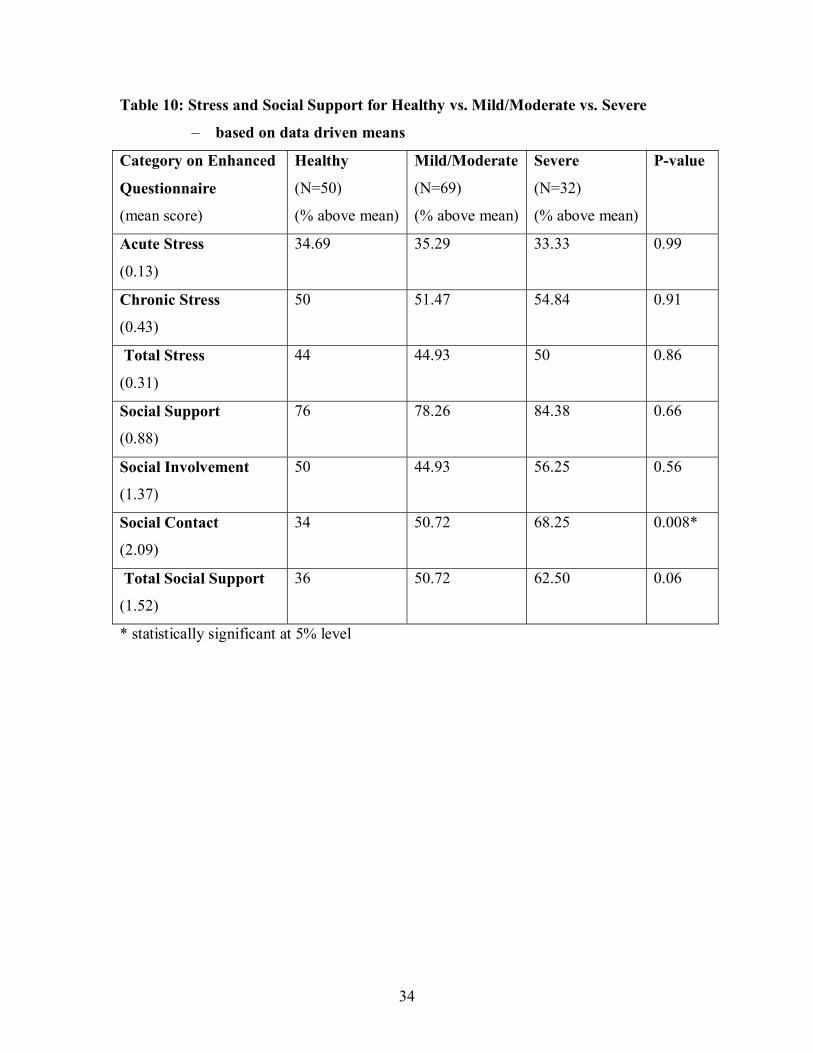
Table 10: Stress and Social Support for Healthy vs. Mild/Moderate vs. Severe
– based on data driven means ………………………………………………...…34
Table 11: Stress and Social Support for Cases and Controls
– based on Safa & Glogauer, 2007 driven means ……………………………….36
Table 12: Stress and Social Support for Healthy vs. Mild/Moderate vs. Severe
– based on Safa & Glogauer, 2007 driven means ……………………………….37
Table 13: Association Between Stress and Social Support……………………………...39
Table 14 – CES-D for Controls versus Cases…………………………………………...40
Table 15 - CES-D for Healthy vs. Mild/Moderate vs. Severe Disease……….…………40
Table 16: Logistic Regression Analysis – Cases vs. Controls…………………………..41
Table 17: Logistic Regression Analysis –Mild/Moderate Disease vs. Healthy…………42
Table 18: Logistic Regression Analysis –Severe Disease vs. Healthy.……………….…43

vii
LIST OF FIGURES
Figure 1a: Test-retest reliability – Acute stress ………...……..………………………...28
Figure 1b: Test-retest reliability – Chronic stress ………..……………………………...29
Figure 1c: Test-retest reliability – Social support…………………………………...…...29
Figure 1d: Test-retest reliability – Social involvement………….…..…………………...30
Figure 1e: Test-retest reliability – Social contact……………………...………………...30
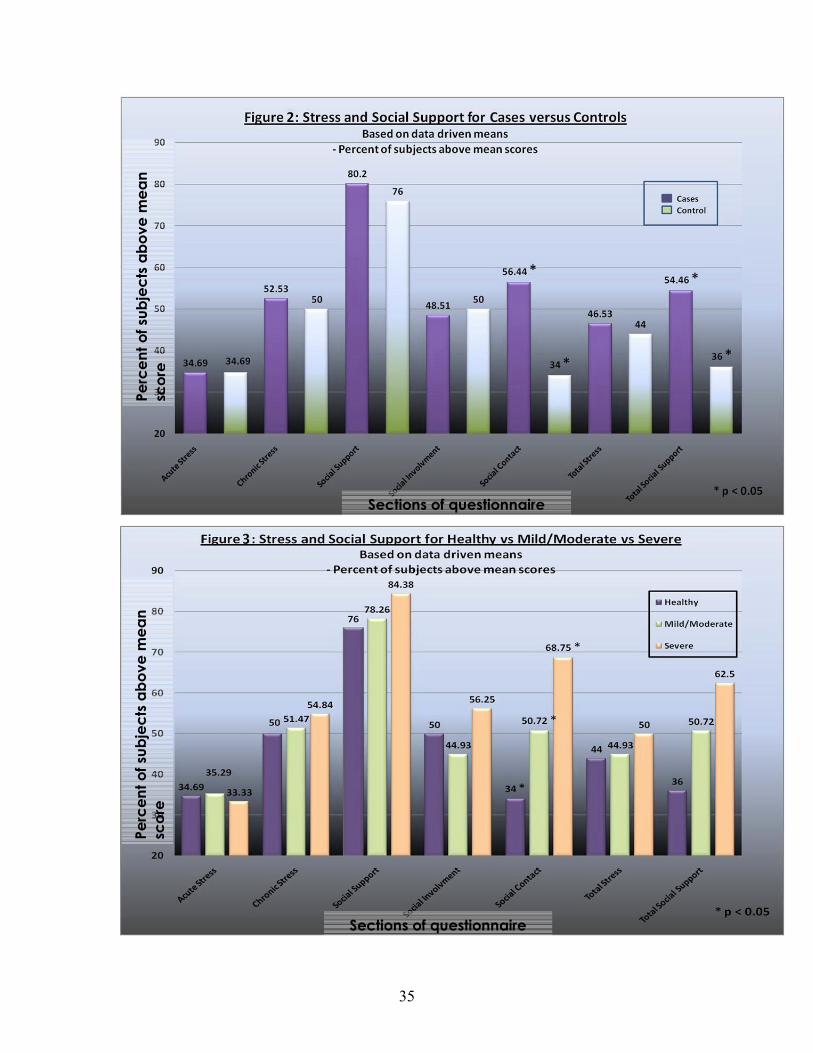
Figure 2: Stress and Social Support for Cases and Controls
– based on data driven means…………………..………………………………….35
Figure 3: Stress and Social Support for Healthy vs. Mild/Moderate vs. Severe
– based on data driven means……………………………………………………...35
Figure 4: Stress and Social Support for Cases and Controls
– based on Safa & Glogauer, 2007 driven means………………………………….37
Figure 5: Stress and Social Support for Healthy vs. Mild/Moderate vs. Severe
– based on Safa & Glogauer, 2007 driven means………………………………….38

viii
ABBREVIATIONS ACTH: Adrenocorticotrophic hormone AG: Attached gingiva BI: Bleeding index CAL: Clinical attachment level CES-D: Center for Epidemiologic Studies Depression Scale CNS: Central nervous system CRH: Corticotrophic-releasing hormone E: Epinephrine Furc: Furcation GCF: Gingival crevicular fluid GI: Gingival index HPA axis: Hypothalamic-pituitary-adrenal axis IgA, IgG, IgM: Immunoglobulin A/G/M IL-1B: Interleukin 1-beta INF-gamma: Interferon-gamma LEQ: Life Events Questionnaire MMP: Matrix metalloproteinases Mob: Mobility MSPSS: Multidimensional Scale of Perceived Social Support NE: Norepinephrine NK cells: Natural killer cells NO: Nitric Oxide

ix
PD: Probing depth P. gingivalis: Porphyromonas gingivalis PI: Plaque index PMN: Neutrophils PNI: Psychoneuroimmunology PSS: Perceived Stress Scale Rec: Recession SAM axis: Sympathetic-adrenal medullary axis SP: Substance P T. forsythus: Tannerella forsythus TNF-a: Tumor Necrosis Factor – Alpha

1
INTRODUCTION AND STATEMENT OF THE PROBLEM Periodontitis is inflammation and infection of the tissues that support the teeth. This
progressive disease, which is initiated and sustained by bacterial plaque, can lead to the
loss of the hard and soft connective tissues that retain the tooth within the jaw if left
untreated (Flemming, 1999). Studies point to several risk factors and risk indicators for
periodontitis including, amongst others: smoking, age, gender, poor oral hygiene and
systemic diseases such as diabetes mellitus (Albandar, 2002, Grossi et al., 1995, Grossi et
al., 1994). Growing evidence suggests that the psychosocial factors of stress, depression
and level of social support provoke changes in host defense mechanisms that modify
disease (Kloostra et al., 2006; Ng & Leung, 2006; Hugoson et al., 2002; Genco et al.,
1999; Breivik et al., 1996; Linden et al., 1996; Moss et al., 1996; Monterio da Silva et
al., 1995). The field of psychoneuroimmunology (PNI) focuses on how changes to the
relationships between the central nervous, the endocrine and the immune systems impact
health (Padgett & Glasser, 2003; Kiecolt-Glaser & McGuire, 2002; Rozlog et al., 1999).
Previous studies in our laboratory (Safa & Glogauer, 2007) have demonstrated that
patients with chronic periodontitis suffer from high levels of acute or chronic stress and
that patients suffering from acute stress are more likely to have severe disease. Observed
also was a trend for a higher proportion of the patients in the diseased category to have a
lower level of social support. Although these correlations are valid, the long and
unwieldy diagnostic questionnaire employed in these studies did not address all aspects
of the psychosocial background of the patient. Therefore, in order to enhance the use of a
questionnaire in a clinical setting, we identified and retained those questions which
yielded reliable information, deleted any questions that provide little or no information
and added a questionnaire designed to measure levels of depression. The result was a
concise, comprehensive version of our original questionnaire (Appendix 1). The
psychometric properties of this enhanced questionnaire were then tested to ensure
validity and reliability. Following this, the questionnaire was used to acquire data to
assess the relationships, if any, between stress, depression and level of social support in
patients with and without chronic periodontitis.

2
REVIEW OF THE LITERATURE I) Etiology of Chronic Periodontitis Chronic periodontitis is an infectious inflammatory disease involving progressive
attachment and bone loss around the teeth. While it is initiated by bacterial plaque, the
pathogenesis of the disease is primarily affected by local and systemic factors that affect
the resistance of the host to infecting periodontal organisms (Page & Kornman, 1997;
Seymour, 1991), as well as by host defence mechanisms (Flemming, 1999). Examples of
local factors include pre-existing disease evidenced by deep probing depths, plaque
retentive areas and invasion of periodontal tissue by virulent organisms such as
Porphyromonas gingivalis (P.gingivalis), Tannerella forsythus (T. forsythus), formerly
known as Bacteriodes forsythus, and Treponema denticola. Recently identified examples
of systemic factors include diabetes mellitus, cigarette smoking, and neutrophil (PMN)
dysfunction (Genco, 1996; Johnson & Hill, 2004; Mealey & Oates, 2006). There is also a
growing body of evidence to suggest that stress, depression and level of social support
affects host defense mechanisms thereby influencing the progression of chronic
periodontitis (Genco et al., 1999).
(i) The old theory of the pathogenesis of periodontitis focuses on bacterial etiology:
(Page & Kornman, 1997)

3
(ii) New concepts in periodontitis, recognize the host response: (Page & Kornman, 1997)
II) Brief Description of Various Psychosocial Conditions of Interest
A) Stress
In the literature, there does not appear to be universal agreement for the definition of
stress. Stress can be defined as a state of imbalance within a person elicited by an actual
or a perceived discrepancy between environmental demands and the person's ability to
cope with these demands (Maes et al., 1987). Stress can also be defined as a state of
physiological or psychological strain caused by adverse physical or mental stimuli that
tends to disturb the functioning of an organism (Boyapati & Wang, 2007). The intensity
of, or the absence of, a stress response is determined by the perception of the situation
and one’s perceived ability to master it. Individual perceptions and the enacted coping
mechanisms are as important in determining health or disease as the stressors themselves
(Breivik et al., 1996; LeResche & Dworkin, 2002).
Definitions of acute and chronic stress are also inconsistent. Current stressor definitions
make the distinction between acute and chronic stressors with no established temporal
cut-off periods. Acute stressors refer to short-term and time-limited events while chronic
stressors denote conditions which are longer lasting and may not be attributed to a

4
discrete event (Herbert & Cohen, 1993). Stress duration may be important because the
plausibility of stress-elicited hormones (ex. catecholamines, cortisol) affecting immune
outcomes depends on the duration of the stressor. Acute stress appears to have a boosting
effect on the immune system while chronic stress has a dampening effect (Olff, 1999).
B) Depression
Depressive disorder is a very common psychiatric illness that involves long-term
impairment of mood, thought and behavioral patterns. Depression presents with
dysphoria and sadness (a depressed mood), loss of interest or pleasure (anhedonia),
feelings of guilt or low self-worth, disturbed sleep or appetite, low energy and poor
concentration (Olff, 1999; Friedlander & Mahler, 2001).
C) Social Support
Social support is defined as the physical and emotional comfort given to an individual by
family, friends and significant others. When an individual knows that he or she is loved,
cared for, valued and generally thought well of, that person can be said to have a good
social support base (Maes et al., 1987). Social support can be measured structurally or
functionally; structurally via the presence or absence of interpersonal relationships or
functionally, via the functionality of that relationship. Structural measures of social
support include the number of contacts with family, friends, and community, as well as
the number of active memberships in formal and informal groups (Cohen & Syme, 1985).
Functional measures emphasize one’s perception of the relationship or of the perceived
resources available to themselves. Functional measures are good predictors of health
since the relationship between support and health is mediated by psychological
representations of available support as opposed to objective structural relations (Cohen &
Syme, 1985).
There are two models that demonstrate the positive effect of social support on health and
well being; the direct effect hypothesis and the buffering hypothesis. Direct effect argues
that social support enhances health due to the perception that others will provide aid in
the event of a stressful occurrence or that aid will be provided as a result of an integrated

5
membership in a social network (Cohen & Syme, 1985). Buffering argues that social
support exerts its beneficial effects in the presence of stress, thereby reducing /
preventing a stress response and protecting people from the pathogenic effects of stress
(Cohen & Syme, 1985).
D) Coping
Coping is the ability to reduce, control or tolerate a state of stress. Coping efforts may be
directed at the demands themselves (problem-focused strategies) or at the emotional
reactions which often accompany those demands (emotion-focused strategies). Research
has shown that problem-focus coping is more beneficial than emotion-focused coping
(Newton, 2005; Reners & Brecx, 2007; Genco et al., 1999).
III) Questionnaires Used for Validation of Psychosocial Measures
The validity and reliability of our enhanced questionnaire was assessed.
The accuracy of our questionnaire was assessed by determining the degree of correlation
between itself and an already validated instrument or process that measures the same
parameter (WHO, 1997). For this study, our enhanced questionnaire was administered
alongside three validated standardized questionnaires: the Perceived Stress Scale (PSS),
the Life Events Questionnaire (LEQ) and the Multidimensional Scale of Perceived Social
Support (MSPSS). The PSS, a fourteen-item instrument used to measure the degree to
which a situation in one’s life is judged as stressful (Cohen et al., 1983), was used to
validate the acute stress section of our questionnaire. The LEQ, a twelve-item instrument
designed to measure common life events from the past six months that tend to be
threatening (Concoran & Fischer, 1998; Brugha & Cragg, 1990; Brugha et al., 1985;
Tennant & Andrews, 1976), was used to validate the chronic stress section. The MSPSS,
a twelve-item instrument designed to measure perceived social support from family,
friends and a significant other, was used to evaluate the social support section.
Respondents used a 7-point Likert-type scale (very strongly disagree to very strongly
agree) with each item (Concoran & Fischer, 1998; Zimet, 1988; Zimet et al., 1990;
Dahlem et al., 1991; Grassi et al., 2000).

6
Test-retest reliability was assessed by re-administering the enhanced questionnaire to
patients one to two months after they had completed the original questionnaire. This time
period would be short enough to ensure predictive validity of the scale but long enough
that patients would not remember their previous answers (Cohen et al., 1983).
To augment our study, we added the Center for Epidemiologic Studies Depression Scale
(CES-D) to our questionnaire (Radloff, 1977). The CES-D consists of twenty items, each
representing a state characteristic of a depressed person (Radloff, 1986; Concoran &
Fischer, 1998) and measures the current level of depressive symptoms in the general
population. It has been validated against the clinical diagnosis of depression (Andresen et
al., 1994). Each item is rated on a four-point Likert-type scale to indicate the frequency
of their occurrence during the last week. Response options range from “rarely or none of
the time” to “most or all of the time” (Radloff, 1986; Concoran & Fischer, 1998). A
cutoff score of 16 or higher has been validated with DSM-III criteria as clinical
depression in a wide range of populations (Andresen et al., 1994).
IV) Impact of Psychosocial Health on Inflammatory Diseases
A) Stress
It has been proposed that stress is an important disruptive factor in the homeostatic
relationship between oral bacteria and the host’s immune system. A decreased immune
reaction to bacterial challenge enables bacteria to proliferate and invade the surrounding
tissues provoking an increased inflammatory response (Boyapati & Wang, 2007;
Albandar, 2002; Breivik et al., 1996; Linden et al., 1996; Grossi et al., 1995; Grossi et
al., 1994).
To investigate the effect that a psychosocial stressor (academic stress) might have on a
person’s ability to generate an immune response to a primary antigen, Glaser et al.
inoculated medical students with hepatitis B vaccines at the end of a series of
examinations. Of the students inoculated, one quarter seroconverted after the first
injection and were significantly less stressed and less anxious than those students who
7
seroconverted after the second injection (Glaser et al., 1992; Kiecolt-Glaser & Glaser,
1995; Kiecolt-Glaser & McGuire, 2002; Kiecolt-Glaser et al., 2002). Evidence further
suggests that chronic stressors are associated with continued down-regulation of immune
function rather than adaptation. Changes in immunity and health were investigated in
both spousal dementia caregivers who had been providing care for an average of five
years and controls. Caregivers showed a down-regulation in cellular immunity relative to
controls and were sick more often (Kiecolt-Glaser et al., 1991; Kiecolt-Glaser & Glaser,
1992; Kiecolt-Glaser & McGuire, 2002; Kiecolt-Glaser et al., 2002).
Kiecolt-Glaser et al. studied the immunological response evoked by stress in first-year
medical students by measuring natural killer (NK) cell activity, total levels of plasma
immunoglobulin A, G, M, (IgA, IgG, and IgM) and salivary immunoglobulin-A. Blood
samples taken one month before a final examination were compared with samples taken
immediately prior to the exam. The results showed that NK cell activity declined
significantly from the first to the second blood sample. Also, both stressful life events and
loneliness had significant effects on NK activity with high scores on either measure
leading to lower levels of NK cells (Kiecolt-Glaser et al., 1984).
B) Depression
Apart from the obvious psychological effects, other functional aspects of depression have
been found to be associated with impairment of the immune system (Olff, 1999;
Friedlander & Mahler, 2001). For example, cortisol hypersecretion has been shown to be
a biological risk indicator for depression and may play a role in cognitive and emotional
processing and depression. Tse & Bond reported that cortisol secretion was significantly
associated with both depression and poor social functioning. These findings suggest that
poor social functioning is the mediator and elevated cortisol secretion is the predisposing
factor in depression (Tse & Bond, 2004).
C) Social Support
Social support, or the lack thereof, has been previously shown to have a direct impact on
an individual’s risk for infection. Overall, the quality of one's interpersonal relationships

8
have health-related consequences. As an example, Cohen and Syme reported that
individuals with poor social support showed inhibitory effects in their immune system
(Cohen & Syme, 1985). Social marginality, a state often reflective of weak ties with
one's community, is a major factor and accounts for higher mortality rates from all
causes. One’s participation in a close-knit religious group has been associated with a
lower incidence of disease. Individuals who are married also have less illness and greater
longevity compared with those who are single (Pilisuk, 1982).
Studies have shown that social support is also related to increased psychological well-
being and lower incidence of physical illness. These studies used either questionnaire
data or were PNI studies. Questionnaire data collected from young military personnel
indicated that the group that had many negative life events and low satisfaction
concerning their social support showed higher rates of isolation, chronic illness and total
illnesses than did other groups (Sarason et al., 1985). Questionnaire data collected from
college students showed that individuals who had less social support were more likely to
be depressed (Pengilly & Dowd, 2000). Furthermore, social support was found to
moderate the relationship between stress and depression such that high stress / low
support individuals were more depressed. Individuals with high social support had similar
levels of depression regardless of their level of stress. Thus, it appeared that social
support can buffer the effect of stress on depression.
PNI studies have found a link between personal relationships and immune function.
Women whose husbands were being treated for urologic cancer, but had great social
support, had high NK cell activity and strong proliferative responses of peripheral blood
leukocytes to mitogen stimulation (Kiecolt-Glaser et al., 2002). Medical students who
reported better social support mounted a stronger immune response to a Hepatitis B
vaccine then did those with less support (Glaser et al., 1992). Poor marital quality was a
significant predictor of depression and generated a poor response on immunologic assays
(Kiecolt-Glaser et al., 1987). Women that had been recently separated from their
husbands had a significantly lower percentage of NK cells and helper cells than did
sociodemographically matched married women (Kiecolt-Glaser et al., 1987).

9
V) Impact of Psychosocial Health on Chronic Periodontitis
A) Stress
The successful clinical management of a disease depends on whether or not the etiology
is clearly understood. With periodontal disease, it is essential to determine whether
psychosocial factors like stress give rise to, or exacerbate the pathologic process within
the periodontal structures. Several animal and human studies have explored the
hypothesis that stress is a causative factor of periodontal tissue destruction and chronic
periodontitis.
i) Animal studies:
As early as the 1950s, researchers used animal models to study the effects of stress on
periodontal tissues. In 1956, rats exposed to stress showed numerous signs of periodontal
destruction including the sloughing of the keratinized layers of epithelium in the gingival
tissue, splitting of the papilla at the junction of the oral and enamel epithelial cells,
degeneration of the connective tissue of the periodontal membrane and an overall
reduction in the number of osteoblasts and cementoblasts (Ratcliff, 1956). Others
showed similar results in a hamster. Histologic analysis of tissue specimens from stressed
animals revealed irregularities in both the arrangement of the fibres of the periodontal
membrane and the shape of the fibroblasts (Fedi, 1958).
The response of the periodontium to long-term stress caused by environmental stimuli
was also studied in the 1960’s by using both young adult male rats and hamsters. Stressed
rats showed marked and extensive endosteal osteoporosis in their interrradicular septi as
well as osteoclastic cell activity at the alveolar crest (Gupta and Blechman, 1960).
Gingival healing in hamsters was investigated and it was found that there was a delay in
the organization of the connective tissue in the wounded areas of stressed rats in
comparison to controls. Similarly, the regeneration of bone was reduced in the stressed
animals (Stahl, 1961).

10
A more recent approach has been the study of stressors in combination with a P.
gingivalis challenge. Mice challenged with P. gingivalis and placed in isolation
(emotional stressor) under “cold” conditions (physical stressor) showed a suppression of
macrophages, increased secretion of nitric oxide (NO) and reduced secretion of cytokine
tumor necrosis factor – alpha (TNF-a). The authors speculated that the NO was
responsible for the accelerated periodontal destruction observed in stressed animals
(Shapira et al., 1999; Shapira et al., 2000). The impact of emotional stress on the humoral
response to P. gingivalis has also been studied in mice. Findings showed that chronic
psychological stress affected the localized response to P. gingivalis as evidenced by the
lower IgG ratio in stressed mice compared with controls (Houri-Haddad et al., 2003). The
effects of restraint stress on periodontal breakdown as a result of P. gingivalis-challenged
periodontitis, has also been investigated. Results showed that there was a physiologic
burden caused by restraint stress in rats, indicated by an elevation in the levels of the
hormone markers cortisol and corticosterone. Resistant stress alone did not induce
alveolar bone loss. The combination of restraint stress and P. gingivalis challenge
resulted in significantly higher attachment and alveolar bone loss and a decrease in
cytokine expression than did a P. gingivalis challenge alone (Nakajima et al., 2006).
In 2008, a randomized controlled study in rats investigated the effect of chronic stress on
bone loss and key inflammatory factors resulting from ligature-induced periodontitis. The
results demonstrated that plasma levels of corticosterone and catecholamines were
significantly increased in rats with restraint stress. Histometric analysis revealed that
ligature placement resulted in significant bone loss and that chronic stress significantly
increased the rate of periodontitis progression (i.e. bone loss) in ligated sites. Analysis
further demonstrated that chronic stress promoted a local imbalance in both the pro- and
anti-inflammatory cytokines in periodontal tissues. Interleukin 1-beta (IL-1B),
interleukin 10, interferon gamma (IFN-gamma) and RANKL (regulates osteoclast
differentiation and function) mRNA levels were increased significantly by inflammation
produced by ligature placement. It can be concluded that chronic stress significantly
increased bone loss resulting from ligature-induced periodontitis and was related to a
11
local increase in pro-inflammatory and pro-resorptive factors and cytokines (Peruzzo et
al., 2008).
ii) Human Studies
Although clinical investigations aimed at studying the relationship between stress and
periodontal disease began in the 1950s, most were directed towards acute necrotizing
ulcerative periodontitis and not chronic periodontitis (Moulton et al., 1952).
Two of the earliest studies which investigated the association between stress and chronic
periodontitis were performed on psychiatric patients in the 1960s by both Belting &
Gupta and Davis & Jenkins. Belting & Gupta found that the severity of periodontal
disease was significantly greater among patients with psychiatric disorders than among
healthy controls. Moreover, the severity of periodontal disease increased as the degree of
anxiety intensified. Significant differences in severity persisted even when variables such
as the degree of calculus, brushing frequency and the habit of bruxism and clenching
were held constant in the two groups (Belting & Gupta, 1961). Davis & Jenkins found a
similar significant relationship between periodontal disease and mental stress (Davis &
Jenkins, 1962).
In the 1970s and 1980s, researchers continued their quest to find a link between stress
and chronic periodontitis. A series of case studies established that severe periodontal
bone loss in a group of young men was probably the result of severe emotional stress
associated with active duty in Vietnam (De Marco, 1976). However, it wasn’t until 1986
when a study by Green et al. reported a significant association between life events stress
and periodontal status in humans. In this study, gingival and periodontal pathology,
stressful life events and somatic symptoms were investigated (Green et al., 1986).
Since then, numerous studies have investigated the relationship between stress and
chronic periodontitis. Initial studies examined the relationship between occupational
stress and chronic periodontitis and showed that chronic stress associated with job and
financial strain could adversely affect the immune response thereby reducing resistance
12
to infection (Ng & Leung, 2006). Marcenes & Sheiham found that lower work-related
mental demands, higher levels of marital quality and socio-economic status were
significantly associated with good periodontal health. Furthermore, work-related mental
demands were found to be associated with alterations in salivary flow and changes in the
immune system and not associated with risk-related behaviors such as dental attendance
and/or tooth-brushing frequency (Marcenes & Sheiham, 1992). A retrospective study by
Freeman and Gross found that occupational stress factors predicted pocket depth
(Freeman & Gross, 1993). Lastly, Linden et al. showed that increased age, lowered socio-
economic status, lowered job satisfaction and the presence of a type A personality
(characterized by competitiveness and excessive drive) could predict a loss in periodontal
attachment (Linden et al., 1996).
Later studies which were designed to better understand the general relationship between
stress and chronic periodontitis utilized case-control methodology and questionnaire data
to determine stress level and clinical data to determine periodontal status. Moss et al.
found an association between T. forsythus and case status. As well, measures of smoking
status and levels of antibodies for Actinobacillus actinomycetemcomitans & P. gingivalis
were higher in cases compared with controls (Moss et al., 1996). Croucher et al. showed
that both the number of negative life events and the number of negative life events
weighted by the impact of the event on the person were significantly associated with
periodontitis. Moreover, the observed association between negative life events and
periodontitis remained significant even after adjusting for smoking status (Croucher et
al., 1997). Teng et al. found a dose-response relationship between psychosocial stress and
chronic periodontitis (Teng et al., 2003).
Studies have also investigated the relationship between stress and healing after
periodontal therapy. Axtelius et al. investigated stress as it relates to the pathogenesis of
therapy-resistant periodontitis. Those patients who did not respond favorably to therapy
showed various indicators of stress and vulnerability both in the past and in the present.
Those patients also showed more passive dependence (submissively help seeking,
dependent on other people) in comparison to those who responded well and who had a

13
more rigid-compulsive stress coping behavior. The results emphasized the importance of
assessing the psychological profile of patients who do not respond to traditional
periodontal therapy (Axtelius et al., 1998). Vettore et al described a dose-response
relationship between an individual’s mean anxiety score and the severity of chronic
periodontitis observed. Furthermore, a relationship between anxiety and periodontal
healing was also reported given that non-stressed individuals showed a significant
improvement in periodontal parameters after treatment compared with individuals who
were stressed (Vettore et al., 2005). Kloostra et al., showed that patients with stress had
more pain and delays in wound healing after periodontal surgery than did those with less
stress (Kloostra et al., 2006).
B) Depression
Clinical depressive disorder is an affective disorder which has consistently demonstrated
immunologic challenges. Genco et al. in 1999 investigated the relationship of periodontal
disease in adults to stress, distress, and coping and found that depression was associated
with greater levels of clinical attachment loss (CAL) and alveolar bone loss (Genco et al.,
1999). Ng & Leung examined the relationship of periodontal disease to psychosocial
stress and found that depression was a significant risk indicator for CAL. Compared to
healthy subjects, there were trends of more severe psychological symptoms of depression
in those with more severe CAL (Ng & Leung, 2006). Moss et al. explored the role of
depression as a host factor which could influence the progression of chronic periodontitis
and found that an individual’s case status and presence of T. forsythus were associated
with higher levels of depression (Moss et al., 1996). More recently, Kloostra et al.
showed that the more depressed a patient was, the more pain they had post-periodontal
surgery, the stronger the pain medication they used, and the more delayed their wound
healing was after surgery (Kloostra et al., 2006).
C) Social Support
The relationship between marital status and periodontal disease has been investigated.
Marcenes & Sheiham in 1992 used questionnaire data to show that higher levels of
marital quality were significantly associated with better periodontal health status

14
(Marcenes & Sheiham, 1992). Croucher et al. assessed the role of life events in
periodontitis and found that marital status becomes statistically significant after adjusting
for all of the other variables (Croucher et al., 1997).
Merchant et al. utilized data from an ongoing Health Professionals questionnaire-based
prospective study in order to explore the association between anger expression, social
support and periodontitis in a cohort of middle-aged to older men. Men who had more
social support were less likely to develop periodontitis. Moreover, men who reported
having at least one close friend or who participated in religious services were at an even
greater reduced risk of developing periodontitis (Merchant et al., 2003).
D) Coping
An individual’s ability to cope with difficulties and problems as well as their past
experience with traumatic life events is important in determining an individual’s
susceptibility to periodontal infections (Hugoson et al., 2002). Numerous studies have
explored the relationship between coping with a stressor and chronic periodontitis.
Adequate coping behaviors, either low emotion-focused coping or high problem-focused
coping, combined with an internal locus of control, results in little or no effect on
periodontal status. By contrast, the inability to cope adequately with chronic stress leads
to more severe periodontal disease.
A large population-based, cross-sectional study by Genco et al. investigated whether
periodontal disease in adults was related to stress, distress, and / or coping strategies
(Genco et al., 1999). The results showed that stress (ie, financial strain) and depression
were associated with greater levels of CAL or alveolar bone loss. Furthermore,
individuals who possessed problem-based and not emotion–based coping strategies, even
when under financial strain, exhibited no more periodontal disease than those individuals
under no financial strain.
A retrospective case-control study conducted by Wimmer et al. evaluated the stress
coping patterns used by patients with periodontal disease and found that patients with

15
periodontitis used both distractive and defensive coping strategies more than active
coping strategies. In addition, a greater number of patients with severe disease had a
defensive coping style compared with patients with mild or moderate disease (Wimmer et
al., 2002). Hugoson et al. studied periodontal disease in relation to the prevalence of
negative life events and psychological factors, and showed that age, oral hygiene,
smoking, loss of a spouse and the personality trait of having an external locus of control
(characterized by poorly developed strategies to cope with stressful life events) was
significantly associated with an increased risk of severe periodontal disease (Hugoson et
al., 2002).
VI) Putative Mechanisms Underlying the Impact of Psychosocial Factors on
Chronic Periodontitis
Several mechanisms have been described that could explain why both stress and
depression are linked to chronic periodontitis. PNI studies have shown that physiological
responses to emotional stressors and depression can modulate the immune system
through the neural and endocrine systems. This might occur by 1) the release of
hypothalamic and pituitary hormones via the hypothalamic-pituitary-adrenal axis (HPA),
2) autonomic nervous system pathways, specifically the sympathetic-adrenal medullary
axis (SAM), and / or 3) the release of neuropeptides such as substance P (SP).
Alternatively, the stress response or depression could lead to behavioral changes which in
turn could have an impact on chronic periodontitis (Breivik et al., 1996; Genco et al.,
1998; Monterio da Silva et al., 1995).
There are two proposed models to evaluate the role of psychosocial stress and coping
behaviors in periodontal disease. The first model focuses on both the HPA and SAM axes
while the second model centers on the behavioral changes that might lead to
immunosupression (Genco et al., 1998; Monterio da Silva et al., 1995).
Model #1: Mental stress response which triggers either the HPA or SMA axis, resulting
in immunosuppressive effects.
16
In this model, activation of the central nervous system (CNS) by psychosocial stress
triggers the hypothalamus to release corticotrophic-releasing hormone (CRH) which in
turn stimulates the pituitary to release adrenocorticotrophic hormone (ACTH). It is this
latter step which causes the production of the cortisol by the adrenal cortex. Cortisol, a
glucocorticosteroid, depresses immunity by reducing the levels of secretory IgA, IgG,
and PMN function, all of which are important in protecting the host against periodontal
infection. Secretory IgA antibodies prevent and / or reduce the organism’s ability to
colonize the tooth surface whereas IgG antibodies are thought to exert protection by
modifying periodontal organisms for PMN killing. This cascade of decreased immune
surveillance activity can then give rise to increased susceptibility to disease thus leading
to periodontal infection and ultimately to the establishment of destructive periodontitis
(Genco et al., 1998; Monterio da Silva et al., 1995). Mental as well as physical stress can
also result in responses being transmitted to the autonomic nervous system and then to
the adrenal medulla, resulting in secretion of catecholamines such as epinephrine (E) and
norepinephrine (NE). Catecholamines upregulate prostaglandin and protease production
or activity which in turn could enhance periodontal destruction (Genco et al., 1998;
Monterio da Silva et al., 1995).
A feedback loop which regulates the inflammatory response is dependent upon effective
communication between the neuroendocrine and immune systems. That being said,
manifestations of systemic illness will be clinically evident if an inflammatory reaction
triggered by a psychological stressor is either profound or prolonged. There is no reason
to believe that chronic periodontitis would be any different in this regard (LeResche &
Dworkin, 2002).

17
Model #2: Mental stress response which leads to behavioral changes.
The second model states that the effects of stress are derived through stress-induced
alterations in the behavior of the host. These behaviors, which include smoking, poor oral
hygiene and poor compliance, likely play an important role in the initiation, progression
and response to the treatment of periodontitis. Furthermore, overeating (especially a high-
fat diet) also leads to the production of increased levels of cortisol which in turn could
lead to immunosupression and the development and progression of chronic periodontitis
(Genco et al., 1998; Monterio da Silva et al., 1995).
Autonomic Nervous System
Activation of CNS Hypothalamus
(CRH)
Pituitary (ACTH)
Adrenal Cortex (Cortisol)
Adrenal Medulla (NE, E)
Prostaglandins and Proteases
Depressed Immunity
(sIgA, IgG, PMN)
Infection
Adequate Coping - + Inadequate Coping
Acute + + Chronic
- +
-
+
+ IL-1B, MMP +
+
+
Model 1: (Genco et al., 1998; Monterio da Silva et al., 1995)
Psychosocial Stress
Periodontal Disease

18
Neuropeptides - SP:
Emotional stressors can modulate the immune system and the release of pro- and anti-
inflammatory cytokines. Through the release of neuropeptides found within neural tissue,
SP, which is secreted from sensory C-type nerve fibres, may be of particular interest for
immune reactions in the gingiva and the periodontium when triggered by dental plaque
bacteria (Breivik et al., 1996). SP causes vasodilation, increased blood flow and can
enhance the microvascular permeability in the gingival connective tissues. The initial
action of SP is to promote and direct the inflammatory and immune response in infected
and/or damaged tissues. It has numerous effects such as the stimulation of neutrophil
chemotaxis, osteoclast stimulation, T-cell proliferation and antibody production, the
regulation of gingival fibroblast proliferation and the release and expression of IL-1B,
interleukin 6, and TNF-a. It is generally inhibitory at high concentrations and stimulatory
at low concentrations (Breivik et al., 1996; Azuma et al., 2004).
Psychosocial Stress
Periodontal Disease
Behavioral Change
Poor Oral Hygiene,Poor Compliance
Smoking Overeating (High-fat diet)
Cortisol
Bacterial Infection
+
+
+
+
+ +
+
+
Depressed Immunity
Model 2: (Genco et al., 1998; Monterio da Silva et al., 1995)
19
SP is detected in gingival tissues and gingival crevicular fluid (GCF) of both healthy
individuals and patients with periodontitis. However, the SP level of GCF is significantly
higher than that of healthy persons. The peripheral release of SP is regulated by stress
hormones such as NE and it has been shown that blocking SP-releasing nerves reduces
inflammation and immune cell mobilization in ligature-induced periodontitis in animals.
Thus, long-lasting emotional stress may increase SP release resulting in enhanced and/or
imbalanced inflammatory reactions. This may promote tissue damage and destruction of
alveolar bone, resulting in chronic periodontal disease (Azuma et al., 2004).

20
OBJECTIVES OF THE STUDY
(1) To validate an enhanced questionnaire designed to measure stress and social
support in patients with chronic periodontitis.
(2) To determine if patients with chronic periodontitis are under increased stress and
have more depressive symptoms compared to healthy controls.
(3) To determine if the social support level of patients with chronic periodontitis
differs from that of healthy controls
HYPOTHESES
(1) Our enhanced questionnaire is valid and reliable for measuring stress and social
support in patients with chronic periodontitis.
(2) Patients with chronic periodontitis suffer from greater perceived stress and
depression than those without periodontal disease.
(3) Patients with chronic periodontitis have less social support than those with no
periodontal disease.
21
MATERIALS AND METHODS
I) Study Population and Clinical Protocol
This study was approved by the Scientific and Ethics Review Board at the University of
Toronto prior to its commencement. The study protocol was explained to each potential
subject and written informed consent was obtained. Questionnaire packages (including
the enhanced questionnaire, the CES-D, the PSS, the LEQ, and the MSPSS) (Appendix
1) were given to patients who were diagnosed with chronic periodontitis at the Graduate
Periodontal Clinic at the Faculty of Dentistry, University of Toronto during the period of
September 2006 and May 2007. Identical packages were given to patients from the
Second Year Periodontal Recall Program at the Faculty of Dentistry, University of
Toronto during the period of January 2007 to March 2007. This formed the control group.
Re-test questionnaires were handed out to case patients and were mailed out to control
patients. All patients had until June 2007 to complete the follow-up questionnaire.
Sample size, as determined in the study by Safa & Glogauer, 2007, was found to be 30
per group to achieve adequate power.
Patients with chronic periodontitis were grouped into one of two groups based on severity
of disease; mild/moderate and severe. Severity was determined by probing depth (PD).
The mild/moderate group had fewer than 10 pockets that were greater than 5 mm and the
severe group had more than 10 pockets that were greater than 5 mm (Mancini et al.,
1999). Those in the control group had no clinical signs of periodontal disease (no PD >
5mm). In order to develop standardized measuring techniques which would enable a
consistent diagnosis, the first and second year Graduate Periodontal Residents were
calibrated to ensure inter-examiner reliability when assessing patients that were to be
included in this study. See Appendix 2 for details.
II) Overall Study
The primary objective of this investigation was to validate an enhanced questionnaire that
measured stress and social support in patients with chronic periodontitis. A secondary

22
objective was to compare the level of stress, depression, and social support in patients
with chronic periodontitis versus patients with no periodontal disease (a case control
study).
Electronic and manual searching of the literature was performed. Databases searched
included Medline (from 1950 to November Week 2 2008), Medline In-Process (up to
November 21 2008), PsychInfo (up to November 2008), and Health and Psychosocial
Instruments (from 1985 to April 2007). Manual searching was based on cited studies in
relevant papers. Two separate literature searches were conducted. The first searched for
validated questionnaires on depression, stress, and social support and the second searched
for general information on stress, depression, and social support.
The enhanced questionnaire used in this study was shortened to include only those
questions that were significantly associated with disease (Safa & Glogauer, 2007). The
questionnaire consisted of 21 questions in total; 4 on acute stress, 6 on chronic stress, and
11 on social support. The 11 questions on social support were subdivided into four social
support questions, two social involvement questions, and five social contact questions.
The CES-D was added to the package as a means to measure depression. The PSS, LEQ,
and MSPSS were included to validate the enhanced questionnaire (Appendix 1).
III) Statistical Analysis
Calibration: Statistical analysis consisted of calculations of percent agreement within a
pre-specified margin.
Questionnaire Data: Statistical analysis was performed to assess: concurrent validity, test-
retest reliability, and to examine the results of both of the enhanced questionnaire and the
CES-D. In order to assess the concurrent validity of the questionnaire, the analysis
consisted of: Pearson’s correlation coefficient and Spearman’s rank correlation
coefficient. In order to assess test-retest reliability of the questionnaire, the analysis

23
consisted of: Intraclass correlation coefficient and percent accuracy with its standard
error and 95% confidence interval.
To assess the relationship between stress, depression, social support and chronic
periodontitis, descriptive statistics (mean scores, standard deviations, and t-tests) were
used to describe the data. In addition, bivariate analysis was performed using Chi-squared
tests to analyze the results based on both data driven classification and on classification
based on a previous study by Safa & Glogauer, 2007. Multivariate analysis, to analyze
the association between stress and social support, used logistic regression to adjust for
other factors.
24
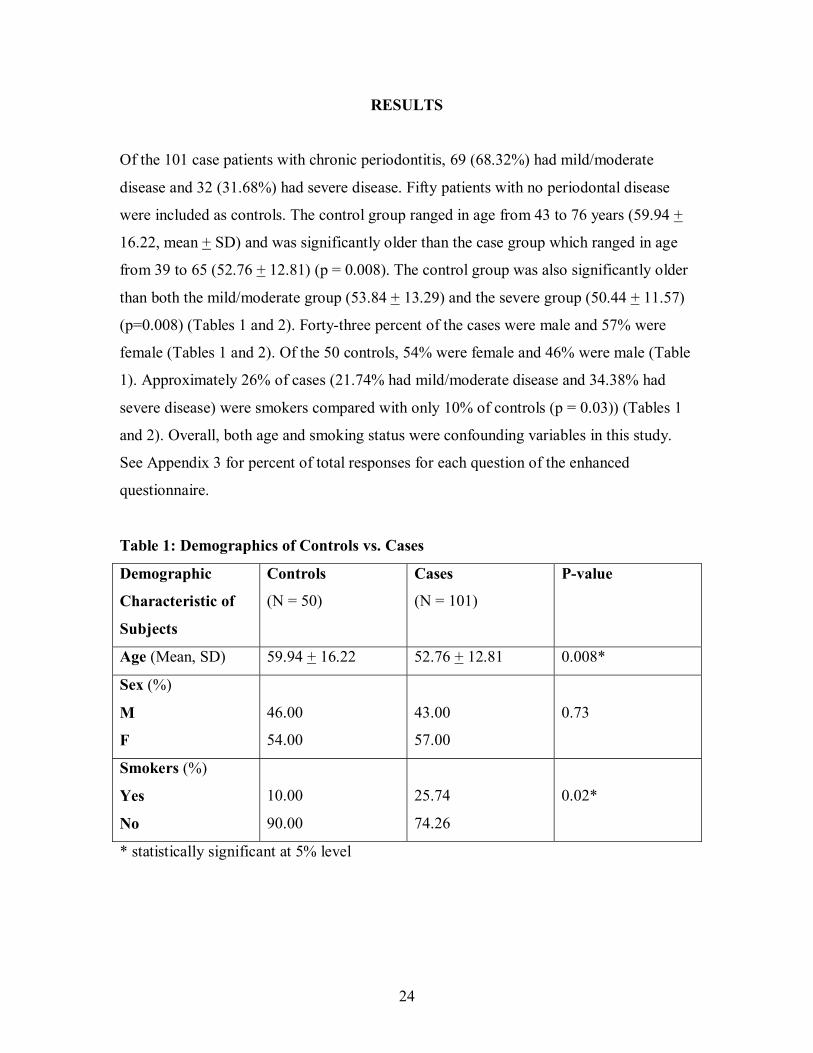
RESULTS
Of the 101 case patients with chronic periodontitis, 69 (68.32%) had mild/moderate
disease and 32 (31.68%) had severe disease. Fifty patients with no periodontal disease
were included as controls. The control group ranged in age from 43 to 76 years (59.94 +
16.22, mean + SD) and was significantly older than the case group which ranged in age
from 39 to 65 (52.76 + 12.81) (p = 0.008). The control group was also significantly older
than both the mild/moderate group (53.84 + 13.29) and the severe group (50.44 + 11.57)
(p=0.008) (Tables 1 and 2). Forty-three percent of the cases were male and 57% were
female (Tables 1 and 2). Of the 50 controls, 54% were female and 46% were male (Table
1). Approximately 26% of cases (21.74% had mild/moderate disease and 34.38% had
severe disease) were smokers compared with only 10% of controls (p = 0.03)) (Tables 1
and 2). Overall, both age and smoking status were confounding variables in this study.
See Appendix 3 for percent of total responses for each question of the enhanced
questionnaire.
Table 1: Demographics of Controls vs. Cases
Demographic
Characteristic of
Subjects
Controls
(N = 50)
Cases
(N = 101)
P-value
Age (Mean, SD) 59.94 + 16.22 52.76 + 12.81 0.008*
Sex (%)
M
F
46.00
54.00
43.00
57.00
0.73
Smokers (%)
Yes
No
10.00
90.00
25.74
74.26
0.02*
* statistically significant at 5% level

25
Table 2: Demographics of Healthy Controls vs. Mild/Moderate vs. Severe Disease
Demographic
Characteristic of
Subjects
Healthy
Controls
(N = 50)
Mild/Moderate
(N = 69)
Severe
(N = 32)
P-value
Age (Mean, SD) 59.94 + 16.22 53.84 + 13.29 50.44 + 11.57 0.008*
Sex (%)
M
F
46.00
54.00
42.65
57.35
43.75
56.25
0.94
Smokers (%)
Yes
No
10.00
90.00
21.74
78.26
34.38
65.63
0.03*
* statistically significant at 5% level
I) Validation of the Enhanced Questionnaire
We used a continuous scale to assess our data so as to not loose information by
categorization. We used Pearson’s correlation coefficient and found evidence of
moderate to low concurrent validity for the sections on chronic stress and social support.
This was demonstrated by a weak positive association between both chronic stress and
the LEQ (p = 0.03) and between social support and the MSPSS questionnaire (p = 0.001).
There was a non-significant trend towards validity for the acute stress section of the
questionnaire. See Table 3.
Table 3: Pearson’s Correlation
Pearson’s Correlation P-value
Acute Stress vs. PSS
(N = 149)
0.14 0.09
Chronic Stress vs. LEQ
(N = 150)
0.19 0.02 *
Social Support vs. MSPSS
(N = 150)
0.27 0.001 *
* statistically significant at 5% level

26
Similar results were found using Spearman’s rank correlation coefficient (Table 4).
Table 4: Spearman’s Correlation
Spearman’s Correlation P-value
Acute Stress vs. PSS
(N = 149)
0.13 0.12
Chronic Stress vs. LEQ
(N = 150)
0.21 0.01*
Social Support vs. MSPSS
(N = 150)
0.23 0.005 *
* statistically significant at 5% level
II) Test-Retest Reliability of the Enhanced Questionnaire
Thirty-two participants (31.68%) of the 101 cases and 17 participants (34%) of the 50
controls were used in the test-retest component of this study (Table 5).
Table 5: Number of Participants for Test-retest Reliability Component of Study
Group N Number of
Participants
Percentage of
Participants
Cases 101 32 31.68 %
Controls 50 17 34 %
In order to analyze the proportion of variance in scores which were related to the true
variance we assessed the test-retest reliability using the Intraclass correlation coefficient
(Table 6).
27
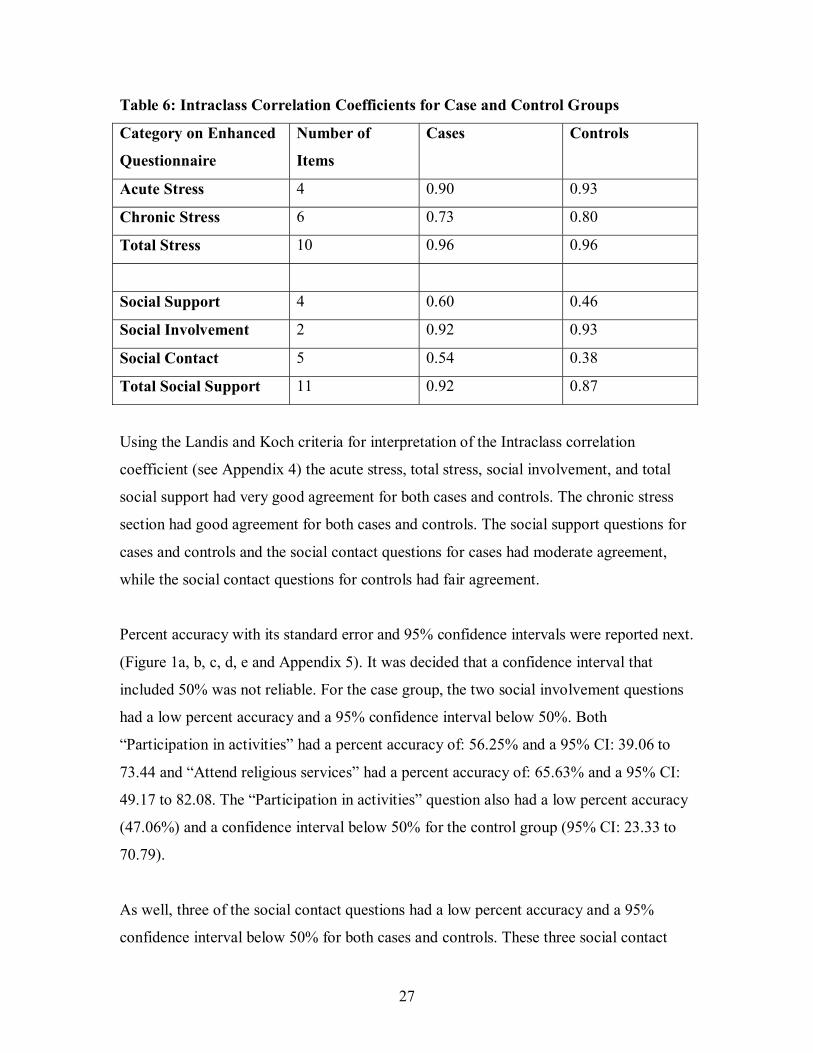
Table 6: Intraclass Correlation Coefficients for Case and Control Groups
Category on Enhanced
Questionnaire
Number of
Items
Cases Controls
Acute Stress 4 0.90 0.93
Chronic Stress 6 0.73 0.80
Total Stress 10 0.96 0.96
Social Support 4 0.60 0.46
Social Involvement 2 0.92 0.93
Social Contact 5 0.54 0.38
Total Social Support 11 0.92 0.87
Using the Landis and Koch criteria for interpretation of the Intraclass correlation
coefficient (see Appendix 4) the acute stress, total stress, social involvement, and total
social support had very good agreement for both cases and controls. The chronic stress
section had good agreement for both cases and controls. The social support questions for
cases and controls and the social contact questions for cases had moderate agreement,
while the social contact questions for controls had fair agreement.
Percent accuracy with its standard error and 95% confidence intervals were reported next.
(Figure 1a, b, c, d, e and Appendix 5). It was decided that a confidence interval that
included 50% was not reliable. For the case group, the two social involvement questions
had a low percent accuracy and a 95% confidence interval below 50%. Both
“Participation in activities” had a percent accuracy of: 56.25% and a 95% CI: 39.06 to
73.44 and “Attend religious services” had a percent accuracy of: 65.63% and a 95% CI:
49.17 to 82.08. The “Participation in activities” question also had a low percent accuracy
(47.06%) and a confidence interval below 50% for the control group (95% CI: 23.33 to
70.79).
As well, three of the social contact questions had a low percent accuracy and a 95%
confidence interval below 50% for both cases and controls. These three social contact
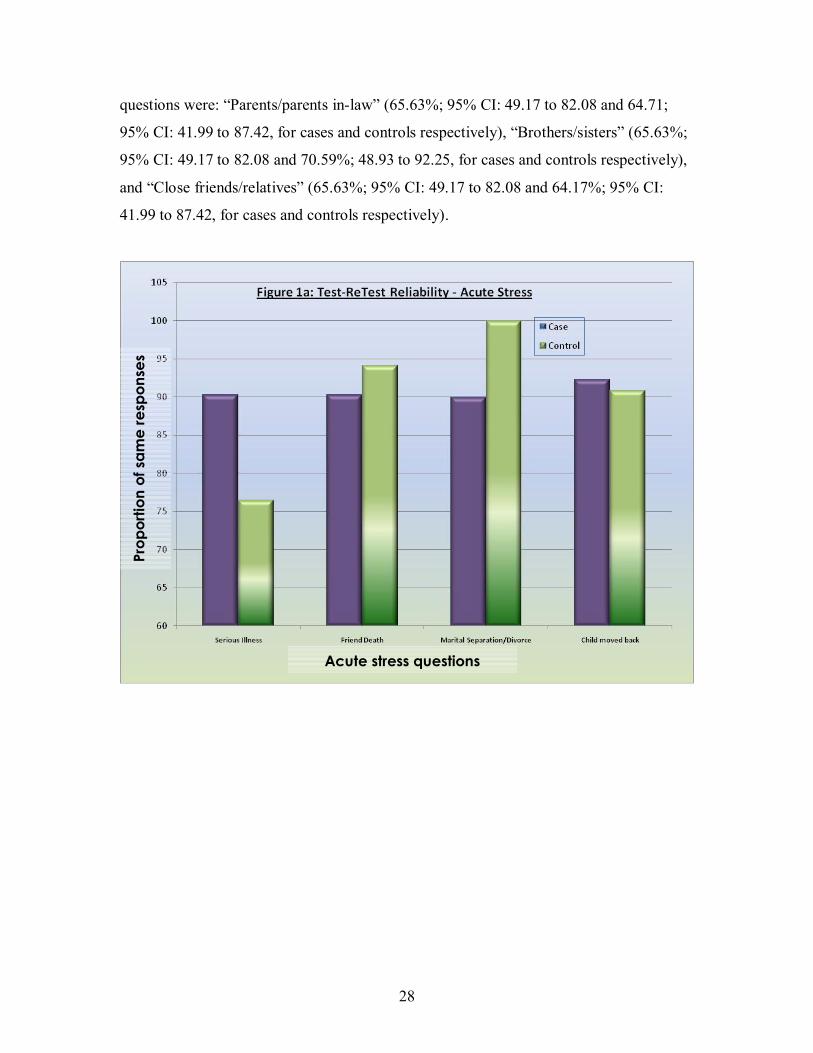
28
questions were: “Parents/parents in-law” (65.63%; 95% CI: 49.17 to 82.08 and 64.71;
95% CI: 41.99 to 87.42, for cases and controls respectively), “Brothers/sisters” (65.63%;
95% CI: 49.17 to 82.08 and 70.59%; 48.93 to 92.25, for cases and controls respectively),
and “Close friends/relatives” (65.63%; 95% CI: 49.17 to 82.08 and 64.17%; 95% CI:
41.99 to 87.42, for cases and controls respectively).
Prop
ortio
n of
sam
e re
spon
ses
Acute stress questions

29
Chronic stress questions
Prop
ortio
n of
sam
e re
spon
ses
Prop
ortio
n of
sam
e re
spon
ses
Social support questions

30
Overall, there was evidence to conclude that test-retest reliability was present for the
enhanced questionnaire for both cases and controls. Weaker question categories were
Social contact questions
Social involvement questions
Prop
ortio
n of
sam
e re
spon
ses
Prop
ortio
n of
sam
e re
spon
ses

31
social contact questions for the control group, which only had fair agreement. When
examining specific questions, weaker questions included the social involvement
questions: “Participation in activities” for the control group, “Attend religious services”
and “Participation in activities” for the case group, and the social contact questions
“Parents/parents in-law,” “Brothers/sisters,” and “Close friends/relatives” for both the
cases and control groups.
III) Preliminary Testing of the Relationship Between Stress, Social Support and
Chronic Periodontitis
Mean scores, standard deviations, and results of t-tests were reported in Tables 7 and 8
for stress and social support measures from the enhanced questionnaire. Data were
reported for cases, healthy controls, patients with mild/moderate, and patients with severe
chronic periodontitis.
Table 7: Mean Scores, Standard Deviations, and P-values for Case and Control
Groups
Category on
Enhanced
Questionnaire
Number
of Items
Possible Range
of Scores
Cases (N=101)
(mean score + SD)
Controls (N = 50)
(mean score + SD)
P-value
Acute Stress 4 0 - 4 0.46 + 0.73 0.40 + 0.61 0.64
Chronic Stress 6 0 - 6 2.31 + 1.73 2.14 + 1.65 0.57
Total Stress 10 0 - 10 2.76 + 1.94 2.54 + 1.81 0.50
Social Support 4 0 - 4 3.61 + 0.91 3.58 + 0.81 0.82
Social Involvement 2 0 - 8 2.68 + 2.51 2.68 + 2.53 0.99
Social Contact 5 0 - 20 10.96 + 4.28 9.00 + 2.51 0.001*
Total Social
Support
11 0 - 32 17.26 + 5.54 15.26 + 3.76 0.01*
* statistically significant at 5% level
32
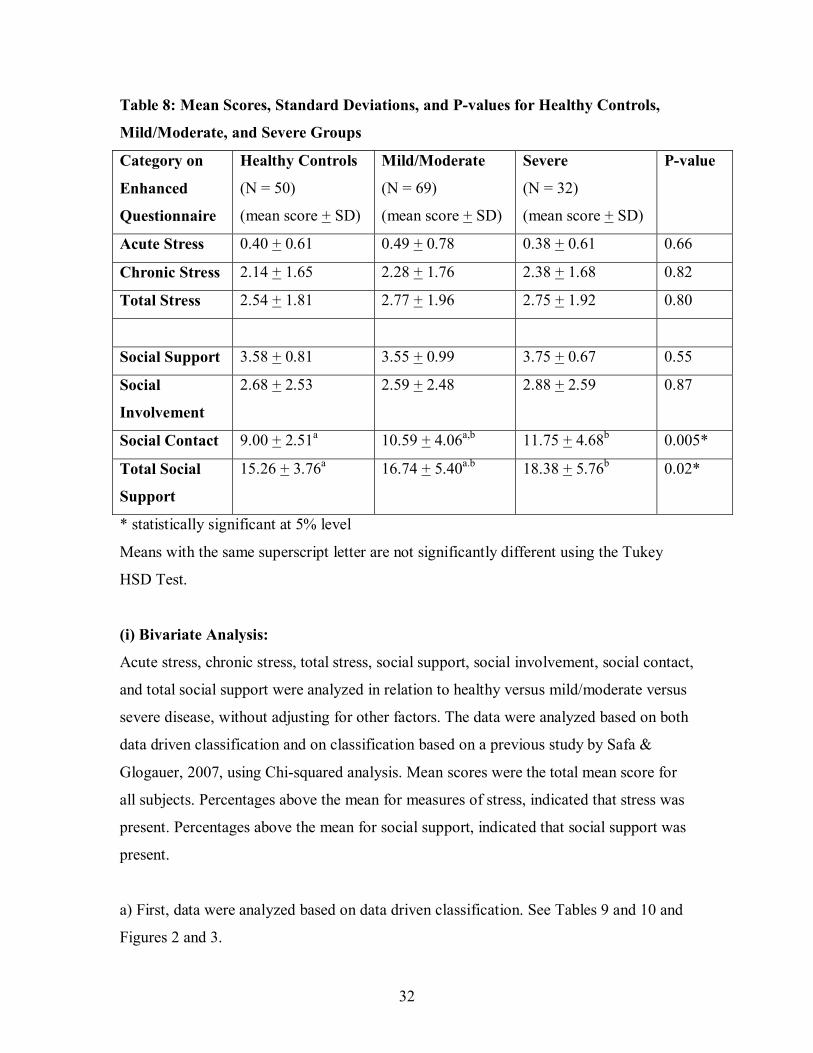
Table 8: Mean Scores, Standard Deviations, and P-values for Healthy Controls,
Mild/Moderate, and Severe Groups
Category on
Enhanced
Questionnaire
Healthy Controls
(N = 50)
(mean score + SD)
Mild/Moderate
(N = 69)
(mean score + SD)
Severe
(N = 32)
(mean score + SD)
P-value
Acute Stress 0.40 + 0.61 0.49 + 0.78 0.38 + 0.61 0.66
Chronic Stress 2.14 + 1.65 2.28 + 1.76 2.38 + 1.68 0.82
Total Stress 2.54 + 1.81 2.77 + 1.96 2.75 + 1.92 0.80
Social Support 3.58 + 0.81 3.55 + 0.99 3.75 + 0.67 0.55
Social
Involvement
2.68 + 2.53 2.59 + 2.48 2.88 + 2.59 0.87
Social Contact 9.00 + 2.51a 10.59 + 4.06a,b 11.75 + 4.68b 0.005*
Total Social
Support
15.26 + 3.76a 16.74 + 5.40a.b 18.38 + 5.76b 0.02*
* statistically significant at 5% level
Means with the same superscript letter are not significantly different using the Tukey
HSD Test.
(i) Bivariate Analysis:
Acute stress, chronic stress, total stress, social support, social involvement, social contact,
and total social support were analyzed in relation to healthy versus mild/moderate versus
severe disease, without adjusting for other factors. The data were analyzed based on both
data driven classification and on classification based on a previous study by Safa &
Glogauer, 2007, using Chi-squared analysis. Mean scores were the total mean score for
all subjects. Percentages above the mean for measures of stress, indicated that stress was
present. Percentages above the mean for social support, indicated that social support was
present.
a) First, data were analyzed based on data driven classification. See Tables 9 and 10 and
Figures 2 and 3.
33
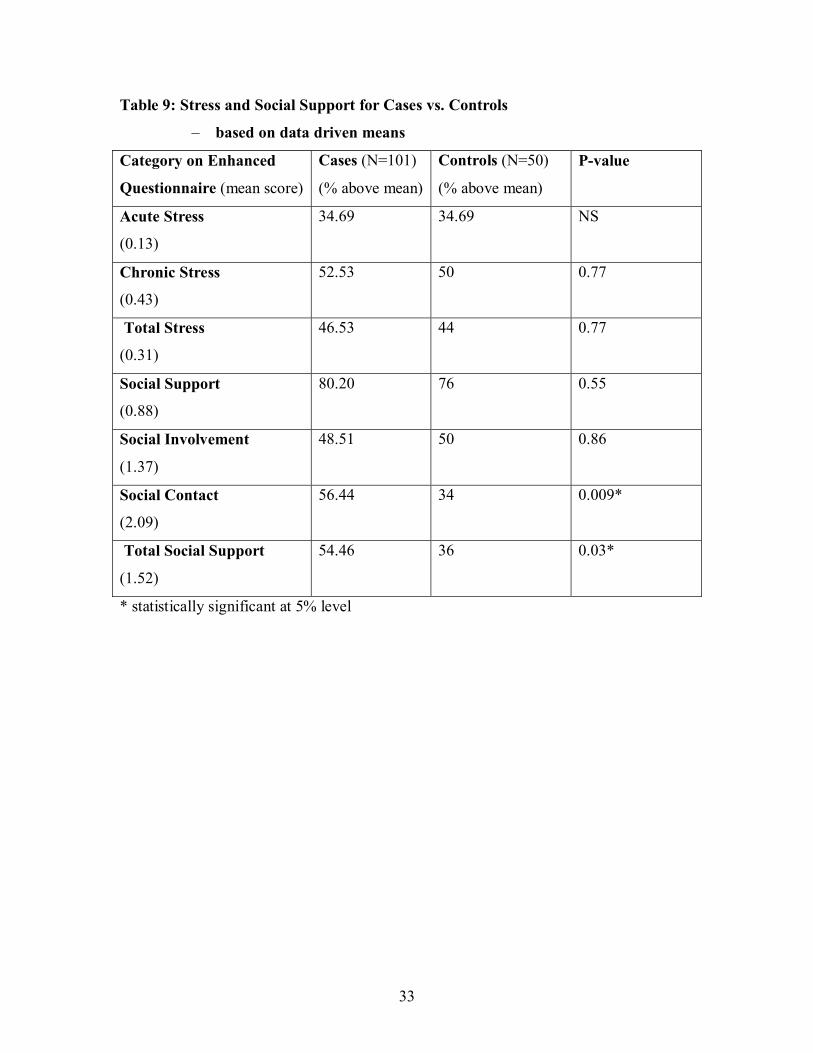
Table 9: Stress and Social Support for Cases vs. Controls
– based on data driven means
Category on Enhanced
Questionnaire (mean score)
Cases (N=101)
(% above mean)
Controls (N=50)
(% above mean)
P-value
Acute Stress
(0.13)
34.69 34.69 NS
Chronic Stress
(0.43)
52.53 50 0.77
Total Stress
(0.31)
46.53 44 0.77
Social Support
(0.88)
80.20 76 0.55
Social Involvement
(1.37)
48.51 50 0.86
Social Contact
(2.09)
56.44 34 0.009*
Total Social Support
(1.52)
54.46 36 0.03*
* statistically significant at 5% level
34
Table 10: Stress and Social Support for Healthy vs. Mild/Moderate vs. Severe
– based on data driven means
Category on Enhanced
Questionnaire
(mean score)
Healthy
(N=50)
(% above mean)
Mild/Moderate
(N=69)
(% above mean)
Severe
(N=32)
(% above mean)
P-value
Acute Stress
(0.13)
34.69 35.29 33.33 0.99
Chronic Stress
(0.43)
50 51.47 54.84 0.91
Total Stress
(0.31)
44 44.93 50 0.86
Social Support
(0.88)
76 78.26 84.38 0.66
Social Involvement
(1.37)
50 44.93 56.25 0.56
Social Contact
(2.09)
34 50.72 68.25 0.008*
Total Social Support
(1.52)
36 50.72 62.50 0.06
* statistically significant at 5% level
35
Perc
ent o
f sub
ject
s ab
ove
mea
n sc
ore
Sections of questionnaire
Perc
ent o
f sub
ject
s ab
ove
mea
n sc
ore
Sections of questionnaire

36
Chi-squared analysis of disease status using classified/dichotomized data derived from
means as above or below the mean on the enhanced questionnaire, showed no significant
association between acute stress, chronic stress, or total stress and disease status (p>0.05).
There was a trend, however, for cases and patients with more severe disease to have more
total stress than controls.
Chi-squared analysis demonstrated that social contact and total social support were
correlated significantly and positively with disease status. Patients in the ‘case’ group had
significantly more social contact (p = 0.009) and total social support (p = 0.03) than
patients in the control group. As well, patients with severe disease had more social
contact than those with mild/moderate disease, who had more social contact than those
who were healthy (p = 0.008).
b) Next, data was analyzed using the classification based on a previous study by Safa &
Glogauer 2007. See Tables 11 and 12 and Figures 4 and 5.
Table 11: Stress and Social Support for Cases and Controls
– based on Safa & Glogauer, 2007 driven means
Category on Questionnaire
(mean score)
Cases (N=101)
(% above mean)
Controls (N=50)
(% above mean)
P-value
Acute Stress
(0.12)
33.66 34 0.97
Chronic Stress
(0.61)
29.70 22 0.32
Social Support
(0.87)
80.20 76 0.55

37
Table 12: Stress and Social Support for Healthy vs. Mild/Moderate vs. Severe
– based on Safa & Glogauer, 2007 driven means
Category on
Questionnaire
(mean score)
Healthy
(N=50)
(% above mean)
Mild/Moderate
(N=69)
(% above mean)
Severe
(N=32)
(% above mean)
P-value
Acute Stress
(0.12)
34 34.78 31.25 0.94
Chronic Stress
(0.61)
22 28.99 31.25 0.59
Social Support
(0.87)
76 78.26 84.38 0.66
Perc
ent o
f sub
ject
s ab
ove
mea
n sc
ore
Sections of questionnaire

38
Chi-squared analysis of disease status using the classification based on a previous study
by Safa & Glogauer 2007, showed no significant association between stress or social
support and disease status (p>0.05).
Perc
ent o
f sub
ject
s ab
ove
mea
n sc
ore
Sections of questionnaire

39
c) Data were then analyzed to investigate the association between stress and social
support, using Chi-squared analysis. See Table 13.
Table 13: Association Between Stress and Social Support
Social Support (%) No Social Support (%) P-value
Acute Stress
(N=51)
49.02 50.98
No Acute Stress
(N=96)
48.96 51.04 0.99
Chronic Stress
(N=77)
37.66 62.34
No Chronic Stress
(N=72)
59.72 40.28 0.007*
Total Stress
(N=69)
36.23 63.77
No Total Stress
(N=82)
58.54 41.46 0.006*
* statistically significant at 5% level
When analyzing the combined data for all cases and controls, no significant association
between acute stress and social support (p = 0.99) was found. Both chronic stress and
total stress showed a significant association with social support (p = 0.007 and p = 0.006,
respectively). The above findings showed that 59.72% of subjects who had social support
scores above the mean (high social support) had chronic stress scores below the mean
(low stress), while 62.34% of subjects who had social support scores below the mean
(low social support) had chronic stress scores above the mean (high stress). Accordingly,
58.54% of subjects who had social support scores above the mean (high social support)
had total stress scores below the mean (low stress), while 63.77% of subjects who had
40
social support scores below the mean (low social support) had total stress scores above
the mean (high stress).
Overall, there was a significant, inverse, association between social support and chronic
and total stress. Subjects who had increased social support had decreased chronic and
total stress, while subjects who had decreased social support had increased chronic and
total stress. There was no significant association between social support and acute stress.
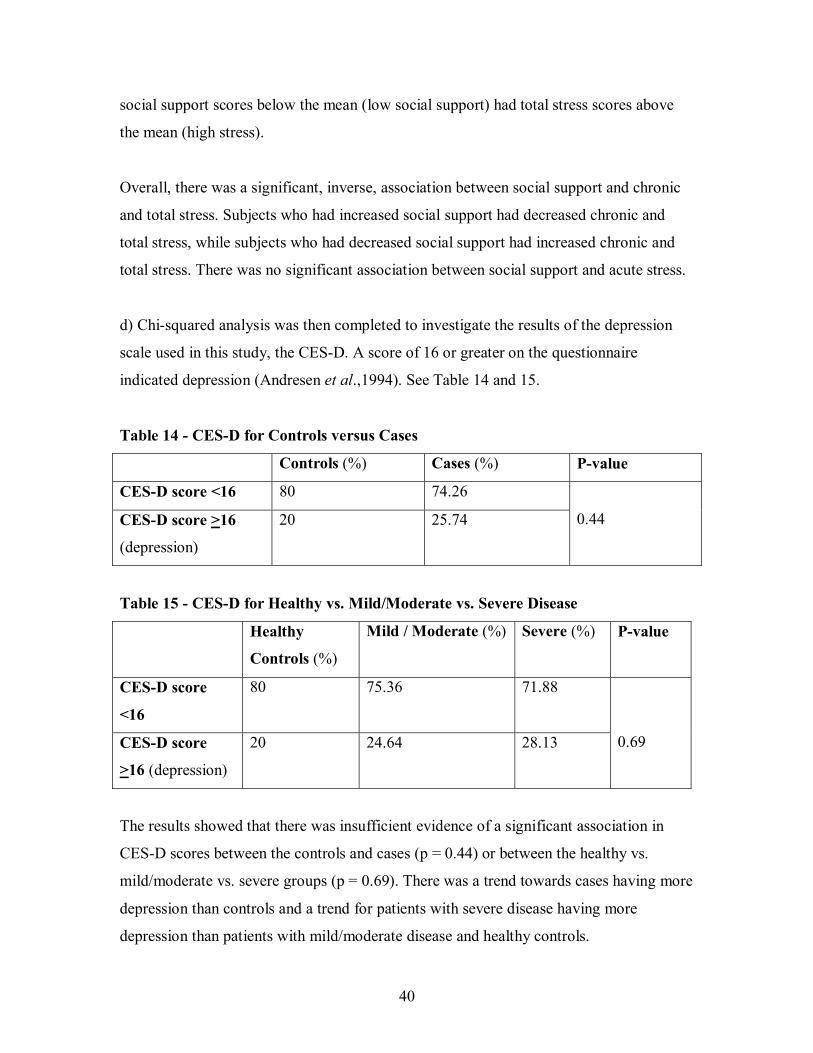
d) Chi-squared analysis was then completed to investigate the results of the depression
scale used in this study, the CES-D. A score of 16 or greater on the questionnaire
indicated depression (Andresen et al.,1994). See Table 14 and 15.
Table 14 - CES-D for Controls versus Cases
Controls (%) Cases (%) P-value
CES-D score <16 80 74.26
CES-D score >16
(depression)
20 25.74
0.44
Table 15 - CES-D for Healthy vs. Mild/Moderate vs. Severe Disease
Healthy
Controls (%)
Mild / Moderate (%) Severe (%) P-value
CES-D score
<16
80 75.36 71.88
CES-D score
>16 (depression)
20 24.64 28.13
0.69
The results showed that there was insufficient evidence of a significant association in
CES-D scores between the controls and cases (p = 0.44) or between the healthy vs.
mild/moderate vs. severe groups (p = 0.69). There was a trend towards cases having more
depression than controls and a trend for patients with severe disease having more
depression than patients with mild/moderate disease and healthy controls.

41
(ii) Multivariate Analysis:
Acute stress, chronic stress, total stress, social support, social involvement, social contact,
and total social support were entered into logistic regression equations which provided
odds ratios (controlling for other variables) and were evaluated in relation to cases versus
controls, mild/moderate disease versus healthy patients, and severe disease versus healthy
patients. All variables were dichotomized at their mean scores. The goodness of fit of the
models was checked and it was found that the fit was good for the models.
Multivariate Analysis for Cases versus Controls
The odds ratios comparing cases to controls are presented in Table 16 for stress and
social support variables. Those with social contact were 2.31 times more likely to be
cases as compared to controls (p = 0.04). Also those with total social support were 2.35
times more likely to be cases as compared to controls (p = 0.03). These differences were
statistically significant.
Table 16: Logistic Regression Analysis – Cases vs. Controls
Parameter Adjusted OR* P-value
Acute Stress 1.67 0.24
Chronic Stress 1.15 0.74
Total Stress 1.14 0.76
Social Support 1.21 0.69
Social
Involvement
0.95 0.89
Social Contact 2.31 0.04**
Total Social
Support
2.35 0.03**
*from separate models controlling for: age, gender, smoking status and
either stress or social support.
** statistically significant at 5% level

42
Multivariate Analysis for Mild/Moderate Disease versus Healthy
The odds ratios comparing mild/moderate disease versus healthy are presented in Table
17 for stress and social support variables. There were no significant associations in this
analysis.
Table 17: Logistic Regression Analysis –Mild/Moderate Disease vs. Healthy
Parameter Adjusted
OR*
P-value
Acute Stress 1.84 0.19
Chronic Stress 1.09 0.84
Total Stress 1.11 0.87
Social Support 1.04 0.95
Social
Involvement
0.85 0.69
Social Contact 1.84 0.15
Total Social
Support
1.90 0.13
* from separate models controlling for: age, gender, smoking status and
either stress or social support.

43
Multivariate Analysis for Severe Disease versus Healthy
The odds ratios comparing severe disease versus healthy are presented in Table 18 for
stress and social support variables. Patients with social contact were 5.26 times more
likely to have severe disease as opposed to being healthy (p = 0.007). Also patients with
total social support were 5.75 times more likely to have severe disease as opposed to
being healthy (p = 0.008). These differences were statistically significant.
Table 18: Logistic Regression Analysis –Severe Disease vs. Healthy
Parameter Adjusted
OR*
P-value
Acute Stress 1.12 0.86
Chronic Stress 1.31 0.67
Total Stress 1.11 0.87
Social Support 1.85 0.38
Social
Involvement
1.48 0.47
Social Contact 5.26 0.007**
Total Social
Support
5.75 0.008**
* from separate models controlling for: age, gender, smoking status and
either stress or social support.
** statistically significant at 5% level
Overall, when the data were analyzed using multivariate analyses, it showed that there
was insufficient evidence to confirm a meaningful association between stress and
periodontal disease status. There was evidence of an association between social contact
and total social support with disease status when controls and cases were compared as
well as when healthy controls and patients with severe disease were compared. Patients in
both the case and severe disease categories had significantly more social contact and total
social support than healthy controls.

44
DISCUSSION
Questionnaires designed to investigate acute and chronic stressors, depression and social
support among patients with periodontal disease were utilized in this study. Statistical
analysis of the data collected from individuals with and without disease was performed to
validate our enhanced questionnaire and to establish a relationship between periodontal
disease status and levels of stress, depression and social support. The results and
limitations of this study are discussed below.
I) Questionnaire
Our primary objective was to determine both the validity and the test-retest reliability of
our enhanced questionnaire designed to specifically measure levels of stress and social
support in patients with chronic periodontitis. Overall, our data showed that the sections
on chronic stress and social support were valid and that the section on acute stress
revealed a trend towards being validated. Furthermore, the questionnaire’s test-retest
reliability for both the case group and the control group was conclusive.
Our secondary objective was to test our enhanced questionnaire in combination with the
CES-D in order that we may establish a relationship between stress, depression and social
support in patients with chronic periodontitis.
Initially, we sought to determine if patients with chronic periodontitis were under
increased stress and showed more depressive symptoms compared to healthy controls.
Previous work has suggested that stress, when in combination with bacteria and dental
plaque-induced inflammation, triggers a sustained and inappropriate HPA axis response,
a SAM axis response, a release of neuropeptides, and / or behavioral changes. It has been
hypothesized that these changes when taken together may increase the susceptibility of an
individual to periodontal disease. (Page, 1991; Genco et al., 1998; Monterio da Silva et
al., 1995, Hugoson et al., 2002). Similarly, depression has also been shown to be related
to chronic periodontal disease (Olff, 1999; Ng & Leung, 2006). However, in our study,
both bivariate and multivariate analyses showed that there was no significant association
between stress or depression and chronic periodontitis. That being said, there was a trend

45
for patients with periodontal disease to have more total stress and more depression than
those without disease. Incidentally, patients with severe disease tended to have greater
levels of total stress and more depression than patients with mild/moderate disease.
Bivariate analysis did however show a significant inverse association between social
support and both chronic stress and total stress. Patients who had increased social support
had decreased chronic and total stress whereas patients who had decreased social support
had increased chronic and total stress.
Next we wanted to establish whether differences in the level of social support existed
between these patients. Cohen and Syme in 1985 indicated that the social support of an
individual, regardless of that person’s level of stress, may directly enhance their health
and well-being. Alternatively, social support may act as a buffer thereby reducing or
eliminating the effects of the stressful experience (Cohen & Syme, 1985). In this study,
bivariate and multivariate analyses showed that both cases and patients with severe
disease had significantly more social contact and total social support than patients
without periodontal disease. Surprisingly, this finding refutes our third hypothesis.
The reasons for our inability to show a statistically significant difference in stress and
depression between patients with and without disease and that patients with disease had
significantly more social support than those without, could be explained by our patient
demographics. Our bivariate analyses did not control for the fact that patients without
disease were both older and smoked more than those with disease. By comparison,
smoking and age were controlled for in our multivariate analysis which showed acute
stress to have a trend toward significance (increased acute stress in diseased patients) in
both the case versus control analysis (p = 0.24) and the healthy versus mild/moderate
disease analysis (p = 0.19).
An accurate understanding of the risks and modifying factors of chronic periodontitis are
key to it’s successful clinical management. Unfortunately, dentists and specialists alike
have not been properly trained to effectively assess the psyche of a patient. Kloostra et
al. reported that periodontists are neither knowledgeable nor confident in their abilities to

46
treat patients with stress and in particular those patients who are clinically depressed
(Kloostra et al., 2007). Thus, validated questionnaires designed to assist a dental care
professional in the determination of a patient’s psychosocial condition would be useful
for the management of chronic periodontitis in routine dental or periodontal practice.
II) Limitations of the Study
It could be argued that PNI markers of stress should replace the use of questionnaires
when measuring a person’s mental health. However, such tests are not practical in a
clinical setting and would likely increase the cost of care substantially. By contrast,
questionnaires could be routinely used by dentists as a means of collecting pertinent
information about a patient’s stress level in nonintrusive way. Moreover, the collection of
such information would enable the dentist to take into account a patient’s stress during
the course of periodontal treatment. It is equally important to take into account people’s
perceptions of each event as the total number of life events may not be related to any
health outcome variable. This should be attainable by way of the questionnaire.
Interestingly, this may explain why some studies fail to demonstrate an association
between life-events and health (Croucher et al., 1997).
A true limitation of our study was our working definition of disease. Regrettably, studies
that examine the relationship between chronic periodontitis and stress and/or social
support utilize different criteria when defining the disease state. For example, some use
the criteria proposed by Machtei et al., 1992, which defines established periodontitis as
two or more individual teeth with CAL of >6mm and who also have one or more sites
with PD >5mm (Linden et al., 1996; Moss et al., 1996). In our study, a patient was
classed as having mild/moderate disease if they had fewer than 10 pockets with a PD
greater than 5 mm. Those classed as severe had more than 10 pockets with a PD greater
than 5 mm (Mancini et al., 1999). Patients with no clinical signs of periodontal disease
(no PD > 5mm) were classed as having no disease and treated as controls. It is this
inconsistency in defining disease status may have limited our ability to generalize our
findings.

47
Self-reported personal information which can be perceived as sensitive and thus, makes it
difficult to collect, was also considered a limitation of our study for several reasons. First,
our study was voluntary. Second, it is likely that some of the respondents choose to either
under-report or over-report. Third, a social desirability bias may have also been
introduced as there is a tendency of respondents to reply in a manner that will be viewed
favorably by others.
Individual perceptions of social strain and measures of physiologic distress may not
always equate with one another. An individual may readily report high levels of strain but
will be functioning at a very healthy level whereas an individual who reports low levels
of strain may be physiologically distressed. Thus, despite the complexity of an
individual’s social environment, every effort should be made to uncover common
patterns of social characteristics and circumstances (Moss et al., 1996). Perhaps the
questionnaire used in our study failed to adequately determine how respondents function
with their level of stress.
A final limitation may have been the fact that the patient’s stress response reported
reflected only recent symptoms and therefore was not related to the observed periodontal
disease which is a chronic event (Peruzzo et al., 2007). It is possible that the respondents
in this study consisted of patients at various stages of the periodontal disease process and
that symptoms of stress reported may not have correlated with disease status.

48
SUMMARY AND FUTURE DIRECTION
In summary, we demonstrated both the validity and the reliability of our enhanced
questionnaire designed to measure the level of stress and social support in patients with
chronic periodontitis. Furthermore, this questionnaire when administered in combination
with the CES-D, revealed a trend for cases and patients with more severe disease to have
increased total stress and depression compared with those without disease. There was
also a significant inverse association between social support and both chronic and total
stress which proves that stress-reduction protocols have some value in the management of
periodontal disease.
This questionnaire, if administered with the CES-D, could be used to by dental care
professionals to assess the levels of stress, depression and social support seen in patients
with periodontal disease. We hypothesize that this would help to establish both the
etiology and the prognosis of the disease.
Future research should further validate the acute stress section of our questionnaire and
be tested alongside the CES-D with a larger sample size and more consistent
demographics. In doing so, we speculate that an association between stress, depression,
social support and chronic periodontal disease would be revealed. Following
confirmation of these associations by longitudinal studies, it would be advised that such a
questionnaire be incorporated into patient charts so as to permit a more holistic approach
to the management of chronic periodontitis.

49
CONCLUSIONS
- Our enhanced questionnaire provides a valid and a reliable measure of stress and
social support in patients with chronic periodontitis.
- There was a trend for cases and patients with more severe disease to have
increased total stress and increased depression compared to healthy controls.
- There was a significant inverse association between social support and both
chronic and total stress.

50
APPENDIX 1 – QUESTIONNAIRE PACKAGE
INFORMATION AND CONSENT FORM
STRESS AND SOCIAL SUPPORT STUDY INVESTIGATORS: DRS. JILL LEVINE AND MICHAEL GLOGAUER
DEPARTMENT OF PERIODONTOLOGY, FACULTY OF DENTISTRY, UNIVERSITY OF TORONTO
INTRODUCTION: This research project is being carried out in the Department of Periodontology at the Faculty of Dentistry, University of Toronto. Dr. Glogauer is the supervising faculty member for this project. Dr. Levine is a dentist as well as graduate student in the Department of Periodontology. You have been asked to participate in this study because you are currently a patient in one of the clinics of the Faculty of Dentistry. PURPOSE: The purpose of this study is to assess the relationship of stress and social support to periodontal disease. The information obtained from patients taking part in this study may be valuable to future diagnosis, treatment and management of this disease. PROCEDURES: The project asks that you complete questionnaires on social support, stress, and depression. Information about your medical and dental history will also be obtained from your chart. You will be given a questionnaire to fill out in the future for comparison. RISKS OF PARTICIPATION: Since these are questionnaires on stress, social support, and depression, there exists the risk of upset of the participant. Please refer to the List of Resources on page three. There is no direct benefit to the participant, as the information gathered from this study may be valuable for future research. BENEFITS OF PARTICIPATION: It is expected that the information obtained from patients taking part in this study may be valuable for a better understanding of periodontal disease. By participating in this study you will be contributing to the production of new and potentially illuminating knowledge about periodontal disease. CONFIDENTIALITY: You will not be identified in any way. The questionnaire is coded and will not contain your name or any identifying feature, except a number code. The information that you provide will be coded and summarized with the information from all other patients taking part in this study. PARTICIPATION: Your participation in this study is strictly voluntary. Not participating will have no bearing on the treatment you receive or access to future treatment. You may leave the study at any time without consequence. If you wish to participate, please sign the consent form that follows.

51
QUESTIONS: If you have questions about your rights as a research subject, you may contact Dr. Rachel Zand, Manager, Research Ethics Office, telephone 416-946-3389. CONSENT: I acknowledge that the research procedures described on the attached form, and of which I have a copy, have been explained to me and that any questions that I have asked have been answered to my satisfaction. I have been informed of the alternatives to participation in this study. I know that I may ask now, or in the future, any questions I have about the study or the research procedure. I understand that while I will not benefit directly from the study, the information gained may assist both researchers and education professionals to better understand periodontal disease. I have been assured that records relating to my care will be kept confidential and that no information will be released or printed that would disclose my personal identity without my permission. I understand that I am free to withdraw from the study at any time. I further understand that if the study is not completed, or there is withdrawal from it at any time, the quality of dental care for me will not be affected. I hereby consent to participate. _______________________ ____________________ ____________ Patient’s name (Please Print) Patient’s Signature Date
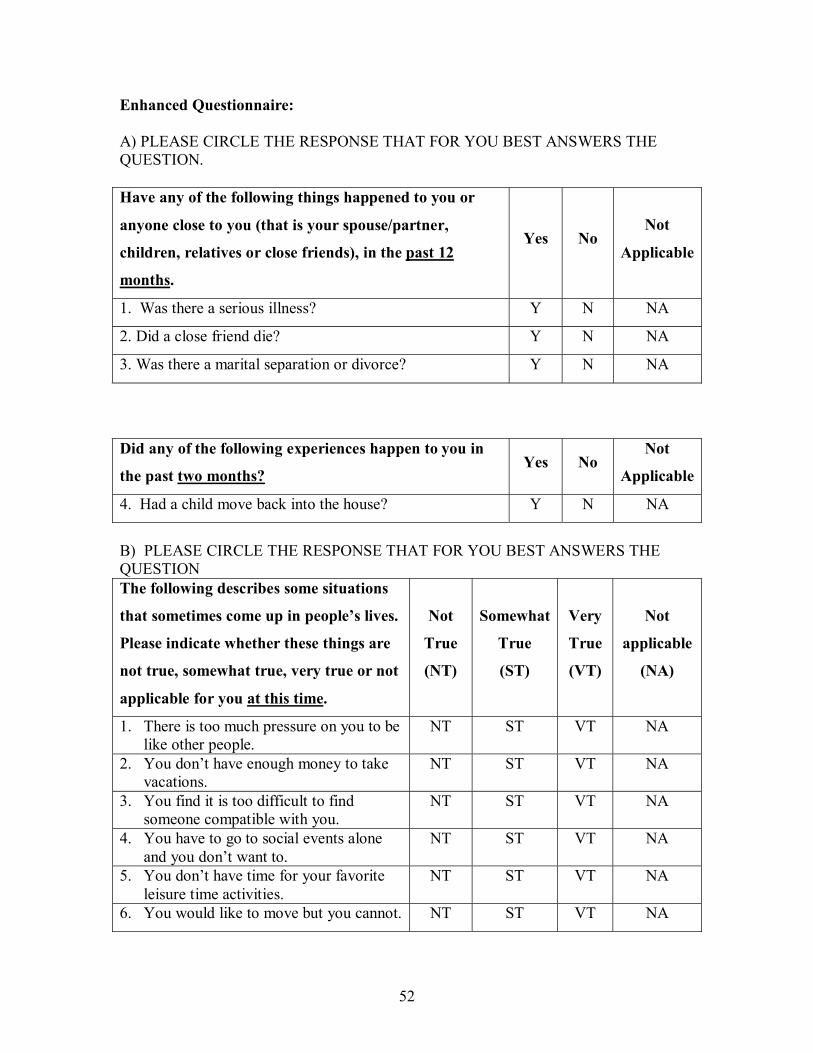
52
Enhanced Questionnaire: A) PLEASE CIRCLE THE RESPONSE THAT FOR YOU BEST ANSWERS THE QUESTION. Have any of the following things happened to you or
anyone close to you (that is your spouse/partner,
children, relatives or close friends), in the past 12
months.
Yes No Not
Applicable
1. Was there a serious illness? Y N NA
2. Did a close friend die? Y N NA
3. Was there a marital separation or divorce? Y N NA
Did any of the following experiences happen to you in
the past two months? Yes No
Not
Applicable
4. Had a child move back into the house? Y N NA
B) PLEASE CIRCLE THE RESPONSE THAT FOR YOU BEST ANSWERS THE QUESTION The following describes some situations
that sometimes come up in people’s lives.
Please indicate whether these things are
not true, somewhat true, very true or not
applicable for you at this time.
Not
True
(NT)
Somewhat
True
(ST)
Very
True
(VT)
Not
applicable
(NA)
1. There is too much pressure on you to be like other people.
NT ST VT NA
2. You don’t have enough money to take vacations.
NT ST VT NA
3. You find it is too difficult to find someone compatible with you.
NT ST VT NA
4. You have to go to social events alone and you don’t want to.
NT ST VT NA
5. You don’t have time for your favorite leisure time activities.
NT ST VT NA
6. You would like to move but you cannot. NT ST VT NA

53
C) PLEASE CIRCLE THE ANSWER THAT FOR YOU BEST DESCRIBES THE QUESTION. YES NO
Do you have someone you can confide in or talk to about your private feelings or concerns?
Y N
Do you have someone you can really count on to help you out in a crisis situation? Y N
Do you have someone you can really count on to give you advice when you are making important personal decisions?
Y N
Do you have someone who makes you feel loved and cared for? Y N
PLEASE PUT A CHECK MARK IN THE COLUMN THAT BEST DESCRBIES YOUR RESPONSE.
Not at all
At least once a year
At least 3 or 4
times a year
At least once a month
At least once a week
How often did you participate in meetings or activities sponsored by voluntary organizations or associations (such as school groups, church social groups, civic, or fraternal clubs) in the past 12 months? If you belong to many, just think of the ones in which you are most active.
Other than on special occasions (such as weddings, funerals or baptisms), how often did you attend religious services or religious meetings in the past 12 months?
The next few questions are about contact in the past 12 months with persons who do not live with you. Contact could either be in person, by phone, by mail or e-mail. If you have more than one person in a category – for example, several sisters- think of the one with whom you have the most contact. How often did you have contact with (fill each line with the categories below)?
_____Your parents or parents-in-law _____Your grandparents _____Your children and/or their spouses _____Your brothers or sisters _____Your close friends and/or other relatives
0= don’t have any 1= never 2= less than once a month 3= once a month 4= more than once a month

54
Center for Epidemiologic Studies Depression Scale Below is a list of the ways you might have felt or behaved. Please tell me how often you have felt this way during the past week. 1 = Rarely or none of the time (less than 1 day). 2 = Some or a little of the time (1-2 days). 3 = Occasionally or a moderate amount of time (3-4 days). 4 = Most or all of the time (5-7 days).
DURING THE PAST WEEK: _____ 1. I was bothered by things that usually don’t bother me.
_____ 2. I did not feel like eating; my appetite was poor.
_____ 3. I felt that I could not shake off the blues even with help from my
family or friends.
_____ 4. I felt that I was just as good as other people.
_____ 5. I had trouble keeping my mind on what I was doing.
_____ 6. I felt depressed.
_____ 7. I felt that everything I did was an effort.
_____ 8. I felt hopeful about the future.
_____ 9. I thought my life had been a failure.
_____ 10. I felt fearful.
_____ 11. My sleep was restless.
_____ 12. I was happy.
_____ 13. I talked less than usual.
_____ 14. I felt lonely.
_____ 15. People were unfriendly.
_____ 16. I enjoyed life.
_____ 17. I had crying spells.
_____ 18. I felt sad.
_____ 19. I felt that people disliked me.
_____ 20. I could not get “going.”

55
Perceived Stress Scale
The questions in this scale ask you about your feelings and thoughts during the last month. In each case, you will be asked to indicate how often you felt or thought a certain way. Although some of the questions are similar, there are differences between them and you should treat each one as a separate question. The best approach is to answer each question fairly quickly. That is, don’t try to count up the number of times you felt a particular way, but rather indicate the alternative that seems like a reasonable estimate.
For each question choose from the following alternatives: 0. Never 1. Almost never 2. Sometimes 3. Fairly often 4. Very often
_____ 1. In the last month, how often have you been upset because of something that
happened unexpectedly? _____ 2. In the last month, how often have you felt that you were unable to control the
important things in your life? _____ 3. In the last month, how often have you felt nervous and stressed? _____ 4. In the last month, how often have you dealt successfully with irritating life
hassles? _____ 5. In the last month, how often have you felt that you were effectively coping
with important changes that were occurring in your life? _____ 6. In the last month, how often have you felt confident about your ability to
handle your personal problems? _____ 7. In the last month, how often have you felt that things were going your way? _____ 8. In the last month, how often have you found that you could not cope with all
the things that you had to do? _____ 9. In the last month, how often have you been able to control irritations in your
life? _____ 10. In the last month, how often have you felt that you were on top of things? _____ 11. In the last month, how often have you been angered because of things that
happened that were outside of your control? _____ 12. In the last month, how often have you found yourself thinking about things
that you have to accomplish? _____ 13. In the last month, how often have you been able to control the way you spend
your time? _____ 14. In the last month, how often have you felt difficulties were piling up so high
that you could not overcome them?

56
Life Events Questionnaire Have any of the following life events or problems happened to you during the last 6 months? Please check the box or boxes corresponding to the month or months in which any event happened or began. 1
month ago
2 months ago
3 months ago
4 months ago
5 months ago
6 months ago
N/A
1. You yourself suffered a serious illness, injury, or an assault.
2. A serious illness, injury, or assault happened to a close relative.
3. Your parent, child, or spouse died.
4. A close family friend or another relative (aunt, cousin, grandparent) died.
5. You had a separation due to marital difficulties.
6. You broke off a steady relationship.
7. You had a serious problem with a close friend, neighbor, or relative.
8. You became unemployed or you were seeking work unsuccessfully for more than one month.
9. You were fired from your job.
10. You had a major financial crisis.
11. You had problems with the police and a court appearance.
12. Something you valued was lost or stolen.

57
Multidimensional Scale of Perceived Social Support Read each statement carefully. Indicate how you feel about each statement by circling the appropriate number using the following scale: 1 = Very strongly disagree 2 = Strongly disagree. 3 = Mildly disagree. 4 = Neutral. 5 = Mildly agree. 6 = Strongly agree. 7 = Very strongly agree.
1. There is a special person who 1 2 3 4 5 6 7 is around when I am in need. 2. There is a special person with 1 2 3 4 5 6 7 whom I can share joys and sorrows. 3. My family really tries to help me. 1 2 3 4 5 6 7 4. I get the emotional help and 1 2 3 4 5 6 7 support I need from my family. 5. I have a special person who is a 1 2 3 4 5 6 7 real source of comfort to me. 6. My friends really try to help me. 1 2 3 4 5 6 7 7. I can count on my friends when 1 2 3 4 5 6 7 things go wrong. 8. I can talk about my problems 1 2 3 4 5 6 7 with my family. 9. I have friends with whom I can 1 2 3 4 5 6 7 share my joys and sorrows. 10. There is a special person in my 1 2 3 4 5 6 7 life who cares about my feelings. 11. My family is willing to help 1 2 3 4 5 6 7 me make decisions. 12. I can talk about my problems 1 2 3 4 5 6 7 with my friends.

58
APPENDIX 2 – Calibration
Calibration Methods:
The purpose of calibration was to develop standardized measuring techniques to ensure
that one is scoring the same condition the same way every time it is observed. The first
and second year Graduate Periodontal Residents at the Faculty of Dentistry, University of
Toronto were calibrated in order to help ensure inter-examiner reliability when assessing
patients that were to be included in this study.
The calibration training schedule consisted of an introduction to calibration by means of a
presentation and a calibration manual. Next, there was a session in which there was a
question and answer period about the calibration measures and practice with a scale in
order to calibrate the amount of probing force used during assessments. The amount of
force that everyone was calibrated to was 0.25 N (Armitage, 2004). Calibration was
performed on patients on two separate occasions. Three residents were calibrated on the
first day and three other residents were calibrated on the second day. All residents were
calibrated to the same gold standard, an assistant professor and head of Periodontology at
the Faculty of Dentistry.
The inclusion criteria for admission of patients into the calibration exercise were: 1) good
health, 2) minimum of 5 teeth/quadrant, 3) mild/moderate or severe chronic periodontitis,
and 4) two or more non-adjacent sites in a posterior sextant with greater or equal to 2mm
CAL and greater or equal to 5mm PD.
The exclusion criteria for patients in the calibration exercise were: 1) antibiotic
prophylaxis, 2) poor cooperation, 3) clinically significant chronic or acute illness (AIDS,
herpes, cardiovascular diseases, uncontrolled diabetes, etc), and 4) PD greater or equal to
10mm, grade 3 furcation and/or grade 3 mobility.

59
The nine clinical measurements that were performed for calibration were: Gingival index
(GI), Plaque index (PI), PD, Recession (Rec), CAL, Bleeding index (BI), Furcation
(Furc), Mobility (Mob), and Amount of attached gingiva (AG) (Lenton, 1997).
Examiners conducted patient examinations such that the gold standard performed an
examination on three quadrants in each patient, and each resident examined one random
quadrant per patient. Care was taken to ensure that each resident had an opportunity to
examine all quadrants and that the number of examinations for a given quadrant was
balanced across examiners, so that each quadrant was measured no more than twice.
After all calibration sessions, the data was compiled and statistical analysis carried out to
compare inter-examiner reliability between each resident and the gold standard. The
results were analyzed to see if each resident was calibrated or if there was need for any
further training.
Clinical Measurements for Calibration: (1) GI 0 Absence of inflammation.
1 Mild inflammation – slight change in colour and little change in texture.
2 Moderate inflammation – moderate glazing, redness, edema, and hypertrophy.
Bleeding on pressure.
3 Severe inflammation – marked redness and hypertrophy. Tendency to spontaneous bleeding. Ulceration.

60
(2) PI **Plaque index is determined by thickness of plaque in a buccal/lingual orientation. 0 No plaque in gingival area.
1 A film of plaque adhering to the free gingival margin and adjacent area of the
tooth. The plaque may be seen in situ by using the probe on the tooth surface.
2 Moderate accumulation of soft deposits within the gingival pocket or on the adjacent tooth surface and gingival margin which can be seen with the naked eye.
3 Abundance of soft matter within the gingival pocket and/or on the adjacent tooth surface and gingival margin (1-2mm thick).
(3) PD
Record probing depth at the deepest site at each of: distobuccal, mid-buccal, mesiobuccal, distolingual, mid-lingual, and mesiolingual areas.
(4) Rec
Each measure of recession (FGM to CEJ measurement) will be recorded immediately following the probing depth measurement at the same location.
Positive Number When the FGM is located apical to the CEJ.
Negative Number When the FGM is located coronal to the CEJ.
Zero When the FGM is located at the CEJ.
(5) CAL CAL = probing depth plus distance from free gingival margin to cemento-enamel junction. (6) BI 0 No evidence of bleeding following probing.
1 Evidence of bleeding within 15 seconds of probing.
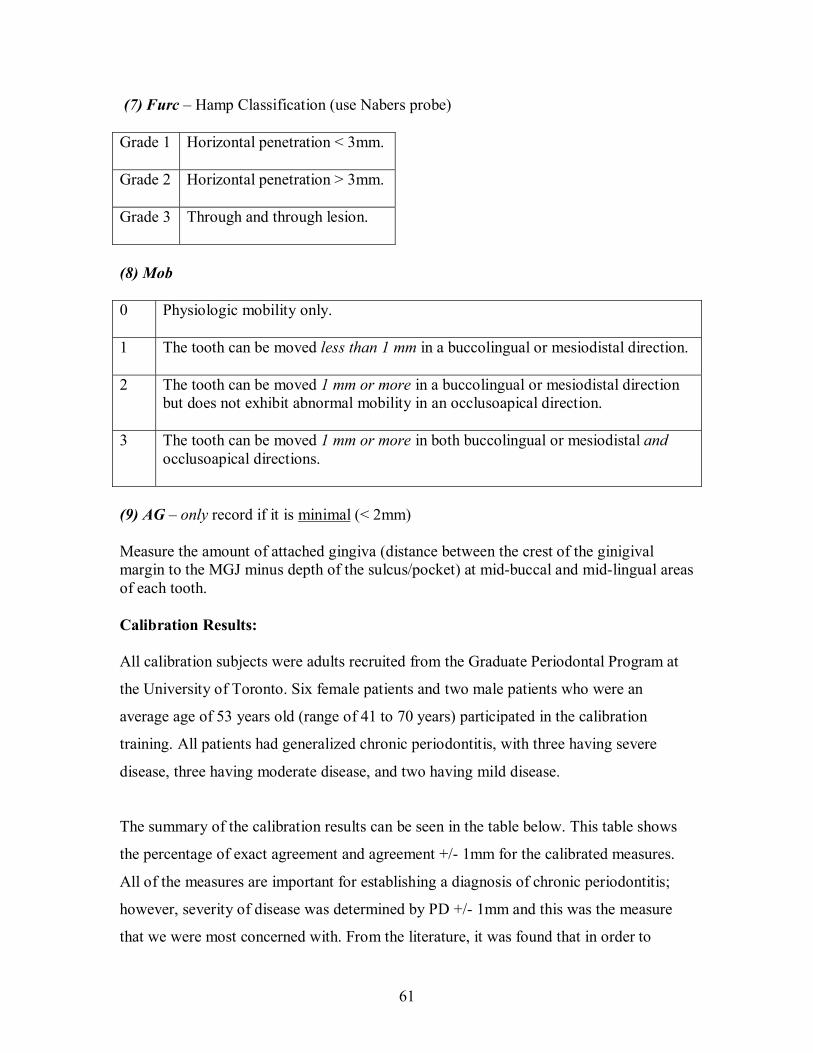
61
(7) Furc – Hamp Classification (use Nabers probe) Grade 1 Horizontal penetration < 3mm.
Grade 2 Horizontal penetration > 3mm.
Grade 3 Through and through lesion.
(8) Mob 0 Physiologic mobility only.
1 The tooth can be moved less than 1 mm in a buccolingual or mesiodistal direction.
2 The tooth can be moved 1 mm or more in a buccolingual or mesiodistal direction
but does not exhibit abnormal mobility in an occlusoapical direction.
3 The tooth can be moved 1 mm or more in both buccolingual or mesiodistal and occlusoapical directions.
(9) AG – only record if it is minimal (< 2mm) Measure the amount of attached gingiva (distance between the crest of the ginigival margin to the MGJ minus depth of the sulcus/pocket) at mid-buccal and mid-lingual areas of each tooth. Calibration Results: All calibration subjects were adults recruited from the Graduate Periodontal Program at
the University of Toronto. Six female patients and two male patients who were an
average age of 53 years old (range of 41 to 70 years) participated in the calibration
training. All patients had generalized chronic periodontitis, with three having severe
disease, three having moderate disease, and two having mild disease.
The summary of the calibration results can be seen in the table below. This table shows
the percentage of exact agreement and agreement +/- 1mm for the calibrated measures.
All of the measures are important for establishing a diagnosis of chronic periodontitis;
however, severity of disease was determined by PD +/- 1mm and this was the measure
that we were most concerned with. From the literature, it was found that in order to

62
establish inter-examiner reliability, PD should be +/- 1mm 90% or more of the time. This
percentage would be lower for Rec and again lower for CAL due to the accumulation of
error with these measures (Polson, 1997). We modified this and wanted PD to be +/-
1mm 80% or more of the time.
Calibration Summary of Results: Clinical Measurement: Range of Percentage of
Agreement: Probing depth + 1mm
83.85% - 96.88%
Recession + 1mm
86.98% - 95.83%
CAL + 1mm
78.13% - 100%
GI exact
57.14% - 74.29%
GI +1
57.14% - 74.29%
PI exact
60% - 85.71%
PI +1
97.14% - 100%
Mobility exact
57.14% - 88.57%
Mobility +1
91.43% - 100%
BOP exact
54.17% - 78.13%
Furcations exact
45.83% - 96.43%
Min. attached gingiva exact
22.5% - 100%
The figure below displays a graph of PD within +/- 1mm, showing the percentage
agreement and 95% confidence intervals for each resident. It can be seen that 3/6
residents were above the 90% cut- off and all of the 6 residents were above the 80% cut-
off.

63
Figure: Comparing Inter-examiner Reliability for PD +/- 1mm
Probing Depth +/- 1mm
0.8698
0.9688
0.93230.9375
0.8646
0.8385
0.75
0.8
0.85
0.9
0.95
1
1 2 3 4 5 6
Examiners
Prop
ortio
n
In general, there was a trend for PD, Rec, and CAL to be associated with the gold
standard. This means that one can say that the examiners were calibrated with respect to
PD, Rec, and CAL. In general BOP, GI, PI, Furc, Mob, and AG were not as clearly
associated with gold standard. This means that examiners were generally not calibrated to
the gold standard with respect to BOP, GI, PI, Furc, Mob, and AG.

64
APPENDIX 3 – Percent of Total Responses for Enhanced Questionnaire Table 1: Percent of Total Responses for Cases for Enhanced Questionnaire - Stress Acute Stress Questions: No
(score = 0) Yes (score = 1)
N/A
1. Was there a serious illness? 76 (75.25%)
21 (20.79%)
4 (3.96%)
2. Did a close friend die? 80 (79.21%)
18 (17.82%)
3 (2.97%)
3. Was there a marital separation or divorce? 88 (87.13%)
5 (4.95%)
8 (7.92%)
4. Had a child move back into the house? 82 (81.19%)
2 (1.98%)
17 (16.83%)
Chronic Stress Questions: NT
(score = 0) ST/VT (score = 1)
N/A
1. There is too much pressure on you to be like other people.
56 (55.45%)
35 (34.65%)
10 (9.90%)
2. You don’t have enough money to take vacations.
33 (32.67%)
64 (63.37%)
4 (3.96%)
3. You find it is too difficult to find someone compatible with you.
50 (49.50%)
38 (37.62%)
13 (11.88%)
4. You have to go to social events alone and you don’t want to.
65 (64.36%)
22 (21.78%)
14 (13.86%)
5. You don’t have time for your favorite leisure time activities.
55 (54.46%)
42 (41.58%)
4 (3.96%)
6. You would like to move but you cannot. 62 (61.39%)
32 (31.68%)
7 (6.93%)
Table 2: Percent of Total Responses for Cases for Enhanced Questionnaire – Social Support Social Support Questions:
No (score = 0)
Yes (score = 1)
1. Do you have someone you can confide in or talk to about your private feelings or concerns?
11 (10.89%) 90 (89.11%)
2. Do you have someone you can really count on to help you out in a crisis situation?
7 (6.93%) 94 (93.06%)
3. Do you have someone you can really count on to give you advice when you are
14 (13.86%) 87 (86.14%)
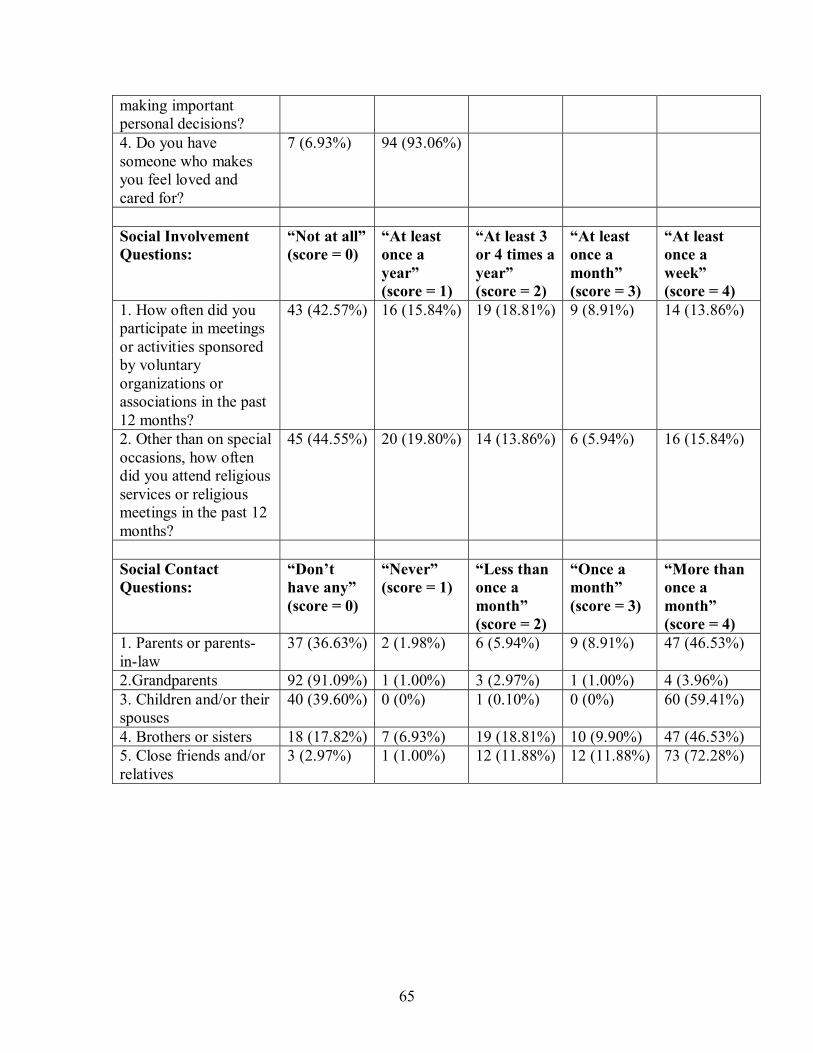
65
making important personal decisions? 4. Do you have someone who makes you feel loved and cared for?
7 (6.93%) 94 (93.06%)
Social Involvement Questions:
“Not at all”(score = 0)
“At least once a year” (score = 1)
“At least 3 or 4 times a year” (score = 2)
“At least once a month” (score = 3)
“At least once a week” (score = 4)
1. How often did you participate in meetings or activities sponsored by voluntary organizations or associations in the past 12 months?
43 (42.57%) 16 (15.84%) 19 (18.81%) 9 (8.91%) 14 (13.86%)
2. Other than on special occasions, how often did you attend religious services or religious meetings in the past 12 months?
45 (44.55%) 20 (19.80%) 14 (13.86%) 6 (5.94%) 16 (15.84%)
Social Contact Questions:
“Don’t have any” (score = 0)
“Never” (score = 1)
“Less than once a month” (score = 2)
“Once a month” (score = 3)
“More than once a month” (score = 4)
1. Parents or parents-in-law
37 (36.63%) 2 (1.98%) 6 (5.94%) 9 (8.91%) 47 (46.53%)
2.Grandparents 92 (91.09%) 1 (1.00%) 3 (2.97%) 1 (1.00%) 4 (3.96%) 3. Children and/or their spouses
40 (39.60%) 0 (0%) 1 (0.10%) 0 (0%) 60 (59.41%)
4. Brothers or sisters 18 (17.82%) 7 (6.93%) 19 (18.81%) 10 (9.90%) 47 (46.53%) 5. Close friends and/or relatives
3 (2.97%) 1 (1.00%) 12 (11.88%) 12 (11.88%) 73 (72.28%)

66
Table 3: Percent of Total Responses for Controls for Enhanced Questionnaire - Stress Acute Stress Questions: No
(score = 0) Yes (score = 1)
N/A
1. Was there a serious illness? 37 (74%)
11 (22%)
2 (4%)
2. Did a close friend die? 42 (84%)
6 (12%)
2 (4%)
3. Was there a marital separation or divorce? 41 (82%)
3 (6%)
6 (12%)
4. Had a child move back into the house? 38 (76%)
0 (0%)
12 (24%)
Chronic Stress Questions: NT
(score = 0) ST/VT (score = 1)
N/A
1. There is too much pressure on you to be like other people.
34 (68%)
14 (28%)
2 (4%)
2. You don’t have enough money to take vacations. 21 (42%)
29 (58%)
0 (0%)
3. You find it is too difficult to find someone compatible with you.
24 (48%)
21 (42%)
5 (10%)
4. You have to go to social events alone and you don’t want to.
34 (68%)
12 (24%)
4 (8%)
5. You don’t have time for your favorite leisure time activities.
31 (62%)
18 (36%)
1 (2%)
6. You would like to move but you cannot. 33 (66%)
13 (26%)
4 (8%)
Table 4: Percent of Total Responses for Controls for Enhanced Questionnaire – Social Support Social Support Questions:
No (score = 0)
Yes (score = 1)
1. Do you have someone you can confide in or talk to about your private feelings or concerns?
6 (12%) 44 (88%)
2. Do you have someone you can really count on to help you out in a crisis situation?
1 (2%) 49 (98%)
3. Do you have someone you can really count on to give you advice
8 (16%) 42 (84%)

67
when you are making important personal decisions? 4. Do you have someone who makes you feel loved and cared for?
6 (12%) 44 (88%)
Social Involvement Questions:
“Not at all” (score = 0)
“At least once a year” (score = 1)
“At least 3 or 4 times a year” (score = 2)
“At least once a month” (score = 3)
“At least once a week” (score = 4)
1. How often did you participate in meetings or activities sponsored by voluntary organizations or associations in the past 12 months?
22 (44%) 6 (12%) 7 (14%) 6 (12%) 9 (18%)
2. Other than on special occasions, how often did you attend religious services or religious meetings in the past 12 months?
25 (50%) 10 (20%) 3 (6%) 4 (8%) 8 (16%)
Social Contact Questions:
“Don’t have any” (score = 0)
“Never” (score = 1)
“Less than once a month” (score = 2)
“Once a month” (score = 3)
“More than once a month” (score = 4)
1. Parents or parents-in-law
35 (70%) 2 (4%) 0 (0%) 1 (2%) 12 (24%)
2.Grandparents 46 (92%) 1 (2%) 1 (2%) 2 (4%) 0 (0%) 3. Children and/or their spouses
28 (56%) 0 (0%) 2 (4%) 2 (4%) 18 (36%)
4. Brothers or sisters 9 (18%) 0 (0%) 8 (16%) 14 (28%) 19 (38%) 5. Close friends and/or relatives
2 (4%) 2 (4%) 5 (10%) 4 (8%) 37 (74%)

68
APPENDIX 4 – Interpretation of Intraclass Correlation Coefficient Statistic Landis and Koch’s Criteria: > 0.8 = Very good agreement > 0.6 - 0.8 = Good agreement > 0.4 - 0.6 = Moderate agreement > 0.2 - 0.4 = Fair agreement < 0.2 = Poor agreement

69
APPENDIX 5 – Test-Retest Reliability Tables
Test-Retest Reliability for Cases
Question Number Number &
Proportion of
Same Response
95% Confidence Interval
n(%) Lower Upper
A1 – acute stress 28 (90.32 %) 0.7992 1.0000
A2 28 (90.32 %) 0.7992 1.0000
A3 27 (90.00 %) 0.7926 1.0000
A4 24 (92.31 %) 0.8207 1.0000
B1 – chronic stress 21 (72.41 %) 0.5615 0.8868
B2 26 (92.86 %) 0.8332 1.0000
B3 21 (84.00 %) 0.6963 0.9837
B4 20 (76.92 %) 0.6073 0.9312
B5 21 (70.00 %) 0.5360 0.8640
B6 22 (78.57 %) 0.6337 0.9377
C1 – social support 29 (90.63 %) 0.8053 1.0000
C2 28 (87.50 %) 0.7604 0.9896
C3 29 (90.63 %) 0.8053 1.0000
C4 30 (93.75 %) 0.8536 1.0000
D1 – social involve 18 (56.25 %) 0.3906 0.7344
D2 21 (65.63 %) 0.4917 0.8208
E1 – social contact 21 (65.63 %) 0.4917 0.8208
E2 28 (87.50 %) 0.7604 0.9896
E3 29 (90.63 %) 0.8053 1.0000
E4 21 (65.63 %) 0.4917 0.8208
E5 21 (65.63 %) 0.4917 0.8208

70
Test-Retest Reliability for Controls
Question Number Number &
Proportion of
Same Response
95% Confidence Interval
n(%) Lower Upper
A1 – acute stress 13 (76.47 %) 0.5631 0.9663
A2 16 (94.12 %) 0.8293 1.0000
A3 12 (100%) 1.0000 1.0000
A4 10 (90.91 %) 0.7392 1.0000
B1 – chronic stress 13 (76.47 %) 0.5631 0.9663
B2 15 (88.24 %) 0.7292 1.0000
B3 12 (75.00%) 0.5378 0.9622
B4 12 (80.00%) 0.5976 1.0000
B5 12 (70.59 %) 0.4893 0.9225
B6 13 (92.86 %) 0.7937 1.0000
C1 – social support 14 (82.35 %) 0.6423 1.0000
C2 15 (88.24 %) 0.7292 1.0000
C3 15 (88.24 %) 0.7292 1.0000
C4 16 (94.12 %) 0.8293 1.0000
D1 – social involve 8 (47.06 %) * 0.2333 0.7079
D2 15 (88.24%) 0.7292 1.0000
E1 – social contact 11 (64.71 %) 0.4199 0.8742
E2 17 (100%) 1.0000 1.0000
E3 13 (76.47 %) 0.5631 0.9663
E4 12 (70.59 %) 0.4893 0.9225
E5 11 (64.71 %) 0.4199 0.8742
* insufficient evidence of being a reliable response

71
REFERENCES Albandar JM. Global risk factors and risk indicators for periodontal diseases. Periodontol 2000 2002;29:177-206. Andresen EM, Malmgren JA, Carter WB, Patrick DL. Screening for depression in well older adults: Evaluation of a short form of the CES-D. Am J Prev Med 1994;10(2):77-84. Armitage GC. Chapter 8: Clinical Periodontology Examination. In: Rose L Mosby, ed. Periodontics: medicine, surgery, and implants, St. Louis: The CV Mosby Company; 2004:135-144. Axtelius B, Soderfeldt B, Nilsson A, Edwardsson S, Attstrom R. Therapy-resistant periodontitis. Psychosocial characteristics. J Clin Periodontol 1998;25:482-491. Azuma H, Kido J, Ikedo D, Kataoka M, Nagata T. Substance P enhances the inhibition of osteoblastic cell differentiation induced by lipopolysaccharide from Porphyromonas gingivalis. J Periodontol 2004;75(7):974-981. Belting CM, Gupta OP. The influence of psychiatric disturbances on the severity of periodontal disese. J Periodontol 1961;32:219-226. Boyapati L & Wang HL. The role of stress in periodontal disease and wound healing. Periodontol 2000 2007;44:195-210. Breivik T, Thrane PS, Murison R, Gjermo P. Emotional stress effects on immunity, gingivitis and periodontitis. Eur J Oral Sci 1996;104:327-334. Brugha T, Bebbington P, Tennant C, Hurry J. The list of threatening experiences: a subset of 12 life event categories with considerable long-term contextual threat. Psychol Med 1985;15:189-194. Brugha TS, Cragg D. The list of threatening experiences: the reliability and validity of a brief life events questionnaire. Acta Psychiatr Scand 1990;82:77-81. Cohen S, Kamarck T, Mermelstein R. A global measure of perceived stress. J Health Soc Behav 1983;24(4):385-396. Cohen S, Syme SL. Social support and health. Orlando, Florida:Academic Press Inc; 1985: :6-7, 11-12, 61, 65-74, 225, 232-236. Concoran K, Fischer, J. Measures for clinical practice: a sourcebook, 3rd edition, volume 2. New York:Free Press; 1998:114-115, 321-322, 393-394.
72
Croucher R, Marcenes WS, Torres MC, Hughes WS, Sheiham A. The relationship between life-events and periodontitis. A case-control study. J Clin Periodontol 1997;24:39-43. Dahlem NW, Zimet GD, Walker RR. The multidimensional scale of perceived social support: A confirmation study. J Clin Psychol 1991;47(6):756-761. Davis CH, Jenkins CD. Mental stress and oral diseases. J Dent Res 1962;41:1045-1049. De Marco TJ. Periodontal emotional stress syndrome. J Periodontol 1976;47:67-68. Fedi PF. The effects of stress on the periodontium of the Syrian hamster. J Periodontol 1958;29:292-300. Flemming TF. Periodontitis. Ann Periodontol 1999;1:32-38. Freeman R, Gross S. Stress measures as predictors of periodontal disease – a preliminary communication. Community Dent Oral Epidemiol 1993;21:176-177. Friedlander AH, Mahler ME. Major depressive disorder: Psychopathology, medical management and dental implications. JADA 2001;132:629-638. Genco RJ. Current view of risk factors for periodontal diseases. J Periodontol 1996;67(10)suppl: 1041-1049. Genco RJ, Ho AW, Grossi SG, Dunford RG, Tedesco LA. Models to evaluate the role of stress in periodontal disease. Ann Periodontol 1998;3(1):288-302. Genco RJ, Ho AW, Grossi SG, Dunford RG, Tedesco LA. Relationship of stress, distress, and inadequate coping behaviors to periodontal disease. J Periodontol 1999;70(7):711-723. Glaser R, Kiecolt-Glaser JK, Bonneau R, et al. Stress-induced modulation of immune response to recombinant hepatitis B vaccine. Psychosom Med 1992;54:22-29. Grassi L, Rasconi G, Pedriali A, Corridoni A, Bevilacqua M. Social support and psychological distress in primary care attenders. Psychother Psychosom 2000;69:95-100. Green L, Tryon W, Marks B, Juryn J. Periodontal disease as a function of life-events stress. J Human Stress 1986;12:32-37. Grossi SG, Genco RJ, Machtei EE, et al. Assessment of risk for periodontal disease. II. Risk indicators for alveolar bone loss. J Periodontol 1995;66(1):23-29. Grossi SG, Zambon JJ, Ho AW, et al. Assessment of risk for periodontal disease. I. Risk indicators for attachment loss. J Periodontol 1994;65:260-267.

73
Gupta OP, Blechman H. Effects of stress on the periodontal tissues of young adult male rats and hamsters. J Periodontol 1960;31:413-417. Herbert TB, Cohen S. Stress and immunity in humans: A meta-analytic review. Psychosom Med 1993;55:364-379. Houri-Haddad Y, Itzchaki O, Ben-Nathan D, Shapira L. The effect of chronic emotional stress on the humoral immune response to Porphyromonas gingivalis in mice. J Periodontal Res 2003;38:204-209. Hugoson A, Ljungquist B, Breivik T. The relationship of some negative events and psychological factors to periodontal disease in an adult Swedish population 50 to 80 years of age. J Clin Periodontol 2002;29:247-253. Johnson GK & Hill M. Cigarette Smoking and the Periodontal Patient. J Periodontol 2004;75(2):196-209. Kiecolt-Glaser JK, Dura JR, Speicher CE, Trask OJ, Glaser R. Spousal caregivers of dementia victims: Longitudinal changes in immunity and health. Psychosom Med 1991;53:345-362. Kiecolt-Glaser JK, Fisher LD, Ogrocki P, Stout JC, Speicher CE, Glaser R. Marital quality, martial disruption, and immune function. Psychosom Med 1987;49(1):13-34. Kiecolt-Glaser JK, Garner W, Speicher C, Penn GM, Holliday J, Glaser R. Psychosocial modifiers of immunocompetence in medical students. Psychosom Med 1984;46(1):7-14. Keicolt-Glaser JK, Glaser R. Psychoneuroimmunology and health consequences: Data and shared mechanisms. Psychosom Med 1995;57(3):269-274. Keicolt-Glaser JK, Glaser R. Psychoneuroimmunology: Can psychological interventions modulate immunity? J Consult Clin Psychol 1992;60(4):569-575. Keicolt-Glaser JK, McGuire L. Psychoneuroimmunology: Psychological influences on immune function and health. J Consult Clin Psychol 2002;70(3):537-547. Keicolt-Glaser JK, McGuire L, Robles TF, Glaser R. Psychoneuroimmunology and psychosomatic medicine: Back to the future. Psychosom Med 2002;64(1):15-28. Kloostra PW, Eber RM, Wang HL, Inglehart MR. Surgical vs. non-surgical periodontal treatment: Psychosocial factors and treatment outcomes. J Periodontol 2006;77(7):1253-1260. Kloostra PW, Eber RM, Inglehart MR. Anxiety, stress, depression and patients’ response to periodontal treatment: Periodontists’ knowledge and professional behavior. J Periodontol 2007;78(1):64-71.

74
Lenton P. Examiner guide to measuring periodontal parameters and indices. [Thesis]. Minneapolis, Minnesota: University of Minnesota; 1997. LeResche L, Dworkin SF. The role of stress in inflammatory disease, including periodontal disease: review of concepts and current findings. Periodontol 2000 2002;30:91-103. Linden GJ, Mullally BH, Freeman R. Stress and the progression of periodontal disease. J of Clinical Periodontol 1996;23:675-680. Maes S, Vingerhoets A, Van Heck G. The study of stress and disease: Some developments and requirements. Soc Sci Med 1987;25(6):567-578. Machtei EE, Christersson LA, Grossi SG, Dunford R, Zambon JJ, Genco RJ. Clinical criteria for the definition of “established periodontitis.” J Periodontol 1992;63(3): 206-213. Mancini S, Romanelli R, Laschinger CA, Overall CM, Sodek J, McCulloch CAG. Assessment of a novel screening test for neutrophil collagenase activity in the prognosis of periodontal disease. J Periodontol 1999;70:1292-1302. Marcenes WS, Sheiham A. The relationship between work stress and oral health status. Soc Sci Med 1992;35(12):1511-1520. Mealey BL, Oates TW. Diabetes Mellitus and Periodontal Diseases. J Periodontol 2006; 77(8):1289-1303. Merchant AT, Pitiphat W, Ahmed B, et al. A prospective study of social support, anger expression and risk of periodontitis in men. J Am Dent Assoc 2003;134:1591-1596. Monterio da Silva AM, Newman HN, Oakley DA. Psychosocial factors in inflammatory periodontal diseases. A review. J Clin Periodontol 1995; 22(7):516-26. Moss ME, Beck JD, Kaplan BH, et al. Exploratory case-control analysis of psychosocial factors and adult periodontitis. J Periodontol 1996(suppl);67(10):1060-1069. Moulton R, Ewen S, Thieman W. Emotional factors in periodontal disease. Oral Surg Oral Med Oral Pathol 1952;5:833-860. Nakajima K, Hamada N, Takahashi Y, et al. Restraint stress enhances alveolar bone loss in an experimental rat model. J Periodont Res 2006;41:527-534. Newton T. Specification and analysis of the effects of coping in research on the relationship between psychosocial stress and periodontal disease. J Clin Periodontol 2005;32:1141-1142.

75
Ng SKS, Leung WK. A community study on the relationship between stress, coping, affective dispositions and periodontal attachment loss. Community Dent Oral Epidemiol 2006;34:252-266. Olff M. Stress, depression and immunity: The role of defense and coping styles. Psychiatry Res 1999;85:7-15. Padgett DA, Glasser R. How stress influences the immune response. Trends Immunol 2003;24(8):444-448. Page RC. The role of inflammatory mediators in the pathogenesis of periodontal disease. J Periodontal Res 1991;26:230-242. Page RC, Kornman KS. The pathogenesis of human periodontitis: an introduction. Periodontol 2000 1997;14:9-11. Pengilly JW, Dowd ET. Hardiness and social support as moderators of stress. J Clin Psychol 2000;56(6):813-820. Perruzo DC, Benatti BB, Ambrosano GMB, et al. A systematic review of stress and psychological factors as possible risk factors for periodontal disease. J Periodontol 2007;78(8):1491-1504. Peruzzo DC, Benatti BB, Antunes IB, et al. Chronic stress may modulate periodontal disease: A study in rats. J Periodontol 2008; 79:697-704. Pilisuk M. Delivery of social support: The social inoculation. Amer J Orthopsychiat 1982;52(1):20-31. Polson AM. The research team, calibration, and quality assurance in clinical trials in periodontics. Ann Periodontol 1997;2:75-82. Radloff LS. The CES-D Scale: A self-report depression scale for research in the general population. Appl Psychol Meaurement 1977;1(3):385-401. Radloff LS, Lock BZ. The community mental health assessment survey and the CES-D scale. In: MM Weissman, JK Myers, CE Ross. Community surveys of psychiatric disorders. Surveys in Psycholosocial Epidemiology 1986;4:177-189. Ratcliff PA. The relationship of the general adaptation syndrome to the periodontal tissues in the rat. J Periodontol 1956;27:40-43. Reners M & Brecx M. Stress and periodontal disease. Int J Dent Hygiene 2007;5:199-204.

76
Rozlog LA, Keicolt-Glaser JK, Marucha PT, Sheridan JF, Glaser R. Stress and immunity: implications for viral disease and wound healing. J Periodontol 1999;70:786-792. Safa S & Glogauer M. Development and preliminary analysis of a questionnaire to study links between stress, social support and periodontal disease. [Thesis] Toronto, Ontario:University of Toronto, Faculty of Dentistry; 2007. Sarason IG, Sarason BR, Potter EH, Antoni MH. Life events, social support, and illness. Psychosom Med 1985;47(2):156-163. Seymour GJ. Importance of the host response in the periodontium. J Clin Periodontol 1991;18:421-426. Shapira L, Frolov I, Halabi A, Ben-Nathan D. Experimental stress suppresses recruitment of machrophages but enhanced their P.gingivalis LPS-stimulated secretion of nitric oxide. J Periodontol 2000;71(3):476-481. Shapira L, Houri-Haddad Y, Frolov I, Halabi A, Ben-Nathan D. The effect of stress on the inflammatory response to porphyromonas gingivalis in a mouse subcutaneous chamber model. J Periodontol 1999;70(3):289-293. Stahl SS. Healing gingival injury in normal and systematically stressed young adult male rats J Periodontol 1961;32:63-73. Teng HC, Lee CH, Hung HC, et al. Lifestyle and psychosocial factors associated with chronic periodontitis in Taiwanese adults. J Periodontol 2003;74(8):1169-1175. Tennant C, Andrews G. A scale to measure the stress of life events. Aust N Z J Psychiatry 1976;10:27-32. Tse WS, Bond AJ. Relationship between baseline cortisol, social functioning and depression: a mediation analysis. Psychiatr Res 2004;126:197-201. Vettore M, Quintanilha RS, Monterio da Silva AM, Lamarca GA, Leao ATT. The influence of stress and anxiety on the response of non-surgical periodontal treatment. J Clin Periodontol 2005;32:1226-1235. Wimmer G, Janda M, Wieselmann-Penkner K, Jakse N, Polansky R, Pertl C. Coping with stress: Its influence on periodontal disease. J Periodontol 2002;73(11):1343-1351. World Health Organization. Oral health surveys: basic methods. 4th edition. 1997, Geneva: World Health Organization. vii, 66 p. 6. Zimet GD, Dahlem NW, Zimet SG, Farley GK. The multidimensional scale of perceived social support. J Pers Assess 1988;52(1):30-41.

77
Zimet GD, Powell SS, Farley GK, Werkman S, Berkoff KA. Psychometric characteristics of the multidimensional scale of perceived social support. J Pers Assess 1990;55(3&4):610-617.