development and initial validation of an abbreviated spider phobia questionnaire using item response...
TRANSCRIPT
www.elsevier.com/locate/bt
Available online at www.sciencedirect.com
Behavior Therapy 40 (2009) 114–130
Development and Initial Validation of an Abbreviated Spider PhobiaQuestionnaire Using Item Response Theory
Bunmi O. Olatunji, Vanderbilt UniversityCarol M. Woods, Washington University in St. Louis
Peter J. de Jong, University of Groningen
Bethany A. Teachman, University of Virginia
Craig N. Sawchuk, University of Washington
Bieke David, Vanderbilt University
An abbreviated Spider Phobia Questionnaire (SPQ) wasdeveloped using methods based in item response theory.Fifteen of the 31 SPQ items that demonstrated good toexcellent discrimination along the spider fear continuumwere retained in Study 1 that consisted of 1,555 nonclinicaland clinical participants. The SPQ-15 demonstrated goodinternal consistency and correlated highly with the full SPQ.Structural equation modeling revealed that the SPQ-15demonstrated excellent convergent validity, with strongassociations with small animal disgust and other phobicsymptoms. Supportive evidence was also found for diver-gent validity in relation to panic-related symptoms. TheSPQ-15 was uniquely predictive of avoidance behavior andfear and disgust responding towards spiders in nonclinical,analogue, and treatment-seeking samples in Studies 2, 3,and 4. Lastly, in Study 5, the SPQ-15 was sensitive to theeffects of exposure-based treatment. These findings suggestthat the SPQ-15 has considerable strengths, includingdecreased assessment and scoring time while retaining highreliability, validity, and sensitivity.
Address correspondence to Bunmi O. Olatunji, Ph.D., Depart-ment of Psychology, Vanderbilt University, 301 Wilson Hall, 11121st Avenue South, Nashville, TN 37203; e-mail: [email protected]/08/0114–0130$1.00/0© 2008 Association for Behavioral and Cognitive Therapies. Published byElsevier Ltd. All rights reserved.
SPECIFIC PHOBIAS ARE CHARACTERIZED by an excessiveor unrealistic fear of specific objects or situations(American Psychiatric Association, 1994). Epide-miological studies have shown that an estimated 10to 12.5% of people in the US experience a specificphobia in their lifetime (Kessler et al., 2005; Magee,Eaton, Wittchen, McGonagle, & Kessler, 1996).Factor analytic investigations have consistentlyidentified animals as a distinct category of specificphobias (Arrindell, Pickersgill, Merckelbach, Ardon,& Cornet, 1991), with approximately 40% of alldiagnosed phobias belonging to this category (Chap-man, 1997). In fact, themost common specific fear inWestern societies is that of spiders, with prevalenceestimates upwards of 55% and 18% among femalesand males, respectively (Davey, 1992). Similar toother phobic disorders, individuals with spiderphobia experience persistent dread, immediatelyrespond with fear upon exposure, and generallyavoid situations in which the phobic stimulus mightbe encountered. Despite evidence of role impairmentin phobia, only aminority of individuals with phobiaever seek professional treatment (Magee et al., 1996).In contrast to many phobic disorders, disgustappears to play a prominent role in spider phobia(Olatunji & Deacon, 2008).Investigations of spider phobia have greatly
advanced our clinical and theoretical knowledgeabout anxiety disorders. For instance, research onspider phobia has identified disgust as a criticalemotion that may be relevant for a variety of otheranxiety disorders (Olatunji & McKay, 2007).Furthermore, the importance of context dependency
115s p ider phob ia que s t ionna i r e
in fear extinction has been illuminated through theuse of samples with spider phobia (Vansteenwegenet al., 2007). Studies with spider phobia have alsohelped identify specific neural correlates of auto-nomic (amygdala) and direct evaluation (insula,anterior cingulate gyrus, left dorsomedial prefrontalcortex) of threatening stimuli (Straube, Mentzel, &Miltner, 2006). Lastly, research employing spiderphobic samples has begun to shed light on the effectsof successful psychotherapy on brain function inpersons with anxiety disorders (Straube, Glauer,Dilger, Mentzel, & Miltner, 2006).The clinical condition of spider phobia appears to
serve as amodel for better understanding the pheno-menology of fear and anxiety in the laboratory.Given the broad impact of research on spiderphobia, brief and sensitive methods of assessmentwould be of considerable utility. Although multipleself-report inventories exist, the Spider PhobiaQuestionnaire (SPQ; Klorman, Hastings, Weerts,Melamed, & Lang, 1974) has established itself asthe most widely used measure of spider fear. TheSPQ has been translated into several languages (e.g.,Dutch, Swedish) and has been adapted as a measurefor children (SPQ-C; Kindt, Brosschot, & Muris,1996). The SPQ was developed to assess the verbal-cognitive component of spider fear, consisting of 31true/false items, 9 of which are reversed-scored(Antony, Orsillo, & Roemer, 2001).Although the development of the SPQ has
enabled researchers to follow a standardized pro-cedure for the evaluation of spider phobia (Klor-man et al., 1974), reports of the internal consistencyof the SPQ have been inconsistent. For example,Muris and Merckelbach (1996) reported Chron-bach alpha of .62 before treatment and .90 aftertreatment for the SPQ in a sample of spider phobicindividuals. Muris and Merckelbach also found aCronbach alpha of .43 among nonphobic controls.However, other studies using the Kuder-Richard-son formula 20 have reported higher reliabilityestimates in nonclinical samples (α's ranging from.83 to 90; Klorman et al., 1974). Despite variableinternal consistency estimates, the SPQ has demon-strated excellent test-retest reliability over periodsbetween 3 weeks (r=.94; Muris & Merckelbach,1996) and 1 year (r= .87; Fredrikson, 1983).Importantly, the SPQ discriminates individualswith spider phobia from those with snake phobiaand nonclinical controls (Fredrikson, 1983; Muris& Merckelbach, 1996) and correlates significantlywith other measures of spider fear and avoidance(Muris & Merckelbach, 1996). Lastly, the SPQ issensitive to the effects of treatment (Hellstrom &Öst, 1995; Öst, 1978; Teachman &Woody, 2003).Despite the widespread use of the SPQ and studies
examining its psychometric properties, no study hasused modern statistical techniques, such as itemresponse theory (IRT; see Embretson & Reise,2000, or Thissen & Wainer, 2001), to examine thepsychometric properties of each SPQ item.Application of analytic techniques, such as IRT,
to the SPQmay be warranted given that the validityand relative utility of the measure is not withoutquestion (Packer, Bond, & Siddle, 1987). Forexample, Muris and Merckelbach compared thepsychometric properties of the SPQ to that of theFear of Spiders Questionnaire (FSQ; Szymanski &O'Donohue, 1995), an alternative measure ofspider fear. Both were found to be generally reliableand valid self-report measures of spider fear.However, two potential drawbacks of the SPQ,relative to the FSQ, were observed. First, thefindings indicated that the SPQ may be limited inindexing more subtle differences in self-reportedspider fear in samples with (extremely) low levels ofspider fear. Second, the 18-item FSQ is shorter thanthe 31-item SPQ, and although the amount of timerequired to administer and score a 31-item instru-ment is not unreasonable, clinicians and researchersoften need quickmeasures either to screen for spiderphobia or to use as part of a larger assessmentbattery. By refining and reducing the number ofitems on the SPQ, greater compliance (i.e., fewerskipped or missing items) could be achieved whilesimultaneously reducing participant burden. Itcould also be argued that given that spider fear/phobia represents a relatively narrow construct, 31items may not be necessary for accurate assessment.For these reasons, an abbreviated version of the SPQthat continues to validly and reliably assess spiderfear would have considerable practical benefits.Prior studies have made important contributions
towards a better understanding of the psycho-metric properties of the SPQ (e.g., Muris &Merckelbach, 1996), but these studies are basedon classic test theory methods that have importantlimitations. Specifically, they do not directly assesshow well SPQ items discriminate individuals whodiffer in their level of spider fear (cf. Embretson,1996). IRT consists of a set of generalized linearmodels and statistical procedures that identifyresponses on an underlying latent trait. IRT modelshave a number of potential advantages over classictest theory in facilitating valid and reliable assess-ment. For example, IRT models yield estimates thatdo not vary with the characteristics of the samplein the underlying trait and trait estimates linked toitem content. Furthermore, IRT facilitates evalua-tion of the extent to which items are equivalentamong different respondents. Accordingly, it hasbeen argued that state-of-the-art scale development
116 olatun j i e t al .
should use IRT methods to determine the psycho-metric performance of scale items (see Beevers,Strong, Meyer, Pilkonis, & Miller, 2007; Embret-son, 1996). IRT methods have not yet been appliedto the SPQ. Given the widespread use of the SPQand the general benefit of using brief assessmentsto increase compliance and reduce subject burden,we conducted a series of studies using IRT todevelop a briefer version of the SPQ that (a) iscomprised of items that discriminate individualsalong the spider fear continuum, (b) is highlycorrelated with the original SPQ, (c) has adequateinternal consistency, (d) has adequate convergent/divergent, concurrent and predictive validity, and(e) shows treatment sensitivity. Using IRT andstructural equation modeling, we examined theresponses of a large nonclinical sample to evaluate,refine, and shorten the SPQ. We then used ap-proaches from traditional test theory to examinethe reliability and validity of the abbreviatedversion of the SPQ in nonclinical, analogue, andtreatment-seeking community samples.
Study 1 Methods: Development and InitialValidation of the Abbreviated SPQparticipants
A total of 1,555 participants were included in theanalysis. One thousand four hundred and five (63%female; mean age=20.88, SD=5.14, ranged in agefrom 18 to 56 years) of these participants wererecruited from undergraduate courses and partici-pated in exchange for course credit. A second set of91 participants were recruited from an outpatientclinic in the Netherlands (see Study 4). Of these 91participants, 61 (mean age=33.82; SD=11.05;82% women) met diagnostic criteria for spiderphobia and 30 (mean age=35.18; SD=13.07; 80%women) did not. A third set of 59 participants wererecruited from an outpatient clinic in the UnitedStates (see Study 5). Of these 59 participants, 30(mean age=33.60; SD=10.70; 83% women) metdiagnostic criteria for spider phobia and 29 (meanage=24.00; SD=9.40; 77% women) did not.Nonclinical and clinical participants were combinedfor the initial analysis to ensure a more ecologicallyvalid continuum of spider fear and phobia.
measures
The Spider Phobia Questionnaire (SPQ; Klormanet al., 1974) is a 31-item true/false measure of fearand avoidance of spiders. Scoring is reversed for 9fear-absent items.The Disgust Emotion Scale (DES; Kleinknecht,
Kleinknecht, & Thorndike, 1997) is a 30-item scalemeasuring disgust sensitivity across five domains:
Animals, Injections and Blood Draws, Mutilationand Death, Rotting Foods, and Smells. Ratings aregiven on a 5-point Likert-type scale, ranging from 0(no disgust or repugnance at all) to 4 (extremedisgust or repugnance). The alpha coefficient for theDES was .93 in the present study. The DES hasdemonstrated acceptable reliability and validity(Kleinknecht et al., 1997).The Injection Phobia Scale–Anxiety (IPS-Anx;
Öst, Hellstrom, & Kaver, 1992) is an 18-item scalein which individuals rate their degree of anxiety ifthey were to experience a variety of injection and/orvenipuncture procedures. The scale ranges from 0(no anxiety) to 4 (maximum anxiety). The IPS-Anxdemonstrated good internal consistency in thepresent study (α=.95). Two additional items, asses-sing fainting and avoidance, were added to the IPS-Anx. The fainting item asked participants if theyhave ever fainted, almost fainted, or felt dizzyduring medical procedures such as giving blood orreceiving injections. The avoidance item askedparticipants if they have ever avoided, delayed, orput off medical procedures because they were afraidof blood, needles, injections, etc.The Anxiety Sensitivity Index (ASI; Reiss, Peter-
son, Gursky, & McNally, 1986) is a 16-item ques-tionnaire in which respondents indicate on a 5-pointLikert-type scale (0=very little to 4=very much) thedegree to which they expect negative consequencesto arise from anxiety-related sensations acrossdimensions of Physical Concerns, Mental Incapaci-tation, and Social Concerns (Zinbarg, Barlow, &Brown, 1997). The ASI demonstrated good internalconsistency in the present study (α=.86). However,items for the Social Concerns subscale (Items 1, 5, 7,and 13) reportedly deviate from the other twolower-order components of the ASI (Blais et al.,2001;McWilliams, Stewart,&MacPherson, 2000).Consequently, only the Physical Concerns andMental Incapacitation items were used in the pre-sent study (α=.86).
item response analyses
We used Birnbaum's (1968) unidimensional twoparameter logistic (2PL) item response model toexplore the measurement properties of individualSPQ items. This model specifies a discriminationparameter (a) and a threshold parameter (b) foreach item. The a parameter conveys how stronglythe item relates to the latent variable, and the bparameter is the location on the latent continuumwhere the discrimination occurs (and where theprobability of endorsing the item is 0.5).For typical IRT analysis, it is assumed that the
latent variable (here, spider fear) is unidimensionaland normally distributed. To check the dimension-
117s p ider phob ia que s t ionna i r e
ality assumption, we used exploratory factoranalysis (EFA). To avoid assuming the latentdistribution is normal, as is implicit in popularsoftware such as BILOG, MULTILOG and PARS-CALE, we estimated the latent distribution simul-taneously with the 2PL item parameters usingRamsay-curve item response theory (RC-IRT;Woods, 2006; Woods & Thissen, 2006) as imple-mented in RCLOG (Woods & Thissen, 2004).In RC-IRT, the latent distribution is modeled as a
“Ramsay-curve,” which is a density made fromBasis splines (B-splines; de Boor, 2001). Technicaldetails appear elsewhere (Woods, 2004; Woods &Thissen, 2006), as does a more accessible explana-tion of RC-IRT (Woods, 2006). In brief, a splineregression line (which can curve) is estimated simul-taneously with the item parameters and thenoperated upon (exponentiation and integration) sothat the result is a proper density. Parameters of aRamsay curve are coefficients of the spline regres-sion line.
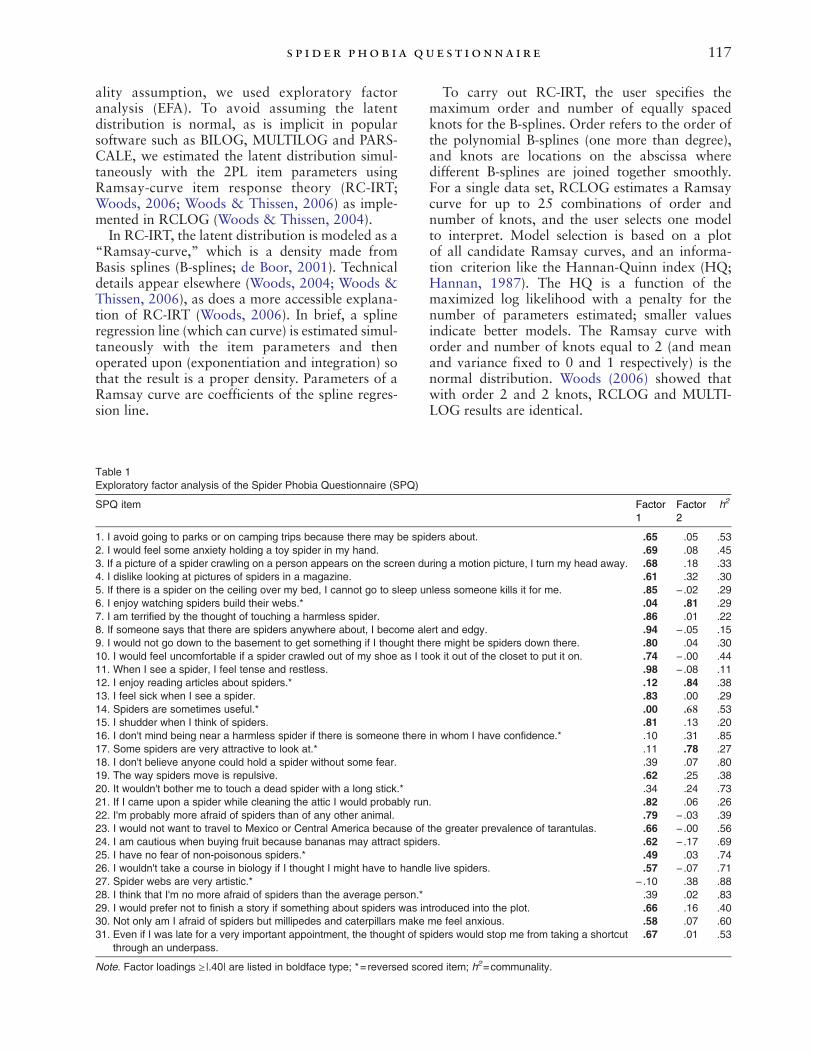
Table 1Exploratory factor analysis of the Spider Phobia Questionnaire (SPQ)
SPQ item
1. I avoid going to parks or on camping trips because there may be spid2. I would feel some anxiety holding a toy spider in my hand.3. If a picture of a spider crawling on a person appears on the screen du4. I dislike looking at pictures of spiders in a magazine.5. If there is a spider on the ceiling over my bed, I cannot go to sleep u6. I enjoy watching spiders build their webs.⁎7. I am terrified by the thought of touching a harmless spider.8. If someone says that there are spiders anywhere about, I become al9. I would not go down to the basement to get something if I thought th10. I would feel uncomfortable if a spider crawled out of my shoe as I to11. When I see a spider, I feel tense and restless.12. I enjoy reading articles about spiders.⁎13. I feel sick when I see a spider.14. Spiders are sometimes useful.⁎15. I shudder when I think of spiders.16. I don't mind being near a harmless spider if there is someone there17. Some spiders are very attractive to look at.⁎18. I don't believe anyone could hold a spider without some fear.19. The way spiders move is repulsive.20. It wouldn't bother me to touch a dead spider with a long stick.⁎21. If I came upon a spider while cleaning the attic I would probably run22. I'm probably more afraid of spiders than of any other animal.23. I would not want to travel to Mexico or Central America because of24. I am cautious when buying fruit because bananas may attract spide25. I have no fear of non-poisonous spiders.⁎26. I wouldn't take a course in biology if I thought I might have to handl27. Spider webs are very artistic.⁎28. I think that I'm no more afraid of spiders than the average person.⁎29. I would prefer not to finish a story if something about spiders was in30. Not only am I afraid of spiders but millipedes and caterpillars make31. Even if I was late for a very important appointment, the thought of sp
through an underpass.
Note. Factor loadings ≥ |.40| are listed in boldface type; ⁎=reversed sco
To carry out RC-IRT, the user specifies themaximum order and number of equally spacedknots for the B-splines. Order refers to the order ofthe polynomial B-splines (one more than degree),and knots are locations on the abscissa wheredifferent B-splines are joined together smoothly.For a single data set, RCLOG estimates a Ramsaycurve for up to 25 combinations of order andnumber of knots, and the user selects one modelto interpret. Model selection is based on a plotof all candidate Ramsay curves, and an informa-tion criterion like the Hannan-Quinn index (HQ;Hannan, 1987). The HQ is a function of themaximized log likelihood with a penalty for thenumber of parameters estimated; smaller valuesindicate better models. The Ramsay curve withorder and number of knots equal to 2 (and meanand variance fixed to 0 and 1 respectively) is thenormal distribution. Woods (2006) showed thatwith order 2 and 2 knots, RCLOG and MULTI-LOG results are identical.
Factor1
Factor2
h2
ers about. .65 .05 .53.69 .08 .45
ring a motion picture, I turn my head away. .68 .18 .33.61 .32 .30
nless someone kills it for me. .85 − .02 .29.04 .81 .29.86 .01 .22
ert and edgy. .94 − .05 .15ere might be spiders down there. .80 .04 .30ok it out of the closet to put it on. .74 − .00 .44
.98 − .08 .11
.12 .84 .38
.83 .00 .29
.00 .68 .53
.81 .13 .20in whom I have confidence.⁎ .10 .31 .85
.11 .78 .27
.39 .07 .80
.62 .25 .38
.34 .24 .73. .82 .06 .26
.79 − .03 .39the greater prevalence of tarantulas. .66 − .00 .56rs. .62 − .17 .69
.49 .03 .74e live spiders. .57 − .07 .71
− .10 .38 .88.39 .02 .83
troduced into the plot. .66 .16 .40me feel anxious. .58 .07 .60iders would stop me from taking a shortcut .67 .01 .53
red item; h2=communality.
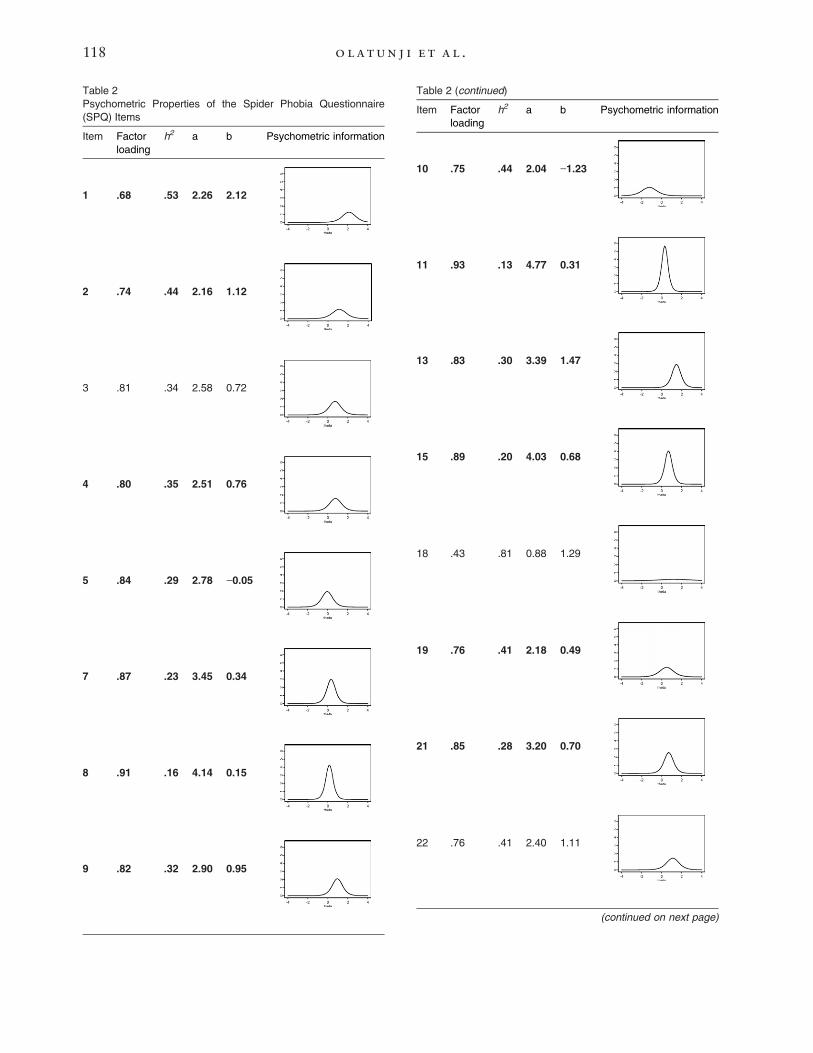
Table 2Psychometric Properties of the Spider Phobia Questionnaire(SPQ) Items
Item Factorloading
h2 a b Psychometric information
1 .68 .53 2.26 2.12
2 .74 .44 2.16 1.12
3 .81 .34 2.58 0.72
4 .80 .35 2.51 0.76
5 .84 .29 2.78 −0.05
7 .87 .23 3.45 0.34
8 .91 .16 4.14 0.15
9 .82 .32 2.90 0.95
Table 2 (continued)
Item Factorloading
h2 a b Psychometric information
10 .75 .44 2.04 −1.23
11 .93 .13 4.77 0.31
13 .83 .30 3.39 1.47
15 .89 .20 4.03 0.68
18 .43 .81 0.88 1.29
19 .76 .41 2.18 0.49
21 .85 .28 3.20 0.70
22 .76 .41 2.40 1.11
(continued on next page)
118 olatun j i e t al .
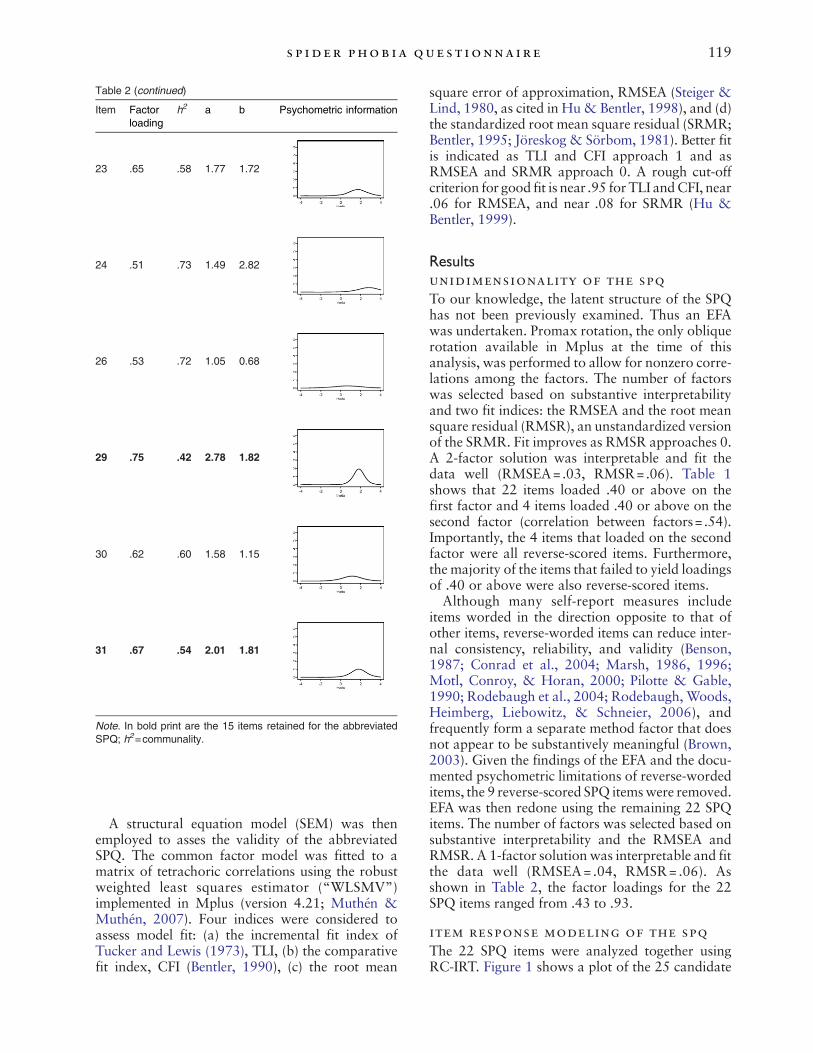
Table 2 (continued)
Item Factorloading
h2 a b Psychometric information
23 .65 .58 1.77 1.72
24 .51 .73 1.49 2.82
26 .53 .72 1.05 0.68
29 .75 .42 2.78 1.82
30 .62 .60 1.58 1.15
31 .67 .54 2.01 1.81
Note. In bold print are the 15 items retained for the abbreviatedSPQ; h2=communality.
119s p ider phob ia que s t ionna i r e
A structural equation model (SEM) was thenemployed to asses the validity of the abbreviatedSPQ. The common factor model was fitted to amatrix of tetrachoric correlations using the robustweighted least squares estimator (“WLSMV”)implemented in Mplus (version 4.21; Muthén &Muthén, 2007). Four indices were considered toassess model fit: (a) the incremental fit index ofTucker and Lewis (1973), TLI, (b) the comparativefit index, CFI (Bentler, 1990), (c) the root mean
square error of approximation, RMSEA (Steiger &Lind, 1980, as cited in Hu& Bentler, 1998), and (d)the standardized root mean square residual (SRMR;Bentler, 1995; Jöreskog & Sörbom, 1981). Better fitis indicated as TLI and CFI approach 1 and asRMSEA and SRMR approach 0. A rough cut-offcriterion for good fit is near .95 for TLI andCFI, near.06 for RMSEA, and near .08 for SRMR (Hu &Bentler, 1999).
Resultsunidimensionality of the spq
To our knowledge, the latent structure of the SPQhas not been previously examined. Thus an EFAwas undertaken. Promax rotation, the only obliquerotation available in Mplus at the time of thisanalysis, was performed to allow for nonzero corre-lations among the factors. The number of factorswas selected based on substantive interpretabilityand two fit indices: the RMSEA and the root meansquare residual (RMSR), an unstandardized versionof the SRMR. Fit improves as RMSR approaches 0.A 2-factor solution was interpretable and fit thedata well (RMSEA=.03, RMSR=.06). Table 1shows that 22 items loaded .40 or above on thefirst factor and 4 items loaded .40 or above on thesecond factor (correlation between factors= .54).Importantly, the 4 items that loaded on the secondfactor were all reverse-scored items. Furthermore,the majority of the items that failed to yield loadingsof .40 or above were also reverse-scored items.Although many self-report measures include
items worded in the direction opposite to that ofother items, reverse-worded items can reduce inter-nal consistency, reliability, and validity (Benson,1987; Conrad et al., 2004; Marsh, 1986, 1996;Motl, Conroy, & Horan, 2000; Pilotte & Gable,1990; Rodebaugh et al., 2004; Rodebaugh, Woods,Heimberg, Liebowitz, & Schneier, 2006), andfrequently form a separate method factor that doesnot appear to be substantively meaningful (Brown,2003). Given the findings of the EFA and the docu-mented psychometric limitations of reverse-wordeditems, the 9 reverse-scored SPQ itemswere removed.EFA was then redone using the remaining 22 SPQitems. The number of factors was selected based onsubstantive interpretability and the RMSEA andRMSR. A 1-factor solution was interpretable and fitthe data well (RMSEA= .04, RMSR= .06). Asshown in Table 2, the factor loadings for the 22SPQ items ranged from .43 to .93.
item response modeling of the spq
The 22 SPQ items were analyzed together usingRC-IRT. Figure 1 shows a plot of the 25 candidate
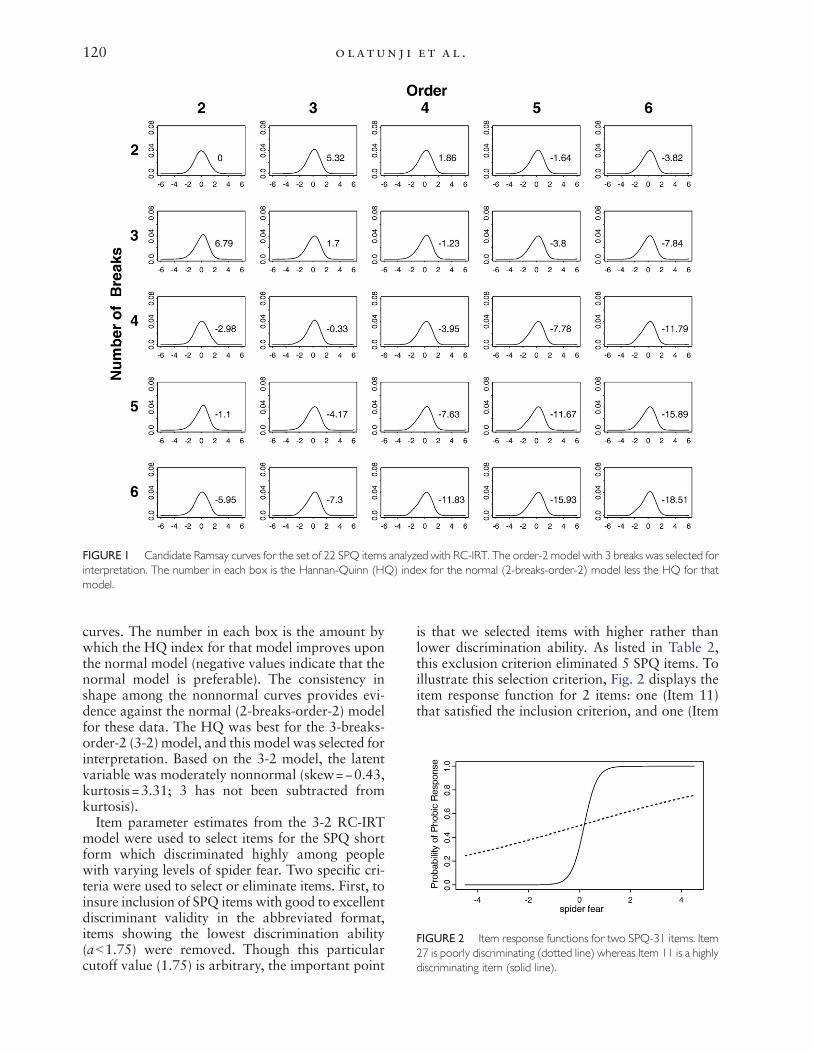
FIGURE 1 Candidate Ramsay curves for the set of 22 SPQ items analyzed with RC-IRT. The order-2 model with 3 breaks was selected forinterpretation. The number in each box is the Hannan-Quinn (HQ) index for the normal (2-breaks-order-2) model less the HQ for thatmodel.
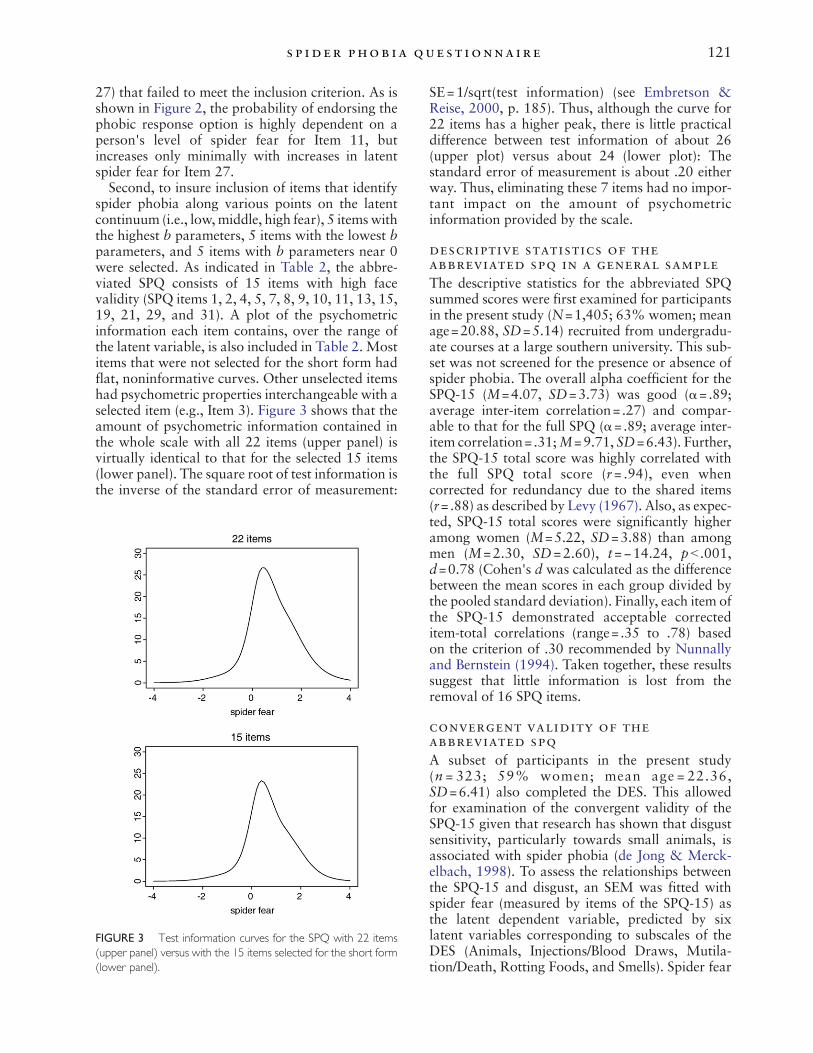
FIGURE 2 Item response functions for two SPQ-31 items. Item27 is poorly discriminating (dotted line) whereas Item 11 is a highlydiscriminating item (solid line).
120 olatun j i e t al .
curves. The number in each box is the amount bywhich the HQ index for that model improves uponthe normal model (negative values indicate that thenormal model is preferable). The consistency inshape among the nonnormal curves provides evi-dence against the normal (2-breaks-order-2) modelfor these data. The HQ was best for the 3-breaks-order-2 (3-2) model, and this model was selected forinterpretation. Based on the 3-2 model, the latentvariable was moderately nonnormal (skew=−0.43,kurtosis=3.31; 3 has not been subtracted fromkurtosis).Item parameter estimates from the 3-2 RC-IRT
model were used to select items for the SPQ shortform which discriminated highly among peoplewith varying levels of spider fear. Two specific cri-teria were used to select or eliminate items. First, toinsure inclusion of SPQ items with good to excellentdiscriminant validity in the abbreviated format,items showing the lowest discrimination ability(ab1.75) were removed. Though this particularcutoff value (1.75) is arbitrary, the important point
is that we selected items with higher rather thanlower discrimination ability. As listed in Table 2,this exclusion criterion eliminated 5 SPQ items. Toillustrate this selection criterion, Fig. 2 displays theitem response function for 2 items: one (Item 11)that satisfied the inclusion criterion, and one (Item
121s p ider phob ia que s t ionna i r e
27) that failed to meet the inclusion criterion. As isshown in Figure 2, the probability of endorsing thephobic response option is highly dependent on aperson's level of spider fear for Item 11, butincreases only minimally with increases in latentspider fear for Item 27.Second, to insure inclusion of items that identify
spider phobia along various points on the latentcontinuum (i.e., low,middle, high fear), 5 itemswiththe highest b parameters, 5 items with the lowest bparameters, and 5 items with b parameters near 0were selected. As indicated in Table 2, the abbre-viated SPQ consists of 15 items with high facevalidity (SPQ items 1, 2, 4, 5, 7, 8, 9, 10, 11, 13, 15,19, 21, 29, and 31). A plot of the psychometricinformation each item contains, over the range ofthe latent variable, is also included in Table 2. Mostitems that were not selected for the short form hadflat, noninformative curves. Other unselected itemshad psychometric properties interchangeable with aselected item (e.g., Item 3). Figure 3 shows that theamount of psychometric information contained inthe whole scale with all 22 items (upper panel) isvirtually identical to that for the selected 15 items(lower panel). The square root of test information isthe inverse of the standard error of measurement:
FIGURE 3 Test information curves for the SPQ with 22 items(upper panel) versus with the 15 items selected for the short form(lower panel).
SE=1/sqrt(test information) (see Embretson &Reise, 2000, p. 185). Thus, although the curve for22 items has a higher peak, there is little practicaldifference between test information of about 26(upper plot) versus about 24 (lower plot): Thestandard error of measurement is about .20 eitherway. Thus, eliminating these 7 items had no impor-tant impact on the amount of psychometricinformation provided by the scale.
descriptive statistics of theabbreviated spq in a general sample
The descriptive statistics for the abbreviated SPQsummed scores were first examined for participantsin the present study (N=1,405; 63% women; meanage=20.88, SD=5.14) recruited from undergradu-ate courses at a large southern university. This sub-set was not screened for the presence or absence ofspider phobia. The overall alpha coefficient for theSPQ-15 (M=4.07, SD=3.73) was good (α=.89;average inter-item correlation= .27) and compar-able to that for the full SPQ (α=.89; average inter-item correlation= .31;M=9.71, SD=6.43). Further,the SPQ-15 total score was highly correlated withthe full SPQ total score (r= .94), even whencorrected for redundancy due to the shared items(r=.88) as described by Levy (1967). Also, as expec-ted, SPQ-15 total scores were significantly higheramong women (M=5.22, SD=3.88) than amongmen (M=2.30, SD=2.60), t=−14.24, pb .001,d=0.78 (Cohen's d was calculated as the differencebetween the mean scores in each group divided bythe pooled standard deviation). Finally, each item ofthe SPQ-15 demonstrated acceptable correcteditem-total correlations (range=.35 to .78) basedon the criterion of .30 recommended by Nunnallyand Bernstein (1994). Taken together, these resultssuggest that little information is lost from theremoval of 16 SPQ items.
convergent validity of theabbreviated spq
A subset of participants in the present study(n = 323; 59% women; mean age = 22.36,SD=6.41) also completed the DES. This allowedfor examination of the convergent validity of theSPQ-15 given that research has shown that disgustsensitivity, particularly towards small animals, isassociated with spider phobia (de Jong & Merck-elbach, 1998). To assess the relationships betweenthe SPQ-15 and disgust, an SEM was fitted withspider fear (measured by items of the SPQ-15) asthe latent dependent variable, predicted by sixlatent variables corresponding to subscales of theDES (Animals, Injections/Blood Draws, Mutila-tion/Death, Rotting Foods, and Smells). Spider fear
122 olatun j i e t al .
was expected to be best predicted by the core dis-gust (i.e., animals, rotting foods) and less stronglyby subscales that remind humans they are animals(i.e., injections and blood draws, and mutilationand death). The WLSMV estimator in the Mplusprogram was used to fit the model. Global modelfit was evaluated with the TLI and RMSEAdescribed earlier, as well as the weighted rootmean square residual (WRMR), a statistic similarto SRMR except that it is weighted by the varianceof the parameter estimates. WRMR ranges from 0to infinite, with smaller values indicating better fit.Global fit was acceptable (TLI= .96, RMSEA=.08,WRMR=1.42). Spider fear was significantly pre-dicted by DES Animals with a standardizedregression coefficient (B) of .96. The SPQ-15 factorwas also significantly predicted by DES Mutilationand Death. However, this relationship was in theinverse direction (Β=− .26). Multiple R2 showedthat the DES predictors explained 64% of variancein SPQ-15.1
divergent validity of the abbreviatedspq
A second (independent from those used for theconvergent validity analysis) subset of participantsin the present study (n=430; 61% women; meanage=20.86, SD=4.84) also completed the IPS-Anxand the ASI. This allowed for examination of thedivergent validity of the SPQ-15. Anxiety sensitiv-ity (AS), as assessed by the ASI, refers to the fear ofanxiety-related bodily sensations derived frombeliefs that these symptoms have harmful con-sequences (Reiss & McNally, 1985). The literaturesuggests that AS is a risk factor for the develop-ment of anxiety-related conditions, especially panicdisorder, but not for specific phobias (e.g., Taylor,Koch, McNally, 1992). Furthermore, there isevidence that specific phobias co-occur at a highrate (Magee et al., 1996). Consequently, the SPQ-15 was expected to be modestly predicted by theIPS-Anx, a measure of injection phobia, but not bythe ASI. An SEM was fitted with spider fear pre-dicted by two latent variables corresponding to theASI (Physical Concerns, Mental Incapacitation)and one additional injection phobia latent variablethat consisted of the 18-item IPS-Anx, injection-related fainting, and injection-related avoidance.Global fit was acceptable (TLI= .97, RMSEA=.06,WRMR=1.39). As predicted, the SPQ-15 factorwas significantly predicted by injection phobiawith a standardized regression coefficient of .34.The SPQ-15 factor was not predicted by AS related
1 These analyses were repeated using the full SPQ and thefindings were identical.
to Physical Concerns (Β=.14) or Mental Incapaci-tation (Β= .00). Multiple R2 showed that thepredictors explained 17% of variance in SPQ-15.2
Study 2 Methods: Behavioral Validation of theSPQ-15participant selection
Participants were selected from a pool of under-graduate students enrolled in introductory psycho-logy courses. Fifty participants (mean age=19.86;SD=5.18) were selected and classified into twomutually exclusive groups. The spider fearful group(n=22; 96% women) consisted of participantsreporting yes on a single item question inquiringabout avoidance of situations in which spiders maybe present. The nonfearful group (n=28; 100%women) consisted of participants reporting noavoidance of situations in which spiders may bepresent.
measure
The SPQ (Klorman et al., 1974), described in Study1, was administered.
behavioral avoidance task (bat)
Participants completed a BAT in which they wereinstructed to open a black box with a spider insidethat was placed 13 feet away on a small table. Thespider was a realistic-looking, but fake tarantulathat was 4 inches in length.
procedure
Following the informed consent and self-reportassessment process, participants were given a briefintroduction to the BAT. The participants wereinstructed to open the black box in order to look atthe spider that was inside. Participants were giventhe option to comply or refuse the task. If theparticipant chose not to comply, the experimenteropened the black box and the participant was askedhow close she would be willing to get to the openedbox in order to look at the spider. The participant'sphysical approach to the stimulus was thenmeasured in feet and inches (scores ranged from 0to 13 feet) using a scale that was disguised on theside wall.
Resultspreliminary analysis
The alpha coefficient for the SPQ-15 (M=6.24,SD=5.44) was good (α=.95; average inter-item
2 These analyses were repeated using the full SPQ and thefindings were identical.
123s p ider phob ia que s t ionna i r e
correlation=.56) and comparable to that of the fullSPQ (α=.96; average inter-item correlation= .45;M=13.05, SD=9.96). The SPQ-15 total score washighly correlated with the full SPQ total score(r=0.97), even when corrected for the redundantitems (r=0.94). SPQ-15 total scores were signifi-cantly higher among participants reporting avoid-ance of situations in which spiders may be present(M=11.90, SD=2.26) than among those partici-pants who reported no avoidance of situations inwhich spiders may be present (M=1.78, SD=1.77),t=17.74, pb .001 (d=1.86).
spq-15 and behavioral avoidance
The association between the SPQ-15 total score, thefull SPQ total score, and behavioral avoidance onthe BAT for the full sample was then examined.Percent refusal on the BATwas 36% (18/50), with amean approach of 10.30 feet (SD=4.06). The SPQ-15 was significantly associated with compliance (r=− .79) and approach behavior (r=− .75) on thespider BAT (p'sb .001). The association between theSPQ-15 and the behavioral avoidance outcomeswas also comparable to that of the full SPQ (r's=− .78 and − .74, respectively). A hierarchical multi-ple regression analysis was then conducted toexamine the specific contribution of the SPQ-15in predicting approach behavior on the BAT whencontrolling for group membership. Sets of predictorvariables were entered in two blocks. In the firstblock, group status was entered as a predictor. Inthe second block, the SPQ-15 was entered as apredictor. In the first step, group status explained asignificant portion of the variance in approachbehavior [Β= .73, pb .001; F (1, 48) =56.91,pb .001]. The SPQ-15 explained marginally sig-nificant additional variance in predicting approachbehavior (Β=− .47, pb .09).
Study 3 Methods: Pictorial Validation of theSPQ-15participant selection
One hundred sixteen students were selected basedon their scores on brief measures of injection andspider fear and were classified into three mutuallyexclusive groups. They participated in exchange forresearch credit.The Spider Fearful group (n=39; mean age=
19.44, SD=2.89; 74% women) consisted ofparticipants meeting the following criteria: scoringat least 1 SD above their respective gender meansfrom the selection pool on the SPQ; reportingavoidance of situations in which spiders may bepresent; scoring equal to or less than 2 SD belowthe injection phobia patient mean on the IPS-Anx;
and reporting neither dizziness in the presence ofblood-injection stimuli nor avoidance of medicalprocedures.The Blood-Injection-Injury (BII) Fearful group
(n=37; mean age=19.78, SD=3.44; 83% women)consisted of participants meeting the followingcriteria: scoring equal to or higher than the injectionphobia patient mean on the IPS-Anx (Öst et al.,1992); endorsement of dizziness in the presence ofblood-injection stimuli and/or avoidance of medicalprocedures; scoring equal to or less than theirrespective gender means on the SPQ; and reportingno avoidance of situations in which spiders may bepresent.The Nonfearful group (n=40; mean age=20.15,
SD=3.85; 75% women) consisted of participantsmeeting the following criteria: scoring equal to orless than 2 SD below the injection phobia patientmean on the IPS-Anx; reporting neither dizziness inthe presence of blood-injection stimuli nor avoid-ance of medical procedures; scoring equal to or lessthan their respective gender means on the SPQ; andreporting no avoidance of situations in whichspiders may be present.
measures
The SPQ and IPS-Anx, described in Study 1, wereadministered.The Picture Rating Scale (PRS; Tolin et al., 1997)
was used to assess participants' responses to thepictorial stimuli across subjective, motoric, physio-logical, and cognitive indicators of fear and disgust.The picture rating scale is an 8-item, 11-pointLikert-type scale ranging from 0 (not at all true) to10 (very true). Each response domain was precededby the question, “This picturemakesme feel…”: (1)afraid; (2) disgusted; (3) like running away; (4) likepushing the picture away fromme; (5) like my heartis pounding; (6) sick to my stomach; (7) like I am indanger; and (8) like I might be contaminated orinfected. Two composite scores were generatedbased on the PRS. First, the composite fear scorewas calculated by summing the items referring to thesubjective (“This picture makes me feel afraid”),physiological (“This picture makes my heartpound”), motoric (“This picture makes me wantto run away”), and cognitive (“This picture makesme feel like I am in danger”) dimensions of fear.Second, the composite disgust score was determinedby summing the items referring to the subjective/emotional (“This picture makes me feel disgusted”),physiological (“This picture makes me feel sick tomy stomach”), motoric (“This picture makes mewant to push the picture away from me”) and cog-nitive (“This picture makes me feel like I will becontaminated or infected”) components of disgust.

Table 3Association Between the Spider Phobia Questionnaire-15 (SPQ-15), the Spider Phobia Questionnaire (SPQ), and Fear andDisgust Ratings of Pictorial Stimuli
Emotion Picture Type SPQ-15 SPQ Mean (SD)
FearSurgical operations .08 .02 6.14 (8.71)Spiders .57⁎⁎⁎ .56⁎⁎⁎ 10.52 (11.07)Rotting foods .07 .04 2.42 (5.24)Body products .15 .08 2.98 (5.02)Flowers − .04 − .09 0.01 (0.13)
DisgustSurgical operations .06 .03 10.89 (11.10)Spiders .61⁎⁎⁎ .59⁎⁎⁎ 7.57 (9.57)Rotting foods .16 .15 11.74 (10.76)Body products .22⁎⁎ .21⁎ 14.60 (10.71)Flowers .10 .07 0.01 (0.13)
Note. N=116. ⁎pb .05, ⁎⁎pb .01, ⁎⁎⁎pb .001.
Table 4Specificity of the Spider Phobia Questionnaire-15 (SPQ-15) in thePrediction of Affective Responding to Spider Pictures
Δ R2 b SE Β t
Spider fearStep 1 .08⁎⁎Condition −3.85 1.23 − .28 −3.13⁎⁎Step 2a .29⁎⁎⁎SPQ-15 1.73 .23 .54 7.25⁎⁎⁎
Spider disgustStep 1 .05⁎Condition −2.77 1.07 − .23 −2.57⁎Step 2b .34⁎⁎⁎SPQ-15 1.61 .20 .59 7.97⁎⁎⁎
Note. b=unstandardized regression coefficient; SE=standarderror; Β=standardized regression; Condition: 1=blood phobic,2=spider phobic, 3=nonphobic; aR2=0.37, F (2, 112)=33.44,pb .001; bR2=0.39, F (2, 112)=36.90, pb .001. ⁎pb .05, ⁎⁎pb .01,⁎⁎⁎pb .001.
124 olatun j i e t al .
pictorial stimuli
A total of 100 pictures were selected for computerpresentation, comprised of five categories, eachcontaining 20 color photographs: (1) surgical opera-tions (thoracic and abdominal regions); (2) spiders;(3) rotting foods; (4) body products (e.g., feces,vomit); and (5) flowers. The pictures served as targetand distracter stimuli for a recognition memoryexperiment, the results of which are presentedelsewhere (Sawchuk, Meunier, Lohr, &Westendorf,2002). The pictures were roughly matched for size,brightness, and figure-ground proportions.
apparatus
An Apple Macintosh Quadra 700 computer usingPsyScope software presented the pictorial stimuli ona 17″ Vivitron 1776 color monitor.
procedure
The presentation of the pictorial stimuli for thememory experiment began each testing session.Following completion of the second phase of thememory experiment, one picture from each of thefive stimulus categories was randomly selected andpresented individually to the participant. Participantsthen completed a PRS for each of the selectedpictures.
Resultspreliminary analysis
The alpha coefficient for the SPQ-15 (M=4.15,SD=3.50) was good (α=.87; average inter-itemcorrelation= .27) and comparable to that of the fullSPQ (α=.88; average inter-item correlation= .19;M=9.62, SD=6.15). The SPQ-15 total score was
also highly correlated with the full SPQ total score(r=.93, corrected r=.86). Univariate analysis indi-cated that the spider fearful, blood fearful, andnonfearful groups were different with regards totheir scores on the SPQ-15, F(2, 112)=149.13,pb .001, and Tukey HSD comparisons suggestedthat these differences were in the expected direction,with the spider fearful group (M=8.28; SD=2.29)scoring significantly (pb .001; d=1.66) higher thanthe blood fearful group (M=2.47; SD=1.71), whoscored (p= .05; d= .52) higher than nonfearfulcontrols (M=1.65; SD=1.42).
spq-15 and affective responding topictorial stimuli
The association between the SPQ-15 total score, thefull SPQ total score, and affective responding topictorial stimuli for the full sample was then exa-mined. As shown in Table 3, the SPQ-15 was signi-ficantly associated with fear and disgust affectiveresponding to pictures of spiders (p'sb .001). Theassociation between the SPQ-15 and affectiveresponding to the spider pictures was also compar-able to that of the SPQ. The SPQ-15 was alsosignificantly associated with disgust responding topictures of body products (pb .01). No other signi-ficant associations were observed between the SPQ-15 and fear and disgust responding to the variouspicture categories. A hierarchical multiple regres-sion analysis was then conducted to examine thespecific contribution of the SPQ-15 in predictingfear and disgust responding to spider pictures whencontrolling for groupmembership (see Table 4). Setsof predictor variables were entered in two blocks. Inthe first block, group status was entered as a
125s p ider phob ia que s t ionna i r e
predictor. In the second block, the SPQ-15 wasentered as a predictor. Group status explained asignificant portion of the variance in the first steppredicting spider fear, F(1, 113)=9.81, pb .01, andspider disgust, F(1, 113)=6.62, pb .05. As shown inTable 4, the SPQ-15 explained significant additionalvariance in predicting fear (Β=.54, pb .001) anddisgust (Β=.59, pb .001) responding to the spiderpictures.
Study 4 Methods: Further Validation of theSPQ-15 in a Dutch Sample3
participant selection
Participants were those with a strong fear ofspiders who applied for treatment at the Ambula-torium of the Department of Psychology of theUniversity of Groningen. After a telephone inter-view, applicants were asked to write down in theirown words how fear of spiders interfered withtheir daily lives. Only individuals with high fearlevels who indicated that fear of spiders stronglyinterfered with daily life were invited for diagnosticassessment. During a focused clinical interview, itwas determined whether the fearful individuals metDSM-IV criteria for specific phobia. Interviewerswere trained and supervised by a Ph.D.-levelclinical psychologist specializing in anxiety disor-ders. Sixty-one participants (mean age=33.82;SD=11.05; 82% women) met diagnostic criteria.The control group consisted of 30 participants(mean age=35.18; SD=13.07; 80% women)reporting minimal fear, who did not meet diag-nostic criteria for specific phobia.
measure
The SPQ was administered.
bat
A BAT was used to assess avoidance of a medium-sized house spider (Tegenaria atrica). The spiderwas placed in a glass jar on a table. A pencil and aplastic washing bowl were also placed on this table.The participants were instructed as follows: “To getan impression of how far you dare to approach aspider, I will ask you to perform a number of steps.You are free to refuse each step, you are notrequired to force yourself. But, you should do yourvery best so that we get an impression of how faryou dare to go. Do you have any questionsconcerning this procedure?” The participant was
3 The SPQ was translated by Dutch colleagues with researchinterest in spider phobia. Although a backward translationprocedure was not employed for the measure used in the presentstudy, a recent back translation resulted in a satisfactory outcome.
instructed to perform each step following verbalinstructions given by the assistant, who remained inthe corner of the room. There were 8 steps: (1) walkas close to the spider as you can; (2) touch the jar;(3) open the jar; (4) take the jar in your hands; (5)touch the spider with the pencil; (6) put the spider inthe washing bowl; (7) touch the spider with a finger;(8) let the spider walk over your hands.After each instruction, the assistant asked the
participant whether he or she was willing to carryout the step or not. When participants refused, theinstructions describing the step were repeated. Toget a positive rating, participants had to start withthe step immediately after the instruction and hadto perform it successfully within 1 minute. VisualAnalogue Scales (VASs) were used to assess peakfear (extremely not fearful=0; extremely fear-ful=100) and peak disgust (extremely not dis-gusted=0; extremely disgusted=100) after eachstep. The BAT was scored on an 8-point scaleranging from 1 (spider at 4 meters) to 8 (spider onhand for at least 30 s).
preliminary analysis
The alpha coefficient for the SPQ-15 (M=7.43,SD=4.99) was good (α=.93; average inter-itemcorrelation= .48) and comparable to that of the fullSPQ (α=.96; average inter-item correlation= .41;M=14.81, SD=9.61). The SPQ-15 total score washighly correlated with the full SPQ total score(r=.97, corrected r=.93). SPQ-15 total scores weresignificantly higher among spider phobic partici-pants (M=10.67, SD=1.79) than among the con-trol group (M=0.86, SD=2.04), t=23.37, pb .001(d=1.96).
spq-15, behavioral avoidance, andaffective responding
The association between the SPQ-15 total score, thefull SPQ total score, and behavioral avoidance andaffective responding on the spider BAT for the fullsample was then examined. The SPQ-15 wassignificantly negatively associated with approachbehavior avoidance (r=− .76; M=5.08, SD=2.58),fear (r=.79; M=54.37, SD=39.59) and disgust(r= .68; M=38.85, SD=40.62) (p'sb .001), andthese associations were comparable to associationswith the full SPQ (r's =− .79, .81, and .70,respectively). A hierarchical multiple regressionanalysis was then conducted to examine the specificcontribution of the SPQ-15 in predicting behavioralavoidance on the BAT controlling for groupmembership. Sets of predictor variables wereentered in two blocks. In the first block, groupstatus was entered as a predictor. In the secondblock, the SPQ-15 was entered as a predictor.
126 olatun j i e t al .
Group status explained a significant portion of thevariance in the first step (Β=− .70, pb .001)predicting behavioral avoidance, F(1, 89)=88.95,pb .001. The SPQ-15 explained significant addi-tional variance in predicting behavioral avoidance(Β=− .78, pb .001).
Study 5 Methods: Treatment Sensitivity of theSPQ-15participant selection
Individuals with spider phobia (N=30) completingthe treatment program (mean age=32.6 years,SD=10.7, range=18–55) were predominantlyfemale (83%). In addition to exhibiting extremefear and avoidance toward spiders, phobic partici-pants were required to be over 17 years old and notsuffering from current major depression or psycho-sis. An additional exclusion criterion was that thespider phobic participants could not have anextreme fear of snakes, as indicated by self-reportduring the initial telephone screen. Most of the 30participants in the nonphobic control group werefemale (77%), and they had a mean age of 24.0years (SD=9.4, range=17–56).
measures
Diagnosis. The specific phobia, major depres-sion, and psychotic screening sections of theStructured Clinical Interview for DSM–IV (SCID–IV; First, Spitzer, Gibbon, & Williams, 1997) wereadministered during an initial telephone interviewfor all participants. Spider phobia diagnoses wereconfirmed during an individualized interview inpreparation for group treatment.
Questionnaire. The SPQ was administered.
procedure
Participants were recruited from a university cam-pus and surrounding communities by posting signsand advertisements in local newspapers and offer-ing monetary compensation. Notices directedtoward phobic participants also offered free treat-ment in conjunction with participation in a researchstudy. Interested participants phoned the clinicwhere they were administered the diagnostic screen-ing interview by telephone. Phobic participantssubsequently took part in an idiographic assess-ment session followed by three weekly 90-mingroup treatment sessions.
Treatment. The treatment protocol was based onMastery of Your Specific Phobia: Therapist Guide(Antony, Barlow, & Craske, 1997). The protocolwas modified to fit a weekly, three-session groupformat, given evidence that spider phobia can beeffectively treated with a short, intensive exposure
program (Arntz, Lavy, van den Berg, & vanRijsoort, 1993; Öst, 1996). Groups varied in sizefrom 2 to 6 persons (mean size=3.7 persons,SD=1.0). The therapist for the study was trainedand supervised (using audiotapes of sessions) by alicensed clinical psychologist specializing in thetreatment of anxiety disorders, and supervisionwas maintained throughout the study. A trainedresearch assistant accompanied the therapist duringeach session to serve as a note taker and to modelinteractions with the spider. Different assistantswere used for various groups, but all were graduatestudents who were familiar with the principles ofcognitive behavior therapy. The treatment involvedgradual in vivo exposure. Participants were simul-taneously encouraged to counter their maladaptivebeliefs, such as that spiders are dangerous or thatanxiety is unmanageable. Further, informationabout the general dangerousness of spiders as wellas information about poisonous local spiders wasprovided (see Teachman & Woody, 2003, forfurther detail).
Resultspreliminary analysis
The alpha coefficient for the SPQ-15 (pretreatmentM = 6.11, SD = 4.60; posttreatment M = 3.85,SD=3.36) was good (pretreatment α=.92, averageinter-item correlation= .40; postreatment α=.85,average inter-item correlation=.26) and comparableto that of the full SPQ (pretreatment α=.94, averageinter-item correlation=.31, M=12.43, SD=8.31;postreatment α=.80, average inter-item correla-tion=.12, M=8.59, SD=4.76). The SPQ-15 totalscore was highly correlated with the full SPQ totalscore at pretreatment (r=.97, corrected r=.93) andpostreatment (r=.86, corrected r=.75). PretreatmentSPQ-15 total scores were significantly higher amongspider phobic participants (M=10.31, SD=2.39)than the nonphobic group (M=2.06, SD=1.50),t=16.35, pb .001 (d=1.79). Pretreatment SPQ-15total scores were also significantly correlated withposttreatment SPQ-15 total scores among spiderphobic (r=.56) and nonphobic (r=.70) participants.
sensitivity of the spq-15 to treatment
A 2 (phobic group vs. control group)×2 (pretreat-ment vs. posttreatment) mixed factor analysis ofvariance with SPQ-15 scores as the repeated mea-sure was calculated to examine treatment efficacy. Asignificant interaction was expected, showingreduced fear responding following treatment forthe phobic group but no change over time for thecontrol group. Consistent with these predictions, asignificant Group×Treatment interaction was
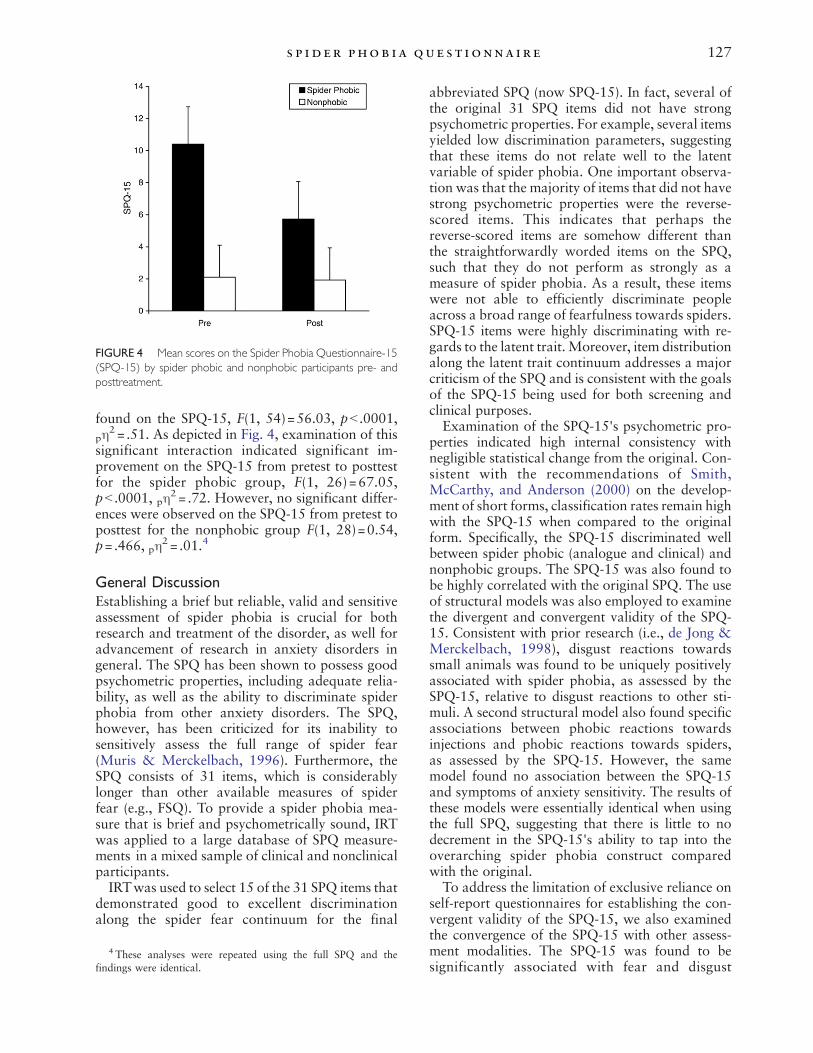
FIGURE 4 Mean scores on the Spider Phobia Questionnaire-15(SPQ-15) by spider phobic and nonphobic participants pre- andposttreatment.
127s p ider phob ia que s t ionna i r e
found on the SPQ-15, F(1, 54)=56.03, pb .0001,pη
2 = .51. As depicted in Fig. 4, examination of thissignificant interaction indicated significant im-provement on the SPQ-15 from pretest to posttestfor the spider phobic group, F(1, 26)=67.05,pb .0001, pη
2 = .72. However, no significant differ-ences were observed on the SPQ-15 from pretest toposttest for the nonphobic group F(1, 28)=0.54,p=.466, pη
2 = .01.4
General DiscussionEstablishing a brief but reliable, valid and sensitiveassessment of spider phobia is crucial for bothresearch and treatment of the disorder, as well foradvancement of research in anxiety disorders ingeneral. The SPQ has been shown to possess goodpsychometric properties, including adequate relia-bility, as well as the ability to discriminate spiderphobia from other anxiety disorders. The SPQ,however, has been criticized for its inability tosensitively assess the full range of spider fear(Muris & Merckelbach, 1996). Furthermore, theSPQ consists of 31 items, which is considerablylonger than other available measures of spiderfear (e.g., FSQ). To provide a spider phobia mea-sure that is brief and psychometrically sound, IRTwas applied to a large database of SPQ measure-ments in a mixed sample of clinical and nonclinicalparticipants.IRTwas used to select 15 of the 31 SPQ items that
demonstrated good to excellent discriminationalong the spider fear continuum for the final
4 These analyses were repeated using the full SPQ and thefindings were identical.
abbreviated SPQ (now SPQ-15). In fact, several ofthe original 31 SPQ items did not have strongpsychometric properties. For example, several itemsyielded low discrimination parameters, suggestingthat these items do not relate well to the latentvariable of spider phobia. One important observa-tion was that the majority of items that did not havestrong psychometric properties were the reverse-scored items. This indicates that perhaps thereverse-scored items are somehow different thanthe straightforwardly worded items on the SPQ,such that they do not perform as strongly as ameasure of spider phobia. As a result, these itemswere not able to efficiently discriminate peopleacross a broad range of fearfulness towards spiders.SPQ-15 items were highly discriminating with re-gards to the latent trait. Moreover, item distributionalong the latent trait continuum addresses a majorcriticism of the SPQ and is consistent with the goalsof the SPQ-15 being used for both screening andclinical purposes.Examination of the SPQ-15's psychometric pro-
perties indicated high internal consistency withnegligible statistical change from the original. Con-sistent with the recommendations of Smith,McCarthy, and Anderson (2000) on the develop-ment of short forms, classification rates remain highwith the SPQ-15 when compared to the originalform. Specifically, the SPQ-15 discriminated wellbetween spider phobic (analogue and clinical) andnonphobic groups. The SPQ-15 was also found tobe highly correlated with the original SPQ. The useof structural models was also employed to examinethe divergent and convergent validity of the SPQ-15. Consistent with prior research (i.e., de Jong &Merckelbach, 1998), disgust reactions towardssmall animals was found to be uniquely positivelyassociated with spider phobia, as assessed by theSPQ-15, relative to disgust reactions to other sti-muli. A second structural model also found specificassociations between phobic reactions towardsinjections and phobic reactions towards spiders,as assessed by the SPQ-15. However, the samemodel found no association between the SPQ-15and symptoms of anxiety sensitivity. The results ofthese models were essentially identical when usingthe full SPQ, suggesting that there is little to nodecrement in the SPQ-15's ability to tap into theoverarching spider phobia construct comparedwith the original.To address the limitation of exclusive reliance on
self-report questionnaires for establishing the con-vergent validity of the SPQ-15, we also examinedthe convergence of the SPQ-15 with other assess-ment modalities. The SPQ-15 was found to besignificantly associated with fear and disgust
128 olatun j i e t al .
ratings to pictures of spiders, and generallyunrelated to fear and disgust ratings to pictures ofother stimulus categories. Furthermore, the SPQ-15predicted avoidance of spiders above and beyondphobic group membership, indicating incrementalvalidity. Moreover, Study 5 found that the SPQ-15showed significant change over time during expo-sure-based treatment, thereby highlighting thepotential clinical utility of the SPQ-15.The results of this study offer supportive evidence
for a brief measure of spider phobia that demon-strates initial psychometric strengths and potentialclinical utility. With regards to “time-saving bene-fits,” the original SPQ takes approximately 5minutes to complete (Antony et al., 2001). By redu-cing the SPQ to 15 items, a valid assessment ofspider phobia may be obtained in less than 2minutes. This time savings could allow for addi-tional brief assessments of related constructs in theresearch setting. Overall, the SPQ-15 shows pro-mise as a brief measure of spider phobia that,despite its brevity, demonstrates initial psychome-tric properties on par with the longer SPQ.Consequently, the SPQ-15 appears suitable for usein clinical and research settings where time andresources do not permit administration of lengthysymptom interviews. Despite these encouragingresults, however, additional refinement and valida-tion of the SPQ-15 may be required. One specificissue is the response format of the SPQ-15. Like theoriginal, the SPQ-15 consists of a true/false res-ponse format, but converting it to a Likert-typeresponse format may improve its predictive utility.Although the present study provides normativeSPQ-15 scores for various samples, including aDutch clinical sample, additional psychometric re-search is needed to determine potential clinicalcutoff scores across different cultures. Futureresearch employing independent administrations(from the SPQ-31) of the SPQ-15 will also beneeded to examine whether the short from ispredictive of clinically meaningful reductions inspider phobia rather than statistical symptomchange, as reported in the present study.
ReferencesAmerican Psychiatric Association. (1994). Diagnostic and
statistical manual of mental disorders, 4th ed. Washington,DC: Author.
Antony, M. M., Barlow, D. H., & Craske, M. J. (1997).Mastery of your specific phobia: Therapist guide. SanAntonio, TX: The Psychological Corporation.
Antony, M. M., Orsillo, S. M., & Roemer, L. (2001).Practitioner's guide to empirically based measures ofanxiety. New York: Plenum Press.
Arntz, A., Lavy, E., van den Berg, G., & van Rijsoort, S. (1993).Negative beliefs of spider phobics: A psychometric evalua-
tion of the Spider Phobia Beliefs Questionnaire. Advances inBehaviour Research and Therapy, 15, 257–277.
Arrindell, W. A., Pickersgill, M. J., Merckelbach, H., Ardon, A.M., & Cornet, F. C. (1991). Phobic dimensions. 3. Factoranalytic approaches to the study of common phobic fears—an updated review of findings obtained with adult subjects.Advances in Behaviour Research and Therapy, 13, 73–130.
Beevers, C., Strong, D., Meyer, B., Pilkonis, P., & Miller, I.(2007). Efficiently assessing negative cognition in depres-sion: An item response theory analysis of the DysfunctionalAttitude Scale. Psychological Assessment, 19, 199–209.
Benson, J. (1987). Detecting item bias in affective scales.Educational and Psychological Measurement, 47, 55–67.
Bentler, P. M. (1990). Comparative fit indices in structuralmodels. Psychological Bulletin, 107, 238–246.
Bentler, P. M. (1995). EQS structural equations programmanual Encino, CA: Multivariate Software.
Birnbaum, A. (1968). Some latent trait models and their usein inferring an examinee's ability. In F. M. Lord, & R.Novick (Eds.), Statistical theories of mental test scores(pp. 395–479). Reading, MA: MIT Press.
Blais, M. A., Otto, M. W., Zucker, B. G., McNally, R. M.,Schmidt, N. B., Fava, M., & Pollack, M. H. (2001). TheAnxiety Sensitivity Index: Item analysis and suggestions forrefinement. Journal of Personality Assessment, 77, 272–294.
Brown, T. (2003). Confirmatory factor analysis of the PennState Worry Questionnaire: Multiple factors or methodeffects? Behaviour Research and Therapy, 41, 1411–1426.
Chapman, T. F. (1997). The epidemiology of fears and phobias.In G. C. L. Davey (Ed.), Phobias: A handbook of theory,research and treatment Chichester: Wiley.
Conrad, K. J., Wright, B. D., McKnight, P., McFall, A.,Fontana, A., & Rosenheck, R. (2004). Comparing tradi-tional and Rasch analyses of the Mississippi PTSD scale:Revealing limitations of reverse-scored items. Journal ofApplied Measurement, 5, 15–30.
Davey, G. C. L. (1992). Characteristics of individuals with fearof spiders. Anxiety Research, 4, 299–314.
de Boor, C. (2001). A practical guide to splines, Rev. ed. NewYork: Springer-Verlag.
de Jong, P. J., & Merckelbach, H. (1998). Blood-injection-injury phobia and fear of spiders: Domain specific individualdifferences in disgust sensitivity. Personality and IndividualDifferences, 24, 153–158.
Embretson, S. E. (1996). The new rules of measurement.Psychological Assessment, 8, 341–349.
Embretson, S. E., & Reise, S. P. (2000). Item response theory forpsychologists. Mahwah, NJ: Lawrence Erlbaum.
First, M. B., Spitzer, R. L., Gibbon, M., & Williams, J. B. W.(1997). Structured Clinical Interview for DSM–IV Axis IDisorders. Washington, DC: American PsychiatricAssociation.
Fredrikson, M. (1983). Reliability and validity of some specificfear questionnaires. Scandinavian Journal of Psychology,79, 331–334.
Hannan, E. J. (1987). Rational transfer function approximation.Statistical Science, 2, 135–161.
Hellstrom, K., & Öst, L. -G. (1995). One-session therapistdirected exposure vs. two forms of manual directed selfexposure in the treatment of spider phobia. BehaviourResearch and Therapy, 33, 959–965.
Hu, L., & Bentler, P. M. (1998). Fit indices in covariancestructure modeling: Sensitivity to underparameterized modelmisspecification. Psychological Methods, 3, 424–453.
Hu, L., & Bentler, P. M. (1999). Cutoff criteria for fit indexes incovariance structure analysis: Conventional criteria versusnew alternatives. Structural Equation Modeling, 6, 1–55.
129s p ider phob ia que s t ionna i r e
Jöreskog, K. G., & Sörbom, D. (1981). LISREL V: Analysis oflinear structural relationships by the method of maximumlikelihood. Chicago: National Education Resources.
Kessler, R. C., Berglund, P., Demler, O., Jin, R., Merikangas, K.,& Walters, E. E. (2005). Lifetime prevalence and age-of-onset distributions of DSM-IV disorders in the NationalComorbidity Survey Replication. Archives of GeneralPsychiatry, 62, 593–602.
Kindt, M., Brosschot, J. F., & Muris, P. (1996). Spider PhobiaQuestionnaire for Children (SPQC): A psychometric studyand normative data. Behaviour Research and Therapy, 34,277–282.
Kleinknecht, R. A., Kleinknecht, E. E., & Thorndike, R. M.(1997). The role of disgust and fear in blood and injection-related fainting symptoms: A structural equation model.Behaviour Research and Therapy, 35, 1075–1087.
Klorman, R., Hastings, J., Weerts, T., Melamed, B., & Lang, P.(1974). Psychometric description of some specific fearquestionnaires. Behavior Therapy, 5, 401–409.
Levy, P. (1967). The correction for spurious correlation inthe evaluation of short-form tests. Journal of ClinicalPsychology, 23, 84–86.
Magee, W. J., Eaton, W. W., Wittchen, H. -U., McGonagle,K. A., & Kessler, R. C. (1996). Agoraphobia, simplephobia, and social phobia in the National ComorbiditySurvey. Archives of General Psychiatry, 53, 159–168.
Marsh, H. W. (1986). Negative item bias in ratings scales forpreadolescent children: A cognitive-developmental phenom-enon. Developmental Psychology, 22, 37–49.
Marsh, H. W. (1996). Positive and negative global self-esteem:A substantively meaningful distinction or artifactors?Journal of Personality and Social Psychology, 70, 810–819.
McWilliams, L. A., Stewart, S. H., & MacPherson, P. S. R.(2000). Does the social concerns component of the AnxietySensitivity Index belong to the domain of anxiety sensitivityor negative evaluation sensitivity? Behaviour Research andTherapy, 38, 985–992.
Motl, R. W., Conroy, D. E., & Horan, P. M. (2000). The SocialPhysique Anxiety Scale: An example of the potentialconsequence of negatively worded items in factorial validitystudies. Journal of Applied Measurement Special Issue:Constructing Variables, 1, 327–345.
Muris, P., & Merckelbach, H. (1996). A comparison of twospider fear questionnaires. Journal of Behavior Therapy andExperimental Psychiatry, 27, 241–244.
Muthén, L. K., & Muthén, B. O. (2007). Mplus: Statisticalanalysis with latent variables (Version 4.21) [Computersoftware]. Los Angeles: Muthén & Muthén.
Nunnally, J., & Bernstein, I. (1994). Psychometric theory. NewYork: McGraw-Hill.
Olatunji, B. O., & Deacon, B. J. (2008). Specificity of disgustsensitivity in the prediction of fear and disgust responding toa brief spider exposure. Journal of Anxiety Disorders, 22,328–336.
Olatunji, B. O., & McKay, D. (2007). Disgust and psychiatricillness: Have we remembered? British Journal of Psychiatry,190, 457–459.
Öst, L. -G. (1978). Fading vs. systematic desensitization in thetreatment of snake and spider phobia. Behaviour Researchand Therapy, 16, 379–389.
Öst, L. -G. (1996). One-session group treatment of spiderphobia. Behaviour Research and Therapy, 34, 707–715.
Öst, L. G., Hellstrom, K., & Kaver, A. (1992). One versus fivesessions of exposure in the treatment of injection phobia.Behavior Therapy, 23, 263–282.
Packer, J. S., Bond, N., & Siddle, D. A. T. (1987). Animalfears in the antipodes: Normative data from an Austra-
lian sample. Scandinavian Journal of Psychology, 28,150–156.
Pilotte, W. J., &Gable, R. K. (1990). The impact of positive andnegative item stems on the validity of a computer anxietyscale. Educational and Psychological Measurement, 50,603–610.
Reiss, S., & McNally, R. J. (1985). Expectancy model of fear.In S. Reiss, & R. R. Bootzin (Eds.), Theoretical issues inbehavior therapy (pp. 107–121). San Diego: AcademicPress.
Reiss, S., Peterson, R. A., Gursky, D. M., & McNally, R. J.(1986). Anxiety sensitivity, anxiety frequency, and theprediction of fearfulness. Behaviour Research and Therapy,24, 1–8.
Rodebaugh, T. L., Woods, C. M., Thissen, D. M., Heimberg,R. G., Chambless, D. L., & Rapee, R. M. (2004). Moreinformation from fewer questions: The factor structureand item properties of the original and brief Fear ofNegative Evaluation Scale. Psychological Assessment, 16,169–181.
Rodebaugh, T. L., Woods, C. M., Heimberg, R. G., Liebowitz,M. R., & Schneier, F. R. (2006). The factor structure andscreening utility of the Social Interaction Anxiety Scale.Psychological Assessment, 18, 231–237.
Sawchuk, C. N., Meunier, S. A., Lohr, J. M., & Westendorf,D. H. (2002). Fear, disgust, and information processingin specific phobia: The application of signal detectiontheory. Journal of Anxiety Disorders, 16, 495–510.
Smith, G. T., McCarthy, D. M., & Anderson, K. G. (2000).On the sins of short form development. PsychologicalAssessment, 12, 102–111.
Steiger, J. H., & Lind, J. C. (1980). Statistically-based tests forthe number of common factors. Paper presented at theannual spring meeting of the Psychometric Society, IowaCity May.
Straube, T., Glauer, M., Dilger, D., Mentzel, H. -J., &Miltner, W. (2006). Effects of cognitive-behavioral therapyon brain activation in specific phobia. NeuroImage, 29,129–135.
Straube, T., Mentzel, H. -J., & Miltner, W. (2006). Neuralmechanisms of automatic and direct processing of phobo-genic stimuli in specific phobia. Biological Psychiatry, 59,162–170.
Szymanski, J., & O'Donohue, W. (1995). Fear of SpidersQuestionnaire. Journal of Behavior Therapy and Experi-mental Psychiatry, 26, 31–34.
Taylor, S., Koch, W. J., & McNally, R. (1992). How doesanxiety sensitivity vary across the anxiety disorders? Journalof Anxiety Disorders, 6, 249–259.
Teachman, B., & Woody, S. (2003). Automatic processingamong individuals with spider phobia: Change in implicitfear associations following treatment. Journal of AbnormalPsychology, 112, 100–109.
Tolin, D. F., Lohr, J. M., Sawchuk, C. N., & Lee, T. C. (1997).Disgust and disgust sensitivity in blood-injection-injury andspider phobia. Behaviour Research and Therapy, 10,949–953.
Tucker, L. R., & Lewis, C. (1973). A reliability coefficient formaximum likelihood factor analysis. Psychometrika, 38,1–10.
Thissen, D., & Wainer, H. (Eds.). (2001). Test scoring Mahwah,NJ: Lawrence Erlbaum.
Vansteenwegen, D., Vervliet, B., Iberico, C., Baeyens, F., Vanden Bergh, O., & Hermans, D. (2007). The repeatedconfrontation with videotapes of spiders in multiplecontexts attenuates renewal of fear in spider anxiousstudents. Behaviour Research and Therapy, 45, 1169–1179.

130 olatun j i e t al .
Woods, C. M. (2004). Item response theory with estimation ofthe latent population distribution using spline-based den-sities. Unpublished doctoral dissertation, University ofNorth Carolina, Chapel Hill.
Woods, C. M. (2006). Ramsay-curve item response theory todetect and correct for nonnormal latent variables. Psycho-logical Methods, 11, 253–270.
Woods, C. M., & Thissen, D. (2004). RCLOG v.1: Software foritem response theory parameter estimation with the latentpopulationdistribution representedusing spline-based densities.Technical Report, L.L. Thurstone Psychometric Laboratory.
Woods, C. M., & Thissen, D. (2006). Item response theory withestimation of the latent population distribution using spline-based densities. Psychometrika, 71, 281–301.
Zinbarg, R. E., Barlow, D. H., & Brown, T. A. (1997).Hierarchical structure and general factor saturation of theAnxiety Sensitivity Index: Evidence and implications.Psychological Assessment, 9, 277–284.
RECEIVED: November 29, 2007ACCEPTED: April 17, 2008Available online 21 October 2008