development and conflict - debraj ray (nyu)
DESCRIPTION
Roundtable on Development: poverty, corruption, fragmentation and conflict Barcelona GSE Summer Forum Barcelona Graduate School of Economics June 14, 2013 http://www.barcelonagse.eu/summer-forum.htmlTRANSCRIPT

Starting point: economic development is intrinsically uneven.
Contrast with theories based on convergence.
Debraj Ray, “Uneven Growth: A Framework for Research in DevelopmentEconomics,” Journal of Economic Perspectives 24, 45–60 (2010).
0-0
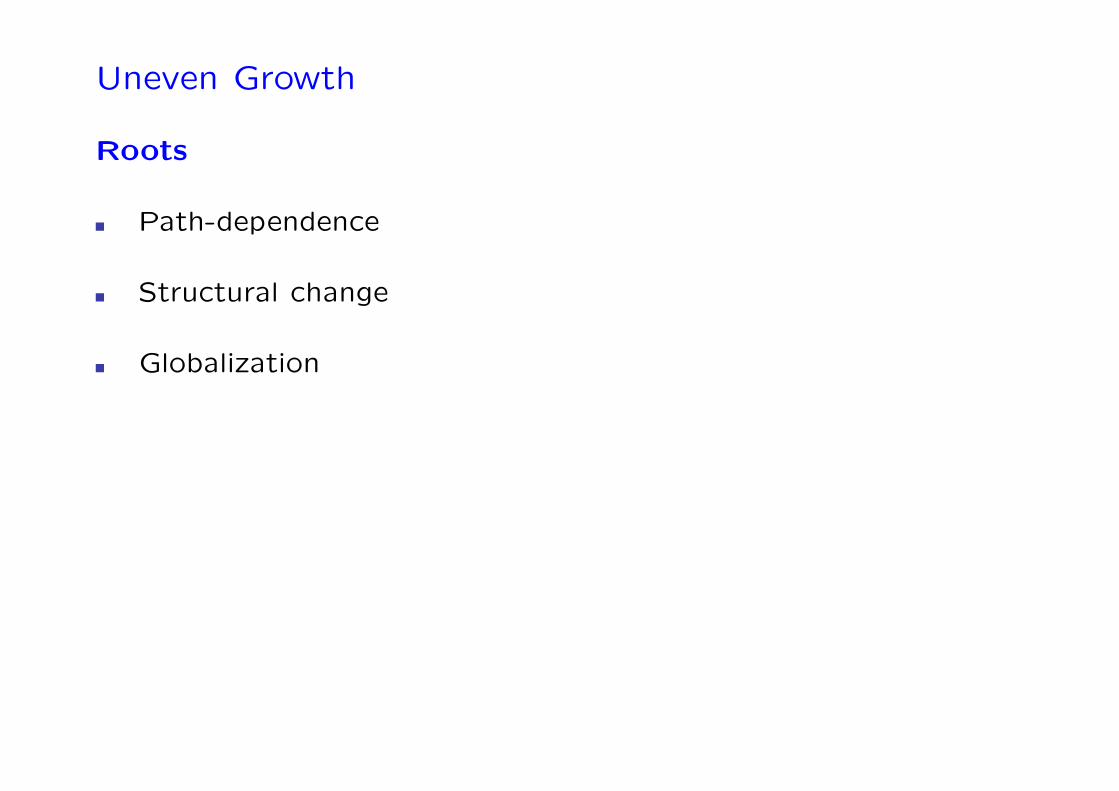
Uneven Growth
Roots
Path-dependence
Structural change
Globalization
0-1

Uneven Growth
Roots
Path-dependence (sensitivity to initial conditions)
Structural change
Globalization
0-2
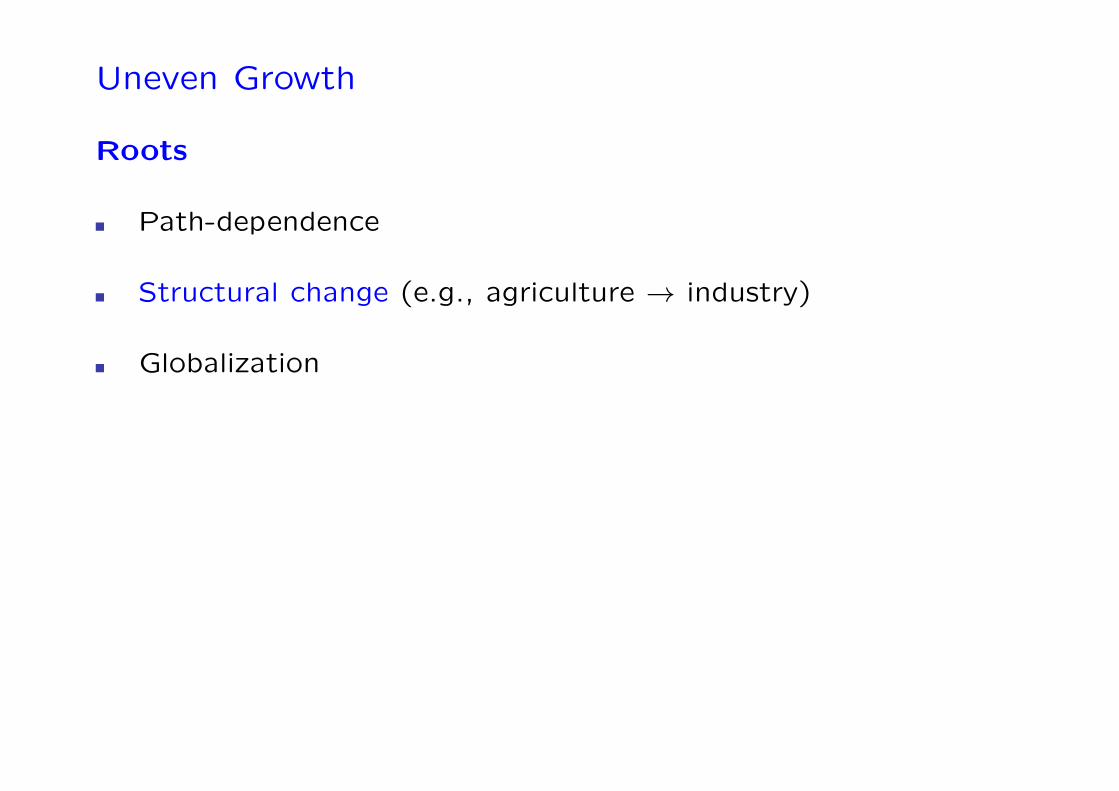
Uneven Growth
Roots
Path-dependence
Structural change (e.g., agriculture → industry)
Globalization
0-3

Uneven Growth
Roots
Path-dependence
Structural change
Globalization (comparative advantage, FDI)
0-4

Uneven Growth
Reactions
0-5

Uneven Growth
Reactions
The lives of others are on display:
Aspirations and frustrations are socially generated.
0-6

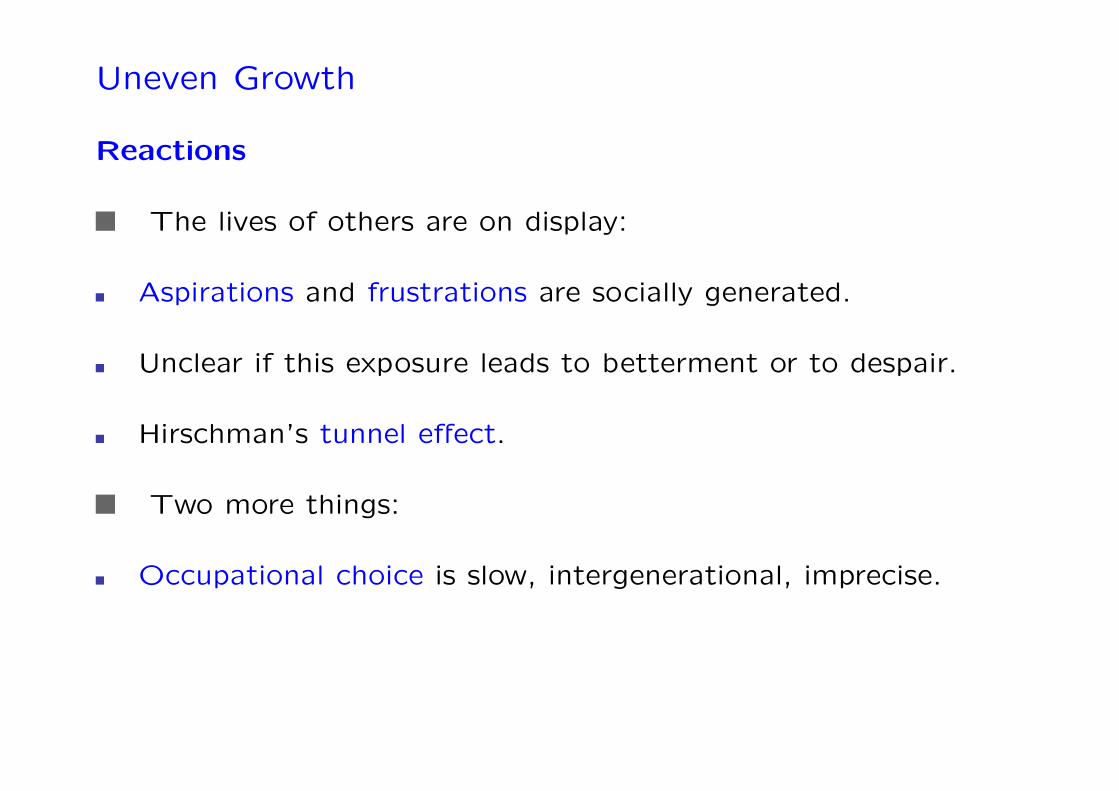
Uneven Growth
Reactions
The lives of others are on display:
Aspirations and frustrations are socially generated.
Unclear if this exposure leads to betterment or to despair.
Hirschman’s tunnel effect.
0-7
Uneven Growth
Reactions
The lives of others are on display:
Aspirations and frustrations are socially generated.
Unclear if this exposure leads to betterment or to despair.
Hirschman’s tunnel effect.
Two more things:
Occupational choice is slow, intergenerational, imprecise.
0-8

Uneven Growth
Reactions
The lives of others are on display:
Aspirations and frustrations are socially generated.
Unclear if this exposure leads to betterment or to despair.
Hirschman’s tunnel effect.
Two more things:
Occupational choice is slow, intergenerational, imprecise.
The great acceleration: UK, 1780, 58; US, 1839, 47; Japan,1885, 34, Brazil, 1961, 18, Korea, 1966, 11, China, 1980→, 7–9.
0-9

Uneven Growth
Reactions
The lives of others are on display:
Aspirations and frustrations are socially generated.
Unclear if this exposure leads to betterment or to despair.
Hirschman’s tunnel effect.
Two more things:
Occupational choice is slow, intergenerational, imprecise.
The great acceleration: UK, 1780, 58; US, 1839, 47; Japan,1885, 34, Brazil, 1961, 18, Korea, 1966, 11, China, 1980→, 7–9.
The potential for conflict.
0-10

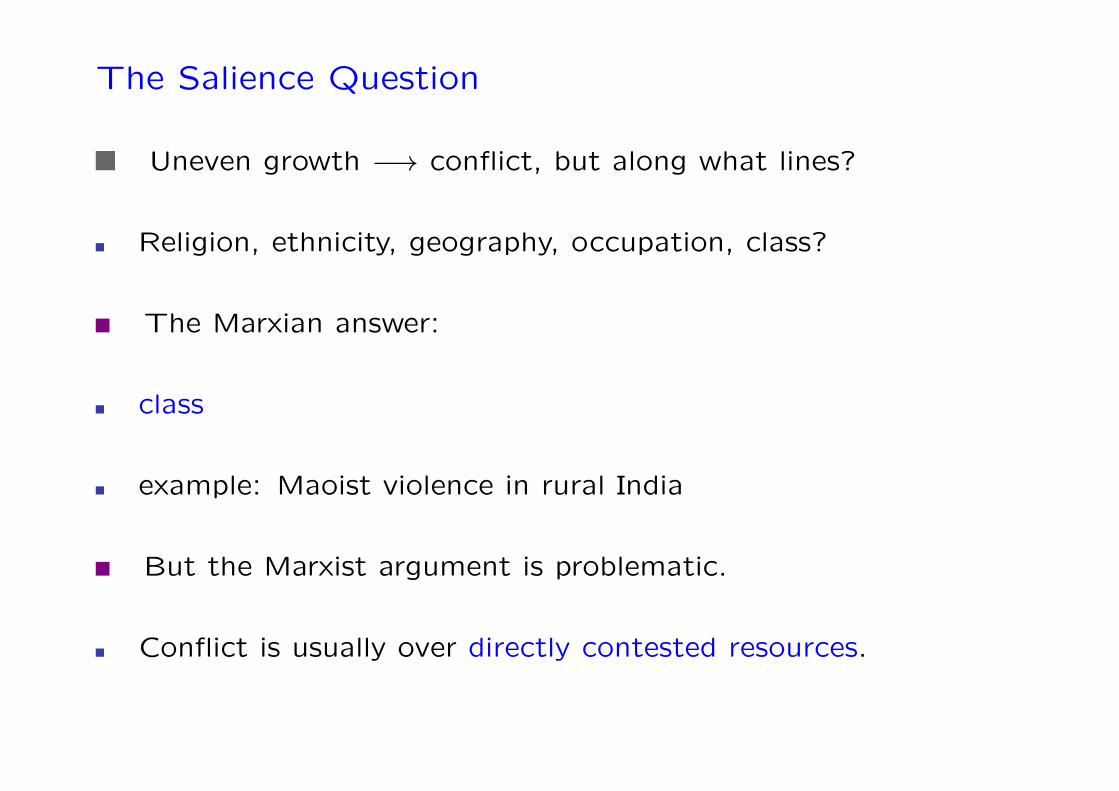
The Salience Question
Uneven growth −→ conflict, but along what lines?
Religion, ethnicity, geography, occupation, class?
0-11

The Salience Question
Uneven growth −→ conflict, but along what lines?
Religion, ethnicity, geography, occupation, class?
The Marxian answer:
class
example: Maoist violence in rural India
0-12
The Salience Question
Uneven growth −→ conflict, but along what lines?
Religion, ethnicity, geography, occupation, class?
The Marxian answer:
class
example: Maoist violence in rural India
But the Marxist argument is problematic.
Conflict is usually over directly contested resources.
0-13
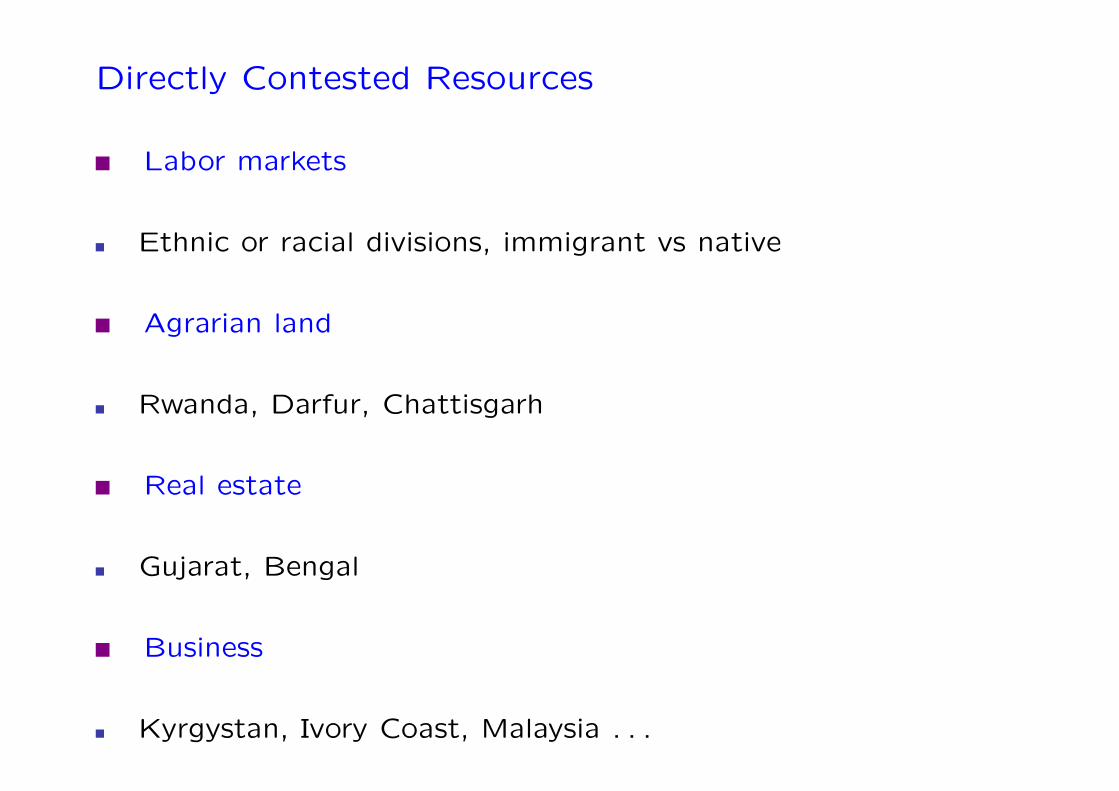
Directly Contested Resources
Labor markets
Ethnic or racial divisions, immigrant vs native
Agrarian land
Rwanda, Darfur, Chattisgarh
Real estate
Gujarat, Bengal
Business
Kyrgystan, Ivory Coast, Malaysia . . .
0-14
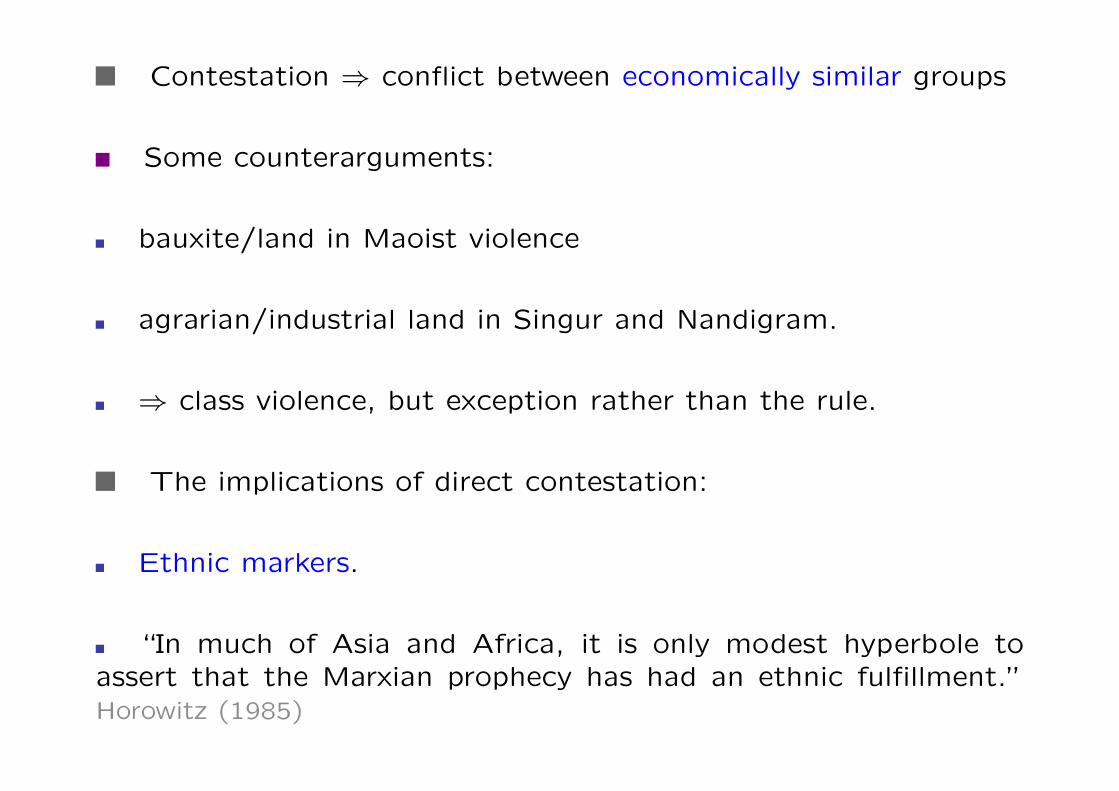
Contestation ⇒ conflict between economically similar groups
Some counterarguments:
bauxite/land in Maoist violence
agrarian/industrial land in Singur and Nandigram.
⇒ class violence, but exception rather than the rule.
The implications of direct contestation:
Ethnic markers.
“In much of Asia and Africa, it is only modest hyperbole toassert that the Marxian prophecy has had an ethnic fulfillment.”Horowitz (1985)
0-15
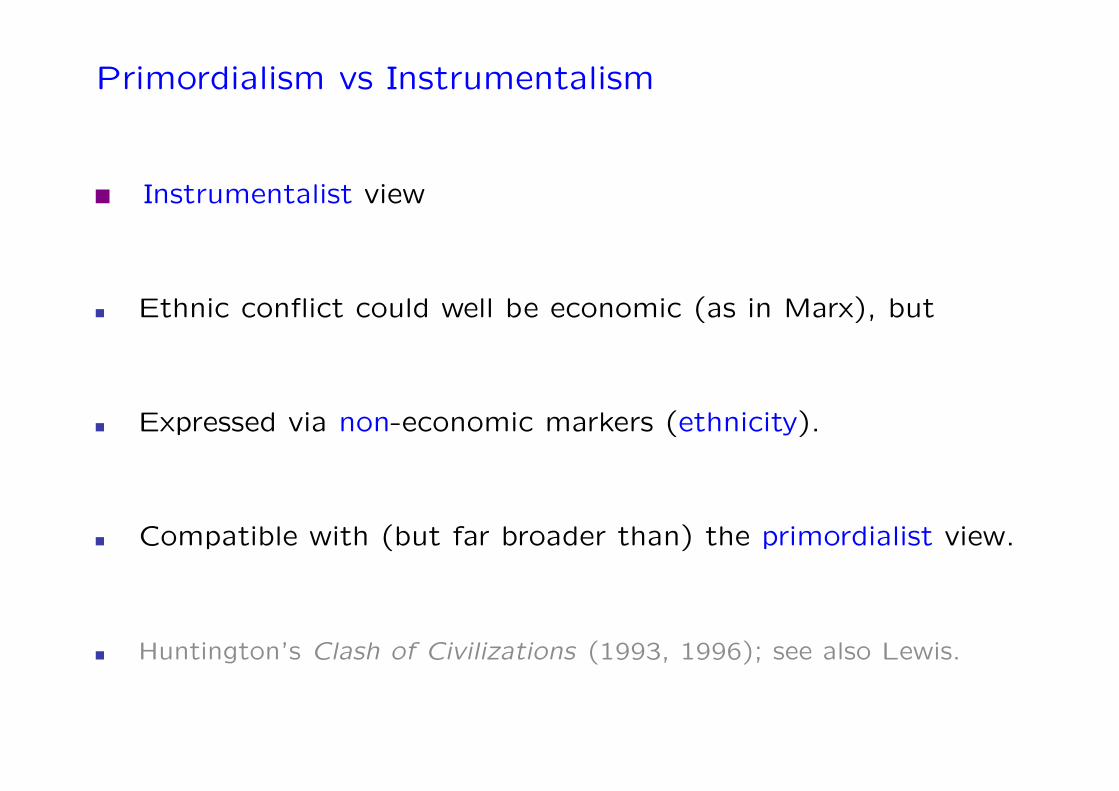
Primordialism vs Instrumentalism
Instrumentalist view
Ethnic conflict could well be economic (as in Marx), but
Expressed via non-economic markers (ethnicity).
Compatible with (but far broader than) the primordialist view.
Huntington’s Clash of Civilizations (1993, 1996); see also Lewis.
0-16

Are Ethnic Divisions Conflictual?
Based on Esteban and Ray (AER 2011)
Groups engaged in conflict over some combination of:
Public prize:
religious dominance, political control, hatreds, public goods
Private prize:
Oil, diamonds, scarce land
Each group contributes resources to obtain favorite outcome.
Conflict: sum of all resource contributions
0-17

Predicted Connections
Conflict over public goods related to polarization P .
Conflict over private goods related to fractionalization F .
Overall connection:
conflict per-capita '[λP + (1− λ)F
],
where
λ = relative importance of public prize
0-18

Empirical Investigation
From Esteban, Mayoral and Ray (AER 2012, Science 2012)
138 countries over 1960–2008.
C: PRIO.
isc: Continuous index, Banks (2008).
Indices of publicness and privateness of the prize
0-19
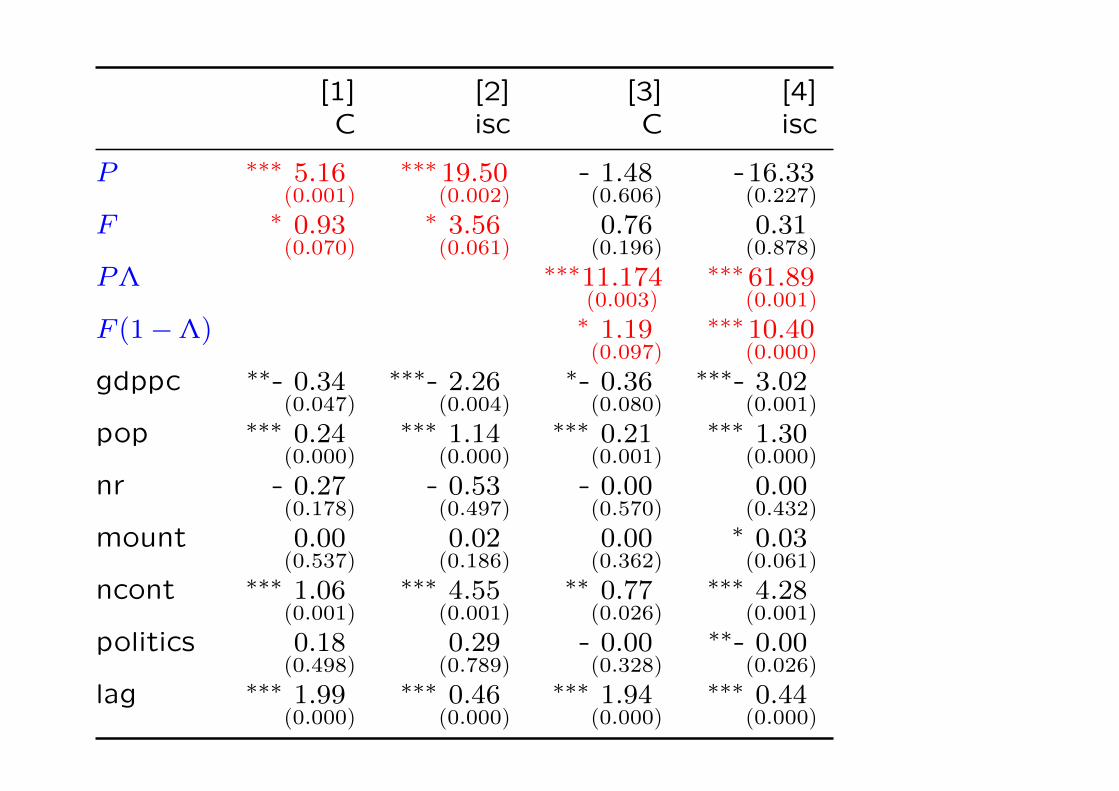
[1] [2] [3] [4]C isc C isc
P ∗∗∗ 5.16(0.001)
∗∗∗19.50(0.002)
- 1.48(0.606)
-16.33(0.227)
F ∗ 0.93(0.070)
∗ 3.56(0.061)
0.76(0.196)
0.31(0.878)
PΛ ∗∗∗11.174(0.003)
∗∗∗61.89(0.001)
F (1−Λ) ∗ 1.19(0.097)
∗∗∗10.40(0.000)
gdppc ∗∗- 0.34(0.047)
∗∗∗- 2.26(0.004)
∗- 0.36(0.080)
∗∗∗- 3.02(0.001)
pop ∗∗∗ 0.24(0.000)
∗∗∗ 1.14(0.000)
∗∗∗ 0.21(0.001)
∗∗∗ 1.30(0.000)
nr - 0.27(0.178)
- 0.53(0.497)
- 0.00(0.570)
0.00(0.432)
mount 0.00(0.537)
0.02(0.186)
0.00(0.362)
∗ 0.03(0.061)
ncont ∗∗∗ 1.06(0.001)
∗∗∗ 4.55(0.001)
∗∗ 0.77(0.026)
∗∗∗ 4.28(0.001)
politics 0.18(0.498)
0.29(0.789)
- 0.00(0.328)
∗∗- 0.00(0.026)
lag ∗∗∗ 1.99(0.000)
∗∗∗ 0.46(0.000)
∗∗∗ 1.94(0.000)
∗∗∗ 0.44(0.000)
0-20
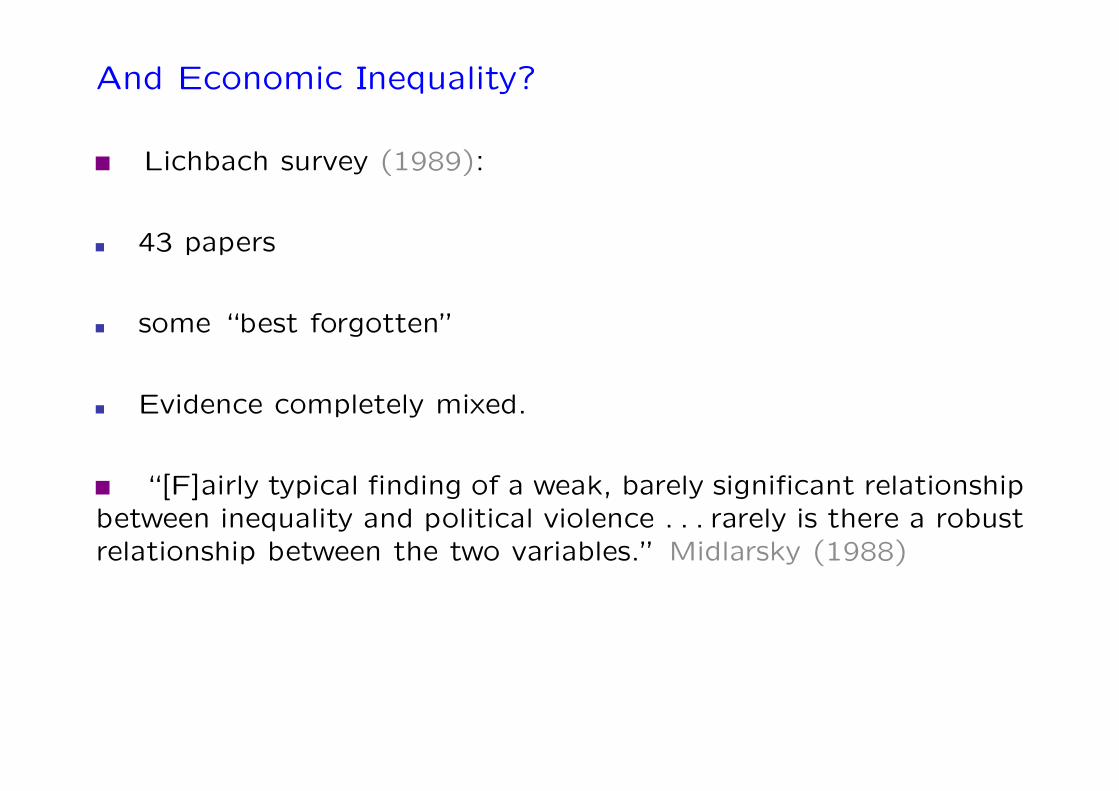
And Economic Inequality?
Lichbach survey (1989):
43 papers
some “best forgotten”
Evidence completely mixed.
“[F]airly typical finding of a weak, barely significant relationshipbetween inequality and political violence . . . rarely is there a robustrelationship between the two variables.” Midlarsky (1988)
0-21
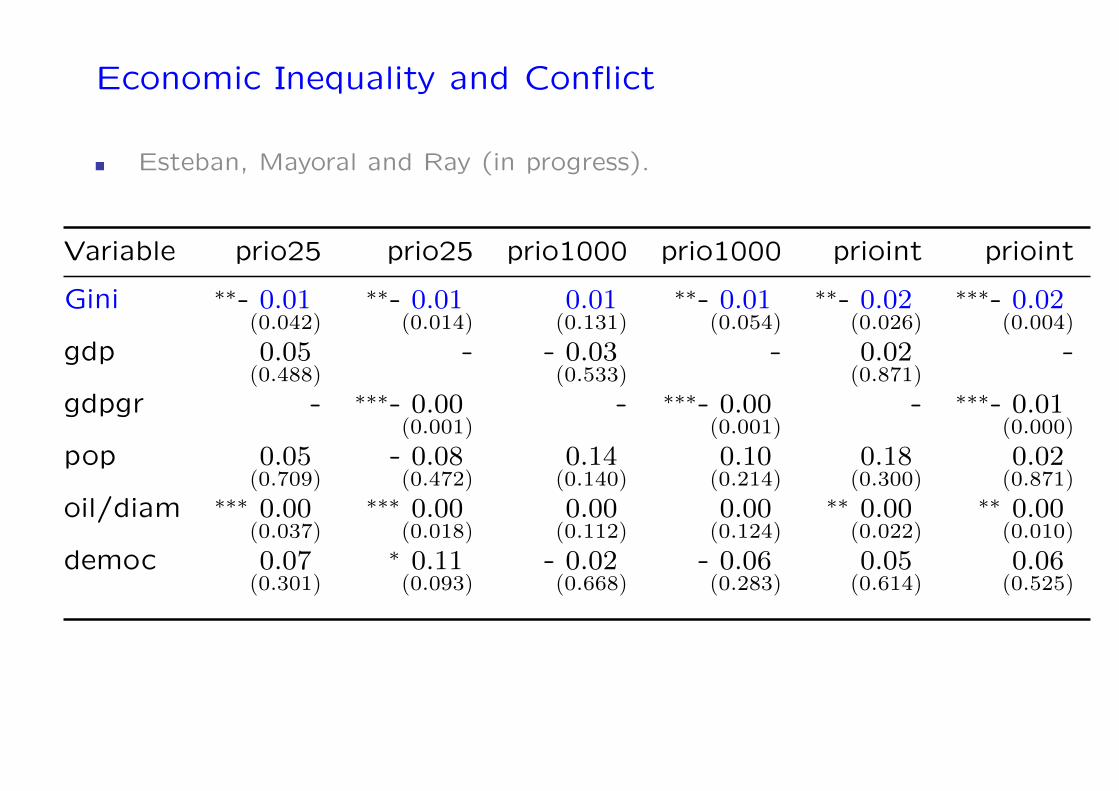
Economic Inequality and Conflict
Esteban, Mayoral and Ray (in progress).
Variable prio25 prio25 prio1000 prio1000 prioint prioint
Gini ∗∗- 0.01(0.042)
∗∗- 0.01(0.014)
0.01(0.131)
∗∗- 0.01(0.054)
∗∗- 0.02(0.026)
∗∗∗- 0.02(0.004)
gdp 0.05(0.488)
- - 0.03(0.533)
- 0.02(0.871)
-
gdpgr - ∗∗∗- 0.00(0.001)
- ∗∗∗- 0.00(0.001)
- ∗∗∗- 0.01(0.000)
pop 0.05(0.709)
- 0.08(0.472)
0.14(0.140)
0.10(0.214)
0.18(0.300)
0.02(0.871)
oil/diam ∗∗∗ 0.00(0.037)
∗∗∗ 0.00(0.018)
0.00(0.112)
0.00(0.124)
∗∗ 0.00(0.022)
∗∗ 0.00(0.010)
democ 0.07(0.301)
∗ 0.11(0.093)
- 0.02(0.668)
- 0.06(0.283)
0.05(0.614)
0.06(0.525)
0-22

Surprising? Not Really
Two entry points:
Wealth of the rival group — related to the gains from conflict.
Wealth of the own group — related to the costs of conflict.
⇒ No connection between intergroup inequality and conflict.
0-23
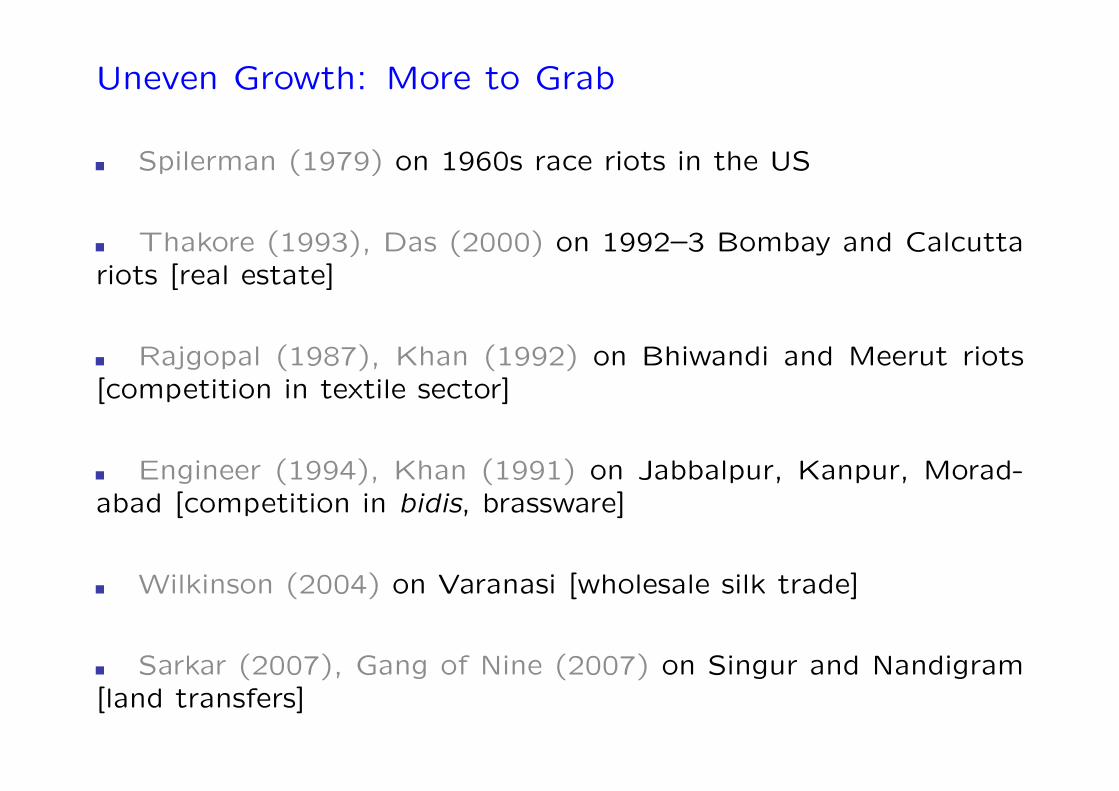
Uneven Growth: More to Grab
Spilerman (1979) on 1960s race riots in the US
Thakore (1993), Das (2000) on 1992–3 Bombay and Calcuttariots [real estate]
Rajgopal (1987), Khan (1992) on Bhiwandi and Meerut riots[competition in textile sector]
Engineer (1994), Khan (1991) on Jabbalpur, Kanpur, Morad-abad [competition in bidis, brassware]
Wilkinson (2004) on Varanasi [wholesale silk trade]
Sarkar (2007), Gang of Nine (2007) on Singur and Nandigram[land transfers]
0-24
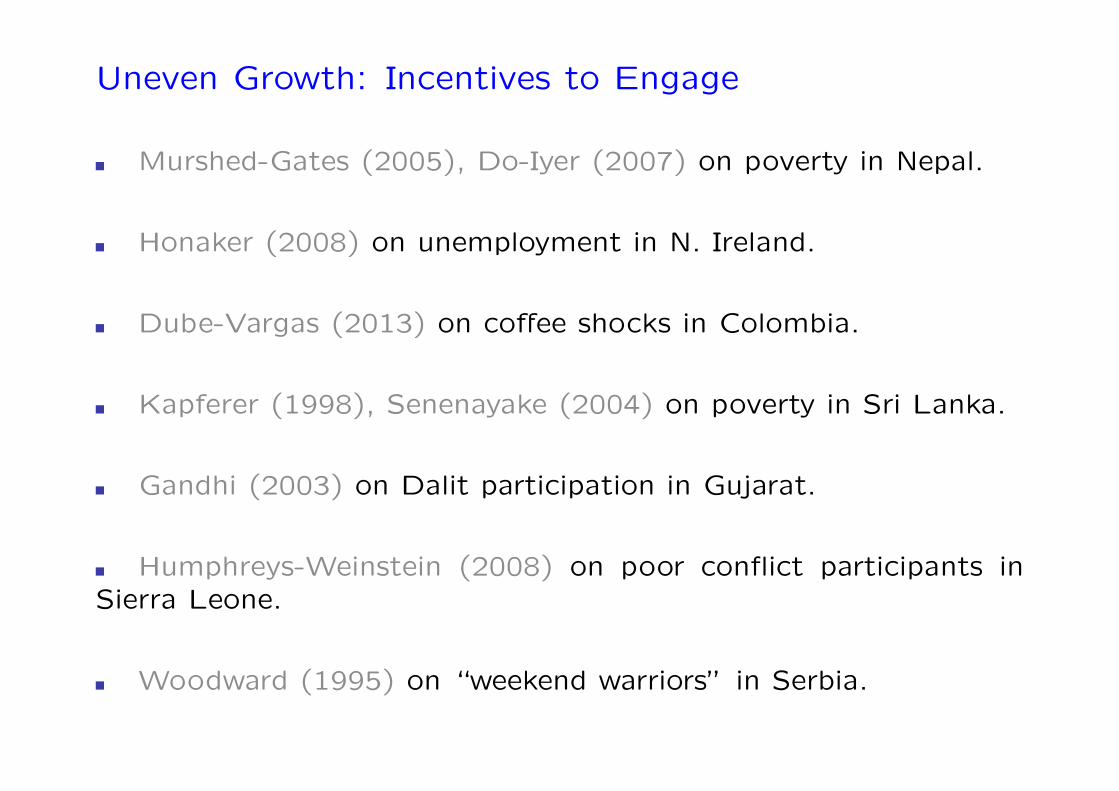
Uneven Growth: Incentives to Engage
Murshed-Gates (2005), Do-Iyer (2007) on poverty in Nepal.
Honaker (2008) on unemployment in N. Ireland.
Dube-Vargas (2013) on coffee shocks in Colombia.
Kapferer (1998), Senenayake (2004) on poverty in Sri Lanka.
Gandhi (2003) on Dalit participation in Gujarat.
Humphreys-Weinstein (2008) on poor conflict participants inSierra Leone.
Woodward (1995) on “weekend warriors” in Serbia.
0-25
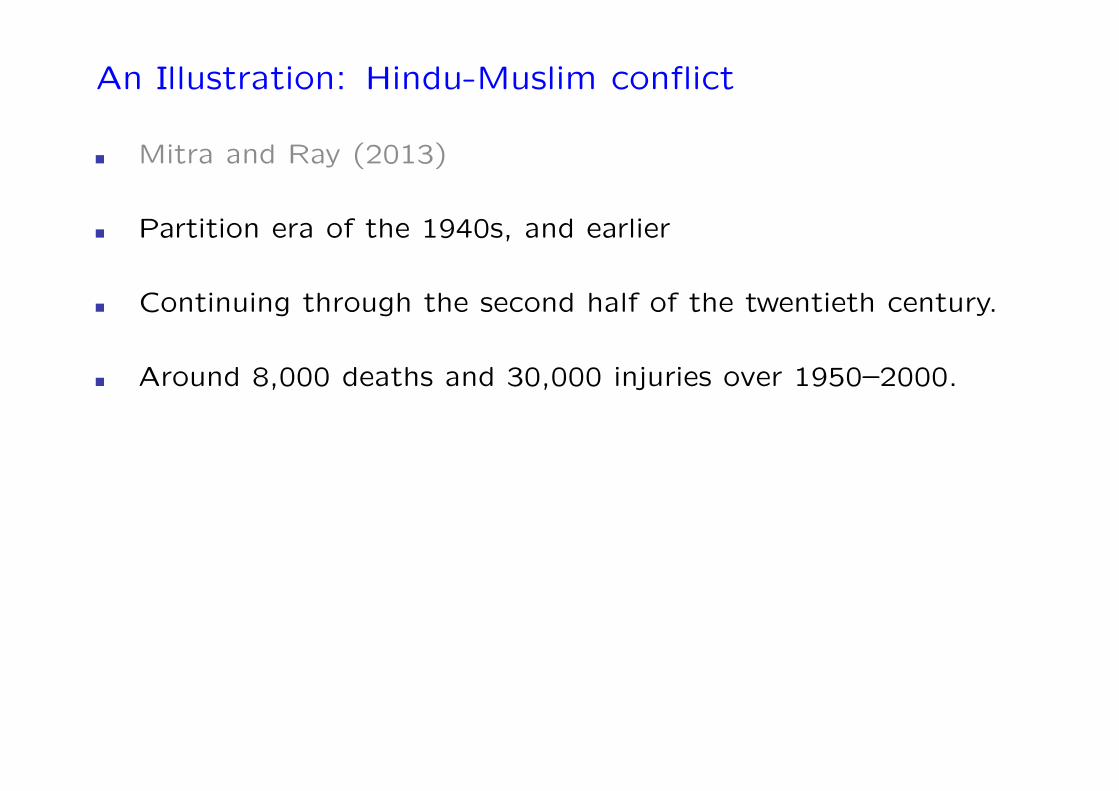
An Illustration: Hindu-Muslim conflict
Mitra and Ray (2013)
Partition era of the 1940s, and earlier
Continuing through the second half of the twentieth century.
Around 8,000 deaths and 30,000 injuries over 1950–2000.
0-26

An Illustration: Hindu-Muslim conflict
Mitra and Ray (2013)
Partition era of the 1940s, and earlier
Continuing through the second half of the twentieth century.
Around 8,000 deaths and 30,000 injuries over 1950–2000.
Ethnographic studies suggest:
Hindu aggressor
Economic component to violence
0-27
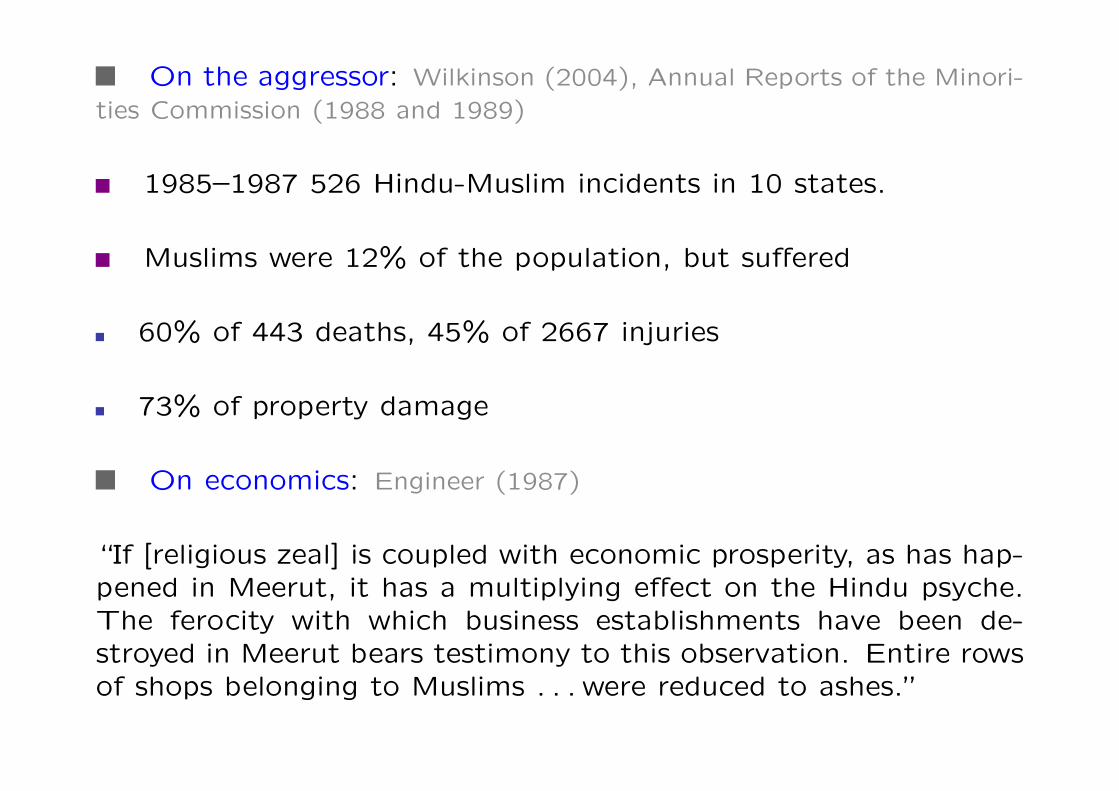
On the aggressor: Wilkinson (2004), Annual Reports of the Minori-ties Commission (1988 and 1989)
1985–1987 526 Hindu-Muslim incidents in 10 states.
Muslims were 12% of the population, but suffered
60% of 443 deaths, 45% of 2667 injuries
73% of property damage
On economics: Engineer (1987)
“If [religious zeal] is coupled with economic prosperity, as has hap-pened in Meerut, it has a multiplying effect on the Hindu psyche.The ferocity with which business establishments have been de-stroyed in Meerut bears testimony to this observation. Entire rowsof shops belonging to Muslims . . . were reduced to ashes.”
0-28
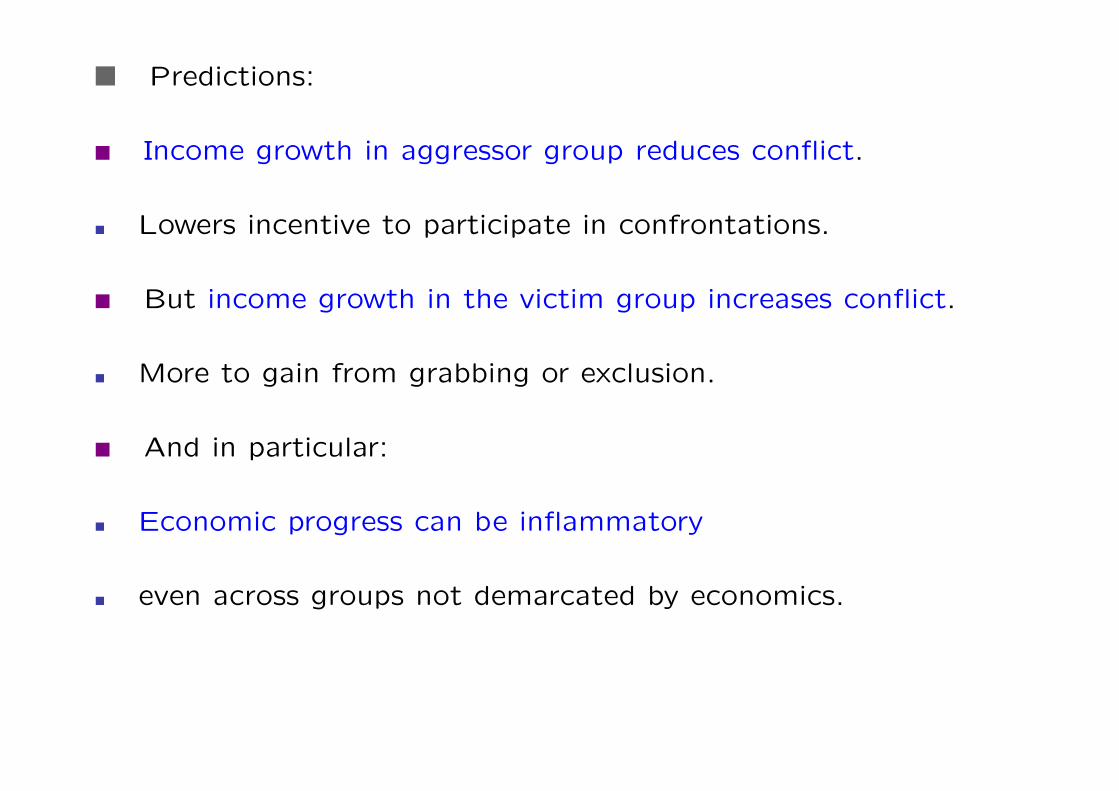
Predictions:
Income growth in aggressor group reduces conflict.
Lowers incentive to participate in confrontations.
But income growth in the victim group increases conflict.
More to gain from grabbing or exclusion.
And in particular:
Economic progress can be inflammatory
even across groups not demarcated by economics.
0-29

0-30

0-31

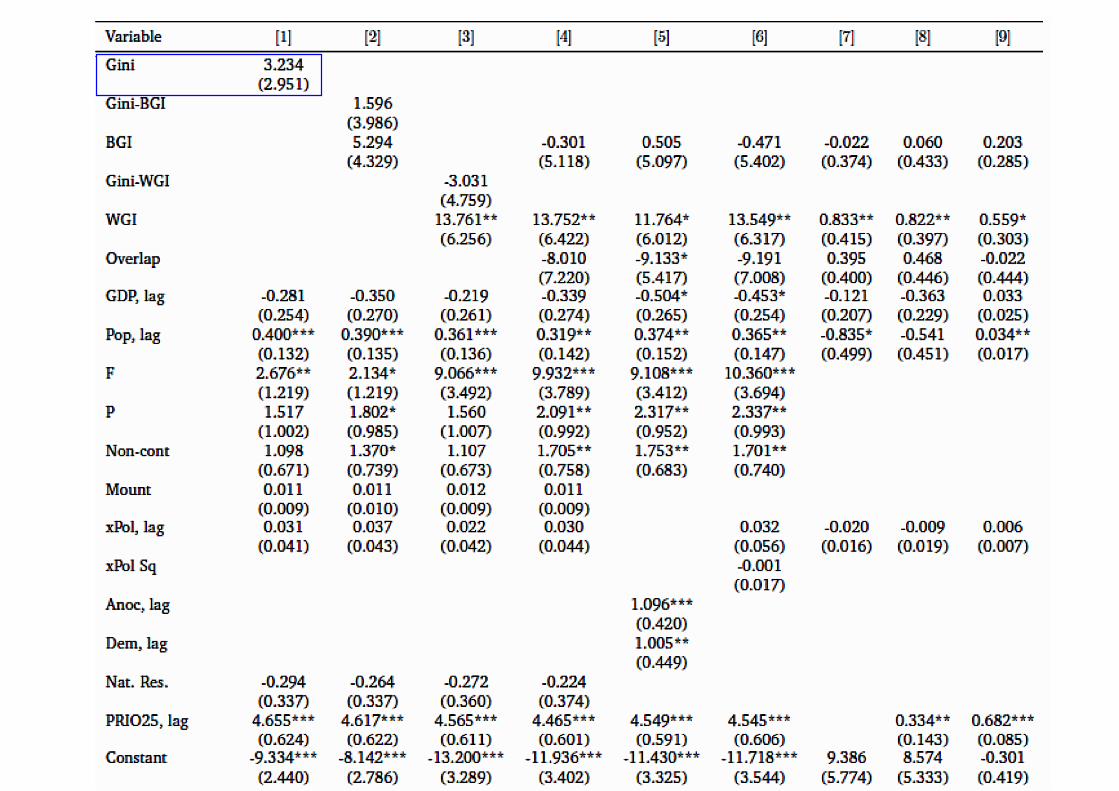
Casualties, 5-Year Average Starting Just After
[Poiss] [Poiss] [NegBin] [NegBin] [OLS] [OLS]
H Exp ∗∗∗-7.87 ∗∗∗-6.82 ∗∗-2.79 -3.31 ∗∗-9.15 ∗-8.46(0.005) (0.003) (0.093) (0.131) (0.033) (0.085)
M Exp ∗∗∗5.10 ∗∗∗4.67 ∗∗2.64 ∗∗3.87 ∗∗∗6.89 ∗∗∗ 9.52(0.000) (0.001) (0.040) (0.023) (0.006) (0.009)
Pop 4.28 3.91 0.62 0.74 -3.87 -1.23(0.468) (0.496) (0.149) (0.132) (0.614) (0.877)
RelPol ∗5.55 ∗5.57 0.72 1.09 6.00 6.86(0.054) (0.056) (0.763) (0.715) (0.470) (0.408)
Gini H -5.426 4.121 -14.473(0.317) (0.521) (0.342)
Gini M 3.399 -5.952 -11.073(0.497) (0.362) (0.451)
Lit, Urb Y Y Y Y Y Y
Mus exp ↑ 1% ⇒ Cas ↑ 3–5%. Opp for Hindu exp.
Result survives numerous robustness checks, including IV.
0-32

A Second Argument for Ethnic Salience
Esteban and Ray (2008, 2010)
Organized conflict is people + finance.
Within-group disparities feed the people/finance synergy.
Class conflict, by definition of class, fails on this score.
Leads to the one robust prediction for incomes and conflict:
Within-group inequality is conflictual.
Huber and Mayoral (2013)
0-33

0-34
0-35

0-36

0-37

A Summary
Economic development fundamentally uneven.
Large effects on aspirations.
Occupational choice is a slow process.
So conflict predicted under uneven development.
Us and Them, profoundly contextual.
The Marxian view sometimes makes sense, but not always.
Direct contestability creates antagonism across similar groups.
And non-class conflict, including ethnic conflict, may be focal.
A research agenda in development economics cannot ignore this ques-tion of salience.
0-38