development and characterisation of starch and polyphenols
TRANSCRIPT

HAL Id: tel-03336577https://tel.archives-ouvertes.fr/tel-03336577
Submitted on 7 Sep 2021
HAL is a multi-disciplinary open accessarchive for the deposit and dissemination of sci-entific research documents, whether they are pub-lished or not. The documents may come fromteaching and research institutions in France orabroad, or from public or private research centers.
L’archive ouverte pluridisciplinaire HAL, estdestinée au dépôt et à la diffusion de documentsscientifiques de niveau recherche, publiés ou non,émanant des établissements d’enseignement et derecherche français ou étrangers, des laboratoirespublics ou privés.
Development and characterisation of starch andpolyphenols for functional enhancement in high value
food products from lontan vegetablesVigna Nivetha Chandrasekaran
To cite this version:Vigna Nivetha Chandrasekaran. Development and characterisation of starch and polyphenols forfunctional enhancement in high value food products from lontan vegetables. Food and Nutrition.Université de la Réunion, 2020. English. �NNT : 2020LARE0023�. �tel-03336577�

Université de La Réunion
Faculty of Science and technology
Speciality: Food Engineering (Agro-alimentaire)
Thesis for the degree of Doctor of Philosophy
Submitted by: Vigna Nivetha CHANDRASEKARAN
Development and characterisation of
starch and polyphenols for functional
enhancement in high value food
products from lontan vegetables Date : 25 /11/2020
Director : Prof. Patrick POUCHERET
Composition of Jury
Rapporteur Mme.Claudie DHUIQUE-MAYER, Directeur de Recherches,
PERSYST UMR Qualisud, CIRAD
Mme. Françoise FONS, Professeur, Centre d’Écologie Fonctionnelle
et Évolutive (CEFE), Faculté de pharmacie, Université de Montpellier
Examiner Monsieur. Hippolyte KODJA, Professeur, Université de la Réunion
Monsieur. Thomas PETIT, Professeur, Institut Universitaire de
Technologie (IUT), Université de la Réunion
Director Prof. Patrick POUCHERET, Maître de Conférences H.D.R.,
Université de Montpellier
Co-Director Prof. Abel HIOL, Professeur, Université de la Réunion

Université de La Réunion
Ecole Doctotale des Sciences Technologies et Santé
Discipline: Agro-alimentaire
Thèse de doctorat
Présentée par: Vigna Nivetha CHANDRASEKARAN
Développement et caractérisation des
amidons/polyphénols fonctionnels pour
la valorisation en aliments à haute
valeur ajoutée des produits à base de «
légumes lontan » Date : 25/11/2020
Directeur: Prof. Patrick POUCHERET
Composition du Jury
Rapporteur Mme.Claudie DHUIQUE-MAYER, Directeur de Recherches,
PERSYST UMR Qualisud, CIRAD
Mme. Françoise FONS, Professeur, Centre d’Écologie Fonctionnelle et
Évolutive (CEFE), Faculté de pharmacie, Université de Montpellier
Examinateur Monsieur. Hippolyte KODJA, Professeur, Université de la Réunion
Monsieur. Thomas PETIT, Professeur, Institut Universitaire de Technologie
(IUT), Université de la Réunion
Directeur de thèse Prof. Patrick POUCHERET, Maître de Conférences H.D.R., Université
de Montpellier
Co-Directeur de thèse Prof. Abel HIOL, Professeur, Université de la Réunion

Dedicated to the almighty and my
dear parents

Page | ii
ACKNOWLEDGEMENT
This Ph.D. Journey has been a life changing experience for me and it would not have been
possible without the guidance and support I received from many people.
First and foremost, I would like to express my sincere gratitude to my thesis director
Prof. Patrick POUCHERET for his immense support, patient guidance, invaluable advice and
continuous encouragement. My sincere thanks to him for his uplifting words even during the
difficult times. His positive approach and feedback were the guiding light for me in this long
journey, without it this Ph.D. would not have been achievable.
I am deeply grateful to my thesis co-director Prof. Abel HIOL for providing me this
opportunity by recruiting me and for making my transition from India to Reunion easier. His
support, encouragement and enthusiasm for my work inspired me and his expertise was
invaluable while formulating the research topic.
A special thanks to Dr. Thierry TRAN for his valuable input and feedback, which helped me
to stream line my work. I would like to extend my gratitude to Prof. Thomas PETIT for helping
me to work with microwave extractor, it was really an edifying experience. I would also like to
thank Prof. Hippolyte KODJA for helping me to acquire laptop at a much need time.
I would like to thank Dr. Axelle September-Malaterre for her immense contribution to this
work. Her experience and constant encouraging words eased the laboratory working
environment. Many thanks to Mme Cathie Milhau, for her technical support. I would like to
extend my special thanks to Ms. Marie HUTE for making my working days at Saint-Pierre
memorable.
I greatly appreciate the support I received from my mentor Dr. Prakas maran, who inspired
me to pursue research career and encouraged me to start this Ph.D. journey. He impelled me to
dream big and taught me how work towards it. My heartfelt thanks for his persistent support,
encouragement, sincere advice and scolding’s, without which this would not have been
possible.
Words cannot express my gratitude to Dr. Mekala Venkatachalam, who was my role model
and well-wisher. She took the role of my big sister and took care of me as her own, without her
I would have struggled a lot in a foreign country. Her go-getting attitude, positive perception
and strong personality inspired me both professionally and personally.

Page | iii
My gratitude knows no bound to Ms. Anamya who was my friend, supporter and sounding
board. My sincere thanks to her sympathetic ear’s, honest and brutal (sometimes) counsels,
which put things in perspective. My heartfelt thanks to Ms. Lovida my partner in crime, who
provided a happy distraction to rest my mind outside of my research.
Last, but not least, I would like to thank my family, my parents Shanthi and Joshi, my
sisters Smrithi, Sharanyaa, my aunt Dhanalakshmi and uncle Krishnamoorthy, my friend
Deepak and my husband Elumalai, for their unconditional support, encouragement and love,
without which I would not have come this far.

Page | iv
ABSTRACT
Roots and Tuber crops plays an eminent, countless and complex part in feeding the world.
These crops have the potential to eradicate poverty and improve food security. Starch is the
principal component of roots and tuber crops. The significance of starch as a raw material in
both food and non-food industries are increasing. In present study efficiency of ultrasound
assisted extraction (UAE) to increase the yield of starch and polyphenols from lontan (Canna
and Cassava) crops were analysed along with its influence on the physiochemical properties of
extracted compounds. Extraction parameters (Temperature, time, solid: liquid ratio) were
optimized through Box Behnken response surface design (BBD). Physiochemical and
functional properties of starch and polyphenols were investigated through SEM, swelling and
solubility index, oil and water absorption index, Total polyphenol yield, DPPH and ORAC
assay. Starch yield obtained from canna and cassava at the optimum extraction conditions
(Canna: temperature 40°C, time 10 min, solid: liquid ratio 1:30 g/ml ; Cassava: temperature
40°C, time 10 min, solid: liquid ratio 1:25 g/ml) were 19.81% and 16.51% respectively.
Obtained starch yield was found to be significantly higher than the yield attained through
conventional extraction method without any significant or adverse changes in the
physicochemical and functional properties. Total polyphenol yield from canna and cassava
rhizome was 1061.72 mg GAE/&100g and 7644.46 mg GAE/&100g respectively. Total
polyphenol yield obtained through UAE was found to be significantly higher than conventional
method. Antioxidant activity of bioactive compounds analysed through DPPH and ORAC was
found to be directly proportional to the attained polyphenol yield. From the obtained results it
can be observed that UAE has the efficiency to increase the yield of starch and polyphenols
without altering the properties of isolated compounds.

Page | v
Résumé
Les cultures de racines et tubercules jouent un rôle important, diversifié et complexe dans
l'alimentation des populations. Ces cultures ont le potentiel d'éradiquer la pauvreté et
d'améliorer la sécurité alimentaire. L'amidon est le principal composant des racines et des
tubercules. L'importance de l'amidon en tant que matière première dans les industries
alimentaires et non alimentaires augmente Dans la présente étude, l'efficacité de l'extraction
assistée par ultrasons (EAU) pour augmenter le rendement d’extraction de l’amidon et des
polyphénols à partir des légumes lontan (Canna et manioc) a été analysée ainsi que son
influence sur les propriétés physico-chimiques des composés extraits. Les paramètres
d'extraction (température, temps, rapport solide: liquide) ont été optimisés grâce à la conception
de surface de réponse Box Behnken (BBD). Les propriétés physiochimiques et fonctionnelles
de l'amidon et des polyphénols ont été étudiées par SEM, indice de gonflement et de solubilité,
indice d'absorption d'huile et d'eau, rendement total en polyphénols, dosage DPPH et ORAC.
Les rendementq en amidon obtenu à partir du canna et du manioc aux conditions d'extraction
optimales (Canna: température 40 ° C, durée 10 min, rapport solide: liquide 1:30 g / ml; Manioc:
température 40 ° C, durée 10 min, rapport solide: liquide 1:25 g / ml) étaient respectivement de
19,81% et 16,51%. Nous avons mis en évidence que le rendement en amidon obtenu était
significativement plus élevé que le rendement atteint par la méthode d'extraction
conventionnelle sans aucun changement significatif ou défavorable de ses propriétés physico-
chimiques et fonctionnelles. Les rendements d’extraction des polyphénols du canna et du
manioc étaient de 1061,72 mg GAE / & 100g et 7644,46 mg GAE / & 100g respectivement. Le
rendement total en polyphénols obtenu par EAU s'est révélé significativement plus élevé que
pour la méthode conventionnelle. L'activité antioxydante des composés bioactifs analysés par
DPPH et ORAC s'est avérée être directement proportionnelle au rendement en polyphénol. Les
résultats que nous avons obtenus suggèrent que les EAU augmenter les rendements d’extraction
en amidon et en polyphénols sans altérer les propriétés des composés isolés.

Page | vi
TABLE OF CONTENTS
ACKNOWLEDGEMENT II ABSTRACT IV
RESUME V
TABLE OF CONTENTS VI
TABLE OF FIGURES IX
LIST OF TABLES XI
LIST OF ABBREVATIONS XII
I INTRODUCTION 1
II LITERATURE SURVEY 5
II.I CANNA 6
II.I.I Origin and Distribution of Canna species 6
II.I.II Classification or Taxonomy 7
II.I.III Botanic and Physiology 8
II.I.IV Culture 17
II.I.V Physico-chemical and functionalroperties of canna 18
II.I.VI Biological properties of Canna 20
II.II CASSAVA 22
II.II.I Origin and distribution 22
II.II.II Classification or taxonomy 23
II.II.III Botanic and physiology 24
II.II.IV Physico-chemical properties of cassava 25
II.II.V Biological properties 26
II.III STARCH 28
II.III.I General Overview 28
II.III.II Chemical composition of starch 28
II.III.III Granule Structure 30
II.III.IV Physicochemical and functional properties of starch 32
II.III.V Starch Isolation 34
II.IV POLYPHENOLS 36
II.IV.I Structural characterization 36
II.IV.II The Cellular Effects of polyphenols 39
II.IV.III Phytochemicals in roots and tuber crops 39
II.IV.IV Extraction of polyphenols 41
II.IV.V Polyphenols and Metabolic syndrome 42
III METHODOLOGY 44

Page | vii
III.I Preliminary screening 45
III.I.I Sample type and preparation 45
III.I.II Sieve selection 45
III.I.III Sample selection 45
III.II Starch extraction 46
III.II.I Conventional extraction (CE) of starch 46
III.II.II Ultrasound Assisted Extraction (UAE) of starch 46
III.II.III Optimization of UAE conditions for starch extraction through Response Surface Methodology
(RSM) 47
III.III POLYPHENOL EXTRACTION 49
III.III.I Conventional extraction of phenols 49
III.III.II Ultrasound-assisted extraction of Phenols 50
III.IV Physio-chemical and functional property analysis of isolated starch and polyphenols 50
III.IV.I Starch characterization 50
III.IV.II Evaluation of phenol content 51
IV RESULTS AND DISCUSSION 53
IV.I Preliminary screening 54
IV.I.I Effect of sieve size on starch yield 54
IV.I.II Effect of Storage Conditions on the starch yield 55
IV.II Influence of UAE on starch yield from canna rhizome and its optimization through RSM 56
IV.II.I Comparison of conventional (CE) and Ultrasound-assisted extraction (UAE) method 56
IV.II.II UAE optimization of starch yield through RSM 57
IV.III Influence of UAE on starch yield from cassava rhizome and its optimization through RSM 64
IV.III.I Comparison of Conventional (CE) and Ultrasound-Assisted extraction (UAE) method. 64
IV.III.II UAE optimisation through RSM 65
IV.IV Effect of sonication on physicochemical properties of extracted starch 69
IV.IV.I Water absorption Index (WAI) & Oil Absorption Index (OAI) 69
IV.IV.II Water Solubility Index (WSI) & Swelling Power (SP) 70
IV.IV.III Micrographs of Sonicated Samples 71
IV.V Polyphenol Extraction 74
IV.V.I Effect of storage conditions on Total phenol content (Folin-ciocalteau method) 74
IV.V.II Effect of Ultrasound-Assisted Extraction (UAE) on Total Polyphenol content from Canna rhizome
75
IV.V.III Polyphenol yield from fresh canna and cassava rhizome through UAE 76
IV.VI Antioxidant activity 77
IV.VI.I Effect of storage conditions on the antioxidant activity of polyphenols 77
IV.VI.II Effect of extraction method on the antioxidant activity of Polyphenols extracted 79

Page | viii
IV.VI.III Antioxidant activity of bioactive compounds extracted from Canna and Cassava rhizome 81
V CONCLUSION 83
Page | ix
TABLE OF FIGURES
Figure 1: Distribution of Canna Indica around the world according to discover life .......................... 7
Figure 2: Classification of the family Cannaceae ................................................................................. 8
Figure 3: First picture denotes the root system of canna at early growth stage and the second picture
denotes the root system of canna at later growth stage [6]. ......................................................................... 9
Figure 4: Segments of rhizome in four-month-old canna plant [8] .................................................... 10
Figure 5:Transverse section of canna edulis leaf [6] .......................................................................... 12
Figure 6: Germination of Canna indica seeds through in-vitro method (a) Seeds at 7 days and (b)
Seeds at 18th day of germination, detached imbibition lid is indicated in red box [10]. .......................... 15
Figure 7: Canna indica- Style and stamen; s-fertile stamen, t-theca, lp-lateral part of stigma, ap-Apical
part of stigma, spp- Secondary pollen presenter. ....................................................................................... 16
Figure 8: Hummingbird-Heliomaster furcifer pollination of Canna indica. (a) Hummingbird taking
nectar, without touching the style. (b) Hummingbird bill at the time of inward movement. The pollen
transferred on the pollinator’s beak from the stigma during an early visit of the bird is indicated through
the arrow [56].............................................................................................................................................. 17
Figure 9: World map of Cassava distribution. ..................................................................................... 23
Figure 10: Phytochemicals structure [161] .......................................................................................... 36
Figure 11: Effect of sieve size on the starch yield from fresh canna rhizome through conventional
extraction (CE) ........................................................................................................................................... 54
Figure 12: Effect of storage conditions in the yield of starch through CE from Canna rhizome...... 55
Figure 13: Comparison of conventional (CE) and ultrasound assisted extraction (UAE) method on
the yield of starch from canna rhizome ..................................................................................................... 56
Figure 14: Response surface plots (a) Effect of Solid:Liquid ratio and Temperature on starch yield;
(b) Effect of Solid:Liquid ratio and Time on Starch Yield; (c) Effect of Time and Temperature on Starch
Yield. ............................................................................................................................................................ 61
Figure 15: Comparison of conventional (CE) and utrasound assisted extraction (UAE) method on the
yield of starch from cassava rhizome. ........................................................................................................ 64
Figure 16: Response surface plots (a) Effects of Solid:Liquid ratio and Temperature on Starch Yield;
(b) Effect of Time and Temperature on Starch Yield; (c) Effect of Solid: Liquid ratio and Time on Starch

Page | x
yield. ............................................................................................................................................................ 68
Figure 17: SEM images of Conventional extracted and UAE Canna Starch. ................................... 72
Figure 18: SEM images of conventionally extracted and UAE Cassava starch ................................. 73
Figure 19: Total phenolic content from canna (fresh and frozen) rhizome. ...................................... 74
Figure 20: Total polyphenol yield from Canna through CE and UAE. .............................................. 75
Figure 21: Comparison of polyphenol yield from canna and cassava rhizome through UAE .......... 76
Figure 22: Radical scavenging activity of phenols extracted from canna rhizome through CE and
UAE. ............................................................................................................................................................ 78
Figure 23: Antioxidant activity of phenols extracted from canna rhizome through CE and UAE. ... 78
Figure 24: Radical scavenging activity of phenols extracted through Conventional extraction (CE)
and Ultrasound-assisted extraction (U AE) from fresh Canna Rhizome.................................................. 80
Figure 25: Antioxidant activity of phenols extracted from fresh canna rhizome through Conventional
extraction (CE) and Ultrasound-aAssisted eExtraction (UAE). ............................................................... 81
Figure 26: Radical scavenging activity of phenols extracted through UAE from fresh Canna and
Cassava rhizome. ........................................................................................................................................ 82

Page | xi
LIST OF TABLES
Table 1: Variables and its levels in coded form. ................................................................................... 47
Table 2: Box-Bhenken Experimental design for starch extraction. .................................................... 48
Table 3: Model Summary Statistics. ..................................................................................................... 57
Table 4:Pareto analysis of variance. ..................................................................................................... 59
Table 5: Predicted and experimented starch yield at optimum conditions. ......................................... 63
Table 6: Model Summary statistics. ...................................................................................................... 65
Table 7: Pareto Analysis of Variance. ................................................................................................... 66
Table 8: Optimum conditions for Starch yield. .................................................................................... 69
Table 9: Physicochemical properties of canna and cassava starch. .................................................... 70

Page | xii
LIST OF ABBREVATIONS
UAE Ultrasound Assisted Extraction
CE Conventional Extraction
USDA United States Department of Agriculture
HDL High-density lipoprotein
AOAC Association of Official Agricultural Chemists
SEM Scanning Electron Microscope
HPLC High Performance Liquid Chromatography
RSM Response Surface methodology
BBD Box-Behnken Design
2FI 2 Factorial Interaction
PRESS Prediction Error Sum of Squares
R2 Square of Correlation coefficient
ANOVA Pareto analysis of variance
DF Degree of freedom
µM Micromolar
mM Millimolar
µL Microliter
nm Nanometre
OD Optical Density
mg Milligram
g Gram
kg Kilogram
ml Millilitre
L Litter
m Meter
cm Centimetre
mm Millimetre
ft Feet
kHz Kilohertz
MHz Megahertz
W Watt
ha Hectare
Da Dalton
DP Degree of polymerization
°C Degree Celsius
% Percentage
min Minutes
GAE Gallic Acid Equivalent
QE Quercetin Equivalent
rpm Revolutions per minute
db Dry basis
SP Swelling Power
WA Water absorption

Page | xiii
OA Oil Absorption
DPPH 2,2’-diphenyl-1-picrylhydrazyl
ORAC Oxygen Radical Absorbance Capacity
AAPH 2,2’-azobis[2-methyl-propio namidin] dihydrochloride
Ph Power of Hydrogen
PBS Phosphate buffer

Chapter I Introduction
Page | 1
I INTRODUCTION

Chapter I Introduction
Page | 2
Roots and Tuber crops plays an eminent, countless and complex part in feeding the world.
These crops have the potential to eradicate poverty and improve food security. In many
developing world, roots and tuber crops contribute as a source of food, nutrition and cash
income [1]. The value of roots and tuber crops comes from its potential to produce ample
quantities of dietary energy and their production stability under conditions were other crops
might fail [1]. Starch is the principal component of roots and tuber crops. The significance of
starch as a raw material in both food and non-food industries are increasing. Along with starch
these crops also a good source of bioactive compounds. In spite of being a rich source of starch
and bioactive compounds, tropical roots and tuber crops like Canna edulis (Canna) remains
underutilized. Corn, potato and wheat are the three major crops which are currently used to
meet the industrial demand for starch [2]. In order to meet the growing demands of starch and
bioactive compounds, utilization of these underutilized roots and tuber crops as an industrial
source of starch is necessary.
Canna edulis (Canna) of the Cannaceae family is a perennial herb indigenous to the Andean
region in South America. It is widely cultivated for its edible rhizome in subtropical and tropical
regions of the world, in particular Taiwan, Thailand, Vietnam, China, Burma, Ceylon and India
[3][4]. Canna is considered as a potential source of starch as its content in this product reaches
75-80% [5]. Starch from Canna is qualitatively and quantitatively different of the one extracted
from corn and wheat [6][7]. It is also considered as a source of phenolic compounds [8]. Canna
starch was documented with interesting characteristics such as large granule size (60~145 µm)
[5], high amylose content, high viscosity, clear paste, high resistance to α-amylase hydrolysis
and high retrogradation levels [9][10][6]. Owing to these properties it is used by Food industries
as food additive (e.g., soups, sauces, noodles production) and by pharmaceutical industry as
excipient (e.g., in tablets, capsules, bulk granules, medicated powders) [11][12][13].
In tuber crops starch granules are enclosed in cellulosic fibers [14]. Isolation of starch from

Chapter I Introduction
Page | 3
this matrix is performed through grating, to disrupt the cellular matrix and to release starch,
followed by filtration through sieves. The starch slurry is concentrated through decantation or
centrifugation [15]. Although standard extraction method is simple, complete disintegration of
celluloids is unattainable, thus the starch present in fibrous residue can be lost as high residual
starch. In order to increase starch extraction yield, efficient disintegration of cellular matrix is
essential. Some researchers achieved it with enzymatic methods [16]. It should be noted that
these methods are highly time- and energy consuming and expensive.
Numerous conventional extraction techniques have been disclosed for the extraction of
polyphenols from different plant matrices like solvent extraction [17], [18], [19], [20], [21],
[22] alkaline extraction [23],[24], hot water extraction [25], resin-based extraction [26],
electron beam- and γ-irradiation-based extractions [27], [28], enzyme-assisted extraction [29],
and supercritical fluid extraction [30]. These extraction techniques may either compromise the
efficiency of extracted polyphenols by exposing it to high temperatures for a long period of
time as in solvent extraction, or might possess potential health risk because of the ignorance of
safety criteria during irradiation. Though enzyme-assisted extraction is effective, enzyme
denaturation limits its application. These drawbacks promote the use of sustainable green
extraction techniques like ultrasound. This technique offers advantages in terms of yield
improvement, enhanced quality, efficient process time, minimized chemical hazards and
environment preservation [31].
Ultrasounds are sound waves with a frequency ranging from 20 kHz to 10 MHz. As it passes
through the liquid medium it generates a longitudinal particle displacement which results in
compression and rarefaction cycle. These cycles generate cavitation bubbles into the medium,
which grow during the cycle. When the cavitation bubbles reach a critical point, it erupts with
the release of high pressure and temperature which in turn generate micro jets. This engender
shear forces that break long chain polymers with limited effects on smaller molecules [31][32].

Chapter I Introduction
Page | 4
This mechanical action of sonication has been employed not only for improving the efficiency
of separation process through the disruption of cells walls, but also to enhance native starch
properties [33]. Ultrasound Assisted Extraction (UAE) has been employed for increasing the
yield of extraction of starch from maize and rice [34][35][36] and of polysaccharides from
mulberry leaves [37]. It was also described to decrease the time required for the extraction of
vitamin C and phenolic compounds from acerola fruit [38] and of water-soluble hemi-celluloses
from wheat bran [39]. In addition it was reported improve bioactive compounds extraction from
various plant matrices [40][41][34].
The efficiency of Ultrasound assisted extraction in isolating starch and polyphenols from the
root crop like Canna edulis rhizome is not reported yet. The present study aimed,
-To evaluate the effect of Ultrasound Assisted Extraction (UAE) on yield, granular
morphology, and functional properties of starch extracted from Canna (Canna edulis) and to
optimize the UAE conditions for maximum starch yield from Canna (Canna edulis) through
Response Surface Methodology
-To validate the efficiency of Ultrasound Assisted Extraction protocol by applying it for
starch extraction from Cassava (Manihot esculenta)
-To study the effect of Ultrasound Assisted Extraction on the polyphenol yield and
antioxidant activities from Canna and Cassava Rhizome

Chapter II Literature Survey
Page | 5
II LITERATURE SURVEY

Chapter II Literature Survey
Page | 6
II.I CANNA
II.I.I Origin and Distribution of Canna species
Origin: Canna edulis, of family Cannaceae is a root crop, which was originated and
domesticated in the Andean region [42]. According Kamer et al., (2008) the family Cannacea
originated from Neotropics and all the dispersed species from Africa to Asia were derived from
the plant parts (rhizomes or seeds) imported from Neotropics. They state that as these plants
have been naturalized very early now, they behave as indigenous taxa. They have identified that
almost all the species from Asia and Africa have similar characteristics as that of the species
Canna.indica. Based on their study it was found that Canna edulis Ker Gawal has similar traits
as that of Canna.indica and it was considered as a synonym for Canna.indica [43].
Distribution: Cannacea family is widely dispersed over Neotropics. It is distributed from
northern Argentina and West Indies (Canna.indica and Canna.glauca) to U.S.A- Virginia
(Canna.flaccida). It is scattered over the altitude range from sea level to almost 3000 m,
especially species like Canna.bangii, Canna.iridiflora, Canna. jaegeriana, and Canna.liliiflora
which grows in Andes of Peru and Bolivia. The family has heterogeneous habitat preference,
some species like Canna.flaccida and Canna.glauca grows at low, open and wet vegetative
conditions, whereas some species favor forest conditions. Not only that several canna species
flourish as weed among other cultivated crops but also as secondary vegetation [43].

Chapter II Literature Survey
Page | 7
Figure 1: Distribution of Canna Indica around the world according to discover life
II.I.II Classification or Taxonomy
Kingdom: Plantae, Subkingdom: Tracheobiont, Superdivision: Spermatophyta, Division:
Magnoliophyta, Class: Liliopsida, Subclass: Zingiberidae, Order: Zingiberales, Family:
Cannaceae [44].
The Cannaceae family has single genus Canna and 10 species. Though there are numerous
species identified as canna according to Kamer et al., (2008) most of the species were found to
have similar characteristics as that of either one of the identified 10 species [43].

Chapter II Literature Survey
Page | 8
Figure 2: Classification of the family Cannaceae
II.I.III Botanic and Physiology
i) Vegetal apparatus
General morphology: Edible canna are approximately 2-3m tall [4]. The Canna species are
very uniform in their vegetative morphology. The leafy shoot emerges from each rhizome
segments with terminal inflorescence. Leaves undergo transition from scale-leaves to foliage-
leaves at the base of each shoot, whereas the foliage doesn’t change to bracts. Foliage leaves
FAMILY: Cannaceae
GENUS: Canna
Canna bangii
Canna flaccida
Canna glauca
Canna indica
Canna iridiflora
Canna jaegeriana
Canna liliiflora
Canna paniculate
Canna tuerekheimii

Chapter II Literature Survey
Page | 9
are arranged at each swollen node distichously. Each leaf has an open, eligulate, encircling leaf
sheath which pass gradually into an indistinct petiole. The petiole becomes the midrib of the
ovate-lanceolate lamina. The veins present in the lamina pass from midrib region to the leaf
margin asymptotically [45].
Figure 3: First picture denotes the root system of canna at early growth stage and the second picture denotes the
root system of canna at later growth stage [6].
Vacuoles present in the epidermal cells of the aerial parts contain anthocyanin, which imparts
color to the reddish-purple colored plants [4].Edible canna has fibrous root system which
encompasses thin primary and secondary lateral root and thick adventitious roots. Some unique
features of canna adventitious roots are lacunate cortex and polyarch stele with many vessels.
These adventitious roots generate as horizontal roots and vertical roots simultaneously along
the rhizome nodes, the formal root runs shallow underground, whereas the later root as the name
suggests grows deep into the soil. At the early growth stage the root system was observed to be
clumpy, which then transition to mushroom stage at the middle growth stage (Figure 3). Shoots
emerge from the rhizome at the early growth stage, however as temperature declines or on the

Chapter II Literature Survey
Page | 10
onset of water scarcity rhizome swell due to starch accumulation [46].
Rhizome: Edible canna has fleshy rhizome which grows horizontally and are sympodially
branched [45]. Rhizomes are tuberous, short and rich in starch, which are divided into segments
by nodes with scale-like leaves arranged distichously [4][43].A single fully mature rhizome can
grow up to 2ft long and may contain 12 segments representing 5 generations [47]. Epidermis
of the rhizomes are sometimes tanniferous but not cutinized. Cortex is narrow with scattered
arrangement of vascular bundles. Cortical fibers are adjacent to phloem and xylem. An
indistinct endodermis layer surrounded with anastomosing vascular strands demarcate the
central cylinder from cortex. At the periphery of the central cylinder irregular and wider
mucilage canals are present. Central vascular bundles with several metaxylem elements and
fiber sheathed phloem are arranged irregularly [45]. Rhizome segments are classified as mother,
mature, immature and premature segments. According to puncha-arnon et al (2007), starch
content is less in mother segment followed by mature segment, whereas it increased from
immature to premature segment. Whereas the size of the starch granules progressed along with
the segments from immature to mature segments [48]. Edible cannas are propagated through
the divisions of appropriate rhizome [4].
Figure 4: Segments of rhizome in four-month-old canna plant [8]

Chapter II Literature Survey
Page | 11
Stem and Leaves
Stem: Aerial stem has thinly cutinized epidermis, rectangular and elongated cells with
slightly thick walls. Sporadically stem contains stomata. At the internode the cortex and central
cylinder has indistinct boundary. Following epidermis one-two layers of achromatic
hypodermal cells are present after which one-two layers of chlorenchyma cells. The large
peripheral vascular bundles are composed of well-developed fibrous phloem. Central vascular
bundles are irregularly scattered. It is devoid of sheathing fibers but occasionally has small
thick-walled prosenchyma adjoining xylem and phloem. Each central vascular bundle is
comprised of single wide tracheal element, whereas only the largest vascular bundle has
extended protoxylem. Wide mucilage canals are present in ground tissue at the internodes.
Nodes are slightly swollen with a vascular plexus. Large mucilage canals present at nodes are
the continuation of the mucilage canals of the internodes. Although the leaf traces are inserted
horizontally in the rhizome, it has a palm type distribution in the main stem [45]. The main stem
has approximately around 12-22 elliptical leaves based on the region of cultivation, in temperate
regions it has around 20-22 leaves and in tropical or torid regions it has around 12-14 leaves
[4][46]. Although the stem is stunned at the early growth stage, it starts to elongate with time
notably under hot temperature [46].
Leaf: The leaves have dorsiventral lamina in general but sporadically have isolateral lamina.
They are devoid of hairs. Epidermis of the leaves has a thin cuticle with anticlinical walls which
are thicker than mesophyll cells. Inner epidermal walls are thicker than the outer walls [45].

Chapter II Literature Survey
Page | 12
Figure 5:Transverse section of canna edulis leaf [6]
Hypodermal cells are located one-layer underneath each surface of cells. It is thin walled,
colorless, rectangular or hexagonal. Abaxial hypodermal cells are shallower than the adaxial
cells. In some cases adaxial cells act as expansion cells [45]. Stomata are not only present
frequently on abaxial surface but are also occasionally present on the adaxial surface.
Chlorencyma cells are always present with in the adaxial palisade. Generally veins are diffused
in the leaves, whereas few large veins are attached to both surface of the leaf by fibers but small
silica-cells separate those fibers from epidermis. In the leaf axis initially the midrib, petiole and
leaf sheath are separate from each other but gradually it merges [45]. In the midrib abaxial
hypodermal tissues are formed with oblique cells, which are structured as elongated cells with
round ends and are arranged obliquely [46][49].
Flowers and Fruits
Flowers: 3.5 to 7.5 cm long erect. In general the flowers are deep red to yellow in color and
the sepals are whitish green to red or purple in color with acute and triangular-ovate (0.8-2×
0.3-0.5 cm). Corolla are 3-6.5 cm long with erect, acute, triangular petals (2.5-5×0.3-0.7cm).
Color of the corolla varies from red to yellow. Flower has 3 or 4 staminodes, which are of red
to yellow shades. The staminodes are 4.5-7.5cm long and the free part are obovate to triangular

Chapter II Literature Survey
Page | 13
(2.5-5 × 0.3-0.8 cm). Staminodes are erect except for one recurved and are occasionally dotted
or stripped. Stamen color varies from red to yellow with narrowly elliptical (1.5-25 × 0.2-0.6
cm) free part and 0.5-1.2 cm long. Shades of the style differs from red to yellow and the free
part from linear to club-shaped (1.5-4.5 × 0.1-0.3 cm). Canna.indica flowers are long-lasting
flowers, they are at anthesis for several days. Fruits: Fruits of canna species are capsules. They
are bright green in color and covered with tubercles (green to purple). Shape differs from
ellipsoid to sub-globose or obovoid (1.5-5.5 × 1.5-3.5 cm), Seeds are 4-8 mm in diameter and
of sub-globose shape. Initially they are of white in color and turns black with chestnut brown
spots upon maturation, they are protected with smooth coating [50] [43].
ii) Physiology
Life cycle of plant
All the species of Canna has a life cycle of about 9 months/ 36 weeks. The first green leaf of
the plant, from the bud of underground rhizome grows in the first week of September, which
continues to grow for the next 45 days to reach their adult length of 2.5 m with 7 to 11 leaves.
From the first week of September to the last week of October vegetative growth from the
rhizome occurs. From either the last week of October or the first week of November to the last
week of May flowers bloom as well as produce seeds and fruits. By the end of February the
plants produce copious amount of fruits and seeds, the colonies also attain its maximum height.
At this time period the seeds fall of and either germinate if the climatic conditions are favorable
or they will remain dormant. One infrutescence of Canna indica contains nearly around 20-28
seeds, this numbers varies based on the species of Canna [51].
Vegetal reproduction cycle: Canna indica is practically propagated through rhizome
division, seeds rhizomes of 20-500 g fresh weight was employed for screening. Based on the
study by Intabon et al., (1993) rhizomes of 200 g fresh weight produced optimum yield with
efficient growth rate, thus the optimum weight for the seed rhizome were considered as 200 g

Chapter II Literature Survey
Page | 14
[52]. Plagiotropic axis in the rhizome curves in the upward direction after producing 5-6 nodes
to develop the aerial part of the plant. Propagation is restarted by the axillary bud which arises
from the base of last node and the pattern is repeated. Each active node not only has profuse
abaxial and adaxial roots but are also capable of producing three new individual plant, thus
resulting in a row of plants from a single seed rhizome. Moreover, main axis of each plant forms
a “Y” branching mode by dividing into two separate braches which, not only increases the
number of plants but also strengths the underground root connections [51]. Ciciarelli 2011,
studied the in-vitro germination of Canna indica seeds, based on his studies total germination
time for producing a new plant was 18 days. First the seeds were immersed in hot water (50°C,
24 hours) thrice to remove the imbibition lid and to soften the coat [43]. On the third day of
germination, cotyledon pushed the radicle through micropilar region. On the 7th day white
cotyledon grew to 2.5cm long with cotyledon node, tiny radicle and short hipocotyledon. The
first green leaf grew on the 18th day of germination, length of the axis was around 6 cm and the
cotyledon sheath provided a protective covering to the growing apex [51][53].

Chapter II Literature Survey
Page | 15
Figure 6: Germination of Canna indica seeds through in-vitro method (a) Seeds at 7 days and (b) Seeds at 18th
day of germination, detached imbibition lid is indicated in red box [10].
Dissemination: As stated by Delpino (1867) the canna species exhibit secondary pollen
presentation [54]. Before anthesis during the bud stage, theca opens and deposits all the pollen
on style as a patch from which it will be accessed by possible pollinators [55]. During the male
phase of anthesis, pollen will be deposited freely on the dorsal side of style and they will be a
bit coherent. On completion of this phase the empty stamen shrink and coil backwards from top
to base [56].As a reward for pollinators, nectaries in septa secrete nectar into the floral tube
base [43]. Based on the place of pollen deposition on style, Bouche (1833) classified canna
species into two groups: (a) foecundatio directa: direct deposition of pollen on the stigmatic
part of style, which in turn results in self-pollination; (b) foecundatio indirecta: deposition of
pollen below the stigmatic part of style, which opens possibility for the pollinators for cross-
pollination. In case of the absence of pollinators self-pollination could be a final resort [43]
[56]. As per Yeo (1993), all the Canna species present the pollen through ornithophilous

Chapter II Literature Survey
Page | 16
syndrome, in which during the same pollinator visit both the reception and donation of pollen
will occur. Nonetheless, the pollinators have not been recorded or observed frequently.
Furthermore, it is also presumed that all the Canna species are self-compatible [55].
Figure 7: Canna indica- Style and stamen; s-fertile stamen, t-theca, lp-lateral part of stigma, ap-Apical part of
stigma, spp- Secondary pollen presenter.
According to Vogel (1969) as the flowers of Canna indica not only lack sent but also has
short tube with small nectaries, they are mostly pollinated by birds [57]. As per Kress in
Kirchoff 1983 Canna indica is predominantly pollinated by hummingbirds which was also
acknowledged by Glinos (2011) [56].

Chapter II Literature Survey
Page | 17
Figure 8: Hummingbird-Heliomaster furcifer pollination of Canna indica. (a) Hummingbird taking nectar,
without touching the style. (b) Hummingbird bill at the time of inward movement. The pollen transferred on the
pollinator’s beak from the stigma during an early visit of the bird is indicated through the arrow [56].
II.I.IV Culture
i) Conditions of culture and growing
In general Canna indica grows from spring to summer and the aerials part starts decaying in
winter and the cycle continues. Ciciarelli (2011) studied the life cycle and climatic conditions
of canna, based on his observations the climatic conditions in Province of Buenos under which
Canna indica started to grow are 13.7°C average temperature, 54 mm rainfall, 79% average
relative humidity and 11.8 hours solar radiation per day [51].
Edible canna prefers loose, loamy, well-draining soil with humus for rhizome propagation.
It can survive under both drought conditions as well as excess rain and irrigation, provided the
soil is not ill-drained. There are two important factors for canna production plant spacing and
soil moisture content. Some of the optimum spacing arrangements are 100 ×50 cm and 60×50-
60 cm. Though the root-shoot ratio is decreased under high moisture content, it provides a better
yield than low moisture content conditions [4].
ii) Conditions of Harvest and Storage
In olden days the seed rhizomes were stored in special underground pits and covered with a

Chapter II Literature Survey
Page | 18
thick layer of dry leaves and earth, for three months before planting. These rhizomes are mainly
consumed locally, thus the time interval between the production and storage is less. Whereas,
in some parts of japan the cleaned rhizomes are stored under cool frost-free and moderately dry
conditions for longer periods. Based on the studies conducted by W. Lu and W.B. Miller, (2013)
Canna rhizomes could be stored at 1-13°C for short term period (up to minimum 5 weeks) with
a moisture barrier, whereas the optimum conditions for long term storage were found to be at
1-4°C with a perforated polyethylene moisture barrier [58].
II.I.V Physico-chemical and functionalroperties of canna
i) Physico-chemistry of rhizome
Rhizome and macronutrients: Canna rhizome are composed of 50.66% moisture, 4.17%
carbohydrates. 4.35% lipid, 4.81% protein, 2.85% ash and high fibre (33.16%) content than that
of its leaves [59]. It comprised of starch, lipids, gum and traces of an alkaloid [44].Ovoidal and
eccentric starch granules, tanniferous content and calcium oxalate crystals are stored in the
central cylinder of parenchymatous tissue which compiles the thin cortex of rhizome. As starch
acts as a storage carbohydrate, tannins provide cell impermeability resulting in cold resistance
of the rhizome [51]. Petroleum ether extract of canna rhizome constitutes 3.27% 5, 8-
henicosdiene, 3.70% 7- henicosyne, 45.12% 3, 15- dihydroxy-2- octadecene, 5.18% 6-
hydroxyeicosane, 2.40% tricosane and 1.89% tetracosane [60].
Starch: The chemical and mineral composition of the starch is influenced by multiple factors
like crop genetics, planting conditions and the method of starch isolation [61]. Total starch
content of the rhizome is around 88.10±0.80 % [62], Shape of the canna starch ranges from
oval to elliptical and the granule size ranges from 13.0-57.6 µm [3], [63]. The amylose and
amylopectin content of canna starch ranges from 35.0±0.49 % and 53.0±1.11 % respectively
[62]. Apart from the macromolecules the starch also contains proteins (0.80±0.10 %), lipids

Chapter II Literature Survey
Page | 19
(0.30 %) 80% of which are methanol soluble, phosphorous (0.01%), nitrogen (0.01%) and crude
fiber (0.01%) [62], [3], [63]. Canna starch also contains minerals like Sodium (44.29 mg/100g),
Potassium (27.20 mg/100g), Calcium (2.40 mg/100g), Zinc (2.21 mg/100g), Magnesium (20.37
mg/100g) and Iron (4.79 mg/100 g) [64]. Through X-ray diffractometry crystallinity of starch
granules were studied and Canna starch was reported to exhibit Type B crystalline pattern
[63].The physicochemical properties of amylose from canna starch such as blue value, iodine
affinity, Organic phosphorous content, β-amylose limit, Number of branch linkages, Number
of degree of polymerization, Weight degree of polymerization, Apparent degree of
polymerization and limiting viscosity are as follows 1.47, 20.2-20, 5.0, 83%, 2.2, 1380-1950,
5480, 550-14,400, 361[63]. The average chain length of the amylopectin present canna starch
was documented to be 44 by Hizukuri (1985) [65] [63].The swelling power and solubility (at
95°C) of canna starch was me to be around 19 and 17% , which was reported to be lesser than
that of potato starch and cassava starch because of the higher quantity of phosphate group[63].
The gelatinization temperature range of canna was reported to range from 65°C-70°C [3] and
the rate and extent of retrogradation of canna starch in 20% solution (cooling at 5°C) was
observed to be higher than potato, arrowroot and cassava [66].
Rhizome and micronutrients: Phytochemical studies of canna rhizome validated the
presence of phenols, sterols, flavonoids and saponins[44]. Hot extracts of Canna rhizome
contains 42.71 mg GAE/g of total phenol and 21.92 mg QE/g of flavonoids[8]. As stated by
Imai et al (1990), Nitrogen content absorbed by the whole plant was around ca. 240 Kg·ha-
1[67], and the potassium content of stem was 6-14% higher than those of other tuber and root
crops[46]. Hydro-distillated essential oil from the rhizome has been identified to constitute forty
three compounds hexanal (0.05%), furfural (0.04%), heptanol (0.06%), α-pinene (0.73%),
camphene (0.48%), β-pinene (3.13%), 1,8- cineole (3.17%), γ- terpinene (0.71%), α-terpinolene
(0.22%), cis-sabinenehydrate (0.19%), β- linalool (0.63%), fenchol (0.46%), trans-pinocarveol

Chapter II Literature Survey
Page | 20
(0.40%), 1-terpinen-4-ol (4.60%), α- fenchyl acetate (3.26%), bornyl acetate (0.52%), 2,3-
pinanediol (0.08%), isobornyl acetate (2.56%), geosmin (0.49%), β-caryophyllene (2.00%), α
-caryophyllene (4.78%), γ-selinene (5.23%), salina- 3,7(11)-diene (1.72%), trans-nerolidol
(3.23%), carotol (2.72%), caryophyllene oxide (4.96%), δ-cadinol (6.33%), γ-euedsmol
(9.79%), 9-cedranone (2.43%), tridecanoic acid (2.14%), α-acorenol (2.49%), myristic acid
(1.83%), luciferin (5.05%), palmitic acid (8.53%), dibutyl phthalate (0.85%), manool (2.75%),
methyl linoleate (0.63%), geranyl linalool (2.75%), dodeceenyl succinic anhydride (0.98%),
oleic acid (0.33%), stearic acid (0.38%), geranylgeraniol acetate (0.50%) and 4,8,13-
duvatriene-1,3-diol (1.14%)[68].
II.I.VI Biological properties of Canna
i) Nutritional and Health properties
Rhizome of Canna were reported to have higher fibre content (33.16%), which led to the use
of it for treating people with stomach complains in olden days [59]. Native canna starch was
reported to have significant resistant starch content (20.8%) [69] [70], and the starch granules
was reported to have high resistance to enzyme hydrolysis [48], [69], thus they might aid in the
control of diabetes and obesity [71]. Arabinoxylans have been identified in the residues of canna
starch extraction, as these compounds possess the potential to enhance the viscosity and gel
formation and inhibition of enzymatic digestibility by pepsin and lipase, they can be employed
as dietary fibre and food additives [72].
Canna rhizomes were one among the medicinal plants employed in the treatment of AIDS,
because of their HIV type 1 reverse transcriptase inhibitory activity. The HIV-1 RT inhibition
ratio was reported to be greater than 90% at 200 bug/ml concentration. The rhizomes were
reported to exhibit antimicrobial and antioxidant activity [44].The essential oil extracted from
the rhizomes of canna were identified to contain forty three components, and terpenes and

Chapter II Literature Survey
Page | 21
terpenoids were found to constitute around 81.33% of the essential oil composition [68]. The
essential oil of canna rhizome was reported to exhibit antihypertensive and anti-inflammatory
effect because of the presence of 1-Terpinen-4-ol [50]. The essential oils exhibited significant
cytotoxicity against particular human tumor cell because of the presence of δ-Cadinol, efficient
superoxide aninon-scavenging capability owing to the presence of γ-selinene. Extracted
essential oil were also exhibited anti-fungal and anti-inflammatory activity because of the
presence of caryophyllene. Dodecenyl succinic anhydride compound which is employed as a
curing agent for epoxy resins. The extracted oil was also found to exhibit anti-bacterial activity
[68].
ii) Traditional uses
Rhizome: Traditionally the mature rootstocks were used as a source of edible starch and in
the preparation of transparent noodles. In the late 1960s to early 1970s the canna starch was
principally used for the production of cellophane noodles [73]. The premature or younger parts
of the roots were used for flavouring the palm cabbage by mixing the boiled or pulverised young
roots with tender shoots of palm cabbage. Powdered tubers were used as a thickener for sauces
and used as a texture enhancer for some prepared foods [50]. Fresh rhizome decoction was
employed to treat jaundice symptoms such as fevers, dyspepsia and dropsy. In Thailand, canna
rhizomes along with other medicinal herbs have been employed in the treatment for cancer. In
Philippines, decoctions extracted from the rhizomes were employed as diuretic and antipyretic.
In Congo, aqueous decoction of the rhizome was consumed by women with irregular menses.
Nose bleeds were relived with the macerated rhizomes. The rhizomes were used in enemas
against intestinal worms and dysentery. The rhizome infusion was used as emollient in costa-
Rica [44]
Other parts : The aerial parts of the canna was used as a livestock feed [4]. Canna was
traditionally used for treating malaria, dysentery, diarrhoea, fever, dropsy, bruises and cut

Chapter II Literature Survey
Page | 22
[74],[75]. They were also employed as diuretic and diaphoretic [75]. Decoction produced from
the roots of canna was employed for treating fever, dyspepsia and dropsy. Juice extracted from
the seeds were used to alleviate earaches and the flowers were employed in treating eye diseases
[76].The decoction extracted from the flower is employed for external wound bleeding [44].
Decoction extracted from the roots along with fermented rice was used in the treatment of
amenorrhoea and gonorrhoea. In Nigeria the powdered root was consumed to cure diarrhoea
and dysentery. Paste prepared from the entire plant is used for treating tonsillitis in Bangladesh
[44].
iii) Industrial Uses
Rhizome: Rhizomes are rich source of starch and fibre content. Rhizomes are used in bakery
industry to produce low fat, high-fibre dietary products. Baked rhizomes are employed for
making starch dense cakes [77]. As a carbohydrate source their application is not limited to
food industry, but are also employed in textile industry (cellulose) and energy industries
(Bioethanol production) [4].
Other parts: The seeds of canna are used in the production of purple dye, they are also used
as beads in jewellery. The fibre obtained from the leaves are utilized in paper making. Flowers
are used to inhibit corrosion for mild steel in the acid medium. Flowers are used in the
development of non-plasmodial, invasive tapetum. Nitrogen and Phosphorus present in the
plant are used as biomass. Biochar produced from canna is used for the removal of cadmium
[78].
II.II CASSAVA
II.II.I Origin and distribution
Cassava (Manihot esculenta) is a perineal woody shrub from the family Euphorbiaceae.
These tuberous roots and are also named as manioc, tapioca or yuca [79]. Though its origin was

Chapter II Literature Survey
Page | 23
in South America, it is widely cultivated now in tropical and subtropical regions of Africa, Asia
and Latin America. Thy are the third most important source of calories after rice and maize in
the tropics [61]. The world’s top producers of cassava in 2012 were Nigeria, Brazil, Indonesia
and Thailand with the production estimate of 262,585,741 tonnes [61]. Cassava has the potential
to be highly productive on marginal lands and poor soils, they are also highly tolerant to drought
and harsh climatic conditions [79]. Due to its flexibility in planting and harvesting they are
available throughout the year; this trait makes it a reliable crop for food security. They are
considered as a source of carbohydrate, thiamin, nicotinic acid and riboflavin but not protein.
In America, 30% of cassava produced is used for livestock feed and 40% is utilized for human
consumption. In Africa, more than 80% of produced cassava is consumed as a source of
carbohydrates by humans, whereas Asia exports its cassava produce entirely. The major
component of cassava rhizome is starch, it amounts up to 80% of dried weight of root [61].
Figure 9: World map of Cassava distribution.
II.II.II Classification or taxonomy
Kingdom: Plantae, Subkingdom: Viridiplantae, Super division: Embryophyta, Division:

Chapter II Literature Survey
Page | 24
Tracheophyta, Class: Mangnoliopisida, Order: Malpighiales, Family: Euphorbiaceae, Genus:
Manihot, Species: Manioc, bitter cassava, tapioca, cassava.
Although cassava is a commercial crop in tropical countries, only few of its varieties have
been known from the identification and nomenclature among hundreds of them. Based on the
crop’s morphological characteristics such as colour of their stems, petioles, tubers, and leaves
the varieties are distinguished. Cassava crops are also classified based on their hydrocyanic acid
content. Environmental factors such as soil, humidity, temperature, and plant age drastically
influence the production of hydrocyanic acid content [80].
II.II.III Botanic and physiology
General morphology
Cassava plants are 3-7 m tall semi-woody perennial shrub or tree. They have single to
few stems and are sparingly branching. The plant is encompassed with a smooth, light brown
to yellowish grey outer bark and cream-green colour inner bark. The consistency of the wood
is soft. The petioles are long and its colour varies from light greenish to red. Leaves contain 3-
7 lobes and its colour varies from dark green to greenish grey, above parts are dark green in
colour and the underneath parts are pale light greenish grey in colour. After 8-10 months of
plantation, long roots would to grow for 2-4 feet dept in the soil. Both male and female flowers
grow in the same plant. Fruits are somewhat subglobose with a smooth texture, they also contain
6 longitudinal wings. Fruits exhibit wide range of colours such as green, light yellow, dark
brown and white. Roots grow in clusters of 4-8 at the base of the stem. Interior of the roots
contains sweet-flavored meat, which are edible after cooking. The pure white interiors are rich
in starch content. Number of roots per plant varies based on the cassava varieties, size of the
roots differs from 30-120 cm long, 4-15 cm in diameter and weight 1-8 kg. Roots are covered
with two-part peel the outer part is comprised of cork cells and the inner part is comprised of

Chapter II Literature Survey
Page | 25
phellogen. The inner peel part contains phelloderm and phloem, which isolates the body of the
root from peel [80], [79].
II.II.IV Physico-chemical properties of cassava
i) Root and macro nutrients
Cassava is a fibrous root crop, which contains high amounts of starch and small
quantities of protein, fat and fibre. The starch is comprised of 17-20% of amylose and 80% of
amylopectin, this proportion gives cassava starch a functioning quality in the confectioneries
production. Roots contains other macronutrients such as monosaccharides (Sucrose 17%, small
quantities of fructose and dextrose), fibre (1.5 to 4%), lipid, protein (1 to 2%) [81].
Starch: The starch is comprised of a wide range of chemical components such as ash
(0.03–0.29%), protein (0.06–0.75%), lipid (0.01–1.2%), phosphorous (0.0029–0.0095%), and
fibre (0.11–1.9%). Starch contains fatty acids such as oleic acid, palmitic acid, linoleic and
linolenic acids [82]. The phosphorous contents of cassava starch are in the form of phosphate
monoester (0.0065%) [61]. Cassava starch contains smaller amounts of phosphorous when
compared to wheat, potato, mug bean, normal and high-amylose maize starch [61]. Starch
contains two major macromolecules amylose (0-30.3%) an amylopectin (15.2-26.5%), it
determines the diverse properties and applications of cassava starch. Ratio of these major
molecules are influenced by agronomic factors and plant genetics [83], [84], [85], [86]. Shape
of the starch granules have been described as truncated, oval and round, and its surface was
reported to be smoother than that of potato starch [87]. Size of the starch granules were reported
to be in the range of 2-32 µm [61]. Cassava starch granules are composed of alternating
amorphous and semi crystalline shells with a thickness between 100 and 400 nm. All the cassava
starch was reported to exhibit A-type or Ca type polymorphism [61] . Molecular weight of
cassava starch amylose and amylopectin was reported as degree of polymerization (DP) 1035-

Chapter II Literature Survey
Page | 26
1202 and 6000-17,100 respectively. Swelling power and solubilization of cassava starch varied
greatly because of the influence of factors such as genetic variations, water stress, nature of the
root from which starch was isolated. Swelling properties are also influenced by protein present
in starch granules. During heat treatment with excess water the granule-associated proteins gets
redistributed and forms an envelope encasing starch in the deformed granules. This protein
envelope retains the granule content during swelling, which in turn influence the thermal and
pasting properties of starch. Cassava starch exhibited diverse gelatinization properties (To - 61.1
to 71.3 °C; Tp - 66.8 to 74.9 °C; Tc – 78.4 to 85 °C; ∆H – 15.1-16.4 J/g). Along with genetic
factors such as amylose content, weight percentage of amylopectin unit chains, various non-
genetic factors such as agronomic practice, environmental conditions and processing
parameters influence the gelatinization properties of cassava starch [61].
ii) Roots and micronutrients
Micronutrients are nutrients required by the human body in smaller quantities. Cassava
root contains trivial amounts of potassium, magnesium, copper, iron, zinc, and manganese.
Calcium content (16mg/100g) of cassava root is high compared to maize (2 mg/100 g). Lipid
content (0.1- 0.3%) of fresh cassava roots were reported to be higher than yam and potato and
lower than rice and maize. The glycolipids present are mainly galactose-diglyceride [88].
II.II.V Biological properties
Nutrition value and Health properties
Nutritional value of cassava is influenced by factors such as specific tissue (either root
or leaf), variety of cassava, geographic location, plant age and environmental conditions.
Nutritionally valuable parts of cassava are roots and leaves, those parts constitute around 50%
and 6% of the entire cassava plant [88]. Cassava root is an efficient carbohydrate source as they
are rich in starch (energy-dense food). The root produces approximately around 250,000

Chapter II Literature Survey
Page | 27
calories/hectare/day [89]. Because of the high carbohydrate content (32-35% fresh weight basis,
80-90% dry matter basis) roots are considered as physiological energy reserve [89]. Roots also
contains lesser quantities of glucose, sucrose, fructose and maltose [88], quantities differ based
on the plant varieties. Roots of sweet cassava varieties contain 17% of sucrose with trivial
amounts of fructose and dextrose, which makes it as a suitable raw material in the production
of high-fructose syrup, pastries and beverages [90]. Fiber contents of the cassava roots are
influenced by the plant variety and age. In general, the fresh cassava roots contain
approximately not more than 1.5% fiber, whereas the root flour contains around 4% of fiber
[88]. Lipid content of the fresh cassava root ranges from 0.1% to 0.3%. Roots contain calcium
(19-176 mg/100g), potassium (0.25-0.72%), iron (0.3-14.0 mg/100g) , copper (2.00- 6.00 ppm),
magnesium (0.03-0.08%), manganese (3.00-10.00 ppm) and zinc (14.00-41.00 ppm) .Calcium
content of cassava plants ranges from 15-35 mg/100g, which was found to be relatively higher
than other stable crops. They contain relatively higher quantities of vitamin C which ranges
from 15 to 45 mg/100g edible portion [88] and trivial quantities of B vitamins such as riboflavin
(0.03-0.06 mg/100g), thiamin (0.03-0.028 mg/100g) and niacin (0.6-1.09 mg/100g) [88]. Root
peel are the relatively good source of protein, fat, minerals and fibre than the peeled roots,
whereas the carbohydrates are densely present in the peeled roots. Thus, the cassava is found
be rich in calories and low in fat, protein and other minerals and vitamins[88].
In Nigeria cassava plant is used in the treatment of tumor, ringworm, sores,
conjunctivitis and abscesses. Leaves of the plant have been employed for treating disorders like
fever, diarrhea, headache, rheumatism and loss of appetite. The leaves have also been reported
to possess anti-inflammatory, anti-hemorrhoid and antimicrobial activity. Flavonoid fractions
and volatile flavonoid compounds of the plant were found to have analgesic and anti-
inflammatory effect. Methanolic extracts of cassava were reported to have potent anthelmintic
activity. This plant was employed in the folk remedy for boils, abscesses, conjunctivitis,

Chapter II Literature Survey
Page | 28
dysentery, diarrhea, inflammation, flu, hernia, prostatitis, sores, spasm, marasmus, swellings of
testicles because of its antiseptic, demulcent, cyanogenic and diuretic properties. Owing to its
various antioxidants this plant could also be used as natural antioxidants [91]
II.III STARCH
II.III.I General Overview
Starch is the major form of storage carbohydrates in higher plants. In general plants
accumulate and store starch in its reserve organs. However, it is also distributeHd in almost
every organs of higher plants. They are present in pollen, flowers, fruits, pericarp, seeds, leaves,
woody tissue, stem, tubers, roots and bulbs [92]. Transitory starch is synthesis in higher plant
leaves. When the leaves are exposed to bright light starch is synthesized in its chloroplast, these
starches will get degraded to maltodextrin for the synthesis of sucrose during low light or dark
conditions [93] [94]. Starch in storage organs (tubers, fruits and seeds) are synthesized during
development and maturation phase of the plant’s life cycle. It is in turn used during the plant’s
germination (seed or tuber starch) or ripening (fruit starch) phase. Thus, the synthesis of starch
and degradation of it in storage organs takes place during different phase of plants life cycle.
Starch content in storage organs like potato and sweet potato tubers, endosperm of maize,
cassava and yam roots vary between 65% and 90% D.W. Composition, shape and size of starch
granules vary based on the tissue and plant source. Size of the granules vary with the maturation
of reserve tissue [93].
II.III.II Chemical composition of starch
Starch granules are composed of amylose, amylopectin, intermediate compounds, lipids
(phospholipids, free fatty acids), phosphate monoester, and proteins or enzymes. Both major
(amylose and amylopectin) and minor (lipids, phosphate monoester, and proteins) components

Chapter II Literature Survey
Page | 29
play a significant role in the functional properties of starch.
Among major components, amylopectin constitutes 70-80% of normal starch and the
remaining 20-30% is comprised of amylose. The relative proportion of amylose to amylopectin
vary with crops and its verities [95] [96] [97]. Peroni et al. (2006) reported high amylose content
in starches from canna (31.7%), yam (32.6%), and ginger (26.5%), when compared to the
amylose content from cassava (19.8%), sweet potato (22.6%) and arrowroot (20.8%) starch.
Based on the variety of the crops the amylose content were reported to differ from 3-43% for
cocoyam, 20-25% for sweet potato and 13.6-23.8% for cassava by Moorthy (2002) and Tian et
al., 1991 [98], [99]. Starch from five varieties of taro (Bun-long, Dasheen, Hawaii Red, Hawaii
white and Niu’e) were studied by Jane et al., (1992). Amylose content from the five varieties
were determined through iodine affinity and gel permeation chromatography, it was reported to
vary from 18 to 22% and 19-to 24% respectively. Amylose content of waxy starch are
negligible, amylose content of waxy maize starch is less than 1% and that of waxy barley
starch vary upto 8% [97]. Amylose content are greater than 50% in high amylose starch [100]
[101] [102] [103].
Starch granules were reported to contain intermediate compounds which has structure
and properties which are intermediate to amylose molecules and amylopectin molecules. They
possess heterogeneous nature [104]. Intermediate molecules are vastly found in high-amylose
maize starch, which are produced from mutant of maize and double mutants with the ae gene
[105] [106] [107]. They were also detected in starch extracted from the sugary- 2 gene carrying
corn [108] [109] [110]. These molecules isolated from high amylose maize starch were found
to have longer branch chains than amylopectin, as well as short linear molecules [111][112].
These compounds in high-amylose maize starch are the result of insufficient branching enzyme
IIb that transfers short chains [112][110]. Phytoglycogen is a water-soluble polysaccharide.
They were detected in sugary-1 mutants of maize and rice endosperm [105] [113] [114] [115].

Chapter II Literature Survey
Page | 30
They were reported to posse average branch chain length smaller than waxy maize amylopectin,
precisely the exterior branch chain length was observed to be smaller [116]. The highly
branched structure and water solubility of Phytoglycogen present in sugary-1 maize and rice
mutants are the result of insufficient sugary-1 gene-coded debranching enzyme [114][115].
Lipids are one among the minor components present cereal starch [117]. Ample quantities
of phospholipids and meager quantity of free fatty acids were detected in normal rice starch,
whereas, in maize starch the quantity of phospholipid and free fatty acids were small [117].
Barley, wheat, triticale and rye starches were composed of significant quantity of phospholipids
and insignificant quantities of phosphate monoesters [117]. In major cereal starches the quantity
of lipids is proportional to apparent amylose content [118] . Lipids and phospholipids restrict
the swelling of starch granule by forming stable complexes with both amylose and branch
chains of amylopectin [119][120]. Lipid content tuber and root starches are very little.
Mineral contents of the starch contribute less 0.4% of starch composition [121]. Sodium,
calcium, magnesium, potassium and phosphorous are common minerals found in starch, apart
from phosphorous the minerals have less functional significance[121]. Major forms of
phosphorus in starch are phospholipids, phosphate monoesters and inorganic phosphates. The
forms of phosphorous vary with the botanical source. Roots and tuber have phosphate mono
esters covalently bonded to its starches, Whereas, cereal starches have it in the form of
phospholipids. Sweet potato and cocoyam starches were reported to have 0.09 to 0.25% of
phosphorus content by Moorthy (2002) and Jane et al., [122][97]. Yam and canna starches was
reported to exhibit higher quantity of phosphorous (0.022 and 0.031%) than cassava (0.007%),
sweet potato (0.014%), ginger (0.007%) and arrowroot starches (0.018%) [96].
II.III.III Granule Structure
Granules from different botanical source has different size, shape and morphology as

Chapter II Literature Survey
Page | 31
reported by Jay-lin et al, 1994 [123]. Starch granule size range from 0.1 to minimum 200 µm
in diameter. Some common granule shapes are elliptical, polygons, spheres, platelets and
irregular tubes [124]. Native starch granules in general are composed of 15% to 45% of
crystalline state and ~70% of amorphous state [125][126]. Starch granules are made up of
alternating crystalline and amorphous growth rings [127]. Amylose molecules and amylopectin
are two major macromolecular compounds contribute to the starch structure. Amylose is
principally linear (1→4)-linked α-glucan with a DP (degree of polymerization) of 600, with a
molecular weight of 105- 106 Da. It was also reported to contain few α-(1→6) linkages [128].
Amylose was observed to have 9-20 branching points, which corresponds to 3-11 branch chains
per molecule. Glucose residues in each chain will be around 200-700, contributing to 32400-
113400 Da molecular weight. Botanical source of starch preeminently influences the size and
structure of amylose molecule [129]. Amylopectin is a branched polymer with α (1→4)-linked
α-glucan and α-(1→6) branch points. Molecular weight of amylopectin ranges from 50–500×
106 and it occupies the major portion of the granule. From sequential analysis of amylopectin,
it was determined that they are composed of short chains (DP: 12-20), long chains (DP: 30-40),
Very long chains (DP: 60 and above). Amylopectin chains are classified further as A, B & C-
Chains, A-chains neither carry B-chain nor C-Chain, B-chains carry either A or C chain or It
can carry both, C- chains is the original chain with reducing end. Current widely accepted
cluster model states that, the branching points in amylopectin are clustered instead of randomly
distributed [130][131][132][133]. Short linear chain clusters were speculated to be more
crystalline compared to branching points [127][121]. The B-chains of amylopectin forms more
than one side chain clusters, thus based on the number of side chain clusters it participates B-
chains were further classified as B1-B4. B1-chain aids in single cluster formation and B2- Chain
branches into two clusters and so on [134][121]. Crystalline structure of starch granules is
classified into A- type and B-type crystals. A-type starch has left-handed, parallel-stranded,

Chapter II Literature Survey
Page | 32
double helices chain structure. The double helix structure is devoid of water molecules and are
very compact. B-type starch has similar chain structure as A-type starch except for the water
content and starch in crystal packing. Double helix structures are interconnected through
hydrogen bonds. It forms a channel inside the hexagonal arrangements, which accumulates
water molecule. A part of the water molecule in the channel are bound to amylose through
hydrogen bonds and the other part bounds with other water molecule [135]. Chain length is a
predominant factor which influence the crystal formation, chains with degree of polymerization
less than 10 remains amorphous, chains with degree of polymerization between 10 to 12 forms
A-type crystals, and chains with degree of polymerization greater than 12 produce B-type
crystals. Climatic conditions also influence the type of crystal generated. A-type crystals are
generated in warmer and drier conditions as in cereal grains, B-type crystals are generated under
cool and wet conditions as in potato tubers [136].
II.III.IV Physicochemical and functional properties of starch
Major asset of starch is its functional properties. Botanical source of starch, molecular weight
of amylose and amylopectin, supramolecular organization, composition of micromolecular
compounds (Lipids, phosphorus) are some preeminent characteristics which influence the
functional properties of starch [121]. Based on the functional properties of starch (viscosity,
solubility and swelling, oil and water absorption index, freeze-thaw stability, gelatinization and
retrogradation) its application is governed.
Gelatinization of starch is a phenomenon in which the molecular order of starch granules is
disrupted in the presence of water and high temperature (above gelatinization temperature).
Gelatinization leads to increase in the viscosity of starch slurry. Concomitant with granule
swelling, amylose molecules disentangle, leave the granule and become solubilized in the
solvent. Each starch has its unique temperature range and increase in viscosity over which it

Chapter II Literature Survey
Page | 33
swells and erupts [137][138]. Continuous heating of starch paste, after it reaches its peak
viscosity results in a decline in its viscosity. This decline is termed as breakdown of starch paste,
which is the outcome of extensive solubilization and fragmentation of starch granule structures
to an extent that they are inadequate to withhold large volume of water [139][137].
Onset of retrogradation occurs as the starch paste is cooled. Free disentangled amylose
molecules realign in paste matrix through hydrogen bonds. Realignment of amylose molecules
not only increases the paste viscosity but also abate the paste clarity, this in turn affects the
palatability and appearance of the final product. This increase in starch viscosity on decrease in
temperature is termed as setback of starch paste. Consecutive storing of cooked paste at reduced
temperature results in further realignment of amylose and alignment of amylopectin. On cooling
a gel structure might assemble, if the starch-water concentration is significantly high (3-7%),
but the characteristics of formed gel depends on the properties of starch [140][141]. Freezing
and thawing of gel has a negative impact on food texture. During thawing, due to realignment
of macromolecules water oozes out from gel structure. This effect is termed as syneresis.
Syneresis of gel is proportional to the amylose content of starch, low amylose content leads to
reduced syneresis and free-thaw stable starch paste [142]. Amylose content of content not only
influence the starch retrogradation but also other functional properties like viscosity, starch
breakdown and setback. Low amylose content starch generally exhibits high peak viscosity,
greater breakdown, lower final viscosity and lower setback [142][141][143][144][145].
Another functional property influenced by amylose content is swelling and solubility of
starch. Swelling and solubility of starch is analyzed to study the non-covalent bond between the
starch molecules and to compare the bond strength at particular temperatures [146]. On heating
starch at high temperatures in the presence of excess water, hydrogen bonds between the
molecules break and disrupt the crystalline structure, exposing the hydroxyl groups of amylose
and amylopectin to water molecules leading to the formation of hydrogen bonds between

Chapter II Literature Survey
Page | 34
exposed hydroxyl groups and water molecules resulting in increased swelling and solubility of
starch [129]. Swelling and solubility of starch is directly proportional to the treatment
temperature [96],[146] Chemical compositions of starch such as amylose/amylopectin ratio,
structural features of amylose and amylopectin, lipid and phosphate content also influence the
swelling and solubility of selected starch. Sasaki and Matsuki,1998 reported increase in
swelling power with the increase in amylopectin concentration [147],[148]. Along with amylose
lipids also influence the swelling and solubility of starch, Amylose and lipids forms an insoluble
complex restricting the starch swelling and solubility [149]. Swelling and solubility of starch
was found to increase with the increase in the concentrations of phosphate monoester as a result
of increased repulsion among phosphate groups attached to the amylopectin molecules[150].
II.III.V Starch Isolation
Cereal, tubers and roots are the major sources of industrial starch production. Starch granules
present in tuber and roots are well enclosed in cellulosic fibers and pectin substrates hold it
together [151]. Isolation of starch from roots and tubers involves breaking the vegetal cell to
release starch granules through grating, followed by separating the fiber by passing the slurry
through different sieve and concentration of it by decantation or centrifugation [15]. Important
considerations during industrial starch extractions are reducing the loss of small starch granules,
avoidance of starch gelatinization, prevention of amylolytic or mechanical damage to starch
granules and effective starch deproteinization [152].
Commercial processing of cassava starch involves cleaning of roots, peeling, chopping and
rasping the rhizome to pulpy slurry. Fibre was removed from the freshly made slurry by passing
it through coarse and fine extractors. Fine fibre particles were further separated using sieves
with mesh size ranging from 140-200 mesh. To prevent the passage of starch clump in pulp
extra filtration was done. Pulp from the coarse extractor was re-extracted repeatedly to reduce

Chapter II Literature Survey
Page | 35
the loss of starch trapped in moist pulp. Nearly 45-55% of starch was trapped in moist pulp
[153]. The final starch slurry is concentrated and dewatered to produce starch cake. Horizontal
centrifuge is used to dewater the starch slurry some other alternative methods like high-pressure
filtration or filter press is employed to reduce the loss of starch in liquid stream. Thus, produced
high moisture content starch cakes were further dried in flash dryer to moisture content < 13%
before storage.
Traditional grating or rasping complete disintegration of cellular matrix to release starch
granules is impossible, resulting in reduced starch recovery. Alternative methods employed for
increasing the starch recovery from tubers and roots are enzymatic methods [154], [155], [156],
[16]. Whereas, these methods are expensive as pure enzymes for starch extraction is expensive
and time consuming because of the long incubation period.
These drawbacks promote the use of sustainable green extraction techniques like ultrasound.
This technique offers advantages in terms of yield improvement, enhanced quality, efficient
process time, minimized chemical hazards and environment preservation [31].
Ultrasounds are sound waves with a frequency ranging from 20 kHz to 10 MHz. As it passes
through the liquid medium it generates a longitudinal particle displacement which results in
compression and rarefaction cycle. These cycles generate cavitation bubbles into the medium,
which grow during the cycle. When the cavitation bubbles reach a critical point, it erupts with
the release of high pressure and temperature which in turn generate micro jets. This engender
shear forces that break long chain polymers with limited effects on smaller molecules [31],[32].
This mechanical action of sonication has been employed not only for improving the efficiency
of separation process through the disruption of cells walls, but also to enhance native starch
properties [157]. Ultrasound Assisted Extraction (UAE) has been employed for increasing the
yield of extraction of starch from maize and rice [34][35][36] and of polysaccharides from
mulberry leaves [37].

Chapter II Literature Survey
Page | 36
II.IV POLYPHENOLS
Polyphenols are secondary metabolites present in edible plants and vegetables, fruits,
cereals, seeds, oils and in processed products like tea, cocoa products, red wine etc [158],[159].
They constitute a diverse group of phytochemicals such as stilbenes, flavonoids, lignans and
phenolic acids [160]. Structures of some bioactive compounds and some important classes of
phenolic compounds are provided in Figure 10.
Figure 10: Phytochemicals structure [161]
II.IV.I Structural characterization
Phenols are compounds with the chemical structure (C6H5OH). The compounds are termed
as phenols when minimum of one hydroxyl group (-OH) is attached to atleast one or more
benzene aromatic rings (C6H5 or C6). Based on the aromatic ring the phenols are classified as
simple phenolics or monophenolics and polyphenols, as the name suggests monophenolics have

Chapter II Literature Survey
Page | 37
one aromatic rings and polyphenols have two or more aromatic rings. Polyphenols are a
heterogeneous group of chemical compounds with minimum one hydroxyl group and two or
more aromatic rings [162], [163].Polyphenols are further divided into several classes (Figure
10) based on the phenolic hydroxyl groups numbers, the specificity of the functional groups
attached to the benzene ring and the type of connection between the phenolic compounds and
rings [162]. All the phenolic compounds are generally considered as polyphenols by majority
of scientific research papers based on the fact that both (monophenolics and polyphenols)
exhibit similar characteristics and properties [162], [163],[164],[165]).
Simple phenolic compounds are comprised of one phenolic structure, one hydroxyl group as
main functional group and up to three other functional groups (R, R1 and R2). Resorcinol
comprised of two hydroxyl groups bonded to the benzene ring, present in argan oil is an
example of simple phenolic compound [162],[163].
Phenolic acids have similar structure as that of simple phenolics, in this structure along with
the hydroxyl or methoxyl group, carboxyl group (-COOH) is also attached to the aromatic
benzene ring. Phenolic acids are further divided into benzoic acids (7 (C6-C1)) and cinnamic
acids (9 (C6-C3)) [164],[166]. Vanillic acid (R=OH, R1=OCH3, R2=H) and gallic acid
(R=R1=R2=OH) represents benzoic acid [167].
Flavonoids are the largest group of polyphenols, which represents almost 50% of phenolic
compounds. Structure of flavonoids are comprised of two aromatic benzene rings, bonded by
three carbon atoms, thus exhibiting the C6-C3-C6 backbone structure. Based on the
configurations of the intermediate three carbon atom (C3) and ring B (C6) flavonoids are
classified into seven sub-classes, such as (1) flavonols; (2) flavones; (3) chalcones; (4)
isoflavones; (5) flavanones; (6) anthocyanidins and (7) flavanols. More complex flavonoid
compounds are formed based on the substitutions (oxygenation, sulfation, glycosylation and
alkylation) in the flavonoid backbone structure[162],[166].

Chapter II Literature Survey
Page | 38
Among the sub-classes some flavonoids are present only in particular foods such as,
isoflavones, which is present only in soy (1g of Soy contains 1mg of genistein and daidzein),
flavonones is present in citrus fruits (Per L of juice contains 100-250 mg of hesperidin),
flavanols are available only in some teas (per g contains around 200-300 mg of catechin,
gallocatechin and their galloylated derivatives) [168],[169].
Chalcones are the subclasses of flavonoid in which the aromatic benzene rings are bound
together by an open C3 chain. They contribute to the yellow color in flowers in some cases,
fruits such as apple also has chalcones [164][166]. Isoflavone are the compounds in which B
ring bonds to the carbon 3 of the benzopyran portion. This structure is similar to estrogen, thus
isoflavones are used as an estrogen mimetic. Leguminous items particularly soybeans are the
richest source of isoflavones [170]. In flavones and flavonols carbon 2 and 3 of ring-C are
bonded through double bonds and flavonols possess an additional hydroxyl groups at position
3. Carbon 2 and 3 of the flavanols are linked through the hydroxyl groups present at its position
3. Whereas, carbon 2 and 3 of flavanones are attached through the oxygen atom present at its
position 4. Citrus fruits are the classic source of flavanones, flavanols are mainly present in
green tea and chocolates in the form of catechin [171],[172].
Anthocyanidins are the type of polyphenols which contains positively charged oxygen
(pyrylium cation) in ring C. These molecules are termed as anthocyanins, when they are
associated to glycans. Anthocyanidins contribute to the production of colours ranging from red
to purple in different plant parts like leaves, flowers and fruits. Berries, grapes and vegetables
which are red or purple colored [173].
Stilbenes and lignans are the minor classes of polyphenols. Stilbenes possess the backbone
structure similar to flavonoids, with the only difference that both the A and B benzene rings are
bonded through two carbon atom chain (C6-C2-C6). This class of polyphenols are represented
through resveratrol, which is present in wine [162],[172]. Dimerization of the derivatives from

Chapter II Literature Survey
Page | 39
C6-C3 compounds (p-coumaryl, conferyl and sinapyl alcohol) leads to the formation of lignans
[174]. Dietary fibers, particularly flax seed and tea are the quintessential source of lignans.
Tannins are either ellagic polymer or gallic acid polymer, or both polymers, with a glucose
molecule attached. They are also present in the condensed form of two flavan-3-ol molecules.
Tannins are considered as anti-nutritional compounds [174] ,[172]. Coumarins, like cinnamic
acid, evince C6-C3 backbone, but the C3 chain forms a heterocycle ring because of the presence
of an oxygen atom. The Warfarin anticoagulant compound represents the coumarins [162].
II.IV.II The Cellular Effects of polyphenols
Phenolic compounds exhibit a wide range of medicinal properties, such as antibacterial, anti-
allergic, antioxidants, anti-inflammatory, anti-thrombotic and vasodilators [175]. Among the
polyphenol sub-classes, flavonoids are substantial antioxidants with the potential to scavenge
negative oxygen ions and free hydroxyl radicals in vivo [176]. The antioxidant activity of the
phenolic compounds attribute to the majority of the beneficial effects of phenolic compounds
from food [177].
II.IV.III Phytochemicals in roots and tuber crops
Cassava: Several factors such as plant genotype, cultural practices, climatic conditions
and the type of fertilizer (organic or inorganic) influence the phyto-nutritional status of cassava
crops. Wide range of phenolic compounds like tannins, terpenoids, alkaloids, flavonoids and
glycosides, were identified in the cassava extract [178],[179]. The main polyphenolic
compound extracted from cassava is coumarins. Catechins are present in cassava, but only in
minor concentrations [91]. Catechin gallate, flavone 3-glycosides, gallocatechin represents the
coumarins present in cassava and these compounds exhibit cardiovascular health benefits [180].
Stilbenes are also present in cassava. Two of stilbenes compounds (trans-3,3ʹ,5,5ʹ-tetrahydroxy-

Chapter II Literature Survey
Page | 40
4ʹ-methoxystilbene and trans-3,4ʹ,5-tetraxydroxystilbene (resveratrol) have been reported so far
[181]. Some rare compounds such as spiro biflavonoid larixinol, were also identified from
cassava samples [182], [183]. Cassava tubers have been reported to contain polyphenol oxidase
enzyme, which has the potential to oxidize monophenols into o-diphenols and/or further to its
o-quinones [184].
Taro: Taro crop was reported to have diverse range of a diverse range of biologically
active phyto constituents such as flavonoids, phytates, alkaloids, tannins, glycosides, sterols
and other micronutrients [185],[186]. Taro leaves extract were determined to have forty-one
phenolic compounds. About 84-87% of the total phenolic compounds from the extract were
comprised of flavones di-C-glycoside [187],[188]. Polyphenolic composition of taro corm was
investigated by Simsek and Nehir (2015), and reported that one quarter of the total phenolic
content was occupied by flavonoids [189]. In USDA 2013 database quercetin (28.7 mg kg-1)
was listed as the main flavonoid content identified from taro corm [190]. Presence of
anthocyanin have also been identified in taro corm, whereas the quantity was found to differ
from corm skin (16 mg) to corm and its petioles (3.29 mg each) [191].
Canna: Phytochemical studies of canna rhizome validated the presence of phenols, sterols,
flavonoids and saponins [44]. Hot extracts of Canna rhizome contains 42.71 mg GAE/g of total
phenol and 21.92 mg QE/g of flavonoids[8]. Hydro-distillated essential oil from the rhizome
has been identified to constitute forty three compounds hexanal (0.05%), furfural (0.04%),
heptanol (0.06%), α-pinene (0.73%), camphene (0.48%), β-pinene (3.13%), 1,8- cineole
(3.17%), γ- terpinene (0.71%), α-terpinolene (0.22%), cis-sabinenehydrate (0.19%), β- linalool
(0.63%), fenchol (0.46%), trans-pinocarveol (0.40%), 1-terpinen-4-ol (4.60%), α- fenchyl
acetate (3.26%), bornyl acetate (0.52%), 2,3- pinanediol (0.08%), isobornyl acetate (2.56%),
geosmin (0.49%), β-caryophyllene (2.00%), α -caryophyllene (4.78%), γ-selinene (5.23%),
salina- 3,7(11)-diene (1.72%), trans-nerolidol (3.23%), carotol (2.72%), caryophyllene oxide

Chapter II Literature Survey
Page | 41
(4.96%), δ-cadinol (6.33%), γ-euedsmol (9.79%), 9-cedranone (2.43%), tridecanoic acid
(2.14%), α-acorenol (2.49%), myristic acid (1.83%), luciferin (5.05%), palmitic acid (8.53%),
dibutyl phthalate (0.85%), manool (2.75%), methyl linoleate (0.63%), geranyl linalool (2.75%),
dodeceenyl succinic anhydride (0.98%), oleic acid (0.33%), stearic acid (0.38%),
geranylgeraniol acetate (0.50%) and 4,8,13-duvatriene-1,3-diol (1.14%)[68].
II.IV.IV Extraction of polyphenols
Numerous conventional extraction techniques have been disclosed for the extraction of
polyphenols from different plant matrices like solvent extraction [17], [18], [19], [20], [21],
[22] alkaline extraction [23],[24], hot water extraction [25], resin-based extraction [26],
electron beam- and γ-irradiation-based extractions [27], [28], enzyme-assisted extraction [29],
and supercritical fluid extraction [30]. These extraction techniques may either compromise the
efficiency of extracted polyphenols by exposing it to high temperatures for a long period of
time as in solvent extraction, or might possess potential health risk because of the ignorance of
safety criteria during irradiation. Though enzyme-assisted extraction is effective, enzyme
denaturation limits its application.
The booming “Green Chemistry” concept is paying way to more environmentally friendly
and efficient extraction techniques. Ultrasound assisted extraction techniques is one such
technique that offer simplified manipulation, high reproducibility in short time, reduced solvent
consumption, extraction temperature and lower energy input [192]. Sonication efficiency is
attributed to the cavitation phenomena. As the ultrasound waves passes through the medium it
generates cavitation bubbles, which grows and erupts with the release of enormous amount of
energy and leads to microjet formation. This further leads to either the breakdown of cell walls
or swelling of the cells, which in turn increases the diffusion rates across the cell wall in first
scenario or complete washing of the cell components in second scenario [193]. Many research

Chapter II Literature Survey
Page | 42
studies have claimed the efficiency of Ultrasound in increasing the yield of target compounds
at a reduced extraction time [194]
II.IV.V Polyphenols and Metabolic syndrome
Metabolic syndrome is a collection of cardiovascular risk factors (hypertension,
hyperglycemia, insulin resistance, dyslipidemia and central adiposity) which has the potential
to increase the risk of cardiovascular disease [195],[196] and type II diabetes [197]. The major
cause of disabilities in recent days are these cardiovascular disease and diabetes. Thus,
researchers are exhibiting increased interest in preventing the onset of Metabolic syndrome and
its related pathologies. Numerous studies have stated obesity as one of the prominent triggering
factors of the metabolic syndrome. Whereas, from the profound research conducted during the
last decade it was observed that along with obesity (energy balance), macro and micro nutrients
of diet also influence the onset and progression of metabolic syndrome.
A diet or a meal is a mixture of food and compounds with a range of bioavailability and
diversified interactions. Identification and isolation of the effect of a single component from a
complete diet is hindered by its versatile nature. In order to study the effect of diet on metabolic
syndrome individual dietary components present in the diet must be identified and analysed.
Phytochemicals like polyphenols and its metabolites present in the meal have been identified
to influence the metabolic syndrome evolution through different mechanism.
The pro-oxidation status and low-grade chronic inflammation are the hallmark markers of
metabolic syndrome, antioxidant and anti-inflammatory property of polyphenols qualifies it as
an efficient candidate for the prevention and progression of metabolic syndrome [198].
Moreover, polyphenols have been proven to decrease body weight [199], and blood pressure
[200], efficiently increase insulin resistance [201] and improve lipid profile [202]. Though
polyphenols are efficient in preventing or decreasing the progression of some metabolic

Chapter II Literature Survey
Page | 43
syndrome features, there is no evidence suggesting that a single food or supplement or
polyphenol is capable of acting on all metabolic syndrome, thus suggesting that entire dietary
pattern may contribute in the prevention of the onset and progression metabolic syndrome.
Numerous epidemiological studies have reported negative correlation between the
polyphenols and metabolic syndrome. In Korean women, Japanese women, and Danish men
and women consumption of coffee has been inversely proportional to the occurrence of
metabolic syndrome [203],[204],[205], and these associations were reported to differ based on
the BMI (Body Mass Index) of the individual [206]. In Taiwanese males, consumption of tea
(≥ 240 ml) on daily basis was observed to be inversely correlated with the prevalence of
metabolic syndrome [207]. Moderate red wine consumption of Spanish cohort was found to
exhibit a negative correlation not only with the incidents of metabolic syndrome, but also with
waist circumference, fasting glucose and blood pressure, accompanied by higher HDL level
[208]. From the existing literatures it is evident that polyphenol consumption at maintained
dose has the potential to alleviate some components of metabolic syndrome. However, no
specific food or polyphenol is yet proven to influence all the metabolic syndrome components.

Chapter III Methodology
Page | 44
III Methodology

Chapter III Methodology
Page | 45
III.I Preliminary screening
III.I.I Sample type and preparation
Types: Four samples were selected for initial screening, Fresh Canna (Canna edulis)
rhizome, Frozen (Cold Stored) Canna rhizome, Lyophilized Canna Rhizome and Fresh Cassava
(Manihot esculenta) rhizome. Samples were screened based on significant starch yield through
conventional extraction.
Preparations: Fresh samples of Canna and Cassava rhizomes were collected from local
farmers of Reunion island “Le pied à l’étrier”, cleaned, trimmed and stored at room temperature
for further analysis. Frozen samples were prepared by storing the cubed (approximately 1cm)
fresh cleaned rhizomes at -80°C. Some frozen samples were Lyophilized and stored at room
temperature in airtight pouches for further analysis.
III.I.II Sieve selection
Optimum sieve for the separation of fiber and starch was selected through aqueous extraction
of fresh rhizome. Cubed rhizomes were mixed with equal proportions of water and grounded
in a high-speed laboratory blender (Philips HR 2084, Brazil), the grounded slurry was filtered
with different sieves (50, 80, 100, 120, 150, 200 µm) sieve. Filtrate was sedimented for 3 hours
at room temperature. The starch sediments were washed with distilled water and dried at 40°C
in hot-air oven for 24 hours. Dried starch was grounded and sieved with a 150 µm sieve and
stored in air-tight pouch at room temperature (25°C) for further analysis.
III.I.III Sample selection
Starch yield from Fresh canna rhizome, frozen canna (-80°C) rhizome and lyophilized canna
rhizome was studied through the aqueous extraction method. Rhizomes were mixed with

Chapter III Methodology
Page | 46
different proportions of water as per the sample requirement for thorough blending and
grounded in laboratory blender (Philips HR 2084, Brazil), the slurry was filtered with 200 µm)
sieve. Filtrate was sedimented, dried and stored.
III.II Starch extraction Fresh rhizomes were selected for starch extraction through conventional (Aqueous) and
ultrasound assisted extraction (UAE). Bath Ultrasound assisted extraction (UAE) was
performed to extract starch and polyphenols from rhizomes. Conventional extraction (aqueous
extraction) was performed as a control to study the efficiency of the proposed UAE method.
III.II.I Conventional extraction (CE) of starch
50 g of cubed rhizomes were mixed with equal proportions of water and grounded in a high-
speed laboratory blender (Philips HR 2084, Brazil), the grounded slurry was filtered with a 150
µm sieve. Filtrate was sedimented for 3 hours at room temperature. The starch sediments were
washed with distilled water and dried at 40°C in hot-air oven for 24 hours. Dried starch was
grounded and sieved with a 150 µm sieve and stored in air-tight pouch at room temperature
(25°C) for further analysis.
III.II.II Ultrasound Assisted Extraction (UAE) of starch
Starch extraction was done using the method described by Sit et al. (2014) [209] with slight
modifications in bath ultrasound (AL04-12-230, Advantageous Lab, Belgium) functioning at
38 kHz frequency and 800 W heating power, including time and temperature controllers.
Briefly, 100 g of cubed rhizome were grounded with appropriate proportions of water in high
speed laboratory blender (Philips HR 2084, Brazil) and sonicated at varying extraction
conditions selected on the base of preliminary analysis and literature review (Table 1).
Sonicated slurry was filtered using 150 µm sieve. Filtrate was sedimented for 3 hours.

Chapter III Methodology
Page | 47
Sedimented starch was washed with distilled water and dried at 40°C in hot-air oven for 24
hours, followed by grinding and sieving (150µm). Samples were then stored in air-tight pouch
for later further analysis.
III.II.III Optimization of UAE conditions for starch extraction
through Response Surface Methodology (RSM)
RSM is a mathematical tool used for optimization of process conditions based on multiple
linear regression that considers the main, quadratic and interactive effects of process variables
[19]. Box-Behnken design (BBD) [36] is an independent, rotatable or partially rotatable, three-
level fractional factorial design with second-order polynomial design. Three- Factor (Extraction
temperature, extraction time and Solid: liquid ratio), three level BBD design was applied in
order to study the influence of factors and optimize the process conditions (Table.1) to increase
the starch yield. Factors and conditions were screened through single factor analysis. Levels of
the factors are coded as -1, 0 and 1, according the following equation [210] (Table 1).
𝑥𝑖 =𝑋𝑖 − 𝑋𝑧
∆𝑋𝑖 𝑖 = 1,2,3 … … 𝑘 (1)
Where xi, denotes the dimensionless value of the variables, Xi, is the actual value of the
independent variable, Xz, is the actual value of independent variable at the center point and ΔXi
is the distance between the actual value of center point and the actual value of the superior or
the inferior level of the variable.
Table 1: Variables and its levels in coded form.
Variables Level (-1) Level (0) Level (1)
Temperature (°C) 30 40 50
Time (min) 5 10 15
Solid: Liquid (g/ml) 1:1 1:2 1:3

Chapter III Methodology
Page | 48
The design is composed of 17 experiments with five center points. Centre points are used to
estimate the pure error. Number of experiments are calculated using the following equation.
𝑁 = 2𝑘(𝑘 − 1) + 𝐶𝑝 (2)
Where k is the number of independent variables and Cp is the number of centre point
replicates [211]. Experimental design is given in Table 2. Unexplained deviations in the
response due to external factors were minimized through randomizing the experimental run.
Correlation between the response and the independent factors were studied through an
empirical model which was developed using second order polynomial equation. The general
form of second order polynomial equation is given below
𝑌 = 𝛽𝑜 + ∑ 𝛽𝑗𝑋𝑗𝑘𝑗=1 + ∑ 𝛽𝑗𝑗𝑋𝑗
2𝑘𝑗=1 + ∑ ∑ 𝛽𝑖𝑗𝑋𝑖𝑋𝑗 + 𝑒𝑖
𝑘<𝑗=2𝑖 (3)
Where Y denotes the response, Xi and Xj are variables and its levels (i and j) from to k, β0 is
the intercept coefficient of model, βj, βjj and βij represents the intercept coefficients of linear,
quadratic and the second-order terms, k is the number of independent variables (k =3), ei,
represents the error[212].
Table 2: Box-Bhenken Experimental design for starch extraction.
RUN Temperature (°C) Time (min) Solid:Liquid (g/ml)
1 40 15 1.1
2 30 10 1.3
3 40 5 1.3
4 30 10 1.1
5 50 10 1.1
6 50 5 1.2
7 40 10 1.2

Chapter III Methodology
Page | 49
8 40 10 1.2
9 50 15 1.2
10 50 10 1.3
11 30 5 1.2
12 40 10 1.2
13 40 15 1.3
14 40 10 1.2
15 30 15 1.2
16 40 5 1.1
17 40 10 1.2
Multiple regression analysis and Pareto analysis of variance (ANOVA) were used to analyse
the experimental data and to test the significance of the selected mathematical model using
Design Expert software (Version 8.0.7.1, Stat-Ease Inc., USA).
III.III POLYPHENOL EXTRACTION
III.III.I Conventional extraction of phenols
The procedure proposed by September et al. [213] was used for phenol extraction. 30 ml of
aqueous acetone (70% v/v) was mixed with 6 g of crushed rhizome (fresh and frozen) and
incubated at 4°C for 90 min. It was then centrifuged at 3500 rpm for 20 min at 4°C. Supernatants
were collected and incubated at -80°C for further analysis.

Chapter III Methodology
Page | 50
III.III.II Ultrasound-assisted extraction of Phenols
2 g of crushed rhizome (fresh and frozen) was mixed with 20 ml of aqueous ethanol (70%
v/v) and subjected to sonication in an ultrasound bath (AL04-12-230, Advantage lab) at 800W
power and 38 kHz frequency for a period of 15 min. Samples were filtered using Whatman no.1
filter paper and stored in dark to prevent the oxidation of polyphenols. The filter residue was
mixed again with 20 ml of aqueous ethanol (70% v/v) and subjected to sonication and filtration.
Filtrate residue was discarded, the collected liquid phase was rotavaporated at 40°C.
Rotavaporated sample was dissolved with methanol and transferred to a 10 ml amber
volumetric flask and the volume was made up with methanol. It was then filtered with syringe
filter (45 µm) in sample vials and stored at -80°C for further analysis.
III.IV Physio-chemical and functional property analysis of
isolated starch and polyphenols In order to evaluate the Ultrasound assisted extracted starch, following physico-chemical
analysis was done.
III.IV.I Starch characterization
i) Chemical characterization
Moisture content of starch was determined as described by AOAC, 1990 [214] and the
method stated by Holm [215] was used to calculate the starch quantity in the Isolated Starch.
The starch yield was measured using equation (4) [216].
𝑌𝑆% =𝑊𝑏
𝑊𝑎× 100 (4)
ii) Swelling and Solubility
The swelling and solubility index of canna starch were measured by the method stated by
Yu et al. [217] with slight modifications. 0.5 g (db) of starch samples (W) were mixed with 20

Chapter III Methodology
Page | 51
ml distilled water in centrifuge tubes and heated at different temperatures (55, 65, 75, 85, and
95°C) for 30 min in a shaking water bath. Tubes were cooled to room temperature and
centrifuged (2600 × g) for 15 min. The supernatant was transferred to a pre weighed glass dish
and kept on a boiling water bath for evaporation followed by drying at 105 °C to constant weight
(Wt). The sediment attached to the centrifuge was weighed (Wt) for SP calculation. Swelling
power (SP) and solubility (S) were measured with the following equation. (5)
𝑆𝑜𝑙𝑢𝑏𝑖𝑙𝑖𝑡𝑦 (𝑆) = 𝑊𝑡
𝑊× 100%; 𝑆𝑤𝑒𝑙𝑙𝑖𝑛𝑔 𝑝𝑜𝑤𝑒𝑟 (𝑆𝑃) =
𝑊𝑡
𝑊 − 𝑊𝑟 (5)
iii) Oil and water absorption
The method applied for oil and water absorption was proposed by M. Sujka and J.Jamroz
[218]. 0.5 g (db) of starch samples (W) were mixed with 5 ml of oil/distilled water in centrifuge
tubes. The tubes were homogenized and centrifuged at 1000 rpm for 1min. The samples were
then stored for 5 min, homogenized and centrifuged for 15 min at 1500 rpm. The unabsorbed
water or oil was discarded, and the centrifuge tubes were weighed and the Water absorption
(WA) and Oil Absorption index (OA) were calculated with the following equation.(6)
𝑂𝐴 𝑜𝑟 𝑊𝐴 =(𝑎 − 𝑏)
𝑊 × 100 (6)
Where, “a”- denotes the weight of centrifuge tube with the precipitate (g); “b”- represents
the Weight of the empty centrifuge tube (g); “W”- initial weight of the sample (g).
iv) Scanning electron microscopy
The samples were mounted on sheet metal and coated with gold in Balzer sputter Gold
Sputter FL9496 Balzers (Liechtenstein). Sample micrographs were observed and photographed
using Zeiss EVO MA10 (Germany) tungsten filament.
III.IV.II Evaluation of phenol content
Polyphenol content of the extracted phenolic samples were measured using Folin-Ciocalteu

Chapter III Methodology
Page | 52
assay proposed by Folin and Denis [219]. 25 µL extract, 125 µL Folin-Ciocalteu’s phenol
reagent (Sigma-Aldrich) and 100 µL sodium carbonate were added in a 96-well microplate. The
mixture was incubated at 54°C for 5min followed by 4°C incubation for 5 min. At 765 nm
(Infinite M200PRO, TECAN) the absorbance was measured. Using Gallic acid as standard a
calibration curve was drawn and phenol contents were measured as mg Gallic acid equivalent
(GAE)/100 g fresh weight
i) Antioxidant activity assay
Antioxidants activities of polyphenols-rich extracts from Canna were evaluated by DPPH
and Oxygen radical absorbance capacity (ORAC). Efficiency of Canna rhizome extracts free
radical-scavenging activity on 2,2’-diphenyl-1-picrylhydrazyl (DPPH) radical was determined
through the method used by Hatia et al. [220]. Diluted Extracts were incubated with 0.25 mM
of methanol diluted DPPH for 25 min at 25°C, at 517 nm the optical density (OD) was
measured. Free radical-scavenging activity was denoted as percentage of inhibition.
𝐴𝑛𝑡𝑖𝑜𝑥𝑖𝑑𝑎𝑛𝑡 𝑐𝑎𝑝𝑎𝑐𝑖𝑡𝑦 (%) = ((𝑂𝐷 𝑐𝑜𝑛𝑡𝑟𝑜𝑙 − 𝑂𝐷 𝑠𝑎𝑚𝑝𝑙𝑒)/(𝑂𝐷 𝑐𝑜𝑛𝑡𝑟𝑜𝑙)) × 100 (7)
Oxygen radical absorbance capacity (ORAC) assay employed by Hatia et al. [220] was
adopted to assess the free radical-scavenging activity of Canna rhizome. 2,2’-azobis[2-methyl-
propio namidin] dihydrochloride (AAPH) (Sigma-Aldrich) was used to generate peroxyl
radical and fluorescein (Sigma-Aldrich) was used as the substrate. 25 µL sample was diluted
40 times in phosphate buffer saline (PBS, pH 7.4). Diluted sample and 150 µL of 8.4 × 10⁻⁵
mM fluorescein were added in a 96-well black plate and incubated for 15 min at 37°C. Then 25
µL of 153 mM AAPH radical were added and fluorescence was measured for 1 hour 40 min at
an excitation wavelength of 485 nm and an emission wavelength of 530 nm (Infinite 200,
Tecan). Values were calculated based on net area under the curve (AUC), which was measured
by subtracting the AUC of the blank from that of samples and compared to Trolox standard
curve

Chapter IV Results and Discussion
Page | 53
IV RESULTS AND
DISCUSSION

Chapter IV Results and Discussion
Page | 54
IV.I Preliminary screening
IV.I.I Effect of sieve size on starch yield
Conventional extraction of starch and fiber was used to study the influence of sieve size on
starch yield, the extracted slurry was filtered through the different sieve (50 µm, 80 µm, 100
µm, 120 µm, 150 µm, 200 µm) for separating starch and fiber. From the results (Figure 11) it
can be observed that the sieve size has not much significant effect on the percentage yield of
starch and fiber. Though it causes a prominent effect on the purity of starch, the effect on yield
was found to be insignificant through ANOVA. The overall yield of starch ranges from 65-85%
and of fiber ranges from 17-35%. Though the maximum starch yield (85%) was obtained with
200 µm Sieve, the impurities in it were comparatively higher than 150 µm sieve, which also
gave almost similar starch yield (84.31%). Thus 150 µm sieve was used for further studies.
Figure 11: Effect of sieve size on the starch yield from fresh canna rhizome through conventional extraction (CE)
50
80
100
120
150
200
0
20
40
60
80
100
Sieve (m)
% Y
ield
Starch %
Fiber %
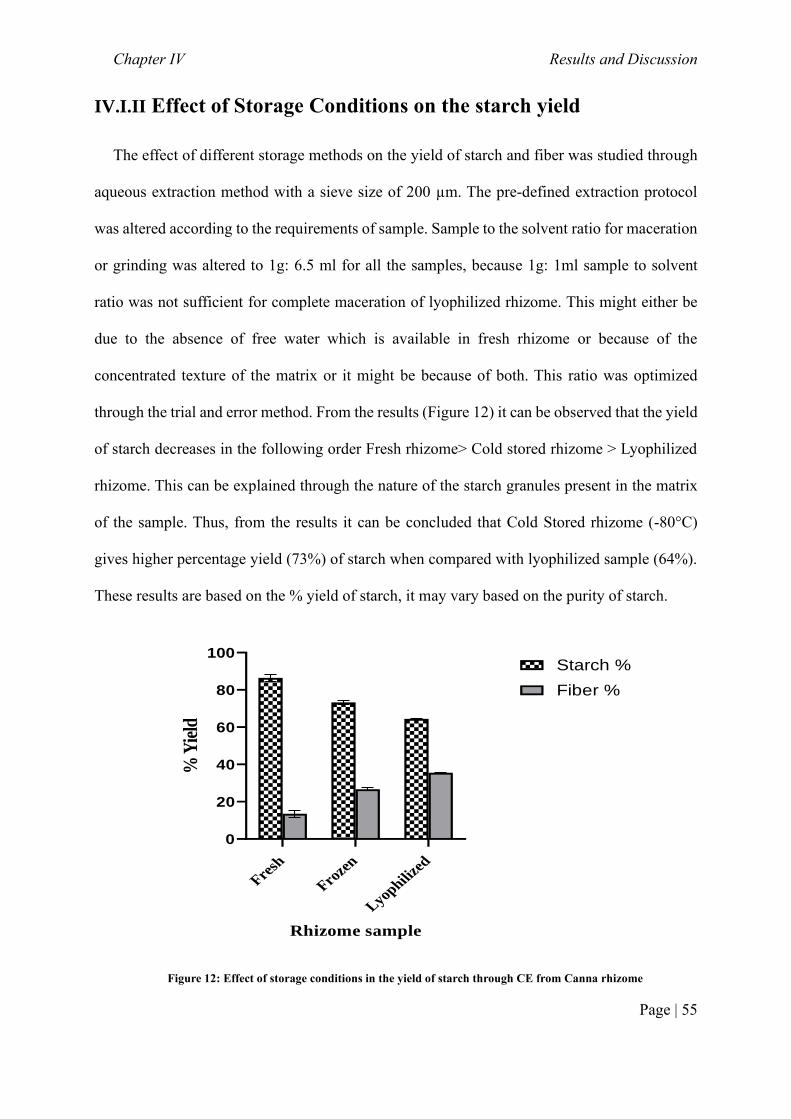
Chapter IV Results and Discussion
Page | 55
IV.I.II Effect of Storage Conditions on the starch yield
The effect of different storage methods on the yield of starch and fiber was studied through
aqueous extraction method with a sieve size of 200 µm. The pre-defined extraction protocol
was altered according to the requirements of sample. Sample to the solvent ratio for maceration
or grinding was altered to 1g: 6.5 ml for all the samples, because 1g: 1ml sample to solvent
ratio was not sufficient for complete maceration of lyophilized rhizome. This might either be
due to the absence of free water which is available in fresh rhizome or because of the
concentrated texture of the matrix or it might be because of both. This ratio was optimized
through the trial and error method. From the results (Figure 12) it can be observed that the yield
of starch decreases in the following order Fresh rhizome> Cold stored rhizome > Lyophilized
rhizome. This can be explained through the nature of the starch granules present in the matrix
of the sample. Thus, from the results it can be concluded that Cold Stored rhizome (-80°C)
gives higher percentage yield (73%) of starch when compared with lyophilized sample (64%).
These results are based on the % yield of starch, it may vary based on the purity of starch.
Fresh
Froze
n
Lyophilize
d
0
20
40
60
80
100
Rhizome sample
% Y
ield
Starch %
Fiber %
Figure 12: Effect of storage conditions in the yield of starch through CE from Canna rhizome

Chapter IV Results and Discussion
Page | 56
IV.II Influence of UAE on starch yield from canna rhizome
and its optimization through RSM
IV.II.I Comparison of conventional (CE) and Ultrasound-assisted
extraction (UAE) method
Starch was extracted from Canna through both Conventional extraction and UAE. Data are
provided in Figure 13. It was observed that starch yield obtained through Ultrasound-assisted
extraction (UAE) method was significantly higher than conventional extraction (CE). Obtained
result agree with the other researchers such as Benmoussa and Hamaker (2011)[221], Park et
al (2006)[222] and Wang and Wang (2004)[223] who reported higher starch yield from sorghum
and rice through UAE method. Increase in starch yield through sonication is attributed to
efficient disintegration of cellulosic material through cavitation effect. Mechanism behind the
cavitation effect was formation and disruption of cavities during refraction and rarefaction cycle
of ultrasonic waves with the release of violent shock waves and micro-jet [224]. These changes
in the medium causes disintegration of cellulosic matrix resulting in higher starch yield.
CE UAE
0
5
10
15
20
25
% S
tarc
h
Yie
ld
****
Figure 13: Comparison of conventional (CE) and ultrasound assisted extraction (UAE) method on the yield of
starch from canna rhizome

Chapter IV Results and Discussion
Page | 57
IV.II.II UAE optimization of starch yield through RSM
Analysis of Experimental Data
Experimental data were fitted in linear, 2FI (interactive), quadratic, and cubic models (Table
3). Statistical data (R2, adjusted R2, Predicted R2, and p-value) were availed to analyze the
significance of the fitted model. Among the fitted models, the quadratic model exhibited higher
values of R2, adjusted R2, Predicted R2, and lower p-value, which connote the significance of
the quadratic model to analyse the influence of process variables over response.
Table 3: Model Summary Statistics.
Model Summary Statistics
Source
Sequential
sum of squares
(p-value) R2 Adjusted R2
Predicted
R2 PRESS
Linear 0.0002 0.7783 0.7271 0.6332 92.3858
2FI 0.6923 0.8071 0.6913 0.4134 147.7631
Quadratic < 0.0001 0.9963 0.9916 0.9686 7.9030 Suggested
Cubic 0.4051 0.9981 0.9924 Aliased
Model fitting
Multiple regression analysis was employed to evaluate the experimental data. Second-order
polynomial equation was derived, relationship between factors and response were depicted
through derived equation. Significance of factors (linear and cross product) were appraised
through Student F-test of its coefficients. Final equation after excluding the insignificant factors
in its coded form is provide below ( Equation n°7).

Chapter IV Results and Discussion
Page | 58
𝑺𝒕𝒂𝒓𝒄𝒉 𝒀𝒊𝒆𝒍𝒅 (%)
= 𝟏𝟓. 𝟒𝟕 + 𝟎. 𝟑𝟓𝑿𝒊 + 𝟎. 𝟑𝟑𝑿𝒋 + 𝟒. 𝟗𝟑𝑿𝒌 + 𝟏. 𝟐𝟖𝑿𝒊𝒋
− 𝟏. 𝟐𝟏𝑿𝒊𝟐 − 𝟐. 𝟗𝟕𝑿𝒋
𝟐 − 𝟎. 𝟓𝟕𝑿𝒌𝟐
(1)
Statistical analysis
ANOVA (Pareto analysis of variance) was applied to validate the adequacy and fitness
of selected model, as well as of second-order polynomial equation, through evaluating the
relationship between factors (linear, interactive and quadratic interaction) and response (Table
4). Fisher’s value (F-value) provided by ANOVA was assed to determine the adequacy of
selected model. An ideal adequate model has high F-value with a consociated low p-value
(p<0.0001). ANOVA results of the quadratic model provided F-value around 210.55 with a
probability value p<0.0001, which signifies the adequacy of the selected model. Lack of fit
values provided by ANOVA determines the fitness of selected model with experimental data.
High Lack of Fit (insignificant) of quadratic model further validates the adequate fit of model
and experimental data[225]. Adequate precision of the model was computed through Signal to
noise ratio. Signal to noise ratio of a significant model is preferred to be greater than 4 [226],
for selected quadratic model it was found to be 44.14 which denotes the significance of model
to navigate the design space.
Statistical analysis as such correlation coefficient (R), determination coefficient (R2),
adjusted determination co-efficient (Adj- R2) and coefficient of variance (CV) were adopted to
validate the goodness of fit of the quadratic model [227]. Correlation between experimental
data and predicted data were assessed with correlation coefficient (R). R-value of quadratic
model was 0.9981 which denotes the significant correlation between experimental and
predicted value. Determination coefficients (R2) describes the percentage of unexplained
deviation in the model, from R2- 0.9963 of this model it was interpreted that only 0.0037 % of

Chapter IV Results and Discussion
Page | 59
the deviations were unexplained. The closer the adjusted determination coefficient (Adj- R2)
value to determination coefficient (R2) value, the efficient the correlation between experimental
and predicted values. Adj- R2 - 0.9916 value of this model is closer and smaller to R2- 0.9963,
which denotes the significant correlation between predicted and experimental value. Coefficient
of variation (C.V) describes the deviation between the experimental and predicted value.
Through C.V reliability and degree of precision of the performed experiments were validated.
C.V. value 2.75% of this experiment denotes significant reliability and high degree of precision
of the preformed experiments.
Table 4:Pareto analysis of variance.
ANOVA
Source
Coefficient
Estimate
Sum of
Squares DF
Mean
Square F- Value p-value
Model 15.47 250.97 9 27.89 210.55 < 0.0001 Significant
Xi-Temperature 0.35 1.01 1 1.01 7.60 0.0282
Xj-Time 0.33 0.88 1 0.88 6.64 0.0366
Xk-Solid:Liquid 4.93 194.17 1 194.17 1466.00 < 0.0001
Xij 1.28 6.60 1 6.60 49.86 0.0002
Xik 0.30 0.35 1 0.35 2.67 0.1463
Xjk 0.27 0.29 1 0.29 2.21 0.1807
Xi2 -1.21 6.20 1 6.20 46.80 0.0002
Xj2 -2.97 37.05 1 37.05 279.73 < 0.0001
Xk2 -0.57 1.35 1 1.35 10.20 0.0152
Residual 0.93 7 0.13

Chapter IV Results and Discussion
Page | 60
Lack of Fit 0.45 3 0.15 1.24 0.4051 not significant
Pure Error 0.48 4 0.12
Cor Total 251.90 16
Mean 13.24
Coefficient of
variance (C.V.) %
2.75
Determination
coefficient (R2)
0.9963
Correlation
coefficient (R)
0.9981
Adjusted
determination
coefficient (Adj-R2)
0.9916
Predicted
determination
coefficient (Pred-R2)
0.9686
Effect of process variables on starch yield
In this study to investigate the influence of independent variables (Temperature, Time
and Solid:Liquid ratio) over the response (starch yield), three factor three level BBD was
implemented. Response surface and contour plots were drafted to portray both individual and
interactive effects of factors over the response. Graphs were plotted in three-dimensional
manner by retaining three of two factors constant, while varying the other one. These graphs

Chapter IV Results and Discussion
Page | 61
help in better understanding of the interaction between factors and response (Figure 14).
Figure 14: Response surface plots (a) Effect of Solid:Liquid ratio and Temperature on starch yield; (b) Effect of
Solid:Liquid ratio and Time on Starch Yield; (c) Effect of Time and Temperature on Starch Yield.
Effect of Temperature
Effect of temperature on starch yield was studied and portrayed in Figure 14. From the

Chapter IV Results and Discussion
Page | 62
results it can be observed that as the temperature increases from 30°C to 40°C the starch yield
increases. As the temperature increases, cavitation threshold of the medium increases, which
results in increased nucleation of cavities [228]. Mass transfer rate between the canna matrix
and solvent were enhanced by canna matrix disruption. Disruption of matrix was attained
through cavitation effect. Principle behind the cavitation effect was eruption of cavities by a
greater force, which results in the rupture of cavitation nucleus with the release of micro-jets.
This in turn disrupts the canna matrix and enhances the mass transfer rate [229]. Whereas, as
the temperature reaches 50°C, gelatinization of extracted starch commences, density and
viscosity of the solvent decreases which results in the decrease in starch yield.
Effect of Time
Figure 14 represents the individual and interactive influence of extraction time on starch
yield. Significant increase in the starch yield was observed during the time period of 5 – 10min,
after which a decline in extraction yield was observed. During the first few minutes the rate of
cavitation effect was high, which aids in the enhanced swelling and hydration of canna matrix.
Due to eruption of micro-bubbles near the swollen matrix along with the release of micro-jets,
disruption of plant matrix and diffusion of solvent into the matrix was enhanced. This
phenomena aided in the efficient transfer of starch from plant matrix to solvent which resulted
in higher starch yield during the initial phase [230][231][232].Whereas, prolong exposure to
cavitation effect disrupt the extracted starch granule’s structure [37], thus resulted in decreased
extraction yield after 10 min.
Effect of Solid:Liquid ratio
Solid:Liquid ratio influence the extraction process by enhancing the mass transfer rate.
Higher concentrations of Solid:Liquid ratio results in lower solvent viscosity. This aids in
production of cavitation bubbles by ultrasonic waves. Cavitation bubbles grows during
refraction and rarefaction cycle of ultrasonic waves until it reaches a critical size, after which it

Chapter IV Results and Discussion
Page | 63
erupts with a release of enormous amount of energy [233]. Released energy either enlarge the
pores in call or disrupt the cell wall completely. This aids in efficient penetration of solvent into
the matrix, which results in significant mass transfer rate. From the results it was observed that
the starch yield increases along with the Solid:Liquid ratio, the optimum yield was obtained at
1:30 g:ml.
Optimization and Validation
Starch extraction conditions were optimized through Derringer’s desired function
methodology for maximum yield of starch. Under the Optimized conditions (Temperature
40°C, Time 10 min and Solid:Liquid ratio 1:30 g:ml, starch yield predicted by the model was
19.74% with a desirability value of 1 (Table 5).
Validation of the optimum conditions were attained by performing triplicate
experiments at optimum conditions and the average starch yield obtained was 19.871%. From
the results it can be observed that both the predicted value and the experimentally obtained
value were closely related, which in turn denotes the efficiency of Box-Behnken design
associated with desirability function to optimize the conditions for extraction on starch yield.
Table 5: Predicted and experimented starch yield at optimum conditions.
Factors
Optimum
Conditions
Predicted Values
Starch Yield (%)
Experimental values
Starch Yield (%)
Temperature 40 °C 19.7417 19.871
Time 10 min
Solid: Liquid ratio 01:30

Chapter IV Results and Discussion
Page | 64
IV.III Influence of UAE on starch yield from cassava
rhizome and its optimization through RSM
IV.III.I Comparison of Conventional (CE) and Ultrasound-
Assisted extraction (UAE) method.
Figure 15, portrays the yield of starch from fresh cassava rhizome through both
Conventional extraction (CE) and Ultrasound-assisted extraction (UAE) method. UAE was
found to significantly (p-value< 0.001) increase the starch yield. Cavitation effect of sonication
contributes to significant disintegration of cassava matrix, leads to efficient mass transfer rate
from cassava matrix to solvent resulting in increased starch yield. Obtained results are in
correlation with other studies done on matrices like hawthorn seeds [41],wheat bran [34],
mulberry leaves [37], orange peel [234], taro [209] etc., to increase the extraction yield.
Sonication parameters like temperature, time, solid:liquid ratio play a major role in increasing
the cavitation effect [235]. Influence of these parameters must be optimized to obtain maximum
yield from cassava rhizome.
CE UAE
0
5
10
15
20
% S
tarc
h
Yie
ld
CE
UAE
****
Figure 15: Comparison of conventional (CE) and utrasound assisted extraction (UAE) method on the yield of
starch from cassava rhizome.

Chapter IV Results and Discussion
Page | 65
IV.III.II UAE optimisation through RSM
Data Analysis and Model Fitting
Obtained experimental data were fitted to different statistical models (linear, 2FI,
quadratic and cubic models) and its significance were analysed through R2, adjusted R2,
Predicted R2, and p-value. From the obtained results (Table 6) quadratic model with significant
values of R2, adjusted R2, Predicted R2 and lower p-value, were elected for studying the factors
and its influence over response.
Table 6: Model Summary statistics.
Model Summary Statistics
Source
Sequential
Sum of squares
(p-value) R2
Adjusted
R2
Predicted
R2 PRESS
Linear 0.1009 0.3704 0.2252 0.0506 189.30
2FI 0.7655 0.4358 0.0973 -0.3674 272.64
Quadratic < 0.0001 0.9972 0.9935 0.9621 7.56 Suggested
Cubic 0.0607 0.9995 0.9979 Aliased
Second order polynomial model was derived through multiple regression analysis for
investigating the relationship between factors and response. Second order polynomial equation
after excluding the insignificant parameters are provided below (Equation n° 8).
𝑺𝒕𝒂𝒓𝒄𝒉 𝒀𝒊𝒆𝒍𝒅 (%)
= 𝟏𝟓. 𝟒𝟕 + 𝟏. 𝟎𝟑𝑿𝒊 − 𝟎. 𝟓𝟒𝑿𝒋 + 𝟐. 𝟖𝟏𝑿𝒌 + 𝟏. 𝟔𝟎𝑿𝒊𝒌
− 𝟎. 𝟖𝟒𝑿𝒋𝒌 − 𝟑. 𝟏𝟓𝑿𝒊𝟐 − 𝟑. 𝟐𝟏𝑿𝒋
𝟐 − 𝟏. 𝟗𝟑𝑿𝒌𝟐
(8)

Chapter IV Results and Discussion
Page | 66
Statistical Analysis
Regression analysis and ANOVA of three factor three level Box-Behnken design in
provided in (Table 7). The p-value less than 0.0001 of the selected quadratic model validate the
significance of selected quadratic model. Insignificant p-value of the lack of fit ascertain the
significance of regression model to fit the test. Significant determination coefficient (R2-
0.9972) and adjusted determination coefficient (adj- R2- 0.9935) validates the good relevance
and interpretation of the selected model. Lower coefficient of variation (CV-2.40%) denotes the
reliability of the selected model. From the significance test of the regression coefficients
significance of all the linear terms (Xi, Xj, Xk), interactive terms (Xik, Xjk) except (Xij) and
quadratic terms (Xi2, Xj
2, Xk2) were validated.
Table 7: Pareto Analysis of Variance.
ANOVA
Source Sum of
Squares Df
Mean
Square F- Value p-value
Model 198.8192 9 22.0910 272.3117 < 0.0001 Significant
Xi-Temperature 8.4520 1 8.4520 104.1863 < 0.0001
Xj-Time 2.3042 1 2.3042 28.4029 0.0011
Xk-
Solid:Liquid 63.1064 1 63.1064 777.9007 < 0.0001
Xij 0.0039 1 0.0039 0.0477 0.8334
Xik 10.2198 1 10.2198 125.9781 < 0.0001
Xjk 2.8060 1 2.8060 34.5885 0.0006
Xi2 41.7052 1 41.7052 514.0915 < 0.0001
Xj2 43.4274 1 43.4274 535.3210 < 0.0001
Xk2 15.6719 1 15.6719 193.1843 < 0.0001
Residual 0.5679 7 0.0811

Chapter IV Results and Discussion
Page | 67
Lack of Fit 0.4622 3 0.1541 5.8330 0.0607 not significant
Pure Error 0.1057 4 0.0264
Cor Total 199.3871 16
Mean 11.87
C.V. % 2.40
R2 0.9972
Adj R2 0.9935
Pred R2 0.9621
Response Surface Analysis
3D response surface graphs and contour plots were constructed using second order
polynomial equation to study the individual and interactive effects of process variables over
response and provided in Figure 16.
Effect of Temperature
From the results it can be observed that starch yield from cassava rhizome increased with
the increase in temperature up to 40°C and the yield was found to decrease. Increase in yield
with the increase in temperature is a result of larger number of cavitation bubbles, enhanced
desorption and mass transfer rate of starch from cassava matrix to solvent [235][236].As the
temperature increase viscosity and surface tension of the solvent increases along with the
vapour pressure. As the vapour pressure increases intensity of cavitation decreases leads to
decreased matrix disruption and decrease in yield [237]. Gelatinization of extracted starch could
also result in decreased extraction yield at higher temperatures.
Effect of Time on starch yield
Figure 16(b) and 16(c) represents the influence of time on starch yield. Increase of starch
yield with the increase in time up to 10 min followed by a decline in yield could be observed.

Chapter IV Results and Discussion
Page | 68
Increase in yield during the initial phase of extraction could be attributed to the increased
cavitation effect, which lead to significant disruption of cassava matrix and efficient mass
transfer rate [222]. Whereas, prolong exposure of extracted starch to ultrasonic waves could
lead to disruption of extracted compounds [37], [238] thus resulted in decreased starch yield.
Effect of Solid:Liquid ratio on starch yield
From Figure 16(a) and 16(c) influence of Solid: liquid ratio on starch yield could be
observed. It can be depicted that the Starch yield increases with Solid:Liquid ratio until 1:25
(g:ml). An efficient concentration difference between the interior cell matrix and exterior
solvent was created with increase solid:liquid ratio. This aids in mass transfer rate, which in
turn results in higher starch yield. However, increase in solvent concentration would not alter
the driving force as the rate of mass transfer was more confined to the interior of cassava matrix
[239]. Thus, the result slower decline of starch yield as the concentration increase was observed.
Figure 16: Response surface plots (a) Effects of Solid:Liquid ratio and Temperature on Starch Yield; (b) Effect of
Time and Temperature on Starch Yield; (c) Effect of Solid: Liquid ratio and Time on Starch yield.

Chapter IV Results and Discussion
Page | 69
Optimization and Validation
Derringer’s desired function methodology were employed for optimizing the starch
extraction. At optimum conditions (Temperature 40°C, Time 10 min and Solid:Liquid ratio 1:25
g:ml), starch yield predicted by the model was 16.62% with a desirability value of 1 (Table 8).
Triplicate experiments were performed under obtained optimum conditions to validate
the obtained conditions. Mean starch yield of the experimental data 16.517% were in well
correlation with the predicted data. This further validates the efficiency Box- Behnken design
to optimize the extraction conditions for starch yield.
Table 8: Optimum conditions for Starch yield.
Factors
Experimented
Conditions
Predicted Values
Starch Yield (%)
Experimental Values
starch yield (%)
Temperature 40 °C 16.616 16.517
Time 10 min
Solid: Liquid ratio 01:25 g/ml
IV.IV Effect of sonication on physicochemical properties of
extracted starch
IV.IV.I Water absorption Index (WAI) & Oil Absorption Index
(OAI)
Water absorption index is attributed to the association of starch polymers inside the starch
granule [240]. It is influenced by the disintegration of starch granules, Higher disintegration of
starch and the consequent leaching aids in the entrapment of water inside the starch matrix
leading to increase in water absorption index [241]. In this study, the water absorption index of
both conventionally extracted starch and UAE starch was similar. This infers that UAE

Chapter IV Results and Discussion
Page | 70
treatment conditions didn’t alter the association of starch polymers (Table 9).
Oil absorption is physical entrapment of oil molecules in starch matrix [242]. It is highly
influenced by the size and shape of the starch granule. In general sonication affects the oil
absorption property of starch granule by altering its pore size, surface area of exposure, and by
cleaving the branched chain on starch surface [243] [244], whereas the sonication conditions
used in this study was mild enough to isolate the starch from canna & cassava matrix without
disturbing the starch granule structure. Thus, the oil absorption property of both conventional
extraction and ultrasound assisted extraction was similar (Table 9)
IV.IV.II Water Solubility Index (WSI) & Swelling Power (SP)
Structural alterations and molecular arrangement of canna & cassava starch granules were
studied through swelling power and solubility index. Swelling and solubility of starch alters or
increases with the increase in disruption of starch structure. Breakdown of molecular
arrangement of starch granule leads to the exposure of hydrophilic groups to solvent, which in
turn increases the water absorption and retention [245][224].Whereas, the extraction conditions
of UAE (Temperature 40°C, Time 10 min and Solid:liquid ratio (canna- 1:30 g:ml) (cassava
1:25 g:ml)) was intense enough to only disrupt the canna cell wall matrix, leaving the starch
granules undisturbed. Thus, the swelling power and solubility of UAE starch were equivalent
to conventional extracted starch (i.e. native starch) (Table 9).
Table 9: Physicochemical properties of canna and cassava starch.
CANNA CASSAVA
CE UAE CE UAE
Moisture content (%) 14.76±0.28 17.80±0.24 10.46±0.29 10.62±0.49
Water absorption Index (%) 168.70±2.38 174.94±3.06 208.61±3.74 208.59±4.51
Oil absorption Index (%) 219.75±7.28 217.57±14.13 253.92±6.58 254.89±6.94

Chapter IV Results and Discussion
Page | 71
Water solubility Index (55° C) 201.87±1.28 212.12±1.26 422.05±7.77 360.89±25.36
Water solubility Index (85°C) 1339.10±39.23 1345.90±2.78 1539.62±26.85 1545.80±37.67
Swelling power (%) (55°C) 2.12±0.12 2.13±0.01 4.23±0.08 3.82±0.07
Swelling power (%) (85°C) 13.10±0.29 13.29±0.09 13.69±0.43 13.73±0.17
IV.IV.III Micrographs of Sonicated Samples
Morphological anomaly of starch granules was studied through SEM images (Figure 17&
18). The granules of Canna starch were in elliptical or disk shape with smooth surface devoid
of any pores and fissures, which was in correlation with other researchers [246]. The cassava
granules were oval to round with partially inward curvatures, the surface was smooth as
reported by other researchers [247]. In general, UAE treated starch granule was found to have
increased number of pores and fissures as reported by other researchers [248] [157] [224] due
to cavitation effect. Sonication conditions plays a critical part in cavitation, higher extraction
conditions result in intense cavitation effect. From the results it is clear that sonication
conditions employed for this study were mild enough to significantly isolate the starch granules
from canna matrix, without disturbing the granule structure. Therefore, the negligible impact of
UAE on starch structure is an indicator of similar physicochemical, as well as functional
properties of conventionally extracted and UAE starch samples.

Chapter IV Results and Discussion
Page | 72
Figure 17: SEM images of Conventional extracted and UAE Canna Starch.

Chapter IV Results and Discussion
Page | 73
Figure 18: SEM images of conventionally extracted and UAE Cassava starch

Chapter IV Results and Discussion
Page | 74
IV.V Polyphenol Extraction
The influence of storage conditions and extraction method on polyphenol yield was studied
and the results are provided in Figure 19 &20. To evaluate the impact of Ultrasound on
polyphenol yield from rhizome a comparison study was carried out between conventional and
UAE method and the results are provided below.
IV.V.I Effect of storage conditions on Total phenol content (Folin-
ciocalteau method)
Fresh Frozen
0
500
1000
1500
Sample
To
tal p
hen
olic c
on
ten
t
(m
g G
AE
/10
0g
)
CE
UAE****
****
## ####
Figure 19: Total phenolic content from canna (fresh and frozen) rhizome.
Influence of storage condition on polyphenol yield was studied. The results are provided in
Figure 19. From the results, it can be observed that frozen rhizome samples (-80°C) exhibited
lower TPC yield (CE-91.21 mg GAE/100g; UAE- 403.6070 mg GAE/100g) through both
conventional and ultrasound extraction method. The percentage difference between the yield of
fresh and frozen samples through both extraction method (UAE-89.82% and CE- 84.96%) were

Chapter IV Results and Discussion
Page | 75
significant. Cubing of rhizomes before freezing increased the rhizome surface area of exposure,
resulting in oxidation of phenolic compounds through Polyphenol Oxidase (PPO)[249]. Though
the activity of PPO enzyme was inhibited at -80°C, its moderate contribution in polyphenol
oxidation was very probable from the browning of rhizome cubes [250]. Freezing induces
mechanical damage to rhizome cells resulting in the disruption of vacuoles. This leads to
increased emission of mucilaginous content from cell vacuoles to solvent, which in turn
increases the solvent viscosity [251][252]. Rise in solvent viscosity, increases solvent molecular
interaction. That leads to increased cavitation threshold [235], which results in lower yield of
polyphenols from frozen rhizome through UAE.
IV.V.II Effect of Ultrasound-Assisted Extraction (UAE) on Total
Polyphenol content from Canna rhizome
CE UAE
0
500
1000
1500
To
tal p
hen
olic c
on
ten
t
(m
g G
AE
/10
0g
)
✱✱✱✱
Figure 20: Total polyphenol yield from Canna through CE and UAE.
The impact of Ultrasound-Assisted Extraction on polyphenol yield was studied and the
results are provided in Figure 20. From the results it can be interpreted that UAE (1061.7 mg
GAE/100 g) provided higher polyphenol yield when compared to the conventional extraction

Chapter IV Results and Discussion
Page | 76
method (225.97 mg GAE/100 g). Significant increase in the yield of polyphenols through UAE
method could be ascribed to ultrasonic cavitation. As ultrasonic waves passes through the
medium cavities form, grow until it reaches critical size and erupt with a release of violent
shock waves, which in turn results in increased medium temperature and micro-jet formation
[230][253][254]. This phenomenon leads to efficient rhizome cell wall disruption, increase
penetration rate of solvent in rhizome matrix, enhanced mass transfer rate [247], resulting in
higher polyphenol yield.
IV.V.III Polyphenol yield from fresh canna and cassava rhizome
through UAE
Fresh
0
2000
4000
6000
8000
10000
To
tal p
hen
olic c
on
ten
t
(m
g G
AE
/100g
)
Cassava-UAE
Canna- UAE
Figure 21: Comparison of polyphenol yield from canna and cassava rhizome through UAE
The yield of polyphenols from Canna and Cassava rhizome through Ultrasound Assisted
Extraction method was studied for further validating the efficiency of UAE. The polyphenol
yield from fresh cassava rhizome (7644.46 mg GAE/&100g) and fresh canna rhizome (1061.72
mg GAE/&100g) are provided in (Figure 21). The yield obtained from cassava rhizome was
found to be higher than the yield obtained through other conventional methods [255][256].

Chapter IV Results and Discussion
Page | 77
Increase in yield validates the efficiency of cavitation in both the matrix. Extraction time,
ultrasound power and frequency influences the efficiency of sonication [257]. The sonication
conditions employed in this study (Ultrasonic power 800W, Ultrasonic frequency 38kHz,
treatment time 15min) was found to increase the polyphenol yield from both the matrix, further
validating the efficiency of UAE irrespective of the matrix.
IV.VI Antioxidant activity
A positive correlation between the antioxidant content and antioxidant activity was
interpreted from the results. Antioxidant properties of the extracted polyphenols were studied
through DPPH assay and ORAC Assay.
IV.VI.I Effect of storage conditions on the antioxidant activity of
polyphenols
Antioxidant property of fresh and frozen sample extract were studied through DPPH
and ORAC and the results are provided in Figure 22 and Figure 23. Significant difference (UAE
fresh Vs UAE froze - p-value<0.001) in antioxidant activity between fresh and frozen extract
could be observed. This difference is in good correlation with the difference in Polyphenol yield
(TPC yield). Though the initial quantity of bioactive compounds in both samples are similar as
a result of limited polyphenol degradation at -80°C, the extraction yield between both samples
were different. The changes in frozen rhizome matrix contribute to the reduction in extraction
yield through UAE [251], which in turn reduced the antioxidant activity [258]. Thus, fresh
rhizome was selected for further studies.
Difference in the antioxidant activity between frozen CE and frozen UAE extracts were
not significant, though the TPC between aforementioned both was significant. Influence of
UAE parameters on the structural characters of extracted bioactive compounds could have

Chapter IV Results and Discussion
Page | 78
resulted in negative correlation between polyphenol content and antioxidant activity [259]
[260]. Further structural studies on the extracted bioactive compounds from frozen sample
could explain the deviation.
fres
h
froze
n
0
2
4
6
8R
ad
ical scaven
gin
g a
cti
vit
y
(%
DP
PH
red
uc
ed
) CE
UAE
✱✱
ns
####
ns
Figure 22: Radical scavenging activity of phenols extracted from canna rhizome through CE and UAE.
fres
h
froze
n
0
2000
4000
6000
8000
Tro
lox e
qu
ivale
nt
(M
)
CE
UAE
####
####✱✱✱
ns
Figure 23: Antioxidant activity of phenols extracted from canna rhizome through CE and UAE.

Chapter IV Results and Discussion
Page | 79
IV.VI.II Effect of extraction method on the antioxidant activity of
Polyphenols extracted
Extracts of the canna rhizome were analyzed to determine their radical scavenging
potency. The antioxidant activity of extracts was found to increase with the concentration of
bioactive compounds [261][8]. From the results (Figure 24), it was observed that the UAE
extract exhibited significantly higher antioxidant activity when compared to CE extract. UAE
extract provided around 59% efficient radical scavenging activity than CE extract. This can be
attributed to high phenolic content in UAE extracts, which is in agreement with the TPC content
determined from UAE extract [8]. Cavitation phenomena of sonication aids in the increase of
bioactive compounds which in turn increased the radical scavenging activity of the extract
[262]. Sonication conditions (Frequency 38 kHz, Power 800w, and time 15 minutes) employed
in this study was significant enough to extract the polyphenols without disturbing its chemical
structure (hydrogen donating potency). Obtained results were in agreement with various studies
done on the efficiency of UAE on polyphenol yield and its antioxidant activities from diverse
matrices [262] [253][234][40].
Total antioxidant capacity of an extract cannot be ensured through one antioxidant
capacity assay, to efficiently validate the antioxidant capacity of any extract both radical
quenching and radical reduction ability of the antioxidants must be measured. As the radical
reduction ability of antioxidants was determined through DPPH, the radical quenching
(hydrogen atom transfer) capability was studied through ORAC. Among all Hydrogen Atom
transfer Assays (HAT) ORAC has been proven to be the most sensitive assay to determine the
chain-breaking antioxidant capacity of Canna rhizome extract [263]. From the obtained results
(Figure 25), it can be interpreted that the extracts obtained through UAE reacted efficiently with
peroxyl radicals when compared to the CE extract and exhibited higher antioxidant activity

Chapter IV Results and Discussion
Page | 80
(UAE-5649.93 µM Trolox equivalent). A higher concentration of the bioactive compound in
the UAE extract could accredit to the increased antioxidant activity [234]. Obtained results were
well correlated with many studies conducted to analyze the efficiency of UAE in increasing the
polyphenol yield and antioxidant properties [264][257][234].
UAE resulted in 129% increase in TPC when compared with CE, the radical scavenging
activity measured by DPPH assay increased by less than 60% and the ORAC value increased
by 179%. ORAC assay was found to be more correlated with TPC increase than DPPH assay.
ORAC assay was found to exhibit higher antioxidant activity than the concentration of TPC,
this might be due to the contribution of radical quenching (Hydrogen atom transferring)
antioxidant compounds, which was undetected by TPC analysis [258]. The analysis of this
compound can be done through further analysis through HPLC.
CEUAE
0
2
4
6
8
Rad
ical
sca
veng
ing
activ
ity
(%
DP
PH
red
uced
)
✱✱
Figure 24: Radical scavenging activity of phenols extracted through Conventional extraction (CE) and
Ultrasound-assisted extraction (U AE) from fresh Canna Rhizome.

Chapter IV Results and Discussion
Page | 81
CE
UAE
0
2000
4000
6000
8000
Tro
lox e
qu
ivale
nt
(M
)
✱✱✱
Figure 25: Antioxidant activity of phenols extracted from fresh canna rhizome through Conventional extraction
(CE) and Ultrasound-aAssisted eExtraction (UAE).
IV.VI.III Antioxidant activity of bioactive compounds extracted
from Canna and Cassava rhizome
Antioxidant activity of UAE extracts from Canna and Cassava rhizome were
investigated through DPPH and the results are provided in Figure 26. Antioxidant activity was
found to be in well correlation with TPC yield, which validates the obvious relationship
between polyphenol yield and radical scavenging efficiency of the rhizome extract. Cassava
tuber comprised not only of carbohydrates but also of bioactive compounds like alkaloids,
flavonoids, tannins, anthocyanosides, scopolin, scopoletin and diterpenoids [91][255]. Results
further indicates the significant efficiency of UAE in increasing the yield of polyphenols
without negatively affecting the chemical structure of extracted bioactive compounds.

Chapter IV Results and Discussion
Page | 82
Cassava Canna
0
20
40
60
80
Rad
ical scaven
gin
g a
cti
vit
y
(%
DP
PH
red
uc
ed
) Cassava
Canna
Figure 26: Radical scavenging activity of phenols extracted through UAE from fresh Canna and Cassava rhizome.

Chapter V Conclusion
Page | 83
V CONCLUSION

Chapter V Conclusion
Page | 84
In this study, starch from canna edulis rhizome were successfully isolated using UAE.
Through BBD optimum conditions of factors (temperature, time and solid:liquid ratio) over
maximum starch yield were studied. Through SEM, swelling and solubility index, oil and water
absorption properties structural and functional morphology of extracted starch granule was
investigated. Optimum extracted conditions obtained were temperature 40°C, time 10 min,
solid:liquid ratio 1:30 g/ml. Maximum yield of starch obtained at optimum conditions was
19.81%. Starch yield obtained through conventional extraction method was 2.53%. Functional
properties and structural morphology of starch extracted through both CE and UAE were
similar.
The efficiency of ultrasound assisted extraction to improve the yield of starch from rhizome
was further validated by applying it for the extraction of starch from cassava rhizome.
Extraction conditions were optimized through BBD. Physicochemical, functional and
morphological properties of extracted starch were analysed through swelling and solubility
index, oil and water absorption properties and SEM. Maximum cassava starch yield obtained
at optimum extraction conditions (temperature 40°C, time 10 min, solid:liquid ratio 1:25 g/ml)
was 16.517%. and the yield obtained through conventional extraction method was 12.02%.
Whereas, the properties of extracted through both conventional method and ultrasound assisted
extraction method were similar.
From the results it can be concluded that significant starch yield, with negligible changes in
the properties of starch from rhizome (Canna and Cassava) can be successfully achieved
through UAE.
Micro-molecules such as polyphenols from the rhizomes of canna and cassava were
successfully isolated through UAE. Total polyphenol yield from the Canna and Cassava

Chapter V Conclusion
Page | 85
rhizome was 1061.72 mg GAE/&100g and 7644.46 mg GAE/&100g respectively. Total
polyphenol yield obtained through UAE was found to be higher than that of conventional
method. Antioxidant activity of the extracted polyphenols were studied through DPPH and
ORAC. Antioxidant activity of the extracted compounds was in well correlation with the
polyphenol yield, antioxidant activity increased with the increase in polyphenol concentration.
Thus, from the results it can be concluded that through UAE, the yield of both
macromolecules like starch and micro molecules such as polyphenols can be significantly
increased without any adverse changes it their properties.

Bibliography
Page | 86
BIBLIOGRAPHY
1. Scott GJ, Best R, Rosegrant M, Bokanga M. Roots and tubers in the global food system
[Internet]. Vol. 3. 2000. 54–67 p. Available from:
http://repositorio.unan.edu.ni/2986/1/5624.pdf
2. Ellis RP, Cochrane MP, Dale MFB, Duffus CM, Lynn A, Morrison IM, et al. Starch
production and industrial use. J Sci Food Agric. 1998;77(3):289–311.
3. Soni PL, Sharma H, Srivastava HC, Gharia MM. Physicochemical properties of Canna
edulis starch — comparison with maize starch. Starch - Stärke [Internet].
1990;42(12):460–4. Available from: http://dx.doi.org/10.1002/star.19900421203
4. Imai K. Edible Canna : A New Potential of Carbohydrate Source for Human Health.
2013;(1971):33–44.
5. Gallant DJ, Bewa H, Buy QH, Bouchet B, Szylit O, Sealy L. On Ultrastructural and
Nutritional Aspects of Some Tropical Tuber Starches. Starch ‐ Stärke. 1982;34(8):255–
62.
6. Cisneros FH, Zevillanos R, Cisneros-Zevallos L. Characterization of starch from two
ecotypes of andean achira roots (Canna edulis). J Agric Food Chem. 2009;57(16):7363–
8.
7. Aprianita A, Vasiljevic T, Bannikova A, Kasapis S. Physicochemical properties of wheat-
canna and wheat-konjac composite flours. J Food Sci Technol. 2014;51(9):1784–94.
8. Mishra T, Goyal AK, Middha SK, Sen A. Antioxidative properties of Canna edulis Ker-
Gawl. Indian J Nat Prod Resour. 2011;2(3):315–21.
9. Piyachomkwan K, Chotineeranat S, Kijkhunasatian C, Tonwitowat R, Prammanee S,
Oates CG, et al. Edible canna (Canna edulis) as a complementary starch source to cassava
for the starch industry. Ind Crops Prod. 2002;16(1):11–21.

Bibliography
Page | 87
10. Van Hung P, Morita N. Physicochemical properties and enzymatic digestibility of starch
from edible canna (Canna edulis) grown in Vietnam. Carbohydr Polym. 2005;61(3):314–
21.
11. Builders PF, Arhewoh MI. Pharmaceutical applications of native starch in conventional
drug delivery. Starch/Staerke. 2016;68(9–10):864–73.
12. Andrade-Mahecha MM, Tapia-Blácido DR, Menegalli FC. Physical-chemical, thermal,
and functional properties of achira (Canna indica L.) flour and starch from different
geographical origin. Starch/Staerke. 2012;64(5):348–58.
13. Falade KO, Okafor CA. Physicochemical properties of five cocoyam (Colocasia
esculenta and Xanthosoma sagittifolium) starches. Food Hydrocoll [Internet]. 2013
Jan;30(1):173–81. Available from:
http://www.sciencedirect.com/science/article/pii/S0268005X12001063
14. Mahfuzur Rahman SM, Rakshit SK. Effect of endogenous and commercial enzyme on
improving extraction of sweet potato starch. ASAE Annu Int Meet 2004. 2004;0300(04).
15. Daiuto É́, Cereda M, Sarmento S, Vilpoux O. Effects of extraction methods on Yam
(Dioscorea alata) starch characteristics. Starch/Staerke. 2005;57(3–4):153–60.
16. Padmanabhan S, Ramakrishna M, Lonsane BK, Krishnaiah MM. Enzymic treatment of
cassava flour slurry for enhanced recovery of starch. Food Biotechnol. 1993;7(1):1–10.
17. Anagnostopoulou MA, Kefalas P, Papageorgiou VP, Assimopoulou AN, Boskou D.
Radical scavenging activity of various extracts and fractions of sweet orange peel (Citrus
sinensis). Food Chem. 2006;94(1):19–25.
18. Jeong SM, Kim SY, Kim DR, Jo SC, Nam KC, Ahn DU, et al. Effect of heat treatment
on the antioxidant activity of extracts from citrus peels. J Agric Food Chem.
2004;52(11):3389–93.
19. Li BB, Smith B, Hossain MM. Extraction of phenolics from citrus peels: II. Enzyme-

Bibliography
Page | 88
assisted extraction method. Sep Purif Technol. 2006;48(2):189–96.
20. Manthey JA, Grohmann K. Concentrations of hesperidin and other orange peel
flavonoids in citrus processing byproducts. J Agric Food Chem. 1996;44(3):811–4.
21. Xu G, Ye X, Chen J, Liu D. Effect of heat treatment on the phenolic compounds and
antioxidant capacity of citrus peel extract. J Agric Food Chem. 2007;55(2):330–5.
22. Zia-ur-Rehman. Citrus peel extract - A natural source of antioxidant. Food Chem.
2006;99(3):450–4.
23. Bocco A, Cuvelier ME, Richard H, Berset C. Antioxidant Activity and Phenolic
Composition of Citrus Peel and Seed Extracts. J Agric Food Chem. 1998;46(6):2123–9.
24. Lo Curto R, Tripodo MM, Leuzzi U, Giuffrè D, Vaccarino C. Flavonoids recovery and
SCP production from orange peel. Bioresour Technol. 1992;42(2):83–7.
25. Xu GH, Chen JC, Liu DH, Zhang YH, Jiang P, Ye XQ. Minerals, phenolic compounds,
and antioxidant capacity of citrus peel extract by hot water. J Food Sci. 2008;73(1).
26. Kim MR, Kim WC, Lee DY, Kim CW. Recovery of narirutin by adsorption on a non-
ionic polar resin from a water-extract of Citrus unshiu peels. J Food Eng. 2007;78(1):27–
32.
27. Kim JW, Lee BC, Lee JH, Nam KC, Lee SC. Effect of electron-beam irradiation on the
antioxidant activity of extracts from Citrus unshiu pomaces. Radiat Phys Chem.
2008;77(1):87–91.
28. Oufedjikh H, Mahrouz M, Amiot MJ, Lacroix M. Effect of γ-irradiation on phenolic
compounds and phenylalanine ammonia-lyase activity during storage in relation to peel
injury from peel of Citrus clementina Hort. ex. Tanaka. J Agric Food Chem.
2000;48(2):559–65.
29. Li BB, Smith B, Hossain MM. Extraction of phenolics from citrus peels: I. Solvent
extraction method. Sep Purif Technol. 2006;48(2):182–8.

Bibliography
Page | 89
30. Giannuzzo AN, Boggetti HJ, Nazareno MA, Mishima HT. Supercritical fluid extraction
of naringin from the peel of Citrus paradisi. Phytochem Anal. 2003;14(4):221–3.
31. Chemat F, Zill-E-Huma, Khan MK. Applications of ultrasound in food technology:
Processing, preservation and extraction. Ultrason Sonochem [Internet]. 2011;18(4):813–
35. Available from: http://dx.doi.org/10.1016/j.ultsonch.2010.11.023
32. Chan H-TT, Bhat R, Karim AA. Effects of sodium dodecyl sulphate and sonication
treatment on physicochemical properties of starch. Food Chem [Internet].
2010;120(3):703–9. Available from: http://dx.doi.org/10.1016/j.foodchem.2009.10.066
33. Zhu J, Li L, Chen L, Li X. Study on supramolecular structural changes of ultrasonic
treated potato starch granules. Food Hydrocoll [Internet]. 2012;29(1):116–22. Available
from: http://dx.doi.org/10.1016/j.foodhyd.2012.02.004
34. Wang J, Sun B, Cao Y, Tian Y, Li X. Optimisation of ultrasound-assisted extraction of
phenolic compounds from wheat bran. Food Chem. 2008;106(2):804–10.
35. Shen N, Wang Q, Qin Y, Zhu J, Zhu Q, Mi H, et al. Optimization of succinic acid
production from cane molasses by Actinobacillus succinogenes GXAS137 using
response surface methodology (RSM). Food Sci Biotechnol. 2014;23(6):1911–9.
36. Box GEP, Behnken DW. American Society for Quality Some New Three Level Designs
for the Study of Quantitative Variables Society for Quality Stable URL :
http://www.jstor.org/stable/1266454 Your use of the JSTOR archive indicates your
acceptance of the Terms & Conditions of Use. Technometrics. 1960;2(4):455–75.
37. Ying Z, Han X, Li J. Ultrasound-assisted extraction of polysaccharides from mulberry
leaves. Food Chem [Internet]. 2011;127(3):1273–9. Available from:
http://dx.doi.org/10.1016/j.foodchem.2011.01.083
38. Le H Van, Le VVM. Comparison of enzyme-assisted and ultrasound-assisted extraction
of vitamin C and phenolic compounds from acerola (Malpighia emarginata DC.) fruit.

Bibliography
Page | 90
Int J Food Sci Technol. 2012;47(6):1206–14.
39. Hromádková Z, Ebringerová A, Valachovič P. Comparison of classical and ultrasound-
assisted extraction of polysaccharides from Salvia officinalis L. Ultrason Sonochem
[Internet]. 1999;5(4):163–8. Available from:
http://www.sciencedirect.com/science/article/pii/S1350417798000467
40. Chen W, Huang Y, Qi J, Tang M, Zheng Y, Zhao S, et al. Optimization of ultrasound-
assisted extraction of phenolic compounds from areca husk. J Food Process Preserv.
2014;38(1):90–6.
41. Pan G, Yu G, Zhu C, Qiao J. Optimization of ultrasound-assisted extraction (UAE) of
flavonoids compounds (FC) from hawthorn seed (HS). Ultrason Sonochem [Internet].
2012;19(3):486–90. Available from: http://dx.doi.org/10.1016/j.ultsonch.2011.11.006
42. National Research Council. Lost Crops of the Incas. 1989;
43. Maas-Van De Kamer H, Maas PJM. The cannaceae of the world. Blumea J Plant Taxon
Plant Geogr. 2008;53(2):247–318.
44. Sandeep kumar singh, Ashutosh Yadav SM. A review on canna indica linn:
Pharmacognostic and pharmocological profile. J Harmon Res Pharm. 2013;2(2):131–44.
45. Morpholoqy Q. The anatomy of Canna. 1969;
46. Imai K. Edible Canna : A Prospective Plant Resource from South America. 2008;(Gade
1966).
47. Gade DW. Achira, the edible Canna, its cultivation and use in the peruvian andes. Econ
Bot. 1966;20(4):407–15.
48. Puncha-arnon S, Puttanlek C, Rungsardthong V, Pathipanawat W, Uttapap D. Changes
in physicochemical properties and morphology of canna starches during rhizomal
development. Carbohydr Polym. 2007;70(2):206–17.
49. Brück H, Jureit C, Hermann M, Schulz A, Sattelmacher B. Effects of water and nitrogen

Bibliography
Page | 91
supply on water use efficiency and carbon isotope discrimination in edible canna (Canna
edulis Ker-Gawler). Plant Biol. 2001;3(4):326–34.
50. Al-snafi AE. BIOACTIVE COMPONENTS AND PHARMACOLOGICAL EFFECTS
OF CANNA INDICA - AN OVERVIEW. 2015;(January 2015):2–7.
51. Ciciarelli M de las M. Life Cycle in Natural Populations. 2011;
52. Keo Intabon MK and KI. Effect of Seed-Rhizome weight on Growth and Yield of Edible
Canna. Chem Pharm Bull [Internet]. 1980;28(1):296–300. Available from:
http://www.mendeley.com/research/geology-volcanic-history-eruptive-style-yakedake-
volcano-group-central-japan/
53. Graven P, De Koster CG, Boon JJ, Bouman F. Functional aspects of mature seed coat of
the cannaceae. Plant Syst Evol. 1997;205(3–4):223–40.
54. Delpino DF. Sugli apparechi della fecondazione nelle piante antocarpe (Fanerogame).
1867;
55. P.F Y. Secondary pollen presentation. 1993.
56. Cocucci EGAA. Pollination biology of Canna indica ( Cannaceae ) with particular
reference to the functional morphology of the style. 2011;49–58.
57. Vogel S. Chiropterophilie in der neotropischen Flora Neue Mitteilungen III 1 ) 1Neue
Mitteilungen, Teil I, vgl. Flora, Abt. B, 157, 562-602 (1968), Teil II, vgl. Flora, Abt. B.
158, 185-222 (1969). Flora oder Allg Bot Zeitung Abt B, Morphol und Geobot [Internet].
1969;158(4–5):289–323. Available from: http://dx.doi.org/10.1016/S0367-
1801(17)30220-X
58. Lu W, Miller WB. Storage of canna rhizomes. Acta Hortic. 2013;970:163–70.
59. Okonwu K, Ariaga CA. Nutritional evaluation of various parts of Canna indica L. Annu
Res Rev Biol. 2016;11(4).
60. Nirmal SA, Kolhe NM, Pal SC, Mandal S. Nonpolar compounds from Canna indica

Bibliography
Page | 92
rhizomes. Facta Univ - Ser Physics, Chem Technol. 2008;6(1):141–4.
61. Zhu F. Composition, structure, physicochemical properties, and modifications of cassava
starch. Carbohydr Polym [Internet]. 2015;122:456–80. Available from:
http://dx.doi.org/10.1016/j.carbpol.2014.10.063
62. Aprianita A, Vasiljevic T, Bannikova A, Kasapis S. Physicochemical properties of flours
and starches derived from traditional Indonesian tubers and roots. J Food Sci Technol.
2014;51(12):3669–79.
63. Hoover R. Composition, molecular structure, and physicochemical properties of tuber
and root starches: A review. Carbohydr Polym. 2001;45(3):253–67.
64. Perez E, Lares M, Perez E, Lares M. Chemical composition, mineral profile, and
functional properties of Canna (Canna edulis) and Arrowroot (Maranta spp.) starches.
Plant Foods Hum Nutr. 2005;60(3):113–6.
65. Hizukuri S. Relationship between the distribution of the chain length of amylopectin and
the crystalline structure of starch granules. Carbohydr Res. 1985;141(2):295–306.
66. ISHII Y, KAWABATA A, NAKAMURA M. Retrogradation Specificities of
Amylopectins Isolated from Tropical Starches Using Differential Scanning Calorimetry
(DSC). J Appl Glycosci. 1994;41(3):297–303.
67. Kenichi Tanaka, Keo Intabon, Kiyoshi Shimabe, Takeo Kawana KI. Studies on Matter
Production of Edible Canna (Canna edulis Ker). Japanese J Crop Sci [Internet].
1993;62:601–8. Available from: http://www.mendeley.com/research/geology-volcanic-
history-eruptive-style-yakedake-volcano-group-central-japan/
68. Indrayan AK, Bhojak NK, Kumar N, Shatru A, Gaur A. Chemical composition and
antimicrobial activity of the essential oil from the rhizome of Canna indica Linn. Indian
J Chem - Sect B Org Med Chem. 2011;50(8):1136–9.
69. Wandee Y, Uttapap D, Puncha-Arnon S, Puttanlek C, Rungsardthong V, Wetprasit N.

Bibliography
Page | 93
Quality assessment of noodles made from blends of rice flour and canna starch. Food
Chem [Internet]. 2015;179:85–93. Available from:
http://dx.doi.org/10.1016/j.foodchem.2015.01.119
70. Juansang J, Puttanlek C, Rungsardthong V, Puncha-Arnon S, Uttapap D. Effect of
gelatinisation on slowly digestible starch and resistant starch of heat-moisture treated
and chemically modified canna starches. Food Chem [Internet]. 2012;131(2):500–7.
Available from: http://dx.doi.org/10.1016/j.foodchem.2011.09.013
71. Zhang J, Wang ZW, Shi XM. Effect of microwave heat/moisture treatment on
physicochemical properties of Canna edulis Ker starch. J Sci Food Agric.
2009;89(4):653–64.
72. Zhang J, Wang ZW. Arabinoxylan from Canna edulis Ker by-product and its enzymatic
activities. Carbohydr Polym [Internet]. 2011;84(1):656–61. Available from:
http://dx.doi.org/10.1016/j.carbpol.2010.12.049
73. Hermann M, Quynh NK, Peters D. Reappraisal of Edible Canna as a High-Value Starch
Crop in Vietnam. Andean Roots and Tubers. 1998;(1998):415–24.
74. Odugbemi OT, Akinsulire RO, Aibinu EI, Fabeku OP. MEDICINAL PLANTS USEFUL
FOR MALARIA THERAPY IN OKEIGBO, ONDO STATE, SOUTHWEST NIGERIA.
Plant Biol. 2011;4(April 2004):no-no.
75. Thepouyporn A, Yoosook C, Chuakul W, Thirapanmethee K, Napaswad C, Wiwat C.
Purification and characterization of anti-HIV-1 protein from Canna indica L. leaves.
Southeast Asian J Trop Med Public Health. 2012;43(5):1153–9.
76. Kirtikar KR, Basu D. Indian Medicinal Plants. 1918;3(2):54–67. Available from:
http://repositorio.unan.edu.ni/2986/1/5624.pdf
77. Kanase V, Vishwakarma S. Treatment of various diseases by canna indica l.-a promising
herb. Asian J Pharm Clin Res. 2018;11(12):51–6.

Bibliography
Page | 94
78. Cui X, Fang S, Yao Y, Li T, Ni Q, Yang X, et al. Potential mechanisms of cadmium
removal from aqueous solution by Canna indica derived biochar. Sci Total Environ
[Internet]. 2016;562:517–25. Available from:
http://dx.doi.org/10.1016/j.scitotenv.2016.03.248
79. Alves AAC. Cassava botany and physiology. Cassava Biol Prod Util. 2009;67–89.
80. Joelson Vieira da Silva; Édison Miglioranza; Ricardo Augusto Dias Kanthack; Eli Carlos
de Oliveira; José Carlos Feltran. Manihot esculenta. Rev Raízes e Amidos Trop.
2014;v.10 p.38-48.
81. Uchechukwu-Agua AD, Caleb OJ, Opara UL. Postharvest Handling and Storage of Fresh
Cassava Root and Products: a Review. Food Bioprocess Technol. 2015;8(4):729–48.
82. Leo L. The Fatty acids associated with cassava starch. Chem Lab Coll city new york.
1932;1739(1926):2527–30.
83. Sánchez T, Salcedo E, Ceballos H, Dufour D, Mafla G, Morante N, et al. Screening of
starch quality traits in cassava (Manihot esculenta Crantz). Starch/Staerke.
2009;61(1):12–9.
84. Defloor I, Dehing I, Delcour JA. Physico-chemical properties of cassava starch. Starch-
Starke. 1986;5(23):58–64.
85. Moorthy SN, Ramanujam T. Variation in Properties of Starch in Cassava Varieties in
Relation to Age of the Crop. Starch ‐ Stärke. 1986;38(2):58–61.
86. Sriroth K, Santisopasri V, Petchalanuwat C, Kurotjanawong K, Piyachomkwan K, Oates
C. Cassava starch granule structure–function properties: influence of time and conditions
at harvest on four cultivars of cassava starch. Carbohydr Polym [Internet].
1999;38(2):161–70. Available from:
http://www.sciencedirect.com/science/article/pii/S0144861798001179
87. Juszczaka L, Fortuna T, Krok F. Non-contact Atomic Force Microscopy of Starch

Bibliography
Page | 95
Research Paper. Microscopy. 2003;55:1–7.
88. Onyenwoke CA, Simonyan KJ. Cassava post-harvest processing and storage in Nigeria:
A review. African J Agric Res. 2014;9(53):3853–63.
89. Montagnac JA, Davis CR, Tanumihardjo SA. Nutritional value of cassava for use as a
staple food and recent advances for improvement. Compr Rev Food Sci Food Saf.
2009;8(3):181–94.
90. Charles AL, Sriroth K, Huang TC. Proximate composition, mineral contents, hydrogen
cyanide and phytic acid of 5 cassava genotypes. Food Chem. 2005;92(4):615–20.
91. Bahekar S, Kale R. PHYTOPHARMACOLOGICAL ASPECTS OF MANIHOT
ESCULENTA CRANTZ ( CASSAVA ) - A REVIEW. 2017;(April):5–7.
92. Shannon JC, Garwood DL, Boyer CD. Genetics and Physiology of Starch Development
[Internet]. Third Edit. Starch. Elsevier Inc.; 2009. 23–82 p. Available from:
http://dx.doi.org/10.1016/B978-0-12-746275-2.00003-3
93. Preiss J. Biochemistry and Molecular Biology of Starch Biosynthesis [Internet]. Third
Edit. Starch. Elsevier Inc.; 2009. 83–148 p. Available from:
http://dx.doi.org/10.1016/B978-0-12-746275-2.00004-5
94. Hechavarría, Rodney; López G. Lectures on the physiology of plants. J Chem Inf Model.
2013;53(9):1689–99.
95. Shujun W, Hongyan L, Wenyuan G, Haixia C, Jiugao Y, Peigen X. Characterization of
new starches separated from different Chinese yam (Dioscorea opposita Thunb.)
cultivars. Food Chem. 2006;99(1):30–7.
96. Peroni FHG, Rocha TS, Franco CML. Some structural and physicochemical
characteristics of tuber and root starches. Food Sci Technol Int. 2006;12(6):505–13.
97. JANE J, SHEN L, CHEN J, LIM S, KASEMSUWAN T, NIP W. Physical and chemical
studies of taro starches and flours. Cereal Chem. 1992;69(5):528–35.

Bibliography
Page | 96
98. Moorthy SN. Physicochemical and Functional Properties of Tropical Tuber Starches: A
Review. Starch - Stärke [Internet]. 2002;54(12):559–592. Available from:
http://onlinelibrary.wiley.com/doi/10.1002/1521-379X(200212)54:12%3C559::AID-
STAR2222559%3E3.0.CO;2-
F/abstract%5Cnhttp://onlinelibrary.wiley.com/store/10.1002/1521-
379X(200212)54:12%3C559::AID-STAR2222559%3E3.0.CO;2-
F/asset/2222559_ftp.pdf?v=1&t=hhiv0ikr&s=04756574
99. Tian SJ, Rickard JE, Blanshard JM V. Physicochemical Properties of Sweet Potato
Starches. Starch ‐ Stärke. 1986;38(10):345–50.
100. Schwall GP, Safford R, Westcott RJ, Jeffcoat R, Tayal A, Shi YC, et al. Production of
very-high-amylose potato starch by inhibition of SBE A and B. Nat Biotechnol.
2000;18(5):551–4.
101. Shi YC, Capitani T, Trzasko P, Jeffcoat R. Molecular structure of a low-amylopectin
starch and other high-amylose maize starches. J Cereal Sci. 1998;27(3):289–99.
102. Sidebottom C, Kirkland M, Strongitharm B, Jeffcoat R. Characterization of the
difference of starch branching enzyme activities in normal and low-amylopectin maize
during kernel development. J Cereal Sci. 1998;27(3):279–87.
103. Case SE, Capitani T, Whaley JK, Shi YC, Trzasko P, Jeffcoat R, et al. Physical properties
and gelation behavior of a low-amylopectin maize starch and other high-amylose maize
starches. J Cereal Sci. 1998;27(3):301–14.
104. Jane J lin. Structural Features of Starch Granules II [Internet]. Third Edit. Starch.
Elsevier Inc.; 2009. 193–236 p. Available from: http://dx.doi.org/10.1016/B978-0-12-
746275-2.00006-9
105. Wang Y-J, White P, Pollak L, Jane J. Amylopectin and Intermediate Materials in Starches
from Mutant Genotypes of the Oh43 Inbred Line. Vol. 70. 1993. p. 521–5.

Bibliography
Page | 97
106. Inouchi N, Glover D V., Takaya T, Fuwa H. Development Changes in Fine Structure of
Starches of Several Endosperm Mutants of Maize. Starch ‐ Stärke. 1983;35(11):371–6.
107. Ikawa Y, Glover D V., Sugimoto Y, Fuwa H. Some Structural Characteristics of Starches
of Maize Having a Specific Genetic Background. Starch ‐ Stärke. 1981;33(1):9–13.
108. Perera C, Lu Z, Sell J, Jane J. Comparison of physicochemical properties and structures
of sugary-2 cornstarch with normal and waxy cultivars. Cereal Chem. 2001;78(3):249–
56.
109. Campbell MR, White PJ, Pollak LM. Dosage effect at the sugary-2 locus on maize starch
structure and function. Cereal Chem. 1994;71(5):464–8.
110. Takeda Y, Preiss J. Structures of B90 (sugary) and W64A (normal) maize starches.
Carbohydr Res. 1993;240(C):265–75.
111. Arai Y, Baba T. Structural characterization of amylopectin and intermediate material in
amylomaize starch granules. Agric Biol Chem. 1984;48(7):1763–75.
112. Takeda C, Takeda Y, Hizukuri S. Structure of the amylopectin fraction of amylomaize.
Carbohydr Res. 1993;246(1):273–81.
113. Pan D, Nelson OE. A Debranching Enzyme Deficiency in Endosperms of the Sugary-1
Mutants of Maize. 1984;324–8.
114. James MG, Robertson DS, Myers AM. Characterization of the maize gene sugary1, a
determinant of starch composition in kernels. Plant Cell. 1995;7(4):417–29.
115. Nakamura Y, Kubo A, Shimamune T, Matsuda T, Harada K, Satoh H. Correlation
between activities of starch debranching enzyme and α-polyglucan structure in
endosperms of sugary-1 mutants of rice. Plant J. 1997;12(1):143–53.
116. Inouchi N, Glover D V., Sugimoto Y, Fuwa H. Developmental Changes in Starch
Properties of Several Endosperm Mutants of Maize. Starch ‐ Stärke. 1984;36(1):8–12.
117. Morrison WR. The stability of wheat starch lipids in untreated and chlorine‐treated cake

Bibliography
Page | 98
flours. J Sci Food Agric. 1978;29(4):365–71.
118. South JB, Morrison WR, Nelson OE. A relationship between the amylose and lipid
contents of starches from various mutants for amylose content in maize. J Cereal Sci.
1991;14(3):267–78.
119. Morrison WR, Law R., Snape C. Evidence for Inclusion Compplexes of lipids with V-
amylose in Maize, Rice and Oat Starches.
120. Morrison WR, Tester RF, Gidley MJ, Karkalas J. Resistance to acid hydrolysis of lipid-
complexed amylose and lipid-free amylose in lintnerised waxy and non-waxy barley
starches. Carbohydr Res. 1993;245(2):289–302.
121. Tester RF, Karkalas J, Qi X. Starch - Composition, fine structure and architecture. J
Cereal Sci. 2004;39(2):151–65.
122. Moorthy SN. Physicochemical and functional properties of tropical tuber starches: A
review. Starch/Staerke. 2002;54(12):559–92.
123. Jay-lin J, Tunyawat K, Sharon L, Ames I, Henry Z, Darien I, et al. Anthology of starch
granule morphology by scanning electron microscopy. Starch-Stärke. 1994;46(5):121.
124. Gallant DJ, Bouchet B, Buleon A, Perez S. Physical characteristics of starch granules
and susceptibility to enzymatic degradation. Eur J Clin Nutr. 1992;46(SUPPL. 2).
125. Zobel HF. Molecules to Granules: A Comprehensive Starch Review. Starch - Stärke
[Internet]. 1988;40(2):44–50. Available from:
http://onlinelibrary.wiley.com/doi/10.1002/star.19880400203/abstract%5Cnhttp://onlin
elibrary.wiley.com/store/10.1002/star.19880400203/asset/19880400203_ftp.pdf?v=1&t
=hd9apk7q&s=4ec11407da97d9e1ee5dfe5adcdd1428cdd5a7f8
126. Oostergetel GT, van Bruggen EFJ. The crystalline domains in potato starch granules are
arranged in a helical fashion. Carbohydr Polym. 1993;21(1):7–12.
127. Hizukuri S, Takeda Y, Maruta N, Juliano BO. Molecular structures of rice starch.

Bibliography
Page | 99
Carbohydr Res. 1989;189(C):227–35.
128. Burki TK. Starch As simple as A, B, C? Lancet Gastroenterol Hepatol. 2018;3(2):82.
129. Hoover R. Compositions, molecular structure, and physiochemical properties of tuber
and root starches:A review. Carbohydr Polym. 2001;45:253–67.
130. Kohyama K, Nishinari K. Effect of soluble sugars on gelatinization and retrogradation
of sweet potato starch. J Agric Food Chem. 1991;39:1406–10.
131. Nikuni Z. Studies on Starch Granules. Starch ‐ Stärke. 1978;30(4):105–11.
132. Manners DJ, Matheson NK. The fine structure of amylopectin. Carbohydr Res.
1981;90(1):99–110.
133. Gallant DJ, Bouchet B, Baldwin PM. Microscopy of starch: evidence of a new level of
granule organization. Carbohydr Polym. 1997;32(3–4):177–91.
134. Hrzukuri S. Polymodal distribution of the chain lengths of amylopectins, and its
significance. Carbohydr Res. 1986;147:342–7.
135. B.Rockland; L, Stewart; GF. Water Activity: Influences on Food Quality. 1981. 489–510
p.
136. Pfannemüller B. Influence of chain length of short monodisperse amyloses on the
formation of A- and B-type X-ray diffraction patterns. Int J Biol Macromol.
1987;9(2):105–8.
137. Eliasson A. Gelatinization and retrogradation of starch in foods and its implications
[Internet]. Chemical deterioration and physical instability of food and beverages.
Woodhead Publishing Limited; 2010. 296–323 p. Available from:
http://dx.doi.org/10.1533/9781845699260.2.296
138. Jane J, Chen YY, Lee LF, McPherson AE, Wong KS, Radosavljevic M, et al. Effects of
amylopectin branch chain length and amylose content on the gelatinization and pasting
properties of starch. Cereal Chem. 1999;76(5):629–37.

Bibliography
Page | 100
139. Schirmer M, Jekle M, Becker T. Starch gelatinization and its complexity for analysis.
Starch/Staerke. 2015;67(1–2):30–41.
140. Gudmundsson M. Retrogradation of starch and the role of its components. Thermochim
Acta. 1994;246(2):329–41.
141. Jacobson MR, Obanni M, Bemiller JN. Retrogradation of starches from different
botanical sources. Cereal Chem. 1997;74(5):511–8.
142. Wang SSSSS, Li C, Copeland L, Niu Q, Wang SSSSS. Starch Retrogradation: A
Comprehensive Review. Compr Rev Food Sci Food Saf [Internet]. 2015;14(5):568–85.
Available from: http://dx.doi.org/10.1111/1541-4337.12143
143. Baldwin PM. Starch granule-associated proteins and polypeptides: A review.
Starch/Staerke. 2001;53(10):475–503.
144. Bao JS, Cai YZ, Corke H. Prediction of rice starch quality parameters by near-infrared
reflectance spectroscopy. J Food Sci. 2001;66(7):936–9.
145. Grant LA, Vignaux N, Doehlert DC, McMullen MS, Elias EM, Kianian S. Starch
characteristics of waxy and nonwaxy tetraploid (Triticum turgidum l. var. durum)
wheats. Cereal Chem. 2001;78(5):590–5.
146. Tester RF, Limited G. Swelling and gelatinization of cereal starches . I . Effects of
amylopectin , amylose and lipids Swelling and Gelatinization of Cereal Starches . I .
Effects of Amylopectin , Amylose , and Lipids ’. Cereal Chem. 2016;(June).
147. Sasaki T, Matsuki J. Effect of wheat starch structure on swelling power. Cereal Chem.
1998;75(4):525–9.
148. Srichuwong S, Sunarti TC, Mishima T, Isono N, Hisamatsu M. Starches from different
botanical sources II: Contribution of starch structure to swelling and pasting properties.
Carbohydr Polym. 2005;62(1):25–34.
149. Tester RF, Karkalas J. Swelling and gelatinization of oat starches. Cereal Chem.

Bibliography
Page | 101
1996;73(2):271–7.
150. Singh N, Singh J, Kaur L, Sodhi NS, Gill BS. Morphological, thermal and rheological
properties of starches from different botanical sources. Food Chem. 2003;81(2):219–31.
151. Mahfuzur Rahman SM, Rakshit SK. Effect of endogenous and commercial enzyme on
improving extraction of sweet potato starch. ASAE Annu Int Meet 2004.
2004;0300(04):8007–19.
152. Schulman AH, Kammiovirta K. Purification of Barley Starch by Protein Extraction.
Starch ‐ Stärke. 1991;43(10):387–9.
153. Sriroth K, Chollakup R, Chotineeranat S, Piyachomkwan K, Oates CG. Processing of
cassava waste for improved biomass utilization. Bioresour Technol. 2000;71(1):63–9.
154. Sit N, Deka SC, Misra S. Optimization of starch isolation from taro using combination
of enzymes and comparison of properties of starches isolated by enzymatic and
conventional methods. J Food Sci Technol. 2014;52(7):4324–32.
155. Japheth KA, John B. Physicochemical properties of starches extracted from local cassava
varieties with the aid of crude pectolytic enzymes from Saccharomyces cerevisiae
(ATCC 52712). African J Food Sci. 2018;12(7):151–64.
156. Hameed M, Malik SR, Farhan Iqbal M, Mehmood M. Extraction of Starch From Potato
By Enzymatic Process. SciInt(Lahore). 2015;27(6):6049–52.
157. Zhu J, Li L, Chen L, Li X. Study on supramolecular structural changes of ultrasonic
treated potato starch granules. Food Hydrocoll [Internet]. 2012;29(1):116–22. Available
from: http://dx.doi.org/10.1016/j.foodhyd.2012.02.004
158. Pérez-Jiménez J, Neveu V, Vos F, Scalbert A. Identification of the 100 richest dietary
sources of polyphenols: An application of the Phenol-Explorer database. Eur J Clin Nutr.
2010;64:S112–20.
159. Gupta A, Kagliwal LD, Singhal RS. Biotransformation of Polyphenols for Improved

Bibliography
Page | 102
Bioavailability and Processing Stability [Internet]. 1st ed. Vol. 69, Advances in Food and
Nutrition Research. Copyright © 2013 Elsevier Inc. All rights reserved.; 2013.
183–217 p. Available from: http://dx.doi.org/10.1016/B978-0-12-410540-9.00004-1
160. Manach C, Williamson G, Morand C, Scalbert A, Rémésy C. Bioavailability and
bioefficacy of polyphenols in humans. I. Review of 97 bioavailability studies. Am J Clin
Nutr. 2005;81(1 Suppl):230–42.
161. Fraga CG, Croft KD, Kennedy DO, Tomás-Barberán FA. The effects of polyphenols and
other bioactives on human health. Food Funct. 2019;10(2):514–28.
162. Vermerris W, Nicholson R. Phenolic compound biochemistry. Phenolic Compound
Biochemistry. 2006. 1–276 p.
163. Quideau S, Deffieux D, Douat-Casassus C, Pouységu L. Plant polyphenols: Chemical
properties, biological activities, and synthesis. Angew Chemie - Int Ed. 2011;50(3):586–
621.
164. Giada M de LR. Food Phenolic Compounds: Main Classes, Sources and Their
Antioxidant Power. Oxidative Stress Chronic Degener Dis - A Role Antioxidants.
2013;87–112.
165. Weichselbaum E, Buttriss JL. Polyphenols in the diet. Nutr Bull. 2010;35(2):157–64.
166. Tsao R. Chemistry and biochemistry of dietary polyphenols. Nutrients.
2010;2(12):1231–46.
167. Neveu V, Perez-Jiménez J, Vos F, Crespy V, du Chaffaut L, Mennen L, et al. Phenol-
Explorer: an online comprehensive database on polyphenol contents in foods. Database
(Oxford). 2010;2010:1–9.
168. Scalbert A, Williamson G. Dietary Intake and Bioavailability of Polyphenols. J Med
Food. 2000;3(2):121–5.
169. Başkan KS, Tütem E, Akyüz E, Apak R. Assessment of the contributions of anthocyanins

Bibliography
Page | 103
to the total antioxidant capacities of plant foods. Eur Food Res Technol.
2015;241(4):529–41.
170. Fatih B, Madani K, Chibane M, Duez P. Chemical Composition and Biological Activities
of Mentha Species. Aromat Med Plants - Back to Nat. 2017;67291.
171. D’Archivio M, Filesi C, Di Benedetto R, Gargiulo R, Giovannini C, Masella R.
Polyphenols, dietary sources and bioavailability. Ann Ist Super Sanita. 2007;43(4):348–
61.
172. Shahidi F, Ambigaipalan P. Phenolics and polyphenolics in foods, beverages and spices:
Antioxidant activity and health effects - A review. J Funct Foods [Internet]. 2015;18:820–
97. Available from: http://dx.doi.org/10.1016/j.jff.2015.06.018
173. Wallace C T, Giusti M M. Anthocyanins. Am Soc Nutr. 2015;(8):620–2.
174. Pereira DM, Valentão P, Pereira JA, Andrade PB. Phenolics: From chemistry to biology.
Molecules. 2009;14(6):2202–11.
175. Yildirim AB, Guner B, Karakas FP, Turker AU. Evaluation of Antibacterial, Antitumor,
Antioxidant Activities and Phenolic Constituents of Field-Grown and in Vitro-Grown
Lysimachia Vulgaris L. African J Tradit Complement Altern Med AJTCAM.
2017;14(2):177–87.
176. Eghbaliferiz S, Iranshahi M. Prooxidant Activity of Polyphenols, Flavonoids,
Anthocyanins and Carotenoids: Updated Review of Mechanisms and Catalyzing Metals.
Phyther Res. 2016;1391(May):1379–91.
177. Singh M, Kaur M, Silakari O. Flavones: An important scaffold for medicinal chemistry.
Eur J Med Chem [Internet]. 2014;84:206–39. Available from:
http://dx.doi.org/10.1016/j.ejmech.2014.07.013
178. Adam I. Y S, Ahmed A. A W, Esra OM, Nazik EY, Eiman FA, Shaimaa AA, et al.
Antimicrobial activity of Manihot esculanta root methanolic and aqueous extracts.

Bibliography
Page | 104
2018;1(May):390–401.
179. Menghani E, Dwivedi SC, Dubey R, Tyagi R, Masand M, Advani U. Medicinal
Bioactives as Antimicrobial Agents: An Overview. 2011;11(2):10–4.
180. Buschmann H, Rodriguez MX, Tohme J, Beeching JR. Accumulation of
hydroxycoumarins during post-harvest deterioration of tuberous roots of Cassava
(Manihot esculenta Crantz). Ann Bot. 2000;86(6):1153–60.
181. Cheeke PR, Piacente S, Oleszek W. Anti-inflammatory and anti-arthritic effects of yucca
schidigera: A review. J Inflamm. 2006;3:2–8.
182. Oleszek W, Sitek M, Stochmal A, Piacente S, Pizza C, Cheeke P. Resveratrol and other
phenolics from the bark of Yucca schidigera Roezl. J Agric Food Chem. 2001;49(2):747–
52.
183. Piacente S, Montoro P, Oleszek W, Pizza C. Yucca schidigera bark: Phenolic constituents
and antioxidant activity. J Nat Prod. 2004;67(5):882–5.
184. Barthet J V. POLYPHENOL OXIDASES FROM CASSAVA (MANIHOT ESCULENTA
C.) ROOT: EXTRACTION, PURIFICATION AND CHARACTERIZATION.
1998;274.
185. Adegunwa MO, Alamu EO. Effect of processing on the nutritional contents of yam and
cocoyam tubers. 2018;(January 2011).
186. Olajide R, Akinsoyinu AO, Babayemi OJ, Omojola AB, Abu AO, Afolabi KD. Effect of
Processing on Energy Values, Nutrient and Anti-nutrient components of Wild Cocoyam
[Colocasia esculenta (L.) Schott] Corm. 2011. p. 29–34.
187. Ferreres F, Gonçalves RF, Gil-Izquierdo A, Valentão P, Silva AMS, Silva JB, et al.
Further knowledge on the phenolic profile of Colocasia esculenta (L.) Shott. J Agric
Food Chem. 2012;60(28):7005–15.
188. Goncalves RF, Silva AMS, Silva AM, Valentao P, Ferreres F, Gil-Izquierdo A, et al.

Bibliography
Page | 105
Influence of taro (Colocasia esculenta L. Shott) growth conditions on the phenolic
composition and biological properties. Food Chem. 2013;141(4):3480–5.
189. Simsek S, El SN. In vitro starch digestibility, estimated glycemic index and antioxidant
potential of taro (Colocasia esculenta L. Schott) corm. Food Chem [Internet].
2015;168:257–61. Available from: http://dx.doi.org/10.1016/j.foodchem.2014.07.052
190. Awa E, Eleazu C. Bioactive constituents and antioxidant activities of raw and processed
cocoyam (Colocasia esculenta). Nutrafoods. 2015;14(3):133–40.
191. Terasawa N, Saotome A, Tachimura Y, Mochizuki A, Ono H, Takenaka M, et al.
Identification and some properties of anthocyanin isolated from zuiki, stalk of Colocasia
esculenta. J Agric Food Chem. 2007;55(10):4154–9.
192. Ötles S. Handbook of Food Analysis Instruments [Internet]. Vol. 3. 2015. 54–67 p.
Available from: http://repositorio.unan.edu.ni/2986/1/5624.pdf
193. Vinatoru M. An overview of the ultrasonically assisted extraction of bioactive principles
from herbs. Ultrason Sonochem. 2001;8(3):303–13.
194. Tiwari BK. Ultrasound: A clean, green extraction technology. TrAC - Trends Anal Chem
[Internet]. 2015;71:100–9. Available from: http://dx.doi.org/10.1016/j.trac.2015.04.013
195. Reiner Ž, Catapano AL, De Backer G, Graham I, Taskinen MR, Wiklund O, et al.
ESC/EAS Guidelines for the management of dyslipidaemias. Eur Heart J.
2011;32(14):1769–818.
196. Gami AS, Witt BJ, Howard DE, Erwin PJ, Gami LA, Somers VK, et al. Metabolic
Syndrome and Risk of Incident Cardiovascular Events and Death. A Systematic Review
and Meta-Analysis of Longitudinal Studies. J Am Coll Cardiol. 2007;49(4):403–14.
197. Hanley AJG, Karter AJ, Williams K, Festa A, D’Agostino RB, Wagenknecht LE, et al.
Prediction of type 2 diabetes mellitus with alternative definitions of the metabolic
syndrome: The Insulin Resistance Atherosclerosis Study. Circulation.

Bibliography
Page | 106
2005;112(24):3713–21.
198. Upadhyay S, Dixit M. Role of polyphenols and other phytochemicals on molecular
signaling. Oxid Med Cell Longev. 2015;2015.
199. Yang CS, Zhang J, Zhang L, Huang J, Wang Y. Mechanisms of body weight reduction
and metabolic syndrome alleviation by tea. Mol Nutr Food Res. 2016;60(1):160–74.
200. Alves JL d. B, de Sousa VP, Neto MPC, Magnani M, Braga V de A, da Costa-Silva JH,
et al. New insights on the use of dietary polyphenols or probiotics for the management
of arterial hypertension. Front Physiol. 2016;7(OCT).
201. Gothai S, Ganesan P, Park SY, Fakurazi S, Choi DK, Arulselvan P. Natural phyto-
bioactive compounds for the treatment of type 2 diabetes: Inflammation as a target.
Nutrients. 2016;8(8).
202. Murillo AG, Fernandez ML. The Relevance of Dietary Polyphenols in Cardiovascular
Protection. Curr Pharm Des. 2017;23(17).
203. Kim K, Kim K, Park SM. Association between the prevalence of metabolic syndrome
and the level of coffee consumption among korean women. PLoS One. 2016;11(12):1–
15.
204. Takami H, Nakamoto M, Uemura H, Katsuura S, Yamaguchi M, Hiyoshi M, et al. Inverse
correlation between coffee consumption and prevalence of metabolic syndrome:
Baseline survey of the japan multi-institutional collaborative cohort (J-MICC) study in
Tokushima, Japan. J Epidemiol. 2013;23(1):12–20.
205. Nordestgaard AT, Thomsen M, Nordestgaard BG. Coffee intake and risk of obesity,
metabolic syndrome and type 2 diabetes: A Mendelian randomization study. Int J
Epidemiol. 2015;44(2):551–65.
206. Suliga E, Kozieł D, Cieśla E, Rębak D, Głuszek S. Coffee consumption and the
occurrence and intensity of metabolic syndrome: a cross-sectional study. Int J Food Sci

Bibliography
Page | 107
Nutr [Internet]. 2017;68(4):507–13. Available from:
http://dx.doi.org/10.1080/09637486.2016.1256381
207. Chang CS, Chang YF, Liu PY, Chen CY, Tsai YS, Wu CH. Smoking, habitual tea
drinking and metabolic syndrome in elderly men living in rural community: The Tianliao
old people (TOP) study 02. PLoS One. 2012;7(6):1–8.
208. Tresserra-Rimbau A, Medina-Remón A, Lamuela-Raventós RM, Bulló M, Salas-
Salvadó J, Corella D, et al. Moderate red wine consumption is associated with a lower
prevalence of the metabolic syndrome in the PREDIMED population. Br J Nutr.
2015;113(S2):S121–30.
209. Sit N, Misra S, Deka SC. Yield and Functional Properties of Taro Starch as Affected by
Ultrasound. Food Bioprocess Technol. 2014;7(7):1950–8.
210. Maran JP, Manikandan S, Priya B, Gurumoorthi P. Box-Behnken design based multi-
response analysis and optimization of supercritical carbon dioxide extraction of bioactive
flavonoid compounds from tea (Camellia sinensis L.) leaves. J Food Sci Technol.
2015;52(1):92–104.
211. Bezerra MA, Santelli RE, Oliveira EP, Villar LS, Escaleira LA. Response surface
methodology (RSM) as a tool for optimization in analytical chemistry. Talanta.
2008;76(5):965–77.
212. Prakash Maran J, Manikandan S, Thirugnanasambandham K, Vigna Nivetha C, Dinesh
R, Maran JP, et al. Box-Behnken design based statistical modeling for ultrasound-
assisted extraction of corn silk polysaccharide. Carbohydr Polym [Internet].
2013;92(1):604–11. Available from: http://dx.doi.org/10.1016/j.carbpol.2012.09.020
213. Septembre-Malaterre A, Stanislas G, Douraguia E, Gonthier MP. Evaluation of
nutritional and antioxidant properties of the tropical fruits banana, litchi, mango, papaya,
passion fruit and pineapple cultivated in R??union French Island. Food Chem [Internet].

Bibliography
Page | 108
2016;212(May):225–33. Available from:
http://dx.doi.org/10.1016/j.foodchem.2016.05.147
214. AOAC. AOAC Official Methods of Analysis. Assoc Off Anal Chem Washington, DC.
1990;15th(Volume 2).
215. Holm J, Björck I, Drews a., Asp N-G. A Rapid Method for the Analysis of Starch. Starch
- Stärke [Internet]. 1986;38(7):224–6. Available from:
http://doi.wiley.com/10.1002/star.19860380704
216. Qi Y, Du F, Jiang Z, Qiu B, Guan Q, Liu J, et al. Optimization of starch isolation from
red sorghum using response surface methodology. LWT - Food Sci Technol [Internet].
2018;91(September 2017):242–8. Available from:
https://doi.org/10.1016/j.lwt.2018.01.014
217. Yu S, Ma Y, Menager L, Sun DW. Physicochemical Properties of Starch and Flour from
Different Rice Cultivars. Food Bioprocess Technol. 2012;5(2):626–37.
218. Sujka M, Jamroz J. Ultrasound-treated starch: SEM and TEM imaging, and functional
behaviour. Food Hydrocoll [Internet]. 2013;31(2):413–9. Available from:
http://dx.doi.org/10.1016/j.foodhyd.2012.11.027
219. Folin O, Boston M. Phenols. 1912;
220. Hatia S, Septembre-Malaterre A, Le Sage F, Badiou-Bénéteau A, Baret P, Payet B, et al.
Evaluation of antioxidant properties of major dietary polyphenols and their protective
effect on 3T3-L1 preadipocytes and red blood cells exposed to oxidative stress. Free
Radic Res. 2014;48(4):387–401.
221. Benmoussa M, Hamaker BR. Rapid small-scale starch isolation using a combination of
ultrasonic sonication and sucrose density separation. Starch/Staerke. 2011;63(6):333–9.
222. Park SH, Bean SR, Wilson JD, Schober TJ. Rapid isolation of sorghum and other cereal
starches using sonication. Cereal Chem. 2006;83(6):611–6.

Bibliography
Page | 109
223. Wang L, Wang YJ. Rice starch isolation by neutral protease and high-intensity
ultrasound. J Cereal Sci. 2004;39(2):291–6.
224. Jambrak AR, Herceg Z, Subaric D, Babic J, Brncic M, Brncic SR, et al. Ultrasound effect
on physical properties of corn starch. Carbohydr Polym. 2010;79(1):91–100.
225. Maran JP, Priya B, Manikandan S. Modeling and optimization of supercritical fluid
extraction of anthocyanin and phenolic compounds from Syzygium cumini fruit pulp. J
Food Sci Technol. 2014;51(9):1938–46.
226. Guo Z, Zhao B, Li H, Miao S, Zheng B. Optimization of ultrasound-microwave
synergistic extraction of prebiotic oligosaccharides from sweet potatoes (Ipomoea
batatas L.). Innov Food Sci Emerg Technol [Internet]. 2019;54(December 2018):51–63.
Available from: https://doi.org/10.1016/j.ifset.2019.03.009
227. Prakash Maran J, Manikandan S. Response surface modeling and optimization of process
parameters for aqueous extraction of pigments from prickly pear (Opuntia ficus-indica)
fruit. Dye Pigment [Internet]. 2012;95(3):465–72. Available from:
http://dx.doi.org/10.1016/j.dyepig.2012.06.007
228. Maran JP, Priya B. Ultrasound-assisted extraction of pectin from sisal waste. Carbohydr
Polym [Internet]. 2015;115:732–8. Available from:
http://dx.doi.org/10.1016/j.carbpol.2014.07.058
229. Toma M, Vinatoru M, Paniwnyk L, Mason TJ. Investigation of the effects of ultrasound
on vegetal tissues during solvent extraction. Ultrason Sonochem. 2001;8(2):137–42.
230. Wang XS, Wu YF, Dai SL, Chen R, Shao Y. Ultrasound-assisted extraction of geniposide
from Gardenia jasminoides. Ultrason Sonochem [Internet]. 2012;19(6):1155–9.
Available from: http://dx.doi.org/10.1016/j.ultsonch.2012.03.012
231. Vilkhu K, Mawson R, Simons L, Bates D. Applications and opportunities for ultrasound
assisted extraction in the food industry - A review. Innov Food Sci Emerg Technol.

Bibliography
Page | 110
2008;9(2):161–9.
232. Sun RC, Tomkinson J. Comparative study of lignins isolated by alkali and ultrasound-
assisted alkali extractions from wheat straw. Ultrason Sonochem. 2002;9(2):85–93.
233. Chen F, Sun Y, Zhao G, Liao X, Hu X, Wu J, et al. Optimization of ultrasound-assisted
extraction of anthocyanins in red raspberries and identification of anthocyanins in extract
using high-performance liquid chromatography-mass spectrometry. Ultrason Sonochem.
2007;14(6):767–78.
234. Khan MK, Abert-Vian M, Fabiano-Tixier AS, Dangles O, Chemat F. Ultrasound-assisted
extraction of polyphenols (flavanone glycosides) from orange (Citrus sinensis L.) peel.
Food Chem [Internet]. 2010;119(2):851–8. Available from:
http://dx.doi.org/10.1016/j.foodchem.2009.08.046
235. Chemat F, Rombaut N, Sicaire A, Meullemiestre A, Abert-vian M. Ultrasonics
Sonochemistry Ultrasound assisted extraction of food and natural products . Mechanisms
, techniques , combinations , protocols and applications . A review. Ultrason -
Sonochemistry [Internet]. 2017;34:540–60. Available from:
http://dx.doi.org/10.1016/j.ultsonch.2016.06.035
236. Esclapez MD, Mulet A, Ca JA. Ultrasound-Assisted Extraction of Natural Products.
2011;108–20.
237. Ginsburg E, Kinsley MD, Quitral A. The power of ultrasound. Adm Radiol J.
1998;17(5):17–20.
238. Qiang H, Lin L, Xiong F. Ultrasound effects on the structure and chemical reactivity of
cornstarch granules. Starch/Staerke. 2007;59(8):371–8.
239. Zhang ZS, Wang LJ, Li D, Jiao SS, Chen XD, Mao ZH. Ultrasound-assisted extraction
of oil from flaxseed. Sep Purif Technol. 2008;62(1):192–8.
240. Halbrook, W. U., & Kurtzman Jr RH. Water uptake of bean and other starches at high

Bibliography
Page | 111
temperatures and pressures. Vol. 52, Cereal Chemistry. 1975. p. 156–61.
241. Ekanayake S, Nair BM, Asp NG, Jansz ER. Effect of processing of sword beans
(canavalia gladiata) on physicochemical properties of starch. Starch/Staerke.
2006;58(5):215–22.
242. Verma R, Jan S, Rani S, Jan K, Swer TL, Prakash KS, et al. Physicochemical and
functional properties of gamma irradiated buckwheat and potato starch. Radiat Phys
Chem [Internet]. 2018;144(July 2017):37–42. Available from:
https://doi.org/10.1016/j.radphyschem.2017.11.009
243. Wu Y, Du X, Ge H, Lv Z. Preparation of microporous starch by glucoamylase and
ultrasound. Starch/Staerke. 2011;63(4):217–25.
244. Majzoobi M, Hedayati S, Farahnaky A. Functional properties of microporous wheat
starch produced by α-amylase and sonication. Food Biosci [Internet]. 2015;11:79–84.
Available from: http://dx.doi.org/10.1016/j.fbio.2015.05.001
245. Tester RF, Morrison WR. Swelling and gelatinization of cereal starches. II. Waxy rice
starches. Cereal Chem. 1990;67(6):558–63.
246. Puncha-arnon S, Pathipanawat W, Puttanlek C, Rungsardthong V, Uttapap D. Effects of
relative granule size and gelatinization temperature on paste and gel properties of starch
blends. Food Res Int. 2008;41(5):552–61.
247. Rostagno MA, Palma M, Barroso CG. Ultrasound-assisted extraction of soy isoflavones.
J Chromatogr A. 2003;1012(2):119–28.
248. Sandhu KS, Singh N. Some properties of corn starches II: Physicochemical,
gelatinization, retrogradation, pasting and gel textural properties. Food Chem.
2007;101(4):1499–507.
249. Rössle C, Wijngaard HH, Gormley RT, Butler F, Brunton N. Effect of storage on the
content of polyphenols of minimally processed skin-on apple wedges from ten cultivars

Bibliography
Page | 112
and two growing seasons. J Agric Food Chem. 2010;58(3):1609–14.
250. Ding CK, Chachin K, Ueda Y, Imahori Y. Purification and Properties of Polyphenol
Oxidase from Loquat Fruit. J Agric Food Chem. 1998;46(10):4144–9.
251. González-lemus LB, Calderón-domínguez G, De M, Salgado-cruz P, Díaz-ramírez M,
Ramírez-miranda M, et al. Ultrasound-assisted extraction of starch from frozen jicama (
P . erosus ) roots : Effect on yield , structural characteristics and thermal properties.
2018;6337.
252. Xin Y, Zhang M, Adhikari B. The effects of ultrasound-assisted freezing on the freezing
time and quality of broccoli (Brassicaoleracea L. var. botrytis L.) during immersion
freezing. Int J Refrig [Internet]. 2014;41:82–91. Available from:
http://dx.doi.org/10.1016/j.ijrefrig.2013.12.016
253. Brusotti G, Ngueyem TA, Biesuz R, Caccialanza G. Optimum extraction process of
polyphenols from Bridelia grandis stem bark using experimental design. J Sep Sci.
2010;33(11):1692–7.
254. Vinatoru M. An overview of the ultrasonically assisted extraction of bioactive principles
from herbs An overview of the ultrasonically assisted extraction of bioactive principles
from herbs. 2018;4177(December).
255. Baião D, Defreitas C, Gomes L, Silva D, Correa ACNTF, Pereira P, et al. Polyphenols
from root, Tubercles and grains cropped in brazil: Chemical and nutritional
characterization and their effects on human health and diseases. Nutrients. 2017;9(9).
256. Gogbeu SJ, Dogbo DO, Gonnety JT, Zue N, Zohouri GP, Boka A. Study of some
characteristics of soluble polyphenol oxidases from six cultivars callus of cassava (
Manihot esculenta Crantz ). 2011;9(3):1169–79.
257. Dzah CS, Duan Y, Zhang H, Wen C, Zhang J, Chen G, et al. The effects of ultrasound
assisted extraction on yield, antioxidant, anticancer and antimicrobial activity of

Bibliography
Page | 113
polyphenol extracts: A review. Food Biosci [Internet]. 2020;35(June 2019):100547.
Available from: https://doi.org/10.1016/j.fbio.2020.100547
258. Roy MK, Koide M, Rao TP, Okubo T, Ogasawara Y, Juneja LR. ORAC and DPPH assay
comparison to assess antioxidant capacity of tea infusions: Relationship between total
polyphenol and individual catechin content. Int J Food Sci Nutr. 2010;61(2):109–24.
259. Soria AC, Villamiel M. Effect of ultrasound on the technological properties and
bioactivity of food: A review. Trends Food Sci Technol [Internet]. 2010;21(7):323–31.
Available from: http://dx.doi.org/10.1016/j.tifs.2010.04.003
260. Chemat F, Grondin I, Sing ASC, Smadja J. Deterioration of edible oils during food
processing by ultrasound q. 2004;11(December 2001):13–5.
261. Rice-Evans CA, Miller NJ, Paganga G. Antioxidant properties of phenolic compounds.
Trends Plant Sci. 1997;2(4):152–9.
262. Adjé F, Lozano YF, Lozano P, Adima A, Chemat F, Gaydou EM. Optimization of
anthocyanin, flavonol and phenolic acid extractions from Delonix regia tree flowers
using ultrasound-assisted water extraction. Ind Crops Prod. 2010;32(3):439–44.
263. Moharram HA, Youssef MM. Methods for Determining the Antioxidant Activity : A
Review = Méthodes d'estimation de l'activité antioxydante: une revue de référence
. Alexandria J Food Sci Technol. 2014;11(1):31–41.
264. Chen C, Wang L, Wang R, Luo X, Li Y, Li J, et al. Ultrasound-assisted extraction from
defatted oat (Avena sativa L.) bran to simultaneously enhance phenolic compounds and
β-glucan contents: Compositional and kinetic studies. J Food Eng [Internet].
2018;222:1–10. Available from: https://doi.org/10.1016/j.jfoodeng.2017.11.002

Pôle Recherche Ecoles doctorales
LETTRE D’ENGAGEMENT DE NON-PLAGIAT
Je, soussigné(e) en ma qualité de doctorant(e) de
l’Université de La Réunion, déclare être conscient(e) que le plagiat est un acte délictueux
passible de sanctions disciplinaires. Aussi, dans le respect de la propriété intellectuelle et du
droit d’auteur, je m’engage à systématiquement citer mes sources, quelle qu’en soit la forme
(textes, images, audiovisuel, internet), dans le cadre de la rédaction de ma thèse et de toute
autre production scientifique, sachant que l’établissement est susceptible de soumettre le texte
de ma thèse à un logiciel anti-plagiat.
Fait à Saint-Denis le
Signature :
Extrait du Règlement intérieur de l'Université de La Réunion (validé par le Conseil d’Administration en date du 11 décembre 2014)
Article 9. Protection de la propriété intellectuelle – Faux et usage de faux, contrefaçon, plagiat
L’utilisation des ressources informatiques de l’Université implique le respect de ses droits de propriété intellectuelle ainsi que ceux de ses partenaires et plus généralement, de tous tiers titulaires de tes droits. En conséquence, chaque utilisateur doit : - utiliser les logiciels dans les conditions de licences souscrites ; - ne pas reproduire, copier, diffuser, modifier ou utiliser des logiciels, bases de données, pages Web, textes, images, photographies ou autres créations protégées par le droit d’auteur ou un droit privatif, sans avoir obtenu préalablement l’autorisation des titulaires de ces droits.
La contrefaçon et le faux Conformément aux dispositions du code de la propriété intellectuelle, toute représentation ou reproduction intégrale ou partielle d’une œuvre de l’esprit faite ans le consentement de son auteur est illicite et constitue un délit pénal. L’article 444-1 du code pénal dispose : « Constitue un faux toute altération frauduleuse de la vérité, de nature à cause un préjudice et accomplie par quelque moyen que ce soit, dans un écrit ou tout autre support d’expression de la pensée qui a pour objet ou qui peut avoir pour effet d’établir la preuve d’un droit ou d’un fait ayant des conséquences juridiques ». L’article L335_3 du code de la propriété intellectuelle précise que : « Est également un délit de contrefaçon toute reproduction, représentation ou diffusion, par quelque moyen que ce soit, d’une œuvre de l’esprit en violation des droits de l’auteur, tels qu’ils sont définis et réglementés par la loi. Est également un délit de contrefaçon la violation de l’un des droits de l’auteur d’un logiciel (…) ».
Le plagiat est constitué par la copie, totale ou partielle d’un travail réalisé par autrui, lorsque la source empruntée n’est pas citée, quel que soit le moyen utilisé. Le plagiat constitue une violation du droit d’auteur (au sens des articles L 335-2 et L 335-3 du code de la propriété intellectuelle). Il peut être assimilé à un délit de contrefaçon. C’est aussi une faute disciplinaire, susceptible d’entraîner une sanction. Les sources et les références utilisées dans le cadre des travaux (préparations, devoirs, mémoires, thèses, rapports de stage…) doivent être clairement citées. Des citations intégrales peuvent figurer dans les documents rendus, si elles sont assorties de leur référence (nom d’auteur, publication, date, éditeur…) et identifiées comme telles par des guillemets ou des italiques.
Les délits de contrefaçon, de plagiat et d’usage de faux peuvent donner lieu à une sanction disciplinaire indépendante de la mise en œuvre de poursuites pénales.
: