developing a geographic information oregon coast
TRANSCRIPT

DEVELOPING A GEOGRAPHIC INFORMATION
SYSTEM COUNTY TEMPLATE TO SUPPORT TSUNAMI
EVACUATION ROUTE PLANNING ON THE
OREGON COAST
In partial fulfillment of theMaster of Science-Geography Degree
Department of GeosciencesOregon State University
Corvallis, Oregon
Kyle R. Gomez
April 2001

ACKNOWLEDGEMENTS
I would like to thank the entire Oregon State University Geography Program inthe Department of Geosciences for giving me the opportunity to expand my experiencesand education at OSU. Specifically, I would like to thank Dr. Charles Rosenfeld forgiving me the latitude to explore my interests and giving me direction when needed. Dr.John Marra has been an invaluable asset to my education at OSU. I appreciate John forhiring me as an intern and reviewing my work with close attention to detail. Thanks toGreg Gaston for always setting aside time to provide advice and comments on theproject. I would like to thank to my fellow graduate students who have made the OregonState experience great and especially to Nate Wood and Steve Tolzman, who haveprovided too much advice and knowledge to list here. Last but definitely not least, I wantto thank my wife CJ for offering invaluable support and feedback on my assignments aswell as putting up with my sour graduate student moods.

ABSTRACT
Tsunamis pose a major threat to Oregon's coastal communities. Evacuation isthe best method to mitigate for tsunamis. Planning for tsunami evacuation is underwayin Oregon's coastal communities. Current methodologies use tsunami inundationmodels and population for evacuation planning. Tsunamis from a Cascadia subductionzone (CSZ) earthquake will create more complex response issues than these currentmethodologies account for. Coseismic landslides, liquefaction, intense ground shakingand hazardous material release further complicate current evacuation plans. In addition,the lack of consistent secondary hazard information to the public and the localgovernments results in simplified tsunami evacuation methodologies. The importance ofassessing multiple parameters for multiple hazards in tsunami evacuation planning hasnational and worldwide implications. The purpose of this project was to develop aCoastal Catastrophic Hazard GIS template that incorporates the complexity of CSZearthquake/tsunami events into evacuation planning and to support the consistentdevelopment of tsunami evacuation maps.
Keywords: Tsunami, Natural Hazards, Land Use Planning, Geographic InformationSystems, Earthquakes, Coastal Planning
2

TABLE OF CONTENTS
Acknowledgements......................................................................................................... 1Abstract ........................................................................................................................... 2TABLEOF CONTENTS ..................................................................................................3LISTOF FIGURES .......................................................................................................... 4LISTOF TABLES & CHARTS .........................................................................................4INTRODUCTION AND PURPOSE .................................................................................. 5BACKGROUND ............................................................................................................... 6
The Oregon Coast Hazard Setting ............................................................................... 6Earthquakes ................................................................................................................6Liguefaction ................................................................................................................. 7Amplification ................................................................................................................8Landslides ................................................................................................................... 8CoseismicSubsidence ................................................................................................ 9Ffre ............................................................................................................................ 10TsunamiHazards ......................................................................................................10The Cultural And Legal Setting .................................................................................. 12Tsunami Evacuation Decision-Making In Oregon ......................................................12Functional Tsunami Planning .................................................................................... 15Role Of Geographic Information Systems.................................................................. 16
STUDYAREA ............................................................................................................... 16METHODS.................................................................................................................... 20
GisDevelopment ....................................................................................................... 20ApplicationAt Gold Beach ......................................................................................... 23Performance Assessment.......................................................................................... 23
RESULTS...................................................................................................................... 24CatHazGlS................................................................................................................ 24Evacuation/Inundation Zones ....................................................................................24Secondary Hazard Analysis ....................................................................................... 24Evacuation Route Maps .............................................................................................25OverallPerformance .................................................................................................. 31
Scale......................................................................................................................... 31DataCoverage .......................................................................................................... 32PlanningIssues ......................................................................................................... 32
REFERENCES ..............................................................................................................34
1

LIST OF FIGURES
Figure 1. The Cascadia Subduction Zone ....................................................................... 6Figure2. Soil Liquefaction ..............................................................................................8Figure 3. Potential Ground Accelerations in Oregon ......................................................9Figure 4. Coseismic Subsidence Sequence ................................................................. 10Figure 5. Tsunami Wave Heights along the Oregon Coast ........................................... 12Figure 6. Study Area: Gold Beach, Oregon .................................................................. 18Figure 7. Study Area: Insets ........................................................................................ 19Figure 8. Data Model Secondary Hazard Layer ..........................................................22Figure 9. Process of Evacuation Map Development .....................................................23Figure 11. Relative Landslide Hazard at Gold Beach, Oregon ......................................27Figure 12. Evacuation Route Map-Downtown Gold Beach. Oregon..............................28Figure 13. LandScan Population and Building Evacuation at Gold Beach ....................30
LIST OF TABLES & CHARTS
Table 1. Summary Characteristics of CSZ Earthquakes in the Pacific Northwest ........... 7Table 2. Relative Landslide Hazard Model (Modified from Madin 1999) .........................9Table 3. Data Library Summary ....................................................................................21
Table 4. Persons Evacuated Per Inundation Model ...................................................... 29Chart 1. Population Evacuated .....................................................................................29
4

INTRODUCTION AND PURPOSE
Tsunamis pose a major threat to life and property on the Oregon coast.
Historically, they have been thought to originate from distant Pacific Rim areas only.
Recent studies prove that tsunamis can be generated from Cascadia subduction zone
(CSZ) earthquakes near the Oregon coast (Atwater and Hemphill-Haley 1997, Atwater
1995, Clague 1997, Darienzo and Peterson 1990, Nelson et al. 1995, Yamaguchi 1997).
Planning for near-source tsunamis is very complex because large earthquakes with
associated secondary hazards can 'disorganize' local communities and render most
warning systems inoperable. The number of hazards triggered by earthquake/tsunami
events makes evacuation planning confusing and difficult. Therefore current
methodologies for evacuation planning, which use too few parameters, leave many
residents at risk from secondary hazards.
Furthermore, summertime brings many visitors to the Oregon coast who have no
knowledge of the local coastal hazards. Current evacuation maps and tsunami
brochures are not consistent among communities and can be confusing to the tourist.
Many maps use small print, different symbology, and various designs, that confuse
visitors and residents. A need exists for consistent map design, with large, easily read
symbols and print, as well as an information template to aid in tsunami evacuation
planning in Oregon. The purpose of this project was to: 1) develop a Coastal
Catastrophic Hazard GIS template that incorporates the complexity of CSZ
earthquake/tsunami events and 2) to support the consistent development of tsunami
evacuation maps. The GIS developed in this project was assessed in its application to
the Gold Beach, Curry County, Oregon community (See Study Area, page 16).

BACKGROUND
THE OREGON COAST HAZARD SETTING
EARTHQUAKES
Earthquakes and tsunamis represent significant hazards to Oregon's coastal
communities. Earthquakes can have three main classifications in this region: crustal
earthquakes on the North American plate, crustal earthquakes on the Juan de Fuca
plate, and subduction earthquakes (figure 1) where the two plates interface (Madin
1992).
Figure 1. The Cascadia Subduction Zone
Juan de Fuca plate boundaries and directionCross-section of the Cascadiasubduction
Cascade Range
Joan de F$ dge MQU{ St dans BA
fl
Credit: www.csc.noaa.gov/products/tsunami
Once thought inactive, scientists have found that the Cascadia subduction zone
(CSZ), shown in Figure 1, may generate earthquakes with magnitudes surpassing 8.0 on
the Richter scale (Heaton and Hartzel, 1987 and Atwater 1995). Although not very
common, these events are extremely large and can generate major tsunamis.
Numerous scientists have predicted CSZ earthquake recurrence intervals of 300 1000
years (Darienzo and Peterson 1990) and 700 1300 years (Clague 1997), with an
average recurrence of 450 +1- 150 years (Geomatrix 1995). These long intervals have
brought a false sense of security to coastal communities that have no record of CSZ
events. However, an event of this magnitude would cause widespread physical and

economic damage. Similar earthquakes have occurred in Alaska (1964) and Chile
(1960) and have a 10% chance of occurring in the next 50 years in the Pacific Northwest
(Priest, personal communication). The characteristics of a Cascadia subduction
earthquake are summarized in Table 1.
Cascadia subduction zone events pose a major threat to life and property due to
tremendous shaking and significant secondary hazards. Subduction earthquake
secondary hazards include large tsunamis, soil liquefaction, amplification, landslides,
coastal subsidence, hazardous materials release and fire.
Table 1. Summary Characteristics of CSZ Earthquakes in the Pacific Northwest
Parameter Description
Rupture Location At the plate boundary, reason for abrupt coastal subsidence.Rupture Length Maximum length of 250 to 450 kmRupture Area Maximum 50,000 sq. metersRupture Width Maximum 100 sq. metersSeismic Slip 10-20 meters of potential slip.Inland Shaking No smaller than magnitude 7 (See Figure 3)
from Atwater et al. 1995.
Liquefaction
Liquefaction is the result of soils taking on a liquid form. During intense shaking,
fine sand and water break through fissures in the 'A' horizon of the soil and spread along
the surface. Buildings, roads and other infrastructure tend to loose solid footing and be
destroyed as shown in figure 2 (Madin 1999). Liquefaction potential is based on three
parameters:
1. Highwatertable2. Loosely consolidated soils3. Peak ground acceleration (intensity of shaking)
7

Amplification
Subduction megathrust events cause severe shaking (Atwater 1995). Geologists
measure the intensity of shaking by determining peak ground acceleration of motion
waves. Figure 3 depicts peak ground accelerations for southwest Oregon. Curry
County's coastal region is at relatively high risk of severe shaking, with peak ground
accelerations between 40 %g and 60 %g.
Figure 2. Soil Liquefaction
Credit: www.csc.noaa.Qov/rroducts/tsunami
Landslides
Coseismic landslides may occur during a major earthquake. The steep, saturated
slopes of the Coast may fail and create a significant hazard during an earthquake. The
most recent example was in the February 2001 earthquake in Olympia, Washington,
where many coseismic slides destroyed roads. Another example was the 2001 El
Salvador earthquake where a coseismic landslide covered approximately 500 homes
8

Figure 3. Potential Ground Accelerations in Oregon
Peak Ground Accelerations forSouthwest Oregon 80
-
- 25
12YW --20
12C)W ci
PeFc Aelertion %)wth 10% Prflb8biIit f n 50'grsite. NEHRFB-Cboundry
Nrianjin,iHJ Upir PrajiCredit: www.usgs.gov
Determining whether a hilislope will or will not fail is extremely difficult. The
Oregon Department of Geology and Mineral Industries (DOGAMI) developed a model
with two parameters to gauge the degree of relative hazard for slope stability: active
landslides and slope. According to DOGAMI, the following guidelines are used to set
relative landslide hazard (Madin 1999).
Table 2. Relative Landslide Hazard Model (Modified from Madin 1999)
Slope Degrees Hazard Risk
Less than 5% Low5% 25% MediumGreater than 25% High
Coseismic Subsidence
Subsidence can occur during subduction earthquake events (Peterson et al.
1 997). Subsidence associated with subduction earthquakes involves the rapid drop in
9

elevation along coastal areas. Coseismic subsidence can destroy edifice foundations
and produce widespread coastal flooding. Estimates of coseismic subsidence can be
taken by observing soil and plant macrofossils in the stratigraphy of soils (Figure 4).
Coseismic subsidence estimates range from 0-2 +I 0.5 meters for the Oregon coast and
0-1 +1- 0.5 meters for the Gold Beach study area (Peterson et al. 1997).
Fire
Fire is an ever-present danger in the post-earthquake scenario. Flammable
materials must be tracked to plan for this secondary hazard. Natural gas lines and
industries using flammable products, such as paper or wood mills, may be sources of
large fires. Fires have the potential to cut off lifelines (important transportation
networks), destroy property and cause casualties.
Figure 4. Coseismic Subsidence Sequence
Burled soilSubsidence of subsided
A marsh andforest
dwer
Beforeearthquake
Minutes to hours Months toyears Decadsto centuriesefter earthquake aer earthquake ater earthquake
Credit: www.csc.noaa.clov/Droducts/tsunami
TSUNAMI HAZARDS
Tsunamis are a series of long waves generated by a large displacement of water.
Undersea volcanoes, undersea landslides, earthquakes and even meteors can generate
tsunamis and threaten coastal communities. The close proximity of the Cascadia
subduction zone (approximately 60 miles off shore) allows tsunamis to arrive soon after
an earthquake.
10

Tsunamis generated from large Cascadia subduction earthquakes have an open
ocean travel time of approximately 500 miles per hour and will reach the coast within 30
minutes (Priest et al 1997). These coseismic tsunamis may reach wave heights of 12
meters as shown in figure 5 (Madin 1999).
Earthquakes from the Pacific Rim can generate trans-oceanic tsunamis, or tele-
tsunamis. Tele-tsunamis are more frequent and can cause severe damage. The 1964
Alaska earthquake generated a 3-meter tsunami that caused one fatality in Cannon
Beach, Oregon and 10 fatalities in Crescent City, California (NOAA et al., 2000). The
National Oceanic and Atmospheric Association has strategically placed buoys in the
Pacific Ocean to give warning of oncoming tsunami waves. These warning signals are
tied to a tsunami warning system in local coastal communities. This warning system is
effective for far-source tsunamis only. In total, both near-source and far-source
tsunamis put coastal communities at risk of severe damage, especially since these
communities have developed in low-lying areas.
The Department of Geology and Mineral Industries currently has two models of
tsunami inundation for Oregon. Senate Bill 379 maps depict an overall assessment of
inundation in Oregon. The model is simple and generalized for the scale at which it was
made. DOGAMI also has the Interactive Map Series (IMS) that provides more detailed
inundation zones at the community-level for three tsunami scenarios: extreme case,
moderate case and least hazardous case. Digital IMS tsunami inundation maps
currently exist for Gold Beach and Warrenton only.
Tsunamis, like their earthquake counterparts, have significant secondary hazards
as well. A series of large waves, especially following a major earthquake, can carry
large debris into structures and! or people that would have otherwise survived the event.
Hazardous chemicals can be spread, threatening local ecological habitat and causing
contamination in many developments.
11

Figure 5. Tsunami Wave Heights along the Oregon Coast
r
It
C4
Scerrio I Snar 2 Scenario 3 Scenario 4W. UrOI2312 M
LiIr
Maximum Heights of Tsunami WavesCoasts of Oregon, Washington, and N. California
Credit: www.csc.noaa.gov/products/tsunami
THE CULTURAL AND LEGAL SETTING
The Oregon coast has experienced significant population growth in its central
and northern regions along with a lack of experience with major seismic events. The
gain in population has led to larger and denser communities which are more susceptible
to damage in earthquakes and tsunamis (Mileti 1999). In addition, the rugged
geography of the Coast Range limits development to the coastal boundaries, leaving
more people in tsunami inundation zones.
Preparation for tsunamis is in progress at the local, state, and federal level
(Wang 1997). Tsunami evacuation planning is a priority because it is the only survival
strategy for people inside of inundation zones (NOAA 2000). Although communities are
preparing plans for evacuation, the methodologies are simple with few parameters.
Tsunami Evacuation Decision-Making In Oregon
Policies
12

The Coastal Zone Management act provides federal regulation on tsunami
planning. The act directed communities to "preserve, protect, develop, and where
possible, restore and enhance the resources of the coastal zone. . ." (NOAA 2000). In
1990 with the Coastal Zone Enhancement Program, coastal hazards were specifically
mentioned along with secondary hazards from development. Finally, the National
Tsunami Hazard Mitigation Program and the National Flood Insurance Program (NFIP)
are mitigation policies for aiding plans before and after an event.
The Oregon Department of Land Conservation and Development's (DLCD) state
land use planning goals provide the framework for Oregon's tsunami policies. All
policies are centered on the local comprehensive plan. The comprehensive plan is the
official document (at the city or county level) that sets forth general policies for the
community to follow. Once approved at the local level, the comprehensive plan must be
followed in all local policies. DLCD's state land use planning Goal 7: Areas subject to
Natural Hazards and Disasters provides general regulations from the state level that
must be followed at the local level. Goal 7 emphasizes avoidance mechanisms for
natural hazard mitigation.
Senate Bill 379 (ORS 455.446-447) is the first tsunami specific law in Oregon.
This bill supports the hazard avoidance objectives set in Goal 7 by prohibiting the
construction of hospitals, emergency response centers, colleges, schools, jails, and
communication centers within the tsunami inundation zone. Maps citing the 'SB 379
lines' were produced to delineate coast-wide inundation zones.
Parties
Oregon has four main contributors to tsunami evacuation planning. They include
Oregon Emergency Management (OEM), the Department of Geology and Mineral
Industries (DOGAMI), Oregon's Coastal Management Program (OCMP) under the
Department of Land Conservation and Development (DLCD), and the local communities.
13

OEM directs and coordinates emergency response and planning among the different
agencies. DOGAMI has three major responsibilities: hazard identification, hazard
mitigation, and hazard awareness/education. DLCD has been concerned with future
development and land use practices in hazardous areas (Wang 1997).
Oregon Emergency Management has directed that tsunami evacuation
brochures be produced for all major coastal communities. The local communities are
encouraged to produce the brochures and DOGAMI is responsible for guiding brochure
development. Brochures were selected to be the main forum for community education
for three reasons: 1) relatively inexpensive costs; 2) relatively effortless access to
residents and; 3) relatively effortless access to tourists. Although Oregon has this plan
in place, there is no consistency among community brochures, and no common
methodology for the creation of evacuation routes.
The local communities are the fourth participants in evacuation planning. Local
officials include county emergency managers, police chiefs, fire chiefs, and community
planners. In some cases the emergency planners take sole responsibility of the
evacuation plan, while in other communities, some or all officials mentioned above are
involved. In all cases, the local community provides invaluable information in the
formation of the community's methodology.
Methodologies for hazard evacuation exist mainly in Hawaii, Japan, and the
southeastern United States (NOAA 2000). The majority of hazard evacuation
experience in the U.S. has been with hurricane evacuation in the southeast. Hurricane
evacuation usually has approximately 5 to 6 hours of evacuation time for millions of
people. Oregon has much less time to evacuate (approximately 15-30 minutes for a
CSZ event). However, no systematic methodology has been used for tsunami
evacuation planning in Oregon.
14

Commonalities to evacuation methodologies do exist in Oregon. Strategies
consist mainly of horizontal evacuation plans. Most plans incorporate tsunami
inundation and population and ignore secondary hazards. Horizontal evacuation plans
use the ground as a forum for evacuating an area. Roads, parking lots, land, and other
ground routes can be used for horizontal evacuation. Some evacuation plans have cars
as the expected mode of travel, a mode that may be impossible to use due to effects
from secondary hazards.
Vertical evacuation strategies have been overlooked in Oregon. Vertical
evacuation takes advantage of larger and stronger buildings that will not fail in the
earthquake! tsunami scenario, by evacuating people to an elevation above the tsunami
heights.
Functional Tsunami Planning
Oregon lies in a unique setting that combines severe earthquake hazards with
large tsunamis. Functional tsunami evacuation plans must be broad in scope and
include 4 key features (modified from Alam 1999):
1. Appropriate earthquake! tsunami and secondary hazards parameters2. Consistent terminology3. Both vertical and horizontal evacuation strategies4. Shelters in safe locations with the capacity to serve the number of people
evacuated.
Seismic events generate multiple hazards thus creating the need for multiple
parameters in tsunami evacuation planning. However, few parameters are currently
used in the evacuation models for Oregon. These parameters are:
1. Location of people.2. Tsunami Inundation run-up3. Location of bridges
Although these are important parameters, CSZ earthquakes cause other events
hazardous to evacuation (liquefaction, landslide, hazardous materials release, fire).
These 'secondary' parameters must be included in the tsunami evacuation plans.
15

Role of Geographic Information Systems
Geographic information systems provide a means for including complex hazard
analysis. GIS has been used to model relative seismic hazards in selected communities
(Madin 1999) and to conduct seismic impact models (FEMA 1997). GIS allows the
ability to create and quickly incorporate secondary hazard models into evacuation plans.
The ability of GIS to identify areas of considerable hazards can greatly assist local
stakeholders and planners in natural hazard planning (Mileti 1999).
The geographic information system provides a forum to design and reproduce
maps for community education and information. Evacuation maps can be consistent
along the entire coast by using GIS. In Oregon, both residents and visitors, many of
which are retirees, will use evacuation maps. Therefore the design of the maps should
be simple, with large lettering and symbology, to easily portray safe from non-safe
zones, as well as recommend paths to safety.
STUDY AREA
Gold Beach, Oregon was selected to apply the CatHazGlS template upon its
completion. Gold Beach lies on the Southern Oregon coast where the Rogue River
empties into the Pacific Ocean (Figure 6 and Figure 7). The town is the county seat for
Curry County, which has two other major communities: Port Orford and Brookings. Gold
Beach is a small town with 2,115 residents (approx. 10% of Curry County) and has little
growth.
The Coast Range rises sharply from the Pacific Ocean near Gold Beach leaving
few flat areas for development. Vegetation from the coast to the hills starts as beach
grasses and quickly forms the conifer forests typical of the coast range. The bedrock
geology consists of the Otter Point Formation, which is mainly mudstones, siltstones,
and serpentine rocks.
16
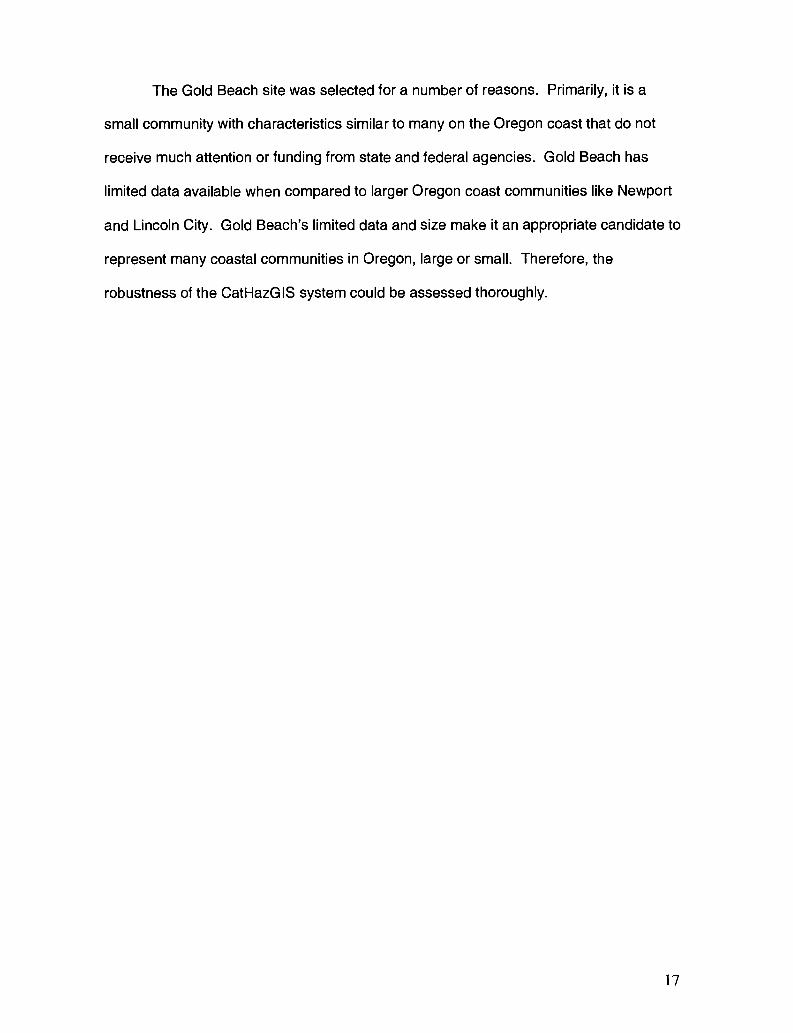
The Gold Beach site was selected for a number of reasons. Primarily, it is a
small community with characteristics similar to many on the Oregon coast that do not
receive much attention or funding from state and federal agencies. Gold Beach has
limited data available when compared to larger Oregon coast communities like Newport
and Lincoln City. Gold Beach's limited data and size make it an appropriate candidate to
represent many coastal communities in Oregon, large or small. Therefore, the
robustness of the CatHazGlS system could be assessed thoroughly.
17
Figure 6. S
tudy Area: G
old Beach, O
regon
:
--
_
I=1
SS
a
18

Figure 7. Study Area Insets
Inset 1. Downtown Gold Beach
VV /- t: V;;
\ " '36'Iy
Gold Btaoh;(--r.'
Inset 2. Nasika Beach
ci . -
I":Inset 3. Hunter Creek
:
Frk
.- --.
- I
19

METHODS
The techniques for this project focused on the development of the information
system and its application at Gold Beach, Oregon. There were three phases of the
project:
1. GIS Development2. Application to Gold Beach3. Performance Analysis
GIS DEVELOPMENT
The development of the information system was organized into two tasks. The
first was data compilation. All data relative to catastrophic hazard planning on the
Oregon coast was compiled and saved in one database. These data include base
Census layers, physical and geological data, tsunami inundation data, hazardous
materials, secondary hazards, and critical and essential facilities (Table 3). Next, the
data was manipulated to be able to work in one system. Most data was reprojected into
a common projection and some tablature data was converted into spatial data (Jay
Charland's Critical and Essential Facilities 1995).
Supporting AMLs (Appendix V), were written to assist in data manipulation. The
CatHazGlS was designed to act as a tool for years to come. Therefore, large amounts of
memory were required for data to be collected at the finest scales possible. Utilizing
supporting AML programs was the only way to complete the project in a timely manner.
SECONDARY HAZARD ANALYSIS
A basic secondary hazard analysis was completed to determine which parts of
the transportation network and shelters were safe/unsafe for evacuation. Due to lack of
secondary hazard data on the Gold Beach area, only coseismic landslide hazards were
assessed. Figure 8 describes the data model of the landslide hazard layer. Upon
completion of modeling landslide hazards, an initial evacuation route map was made to
begin the next phase of the project.
20

Table 3. Data Library Summary
Entity Description
Base*** base Orthophotoelevation DEM 1 Om<county>_streets roads segments<county>_hwy major highways<county>_lakes major lakes<county>_border county boundaries<county>_river major streams<county>_hbr highway bridges<county>_powr county powerlines<county>_shltr county shelters<county>_blockgrPS census blockgroups<county>_czone coastal zone boundary
Essentialand Critical <county>_schools coastal zone schools
Facilities <county>_care coastal zone hospitalsindustrial/residential/commercial
<county> indust facilitiesuntr>Iemerg emergency response facilities
<county>_cfa communication facilities<county>_afa airport facilities
Physical amplificationeqrelhazIndsldSB379I MS<seriesnumber>liqfct<county>_geo<county>_soils
earthquake amplificationearthquake hazardlandslide hazardtsunami inundation
community tsunami indunliquefaction hazardUSGS Geologic MapsSCS soil types
Source
CRESTUSGSCENSUSCENSUSCENSUSCENSUSCENSUSHAZUSCENSUSHAZUS
CENSUSDLCD
DOGAMIDOGAMI
DOGAMIDOGAMIFEMNHAZUSFE MNHAZ U S
DOGAMIDOGAMIDOGAMIDOGAMI
DOGAMIDOGAMIUSGSNRCS
Scale 1:
2400024000100000100000100000100000100000250000100000250000
100000100000
n/an/a
n/an/a
250000250000
24000240002400024000
240002400050000024000
21

Figure 8. Data Model Secondary Hazard Layer
Data Model - Secondary Hazard Layer Creation
Safe routesStreet Route
/ ....................Slope
. /DEM
Rel. Landslide Haz
Aspect "N Safe shelters
Essential Facilities
Human derivedGIS derived
EVACUATION ANALYSIS
The LandScan 1km grid global population database was used in order to study
the implications of different tsunami evacuation zones. This dataset is the foremost
population database for studying populations at risk (Dobson et al. 2000). It was
selected over census data because the database models ambient population instead of
traditional resident populations. Ambient population data incorporates where people are
versus where people live (resident population). The data was developed on four
parameters: slope, nighttime lights, land cover, and proximity to roads (Dobson et al.
2000). On the Oregon coast, ambient population is critical for accurate evacuation
assessments because the number of people vastly increases during the summer while
its residential population increases only slightly. Both residents and tourists must be
accommodated in evacuation shelters. The LandScan Global Population dataset allows
disaster managers to plan for the appropriate number of evacuees.
22

APPLICATION AT GOLD BEACH
The GIS was brought to the City of Gold Beach where the development of the
evacuation plans took place. Meetings were held to determine the location of each
evacuation route, shelter and zone before digitizing them in the GIS. The entire process
was done in 4 steps (Figure 9). First, a trial map was made depicting all hazardous
areas including tsunami inundation zones and secondary earthquake hazards. Then the
local community decided on the routes and evacuation shelters based on the given
information. The routes and shelters were digitized and a trial map was made. The
local community reviewed the trial map before final review by DOGAMI. Upon a
satisfactory final review, the maps were included on the tsunami evacuation brochures.
Figure 9. Process of Evacuation Map Development
Step 1 Step 2 Step 3 Step 4
1LOCAL
/ COMMUNITY
ONSGIS TRIAL LOCAL AND DOGAMI
MAP COMMUNITY REVIEWI
OCA[FINALMAP
PERFORMANCE ASSESSMENT
The final stage of the project was to analyze the earthquake/tsunami GIS
planning template based on the initial goals of the project:
1. Develop a consistent methodology in the creation of evacuation maps2. Develop a county GIS template to support planning for the complex
earthquake/tsunami scenarios of the Pacific Northwest.
The assessment analyzes its strengths and weaknesses in supporting tsunami
evacuation planning. Consultation with local hazard consultants and coastal geologists
23

in combination with a literature review provided a solid base to make a 'needs
assessment' (located in the DISCUSSION section).
RESULTS
The results of this project are organized into three main subgroups:
CatHazGlS version 1.0Evacuation Zones and RoutesSecondary Hazard AnalysisLandScan Population Analysis
CA THAZGIS
The coastal Catastrophic Hazard GIS was the primary result of the project. Data
was assimilated for the seven coastal counties for Oregon covering currently available
datasets with regard to the earthquake! tsunami scenarios in the region. CDs consisting
of the CatHazGlS data accompany this text and are available through the Oregon
Department of Land Conservation and Development.
EVACUATION/INUNDATION ZONES
The GIS allowed evacuation zones to be determined based on existing
inundation models (Figure 10). Both the SB379 lines (figure lOa) and the IMS series
inundation zones (figure 1 Ob) were used interactively during planning meetings for
determining shelter, route and evacuation zone locations. The evacuation zone (figure
lOc), when compared to the other models covers the most area within Gold Beach.
SECONDARY HAZARD ANAL YSIS
The Coastal Catastrophic Hazard GIS provided a means to gauge relative
landslide hazard. DOGAMI's relative landslide hazard model (Madin 1999) was used to
find hillslopes at high relative risk of failure (Figure 11). The zone depicted by the
magenta circle shows Riley Middle School (in yellow) in relation to a hillslope at risk of
coseismic failure. Local planners used this information to designate safe areas for
24

evacuation shelters and to detour possible evacuation routes around this hazardous
area.
EVACUATION ROUTE MAPS
Evacuation route maps were created for tsunami evacuation brochures as
described previously in the methods section. Figure 12 shows the evacuation route map
for the Gold Beach area. Other communities' evacuation maps outside of the study area
have been included in Appendix I.
25

Figure 1O(a., b., and c.) IMS Series Tsunami Inundation at Gold Beach
lOa. SB 379 Inundation lob. Detailed Models lOc. Evacuation Model
Legend
/DEM derived shorelineSb379inundshp
+
LegendDEM derived shoreline
betailed Inundation HazardExtremeHighModerate
Legend
/\ / DEM derived shorelinelnterinund.shp
26

Figure 11. Relative Landslide Hazard at Gold Beach, OregonAreas in red depict hilislope at a high relative risk of failure during large earthquake events. The yellowfeature depicts the location of Riley Creek Elementary School. Notice its relation to the steep hillslopes to itssouth.
27

Figure 12. Evacuation Route Map-Downtown Gold Beach, Oregon
rbzici(HILL 7.o ' /
0k f
1
h- m.-
0
1ti 0
liii
101
+
0 0.5 1 Miles
Legend Evacuation Route Map Design. The evacuation route map wasproduced with the intent of having a highly varied audience. TheOregon coast has many retirees and visitors who may have trouble
Spec Occupancy Structwes reading fine print, or may not know the area. The design1%/Oregon Coast Highway implemented intended to reach these audiences in order to portray
Essential Facilities crucial information in case of a major earthquake! tsunami event.Evacuation Zone Notice the street labels, Oregon Coast Highway labels, and the
aon0(reters)evacuation arrows stand out and are easily recognizable. Essential
01 -20 facilities and Special Occupancy Structures were included on the mapbut shelters were not. At the time of design, local communities hadj 80- 160 not made contractual assignments with communities for the shelterwith one exception in Brookings. The GIS based design allows future
640 - 1280 shelters to be added with ease.1280- 2530

LANDSCAN POPULATION ANALYSIS
The LandScan analysis provided the data shown in Table 4, Chart 1, and also
represented in Figure 1 3a and 1 3b. As expected, the number of buildings evacuated
increased as the area of the evacuation/inundation zone increased. Conversely, the
number of people evacuated decreased between the IMS inundation zone and the
derived evacuation line (Table 4).
Table 4. Persons Evacuated Per Inundation Model
DATASB 379 Line IMS 13 Inundation Zone Buffered Evacuation Line
Number of Buildings 142 297 473Avg#ofPeople(O.R.) 329 630 611
PERCENT INCREASESB 379 Line IMS 13 Inundation Zone Buffered Evacuation Line
Number of Buildings n/a 109.155 59.259Avg # of persons (LandScan) n/a 91 .489 -3.016
Chart 1. Population Evacuated
Evacuation Analysis
700 -,
400 Number of Buildings
300 -1 Ambient PopulaJ
SB 379 Line MS 13 BufferedInundation Zone Evacuation Line
Evacuation I Inundation Line
29

Figure 13. LandScan Population and Building Evacuation at Gold Beach
13a. Indundation and LandScan Grid 1iD. uiiaing evacuatea per evac-moaei
Legend
Sb379 inundationDetailed Model Inundation
J Evacuation ModelLandScan Ambient Population
0 26EJ 27- 53EJ
80 1 06107- 132133- 159
- 160- 185186- 212213 - 239No Data
Legend
SE379 buildingsDetailed Inundation BuildingsEvacuation Zone Buildings
+
n

DISCUSSION
OVERALL PERFORMANCE
The Coastal Catastrophic Hazard GIS was successful in providing a means for
consistent evacuation mapping and providing a countywide earthquake! tsunami hazard
GIS template for Oregon's coastal counties. Moreover, it provided a forum for handling
the complexity of the earthquake! tsunami scenario. The system was generally
successful, but does have weaknesses that were apparent in the application at Gold
Beach.
PERFORMANCE AND NEEDS ASSESSMENT
In applying the GIS to tsunami evacuation planning, weaknesses were found in
the following areas:
scaledata coverageplanning process.
SCALE
An information system is as good as its data and the CatHazGIS is no exception.
Existing data from different sources and at different scales was incorporated into one
system. Much of the data exists at 1:24000 (Table 3), yet the crucial base layers are
1:100,000, and even some data only exists at 1:250,000 and 1:500,000. In all cases,
analysis can only be done at a scale equal to the least common denominator (of scale)
among all layers. Therefore, much of the large scale data could not be used to its full
potential.
This problem of scale arises on the LandScan population data. Each grid cell
exists as a 1 km grid cell (Figure 13), an extremely course resolution for large scale
analysis. The decrease in number of persons evacuated (Table 4) is not acceptable due
to the fact the largest evacuation! inundation zone is over dense development (figure
1 Oc). In addition, the number of buildings evacuated is higher under this 'evacuation
31

zone.' To solve this discrepancy, it is recommended that the data be partitioned or a
higher resolution dataset be developed.
DATA COVERAGE
In addition to problems of scale, the datasets currently available for secondary
hazards cover few communities and leave inter-community residential areas out. In
Curry County alone, only Brookings has liquefaction and amplification hazard layers
(Madin 1999). Liquefaction layers must be made for all communities on the Oregon
coast. The GIS can provide a forum in the future for applying models to gauge relative
liquefaction and amplification hazard.
Coseismic subsidence is only recently being studied. Coseismic subsidence will
greatly alter the evacuation scenario by causing coastal flooding as deep as 2m. Little
subsidence research has been done on the southern coast with most studies
concentrating on the central and northern coast (Peterson 2000). Although studies
have been done predicting possible subsidence, no GIS layers have been developed to
model this phenomenon.
Hazardous materials databases exist in tablature form but not in spatial form.
Some hazardous material information exists in Charland's Critical and Essential
Facilities list from 1995 but the data is incomplete. A statewide hazardous material
spatial dataset is necessary to assess location and hazard of chemical materials.
Natural gas lines and other flammable developments need to be tracked spatially
to determine regions of extreme fire hazard. Vegetation prone to fire must be surveyed
at large scales to support the hazard layer creation. Currently, this data does not exist
for the small communities along the coast.
PLANNING ISSUES
The application of the system at Gold Beach exposed some possibilities for
future planning methodologies. In summary, Oregon should:
32

Study other region's tsunami planning efforts, notably Hawaii,California, Alaska,and Japan.Develop a consistent planning methodology for the entire Oregon coast.Include horizontal and vertical evacuation strategies.Incorporate 'time-to-evacuate' models to aid response area priorities.
Hawaii, Alaska, Japan, Chile and other Pacific Rim regions have experience with
tsunami hazards. Land uses such as tsunami forests, building aspect, and strategic
trenches have been used to mitigate tsunami damage in these regions (WDNR 1999).
The strategies from these regions should be studied and possibly incorporated into
Oregon's planning policies.
A consistent methodology could standardize and add expertise to Oregon's
evacuation planning process. Community members seemed confused on the issues
and unorganized in the decision-making process. The GIS can bring consistency to
tsunami hazard mapping, but a standard methodology is needed to keep state
administrators and local governments 'on the same page.' Interagency consistency will
keep response efforts to such earthquake! tsunami events efficient. The National Guard
should be incorporated into the planning process since it is the primary responder to
natural disasters.
The current evacuation strategies incorporate horizontal evacuation only. This is
due to the lack of suitable buildings for vertical evacuation. Due to the geography of
many coastal areas (stabilized sandbars, small creek estuaries parallel to the coast with
developed beach heads), vertical evacuation may be the only strategy to save lives.
Areas in need of vertical evacuation should be identified. This can be done with the
creation of a time dimension in the GIS. Evacuation time must be modeled to locate
people who cannot be evacuated before a tsunami arrives.
33

REFERENCES
Abkowitz, Mark and Meyer, Erik, 1996, Technological Advancements in HazardousMaterials Evacuation Planning, Transportation Research Record, 1522 PP. 116-120.
Alam, Sajjad B., Goulias, Konstadianos G., 1999, Dynamic Emergency EvacuationManagement System Using Geographic Information System and SpatiotemporalModels of Behavior, Transportation Research Record 1660 pp. 92-98.
Atwater, Brian F. et al. 1995. Summary of Coastal Geologic Evidence for Past GreatEarthquakes at the Cascadia Subduction Zone, Earthquake Spectra, vol. 11, no.1,pp. 1-18
Atwater, Brian F. and Hemphill Haley, E., 1997. Recurrence intervals for greatearthquakes of the past 3,500 years at northeastern Willapa Bay, Washington,U.S. Geological Survey Professional Paper, 1576.
Charland, Jay W. and Priest, G.R., 1995. Inventory of critical and essential facilitiesvulnerable to earthquake and tsunami hazards on the Oregon Coast, Open-File-Report 0-95-02, DOGAMI, Portland, Oregon
Clague, John J., 1997. Evidence for large earthquakes at the Cascadia SubductionZone, Reviews of Geophysics, vol. 35, no. 4, pp. 439-460.
Coastal Service Center, NOAA. 2001. Protecting our Ports and Harbors website,www.csc.noaa.pov/products/tsunami.htm
Darienzo, Mark and Peterson, Curt, 1990. Episodic Tectonic Subsidence of LateHolocene Salt Marshes, Northern Oregon Central Cascadia Margin, Tectonics,vol.9, no. 1, pp. 1 22.
Federal Emergency Management Agency (FEMA), 1997, Project impact: building adisaster resistant community, Government Printing Oftice, Washington, D.C.
Geomatrix Consultants, Inc, 1995, Seismic Design mapping, State of Oregon, FinalReport to Oregon Department of Transportation, Project no. 2442.
Heaton, T.H., and Hartzel, S.H., 1987, Earthquake hazards on the Cascadia subductionzone., Nature, 236:162-168.
Madin, Ian, 1992. Seismic Hazards on the Oregon Coast from Coastal Natural Hazards:Science, Engineering and Public Policy, James W. Good and Sandra S.Ridlington eds., Oregon Sea Grant, Oregon State University Press.
Madin, Ian and Wang, Zhenming, 1999. Relative Earthquake Hazard Maps for SelectedUrban Areas in Western Oregon, Interpretive Map Series IMS 10, Departmentof Geology and Mineral Industries.
Mileti, D.S. 1999. Disasters by Design, A Reassessment of Natural Hazards in theUnited States. Washington D.C.: Joseph Henry Press.
34

Nelson, Alan A., Atwater, Brian F., Bobrowsky, Peter T., Bradley, Lee-Ann, Clague, JohnJ., Carver, Gary A., Darienzo, Mark E., Grant, Wendy C., Krueger, Harold W.,Sparks, Rodger, Stafford, Thomas W., Stuiver, Jr. and Minze, 1995.Radiocarbon Evidence for extensive plat-boundary rupture about 300 years agoat the Cascadia subduction zone, Nature, vol. 378: 371.
NOAA et al, 2000. Designing for Tsunamis: Seven Principles for Planning andDesigning for Tsunami Hazards. Draft Version. National Tsunami HazardMitigation Program.
Oregon Department of Land Conservation and Development Commission, 2001. Goal7: Areas Subject to Natural Hazards and Disasters, State Land Use PlanningGoals: www.lcd.state.or.us.
Peterson, Curt D., Barnett, Elson T., Briggs, Greg G., Carver, Gary A., Clague, John J.,Darienzon, Mark E., 1997. Estimates of Coastal Subsidence from GreatEarthquakes in the Cascadia Subduction Zone, Vancouver Island, B.C.,Washington, Oregon, and Northernmost California, State of Oregon Departmentof Geology and Mineral Industries, Open File Report 0-97-5.
Peterson, Curt D., Doyle, D., and Barnett, E., 2000, Coastal flooding and beach retreatfrom coseismeic subsidence in the Central Cascadia Margin, USA,Environmental and Engineering Geoscience, 6 (3): 255-269.
Priest, George R. Myers, Edward, Baptista, Antonio, Fleuck, Paul, Wang, Kelin,Kamphaus, Robert, Peterson, Curt D., 1997. Cascadia Subduction ZoneTsunamis: Hazard Mapping at Yaquina Bay, Oregon, Open-File Report 0-97-34,Department of Geology and Mineral Industries, Portland, Oregon.
Priest, George R. 2000. Personal Communication. Department of Geology and MineralIndustries, Newport, Oregon.
Pruess, Jane, Raad, Peter, Bidoae, Razwan, 1999, Coastal Earthquake Effects, TsulnfoAlert, prepared on behalf of the National Tsunami Hazard Mitigation Program bythe Washington Department of Natural Resources. Vol. 1, no. 6 pp. 7- 17.
Regional Ecosystem Office website: www.reo.gov
Wang, Y., 1997, Preparing for earthquakes in Oregon, Oregon Geology, vol. 59, no. 2.,pp. 27-39.
Yamada, Takeo, 1996, A Network flow approach to a city emergency evacuationplanning, International Journal of Systems Science, vol. 27, no. 10 pp. 931-936.
Yamaguchi, David K., Atwater, Brian F., Bunker, Daniel E., Benson, Boyd E., Reid,Marion S., 1997. Tree-Ring dating the 1700 Cascadia Earthquake, Nature, vol.389: 922-923.
35

APPENDICES
APPENDIX I. Evacuation Maps
36

APPENDIX II. Data Dictionary
ArcINFOEntity DescriDtion Source Scale 1: Proiection
Base images Orthophoto CREST 24000 image utm83DEMs DEM lOm USGS 24000 grid utm83
Cultural<county>_streets roads segments CENSUS 100000 arcs utm83<county>_hwy major highways CENSUS 100000 arcs utm83<county>_border county boundaries CENSUS 100000 polygon utm83<county>_powr county powerlines CENSUS 100000 arcs utm83<county>_blockgrps census blockgroups CENSUS 100000 polygon utm83<city>_evac Tsunami evacuation DOGAMI N/A polygon utm83
Special occupancy<county>_spec structures DOGAMI n/a point utm83
<county>_essen Essential facilities DOGAMI n/a point utm83
Oak RidgeNational 1 km
Landscan_pop Ambient Population Laboratory grid grid utm83communication
Hazus <county>_cfa facilities FEMA/HAZUS 250000point<county>_afa airport facilities FEMNHAZUS 250000point<county>_hbr highway bridges HAZUS 250000point utm83
<county>shltr county shelters HAZUS 250000point utm83<county>_hazmat hazardous materials HAZUS 250000point utm83<county>_hpdams dams HAZUS 250000point utm83
EssentialFa <county>_care coastal zone DOGAMI n/a shapefile utm83
37

cilities hospitals pointindustrial/residential! shapef lie
<county>_indust commercial facilities DOGAMI n/a point utm83emergency shapefile
<county>_emerg response facilities DOGAMI n/a point utm83communication shapefile
<county>_cfa facilities FEMNHAZUS 250000 pointshapefile
<county>_afa airport facilities FEMA/HAZUS 250000 point
SpecialOccupancy coastal zone shapef lIeStructures <county>schools schools DOGAMI n/a point utm83
earthquakePhysical amplificat amplification DOGAMI 24000 polygon utm83
rel_eq_haz earthquake hazard DOGAMI 24000 polygon utm83landsld landslide hazard DOGAMI 24000 polygon utm83
SB379 tsunami inundation DOGAMI 24000 polygon utm83community tsunami
IMS<series number> indun. DOGAMI 24000 polygon utm83liquefact liquefaction hazard DOGAMI 24000 polygon utm83
USGS Geologic<county>_geo Maps USGS 24000 polygon utm83<county>_soils SCS soil types NRCS 24000 polygon utm83<county>_lakes major lakes CENSUS 100000 polygon utm83<county>_river major streams CENSUS 100000 arcs utm83

Coverage/Shapefile Attribute Description Example Unique Identifier
<county>_streets Street arcs TlidFeName Street name to which arc belongs JettyFeType Type of street Rd.
Length Length of arc (international feet) 302.742Fraddl From left address 1824Toaddl To left address 1800Fraddr From right address 1825Toaddr To right address 1801Zipi Zipcode o the polygon to the left of the arc 97005Zipr Zipcode of the polygon to the right of the arc 97005Fnode# Start point of line segment 331Tnode# End point of line segment 305
<county>_hwys TlidFeName Name of highway to which arc belongs Oregon CoastFeType Type of highway; St., Hwy, Dr., Rd., etc. hwyLength Length of arc (international feet) 677.048Fraddi From left address 5381Toaddl To left address 5369Fraddr From right address 5380Toaddr To right address 5368Fnode# Start point of line segment 446Tnode# End point of line segment 447
<county>_lakes TlidArea polygon area (international square feet) 33502.438Perimeter polygon perimeter (international feet) 1019.22
39

<county>_hbr ld_Name Name of river which brigde covers Skamakawa CreekLat Latitude (datum?) 46.245000Long Longitude (datum?) -123.710000Owner Owner of bridge County Highway AgencyClass Hazus class HWB4Type Hazus type 50500008Traffic traffic index 842Condition Hazus condition 888Length Length of bridge (feet) 24.20Width Width of bridge 9.8Lenmaxspan Length for maximun span based on structure 24.20Num_sp number of spans 1
Angle Swew angle of bridge 15seat_I seat length 0seat_w seat width 0Pier HAZUS Pier type (HAZUS Appendix E) N044400000Scour HAZUS scour index 9Year_b year the bridge was built 1952Year_r year the bridge was remodelled 1986cost replacement cost 0elevation elevation of structure(ft) 112county FIPS county code 41007
<county>_hpdams ld_Dam_name Name of Dam Bear Creekowner Owner of Dam City of Astoriaclass Dam classification (HAZUS) HPDMcountyname county in which Dam is in Clatsop CountyRiver River which is Dam is on Bear CreekPurpose SYear_comp Year finished 1952

<county>_blockgrps
<county>_power
Dam_length span of dam (ft)Dam_height Dam height (ft)Struct_hgt structure height (ft)hydr_hgt water height (ft)Max_disch Maximum water discharge (cfs)Max_star Maximum water storage (acre-feet)Norm_stor Normal water storage (acre-ft)Near_city nearest city to the damDist_city distance to nearest city (miles)hazard relative hazard rating (low, significant, high)lat latitudelong Longitudesurf_area surface area of lake (acre)drain_area drainage area (sq. miles)cost cost of dam constructionprimary_sr primary source agencynat_id national dam ID numbercounty FIPS county codeid hazus internal ID numbervolume spillway volume (cubic yards)EAP emergency action plan (yes/no/not required)Spill_type Spillway type (controlled, uncontrolled, not applicable)Spill_width spillway width (ft)
fnode# starting point of line segmenttnode# ending point of line segmentlpoly# left polygon numberRpoly# right polygon numberCIat_power# line segment numberLength length of line segment (international feet)Tlid
270909488530800700Seaside22L=Low, S=signiflcant, H=high46.095-123.6 166677430OR0R00049410070R000030YC0
2193214688888723721.88215222996
Clat_power#
41

<county>_rivFeName name of stream to which arc belongs Bind SloughLength length of line segment (international feet) 3328.26 1Fnode starting point of line segment 112Tnode ending point of line segment 114
lpoly# left polygon number 1
rpoly# right polygon number 1
<county>_spec<county>_essen Use Level/grade of school
Type General classification for essential facilities
Indust: Industrial and economic facilities
School: Schools and Day Cares
Emerg: Emergency facilities, fire, police, etc.
Care: Hospitals and Medical Care FacilitiesName Name of schoolOwner Owner of facilityAddress Number and street addressCity City of <county> county, OregonLongitude Longitude (NAD27)Latitude Latitude (NAD27)Bldg_class section(s) of ORS 455.477 which applies to facilityZscore_$ Structural score from ACT surveyNon_struct Non_structural falling hazard- presence of facadesZ_5_quad survey sheet number AstoriaSoil general description of soil at site sandData sheet DOGAMI data sheet reference
Clat_riv#
<county>_fac_l
42

ft_elevation_ 5ft_to_shore 1000ft_to_wat feet to water 125
nearest_wa nearest water body Lewis and Clark Riverslope_roug rough slope estimate slopinggeography general area description dense commercialat_risk with tsunami risk as per DOGAMI yes
amplification Poly#Area area of individual polygons 85729.024Perimeter perimeter of individual polygons 1675 .264Rehz relative hazard weighting scale? 0Ubc_1 Uniform Building Code amplification class 2
rel_eq_haz Poly#area area of polygon (international square feet) 1984.364
perimeter perimeter of polygon (international feet) 555.461Lower sqare root of sum of squares of each factor; lower limit 1.16
Upper sqare root of sum of squares of each factor; upper limit 3.51Zone Hazard zone (4+ = A, 3 = B, 2 = C, 1= D) B
Landslide_haz Poly#Hazcat Hazard Category (1-3) 1.5Lower lower level of slope 5
Upper upper level slope 25area area of polygon (international square feet) 18465.233
perimeter perimeter of polygon (international feet) 5654 .232
slope_type slope steepness classification (low, med, high) M
liquefact_haz Poly#area area of polygon (international square feet) 44884.233perimeter perimeter of polygon (international feet) 454 .226
lique_pot liquefaction potential I-!
43

Namefield4 number classification (1-3) from lique_pot 3
sb379_<county>Fnode# starting point number for line segment 55Tnode# ending point number for line segment 56lpoly# left polygon number 1
rpoly# right polygon number 1
inundation_bound above or upper limit category for inundation upper limitlength length (international feet?) 115.231
IMS<number>area area of polygon 44564.223perimeter perimeter of polygon 884.34 7Zone inundation risk zone - low,moderate, high, extreme low
<county>_geoarea area of polygon 4496.88 1perimeter perimeter of polygon 11354.236Ptype geologic classification QalClat_geo# identifier 2
<county>_soilsarea area of polygon 44698.254perimeter perimeter of polygon 1459.114Stssaid State/County identification 0R007Musym Soil classification symbol 15
Muname Soil classification name Dune-LandMuid County and symbol classification 00715
<county>_afalD_ Identifierarpt_id Airport Identifier 363name Facility Name Karpens
sb379_<county>_id
Warrenton_final#
Newgeoii
0r007_a_id

czcounty>_cfa
city Citystate Stateowner Facility Ownerphone Telephone NumberCLASSs Analysis Classfunction Function of Facilityelevat Elevation of Facility (ft)Lat Latitude of Facilitylong Longitude of Facilitygeores Geocoding Results Codecounty County FIPS Codecomment Misc. CommentsID (HAZUS Internal ID)
name Namecity Citystate Stateclass Hazus analysis classfunction function of facilitylat latitudelong longitudegeores Geocoding Results Codecounty FIPS codeid hazus internal identifier
AstoriaORprivate503-325-1151A TBU 1
airport13046.162500-123.643889NG410071 Portway, Astoria, OROR0000 14
IDUSCG Station, Warrenton, ORWarrentonORCBW1Weather46.15-123.883333NG410070R000366
45

APPENDIX III. Proposal for Future Work
DEVELOPING GIS-BASED EARTHQUAKE-TSUNAMI EVACUATION RESPONSE
FOR OREGON COASTAL COMMUNITIES
ABSTRACTTsunamis pose as a major threat to Oregon's coastal communities. Tsunamis
from a Cascadia subduction earthquake will create more complex response issues thanhistorical far-source events. Coseismic landslides, liquefaction, intense ground shakingand hazardous material release from a CSZ event will complicate current evacuationplans along the Oregon coast. In addition, the lack of consistent evacuation informationto the public and the local governments will create confusion when the CSZ eventoccurs. The importance of a reproducible and consistent evacuation planning methodfor subduction zone communities has national and worldwide implications. Theproposed research will create a consistent methodology that encompasses coseismichazards for tsunami evacuation on the Oregon coast.
GOALS AND OBJECTIVES
The principle goal of this project is to create a GIS-based tsunami evacuation
methodology for Oregon coastal communities. The results of the project will serve as a
worldwide tsunami evacuation model for communities susceptible to subduction zone
earthquakes. The model will have national implications for natural hazard evacuation in
other coastal zones, namely Hawaii, Alaska, California and the southeastern states. To
accomplish this, previous work will be extended to include the following objectives:
1. Review previous approaches to planning to identify systematic and reproduciblemethods for earthquake hazard modeling.
2. Secondary hazard layers will be created for the entire coast. These include:Relative liquefaction hazardRelative landslide hazardHazardous materials release
3. Develop a methodology that incorporates modern science, GIS, and localplanning entities to establish evacuation routes and priorities based on uniquelocal needs.
4. Training workshops will be held and a methodology handbook will be created toassist local decision makers in their planning process and to support the use ofthe Catastrophic Hazard GIS.
BACKGROUND
The Oregon Coast Hazard Setting
Earthquakes and tsunamis represent significant hazards to Oregon's coastal
communities. Earthquakes can have three main classifications in this region: crustal
earthquakes on the North American Plate, crustal earthquakes on the Juan de Fuca
plate, and subduction earthquakes where the two plates interface (Madin 1992). Major
crustal earthquakes are not very common. The last recorded event on the North
American plate was the Port Orford quake of 1863, and the 1991 quake west of
Brookings on the Juan de Fuca plate (Madin 1992).
Once thought inactive, scientists have found that the Cascadia subduction zone
(CSZ) may generate earthquakes with magnitudes surpassing 8.0 on the Richter scale
(Heaton and Hartzel, 1987 and Atwater 1995). Although not very common, these events
are extremely large (MW 8-9) and can generate major tsunamis. Numerous scientists
have predicted CSZ earthquake recurrence intervals of 300 1000 years (Darienzo and
Peterson 1990) and 700 1300 years (Clague 1997), with an average recurrence of 450
+1- 150 years (Geomatrix 1995). These longs intervals have brought a false sense of
security to coastal communities who have no record of subsidence events. However, an
event of this magnitude would cause widespread physical, social, and economic
damage. Similar earthquakes have occurred in Alaska (1964) and Chile (1960) and
have a 10% chance of occurring in the next 50 years in the Pacific Northwest.
Cascadia subduction zone events pose a major threat to life and property
because, not only is tremendous shaking involved, but these events can generate large
tsunamis as well as liquefaction and landslides. Liquefaction is the act of soils taking on

a liquid form. Buildings, roads and other infrastructure can loose a solid footing and be
destroyed in such instances (Madin 1999). Coseismic landslides may also occur during
a major earthquake. The steep slopes of the Coast Range combined with saturated
soils may fail and create a significant hazard during an earthquake. The most recent
example was in the 2001 El Salvador earthquake, where a coseismic landslide covered
approximately 500 homes.
The close proximity of the Cascadia subduction zone (approximately 60 miles off
shore) allows tsunamis to arrive soon after an earthquake. Tsunamis generated from
Cascadia subduction earthquakes will reach the coast within 30 minutes (Priest et al
1997) at an open ocean travel time of approximately 500 miles per hour. These
coseismic tsunamis may reach wave heights of 30 feet (Madin 1999).
Earthquakes from the Pacific Rim can generate trans-ocean tsunamis as well.
These tsunamis are more frequent and although, not as big as the predicted CSZ event,
can cause severe damage. The 1964 Alaska earthquake generated a 10-foot tsunami
that caused one fatality in Cannon Beach, Oregon and 10 fatalities in Crescent City,
California (NOAA et al, 2000). The National Oceanic and Atmospheric Association has
strategically placed buoys in the Pacific Ocean to give warning of oncoming tsunami
waves. These warning signals are tied in with a tsunami warning system for local
coastal communities. This warning system is effective for far-source tsunamis only.
Thus, both near-source and far-source tsunamis put coastal communities at risk of
severe damage, especially since they have developed in low-lying areas.
The Oregon coast has experienced large population growth in its central and
northern portion as well as a lack of experience with major seismic events. The gain in
population has led to larger and denser communities, which are more susceptible to
damage in earthquakes and tsunamis (Mileti 1999). In addition, the rugged geography

of the Coast Range limits development to the coastal boundaries, leaving more
population in tsunami zones.
Preparation for tsunamis is in progress (Wang 1997). Tsunami evacuation
planning is a priority because it is the only survival strategy for people inside of
inundation zones (NOAA 2000). Although communities are preparing plans for
evacuation, no specific methodology is being used (Gomez 2001), resulting in a question
of evacuation plan feasibility.
Tsunami Evacuation Decision-Making in Oregon
Oregon has four main contributors to tsunami evacuation planning. They include
Oregon Emergency Management (OEM), the Department of Geology and Mineral
Industries (DOGAMI), the Department of Land Conservation and Development (DLCD),
and the local communities. OEM directs and coordinates emergency response and
planning between the different agencies. DOGAMI has three major responsibilities.
These are hazard identification, hazard mitigation, and hazard awareness. DLCD has
been concerned with the future development and land use practices in hazardous areas
(Wang 1997).
The local communities are the fourth participants in evacuation planning. Local
officials include county emergency managers, police chiefs, fire chiefs, and community
planners. In some cases the emergency planners take sole responsibility of the
evacuation plan, while in other communities, some or all officials mentioned above are
involved. In all cases, the local community provides invaluable information in the
formation of the community's plan.
CURRENT EVACUATION METHODOLOGY
No systematic methodology has been used in tsunami evacuation planning in
Oregon. Methodologies for hazard evacuation exist mainly in Hawaii, Japan, and the
southeastern United States. The southeast has experience with hurricane evacuation.
E1J

Hurricane evacuation usually has approximately 5 to 6 hours of evacuation time for
millions of people. Oregon has much less time to evacuate (approximately 15-30
minutes), but has much fewer people to evacuate (Gomez 2001). Therefore, hurricane
methodologies must be explored to asses their applicability to Oregon's situation.
Hawaii and Japan have tsunami evacuation plans implemented. However, these
methodologies are not appropriate for Oregon since the strategies are for distant source
tsunamis only. Oregon lies in a unique setting that combines severe earthquake
hazards with large tsunamis. Functional tsunami evacuation plans must be broad in
scope and include 3 key features: 1) appropriate earthquake/tsunami parameters, 2)
consistent terminology, and 3) both vertical and horizontal evacuation strategies.
Seismic events generate multiple hazards and therefore the need for multiple
parameters in tsunami evacuation planning. However, few parameters are currently
used in the evacuation models for Oregon. These are:
4. Location of people.5. Tsunami Inundation run-up6. Location of bridges
Although these are parameters important, CSZ earthquakes cause other events
hazardous to evacuation (liquefaction, landslide, hazardous materials release, fire).
These 'secondary' parameters must be included in a tsunami evacuation plan for
Oregon.
County level managers are using different terminology for routes and shelters. A
staging area in one county may be called a shelter in another county. Yet in another
county it may be referred to as a casualty collection point. For an efficient response to
be made after a CSZ event, the responders, primarily the National Guard, must know the
terminology for facilities in addition to all possible hazards present. Therefore there
should have consistent terminology among all agencies involved.
50

Currently, Oregon's evacuation plans utilize horizontal evacuation strategies.
Vertical evacuation provides the best means of evacuation in some areas due to the
proximity of the tsunami source and the local geography. Vertical evacuation involves
the use of buildings and structures for climbing out of the tsunami inundation area.
Structures used for evacuation must be engineered to withstand the force of the tsunami
(NOAA 2000). This evacuation type may provide the only reasonable approach for
evacuating some communities.
ROLE OF GEOGRAPHIC INFORMATION SYSTEMS
Geographic information systems provide a means of including complex hazard
analyses. GIS has been used to model relative seismic hazards in selected
communities (DOGAMI 1999) and to conduct seismic impact models (FEMA 1997). GIS
allows the ability to create secondary hazard models and quickly incorporate them into
evacuation plan maps. The ability to identify areas of considerable hazards can greatly
assist local stakeholders and planners in natural hazard planning (Mileti 1999)
The state of Oregon has invested in the Coastal Catastrophic Hazard GIS. This
GIS is compiled from data of federal and state sources for selected areas along the
coast. The GIS includes secondary hazards for selected communities only. Many
communities, including Port Ortord and Gold Beach, as well as other developments
between major municipalities, do not have secondary hazard data. The overall purpose
of this project is to complete the GIS by creating the secondary hazard layers associated
with CSZ events and to create a GIS-based planning methodology for tsunami
evacuation.
CONCLUSION
Evacuation is the best-known survival strategy for tsunamis. Therefore, tsunami
evacuation planning must provide appropriate parameters based on local traits to save
the most lives as possible. Oregon has three main areas to revamp its methodology.
51

First, tsunami evacuation planning in Oregon is done at the local level with no standard
methodology and with little scientific expertise. Second, Current planning emphasizes
tsunami hazards only. Oregon has a unique situation, having severe earthquake
hazards in conjunction with large tsunamis. A standard methodology linking science,
planning, and GIS technology is needed to provide feasible and safe evacuation routes.
Lastly, GIS provides a tool to support decision-making, address the standardization
issue, and provide quick analysis for decision-making and hazard alert. This multiple
hazard approach will be an example for the state of Oregon, the Pacific Northwest, and
around the world.
PROPOSED WORK PROGRAM
This project will be conducted in three tasks: a technical task, a methodology
creation task, and a write-up task. Each task is described below.
Task 1: Data coLLECTION/GIS Stage
Description
Secondary hazard models will be developed systematically for consistent
reproduction using GIS. Coast wide secondary earthquake hazards data to be included
are liquefaction, landslides, and hazardous materials release.
Subtask A. Liquefaction zones will be determined by using a methodology fromDOGAMI (1999).
Subtask B. Relative landslide hazard layers will be created on a model adapted fromC.J. van Westen's (1994) methodology. The parameters are: slope,concavities/convexities, geology, and soil porosity.
Subtask C. Hazardous material sites will be collected into a database from firemarshals on the local and state level, from the Oregon MilitaryDepartment, and by survey.
Work Product1. Coast wide liquefaction hazard GIS coverage2. Coast wide relative landslide hazard GIS coverage3. Coast wide hazardous material database/GIS coverage
Note: All GIS layers will be ArcINFO coverages.
52

Once these layers are built into the CatHazGIS, they will be brought to the local level fortask 2.
Task 2: Methodology and Analysis
Description
Methodology creation phase will consist of a literature review and interviews.
The literature review will focus on tsunami/hazard evacuation methodologies from
around the world including methodologies from Hawaii, Alaska, Japan and the
southeastern United States.
Interviews will be conducted in each county to rank the relative importance of
each earthquake/tsunami parameter in the evacuation planning process. Then the
parameters will be weighted based on their relative importance. These weighted
parameters will provide local input for a statewide methodology for Oregon's unique
needs.
Work Product
1. State wide earthquake/tsunami evacuation planning methodology.
Task 3: Evacuation Planning Manual
Description
Once the methodology is developed, a manual will be written as a reference tool for
local planners. Instructional workshops will be hosted to train local decision makers on
the science, the GIS, and the methodology created in this project.
Work Product
1. CatHazGlS Handbook includingSummaries of the seismic and tsunami hazardsThe guidelines recommended for tsunami evacuation planning.Instructions on the CatHazGlS and a description of the dataincorporated in it.
2. CatHazGIS training workshops for the local communities
53

SCHEDULE AND BUDGET
SCHEDULE
The project will take 2 years (See Figure 1). The first 9 months will focus on the
creation of secondary hazard models. The following 9 months will incorporate
interviews, the analysis, and the creation of the methodology. The last 6 months will
involve the production of the manual and training workshops.
.,'I .r 4 ,:..: .i
TABLE 1. PROPOSED COSTSEXPENSES
Salary ($40/hr)Personnel
Other Expenses
Annual SubTotals
Annual TotalPROJECT TOTAL
Year 1
40,000.00Task 1 (40%) 32,000Task 2 (40%) 8,000Task 3 (20%)
Travel 2,000.00Services & Supplies 2,000.00
SubTotal 4,000.00
Year 2
40,000.00
16,00016,000
2,000.002,000.004,000.00
44000.00 44,000.00Other Services 10% 10%
48,400.00 48,400.00$96,800.00
54

REFERENCES:
Atwater, Brian F. et al. 1995. Summary of Coastal Geologic Evidence for Past GreatEarthquakes at the Cascadia Subduction Zone, Earthquake Spectra, vol. 11, no.1, pp.1 18
Atwater, Brian F. and Hemphill Haley, E., 1997. Recurrence intervals for greatearthquakes of the past 3,500 years at northeastern Willapa Bay, Washington,U.S. Geological Survey Professional Paper, 1576.
Clague, John J., 1997. Evidence for large earthquakes at the Cascadia SubductionZone, Reviews of Geophysics, vol. 35, no. 4, pp. 439-460.
Darienzo, Mark and Peterson, Curt, 1990. Episodic Tectonic Subsidence of LateHolocene Salt Marshes, Northern Oregon Central Cascadia Margin, Tectonics,vol.9, no.1, pp.1 22.
Federal Emergency Management Agency (FEMA), 1997, Project impact: building adisaster resistant community, Government Printing Office, Washington,D.C.
Gomez, Kyle R., 2001. Developing a Geographic Information System to supportTsunami evacuation planning on the Oregon Coast. Unfinished M.S. ResearchProject. Department of Geosciences, Oregon State University, Corvallis.
Heaton, T.H., and Hartzel, S.H., 1987, Earthquake hazards on the Cascadia subductionzone., Nature, 236:162-168.
Madin, lan, 1992. Seismic Hazards on the Oregon Coast from Coastal Natural Hazards:Science, Engineering and Public Policy, James W. Good and Sandra S.Ridlington eds., Oregon Sea Grant, Oregon State University Press.
Madin, Ian and Wang, Zhenming, 1999. Relative Earthquake Hazard Maps for SelectedUrban Areas in Western Oregon, Interpretive Map Series IMS 10, Departmentof Geology and Mineral Industries.
Mileti, D.S. 1999. Disasters by Design, A Reassessment of Natural Hazards in theUnited States. Washington D.C.: Joseph Henry Press.
Nelson, Alan A., Atwater, Brian F., Bobrowsky, Peter T., Bradley, Lee-Ann, Clague, JohnJ., Carver, Gary A., Darienzo, Mark E., Grant, Wendy C., Krueger, Harold W.,Sparks, Rodger, Stafford, Thomas W., Stuiver, Jr. and Minze, 1995.Radiocarbon Evidence for extensive plat-boundary rupture about 300 years agoat the Cascadia subduction zone, Nature, vol. 378: 371.
NOAA et at, 2000. Designing for Tsunamis: Seven Principles for Planning andDesigning for Tsunami Hazards. Draft Version. National Tsunami HazardMitigation Program.
55

Priest, George R. Myers, Edward, Baptista, Antonio, Fleuck, Paul, Wang, Kelin,Kamphaus, Robert, Peterson, Curt D., 1997. Cascadia Subduction ZoneTsunamis: Hazard Mapping at Yaquina Bay, Oregon, Open-File Report 0-97-34,Department of Geology and Mineral Industries, Portland, Oregon.
Priest, George R. 2000. Personal Communication. Department of Geology and MineralIndustries, Newport, Oregon.
Wang, Y., 1997, Preparing for earthquakes in Oregon, Oregon Geology, vol. 59, no. 2.,pp. 27-39.
Yamaguchi, David K., Atwater, Brian F., Bunker, Daniel E., Benson, Boyd E., Reid,Marion S., 1997. Tree-Ring dating the 1700 Cascadia Earthquake, Nature, vol.389: 922-923.
56