developing a gdot pavement marking handbook using …
TRANSCRIPT
GEORGIA DOT RESEARCH PROJECT 12-31
FINAL REPORT
DEVELOPING A GDOT PAVEMENT MARKING HANDBOOK USING FIELD TEST DECK EVALUATION AND LONG-TERM
PERFORMANCE ANALYSIS
OFFICE OF RESEARCH 15 KENNDY DRIVE
FOREST PARK, GA 30297-2534

Contract Research
GDOT Research Project No. 12-31 Final Report
DEVELOPING A GDOT PAVEMENT MARKING HANDBOOK USING FIELD TEST DECK EVALUATION AND LONG-TERM PERFORMANCE ANALYSIS
By Yichang (James) Tsai, Ph.D., P.E.
Zhaohua Wang, Ph.D., P.E. Chieh (Ross) Wang
Georgia Institute of Technology
Contract with Georgia Department of Transportation
In cooperation with U.S. Department of Transportation
Federal Highway Administration December, 2015
The contents of this report reflect the views of the author(s) who is (are) responsible for the facts and the accuracy of the data presented herein. The contents do not necessarily reflect the official views or policies of the Georgia Department of Transportation or of the Federal Highway Administration. This report does not constitute a standard, specification, or regulation.

1.Report No.:
GA-15-1231
2. Government Accession
No.:
3. Recipient's Catalog No.:
4. Title and Subtitle:
Developing a GDOT Pavement Marking Handbook
Using Field Test Deck Evaluation and Long-term
Performance Analysis
5. Report Date: December 2015
6. Performing Organization Code:
7. Author(s): Yichang (James) Tsai; Zhaohua Wang;
Chieh (Ross) Wang 8. Performing Organ. Report No.: RP 12-31
9. Performing Organization Name and Address:
Georgia Institute of Technology
790 Atlantic Drive
Atlanta, GA 30332-0355
10. Work Unit No.:
11. Contract or Grant No.:
0011761
12. Sponsoring Agency Name and Address:
Georgia Department of Transportation
Office of Research
15 Kennedy Drive
Forest Park, GA 30297-2534
13. Type of Report and Period Covered:
Final; December 2012 – December 2015
14. Sponsoring Agency Code:
15. Supplementary Notes:
Prepared in cooperation with the U.S. Department of Transportation, Federal Highway Administration.
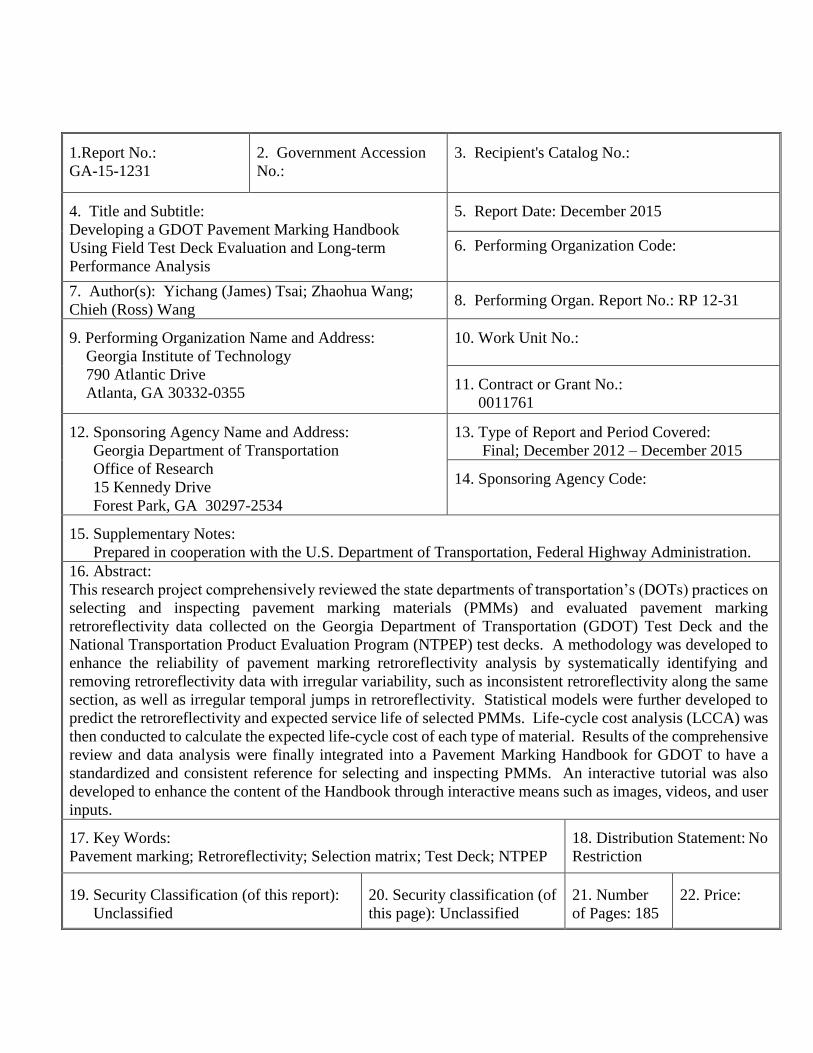
16. Abstract:
This research project comprehensively reviewed the state departments of transportation’s (DOTs) practices on
selecting and inspecting pavement marking materials (PMMs) and evaluated pavement marking
retroreflectivity data collected on the Georgia Department of Transportation (GDOT) Test Deck and the
National Transportation Product Evaluation Program (NTPEP) test decks. A methodology was developed to
enhance the reliability of pavement marking retroreflectivity analysis by systematically identifying and
removing retroreflectivity data with irregular variability, such as inconsistent retroreflectivity along the same
section, as well as irregular temporal jumps in retroreflectivity. Statistical models were further developed to
predict the retroreflectivity and expected service life of selected PMMs. Life-cycle cost analysis (LCCA) was
then conducted to calculate the expected life-cycle cost of each type of material. Results of the comprehensive
review and data analysis were finally integrated into a Pavement Marking Handbook for GDOT to have a
standardized and consistent reference for selecting and inspecting PMMs. An interactive tutorial was also
developed to enhance the content of the Handbook through interactive means such as images, videos, and user
inputs.
17. Key Words:
Pavement marking; Retroreflectivity; Selection matrix; Test Deck; NTPEP
18. Distribution Statement: No
Restriction
19. Security Classification (of this report):
Unclassified
20. Security classification (of
this page): Unclassified
21. Number
of Pages: 185
22. Price:


ii
TABLE OF CONTENTS
Table of Contents ............................................................................................................................ ii
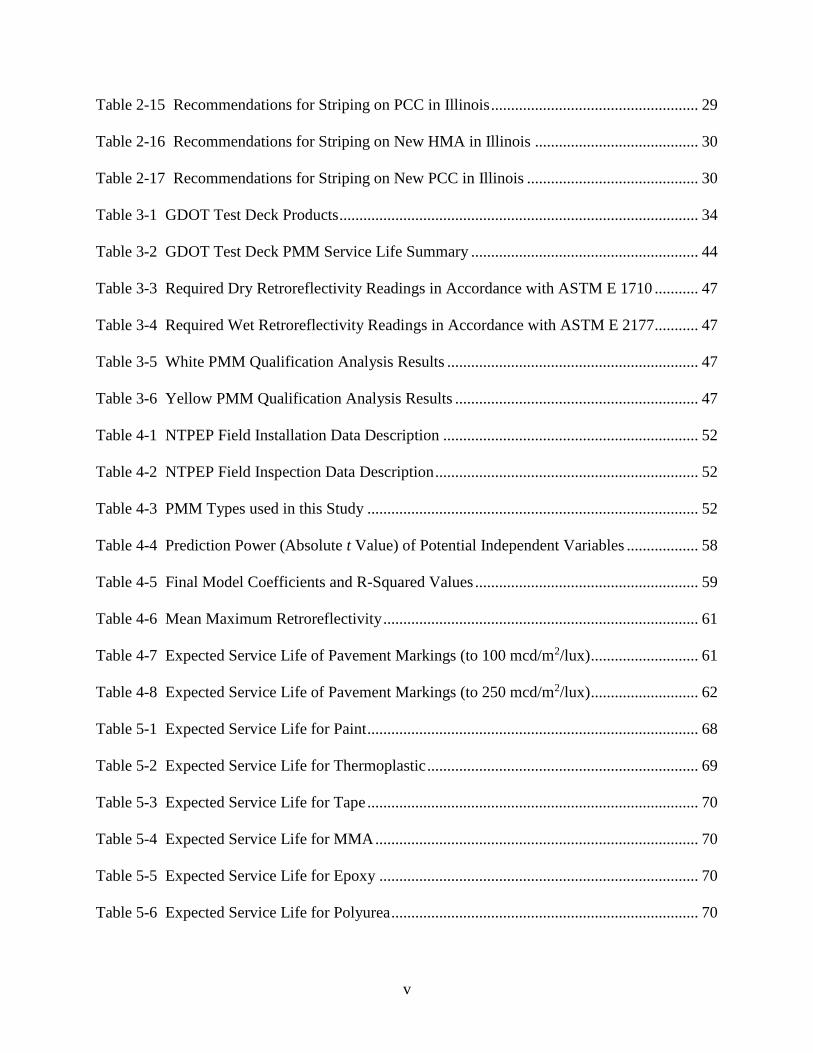
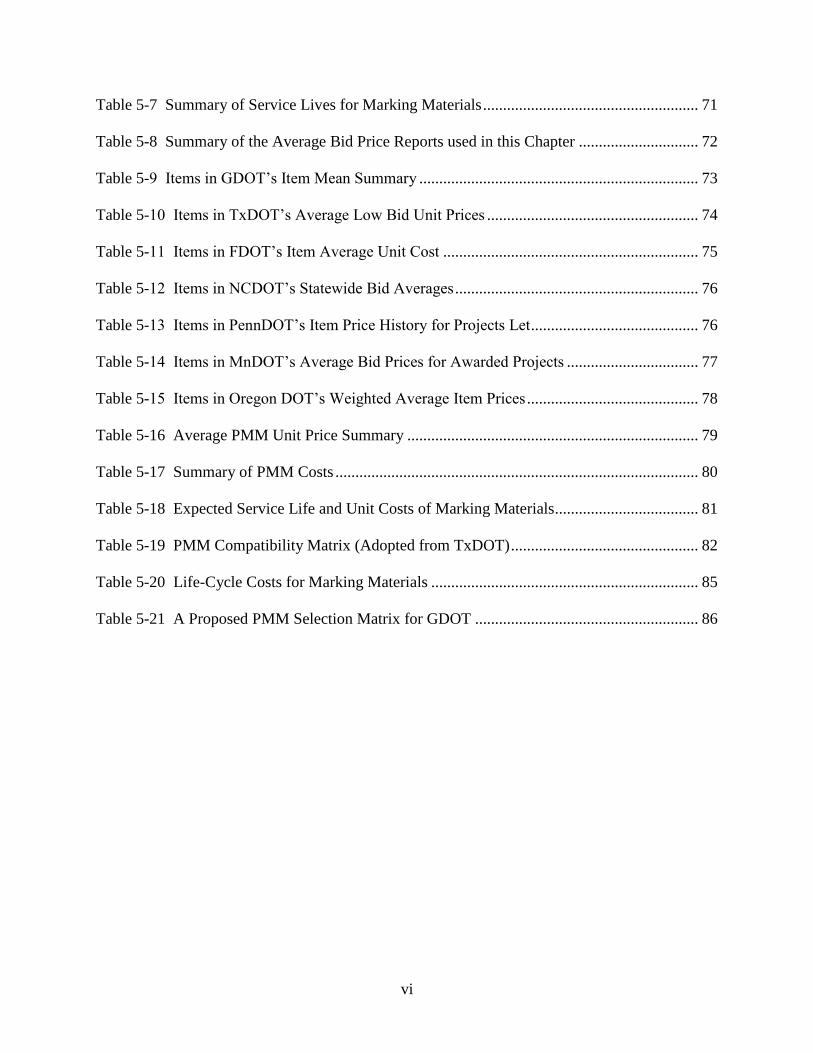
List of Tables ................................................................................................................................. iv
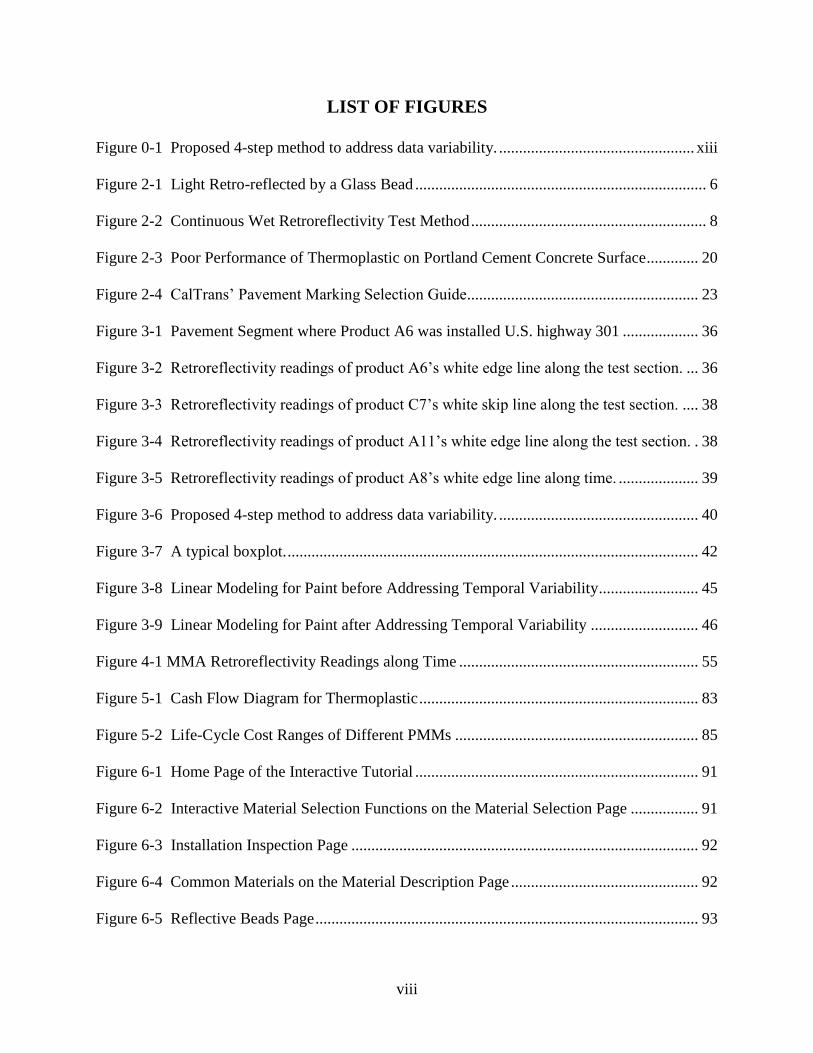
List of Figures .............................................................................................................................. viii
Acknowledgments........................................................................................................................... x
Executive Summary ...................................................................................................................... xii
1. Introduction ............................................................................................................................. 1
2. Literature Review of Current Practices ................................................................................... 5
3. Analysis of GDOT Test Deck Data ...................................................................................... 33
4. Analysis of National Transportation Product Evaluation Program Data .............................. 51
5. Cost-Effective Pavement Marking Material Selection ......................................................... 67
6. Development of GDOT Pavement Marking Handbook and Interactive Tutorial ................. 89
7. Conclusions and Recommendations ..................................................................................... 95
References ..................................................................................................................................... 99
Appendix I Georgia DOT Pavement Marking Handbook ......................................................... I-1
Appendix II Pavement Marking Tutorial User Manual ......................................................... II-1

iii
iv
LIST OF TABLES
Table 0-1 GDOT Test Deck PMM Service Life Summary ........................................................ xiii
Table 0-2 PMM Types used in this Study .................................................................................. xiv
Table 0-3 Expected Service Life of Pavement Markings (to 100 mcd/m2/lux) ........................... xv
Table 0-4 Expected Service Life of Pavement Markings (to 250 mcd/m2/lux) ......................... xvi
Table 0-5 Expected Service Life and Unit Costs of Marking Materials .................................... xvii
Table 0-6 Life-Cycle Costs for Marking Materials ................................................................... xvii
Table 0-7 A Proposed PMM Selection Matrix for GDOT ....................................................... xviii
Table 2-1 Dry Retroreflectivity Requirements According to ASTM E 1710 Test ........................ 8
Table 2-2 Dry Retroreflectivity Requirements for Intersection Markings and Symbols............... 9
Table 2-3 Wet Retroreflectivity Requirements According to ASTM E 2177 Test ....................... 9
Table 2-4 Recommended Minimum Retroreflectivity Levels (Zwahlen and Schnell 2000) ....... 11
Table 2-5 Recommended Minimum Retroreflectivity Levels (Debaillon et al. 2007) ................ 11
Table 2-6 Proposed MUTCD Minimum Pavement Marking Retroreflectivity Levels (Federal
Highway Administration 2013) .................................................................................................... 11
Table 2-7 Summary of Pavement Marking Degradation Models in the Literature ..................... 15
Table 2-8 GDOT Pavement Marking Selection Matrix ............................................................... 19
Table 2-9 TxDOT Marking Material Selection Guide for Asphalt Concrete Pavements ............ 21
Table 2-10 TxDOT Marking Material Selection Guide for Cement Concrete Pavements .......... 21
Table 2-11 TxDOT Guidelines on Use of Marking Materials by AADT and Surface Type ...... 22
Table 2-12 Kansas Brightness Benefit Factors under Different ADTs and Remaining Lives .... 25
Table 2-13 PMM Selection Matrix of North Dakota ................................................................... 27
Table 2-14 Recommendations for Striping on HMA in Illinois .................................................. 29
v
Table 2-15 Recommendations for Striping on PCC in Illinois .................................................... 29
Table 2-16 Recommendations for Striping on New HMA in Illinois ......................................... 30
Table 2-17 Recommendations for Striping on New PCC in Illinois ........................................... 30
Table 3-1 GDOT Test Deck Products .......................................................................................... 34
Table 3-2 GDOT Test Deck PMM Service Life Summary ......................................................... 44
Table 3-3 Required Dry Retroreflectivity Readings in Accordance with ASTM E 1710 ........... 47
Table 3-4 Required Wet Retroreflectivity Readings in Accordance with ASTM E 2177 ........... 47
Table 3-5 White PMM Qualification Analysis Results ............................................................... 47
Table 3-6 Yellow PMM Qualification Analysis Results ............................................................. 47
Table 4-1 NTPEP Field Installation Data Description ................................................................ 52
Table 4-2 NTPEP Field Inspection Data Description .................................................................. 52
Table 4-3 PMM Types used in this Study ................................................................................... 52
Table 4-4 Prediction Power (Absolute t Value) of Potential Independent Variables .................. 58
Table 4-5 Final Model Coefficients and R-Squared Values ........................................................ 59
Table 4-6 Mean Maximum Retroreflectivity ............................................................................... 61
Table 4-7 Expected Service Life of Pavement Markings (to 100 mcd/m2/lux) ........................... 61
Table 4-8 Expected Service Life of Pavement Markings (to 250 mcd/m2/lux) ........................... 62
Table 5-1 Expected Service Life for Paint ................................................................................... 68
Table 5-2 Expected Service Life for Thermoplastic .................................................................... 69
Table 5-3 Expected Service Life for Tape ................................................................................... 70
Table 5-4 Expected Service Life for MMA ................................................................................. 70
Table 5-5 Expected Service Life for Epoxy ................................................................................ 70
Table 5-6 Expected Service Life for Polyurea ............................................................................. 70
vi
Table 5-7 Summary of Service Lives for Marking Materials ...................................................... 71
Table 5-8 Summary of the Average Bid Price Reports used in this Chapter .............................. 72
Table 5-9 Items in GDOT’s Item Mean Summary ...................................................................... 73
Table 5-10 Items in TxDOT’s Average Low Bid Unit Prices ..................................................... 74
Table 5-11 Items in FDOT’s Item Average Unit Cost ................................................................ 75
Table 5-12 Items in NCDOT’s Statewide Bid Averages ............................................................. 76
Table 5-13 Items in PennDOT’s Item Price History for Projects Let .......................................... 76
Table 5-14 Items in MnDOT’s Average Bid Prices for Awarded Projects ................................. 77
Table 5-15 Items in Oregon DOT’s Weighted Average Item Prices ........................................... 78
Table 5-16 Average PMM Unit Price Summary ......................................................................... 79
Table 5-17 Summary of PMM Costs ........................................................................................... 80
Table 5-18 Expected Service Life and Unit Costs of Marking Materials .................................... 81
Table 5-19 PMM Compatibility Matrix (Adopted from TxDOT) ............................................... 82
Table 5-20 Life-Cycle Costs for Marking Materials ................................................................... 85
Table 5-21 A Proposed PMM Selection Matrix for GDOT ........................................................ 86

vii
viii
LIST OF FIGURES
Figure 0-1 Proposed 4-step method to address data variability. ................................................. xiii
Figure 2-1 Light Retro-reflected by a Glass Bead ......................................................................... 6
Figure 2-2 Continuous Wet Retroreflectivity Test Method ........................................................... 8
Figure 2-3 Poor Performance of Thermoplastic on Portland Cement Concrete Surface ............. 20
Figure 2-4 CalTrans’ Pavement Marking Selection Guide .......................................................... 23
Figure 3-1 Pavement Segment where Product A6 was installed U.S. highway 301 ................... 36
Figure 3-2 Retroreflectivity readings of product A6’s white edge line along the test section. ... 36
Figure 3-3 Retroreflectivity readings of product C7’s white skip line along the test section. .... 38
Figure 3-4 Retroreflectivity readings of product A11’s white edge line along the test section. . 38
Figure 3-5 Retroreflectivity readings of product A8’s white edge line along time. .................... 39
Figure 3-6 Proposed 4-step method to address data variability. .................................................. 40
Figure 3-7 A typical boxplot. ....................................................................................................... 42
Figure 3-8 Linear Modeling for Paint before Addressing Temporal Variability ......................... 45
Figure 3-9 Linear Modeling for Paint after Addressing Temporal Variability ........................... 46
Figure 4-1 MMA Retroreflectivity Readings along Time ............................................................ 55
Figure 5-1 Cash Flow Diagram for Thermoplastic ...................................................................... 83
Figure 5-2 Life-Cycle Cost Ranges of Different PMMs ............................................................. 85
Figure 6-1 Home Page of the Interactive Tutorial ....................................................................... 91
Figure 6-2 Interactive Material Selection Functions on the Material Selection Page ................. 91
Figure 6-3 Installation Inspection Page ....................................................................................... 92
Figure 6-4 Common Materials on the Material Description Page ............................................... 92
Figure 6-5 Reflective Beads Page ................................................................................................ 93

ix

x
ACKNOWLEDGMENTS
The authors would like to thank Mr. Richard Douds, Mr. Binh Bui, Mr. Brad Young, Ms. Pamela
King, and Mr. Brennan Roney of the Georgia Department of Transportation for their valuable
input and assistance. We would also like to thank the National Transportation Product
Evaluation Program for providing data and input, especially the tremendous help from Mr. David
Kuniega, the Chair of NTPEP Pavement Marking Materials Committee, and Ms. Katheryn L.
Malusky, Program Manager of NTPEP. Assistance from Pennsylvania, Florida, and Minnesota
DOTs, is also appreciated. The assistance of Dr. Chengbo Ai, Zachary Lewis, Jinqi Fang, and
Carson Madryga of Georgia Tech is also appreciated.

xi
xii
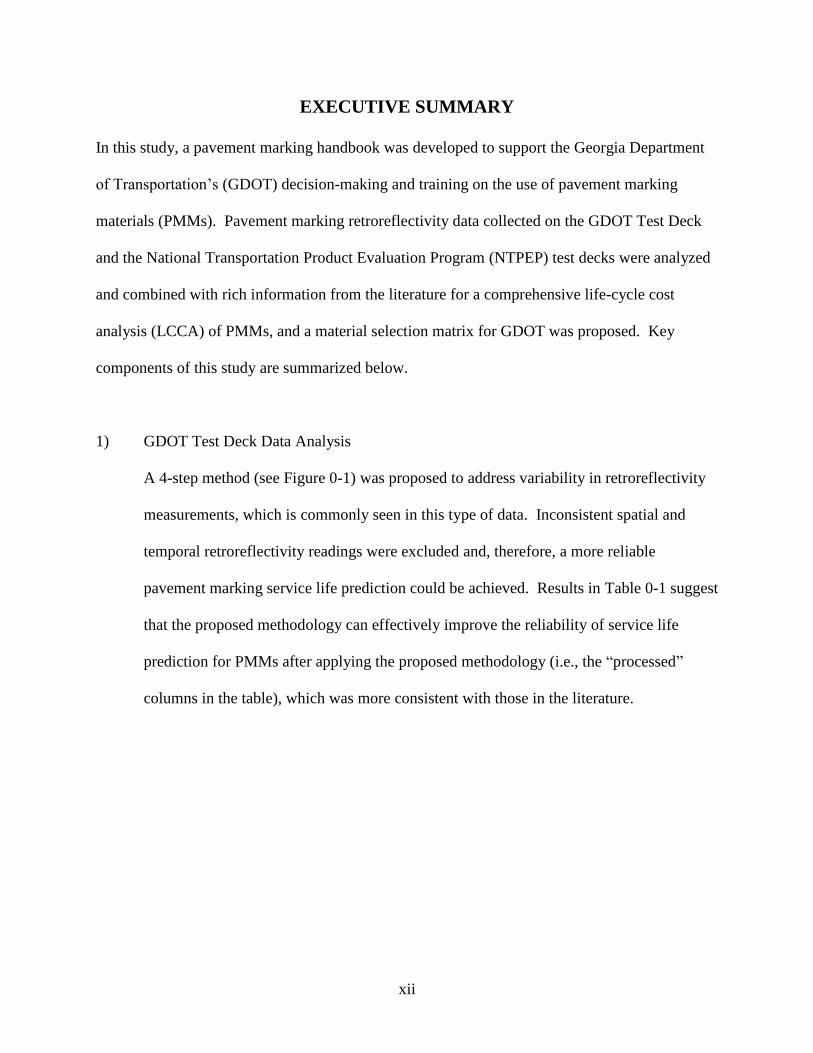
EXECUTIVE SUMMARY
In this study, a pavement marking handbook was developed to support the Georgia Department
of Transportation’s (GDOT) decision-making and training on the use of pavement marking
materials (PMMs). Pavement marking retroreflectivity data collected on the GDOT Test Deck
and the National Transportation Product Evaluation Program (NTPEP) test decks were analyzed
and combined with rich information from the literature for a comprehensive life-cycle cost
analysis (LCCA) of PMMs, and a material selection matrix for GDOT was proposed. Key
components of this study are summarized below.
1) GDOT Test Deck Data Analysis
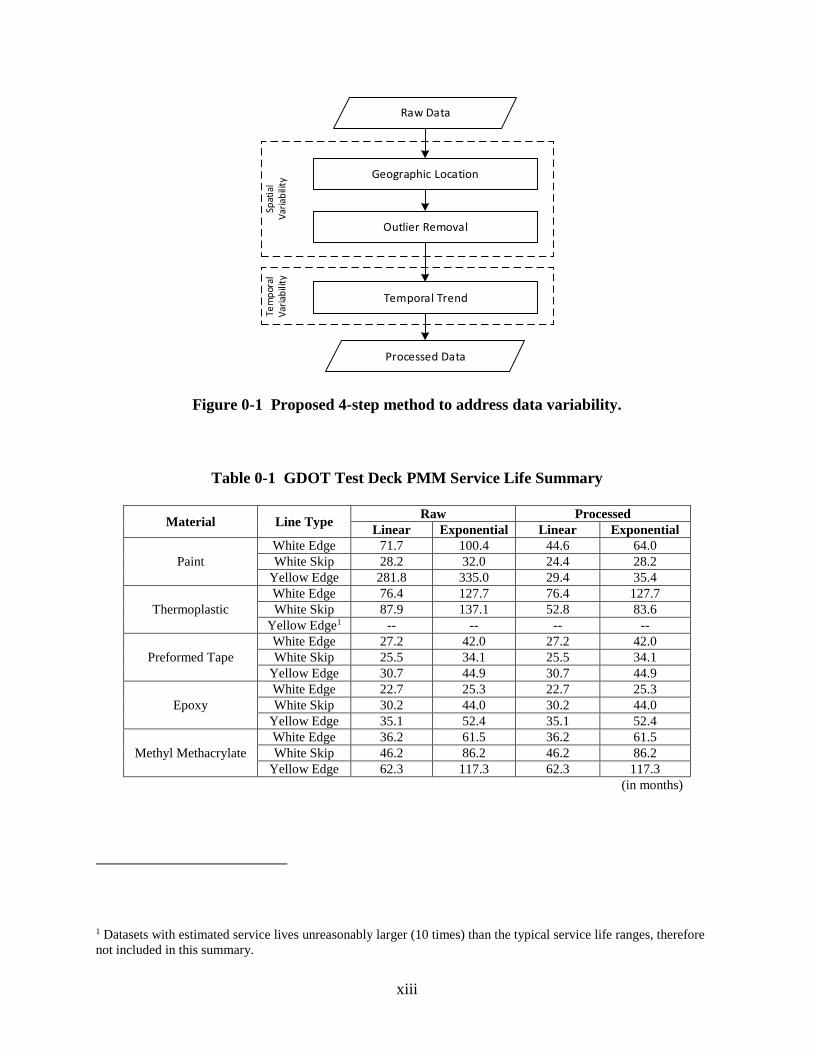
A 4-step method (see Figure 0-1) was proposed to address variability in retroreflectivity
measurements, which is commonly seen in this type of data. Inconsistent spatial and
temporal retroreflectivity readings were excluded and, therefore, a more reliable
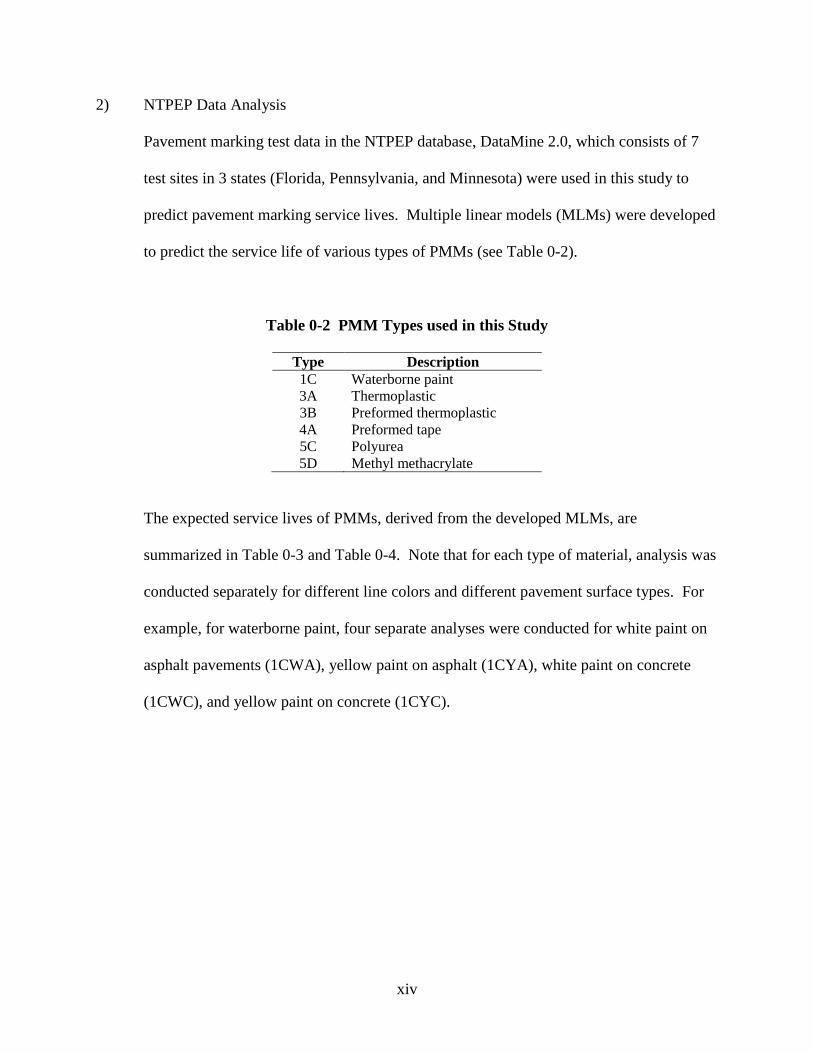
pavement marking service life prediction could be achieved. Results in Table 0-1 suggest
that the proposed methodology can effectively improve the reliability of service life
prediction for PMMs after applying the proposed methodology (i.e., the “processed”
columns in the table), which was more consistent with those in the literature.
xiii
Tem
por
al
Var
iab
ility
Spat
ial
Var
iab
ility
Raw Data
Geographic Location
Outlier Removal
Temporal Trend
Processed Data
Figure 0-1 Proposed 4-step method to address data variability.
Table 0-1 GDOT Test Deck PMM Service Life Summary
Material Line Type Raw Processed
Linear Exponential Linear Exponential
Paint
White Edge 71.7 100.4 44.6 64.0
White Skip 28.2 32.0 24.4 28.2
Yellow Edge 281.8 335.0 29.4 35.4
Thermoplastic
White Edge 76.4 127.7 76.4 127.7
White Skip 87.9 137.1 52.8 83.6
Yellow Edge1 -- -- -- --
Preformed Tape
White Edge 27.2 42.0 27.2 42.0
White Skip 25.5 34.1 25.5 34.1
Yellow Edge 30.7 44.9 30.7 44.9
Epoxy
White Edge 22.7 25.3 22.7 25.3
White Skip 30.2 44.0 30.2 44.0
Yellow Edge 35.1 52.4 35.1 52.4
Methyl Methacrylate
White Edge 36.2 61.5 36.2 61.5
White Skip 46.2 86.2 46.2 86.2
Yellow Edge 62.3 117.3 62.3 117.3
(in months)
1 Datasets with estimated service lives unreasonably larger (10 times) than the typical service life ranges, therefore
not included in this summary.
xiv
2) NTPEP Data Analysis
Pavement marking test data in the NTPEP database, DataMine 2.0, which consists of 7
test sites in 3 states (Florida, Pennsylvania, and Minnesota) were used in this study to
predict pavement marking service lives. Multiple linear models (MLMs) were developed
to predict the service life of various types of PMMs (see Table 0-2).
Table 0-2 PMM Types used in this Study
Type Description
1C Waterborne paint
3A Thermoplastic
3B Preformed thermoplastic
4A Preformed tape
5C Polyurea
5D Methyl methacrylate
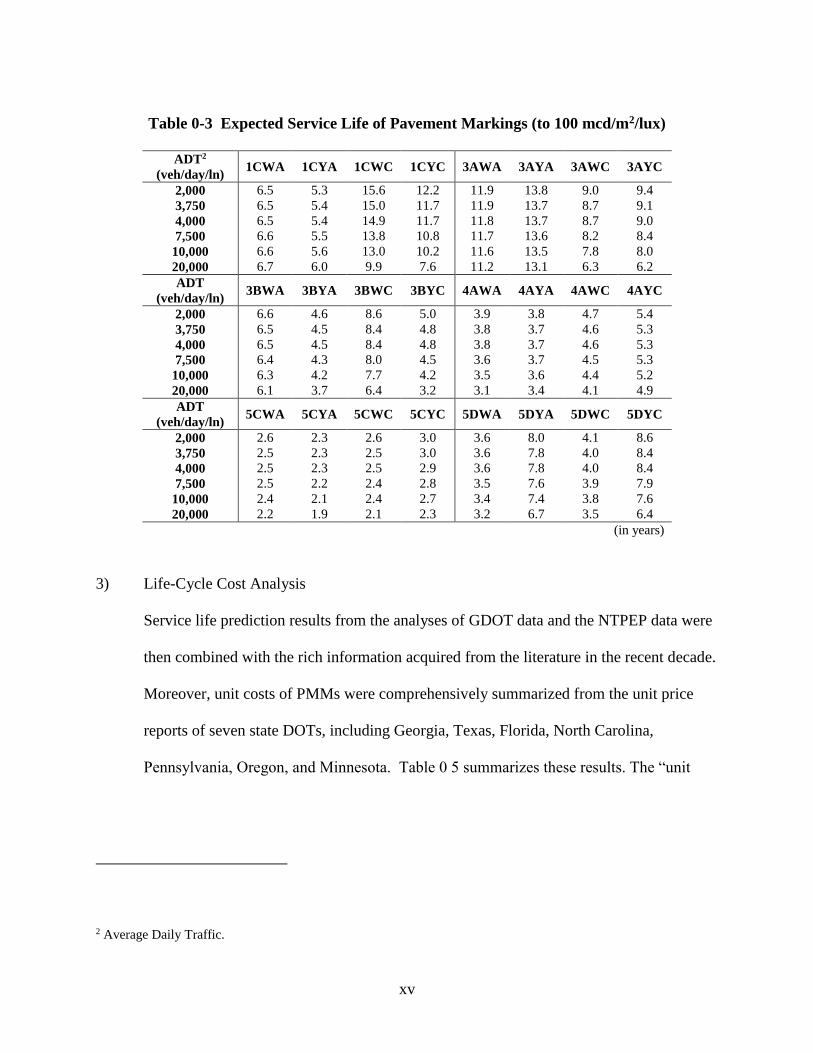
The expected service lives of PMMs, derived from the developed MLMs, are
summarized in Table 0-3 and Table 0-4. Note that for each type of material, analysis was
conducted separately for different line colors and different pavement surface types. For
example, for waterborne paint, four separate analyses were conducted for white paint on
asphalt pavements (1CWA), yellow paint on asphalt (1CYA), white paint on concrete
(1CWC), and yellow paint on concrete (1CYC).
xv
Table 0-3 Expected Service Life of Pavement Markings (to 100 mcd/m2/lux)
ADT2
(veh/day/ln) 1CWA 1CYA 1CWC 1CYC 3AWA 3AYA 3AWC 3AYC
2,000 6.5 5.3 15.6 12.2 11.9 13.8 9.0 9.4
3,750 6.5 5.4 15.0 11.7 11.9 13.7 8.7 9.1
4,000 6.5 5.4 14.9 11.7 11.8 13.7 8.7 9.0
7,500 6.6 5.5 13.8 10.8 11.7 13.6 8.2 8.4
10,000 6.6 5.6 13.0 10.2 11.6 13.5 7.8 8.0
20,000 6.7 6.0 9.9 7.6 11.2 13.1 6.3 6.2
ADT
(veh/day/ln) 3BWA 3BYA 3BWC 3BYC 4AWA 4AYA 4AWC 4AYC
2,000 6.6 4.6 8.6 5.0 3.9 3.8 4.7 5.4
3,750 6.5 4.5 8.4 4.8 3.8 3.7 4.6 5.3
4,000 6.5 4.5 8.4 4.8 3.8 3.7 4.6 5.3
7,500 6.4 4.3 8.0 4.5 3.6 3.7 4.5 5.3
10,000 6.3 4.2 7.7 4.2 3.5 3.6 4.4 5.2
20,000 6.1 3.7 6.4 3.2 3.1 3.4 4.1 4.9
ADT
(veh/day/ln) 5CWA 5CYA 5CWC 5CYC 5DWA 5DYA 5DWC 5DYC
2,000 2.6 2.3 2.6 3.0 3.6 8.0 4.1 8.6
3,750 2.5 2.3 2.5 3.0 3.6 7.8 4.0 8.4
4,000 2.5 2.3 2.5 2.9 3.6 7.8 4.0 8.4
7,500 2.5 2.2 2.4 2.8 3.5 7.6 3.9 7.9
10,000 2.4 2.1 2.4 2.7 3.4 7.4 3.8 7.6
20,000 2.2 1.9 2.1 2.3 3.2 6.7 3.5 6.4
(in years)
3) Life-Cycle Cost Analysis
Service life prediction results from the analyses of GDOT data and the NTPEP data were
then combined with the rich information acquired from the literature in the recent decade.
Moreover, unit costs of PMMs were comprehensively summarized from the unit price
reports of seven state DOTs, including Georgia, Texas, Florida, North Carolina,
Pennsylvania, Oregon, and Minnesota. Table 0 5 summarizes these results. The “unit
2 Average Daily Traffic.
xvi
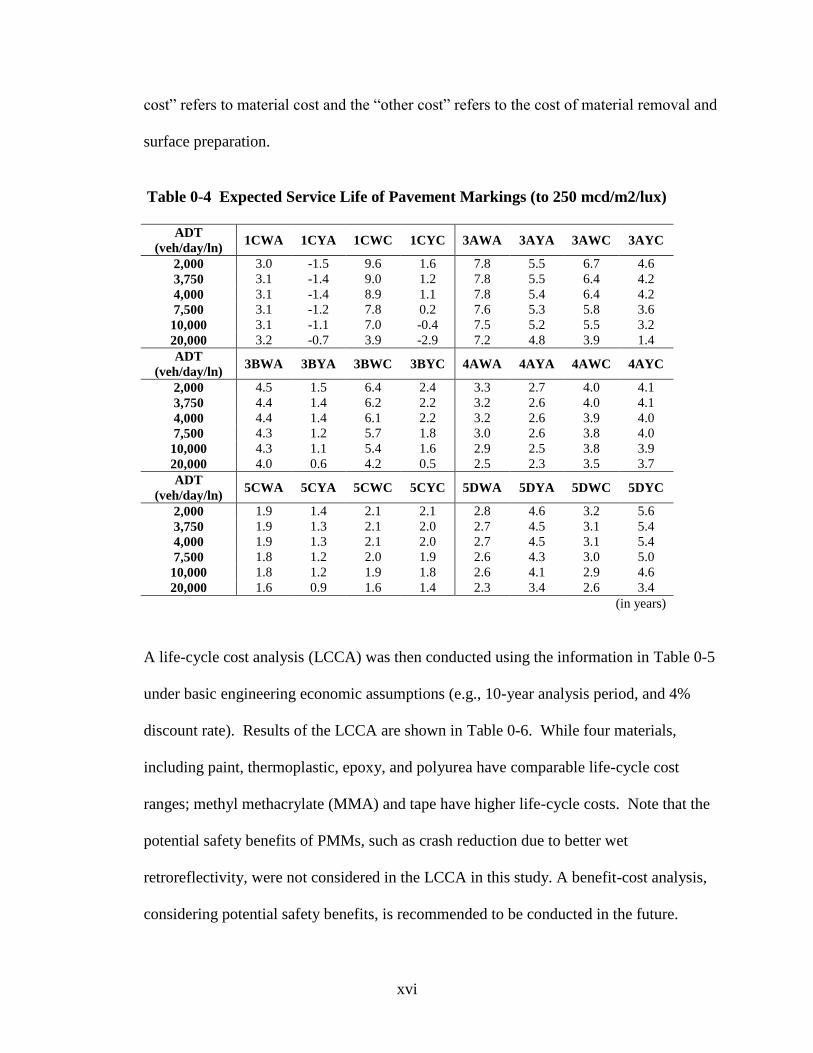
cost” refers to material cost and the “other cost” refers to the cost of material removal and
surface preparation.
Table 0-4 Expected Service Life of Pavement Markings (to 250 mcd/m2/lux)
ADT
(veh/day/ln) 1CWA 1CYA 1CWC 1CYC 3AWA 3AYA 3AWC 3AYC
2,000 3.0 -1.5 9.6 1.6 7.8 5.5 6.7 4.6
3,750 3.1 -1.4 9.0 1.2 7.8 5.5 6.4 4.2
4,000 3.1 -1.4 8.9 1.1 7.8 5.4 6.4 4.2
7,500 3.1 -1.2 7.8 0.2 7.6 5.3 5.8 3.6
10,000 3.1 -1.1 7.0 -0.4 7.5 5.2 5.5 3.2
20,000 3.2 -0.7 3.9 -2.9 7.2 4.8 3.9 1.4
ADT
(veh/day/ln) 3BWA 3BYA 3BWC 3BYC 4AWA 4AYA 4AWC 4AYC
2,000 4.5 1.5 6.4 2.4 3.3 2.7 4.0 4.1
3,750 4.4 1.4 6.2 2.2 3.2 2.6 4.0 4.1
4,000 4.4 1.4 6.1 2.2 3.2 2.6 3.9 4.0
7,500 4.3 1.2 5.7 1.8 3.0 2.6 3.8 4.0
10,000 4.3 1.1 5.4 1.6 2.9 2.5 3.8 3.9
20,000 4.0 0.6 4.2 0.5 2.5 2.3 3.5 3.7
ADT
(veh/day/ln) 5CWA 5CYA 5CWC 5CYC 5DWA 5DYA 5DWC 5DYC
2,000 1.9 1.4 2.1 2.1 2.8 4.6 3.2 5.6
3,750 1.9 1.3 2.1 2.0 2.7 4.5 3.1 5.4
4,000 1.9 1.3 2.1 2.0 2.7 4.5 3.1 5.4
7,500 1.8 1.2 2.0 1.9 2.6 4.3 3.0 5.0
10,000 1.8 1.2 1.9 1.8 2.6 4.1 2.9 4.6
20,000 1.6 0.9 1.6 1.4 2.3 3.4 2.6 3.4
(in years)
A life-cycle cost analysis (LCCA) was then conducted using the information in Table 0-5
under basic engineering economic assumptions (e.g., 10-year analysis period, and 4%
discount rate). Results of the LCCA are shown in Table 0-6. While four materials,
including paint, thermoplastic, epoxy, and polyurea have comparable life-cycle cost
ranges; methyl methacrylate (MMA) and tape have higher life-cycle costs. Note that the
potential safety benefits of PMMs, such as crash reduction due to better wet
retroreflectivity, were not considered in the LCCA in this study. A benefit-cost analysis,
considering potential safety benefits, is recommended to be conducted in the future.
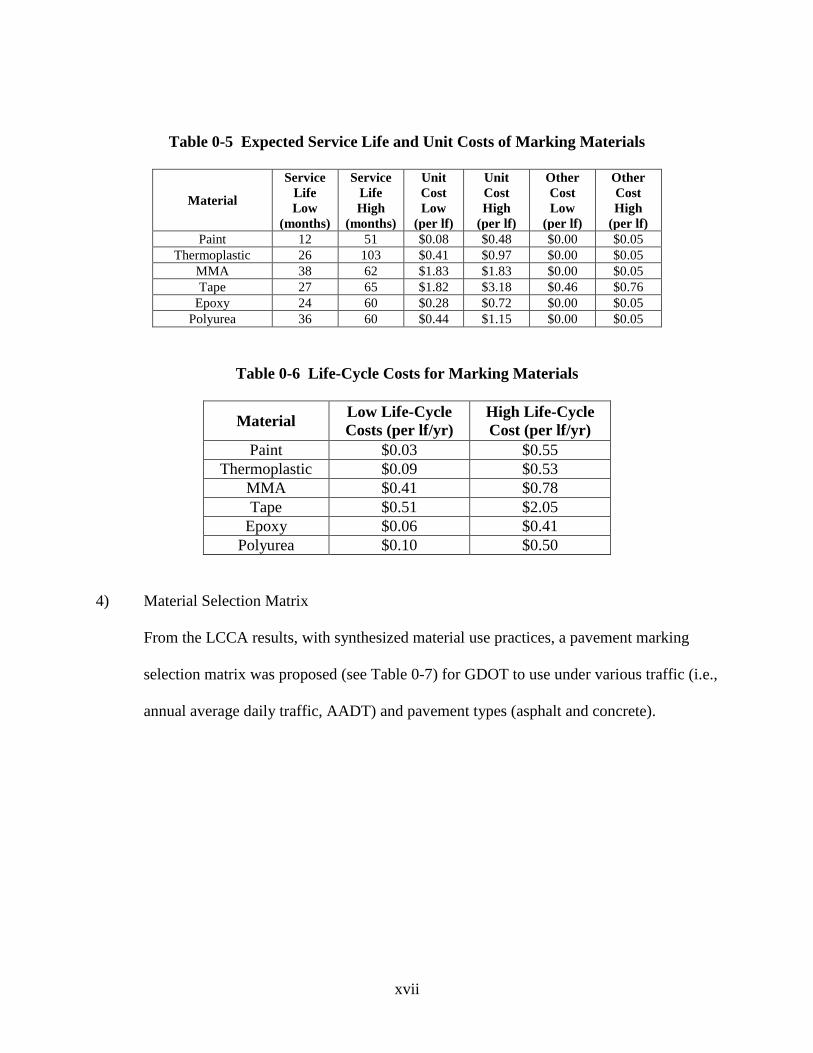
xvii
Table 0-5 Expected Service Life and Unit Costs of Marking Materials
Material
Service
Life
Low
(months)
Service
Life
High
(months)
Unit
Cost
Low
(per lf)
Unit
Cost
High
(per lf)
Other
Cost
Low
(per lf)
Other
Cost
High
(per lf) Paint 12 51 $0.08 $0.48 $0.00 $0.05
Thermoplastic 26 103 $0.41 $0.97 $0.00 $0.05
MMA 38 62 $1.83 $1.83 $0.00 $0.05
Tape 27 65 $1.82 $3.18 $0.46 $0.76
Epoxy 24 60 $0.28 $0.72 $0.00 $0.05
Polyurea 36 60 $0.44 $1.15 $0.00 $0.05
Table 0-6 Life-Cycle Costs for Marking Materials
Material Low Life-Cycle
Costs (per lf/yr)
High Life-Cycle
Cost (per lf/yr)
Paint $0.03 $0.55
Thermoplastic $0.09 $0.53
MMA $0.41 $0.78
Tape $0.51 $2.05
Epoxy $0.06 $0.41
Polyurea $0.10 $0.50
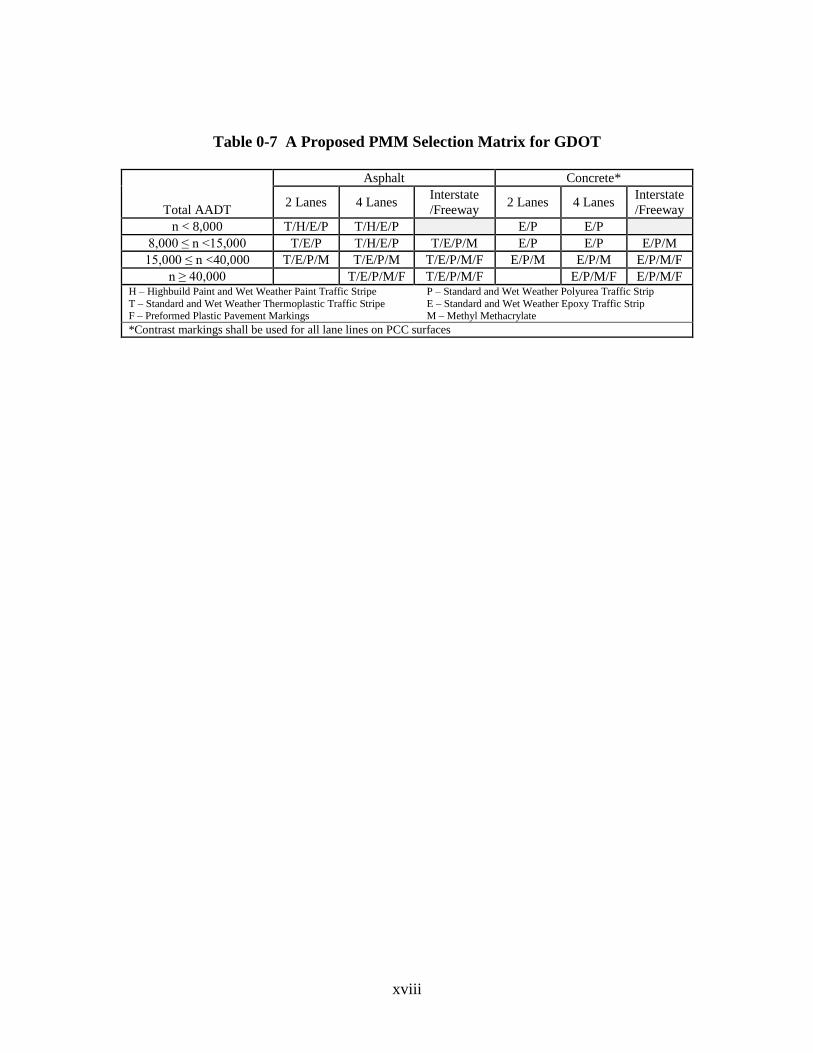
4) Material Selection Matrix
From the LCCA results, with synthesized material use practices, a pavement marking
selection matrix was proposed (see Table 0-7) for GDOT to use under various traffic (i.e.,
annual average daily traffic, AADT) and pavement types (asphalt and concrete).
xviii
Table 0-7 A Proposed PMM Selection Matrix for GDOT
Total AADT
Asphalt Concrete*
2 Lanes 4 Lanes Interstate
/Freeway 2 Lanes 4 Lanes
Interstate
/Freeway
n < 8,000 T/H/E/P T/H/E/P E/P E/P
8,000 ≤ n <15,000 T/E/P T/H/E/P T/E/P/M E/P E/P E/P/M
15,000 ≤ n <40,000 T/E/P/M T/E/P/M T/E/P/M/F E/P/M E/P/M E/P/M/F
n ≥ 40,000 T/E/P/M/F T/E/P/M/F E/P/M/F E/P/M/F H – Highbuild Paint and Wet Weather Paint Traffic Stripe
T – Standard and Wet Weather Thermoplastic Traffic Stripe F – Preformed Plastic Pavement Markings
P – Standard and Wet Weather Polyurea Traffic Strip
E – Standard and Wet Weather Epoxy Traffic Strip M – Methyl Methacrylate
*Contrast markings shall be used for all lane lines on PCC surfaces

xix
1
1. INTRODUCTION
1.1 Research Background and Need
Pavement markings are important traffic control devices that provide navigation and roadway
information to road users for safe travel, especially during nighttime and wet-weather conditions.
It is estimated that, in 2007, approximately $2 billion was spent on pavement markings in the
United States (Carlson et al., 2009). Moreover, approximately $3 million were spent by the
Georgia Department of Transportation (GDOT) on pavement marking installation and
replacement (Georgia Department of Transportation, 2012). Because of current stringent
budgets for highway projects, it is critical for state DOTs to select and use cost-effective
pavement marking materials (PMMs) that provide good visibility during nighttime and wet-
weather conditions.
GDOT has a history of using a wide range of PMMs and have since developed standard
specifications for various PMMs, such as paint, thermoplastic, polyurea, and preformed tape.
However, with the rapid changing and improving PMM industry, many cost-effective and
durable materials have been produced and used in many states. Consequently, in 2010, GDOT’s
Testing Bureau of the Office of Materials and Research (OMR) (now the Office of Materials and
Testing (OMAT)) established the GDOT Test Deck on I-16 and US-301/SR-73 near Statesboro,
Georgia. Around 13 types of pavement markings were installed, and retroreflectivity
measurements were taken 30 days after the installation and every 6 months thereafter.
Retroreflectivity data collected from the GDOT Test Deck can be used to evaluate the
performance of PMMs and set as a foundation for PMM selection practice in Georgia.

2
There is a need to (1) conduct a comprehensive study to evaluate the performance of commonly
used PMMs; (2) summarize the state-of-the-practice of PMM; and, ultimately, (3) develop a
pavement marking handbook that synthesizes the aforementioned information and serves as a
knowledge base for GDOT’s PMM selection and inspection practice.
1.2 Research Objectives and Scope
The objective of this research is to develop a pavement marking handbook by conducting field
test deck evaluations on various PMMs to standardize the PMM selection and inspection. The
handbook will assist both engineering and field personnel in selecting PMMs and inspecting
pavement marking in the field. The following lists the major tasks.
1) Work Task 1: Literature Review
2) Work Task 2: Development of GDOT Pavement Marking Handbook
3) Work Task 3: Analysis of GDOT Test Deck Data
4) Work Task 4: Cost-Effectiveness Analysis of Selected PMMs
5) Work Task 5: Summarize Research Findings and Develop a Final Report
1.3 Organization of This Report
This report is organized as follows:
1) Chapter 1 introduces the background, research need, objectives, and work tasks of this
research project.
2) Chapter 2 presents a review of up-to-date GDOT and other state DOTs’ PMM selection
criteria, as well as installation/inspection practices.

3
3) Chapter 3 presents the analysis of GDOT Test Deck data.
4) Chapter 4 presents the analysis of NTPEP test decks data
5) Chapter 5 presents a LCCA of selected PMMs.
6) Chapter 6 present the design and development of the handbook and the interactive
tutorial.
7) Chapter 7 concludes the research and provides recommendations for further research.

4
5
2. LITERATURE REVIEW OF CURRENT PRACTICES
In this chapter, a comprehensive literature review is conducted to summarize the current
practices that researchers and transportation agencies have used to inspect the performance of
pavement markings, predict service lives of different PMMs, and select cost-effective materials
under different traffic and roadway characteristics. The first section summarizes the standard
measurement and practices for pavement marking condition inspection with a focus on pavement
marking retroreflectivity. The second section summarizes pavement marking retroreflectivity
degradation models that have been established in the literature to predict service lives of different
PMMs. The third section summarizes current transportation agencies’ PMM selection practices,
which have been developed on the basis of the LCCA results, as well as the engineering
experiences and decisions. Finally, the fourth section summarizes the review and identifies
research needs.
2.1 Pavement Marking Condition Inspection Practices
Transportation agencies have developed various standard specifications for PMMs. These
specifications require products to have specific composition (including binder and beads), color,
physical properties (e.g., skid resistance), and chemical properties (e.g., drying time and
installation temperature) for installation. After installation, the conditions of pavement markings
need to be evaluated to ensure they serve their purpose, which is to provide delineation to road
users. If markings fail to serve the purpose due to the lack of visibility or if markings are
excessively worn out, they should be removed and/or replaced. Retroreflectivity and durability
are two commonly used measures for quantitatively and qualitatively evaluating pavement
marking conditions. In this section, we focus on the review of methods and standard practices
6
for measuring retroreflectivity of pavement markings after installation, which is the most used
quantitative measure for pavement marking performance.
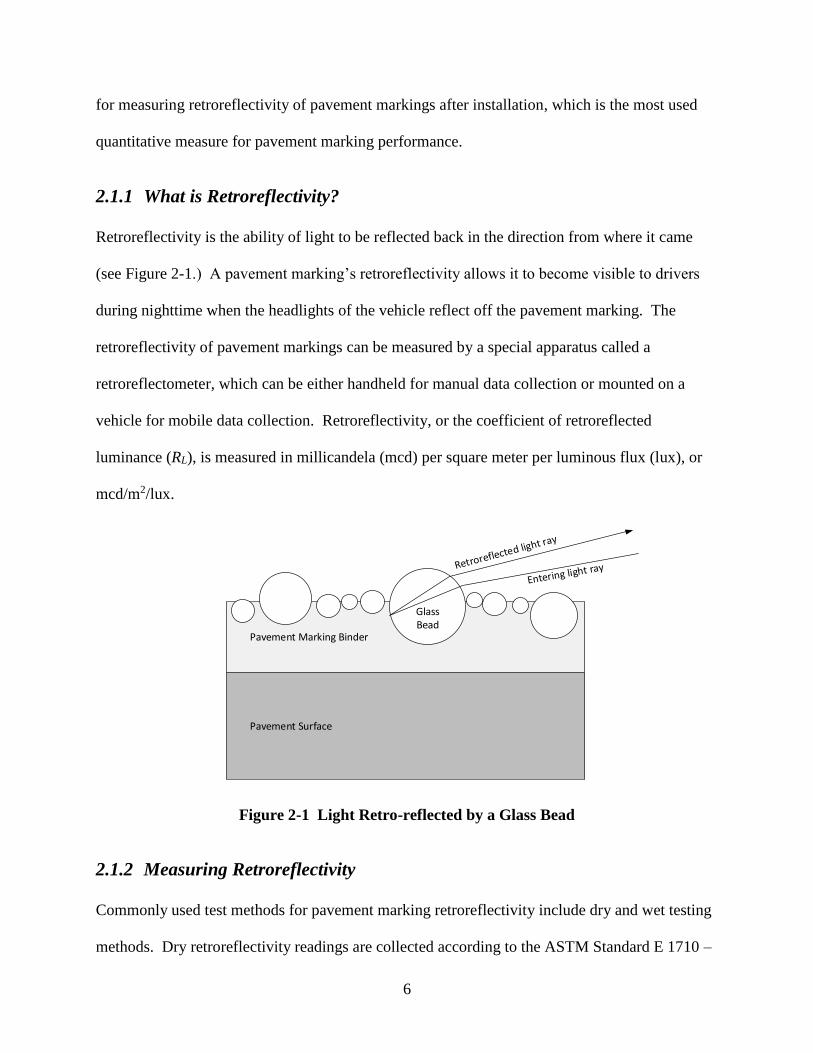
2.1.1 What is Retroreflectivity?
Retroreflectivity is the ability of light to be reflected back in the direction from where it came
(see Figure 2-1.) A pavement marking’s retroreflectivity allows it to become visible to drivers
during nighttime when the headlights of the vehicle reflect off the pavement marking. The
retroreflectivity of pavement markings can be measured by a special apparatus called a
retroreflectometer, which can be either handheld for manual data collection or mounted on a
vehicle for mobile data collection. Retroreflectivity, or the coefficient of retroreflected
luminance (RL), is measured in millicandela (mcd) per square meter per luminous flux (lux), or
mcd/m2/lux.
Pavement Marking Binder
GlassBead
Pavement Surface
Figure 2-1 Light Retro-reflected by a Glass Bead
2.1.2 Measuring Retroreflectivity
Commonly used test methods for pavement marking retroreflectivity include dry and wet testing
methods. Dry retroreflectivity readings are collected according to the ASTM Standard E 1710 –

7
standard test method for measurement of retroreflective PMMs (ASTM International 2008),
which specifies the requirements for conducting dry retroreflectivity test. Wet retroreflectivity
readings are commonly collected according to the ASTM Standard E 2177, the standard test
method for measuring the coefficient of retroreflected luminance of pavement markings in a
standard condition of wetness. To measure retroreflectivity according to the ASTM standard, it
needs to slowly and evenly pour a bucket of 2 to 5 liters of water to the test area, and then,
measure the retroreflectivity 45 seconds after the completion of pouring the water (ASTM
International, 2011). Both ASTM standards require the measurement geometry of the measuring
instrument to be at a viewing distance of 30 meters, a headlight mounting height of 0.65 meter
and an eye height of 1.2 meter, which is equivalent to an observation angle of 1.05 ± 0.02
between the light source and receiver of the instrument.
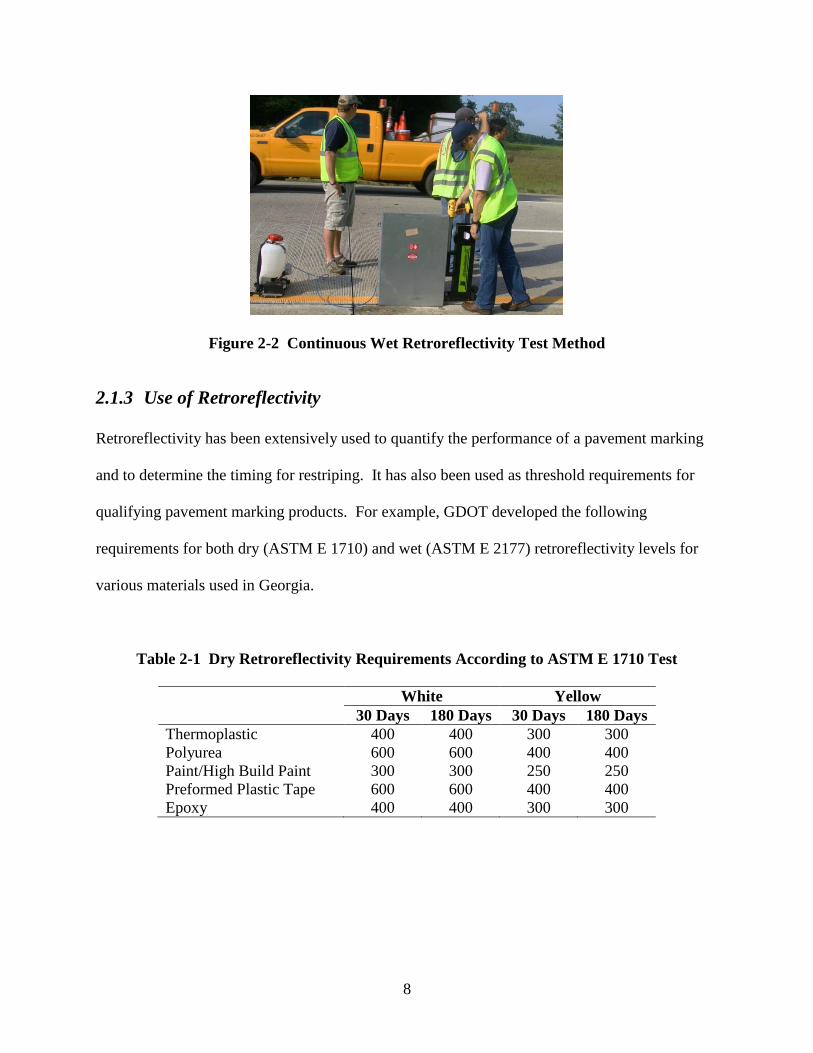
Another method that has been used to test pavement marking retroreflectivity under wet
condition is the continuous wet method. ASTM Standard E 2832 (ASTM International, 2012a)
depicts the standard test method for measuring the coefficient of retroreflected luminance of
pavement markings in a standard condition of continuous wet (RL-2). As shown in Figure 2-2,
the continuous wet test is carried out by covering the test area with a box that sprays water to
simulate a raining condition. Although this method may be very close to real raining conditions,
it is tedious and time-consuming, and its use has been limited.
8
Figure 2-2 Continuous Wet Retroreflectivity Test Method
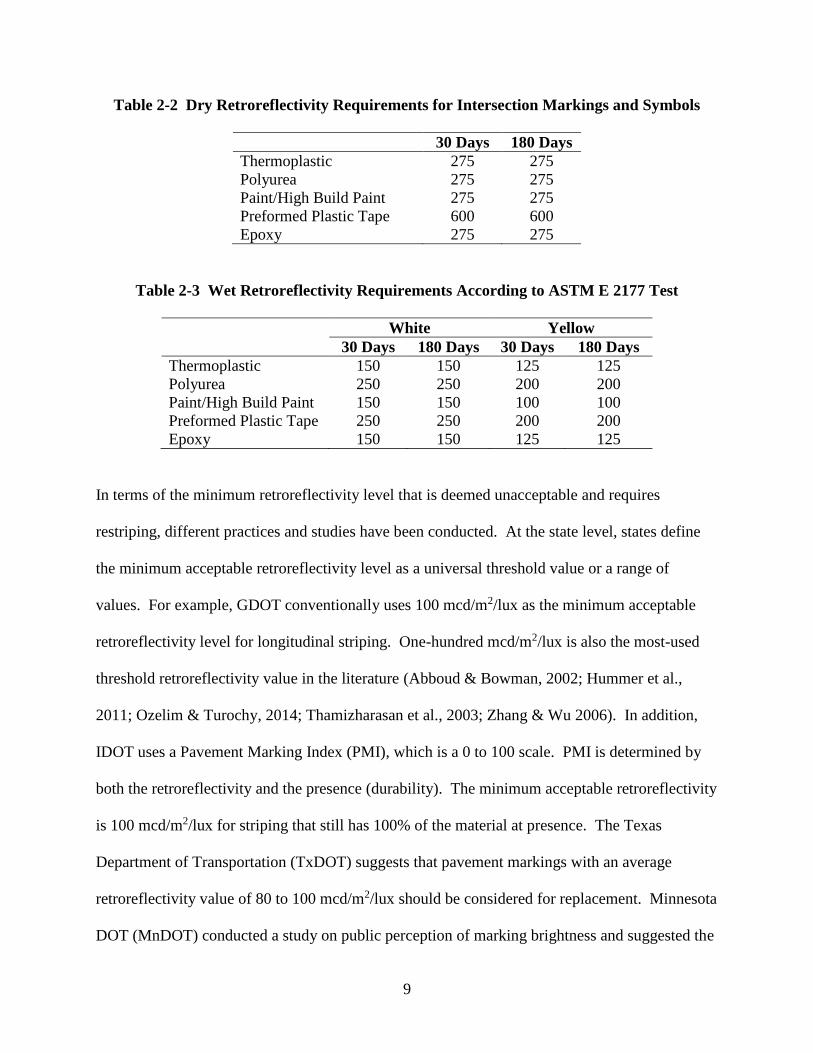
2.1.3 Use of Retroreflectivity
Retroreflectivity has been extensively used to quantify the performance of a pavement marking
and to determine the timing for restriping. It has also been used as threshold requirements for
qualifying pavement marking products. For example, GDOT developed the following
requirements for both dry (ASTM E 1710) and wet (ASTM E 2177) retroreflectivity levels for
various materials used in Georgia.
Table 2-1 Dry Retroreflectivity Requirements According to ASTM E 1710 Test
White Yellow
30 Days 180 Days 30 Days 180 Days
Thermoplastic 400 400 300 300
Polyurea 600 600 400 400
Paint/High Build Paint 300 300 250 250
Preformed Plastic Tape 600 600 400 400
Epoxy 400 400 300 300
9
Table 2-2 Dry Retroreflectivity Requirements for Intersection Markings and Symbols
30 Days 180 Days
Thermoplastic 275 275
Polyurea 275 275
Paint/High Build Paint 275 275
Preformed Plastic Tape 600 600
Epoxy 275 275
Table 2-3 Wet Retroreflectivity Requirements According to ASTM E 2177 Test
White Yellow
30 Days 180 Days 30 Days 180 Days
Thermoplastic 150 150 125 125
Polyurea 250 250 200 200
Paint/High Build Paint 150 150 100 100
Preformed Plastic Tape 250 250 200 200
Epoxy 150 150 125 125
In terms of the minimum retroreflectivity level that is deemed unacceptable and requires
restriping, different practices and studies have been conducted. At the state level, states define
the minimum acceptable retroreflectivity level as a universal threshold value or a range of
values. For example, GDOT conventionally uses 100 mcd/m2/lux as the minimum acceptable
retroreflectivity level for longitudinal striping. One-hundred mcd/m2/lux is also the most-used
threshold retroreflectivity value in the literature (Abboud & Bowman, 2002; Hummer et al.,
2011; Ozelim & Turochy, 2014; Thamizharasan et al., 2003; Zhang & Wu 2006). In addition,
IDOT uses a Pavement Marking Index (PMI), which is a 0 to 100 scale. PMI is determined by
both the retroreflectivity and the presence (durability). The minimum acceptable retroreflectivity
is 100 mcd/m2/lux for striping that still has 100% of the material at presence. The Texas
Department of Transportation (TxDOT) suggests that pavement markings with an average
retroreflectivity value of 80 to 100 mcd/m2/lux should be considered for replacement. Minnesota
DOT (MnDOT) conducted a study on public perception of marking brightness and suggested the
10
threshold value of acceptable retroreflectivity fall in between 80 and 120 mcd/m2/lux (Loetterle
et al. 2000). MnDOT uses 120 mcd/m2/lux as the threshold retroreflectivity value for marking
replacement.
Note that many states’ minimum requirements for acceptable retroreflectivity are determined by
a universal value or a range of values. However, many studies in the literature have also
considered other factors, such as road types, driver’s age, posted speed limits, the presence of
reflective raised pavement marker (RRPM), and line colors, to help determine different
minimum retroreflectivity levels that are accustomed to different situations. For example, Parker
conducted a study and suggested different minimum retroreflectivity levels based on different
age groups (Parker, 2002). He suggested that the threshold retroreflectivity level appeared to be
between 80 and 130 mcd/m2/lux for drivers under 55 years and between 120 and 165 mcd/m2/lux
for drivers older than 55. He also suggested that the New Jersey DOT (NJDOT) use 130
mcd/m2/lux as the threshold value for pavement marking replacement (Parker, 2002).
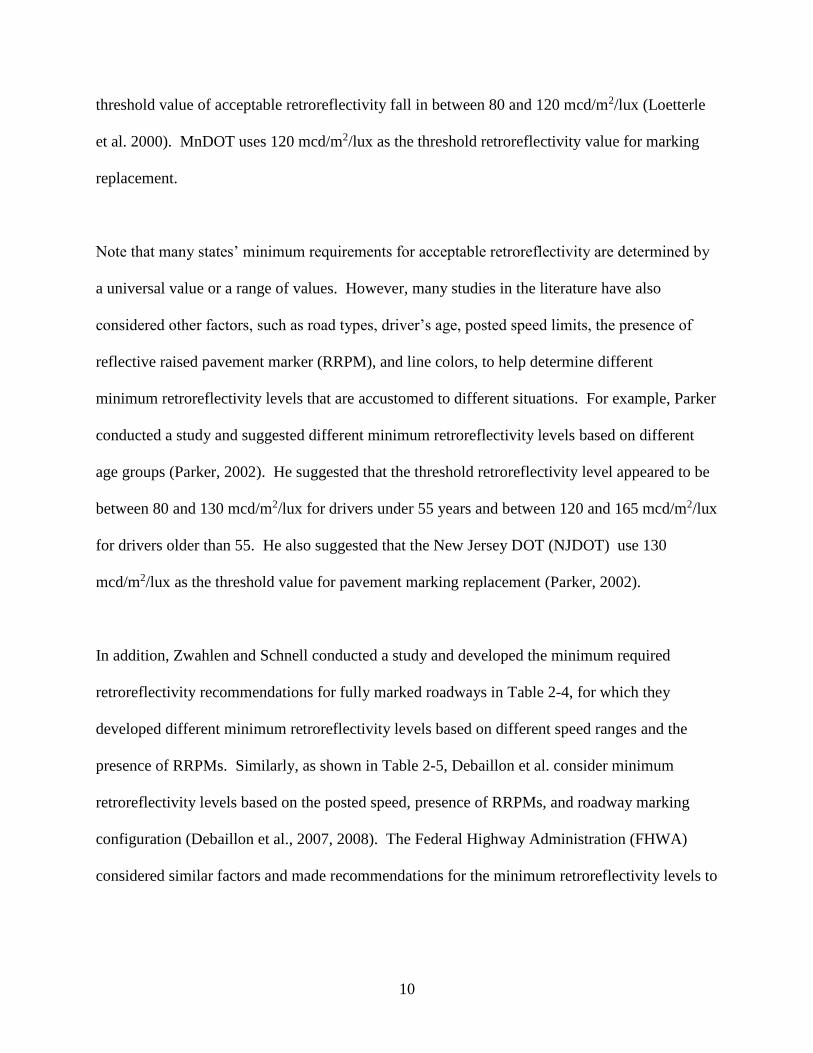
In addition, Zwahlen and Schnell conducted a study and developed the minimum required
retroreflectivity recommendations for fully marked roadways in Table 2-4, for which they
developed different minimum retroreflectivity levels based on different speed ranges and the
presence of RRPMs. Similarly, as shown in Table 2-5, Debaillon et al. consider minimum
retroreflectivity levels based on the posted speed, presence of RRPMs, and roadway marking
configuration (Debaillon et al., 2007, 2008). The Federal Highway Administration (FHWA)
considered similar factors and made recommendations for the minimum retroreflectivity levels to
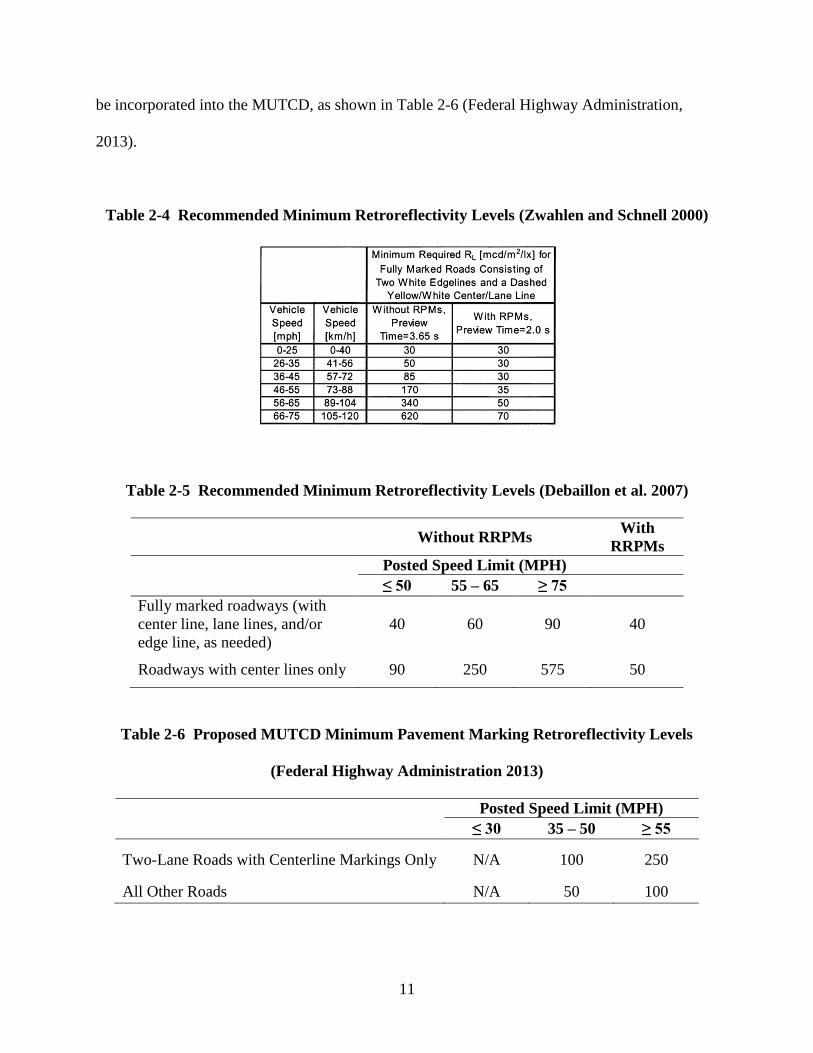
11
be incorporated into the MUTCD, as shown in Table 2-6 (Federal Highway Administration,
2013).
Table 2-4 Recommended Minimum Retroreflectivity Levels (Zwahlen and Schnell 2000)
Table 2-5 Recommended Minimum Retroreflectivity Levels (Debaillon et al. 2007)
Without RRPMs With
RRPMs
Posted Speed Limit (MPH)
≤ 50 55 – 65 ≥ 75
Fully marked roadways (with
center line, lane lines, and/or
edge line, as needed)
40 60 90 40
Roadways with center lines only 90 250 575 50
Table 2-6 Proposed MUTCD Minimum Pavement Marking Retroreflectivity Levels
(Federal Highway Administration 2013)
Posted Speed Limit (MPH)
≤ 30 35 – 50 ≥ 55
Two-Lane Roads with Centerline Markings Only N/A 100 250
All Other Roads N/A 50 100
12
2.2 Pavement Marking Degradation Modeling
Since the late 1990s, researchers have developed several statistical models to predict the
degradation of PMMs. The majority of these models use retroreflectivity as the dependent
variable and use elapsed time, traffic volume, initial retroreflectivity, and other roadway and
pavement marking line properties as independent variables. These independent variables, as well
as other factors that affect the performance of pavement markings, are summarized below:
1) Elapsed time: Elapsed time after marking installation, usually measured in days or
months, is one of the most critical variables in the literature. Various models have
verified the significance of time’s effect on the degradation of pavement marking
retroreflectivity (Abboud & Bowman, 2002; Andrady, 1997; Hummer et al., 2011; J.-T.
Lee et al., 1999; Migletz et al., 2001; Mull & Sitzabee, 2012; Ozelim & Turochy, 2014;
Robertson et al., 2012; Sitzabee et al., 2009, 2012; Thamizharasan et al., 2003; Zhang &
Wu 2006).
2) Traffic: in the literature, the effect of traffic on the degradation of pavement markings
has also been verified to be significant. Specifically, traffic has been considered in the
following formats:
a. Average daily traffic (ADT) or annual average daily traffic (AADT) (Abboud &
Bowman, 2002; J.-T. Lee et al., 1999; Mull & Sitzabee 2012; Ozelim & Turochy,
2014; Robertson et al., 2012; Sitzabee et al., 2009, 2012)
b. Cumulative traffic passages (CTP) (Migletz et al., 2001; Robertson et al., 2012;
Thamizharasan et al., 2003)
c. Commercial/truck traffic (J.-T. Lee et al., 1999)
13
3) Initial retroreflectivity: Initial retroreflectivity is the initial value measured shortly after
the installation, usually within 30 days of installation. Initial retroreflectivity stands for
the initial performance of the marking, and, for the same material type, initial
retroreflectivity can also be used to compare the installation quality of different products,
which is a good indicator of how well the product is expected to perform throughout its
lifetime. Studies have considered initial retroreflectivity in degradation models, and it
has been verified to be a significant variable (Mull and Sitzabee, 2012; Ozelim &
Turochy, 2014; Sitzabee et al., 2009, 2012).
4) Line properties: Different line properties, including color, lateral location, and
installation direction, have different effects on the pavement marking retroreflectivity
(Sitzabee et al., 2009, 2012). For example, lane lines usually deteriorate faster than edge
lines because the former are usually more exposed to traffic.
5) Winter events: Winter weather events, especially pavement surface treatments for
snowfalls and snow plow activities, also have significant effects on the degradation of
pavement markings in northern states (Mull & Sitzabee, 2012). Pavement markings
deteriorate much faster in winter weather.
6) Weather conditions: In addition to winter weather, other weather conditions, such as
temperature and humidity, also have certain effects on the performance of pavement
markings (Robertson et al., 2012).
7) Bead type and properties: The quality of PMMs has improved over the past decade.
New materials and beads have been used to increase nighttime and wet-weather visibility.
Studies have looked into the effect of using conventional beads versus high reflective
(ceramic) elements (Sitzabee et al., 2012). Bead embedment and bead dispersion rate
14
also play an important role on the retroreflectivity of markings (Stoudt and Vedam, 1973;
Texas Department of Transportation, 2004).
8) Other critical factors (that have been identified as important by GDOT engineers but
have not been considered as variables in past degradation models):
a. Thickness: The thickness of pavement markings also has certain impact on how
long and how well the striping can last. The literature has shown that high-build
paint performs much better than conventional waterborne paint (Robertson et al.,
2012).
b. Roadway characteristics: Roadway characteristics can be the functional class of
the road and the geometry of the road. For example, in some studies, analysis has
been conducted separately for pavement markings on interstate highways and on
other routes (Thamizharasan et al., 2003). This is because interstate highways
have limited access and usually do not have intersections that require vehicles to
decelerate/accelerate or turn frequently. In addition, pavement markings installed
along a vertical and/or horizontal curve may perform differently than those
installed along a longitudinal road segment. Different lane and/or shoulder widths
may also affect the performance of the marking (Robertson et al., 2012).
Table 2-7 summarizes the degradation models of various PMMs in the literature. Simple linear
and non-linear regression models that predict retroreflectivity based on a single variable, such as
elapsed time or traffic volume, were used among the first several studies in the late 1990s and
early 2000s (Abboud and Bowman, 2002; Andrady, 1997; J.-T. Lee et al., 1999; Migletz et al.,
2001). For example, Lee et al. developed several simple linear regression models that predict
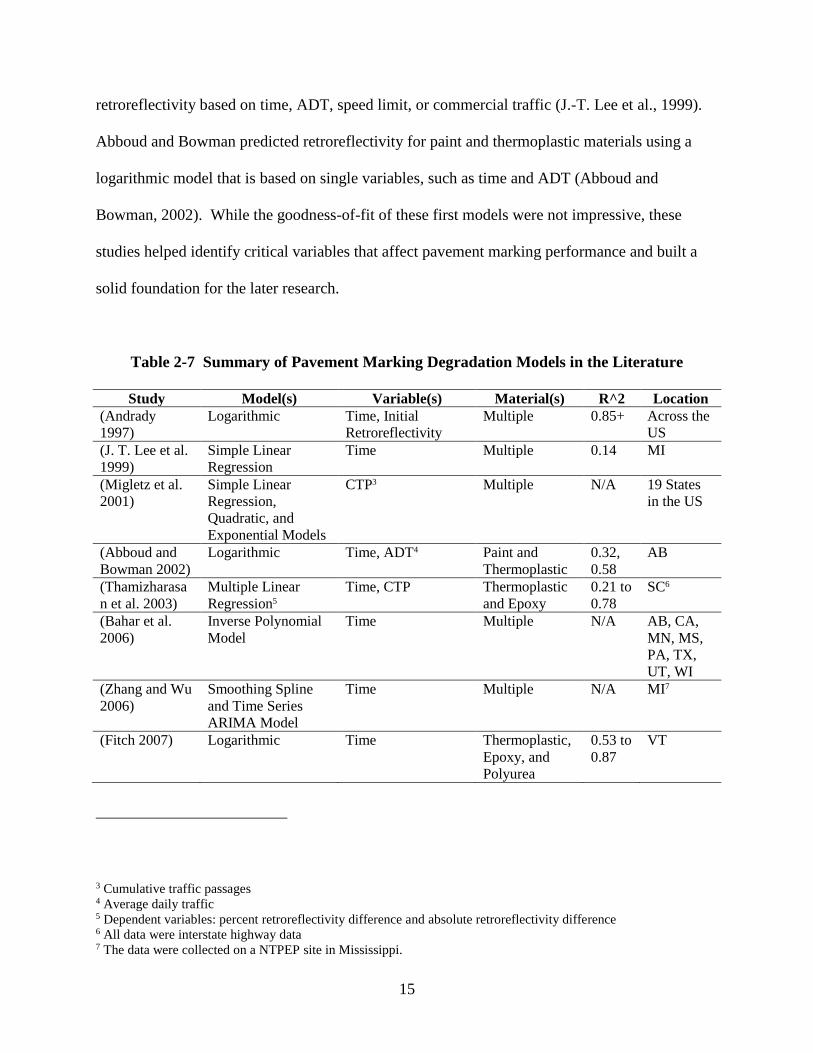
15
retroreflectivity based on time, ADT, speed limit, or commercial traffic (J.-T. Lee et al., 1999).
Abboud and Bowman predicted retroreflectivity for paint and thermoplastic materials using a
logarithmic model that is based on single variables, such as time and ADT (Abboud and
Bowman, 2002). While the goodness-of-fit of these first models were not impressive, these
studies helped identify critical variables that affect pavement marking performance and built a
solid foundation for the later research.
Table 2-7 Summary of Pavement Marking Degradation Models in the Literature
Study Model(s) Variable(s) Material(s) R^2 Location
(Andrady
1997)
Logarithmic Time, Initial
Retroreflectivity
Multiple 0.85+ Across the
US
(J. T. Lee et al.
1999)
Simple Linear
Regression
Time Multiple 0.14 MI
(Migletz et al.
2001)
Simple Linear
Regression,
Quadratic, and
Exponential Models
CTP3 Multiple N/A 19 States
in the US
(Abboud and
Bowman 2002)
Logarithmic Time, ADT4 Paint and
Thermoplastic
0.32,
0.58
AB
(Thamizharasa
n et al. 2003)
Multiple Linear
Regression5
Time, CTP Thermoplastic
and Epoxy
0.21 to
0.78
SC6
(Bahar et al.
2006)
Inverse Polynomial
Model
Time Multiple N/A AB, CA,
MN, MS,
PA, TX,
UT, WI
(Zhang and Wu
2006)
Smoothing Spline
and Time Series
ARIMA Model
Time Multiple N/A MI7
(Fitch 2007) Logarithmic Time Thermoplastic,
Epoxy, and
Polyurea
0.53 to
0.87
VT
3 Cumulative traffic passages 4 Average daily traffic 5 Dependent variables: percent retroreflectivity difference and absolute retroreflectivity difference 6 All data were interstate highway data 7 The data were collected on a NTPEP site in Mississippi.
16
Study Model(s) Variable(s) Material(s) R^2 Location
(Sasidharan et
al. 2009)
Multiple Linear
Regression
Time, Directional
ADT, Line Type,
Pavement Type
Epoxy and
Waterborne
Paint
N/A PA
(Sitzabee et al.
2009)
Multiple Linear
Regression
Time, Initial
Retroreflectivity,
AADT, Line Lateral
Location, Line Color
Thermoplastic
and Paint
0.60 NC
(Hummer et al.
2011)
Linear Mixed-
Effects Model
Time Paint 0.68 NC
(Sitzabee et al.
2012)
Multiple Linear
Regression
Time, AADT8, Bead
Type, Initial
Retroreflectivity,
Line Lateral
Location
Polyurea 0.64 NC
(Mull and
Sitzabee 2012)
Multiple Linear
Regression
Time, Initial
Retroreflectivity,
AADT, and Plow
Events
Paint 0.76 NC
(Robertson et
al. 2012)
Multiple Linear
Regression3
Time, AADT, CTP,
Temperature,
Humidity, Lane
Width, and Shoulder
Width
Conventional
Waterborne
Paint and High-
Build Paint
0.24 to
0.34
SC
(Fu and
Wilmot 2012)
Multiple Linear
Regression
Time, AADT, CTP Thermoplastic,
Tape, and
Inverted Profile
Thermoplastic
0.18 to
0.89
LA
(Ozelim and
Turochy 2014)
Multiple Linear
Regression
Time, AADT, Initial
Retroreflectivity
Thermoplastic Up to
0.49
AB
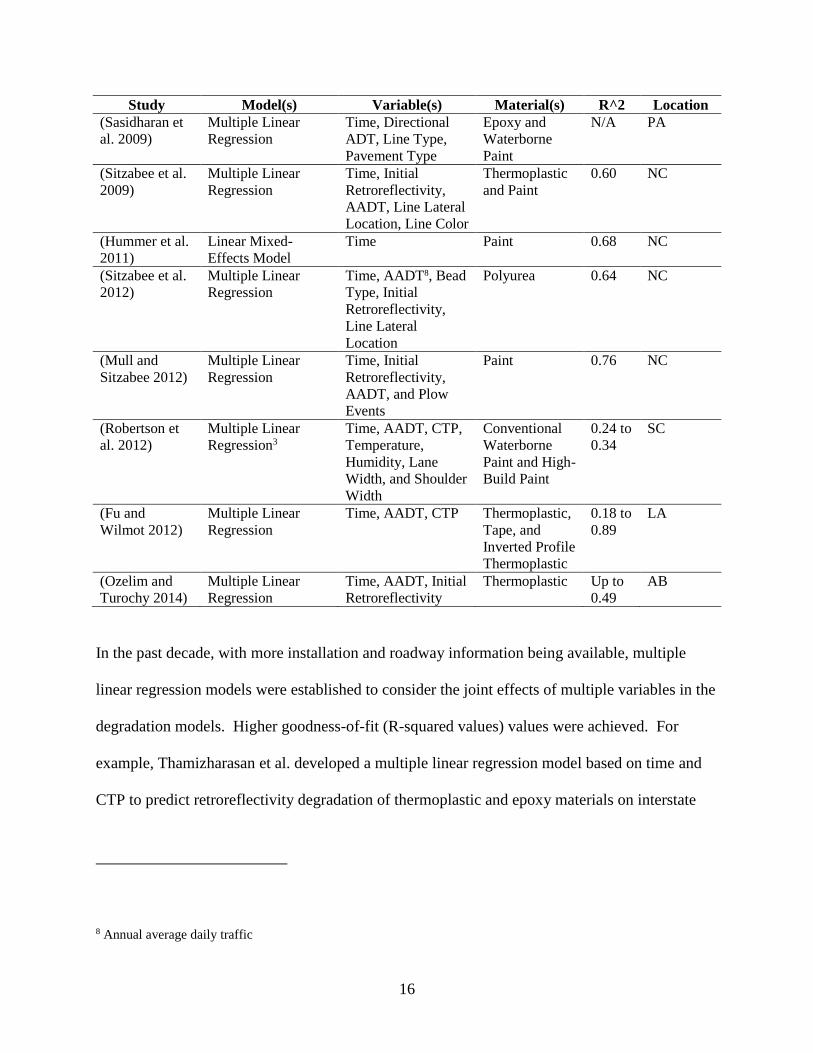
In the past decade, with more installation and roadway information being available, multiple
linear regression models were established to consider the joint effects of multiple variables in the
degradation models. Higher goodness-of-fit (R-squared values) values were achieved. For
example, Thamizharasan et al. developed a multiple linear regression model based on time and
CTP to predict retroreflectivity degradation of thermoplastic and epoxy materials on interstate
8 Annual average daily traffic
17
highways in South Carolina. Their final models were able to achieve a 0.78 R-squared value
(Thamizharasan et al., 2003). Other researchers also attempted to include more independent
variables, such as winter events (e.g., number of snow plows and number of snows (Mull and
Sitzabee, 2012)), bead type (e.g., standard beads and high reflective elements (Sitzabee et al.,
2012)), line type (e.g., center line or skipped line (Sitzabee et al., 2009, 2012)), and land and
shoulder widths (Robertson et al., 2012).
The statistical assumptions, such as “normality, constant variance, uncorrelated errors, linearity,
and lack of multicollinearity,” of multiple linear regression models were also justified by
researchers (Mull and Sitzabee, 2012; Ozelim and Turochy, 2014; Sitzabee et al., 2009, 2012).
These studies verified that the datasets used to develop the models were suitable for multiple
linear regressions.
As for materials that have been studied, most studies developed degradation models for paint and
thermoplastic materials because they account for the majority materials that have been used
throughout the United States (Abboud and Bowman, 2002; Andrady, 1997; Hummer et al., 2011;
J.-T. Lee et al., 1999; Migletz et al., 2001; Mull and Sitzabee, 2012; Robertson et al., 2012;
Sitzabee et al., 2009; Thamizharasan et al., 2003; Zhang and Wu 2006). With the rising interests
of other durable marking materials, such as epoxy and polyurea, researchers have also developed
models to predict performance of these materials (Sitzabee et al., 2012; Thamizharasan et al.,
2003). Degradation models of other commonly used PMMs, such as preformed tape and methyl
methacrylate (MMA), however, have not yet been extensively studied.
18
From the literature summary, extensive studies have been conducted in the southeastern states,
including North Carolina, South Carolina, Alabama, and Mississippi. While these models could
be good references for Georgia because of the proximity of these states and the similarity in
weather conditions, there is still a need to develop a robust model for Georgia, especially for the
unique traffic characteristics in Metro Atlanta that do not exist in other states.
2.3 Pavement Marking Material Selection Practices
To select the most cost-effective PMMs, various factors that affect the performance of PMMs
should be considered. These factors include the type of pavement surface, traffic characteristics,
remaining service life of the pavement, climate conditions, presence of reflective raised
pavement markers (RRPMs), and line color and usage. While it is unlikely for a state DOT to
consider all the possible factors listed above, it is important that a state DOT identify the critical
factors and select materials based on the consideration of these factors. In this section, we
summarize the factors considered by state DOTs and the criteria the used for PMM selection.
2.3.1 Georgia’s Practice
GDOT has internally used the matrix shown in Table 2-8 to select PMMs (Georgia Department
of Transportation, 2013). The selection of PMM is determined by various criteria, including
pavement surface type, traffic condition, and functional classification of road segment. For
example, polyurea would be selected for an interstate highway with asphalt concrete surface and
30,000 AADT.
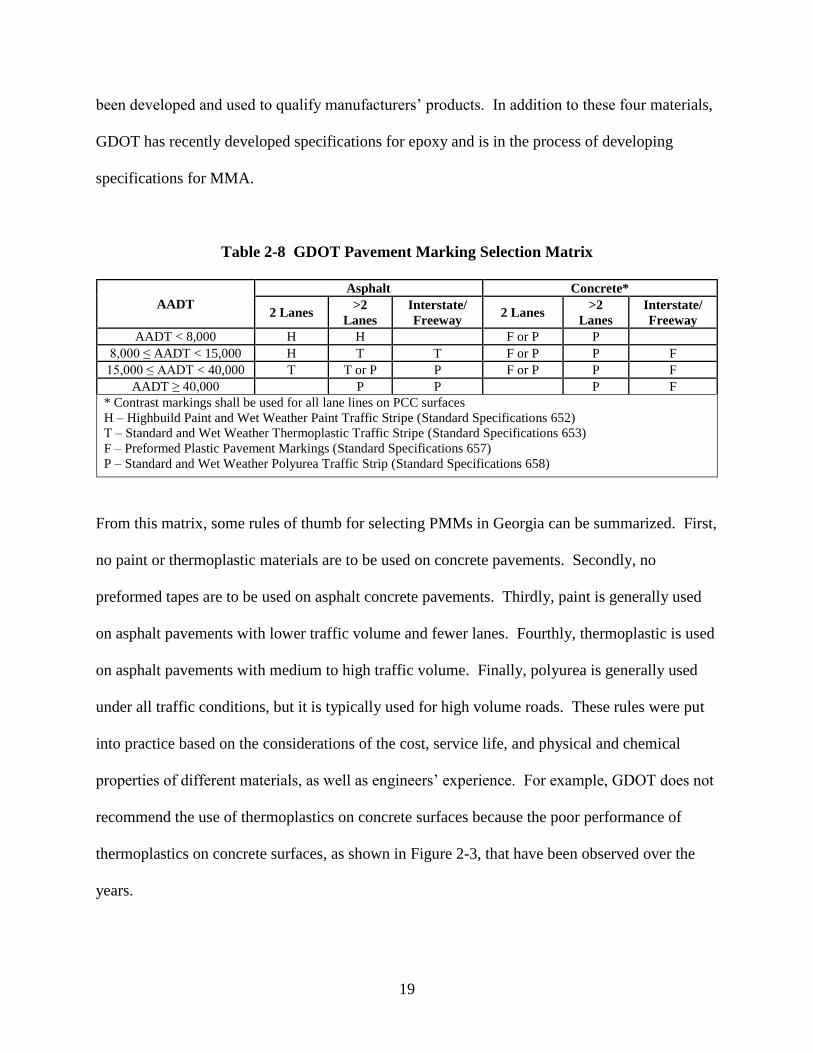
As shown in Table 2-8, four common materials, including paint, thermoplastic, preformed tape,
and polyurea, are currently used by GDOT. Detailed specifications of these four materials have
19
been developed and used to qualify manufacturers’ products. In addition to these four materials,
GDOT has recently developed specifications for epoxy and is in the process of developing
specifications for MMA.
Table 2-8 GDOT Pavement Marking Selection Matrix
AADT
Asphalt Concrete*
2 Lanes >2
Lanes
Interstate/
Freeway 2 Lanes
>2
Lanes
Interstate/
Freeway
AADT < 8,000 H H F or P P
8,000 ≤ AADT < 15,000 H T T F or P P F
15,000 ≤ AADT < 40,000 T T or P P F or P P F
AADT ≥ 40,000 P P P F
* Contrast markings shall be used for all lane lines on PCC surfaces
H – Highbuild Paint and Wet Weather Paint Traffic Stripe (Standard Specifications 652)
T – Standard and Wet Weather Thermoplastic Traffic Stripe (Standard Specifications 653)
F – Preformed Plastic Pavement Markings (Standard Specifications 657)
P – Standard and Wet Weather Polyurea Traffic Strip (Standard Specifications 658)
From this matrix, some rules of thumb for selecting PMMs in Georgia can be summarized. First,
no paint or thermoplastic materials are to be used on concrete pavements. Secondly, no
preformed tapes are to be used on asphalt concrete pavements. Thirdly, paint is generally used
on asphalt pavements with lower traffic volume and fewer lanes. Fourthly, thermoplastic is used
on asphalt pavements with medium to high traffic volume. Finally, polyurea is generally used
under all traffic conditions, but it is typically used for high volume roads. These rules were put
into practice based on the considerations of the cost, service life, and physical and chemical
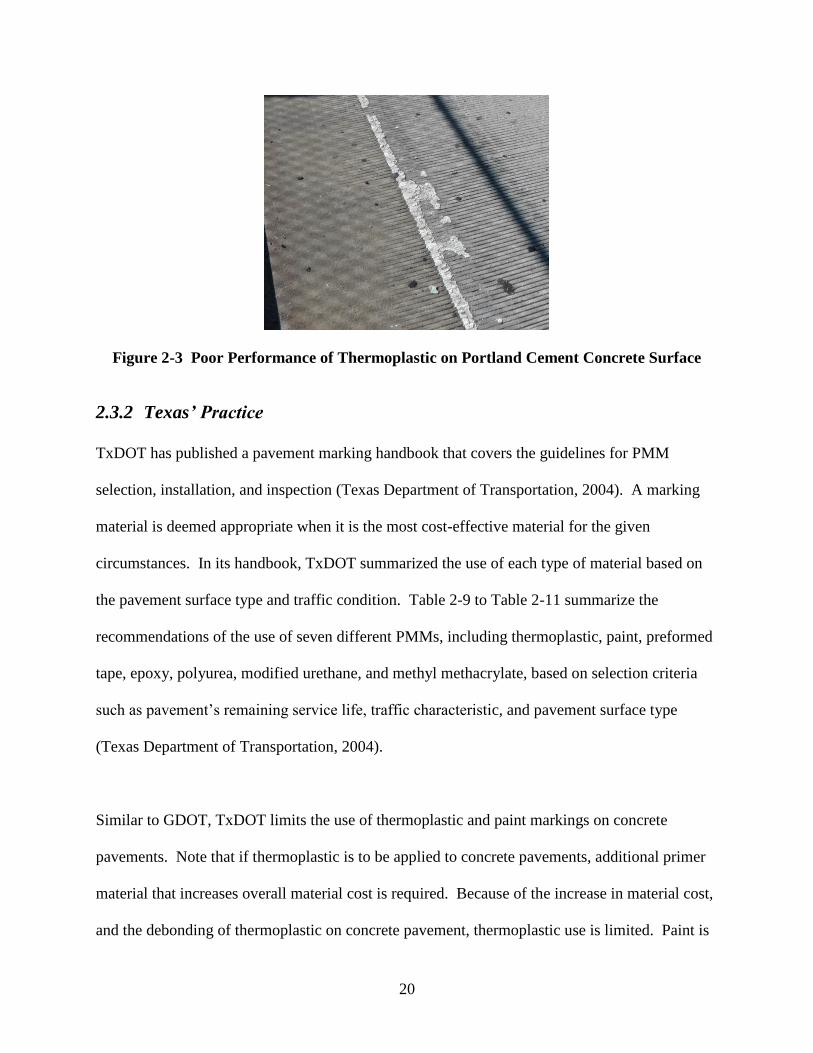
properties of different materials, as well as engineers’ experience. For example, GDOT does not
recommend the use of thermoplastics on concrete surfaces because the poor performance of
thermoplastics on concrete surfaces, as shown in Figure 2-3, that have been observed over the
years.
20
Figure 2-3 Poor Performance of Thermoplastic on Portland Cement Concrete Surface
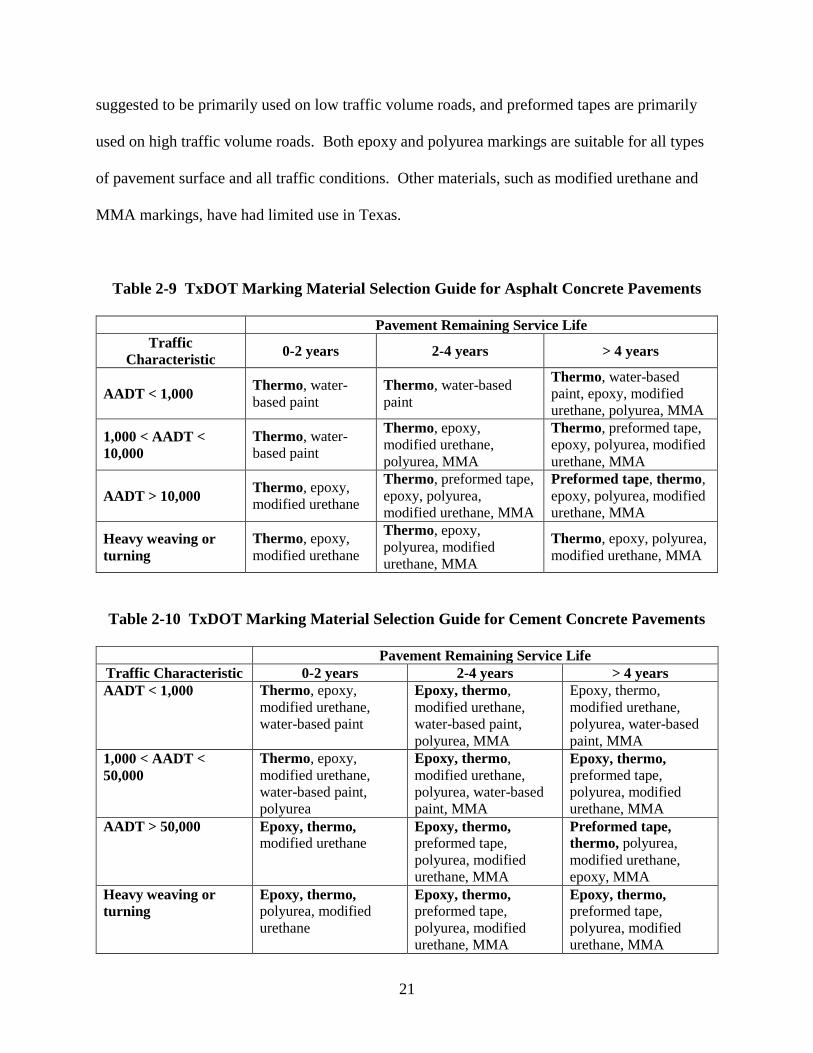
2.3.2 Texas’ Practice
TxDOT has published a pavement marking handbook that covers the guidelines for PMM
selection, installation, and inspection (Texas Department of Transportation, 2004). A marking
material is deemed appropriate when it is the most cost-effective material for the given
circumstances. In its handbook, TxDOT summarized the use of each type of material based on
the pavement surface type and traffic condition. Table 2-9 to Table 2-11 summarize the
recommendations of the use of seven different PMMs, including thermoplastic, paint, preformed
tape, epoxy, polyurea, modified urethane, and methyl methacrylate, based on selection criteria
such as pavement’s remaining service life, traffic characteristic, and pavement surface type
(Texas Department of Transportation, 2004).
Similar to GDOT, TxDOT limits the use of thermoplastic and paint markings on concrete
pavements. Note that if thermoplastic is to be applied to concrete pavements, additional primer
material that increases overall material cost is required. Because of the increase in material cost,
and the debonding of thermoplastic on concrete pavement, thermoplastic use is limited. Paint is
21
suggested to be primarily used on low traffic volume roads, and preformed tapes are primarily
used on high traffic volume roads. Both epoxy and polyurea markings are suitable for all types
of pavement surface and all traffic conditions. Other materials, such as modified urethane and
MMA markings, have had limited use in Texas.
Table 2-9 TxDOT Marking Material Selection Guide for Asphalt Concrete Pavements
Pavement Remaining Service Life
Traffic
Characteristic 0-2 years 2-4 years > 4 years
AADT < 1,000 Thermo, water-
based paint
Thermo, water-based
paint
Thermo, water-based
paint, epoxy, modified
urethane, polyurea, MMA
1,000 < AADT <
10,000
Thermo, water-
based paint
Thermo, epoxy,
modified urethane,
polyurea, MMA
Thermo, preformed tape,
epoxy, polyurea, modified
urethane, MMA
AADT > 10,000 Thermo, epoxy,
modified urethane
Thermo, preformed tape,
epoxy, polyurea,
modified urethane, MMA
Preformed tape, thermo,
epoxy, polyurea, modified
urethane, MMA
Heavy weaving or
turning
Thermo, epoxy,
modified urethane
Thermo, epoxy,
polyurea, modified
urethane, MMA
Thermo, epoxy, polyurea,
modified urethane, MMA
Table 2-10 TxDOT Marking Material Selection Guide for Cement Concrete Pavements
Pavement Remaining Service Life
Traffic Characteristic 0-2 years 2-4 years > 4 years
AADT < 1,000 Thermo, epoxy,
modified urethane,
water-based paint
Epoxy, thermo,
modified urethane,
water-based paint,
polyurea, MMA
Epoxy, thermo,
modified urethane,
polyurea, water-based
paint, MMA
1,000 < AADT <
50,000
Thermo, epoxy,
modified urethane,
water-based paint,
polyurea
Epoxy, thermo,
modified urethane,
polyurea, water-based
paint, MMA
Epoxy, thermo,
preformed tape,
polyurea, modified
urethane, MMA
AADT > 50,000 Epoxy, thermo, modified urethane
Epoxy, thermo,
preformed tape,
polyurea, modified
urethane, MMA
Preformed tape,
thermo, polyurea,
modified urethane,
epoxy, MMA
Heavy weaving or
turning
Epoxy, thermo,
polyurea, modified
urethane
Epoxy, thermo,
preformed tape,
polyurea, modified
urethane, MMA
Epoxy, thermo,
preformed tape,
polyurea, modified
urethane, MMA
22
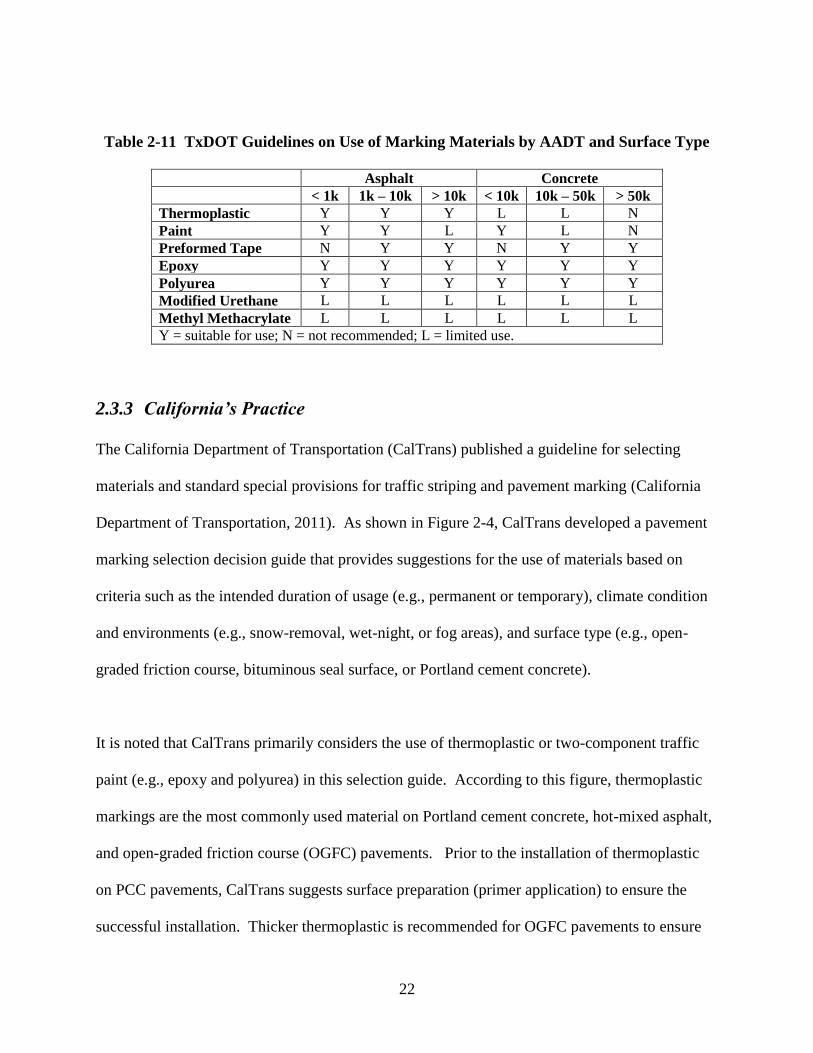
Table 2-11 TxDOT Guidelines on Use of Marking Materials by AADT and Surface Type
Asphalt Concrete
< 1k 1k – 10k > 10k < 10k 10k – 50k > 50k
Thermoplastic Y Y Y L L N
Paint Y Y L Y L N
Preformed Tape N Y Y N Y Y
Epoxy Y Y Y Y Y Y
Polyurea Y Y Y Y Y Y
Modified Urethane L L L L L L
Methyl Methacrylate L L L L L L
Y = suitable for use; N = not recommended; L = limited use.
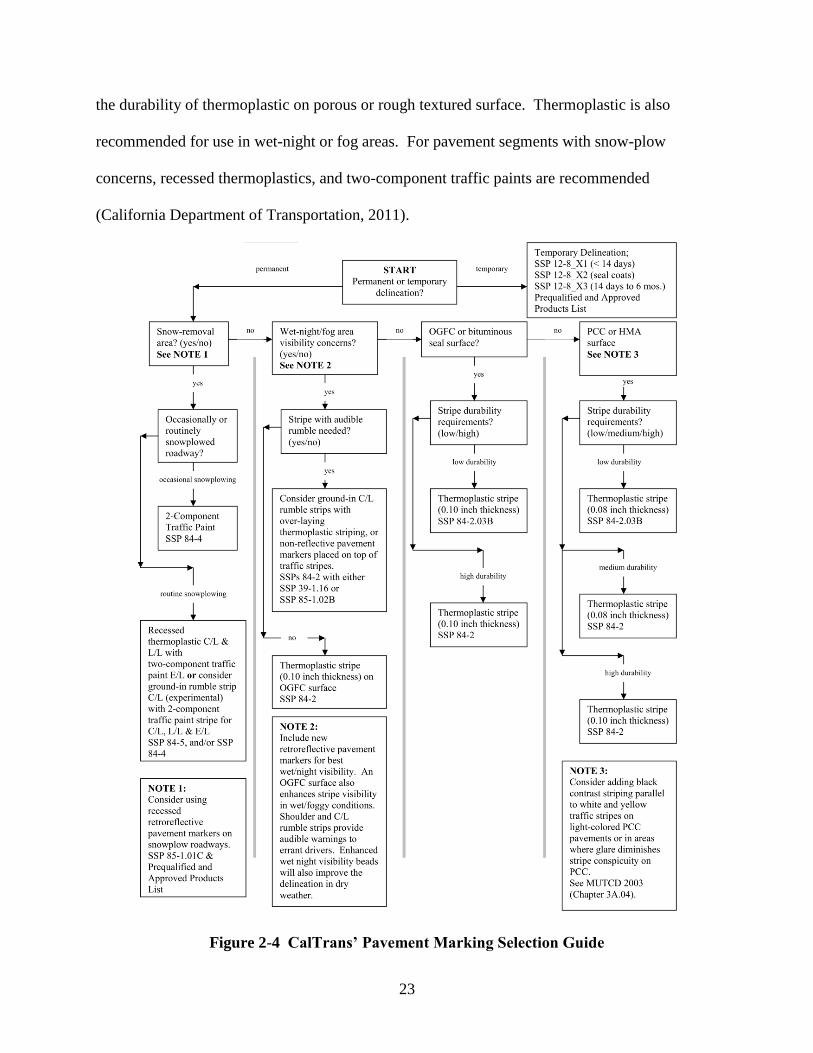
2.3.3 California’s Practice
The California Department of Transportation (CalTrans) published a guideline for selecting
materials and standard special provisions for traffic striping and pavement marking (California
Department of Transportation, 2011). As shown in Figure 2-4, CalTrans developed a pavement
marking selection decision guide that provides suggestions for the use of materials based on
criteria such as the intended duration of usage (e.g., permanent or temporary), climate condition
and environments (e.g., snow-removal, wet-night, or fog areas), and surface type (e.g., open-
graded friction course, bituminous seal surface, or Portland cement concrete).
It is noted that CalTrans primarily considers the use of thermoplastic or two-component traffic
paint (e.g., epoxy and polyurea) in this selection guide. According to this figure, thermoplastic
markings are the most commonly used material on Portland cement concrete, hot-mixed asphalt,
and open-graded friction course (OGFC) pavements. Prior to the installation of thermoplastic
on PCC pavements, CalTrans suggests surface preparation (primer application) to ensure the
successful installation. Thicker thermoplastic is recommended for OGFC pavements to ensure
23
the durability of thermoplastic on porous or rough textured surface. Thermoplastic is also
recommended for use in wet-night or fog areas. For pavement segments with snow-plow
concerns, recessed thermoplastics, and two-component traffic paints are recommended
(California Department of Transportation, 2011).
Figure 2-4 CalTrans’ Pavement Marking Selection Guide
24
When compared to GDOT and TxDOT, CalTrans has a different strategy for the use of
thermoplastic materials on PCC pavements, whereas the former states have no or limited use of
thermoplastic on PCC surface. In addition, the use of preformed tapes is not warranted
according to CalTrans’ selection guide.
2.3.4 Kansas’ Practice
The Kansas Department of Transportation (KDOT) published its pavement marking policy in
2002 (Kansas Department of Transportation, 2002). In this policy, KDOT developed a
Brightness Benefit Factor (BBF) that is essentially a benefit-cost ratio for PMM selection as
shown in the following equation. The benefit is the product of the average retroreflectivity and
the service life of a material; and the cost is the average cost that includes material, road user,
temporary tape, and existing marking removal costs (Kansas Department of Transportation,
2002).
𝐵𝐵𝐹 = (𝑅𝐿𝑎𝑣𝑔× 𝐿𝑖𝑓𝑒) / 𝐶𝑜𝑠𝑡 (2.1)
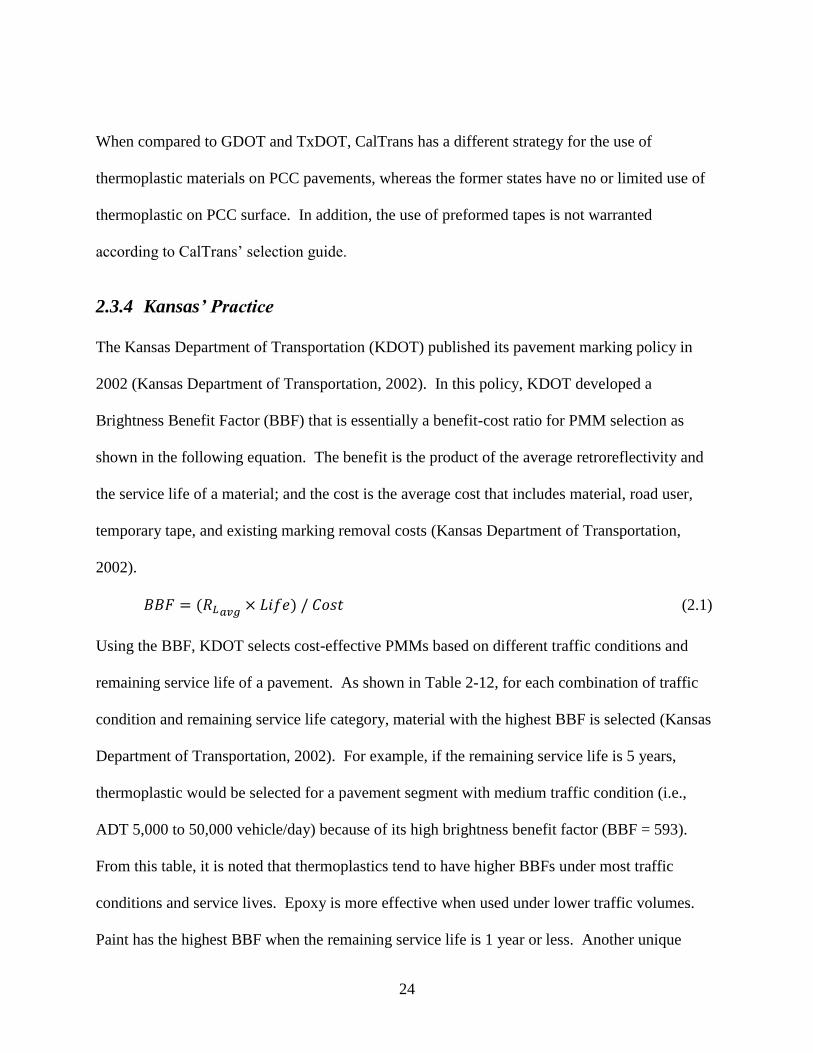
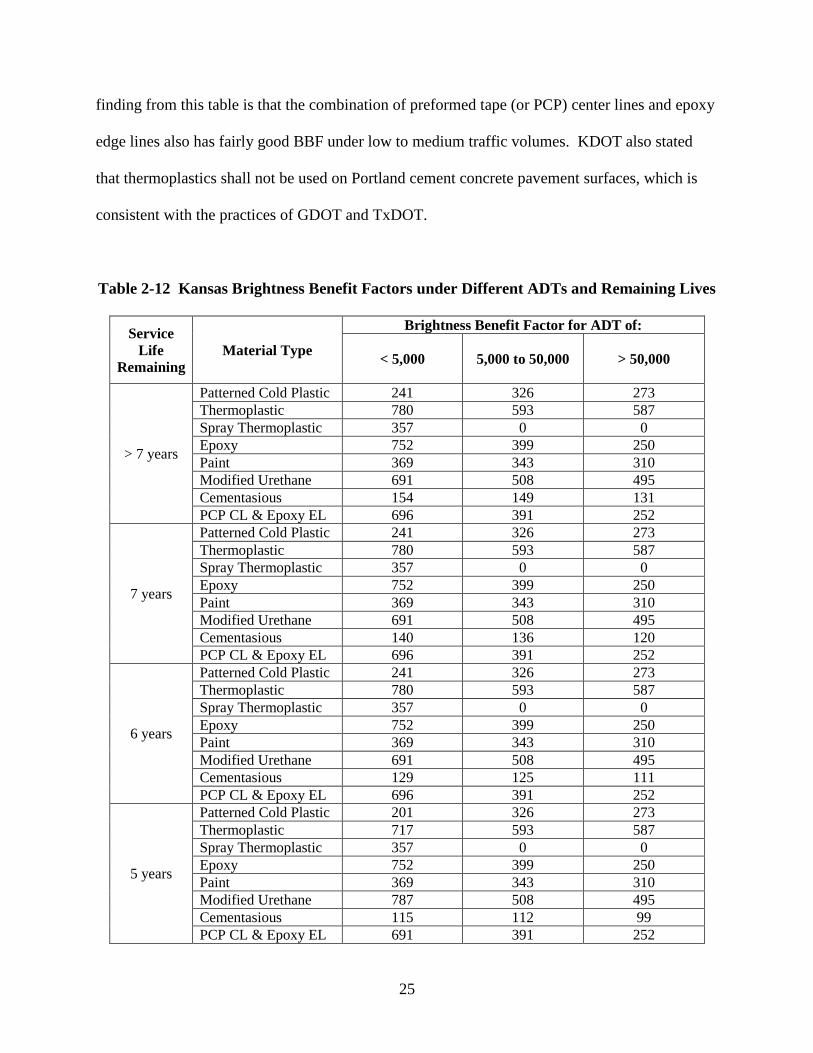
Using the BBF, KDOT selects cost-effective PMMs based on different traffic conditions and
remaining service life of a pavement. As shown in Table 2-12, for each combination of traffic
condition and remaining service life category, material with the highest BBF is selected (Kansas
Department of Transportation, 2002). For example, if the remaining service life is 5 years,
thermoplastic would be selected for a pavement segment with medium traffic condition (i.e.,
ADT 5,000 to 50,000 vehicle/day) because of its high brightness benefit factor (BBF = 593).
From this table, it is noted that thermoplastics tend to have higher BBFs under most traffic
conditions and service lives. Epoxy is more effective when used under lower traffic volumes.
Paint has the highest BBF when the remaining service life is 1 year or less. Another unique
25
finding from this table is that the combination of preformed tape (or PCP) center lines and epoxy
edge lines also has fairly good BBF under low to medium traffic volumes. KDOT also stated
that thermoplastics shall not be used on Portland cement concrete pavement surfaces, which is
consistent with the practices of GDOT and TxDOT.
Table 2-12 Kansas Brightness Benefit Factors under Different ADTs and Remaining Lives
Service
Life
Remaining
Material Type
Brightness Benefit Factor for ADT of:
< 5,000 5,000 to 50,000 > 50,000
> 7 years
Patterned Cold Plastic 241 326 273
Thermoplastic 780 593 587
Spray Thermoplastic 357 0 0
Epoxy 752 399 250
Paint 369 343 310
Modified Urethane 691 508 495
Cementasious 154 149 131
PCP CL & Epoxy EL 696 391 252
7 years
Patterned Cold Plastic 241 326 273
Thermoplastic 780 593 587
Spray Thermoplastic 357 0 0
Epoxy 752 399 250
Paint 369 343 310
Modified Urethane 691 508 495
Cementasious 140 136 120
PCP CL & Epoxy EL 696 391 252
6 years
Patterned Cold Plastic 241 326 273
Thermoplastic 780 593 587
Spray Thermoplastic 357 0 0
Epoxy 752 399 250
Paint 369 343 310
Modified Urethane 691 508 495
Cementasious 129 125 111
PCP CL & Epoxy EL 696 391 252
5 years
Patterned Cold Plastic 201 326 273
Thermoplastic 717 593 587
Spray Thermoplastic 357 0 0
Epoxy 752 399 250
Paint 369 343 310
Modified Urethane 787 508 495
Cementasious 115 112 99
PCP CL & Epoxy EL 691 391 252
26
Service
Life
Remaining
Material Type
Brightness Benefit Factor for ADT of:
< 5,000 5,000 to 50,000 > 50,000
4 years
Patterned Cold Plastic 161 261 218
Thermoplastic 607 576 570
Spray Thermoplastic 357 0 0
Epoxy 781 399 250
Paint 369 343 310
Modified Urethane 737 579 562
Cementasious 98 95 84
PCP CL & Epoxy EL 712 383 246
3 years
Patterned Cold Plastic 121 196 164
Thermoplastic 482 500 495
Spray Thermoplastic 357 0 0
Epoxy 675 372 187
Paint 369 343 310
Modified Urethane 608 514 499
Cementasious 78 76 67
PCP CL & Epoxy EL 613 353 185
2 years
Patterned Cold Plastic 80 131 109
Thermoplastic 351 363 359
Spray Thermoplastic 357 0 0
Epoxy 470 297 164
Paint 369 343 310
Modified Urethane 433 389 378
Cementasious 52 51 45
PCP CL & Epoxy EL 427 278 158
≤ 1 year
Patterned Cold Plastic 40 65 55
Thermoplastic 183 187 185
Spray Thermoplastic 179 0 0
Epoxy 243 172 102
Paint 369 343 310
Modified Urethane 226 217 211
Cementasious 26 25 22
PCP CL & Epoxy EL 220 160 97
2.3.5 North Dakota’s Practice
The North Dakota Department of Transportation (NDDOT) developed the following pavement
marking selection matrix (North Dakota Department of Transportation, 2014). Different than
other states, North Dakota does not include thermoplastics in its selection matrix because of the
frequent winter plow events that can significantly damage thermoplastic pavement markings.
27
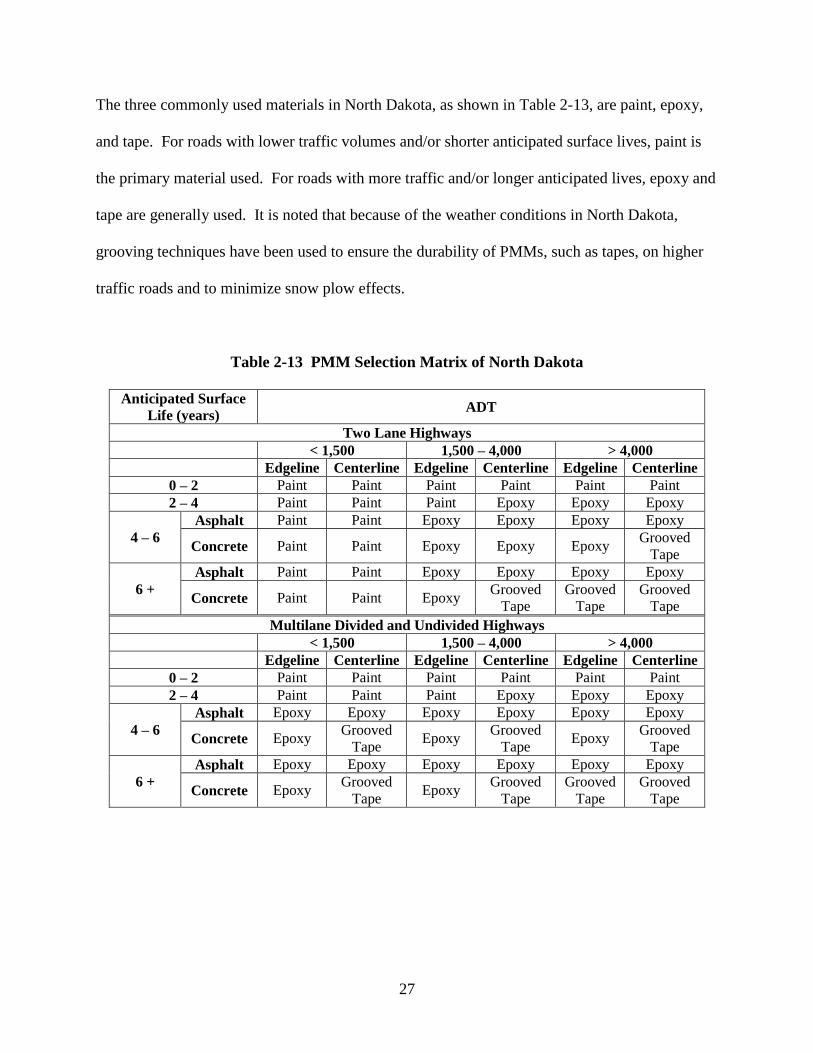
The three commonly used materials in North Dakota, as shown in Table 2-13, are paint, epoxy,
and tape. For roads with lower traffic volumes and/or shorter anticipated surface lives, paint is
the primary material used. For roads with more traffic and/or longer anticipated lives, epoxy and
tape are generally used. It is noted that because of the weather conditions in North Dakota,
grooving techniques have been used to ensure the durability of PMMs, such as tapes, on higher
traffic roads and to minimize snow plow effects.
Table 2-13 PMM Selection Matrix of North Dakota
Anticipated Surface
Life (years) ADT
Two Lane Highways
< 1,500 1,500 – 4,000 > 4,000
Edgeline Centerline Edgeline Centerline Edgeline Centerline
0 – 2 Paint Paint Paint Paint Paint Paint
2 – 4 Paint Paint Paint Epoxy Epoxy Epoxy
4 – 6
Asphalt Paint Paint Epoxy Epoxy Epoxy Epoxy
Concrete Paint Paint Epoxy Epoxy Epoxy Grooved
Tape
6 +
Asphalt Paint Paint Epoxy Epoxy Epoxy Epoxy
Concrete Paint Paint Epoxy Grooved
Tape
Grooved
Tape
Grooved
Tape
Multilane Divided and Undivided Highways
< 1,500 1,500 – 4,000 > 4,000
Edgeline Centerline Edgeline Centerline Edgeline Centerline
0 – 2 Paint Paint Paint Paint Paint Paint
2 – 4 Paint Paint Paint Epoxy Epoxy Epoxy
4 – 6
Asphalt Epoxy Epoxy Epoxy Epoxy Epoxy Epoxy
Concrete Epoxy Grooved
Tape Epoxy
Grooved
Tape Epoxy
Grooved
Tape
6 +
Asphalt Epoxy Epoxy Epoxy Epoxy Epoxy Epoxy
Concrete Epoxy Grooved
Tape Epoxy
Grooved
Tape
Grooved
Tape
Grooved
Tape
28
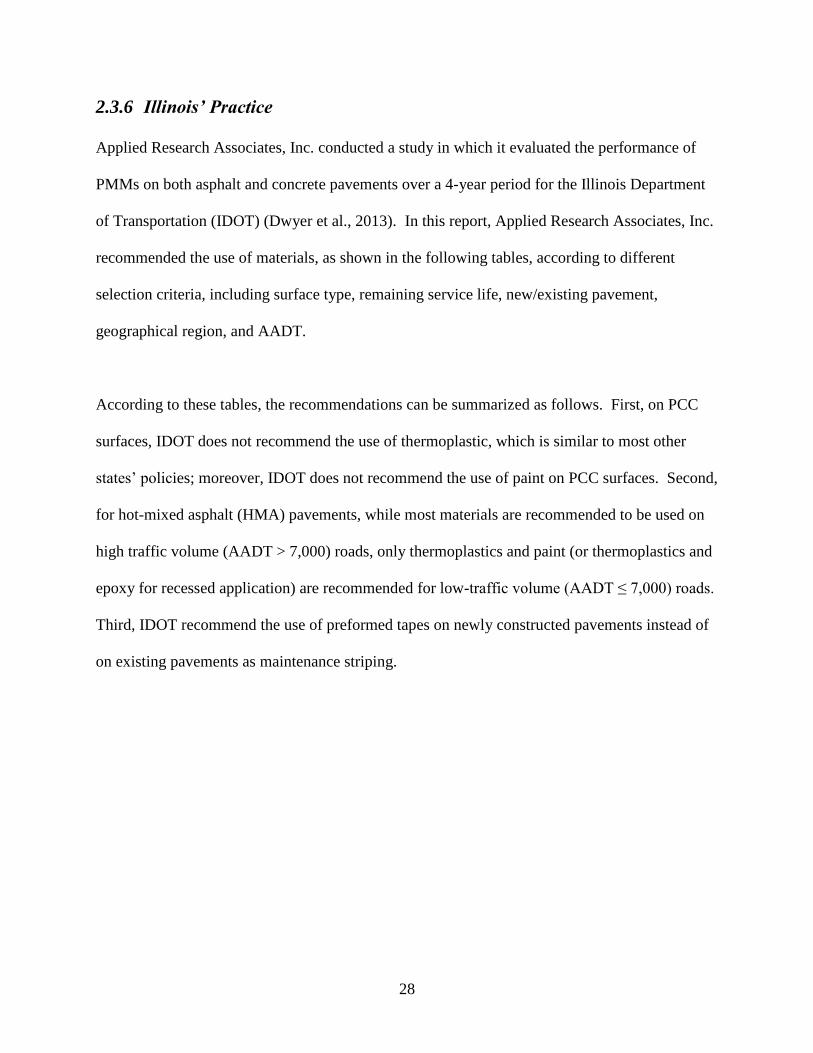
2.3.6 Illinois’ Practice
Applied Research Associates, Inc. conducted a study in which it evaluated the performance of
PMMs on both asphalt and concrete pavements over a 4-year period for the Illinois Department
of Transportation (IDOT) (Dwyer et al., 2013). In this report, Applied Research Associates, Inc.
recommended the use of materials, as shown in the following tables, according to different
selection criteria, including surface type, remaining service life, new/existing pavement,
geographical region, and AADT.
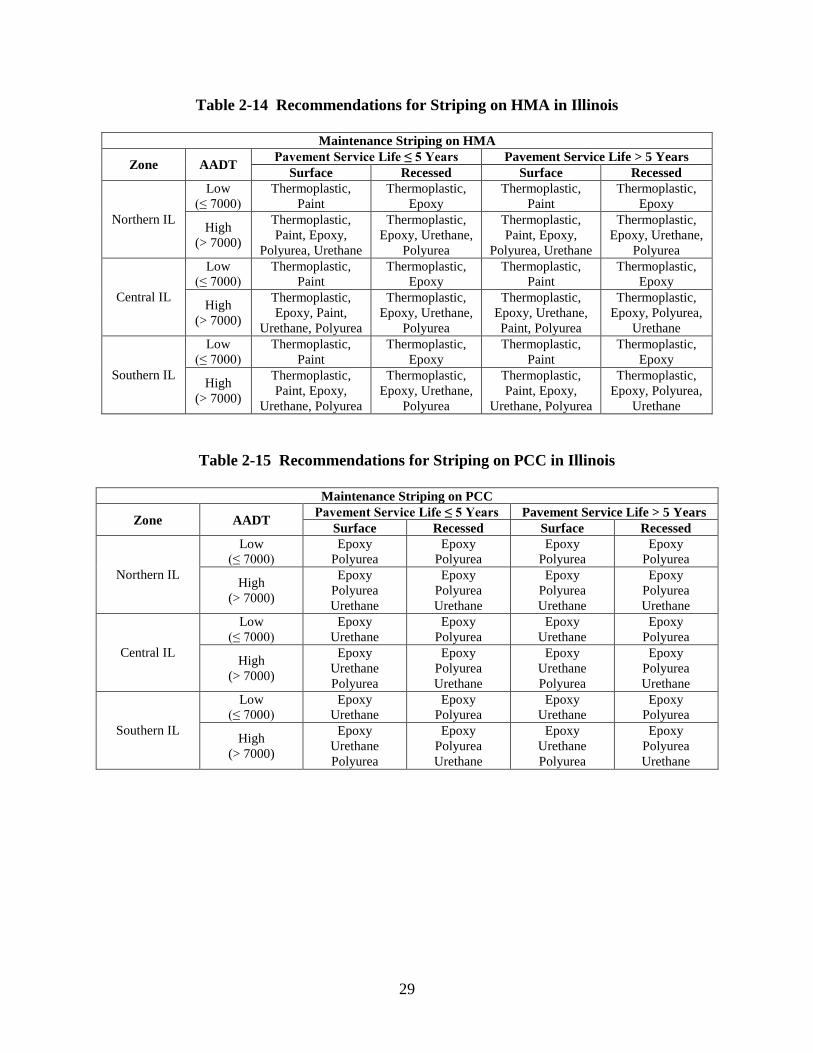
According to these tables, the recommendations can be summarized as follows. First, on PCC
surfaces, IDOT does not recommend the use of thermoplastic, which is similar to most other
states’ policies; moreover, IDOT does not recommend the use of paint on PCC surfaces. Second,
for hot-mixed asphalt (HMA) pavements, while most materials are recommended to be used on
high traffic volume (AADT > 7,000) roads, only thermoplastics and paint (or thermoplastics and
epoxy for recessed application) are recommended for low-traffic volume (AADT ≤ 7,000) roads.
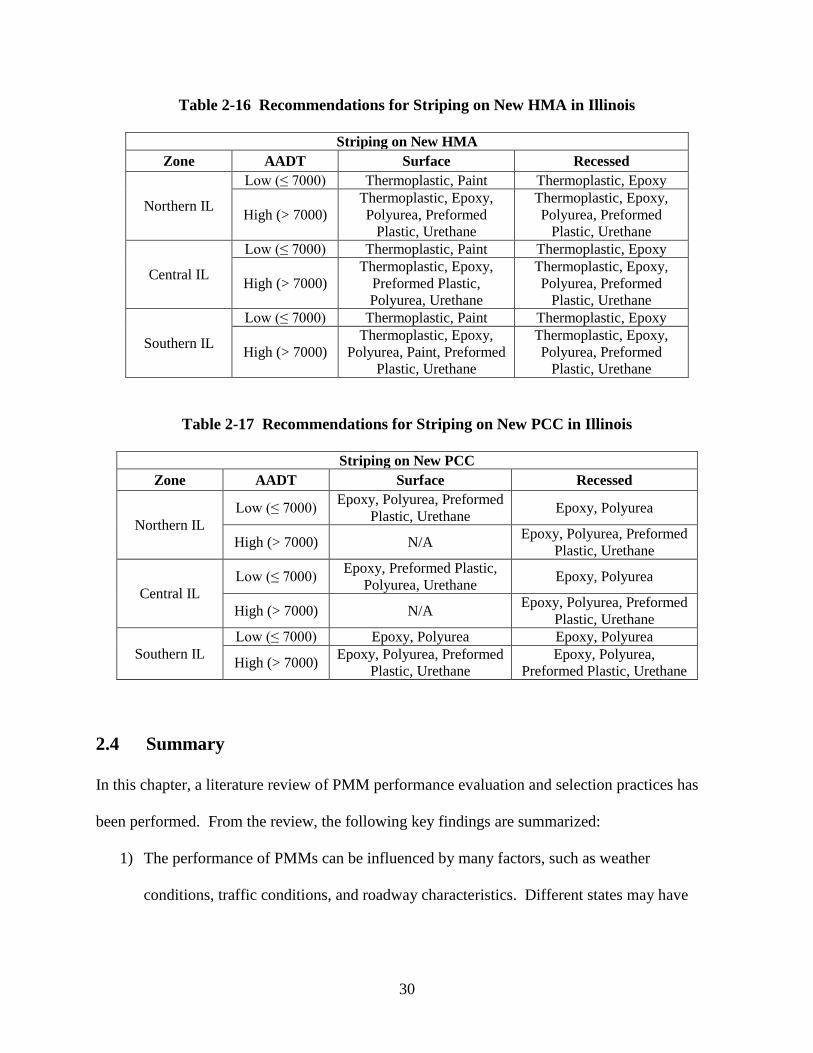
Third, IDOT recommend the use of preformed tapes on newly constructed pavements instead of
on existing pavements as maintenance striping.
29
Table 2-14 Recommendations for Striping on HMA in Illinois
Maintenance Striping on HMA
Zone AADT Pavement Service Life ≤ 5 Years Pavement Service Life > 5 Years
Surface Recessed Surface Recessed
Northern IL
Low
(≤ 7000)
Thermoplastic,
Paint
Thermoplastic,
Epoxy
Thermoplastic,
Paint
Thermoplastic,
Epoxy
High
(> 7000)
Thermoplastic,
Paint, Epoxy,
Polyurea, Urethane
Thermoplastic,
Epoxy, Urethane,
Polyurea
Thermoplastic,
Paint, Epoxy,
Polyurea, Urethane
Thermoplastic,
Epoxy, Urethane,
Polyurea
Central IL
Low
(≤ 7000)
Thermoplastic,
Paint
Thermoplastic,
Epoxy
Thermoplastic,
Paint
Thermoplastic,
Epoxy
High
(> 7000)
Thermoplastic,
Epoxy, Paint,
Urethane, Polyurea
Thermoplastic,
Epoxy, Urethane,
Polyurea
Thermoplastic,
Epoxy, Urethane,
Paint, Polyurea
Thermoplastic,
Epoxy, Polyurea,
Urethane
Southern IL
Low
(≤ 7000)
Thermoplastic,
Paint
Thermoplastic,
Epoxy
Thermoplastic,
Paint
Thermoplastic,
Epoxy
High
(> 7000)
Thermoplastic,
Paint, Epoxy,
Urethane, Polyurea
Thermoplastic,
Epoxy, Urethane,
Polyurea
Thermoplastic,
Paint, Epoxy,
Urethane, Polyurea
Thermoplastic,
Epoxy, Polyurea,
Urethane
Table 2-15 Recommendations for Striping on PCC in Illinois
Maintenance Striping on PCC
Zone AADT Pavement Service Life ≤ 5 Years Pavement Service Life > 5 Years
Surface Recessed Surface Recessed
Northern IL
Low
(≤ 7000)
Epoxy
Polyurea
Epoxy
Polyurea
Epoxy
Polyurea
Epoxy
Polyurea
High
(> 7000)
Epoxy
Polyurea
Urethane
Epoxy
Polyurea
Urethane
Epoxy
Polyurea
Urethane
Epoxy
Polyurea
Urethane
Central IL
Low
(≤ 7000)
Epoxy
Urethane
Epoxy
Polyurea
Epoxy
Urethane
Epoxy
Polyurea
High
(> 7000)
Epoxy
Urethane
Polyurea
Epoxy
Polyurea
Urethane
Epoxy
Urethane
Polyurea
Epoxy
Polyurea
Urethane
Southern IL
Low
(≤ 7000)
Epoxy
Urethane
Epoxy
Polyurea
Epoxy
Urethane
Epoxy
Polyurea
High
(> 7000)
Epoxy
Urethane
Polyurea
Epoxy
Polyurea
Urethane
Epoxy
Urethane
Polyurea
Epoxy
Polyurea
Urethane
30
Table 2-16 Recommendations for Striping on New HMA in Illinois
Striping on New HMA
Zone AADT Surface Recessed
Northern IL
Low (≤ 7000) Thermoplastic, Paint Thermoplastic, Epoxy
High (> 7000)
Thermoplastic, Epoxy,
Polyurea, Preformed
Plastic, Urethane
Thermoplastic, Epoxy,
Polyurea, Preformed
Plastic, Urethane
Central IL
Low (≤ 7000) Thermoplastic, Paint Thermoplastic, Epoxy
High (> 7000)
Thermoplastic, Epoxy,
Preformed Plastic,
Polyurea, Urethane
Thermoplastic, Epoxy,
Polyurea, Preformed
Plastic, Urethane
Southern IL
Low (≤ 7000) Thermoplastic, Paint Thermoplastic, Epoxy
High (> 7000)
Thermoplastic, Epoxy,
Polyurea, Paint, Preformed
Plastic, Urethane
Thermoplastic, Epoxy,
Polyurea, Preformed
Plastic, Urethane
Table 2-17 Recommendations for Striping on New PCC in Illinois
Striping on New PCC
Zone AADT Surface Recessed
Northern IL
Low (≤ 7000) Epoxy, Polyurea, Preformed
Plastic, Urethane Epoxy, Polyurea
High (> 7000) N/A Epoxy, Polyurea, Preformed
Plastic, Urethane
Central IL
Low (≤ 7000) Epoxy, Preformed Plastic,
Polyurea, Urethane Epoxy, Polyurea
High (> 7000) N/A Epoxy, Polyurea, Preformed
Plastic, Urethane
Southern IL
Low (≤ 7000) Epoxy, Polyurea Epoxy, Polyurea
High (> 7000) Epoxy, Polyurea, Preformed
Plastic, Urethane
Epoxy, Polyurea,
Preformed Plastic, Urethane
2.4 Summary
In this chapter, a literature review of PMM performance evaluation and selection practices has
been performed. From the review, the following key findings are summarized:
1) The performance of PMMs can be influenced by many factors, such as weather
conditions, traffic conditions, and roadway characteristics. Different states may have
31
vastly different weather and traffic conditions and, therefore, the same type of PMM may
also behave very differently.
2) Degradation modeling, especially multiple linear regression models, has been verified as
being adequate and useful for predicting the service lives of different PMMs. Important
variables of these models include time, traffic, initial retroreflectivity, weather conditions,
and installation information.
3) From the review of state DOTs’ practices, many state DOTs have developed their own
rules to select PMMs. Many different types of material have been used in states such as
Texas, Illinois, and Georgia. These states shared interest in many key factors, including
traffic characteristics or ADT, surface type (asphalt or concrete), line type (edge or
center, white or yellow), remaining service life of pavement, and weather conditions
(e.g., snow, wet, and fog). In addition, from the selection guidelines and practices of
these states, some engineering experiences (i.e., rules of thumb) are summarized as
follows:
a. Paint is usually used on low-traffic volume roads because it can only last for
approximately a year;
b. Thermoplastic is typically not recommended to be used on PCC pavements because
of the poor bonding and different surface behavior that hinder good performance of
thermoplastics on concrete pavements. In addition, to use thermoplastic on concrete
pavements, additional adhesives are needed and thus additional cost may apply;
c. Epoxy and polyurea are durable marking materials with relatively low costs; in
addition, they can be applied to both asphalt and cement concrete surfaces;
32
d. Methyl methacrylate has very limited use in the reviewed states probably because of
its relatively higher cost than other durable materials;
e. In northern states, the use of grooved/recessed pavement marking installation
technique is common, and fewer types of material can be applied because of the
effects of snow plow events.
From the review, it is also identified that there has not yet a degradation model that is based on
Georgia’s data. Moreover, several other factors, such as marking thickness and roadway
characteristics, have not yet been considered as independent variables in previous degradation
models. GDOT Test Deck provides valuable information and can serve as a starting point to
achieve this goal. In the near future, with continued collaboration with GDOT, it is our intent to
develop a Georgia-specific marking material model that comprehensively considers all factors
and variables that may have effect on the performance of PMMs and refines the PMM selection
matrix for Georgia.
33
3. ANALYSIS OF GDOT TEST DECK DATA
In this chapter, the performance of PMMs installed on GDOT Test Deck is analyzed. To
improve the reliability of performance evaluation results a methodology is first proposed in this
chapter to systematically identify and remove irregular data prior to modeling pavement marking
retroreflectivity performance.
This chapter is organized as follows. This first section gives a brief background of the GDOT
Test Deck and the data currently available. The second section summarizes some observed data
variability in GDOT Test Deck data. The third section describes the proposed methodology,
which first discusses the concerns of data quality and then depicts the proposed method to assess
and improve data quality. The fourth section shows the pavement marking performance
evaluation results, including the estimated lives of PMMs before and after the application of the
proposed methodology. The fifth section further discusses the implications of the results, as well
as a preliminary comparison between the overall performance of different materials and GDOT’s
minimum retroreflectivity requirements. The last section summarizes the findings from this
chapter.
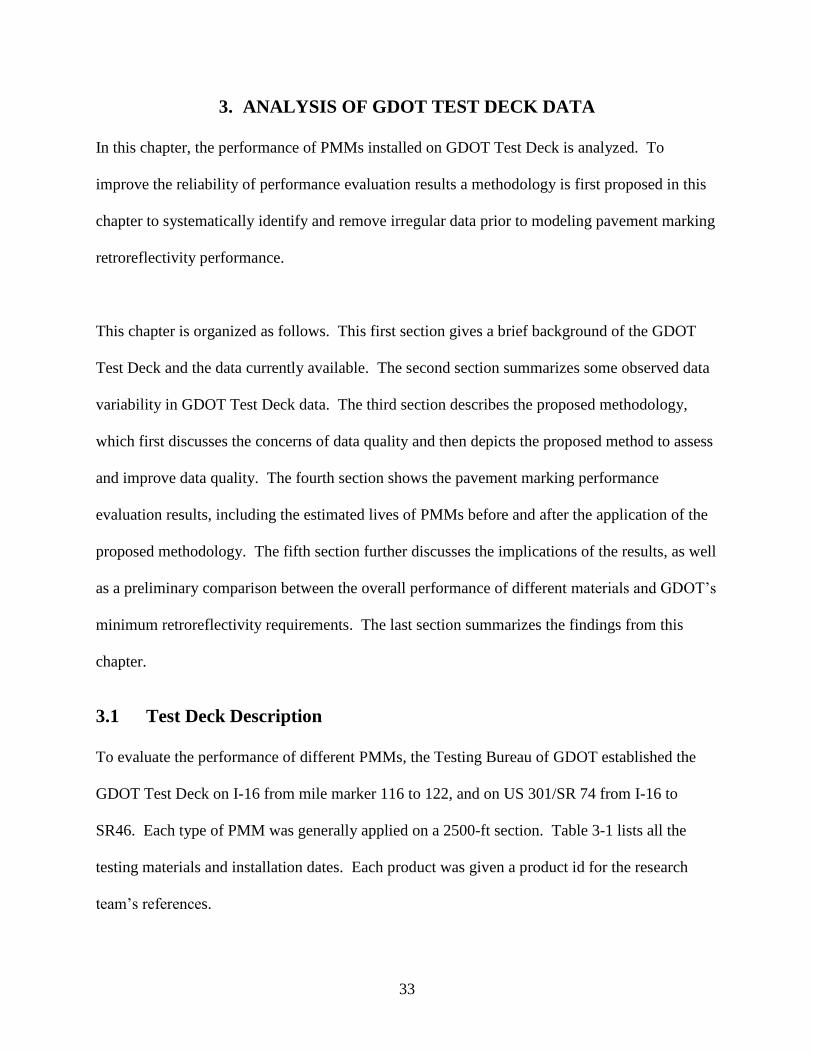
3.1 Test Deck Description
To evaluate the performance of different PMMs, the Testing Bureau of GDOT established the
GDOT Test Deck on I-16 from mile marker 116 to 122, and on US 301/SR 74 from I-16 to
SR46. Each type of PMM was generally applied on a 2500-ft section. Table 3-1 lists all the
testing materials and installation dates. Each product was given a product id for the research
team’s references.
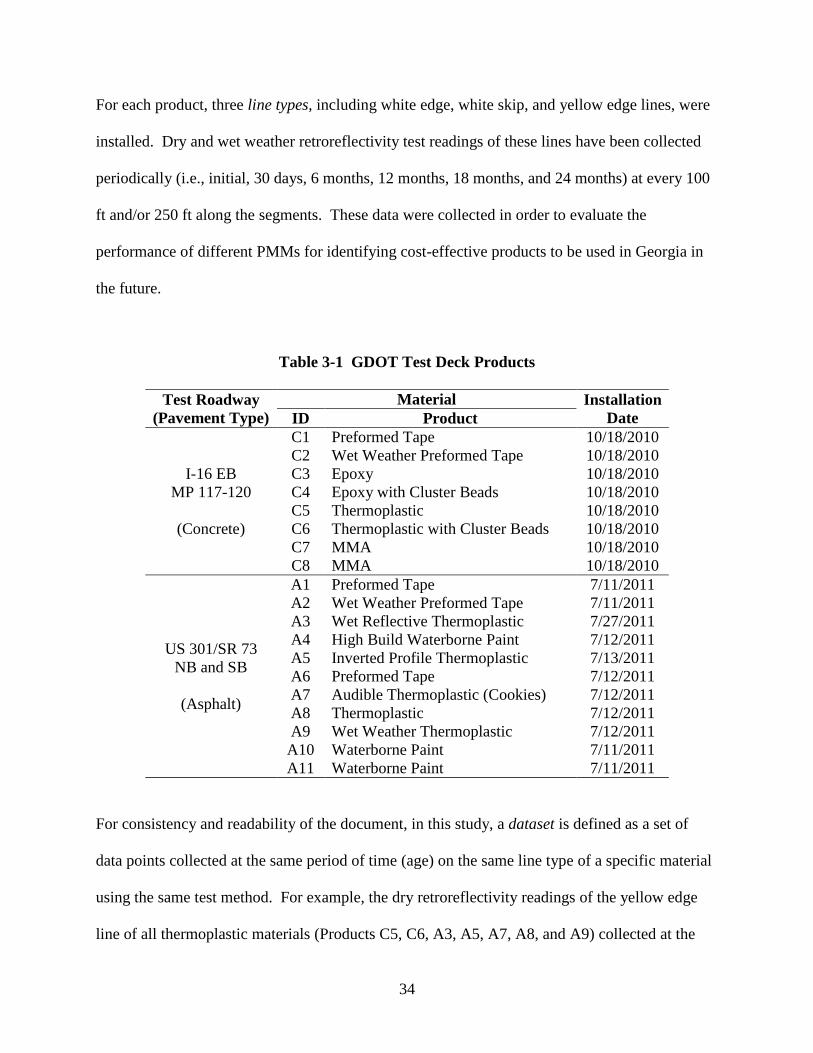
34
For each product, three line types, including white edge, white skip, and yellow edge lines, were
installed. Dry and wet weather retroreflectivity test readings of these lines have been collected
periodically (i.e., initial, 30 days, 6 months, 12 months, 18 months, and 24 months) at every 100
ft and/or 250 ft along the segments. These data were collected in order to evaluate the
performance of different PMMs for identifying cost-effective products to be used in Georgia in
the future.
Table 3-1 GDOT Test Deck Products
Test Roadway
(Pavement Type)
Material Installation
Date ID Product
I-16 EB
MP 117-120
(Concrete)
C1 Preformed Tape 10/18/2010
C2 Wet Weather Preformed Tape 10/18/2010
C3 Epoxy 10/18/2010
C4 Epoxy with Cluster Beads 10/18/2010
C5 Thermoplastic 10/18/2010
C6 Thermoplastic with Cluster Beads 10/18/2010
C7 MMA 10/18/2010
C8 MMA 10/18/2010
US 301/SR 73
NB and SB
(Asphalt)
A1 Preformed Tape 7/11/2011
A2 Wet Weather Preformed Tape 7/11/2011
A3 Wet Reflective Thermoplastic 7/27/2011
A4 High Build Waterborne Paint 7/12/2011
A5 Inverted Profile Thermoplastic 7/13/2011
A6 Preformed Tape 7/12/2011
A7 Audible Thermoplastic (Cookies) 7/12/2011
A8 Thermoplastic 7/12/2011
A9 Wet Weather Thermoplastic 7/12/2011
A10 Waterborne Paint 7/11/2011
A11 Waterborne Paint 7/11/2011
For consistency and readability of the document, in this study, a dataset is defined as a set of
data points collected at the same period of time (age) on the same line type of a specific material
using the same test method. For example, the dry retroreflectivity readings of the yellow edge
line of all thermoplastic materials (Products C5, C6, A3, A5, A7, A8, and A9) collected at the
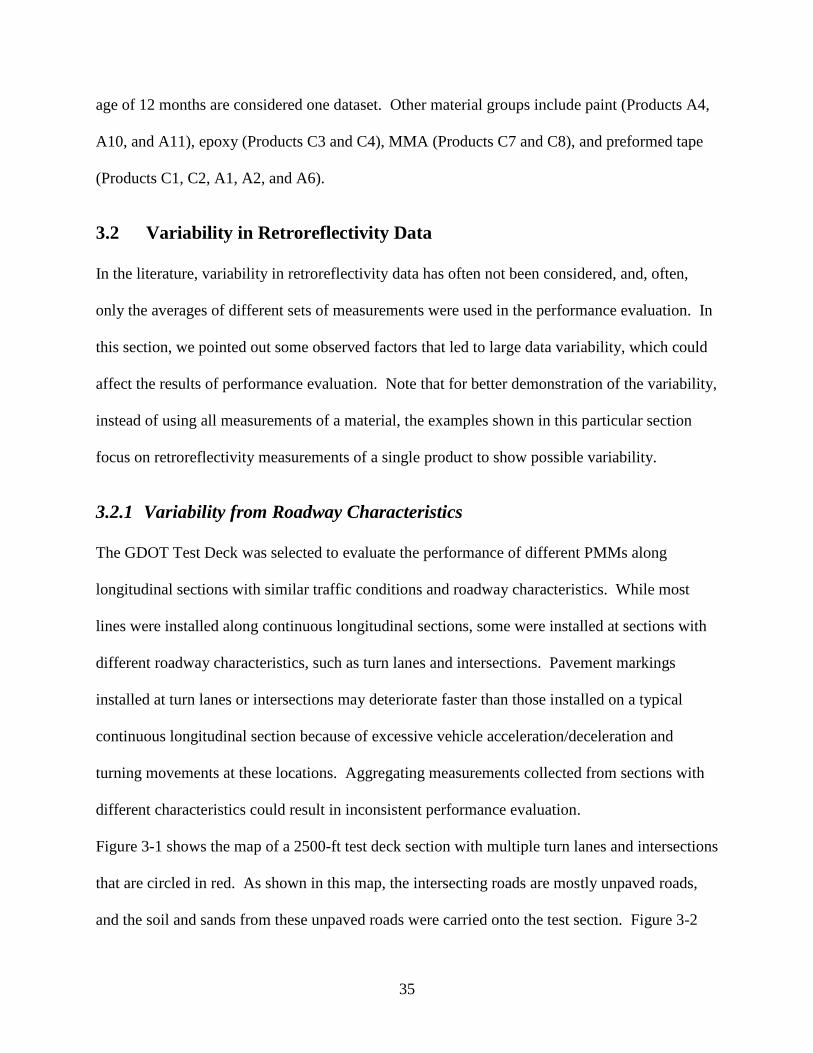
35
age of 12 months are considered one dataset. Other material groups include paint (Products A4,
A10, and A11), epoxy (Products C3 and C4), MMA (Products C7 and C8), and preformed tape
(Products C1, C2, A1, A2, and A6).
3.2 Variability in Retroreflectivity Data
In the literature, variability in retroreflectivity data has often not been considered, and, often,
only the averages of different sets of measurements were used in the performance evaluation. In
this section, we pointed out some observed factors that led to large data variability, which could
affect the results of performance evaluation. Note that for better demonstration of the variability,
instead of using all measurements of a material, the examples shown in this particular section
focus on retroreflectivity measurements of a single product to show possible variability.
3.2.1 Variability from Roadway Characteristics
The GDOT Test Deck was selected to evaluate the performance of different PMMs along
longitudinal sections with similar traffic conditions and roadway characteristics. While most
lines were installed along continuous longitudinal sections, some were installed at sections with
different roadway characteristics, such as turn lanes and intersections. Pavement markings
installed at turn lanes or intersections may deteriorate faster than those installed on a typical
continuous longitudinal section because of excessive vehicle acceleration/deceleration and
turning movements at these locations. Aggregating measurements collected from sections with
different characteristics could result in inconsistent performance evaluation.
Figure 3-1 shows the map of a 2500-ft test deck section with multiple turn lanes and intersections
that are circled in red. As shown in this map, the intersecting roads are mostly unpaved roads,
and the soil and sands from these unpaved roads were carried onto the test section. Figure 3-2
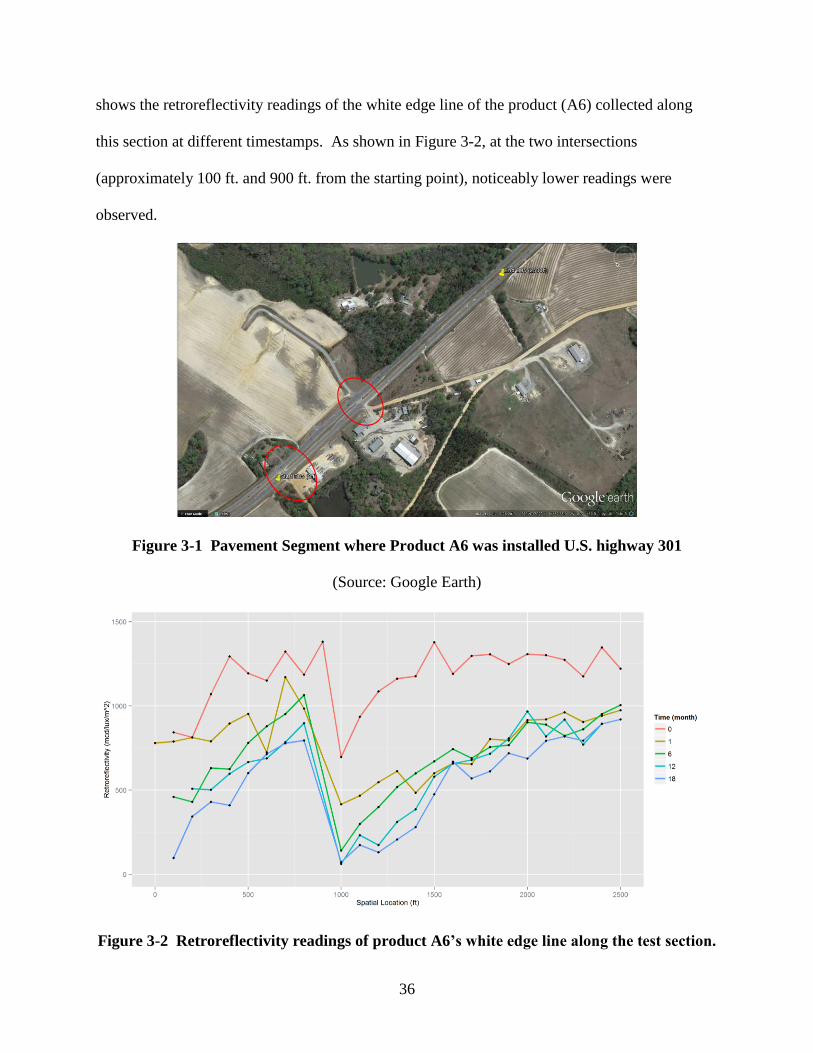
36
shows the retroreflectivity readings of the white edge line of the product (A6) collected along
this section at different timestamps. As shown in Figure 3-2, at the two intersections
(approximately 100 ft. and 900 ft. from the starting point), noticeably lower readings were
observed.
Figure 3-1 Pavement Segment where Product A6 was installed U.S. highway 301
(Source: Google Earth)
Figure 3-2 Retroreflectivity readings of product A6’s white edge line along the test section.
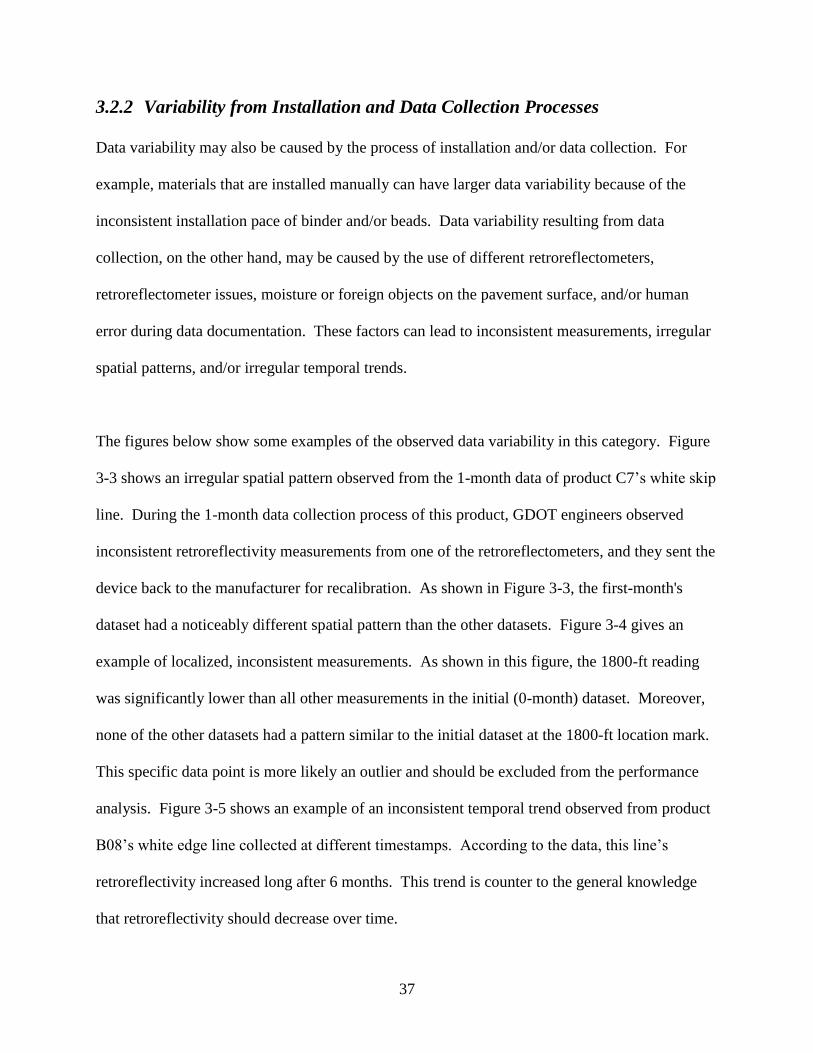
37
3.2.2 Variability from Installation and Data Collection Processes
Data variability may also be caused by the process of installation and/or data collection. For
example, materials that are installed manually can have larger data variability because of the
inconsistent installation pace of binder and/or beads. Data variability resulting from data
collection, on the other hand, may be caused by the use of different retroreflectometers,
retroreflectometer issues, moisture or foreign objects on the pavement surface, and/or human
error during data documentation. These factors can lead to inconsistent measurements, irregular
spatial patterns, and/or irregular temporal trends.
The figures below show some examples of the observed data variability in this category. Figure
3-3 shows an irregular spatial pattern observed from the 1-month data of product C7’s white skip
line. During the 1-month data collection process of this product, GDOT engineers observed
inconsistent retroreflectivity measurements from one of the retroreflectometers, and they sent the
device back to the manufacturer for recalibration. As shown in Figure 3-3, the first-month's
dataset had a noticeably different spatial pattern than the other datasets. Figure 3-4 gives an
example of localized, inconsistent measurements. As shown in this figure, the 1800-ft reading
was significantly lower than all other measurements in the initial (0-month) dataset. Moreover,
none of the other datasets had a pattern similar to the initial dataset at the 1800-ft location mark.
This specific data point is more likely an outlier and should be excluded from the performance
analysis. Figure 3-5 shows an example of an inconsistent temporal trend observed from product
B08’s white edge line collected at different timestamps. According to the data, this line’s
retroreflectivity increased long after 6 months. This trend is counter to the general knowledge
that retroreflectivity should decrease over time.
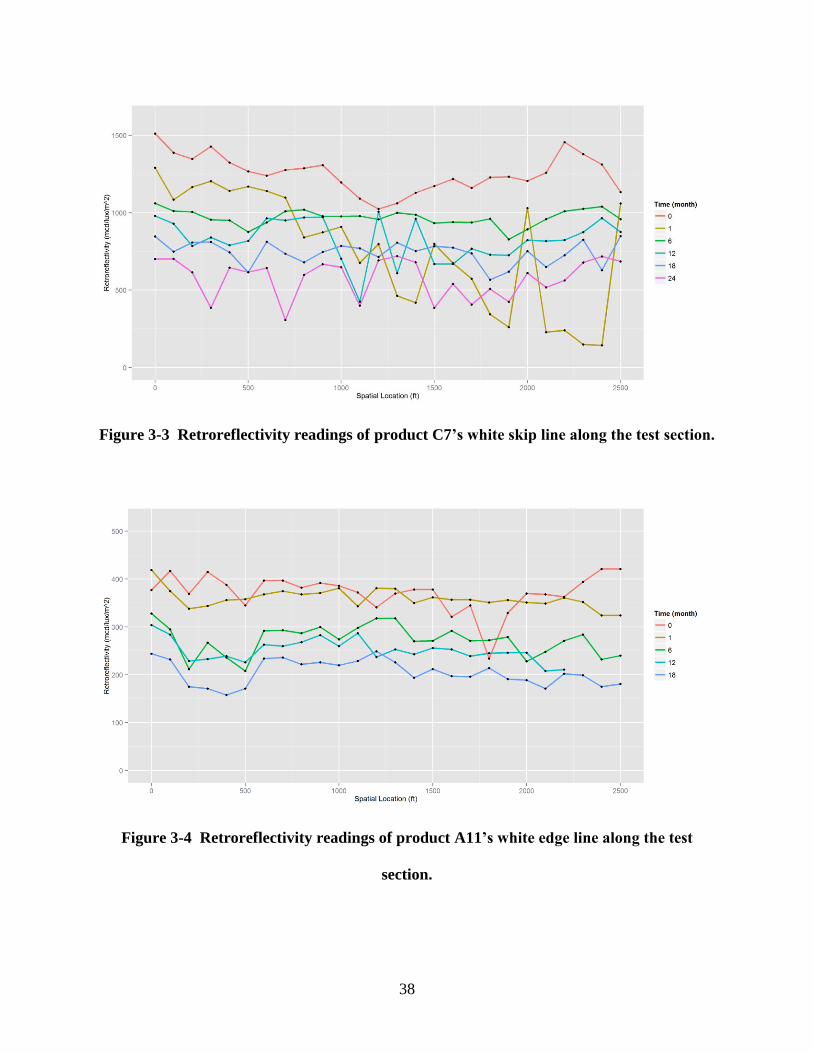
38
Figure 3-3 Retroreflectivity readings of product C7’s white skip line along the test section.
Figure 3-4 Retroreflectivity readings of product A11’s white edge line along the test
section.
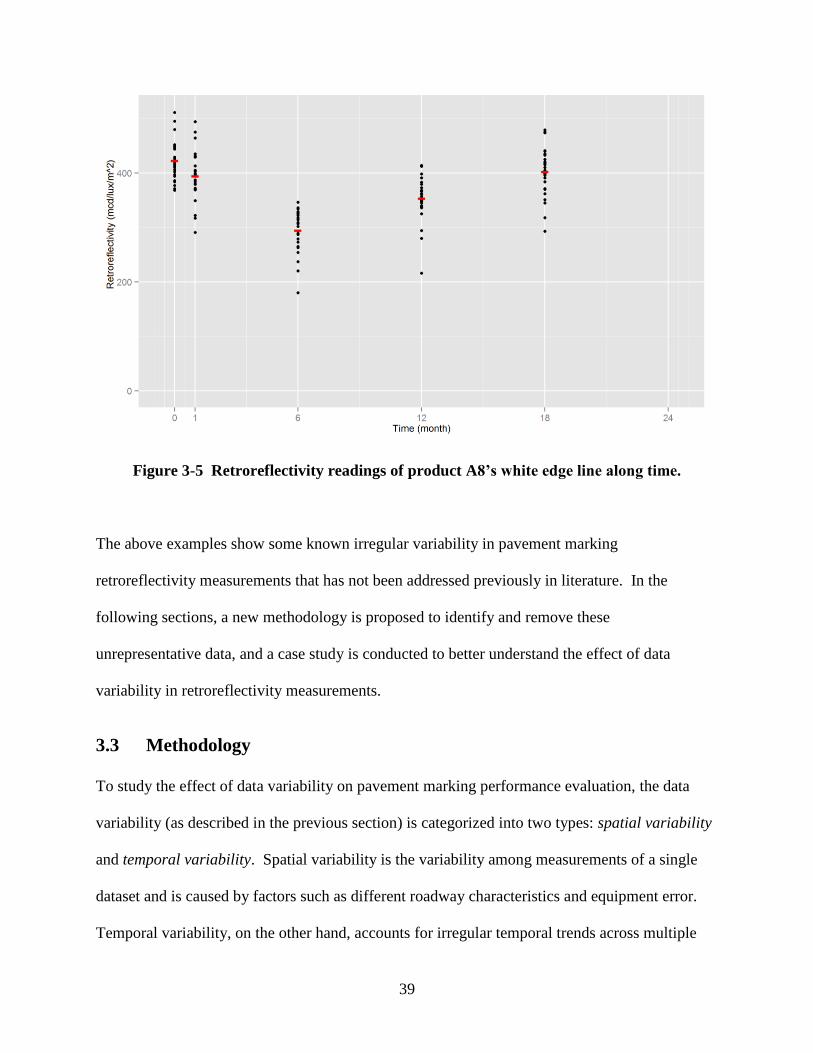
39
Figure 3-5 Retroreflectivity readings of product A8’s white edge line along time.
The above examples show some known irregular variability in pavement marking
retroreflectivity measurements that has not been addressed previously in literature. In the
following sections, a new methodology is proposed to identify and remove these
unrepresentative data, and a case study is conducted to better understand the effect of data
variability in retroreflectivity measurements.
3.3 Methodology
To study the effect of data variability on pavement marking performance evaluation, the data
variability (as described in the previous section) is categorized into two types: spatial variability
and temporal variability. Spatial variability is the variability among measurements of a single
dataset and is caused by factors such as different roadway characteristics and equipment error.
Temporal variability, on the other hand, accounts for irregular temporal trends across multiple
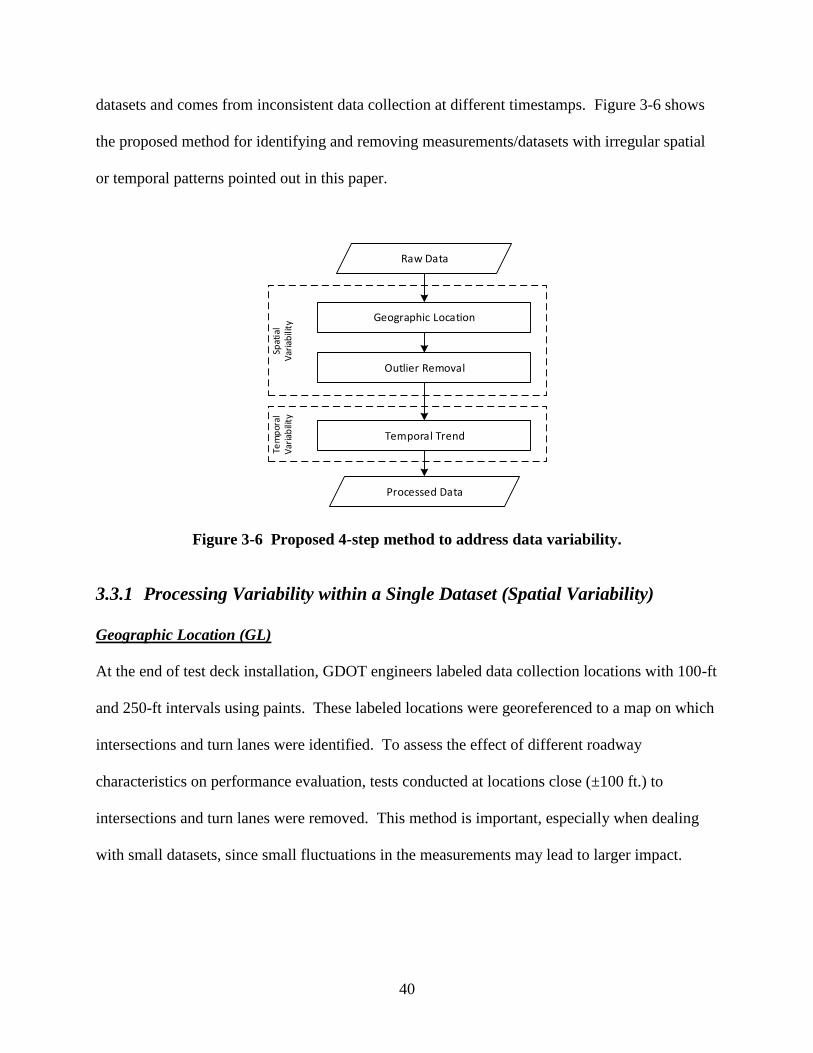
40
datasets and comes from inconsistent data collection at different timestamps. Figure 3-6 shows
the proposed method for identifying and removing measurements/datasets with irregular spatial
or temporal patterns pointed out in this paper.
Tem
por
al
Var
iab
ility
Spat
ial
Var
iab
ility
Raw Data
Geographic Location
Outlier Removal
Temporal Trend
Processed Data
Figure 3-6 Proposed 4-step method to address data variability.
3.3.1 Processing Variability within a Single Dataset (Spatial Variability)
Geographic Location (GL)
At the end of test deck installation, GDOT engineers labeled data collection locations with 100-ft
and 250-ft intervals using paints. These labeled locations were georeferenced to a map on which
intersections and turn lanes were identified. To assess the effect of different roadway
characteristics on performance evaluation, tests conducted at locations close (±100 ft.) to
intersections and turn lanes were removed. This method is important, especially when dealing
with small datasets, since small fluctuations in the measurements may lead to larger impact.
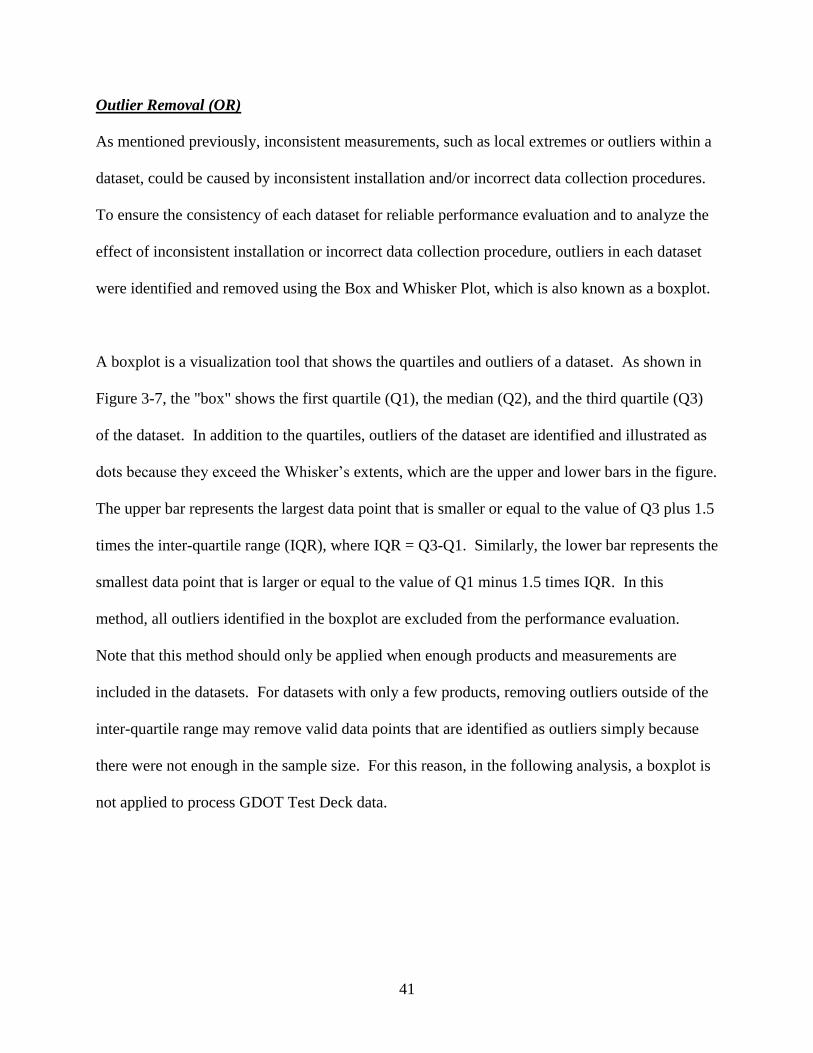
41
Outlier Removal (OR)
As mentioned previously, inconsistent measurements, such as local extremes or outliers within a
dataset, could be caused by inconsistent installation and/or incorrect data collection procedures.
To ensure the consistency of each dataset for reliable performance evaluation and to analyze the
effect of inconsistent installation or incorrect data collection procedure, outliers in each dataset
were identified and removed using the Box and Whisker Plot, which is also known as a boxplot.
A boxplot is a visualization tool that shows the quartiles and outliers of a dataset. As shown in
Figure 3-7, the "box" shows the first quartile (Q1), the median (Q2), and the third quartile (Q3)
of the dataset. In addition to the quartiles, outliers of the dataset are identified and illustrated as
dots because they exceed the Whisker’s extents, which are the upper and lower bars in the figure.
The upper bar represents the largest data point that is smaller or equal to the value of Q3 plus 1.5
times the inter-quartile range (IQR), where IQR = Q3-Q1. Similarly, the lower bar represents the
smallest data point that is larger or equal to the value of Q1 minus 1.5 times IQR. In this
method, all outliers identified in the boxplot are excluded from the performance evaluation.
Note that this method should only be applied when enough products and measurements are
included in the datasets. For datasets with only a few products, removing outliers outside of the
inter-quartile range may remove valid data points that are identified as outliers simply because
there were not enough in the sample size. For this reason, in the following analysis, a boxplot is
not applied to process GDOT Test Deck data.
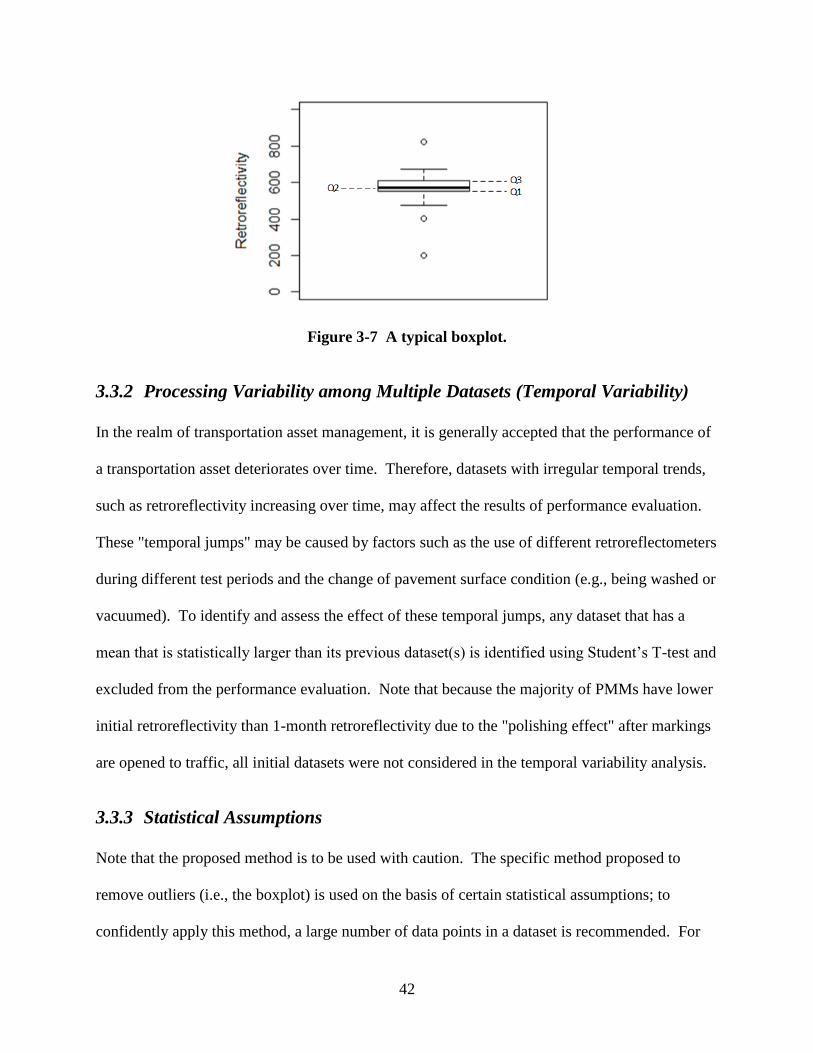
42
Figure 3-7 A typical boxplot.
3.3.2 Processing Variability among Multiple Datasets (Temporal Variability)
In the realm of transportation asset management, it is generally accepted that the performance of
a transportation asset deteriorates over time. Therefore, datasets with irregular temporal trends,
such as retroreflectivity increasing over time, may affect the results of performance evaluation.
These "temporal jumps" may be caused by factors such as the use of different retroreflectometers
during different test periods and the change of pavement surface condition (e.g., being washed or
vacuumed). To identify and assess the effect of these temporal jumps, any dataset that has a
mean that is statistically larger than its previous dataset(s) is identified using Student’s T-test and
excluded from the performance evaluation. Note that because the majority of PMMs have lower
initial retroreflectivity than 1-month retroreflectivity due to the "polishing effect" after markings
are opened to traffic, all initial datasets were not considered in the temporal variability analysis.
3.3.3 Statistical Assumptions
Note that the proposed method is to be used with caution. The specific method proposed to
remove outliers (i.e., the boxplot) is used on the basis of certain statistical assumptions; to
confidently apply this method, a large number of data points in a dataset is recommended. For
43
GDOT Test Deck, since most materials only had fewer than 5 products, using the outlier removal
approach may have, in fact, accidentally removed valid measurements. Therefore, in this
chapter, we only apply the Student’s t-test to eliminate temporal variability and to demonstrate
the proposed methodology. In future research, it is our intent to incorporate more pavement
marking retroreflectivity measurements collected in Georgia to apply the full methodology.
3.3.4 Performance Evaluation
The performance of a PMM is usually presented by its service life. To evaluate the service life,
various studies were conducted using statistical regression analysis, artificial neural networks,
and other means. One popular method for performance evaluation uses the best-fitted curve to
estimate the service life against the elapsed time or cumulative traffic (Kopf, 2004; Migletz et al.,
2001). However, as discussed above, most previous studies used the average readings for
performance evaluation. In this chapter, instead of using the average reading of a material, we
fitted all retroreflectivity measurements of all products in the material (except for the initial
readings because pavement marking’s retroreflectivity usually picks up after it is opened to
traffic) to the following commonly used models:
1. Linear model: 𝑅𝐿 = 𝑎 + 𝑏 ∙ 𝑀𝑜𝑛𝑡ℎ (1)
2. Exponential decay model: 𝑅𝐿 = 𝑎 ∙ e𝑏∙𝑀𝑜𝑛𝑡ℎ (2)
where
Month = Elapsed time, measured in month
𝑅𝐿 = Retroreflectivity, measured in mcd/m2/lux
a, b = Model coefficients
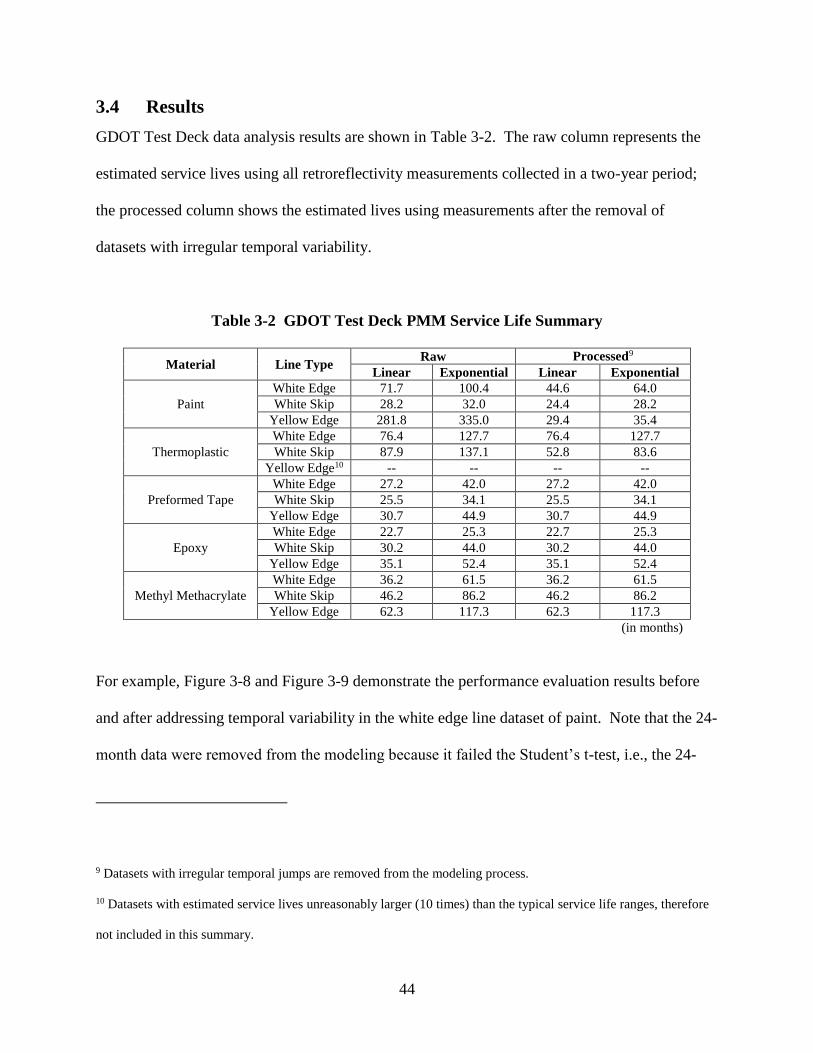
44
3.4 Results
GDOT Test Deck data analysis results are shown in Table 3-2. The raw column represents the
estimated service lives using all retroreflectivity measurements collected in a two-year period;
the processed column shows the estimated lives using measurements after the removal of
datasets with irregular temporal variability.
Table 3-2 GDOT Test Deck PMM Service Life Summary
Material Line Type Raw Processed9
Linear Exponential Linear Exponential
Paint
White Edge 71.7 100.4 44.6 64.0
White Skip 28.2 32.0 24.4 28.2
Yellow Edge 281.8 335.0 29.4 35.4
Thermoplastic
White Edge 76.4 127.7 76.4 127.7
White Skip 87.9 137.1 52.8 83.6
Yellow Edge10 -- -- -- --
Preformed Tape
White Edge 27.2 42.0 27.2 42.0
White Skip 25.5 34.1 25.5 34.1
Yellow Edge 30.7 44.9 30.7 44.9
Epoxy
White Edge 22.7 25.3 22.7 25.3
White Skip 30.2 44.0 30.2 44.0
Yellow Edge 35.1 52.4 35.1 52.4
Methyl Methacrylate
White Edge 36.2 61.5 36.2 61.5
White Skip 46.2 86.2 46.2 86.2
Yellow Edge 62.3 117.3 62.3 117.3
(in months)
For example, Figure 3-8 and Figure 3-9 demonstrate the performance evaluation results before
and after addressing temporal variability in the white edge line dataset of paint. Note that the 24-
month data were removed from the modeling because it failed the Student’s t-test, i.e., the 24-
9 Datasets with irregular temporal jumps are removed from the modeling process.
10 Datasets with estimated service lives unreasonably larger (10 times) than the typical service life ranges, therefore
not included in this summary.
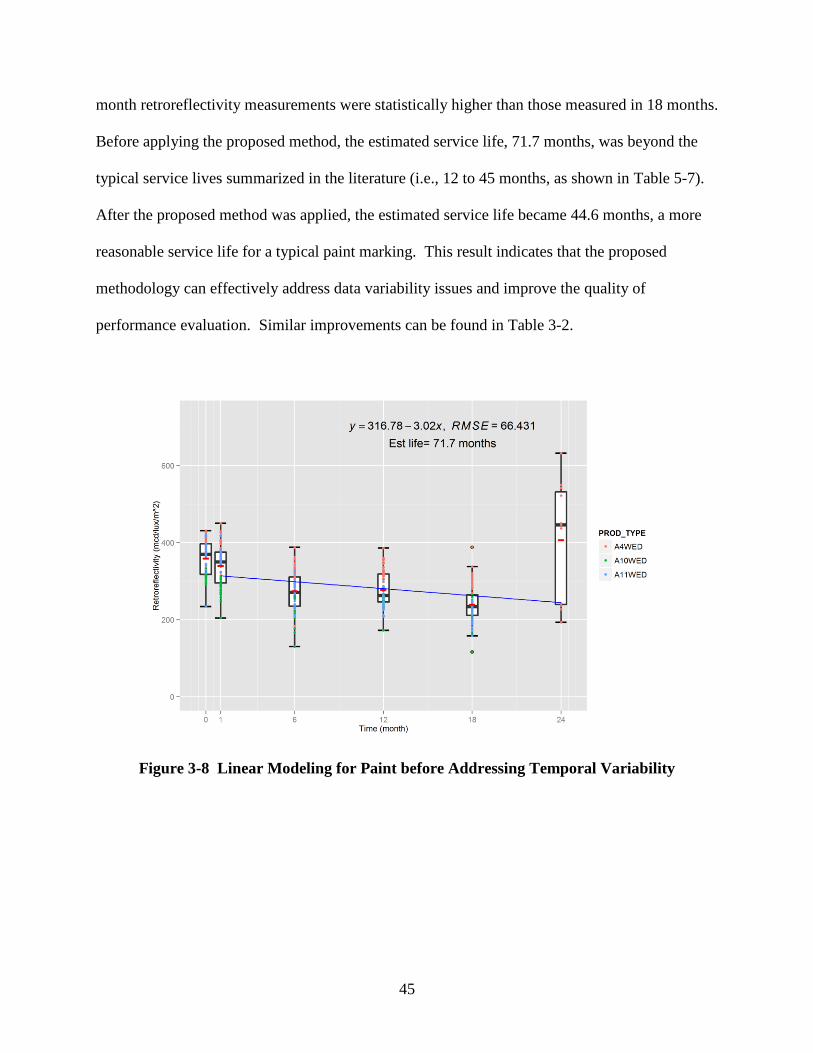
45
month retroreflectivity measurements were statistically higher than those measured in 18 months.
Before applying the proposed method, the estimated service life, 71.7 months, was beyond the
typical service lives summarized in the literature (i.e., 12 to 45 months, as shown in Table 5-7).
After the proposed method was applied, the estimated service life became 44.6 months, a more
reasonable service life for a typical paint marking. This result indicates that the proposed
methodology can effectively address data variability issues and improve the quality of
performance evaluation. Similar improvements can be found in Table 3-2.
Figure 3-8 Linear Modeling for Paint before Addressing Temporal Variability
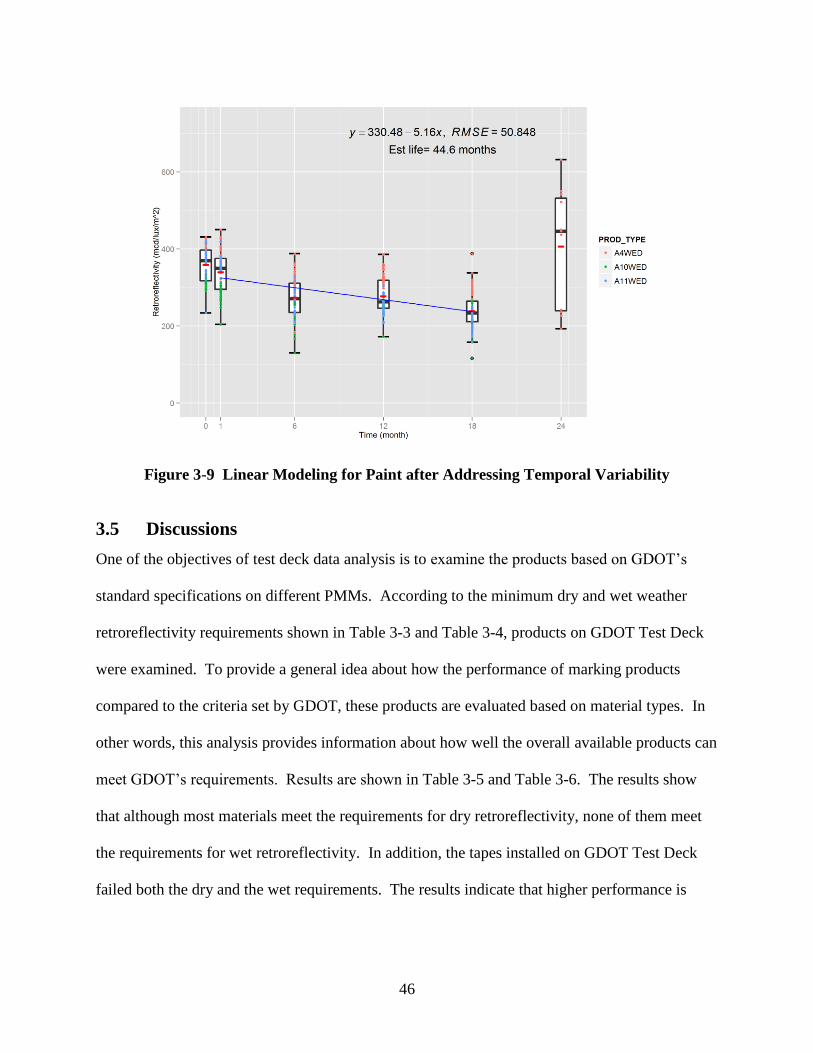
46
Figure 3-9 Linear Modeling for Paint after Addressing Temporal Variability
3.5 Discussions
One of the objectives of test deck data analysis is to examine the products based on GDOT’s
standard specifications on different PMMs. According to the minimum dry and wet weather
retroreflectivity requirements shown in Table 3-3 and Table 3-4, products on GDOT Test Deck
were examined. To provide a general idea about how the performance of marking products
compared to the criteria set by GDOT, these products are evaluated based on material types. In
other words, this analysis provides information about how well the overall available products can
meet GDOT’s requirements. Results are shown in Table 3-5 and Table 3-6. The results show
that although most materials meet the requirements for dry retroreflectivity, none of them meet
the requirements for wet retroreflectivity. In addition, the tapes installed on GDOT Test Deck
failed both the dry and the wet requirements. The results indicate that higher performance is
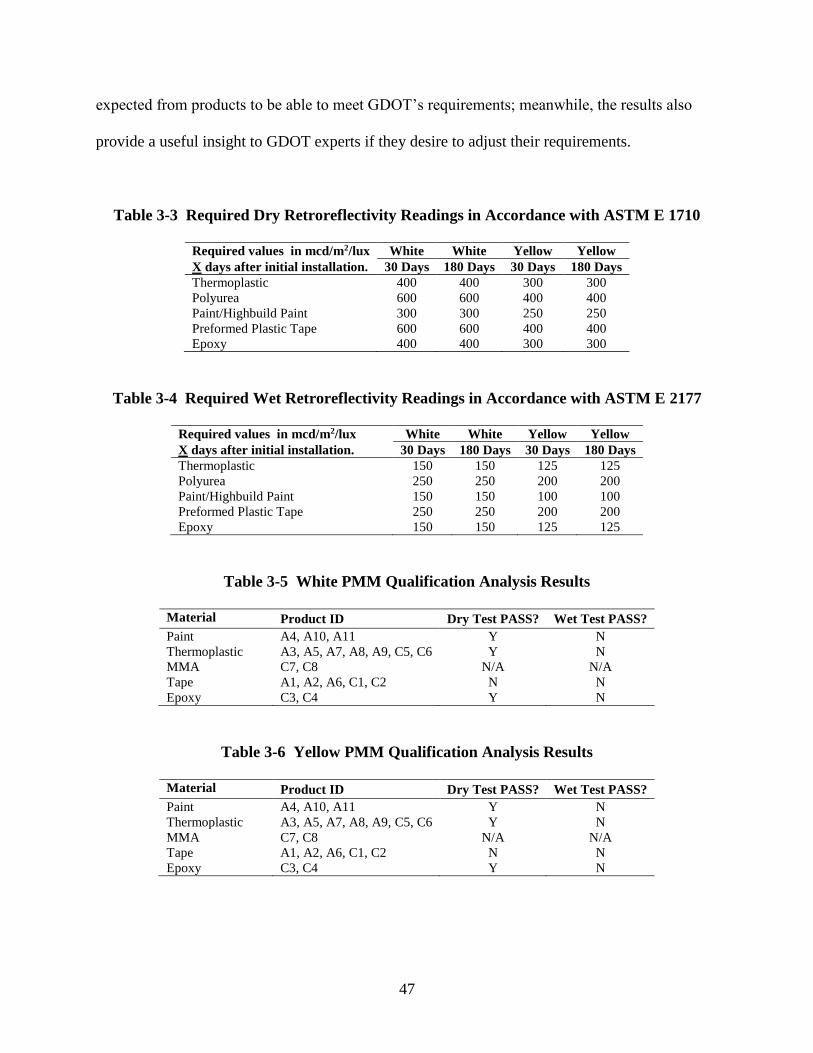
47
expected from products to be able to meet GDOT’s requirements; meanwhile, the results also
provide a useful insight to GDOT experts if they desire to adjust their requirements.
Table 3-3 Required Dry Retroreflectivity Readings in Accordance with ASTM E 1710
Required values in mcd/m2/lux White White Yellow Yellow
X days after initial installation. 30 Days 180 Days 30 Days 180 Days
Thermoplastic 400 400 300 300
Polyurea 600 600 400 400
Paint/Highbuild Paint 300 300 250 250
Preformed Plastic Tape 600 600 400 400
Epoxy 400 400 300 300
Table 3-4 Required Wet Retroreflectivity Readings in Accordance with ASTM E 2177
Required values in mcd/m2/lux White White Yellow Yellow
X days after initial installation. 30 Days 180 Days 30 Days 180 Days
Thermoplastic 150 150 125 125
Polyurea 250 250 200 200
Paint/Highbuild Paint 150 150 100 100
Preformed Plastic Tape 250 250 200 200
Epoxy 150 150 125 125
Table 3-5 White PMM Qualification Analysis Results
Material Product ID Dry Test PASS? Wet Test PASS?
Paint A4, A10, A11 Y N
Thermoplastic A3, A5, A7, A8, A9, C5, C6 Y N
MMA C7, C8 N/A N/A
Tape A1, A2, A6, C1, C2 N N
Epoxy C3, C4 Y N
Table 3-6 Yellow PMM Qualification Analysis Results
Material Product ID Dry Test PASS? Wet Test PASS?
Paint A4, A10, A11 Y N
Thermoplastic A3, A5, A7, A8, A9, C5, C6 Y N
MMA C7, C8 N/A N/A
Tape A1, A2, A6, C1, C2 N N
Epoxy C3, C4 Y N
48
3.6 Summary
In this chapter, a method was proposed to improve the reliability of PMM performance
evaluation based on GDOT Test Deck data, using a series of data preprocessing and cleansing
steps based on descriptive statistics. By applying the proposed method, retroreflectivity readings
of each dataset were critically evaluated and their reliabilities could be improved by removing
data with irregular spatial and temporal variability. The findings of this chapter are summarized
as follows:
1) Characteristics and factors that cause spatial and temporal variability in field-collected
retroreflectivity measurements were identified in this study. Irregular spatial and
temporal variability can be shown in the form of irregular spatial patterns, local extremes,
and increasing temporal trends. The proposed method used the geographic locations and
descriptive statistics of measurements (i.e., a boxplot) to identify and remove irregular
spatial variability; it also addressed irregular temporal variability by identifying datasets
with increasing trends using statistical tests;
2) Results indicate that before and after applying the proposed method, significant
differences can be observed in the estimated lives of these test deck products. Moreover,
the R-squared values, which represent the goodness-of-fit of performance evaluation
models, were improved after applying the proposed method, indicating that the
evaluation results were more reliable when irregular variability was addressed;
3) The study suggests that current practices, which use mostly the average retroreflectivity
and ignore possible spatial and temporal variability, can lead to inconsistent service life
estimation results; and
4) The study also demonstrates that the proposed method can improve data quality for
reliably evaluating PMM performance in compared with an average method.
From this study, the following recommendations are summarized:
49
1) A larger data set, including the data collected in other state DOTs, can be further tested
by using the proposed method and further developing more comprehensive pavement
marking performance models that are more specific to Georgia;
2) The proposed method can be modified and expanded for the quality assurance/quality
control (QA/QC) of the routine pavement marking installation and data collection;
3) The results of the evaluation of the retroreflectivity requirements can be taken into
considerations for future adjustments of retroreflectivity requirements, or for acquiring
pavement marking products with better quality.

50
51
4. ANALYSIS OF NATIONAL TRANSPORTATION PRODUCT
EVALUATION PROGRAM DATA
Since 1994, the American Association of State Highway and Transportation Officials’
(AASHTO) NTPEP has tested numerous transportation products and provided results to the
participating state DOTs and manufacturers. The most recent test results are stored in the
DataMine 2.0 database (DataMine hereafter), which is a publicly accessible online database
(National Transportation Product Evaluation Program, 2015a).
In this chapter, the effect of winter effects on retroreflectivity using all available data in
DataMine was observed. Since severe winter weather events (e.g., snowplows) are not a primary
concern in Georgia, NTPEP data affected by winter weather events were excluded from the
analysis. Then, retroreflectivity degradation models were developed to predict pavement
marking retroreflectivity using NTPEP data, excluding those that had been affected by winter
weather events (such as snowplows). Finally, expected service lives of marking materials were
derived from the models developed.
4.1 NTPEP Data Description
Available field test data in DataMine include (1) installation data, such as installation date, air,
road, and material temperatures, applied thickness, material composition, and bead properties;
and (2) inspection data, such as inspection date and interval, retroreflectivity, durability, and
color measurements. Table 4-1 and Table 4-2 show the detailed data available.
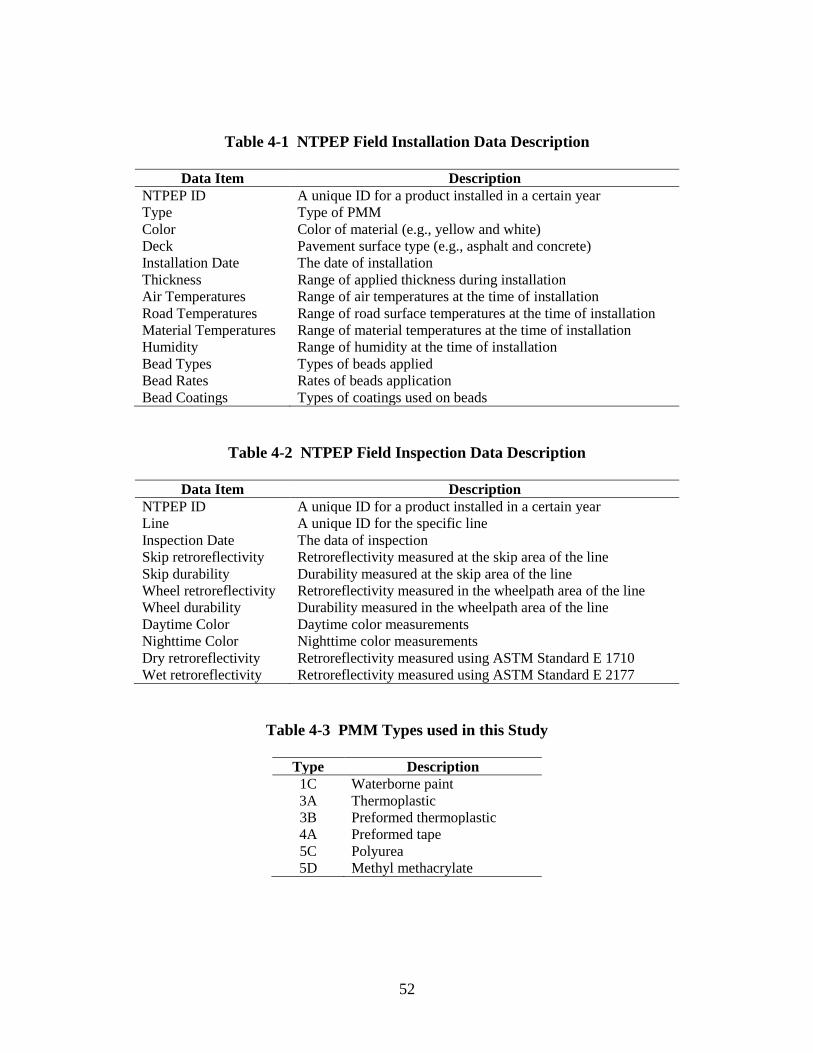
52
Table 4-1 NTPEP Field Installation Data Description
Data Item Description
NTPEP ID A unique ID for a product installed in a certain year
Type Type of PMM
Color Color of material (e.g., yellow and white)
Deck Pavement surface type (e.g., asphalt and concrete)
Installation Date The date of installation
Thickness Range of applied thickness during installation
Air Temperatures Range of air temperatures at the time of installation
Road Temperatures Range of road surface temperatures at the time of installation
Material Temperatures Range of material temperatures at the time of installation
Humidity Range of humidity at the time of installation
Bead Types Types of beads applied
Bead Rates Rates of beads application
Bead Coatings Types of coatings used on beads
Table 4-2 NTPEP Field Inspection Data Description
Data Item Description
NTPEP ID A unique ID for a product installed in a certain year
Line A unique ID for the specific line
Inspection Date The data of inspection
Skip retroreflectivity Retroreflectivity measured at the skip area of the line
Skip durability Durability measured at the skip area of the line
Wheel retroreflectivity Retroreflectivity measured in the wheelpath area of the line
Wheel durability Durability measured in the wheelpath area of the line
Daytime Color Daytime color measurements
Nighttime Color Nighttime color measurements
Dry retroreflectivity Retroreflectivity measured using ASTM Standard E 1710
Wet retroreflectivity Retroreflectivity measured using ASTM Standard E 2177
Table 4-3 PMM Types used in this Study
Type Description
1C Waterborne paint
3A Thermoplastic
3B Preformed thermoplastic
4A Preformed tape
5C Polyurea
5D Methyl methacrylate
53
Data used in this study include the available field test data of several materials in DataMine,
which consists of data from 7 test decks in 3 states (Pennsylvania, Florida, and Minnesota)
between 2008 and 2015. On each test deck, yellow and white pavement marking products were
installed on asphalt and concrete sub-decks, and tests were conducted periodically (every month
in the first year and every three months thereafter) throughout a three-year analysis period. For
the six subject materials (see Table 4-3), there were 3,720 lines installed on the 7 test decks and a
total of 26,166 inspection data entries used in this study (after excluding data affected by winter
weather events, as discussed in Section 4.2).
Note that all pavement marking lines were installed in the transverse direction based on
NTPEP’s test deck standard design, and accelerated degradation in retroreflectivity may be
expected (Hummer et al., 2011; Zhang & Wu, 2006). With that in mind, all retroreflectivity data
used in this study were measurements collected in "skip areas" (i.e., within 9 in. to the long skip
line in the corresponding lane), which are “considered to represent long line retroreflectivity
performance” (National Transportation Product Evaluation Program, 2015b). Interested readers
can find more details on the relationships between the performance of transverse and long lines
in the study published by Pike and Songchitruksa (2015). In addition to NTPEP data, other data
including ADT and average truck traffic (ADTT) were retrieved from the respective state DOTs'
traffic data websites (Florida Department of Transportation, 2014; Minnesota Department of
Transportation, 2015; Pennsylvania Department of Transportation, 2015) or provided by the
corresponding DOTs.
54
4.2 Preliminary Observation of the Effect of Winter Weather Events
In order to better understand the effect of winter weather events and incorporate it into
retroreflectivity modeling, the change of retroreflectivity must be examined. Figure 4-1 shows
the degradation of MMA in Florida and Pennsylvania over time. Each dot in the figure
represents one retroreflectivity measurement, and each line in the figure connects all
measurements made on an actual pavement marking line at different times. For each inspection
interval, a boxplot is drawn to see the distribution of retroreflectivity measurements in this
interval. The bounding box in each boxplot shows the range of the middle 50 percentile of the
points. Three horizontal lines of a bounding box denote the 25th, 50th, and 75th percentiles of
the measurements in one interval. For instance, the three percentiles of interval 0 in Florida are
approximately 360, 640, and 800 mcd/m2/lux, respectively. Note that these graphs were
summarized from multiple test decks within each state (2 decks in Florida and 3 decks in
Pennsylvania), and some intervals were either not collected due to weather conditions or have
not yet been collected/reported. For example, measurements between intervals 6 and 8 in all
three Pennsylvania test decks were not collected due to severe winter weather conditions.
By comparing the changes in retroreflectivity in the two plots in Figure 4-1, interesting findings
can be observed. In the first six intervals, the two states shared some similar degradation
patterns. Retroreflectivity measurements in both states ranged from approximately 200 to 1,700
mcd/m2/lux at interval 0, and these ranges gradually decreased in the first 6 intervals. Moreover,
most median readings of these intervals were around 500 mcd/m2/lux. Nevertheless, these
similar patterns disappeared thereafter. While retroreflectivity measurements continued to
gradually deteriorate in Florida, a dramatic decrease in retroreflectivity was observed between
intervals 5 and 9, i.e., the first winter, in Pennsylvania. The median measurements dropped from
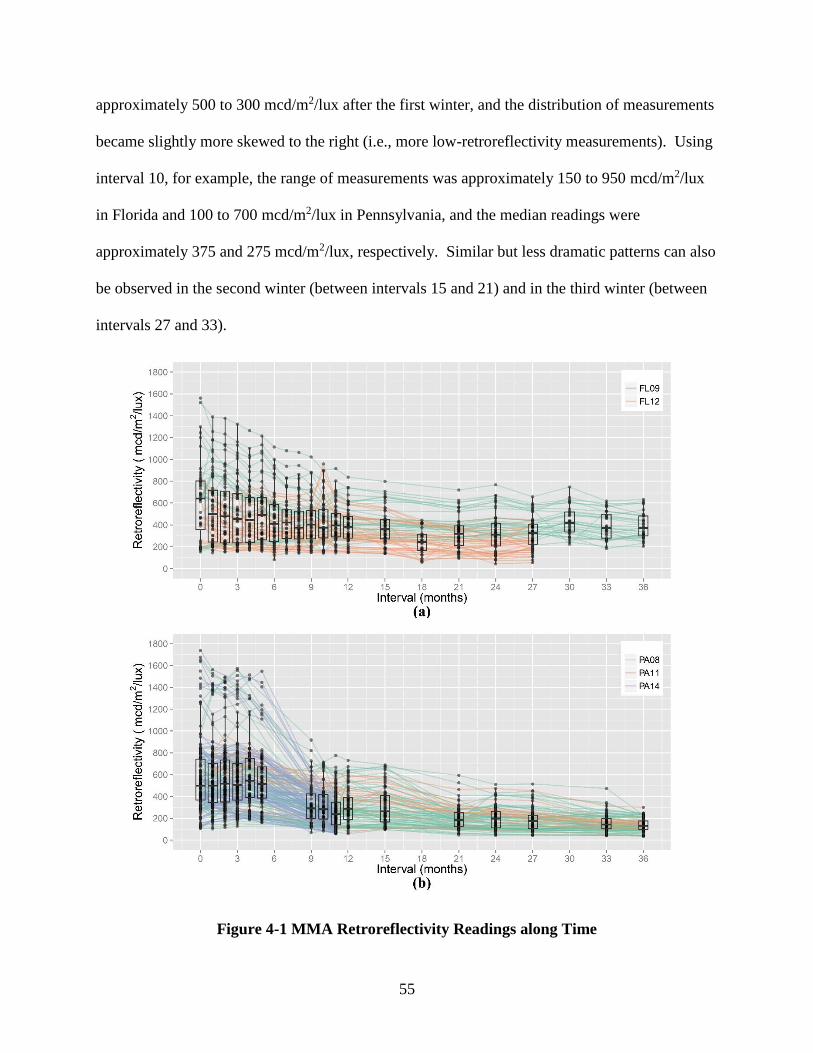
55
approximately 500 to 300 mcd/m2/lux after the first winter, and the distribution of measurements
became slightly more skewed to the right (i.e., more low-retroreflectivity measurements). Using
interval 10, for example, the range of measurements was approximately 150 to 950 mcd/m2/lux
in Florida and 100 to 700 mcd/m2/lux in Pennsylvania, and the median readings were
approximately 375 and 275 mcd/m2/lux, respectively. Similar but less dramatic patterns can also
be observed in the second winter (between intervals 15 and 21) and in the third winter (between
intervals 27 and 33).
Figure 4-1 MMA Retroreflectivity Readings along Time
56
(Inspection Intervals) in Two States (a) Florida (test decks FL09 and FL12); and (b)
Pennsylvania (test decks PA08, PA11, and PA14) as an Example
From these observations, it is noted that winter weather events, especially those in the first
winter, can have significant, non-gradual impact on the performance of pavement markings.
This type of physical damage should be explicitly considered in degradation models. As stated
previously, the dataset contains data collected in Florida, Pennsylvania, and Minnesota. Florida
shares similar weather with Georgia and, also, does not have severe winter weather conditions;
therefore, all data from Florida were used. The latter two states, on the other hand, have snow
events constantly, so only data prior to the first winter were used from these two states.
4.3 Pavement Marking Material Performance Modeling
Multiple linear models, as stated in previous sessions, are robust means for predicting pavement
marking retroreflectivity and deriving expected service lives. Therefore, in this section, we
developed MLMs to predict pavement marking retroreflectivity of multiple PMMs. The
expected service life of each material under different traffic conditions was also derived. These
information was then used in Chapter 5 for calculating the life-cycle costs of materials.
4.3.1 Variable Selection
To predict retroreflectivity, a list of potential variables is summarized below based on literature
review and the availability of data in this study. Note that the maximum retroreflectivity was
added for each line (MaxRetro) as a potential independent variable. The assumption was that,
when compared with the InitialRetro, this variable can better improve the accuracy of the model
by accounting for the “polish effect,” which the retroreflectivity "picks up" in the first couple of
months then starts to deteriorate afterwards. Among these variables, ADT was pre-selected
57
(starred) as a final variable for implementation purposes so that the proposed model can easily be
implemented by state DOTs. Potential variables considered in this study are as follows:
1) ADT*: average daily traffic per lane (veh/day/ln)
2) Days: elapsed days from installation
3) MaxRetro: maximum retroreflectivity from installation
4) InitialRetro: initial retroreflectivity from installation
5) Thickness: the average applied thickness
6) MultipleBeads: a binary variable, 1 if multiple types of beads were applied, 0 otherwise
7) ADTT: average daily truck traffic per lane
8) RoadTemp: the average road of temperatures during installation
Analysis of variance (ANOVA) and t-test were conducted to test the prediction power of these
potential variables. In Table 4-4, the larger the absolute t-value is, the higher prediction power
the corresponding variable has. Statistically significant t-values at the 95% level were
highlighted in gray and bolded in this table. Note that the 4-digit column names of Table 4-4
denote the PMM type (first two digits, see Table 4-3), surface type (third digit, where A stands
for asphalt and C stands for concrete), and line color (fourth digit, where W stands for white, and
Y stands for yellow). From the results, Days and MaxRetro were the two variables with t-values
that are constantly high and significant across all materials. MaxRetro turned out to be a better
predictor than InitialRetro for all materials, for it is more often a significant predictor with higher
prediction power, which verifies our previous assumption.
Consequently, the final selected independent variables were ADT, Days, and MaxRetro. Ten-fold
cross-validation analyses were conducted to ensure the proposed models were not over-fitting.
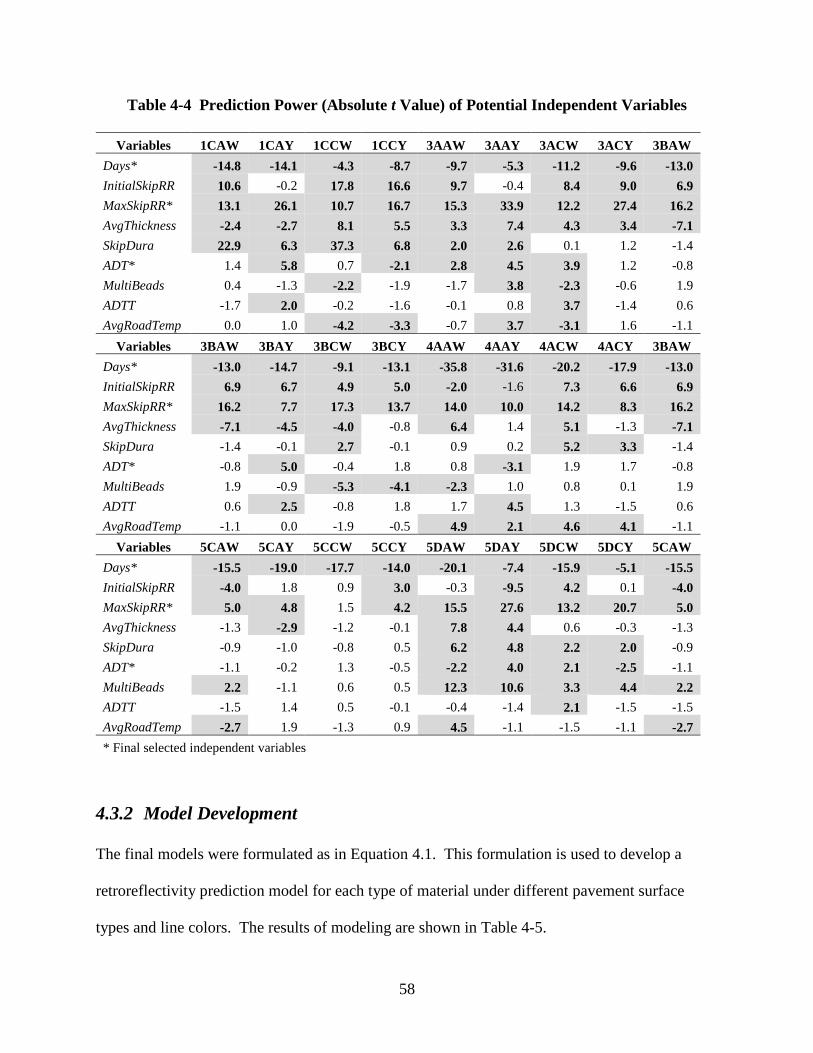
58
Table 4-4 Prediction Power (Absolute t Value) of Potential Independent Variables
Variables 1CAW 1CAY 1CCW 1CCY 3AAW 3AAY 3ACW 3ACY 3BAW
Days* -14.8 -14.1 -4.3 -8.7 -9.7 -5.3 -11.2 -9.6 -13.0
InitialSkipRR 10.6 -0.2 17.8 16.6 9.7 -0.4 8.4 9.0 6.9
MaxSkipRR* 13.1 26.1 10.7 16.7 15.3 33.9 12.2 27.4 16.2
AvgThickness -2.4 -2.7 8.1 5.5 3.3 7.4 4.3 3.4 -7.1
SkipDura 22.9 6.3 37.3 6.8 2.0 2.6 0.1 1.2 -1.4
ADT* 1.4 5.8 0.7 -2.1 2.8 4.5 3.9 1.2 -0.8
MultiBeads 0.4 -1.3 -2.2 -1.9 -1.7 3.8 -2.3 -0.6 1.9
ADTT -1.7 2.0 -0.2 -1.6 -0.1 0.8 3.7 -1.4 0.6
AvgRoadTemp 0.0 1.0 -4.2 -3.3 -0.7 3.7 -3.1 1.6 -1.1
Variables 3BAW 3BAY 3BCW 3BCY 4AAW 4AAY 4ACW 4ACY 3BAW
Days* -13.0 -14.7 -9.1 -13.1 -35.8 -31.6 -20.2 -17.9 -13.0
InitialSkipRR 6.9 6.7 4.9 5.0 -2.0 -1.6 7.3 6.6 6.9
MaxSkipRR* 16.2 7.7 17.3 13.7 14.0 10.0 14.2 8.3 16.2
AvgThickness -7.1 -4.5 -4.0 -0.8 6.4 1.4 5.1 -1.3 -7.1
SkipDura -1.4 -0.1 2.7 -0.1 0.9 0.2 5.2 3.3 -1.4
ADT* -0.8 5.0 -0.4 1.8 0.8 -3.1 1.9 1.7 -0.8
MultiBeads 1.9 -0.9 -5.3 -4.1 -2.3 1.0 0.8 0.1 1.9
ADTT 0.6 2.5 -0.8 1.8 1.7 4.5 1.3 -1.5 0.6
AvgRoadTemp -1.1 0.0 -1.9 -0.5 4.9 2.1 4.6 4.1 -1.1
Variables 5CAW 5CAY 5CCW 5CCY 5DAW 5DAY 5DCW 5DCY 5CAW
Days* -15.5 -19.0 -17.7 -14.0 -20.1 -7.4 -15.9 -5.1 -15.5
InitialSkipRR -4.0 1.8 0.9 3.0 -0.3 -9.5 4.2 0.1 -4.0
MaxSkipRR* 5.0 4.8 1.5 4.2 15.5 27.6 13.2 20.7 5.0
AvgThickness -1.3 -2.9 -1.2 -0.1 7.8 4.4 0.6 -0.3 -1.3
SkipDura -0.9 -1.0 -0.8 0.5 6.2 4.8 2.2 2.0 -0.9
ADT* -1.1 -0.2 1.3 -0.5 -2.2 4.0 2.1 -2.5 -1.1
MultiBeads 2.2 -1.1 0.6 0.5 12.3 10.6 3.3 4.4 2.2
ADTT -1.5 1.4 0.5 -0.1 -0.4 -1.4 2.1 -1.5 -1.5
AvgRoadTemp -2.7 1.9 -1.3 0.9 4.5 -1.1 -1.5 -1.1 -2.7
* Final selected independent variables
4.3.2 Model Development
The final models were formulated as in Equation 4.1. This formulation is used to develop a
retroreflectivity prediction model for each type of material under different pavement surface
types and line colors. The results of modeling are shown in Table 4-5.
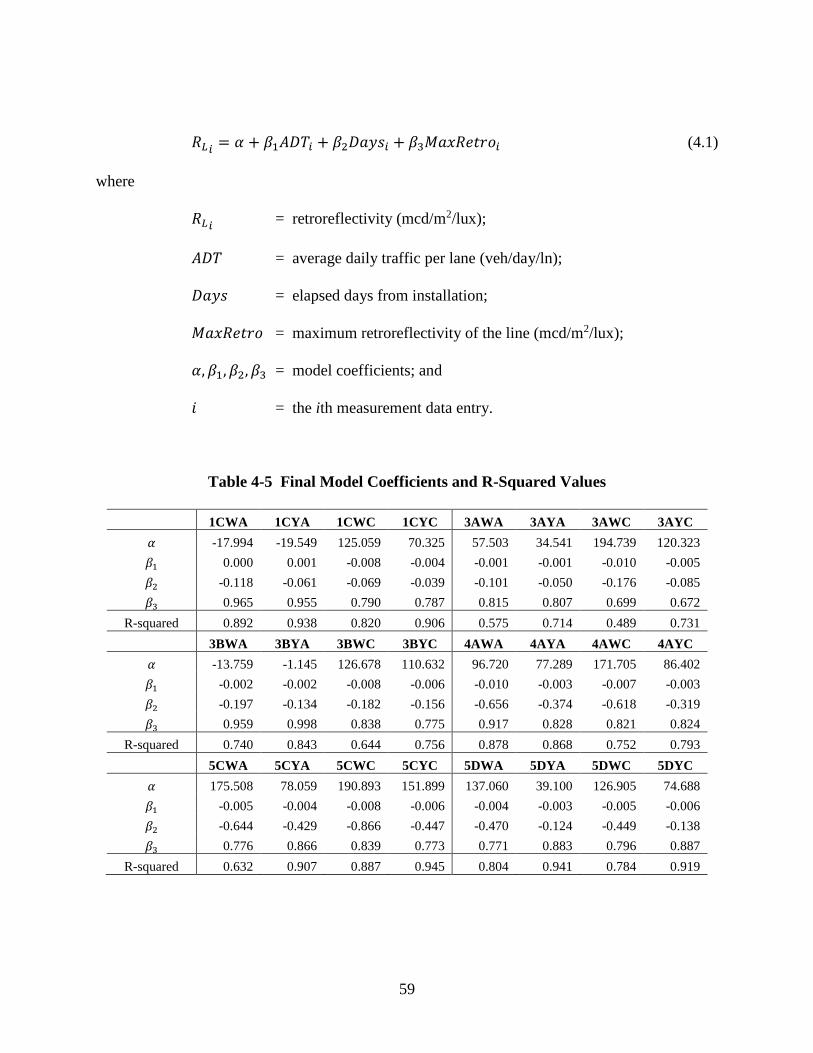
59
𝑅𝐿𝑖= 𝛼 + 𝛽1𝐴𝐷𝑇𝑖 + 𝛽2𝐷𝑎𝑦𝑠𝑖 + 𝛽3𝑀𝑎𝑥𝑅𝑒𝑡𝑟𝑜𝑖 (4.1)
where
𝑅𝐿𝑖 = retroreflectivity (mcd/m2/lux);
𝐴𝐷𝑇 = average daily traffic per lane (veh/day/ln);
𝐷𝑎𝑦𝑠 = elapsed days from installation;
𝑀𝑎𝑥𝑅𝑒𝑡𝑟𝑜 = maximum retroreflectivity of the line (mcd/m2/lux);
𝛼, 𝛽1, 𝛽2, 𝛽3 = model coefficients; and
𝑖 = the ith measurement data entry.
Table 4-5 Final Model Coefficients and R-Squared Values
1CWA 1CYA 1CWC 1CYC 3AWA 3AYA 3AWC 3AYC
𝛼 -17.994 -19.549 125.059 70.325 57.503 34.541 194.739 120.323
𝛽1 0.000 0.001 -0.008 -0.004 -0.001 -0.001 -0.010 -0.005
𝛽2 -0.118 -0.061 -0.069 -0.039 -0.101 -0.050 -0.176 -0.085
𝛽3 0.965 0.955 0.790 0.787 0.815 0.807 0.699 0.672
R-squared 0.892 0.938 0.820 0.906 0.575 0.714 0.489 0.731
3BWA 3BYA 3BWC 3BYC 4AWA 4AYA 4AWC 4AYC
𝛼 -13.759 -1.145 126.678 110.632 96.720 77.289 171.705 86.402
𝛽1 -0.002 -0.002 -0.008 -0.006 -0.010 -0.003 -0.007 -0.003
𝛽2 -0.197 -0.134 -0.182 -0.156 -0.656 -0.374 -0.618 -0.319
𝛽3 0.959 0.998 0.838 0.775 0.917 0.828 0.821 0.824
R-squared 0.740 0.843 0.644 0.756 0.878 0.868 0.752 0.793
5CWA 5CYA 5CWC 5CYC 5DWA 5DYA 5DWC 5DYC
𝛼 175.508 78.059 190.893 151.899 137.060 39.100 126.905 74.688
𝛽1 -0.005 -0.004 -0.008 -0.006 -0.004 -0.003 -0.005 -0.006
𝛽2 -0.644 -0.429 -0.866 -0.447 -0.470 -0.124 -0.449 -0.138
𝛽3 0.776 0.866 0.839 0.773 0.771 0.883 0.796 0.887
R-squared 0.632 0.907 0.887 0.945 0.804 0.941 0.784 0.919

60
4.4 Expected Service Life
The developed models in Section 4.3.2 can be used to further derive the service lives of
pavement markings under different traffic conditions and surface types. By plugging the
minimum acceptable retroreflectivity, MinRetro, into Equation 4.1, the expected service life (𝐿𝑐)
for each category (i.e., material type, line color, and surface type) can be derived using Equation
4.2. For example, assuming the minimum acceptable retroreflectivity is 100 mcd/m2/lux (the
current practice of GDOT), with a maximum retroreflectivity of 773 mcd/m2/lux and an ADT of
10,000 veh/day/ln, the expected life of white MMA on asphalt pavement with no winter weather
events is (100 − 137.060 + 0.004 × 10000 − 0.771 × 773)/(−0.470) = 1,261 days, or
approximately 3.4 years.
𝐿𝑐 =𝑀𝑖𝑛𝑅𝑒𝑡𝑟𝑜−𝛼−𝛽1𝐴𝐷𝑇𝑖−𝛽3𝑀𝑎𝑥𝑅𝑒𝑡𝑟𝑜𝑖
365×𝛽2 (4.2)
where
𝐿𝑐 = expected service life (in years) for category 𝑐;
𝑐 = pavement marking products that share the same material type,
line color, and surface type; and
𝑀𝑖𝑛𝑅𝑒𝑡𝑟𝑜 = minimum acceptable retroreflectivity (in mcd/m2/lux).
Note that in Equation 4.2, for each category (i.e., material type, color, and surface type), the
mean maximum retroreflectivity (shown in Table 4-6) was used to derive service life.
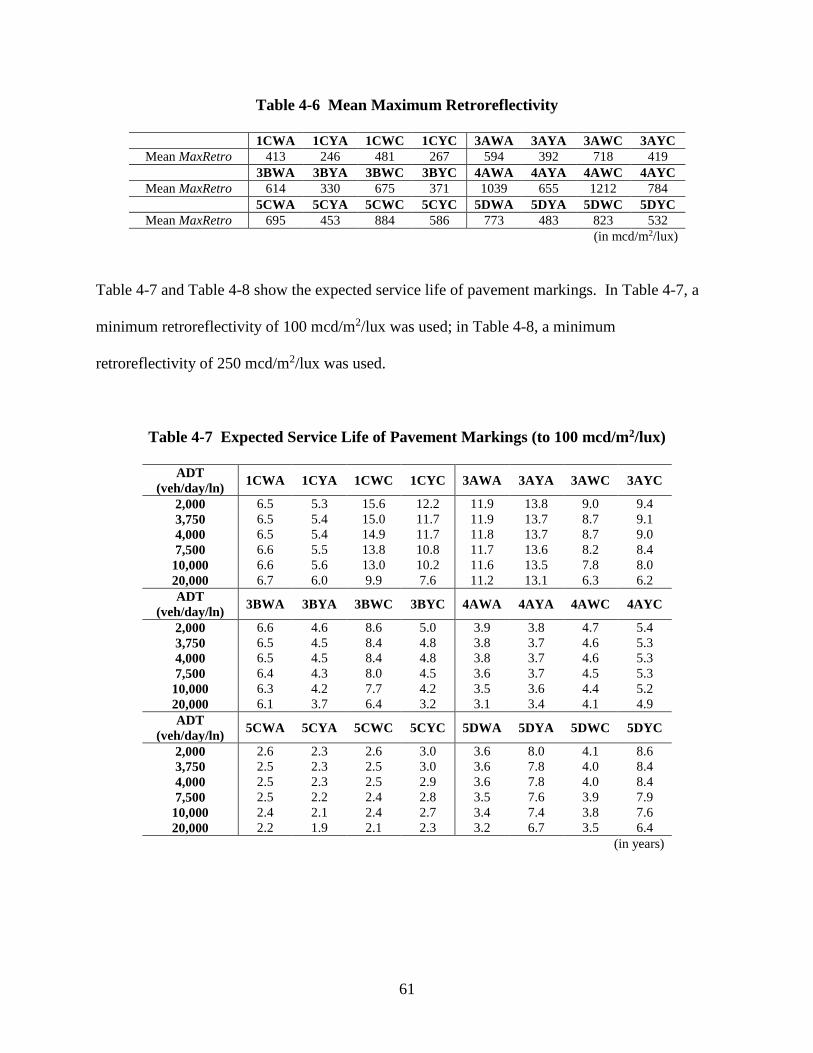
61
Table 4-6 Mean Maximum Retroreflectivity
1CWA 1CYA 1CWC 1CYC 3AWA 3AYA 3AWC 3AYC
Mean MaxRetro 413 246 481 267 594 392 718 419
3BWA 3BYA 3BWC 3BYC 4AWA 4AYA 4AWC 4AYC
Mean MaxRetro 614 330 675 371 1039 655 1212 784
5CWA 5CYA 5CWC 5CYC 5DWA 5DYA 5DWC 5DYC
Mean MaxRetro 695 453 884 586 773 483 823 532
(in mcd/m2/lux)
Table 4-7 and Table 4-8 show the expected service life of pavement markings. In Table 4-7, a
minimum retroreflectivity of 100 mcd/m2/lux was used; in Table 4-8, a minimum
retroreflectivity of 250 mcd/m2/lux was used.
Table 4-7 Expected Service Life of Pavement Markings (to 100 mcd/m2/lux)
ADT
(veh/day/ln) 1CWA 1CYA 1CWC 1CYC 3AWA 3AYA 3AWC 3AYC
2,000 6.5 5.3 15.6 12.2 11.9 13.8 9.0 9.4
3,750 6.5 5.4 15.0 11.7 11.9 13.7 8.7 9.1
4,000 6.5 5.4 14.9 11.7 11.8 13.7 8.7 9.0
7,500 6.6 5.5 13.8 10.8 11.7 13.6 8.2 8.4
10,000 6.6 5.6 13.0 10.2 11.6 13.5 7.8 8.0
20,000 6.7 6.0 9.9 7.6 11.2 13.1 6.3 6.2
ADT
(veh/day/ln) 3BWA 3BYA 3BWC 3BYC 4AWA 4AYA 4AWC 4AYC
2,000 6.6 4.6 8.6 5.0 3.9 3.8 4.7 5.4
3,750 6.5 4.5 8.4 4.8 3.8 3.7 4.6 5.3
4,000 6.5 4.5 8.4 4.8 3.8 3.7 4.6 5.3
7,500 6.4 4.3 8.0 4.5 3.6 3.7 4.5 5.3
10,000 6.3 4.2 7.7 4.2 3.5 3.6 4.4 5.2
20,000 6.1 3.7 6.4 3.2 3.1 3.4 4.1 4.9
ADT
(veh/day/ln) 5CWA 5CYA 5CWC 5CYC 5DWA 5DYA 5DWC 5DYC
2,000 2.6 2.3 2.6 3.0 3.6 8.0 4.1 8.6
3,750 2.5 2.3 2.5 3.0 3.6 7.8 4.0 8.4
4,000 2.5 2.3 2.5 2.9 3.6 7.8 4.0 8.4
7,500 2.5 2.2 2.4 2.8 3.5 7.6 3.9 7.9
10,000 2.4 2.1 2.4 2.7 3.4 7.4 3.8 7.6
20,000 2.2 1.9 2.1 2.3 3.2 6.7 3.5 6.4
(in years)
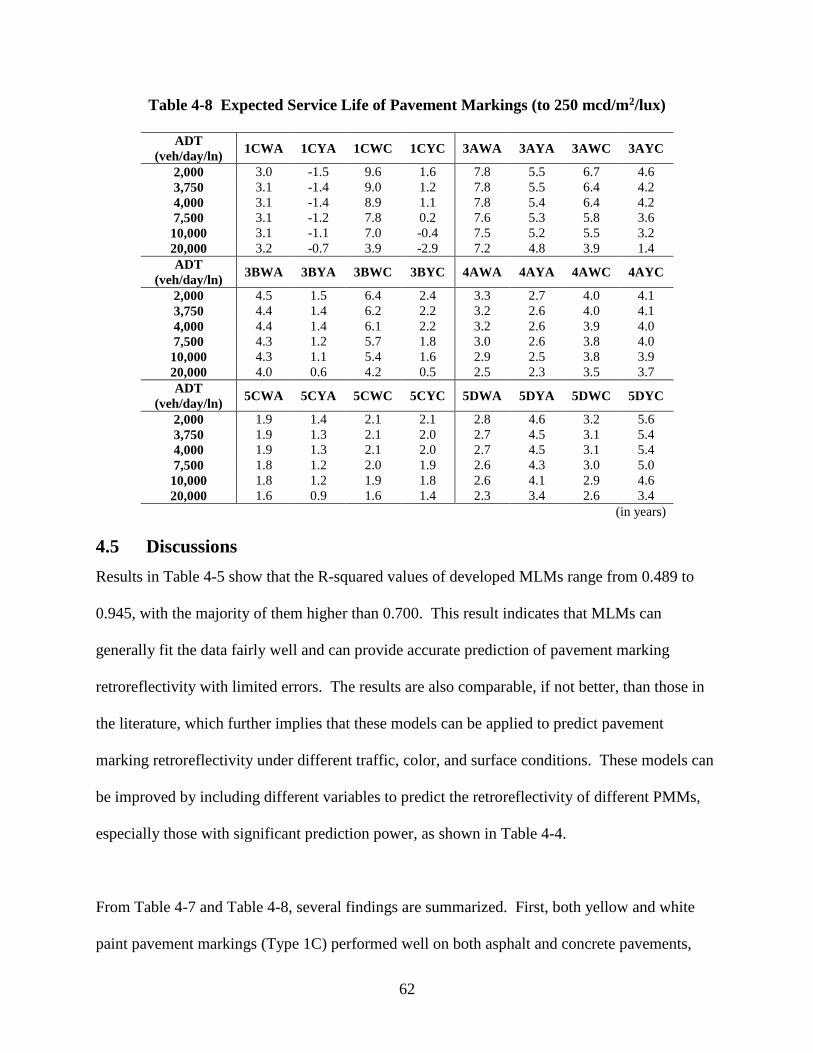
62
Table 4-8 Expected Service Life of Pavement Markings (to 250 mcd/m2/lux)
ADT
(veh/day/ln) 1CWA 1CYA 1CWC 1CYC 3AWA 3AYA 3AWC 3AYC
2,000 3.0 -1.5 9.6 1.6 7.8 5.5 6.7 4.6
3,750 3.1 -1.4 9.0 1.2 7.8 5.5 6.4 4.2
4,000 3.1 -1.4 8.9 1.1 7.8 5.4 6.4 4.2
7,500 3.1 -1.2 7.8 0.2 7.6 5.3 5.8 3.6
10,000 3.1 -1.1 7.0 -0.4 7.5 5.2 5.5 3.2
20,000 3.2 -0.7 3.9 -2.9 7.2 4.8 3.9 1.4
ADT
(veh/day/ln) 3BWA 3BYA 3BWC 3BYC 4AWA 4AYA 4AWC 4AYC
2,000 4.5 1.5 6.4 2.4 3.3 2.7 4.0 4.1
3,750 4.4 1.4 6.2 2.2 3.2 2.6 4.0 4.1
4,000 4.4 1.4 6.1 2.2 3.2 2.6 3.9 4.0
7,500 4.3 1.2 5.7 1.8 3.0 2.6 3.8 4.0
10,000 4.3 1.1 5.4 1.6 2.9 2.5 3.8 3.9
20,000 4.0 0.6 4.2 0.5 2.5 2.3 3.5 3.7
ADT
(veh/day/ln) 5CWA 5CYA 5CWC 5CYC 5DWA 5DYA 5DWC 5DYC
2,000 1.9 1.4 2.1 2.1 2.8 4.6 3.2 5.6
3,750 1.9 1.3 2.1 2.0 2.7 4.5 3.1 5.4
4,000 1.9 1.3 2.1 2.0 2.7 4.5 3.1 5.4
7,500 1.8 1.2 2.0 1.9 2.6 4.3 3.0 5.0
10,000 1.8 1.2 1.9 1.8 2.6 4.1 2.9 4.6
20,000 1.6 0.9 1.6 1.4 2.3 3.4 2.6 3.4
(in years)
4.5 Discussions
Results in Table 4-5 show that the R-squared values of developed MLMs range from 0.489 to
0.945, with the majority of them higher than 0.700. This result indicates that MLMs can
generally fit the data fairly well and can provide accurate prediction of pavement marking
retroreflectivity with limited errors. The results are also comparable, if not better, than those in
the literature, which further implies that these models can be applied to predict pavement
marking retroreflectivity under different traffic, color, and surface conditions. These models can
be improved by including different variables to predict the retroreflectivity of different PMMs,
especially those with significant prediction power, as shown in Table 4-4.
From Table 4-7 and Table 4-8, several findings are summarized. First, both yellow and white
paint pavement markings (Type 1C) performed well on both asphalt and concrete pavements,
63
with the expected service life ranges from 5.3 to 15.6 years when the minimum retroreflectivity
is 100 mcd/m2/lux; however, their performance dropped dramatically when the minimum
retroreflectivity was 250 mcd/m2/lux. This indicates that although paints may have long lives,
their retroreflectivity usually starts low and remains low. Therefore, for roads with higher traffic
volumes, such as interstate highways that require better visibility (e.g., the suggested minimum
retroreflectivity in Table 2-6), paints may not perform as well as if they were applied to general
roads that require lower visibility.
Second, preformed tape, on the other hand, performed consistently throughout different surface
types and roadway conditions under different minimum retroreflectivity requirements. This
indicates that tape markings usually start at a very high retroreflectivity, gradually deteriorates in
the first half of its life, and then deteriorates faster when it is approaching its service life. In
other words, given the consistency and good, long, expected life, tape markings could be a good
candidate material to be comprehensively applied to both general roads and interstate highways.
Third, thermoplastic markings (Type 3A) generally performed better and more consistently when
compared with preformed thermoplastics (Type 3B). This result indicates that truck-mounted
pavement marking applications generally work better than manual installation for thermoplastic
markings. In addition, thermoplastic usually deteriorates much faster on concrete pavements,
especially on higher traffic volume roads, which confirms the general practice of not using
thermoplastic on concrete surfaces. Moreover, if we compare the average service life of
different materials in Table 4-7, thermoplastic markings are expected to have the longest life,
followed by paint, preformed thermoplastic, MMA, tape, and polyurea. Similar comparison can
64
be made in Table 4-8, and the order of material’s service life (from long to short) becomes
thermoplastic, MMA, tape, preformed thermoplastic, paint, and polyurea. This result confirms
the finding in the previous point: thermoplastic can perform consistently well under various
traffic, line color, and pavement surface types. Note that although thermoplastic performs worse
on concrete than on asphalt, it still outperforms other materials. Polyurea, on the other hand, are
expected to have the shortest average life among these materials, according to these results. The
results also show that, in addition to thermoplastic, MMA and preformed tape can also be good
candidates for roads with higher visibility needs, e.g., interstate highways.
Finally, regarding the effect of line colors, although most white markings performed better than
yellow markings for all materials, yellow MMA lines (Type 5D), in fact, performed better than
white MMA lines. This indicates that MMA can potentially be a good candidate for center lines
and/or edge lines.
4.6 Summary
In this chapter, NTPEP data were used to develop statistical models to predict the
retroreflectivity of various PMMs. The developed models were then used to derive the service
lives of PMMs. From the results of the NTPEP data analysis presented in this chapter, the
following findings can be summarized:
1) Multiple linear models with independent variables, such as the elapsed days, average
daily traffic, and maximum retroreflectivity, provide robust results for predicting
pavement marking retroreflectivity. These models can be improved by including
different, additional independent variables according to their prediction power for
different PMMs, as shown in Table 4-4.
65
2) The derived service lives of different PMMs using minimum retroreflectivity
measurements of 100 mcd/m2/lux and 250 mcd/m2/lux show that thermoplastic generally
outperformed other materials under various traffic conditions, line colors, and pavement
surface types. Results also showed that polyurea performed not as well as other materials
and generally has the shortest expected service life.
3) Expected service life analysis results also indicate that for standard roads, thermoplastic
and paint are two types of materials that are expected to perform well, whereas for higher
traffic volume roads (e.g., interstate highways) that require higher retroreflectivity,
thermoplastic, MMA, and tape are expected to perform well.
4) Specific materials may also have unique performance. For example, similar to the
current practice and literature findings, thermoplastic performs worse on concrete
pavements, especially when the traffic volume is high. In addition, yellow MMA
performs better than white MMA, which implies that MMA may be a good candidate
material for center lines.

66
67
5. COST-EFFECTIVE PAVEMENT MARKING MATERIAL SELECTION
In this chapter, general performance and costs of PMMs are summarized and a LCCA is
conducted to evaluate the life-cycle costs of PMMs throughout a 10-year analysis period. Then,
a cost-effective PMM selection matrix is developed on the basis of the analysis results, as well as
engineering experience.
This chapter is organized as follows: the first section summarizes performance of different
PMMs from various sources including the literature, state DOT handbooks, as well as GDOT
Test Deck analysis results from Chapter 3; the second section summarizes the costs of PMMs
from the most recent bid item prices of seven different state DOTs, including Georgia, Florida,
North Carolina, Texas, Pennsylvania, Minnesota, and Oregon; the third section presents LCCA
along a 10-year analysis period, and the annual costs of various PMMs are summarized; the
fourth section presents a preliminary PMM selection matrix for GDOT based on the LCCA
results as well as engineers’ experience.
5.1 Pavement Marking Material Performance
Tables 5.1 to 5.6 summarize expected service lives of six different PMMs from the literature and
from the analysis results of GDOT Test Deck data. In each table, expected service lives are
summarized using the following two approaches: (1) for literature that developed degradation
models, if the variables considered in the models are only AADT and the minimum
retroreflectivity, a minimum retroreflectivity of 100 mcd/m2/lux and GDOT’s AADT category
thresholds (i.e., 8,000, 15,000, and 40,000 vehicles/day) are plugged into these models to obtain
the respective service lives; and (2) for literature that either has more complex factors/models or
is based on engineering experiences, the reported service lives in these sources are directly used.
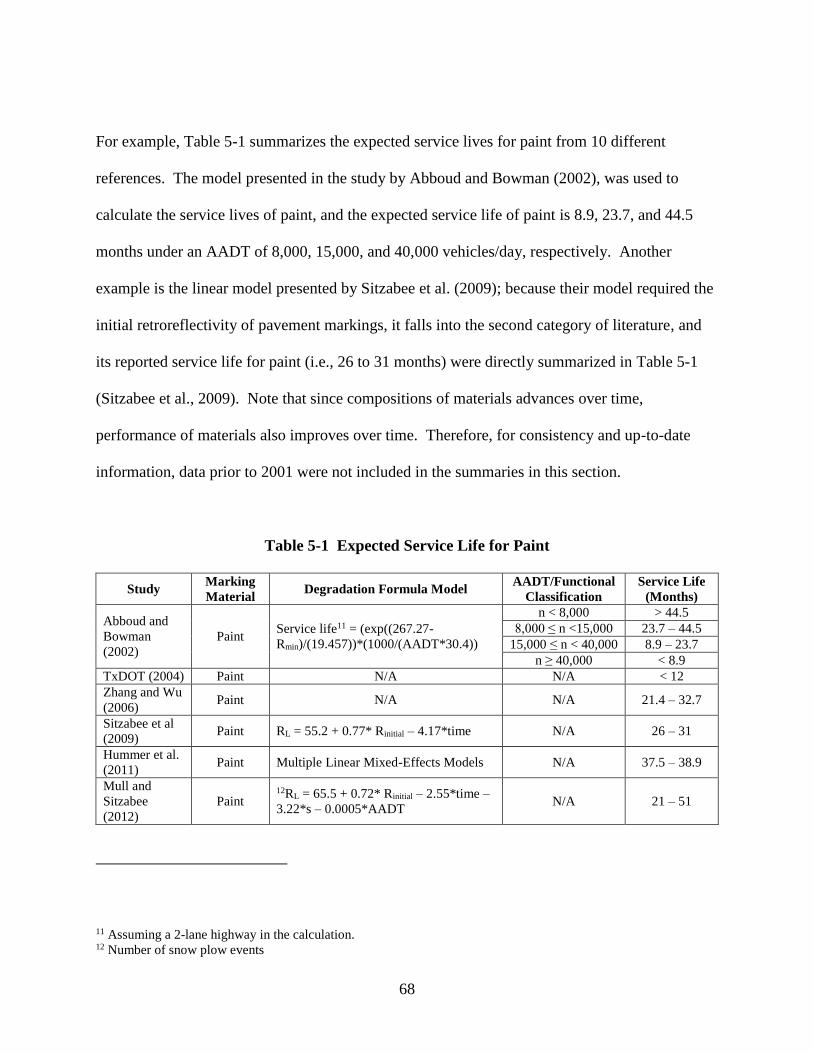
68
For example, Table 5-1 summarizes the expected service lives for paint from 10 different
references. The model presented in the study by Abboud and Bowman (2002), was used to
calculate the service lives of paint, and the expected service life of paint is 8.9, 23.7, and 44.5
months under an AADT of 8,000, 15,000, and 40,000 vehicles/day, respectively. Another
example is the linear model presented by Sitzabee et al. (2009); because their model required the
initial retroreflectivity of pavement markings, it falls into the second category of literature, and
its reported service life for paint (i.e., 26 to 31 months) were directly summarized in Table 5-1
(Sitzabee et al., 2009). Note that since compositions of materials advances over time,
performance of materials also improves over time. Therefore, for consistency and up-to-date
information, data prior to 2001 were not included in the summaries in this section.
Table 5-1 Expected Service Life for Paint
Study Marking
Material Degradation Formula Model
AADT/Functional
Classification
Service Life
(Months)
Abboud and
Bowman
(2002)
Paint Service life11 = (exp((267.27-
Rmin)/(19.457))*(1000/(AADT*30.4))
n < 8,000 > 44.5
8,000 ≤ n <15,000 23.7 – 44.5
15,000 ≤ n < 40,000 8.9 – 23.7
n ≥ 40,000 < 8.9
TxDOT (2004) Paint N/A N/A < 12
Zhang and Wu
(2006) Paint N/A N/A 21.4 – 32.7
Sitzabee et al
(2009) Paint RL = 55.2 + 0.77* Rinitial – 4.17*time N/A 26 – 31
Hummer et al.
(2011) Paint Multiple Linear Mixed-Effects Models N/A 37.5 – 38.9
Mull and
Sitzabee
(2012)
Paint 12RL = 65.5 + 0.72* Rinitial – 2.55*time –
3.22*s – 0.0005*AADT N/A 21 – 51
11 Assuming a 2-lane highway in the calculation. 12 Number of snow plow events
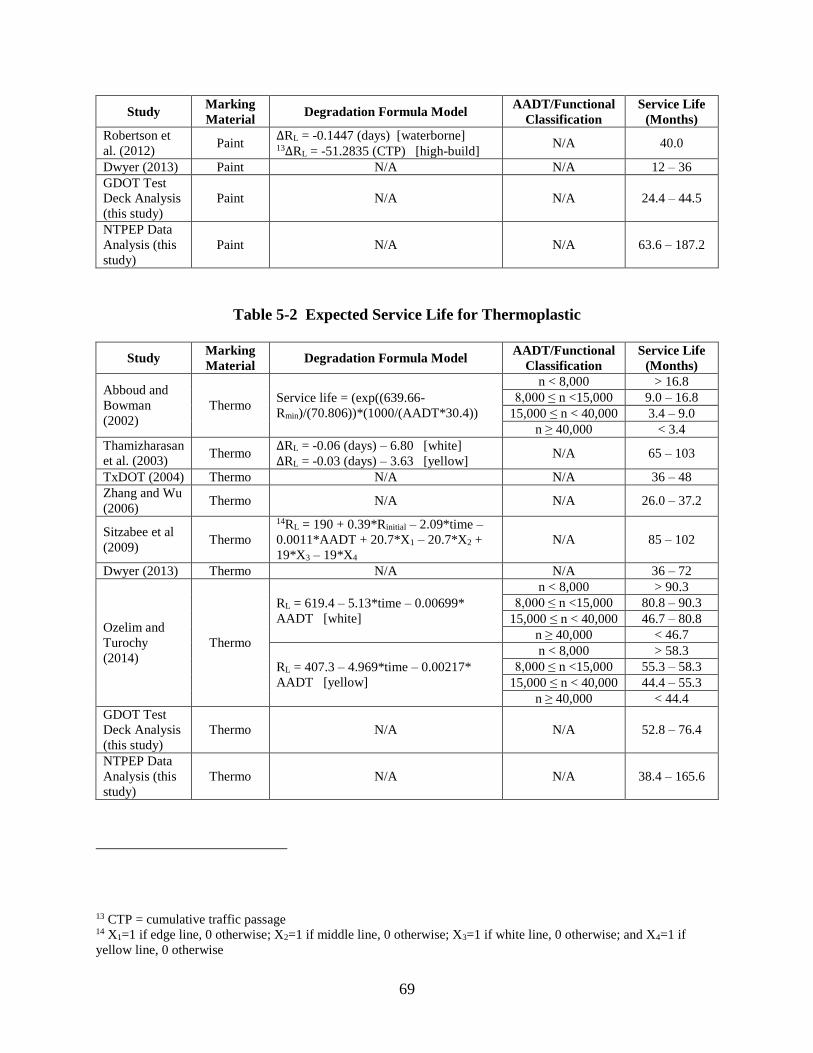
69
Study Marking
Material Degradation Formula Model
AADT/Functional
Classification
Service Life
(Months)
Robertson et
al. (2012) Paint
ΔRL = -0.1447 (days) [waterborne] 13ΔRL = -51.2835 (CTP) [high-build]
N/A 40.0
Dwyer (2013) Paint N/A N/A 12 – 36
GDOT Test
Deck Analysis
(this study)
Paint N/A N/A 24.4 – 44.5
NTPEP Data
Analysis (this
study)
Paint N/A N/A 63.6 – 187.2
Table 5-2 Expected Service Life for Thermoplastic
Study Marking
Material Degradation Formula Model
AADT/Functional
Classification
Service Life
(Months)
Abboud and
Bowman
(2002)
Thermo Service life = (exp((639.66-
Rmin)/(70.806))*(1000/(AADT*30.4))
n < 8,000 > 16.8
8,000 ≤ n <15,000 9.0 – 16.8
15,000 ≤ n < 40,000 3.4 – 9.0
n ≥ 40,000 < 3.4
Thamizharasan
et al. (2003) Thermo
ΔRL = -0.06 (days) – 6.80 [white]
ΔRL = -0.03 (days) – 3.63 [yellow] N/A 65 – 103
TxDOT (2004) Thermo N/A N/A 36 – 48
Zhang and Wu
(2006) Thermo N/A N/A 26.0 – 37.2
Sitzabee et al
(2009) Thermo
14RL = 190 + 0.39*Rinitial – 2.09*time –
0.0011*AADT + 20.7*X1 – 20.7*X2 +
19*X3 – 19*X4
N/A 85 – 102
Dwyer (2013) Thermo N/A N/A 36 – 72
Ozelim and
Turochy
(2014)
Thermo
RL = 619.4 – 5.13*time – 0.00699*
AADT [white]
n < 8,000 > 90.3
8,000 ≤ n <15,000 80.8 – 90.3
15,000 ≤ n < 40,000 46.7 – 80.8
n ≥ 40,000 < 46.7
RL = 407.3 – 4.969*time – 0.00217*
AADT [yellow]
n < 8,000 > 58.3
8,000 ≤ n <15,000 55.3 – 58.3
15,000 ≤ n < 40,000 44.4 – 55.3
n ≥ 40,000 < 44.4
GDOT Test
Deck Analysis
(this study)
Thermo N/A N/A 52.8 – 76.4
NTPEP Data
Analysis (this
study)
Thermo N/A N/A 38.4 – 165.6
13 CTP = cumulative traffic passage 14 X1=1 if edge line, 0 otherwise; X2=1 if middle line, 0 otherwise; X3=1 if white line, 0 otherwise; and X4=1 if
yellow line, 0 otherwise
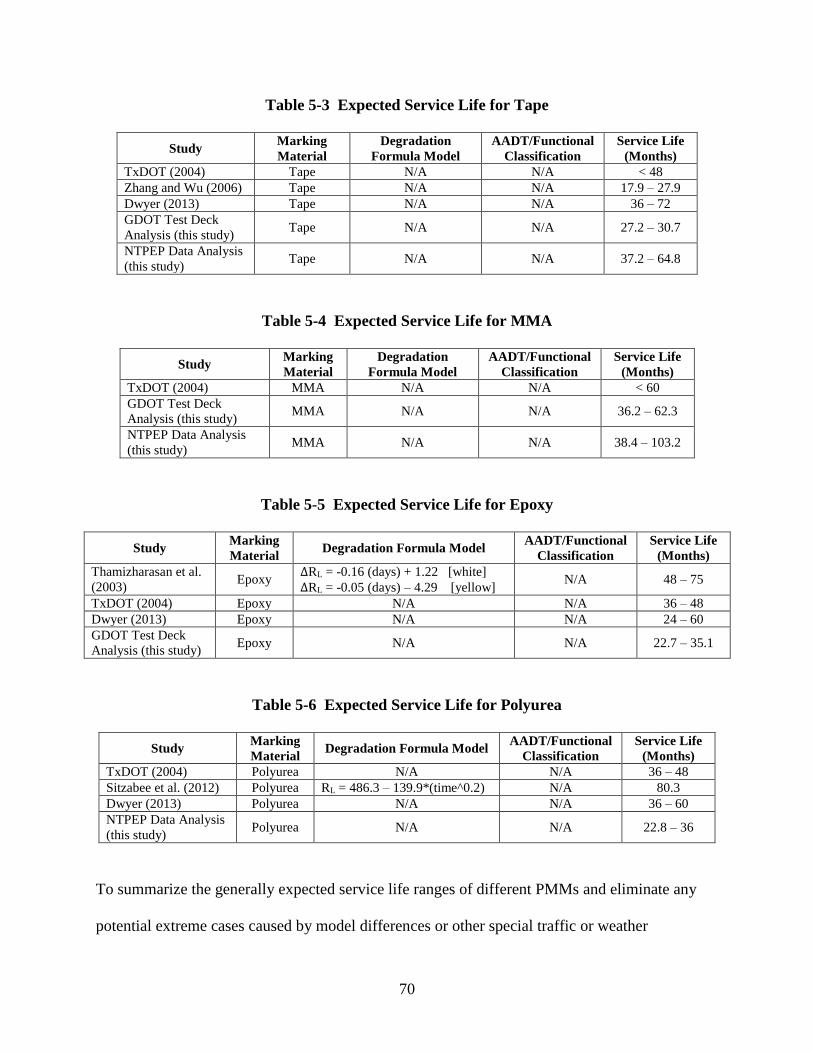
70
Table 5-3 Expected Service Life for Tape
Study Marking
Material
Degradation
Formula Model
AADT/Functional
Classification
Service Life
(Months)
TxDOT (2004) Tape N/A N/A < 48
Zhang and Wu (2006) Tape N/A N/A 17.9 – 27.9
Dwyer (2013) Tape N/A N/A 36 – 72
GDOT Test Deck
Analysis (this study) Tape N/A N/A 27.2 – 30.7
NTPEP Data Analysis
(this study) Tape N/A N/A 37.2 – 64.8
Table 5-4 Expected Service Life for MMA
Study Marking
Material
Degradation
Formula Model
AADT/Functional
Classification
Service Life
(Months)
TxDOT (2004) MMA N/A N/A < 60
GDOT Test Deck
Analysis (this study) MMA N/A N/A 36.2 – 62.3
NTPEP Data Analysis
(this study) MMA N/A N/A 38.4 – 103.2
Table 5-5 Expected Service Life for Epoxy
Study Marking
Material Degradation Formula Model
AADT/Functional
Classification
Service Life
(Months)
Thamizharasan et al.
(2003) Epoxy
ΔRL = -0.16 (days) + 1.22 [white]
ΔRL = -0.05 (days) – 4.29 [yellow] N/A 48 – 75
TxDOT (2004) Epoxy N/A N/A 36 – 48
Dwyer (2013) Epoxy N/A N/A 24 – 60
GDOT Test Deck
Analysis (this study) Epoxy N/A N/A 22.7 – 35.1
Table 5-6 Expected Service Life for Polyurea
Study Marking
Material Degradation Formula Model
AADT/Functional
Classification
Service Life
(Months)
TxDOT (2004) Polyurea N/A N/A 36 – 48
Sitzabee et al. (2012) Polyurea RL = 486.3 – 139.9*(time^0.2) N/A 80.3
Dwyer (2013) Polyurea N/A N/A 36 – 60
NTPEP Data Analysis
(this study) Polyurea N/A N/A 22.8 – 36
To summarize the generally expected service life ranges of different PMMs and eliminate any
potential extreme cases caused by model differences or other special traffic or weather
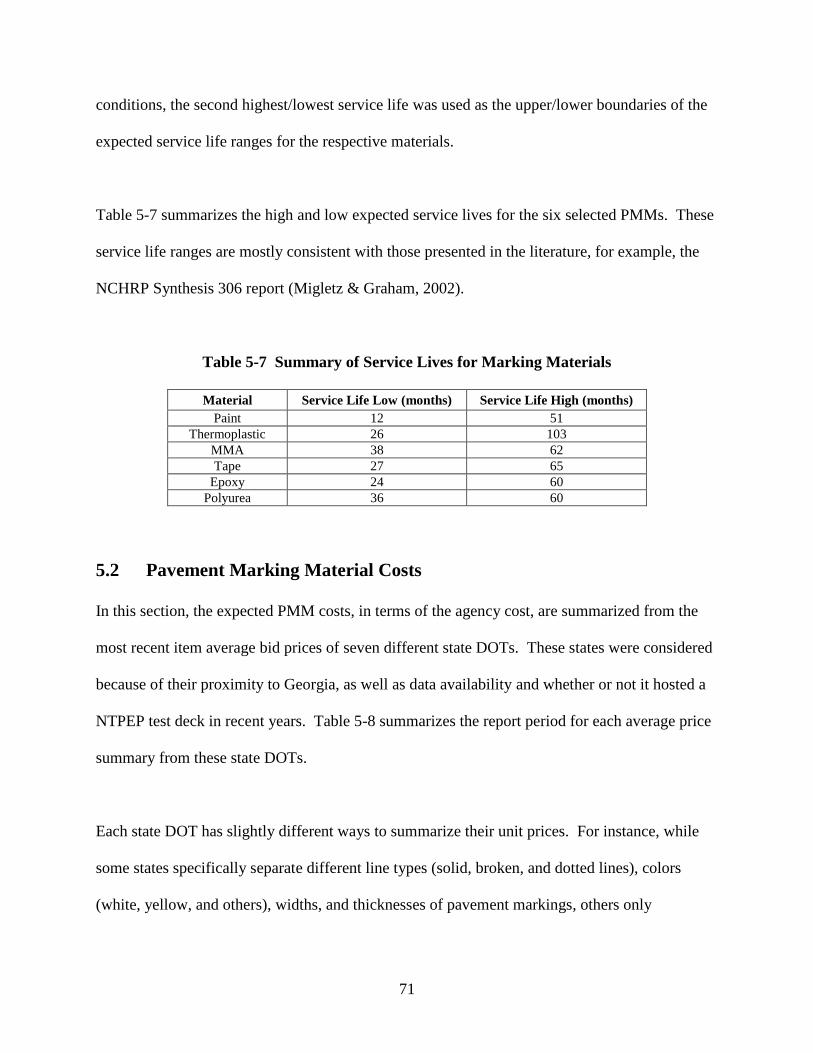
71
conditions, the second highest/lowest service life was used as the upper/lower boundaries of the
expected service life ranges for the respective materials.
Table 5-7 summarizes the high and low expected service lives for the six selected PMMs. These
service life ranges are mostly consistent with those presented in the literature, for example, the
NCHRP Synthesis 306 report (Migletz & Graham, 2002).
Table 5-7 Summary of Service Lives for Marking Materials
Material Service Life Low (months) Service Life High (months)
Paint 12 51
Thermoplastic 26 103
MMA 38 62
Tape 27 65
Epoxy 24 60
Polyurea 36 60
5.2 Pavement Marking Material Costs
In this section, the expected PMM costs, in terms of the agency cost, are summarized from the
most recent item average bid prices of seven different state DOTs. These states were considered
because of their proximity to Georgia, as well as data availability and whether or not it hosted a
NTPEP test deck in recent years. Table 5-8 summarizes the report period for each average price
summary from these state DOTs.
Each state DOT has slightly different ways to summarize their unit prices. For instance, while
some states specifically separate different line types (solid, broken, and dotted lines), colors
(white, yellow, and others), widths, and thicknesses of pavement markings, others only
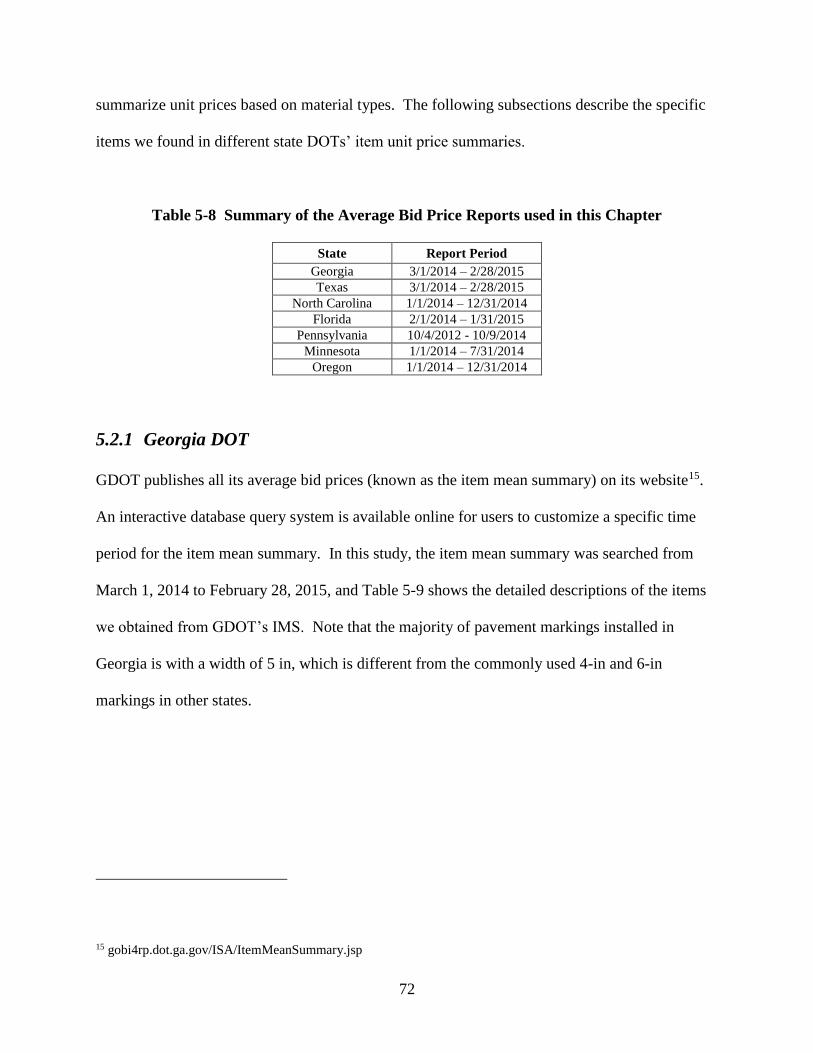
72
summarize unit prices based on material types. The following subsections describe the specific
items we found in different state DOTs’ item unit price summaries.
Table 5-8 Summary of the Average Bid Price Reports used in this Chapter
State Report Period
Georgia 3/1/2014 – 2/28/2015
Texas 3/1/2014 – 2/28/2015
North Carolina 1/1/2014 – 12/31/2014
Florida 2/1/2014 – 1/31/2015
Pennsylvania 10/4/2012 - 10/9/2014
Minnesota 1/1/2014 – 7/31/2014
Oregon 1/1/2014 – 12/31/2014
5.2.1 Georgia DOT
GDOT publishes all its average bid prices (known as the item mean summary) on its website15.
An interactive database query system is available online for users to customize a specific time
period for the item mean summary. In this study, the item mean summary was searched from
March 1, 2014 to February 28, 2015, and Table 5-9 shows the detailed descriptions of the items
we obtained from GDOT’s IMS. Note that the majority of pavement markings installed in
Georgia is with a width of 5 in, which is different from the commonly used 4-in and 6-in
markings in other states.
15 gobi4rp.dot.ga.gov/ISA/ItemMeanSummary.jsp
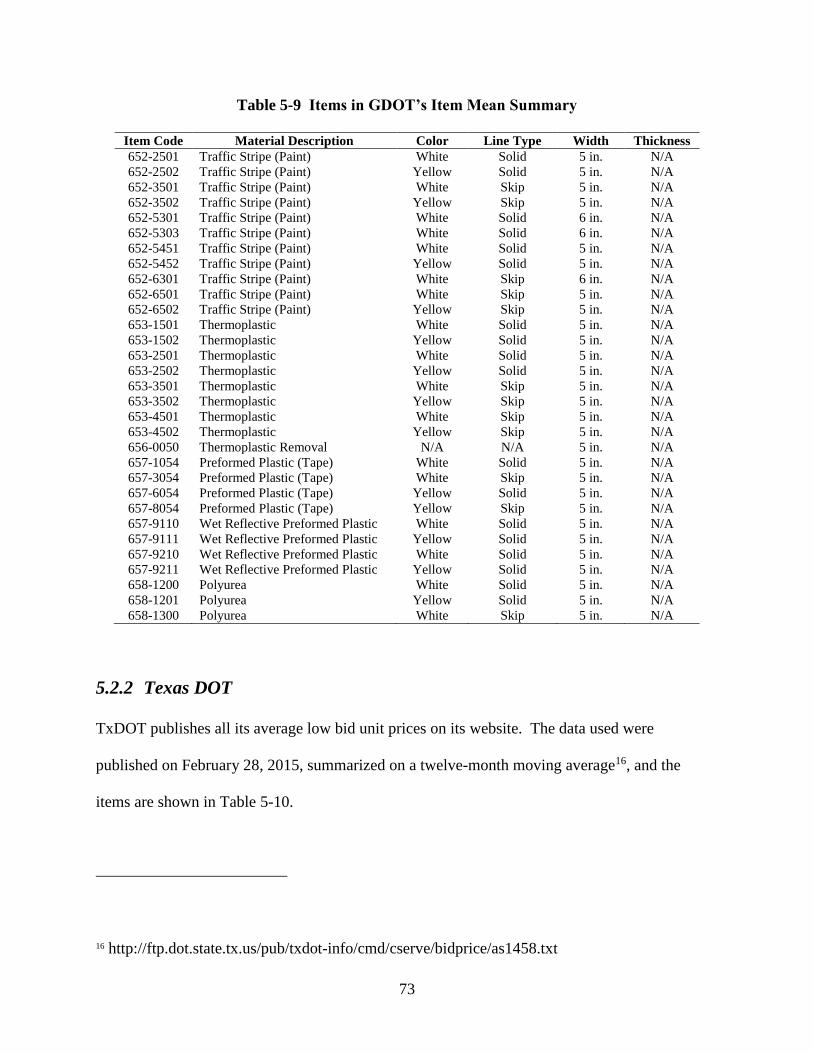
73
Table 5-9 Items in GDOT’s Item Mean Summary
Item Code Material Description Color Line Type Width Thickness
652-2501 Traffic Stripe (Paint) White Solid 5 in. N/A
652-2502 Traffic Stripe (Paint) Yellow Solid 5 in. N/A
652-3501 Traffic Stripe (Paint) White Skip 5 in. N/A
652-3502 Traffic Stripe (Paint) Yellow Skip 5 in. N/A
652-5301 Traffic Stripe (Paint) White Solid 6 in. N/A
652-5303 Traffic Stripe (Paint) White Solid 6 in. N/A
652-5451 Traffic Stripe (Paint) White Solid 5 in. N/A
652-5452 Traffic Stripe (Paint) Yellow Solid 5 in. N/A
652-6301 Traffic Stripe (Paint) White Skip 6 in. N/A
652-6501 Traffic Stripe (Paint) White Skip 5 in. N/A
652-6502 Traffic Stripe (Paint) Yellow Skip 5 in. N/A
653-1501 Thermoplastic White Solid 5 in. N/A
653-1502 Thermoplastic Yellow Solid 5 in. N/A
653-2501 Thermoplastic White Solid 5 in. N/A
653-2502 Thermoplastic Yellow Solid 5 in. N/A
653-3501 Thermoplastic White Skip 5 in. N/A
653-3502 Thermoplastic Yellow Skip 5 in. N/A
653-4501 Thermoplastic White Skip 5 in. N/A
653-4502 Thermoplastic Yellow Skip 5 in. N/A
656-0050 Thermoplastic Removal N/A N/A 5 in. N/A
657-1054 Preformed Plastic (Tape) White Solid 5 in. N/A
657-3054 Preformed Plastic (Tape) White Skip 5 in. N/A
657-6054 Preformed Plastic (Tape) Yellow Solid 5 in. N/A
657-8054 Preformed Plastic (Tape) Yellow Skip 5 in. N/A
657-9110 Wet Reflective Preformed Plastic White Solid 5 in. N/A
657-9111 Wet Reflective Preformed Plastic Yellow Solid 5 in. N/A
657-9210 Wet Reflective Preformed Plastic White Solid 5 in. N/A
657-9211 Wet Reflective Preformed Plastic Yellow Solid 5 in. N/A
658-1200 Polyurea White Solid 5 in. N/A
658-1201 Polyurea Yellow Solid 5 in. N/A
658-1300 Polyurea White Skip 5 in. N/A
5.2.2 Texas DOT
TxDOT publishes all its average low bid unit prices on its website. The data used were
published on February 28, 2015, summarized on a twelve-month moving average16, and the
items are shown in Table 5-10.
16 http://ftp.dot.state.tx.us/pub/txdot-info/cmd/cserve/bidprice/as1458.txt
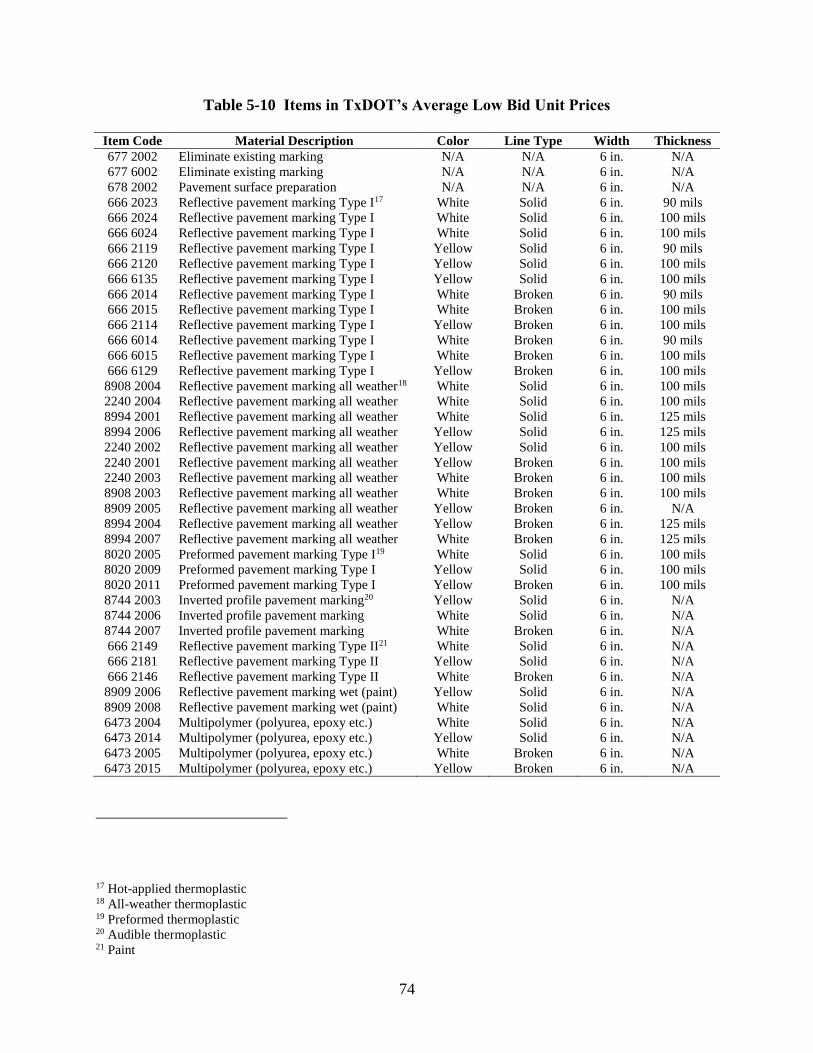
74
Table 5-10 Items in TxDOT’s Average Low Bid Unit Prices
Item Code Material Description Color Line Type Width Thickness
677 2002 Eliminate existing marking N/A N/A 6 in. N/A
677 6002 Eliminate existing marking N/A N/A 6 in. N/A
678 2002 Pavement surface preparation N/A N/A 6 in. N/A
666 2023 Reflective pavement marking Type I17 White Solid 6 in. 90 mils
666 2024 Reflective pavement marking Type I White Solid 6 in. 100 mils
666 6024 Reflective pavement marking Type I White Solid 6 in. 100 mils
666 2119 Reflective pavement marking Type I Yellow Solid 6 in. 90 mils
666 2120 Reflective pavement marking Type I Yellow Solid 6 in. 100 mils
666 6135 Reflective pavement marking Type I Yellow Solid 6 in. 100 mils
666 2014 Reflective pavement marking Type I White Broken 6 in. 90 mils
666 2015 Reflective pavement marking Type I White Broken 6 in. 100 mils
666 2114 Reflective pavement marking Type I Yellow Broken 6 in. 100 mils
666 6014 Reflective pavement marking Type I White Broken 6 in. 90 mils
666 6015 Reflective pavement marking Type I White Broken 6 in. 100 mils
666 6129 Reflective pavement marking Type I Yellow Broken 6 in. 100 mils
8908 2004 Reflective pavement marking all weather18 White Solid 6 in. 100 mils
2240 2004 Reflective pavement marking all weather White Solid 6 in. 100 mils
8994 2001 Reflective pavement marking all weather White Solid 6 in. 125 mils
8994 2006 Reflective pavement marking all weather Yellow Solid 6 in. 125 mils
2240 2002 Reflective pavement marking all weather Yellow Solid 6 in. 100 mils
2240 2001 Reflective pavement marking all weather Yellow Broken 6 in. 100 mils
2240 2003 Reflective pavement marking all weather White Broken 6 in. 100 mils
8908 2003 Reflective pavement marking all weather White Broken 6 in. 100 mils
8909 2005 Reflective pavement marking all weather Yellow Broken 6 in. N/A
8994 2004 Reflective pavement marking all weather Yellow Broken 6 in. 125 mils
8994 2007 Reflective pavement marking all weather White Broken 6 in. 125 mils
8020 2005 Preformed pavement marking Type I19 White Solid 6 in. 100 mils
8020 2009 Preformed pavement marking Type I Yellow Solid 6 in. 100 mils
8020 2011 Preformed pavement marking Type I Yellow Broken 6 in. 100 mils
8744 2003 Inverted profile pavement marking20 Yellow Solid 6 in. N/A
8744 2006 Inverted profile pavement marking White Solid 6 in. N/A
8744 2007 Inverted profile pavement marking White Broken 6 in. N/A
666 2149 Reflective pavement marking Type II21 White Solid 6 in. N/A
666 2181 Reflective pavement marking Type II Yellow Solid 6 in. N/A
666 2146 Reflective pavement marking Type II White Broken 6 in. N/A
8909 2006 Reflective pavement marking wet (paint) Yellow Solid 6 in. N/A
8909 2008 Reflective pavement marking wet (paint) White Solid 6 in. N/A
6473 2004 Multipolymer (polyurea, epoxy etc.) White Solid 6 in. N/A
6473 2014 Multipolymer (polyurea, epoxy etc.) Yellow Solid 6 in. N/A
6473 2005 Multipolymer (polyurea, epoxy etc.) White Broken 6 in. N/A
6473 2015 Multipolymer (polyurea, epoxy etc.) Yellow Broken 6 in. N/A
17 Hot-applied thermoplastic 18 All-weather thermoplastic 19 Preformed thermoplastic 20 Audible thermoplastic 21 Paint
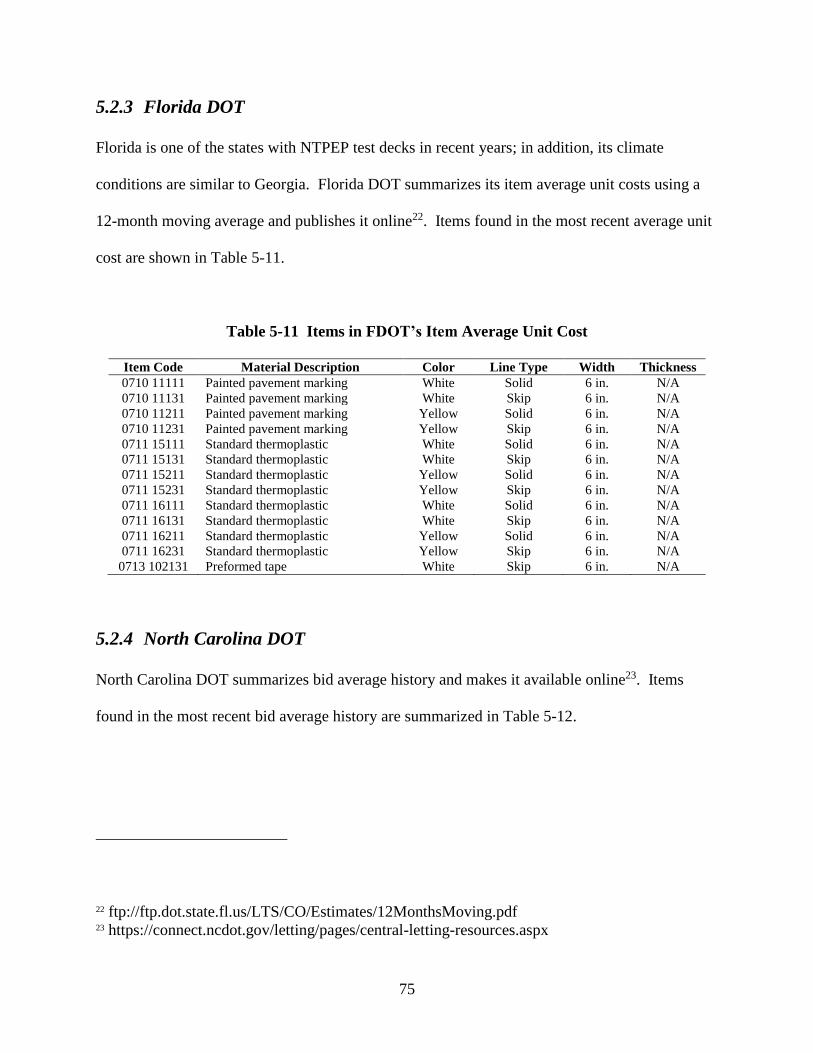
75
5.2.3 Florida DOT
Florida is one of the states with NTPEP test decks in recent years; in addition, its climate
conditions are similar to Georgia. Florida DOT summarizes its item average unit costs using a
12-month moving average and publishes it online22. Items found in the most recent average unit
cost are shown in Table 5-11.
Table 5-11 Items in FDOT’s Item Average Unit Cost
Item Code Material Description Color Line Type Width Thickness
0710 11111 Painted pavement marking White Solid 6 in. N/A
0710 11131 Painted pavement marking White Skip 6 in. N/A
0710 11211 Painted pavement marking Yellow Solid 6 in. N/A
0710 11231 Painted pavement marking Yellow Skip 6 in. N/A
0711 15111 Standard thermoplastic White Solid 6 in. N/A
0711 15131 Standard thermoplastic White Skip 6 in. N/A
0711 15211 Standard thermoplastic Yellow Solid 6 in. N/A
0711 15231 Standard thermoplastic Yellow Skip 6 in. N/A
0711 16111 Standard thermoplastic White Solid 6 in. N/A
0711 16131 Standard thermoplastic White Skip 6 in. N/A
0711 16211 Standard thermoplastic Yellow Solid 6 in. N/A
0711 16231 Standard thermoplastic Yellow Skip 6 in. N/A
0713 102131 Preformed tape White Skip 6 in. N/A
5.2.4 North Carolina DOT
North Carolina DOT summarizes bid average history and makes it available online23. Items
found in the most recent bid average history are summarized in Table 5-12.
22 ftp://ftp.dot.state.fl.us/LTS/CO/Estimates/12MonthsMoving.pdf 23 https://connect.ncdot.gov/letting/pages/central-letting-resources.aspx
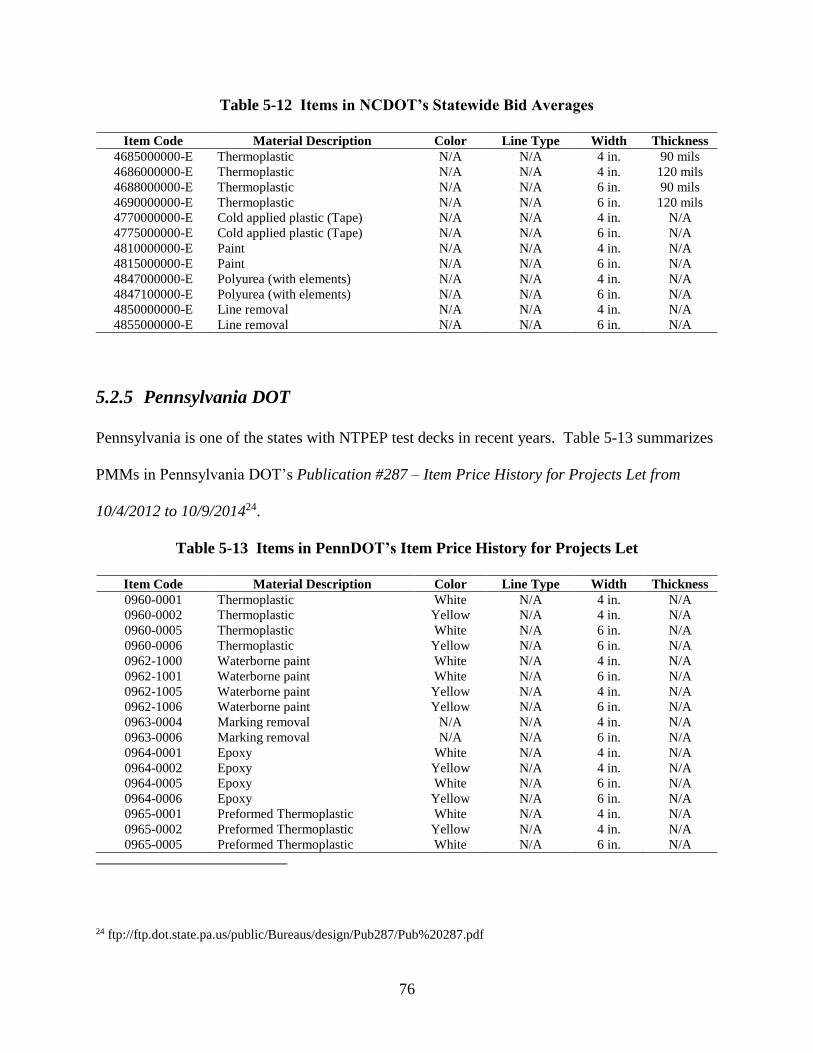
76
Table 5-12 Items in NCDOT’s Statewide Bid Averages
Item Code Material Description Color Line Type Width Thickness
4685000000-E Thermoplastic N/A N/A 4 in. 90 mils
4686000000-E Thermoplastic N/A N/A 4 in. 120 mils
4688000000-E Thermoplastic N/A N/A 6 in. 90 mils
4690000000-E Thermoplastic N/A N/A 6 in. 120 mils
4770000000-E Cold applied plastic (Tape) N/A N/A 4 in. N/A
4775000000-E Cold applied plastic (Tape) N/A N/A 6 in. N/A
4810000000-E Paint N/A N/A 4 in. N/A
4815000000-E Paint N/A N/A 6 in. N/A
4847000000-E Polyurea (with elements) N/A N/A 4 in. N/A
4847100000-E Polyurea (with elements) N/A N/A 6 in. N/A
4850000000-E Line removal N/A N/A 4 in. N/A
4855000000-E Line removal N/A N/A 6 in. N/A
5.2.5 Pennsylvania DOT
Pennsylvania is one of the states with NTPEP test decks in recent years. Table 5-13 summarizes
PMMs in Pennsylvania DOT’s Publication #287 – Item Price History for Projects Let from
10/4/2012 to 10/9/201424.
Table 5-13 Items in PennDOT’s Item Price History for Projects Let
Item Code Material Description Color Line Type Width Thickness
0960-0001 Thermoplastic White N/A 4 in. N/A
0960-0002 Thermoplastic Yellow N/A 4 in. N/A
0960-0005 Thermoplastic White N/A 6 in. N/A
0960-0006 Thermoplastic Yellow N/A 6 in. N/A
0962-1000 Waterborne paint White N/A 4 in. N/A
0962-1001 Waterborne paint White N/A 6 in. N/A
0962-1005 Waterborne paint Yellow N/A 4 in. N/A
0962-1006 Waterborne paint Yellow N/A 6 in. N/A
0963-0004 Marking removal N/A N/A 4 in. N/A
0963-0006 Marking removal N/A N/A 6 in. N/A
0964-0001 Epoxy White N/A 4 in. N/A
0964-0002 Epoxy Yellow N/A 4 in. N/A
0964-0005 Epoxy White N/A 6 in. N/A
0964-0006 Epoxy Yellow N/A 6 in. N/A
0965-0001 Preformed Thermoplastic White N/A 4 in. N/A
0965-0002 Preformed Thermoplastic Yellow N/A 4 in. N/A
0965-0005 Preformed Thermoplastic White N/A 6 in. N/A
24 ftp://ftp.dot.state.pa.us/public/Bureaus/design/Pub287/Pub%20287.pdf
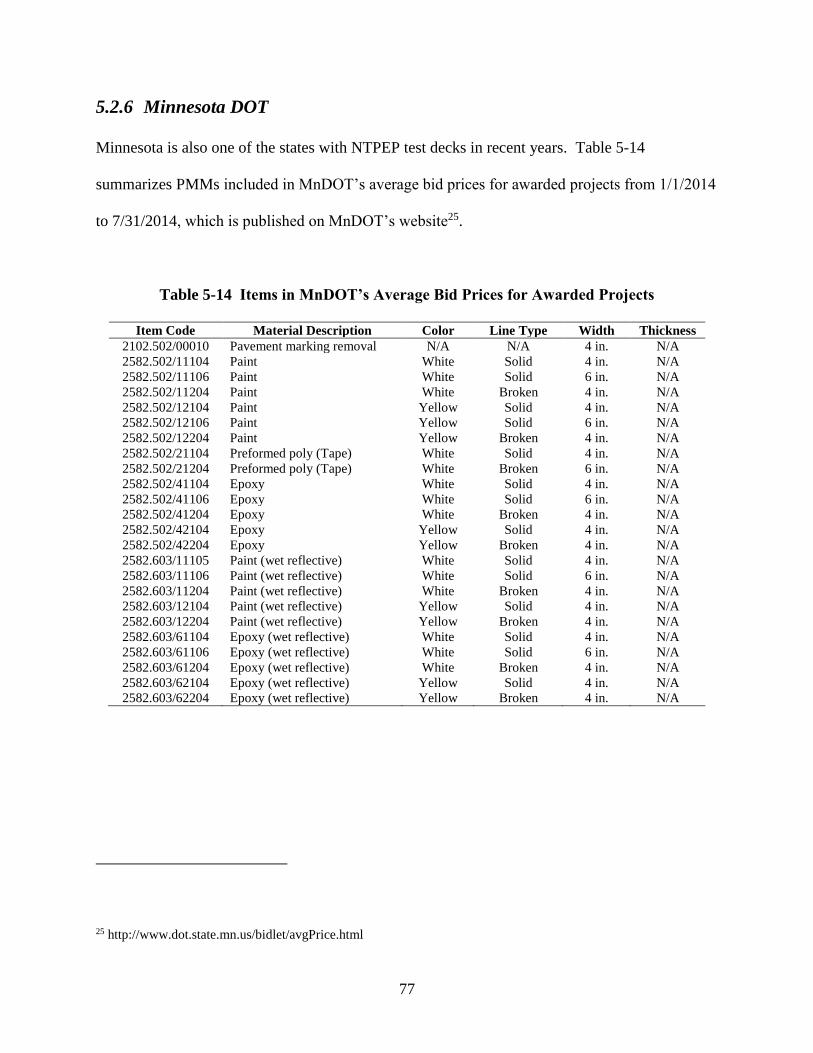
77
5.2.6 Minnesota DOT
Minnesota is also one of the states with NTPEP test decks in recent years. Table 5-14
summarizes PMMs included in MnDOT’s average bid prices for awarded projects from 1/1/2014
to 7/31/2014, which is published on MnDOT’s website25.
Table 5-14 Items in MnDOT’s Average Bid Prices for Awarded Projects
Item Code Material Description Color Line Type Width Thickness
2102.502/00010 Pavement marking removal N/A N/A 4 in. N/A
2582.502/11104 Paint White Solid 4 in. N/A
2582.502/11106 Paint White Solid 6 in. N/A
2582.502/11204 Paint White Broken 4 in. N/A
2582.502/12104 Paint Yellow Solid 4 in. N/A
2582.502/12106 Paint Yellow Solid 6 in. N/A
2582.502/12204 Paint Yellow Broken 4 in. N/A
2582.502/21104 Preformed poly (Tape) White Solid 4 in. N/A
2582.502/21204 Preformed poly (Tape) White Broken 6 in. N/A
2582.502/41104 Epoxy White Solid 4 in. N/A
2582.502/41106 Epoxy White Solid 6 in. N/A
2582.502/41204 Epoxy White Broken 4 in. N/A
2582.502/42104 Epoxy Yellow Solid 4 in. N/A
2582.502/42204 Epoxy Yellow Broken 4 in. N/A
2582.603/11105 Paint (wet reflective) White Solid 4 in. N/A
2582.603/11106 Paint (wet reflective) White Solid 6 in. N/A
2582.603/11204 Paint (wet reflective) White Broken 4 in. N/A
2582.603/12104 Paint (wet reflective) Yellow Solid 4 in. N/A
2582.603/12204 Paint (wet reflective) Yellow Broken 4 in. N/A
2582.603/61104 Epoxy (wet reflective) White Solid 4 in. N/A
2582.603/61106 Epoxy (wet reflective) White Solid 6 in. N/A
2582.603/61204 Epoxy (wet reflective) White Broken 4 in. N/A
2582.603/62104 Epoxy (wet reflective) Yellow Solid 4 in. N/A
2582.603/62204 Epoxy (wet reflective) Yellow Broken 4 in. N/A
25 http://www.dot.state.mn.us/bidlet/avgPrice.html
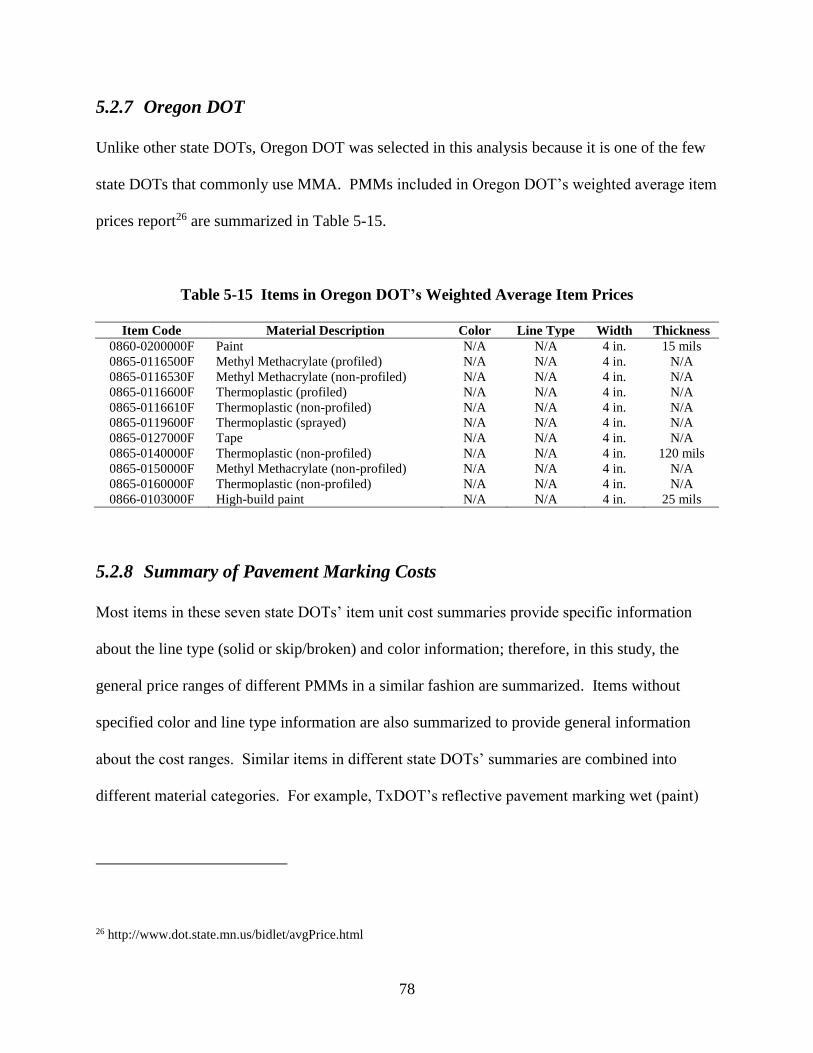
78
5.2.7 Oregon DOT
Unlike other state DOTs, Oregon DOT was selected in this analysis because it is one of the few
state DOTs that commonly use MMA. PMMs included in Oregon DOT’s weighted average item
prices report26 are summarized in Table 5-15.
Table 5-15 Items in Oregon DOT’s Weighted Average Item Prices
Item Code Material Description Color Line Type Width Thickness
0860-0200000F Paint N/A N/A 4 in. 15 mils
0865-0116500F Methyl Methacrylate (profiled) N/A N/A 4 in. N/A
0865-0116530F Methyl Methacrylate (non-profiled) N/A N/A 4 in. N/A
0865-0116600F Thermoplastic (profiled) N/A N/A 4 in. N/A
0865-0116610F Thermoplastic (non-profiled) N/A N/A 4 in. N/A
0865-0119600F Thermoplastic (sprayed) N/A N/A 4 in. N/A
0865-0127000F Tape N/A N/A 4 in. N/A
0865-0140000F Thermoplastic (non-profiled) N/A N/A 4 in. 120 mils
0865-0150000F Methyl Methacrylate (non-profiled) N/A N/A 4 in. N/A
0865-0160000F Thermoplastic (non-profiled) N/A N/A 4 in. N/A
0866-0103000F High-build paint N/A N/A 4 in. 25 mils
5.2.8 Summary of Pavement Marking Costs
Most items in these seven state DOTs’ item unit cost summaries provide specific information
about the line type (solid or skip/broken) and color information; therefore, in this study, the
general price ranges of different PMMs in a similar fashion are summarized. Items without
specified color and line type information are also summarized to provide general information
about the cost ranges. Similar items in different state DOTs’ summaries are combined into
different material categories. For example, TxDOT’s reflective pavement marking wet (paint)
26 http://www.dot.state.mn.us/bidlet/avgPrice.html
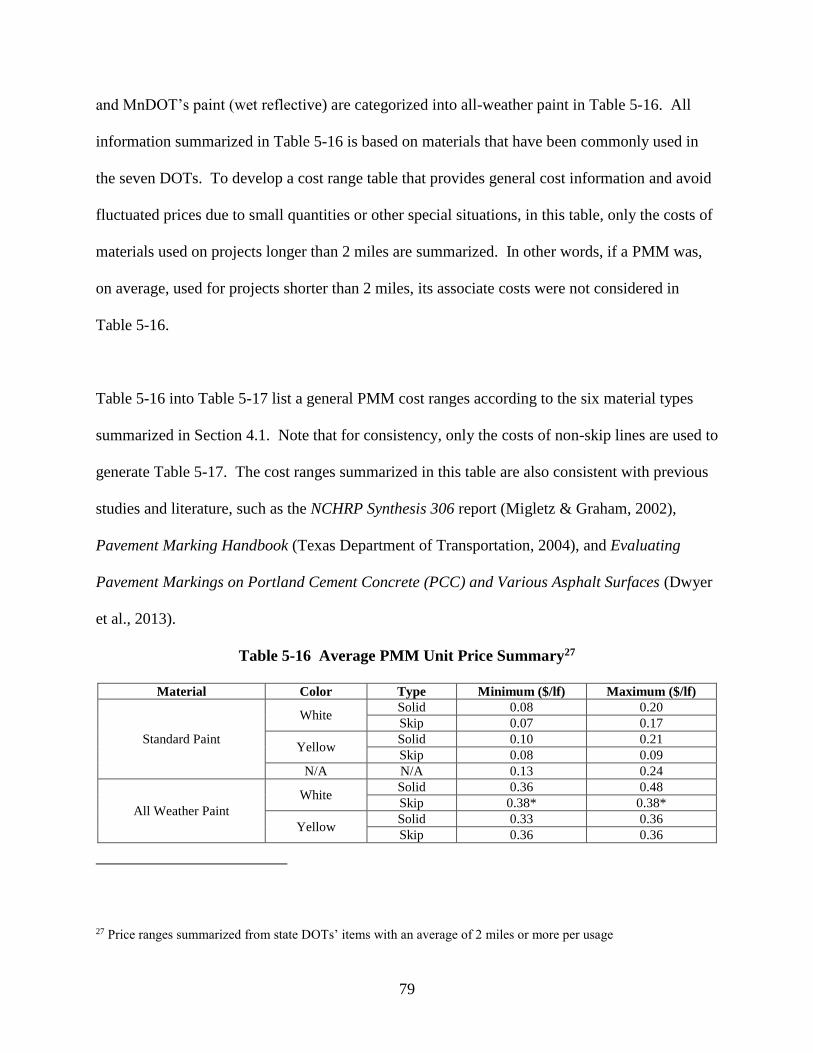
79
and MnDOT’s paint (wet reflective) are categorized into all-weather paint in Table 5-16. All
information summarized in Table 5-16 is based on materials that have been commonly used in
the seven DOTs. To develop a cost range table that provides general cost information and avoid
fluctuated prices due to small quantities or other special situations, in this table, only the costs of
materials used on projects longer than 2 miles are summarized. In other words, if a PMM was,
on average, used for projects shorter than 2 miles, its associate costs were not considered in
Table 5-16.
Table 5-16 into Table 5-17 list a general PMM cost ranges according to the six material types
summarized in Section 4.1. Note that for consistency, only the costs of non-skip lines are used to
generate Table 5-17. The cost ranges summarized in this table are also consistent with previous
studies and literature, such as the NCHRP Synthesis 306 report (Migletz & Graham, 2002),
Pavement Marking Handbook (Texas Department of Transportation, 2004), and Evaluating
Pavement Markings on Portland Cement Concrete (PCC) and Various Asphalt Surfaces (Dwyer
et al., 2013).
Table 5-16 Average PMM Unit Price Summary27
Material Color Type Minimum ($/lf) Maximum ($/lf)
Standard Paint
White Solid 0.08 0.20
Skip 0.07 0.17
Yellow Solid 0.10 0.21
Skip 0.08 0.09
N/A N/A 0.13 0.24
All Weather Paint
White Solid 0.36 0.48
Skip 0.38* 0.38*
Yellow Solid 0.33 0.36
Skip 0.36 0.36
27 Price ranges summarized from state DOTs’ items with an average of 2 miles or more per usage
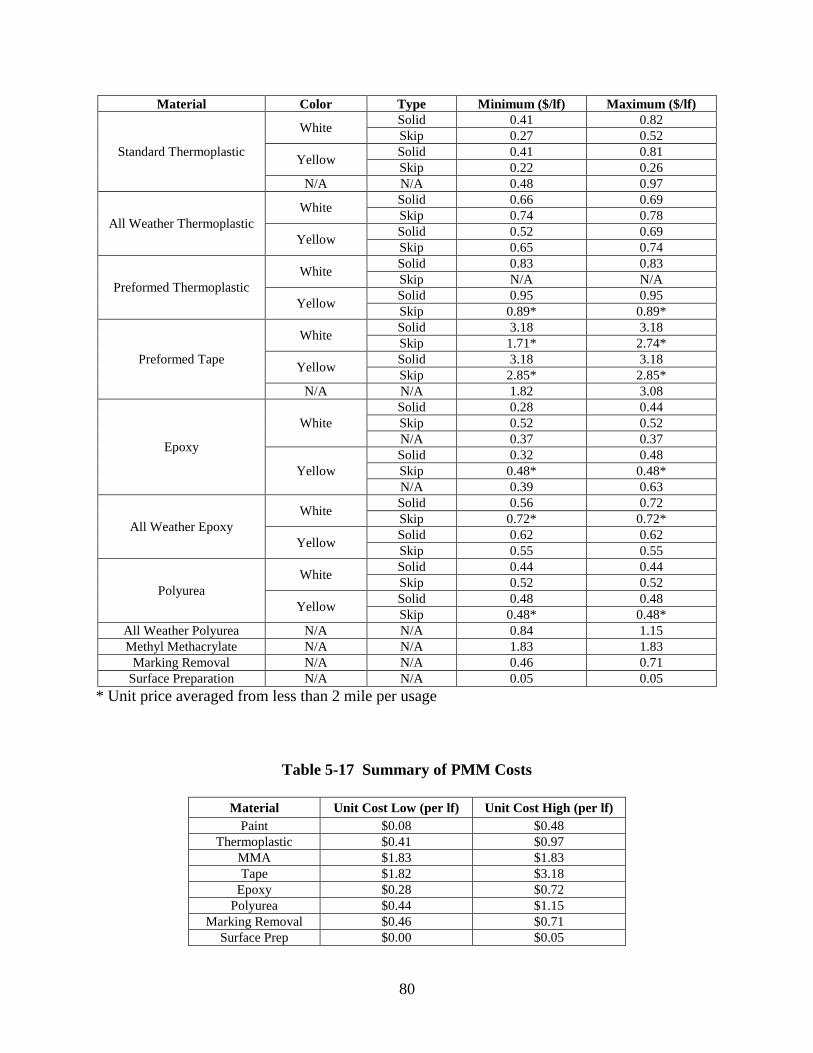
80
Material Color Type Minimum ($/lf) Maximum ($/lf)
Standard Thermoplastic
White Solid 0.41 0.82
Skip 0.27 0.52
Yellow Solid 0.41 0.81
Skip 0.22 0.26
N/A N/A 0.48 0.97
All Weather Thermoplastic
White Solid 0.66 0.69
Skip 0.74 0.78
Yellow Solid 0.52 0.69
Skip 0.65 0.74
Preformed Thermoplastic
White Solid 0.83 0.83
Skip N/A N/A
Yellow Solid 0.95 0.95
Skip 0.89* 0.89*
Preformed Tape
White Solid 3.18 3.18
Skip 1.71* 2.74*
Yellow Solid 3.18 3.18
Skip 2.85* 2.85*
N/A N/A 1.82 3.08
Epoxy
White
Solid 0.28 0.44
Skip 0.52 0.52
N/A 0.37 0.37
Yellow
Solid 0.32 0.48
Skip 0.48* 0.48*
N/A 0.39 0.63
All Weather Epoxy
White Solid 0.56 0.72
Skip 0.72* 0.72*
Yellow Solid 0.62 0.62
Skip 0.55 0.55
Polyurea
White Solid 0.44 0.44
Skip 0.52 0.52
Yellow Solid 0.48 0.48
Skip 0.48* 0.48*
All Weather Polyurea N/A N/A 0.84 1.15
Methyl Methacrylate N/A N/A 1.83 1.83
Marking Removal N/A N/A 0.46 0.71
Surface Preparation N/A N/A 0.05 0.05
* Unit price averaged from less than 2 mile per usage
Table 5-17 Summary of PMM Costs
Material Unit Cost Low (per lf) Unit Cost High (per lf)
Paint $0.08 $0.48
Thermoplastic $0.41 $0.97
MMA $1.83 $1.83
Tape $1.82 $3.18
Epoxy $0.28 $0.72
Polyurea $0.44 $1.15
Marking Removal $0.46 $0.71
Surface Prep $0.00 $0.05
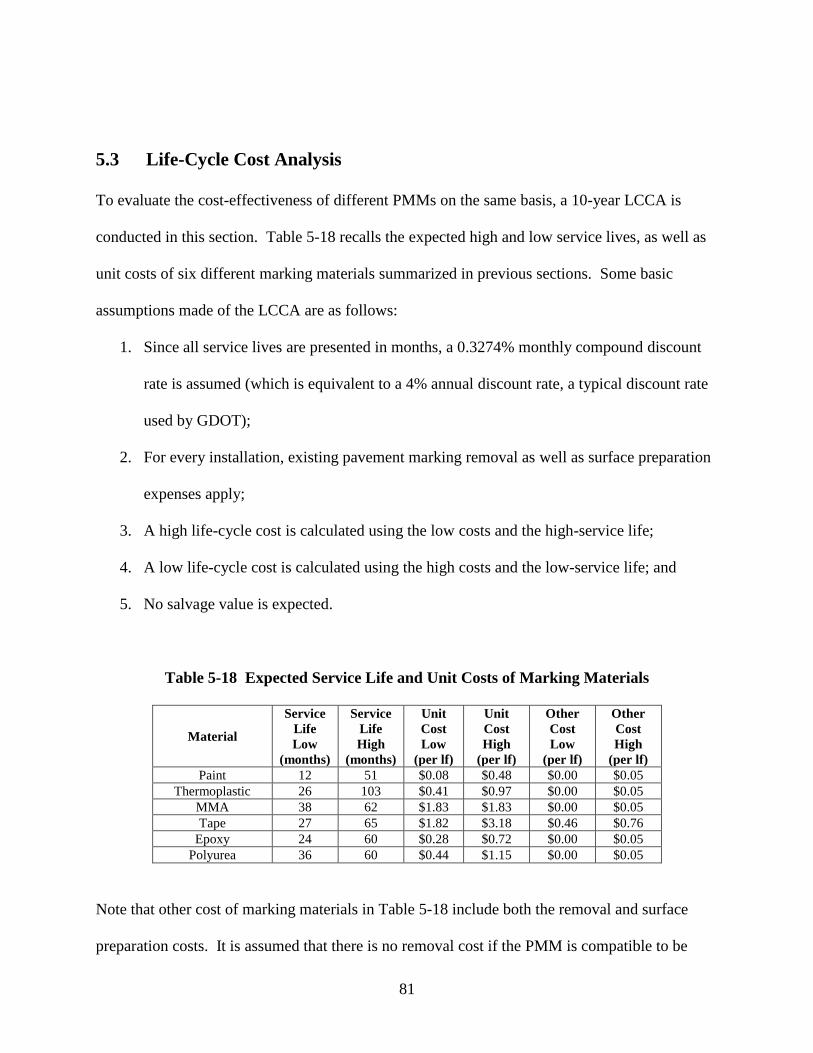
81
5.3 Life-Cycle Cost Analysis
To evaluate the cost-effectiveness of different PMMs on the same basis, a 10-year LCCA is
conducted in this section. Table 5-18 recalls the expected high and low service lives, as well as
unit costs of six different marking materials summarized in previous sections. Some basic
assumptions made of the LCCA are as follows:
1. Since all service lives are presented in months, a 0.3274% monthly compound discount
rate is assumed (which is equivalent to a 4% annual discount rate, a typical discount rate
used by GDOT);
2. For every installation, existing pavement marking removal as well as surface preparation
expenses apply;
3. A high life-cycle cost is calculated using the low costs and the high-service life;
4. A low life-cycle cost is calculated using the high costs and the low-service life; and
5. No salvage value is expected.
Table 5-18 Expected Service Life and Unit Costs of Marking Materials
Material
Service
Life
Low
(months)
Service
Life
High
(months)
Unit
Cost
Low
(per lf)
Unit
Cost
High
(per lf)
Other
Cost
Low
(per lf)
Other
Cost
High
(per lf) Paint 12 51 $0.08 $0.48 $0.00 $0.05
Thermoplastic 26 103 $0.41 $0.97 $0.00 $0.05
MMA 38 62 $1.83 $1.83 $0.00 $0.05
Tape 27 65 $1.82 $3.18 $0.46 $0.76
Epoxy 24 60 $0.28 $0.72 $0.00 $0.05
Polyurea 36 60 $0.44 $1.15 $0.00 $0.05
Note that other cost of marking materials in Table 5-18 include both the removal and surface
preparation costs. It is assumed that there is no removal cost if the PMM is compatible to be
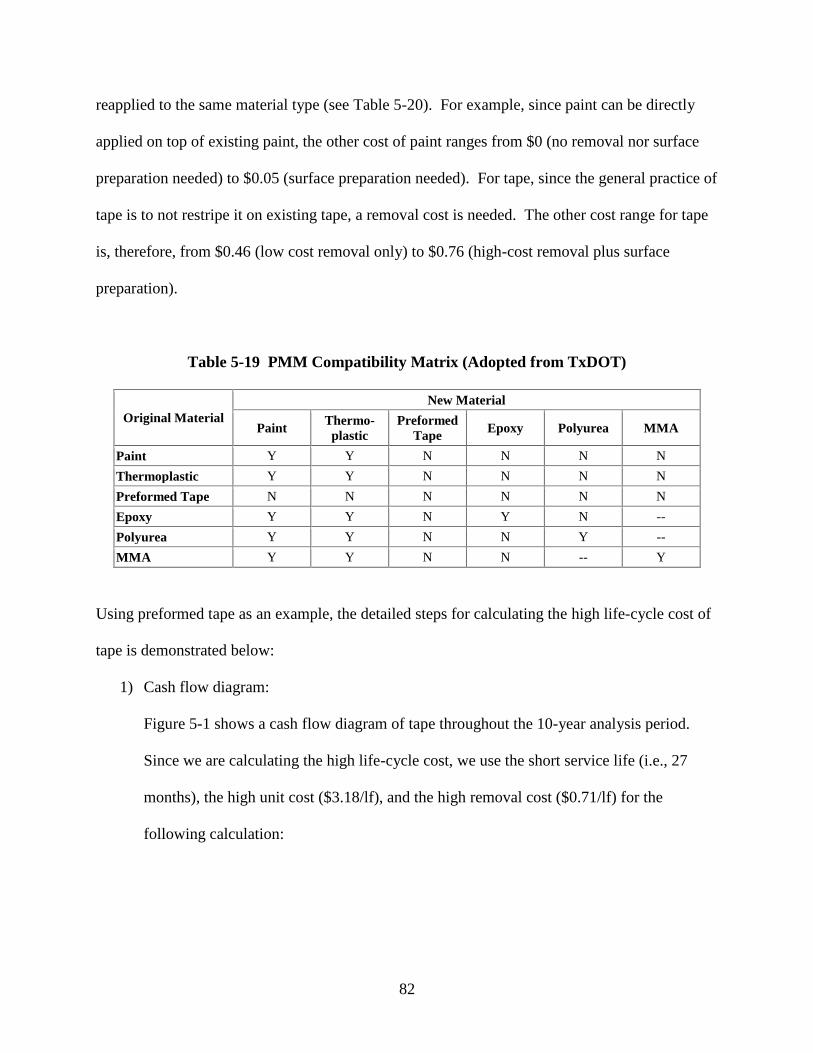
82
reapplied to the same material type (see Table 5-20). For example, since paint can be directly
applied on top of existing paint, the other cost of paint ranges from $0 (no removal nor surface
preparation needed) to $0.05 (surface preparation needed). For tape, since the general practice of
tape is to not restripe it on existing tape, a removal cost is needed. The other cost range for tape
is, therefore, from $0.46 (low cost removal only) to $0.76 (high-cost removal plus surface
preparation).
Table 5-19 PMM Compatibility Matrix (Adopted from TxDOT)
Original Material
New Material
Paint Thermo-
plastic
Preformed
Tape Epoxy Polyurea MMA
Paint Y Y N N N N
Thermoplastic Y Y N N N N
Preformed Tape N N N N N N
Epoxy Y Y N Y N --
Polyurea Y Y N N Y --
MMA Y Y N N -- Y
Using preformed tape as an example, the detailed steps for calculating the high life-cycle cost of
tape is demonstrated below:
1) Cash flow diagram:
Figure 5-1 shows a cash flow diagram of tape throughout the 10-year analysis period.
Since we are calculating the high life-cycle cost, we use the short service life (i.e., 27
months), the high unit cost ($3.18/lf), and the high removal cost ($0.71/lf) for the
following calculation:
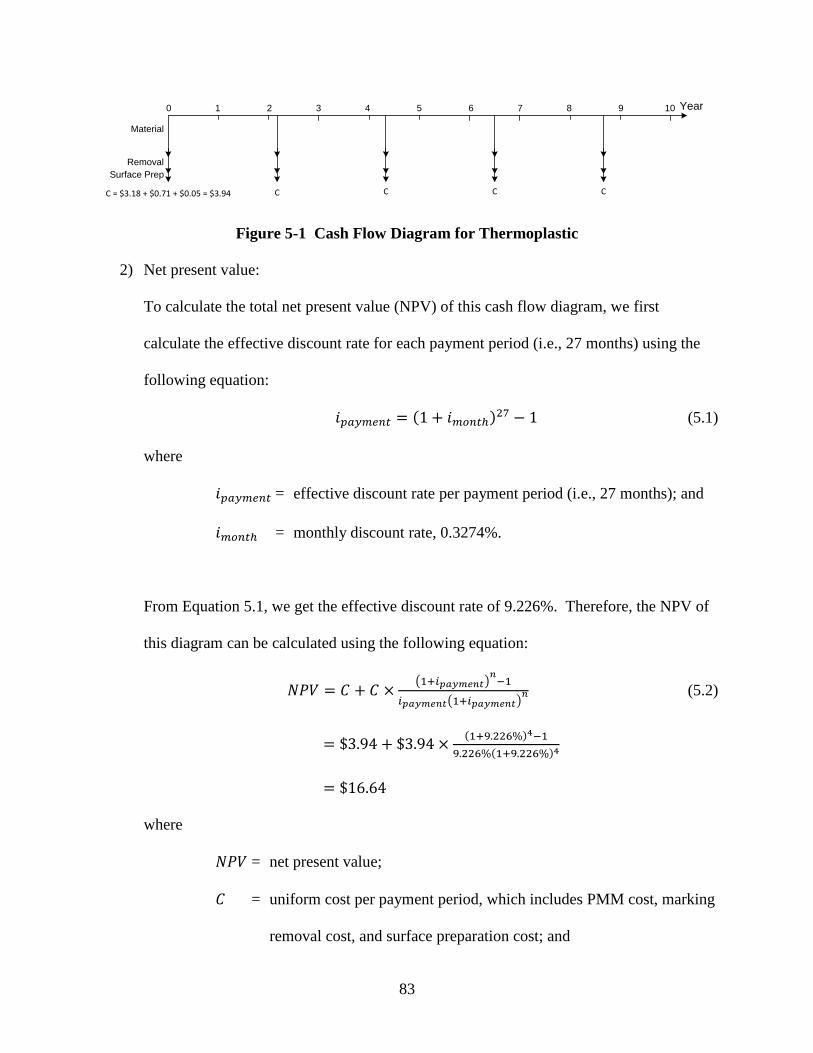
83
Material
Removal
Surface Prep
Year0 1 2 3 4 5 6 7 8 9 10
C = $3.18 + $0.71 + $0.05 = $3.94 C C C C
Figure 5-1 Cash Flow Diagram for Thermoplastic
2) Net present value:
To calculate the total net present value (NPV) of this cash flow diagram, we first
calculate the effective discount rate for each payment period (i.e., 27 months) using the
following equation:
𝑖𝑝𝑎𝑦𝑚𝑒𝑛𝑡 = (1 + 𝑖𝑚𝑜𝑛𝑡ℎ)27 − 1 (5.1)
where
𝑖𝑝𝑎𝑦𝑚𝑒𝑛𝑡 = effective discount rate per payment period (i.e., 27 months); and
𝑖𝑚𝑜𝑛𝑡ℎ = monthly discount rate, 0.3274%.
From Equation 5.1, we get the effective discount rate of 9.226%. Therefore, the NPV of
this diagram can be calculated using the following equation:
𝑁𝑃𝑉 = 𝐶 + 𝐶 ×(1+𝑖𝑝𝑎𝑦𝑚𝑒𝑛𝑡)
𝑛−1
𝑖𝑝𝑎𝑦𝑚𝑒𝑛𝑡(1+𝑖𝑝𝑎𝑦𝑚𝑒𝑛𝑡)𝑛 (5.2)
= $3.94 + $3.94 ×(1+9.226%)4−1
9.226%(1+9.226%)4
= $16.64
where
𝑁𝑃𝑉 = net present value;
𝐶 = uniform cost per payment period, which includes PMM cost, marking
removal cost, and surface preparation cost; and
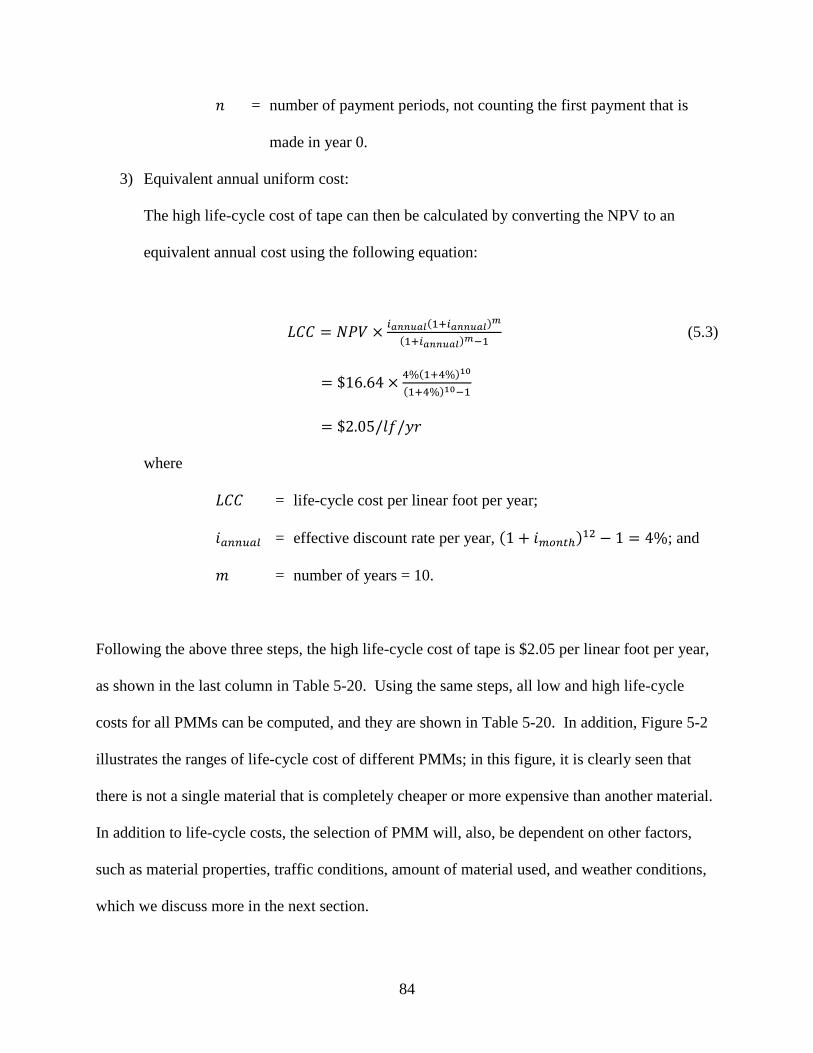
84
𝑛 = number of payment periods, not counting the first payment that is
made in year 0.
3) Equivalent annual uniform cost:
The high life-cycle cost of tape can then be calculated by converting the NPV to an
equivalent annual cost using the following equation:
𝐿𝐶𝐶 = 𝑁𝑃𝑉 ×𝑖𝑎𝑛𝑛𝑢𝑎𝑙(1+𝑖𝑎𝑛𝑛𝑢𝑎𝑙)𝑚
(1+𝑖𝑎𝑛𝑛𝑢𝑎𝑙)𝑚−1 (5.3)
= $16.64 ×4%(1+4%)10
(1+4%)10−1
= $2.05/𝑙𝑓/𝑦𝑟
where
𝐿𝐶𝐶 = life-cycle cost per linear foot per year;
𝑖𝑎𝑛𝑛𝑢𝑎𝑙 = effective discount rate per year, (1 + 𝑖𝑚𝑜𝑛𝑡ℎ)12 − 1 = 4%; and
𝑚 = number of years = 10.
Following the above three steps, the high life-cycle cost of tape is $2.05 per linear foot per year,
as shown in the last column in Table 5-20. Using the same steps, all low and high life-cycle
costs for all PMMs can be computed, and they are shown in Table 5-20. In addition, Figure 5-2
illustrates the ranges of life-cycle cost of different PMMs; in this figure, it is clearly seen that
there is not a single material that is completely cheaper or more expensive than another material.
In addition to life-cycle costs, the selection of PMM will, also, be dependent on other factors,
such as material properties, traffic conditions, amount of material used, and weather conditions,
which we discuss more in the next section.
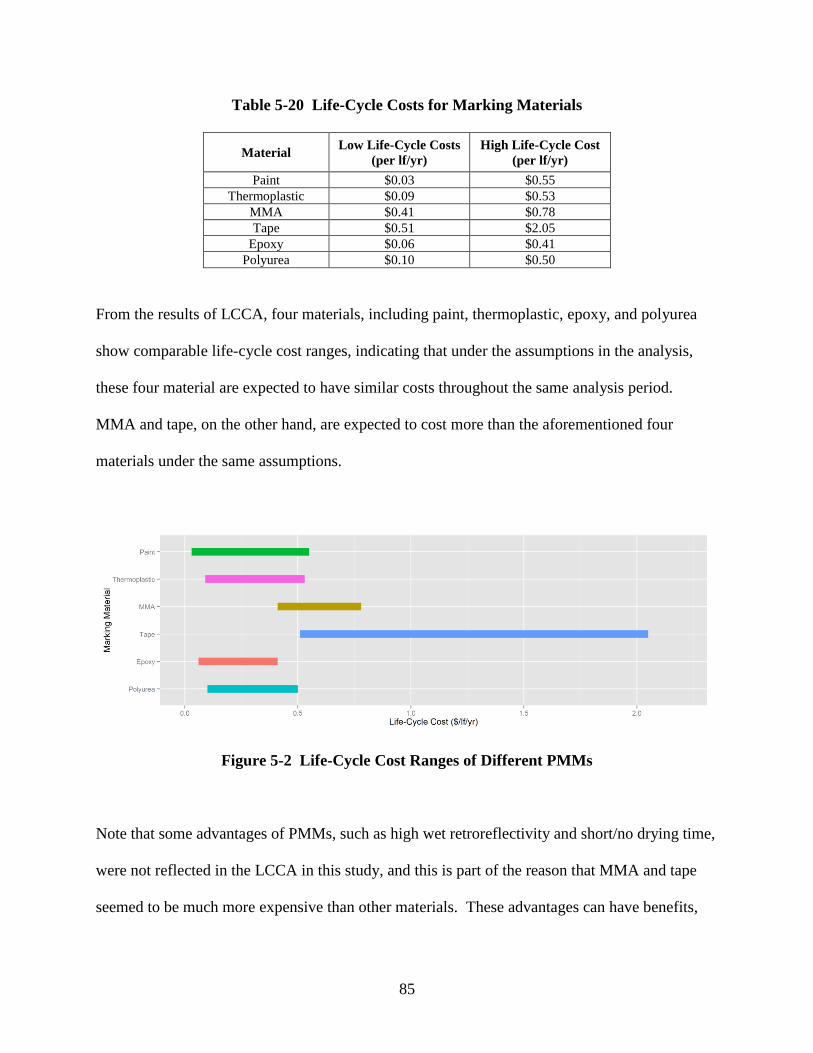
85
Table 5-20 Life-Cycle Costs for Marking Materials
Material Low Life-Cycle Costs
(per lf/yr)
High Life-Cycle Cost
(per lf/yr)
Paint $0.03 $0.55
Thermoplastic $0.09 $0.53
MMA $0.41 $0.78
Tape $0.51 $2.05
Epoxy $0.06 $0.41
Polyurea $0.10 $0.50
From the results of LCCA, four materials, including paint, thermoplastic, epoxy, and polyurea
show comparable life-cycle cost ranges, indicating that under the assumptions in the analysis,
these four material are expected to have similar costs throughout the same analysis period.
MMA and tape, on the other hand, are expected to cost more than the aforementioned four
materials under the same assumptions.
Figure 5-2 Life-Cycle Cost Ranges of Different PMMs
Note that some advantages of PMMs, such as high wet retroreflectivity and short/no drying time,
were not reflected in the LCCA in this study, and this is part of the reason that MMA and tape
seemed to be much more expensive than other materials. These advantages can have benefits,
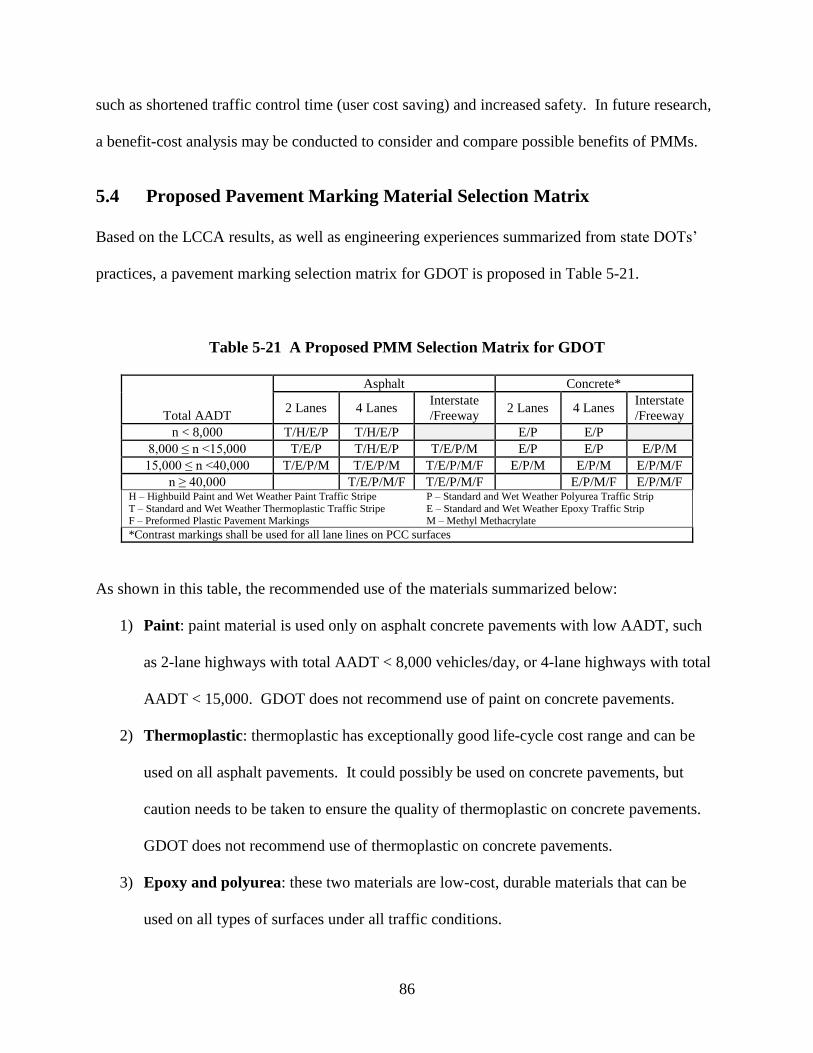
86
such as shortened traffic control time (user cost saving) and increased safety. In future research,
a benefit-cost analysis may be conducted to consider and compare possible benefits of PMMs.
5.4 Proposed Pavement Marking Material Selection Matrix
Based on the LCCA results, as well as engineering experiences summarized from state DOTs’
practices, a pavement marking selection matrix for GDOT is proposed in Table 5-21.
Table 5-21 A Proposed PMM Selection Matrix for GDOT
Total AADT
Asphalt Concrete*
2 Lanes 4 Lanes Interstate
/Freeway 2 Lanes 4 Lanes
Interstate
/Freeway
n < 8,000 T/H/E/P T/H/E/P E/P E/P
8,000 ≤ n <15,000 T/E/P T/H/E/P T/E/P/M E/P E/P E/P/M
15,000 ≤ n <40,000 T/E/P/M T/E/P/M T/E/P/M/F E/P/M E/P/M E/P/M/F
n ≥ 40,000 T/E/P/M/F T/E/P/M/F E/P/M/F E/P/M/F H – Highbuild Paint and Wet Weather Paint Traffic Stripe
T – Standard and Wet Weather Thermoplastic Traffic Stripe F – Preformed Plastic Pavement Markings
P – Standard and Wet Weather Polyurea Traffic Strip
E – Standard and Wet Weather Epoxy Traffic Strip M – Methyl Methacrylate
*Contrast markings shall be used for all lane lines on PCC surfaces
As shown in this table, the recommended use of the materials summarized below:
1) Paint: paint material is used only on asphalt concrete pavements with low AADT, such
as 2-lane highways with total AADT < 8,000 vehicles/day, or 4-lane highways with total
AADT < 15,000. GDOT does not recommend use of paint on concrete pavements.
2) Thermoplastic: thermoplastic has exceptionally good life-cycle cost range and can be
used on all asphalt pavements. It could possibly be used on concrete pavements, but
caution needs to be taken to ensure the quality of thermoplastic on concrete pavements.
GDOT does not recommend use of thermoplastic on concrete pavements.
3) Epoxy and polyurea: these two materials are low-cost, durable materials that can be
used on all types of surfaces under all traffic conditions.
87
4) MMA: MMA performs like other durable materials, such as thermoplastic and tape; its
unique patterned texture can provide good wet retroreflectivity; moreover, it can be used
on all surface types; however, due to its higher unit cost, this type of material is only
recommended to be used for high traffic volume roads.
5) Tape: similarly, tape performs like other durable materials. One great advantage of tape
is that no drying time is required for its installation; in addition, patterned tapes can
provide high wet retroreflectivity. Tape can also perform consistently under various
weather and traffic conditions; it can also perform consistently in different line colors and
on different pavement surface types. Due to its high life-cycle cost, nevertheless, tape is
only considered/recommended for use on roads with a high volume of traffic.

88
89
6. DEVELOPMENT OF GDOT PAVEMENT MARKING HANDBOOK
AND INTERACTIVE TUTORIAL
This chapter summarizes the development of the GDOT Pavement Marking Handbook and the
interactive tutorial. The first section presents the objectives and organization of the handbook.
The second section presents the objectives and design of tutorial.
6.1 Objectives and Organization of Handbook
The objective of this handbook is fourfold. First, this handbook gives a summary of standard test
methods, practices, and specifications used in Georgia. Second, it provides a list of commonly
used PMMs and their properties and notes for installation. Third, it provides general pre-
installation and post-installation preparation and inspection procedures. Fourth, it provides
PMM selection suggestions based on the cost-effectiveness of different materials under the
considerations of different traffic conditions, surface types, and functionalities of roads.
The handbook consists of three major topics: PMMs, pavement marking installation inspection,
and PMM selection. The first topic, PMMs, comprehensively covers commonly used PMMs in
terms of the history, physical properties, application procedures, and advantage and
disadvantages. The second topic, pavement marking installation inspection, describes the
general required procedures to prepare pavement surface for installation and the methods for
inspecting and assessing pavement marking performance. The third topic, PMM selection,
summarizes material costs and expected performance in terms of service life and provides
suggestions for cost-effective PMMs according to the road’s traffic condition, surface type, and
functionalities. For details, the full version of the handbook is shown in Appendix I.
90
6.2 Objectives and Design of the Interactive Tutorial
The objective of the interactive tutorial is to convert texts into interactive messages that combine
texts, images, videos, and interactive functions to help users navigate through the tutorial and
find the information they need.
The design of this interactive tutorial is to provide intuitive navigation for users to quickly
absorb information. Instead of putting everything in texts and tables, we use icons, figures,
videos, and interactive functions to help achieve this goal. Below are some examples of the
simple and easy design of this tool. Figure 6-1 shows the home page of this tool. With four
images clearly show the functions provided, users can easily select the function/topic they would
like to use or learn. Figure 6-2 shows the material selection page. This page is designed for
decision-makers to quickly identify cost-effective materials by entering the traffic condition,
pavement surface type, and roadway functionality. Figure 6-3 shows the installation inspection
page, which consists of two main modules: inspection before installation and inspection after
installation. Again, simple image and text combination on this page helps the target users easily
navigate to the information they would like to learn.
Figure 6-4 shows the material description page, which conveys fundamental knowledge, such as
material properties, costs, usage, advantages and disadvantages, and some requirements of
different PMMs, which allows newly hired engineers to quickly navigate and absorb the
information. Similarly, Figure 6-5 provides detailed information of reflective beads, which is
also essential to pavement markings, allowing users to quickly learn and navigate the handbook
to learn the fundamental knowledge, such as types, properties, and usage, of reflective beads.
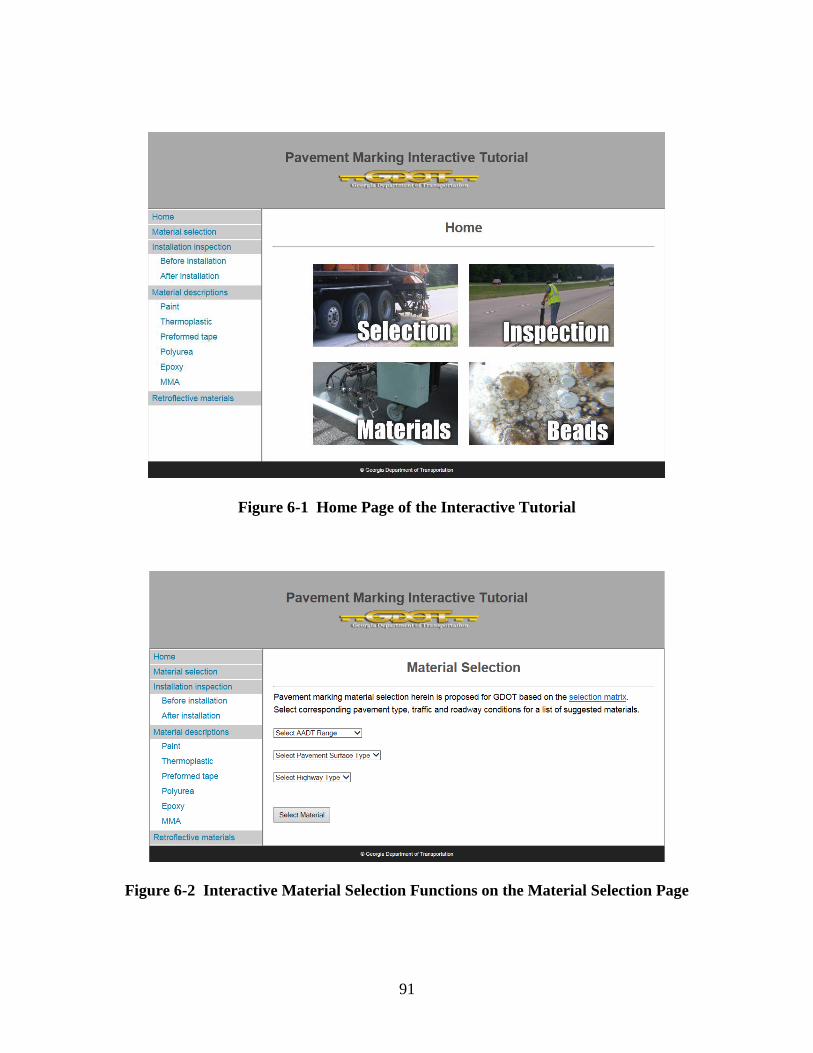
91
Figure 6-1 Home Page of the Interactive Tutorial
Figure 6-2 Interactive Material Selection Functions on the Material Selection Page
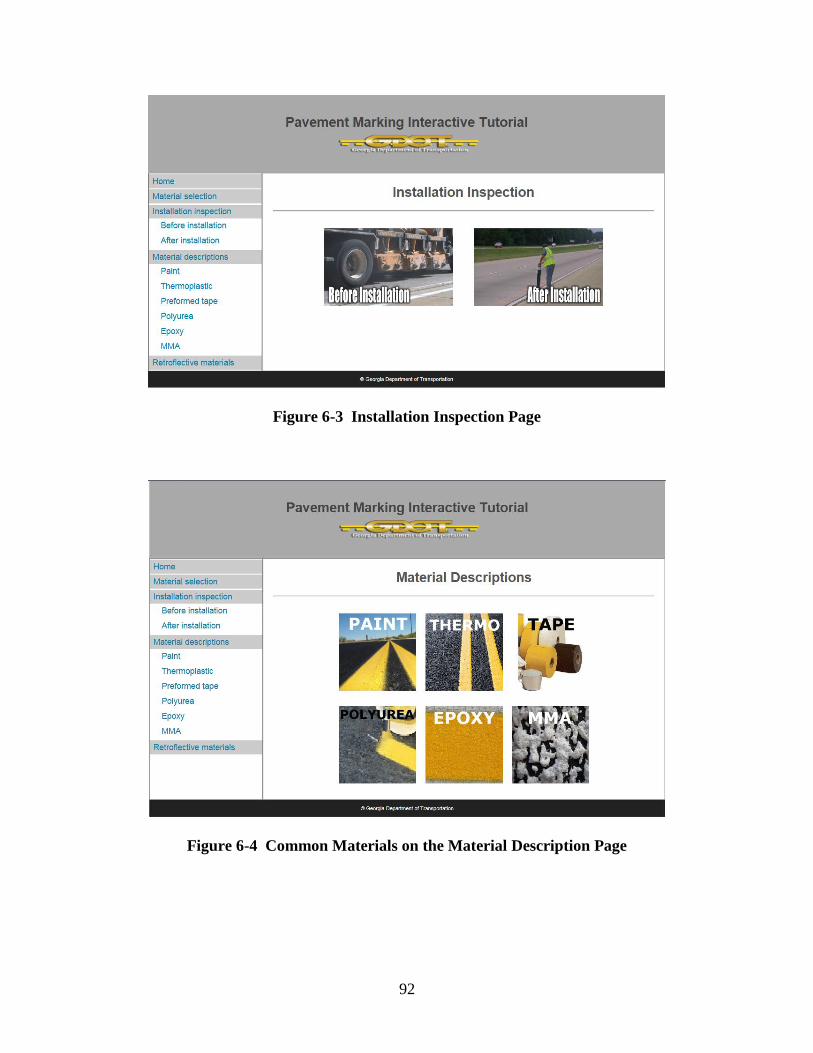
92
Figure 6-3 Installation Inspection Page
Figure 6-4 Common Materials on the Material Description Page
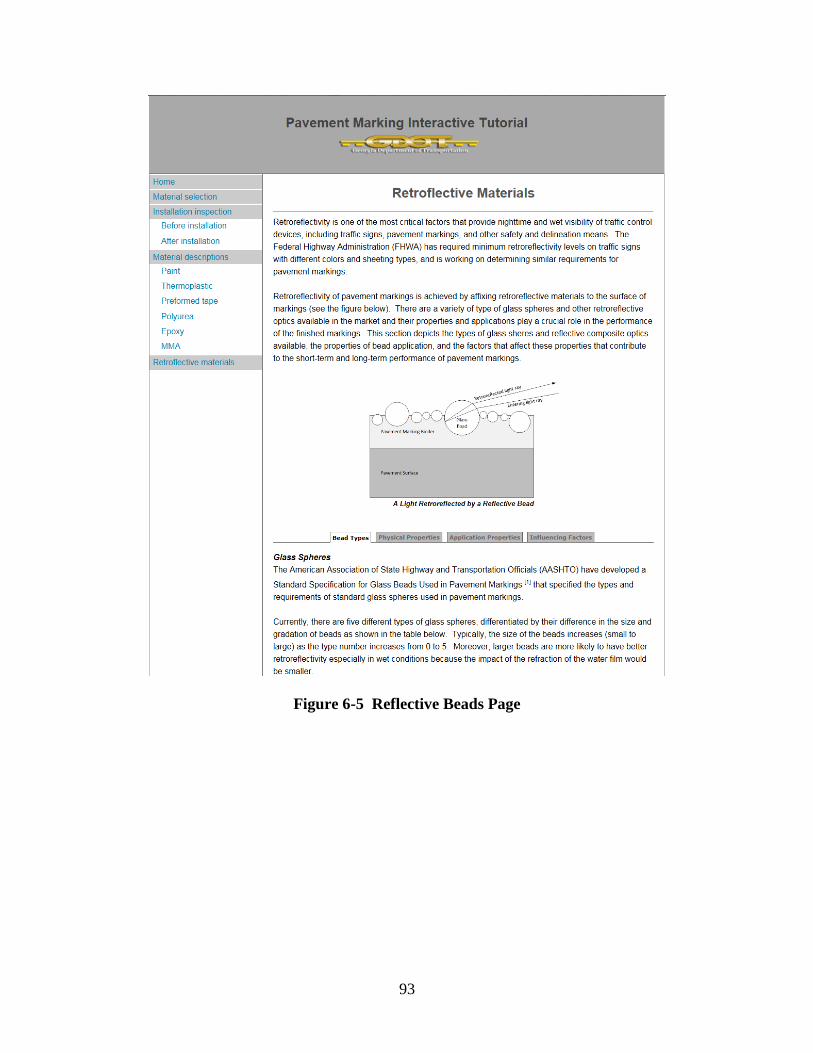
93
Figure 6-5 Reflective Beads Page

94
95
7. CONCLUSIONS AND RECOMMENDATIONS
In this study, a pavement marking handbook was developed for GDOT in support of the standard
procedures for PMM selection, installation, and inspection. In addition, an interactive tutorial
tool was also developed to facilitate the learning of the handbook. Key contributions and
findings of this study are summarized below:
1) A 4-step method was proposed to cleanse pavement marking retroreflectivity data for
better service life prediction using statistical analysis. This method can effectively
identify and remove irregular retroreflectivity measurements that are inconsistent
spatially (e.g., readings collected at intersections) and temporally (e.g., retroreflectivity
jump). Using this proposed method, simple linear regression models were developed to
predict retroreflectivity on GDOT Test Deck.
2) Multiple linear regression models were developed to predict pavement marking
retroreflectivity using NTPEP data. In order to develop these models with important
variables and prevent overfitting, statistical test methods were applied to identify
significant independent variables with higher prediction power; the final variables for the
MLMs include ADT, maximum retroreflectivity, and elapsed days. Results of this
analysis indicate that the MLMs developed were robust (had high R-squared values).
3) Expected service lives of PMMs were derived from the simple linear models for the
GDOT test deck data and from MLMs for the NTPEP data. Results of these expected life
were combined with recent literature to develop a comprehensive range of expected life
for each type of material. Similarly, unit costs of PMMs were summarized from seven
state DOTs to synthesize a range of potential unit cost for each type of material.
96
4) LCCA was conducted using the service life and cost ranges synthesized in this study, and
life-cycle cost ranges of six different materials, including paint, thermoplastic, tape,
epoxy, polyurea, and methyl methacrylate, were calculated. These results provide rich,
general information for each type of material, which can be used by other agencies. In
addition, providing a range of costs instead of a specific value can better reflect the real
world contract situation, which can, therefore, better support decision-making and
material selection.
5) A handbook and an interactive tutorial were developed for GDOT. The handbook is a
useful resource for GDOT’s day-to-day practices, training, and decision-making
regarding PMMs; they serves as a good foundation for future studies. Development of
the interactive tutorial can allow target users, such as decision- makers and newly hired
employees/trainees to navigate and obtain information needed efficiently and effectively.
Recommendations for future research are as follows:
1) It is recommended to develop training material on a) PMM selection and field inspection,
b) test deck data filtering and data processing, and c) use of the developed interactive
tutorial tool for implementation of this research outcomes. The training material is
valuable to GDOT and to local transportation agencies for a standardized operation, and
for knowledge transfer.
2) It is recommended to update and refine the life/performance matrix for Georgia’s specific
data for the refined decision matrix. One possible approach is to use the existing required
retroreflectivity data reported during the initial and 6-month inspections of all newly
installed pavement markings.

97
3) A pool fund study for collecting and sharing the pavement marking performance data in
the southeast states with similar weather condition, is also recommended.
4) For pavement marking asset management, more routine and accurate methods, e.g.,
mobile retroreflectivity measurements using mobile retroreflectometer or Light Detection
and Ranging (LiDAR) sensing technology, need to be explored.
5) A benefit-cost analysis can be conducted to take into consideration the potential benefits
of PMMs. Examples of potential benefits include user cost saving as a result of shorter
traffic control, as well as reduced crash rate as a result of more visible pavement
markings, especially under dark and wet conditions.
6) Bead embedment and bead dispersion (e.g. density) will also impact the performance of
pavement marking retro-reflectivity and a routine field inspection method need to be
developed.

98
99
REFERENCES
Abboud, N., and Bowman, B. L. (2002). “Cost- and Longevity-Based Scheduling of Paint and
Thermoplastic Striping.” Transportation Research Record: Journal of the Transportation
Research Board, (1794), 55–62.
Andrady, A. L. (1997). NCHRP Report 392: Pavement Marking Materials: Assessing
Environment-Friendly Performance. National Cooperative Highway Research Program,
Transportation Research Board, National Research Council, Washington D. C.
ASTM International. (2008). “ASTM D1710 - Standard Specification for Extruded
Polytetrafluoroethylene (PTFE) Rod, Heavy Walled Tubing and Basic Shapes.” ASTM
International, West Conshohocken, PA.
ASTM International. (2011). ASTM E2177 - Standard Test Method for Measuring the Coefficient
of Retroreflected Luminance (RL) of Pavement Markings in a Standard Condition of
Wetness. ASTM International, West Conshohocken, PA.
ASTM International. (2012). “ASTM E2832 - Standard Test Method for Measuring the
Coefficient of Retroreflected Luminance of Pavement Markings in a Standard Condition of
Continuous Wetting (RL-2).” ASTM International, West Conshohocken, PA.
Bahar, G., Masliah, M., Erwin, T., Tan, E., and Hauer, E. (2006). “NCHRP Web-Only
Document 92: Pavement Marking Materials and Markers: Real-World Relationship
Between Retroreflectivity and Safety Over Time.” National Cooperative Highway Research
Program, Transportation Research Board of the National Academies,
<http://onlinepubs.trb.org/onlinepubs/nchrp/nchrp_webdoc_92.pdf> (Jul. 3, 2015).
California Department of Transportation. (2011). Guideline for Selecting Materials and Standard
Special Profisions for Traffic Striping and Pavement Marking. California Department of
100
Transportation, Materials Engineering and Testing Services, Office of Roadway Materials
and Testing, Chemical Testing Branch.
Carlson, P. J., Park, E. S., and Andersen, C. K. (2009). “The Benefits of Pavement Markings: A
Renewed Perspective based on Resent and Ongoing Research.” Transportation Research
Board Annual Meeting, Washington D. C.
Debaillon, C., Carlson, P., He, Y., Schnell, T., and Aktan, F. (2007). Updates to research on
recommended minimum levels for pavement marking retroreflectivity to meet driver night
visibility needs. Office of Safety R & D, Turner-Fairbank Highway Research Center,
McLean, VA.
Debaillon, C., Carlson, P. J., Hawkins, H. G., He, Y. F., Schnell, T., and Aktan, F. (2008).
“Review and Development of Recommended Minimum Pavement Marking
Retroreflectivity Levels.” Transportation Research Record, (2055), 71–77.
Dwyer, C. E., Vavrik, W. R., and Becker, R. L. (2013). Evaluating Pavement Markings on
Portland Cement Concrete (PCC) and Various Asphalt Surfaces. Illinois Department of
Transportation Bureau of Materials and Physical Research.
Federal Highway Administration. (2013). “Proposed Pavement Marking Retroreflectivity
MUTCD Text.”
<http://mutcd.fhwa.dot.gov/knowledge/proposed09mutcdrev1/mutcd2009_pmretro.htm>
(Jun. 4, 2014).
Fitch, J. M. V. (2007). Pavement Marking Durability Statewide Final Report. Vermont Agency
of Transportation Materials and Research Section.
Florida Department of Transportation. (2014). “FDOT Florida Traffic Online.”
<http://www2.dot.state.fl.us/FloridaTrafficOnline/viewer.html> (Jul. 6, 2015).
101
Fu, H., and Wilmot, C. G. (2012). “Evaluating Alternative Pavement Marking Materials.” Public
Works Management & Policy, 18(3), 279–297.
Georgia Department of Transportation. (2012). “Georgia Department of Transportation Item
Mean Summary for 01/01/2012 to 12/31/2012.”
Georgia Department of Transportation. (2013). Pavement Marking Selection Matrix. Georgia
Department of Transportation.
Hummer, J. E., Rasdorf, W., and Zhang, G. H. (2011). “Linear Mixed-Effects Models for Paint
Pavement-Marking Retroreflectivity Data.” Journal of Transportation Engineering,
137(10), 705–716.
Kansas Department of Transportation. (2002). Pavement Marking Policy. Kansas Department of
Transportation.
Kopf, J. (2004). Reflectivity of Pavement Markings: Analysis of Retroreflectivity Degradation
Curves. Washington State Transportation Center.
Lee, J. T., Maleck, T. L., and Taylor, W. C. (1999). “Pavement marking material evolution study
in Michigan.” Ite Journal-Institute of Transportation Engineers, 69(7), 44–+.
Lee, J.-T., Maleck, T. L., and Taylor, W. C. (1999). “Pavement Marking Material Evaluation
Study in Michigan.” ITE Journal, 67(7), 44–51.
Loetterle, F. E., Beck, R. A., and Carlson, J. (2000). “Public Perception of Pavement-Marking
Brightness.” Transportation Research Record: Journal of the Transportation Research
Board, (1715), 51–59.
Migletz, J., and Graham, J. (2002). NCHRP Synthesis 306: Long-Term Pavement Marking
Practices. National Cooperative Highway Research Program, Transportation Research
Board, Washington D. C.
102
Migletz, J., Graham, J. L., Harwood, D. W., and Bauer, K. M. (2001). “Service Life of Durable
Pavement Markings.” Transportation Research Record: Journal of the Transportation
Research Board, (1749), 13–21.
Minnesota Department of Transportation. (2015). “Transportation Data and Analysis -
Cartographic maps, GIS data, traffic monitoring programs, and TIS database maintenance.”
<http://www.dot.state.mn.us/tda/index.html> (Jul. 16, 2015).
Mull, D. M., and Sitzabee, W. E. (2012). “Paint Pavement Marking Performance Prediction
Model.” Journal of Transportation Engineering, 138(5), 618–624.
National Transportation Product Evaluation Program. (2015a). “NTPEP DataMine 2.0.”
<http://data.ntpep.org/> (Jul. 1, 2015).
National Transportation Product Evaluation Program. (2015b). “Pavement Marking Materials
Data Usage Guide.”
<http://www.ntpep.org/Documents/Technical_Committee/PMM/PMMUserGuide.pdf> (Jul.
24, 2015).
North Dakota Department of Transportation. (2014). Design Manual. North Dakota Department
of Transportation.
Ozelim, L., and Turochy, R. E. (2014). “Modeling Retroreflectivity Performance of
Thermoplastic Pavement Markings in Alabama.” Journal of Transportation Engineering,
American Society of Civil Engineers, 140(6).
Parker, N. A. (2002). Evaluation of the Performance of Reflection in Raised Pavement Markers.
Research and Innovative Technology Administration / USDOT (RITA), New Jersey
Department of Transportation (NJDOT).
Pennsylvania Department of Transportation. (2015). “Internet Traffic Monitoring System.”
103
<http://www.dot7.state.pa.us/itms/default.asp> (Jul. 13, 2015).
Pike, A. M., and Songchitruksa, P. (2015). “Predicting Pavement Marking Service Life Using
Transverse Test Deck Data.” Transportation Research Board 94th Annual Meeting.
Robertson, J., Sarasua, W., Johnson, J., and Davis, W. (2012). “A Methodology for Estimating
and Comparing the Lifecycles of High-Build and Conventional Waterborne Pavement
Markings on Primary and Secondary Roads in South Carolina.” Public Works Management
& Policy, 18(4), 360–378.
Sasidharan, L., Karwa, V., and Donnell, E. T. (2009). “Use of Pavement Marking Degradation
Models to Develop a Pavement Marking Management System.” Public Works Management
& Policy, 14(2), 148–173.
Sitzabee, W. E., Hummer, J. E., and Rasdorf, W. (2009). “Pavement Marking Degradation
Modeling and Analysis.” Journal of Infrastructure Systems, 15(3), 190–199.
Sitzabee, W. E., White, E. D., and Dowling, A. W. (2012). “Degradation Modeling of Polyurea
Pavement Markings.” Public Works Management & Policy, 18(2), 185–199.
Stoudt, M. D., and Vedam, K. (1973). “Retroreflectance of Light by Spherical Glass Beads
Partially Embedded in Horizontal-Pavement-Marking Paint.” Journal of the Optical Society
of America, 63(10), 1286.
Texas Department of Transportation. (2004). Pavement Marking Handbook. Texas Department
of Transportation.
Thamizharasan, A., Sarasua, W. A., Clarke, D. B., and Davis, W. J. (2003). “A Methodology for
Estimating the Lifecycle of Interstate Highway Pavement Marking Retroreflectivity.” the
Transportation Research Board Annual Meeting, Washington D.C.
Zhang, Y., and Wu, D. (2006). “Methodologies to Predict Service Lives of Pavement Marking
104
Materials.” Journal of the Transportation Research Forum, 45(3), 5–18.
Zwahlen, H. T., and Schnell, T. (2000). “Minimum In-Service Retroreflectivity of Pavement
Markings.” Transportation Research Record: Journal of the Transportation Research
Board, (1715), 60–70.
I-1
APPENDIX I GEORGIA DOT PAVEMENT MARKING HANDBOOK
Pavement Marking Handbook
Prepared by:
Georgia Institute of Technology
Prepared for:
Georgia Department of Transportation
December 2015
I-2
TABLE OF CONTENTS
Table of Contents ................................................................................................................... 2
I. Introduction .................................................................................................................... 3
II. Pavement Marking Materials ........................................................................................... 4
2.1 Overview ................................................................................................................. 4
2.2 Pavement Marking Materials..................................................................................... 4
2.2.1 Introduction ....................................................................................................... 4
2.2.2 Summary of Georgia’s Specifications ................................................................. 4
2.2.3 Paint ................................................................................................................. 4
2.2.4 Thermoplastic.................................................................................................... 7
2.2.5 Cold-Applied Preformed Plastic Pavement Markings ......................................... 12
2.2.6 Polyurea .......................................................................................................... 16
2.2.7 Epoxy ............................................................................................................. 18
2.2.8 Methyl Methacrylate (MMA) ........................................................................... 21
2.3 Retroreflective Beads.............................................................................................. 22
2.3.1 Introduction ..................................................................................................... 22
2.3.2 Bead Types ..................................................................................................... 23
2.3.3 Bead Physical Properties .................................................................................. 24
2.3.4 Bead Application Properties ............................................................................. 25
2.3.5 Factors that Influence Bead Application Properties ............................................ 25
III. Pavement Marking Installation Inspection ................................................................... 27
3.1 Overview ............................................................................................................... 27
3.2 Pre-Installation Preparation and Inspection .............................................................. 27
3.2.1 Surface Preparation .......................................................................................... 27
3.2.2 Inspection ....................................................................................................... 29
3.2.3 Striping Equipment Inspection ......................................................................... 30
3.3 Inspection During and After Installation .................................................................. 30
3.3.1 Thickness ........................................................................................................ 31
3.3.2 Color .............................................................................................................. 32
3.3.3 Alignment ....................................................................................................... 32
3.3.4 Width and Length ............................................................................................ 33
3.3.5 Glass Bead Application Properties .................................................................... 34
3.3.6 Retroreflectivity .............................................................................................. 35
IV. Pavement Marking Material Selection ......................................................................... 36
I-3
I. INTRODUCTION
Pavement markings, including striping, texts, and symbols, on both state-maintained and local
roads provide important guidance and information for road users. Several specifications and
other sources of pavement marking installation and inspection information have been developed
by Federal transportation agencies, such as the Federal Highway Administration (FHWA), the
American Association of State Highway and Transportation Officials (AASHTO), and the
American Society for Testing and Materials (ASTM), and state DOTs, such as the Georgia
Department of Transportation (GDOT) and the Texas DOT. In addition, various studies have
been performed to evaluate the performance of different pavement marking materials and their
cost-effectiveness. This handbook is intended to gather and synthesize comprehensive
information about pavement marking materials, including material properties, installation,
inspection, costs, and expected performance, with a special focus on the applications in Georgia.
This document includes results from the GDOT Research Project No. 12-31, Developing a
GDOT Pavement Marking Handbook using Field Test Deck Evaluation and Long-term
Performance Analysis, including the comprehensive literature review, the analysis of GDOT and
National Transportation Product Evaluation Program (NTPEP) test decks, and the life-cycle cost
analysis of selected pavement marking materials (PMMs); it also presents a PMM selection
matrix that synthesizes the aforementioned components into recommended usage of PMMs
under different traffic conditions and pavement surface types.
This handbook is organized as follows: Chapter 2 introduces commonly used pavement marking
materials, their characteristics, and application procedures. Chapter 3 summarizes the general
process and preparation of pavement marking installation and inspection. Chapter 4 presents the
proposed PMM selection matrix for GDOT.

I-4
II. PAVEMENT MARKING MATERIALS
2.1 Overview
In this chapter, a variety of commonly used pavement marking materials is reviewed. The use of
these materials in Georgia, their characteristics, and application procedures are summarized. In
addition to the materials (binders), retroreflective bead properties and performance are discussed.
2.2 Pavement Marking Materials
2.2.1 Introduction
Many pavement marking materials have been used by different state DOTs. However, the
performance, costs, and service lives vary significantly from product to product. How to cost-
effectively select pavement marking materials in different regions of the state remains
challenging. In this section, the characteristics and application procedures of a variety of
commonly used pavement marking materials are summarized.
2.2.2 Summary of Georgia’s Specifications
The most common pavement marking materials in Georgia and their specifications1 are as
follows:
Standard Specification Section 652 – Painting Traffic Stripe
Standard Specification Section 653 – Thermoplastic Traffic Stripe
Standard Specification Section 657 – Preformed Plastic Pavement Markings
Standard Specification Section 658 – Polyurea Traffic Stripe
Standard Specification Section 659 – Hot Applied Preformed Plastic Pavement Markings
Special Provision Section 661– Standard and Wet Weather Epoxy Traffic Stripe
Standard Specification Section 870 – Paint
Qualified Product Lists of pavement marking materials are as follows:
QPL 46 – Traffic Markings
QPL 71 – Glass Bead Manufacturers
QPL 74 – Preformed Plastic Markings
QPL 76 – Raised Pavement Markers and Channel Markers
2.2.3 Paint
Introduction
Paint was the first ever pavement marking material and has been used widely on all roads in the
United States. It is, also, primarily, the least expensive pavement marking material available.
Because paint is typically less durable than other pavement marking materials, it is mostly used
on roads with low traffic volumes (e.g., total AADT < 8,000 veh/day). In Georgia, paint is used
only on asphalt pavements. GDOT’s specifications for the paint material can be referred to
Standard Specification Section 652 – Painting Traffic Stripe, and Section 870 – Paint.
1 Revised on August 24, 2012 and first use on October 19, 2012.
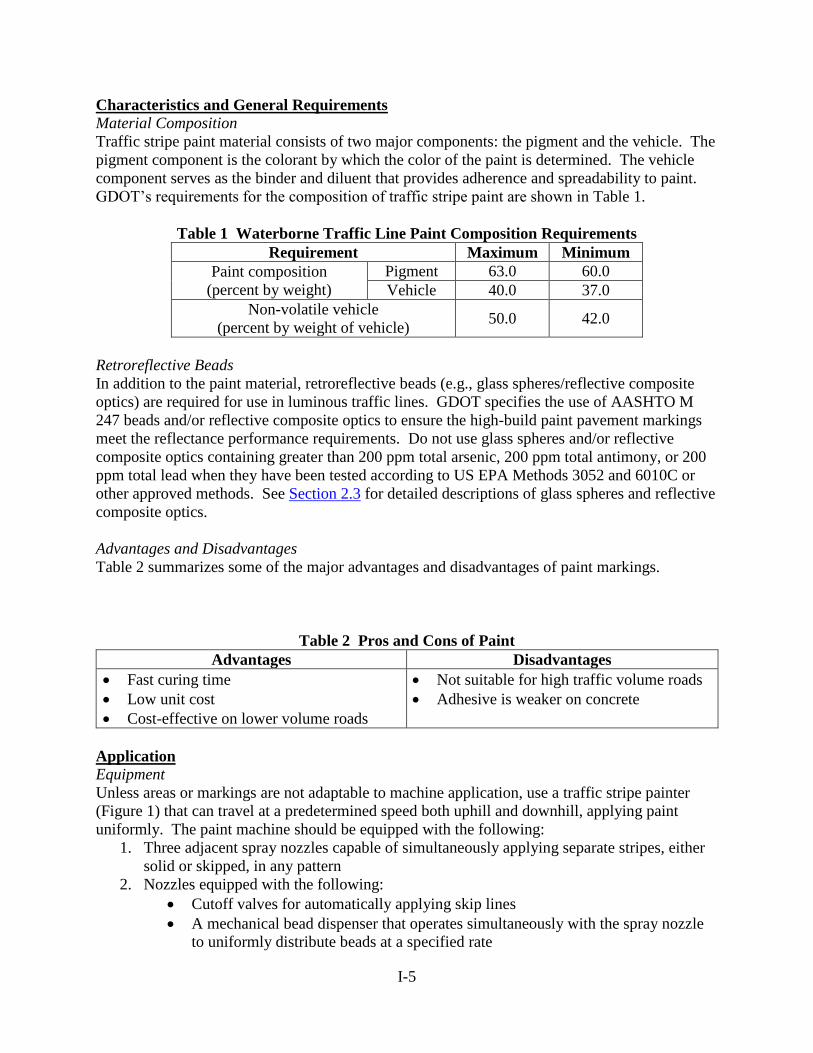
I-5
Characteristics and General Requirements
Material Composition
Traffic stripe paint material consists of two major components: the pigment and the vehicle. The
pigment component is the colorant by which the color of the paint is determined. The vehicle
component serves as the binder and diluent that provides adherence and spreadability to paint.
GDOT’s requirements for the composition of traffic stripe paint are shown in Table 1.
Table 1 Waterborne Traffic Line Paint Composition Requirements
Requirement Maximum Minimum
Paint composition
(percent by weight)
Pigment 63.0 60.0
Vehicle 40.0 37.0
Non-volatile vehicle
(percent by weight of vehicle) 50.0 42.0
Retroreflective Beads
In addition to the paint material, retroreflective beads (e.g., glass spheres/reflective composite
optics) are required for use in luminous traffic lines. GDOT specifies the use of AASHTO M
247 beads and/or reflective composite optics to ensure the high-build paint pavement markings
meet the reflectance performance requirements. Do not use glass spheres and/or reflective
composite optics containing greater than 200 ppm total arsenic, 200 ppm total antimony, or 200
ppm total lead when they have been tested according to US EPA Methods 3052 and 6010C or
other approved methods. See Section 2.3 for detailed descriptions of glass spheres and reflective
composite optics.
Advantages and Disadvantages
Table 2 summarizes some of the major advantages and disadvantages of paint markings.
Table 2 Pros and Cons of Paint
Advantages Disadvantages
Fast curing time
Low unit cost
Cost-effective on lower volume roads
Not suitable for high traffic volume roads
Adhesive is weaker on concrete
Application
Equipment
Unless areas or markings are not adaptable to machine application, use a traffic stripe painter
(Figure 1) that can travel at a predetermined speed both uphill and downhill, applying paint
uniformly. The paint machine should be equipped with the following:
1. Three adjacent spray nozzles capable of simultaneously applying separate stripes, either
solid or skipped, in any pattern
2. Nozzles equipped with the following:
Cutoff valves for automatically applying skip lines
A mechanical bead dispenser that operates simultaneously with the spray nozzle
to uniformly distribute beads at a specified rate
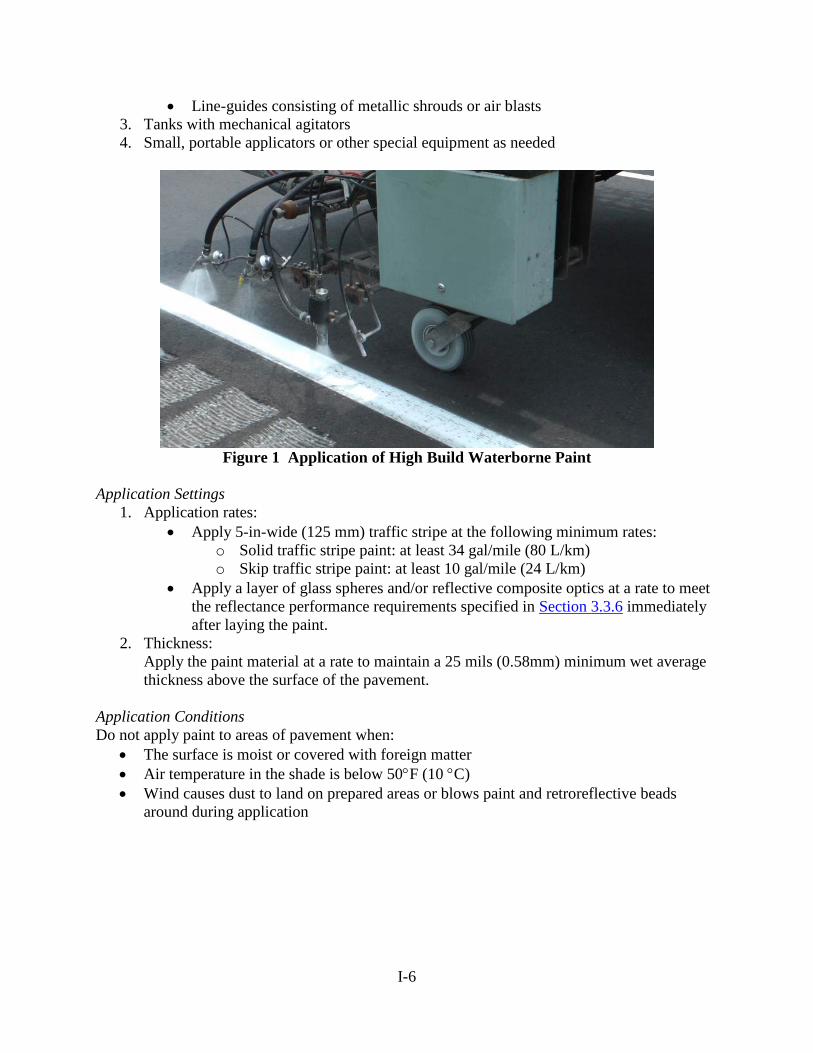
I-6
Line-guides consisting of metallic shrouds or air blasts
3. Tanks with mechanical agitators
4. Small, portable applicators or other special equipment as needed
Figure 1 Application of High Build Waterborne Paint
Application Settings
1. Application rates:
Apply 5-in-wide (125 mm) traffic stripe at the following minimum rates:
o Solid traffic stripe paint: at least 34 gal/mile (80 L/km)
o Skip traffic stripe paint: at least 10 gal/mile (24 L/km)
Apply a layer of glass spheres and/or reflective composite optics at a rate to meet
the reflectance performance requirements specified in Section 3.3.6 immediately
after laying the paint.
2. Thickness:
Apply the paint material at a rate to maintain a 25 mils (0.58mm) minimum wet average
thickness above the surface of the pavement.
Application Conditions
Do not apply paint to areas of pavement when:
The surface is moist or covered with foreign matter
Air temperature in the shade is below 50F (10 C)
Wind causes dust to land on prepared areas or blows paint and retroreflective beads
around during application
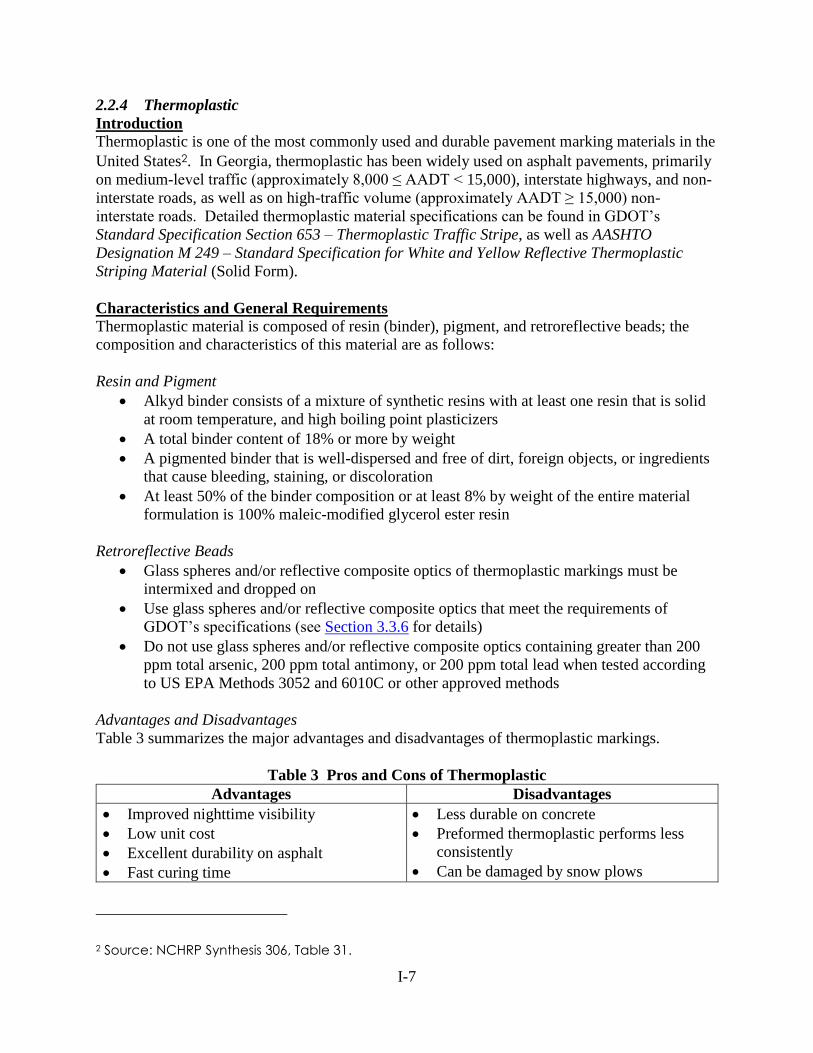
I-7
2.2.4 Thermoplastic
Introduction
Thermoplastic is one of the most commonly used and durable pavement marking materials in the
United States2. In Georgia, thermoplastic has been widely used on asphalt pavements, primarily
on medium-level traffic (approximately 8,000 ≤ AADT < 15,000), interstate highways, and non-
interstate roads, as well as on high-traffic volume (approximately AADT ≥ 15,000) non-
interstate roads. Detailed thermoplastic material specifications can be found in GDOT’s
Standard Specification Section 653 – Thermoplastic Traffic Stripe, as well as AASHTO
Designation M 249 – Standard Specification for White and Yellow Reflective Thermoplastic
Striping Material (Solid Form).
Characteristics and General Requirements
Thermoplastic material is composed of resin (binder), pigment, and retroreflective beads; the
composition and characteristics of this material are as follows:
Resin and Pigment
Alkyd binder consists of a mixture of synthetic resins with at least one resin that is solid
at room temperature, and high boiling point plasticizers
A total binder content of 18% or more by weight
A pigmented binder that is well-dispersed and free of dirt, foreign objects, or ingredients
that cause bleeding, staining, or discoloration
At least 50% of the binder composition or at least 8% by weight of the entire material
formulation is 100% maleic-modified glycerol ester resin
Retroreflective Beads
Glass spheres and/or reflective composite optics of thermoplastic markings must be
intermixed and dropped on
Use glass spheres and/or reflective composite optics that meet the requirements of
GDOT’s specifications (see Section 3.3.6 for details)
Do not use glass spheres and/or reflective composite optics containing greater than 200
ppm total arsenic, 200 ppm total antimony, or 200 ppm total lead when tested according
to US EPA Methods 3052 and 6010C or other approved methods
Advantages and Disadvantages
Table 3 summarizes the major advantages and disadvantages of thermoplastic markings.
Table 3 Pros and Cons of Thermoplastic
Advantages Disadvantages
Improved nighttime visibility
Low unit cost
Excellent durability on asphalt
Fast curing time
Less durable on concrete
Preformed thermoplastic performs less
consistently
Can be damaged by snow plows
2 Source: NCHRP Synthesis 306, Table 31.
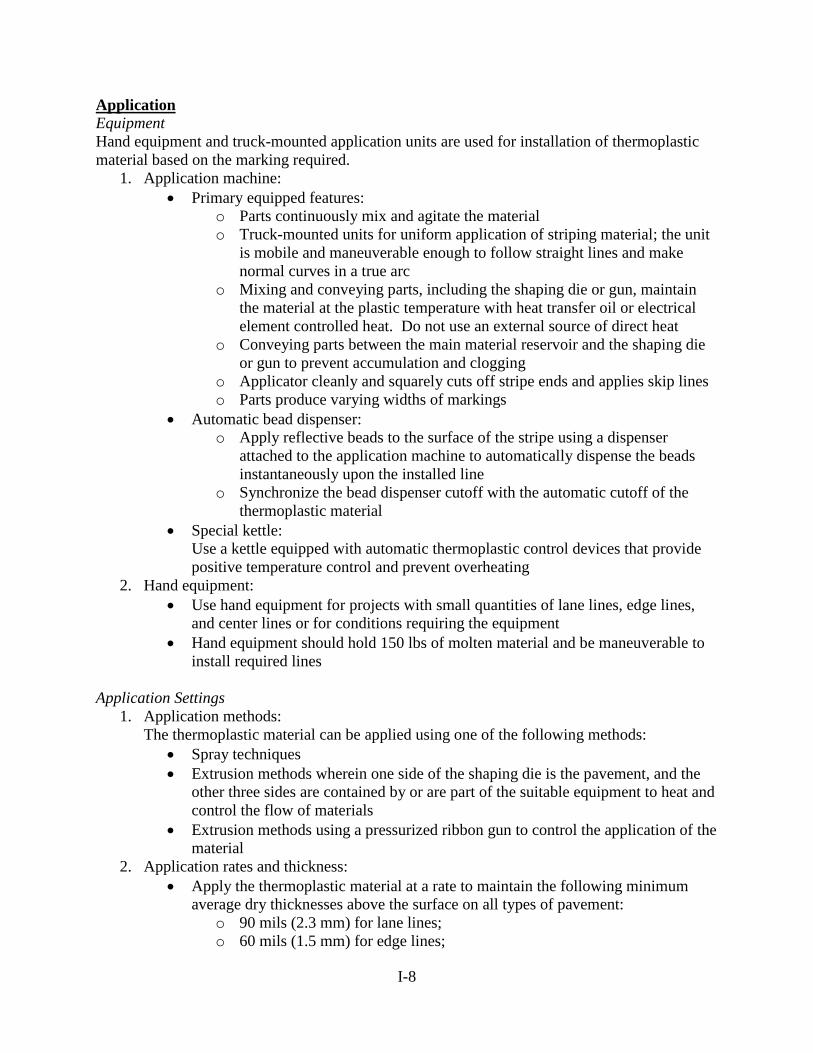
I-8
Application
Equipment
Hand equipment and truck-mounted application units are used for installation of thermoplastic
material based on the marking required.
1. Application machine:
Primary equipped features:
o Parts continuously mix and agitate the material
o Truck-mounted units for uniform application of striping material; the unit
is mobile and maneuverable enough to follow straight lines and make
normal curves in a true arc
o Mixing and conveying parts, including the shaping die or gun, maintain
the material at the plastic temperature with heat transfer oil or electrical
element controlled heat. Do not use an external source of direct heat
o Conveying parts between the main material reservoir and the shaping die
or gun to prevent accumulation and clogging
o Applicator cleanly and squarely cuts off stripe ends and applies skip lines
o Parts produce varying widths of markings
Automatic bead dispenser:
o Apply reflective beads to the surface of the stripe using a dispenser
attached to the application machine to automatically dispense the beads
instantaneously upon the installed line
o Synchronize the bead dispenser cutoff with the automatic cutoff of the
thermoplastic material
Special kettle:
Use a kettle equipped with automatic thermoplastic control devices that provide
positive temperature control and prevent overheating
2. Hand equipment:
Use hand equipment for projects with small quantities of lane lines, edge lines,
and center lines or for conditions requiring the equipment
Hand equipment should hold 150 lbs of molten material and be maneuverable to
install required lines
Application Settings
1. Application methods:
The thermoplastic material can be applied using one of the following methods:
Spray techniques
Extrusion methods wherein one side of the shaping die is the pavement, and the
other three sides are contained by or are part of the suitable equipment to heat and
control the flow of materials
Extrusion methods using a pressurized ribbon gun to control the application of the
material
2. Application rates and thickness:
Apply the thermoplastic material at a rate to maintain the following minimum
average dry thicknesses above the surface on all types of pavement:
o 90 mils (2.3 mm) for lane lines;
o 60 mils (1.5 mm) for edge lines;
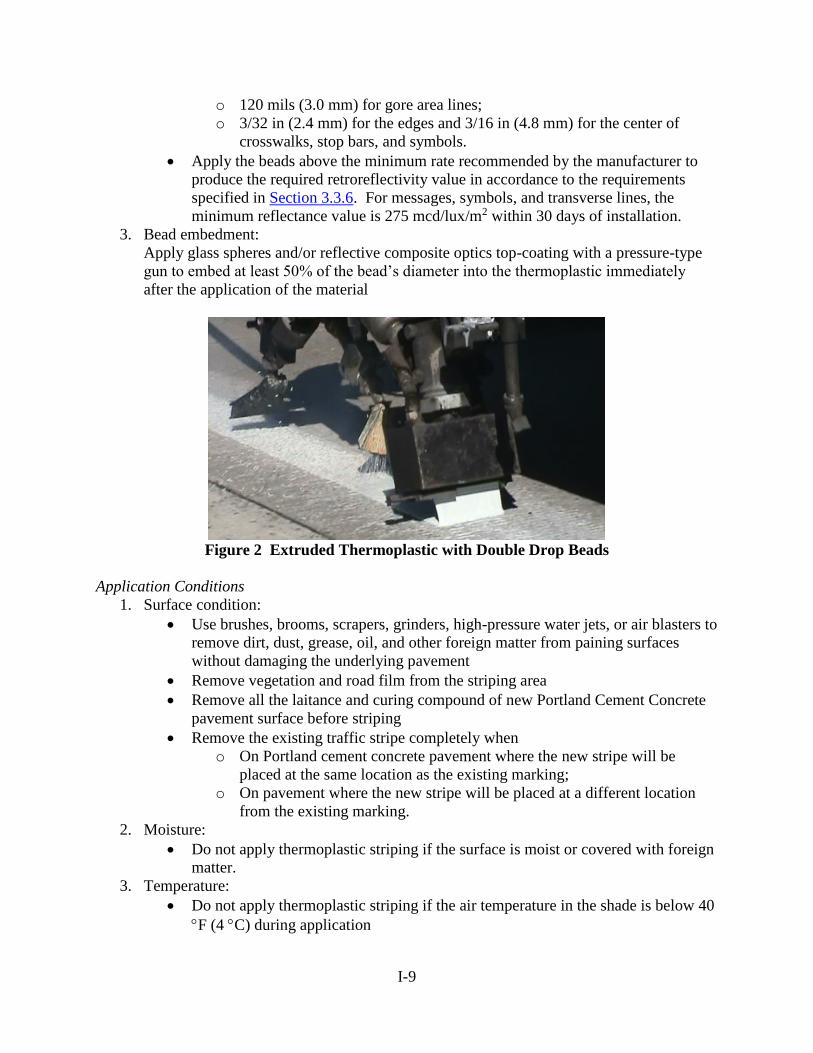
I-9
o 120 mils (3.0 mm) for gore area lines;
o 3/32 in (2.4 mm) for the edges and 3/16 in (4.8 mm) for the center of
crosswalks, stop bars, and symbols.
Apply the beads above the minimum rate recommended by the manufacturer to
produce the required retroreflectivity value in accordance to the requirements
specified in Section 3.3.6. For messages, symbols, and transverse lines, the
minimum reflectance value is 275 mcd/lux/m2 within 30 days of installation.
3. Bead embedment:
Apply glass spheres and/or reflective composite optics top-coating with a pressure-type
gun to embed at least 50% of the bead’s diameter into the thermoplastic immediately
after the application of the material
Figure 2 Extruded Thermoplastic with Double Drop Beads
Application Conditions
1. Surface condition:
Use brushes, brooms, scrapers, grinders, high-pressure water jets, or air blasters to
remove dirt, dust, grease, oil, and other foreign matter from paining surfaces
without damaging the underlying pavement
Remove vegetation and road film from the striping area
Remove all the laitance and curing compound of new Portland Cement Concrete
pavement surface before striping
Remove the existing traffic stripe completely when
o On Portland cement concrete pavement where the new stripe will be
placed at the same location as the existing marking;
o On pavement where the new stripe will be placed at a different location
from the existing marking.
2. Moisture:
Do not apply thermoplastic striping if the surface is moist or covered with foreign
matter.
3. Temperature:
Do not apply thermoplastic striping if the air temperature in the shade is below 40
F (4 C) during application

I-10
Install thermoplastic material in a melted state at the manufacturer’s
recommended temperature but not at less than 375 F (190 C)
4. Bonding to existing surface/old stripe
Apply a binder-sealer material when installing the thermoplastic in each of the
following cases:
o Where directed by the Engineer for sprayed thermoplastic;
o Old asphalt concrete pavements with exposed aggregates;
o Portland cement concrete pavements.
If the old stripe is to be renewed by overlaying the new material, ensure the new
material bonds to the old line without splitting or cracking
Other Forms of Thermoplastic Markings
Hot-Applied Preformed Plastic Pavement Markings
Hot-applied preformed plastic markings are cut into the shapes needed, positioned onto
pavement surface, and affixed to asphalt or Portland cement concrete pavements by the use of
heating equipment, such as a torch. Hot-applied preformed plastic pavement markings have
been commonly used for small scale applications, such as legends, arrows, stop lines,
crosswalks, and symbols.
Detailed characteristics and requirements for preformed plastic pavement markings can be
referred to GDOT’s Standard Specification Section 659 – Hot Applied Preformed Plastic
Pavement Markings. Refer to GDOT’s Qualified Products List QPL-74 for qualified products.
Hot-applied preformed plastic material consists of resin (hydrocarbon, alkyd, or modified ester
rosin), pigments, binders, and beads. The material should conform to AASHTO M 249 standard
specifications except for relevant differences due to the material being supplied in a preformed
state. Other major characteristics are summarized as follows:
1. Beads: the markings should contain at least 30% AASHTO M 247 Type 1 glass spheres
and at least 80% of the beads should be true spheres.
2. Thickness: the thickness of hot-applied preformed plastic markings should be at least
125 mils (3.175 mm).
3. Resealability: the hot-applied preformed markings should have resealing characteristics
so that it will fuse with itself and with previously applied marking material of the same
composition under normal conditions of use.
Key notes for applying hot-applied preformed pavement markings are as follows:
1. Apply markings only when the temperature is 35 F (2 C) or above.
2. Apply markings when the pavement is clean, dry, and free of debris.
3. Apply drop-on glass spheres to the entire surface of the preformed markings that do not
have factory pre-applied surface beads.
4. Apply drop-on glass spheres to the material while still in a liquid state.
Types of preformed thermoplastic markings include word, symbol, arrow, stop bar, crosswalk,
and lane line. For example, preformed thermoplastics have been used for words, symbols, and
arrows of different traffic and bicycle lanes (see Figure 4).
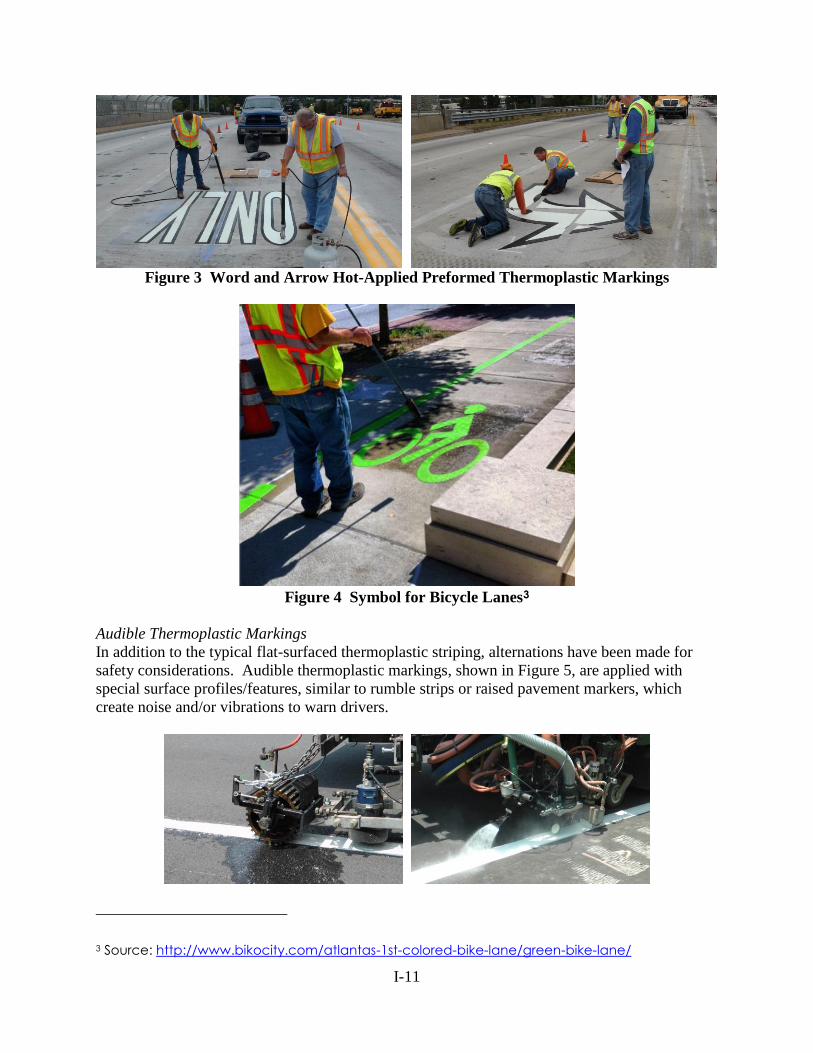
I-11
Figure 3 Word and Arrow Hot-Applied Preformed Thermoplastic Markings
Figure 4 Symbol for Bicycle Lanes3
Audible Thermoplastic Markings
In addition to the typical flat-surfaced thermoplastic striping, alternations have been made for
safety considerations. Audible thermoplastic markings, shown in Figure 5, are applied with
special surface profiles/features, similar to rumble strips or raised pavement markers, which
create noise and/or vibrations to warn drivers.
3 Source: http://www.bikocity.com/atlantas-1st-colored-bike-lane/green-bike-lane/
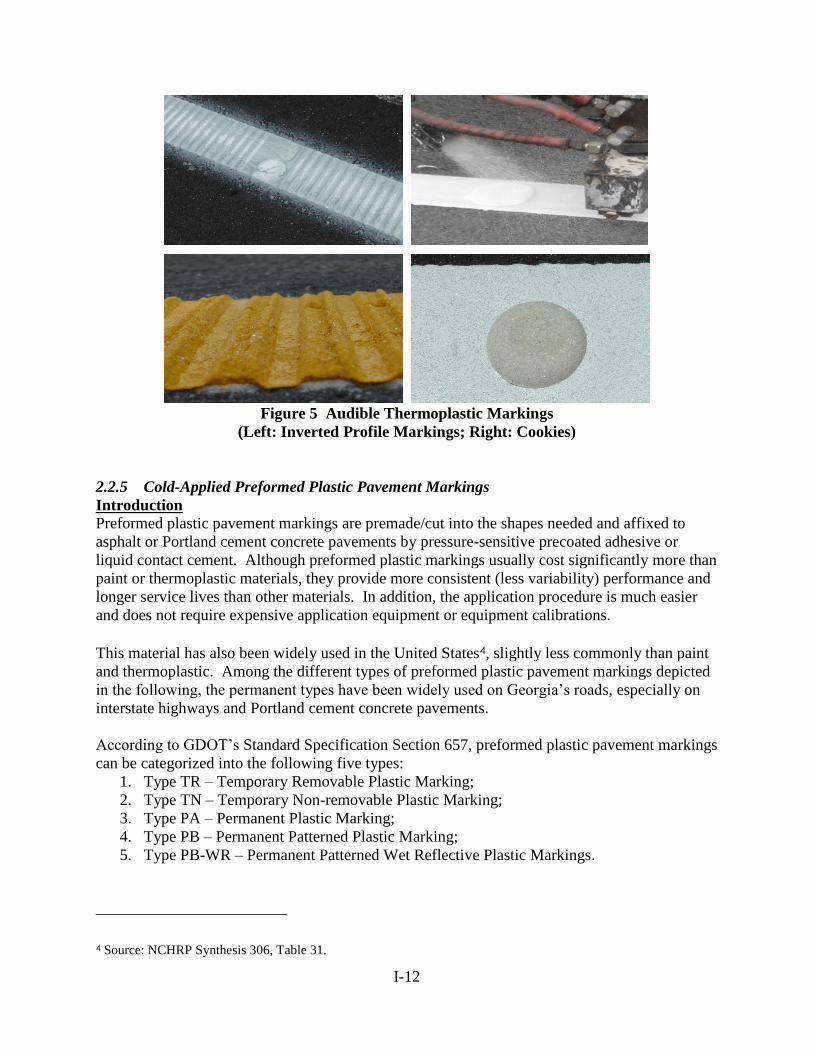
I-12
Figure 5 Audible Thermoplastic Markings
(Left: Inverted Profile Markings; Right: Cookies)
2.2.5 Cold-Applied Preformed Plastic Pavement Markings
Introduction
Preformed plastic pavement markings are premade/cut into the shapes needed and affixed to
asphalt or Portland cement concrete pavements by pressure-sensitive precoated adhesive or
liquid contact cement. Although preformed plastic markings usually cost significantly more than
paint or thermoplastic materials, they provide more consistent (less variability) performance and
longer service lives than other materials. In addition, the application procedure is much easier
and does not require expensive application equipment or equipment calibrations.
This material has also been widely used in the United States4, slightly less commonly than paint
and thermoplastic. Among the different types of preformed plastic pavement markings depicted
in the following, the permanent types have been widely used on Georgia’s roads, especially on
interstate highways and Portland cement concrete pavements.
According to GDOT’s Standard Specification Section 657, preformed plastic pavement markings
can be categorized into the following five types:
1. Type TR – Temporary Removable Plastic Marking;
2. Type TN – Temporary Non-removable Plastic Marking;
3. Type PA – Permanent Plastic Marking;
4. Type PB – Permanent Patterned Plastic Marking;
5. Type PB-WR – Permanent Patterned Wet Reflective Plastic Markings.
4 Source: NCHRP Synthesis 306, Table 31.

I-13
Detailed characteristics and requirements for preformed plastic pavement markings can be
referred to GDOT’s Standard Specification Section 657 – Preformed Plastic Pavement
Markings. Refer to GDOT’s Qualified Products List QPL-74 for qualified products.
Characteristics and General Requirements
Preformed plastic pavement markings are made of resins and plasticizers (20% minimum by
weight), pigments (30% minimum by weight), and glass spheres (33% minimum by weight).
The composition may vary from product to product; however, they should conform the
requirements (including conformability, elongation and tensile strength, skid resistance, abrasion
resistance, and glass bead retention) specified in GDOT’s Standard Specification Section 657.
Similarly, pigments should also comply with the State and Federal requirements. Other
characteristics are summarized below:
Adhesion
Use markings that can be affixed to bituminous or Portland cement concrete pavements by
pressure-sensitive precoated adhesive or a liquid contact cement. Preformed plastic markings are
typically supplied with the following:
A precoated adhesive;
An easily removable backing to protect the adhesive;
An adhesive backing that allows repositioning of marking on the surface before
permanently sticking with greater pressure;
A precoated adhesive but without protective backing material for rolls (see Figure 6) of
preformed plastic lane lines.
Retroreflective Beads
Use markings with a layer of glass spheres and/or reflective composite optics bonded to the
surface according to the marking type.
Type PB and PB-WR contain glass spheres and/or reflective composite optics.
Types TR, TN, and PA contain only glass spheres.
Do not use glass spheres and /or reflective composite optics containing greater than 200
ppm total arsenic, 200 ppm total antimony, or 200 ppm total lead when tested according
to US EPA Methods 3052 and 6010C or other approved methods.
Use glass spheres and/or reflective composite optics that meet the requirements of
GDOT’s specifications (see Section 3.3.6 for details).
Elongation and Tensile Strength
Type TR:
Provide temporal preformed plastic markings with 50% maximum elongation and 40
lbs/in2 (275 kPa) minimum tensile strength.
Types PA, PB, and PB-WR:
Provide permanent preformed plastic markings with 50% maximum elongation and 150
lbs/in2 (1035 kPa) minimum tensile strength.
Thickness
Types TR and TN:

I-14
Ensure that the removable marking material is at least 20 mils (0.50 mm) thick, not
including the backing adhesive.
Type PA:
Ensure the permanent material is at least 60 mils (1.52 mm) thick, without the pre-coated
adhesive.
Types PB and PB-WR:
Ensure the permanent material is at least 60 mils (1.52 mm) thick at the thickest portion
of the patterned cross-section, and at least 20 mils (0.508 mm) at the thinnest portion of
the cross-section.
Conformability
Use markings that will mold to pavement contours, breaks, faults, and the like, by normal action
of traffic at normal pavement temperatures.
Removability (Type TR)
Ensure the marking material can be removed from asphalt and Portland cement concrete
pavements as follows:
Lifted intact or in large pieces;
Lifted either manually or with a roll-up device;
Lifted at temperatures above 40 °F (5 °C) without using heat, solvents, sand blasting, or
grinding;
Pavement shows no objectionable staining or damage after removing the marking.
Advantages and Disadvantages
Table 4 summarizes the major advantages and disadvantages of preformed plastic pavement
markings.
Table 4 Pros and Cons of Preformed Tape
Advantages Disadvantages
Easily applied
No curing time required
Excellent durability performance on high and
low volume roads
No need for drop-on retroreflective beads
High life-cycle cost
Requires special equipment to
remove from concrete – higher
restriping cost
Cannot be fully removed from asphalt
if not temporary tapes
Application
Equipment
Truck-mounted automatic machine and mobile hand equipment are used to install preformed
plastic markings (see Figure 6 and Figure 7). Use equipment according to the manufacturer’s
recommendations and ensure the installed markings meet GDOT’s requirements.

I-15
Figure 6 Preformed Plastic Pavement Marking Application Machine
Figure 7 Preformed Plastic Pavement Marking Hand Equipment
Application Conditions
1. Surface condition:
Clean with compressed air, hand brooms, rotary brooms, scrapers, or other
approved methods that leave the pavement thoroughly clean and undamaged.
Remove all vegetation and road film from the area to be striped.
Mechanically wire brush or abrasive blast clean all new Portland cement concrete
pavement surfaces to remove all laitance and curing compound from the area to
be striped.
Remove at least 90% of existing traffic stripe under either of the following
conditions:
o On Portland cement concrete pavement where the new stripe is to be
placed at the same location as the existing marking;
o On all pavements where the new stripe is to be placed at a location
different from the existing marking.
2. Temperature:
Ambient temperature:
o Types PB and PB-WR: 40 °F (4 °C) and rising;
o Types TR, TN, and PA: 60 °F (15 °C) and rising.
Pavement temperature:
I-16
o Types PB and PB-WR: 40 °F (4 °C) and rising;
o Types TR, TN, and PA: 70 °F (21 °C) and rising;
o At least 120 °F (49 °C) if applying any type on new asphalt pavement.
Previous night temperature:
Did not fall below 40 °F (4 °C).
3. Moisture:
No significant rainfall occurred 24 hours prior to the plastic’s application. 4. Drying Time:
There is typically no drying time for preformed plastic pavement markings because they
are usually cold-applied and can be opened to traffic immediately after the application.
2.2.6 Polyurea
Introduction
Polyurea is a two-component, 100% solid material, which is “a type of elastomer that is derived
from the reaction product of an isocyanate component and a synthetic resin blend component
through step-growth polymerization5.” The development of this type of material took place in
the 1990’s and has been a relatively new material for pavement markings. It has not been as
widely used in the United States as other traditional materials6. In Georgia, polyurea markings
are used on both asphalt and Portland cement concrete (PCC) pavements and can be applied to
roads with the majority of traffic conditions (high, mid, and low AADTs). Detailed
characteristics and requirements can be referred to GDOT’s Standard Specification Section 658 –
Polyurea Traffic Stripe.
Characteristics and General Requirements
Polyurea material consists of a mixture of high-quality resins and curing agent, pigments, and a
reflective layer bonded to the top surface consisting of glass spheres and/or reflective composite
optics. The polyurea material consists of two primary components, Part A and Part B. Part A is
the isocyanate component and Part B is the amine-terminated polymer resin. Polyurea material
is marketed as durable pavement markings with slightly more expensive costs than traditional
paint and thermoplastic materials. Its service life has been reported to be up to 5 years. In
addition, some polyurea products can be applied with ceramic elements in the markings to
enhance pavement marking retroreflectivity, especially under wet conditions7. Some general
requirements are as follows:
Composition
Ensure that the retroreflective pavement markings consist of a mixture of high-quality
resins, curing agents and pigments, with a reflective layer bonded to the top surface
consisting of glass spheres and/or reflective composite optics.
5 Source: Polyurea, Wikipedia, http://en.wikipedia.org/wiki/Polyurea 6 Source: NCHRP Synthesis 306, Table 31. 7 Gates, Hawkins, and Rose (2003), Effective Pavement Marking Materials and Applications for Portland Cement
Concrete Roadways, Texas Transportation Institute

I-17
Ensure the liquid markings consist of a two-component (Part A and Part B), 100% solid
polyurea film formulated and designed to provide a simple volumetric mixing ratio as
recommended by the manufacturer.
Ensure that these films are manufactured without the use of lead chromate pigments or
other similar lead-containing chemicals.
Ensure that the white polyurea contains not less than 13% by weight rutile titanium
dioxide pigment to ensure adequate opacity, hiding power, and reflective properties.
Retroreflective Beads
Use glass spheres and/or reflective composite optics that meet the requirements of
GDOT’s specifications (see Section 3.3.6 for details).
Do not use glass spheres and/or reflective composite optics containing greater than 200
ppm total arsenic, 200 ppm total antimony, or 200 ppm total lead when tested according
to US EPA Methods 3052 and 6010C or other approved methods.
Advantages and Disadvantages
Table 5 summarizes the major advantages and disadvantages of polyurea markings.
Table 5 Pros and Cons of Polyurea
Advantages Disadvantages
Can be applied on all pavement surface types
Great initial retroreflectivity
Fast curing time
Effective on high volume roads
Can be applied at lower temperatures
Color deterioration
Application
Equipment
Use a mobile, truck-mounted and self-contained pavement marking machine, specifically
designed to apply two-component liquid materials and glass spheres in a continuous and skip-
line pattern. Select the necessary accessories, such as spray tip, mix chamber or static tube, and
rod diameter, to ensure proper mixing. Ensure the machine meets the following requirements:
Capable of applying three separate stripes, either solid or skip, in any pattern by utilizing
three adjacent spray nozzles at the same time;
Each nozzle is equipped with satisfactory cutoff valves that will apply skip lines
automatically;
The application equipment is maneuverable to the extent that straight lines can be
followed and normal curves can be made in a true arc;
The truck-mounted unit is provided with accessories to allow for the marking of symbols
and legends.
Application Settings and Conditions
1. Surface condition:
I-18
Use brushes, brooms, scrapers, grinders, high-pressure water jets, or air blasters to
remove dirt, dust, grease, oil, and other foreign matter from the painting surfaces without
damaging the underlying pavement. 2. Temperature:
Both the surface and the ambient temperature should be above 40 F (4 C) at the time of
installation.
3. Moisture:
Only apply polyurea markings during dry weather and subsequently dry pavement
surfaces.
Ensure relative humidity is not greater than 85% at the time of installation.
4. Thickness:
The minimum average uniform dry thicknesses on
Open graded asphalt concrete friction courses: 25 mils ± 2 mils (0.635 mm ±
0.051 mm);
All other pavements: 20 mils ± 2 mils (0.508 mm ± 0.051 mm).
5. Drying time:
The typical drying time is 3 to 8 minutes; ensure that the polyurea markings reach a no-
track condition in less than 10 minutes.
2.2.7 Epoxy
Introduction
Epoxy is also a two-component pavement marking material that has been widely used
nationwide on roadways under the majority of traffic conditions. It was originally developed by
the Minnesota Department of Transportation and H. B. Fuller and Company in the early 1970’s8.
Detailed characteristics and requirements can be referred to in GDOT’s Special Provision
Section 661 – Standard and Wet Weather Epoxy Traffic Stripe.
Characteristics and General Requirements
Composition
The two components are the resins and the curing agent. The curing agent is the catalyst that
accelerates the curing process. Other materials in the composition include filler, pigment, and
retroreflective beads. The use of pigments and beads should conform to Federal requirements to
obtain stripes that meet the expectancy of road users. Other requirements are as follows:
Ensure that the retroreflective pavement markings consist of a mixture of high-quality
resins, curing agent and pigments, with a reflective layer bonded to the top surface
consisting of glass spheres and/or reflective composite optics.
Ensure the liquid markings consist of a two-component (Part A and Part B), 100% solids
epoxy film formulated and designed to provide a simple volumetric mixing ratio as
recommended by the manufacturer.
8 Gates, Hawkins, and Rose (2003), Effective Pavement Marking Materials and Applications for Portland Cement
Concrete Roadways, Texas Transportation Institute

I-19
Ensure that these films are manufactured without the use of lead chromate pigments or
other similar, lead-containing chemicals.
Ensure that the white epoxy contains not less than 13% by weight rutile titanium dioxide
pigment to insure adequate opacity, hiding power, and reflective properties.
Retroreflective Beads
Use glass spheres and/or reflective composite optics that meet the requirements of
GDOT’s specifications (see Section 3.3.6 for details).
Do not use glass spheres and/or reflective composite optics containing greater than 200
ppm total arsenic, 200 ppm total antimony, or 200 ppm total lead when tested according
to US EPA Methods 3052 and 6010C or other approved methods.
Advantages and Disadvantages
Although quicker (e.g., 2-minute) drying epoxies are available, the typical curing/drying time of
epoxy has been reported to be between 30 to 40 minutes, which is significantly higher than other
materials described in this manual. Another commonly reported disadvantage of epoxy is the
color instability under intense ultraviolet exposure. Epoxy’s advantages, on the other hand,
include its lower insensitivity to application factors than other materials and its durable service
life that has shown to exceed 5 years on low to mid traffic volumes9. Table 6 summarizes the
advantages and disadvantages of epoxy markings.
Table 6 Pros and Cons of Epoxy
Advantages Disadvantages
Can be applied on all surface types
High durability on low volume roads
Able to be applied at low temperatures
Slower curing time
Color deterioration
Application
Equipment
1. Traveling Traffic Striping Machine:
Use a mobile, truck-mounted and self-contained pavement marking machine specifically
designed to apply two-component liquid materials and glass spheres in a continuous and
skip-line pattern. Select the necessary accessories, such as spray tip, mix chamber, or
static tube, and rod diameter to ensure proper mixing. Ensure the machine meets the
following requirements:
Capable of applying three separate stripes, either solid or skip, in any specified
pattern by utilizing three adjacent spray nozzles at the same time;
Each nozzle is equipped with satisfactory cutoff valves that will apply skip lines
automatically;
The application equipment is maneuverable to the extent that straight lines can be
followed and normal curves can be made in a true arc.
9 Gates, Hawkins, and Rose (2003), Effective Pavement Marking Materials and Applications for Portland Cement
Concrete Roadways, Texas Transportation Institute
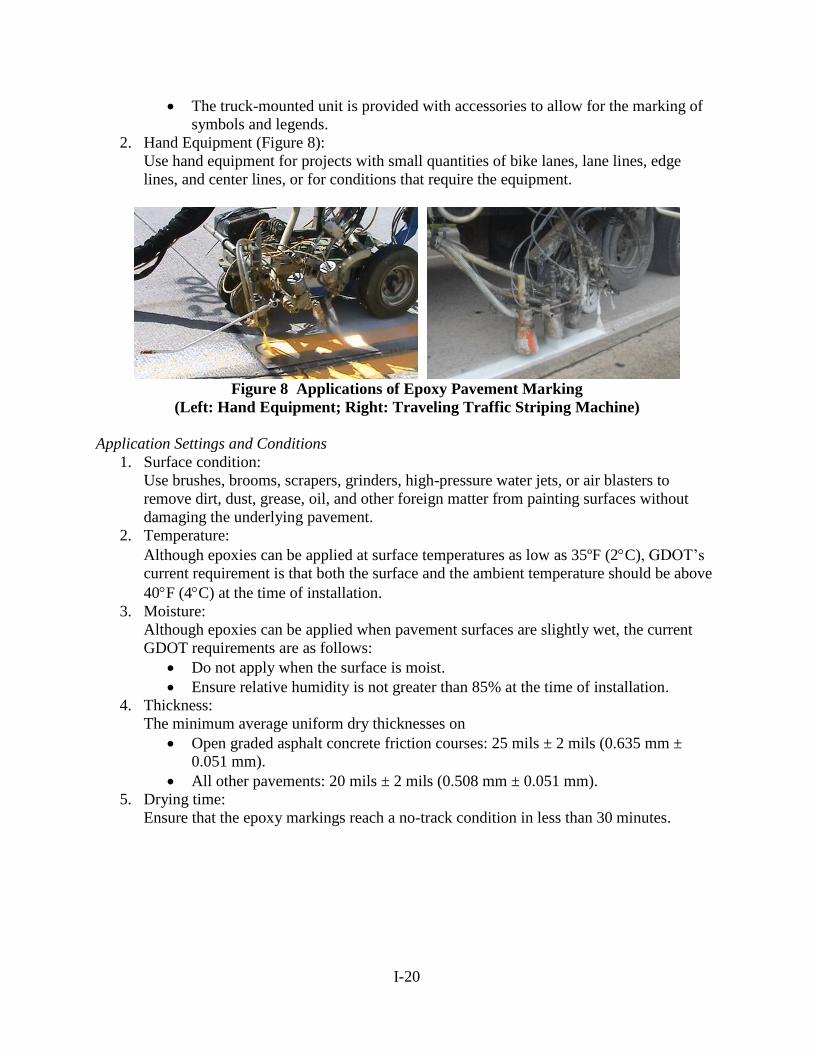
I-20
The truck-mounted unit is provided with accessories to allow for the marking of
symbols and legends.
2. Hand Equipment (Figure 8):
Use hand equipment for projects with small quantities of bike lanes, lane lines, edge
lines, and center lines, or for conditions that require the equipment.
Figure 8 Applications of Epoxy Pavement Marking
(Left: Hand Equipment; Right: Traveling Traffic Striping Machine)
Application Settings and Conditions
1. Surface condition:
Use brushes, brooms, scrapers, grinders, high-pressure water jets, or air blasters to
remove dirt, dust, grease, oil, and other foreign matter from painting surfaces without
damaging the underlying pavement. 2. Temperature:
Although epoxies can be applied at surface temperatures as low as 35ºF (2C), GDOT’s
current requirement is that both the surface and the ambient temperature should be above
40F (4C) at the time of installation.
3. Moisture:
Although epoxies can be applied when pavement surfaces are slightly wet, the current
GDOT requirements are as follows:
Do not apply when the surface is moist.
Ensure relative humidity is not greater than 85% at the time of installation.
4. Thickness:
The minimum average uniform dry thicknesses on
Open graded asphalt concrete friction courses: 25 mils ± 2 mils (0.635 mm ±
0.051 mm).
All other pavements: 20 mils ± 2 mils (0.508 mm ± 0.051 mm).
5. Drying time:
Ensure that the epoxy markings reach a no-track condition in less than 30 minutes.
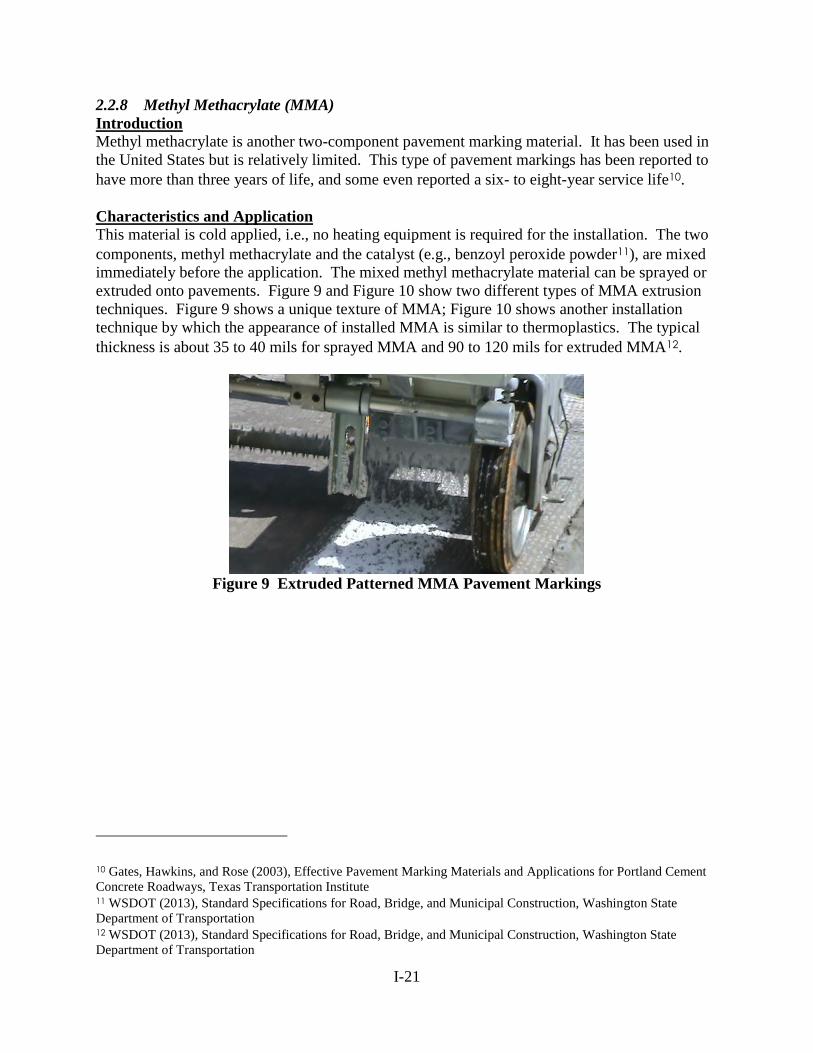
I-21
2.2.8 Methyl Methacrylate (MMA)
Introduction
Methyl methacrylate is another two-component pavement marking material. It has been used in
the United States but is relatively limited. This type of pavement markings has been reported to
have more than three years of life, and some even reported a six- to eight-year service life10.
Characteristics and Application
This material is cold applied, i.e., no heating equipment is required for the installation. The two
components, methyl methacrylate and the catalyst (e.g., benzoyl peroxide powder11), are mixed
immediately before the application. The mixed methyl methacrylate material can be sprayed or
extruded onto pavements. Figure 9 and Figure 10 show two different types of MMA extrusion
techniques. Figure 9 shows a unique texture of MMA; Figure 10 shows another installation
technique by which the appearance of installed MMA is similar to thermoplastics. The typical
thickness is about 35 to 40 mils for sprayed MMA and 90 to 120 mils for extruded MMA12.
Figure 9 Extruded Patterned MMA Pavement Markings
10 Gates, Hawkins, and Rose (2003), Effective Pavement Marking Materials and Applications for Portland Cement
Concrete Roadways, Texas Transportation Institute 11 WSDOT (2013), Standard Specifications for Road, Bridge, and Municipal Construction, Washington State
Department of Transportation 12 WSDOT (2013), Standard Specifications for Road, Bridge, and Municipal Construction, Washington State
Department of Transportation
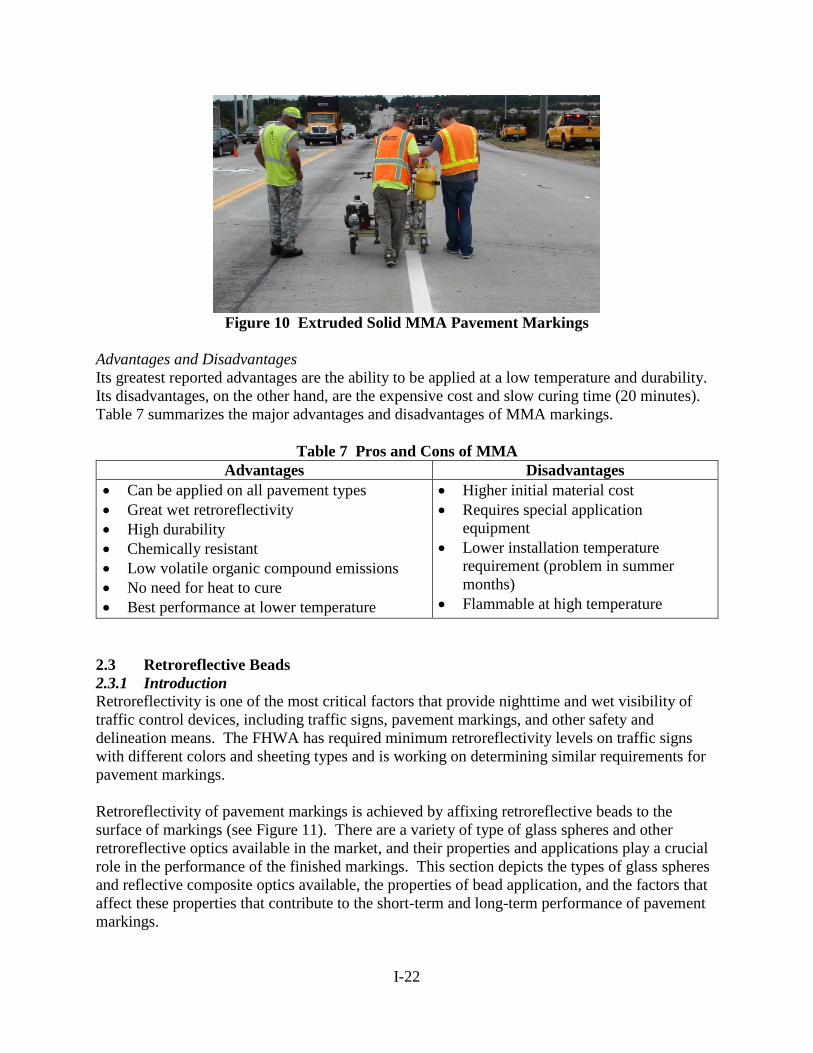
I-22
Figure 10 Extruded Solid MMA Pavement Markings
Advantages and Disadvantages
Its greatest reported advantages are the ability to be applied at a low temperature and durability.
Its disadvantages, on the other hand, are the expensive cost and slow curing time (20 minutes).
Table 7 summarizes the major advantages and disadvantages of MMA markings.
Table 7 Pros and Cons of MMA
Advantages Disadvantages
Can be applied on all pavement types
Great wet retroreflectivity
High durability
Chemically resistant
Low volatile organic compound emissions
No need for heat to cure
Best performance at lower temperature
Higher initial material cost
Requires special application
equipment
Lower installation temperature
requirement (problem in summer
months)
Flammable at high temperature
2.3 Retroreflective Beads
2.3.1 Introduction
Retroreflectivity is one of the most critical factors that provide nighttime and wet visibility of
traffic control devices, including traffic signs, pavement markings, and other safety and
delineation means. The FHWA has required minimum retroreflectivity levels on traffic signs
with different colors and sheeting types and is working on determining similar requirements for
pavement markings.
Retroreflectivity of pavement markings is achieved by affixing retroreflective beads to the
surface of markings (see Figure 11). There are a variety of type of glass spheres and other
retroreflective optics available in the market, and their properties and applications play a crucial
role in the performance of the finished markings. This section depicts the types of glass spheres
and reflective composite optics available, the properties of bead application, and the factors that
affect these properties that contribute to the short-term and long-term performance of pavement
markings.
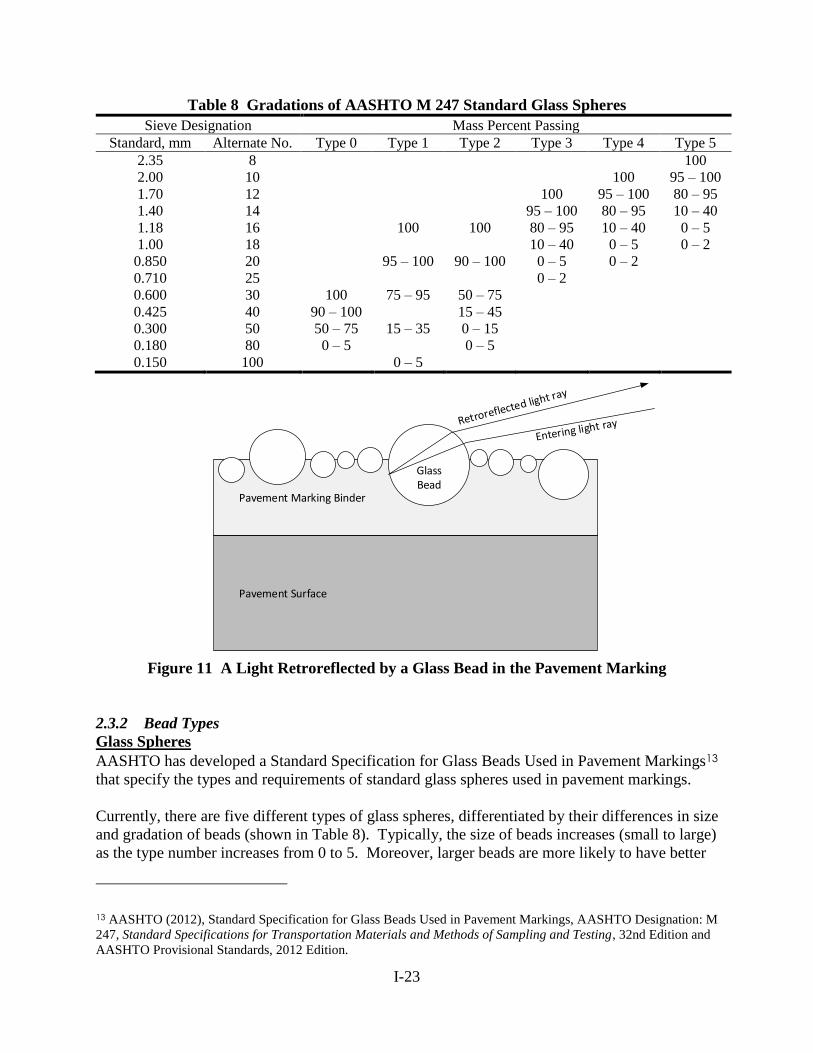
I-23
Table 8 Gradations of AASHTO M 247 Standard Glass Spheres
Sieve Designation Mass Percent Passing
Standard, mm Alternate No. Type 0 Type 1 Type 2 Type 3 Type 4 Type 5
2.35 8 100
2.00 10 100 95 – 100
1.70 12 100 95 – 100 80 – 95
1.40 14 95 – 100 80 – 95 10 – 40
1.18 16 100 100 80 – 95 10 – 40 0 – 5
1.00 18 10 – 40 0 – 5 0 – 2
0.850 20 95 – 100 90 – 100 0 – 5 0 – 2
0.710 25 0 – 2
0.600 30 100 75 – 95 50 – 75
0.425 40 90 – 100 15 – 45
0.300 50 50 – 75 15 – 35 0 – 15
0.180 80 0 – 5 0 – 5
0.150 100 0 – 5
Pavement Marking Binder
GlassBead
Pavement Surface
Figure 11 A Light Retroreflected by a Glass Bead in the Pavement Marking
2.3.2 Bead Types
Glass Spheres
AASHTO has developed a Standard Specification for Glass Beads Used in Pavement Markings13
that specify the types and requirements of standard glass spheres used in pavement markings.
Currently, there are five different types of glass spheres, differentiated by their differences in size
and gradation of beads (shown in Table 8). Typically, the size of beads increases (small to large)
as the type number increases from 0 to 5. Moreover, larger beads are more likely to have better
13 AASHTO (2012), Standard Specification for Glass Beads Used in Pavement Markings, AASHTO Designation: M
247, Standard Specifications for Transportation Materials and Methods of Sampling and Testing, 32nd Edition and
AASHTO Provisional Standards, 2012 Edition.
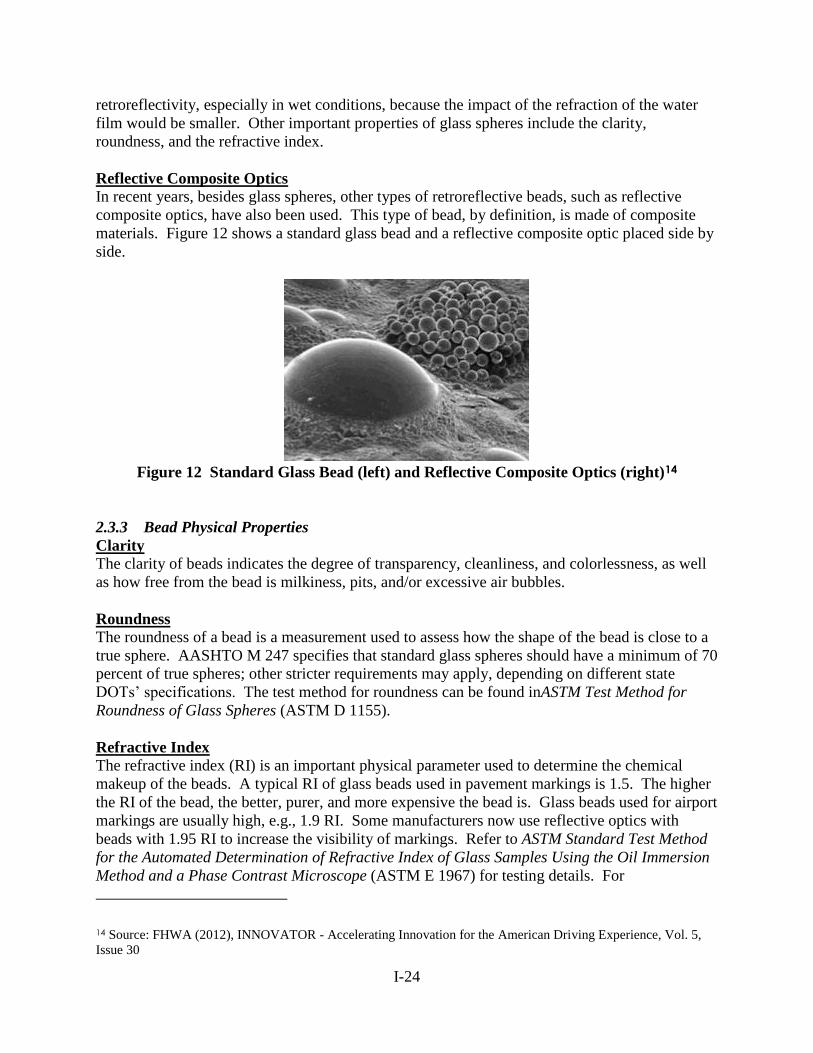
I-24
retroreflectivity, especially in wet conditions, because the impact of the refraction of the water
film would be smaller. Other important properties of glass spheres include the clarity,
roundness, and the refractive index.
Reflective Composite Optics
In recent years, besides glass spheres, other types of retroreflective beads, such as reflective
composite optics, have also been used. This type of bead, by definition, is made of composite
materials. Figure 12 shows a standard glass bead and a reflective composite optic placed side by
side.
Figure 12 Standard Glass Bead (left) and Reflective Composite Optics (right)14
2.3.3 Bead Physical Properties
Clarity
The clarity of beads indicates the degree of transparency, cleanliness, and colorlessness, as well
as how free from the bead is milkiness, pits, and/or excessive air bubbles.
Roundness
The roundness of a bead is a measurement used to assess how the shape of the bead is close to a
true sphere. AASHTO M 247 specifies that standard glass spheres should have a minimum of 70
percent of true spheres; other stricter requirements may apply, depending on different state
DOTs’ specifications. The test method for roundness can be found inASTM Test Method for
Roundness of Glass Spheres (ASTM D 1155).
Refractive Index
The refractive index (RI) is an important physical parameter used to determine the chemical
makeup of the beads. A typical RI of glass beads used in pavement markings is 1.5. The higher
the RI of the bead, the better, purer, and more expensive the bead is. Glass beads used for airport
markings are usually high, e.g., 1.9 RI. Some manufacturers now use reflective optics with
beads with 1.95 RI to increase the visibility of markings. Refer to ASTM Standard Test Method
for the Automated Determination of Refractive Index of Glass Samples Using the Oil Immersion
Method and a Phase Contrast Microscope (ASTM E 1967) for testing details. For
14 Source: FHWA (2012), INNOVATOR - Accelerating Innovation for the American Driving Experience, Vol. 5,
Issue 30
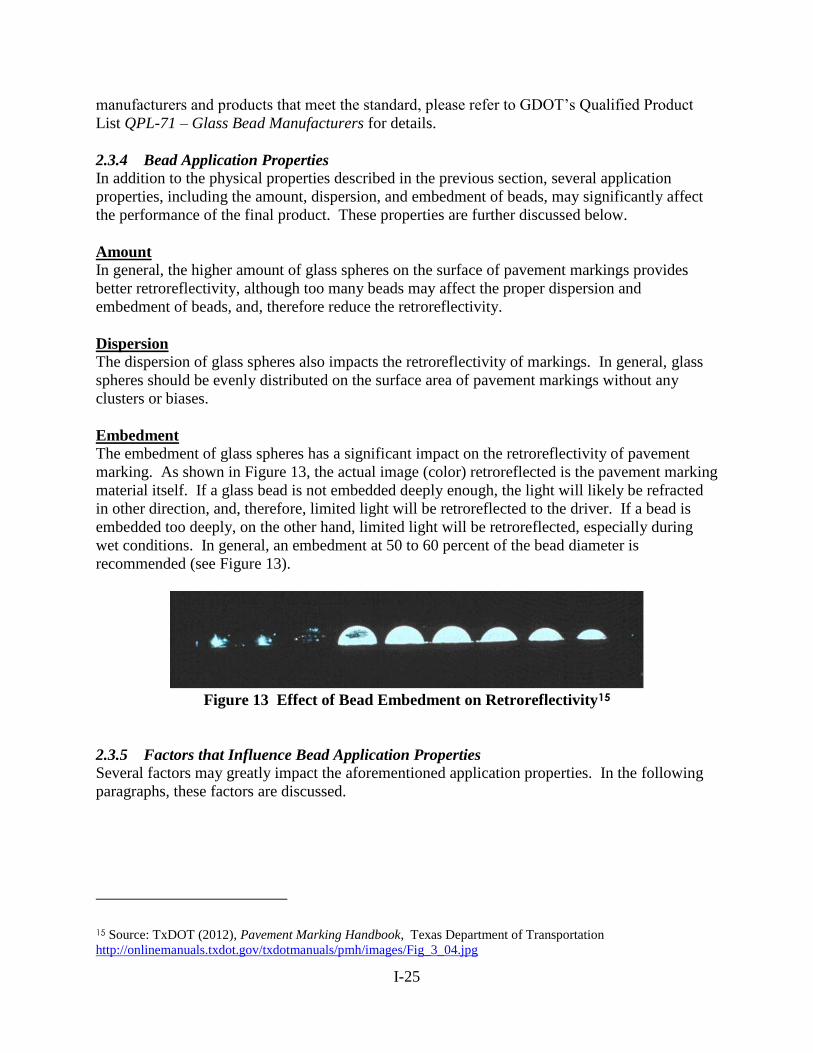
I-25
manufacturers and products that meet the standard, please refer to GDOT’s Qualified Product
List QPL-71 – Glass Bead Manufacturers for details.
2.3.4 Bead Application Properties
In addition to the physical properties described in the previous section, several application
properties, including the amount, dispersion, and embedment of beads, may significantly affect
the performance of the final product. These properties are further discussed below.
Amount
In general, the higher amount of glass spheres on the surface of pavement markings provides
better retroreflectivity, although too many beads may affect the proper dispersion and
embedment of beads, and, therefore reduce the retroreflectivity.
Dispersion
The dispersion of glass spheres also impacts the retroreflectivity of markings. In general, glass
spheres should be evenly distributed on the surface area of pavement markings without any
clusters or biases.
Embedment
The embedment of glass spheres has a significant impact on the retroreflectivity of pavement
marking. As shown in Figure 13, the actual image (color) retroreflected is the pavement marking
material itself. If a glass bead is not embedded deeply enough, the light will likely be refracted
in other direction, and, therefore, limited light will be retroreflected to the driver. If a bead is
embedded too deeply, on the other hand, limited light will be retroreflected, especially during
wet conditions. In general, an embedment at 50 to 60 percent of the bead diameter is
recommended (see Figure 13).
Figure 13 Effect of Bead Embedment on Retroreflectivity15
2.3.5 Factors that Influence Bead Application Properties
Several factors may greatly impact the aforementioned application properties. In the following
paragraphs, these factors are discussed.
15 Source: TxDOT (2012), Pavement Marking Handbook, Texas Department of Transportation
http://onlinemanuals.txdot.gov/txdotmanuals/pmh/images/Fig_3_04.jpg
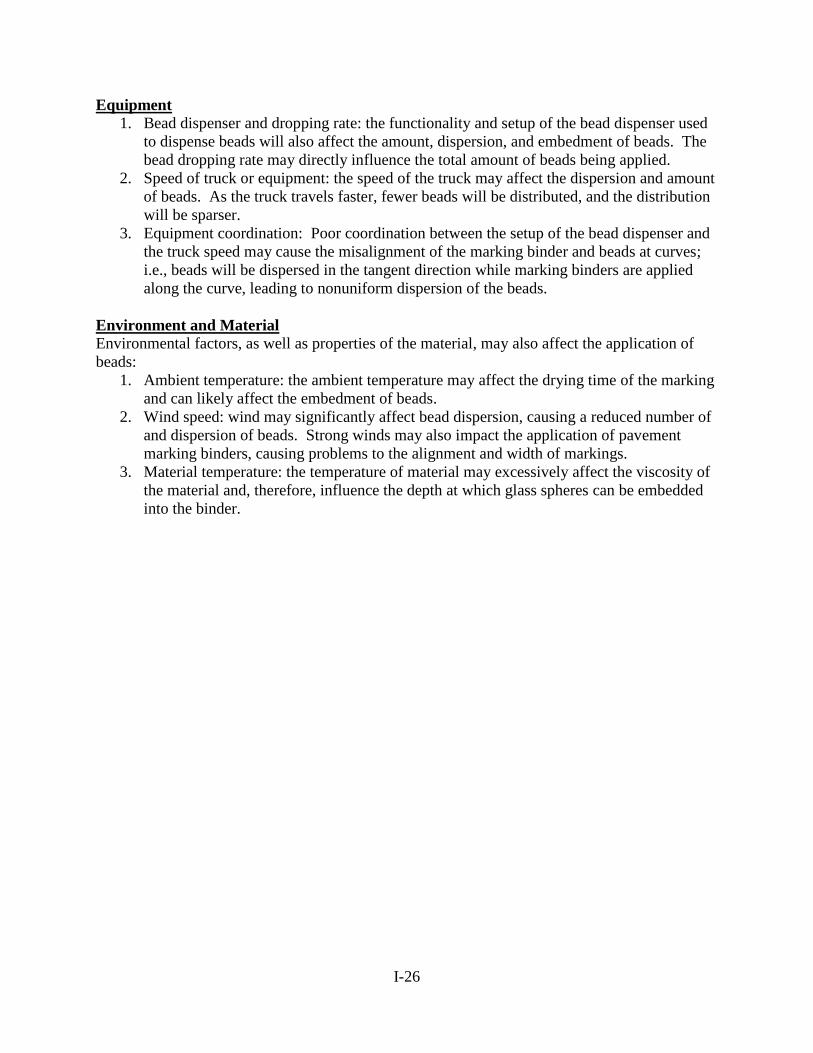
I-26
Equipment
1. Bead dispenser and dropping rate: the functionality and setup of the bead dispenser used
to dispense beads will also affect the amount, dispersion, and embedment of beads. The
bead dropping rate may directly influence the total amount of beads being applied.
2. Speed of truck or equipment: the speed of the truck may affect the dispersion and amount
of beads. As the truck travels faster, fewer beads will be distributed, and the distribution
will be sparser.
3. Equipment coordination: Poor coordination between the setup of the bead dispenser and
the truck speed may cause the misalignment of the marking binder and beads at curves;
i.e., beads will be dispersed in the tangent direction while marking binders are applied
along the curve, leading to nonuniform dispersion of the beads.
Environment and Material
Environmental factors, as well as properties of the material, may also affect the application of
beads:
1. Ambient temperature: the ambient temperature may affect the drying time of the marking
and can likely affect the embedment of beads.
2. Wind speed: wind may significantly affect bead dispersion, causing a reduced number of
and dispersion of beads. Strong winds may also impact the application of pavement
marking binders, causing problems to the alignment and width of markings.
3. Material temperature: the temperature of material may excessively affect the viscosity of
the material and, therefore, influence the depth at which glass spheres can be embedded
into the binder.

I-27
III. PAVEMENT MARKING INSTALLATION INSPECTION
3.1 Overview
In this chapter, critical pavement marking installation information, as well as the preparation and
inspection before, during, and after the installation is discussed.
3.2 Pre-Installation Preparation and Inspection
3.2.1 Surface Preparation
Marking Removal
Because of the characteristics of different pavement marking materials, the removal of existing
pavement markings may be required if the new material cannot be compatible with the existing
one. Table 9 shows the compatibility matrix that depicts the condition when marking removal is
necessary to ensure the performance of new pavement markings.
Table 9 Pavement Marking Material Compatibility Matrix (Adopted from TxDOT)
Original Material
New Material
Paint Thermo Preformed
Tape Epoxy Polyurea MMA
Paint Y Y N N N N
Thermoplastic Y Y N N N N
Preformed Tape N N N N N N
Epoxy Y Y N Y N N/A
Polyurea Y Y N N Y N/A
MMA Y Y N N N/A Y
When necessary, remove existing markings from the pavement before applying the new
markings:
1. Removal: utilize blasting, such as sand blasting or water blasting (Figure 14), grinding
(Figure 15), or other approved methods to completely remove pavement markings
without materially damaging the pavement surface or texture. Repair (at the contractor’s
expense) damage to the pavement or other surfaces caused by removing the markings.
Use repair methods acceptable to GDOT.
2. Blast cleaning:
Immediately remove residue and dust when the sand hits the pavement surface.
Use a vacuum attachment operating simultaneously with blast cleaning.
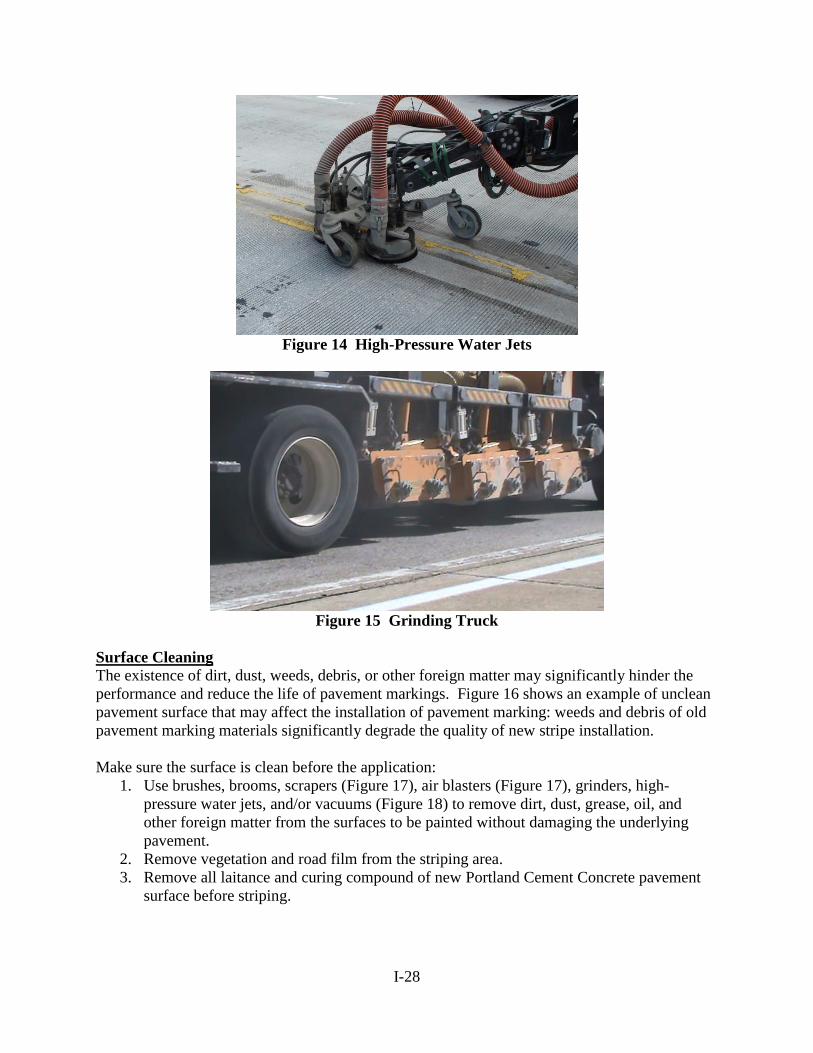
I-28
Figure 14 High-Pressure Water Jets
Figure 15 Grinding Truck
Surface Cleaning
The existence of dirt, dust, weeds, debris, or other foreign matter may significantly hinder the
performance and reduce the life of pavement markings. Figure 16 shows an example of unclean
pavement surface that may affect the installation of pavement marking: weeds and debris of old
pavement marking materials significantly degrade the quality of new stripe installation.
Make sure the surface is clean before the application:
1. Use brushes, brooms, scrapers (Figure 17), air blasters (Figure 17), grinders, high-
pressure water jets, and/or vacuums (Figure 18) to remove dirt, dust, grease, oil, and
other foreign matter from the surfaces to be painted without damaging the underlying
pavement.
2. Remove vegetation and road film from the striping area.
3. Remove all laitance and curing compound of new Portland Cement Concrete pavement
surface before striping.
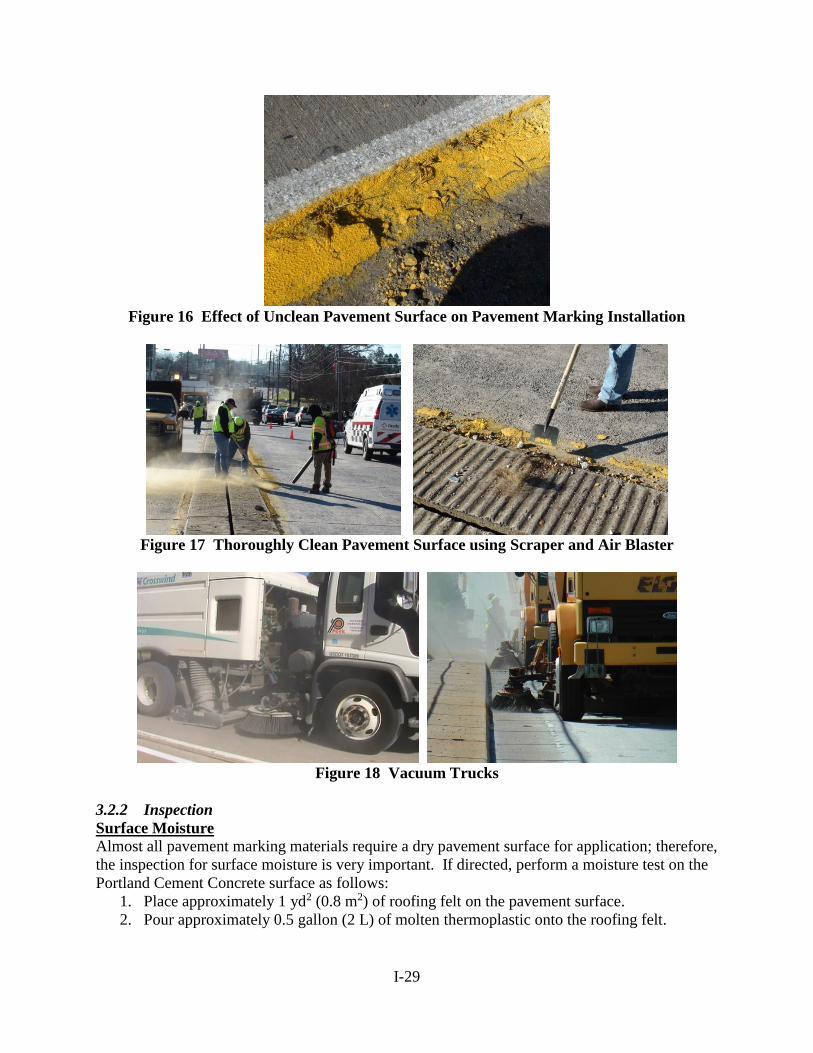
I-29
Figure 16 Effect of Unclean Pavement Surface on Pavement Marking Installation
Figure 17 Thoroughly Clean Pavement Surface using Scraper and Air Blaster
Figure 18 Vacuum Trucks
3.2.2 Inspection
Surface Moisture
Almost all pavement marking materials require a dry pavement surface for application; therefore,
the inspection for surface moisture is very important. If directed, perform a moisture test on the
Portland Cement Concrete surface as follows:
1. Place approximately 1 yd2 (0.8 m2) of roofing felt on the pavement surface.
2. Pour approximately 0.5 gallon (2 L) of molten thermoplastic onto the roofing felt.

I-30
3. After 2 minutes, lift the roofing felt and inspect it to see if moisture is present on the
pavement surface or underside of the roofing felt.
4. If moisture is present, do not proceed with the striping operation until the surface has
dried sufficiently to be moisture-free.
Ambient and Surface Temperature
Different materials have different requirements on the ambient and surface temperatures. Table
10 serves as a reference for minimum temperatures for materials application. Follow GDOT
standard specifications and/or manufacturer’s recommendations to ensure proper application.
Table 10 Minimum Ambient and Surface Temperatures
Material
Minimum Ambient
and/or Surface
Temperature
Paint 40 F
Thermoplastic 40 F
Preformed Plastic 60 F / 70 F and rising
Polyurea 40 F
Epoxy 40 F
MMA 35 F
Material Temperature
Similarly, different pavement marking materials have different temperature requirements for the
material itself; inspect material temperature and follow the specifications or manufacturer’s
recommendations.
3.2.3 Striping Equipment Inspection
Inspect the striping equipment, and make sure each aspect and requirement is met before the
striping operation. Inspect the following items:
1. Spray nozzles capable of simultaneously applying separate stripes, either solid or skip, in
any pattern.
2. Nozzles equipped with the following:
Cutoff valves for automatically applying skip lines;
A mechanical bead dispenser that operates simultaneously with the spray nozzle
to uniformly distribute beads at the specified rate;
Line-guides consisting of metallic shrouds or air blasts.
3. Tanks with mechanical agitators;
4. Small, portable applicators or other special equipment as needed.
3.3 Inspection During and After Installation
As mentioned previously, construction quality is one of the most important factors that affects
the performance of the completed pavement markings; therefore, inspection during installation
(field evaluation) is very crucial to the longevity of pavement markings. In general, the
inspection may include a test line evaluation immediately before the application procedure,
evaluation during the application, and evaluation after the application. Note that it is
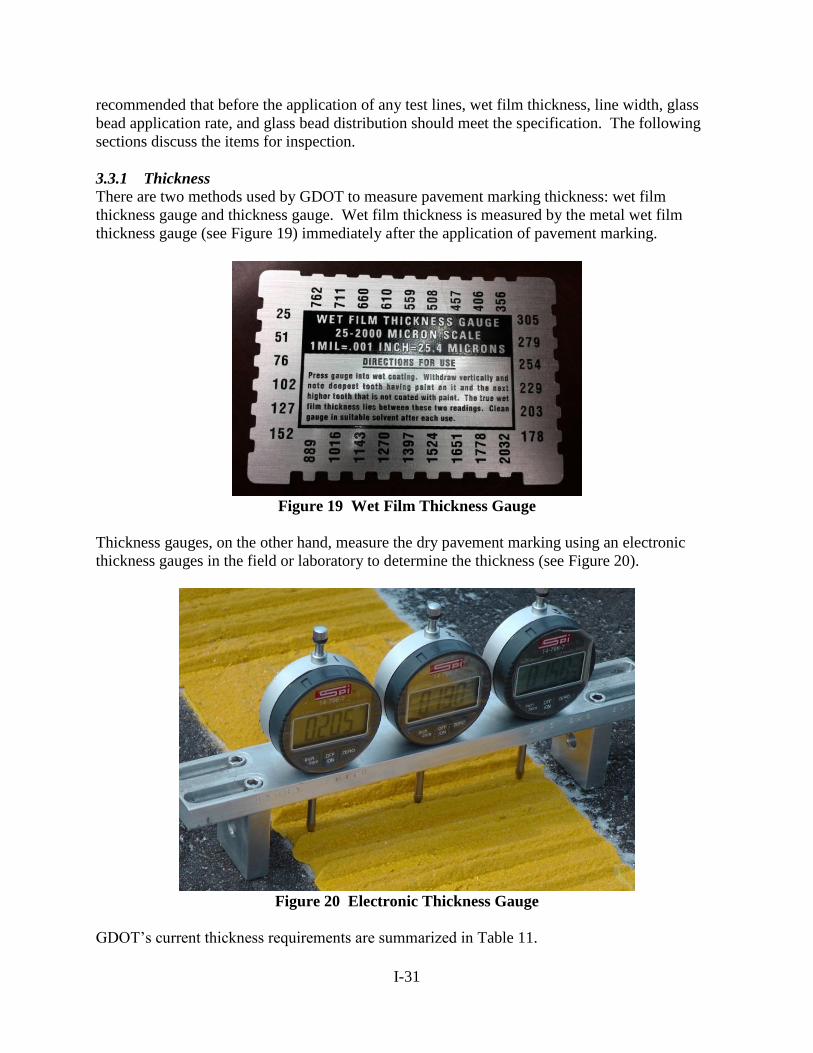
I-31
recommended that before the application of any test lines, wet film thickness, line width, glass
bead application rate, and glass bead distribution should meet the specification. The following
sections discuss the items for inspection.
3.3.1 Thickness
There are two methods used by GDOT to measure pavement marking thickness: wet film
thickness gauge and thickness gauge. Wet film thickness is measured by the metal wet film
thickness gauge (see Figure 19) immediately after the application of pavement marking.
Figure 19 Wet Film Thickness Gauge
Thickness gauges, on the other hand, measure the dry pavement marking using an electronic
thickness gauges in the field or laboratory to determine the thickness (see Figure 20).
Figure 20 Electronic Thickness Gauge
GDOT’s current thickness requirements are summarized in Table 11.
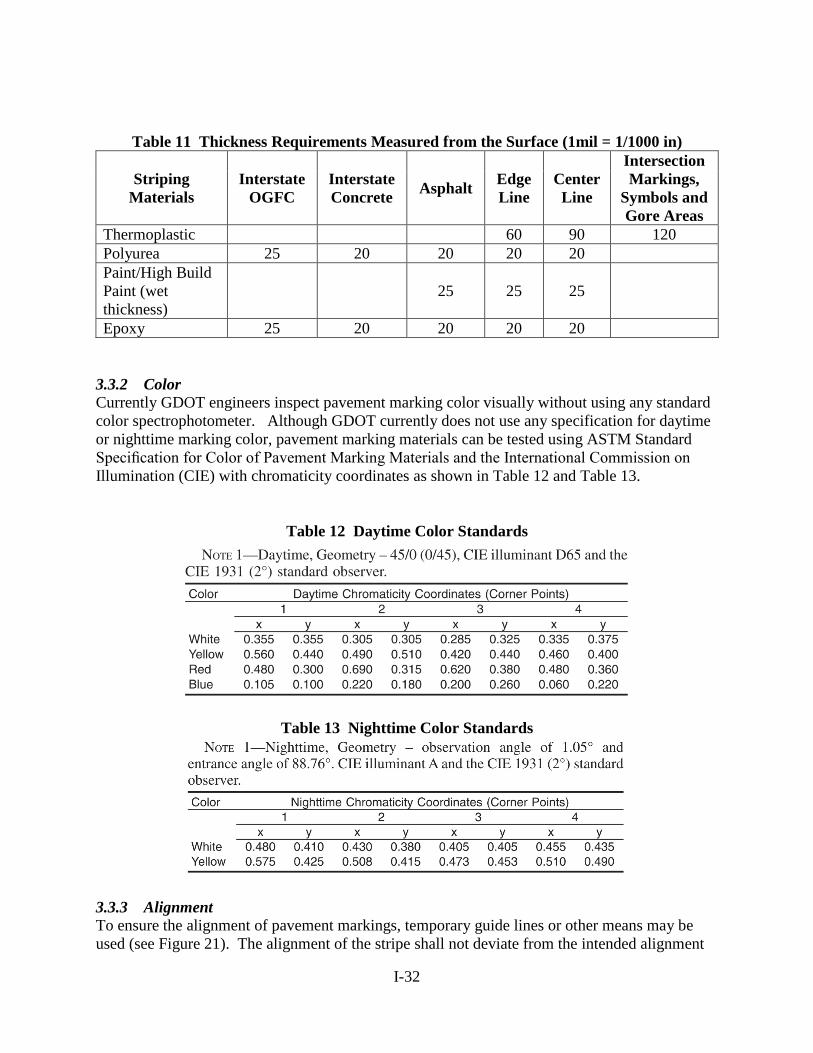
I-32
Table 11 Thickness Requirements Measured from the Surface (1mil = 1/1000 in)
Striping
Materials
Interstate
OGFC
Interstate
Concrete Asphalt
Edge
Line
Center
Line
Intersection
Markings,
Symbols and
Gore Areas
Thermoplastic 60 90 120
Polyurea 25 20 20 20 20
Paint/High Build
Paint (wet
thickness)
25 25 25
Epoxy 25 20 20 20 20
3.3.2 Color
Currently GDOT engineers inspect pavement marking color visually without using any standard
color spectrophotometer. Although GDOT currently does not use any specification for daytime
or nighttime marking color, pavement marking materials can be tested using ASTM Standard
Specification for Color of Pavement Marking Materials and the International Commission on
Illumination (CIE) with chromaticity coordinates as shown in Table 12 and Table 13.
Table 12 Daytime Color Standards
Table 13 Nighttime Color Standards
3.3.3 Alignment
To ensure the alignment of pavement markings, temporary guide lines or other means may be
used (see Figure 21). The alignment of the stripe shall not deviate from the intended alignment
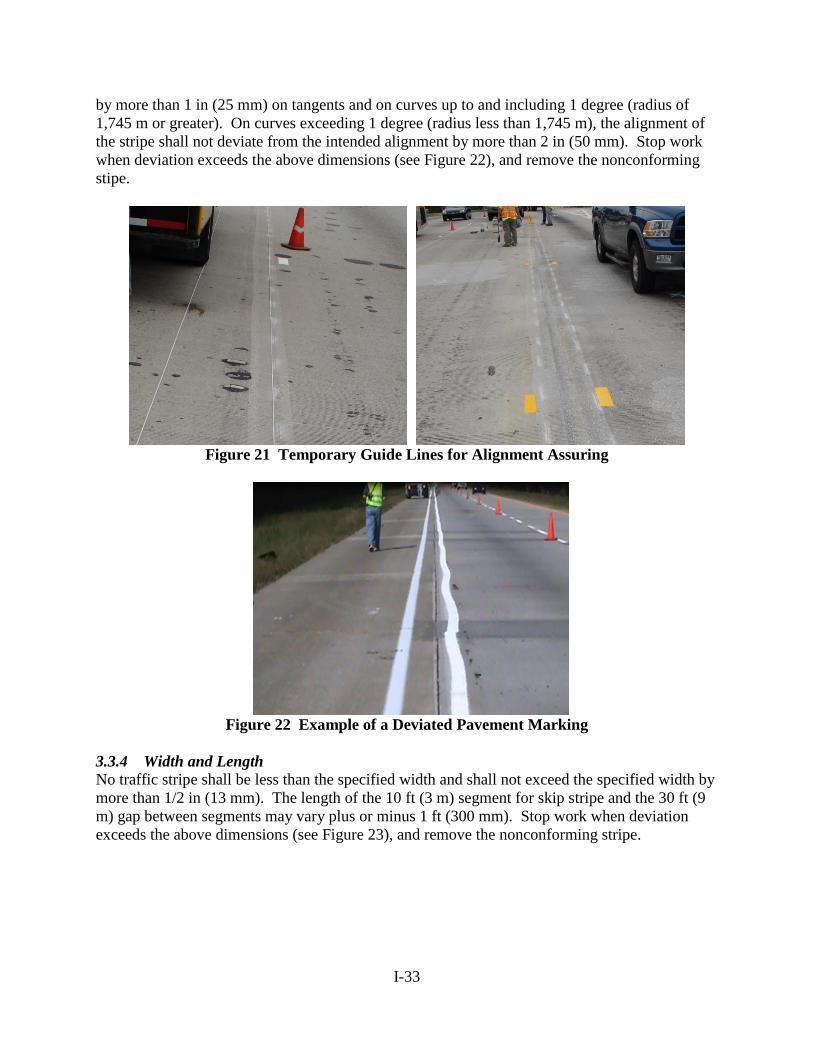
I-33
by more than 1 in (25 mm) on tangents and on curves up to and including 1 degree (radius of
1,745 m or greater). On curves exceeding 1 degree (radius less than 1,745 m), the alignment of
the stripe shall not deviate from the intended alignment by more than 2 in (50 mm). Stop work
when deviation exceeds the above dimensions (see Figure 22), and remove the nonconforming
stipe.
Figure 21 Temporary Guide Lines for Alignment Assuring
Figure 22 Example of a Deviated Pavement Marking
3.3.4 Width and Length
No traffic stripe shall be less than the specified width and shall not exceed the specified width by
more than 1/2 in (13 mm). The length of the 10 ft (3 m) segment for skip stripe and the 30 ft (9
m) gap between segments may vary plus or minus 1 ft (300 mm). Stop work when deviation
exceeds the above dimensions (see Figure 23), and remove the nonconforming stripe.
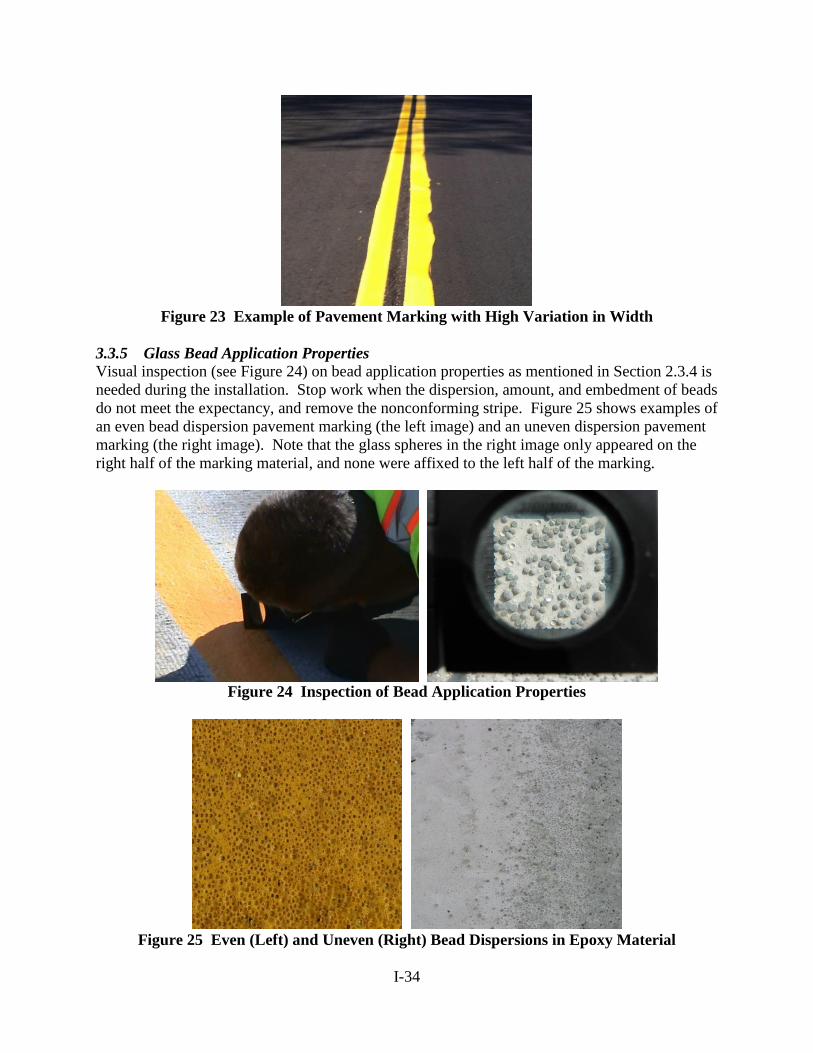
I-34
Figure 23 Example of Pavement Marking with High Variation in Width
3.3.5 Glass Bead Application Properties
Visual inspection (see Figure 24) on bead application properties as mentioned in Section 2.3.4 is
needed during the installation. Stop work when the dispersion, amount, and embedment of beads
do not meet the expectancy, and remove the nonconforming stripe. Figure 25 shows examples of
an even bead dispersion pavement marking (the left image) and an uneven dispersion pavement
marking (the right image). Note that the glass spheres in the right image only appeared on the
right half of the marking material, and none were affixed to the left half of the marking.
Figure 24 Inspection of Bead Application Properties
Figure 25 Even (Left) and Uneven (Right) Bead Dispersions in Epoxy Material
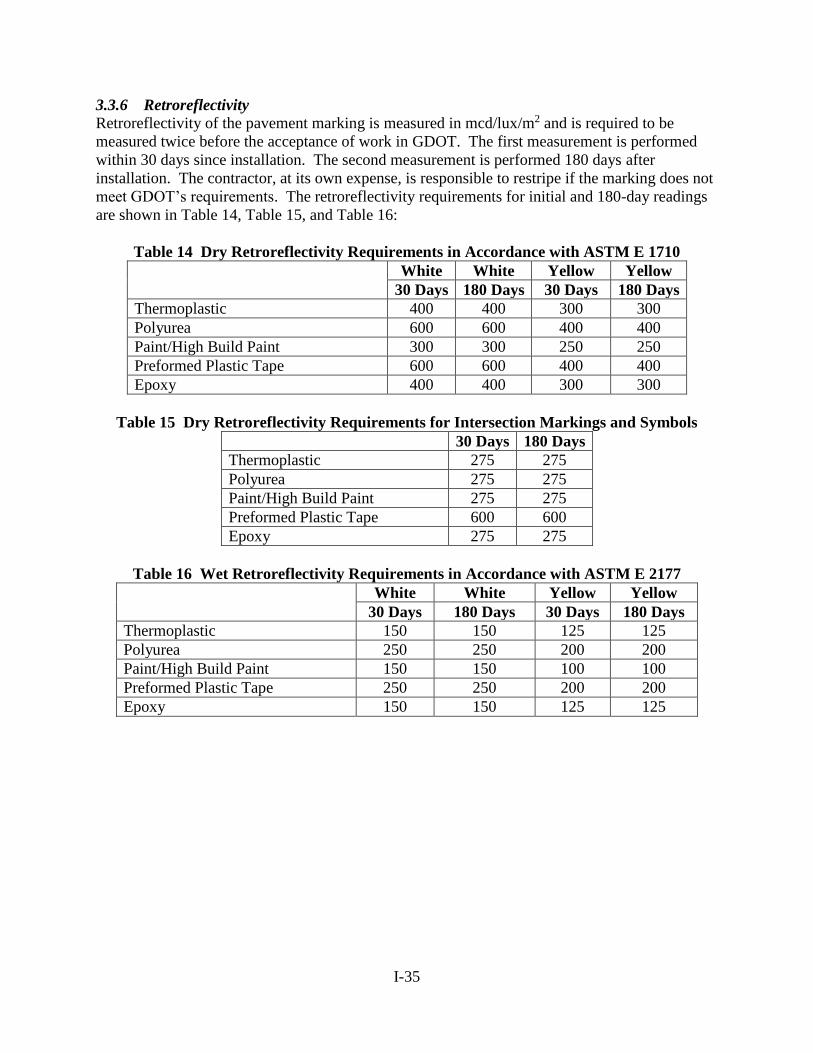
I-35
3.3.6 Retroreflectivity
Retroreflectivity of the pavement marking is measured in mcd/lux/m2 and is required to be
measured twice before the acceptance of work in GDOT. The first measurement is performed
within 30 days since installation. The second measurement is performed 180 days after
installation. The contractor, at its own expense, is responsible to restripe if the marking does not
meet GDOT’s requirements. The retroreflectivity requirements for initial and 180-day readings
are shown in Table 14, Table 15, and Table 16:
Table 14 Dry Retroreflectivity Requirements in Accordance with ASTM E 1710
White White Yellow Yellow
30 Days 180 Days 30 Days 180 Days
Thermoplastic 400 400 300 300
Polyurea 600 600 400 400
Paint/High Build Paint 300 300 250 250
Preformed Plastic Tape 600 600 400 400
Epoxy 400 400 300 300
Table 15 Dry Retroreflectivity Requirements for Intersection Markings and Symbols
30 Days 180 Days
Thermoplastic 275 275
Polyurea 275 275
Paint/High Build Paint 275 275
Preformed Plastic Tape 600 600
Epoxy 275 275
Table 16 Wet Retroreflectivity Requirements in Accordance with ASTM E 2177
White White Yellow Yellow
30 Days 180 Days 30 Days 180 Days
Thermoplastic 150 150 125 125
Polyurea 250 250 200 200
Paint/High Build Paint 150 150 100 100
Preformed Plastic Tape 250 250 200 200
Epoxy 150 150 125 125
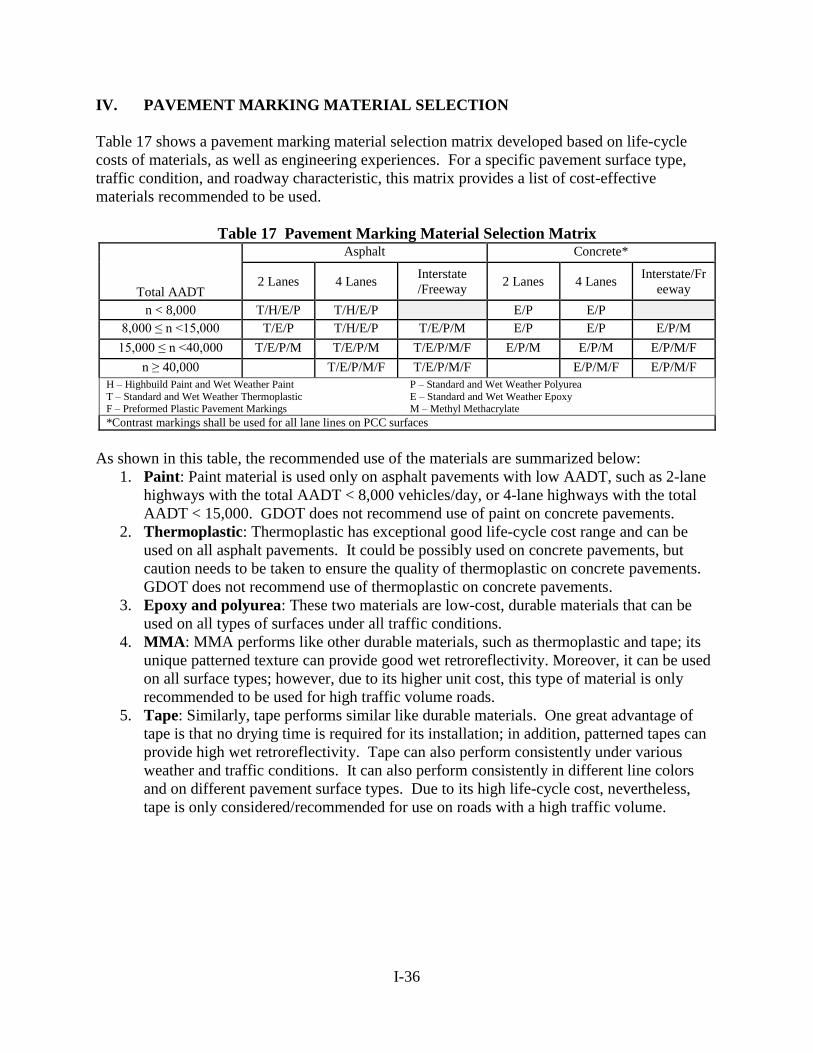
I-36
IV. PAVEMENT MARKING MATERIAL SELECTION
Table 17 shows a pavement marking material selection matrix developed based on life-cycle
costs of materials, as well as engineering experiences. For a specific pavement surface type,
traffic condition, and roadway characteristic, this matrix provides a list of cost-effective
materials recommended to be used.
Table 17 Pavement Marking Material Selection Matrix
Total AADT
Asphalt Concrete*
2 Lanes 4 Lanes Interstate
/Freeway 2 Lanes 4 Lanes
Interstate/Fr
eeway
n < 8,000 T/H/E/P T/H/E/P E/P E/P
8,000 ≤ n <15,000 T/E/P T/H/E/P T/E/P/M E/P E/P E/P/M
15,000 ≤ n <40,000 T/E/P/M T/E/P/M T/E/P/M/F E/P/M E/P/M E/P/M/F
n ≥ 40,000 T/E/P/M/F T/E/P/M/F E/P/M/F E/P/M/F
H – Highbuild Paint and Wet Weather Paint
T – Standard and Wet Weather Thermoplastic F – Preformed Plastic Pavement Markings
P – Standard and Wet Weather Polyurea
E – Standard and Wet Weather Epoxy M – Methyl Methacrylate
*Contrast markings shall be used for all lane lines on PCC surfaces
As shown in this table, the recommended use of the materials are summarized below:
1. Paint: Paint material is used only on asphalt pavements with low AADT, such as 2-lane
highways with the total AADT < 8,000 vehicles/day, or 4-lane highways with the total
AADT < 15,000. GDOT does not recommend use of paint on concrete pavements.
2. Thermoplastic: Thermoplastic has exceptional good life-cycle cost range and can be
used on all asphalt pavements. It could be possibly used on concrete pavements, but
caution needs to be taken to ensure the quality of thermoplastic on concrete pavements.
GDOT does not recommend use of thermoplastic on concrete pavements.
3. Epoxy and polyurea: These two materials are low-cost, durable materials that can be
used on all types of surfaces under all traffic conditions.
4. MMA: MMA performs like other durable materials, such as thermoplastic and tape; its
unique patterned texture can provide good wet retroreflectivity. Moreover, it can be used
on all surface types; however, due to its higher unit cost, this type of material is only
recommended to be used for high traffic volume roads.
5. Tape: Similarly, tape performs similar like durable materials. One great advantage of
tape is that no drying time is required for its installation; in addition, patterned tapes can
provide high wet retroreflectivity. Tape can also perform consistently under various
weather and traffic conditions. It can also perform consistently in different line colors
and on different pavement surface types. Due to its high life-cycle cost, nevertheless,
tape is only considered/recommended for use on roads with a high traffic volume.
II-1
APPENDIX II PAVEMENT MARKING TUTORIAL USER MANUAL
Pavement Marking Interactive Tutorial
-- User Manual --
Prepared by:
Georgia Institute of Technology
Prepared for:
Georgia Department of Transportation
December 2015
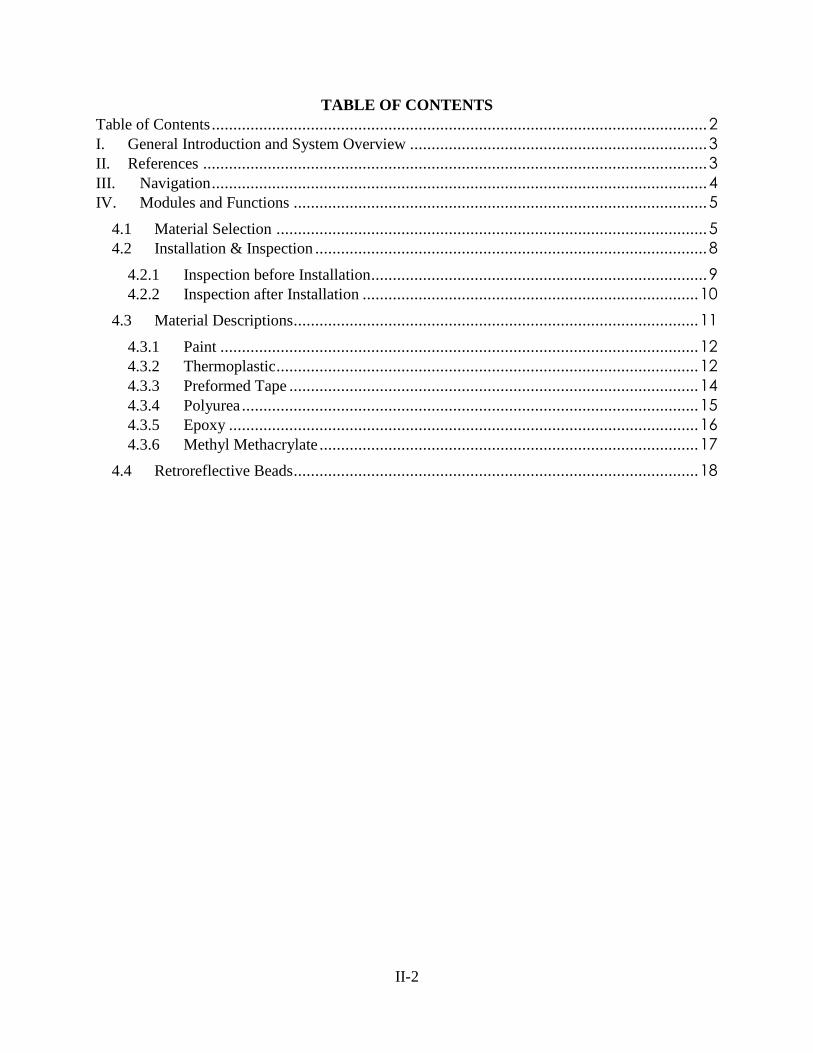
II-2
TABLE OF CONTENTS
Table of Contents ................................................................................................................... 2
I. General Introduction and System Overview ..................................................................... 3
II. References ..................................................................................................................... 3
III. Navigation ................................................................................................................... 4
IV. Modules and Functions ................................................................................................ 5
4.1 Material Selection .................................................................................................... 5
4.2 Installation & Inspection ........................................................................................... 8
4.2.1 Inspection before Installation.............................................................................. 9
4.2.2 Inspection after Installation .............................................................................. 10
4.3 Material Descriptions.............................................................................................. 11
4.3.1 Paint ............................................................................................................... 12
4.3.2 Thermoplastic.................................................................................................. 12
4.3.3 Preformed Tape ............................................................................................... 14
4.3.4 Polyurea .......................................................................................................... 15
4.3.5 Epoxy ............................................................................................................. 16
4.3.6 Methyl Methacrylate ........................................................................................ 17
4.4 Retroreflective Beads.............................................................................................. 18
II-3
I. GENERAL INTRODUCTION AND SYSTEM OVERVIEW
The content of this web-based interactive tutorial is essentially summarized from the Pavement
Marking Handbook; it has additional interactive functions and videos that can be used as a
means for pavement marking material selection and personnel training.
In this user guide, the basic functions and modules of the interactive tutorial are introduced. This
web-based tutorial is designed to be used by desktop or laptop users; it can be opened by most
modern web browsers, including Internet Explorer (IE), Chrome, and Firefox. Note that because
Javascript was used to develop these interactive functions (mainly in the Material Selection
Module), IE users need to allow the default restriction and enable the webpage to run scripts (see
Figure 1). It is recommended that the most updated browser version be used.
Figure 1 Internet Explorer Alert: Allow Blocked Content
II. REFERENCES
Most pavement marking material specifications in this tutorial, in terms of composition, binder,
pigment, temperature, thickness, and more, were extracted from GDOT’s standard specifications
or provisional standards as follows:
Standard Specification Section 652 – Painting Traffic Stripe
Standard Specification Section 653 – Thermoplastic Traffic Stripe
Standard Specification Section 657 – Preformed Plastic Pavement Markings
Standard Specification Section 658 – Polyurea Traffic Stripe
Standard Specification Section 659 – Hot Applied Preformed Plastic Pavement Markings
Special Provision Section 661– Standard and Wet Weather Epoxy Traffic Stripe
Standard Specification Section 870 – Paint
Besides the specifications and standards, a pavement marking material selection matrix proposed
by the Georgia Research Team is used to recommend materials under various traffic and
pavement conditions. Table 1 summarizes the recommended materials for different AADT,
highway functions, and pavement surface types.
Table 1 A Proposed Pavement Marking Material Selection Matrix for GDOT
AADT
Asphalt Concrete*
2 Lanes 4 Lanes Interstate/Fr
eeway 2 Lanes 4 Lanes
Interstate/Fr
eeway
n < 8,000 T/H/E/P T/H/E/P E/P E/P
8,000 ≤ n <15,000 T/E/P T/H/E/P T/E/P/M E/P E/P E/P/M
15,000 ≤ n <40,000 T/E/P/M T/E/P/M T/E/P/M/F E/P/M E/P/M E/P/M/F
n ≥ 40,000 T/E/P/M/F T/E/P/M/F E/P/M/F E/P/M/F H – Highbuild Paint and Wet Weather Paint Traffic Stripe T – Standard and Wet Weather Thermoplastic Traffic Stripe
F – Preformed Plastic Pavement Markings
P – Standard and Wet Weather Polyurea Traffic Strip E – Standard and Wet Weather Epoxy Traffic Strip
M – Methyl Methacrylate
*Contrast markings shall be used for all lane lines on PCC surfaces
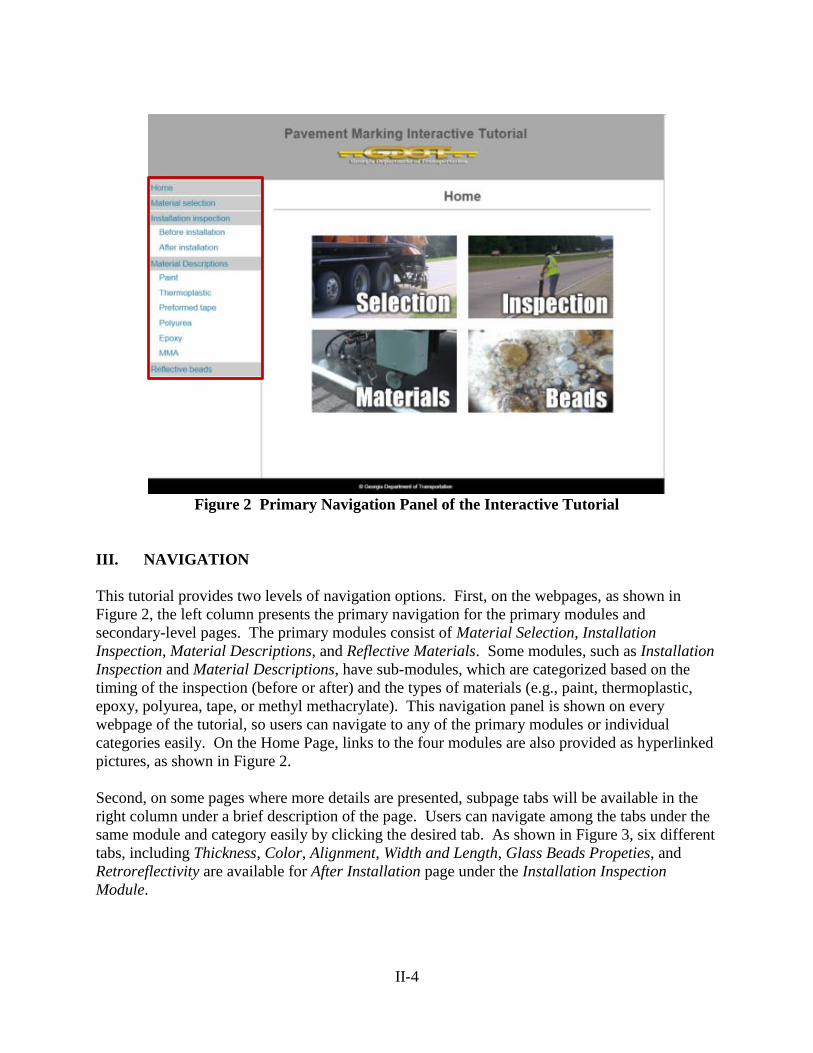
II-4
Figure 2 Primary Navigation Panel of the Interactive Tutorial
III. NAVIGATION
This tutorial provides two levels of navigation options. First, on the webpages, as shown in
Figure 2, the left column presents the primary navigation for the primary modules and
secondary-level pages. The primary modules consist of Material Selection, Installation
Inspection, Material Descriptions, and Reflective Materials. Some modules, such as Installation
Inspection and Material Descriptions, have sub-modules, which are categorized based on the
timing of the inspection (before or after) and the types of materials (e.g., paint, thermoplastic,
epoxy, polyurea, tape, or methyl methacrylate). This navigation panel is shown on every
webpage of the tutorial, so users can navigate to any of the primary modules or individual
categories easily. On the Home Page, links to the four modules are also provided as hyperlinked
pictures, as shown in Figure 2.
Second, on some pages where more details are presented, subpage tabs will be available in the
right column under a brief description of the page. Users can navigate among the tabs under the
same module and category easily by clicking the desired tab. As shown in Figure 3, six different
tabs, including Thickness, Color, Alignment, Width and Length, Glass Beads Propeties, and
Retroreflectivity are available for After Installation page under the Installation Inspection
Module.
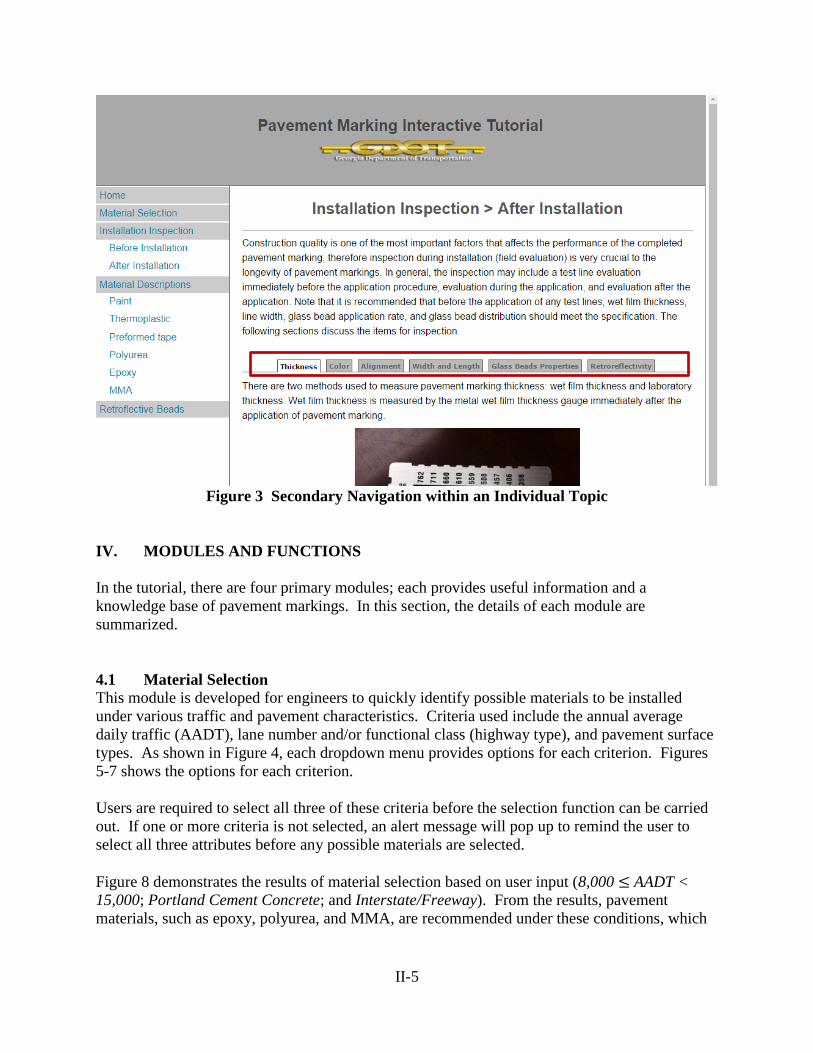
II-5
Figure 3 Secondary Navigation within an Individual Topic
IV. MODULES AND FUNCTIONS
In the tutorial, there are four primary modules; each provides useful information and a
knowledge base of pavement markings. In this section, the details of each module are
summarized.
4.1 Material Selection
This module is developed for engineers to quickly identify possible materials to be installed
under various traffic and pavement characteristics. Criteria used include the annual average
daily traffic (AADT), lane number and/or functional class (highway type), and pavement surface
types. As shown in Figure 4, each dropdown menu provides options for each criterion. Figures
5-7 shows the options for each criterion.
Users are required to select all three of these criteria before the selection function can be carried
out. If one or more criteria is not selected, an alert message will pop up to remind the user to
select all three attributes before any possible materials are selected.
Figure 8 demonstrates the results of material selection based on user input (8,000 ≤ AADT <
15,000; Portland Cement Concrete; and Interstate/Freeway). From the results, pavement
materials, such as epoxy, polyurea, and MMA, are recommended under these conditions, which
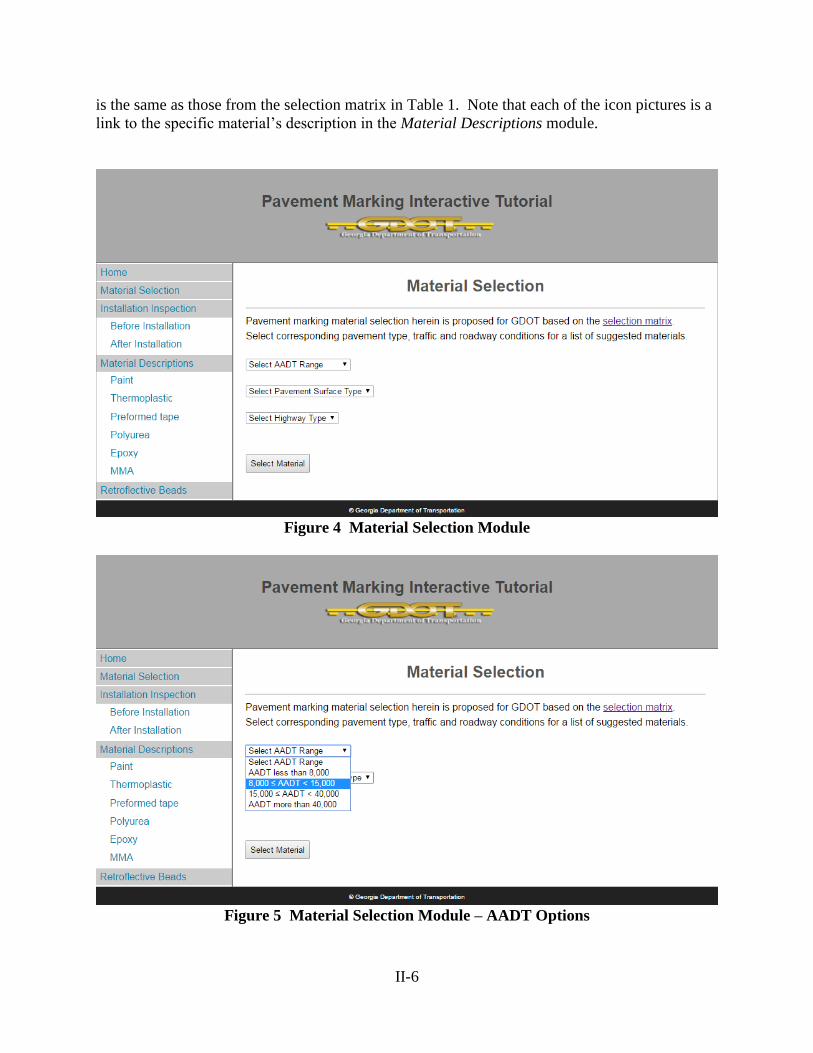
II-6
is the same as those from the selection matrix in Table 1. Note that each of the icon pictures is a
link to the specific material’s description in the Material Descriptions module.
Figure 4 Material Selection Module
Figure 5 Material Selection Module – AADT Options
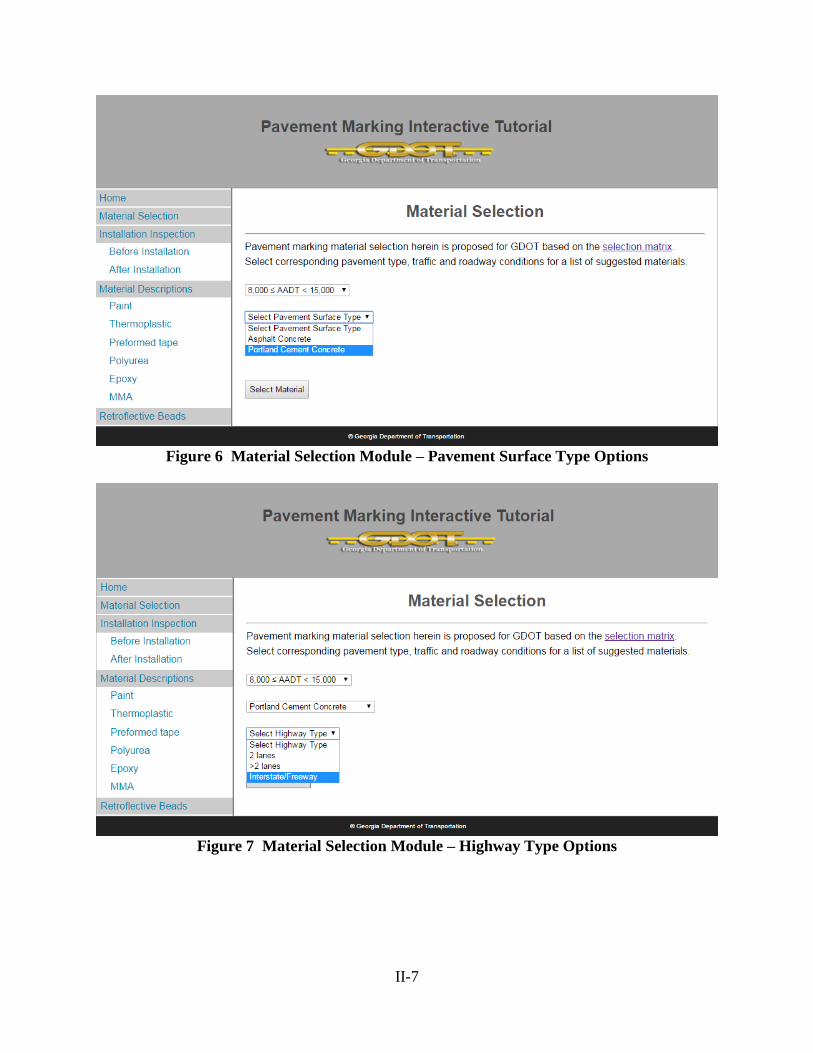
II-7
Figure 6 Material Selection Module – Pavement Surface Type Options
Figure 7 Material Selection Module – Highway Type Options
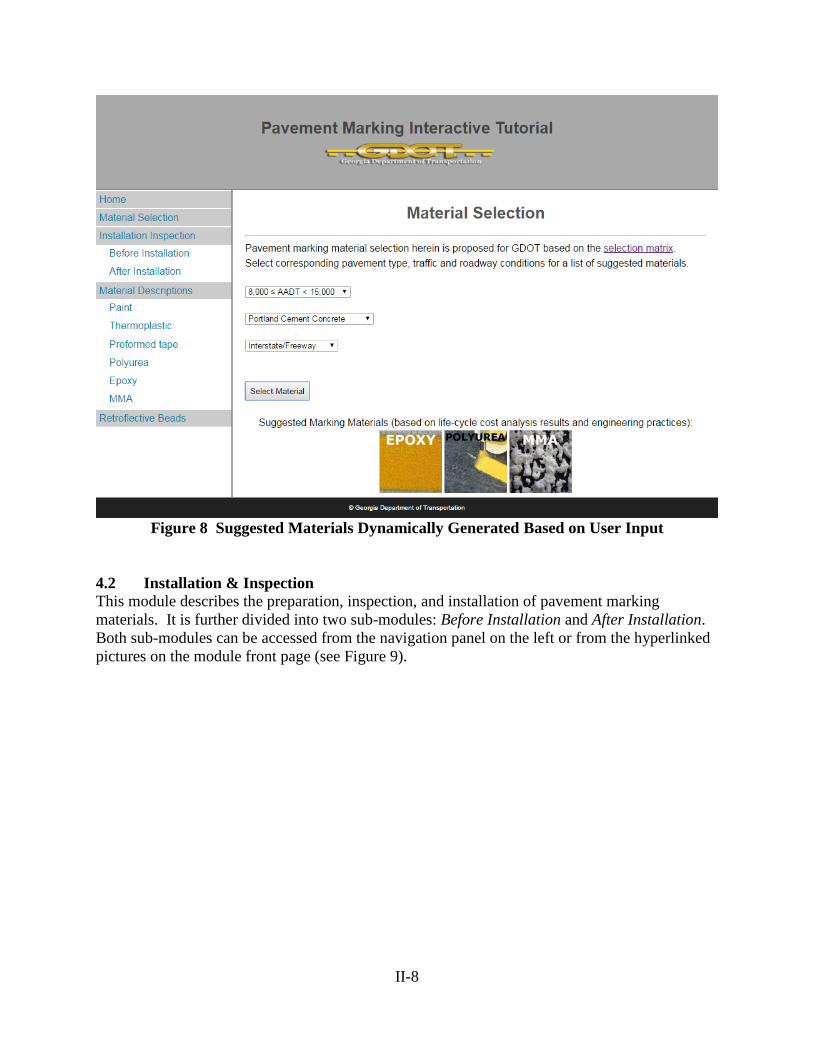
II-8
Figure 8 Suggested Materials Dynamically Generated Based on User Input
4.2 Installation & Inspection
This module describes the preparation, inspection, and installation of pavement marking
materials. It is further divided into two sub-modules: Before Installation and After Installation.
Both sub-modules can be accessed from the navigation panel on the left or from the hyperlinked
pictures on the module front page (see Figure 9).
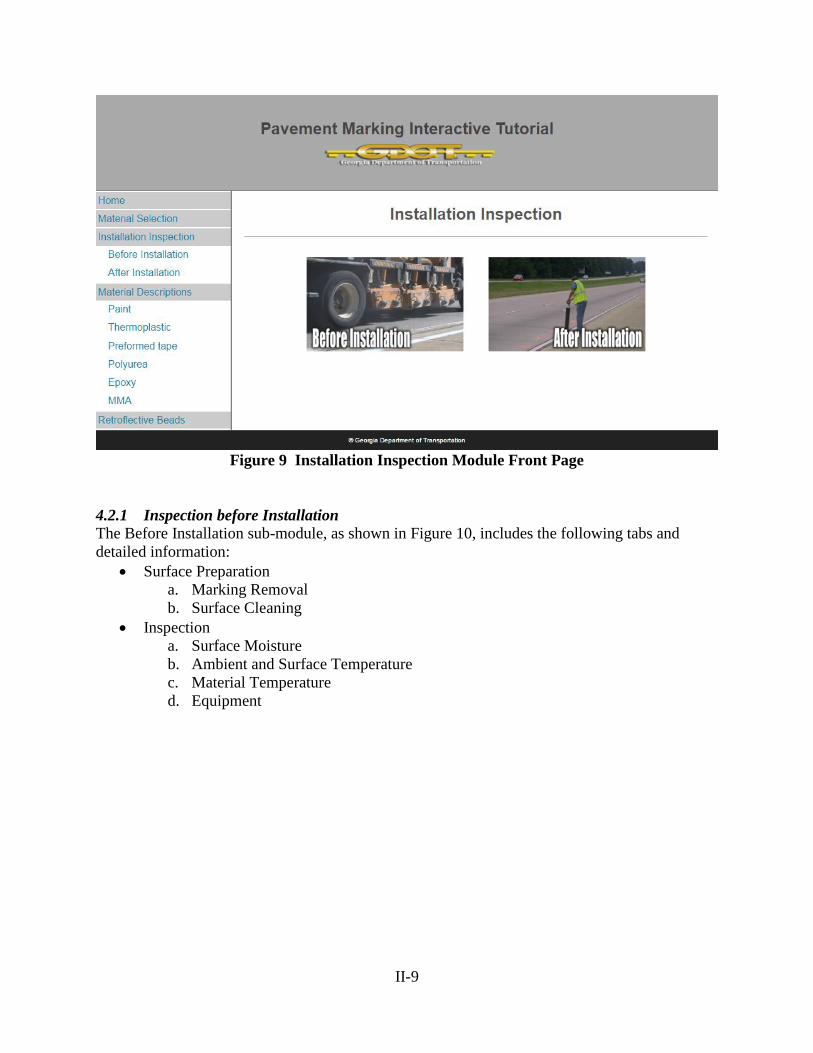
II-9
Figure 9 Installation Inspection Module Front Page
4.2.1 Inspection before Installation
The Before Installation sub-module, as shown in Figure 10, includes the following tabs and
detailed information:
Surface Preparation
a. Marking Removal
b. Surface Cleaning
Inspection
a. Surface Moisture
b. Ambient and Surface Temperature
c. Material Temperature
d. Equipment
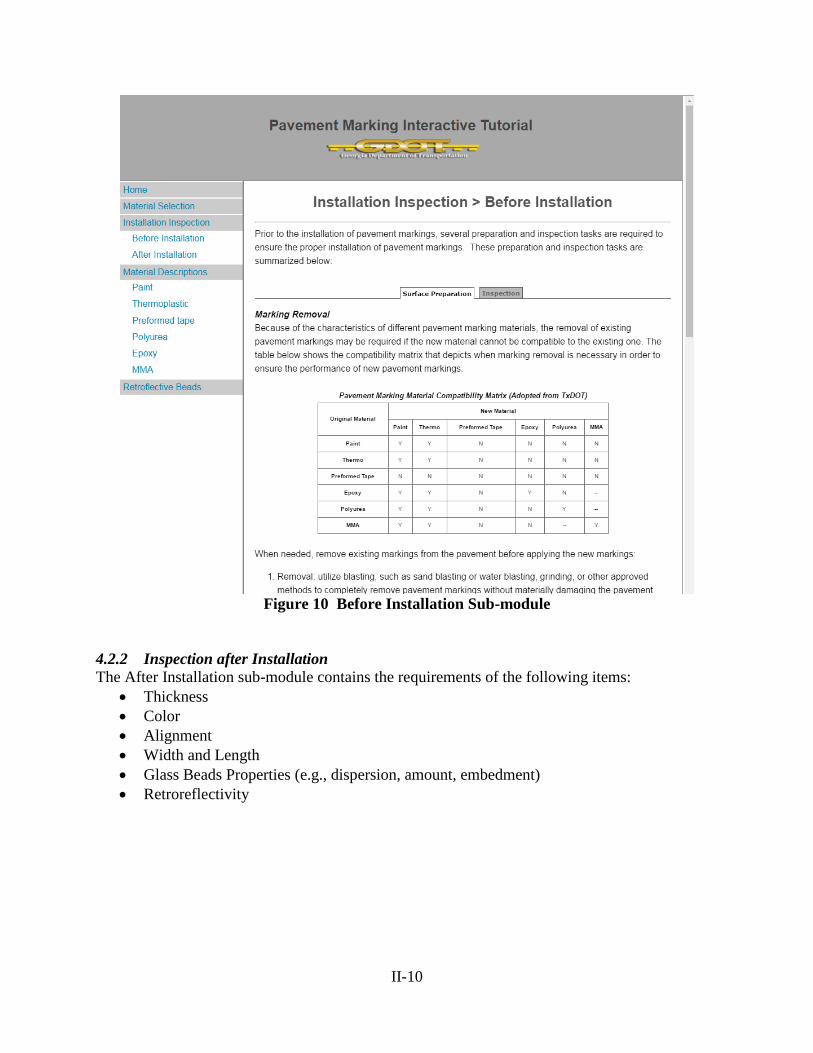
II-10
Figure 10 Before Installation Sub-module
4.2.2 Inspection after Installation
The After Installation sub-module contains the requirements of the following items:
Thickness
Color
Alignment
Width and Length
Glass Beads Properties (e.g., dispersion, amount, embedment)
Retroreflectivity
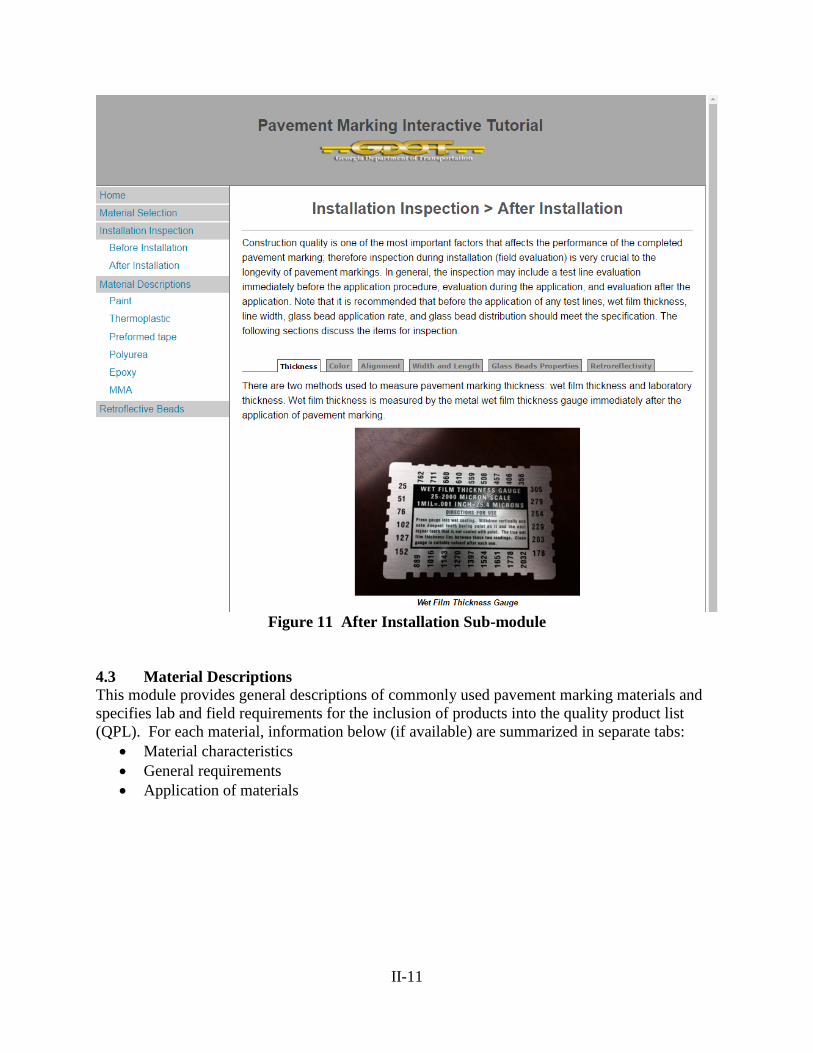
II-11
Figure 11 After Installation Sub-module
4.3 Material Descriptions
This module provides general descriptions of commonly used pavement marking materials and
specifies lab and field requirements for the inclusion of products into the quality product list
(QPL). For each material, information below (if available) are summarized in separate tabs:
Material characteristics
General requirements
Application of materials
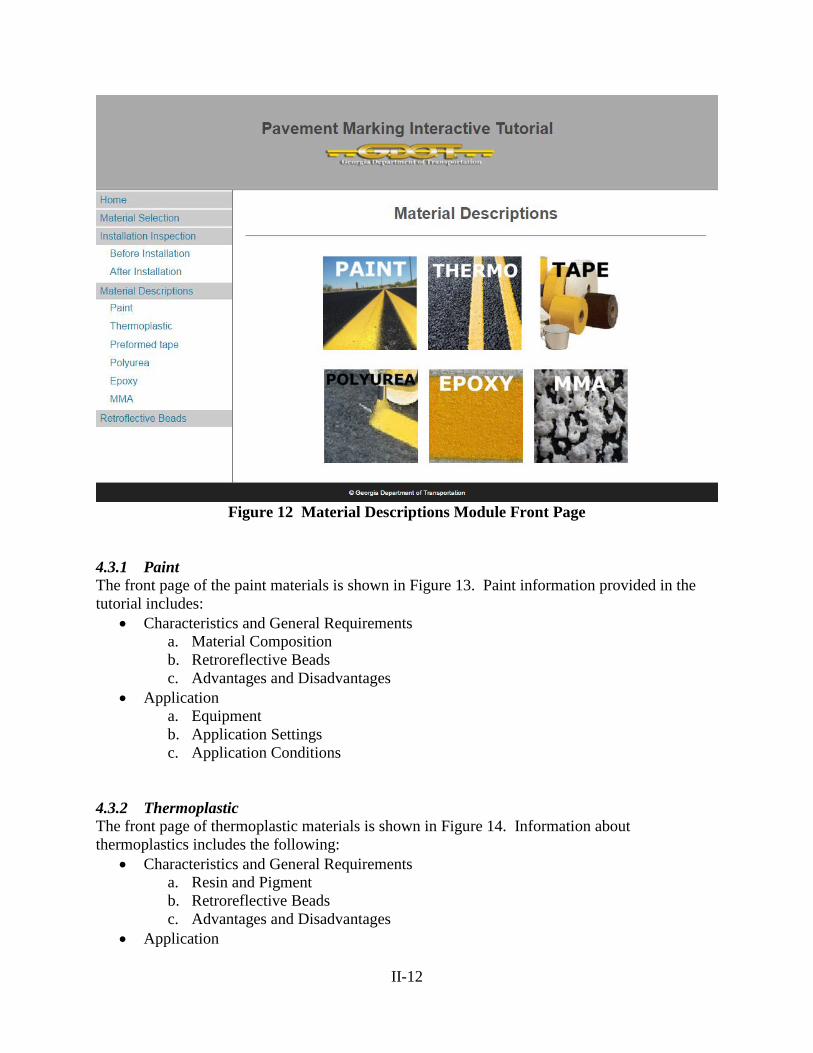
II-12
Figure 12 Material Descriptions Module Front Page
4.3.1 Paint
The front page of the paint materials is shown in Figure 13. Paint information provided in the
tutorial includes:
Characteristics and General Requirements
a. Material Composition
b. Retroreflective Beads
c. Advantages and Disadvantages
Application
a. Equipment
b. Application Settings
c. Application Conditions
4.3.2 Thermoplastic
The front page of thermoplastic materials is shown in Figure 14. Information about
thermoplastics includes the following:
Characteristics and General Requirements
a. Resin and Pigment
b. Retroreflective Beads
c. Advantages and Disadvantages
Application
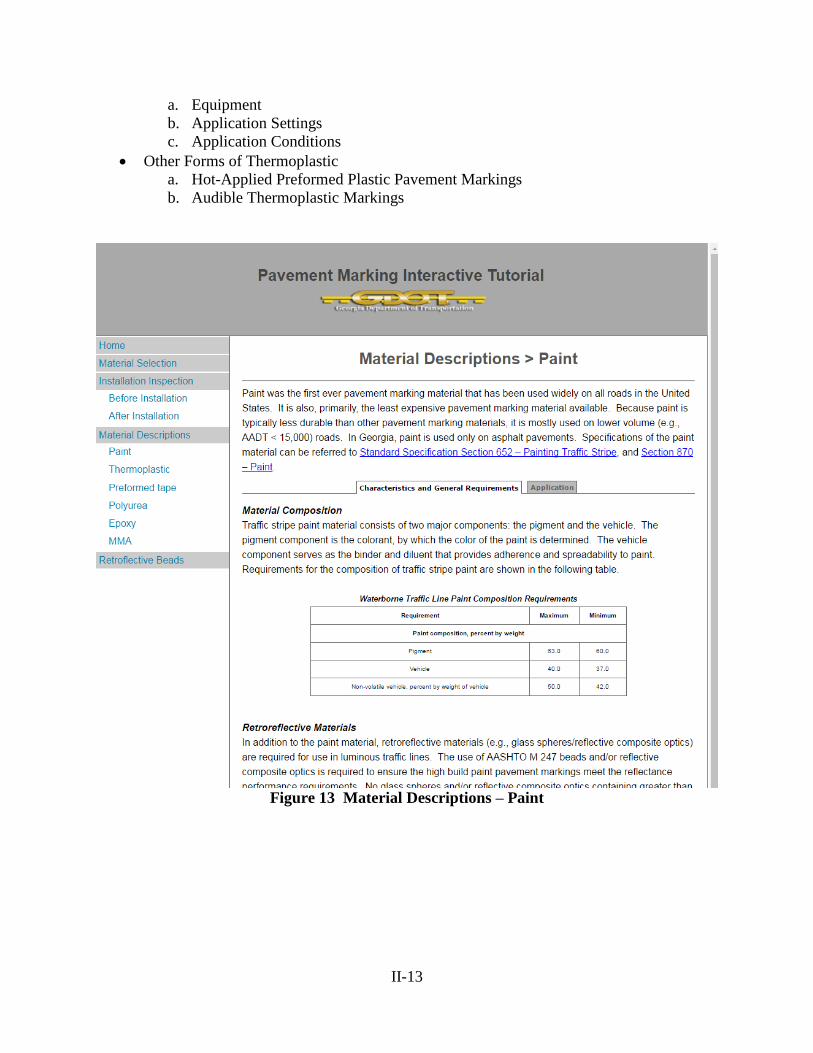
II-13
a. Equipment
b. Application Settings
c. Application Conditions
Other Forms of Thermoplastic
a. Hot-Applied Preformed Plastic Pavement Markings
b. Audible Thermoplastic Markings
Figure 13 Material Descriptions – Paint
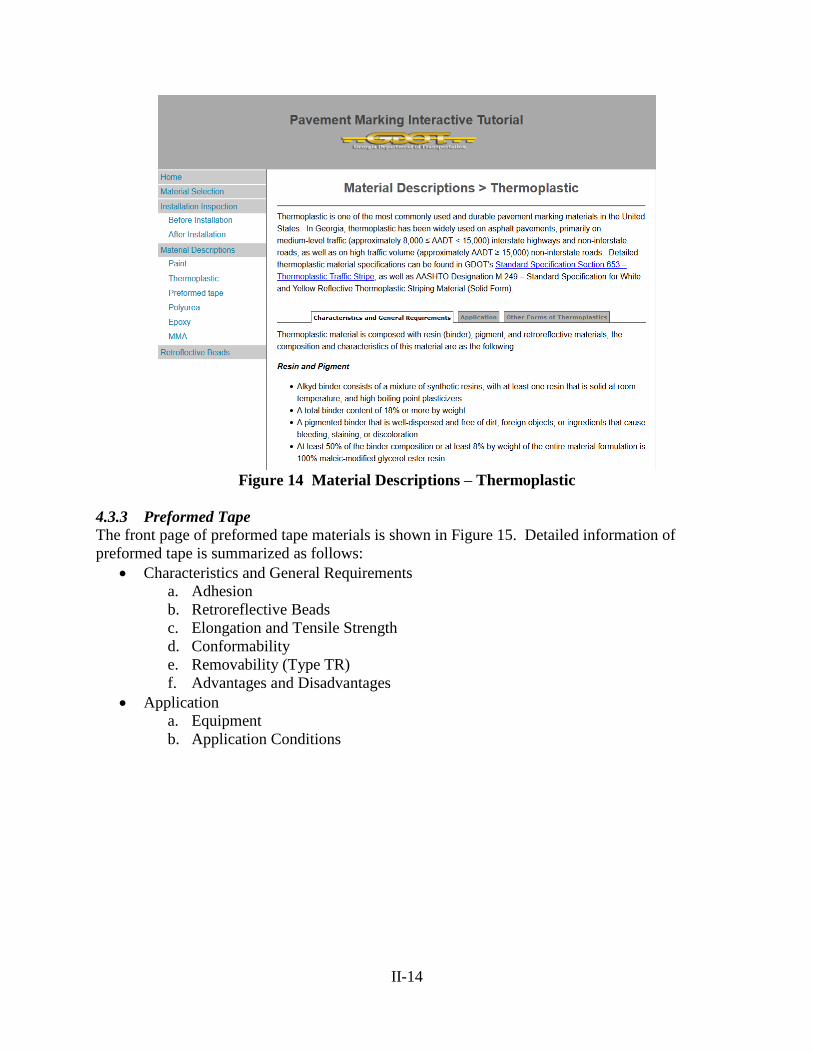
II-14
Figure 14 Material Descriptions – Thermoplastic
4.3.3 Preformed Tape
The front page of preformed tape materials is shown in Figure 15. Detailed information of
preformed tape is summarized as follows:
Characteristics and General Requirements
a. Adhesion
b. Retroreflective Beads
c. Elongation and Tensile Strength
d. Conformability
e. Removability (Type TR)
f. Advantages and Disadvantages
Application
a. Equipment
b. Application Conditions
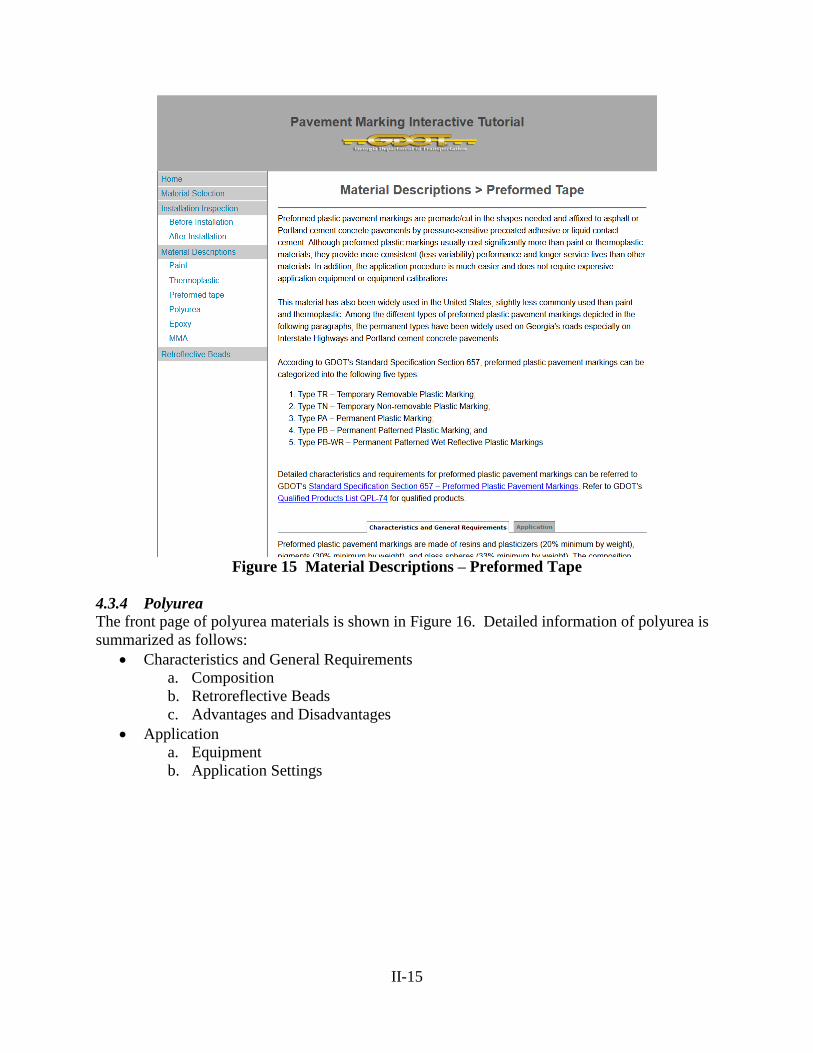
II-15
Figure 15 Material Descriptions – Preformed Tape
4.3.4 Polyurea
The front page of polyurea materials is shown in Figure 16. Detailed information of polyurea is
summarized as follows:
Characteristics and General Requirements
a. Composition
b. Retroreflective Beads
c. Advantages and Disadvantages
Application
a. Equipment
b. Application Settings
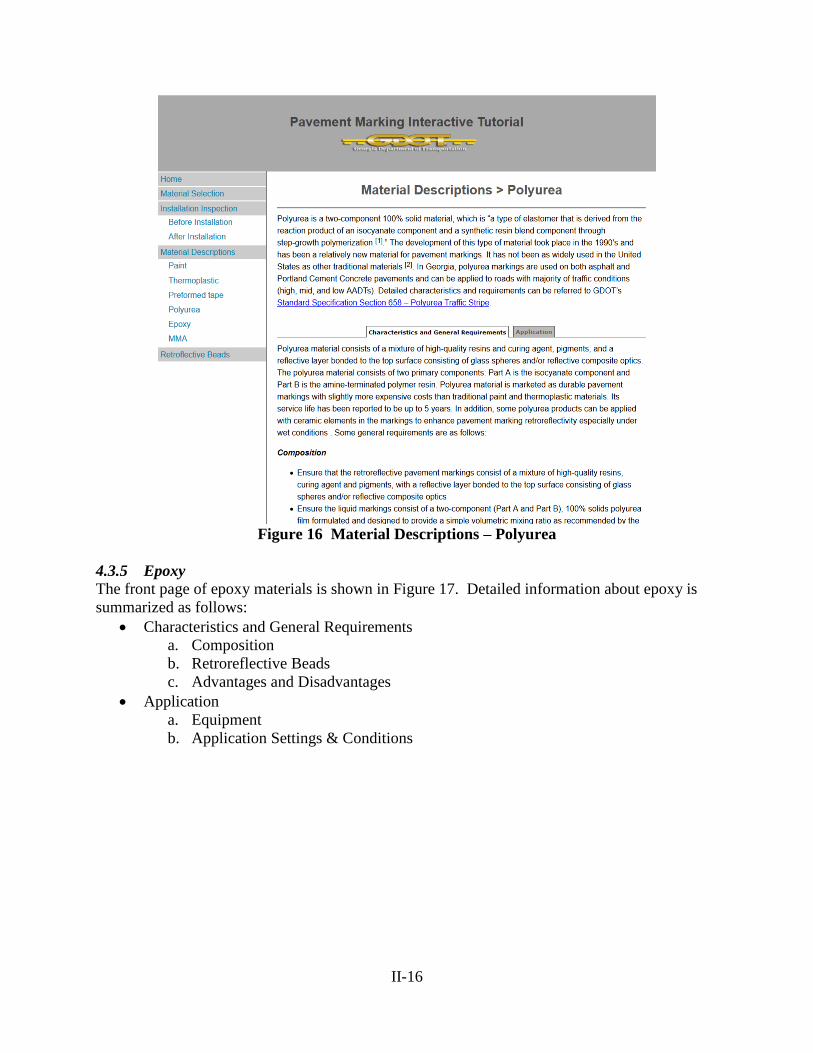
II-16
Figure 16 Material Descriptions – Polyurea
4.3.5 Epoxy
The front page of epoxy materials is shown in Figure 17. Detailed information about epoxy is
summarized as follows:
Characteristics and General Requirements
a. Composition
b. Retroreflective Beads
c. Advantages and Disadvantages
Application
a. Equipment
b. Application Settings & Conditions
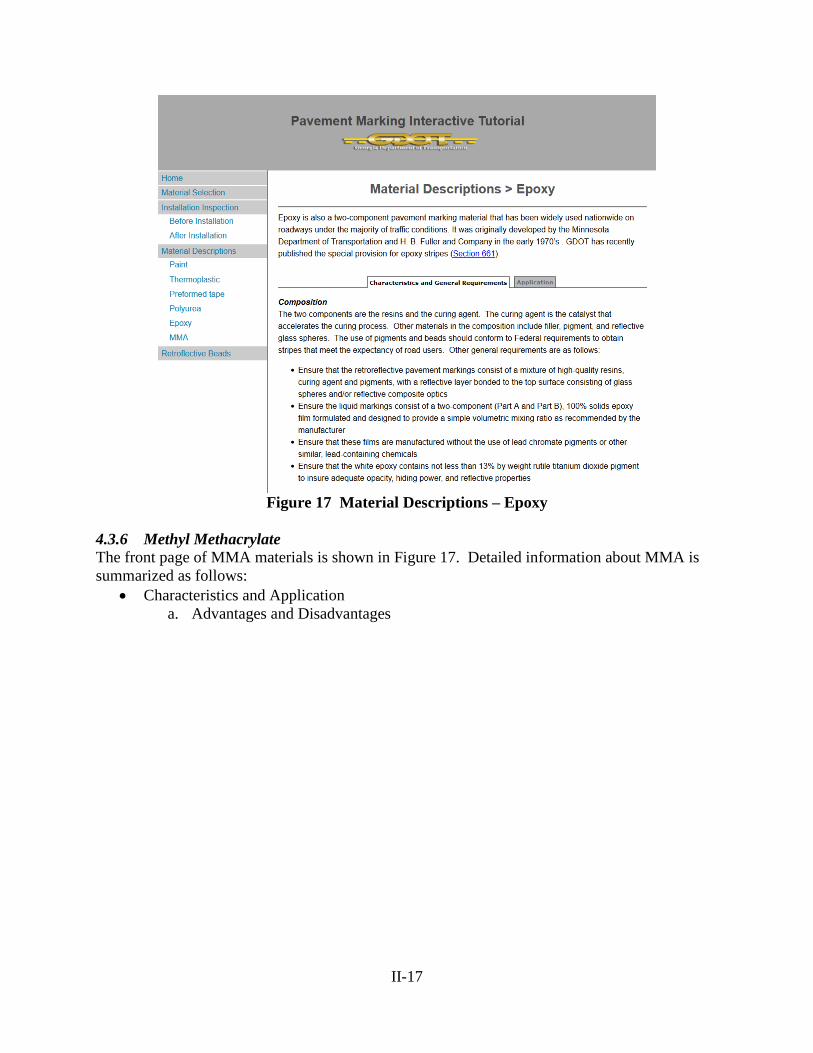
II-17
Figure 17 Material Descriptions – Epoxy
4.3.6 Methyl Methacrylate
The front page of MMA materials is shown in Figure 17. Detailed information about MMA is
summarized as follows:
Characteristics and Application
a. Advantages and Disadvantages
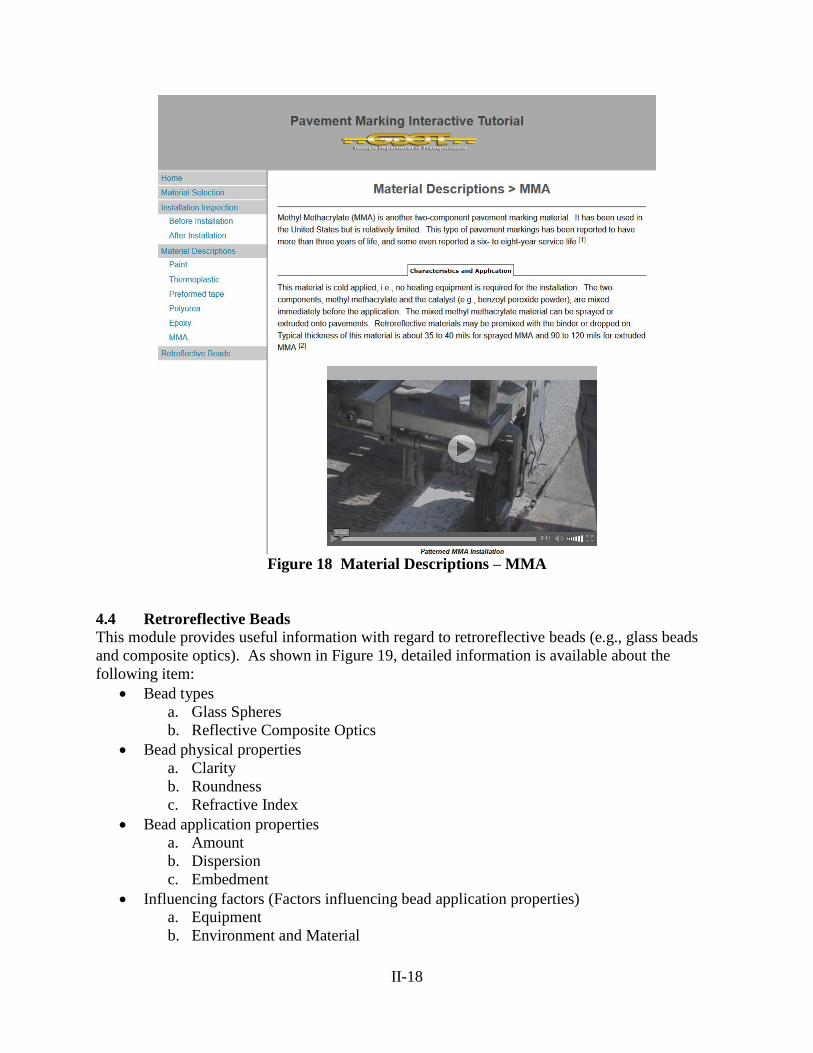
II-18
Figure 18 Material Descriptions – MMA
4.4 Retroreflective Beads
This module provides useful information with regard to retroreflective beads (e.g., glass beads
and composite optics). As shown in Figure 19, detailed information is available about the
following item:
Bead types
a. Glass Spheres
b. Reflective Composite Optics
Bead physical properties
a. Clarity
b. Roundness
c. Refractive Index
Bead application properties
a. Amount
b. Dispersion
c. Embedment
Influencing factors (Factors influencing bead application properties)
a. Equipment
b. Environment and Material
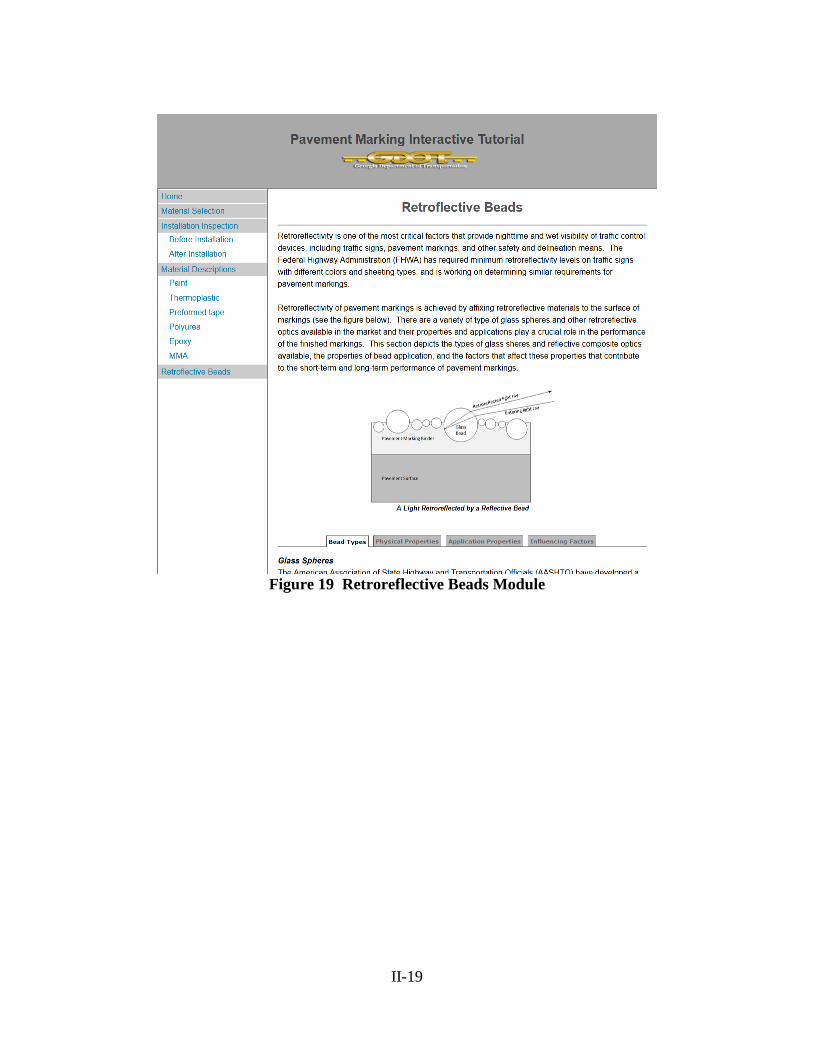
II-19
Figure 19 Retroreflective Beads Module